UNITED STATES
SECURITIES AND EXCHANGE COMMISSION
Washington, D.C. 20549
FORM N-CSR
CERTIFIED SHAREHOLDER REPORT OF REGISTERED
MANAGEMENT INVESTMENT COMPANIES
Investment Company Act file number 811-22743
Blackstone Alternative Investment Funds
(Exact Name of Registrant as Specified in Charter)
345 Park Avenue
28th Floor
New York, NY 10154
(Address of Principal Executive Offices)
Registrant’s telephone number, including area code: (212) 583-5000
Peter Koffler, Esq.
c/o Blackstone Alternative Investment Advisors LLC
345 Park Avenue
28th Floor
New York, NY 10154
(Name and Address of Agent for Service)
With a copy to:
James E. Thomas, Esq.
Ropes & Gray LLP
Prudential Tower
800 Boylston Street
Boston, MA 02199-3600
Date of fiscal year end: March 31
Date of reporting period: March 31, 2016
| Item 1. | Reports to Stockholders. |
The Report to Shareholders is attached hereto.
Blackstone
|
Blackstone Alternative Multi-Manager Fund
Blackstone Alternative Multi-Strategy Fund
Series of Blackstone Alternative Investment Funds
Annual Report For the Year Ended March 31, 2016
|
TABLE OF CONTENTS
| 1 | |||||
| 5 | |||||
| 6 | |||||
| 13 | |||||
| 204 | |||||
| 206 | |||||
| 207 | |||||
| 210 | |||||
| 212 | |||||
| 216 | |||||
| 253 | |||||
| 254 | |||||
| 256 |
All investors should consider the investment objectives, risks, charges and expenses of the Blackstone Alternative Multi-Strategy Fund and the Blackstone Alternative Multi-Manager Fund (collectively the “Funds”) carefully before investing. The prospectus and, if available, the summary prospectus contain this and other information about the Funds. You can obtain a prospectus and, if available, a summary prospectus, from the Fund’s website (www.blackstone.com/bammf). All investors are urged to carefully read the prospectus and, if available, the summary prospectus, in its entirety before investing. Interests in the Funds are offered through Blackstone Advisory Partners L.P., a member of FINRA and an affiliate of Blackstone Alternative Asset Management L.P.
Important Risks: An investment in the Fund should be considered a speculative investment that entails substantial risks; you may lose part or all of your investment or your investment may not perform as well as other investments. The Fund’s investments involve special risks including, but not limited to, loss of all or a significant portion of the investment due to leveraging, short-selling, or other speculative practices, lack of liquidity and volatility of returns. The following is a summary description of certain additional principal risks of investing in the Fund:
Allocation Risk - Blackstone’s judgment about the attractiveness, value or market trends affecting a particular asset class, investment style, sub- adviser or security may be incorrect and this may have a negative impact upon performance. Derivatives Risk - the use of derivatives involves the risk that their value may not move as expected relative to the value of the relevant underlying assets, rates, or indices. Derivatives can be subject to counterparty credit risk and may entail investment exposure greater than their notional amount. Distressed Securities Risk - investments in securities of business enterprises involved in workouts, liquidations, reorganizations, bankruptcies and similar situations involve a high degree of risk of loss since there is typically substantial uncertainty concerning the outcome of such situations. Event-Driven Trading Risk - involves the risk that the specific event identified may not occur as anticipated and that this may have a negative impact upon the market price of the securities involved. Foreign Investments/Emerging Markets Risk - involves special risks caused by foreign political, social and economic factors, including exposure to currency fluctuations, less liquidity, less developed and less efficient trading markets, political instability and less developed legal and auditing standards. High Portfolio Turnover Risk - active trading of securities can increase transaction costs (thus lowering performance) and taxable distributions. Model and Technology Risk - involves the risk that model-based strategies, data gathering systems, order execution and trade allocation systems and risk management systems may not be successful on an ongoing basis or could contains errors, omissions, imperfections or malfunctions. Multi-Manager Risk - managers may make investment decisions which conflict with each other and as a result, the Fund could incur transaction costs without accomplishing any net investment result.
BLACKSTONE ALTERNATIVE INVESTMENT FUNDS
Dear Blackstone Investor,
We are pleased to present this annual shareholder report for Blackstone Alternative Investment Funds (“BAIF”), which includes Blackstone Alternative Multi-Manager Fund (“Multi-Manager Fund”) and Blackstone Alternative Multi-Strategy Fund (“Multi-Strategy Fund”) (each individually referred to as a “Fund,” and collectively, the “Funds”). This report includes portfolio commentary, a listing of each Fund’s investments and each Fund’s audited financial statements. Audited financial statements for both Funds cover the year from April 1, 2015 to March 31, 2016 (the “Reporting Period”).
Each Fund’s investment objective is to seek capital appreciation. Each Fund seeks this objective by allocating its assets among a variety of nontraditional, or “alternative,” investment strategies. Blackstone Alternative Investment Advisors LLC (the “Investment Adviser”) determines the allocations of a Fund’s assets and allocates a majority of a Fund’s assets among investment sub-advisers with experience managing alternative investment strategies and among investment funds. Each sub-adviser is responsible for the day-to-day management of a Fund’s assets that the Investment Adviser allocates to it. Subject to oversight by the Board of Trustees, the Investment Adviser is responsible for making recommendations with respect to hiring, terminating and/or replacing the Funds’ investment sub-advisers, and it may also manage a portion of the Funds’ assets directly.
Fund Performance1
The Reporting Period presented a challenging market for the types of strategies utilized by the Funds. The Funds faced a number of headwinds that prevented the Funds from providing as much downside protection and upside capture as they have in prior periods. Despite these challenging conditions, we are pleased with each Fund’s performance results thus far and remain focused on pursuing the Funds’ investment objective. As the world’s largest discretionary allocator to hedge funds,2 with a 26-year track record in hedge fund investing, we will continue to leverage our due diligence, risk management, and investment expertise in identifying alternative investment strategies and investment sub-advisers for the Funds.
Multi-Manager Fund
During the Reporting Period, the Multi-Manager Fund generated a cumulative return, net of fees and expenses, of -3.71%3 and realized an annualized volatility4 of 4.35% with a Sharpe ratio5 of -0.88. Over the same period,
| 1 | The volatility of the indices presented may be materially different from that of the performance of the Multi-Manager Fund and the Multi-Strategy Fund. In addition, the indices employ different investment guidelines and criteria than the Funds; as a result, the holdings in the Funds may differ significantly from the securities that comprise the indices. The performance of the indices has not been selected to represent an appropriate benchmark to compare to the performance of the Funds, but rather is disclosed to allow for comparison of the Funds’ performance to that of well-known and widely recognized indices. A summary of the investment guidelines for the indices presented are available upon request. In the case of equity indices, performance of the indices reflects the reinvestment of dividends. |
| 2 | This statement refers to the Hedge Fund Solutions business of The Blackstone Group L.P., which includes the Funds’ investment adviser. Source: InvestHedge Billion Dollar Club. Data as of December 2015. |
| 3 | Past performance is not indicative of future results and there is no assurance that the Fund will achieve its objectives or avoid significant losses. Returns are shown net of fees and expenses. |
| 4 | “Volatility” refers to the standard deviation of returns. Standard deviation is a measure of how spread out a set of data is from its mean. The more spread apart the data, the higher the standard deviation. Standard deviation is calculated by taking the square root of the “variance” (the average of the squared difference between each number and the mean of the data set). |
| 5 | “Sharpe ratio” is a ratio to measure risk-adjusted performance that is calculated by subtracting the risk-free rate (such as the 10-year U.S. Treasury bond) from the rate of return for a portfolio and dividing the result by the Standard Deviation (defined above) of the portfolio returns. The greater a portfolio’s Sharpe ratio, the better its risk-adjusted performance has been. |
1
The HFRX Global Hedge Fund Index, a measure of hedge fund performance, returned -7.36%; the MSCI World Total Return Index, a measure of global equity market performance, returned -2.90%; and the Barclays U.S. Aggregate Bond Index, a measure of U.S. investment grade bond performance, returned 1.96%.
On April 4, 2016, the Board of Trustees of the Multi-Manager Fund approved a plan to liquidate the Fund on or about May 31, 2016. The Investment Adviser will continue to manage the Multi-Strategy Fund, which is the larger of the two Funds.
Multi-Strategy Fund
During the Reporting Period, the Multi-Strategy Fund generated a cumulative return, net of fees and expenses, of -3.01%2 and realized an annualized volatility3 of 4.03% with a Sharpe ratio4 of -0.77.
Portfolio Manager Changes
Consistent with its historical approach to team-based portfolio management, the Investment Adviser has designated each of the members of the investment committee as a portfolio manager of each Fund. As of April 6, 2016, the list of portfolio managers is as follows:
| • | Gideon Berger |
| • | Robert Jordan |
| • | David Mehenny |
| • | Ian Morris |
| • | Alberto Santulin |
| • | Stephen Sullens |
Portfolio Commentary
The fiscal year ended March 31, 2016 was one that subjected investors to significant volatility. Although equity markets ended the year somewhat close to where they started, with the S&P 500 Index up 1.78% and the MSCI World Index down -2.90%, investors experienced drawdowns of significant magnitudes that are relatively rare in a historical context. In just the first eleven trading days of January, the S&P 500 Index declined by approximately 8%, one of its worst starts to a year ever. Then, almost as quickly, the market reversed course and rallied approximately 13% from its low on February 11 to its March 31 close. Negative sentiments weighing on markets include fear over decelerating growth in China, continuation of low oil prices, and uncertainty over the pace of potential federal funds rate increases. Geopolitical risks, ranging from Saudi Arabia severing relations with Iran to the U.S. presidential election, are also putting pressure on stock markets, and could continue to do so for a while. In seeking capital appreciation, the Funds attempt to protect capital and, since their inceptions, the Multi-Manager Fund and Multi-Strategy Funds have protected against 75% and 73%, respectively, of the market’s downside during months when the S&P 500 Index had negative returns.6
During the Reporting Period, the Funds’ equity strategies detracted from performance, although the last 12 months could be considered a tale of two halves, with equity strategies generating gains in the first half of the year but suffering in the second half. In the first 6 months of the Reporting Period, equity strategies benefitted from a healthy alpha7 capture environment, with a significant portion of alpha driven by short positions. This is a testament to the sub-advisers’ ability to pick short positions in a bull market. Over the next 6 months, however, equity sub-advisers experienced challenging market conditions, largely a result of the de-risking event that began in January. Concern about slowing global growth, particularly in China, and the continued decline in oil prices resulted in a significant de-risking event across the markets, particularly
| 6 | Past performance is not indicative of future results and there is no assurance that the Fund will achieve its objectives or avoid significant losses. |
| 7 | “Alpha” is a measure of risk-adjusted performance which captures risk attributable to the specific security or portfolio rather than the overall market. A high alpha value implies that the investment has performed better than would have been expected relative to the overall market (beta). It is often called the “excess return” on an investment above a benchmark index or “risk free” rate of return. |
2
for hedge fund strategies. In fact, many investors wondered whether the Federal Reserve acted prematurely when it raised short-term interest rate targets in December 2015, particularly after a flurry of uninspiring economic data points were released that evidenced a material slowdown in domestic manufacturing and corporate profits. With this as a backdrop, momentum stocks began to reverse course and many hedge funds began to take down their risk profiles, first on the long-side, but later in the quarter on the short side as well. Reducing risk on the short side involves buying shares of shorted stocks to “cover” the exposure, which had a cascading effect of driving up stock prices even further, resulting in a short squeeze that was the most extreme instance we’ve seen since the March 2009 market bottom following the global financial crisis. Despite the challenges, we continue to believe that single name short exposures are a potential source of alpha over the long term, and may continue to benefit each portfolio over time.
A second theme negatively impacting each Fund’s equity strategies has been a dispersion in returns across sectors which, in part, has been driven by a rotation out of growth/momentum names into more value orientated strategies. The Funds have historically been overweight healthcare and financials, two sectors which have contributed positively to performance since inception of each Fund. Starting in September, however, healthcare stocks have suffered losses, largely amid concern that political pressure could bring down the price of prescription drugs. Financials stocks also suffered, mostly in the beginning of 2016, due to the increased likelihood that the U.S. will remain in a low rate environment. Despite recent challenges, we continue to believe that the best opportunities for alpha are in sectors where there are disruptive forces such as regulatory changes or technological advantages that result in intra-sector performance dispersion, and we currently retain conviction in these positions. Some healthcare names in particular may have tremendous embedded value and we believe there could be investment opportunity where fundamentals remain strong.
Each Fund’s credit strategies also detracted from performance during the Reporting Period. Some of the same forces impacting equity markets also impacted the credit markets, causing spreads across credit products to widen over the year. In the corporate credit space, performance lagged primarily due to the underperformance of distressed credits. Lower rated credits (rated CCC and below by Standard & Poor’s) drove underperformance, with energy credits being among the largest detractors. While each Fund’s asset-backed sub-strategies experienced mark-to-market losses and ended the Reporting Period down, the sub-advisers continued to search for opportunities to take advantage of market dislocations and subsequently benefitted from the high yield rally occurring in March. In particular, exposure to credit risk transfer bonds8 contributed to performance at the end of the Reporting Period due to spread tightening, which was mostly driven by a reversal of poor technicals and an improvement in market sentiment and the primary markets. Although each Fund is heavily skewed towards asset backed credit versus corporate credit, we are increasingly bullish on the opportunity for corporate credit. Redemptions from hedge funds and fund flows from mutual funds will likely continue to create forced sellers of attractive risk across the corporate credit spectrum, providing opportunities for liquidity providers to capture excess spread.
We allocate a portion of each Fund’s assets to multi-asset strategies because their expected lower correlations to equity and credit markets may offer diversification benefits to a Fund’s portfolio. During the Reporting Period, the Funds’ multi-asset strategies collectively continued to stabilize the portfolio, given idiosyncratic exposures in emerging markets and asset selection in market neutral quantitative exposures. The low pair-wise correlation of these managers to directional market risk has offset losses from long-biased equity and credit managers through Q1 volatility. Gains were driven by long positions in Argentina, Venezuela and Greek sovereign bonds. Losses came from risk premia models, specifically in equity value strategies in March and fixed income momentum strategies in February. Looking ahead, we believe that there will continue to be substantial divergence in foreign exchange markets around the world due to factors such as currency account balances, risk sentiment, and net commodity consuming versus producing countries, which could create attractive long and short opportunities for some of our macro-focused strategies.
| 8 | The Funds invested in credit risk transfer bonds issued by Fannie Mae or Freddie Mac, which reference pools of large, diversified fixed-rate mortgage loans. |
3
During the Reporting Period, the Investment Adviser hired three new sub-advisers for the Multi-Manager Fund and four new sub-advisers for the Multi-Strategy Fund: Blackstone Senfina Advisors L.L.C.9 (equity hedge strategy; both Funds), D.E. Shaw Investment Management, LLC (multi-strategy strategy; both Funds), IPM Informed Portfolio Management AB (multi-strategy strategy; both Funds), and Nephila Capital, Ltd. (event-driven strategy; Multi-Strategy Fund).10 The Investment Adviser also terminated three sub-advisers to each Fund during the period: Union Point Advisors, LLC (fundamental strategy), Verde Serviços Internacionais S.A. (macro strategy), and BTG Pactual Asset Management US, LLC (macro strategy). Sub-adviser additions and terminations are normal events in the Investment Adviser’s investment process and result from our dynamic evaluation of the top down assessment of the opportunity set for fund strategies as well as the bottom up evaluation of a manager’s ability to deliver alpha in a given environment. If done properly, there is potential value that can be created by making the right top-down calls on which asset classes are attractive in a given environment and increasing a Fund’s exposure to those asset classes. For more information on recently added sub-advisers, please refer to the description of sub-advisers available on the Funds’ website.
Looking forward to the remainder of 2016 and into 2017, we believe it is difficult to make the case that the risk factors weighing on the last 12 months will subside in the near-term, despite recent economic data supporting a story of improving fundamentals and a positive outlook. U.S. unemployment remains low at approximately 5%, and we retain our belief that China will have a “soft” rather than “hard” landing. While we do not foresee a recession in 2016, we are more sympathetic to the view that a recession may come around in 2017. The average period of US economic expansion in the post-War period has averaged five years, while the longest expansion in US history was ten years. So, with this expansion more than 7 years in, we believe there could be more downside than upside in equity markets and that they could continue to be volatile. Therefore, we are currently keeping our investment philosophy constant and look to keep the beta11 of the portfolio low by reducing allocations to strategies with higher equity betas or market directionality in favor of strategies with less market directionality. As measured by our beta to the S&P 500 Index, we currently have the lowest level of directional equity risk over the life of each Fund at 0.17. At the same time, we believe recent negative performance is specific to the deleveraging events in the market, and that markets are being driven by technicals as opposed to fundamentals. While this creates a negative alpha environment for stock pickers, managers should be well positioned if markets normalize.
We retain high conviction in the Funds’ sub-advisers and continue to manage each portfolio dynamically, allocating to strategies that we believe have attractive alpha generation potential in the current environment. Despite a tough start to the year, we believe that the environment is primed for investment strategies that are diversified and hedged by nature and that offer alpha generation potential through security selection and strategic asset allocation. It is this type of approach that we expect will be valuable to the Funds’ portfolios over the course of 2016 and beyond.
Thank you for your continued confidence in us. We look forward to continuing to service your investment needs in the years to come.
Sincerely,
| • | Gideon Berger |
| • | Robert Jordan |
| • | David Mehenny |
| • | Ian Morris |
| • | Alberto Santulin |
| • | Stephen Sullens |
| 9 | Blackstone Senfina Advisors L.L.C. (“Senfina”) is an indirect wholly-owned subsidiary of The Blackstone Group L.P., a publicly traded master limited partnership that has units that trade on the New York Stock Exchange under the symbol “BX.” Senfina is an affiliate of the Investment Adviser on the basis that it is under common control with the Investment Adviser. The investment by the Funds with Senfina benefits Blackstone and a withdrawal from Senfina would be detrimental to Blackstone. |
| 10 | Nephila Capital, Ltd. was added as a new sub-adviser during the Reporting Period only for the Multi-Strategy Fund; it was already serving as a sub-adviser to the Multi-Manager Fund. |
| 11 | “Beta” is a measure of the sensitivity of a fund’s return to the return of an index. If the beta = 1, then the return will move with that of the index. If the beta is > 1, the return is more volatile than the index whereas if the beta is < 1, the return is less volatile than the index. |
4
Performance quoted represents past performance, which may be higher or lower than current performance. Past performance is not indicative of future results. Investment returns and principal value of an investment will fluctuate so that an investor’s shares, when redeemed, may be worth more or less than their original cost. The returns shown do not reflect taxes that an investor would pay on fund distributions or on the sale of fund shares. To obtain the most recent month-end performance, visit http://www.blackstone.com/the-firm/asset-management/registered-funds.
Value of a $10,000 Investment Since the Beginning of the Fiscal Year at Net Asset Value*
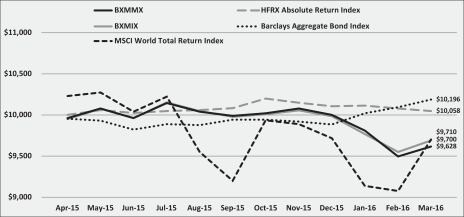
| * | The line graph represents historical performance of a hypothetical investment of $10,000 from April 1, 2015 to March 31, 2016, assuming the reinvestment of distributions. |
Cumulative Total Return
| For the Year Ended March 31, 2016 | |||||
Multi-Manager Fund—Class I Shares (“BXMMX”) | (3.72 | )% | |||
Multi-Strategy Fund—Class I Shares (“BXMIX”) | (3.00 | )% | |||
HFRX Absolute Return Index | 0.58 | % | |||
MSCI World Total Return Index | (2.90 | )% | |||
Barclays Aggregate Bond Index | 1.96 | % | |||
5
Blackstone Alternative Multi-Manager Fund and Subsidiaries
Portfolio Information
March 31, 2016 (Unaudited)
Geographic Breakdown | Percentage of Total Net Assets | ||||
United States | 18.8 | % | |||
Japan | 0.6 | ||||
United Kingdom | 0.4 | ||||
China | 0.3 | ||||
Israel | 0.3 | ||||
Netherlands | 0.3 | ||||
Cayman Islands | 0.2 | ||||
Singapore | 0.2 | ||||
Spain | 0.2 | ||||
Bermuda | 0.1 | ||||
Canada | 0.1 | ||||
France | 0.1 | ||||
Greece | 0.1 | ||||
Ireland | 0.1 | ||||
Italy | 0.1 | ||||
South Africa | 0.1 | ||||
Argentina | 0.0 | 1 | |||
Australia | 0.0 | 1 | |||
Bahamas | 0.0 | 1 | |||
Brazil | 0.0 | 1 | |||
Cyprus | 0.0 | 1 | |||
Hong Kong | 0.0 | 1 | |||
India | 0.0 | 1 | |||
Luxembourg | 0.0 | 1 | |||
Puerto Rico | 0.0 | 1 | |||
Russian Federation | 0.0 | 1 | |||
Taiwan | 0.0 | 1 | |||
Thailand | 0.0 | 1 | |||
Other2 | 6.1 | ||||
Securities Sold Short | (12.0 | ) | |||
Other Assets and Liabilities3 | 83.9 | ||||
|
| ||||
Total | 100.0 | % | |||
|
| ||||
| 1 | Represents less than 0.1%. |
| 2 | Includes Exchange-Traded Funds, Short-Term Investment—Money Market Fund and Purchased Options. |
| 3 | Assets, other than investments in securities, net of other liabilities. See Consolidated Statement of Assets and Liabilities. A portion of the balance represents cash collateral for derivatives. |
See Notes to Consolidated Financial Statements.
6
Blackstone Alternative Multi-Manager Fund and Subsidiaries
Portfolio Information (Continued)
March 31, 2016 (Unaudited)
Portfolio Composition | Percentage of Total Net Assets | ||||
Common Stock | 16.5 | % | |||
Short-Term Investment—Money Market Fund | 6.1 | ||||
Mortgage-Backed Securities | 3.1 | ||||
Bank Loans | 1.7 | ||||
Corporate Bonds & Notes | 0.3 | ||||
Asset-Backed Securities | 0.2 | ||||
Convertible Bond | 0.2 | ||||
Exchange-Traded Funds | 0.0 | 1 | |||
Rights | 0.0 | 1 | |||
Other2 | 0.0 | 1 | |||
Securities Sold Short | (12.0 | ) | |||
Other Assets and Liabilities3 | 83.9 | ||||
|
| ||||
Total | 100.0 | % | |||
|
| ||||
| 1 | Represents less than 0.1%. |
| 2 | Includes Purchased Options. |
| 3 | Assets, other than investments in securities, net of other liabilities. See Consolidated Statement of Assets and Liabilities. A portion of the balance represents cash collateral for derivatives. |
Credit Quality Allocation4 | Percentage of Total Investments in Securities | ||||
AAA/Aaa | 6.0 | % | |||
BBB/Baa | 2.5 | ||||
BB/Ba | 0.9 | ||||
B | 1.1 | ||||
CCC/Caa | 2.0 | ||||
Not Rated | 12.3 | ||||
Other5 | 75.2 | ||||
|
| ||||
Total Investments in Securities | 100.0 | % | |||
|
| ||||
| 4 | Using the higher of Standard & Poor’s (“S&P’s”) or Moody’s Investor Service (“Moody’s”) ratings. |
| 5 | Includes Common Stock, Exchange-Traded Funds, Short-Term Investment—Money Market Fund and Purchased Options. |
Industry | Percentage of Total Net Assets | ||||
Biotechnology & Pharmaceuticals | 3.0 | % | |||
Health Care Facilities & Services | 1.7 | ||||
Financial Services | 1.6 | ||||
Medical Equipment & Devices | 1.6 | ||||
Oil, Gas & Coal | 1.4 | ||||
Media | 1.3 | ||||
Hardware | 0.8 | ||||
Real Estate | 0.8 | ||||
Software | 0.6 | ||||
Semiconductors | 0.4 | ||||
Asset Management | 0.3 | ||||
Containers & Packaging | 0.3 | ||||
Electrical Equipment | 0.3 | ||||
Industrial Services | 0.3 | ||||
Passenger Transportation | 0.3 | ||||
Renewable Energy | 0.3 | ||||
Technology Services | 0.3 | ||||
Telecommunications | 0.3 | ||||
Transportation & Logistics | 0.3 | ||||
Banking | 0.2 | ||||
See Notes to Consolidated Financial Statements.
7
Blackstone Alternative Multi-Manager Fund and Subsidiaries
Portfolio Information (Continued)
March 31, 2016 (Unaudited)
Industry | Percentage of Total Net Assets | ||||
Entertainment Resources | 0.2 | ||||
Gaming, Lodging & Restaurants | 0.2 | ||||
Home & Office Products | 0.2 | ||||
Machinery | 0.2 | ||||
Metals & Mining | 0.2 | ||||
Wireless Telecommunication Services | 0.2 | ||||
Automotive | 0.1 | ||||
Chemicals | 0.1 | ||||
Commercial Services | 0.1 | ||||
Construction Materials | 0.1 | ||||
Consumer Products | 0.1 | ||||
Consumer Services | 0.1 | ||||
Design, Manufacturing & Distribution | 0.1 | ||||
Exploration & Production | 0.1 | ||||
Insurance | 0.1 | ||||
Manufactured Goods | 0.1 | ||||
Publishing & Broadcasting | 0.1 | ||||
Retail—Consumer Staples | 0.1 | ||||
Retail—Discretionary | 0.1 | ||||
Specialty Finance | 0.1 | ||||
Aerospace & Defense | 0.0 | 1 | |||
Apparel & Textile Products | 0.0 | 1 | |||
Banks | 0.0 | 1 | |||
Distributors—Discretionary | 0.0 | 1 | |||
Engineering & Construction Services | 0.0 | 1 | |||
Forest & Paper Products | 0.0 | 1 | |||
Institutional Financial Services | 0.0 | 1 | |||
Iron & Steel | 0.0 | 1 | |||
Leisure Products | 0.0 | 1 | |||
Oil & Gas Services & Equipment | 0.0 | 1 | |||
Property & Casualty Insurance | 0.0 | 1 | |||
Recreation Facilities & Services | 0.0 | 1 | |||
Transportation Equipment | 0.0 | 1 | |||
Utilities | 0.0 | 1 | |||
Waste & Environmental Services & Equipment | 0.0 | 1 | |||
Other2 | 9.4 | ||||
Securities Sold Short | (12.0 | ) | |||
Other Assets and Liabilities3 | 83.9 | ||||
|
| ||||
Total Investments | 100.0 | % | |||
|
| ||||
| 1 | Represents less than 0.1%. |
| 2 | Includes Asset-Backed Securities, Mortgage-Backed Securities, Rights, Exchange-Traded Funds, Short-Term Investment—Money Market Fund and Purchased Options. |
| 3 | Assets, other than investments in securities, net of other liabilities. See Consolidated Statement of Assets and Liabilities. A portion of the balance represents cash collateral for derivatives. |
See Notes to Consolidated Financial Statements.
8
Blackstone Alternative Multi-Strategy Fund and Subsidiaries
Portfolio Information
March 31, 2016 (Unaudited)
Geographic Breakdown | Percentage of Total Net Assets | ||||
United States | 62.7 | % | |||
Cayman Islands | 5.5 | ||||
Japan | 1.4 | ||||
United Kingdom | 1.2 | ||||
Israel | 0.6 | ||||
China | 0.5 | ||||
France | 0.5 | ||||
Netherlands | 0.5 | ||||
Singapore | 0.5 | ||||
Brazil | 0.4 | ||||
Ireland | 0.4 | ||||
Italy | 0.4 | ||||
Switzerland | 0.3 | ||||
Spain | 0.3 | ||||
Canada | 0.2 | ||||
Bermuda | 0.1 | ||||
Ecuador | 0.1 | ||||
Germany | 0.1 | ||||
India | 0.1 | ||||
Mexico | 0.1 | ||||
Poland | 0.1 | ||||
Sweden | 0.1 | ||||
Venezuela | 0.1 | ||||
Argentina | 0.0 | 1 | |||
Australia | 0.0 | 1 | |||
Belgium | 0.0 | 1 | |||
Chile | 0.0 | 1 | |||
Cyprus | 0.0 | 1 | |||
Greece | 0.0 | 1 | |||
Hong Kong | 0.0 | 1 | |||
Luxembourg | 0.0 | 1 | |||
New Zealand | 0.0 | 1 | |||
Norway | 0.0 | 1 | |||
Peru | 0.0 | 1 | |||
Puerto Rico | 0.0 | 1 | |||
Republic of Korea | 0.0 | 1 | |||
Russian Federation | 0.0 | 1 | |||
South Africa | 0.0 | 1 | |||
Taiwan | 0.0 | 1 | |||
Thailand | 0.0 | 1 | |||
Other2 | 23.8 | ||||
Securities Sold Short | (25.8 | ) | |||
Other Assets and Liabilities3 | 25.8 | ||||
|
| ||||
Total | 100.0 | % | |||
|
| ||||
| 1 | Represents less than 0.1%. |
| 2 | Includes Sovereign Debt, Exchange-Traded Funds, Short-Term Investment—Money Market Fund and Purchased Options. |
| 3 | Assets, other than investments in securities, net of other liabilities. See Consolidated Statement of Assets and Liabilities. A portion of the balance represents cash collateral for derivatives. |
See Notes to Consolidated Financial Statements.
9
Blackstone Alternative Multi-Strategy Fund and Subsidiaries
Portfolio Information (Continued)
March 31, 2016 (Unaudited)
Portfolio Composition | Percentage of Total Net Assets | ||||
Common Stock | 36.1 | % | |||
Mortgage-Backed Securities | 20.5 | ||||
Short-Term Investment—Money Market Fund | 18.1 | ||||
Asset-Backed Securities | 8.7 | ||||
Corporate Bonds & Notes | 5.3 | ||||
Sovereign Debt | 4.7 | ||||
Investment in Investee Funds | 2.9 | ||||
U.S. Treasury Obligations | 1.7 | ||||
Exchange-Traded Funds | 0.7 | ||||
U.S. Government Sponsored Agency Securities | 0.6 | ||||
Convertible Bond | 0.3 | ||||
Bank Loans | 0.1 | ||||
Rights | 0.0 | 1 | |||
Other2 | 0.3 | ||||
Securities Sold Short | (25.8 | ) | |||
Other Assets and Liabilities3 | 25.8 | ||||
|
| ||||
Total | 100.0 | % | |||
|
| ||||
| 1 | Represents less than 0.1%. |
| 2 | Includes Purchased Options. |
| 3 | Assets, other than investments in securities, net of other liabilities. See Consolidated Statement of Assets and Liabilities. A portion of the balance represents cash collateral for derivatives. |
Credit Quality Allocation4 | Percentage of Total Investments in Securities | ||||
AAA/Aaa5 | 3.0 | % | |||
AA/Aa | 0.6 | ||||
A | 1.0 | ||||
BBB/Baa | 5.4 | ||||
BB/Ba | 7.1 | ||||
B | 10.4 | ||||
CCC/Caa | 3.0 | ||||
CC/Ca | 0.0 | 1 | |||
D | 0.5 | ||||
Not Rated | 21.9 | ||||
Other6 | 47.1 | ||||
|
| ||||
Total Investments in Securities | 100.0 | % | |||
|
| ||||
| 4 | Using the higher of Standard & Poor’s (“S&P’s”) or Moody’s Investor Service (“Moody’s”) ratings. |
| 5 | Includes U.S. Government Sponsored Agency Securities and U.S. Treasury Obligations which are deemed AAA/Aaa by the Investment Adviser. |
| 6 | Includes Common Stock, Exchange-Traded Funds, Investment in Investee Funds, Short-Term Investment—Money Market Fund and Purchased Options. |
Industry | Percentage of Total Net Assets | ||||
Biotechnology & Pharmaceuticals | 6.6 | % | |||
Media | 3.9 | ||||
Health Care Facilities & Services | 3.6 | ||||
Medical Equipment & Devices | 3.0 | ||||
Real Estate | 2.2 | ||||
Semiconductors | 1.6 | ||||
Chemicals | 1.4 | ||||
Hardware | 1.4 | ||||
Oil, Gas & Coal | 1.3 | ||||
Banking | 1.3 | ||||
Publishing & Broadcasting | 1.1 | ||||
Software | 1.1 | ||||
Gaming, Lodging & Restaurants | 0.9 | ||||
Retail—Discretionary | 0.9 | ||||
Consumer Products | 0.8 | ||||
See Notes to Consolidated Financial Statements.
10
Blackstone Alternative Multi-Strategy Fund and Subsidiaries
Portfolio Information (Continued)
March 31, 2016 (Unaudited)
Industry | Percentage of Total Net Assets | ||||
Electrical Equipment | 0.8 | ||||
Asset Management | 0.6 | ||||
Telecommunications | 0.6 | ||||
Insurance | 0.5 | ||||
Integrated Oils | 0.5 | ||||
Financial Services | 0.4 | ||||
Passenger Transportation | 0.4 | ||||
Specialty Finance | 0.4 | ||||
Technology Services | 0.4 | ||||
Wireless Telecommunication Services | 0.4 | ||||
Automotive | 0.3 | ||||
Casinos & Gaming | 0.3 | ||||
Commercial Services | 0.3 | ||||
Home & Office Products | 0.3 | ||||
Renewable Energy | 0.3 | ||||
Retail—Consumer Discretionary | 0.3 | ||||
Transportation & Logistics | 0.3 | ||||
Transportation Equipment | 0.3 | ||||
Aerospace & Defense | 0.2 | ||||
Apparel & Textile Products | 0.2 | ||||
Banks | 0.2 | ||||
Containers & Packaging | 0.2 | ||||
Industrial Services | 0.2 | ||||
Retail—Consumer Staples | 0.2 | ||||
Software & Services | 0.2 | ||||
Cable & Satellite | 0.1 | ||||
Commercial Finance | 0.1 | ||||
Construction Materials | 0.1 | ||||
Consumer Finance | 0.1 | ||||
Design, Manufacturing & Distribution | 0.1 | ||||
Distributors—Consumer Staples | 0.1 | ||||
Engineering & Construction Services | 0.1 | ||||
Entertainment Resources | 0.1 | ||||
Exploration & Production | 0.1 | ||||
Food & Beverage | 0.1 | ||||
Institutional Financial Services | 0.1 | ||||
Iron & Steel | 0.1 | ||||
Machinery | 0.1 | ||||
Metals & Mining | 0.1 | ||||
Oil & Gas Services & Equipment | 0.1 | ||||
Pipeline | 0.1 | ||||
Property & Casualty Insurance | 0.1 | ||||
Recreation Facilities & Services | 0.1 | ||||
Refining & Marketing | 0.1 | ||||
Wireline Telecommunication Services | 0.1 | ||||
Advertising & Marketing | 0.0 | 1 | |||
See Notes to Consolidated Financial Statements.
11
Blackstone Alternative Multi-Strategy Fund and Subsidiaries
Portfolio Information (Continued)
March 31, 2016 (Unaudited)
Industry | Percentage of Total Net Assets | ||||
Consumer Services | 0.0 | 1 | |||
Distributors—Discretionary | 0.0 | 1 | |||
Electrical Equipment Manufacturing | 0.0 | 1 | |||
Forest & Paper Products | 0.0 | 1 | |||
Forest & Paper Products Manufacturing | 0.0 | 1 | |||
Industrial Other | 0.0 | 1 | |||
Leisure Products | 0.0 | 1 | |||
Managed Care | 0.0 | 1 | |||
Manufactured Goods | 0.0 | 1 | |||
Medical Equipment & Devices Manufacturing | 0.0 | 1 | |||
Pharmaceuticals | 0.0 | 1 | |||
Utilities | 0.0 | 1 | |||
Waste & Environmental Services & Equipment | 0.0 | 1 | |||
Other2 | 58.2 | ||||
Securities Sold Short | (25.8 | ) | |||
Other Assets and Liabilities3 | 25.8 | ||||
|
| ||||
Total Investments | 100.0 | % | |||
|
| ||||
| 1 | Represents less than 0.1%. |
| 2 | Includes Asset-Backed Securities, Sovereign Debt, Mortgage-Backed Securities, U.S. Government Sponsored Agency Securities, U.S. Treasury Obligations, Exchange-Traded Funds, Rights, Investment in Investee Funds, Short-Term Investment—Money Market Fund and Purchased Options. |
| 3 | Assets, other than investments in securities, net of other liabilities. See Consolidated Statement of Assets and Liabilities. A portion of the balance represents cash collateral for derivatives. |
See Notes to Consolidated Financial Statements.
12
Blackstone Alternative Multi-Manager Fund and Subsidiaries
Consolidated Schedule of Investments
March 31, 2016
Security Description | Shares | Value | ||||||||
INVESTMENTS IN SECURITIES — 28.1% | ||||||||||
COMMON STOCK — 16.5% | ||||||||||
Argentina — 0.0% | ||||||||||
Gaming, Lodging & Restaurants — 0.0% | ||||||||||
Arcos Dorados Holdings, Inc. A Shares (a) | 3,400 | $ | 12,750 | |||||||
|
| |||||||||
Total Argentina | 12,750 | |||||||||
|
| |||||||||
Australia — 0.0% | ||||||||||
Iron & Steel — 0.0% | ||||||||||
BHP Billiton PLC ADR | 8,900 | 202,297 | ||||||||
|
| |||||||||
Total Australia | 202,297 | |||||||||
|
| |||||||||
Bahamas — 0.0% | ||||||||||
Transportation & Logistics — 0.0% | ||||||||||
Ultrapetrol Bahamas Ltd. (a) | 1,300 | 351 | ||||||||
|
| |||||||||
Total Bahamas | 351 | |||||||||
|
| |||||||||
Bermuda — 0.1% | ||||||||||
Media — 0.0% | ||||||||||
Central European Media Enterprises Ltd. A Shares (a) | 3,800 | 9,690 | ||||||||
|
| |||||||||
Semiconductors — 0.1% | ||||||||||
Marvell Technology Group Ltd. | 52,600 | 542,306 | ||||||||
|
| |||||||||
Transportation & Logistics — 0.0% | ||||||||||
Teekay Corp. | 5,400 | 46,764 | ||||||||
|
| |||||||||
Total Bermuda | 598,760 | |||||||||
|
| |||||||||
Brazil — 0.0% | ||||||||||
Iron & Steel — 0.0% | ||||||||||
Gerdau SA ADR | 1,900 | 3,382 | ||||||||
|
| |||||||||
Utilities — 0.0% | ||||||||||
Cia Energetica de Minas Gerais ADR (c) | 26,900 | 60,794 | ||||||||
|
| |||||||||
Total Brazil | 64,176 | |||||||||
|
| |||||||||
Canada — 0.1% | ||||||||||
Biotechnology & Pharmaceuticals — 0.0% | ||||||||||
Aralez Pharmaceuticals, Inc. (a) | 1,900 | 6,745 | ||||||||
QLT, Inc. (a) | 5,200 | 10,348 | ||||||||
Sophiris Bio, Inc. (a) | 1,100 | 1,584 | ||||||||
|
| |||||||||
| 18,677 | ||||||||||
|
| |||||||||
Consumer Products — 0.0% | ||||||||||
SunOpta, Inc. (a) | 1,800 | 8,028 | ||||||||
|
| |||||||||
See Notes to Consolidated Financial Statements.
13
Blackstone Alternative Multi-Manager Fund and Subsidiaries
Consolidated Schedule of Investments (Continued)
March 31, 2016
Security Description | Shares | Value | ||||||||
Forest & Paper Products — 0.0% | ||||||||||
Mercer International, Inc. (c) | 6,200 | $ | 58,590 | |||||||
|
| |||||||||
Gaming, Lodging & Restaurants — 0.0% | ||||||||||
Restaurant Brands International | 3 | 117 | ||||||||
|
| |||||||||
Media — 0.0% | ||||||||||
Points International Ltd. (a) | 200 | 1,742 | ||||||||
|
| |||||||||
Metals & Mining — 0.0% | ||||||||||
Dominion Diamond Corp. (c) | 9,100 | 100,919 | ||||||||
Fortuna Silver Mines, Inc. (a) | 3,000 | 11,700 | ||||||||
MFC Industrial Ltd. (a),(c) | 800 | 1,584 | ||||||||
Nevsun Resources Ltd. | 9,000 | 29,160 | ||||||||
Taseko Mines Ltd. (a) | 1,100 | 613 | ||||||||
|
| |||||||||
| 143,976 | ||||||||||
|
| |||||||||
Oil, Gas & Coal — 0.0% | ||||||||||
Advantage Oil & Gas Ltd. (a),(c) | 3,500 | 19,215 | ||||||||
Gran Tierra Energy, Inc. (a),(c) | 27,600 | 68,172 | ||||||||
TransGlobe Energy Corp. (c) | 1,500 | 2,490 | ||||||||
|
| |||||||||
| 89,877 | ||||||||||
|
| |||||||||
Renewable Energy — 0.1% | ||||||||||
Canadian Solar, Inc. (a),(c),(d) | 15,683 | 302,368 | ||||||||
|
| |||||||||
Total Canada | 623,375 | |||||||||
|
| |||||||||
China — 0.3% | ||||||||||
Automotive — 0.0% | ||||||||||
China Automotive Systems, Inc. (a),(c) | 1,200 | 5,568 | ||||||||
|
| |||||||||
Biotechnology & Pharmaceuticals — 0.0% | ||||||||||
Sinovac Biotech Ltd. (a) | 1,800 | 11,502 | ||||||||
|
| |||||||||
Insurance — 0.0% | ||||||||||
China Life Insurance Co. Ltd. ADR | 7,400 | 90,946 | ||||||||
CNinsure, Inc. ADR (a),(c) | 3,300 | 26,466 | ||||||||
|
| |||||||||
| 117,412 | ||||||||||
|
| |||||||||
Machinery — 0.0% | ||||||||||
Hollysys Automation Technologies Ltd. (a) | 3,700 | 77,885 | ||||||||
|
| |||||||||
Media — 0.3% | ||||||||||
Baidu, Inc. ADR (a) | 5,205 | 993,531 | ||||||||
Leju Holdings Ltd. ADR | 5 | 26 | ||||||||
Sohu.com, Inc. (a),(c) | 13,300 | 658,882 | ||||||||
Zhaopin Ltd. ADR (a),(c) | 40 | 635 | ||||||||
|
| |||||||||
| 1,653,074 | ||||||||||
|
| |||||||||
See Notes to Consolidated Financial Statements.
14
Blackstone Alternative Multi-Manager Fund and Subsidiaries
Consolidated Schedule of Investments (Continued)
March 31, 2016
Security Description | Shares | Value | ||||||||
Passenger Transportation — 0.0% | ||||||||||
China Southern Airlines Co. Ltd. ADR | 1,700 | $ | 53,108 | |||||||
Guangshen Railway Co. Ltd. ADR | 200 | 4,282 | ||||||||
|
| |||||||||
| 57,390 | ||||||||||
|
| |||||||||
Real Estate — 0.0% | ||||||||||
Xinyuan Real Estate Co. Ltd. ADR (c) | 9,900 | 43,857 | ||||||||
|
| |||||||||
Total China | 1,966,688 | |||||||||
|
| |||||||||
Cyprus — 0.0% | ||||||||||
Oil, Gas & Coal — 0.0% | ||||||||||
Ocean Rig UDW, Inc. | 2,300 | 1,887 | ||||||||
|
| |||||||||
Total Cyprus | 1,887 | |||||||||
|
| |||||||||
Greece — 0.1% | ||||||||||
Oil, Gas & Coal — 0.0% | ||||||||||
DryShips, Inc. (a) | 52 | 122 | ||||||||
|
| |||||||||
Transportation & Logistics — 0.1% | ||||||||||
Aegean Marine Petroleum Network, Inc. | 8,100 | 61,317 | ||||||||
Costamare, Inc. | 10,700 | 95,230 | ||||||||
Paragon Shipping, Inc. Class A (a) | 10 | 6 | ||||||||
Safe Bulkers, Inc. | 10,600 | 8,517 | ||||||||
StealthGas, Inc. (a) | 2,100 | 7,413 | ||||||||
Tsakos Energy Navigation Ltd. | 17,100 | 105,678 | ||||||||
|
| |||||||||
| 278,161 | ||||||||||
|
| |||||||||
Total Greece | 278,283 | |||||||||
|
| |||||||||
Hong Kong — 0.0% | ||||||||||
Media — 0.0% | ||||||||||
Global Sources Ltd. (a) | 585 | 4,738 | ||||||||
|
| |||||||||
Total Hong Kong | 4,738 | |||||||||
|
| |||||||||
India — 0.0% | ||||||||||
Metals & Mining — 0.0% | ||||||||||
Vedanta Ltd. ADR (c) | 20 | 110 | ||||||||
|
| |||||||||
Total India | 110 | |||||||||
|
| |||||||||
Ireland — 0.1% | ||||||||||
Biotechnology & Pharmaceuticals — 0.1% | ||||||||||
Shire PLC ADR | 1,490 | 256,131 | ||||||||
|
| |||||||||
Medical Equipment & Devices — 0.0% | ||||||||||
Trinity Biotech PLC ADR | 3,300 | 38,478 | ||||||||
|
| |||||||||
See Notes to Consolidated Financial Statements.
15
Blackstone Alternative Multi-Manager Fund and Subsidiaries
Consolidated Schedule of Investments (Continued)
March 31, 2016
Security Description | Shares | Value | ||||||||
Passenger Transportation — 0.0% | ||||||||||
Ryanair Holdings PLC ADR | 37 | $ | 3,175 | |||||||
|
| |||||||||
Total Ireland | 297,784 | |||||||||
|
| |||||||||
Israel — 0.3% | ||||||||||
Biotechnology & Pharmaceuticals — 0.3% | ||||||||||
Teva Pharmaceutical Industries Ltd. ADR (b) | 33,354 | 1,784,773 | ||||||||
|
| |||||||||
Electrical Equipment — 0.0% | ||||||||||
Orbotech Ltd. (a) | 8,000 | 190,240 | ||||||||
|
| |||||||||
Hardware — 0.0% | ||||||||||
AudioCodes Ltd. (a) | 1,000 | 4,650 | ||||||||
Ceragon Networks Ltd. (a) | 100 | 127 | ||||||||
Silicom Ltd. | 100 | 3,414 | ||||||||
|
| |||||||||
| 8,191 | ||||||||||
|
| |||||||||
Medical Equipment & Devices — 0.0% | ||||||||||
Syneron Medical Ltd. (a) | 5,200 | 38,012 | ||||||||
|
| |||||||||
Semiconductors — 0.0% | ||||||||||
Nova Measuring Instruments Ltd. (a) | 1,500 | 15,615 | ||||||||
|
| |||||||||
Software — 0.0% | ||||||||||
Attunity Ltd. (a) | 400 | 2,864 | ||||||||
Mind CTI Ltd. | 100 | 202 | ||||||||
Sapiens International Corp. NV | 400 | 4,792 | ||||||||
|
| |||||||||
| 7,858 | ||||||||||
|
| |||||||||
Technology Services — 0.0% | ||||||||||
Magic Software Enterprises Ltd. | 1,200 | 8,124 | ||||||||
|
| |||||||||
Telecommunications — 0.0% | ||||||||||
Allot Communications Ltd. (a) | 300 | 1,569 | ||||||||
|
| |||||||||
Total Israel | 2,054,382 | |||||||||
|
| |||||||||
Italy — 0.1% | ||||||||||
Telecommunications — 0.1% | ||||||||||
Telecom Italia SpA (b) | 396,323 | 427,525 | ||||||||
|
| |||||||||
Total Italy | 427,525 | |||||||||
|
| |||||||||
Japan — 0.6% | ||||||||||
Automotive — 0.1% | ||||||||||
Aisin Seiki Co. Ltd. (d) | 2,700 | 101,719 | ||||||||
Mazda Motor Corp. (d) | 34,700 | 538,483 | ||||||||
|
| |||||||||
| 640,202 | ||||||||||
|
| |||||||||
See Notes to Consolidated Financial Statements.
16
Blackstone Alternative Multi-Manager Fund and Subsidiaries
Consolidated Schedule of Investments (Continued)
March 31, 2016
Security Description | Shares | Value | ||||||||
Chemicals — 0.0% | ||||||||||
Nitto Denko Corp. (d) | 1,000 | $ | 55,595 | |||||||
|
| |||||||||
Consumer Products — 0.0% | ||||||||||
Ajinomoto Co., Inc. | 13,000 | 293,336 | ||||||||
|
| |||||||||
Electrical Equipment — 0.1% | ||||||||||
Daikin Industries Ltd. (d) | 4,800 | 358,769 | ||||||||
Keyence Corp. (d) | 200 | 109,094 | ||||||||
SMC Corp. (d) | 400 | 92,905 | ||||||||
|
| |||||||||
| 560,768 | ||||||||||
|
| |||||||||
Hardware — 0.1% | ||||||||||
Panasonic Corp. (d) | 20,200 | 185,497 | ||||||||
Sony Corp. (d) | 9,500 | 244,200 | ||||||||
|
| |||||||||
| 429,697 | ||||||||||
|
| |||||||||
Passenger Transportation — 0.1% | ||||||||||
ANA Holdings, Inc. | 171,000 | 481,799 | ||||||||
|
| |||||||||
Real Estate — 0.2% | ||||||||||
Mitsubishi Estate Co. Ltd. (d) | 36,000 | 668,692 | ||||||||
Mitsui Fudosan Co. Ltd. | 28,000 | 698,601 | ||||||||
|
| |||||||||
| 1,367,293 | ||||||||||
|
| |||||||||
Total Japan | 3,828,690 | |||||||||
|
| |||||||||
Luxembourg — 0.0% | ||||||||||
Consumer Products — 0.0% | ||||||||||
Adecoagro SA (a) | 1,100 | 12,705 | ||||||||
|
| |||||||||
Iron & Steel — 0.0% | ||||||||||
Ternium SA ADR (c) | 7,700 | 138,446 | ||||||||
|
| |||||||||
Total Luxembourg | 151,151 | |||||||||
|
| |||||||||
Netherlands — 0.2% | ||||||||||
Media — 0.1% | ||||||||||
Altice NV (a) | 30,650 | 546,490 | ||||||||
|
| |||||||||
Metals & Mining — 0.0% | ||||||||||
Constellium NV Class A (a) | 4,900 | 25,431 | ||||||||
|
| |||||||||
Semiconductors — 0.0% | ||||||||||
NXP Semiconductor NV (a) | 43 | 3,486 | ||||||||
|
| |||||||||
Telecommunications — 0.1% | ||||||||||
Koninklijke KPN NV | 186,872 | 783,159 | ||||||||
|
| |||||||||
Total Netherlands | 1,358,566 | |||||||||
|
| |||||||||
See Notes to Consolidated Financial Statements.
17
Blackstone Alternative Multi-Manager Fund and Subsidiaries
Consolidated Schedule of Investments (Continued)
March 31, 2016
Security Description | Shares | Value | ||||||||
Puerto Rico — 0.0% | ||||||||||
Banking — 0.0% | ||||||||||
First BanCorp (a) | 15,400 | $ | 44,968 | |||||||
Popular, Inc. | 1,081 | 30,927 | ||||||||
|
| |||||||||
| 75,895 | ||||||||||
|
| |||||||||
Health Care Facilities & Services — 0.0% | ||||||||||
Triple-S Management Corp. B Shares (a) | 2,400 | 59,664 | ||||||||
|
| |||||||||
Technology Services — 0.0% | ||||||||||
Evertec, Inc. | 4,500 | 62,910 | ||||||||
|
| |||||||||
Total Puerto Rico | 198,469 | |||||||||
|
| |||||||||
Russian Federation — 0.0% | ||||||||||
Media — 0.0% | ||||||||||
Yandex NV A Shares (a) | 900 | 13,788 | ||||||||
|
| |||||||||
Total Russian Federation | 13,788 | |||||||||
|
| |||||||||
Singapore — 0.2% | ||||||||||
Machinery — 0.0% | ||||||||||
China Yuchai International Ltd. | 1,202 | 11,840 | ||||||||
|
| |||||||||
Semiconductors — 0.2% | ||||||||||
Broadcom Ltd. | 7,397 | 1,142,836 | ||||||||
Kulicke & Soffa Industries, Inc. (a),(c) | 10,400 | 117,728 | ||||||||
|
| |||||||||
Total Singapore | 1,272,404 | |||||||||
|
| |||||||||
South Africa — 0.1% | ||||||||||
Metals & Mining — 0.1% | ||||||||||
AngloGold Ashanti Ltd. ADR (a) | 16,700 | 228,623 | ||||||||
Gold Fields Ltd. ADR (c) | 54,200 | 213,548 | ||||||||
Harmony Gold Mining Co. Ltd. ADR (c) | 12,400 | 45,136 | ||||||||
|
| |||||||||
| 487,307 | ||||||||||
|
| |||||||||
Specialty Finance — 0.0% | ||||||||||
Net 1 UEPS Technologies, Inc. (a),(c) | 13,700 | 126,040 | ||||||||
|
| |||||||||
Total South Africa | 613,347 | |||||||||
|
| |||||||||
Taiwan — 0.0% | ||||||||||
Hardware — 0.0% | ||||||||||
AU Optronics Corp. ADR | 8,800 | 25,960 | ||||||||
|
| |||||||||
Semiconductors — 0.0% | ||||||||||
ChipMOS Technologies Bermuda Ltd. | 300 | 5,214 | ||||||||
United Microelectronics Corp. ADR (c) | 13,894 | 28,900 | ||||||||
|
| |||||||||
| 34,114 | ||||||||||
|
| |||||||||
Total Taiwan | 60,074 | |||||||||
|
| |||||||||
See Notes to Consolidated Financial Statements.
18
Blackstone Alternative Multi-Manager Fund and Subsidiaries
Consolidated Schedule of Investments (Continued)
March 31, 2016
Security Description | Shares | Value | ||||||||
Thailand — 0.0% | ||||||||||
Design, Manufacturing & Distribution — 0.0% | ||||||||||
Fabrinet (a) | 7,300 | $ | 236,155 | |||||||
|
| |||||||||
Total Thailand | 236,155 | |||||||||
|
| |||||||||
United Kingdom — 0.4% | ||||||||||
Banking — 0.1% | ||||||||||
HSBC Holdings PLC | 72,800 | 454,217 | ||||||||
|
| |||||||||
Gaming, Lodging & Restaurants — 0.0% | ||||||||||
Belmond Ltd. Class A (a) | 8,400 | 79,716 | ||||||||
|
| |||||||||
Insurance — 0.0% | ||||||||||
Prudential PLC ADR | 48 | 1,786 | ||||||||
|
| |||||||||
Media — 0.3% | ||||||||||
Liberty Global PLC (a) | 40,552 | 1,523,133 | ||||||||
|
| |||||||||
Oil, Gas & Coal — 0.0% | ||||||||||
Seadrill Ltd. (a) | 45,600 | 150,480 | ||||||||
|
| |||||||||
Recreation Facilities & Services — 0.0% | ||||||||||
Manchester United PLC Class A | 200 | 2,888 | ||||||||
|
| |||||||||
Total United Kingdom | 2,212,220 | |||||||||
|
| |||||||||
United States — 13.9% | ||||||||||
Aerospace & Defense — 0.0% | ||||||||||
B/E Aerospace, Inc. | 4,100 | 189,092 | ||||||||
Ducommun, Inc. (a) | 200 | 3,050 | ||||||||
Orbital ATK, Inc. (c) | 1 | 87 | ||||||||
|
| |||||||||
| 192,229 | ||||||||||
|
| |||||||||
Apparel & Textile Products — 0.0% | ||||||||||
Albany International Corp. Class A | 200 | 7,518 | ||||||||
Culp, Inc. | 1,300 | 34,086 | ||||||||
Perry Ellis International, Inc. (a),(c) | 3,600 | 66,276 | ||||||||
Rocky Brands, Inc. | 100 | 1,274 | ||||||||
Vince Holding Corp. (a),(c) | 11,100 | 70,263 | ||||||||
|
| |||||||||
| 179,417 | ||||||||||
|
| |||||||||
Asset Management — 0.3% | ||||||||||
Apollo Investment Corp. | 400 | 2,220 | ||||||||
Ares Capital Corp. | 500 | 7,420 | ||||||||
BlackRock Kelso Capital Corp. | 18,600 | 175,026 | ||||||||
Calamos Asset Management, Inc. Class A (c) | 4,800 | 40,752 | ||||||||
Capitala Finance Corp. | 3,700 | 44,400 | ||||||||
Charles Schwab Corp. (c) | 11,721 | 328,422 | ||||||||
Fidus Investment Corp. | 2,500 | 38,775 | ||||||||
See Notes to Consolidated Financial Statements.
19
Blackstone Alternative Multi-Manager Fund and Subsidiaries
Consolidated Schedule of Investments (Continued)
March 31, 2016
Security Description | Shares | Value | ||||||||
Fifth Street Finance Corp. | 6,100 | $ | 30,622 | |||||||
Firsthand Technology Value Fund, Inc. (a) | 600 | 4,500 | ||||||||
Garrison Capital, Inc. (c) | 2,800 | 30,044 | ||||||||
Gladstone Capital Corp. (c) | 6,100 | 45,445 | ||||||||
Gladstone Investment Corp. (c) | 7,000 | 49,140 | ||||||||
Horizon Technology Finance Corp. (c) | 2,800 | 32,508 | ||||||||
KCAP Financial, Inc. (c) | 6,000 | 21,600 | ||||||||
Legg Mason, Inc. | 13,000 | 450,840 | ||||||||
Manning & Napier, Inc. | 500 | 4,035 | ||||||||
Medallion Financial Corp. (c) | 9,800 | 90,454 | ||||||||
Monroe Capital Corp. | 200 | 2,770 | ||||||||
MVC Capital, Inc. | 1,400 | 10,444 | ||||||||
OHA Investment Corp. (c) | 1,200 | 4,068 | ||||||||
Oppenheimer Holdings, Inc. Class A | 200 | 3,156 | ||||||||
PennantPark Floating Rate Capital Ltd. | 3,446 | 40,318 | ||||||||
PennantPark Investment Corp. (c) | 20,600 | 124,836 | ||||||||
Solar Capital Ltd. (c) | 5,400 | 93,312 | ||||||||
Solar Senior Capital Ltd. (c) | 1,600 | 23,328 | ||||||||
Stellus Capital Investment Corp. (c) | 1,900 | 19,418 | ||||||||
THL Credit, Inc. | 5,100 | 55,233 | ||||||||
TICC Capital Corp. (c) | 13,797 | 66,226 | ||||||||
TPG Specialty Lending, Inc. | 100 | 1,613 | ||||||||
Triangle Capital Corp. | 400 | 8,232 | ||||||||
TriplePoint Venture Growth BDC Corp. | 3,700 | 38,850 | ||||||||
WhiteHorse Finance, Inc. | 1,653 | 17,158 | ||||||||
|
| |||||||||
| 1,905,165 | ||||||||||
|
| |||||||||
Automotive — 0.0% | ||||||||||
Cooper-Standard Holding, Inc. (a) | 1,700 | 122,128 | ||||||||
Horizon Global Corp. (a) | 1,000 | 12,580 | ||||||||
Modine Manufacturing Co. (a) | 1,800 | 19,818 | ||||||||
Tenneco, Inc. (a),(c) | 200 | 10,302 | ||||||||
Tower International, Inc. (c) | 3,300 | 89,760 | ||||||||
|
| |||||||||
| 254,588 | ||||||||||
|
| |||||||||
Banking — 0.1% | ||||||||||
Arrow Financial Corp. | 516 | 13,710 | ||||||||
Bancorp, Inc. (a) | 600 | 3,432 | ||||||||
Bank Mutual Corp. (c) | 2,900 | 21,953 | ||||||||
BB&T Corp. | 1 | 33 | ||||||||
CU Bancorp (a) | 200 | 4,234 | ||||||||
Farmers Capital Bank Corp. | 100 | 2,642 | ||||||||
Fidelity Southern Corp. | 1,000 | 16,040 | ||||||||
First Bancorp/Southern Pines | 300 | 5,655 | ||||||||
First Business Financial Services, Inc. | 400 | 9,172 | ||||||||
First Community Bancshares, Inc. | 1,400 | 27,776 | ||||||||
See Notes to Consolidated Financial Statements.
20
Blackstone Alternative Multi-Manager Fund and Subsidiaries
Consolidated Schedule of Investments (Continued)
March 31, 2016
Security Description | Shares | Value | ||||||||
First Defiance Financial Corp. | 200 | $ | 7,682 | |||||||
First Financial Northwest, Inc. | 900 | 11,853 | ||||||||
First Interstate BancSystem, Inc. Class A | 100 | 2,813 | ||||||||
Franklin Financial Network, Inc. (a) | 500 | 13,500 | ||||||||
Great Western Bancorp, Inc. (c) | 300 | 8,181 | ||||||||
Guaranty Bancorp | 400 | 6,184 | ||||||||
Heritage Commerce Corp. | 700 | 7,007 | ||||||||
Independent Bank Corp. (c) | 2,700 | 39,285 | ||||||||
Independent Bank Group, Inc. | 400 | 10,960 | ||||||||
Investors Bancorp, Inc. | 10 | 116 | ||||||||
Mercantile Bank Corp. | 1,100 | 24,662 | ||||||||
National Bankshares, Inc. | 100 | 3,432 | ||||||||
Northrim BanCorp, Inc. | 800 | 19,128 | ||||||||
Opus Bank | 400 | 13,600 | ||||||||
Pacific Premier Bancorp, Inc. (a) | 1,900 | 40,603 | ||||||||
Preferred Bank | 600 | 18,150 | ||||||||
Southwest Bancorp, Inc. | 2,300 | 34,615 | ||||||||
Stonegate Bank | 200 | 5,992 | ||||||||
Territorial Bancorp, Inc. (c) | 100 | 2,606 | ||||||||
Towne Bank | 40 | 768 | ||||||||
TriState Capital Holdings, Inc. (a),(c) | 1,600 | 20,160 | ||||||||
Triumph Bancorp, Inc. (a) | 1,000 | 15,830 | ||||||||
Umpqua Holdings Corp. | 35 | 555 | ||||||||
Union Bankshares Corp. (c) | 38 | 936 | ||||||||
United Financial Bancorp, Inc. | 20 | 252 | ||||||||
Univest Corp. of Pennsylvania | 500 | 9,755 | ||||||||
Valley National Bancorp | 12 | 115 | ||||||||
Wilshire Bancorp, Inc. | 600 | 6,180 | ||||||||
|
| |||||||||
| 429,567 | ||||||||||
|
| |||||||||
Biotechnology & Pharmaceuticals — 2.6% | ||||||||||
Acorda Therapeutics, Inc. (a) | 3,800 | 100,510 | ||||||||
Alexion Pharmaceuticals, Inc. (a),(b),(c),(d) | 7,380 | 1,027,444 | ||||||||
Alkermes PLC (a) | 5,200 | 177,788 | ||||||||
Allergan PLC (a),(b) | 5,042 | 1,351,407 | ||||||||
Amphastar Pharmaceuticals, Inc. (a) | 2,800 | 33,600 | ||||||||
Anacor Pharmaceuticals, Inc. (a),(d) | 9,980 | 533,431 | ||||||||
Anika Therapeutics, Inc. (a) | 600 | 26,832 | ||||||||
Applied Genetic Technologies Corp. (a) | 200 | 2,796 | ||||||||
ArQule, Inc. (a) | 3,000 | 4,800 | ||||||||
Array BioPharma, Inc. (a) | 7,700 | 22,715 | ||||||||
Avalanche Biotechnologies, Inc. (a) | 400 | 2,068 | ||||||||
Baxalta, Inc. (c) | 41,630 | 1,681,852 | ||||||||
BioSpecifics Technologies Corp. (a) | 300 | 10,446 | ||||||||
Bristol-Myers Squibb Co. (b),(c),(d) | 20,260 | 1,294,209 | ||||||||
Celgene Corp. (a),(b),(c),(d) | 9,370 | 937,843 | ||||||||
See Notes to Consolidated Financial Statements.
21
Blackstone Alternative Multi-Manager Fund and Subsidiaries
Consolidated Schedule of Investments (Continued)
March 31, 2016
Security Description | Shares | Value | ||||||||
Chimerix, Inc. (a) | 400 | $ | 2,044 | |||||||
Corcept Therapeutics, Inc. (a) | 10,300 | 48,204 | ||||||||
Cytokinetics, Inc. (a) | 2,700 | 19,035 | ||||||||
Eiger BioPharmaceuticals, Inc. (a) | 420 | 7,043 | ||||||||
Endo International PLC (a) | 13,623 | 383,487 | ||||||||
Exelixis, Inc. (a) | 28,900 | 115,600 | ||||||||
Impax Laboratories, Inc. (a) | 4,400 | 140,888 | ||||||||
Incyte Corp. (a),(b),(c) | 16,400 | 1,188,508 | ||||||||
Inotek Pharmaceuticals Corp. (a) | 300 | 2,220 | ||||||||
Ionis Pharmaceuticals, Inc. (a) | 700 | 28,350 | ||||||||
Lexicon Pharmaceuticals, Inc. (a) | 15 | 179 | ||||||||
Mallinckrodt PLC (a),(b) | 44,040 | 2,698,771 | ||||||||
Medivation, Inc. (a),(b),(c) | 41,665 | 1,915,757 | ||||||||
Neothetics, Inc. (a) | 1,000 | 610 | ||||||||
Omega Protein Corp. (a),(c) | 4,200 | 71,148 | ||||||||
Osiris Therapeutics, Inc. | 100 | 571 | ||||||||
PDL BioPharma, Inc. | 18,700 | 62,271 | ||||||||
Perrigo Co. PLC (b) | 44 | 5,629 | ||||||||
Pfizer, Inc. (b),(d) | 33,090 | 980,788 | ||||||||
pSivida Corp. (a) | 100 | 268 | ||||||||
PTC Therapeutics, Inc. (a) | 12,100 | 77,924 | ||||||||
Retrophin, Inc. (a) | 1,400 | 19,124 | ||||||||
Rigel Pharmaceuticals, Inc. (a),(c) | 8,500 | 17,680 | ||||||||
SciClone Pharmaceuticals, Inc. (a),(c) | 3,900 | 42,900 | ||||||||
Sucampo Pharmaceuticals, Inc. Class A (a) | 500 | 5,465 | ||||||||
Tetraphase Pharmaceuticals, Inc. (a) | 100 | 463 | ||||||||
Threshold Pharmaceuticals, Inc. (a) | 10,200 | 4,692 | ||||||||
Verastem, Inc. (a) | 1,800 | 2,844 | ||||||||
Vertex Pharmaceuticals, Inc. (a),(b),(c) | 3,600 | 286,164 | ||||||||
Vical, Inc. (a) | 4,800 | 1,877 | ||||||||
XOMA Corp. (a),(c) | 37,600 | 29,065 | ||||||||
Zoetis, Inc. (b),(c) | 24,930 | 1,105,147 | ||||||||
|
| |||||||||
| 16,472,457 | ||||||||||
|
| |||||||||
Chemicals — 0.1% | ||||||||||
Albemarle Corp. | 26 | 1,662 | ||||||||
Chemours Co. (The) | 25,900 | 181,300 | ||||||||
EI du Pont de Nemours & Co. | 100 | 6,332 | ||||||||
FutureFuel Corp. | 600 | 7,074 | ||||||||
Innophos Holdings, Inc. | 1,900 | 58,729 | ||||||||
Intrepid Potash, Inc. (a),(c) | 8,600 | 9,546 | ||||||||
KMG Chemicals, Inc. | 1,200 | 27,684 | ||||||||
LSB Industries, Inc. (a) | 2,600 | 33,150 | ||||||||
OMNOVA Solutions, Inc. (a),(c) | 2,000 | 11,120 | ||||||||
Orion Engineered Carbons SA | 2,200 | 31,064 | ||||||||
Stepan Co. | 100 | 5,529 | ||||||||
See Notes to Consolidated Financial Statements.
22
Blackstone Alternative Multi-Manager Fund and Subsidiaries
Consolidated Schedule of Investments (Continued)
March 31, 2016
Security Description | Shares | Value | ||||||||
Trinseo SA (a) | 1,600 | $ | 58,896 | |||||||
|
| |||||||||
| 432,086 | ||||||||||
|
| |||||||||
Commercial Services — 0.1% | ||||||||||
ARAMARK Holdings Corp. (c) | 2,000 | 66,240 | ||||||||
ARC Document Solutions, Inc. (a),(c) | 7,200 | 32,400 | ||||||||
CDI Corp. (c) | 2,900 | 18,212 | ||||||||
Collectors Universe, Inc. (c) | 1,200 | 19,920 | ||||||||
Computer Task Group, Inc. (c) | 2,300 | 11,753 | ||||||||
CorVel Corp. (a) | 100 | 3,942 | ||||||||
CRA International, Inc. (a) | 2,600 | 51,064 | ||||||||
Cross Country Healthcare, Inc. (a) | 1,200 | 13,956 | ||||||||
Franklin Covey Co. (a) | 200 | 3,518 | ||||||||
Hackett Group, Inc. (c) | 2,100 | 31,752 | ||||||||
Heidrick & Struggles International, Inc. | 300 | 7,110 | ||||||||
Information Services Group, Inc. (a) | 500 | �� | 1,965 | |||||||
Insperity, Inc. (c) | 200 | 10,346 | ||||||||
Patriot National, Inc. (a) | 1,700 | 13,090 | ||||||||
PRGX Global, Inc. (a),(c) | 2,900 | 13,688 | ||||||||
Quad/Graphics, Inc. | 9,900 | 128,106 | ||||||||
ServiceMaster Global Holdings, Inc. (a),(c) | 300 | 11,304 | ||||||||
|
| |||||||||
| 438,366 | ||||||||||
|
| |||||||||
Construction Materials — 0.1% | ||||||||||
Apogee Enterprises, Inc. | 1,100 | 48,279 | ||||||||
Boise Cascade Co. (a) | 800 | 16,576 | ||||||||
Continental Building Products, Inc. (a) | 11,500 | 213,440 | ||||||||
Headwaters, Inc. (a),(c) | 10,900 | 216,256 | ||||||||
Patrick Industries, Inc. (a) | 1,200 | 54,468 | ||||||||
Universal Forest Products, Inc. (c) | 500 | 42,910 | ||||||||
|
| |||||||||
| 591,929 | ||||||||||
|
| |||||||||
Consumer Products — 0.1% | ||||||||||
Blue Buffalo Pet Products, Inc. (a) | 500 | 12,830 | ||||||||
Central Garden and Pet Co. Class A (a) | 1,300 | 21,177 | ||||||||
Craft Brew Alliance, Inc. (a) | 100 | 823 | ||||||||
Darling Ingredients, Inc. (a) | 200 | 2,634 | ||||||||
Female Health Co. (a) | 1,000 | 1,870 | ||||||||
Herbalife Ltd. (a) | 2,000 | 123,120 | ||||||||
John B. Sanfilippo & Son, Inc. | 1,000 | 69,090 | ||||||||
Mead Johnson Nutrition Co. (b) | 4,981 | 423,235 | ||||||||
Revlon, Inc. Class A (a) | 400 | 14,564 | ||||||||
|
| |||||||||
| 669,343 | ||||||||||
|
| |||||||||
Consumer Services — 0.1% | ||||||||||
American Public Education, Inc. (a) | 4,700 | 96,961 | ||||||||
See Notes to Consolidated Financial Statements.
23
Blackstone Alternative Multi-Manager Fund and Subsidiaries
Consolidated Schedule of Investments (Continued)
March 31, 2016
Security Description | Shares | Value | ||||||||
Apollo Education Group, Inc. (a) | 37,300 | $ | 306,419 | |||||||
Bridgepoint Education, Inc. (a),(c) | 3,700 | 37,296 | ||||||||
Capella Education Co. | 2,300 | 121,072 | ||||||||
Career Education Corp. (a) | 1,400 | 6,356 | ||||||||
Carriage Services, Inc. (c) | 900 | 19,449 | ||||||||
K12, Inc. (a) | 1,200 | 11,868 | ||||||||
Universal Technical Institute, Inc. | 2,200 | 9,482 | ||||||||
|
| |||||||||
| 608,903 | ||||||||||
|
| |||||||||
Containers & Packaging — 0.3% | ||||||||||
AEP Industries, Inc. | 300 | 19,800 | ||||||||
Berry Plastics Group, Inc. (a),(c) | 29,900 | 1,080,885 | ||||||||
Graphic Packaging Holding Co. (c) | 48,700 | 625,795 | ||||||||
|
| |||||||||
| 1,726,480 | ||||||||||
|
| |||||||||
Design, Manufacturing & Distribution — 0.1% | ||||||||||
Flextronics International Ltd. (a) | 37,100 | 447,426 | ||||||||
|
| |||||||||
Distributors—Discretionary — 0.0% | ||||||||||
Bassett Furniture Industries, Inc. | 700 | 22,302 | ||||||||
Insight Enterprises, Inc. (a),(c) | 1,300 | 37,232 | ||||||||
ScanSource, Inc. (a),(c) | 500 | 20,190 | ||||||||
|
| |||||||||
| 79,724 | ||||||||||
|
| |||||||||
Electrical Equipment — 0.2% | ||||||||||
Allegion PLC | 20,000 | 1,274,200 | ||||||||
American Science & Engineering, Inc. | 400 | 11,076 | ||||||||
Babcock & Wilcox Enterprises, Inc. (a) | 2,700 | 57,780 | ||||||||
Checkpoint Systems, Inc. (a),(c) | 6,000 | 60,720 | ||||||||
FARO Technologies, Inc. (a) | 400 | 12,884 | ||||||||
Global Power Equipment Group, Inc. (a) | 400 | 800 | ||||||||
Houston Wire & Cable Co. | 2,700 | 18,873 | ||||||||
LSI Industries, Inc. | 1,800 | 21,150 | ||||||||
Powell Industries, Inc. | 100 | 2,981 | ||||||||
|
| |||||||||
| 1,460,464 | ||||||||||
|
| |||||||||
Engineering & Construction Services — 0.0% | ||||||||||
AECOM Technology Corp. (a) | 32 | 985 | ||||||||
Great Lakes Dredge & Dock Corp. (a) | 1,700 | 7,582 | ||||||||
Kratos Defense & Security Solutions, Inc. (a) | 800 | 3,960 | ||||||||
Mistras Group, Inc. (a),(c) | 1,700 | 42,109 | ||||||||
MYR Group, Inc. (a) | 2,500 | 62,775 | ||||||||
Orion Marine Group, Inc. (a) | 5,700 | 29,526 | ||||||||
Sterling Construction Co., Inc. (a) | 700 | 3,605 | ||||||||
TopBuild Corp. (a) | 1,055 | 31,376 | ||||||||
TRC Cos., Inc. (a) | 100 | 725 | ||||||||
See Notes to Consolidated Financial Statements.
24
Blackstone Alternative Multi-Manager Fund and Subsidiaries
Consolidated Schedule of Investments (Continued)
March 31, 2016
Security Description | Shares | Value | ||||||||
Tutor Perini Corp. (a),(c) | 1,100 | $ | 17,094 | |||||||
|
| |||||||||
| 199,737 | ||||||||||
|
| |||||||||
Forest & Paper Products — 0.0% | ||||||||||
Resolute Forest Products, Inc. (a) | 2,400 | 13,224 | ||||||||
|
| |||||||||
Gaming, Lodging & Restaurants — 0.2% | ||||||||||
Bravo Brio Restaurant Group, Inc. (a) | 3,200 | 24,800 | ||||||||
Caesars Acquisition Co. Class A (a) | 3,200 | 19,584 | ||||||||
Caesars Entertainment Corp. (a) | 9,400 | 63,920 | ||||||||
Carrols Restaurant Group, Inc. (a) | 8,200 | 118,408 | ||||||||
Churchill Downs, Inc. | 2,700 | 399,276 | ||||||||
Del Frisco’s Restaurant Group, Inc. (a) | 800 | 13,264 | ||||||||
Denny’s Corp. (a),(c) | 9,000 | 93,240 | ||||||||
Domino’s Pizza, Inc. (c) | 1,500 | 197,790 | ||||||||
Eldorado Resorts, Inc. (a) | 2,500 | 28,600 | ||||||||
Famous Dave’s of America, Inc. (a) | 700 | 4,263 | ||||||||
Isle of Capri Casinos, Inc. (a),(c) | 18,500 | 259,000 | ||||||||
Monarch Casino & Resort, Inc. (a) | 1,500 | 29,190 | ||||||||
|
| |||||||||
| 1,251,335 | ||||||||||
|
| |||||||||
Hardware — 0.7% | ||||||||||
Apple, Inc. | 4,544 | 495,250 | ||||||||
Clearfield, Inc. (a) | 600 | 9,642 | ||||||||
Comtech Telecommunications Corp. (c) | 2,900 | 67,773 | ||||||||
Daktronics, Inc. (c) | 400 | 3,160 | ||||||||
Datalink Corp. (a) | 3,700 | 33,818 | ||||||||
Dolby Laboratories, Inc. Class A (c) | 8,700 | 378,102 | ||||||||
Eastman Kodak Co. (a) | 100 | 1,085 | ||||||||
Emcore Corp. (a) | 12,800 | 64,000 | ||||||||
Finisar Corp. (a) | 22,400 | 408,576 | ||||||||
Harmonic, Inc. (a) | 300 | 981 | ||||||||
HP, Inc. | 2,100 | 25,872 | ||||||||
Hutchinson Technology, Inc. (a) | 2,300 | 8,418 | ||||||||
Imation Corp. (a) | 1,700 | 2,635 | ||||||||
Immersion Corp. (a) | 3,600 | 29,736 | ||||||||
Imprivata, Inc. (a) | 1,100 | 13,893 | ||||||||
KVH Industries, Inc. (a) | 600 | 5,730 | ||||||||
Lumentum Holdings, Inc. (a) | 7,000 | 188,790 | ||||||||
Mercury Systems, Inc. (a),(c) | 2,000 | 40,600 | ||||||||
Multi-Fineline Electronix, Inc. (a) | 1,500 | 34,815 | ||||||||
Rovi Corp. (a) | 24,200 | 496,342 | ||||||||
ShoreTel, Inc. (a),(c) | 6,900 | 51,336 | ||||||||
Skullcandy, Inc. (a),(c) | 3,100 | 11,036 | ||||||||
Sonus Networks, Inc. (a) | 8,700 | 65,511 | ||||||||
Stratasys Ltd. (a) | 6,267 | 162,441 | ||||||||
Telenav, Inc. (a),(c) | 1,900 | 11,210 | ||||||||
See Notes to Consolidated Financial Statements.
25
Blackstone Alternative Multi-Manager Fund and Subsidiaries
Consolidated Schedule of Investments (Continued)
March 31, 2016
Security Description | Shares | Value | ||||||||
Viavi Solutions, Inc. (a) | 8,500 | $ | 58,310 | |||||||
Vicor Corp. (a) | 700 | 7,336 | ||||||||
Vishay Precision Group, Inc. (a) | 2,700 | 37,827 | ||||||||
Vocera Communications, Inc. (a) | 1,100 | 14,025 | ||||||||
VOXX International Corp. (a),(c) | 1,700 | 7,599 | ||||||||
Western Digital Corp. (c) | 34,600 | 1,634,504 | ||||||||
|
| |||||||||
| 4,370,353 | ||||||||||
|
| |||||||||
Health Care Facilities & Services — 1.7% | ||||||||||
Addus HomeCare Corp. (a) | 1,800 | 30,942 | ||||||||
Aetna, Inc. (b),(c),(d) | 7,790 | 875,207 | ||||||||
Alliance HealthCare Services, Inc. (a) | 900 | 6,471 | ||||||||
Almost Family, Inc. (a) | 1,000 | 37,240 | ||||||||
AmerisourceBergen Corp. (b),(c) | 8,300 | 718,365 | ||||||||
Digirad Corp. (c) | 1,600 | 7,936 | ||||||||
Five Star Quality Care, Inc. (a),(c) | 3,600 | 8,244 | ||||||||
Great Basin Scientific, Inc. (a) | 439 | 3,147 | ||||||||
HCA Holdings, Inc. (a),(b) | 18,700 | 1,459,535 | ||||||||
Healthways, Inc. (a) | 1,500 | 15,135 | ||||||||
Humana, Inc. (b),(c) | 6,978 | 1,276,625 | ||||||||
Laboratory Corp. of America Holdings (a),(b),(d) | 18,570 | 2,175,104 | ||||||||
Magellan Health, Inc. (a) | 100 | 6,793 | ||||||||
McKesson Corp. (b) | 3,720 | 584,970 | ||||||||
Premier, Inc. Class A (a) | 100 | 3,336 | ||||||||
Quest Diagnostics, Inc. (b),(d) | 26,990 | 1,928,436 | ||||||||
RadNet, Inc. (a),(c) | 4,100 | 19,803 | ||||||||
Universal American Corp. | 4,600 | 32,844 | ||||||||
Universal Health Services, Inc. Class B (b),(c) | 11,650 | 1,452,988 | ||||||||
|
| |||||||||
| 10,643,121 | ||||||||||
|
| |||||||||
Home & Office Products — 0.2% | ||||||||||
American Woodmark Corp. (a),(c) | 4,000 | 298,360 | ||||||||
Armstrong World Industries, Inc. (a) | 12,600 | 609,462 | ||||||||
Hooker Furniture Corp. | 700 | 22,995 | ||||||||
Kimball International, Inc. Class B (c) | 2,800 | 31,780 | ||||||||
Libbey, Inc. (c) | 2,400 | 44,640 | ||||||||
Masco Corp. (c) | 8,000 | 251,600 | ||||||||
|
| |||||||||
| 1,258,837 | ||||||||||
|
| |||||||||
Industrial Services — 0.3% | ||||||||||
Electro Rent Corp. | 1,600 | 14,816 | ||||||||
HD Supply Holdings, Inc. (a),(c) | 38,700 | 1,279,809 | ||||||||
WESCO International, Inc. (a),(c) | 13,500 | 738,045 | ||||||||
|
| |||||||||
| 2,032,670 | ||||||||||
|
| |||||||||
See Notes to Consolidated Financial Statements.
26
Blackstone Alternative Multi-Manager Fund and Subsidiaries
Consolidated Schedule of Investments (Continued)
March 31, 2016
Security Description | Shares | Value | ||||||||
Institutional Financial Services — 0.0% | ||||||||||
KCG Holdings, Inc. Class A (a) | 2,100 | $ | 25,095 | |||||||
Piper Jaffray Cos. (a) | 2,000 | 99,120 | ||||||||
|
| |||||||||
| 124,215 | ||||||||||
|
| |||||||||
Insurance — 0.1% | ||||||||||
American Equity Investment Life Holding Co. | 1,800 | 30,240 | ||||||||
Assured Guaranty Ltd. | 23,600 | 597,080 | ||||||||
Citizens, Inc. (a) | 200 | 1,448 | ||||||||
Crawford & Co. Class B | 200 | 1,296 | ||||||||
Employers Holdings, Inc. | 4,100 | 115,374 | ||||||||
Genworth Financial, Inc. Class A (a) | 34,300 | 93,639 | ||||||||
OneBeacon Insurance Group Ltd. Class A | 1,200 | 15,276 | ||||||||
Willis Towers Watson plc | 18 | 2,136 | ||||||||
|
| |||||||||
| 856,489 | ||||||||||
|
| |||||||||
Iron & Steel — 0.0% | ||||||||||
Northwest Pipe Co. (a) | 100 | 922 | ||||||||
Ryerson Holding Corp. (a) | 600 | 3,336 | ||||||||
Shiloh Industries, Inc. (a) | 800 | 4,104 | ||||||||
SunCoke Energy, Inc. | 8,000 | 52,000 | ||||||||
United States Steel Corp. | 2,200 | 35,310 | ||||||||
|
| |||||||||
| 95,672 | ||||||||||
|
| |||||||||
Leisure Products — 0.0% | ||||||||||
Black Diamond, Inc. (a) | 400 | 1,808 | ||||||||
Johnson Outdoors, Inc. Class A | 100 | 2,222 | ||||||||
LeapFrog Enterprises, Inc. (a) | 4,200 | 4,179 | ||||||||
Vista Outdoor, Inc. (a) | 22 | 1,142 | ||||||||
|
| |||||||||
| 9,351 | ||||||||||
|
| |||||||||
Machinery — 0.2% | ||||||||||
Alamo Group, Inc. | 100 | 5,571 | ||||||||
Columbus McKinnon Corp. | 800 | 12,608 | ||||||||
Federal Signal Corp. | 2,900 | 38,454 | ||||||||
Graham Corp. | 800 | 15,928 | ||||||||
Intevac, Inc. (a) | 1,000 | 4,500 | ||||||||
Joy Global, Inc. | 58,500 | 940,095 | ||||||||
Kadant, Inc. | 1,000 | 45,160 | ||||||||
Rofin-Sinar Technologies, Inc. (a),(c) | 1,200 | 38,664 | ||||||||
SPX Corp. | 5,800 | 87,116 | ||||||||
SPX FLOW, Inc. (a) | 2,300 | 57,684 | ||||||||
Xerium Technologies, Inc. (a) | 2,600 | 13,572 | ||||||||
|
| |||||||||
| 1,259,352 | ||||||||||
|
| |||||||||
See Notes to Consolidated Financial Statements.
27
Blackstone Alternative Multi-Manager Fund and Subsidiaries
Consolidated Schedule of Investments (Continued)
March 31, 2016
Security Description | Shares | Value | ||||||||
Manufactured Goods — 0.1% | ||||||||||
Aegion Corp. (a),(c) | 900 | $ | 18,981 | |||||||
Ampco-Pittsburgh Corp. (c) | 900 | 12,519 | ||||||||
Chart Industries, Inc. (a),(c) | 6,100 | 132,492 | ||||||||
Dynamic Materials Corp. (c) | 1,700 | 11,016 | ||||||||
Gibraltar Industries, Inc. (a) | 3,100 | 88,660 | ||||||||
Global Brass & Copper Holdings, Inc. | 300 | 7,485 | ||||||||
Insteel Industries, Inc. | 1,500 | 45,855 | ||||||||
LB Foster Co. Class A | 4,400 | 79,904 | ||||||||
|
| |||||||||
| 396,912 | ||||||||||
|
| |||||||||
Media — 0.6% | ||||||||||
A H Belo Corp. Class A | 1,600 | 7,696 | ||||||||
Autobytel, Inc. (a) | 1,700 | 29,512 | ||||||||
Bankrate, Inc. (a) | 3,200 | 29,344 | ||||||||
Boingo Wireless, Inc. (a),(c) | 3,000 | 23,160 | ||||||||
Cablevision Systems Corp. Class A (c) | 31,294 | 1,032,702 | ||||||||
Clear Channel Outdoor Holdings, Inc. Class A (c) | 6,400 | 30,080 | ||||||||
Comcast Corp. Class A (c) | 14,846 | 906,794 | ||||||||
Demand Media, Inc. (a) | 40 | 200 | ||||||||
Entercom Communications Corp. Class A (a) | 1,900 | 20,102 | ||||||||
Everyday Health, Inc. (a) | 600 | 3,360 | ||||||||
Gray Television, Inc. (a) | 2,900 | 33,988 | ||||||||
Harte-Hanks, Inc. (c) | 13,200 | 33,396 | ||||||||
Lee Enterprises, Inc. (a) | 100 | 180 | ||||||||
Liberty TripAdvisor Holdings, Inc. Class A (a) | 2,500 | 55,400 | ||||||||
McClatchy Co. Class A (a) | 2,600 | 2,730 | ||||||||
MDC Partners, Inc. Class A | 50 | 1,180 | ||||||||
MSG Networks, Inc. (a),(c) | 200 | 3,458 | ||||||||
News Corp. Class A (c) | 16,300 | 208,151 | ||||||||
RetailMeNot, Inc. (a) | 8,500 | 68,085 | ||||||||
Stamps.com, Inc. (a) | 1,000 | 106,280 | ||||||||
Starz (a) | 501 | 13,191 | ||||||||
TechTarget, Inc. (a),(c) | 3,200 | 23,744 | ||||||||
Time Warner Cable, Inc. (c) | 6,065 | 1,241,020 | ||||||||
WebMD Health Corp. (a),(c) | 1,700 | 106,471 | ||||||||
XO Group, Inc. (a),(c) | 3,500 | 56,175 | ||||||||
YuMe, Inc. (a) | 100 | 374 | ||||||||
|
| |||||||||
| 4,036,773 | ||||||||||
|
| |||||||||
Medical Equipment & Devices — 1.6% | ||||||||||
AngioDynamics, Inc. (a),(c) | 2,900 | 35,641 | ||||||||
CR Bard, Inc. (b),(d) | 5,545 | 1,123,805 | ||||||||
CryoLife, Inc. | 3,500 | 37,625 | ||||||||
Cutera, Inc. (a) | 1,300 | 14,625 | ||||||||
Dentsply Sirona, Inc. (b),(c) | 18,409 | 1,134,547 | ||||||||
See Notes to Consolidated Financial Statements.
28
Blackstone Alternative Multi-Manager Fund and Subsidiaries
Consolidated Schedule of Investments (Continued)
March 31, 2016
Security Description | Shares | Value | ||||||||
Derma Sciences, Inc. (a) | 100 | $ | 310 | |||||||
DexCom, Inc. (a),(b),(c),(d) | 32,530 | 2,209,112 | ||||||||
Edwards Lifesciences Corp. (a),(b),(d) | 13,340 | 1,176,721 | ||||||||
Exactech, Inc. (a) | 1,300 | 26,338 | ||||||||
Genomic Health, Inc. (a) | 2,000 | 49,540 | ||||||||
Harvard Bioscience, Inc. (a) | 700 | 2,114 | ||||||||
HeartWare International, Inc. (a) | 2,700 | 84,834 | ||||||||
LeMaitre Vascular, Inc. | 200 | 3,104 | ||||||||
Luminex Corp. (a),(c) | 1,500 | 29,100 | ||||||||
Merit Medical Systems, Inc. (a) | 3,900 | 72,111 | ||||||||
NxStage Medical, Inc. (a) | 1,400 | 20,986 | ||||||||
OraSure Technologies, Inc. (a) | 15,600 | 112,788 | ||||||||
Orthofix International NV (a) | 3,200 | 132,864 | ||||||||
RTI Surgical, Inc. (a),(c) | 8,100 | 32,400 | ||||||||
SurModics, Inc. (a) | 2,000 | 36,820 | ||||||||
Thermo Fisher Scientific, Inc. (b),(d) | 6,700 | 948,653 | ||||||||
Waters Corp. (a),(b) | 1,908 | 251,703 | ||||||||
Wright Medical Group NV (a) | 6 | 100 | ||||||||
Zimmer Holdings, Inc. (b),(c),(d) | 22,050 | 2,351,192 | ||||||||
|
| |||||||||
| 9,887,033 | ||||||||||
|
| |||||||||
Metals & Mining — 0.1% | ||||||||||
Alcoa, Inc. | 96 | 920 | ||||||||
Century Aluminum Co. (a) | 8,000 | 56,400 | ||||||||
Ferroglobe PLC | 1,900 | 16,739 | ||||||||
Freeport-McMoRan, Inc. (c) | 56,200 | 581,108 | ||||||||
Stillwater Mining Co. (a) | 3,500 | 37,275 | ||||||||
|
| |||||||||
| 692,442 | ||||||||||
|
| |||||||||
Oil, Gas & Coal — 1.4% | ||||||||||
Archrock, Inc. | 2,300 | 18,400 | ||||||||
Atwood Oceanics, Inc. | 31,600 | 289,772 | ||||||||
Baker Hughes, Inc. (c) | 30,700 | 1,345,581 | ||||||||
Bill Barrett Corp. (a) | 2,600 | 16,172 | ||||||||
Bonanza Creek Energy, Inc. (a) | 1,900 | 3,021 | ||||||||
Bristow Group, Inc. | 1,300 | 24,596 | ||||||||
C&J Energy Services Ltd. (a) | 100 | 141 | ||||||||
California Resources Corp. | 222,258 | 228,926 | ||||||||
Chesapeake Energy Corp. | 204,600 | 842,952 | ||||||||
Civeo Corp. (a) | 300 | 369 | ||||||||
CONSOL Energy, Inc. | 33,500 | 378,215 | ||||||||
Contango Oil & Gas Co. (a) | 100 | 1,179 | ||||||||
Dawson Geophysical Co. (a) | 1,776 | 8,116 | ||||||||
Denbury Resources, Inc. | 73,700 | 163,614 | ||||||||
EP Energy Corp. Class A (a) | 6,000 | 27,120 | ||||||||
Evolution Petroleum Corp. (c) | 900 | 4,374 | ||||||||
See Notes to Consolidated Financial Statements.
29
Blackstone Alternative Multi-Manager Fund and Subsidiaries
Consolidated Schedule of Investments (Continued)
March 31, 2016
Security Description | Shares | Value | ||||||||
FMC Technologies, Inc. (a),(c) | 71,100 | $ | 1,945,296 | |||||||
Gulf Island Fabrication, Inc. | 3,200 | 25,120 | ||||||||
Gulfport Energy Corp. (a),(c) | 200 | 5,668 | ||||||||
Hallador Energy Co. | 300 | 1,371 | ||||||||
Helix Energy Solutions Group, Inc. (a) | 27,400 | 153,440 | ||||||||
ION Geophysical Corp. (a) | 200 | 1,616 | ||||||||
Kinder Morgan, Inc. | 16 | 286 | ||||||||
LinnCo LLC | 1,799 | 643 | ||||||||
Matrix Service Co. (a) | 3,100 | 54,870 | ||||||||
McDermott International, Inc. (a) | 700 | 2,863 | ||||||||
Mitcham Industries, Inc. (a) | 600 | 1,836 | ||||||||
MRC Global, Inc. (a) | 200 | 2,628 | ||||||||
Nabors Industries Ltd. | 38,300 | 352,360 | ||||||||
Natural Gas Services Group, Inc. (a) | 1,100 | 23,793 | ||||||||
Newfield Exploration Co. (a) | 4,100 | 136,325 | ||||||||
Newpark Resources, Inc. (a) | 8,700 | 37,584 | ||||||||
Noble Energy, Inc. | 16 | 503 | ||||||||
NOW, Inc. (a) | 3,000 | 53,160 | ||||||||
Oasis Petroleum, Inc. (a) | 200 | 1,456 | ||||||||
Oil States International, Inc. (a),(c) | 5,600 | 176,512 | ||||||||
Panhandle Oil and Gas, Inc. Class A | 100 | 1,731 | ||||||||
Peabody Energy Corp. | 8,986 | 20,847 | ||||||||
Pioneer Energy Services Corp. (a) | 100 | 220 | ||||||||
QEP Resources, Inc. | 20,300 | 286,433 | ||||||||
Rice Energy, Inc. (a) | 1,200 | 16,752 | ||||||||
SemGroup Corp. Class A | 1,000 | 22,400 | ||||||||
SM Energy Co. | 7,100 | 133,054 | ||||||||
Southwestern Energy Co. (a),(c) | 108,100 | 872,367 | ||||||||
Stone Energy Corp. (a) | 18,700 | 14,773 | ||||||||
Tesco Corp. (c) | 2,200 | 18,942 | ||||||||
TETRA Technologies, Inc. (a) | 5,000 | 31,750 | ||||||||
TransAtlantic Petroleum Ltd. (a) | 100 | 75 | ||||||||
Ultra Petroleum Corp. (a) | 30,600 | 15,239 | ||||||||
Unit Corp. (a) | 3,500 | 30,835 | ||||||||
VAALCO Energy, Inc. (a) | 3,600 | 3,384 | ||||||||
Warren Resources, Inc. (a) | 1,200 | 205 | ||||||||
Weatherford International PLC (a) | 10,800 | 84,024 | ||||||||
Whiting Petroleum Corp. (a) | 86,149 | 687,469 | ||||||||
|
| |||||||||
| 8,570,378 | ||||||||||
|
| |||||||||
Passenger Transportation — 0.2% | ||||||||||
Era Group, Inc. (a) | 100 | 938 | ||||||||
Hawaiian Holdings, Inc. (a),(c) | 1,400 | 66,066 | ||||||||
Spirit Airlines, Inc. (a),(c) | 21,838 | 1,047,787 | ||||||||
|
| |||||||||
| 1,114,791 | ||||||||||
|
| |||||||||
See Notes to Consolidated Financial Statements.
30
Blackstone Alternative Multi-Manager Fund and Subsidiaries
Consolidated Schedule of Investments (Continued)
March 31, 2016
Security Description | Shares | Value | ||||||||
Real Estate — 0.6% | ||||||||||
Armada Hoffler Properties, Inc. (c) | 8,600 | $ | 96,750 | |||||||
Ashford Hospitality Prime, Inc. | 35 | 408 | ||||||||
CBRE Group, Inc. (a),(c) | 4,700 | 135,454 | ||||||||
Equinix, Inc. | 49 | 16,205 | ||||||||
FelCor Lodging Trust, Inc. (c) | 13,000 | 105,560 | ||||||||
Gladstone Commercial Corp. (c) | 4,800 | 78,624 | ||||||||
InfraREIT, Inc. | 2,600 | 44,330 | ||||||||
Kite Realty Group Trust | 50 | 1,386 | ||||||||
Lamar Advertising Co. Class A (c),(d) | 22,513 | 1,384,549 | ||||||||
Mid-America Apartment Communities, Inc. | 24 | 2,453 | ||||||||
One Liberty Properties, Inc. | 200 | 4,482 | ||||||||
Parkway Properties Inc./Md | 38 | 595 | ||||||||
RE/MAX Holdings, Inc. Class A | 2 | 69 | ||||||||
Realogy Holdings Corp. (a) | 48,900 | 1,765,779 | ||||||||
Sunstone Hotel Investors, Inc. | 19 | 266 | ||||||||
VEREIT, Inc. | 40 | 355 | ||||||||
Weyerhaeuser Co. | 80 | 2,478 | ||||||||
|
| |||||||||
| 3,639,743 | ||||||||||
|
| |||||||||
Recreation Facilities & Services — 0.0% | ||||||||||
Intrawest Resorts Holdings, Inc. (a) | 694 | 5,934 | ||||||||
RCI Hospitality Holdings, Inc. | 100 | 886 | ||||||||
Speedway Motorsports, Inc. | 900 | 17,847 | ||||||||
Town Sports International Holdings, Inc. (a),(c) | 1,800 | 5,166 | ||||||||
|
| |||||||||
| 29,833 | ||||||||||
|
| |||||||||
Renewable Energy — 0.2% | ||||||||||
Ameresco, Inc. Class A (a) | 100 | 477 | ||||||||
Broadwind Energy, Inc. (a) | 1,000 | 3,010 | ||||||||
First Solar, Inc. (a),(c) | 16,100 | 1,102,367 | ||||||||
Renewable Energy Group, Inc. (a) | 3,800 | 35,872 | ||||||||
|
| |||||||||
| 1,141,726 | ||||||||||
|
| |||||||||
Retail—Consumer Staples — 0.1% | ||||||||||
SpartanNash Co. | 100 | 3,031 | ||||||||
Sprouts Farmers Market, Inc. (a),(d) | 1,300 | 37,752 | ||||||||
SUPERVALU, Inc. (a),(c) | 77,000 | 443,520 | ||||||||
|
| |||||||||
| 484,303 | ||||||||||
|
| |||||||||
Retail—Discretionary — 0.1% | ||||||||||
1-800-Flowers.com, Inc. Class A (a) | 400 | 3,152 | ||||||||
Big 5 Sporting Goods Corp. (c) | 3,100 | 34,441 | ||||||||
Citi Trends, Inc. (c) | 900 | 16,047 | ||||||||
Destination Maternity Corp. | 200 | 1,368 | ||||||||
EVINE Live, Inc. (a) | 1,400 | 1,638 | ||||||||
See Notes to Consolidated Financial Statements.
31
Blackstone Alternative Multi-Manager Fund and Subsidiaries
Consolidated Schedule of Investments (Continued)
March 31, 2016
Security Description | Shares | Value | ||||||||
Express, Inc. (a) | 300 | $ | 6,423 | |||||||
Ezcorp, Inc. Class A (a) | 800 | 2,376 | ||||||||
GNC Holdings, Inc. Class A | 1,800 | 57,150 | ||||||||
Hertz Global Holdings, Inc. (a) | 3,800 | 40,014 | ||||||||
Kirkland’s, Inc. | 4,200 | 73,542 | ||||||||
New York & Co., Inc. (a) | 300 | 1,188 | ||||||||
Sears Hometown and Outlet Stores, Inc. (a) | 300 | 1,926 | ||||||||
Stein Mart, Inc. | 3,800 | 27,854 | ||||||||
Tile Shop Holdings, Inc. (a) | 1,300 | 19,383 | ||||||||
Tilly’s, Inc. Class A (a) | 100 | 669 | ||||||||
United Online, Inc. (a),(c) | 3,542 | 40,875 | ||||||||
Vera Bradley, Inc. (a) | 700 | 14,238 | ||||||||
|
| |||||||||
| 342,284 | ||||||||||
|
| |||||||||
Semiconductors — 0.1% | ||||||||||
Alpha & Omega Semiconductor Ltd. (a) | 1,900 | 22,515 | ||||||||
Amkor Technology, Inc. (a) | 14,800 | 87,172 | ||||||||
Applied Materials, Inc. (c) | 16,100 | 340,998 | ||||||||
Axcelis Technologies, Inc. (a),(c) | 6,100 | 17,080 | ||||||||
Cohu, Inc. | 3,400 | 40,392 | ||||||||
DSP Group, Inc. (a) | 2,000 | 18,240 | ||||||||
Electro Scientific Industries, Inc. (a) | 4,600 | 32,890 | ||||||||
FormFactor, Inc. (a),(c) | 5,100 | 37,077 | ||||||||
GSI Technology, Inc. (a) | 518 | 2,124 | ||||||||
InvenSense, Inc. (a) | 6,400 | 53,760 | ||||||||
IXYS Corp. | 3,200 | 35,904 | ||||||||
Kemet Corp. (a),(c) | 1,800 | 3,474 | ||||||||
MaxLinear, Inc. Class A (a) | 48 | 888 | ||||||||
Microchip Technology, Inc. | 34 | 1,639 | ||||||||
Micron Technology, Inc. (a) | 3,600 | 37,692 | ||||||||
NVE Corp. | 200 | 11,306 | ||||||||
Oclaro, Inc. (a) | 9,800 | 52,920 | ||||||||
ON Semiconductor Corp. (a),(c) | 1,700 | 16,303 | ||||||||
Park Electrochemical Corp. | 1,000 | 16,010 | ||||||||
Photronics, Inc. (a),(c) | 700 | 7,287 | ||||||||
Rudolph Technologies, Inc. (a),(c) | 1,400 | 19,124 | ||||||||
SunEdison Semiconductor Ltd. (a) | 700 | 4,536 | ||||||||
Ultra Clean Holdings, Inc. (a),(c) | 5,100 | 27,336 | ||||||||
|
| |||||||||
| 886,667 | ||||||||||
|
| |||||||||
Software — 0.6% | ||||||||||
Agilysys, Inc. (a) | 700 | 7,147 | ||||||||
Akamai Technologies, Inc. (a) | 8,200 | 455,674 | ||||||||
American Software, Inc. Class A | 200 | 1,800 | ||||||||
Bazaarvoice, Inc. (a) | 7,600 | 23,940 | ||||||||
Brightcove, Inc. (a) | 900 | 5,616 | ||||||||
See Notes to Consolidated Financial Statements.
32
Blackstone Alternative Multi-Manager Fund and Subsidiaries
Consolidated Schedule of Investments (Continued)
March 31, 2016
Security Description | Shares | Value | ||||||||
Carbonite, Inc. (a) | 4,000 | $ | 31,880 | |||||||
ChannelAdvisor Corp. (a) | 400 | 4,500 | ||||||||
Digi International, Inc. (a) | 3,500 | 33,005 | ||||||||
Five9, Inc. (a) | 300 | 2,667 | ||||||||
Intralinks Holdings, Inc. (a) | 3,900 | 30,732 | ||||||||
Limelight Networks, Inc. (a) | 14,700 | 26,607 | ||||||||
Lionbridge Technologies, Inc. (a),(c) | 3,000 | 15,180 | ||||||||
Microsoft Corp. | 3,764 | 207,886 | ||||||||
MicroStrategy, Inc. Class A (a) | 1,400 | 251,608 | ||||||||
Model N, Inc. (a) | 1,600 | 17,232 | ||||||||
PDF Solutions, Inc. (a) | 2,000 | 26,760 | ||||||||
QAD, Inc. Class A | 2,000 | 42,500 | ||||||||
Rackspace Hosting, Inc. (a) | 56,500 | 1,219,835 | ||||||||
RealNetworks, Inc. (a),(c) | 300 | 1,218 | ||||||||
SciQuest, Inc. (a) | 1,200 | 16,656 | ||||||||
Seachange International, Inc. (a) | 700 | 3,864 | ||||||||
Support.com, Inc. (a) | 2,500 | 2,150 | ||||||||
VMware, Inc. Class A (a),(c) | 32,300 | 1,689,613 | ||||||||
Zynga, Inc. Class A (a) | 4,000 | 9,120 | ||||||||
|
| |||||||||
| 4,127,190 | ||||||||||
|
| |||||||||
Specialty Finance — 0.1% | ||||||||||
AG Mortgage Investment Trust, Inc. | 4,100 | 53,587 | ||||||||
Alliance Data Systems Corp. (a) | 41 | 9,020 | ||||||||
American Capital Agency Corp. | 35 | 652 | ||||||||
Arbor Realty Trust, Inc. (c) | 5,400 | 36,558 | ||||||||
Cherry Hill Mortgage Investment Corp. (c) | 400 | 5,664 | ||||||||
Consumer Portfolio Services, Inc. (a),(c) | 1,400 | 5,922 | ||||||||
CoreLogic, Inc. (a),(c) | 2,900 | 100,630 | ||||||||
Ellington Residential Mortgage REIT (c) | 2,000 | 23,940 | ||||||||
Enova International, Inc. (a) | 400 | 2,524 | ||||||||
FNFV Group (a) | 34 | 369 | ||||||||
Higher One Holdings, Inc. (a) | 1,200 | 4,692 | ||||||||
Meta Financial Group, Inc. | 1,500 | 68,400 | ||||||||
MoneyGram International, Inc. (a) | 100 | 612 | ||||||||
Newcastle Investment Corp. | 3,883 | 16,813 | ||||||||
Nicholas Financial, Inc. (a) | 400 | 4,316 | ||||||||
On Deck Capital, Inc. (a) | 400 | 3,116 | ||||||||
Regional Management Corp. (a) | 300 | 5,133 | ||||||||
Square, Inc. (a) | 100 | 1,528 | ||||||||
ZAIS Financial Corp. (c) | 1,400 | 20,888 | ||||||||
|
| |||||||||
| 364,364 | ||||||||||
|
| |||||||||
Technology Services — 0.3% | ||||||||||
Black Box Corp. | 2,700 | 36,369 | ||||||||
Ciber, Inc. (a),(c) | 5,800 | 12,238 | ||||||||
See Notes to Consolidated Financial Statements.
33
Blackstone Alternative Multi-Manager Fund and Subsidiaries
Consolidated Schedule of Investments (Continued)
March 31, 2016
Security Description | Shares | Value | ||||||||
Perficient, Inc. (a),(c) | 200 | $ | 4,344 | |||||||
Rightside Group Ltd. (a) | 100 | 805 | ||||||||
Sabre Corp. (c) | 60,300 | 1,743,876 | ||||||||
Travelport Worldwide Ltd. | 5,100 | 69,666 | ||||||||
|
| |||||||||
| 1,867,298 | ||||||||||
|
| |||||||||
Telecommunications — 0.1% | ||||||||||
Alaska Communications Systems Group, Inc. (a) | 3,200 | 5,696 | ||||||||
DigitalGlobe, Inc. (a) | 500 | 8,650 | ||||||||
FairPoint Communications, Inc. (a),(c) | 3,300 | 49,104 | ||||||||
General Communication, Inc. Class A (a),(c) | 2,600 | 47,632 | ||||||||
Hawaiian Telcom Holdco, Inc. (a) | 1,000 | 23,550 | ||||||||
IDT Corp. Class B | 3,600 | 56,124 | ||||||||
Inteliquent, Inc. | 2,400 | 38,520 | ||||||||
Internap Network Services Corp. (a) | 2,300 | 6,279 | ||||||||
Level 3 Communications, Inc. (a) | 50 | 2,642 | ||||||||
Lumos Networks Corp. (a) | 3,200 | 41,088 | ||||||||
Spok Holdings, Inc. (c) | 1,700 | 29,767 | ||||||||
West Corp. (c) | 10,400 | 237,328 | ||||||||
Zix Corp. (a),(c) | 21,900 | 86,067 | ||||||||
|
| |||||||||
| 632,447 | ||||||||||
|
| |||||||||
Transportation & Logistics — 0.2% | ||||||||||
Air Transport Services Group, Inc. (a),(c) | 9,700 | 149,186 | ||||||||
ArcBest Corp. | 1,300 | 28,067 | ||||||||
Hornbeck Offshore Services, Inc. (a) | 200 | 1,986 | ||||||||
ModusLink Global Solutions, Inc. (a) | 1,500 | 2,205 | ||||||||
Navios Maritime Acquisition Corp. | 6,400 | 10,176 | ||||||||
Roadrunner Transportation Systems, Inc. (a) | 400 | 4,984 | ||||||||
Ryder System, Inc. | 5,600 | 362,768 | ||||||||
Saia, Inc. (a) | 1,800 | 50,670 | ||||||||
Swift Transportation Co. (a) | 19,400 | 361,422 | ||||||||
USA Truck, Inc. (a) | 800 | 15,072 | ||||||||
YRC Worldwide, Inc. (a) | 2,600 | 24,232 | ||||||||
|
| |||||||||
| 1,010,768 | ||||||||||
|
| |||||||||
Transportation Equipment — 0.0% | ||||||||||
Accuride Corp. (a) | 5,500 | 8,525 | ||||||||
American Railcar Industries, Inc. | 600 | 24,438 | ||||||||
Commercial Vehicle Group, Inc. (a) | 1,000 | 2,650 | ||||||||
Greenbrier Cos., Inc. (The) | 1,400 | 38,696 | ||||||||
Spartan Motors, Inc. | 200 | 790 | ||||||||
|
| |||||||||
| 75,099 | ||||||||||
|
| |||||||||
Utilities — 0.0% | ||||||||||
Pinnacle West Capital Corp. | 34 | 2,553 | ||||||||
See Notes to Consolidated Financial Statements.
34
Blackstone Alternative Multi-Manager Fund and Subsidiaries
Consolidated Schedule of Investments (Continued)
March 31, 2016
Security Description | Shares | Value | ||||||||
WEC Energy Group, Inc. | 38 | $ | 2,283 | |||||||
|
| |||||||||
| 4,836 | ||||||||||
|
| |||||||||
Waste & Environmental Services & Equipment — 0.0% | ||||||||||
Casella Waste Systems, Inc. Class A (a),(c) | 6,100 | 40,870 | ||||||||
Ceco Environmental Corp. (c) | 42 | 261 | ||||||||
Fuel Tech, Inc. (a) | 100 | 175 | ||||||||
Waste Connections, Inc. | 16 | 1,034 | ||||||||
|
| |||||||||
| 42,340 | ||||||||||
|
| |||||||||
Total United States | 87,349,727 | |||||||||
|
| |||||||||
TOTAL COMMON STOCK | 103,827,697 | |||||||||
|
| |||||||||
Security Description | Principal Amount | Value | ||||||||
ASSET-BACKED SECURITIES — 0.2% | ||||||||||
Cayman Islands — 0.2% | ||||||||||
Babson CLO Ltd., Series 2013-IA, Class D, 4.12%, 04/20/25 (b),(e),(f) | $ | 300,000 | 262,080 | |||||||
Ocean Trails CLO V, Series 2014-5A, Class D, 4.58%, 10/13/26 (b),(e),(f) | 800,000 | 697,360 | ||||||||
|
| |||||||||
Total Cayman Islands | 959,440 | |||||||||
|
| |||||||||
TOTAL ASSET-BACKED SECURITIES | 959,440 | |||||||||
|
| |||||||||
BANK LOANS — 1.7% | ||||||||||
Netherlands — 0.1% | ||||||||||
Exploration & Production — 0.1% | ||||||||||
Endeavour International Holding BV, | 3,106,760 | 326,210 | ||||||||
|
| |||||||||
Total Netherlands | 326,210 | |||||||||
|
| |||||||||
United States — 1.6% | ||||||||||
Financial Services — 1.6% | ||||||||||
MF Global Finance USA, Inc., | ||||||||||
0.00%, 06/15/16 (b),(f),(g) | 13,349,802 | 4,538,933 | ||||||||
1.00%, 06/15/16 (b),(f),(g) | 17,000,000 | 5,780,000 | ||||||||
|
| |||||||||
| 10,318,933 | ||||||||||
|
| |||||||||
Total United States | 10,318,933 | |||||||||
|
| |||||||||
TOTAL BANK LOANS | 10,645,143 | |||||||||
|
| |||||||||
See Notes to Consolidated Financial Statements.
35
Blackstone Alternative Multi-Manager Fund and Subsidiaries
Consolidated Schedule of Investments (Continued)
March 31, 2016
Security Description | Principal Amount | Value | ||||||||
CONVERTIBLE BOND — 0.2% | ||||||||||
Spain — 0.2% | ||||||||||
Wireless Telecommunication Services — 0.2% | ||||||||||
Telefonica Participacion Co. REG S, | 1,300,000 | EUR | $ | 1,328,680 | ||||||
|
| |||||||||
TOTAL CONVERTIBLE BOND | 1,328,680 | |||||||||
|
| |||||||||
CORPORATE BONDS & NOTES — 0.3% | ||||||||||
France — 0.1% | ||||||||||
Oil & Gas Services & Equipment — 0.0% | ||||||||||
CGG SA, 6.88%, 01/15/22 (b) | $ | 400,000 | 156,000 | |||||||
|
| |||||||||
Property & Casualty Insurance — 0.0% | ||||||||||
Groupama SA REG S, 6.38% (b),(f),(i) | 200,000 | EUR | 205,960 | |||||||
|
| |||||||||
Publishing & Broadcasting — 0.1% | ||||||||||
PagesJaunes Finance & Co. SCA REG S, 8.88%, 06/01/18 (b) | 690,000 | EUR | 424,767 | |||||||
|
| |||||||||
Total France | 786,727 | |||||||||
|
| |||||||||
Ireland — 0.0% | ||||||||||
Banks — 0.0% | ||||||||||
UT2 Funding PLC, 5.32%, 06/30/16 (b) | 255,000 | EUR | 291,978 | |||||||
|
| |||||||||
Total Ireland | 291,978 | |||||||||
|
| |||||||||
United States — 0.2% | ||||||||||
Entertainment Resources — 0.2% | ||||||||||
Production Resource Group, Inc., | $ | 1,554,000 | 1,072,260 | |||||||
|
| |||||||||
Total United States | 1,072,260 | |||||||||
|
| |||||||||
TOTAL CORPORATE BONDS & NOTES | 2,150,965 | |||||||||
|
| |||||||||
MORTGAGE-BACKED SECURITIES — 3.1% | ||||||||||
United States — 3.1% | ||||||||||
Commercial Mortgage-Backed Securities — 3.1% | ||||||||||
BAMLL Mezzanine Securities Trust, Series 2015-ASMB, Class MZB, 9.36%, 01/09/17 (b),(e),(f),(g) | 11,925,000 | 11,698,425 | ||||||||
Bear Stearns Commercial Mortgage Securities Trust, | ||||||||||
Series 2007-PW15, Class AM, 5.36%, 02/11/44 (h) | 2,543,321 | 2,538,234 | ||||||||
Series 2007-PW15, Class AMFX, | 1,145,958 | 1,143,666 | ||||||||
See Notes to Consolidated Financial Statements.
36
Blackstone Alternative Multi-Manager Fund and Subsidiaries
Consolidated Schedule of Investments (Continued)
March 31, 2016
Security Description | Principal Amount | Value | ||||||||
Commercial Mortgage Loan Trust, Series 2008-LS1, Class AM, 6.10%, 12/10/49 (f),(h) | $ | 2,436,747 | $ | 1,998,864 | ||||||
Credit Suisse Commercial Mortgage Trust, | ||||||||||
Series 2007-C5, Class AM, 5.87%, 09/15/40 (f),(h) | 1,126,578 | 1,082,078 | ||||||||
Series 2007-C5, Class A1AM, | 1,076,886 | 1,034,672 | ||||||||
|
| |||||||||
| 19,495,939 | ||||||||||
|
| |||||||||
Total United States | 19,495,939 | |||||||||
|
| |||||||||
TOTAL MORTGAGE-BACKED SECURITIES | 19,495,939 | |||||||||
|
| |||||||||
Security Description | Shares | Value | ||||||||
EXCHANGE-TRADED FUNDS — 0.0% | ||||||||||
SPDR S&P Regional Banking ETF (d) | 2,931 | 110,323 | ||||||||
|
| |||||||||
TOTAL EXCHANGE-TRADED FUNDS | 110,323 | |||||||||
|
| |||||||||
RIGHTS — 0.0% | ||||||||||
United States — 0.0% | ||||||||||
Vince Holding Corp. (a) | 11,500 | 2,170 | ||||||||
|
| |||||||||
TOTAL RIGHTS | 2,170 | |||||||||
|
| |||||||||
Security Description | Contracts | Value | ||||||||
PURCHASED OPTIONS — 0.0% | ||||||||||
Exchange-Traded Call Options — 0.0% | ||||||||||
Apple, Inc. Strike Price 110.00 USD Expires 04/15/16 | 91 | 11,375 | ||||||||
Apple, Inc. Strike Price 110.00 USD Expires 05/20/16 | 182 | 63,518 | ||||||||
Bank of America Corp. Strike Price 14.00 USD Expires 05/20/16 | 684 | 24,624 | ||||||||
CBOE SPX Volatility Index Strike Price 29.00 USD Expires 04/20/16 | 242 | 2,420 | ||||||||
DAX Index Strike Price 10,150.00 EUR Expires 04/15/16 | 40 | 17,751 | ||||||||
DAX Index Strike Price 10,500.00 EUR Expires 04/15/16 | 21 | 1,386 | ||||||||
DAX Index Strike Price 10,600.00 EUR Expires 06/17/16 | 42 | 31,160 | ||||||||
Euro Stoxx 50 Strike Price 3,000.00 EUR | 12 | 6,677 | ||||||||
Euro Stoxx 50 Strike Price 3,100.00 EUR | 12 | 1,516 | ||||||||
See Notes to Consolidated Financial Statements.
37
Blackstone Alternative Multi-Manager Fund and Subsidiaries
Consolidated Schedule of Investments (Continued)
March 31, 2016
Security Description | Contracts | Value | ||||||||
Euro Stoxx 50 Strike Price 3,100.00 EUR | 23 | $ | 7,956 | |||||||
S&P 500 Index Strike Price 2,050.00 USD | 9 | 25,200 | ||||||||
S&P 500 Index Strike Price 2,065.00 USD | 25 | 25,350 | ||||||||
S&P 500 Index Strike Price 2,075.00 USD | 8 | 38,800 | ||||||||
Vodafone Group PLC Strike Price 2.30 GBP Expires 09/16/16 | 132 | 14,219 | ||||||||
|
| |||||||||
| 271,952 | ||||||||||
|
| |||||||||
Exchange-Traded Put Options — 0.0% | ||||||||||
FTSE 100 Index Strike Price 6,000.00 GBP | 5 | 10,018 | ||||||||
Marriott International, Inc. Strike Price 70.00 USD Expires 04/15/16 | 35 | 4,795 | ||||||||
Microsoft Corp. Strike Price 55.00 USD Expires 01/19/18 | 75 | 59,250 | ||||||||
SPDR S&P 500 ETF Trust Strike Price 139.00 USD Expires 04/15/16 | 135 | 67 | ||||||||
Telefonica SA Strike Price 9.89 EUR Expires 03/17/17 | 54 | 9,033 | ||||||||
Telefonica SA Strike Price 9.89 EUR Expires 12/16/16 | 180 | 27,446 | ||||||||
|
| |||||||||
| 110,609 | ||||||||||
|
| |||||||||
OTC Call Options — 0.0% | ||||||||||
Bank of America Corp. Strike Price 14.00 USD Expires 05/20/16 Counterparty Deutsche Bank AG | 20,700 | 7,471 | ||||||||
Charles Schwab Corp. Strike Price 28.00 USD Expires 09/16/16 Counterparty Deutsche Bank AG | 38,900 | 95,112 | ||||||||
Charles Schwab Corp. Strike Price 30.00 USD Expires 06/17/16 Counterparty Deutsche Bank AG | 19,500 | 16,295 | ||||||||
SPDR S&P 500 ETF Trust Strike Price 206.00 USD Expires 04/15/16 Counterparty Morgan Stanley & Co. International plc | 3,700 | 6,032 | ||||||||
|
| |||||||||
| 124,910 | ||||||||||
|
| |||||||||
OTC Put Options — 0.0% | ||||||||||
Allergan PLC Strike Price 260.00 USD Expires 04/15/16 Counterparty Morgan Stanley & Co. International plc | 5,000 | 24,136 | ||||||||
iShares PHLX Semiconductor ETF Strike Price 87.00 USD Expires 01/20/17 Counterparty Morgan Stanley & Co. International plc | 5,500 | 34,906 | ||||||||
See Notes to Consolidated Financial Statements.
38
Blackstone Alternative Multi-Manager Fund and Subsidiaries
Consolidated Schedule of Investments (Continued)
March 31, 2016
Security Description | Contracts | Value | ||||||||
iShares PHLX Semiconductor ETF Strike Price 87.00 USD Expires 01/20/17 Counterparty Credit Suisse International | 12,400 | $ | 78,696 | |||||||
Liberty Global, Inc. Strike Price 35.00 USD Expires 04/15/16 Counterparty Bank of America, N.A. | 20,400 | 2,218 | ||||||||
SPDR S&P 500 ETF Trust Strike Price 200.00 USD Expires 05/20/16 Counterparty Morgan Stanley & Co. International plc | 6,900 | 15,536 | ||||||||
|
| |||||||||
| 155,492 | ||||||||||
|
| |||||||||
TOTAL PURCHASED OPTIONS | 662,963 | |||||||||
|
| |||||||||
Security Description | Shares | Value | ||||||||
SHORT-TERM INVESTMENT — MONEY MARKET FUND — 6.1% |
| |||||||||
State Street Institutional Liquid Reserves Fund, 0.45% (b),(j) | 38,128,134 | 38,128,134 | ||||||||
|
| |||||||||
TOTAL SHORT-TERM INVESTMENT — MONEY MARKET FUND |
| 38,128,134 | ||||||||
|
| |||||||||
TOTAL INVESTMENTS IN SECURITIES — 28.1% | 177,311,454 | |||||||||
|
| |||||||||
TOTAL SECURITIES SOLD SHORT — (12.0)% | (75,772,554 | ) | ||||||||
|
| |||||||||
Other Assets (l) — 83.9% | 529,091,964 | |||||||||
|
| |||||||||
Net Assets — 100.0% | $ | 630,630,864 | ||||||||
|
| |||||||||
Security Description | Shares | Value | ||||||||
SECURITIES SOLD SHORT — (12.0)% | ||||||||||
COMMON STOCK — (10.4)% | ||||||||||
Belgium — (0.0)% | ||||||||||
Software — (0.0)% | ||||||||||
Materialise NV ADR | 1,400 | (10,640 | ) | |||||||
|
| |||||||||
Total Belgium | (10,640 | ) | ||||||||
|
| |||||||||
Bermuda — (0.1)% | ||||||||||
Transportation & Logistics — (0.1)% | ||||||||||
Golar LNG Ltd. | 13,900 | (249,783 | ) | |||||||
|
| |||||||||
Total Bermuda | (249,783 | ) | ||||||||
|
| |||||||||
Brazil — (0.0)% | ||||||||||
Banking — (0.0)% | ||||||||||
Banco Santander Brasil SA ADR | 2,300 | (10,695 | ) | |||||||
|
| |||||||||
See Notes to Consolidated Financial Statements.
39
Blackstone Alternative Multi-Manager Fund and Subsidiaries
Consolidated Schedule of Investments (Continued)
March 31, 2016
Security Description | Shares | Value | ||||||||
Iron & Steel — (0.0)% | ||||||||||
Cia Siderurgica Nacional SA ADR | 78,800 | $ | (155,236 | ) | ||||||
|
| |||||||||
Passenger Transportation — (0.0)% | ||||||||||
Gol Linhas Aereas Inteligentes SA ADR | 4,720 | (35,542 | ) | |||||||
|
| |||||||||
Real Estate — (0.0)% | ||||||||||
Gafisa SA ADR | 200 | (284 | ) | |||||||
|
| |||||||||
Telecommunications — (0.0)% | ||||||||||
Oi SA ADR | 20,385 | (6,633 | ) | |||||||
|
| |||||||||
Utilities — (0.0)% | ||||||||||
Centrais Eletricas Brasileiras SA ADR | 200 | (356 | ) | |||||||
|
| |||||||||
Total Brazil | (208,746 | ) | ||||||||
|
| |||||||||
Canada — (0.5)% | ||||||||||
Automotive — (0.0)% | ||||||||||
Westport Innovations, Inc. | 11,800 | (30,739 | ) | |||||||
|
| |||||||||
Banking — (0.0)% | ||||||||||
Royal Bank of Canada | 3,139 | (180,859 | ) | |||||||
|
| |||||||||
Biotechnology & Pharmaceuticals — (0.0)% | ||||||||||
Aeterna Zentaris, Inc. | 9,605 | (31,889 | ) | |||||||
Arbutus Biopharma Corp. | 10,300 | (42,539 | ) | |||||||
|
| |||||||||
| (74,428 | ) | |||||||||
|
| |||||||||
Chemicals — (0.0)% | ||||||||||
BioAmber, Inc. | 200 | (840 | ) | |||||||
|
| |||||||||
Consumer Products — (0.0)% | ||||||||||
DavidsTea, Inc. | 1,900 | (23,009 | ) | |||||||
|
| |||||||||
Hardware — (0.0)% | ||||||||||
Blackberry Ltd. | 4,808 | (38,897 | ) | |||||||
|
| |||||||||
Medical Equipment & Devices — (0.0)% | ||||||||||
Alpha Pro Tech Ltd. | 100 | (182 | ) | |||||||
|
| |||||||||
Metals & Mining — (0.2)% | ||||||||||
Endeavour Silver Corp. | 3,500 | (8,610 | ) | |||||||
First Majestic Silver Corp. | 5,300 | (34,344 | ) | |||||||
Franco-Nevada Corp. | 7,600 | (466,488 | ) | |||||||
NOVAGOLD Resources, Inc. | 11,200 | (56,448 | ) | |||||||
Pan American Silver Corp. | 30,200 | (328,274 | ) | |||||||
Primero Mining Corp. | 5,083 | (9,200 | ) | |||||||
Seabridge Gold, Inc. | 23,000 | (252,080 | ) | |||||||
Tanzanian Royalty Exploration Corp. | 1,700 | (374 | ) | |||||||
|
| |||||||||
| (1,155,818 | ) | |||||||||
|
| |||||||||
See Notes to Consolidated Financial Statements.
40
Blackstone Alternative Multi-Manager Fund and Subsidiaries
Consolidated Schedule of Investments (Continued)
March 31, 2016
Security Description | Shares | Value | ||||||||
Oil, Gas & Coal — (0.1)% | ||||||||||
Enerplus Corp. | 29,300 | $ | (115,149 | ) | ||||||
Pembina Pipeline Corp. | 6,300 | (169,974 | ) | |||||||
Pengrowth Energy Corp. | 25,700 | (33,667 | ) | |||||||
Penn West Petroleum Ltd. | 2,900 | (2,697 | ) | |||||||
Precision Drilling Corp. | 13,100 | (55,020 | ) | |||||||
TransCanada Corp. | 1,600 | (62,896 | ) | |||||||
Vermilion Energy, Inc. | 800 | (23,376 | ) | |||||||
|
| |||||||||
| (462,779 | ) | |||||||||
|
| |||||||||
Renewable Energy — (0.0)% | ||||||||||
Ballard Power Systems, Inc. | 22,200 | (31,080 | ) | |||||||
Hydrogenics Corp. | 100 | (818 | ) | |||||||
|
| |||||||||
| (31,898 | ) | |||||||||
|
| |||||||||
Software — (0.0)% | ||||||||||
Open Text Corp. | 1,900 | (98,420 | ) | |||||||
Sphere 3D Corp. | 100 | (124 | ) | |||||||
|
| |||||||||
| (98,544 | ) | |||||||||
|
| |||||||||
Technology Services — (0.0)% | ||||||||||
CGI Group, Inc. Class A | 700 | (33,446 | ) | |||||||
|
| |||||||||
Telecommunications — (0.1)% | ||||||||||
Rogers Communications, Inc. B Shares | 10,600 | (424,212 | ) | |||||||
|
| |||||||||
Transportation & Logistics — (0.1)% | ||||||||||
Canadian National Railway Co. | 12,500 | (780,750 | ) | |||||||
|
| |||||||||
Utilities — (0.0)% | ||||||||||
Just Energy Group, Inc. | 3,000 | (17,850 | ) | |||||||
TransAlta Corp. | 200 | (930 | ) | |||||||
|
| |||||||||
| (18,780 | ) | |||||||||
|
| |||||||||
Total Canada | (3,355,181 | ) | ||||||||
|
| |||||||||
Cayman Islands — (0.0)% | ||||||||||
Biotechnology & Pharmaceuticals — (0.0)% | ||||||||||
Theravance Biopharma, Inc. | 2,000 | (37,600 | ) | |||||||
|
| |||||||||
Total Cayman Islands | (37,600 | ) | ||||||||
|
| |||||||||
Chile — (0.0)% | ||||||||||
Passenger Transportation — (0.0)% | ||||||||||
Latam Airlines Group SA ADR | 24,062 | (168,434 | ) | |||||||
|
| |||||||||
Retail — Consumer Staples — (0.0)% | ||||||||||
Cencosud SA ADR | 300 | (2,304 | ) | |||||||
|
| |||||||||
Total Chile | (170,738 | ) | ||||||||
|
| |||||||||
See Notes to Consolidated Financial Statements.
41
Blackstone Alternative Multi-Manager Fund and Subsidiaries
Consolidated Schedule of Investments (Continued)
March 31, 2016
Security Description | Shares | Value | ||||||||
China — (0.4)% | ||||||||||
Automotive — (0.0)% | ||||||||||
Kandi Technologies Group, Inc. | 16,100 | $ | (115,920 | ) | ||||||
|
| |||||||||
Chemicals — (0.0)% | ||||||||||
Tantech Holdings Ltd. | 100 | (583 | ) | |||||||
|
| |||||||||
Gaming, Lodging & Restaurants — (0.1)% | ||||||||||
500.com Ltd. Class A ADR | 20,500 | (342,350 | ) | |||||||
|
| |||||||||
Media — (0.2)% | ||||||||||
58.com, Inc. ADR | 4,600 | (255,990 | ) | |||||||
Renren, Inc. ADR | 1 | (3 | ) | |||||||
SouFun Holdings Ltd. ADR | 188,900 | (1,131,511 | ) | |||||||
|
| |||||||||
| (1,387,504 | ) | |||||||||
|
| |||||||||
Oil, Gas & Coal — (0.0)% | ||||||||||
Yanzhou Coal Mining Co. Ltd. ADR | 1,400 | (7,378 | ) | |||||||
|
| |||||||||
Renewable Energy — (0.0)% | ||||||||||
ReneSola Ltd. ADR | 8,200 | (11,808 | ) | |||||||
Yingli Green Energy Holding ADR | 4,640 | (21,205 | ) | |||||||
|
| |||||||||
| (33,013 | ) | |||||||||
|
| |||||||||
Retail — Discretionary — (0.0)% | ||||||||||
LightInTheBox Holding Co. Ltd. ADR | 1,400 | (3,360 | ) | |||||||
|
| |||||||||
Software — (0.1)% | ||||||||||
Momo, Inc. ADR | 11,300 | (127,012 | ) | |||||||
NQ Mobile, Inc. ADR | 28,800 | (131,904 | ) | |||||||
|
| |||||||||
| (258,916 | ) | |||||||||
|
| |||||||||
Telecommunications — (0.0)% | ||||||||||
21Vianet Group, Inc. ADR | 300 | (5,991 | ) | |||||||
|
| |||||||||
Total China | (2,155,015 | ) | ||||||||
|
| |||||||||
Colombia — (0.1)% | ||||||||||
Banking — (0.1)% | ||||||||||
Bancolombia SA ADR | 15,100 | (516,118 | ) | |||||||
Grupo Aval Acciones y Valores SA ADR | 900 | (6,957 | ) | |||||||
|
| |||||||||
| (523,075 | ) | |||||||||
|
| |||||||||
Passenger Transportation — (0.0)% | ||||||||||
Avianca Holdings SA ADR | 2,600 | (12,922 | ) | |||||||
|
| |||||||||
Total Colombia | (535,997 | ) | ||||||||
|
| |||||||||
See Notes to Consolidated Financial Statements.
42
Blackstone Alternative Multi-Manager Fund and Subsidiaries
Consolidated Schedule of Investments (Continued)
March 31, 2016
Security Description | Shares | Value | ||||||||
Denmark — (0.0)% | ||||||||||
Biotechnology & Pharmaceuticals — (0.0)% | ||||||||||
Novo Nordisk A/S B Shares (b) | 3,270 | $ | (177,370 | ) | ||||||
|
| |||||||||
Total Denmark | (177,370 | ) | ||||||||
|
| |||||||||
Germany — (0.0)% | ||||||||||
Biotechnology & Pharmaceuticals — (0.0)% | ||||||||||
Affimed NV | 2,100 | (7,854 | ) | |||||||
|
| |||||||||
Hardware — (0.0)% | ||||||||||
voxeljet AG ADR | 3,700 | (22,570 | ) | |||||||
|
| |||||||||
Total Germany | (30,424 | ) | ||||||||
|
| |||||||||
Greece — (0.0)% | ||||||||||
Transportation & Logistics — (0.0)% | ||||||||||
Diana Containerships, Inc. | 1,100 | (638 | ) | |||||||
Diana Shipping, Inc. | 3,100 | (8,277 | ) | |||||||
Star Bulk Carriers Corp. | 8,400 | (6,300 | ) | |||||||
|
| |||||||||
Total Greece | (15,215 | ) | ||||||||
|
| |||||||||
Hong Kong — (0.2)% | ||||||||||
Gaming, Lodging & Restaurants — (0.2)% | ||||||||||
Melco Crown Entertainment Ltd. ADR | 54,900 | (906,399 | ) | |||||||
|
| |||||||||
Total Hong Kong | (906,399 | ) | ||||||||
|
| |||||||||
India — (0.0)% | ||||||||||
Media — (0.0)% | ||||||||||
MakeMyTrip Ltd. | 2,200 | (39,798 | ) | |||||||
|
| |||||||||
Total India | (39,798 | ) | ||||||||
|
| |||||||||
Ireland — (0.1)% | ||||||||||
Biotechnology & Pharmaceuticals — (0.0)% | ||||||||||
Amarin Corp. PLC ADR | 35,900 | (54,927 | ) | |||||||
|
| |||||||||
Insurance — (0.0)% | ||||||||||
XL Group PLC | 9,004 | (331,347 | ) | |||||||
|
| |||||||||
Specialty Finance — (0.1)% | ||||||||||
AerCap Holdings NV | 9,400 | (364,344 | ) | |||||||
|
| |||||||||
Transportation & Logistics — (0.0)% | ||||||||||
Ardmore Shipping Corp. | 2,700 | (22,815 | ) | |||||||
|
| |||||||||
Total Ireland | (773,433 | ) | ||||||||
|
| |||||||||
Israel — (0.0)% | ||||||||||
Aerospace & Defense — (0.0)% | ||||||||||
RADA Electronic Industries Ltd. | 3,100 | (1,240 | ) | |||||||
|
| |||||||||
See Notes to Consolidated Financial Statements.
43
Blackstone Alternative Multi-Manager Fund and Subsidiaries
Consolidated Schedule of Investments (Continued)
March 31, 2016
Security Description | Shares | Value | ||||||||
Biotechnology & Pharmaceuticals — (0.0)% | ||||||||||
Alcobra Ltd. | 2,400 | $ | (9,096 | ) | ||||||
Neuroderm Ltd. | 1,700 | (24,004 | ) | |||||||
Oramed Pharmaceuticals, Inc. | 1,000 | (6,660 | ) | |||||||
Vascular Biogenics Ltd. | 1,200 | (4,176 | ) | |||||||
|
| |||||||||
| (43,936 | ) | |||||||||
|
| |||||||||
Hardware — (0.0)% | ||||||||||
SuperCom Ltd. | 100 | (398 | ) | |||||||
|
| |||||||||
| (398 | ) | |||||||||
|
| |||||||||
Medical Equipment & Devices — (0.0)% | ||||||||||
ReWalk Robotics Ltd. | 3,900 | (36,660 | ) | |||||||
|
| |||||||||
Semiconductors — (0.0)% | ||||||||||
On Track Innovations Ltd. | 100 | (97 | ) | |||||||
|
| |||||||||
Total Israel | (82,331 | ) | ||||||||
|
| |||||||||
Monaco — (0.1)% | ||||||||||
Transportation & Logistics — (0.1)% | ||||||||||
GasLog Ltd. | 40,600 | (395,444 | ) | |||||||
Navios Maritime Holdings, Inc. | 12,500 | (14,125 | ) | |||||||
Scorpio Tankers, Inc. | 30,100 | (175,483 | ) | |||||||
|
| |||||||||
Total Monaco | (585,052 | ) | ||||||||
|
| |||||||||
Netherlands — (0.0)% | ||||||||||
Insurance — (0.0)% | ||||||||||
Aegon NV | 13 | (72 | ) | |||||||
|
| |||||||||
Oil, Gas & Coal — (0.0)% | ||||||||||
Royal Dutch Shell PLC ADR | 41 | (1,986 | ) | |||||||
|
| |||||||||
Retail—Discretionary — (0.0)% | ||||||||||
Cnova NV | 2,800 | (8,400 | ) | |||||||
|
| |||||||||
Telecommunications — (0.0)% | ||||||||||
VimpelCom Ltd. ADR | 10,700 | (45,582 | ) | |||||||
|
| |||||||||
Total Netherlands | (56,040 | ) | ||||||||
|
| |||||||||
Norway — (0.0)% | ||||||||||
Oil, Gas & Coal — (0.0)% | ||||||||||
North Atlantic Drilling Ltd. | 670 | (1,836 | ) | |||||||
|
| |||||||||
Transportation & Logistics — (0.0)% | ||||||||||
Frontline Ltd. | 5,120 | (42,854 | ) | |||||||
Golden Ocean Group Ltd. | 8,000 | (5,560 | ) | |||||||
See Notes to Consolidated Financial Statements.
44
Blackstone Alternative Multi-Manager Fund and Subsidiaries
Consolidated Schedule of Investments (Continued)
March 31, 2016
Security Description | Shares | Value | ||||||||
Nordic American Offshore Ltd. | 400 | $ | (1,792 | ) | ||||||
|
| |||||||||
| (50,206 | ) | |||||||||
|
| |||||||||
Total Norway | (52,042 | ) | ||||||||
|
| |||||||||
Peru — (0.1)% | ||||||||||
Metals & Mining — (0.1)% | ||||||||||
Southern Copper Corp. | 11,800 | (326,978 | ) | |||||||
|
| |||||||||
Total Peru | (326,978 | ) | ||||||||
|
| |||||||||
Spain — (0.0)% | ||||||||||
Banking — (0.0)% | ||||||||||
Banco Bilbao Vizcaya Argentaria SA ADR | 3 | (20 | ) | |||||||
Banco Santander SA ADR | 20 | (87 | ) | |||||||
|
| |||||||||
| (107 | ) | |||||||||
|
| |||||||||
Utilities — (0.0)% | ||||||||||
Abengoa Yield PLC | 47 | (835 | ) | |||||||
|
| |||||||||
Total Spain | (942 | ) | ||||||||
|
| |||||||||
Switzerland — (0.1)% | ||||||||||
Construction Materials — (0.0)% | ||||||||||
LafargeHolcim Ltd. | 896 | (42,147 | ) | |||||||
|
| |||||||||
Institutional Financial Services — (0.0)% | ||||||||||
Credit Suisse Group AG ADR | 14,242 | (201,239 | ) | |||||||
|
| |||||||||
Retail—Consumer Staples — (0.1)% | ||||||||||
Galenica AG (b) | 235 | (353,398 | ) | |||||||
|
| |||||||||
Total Switzerland | (596,784 | ) | ||||||||
|
| |||||||||
Taiwan — (0.0)% | ||||||||||
Semiconductors — (0.0)% | ||||||||||
Siliconware Precision Industries Co. Ltd. ADR | 43 | (343 | ) | |||||||
|
| |||||||||
Total Taiwan | (343 | ) | ||||||||
|
| |||||||||
United Kingdom — (0.0)% | ||||||||||
Banking — (0.0)% | ||||||||||
Barclays PLC ADR | 28 | (241 | ) | |||||||
|
| |||||||||
Consumer Products — (0.0)% | ||||||||||
Unilever NV | 23 | (1,028 | ) | |||||||
|
| |||||||||
Insurance — (0.0)% | ||||||||||
Aviva PLC ADR | 31 | (405 | ) | |||||||
|
| |||||||||
Machinery — (0.0)% | ||||||||||
CNH Industrial NV | 35 | (236 | ) | |||||||
|
| |||||||||
Total United Kingdom | (1,910 | ) | ||||||||
|
| |||||||||
See Notes to Consolidated Financial Statements.
45
Blackstone Alternative Multi-Manager Fund and Subsidiaries
Consolidated Schedule of Investments (Continued)
March 31, 2016
Security Description | Shares | Value | ||||||||
United States — (8.7)% | ||||||||||
Aerospace & Defense — (0.1)% | ||||||||||
Harris Corp. | 4 | $ | (311 | ) | ||||||
Taser International, Inc. | 35,600 | (698,828 | ) | |||||||
|
| |||||||||
| (699,139 | ) | |||||||||
|
| |||||||||
Apparel & Textile Products — (0.1)% | ||||||||||
Iconix Brand Group, Inc. | 14,000 | (112,700 | ) | |||||||
Lakeland Industries, Inc. | 1,200 | (14,724 | ) | |||||||
Sequential Brands Group, Inc. | 600 | (3,834 | ) | |||||||
Under Armour, Inc. Class A | 2,400 | (203,592 | ) | |||||||
|
| |||||||||
| (334,850 | ) | |||||||||
|
| |||||||||
Asset Management — (0.1)% | ||||||||||
Acacia Research Corp. | 600 | (2,274 | ) | |||||||
Ameriprise Financial, Inc. | 1,364 | (128,230 | ) | |||||||
Artisan Partners Asset Management, Inc. Class A | 5,300 | (163,452 | ) | |||||||
Fifth Street Asset Management, Inc. | 1,200 | (3,672 | ) | |||||||
Full Circle Capital Corp. | 3,500 | (9,030 | ) | |||||||
Medley Capital Corp. | 5,700 | (37,620 | ) | |||||||
T Rowe Price Group, Inc. | 5,501 | (404,103 | ) | |||||||
|
| |||||||||
| (748,381 | ) | |||||||||
|
| |||||||||
Automotive — (0.0)% | ||||||||||
Federal-Mogul Holdings Corp. | 311 | (3,073 | ) | |||||||
|
| |||||||||
Banking — (0.1)% | ||||||||||
Bank of America Corp. | 20,845 | (281,825 | ) | |||||||
Bank of the Ozarks, Inc. | 10 | (420 | ) | |||||||
Beneficial Bancorp, Inc. | 38 | (520 | ) | |||||||
Centerstate Banks, Inc. | 25 | (372 | ) | |||||||
Commerce Bancshares, Inc. | 35 | (1,573 | ) | |||||||
ConnectOne Bancorp, Inc. | 23 | (376 | ) | |||||||
Heritage Financial Corp. | 9 | (158 | ) | |||||||
MB Financial, Inc. | 22 | (714 | ) | |||||||
PacWest Bancorp | 38 | (1,412 | ) | |||||||
Sterling Bancorp | 4,561 | (72,657 | ) | |||||||
United Bankshares, Inc. | 46 | (1,688 | ) | |||||||
|
| |||||||||
| (361,715 | ) | |||||||||
|
| |||||||||
Biotechnology & Pharmaceuticals — (1.3)% | ||||||||||
Abeona Therapeutics, Inc. | 200 | (512 | ) | |||||||
Actinium Pharmaceuticals, Inc. | 20,700 | (41,193 | ) | |||||||
Advaxis, Inc. | 6,500 | (58,695 | ) | |||||||
Aegerion Pharmaceuticals, Inc. | 16,800 | (62,160 | ) | |||||||
Aerie Pharmaceuticals, Inc. | 6,900 | (83,904 | ) | |||||||
See Notes to Consolidated Financial Statements.
46
Blackstone Alternative Multi-Manager Fund and Subsidiaries
Consolidated Schedule of Investments (Continued)
March 31, 2016
Security Description | Shares | Value | ||||||||
Akebia Therapeutics, Inc. | 9,200 | $ | (82,892 | ) | ||||||
Alder Biopharmaceuticals, Inc. | 600 | (14,694 | ) | |||||||
Alimera Sciences, Inc. | 100 | (175 | ) | |||||||
Allergan PLC | 790 | (211,744 | ) | |||||||
Amicus Therapeutics, Inc. | 6,100 | (51,545 | ) | |||||||
Ampio Pharmaceuticals, Inc. | 7,000 | (15,750 | ) | |||||||
Anavex Life Sciences Corp. | 14,700 | (72,030 | ) | |||||||
Anthera Pharmaceuticals, Inc. | 6,500 | (23,530 | ) | |||||||
Apricus Biosciences, Inc. | 100 | (58 | ) | |||||||
Aratana Therapeutics, Inc. | 1,200 | (6,624 | ) | |||||||
Arena Pharmaceuticals, Inc. | 35,800 | (70,526 | ) | |||||||
Arrowhead Pharmaceuticals, Inc. | 30,600 | (147,492 | ) | |||||||
Atara Biotherapeutics, Inc. | 900 | (17,127 | ) | |||||||
AVEO Pharmaceuticals, Inc. | 2,900 | (2,668 | ) | |||||||
Axovant Sciences Ltd. | 200 | (2,296 | ) | |||||||
BIND Therapeutics, Inc. | 800 | (1,760 | ) | |||||||
Biocept, Inc. | 600 | (774 | ) | |||||||
BioCryst Pharmaceuticals, Inc. | 2,000 | (5,660 | ) | |||||||
BioDelivery Sciences International, Inc. | 38,100 | (123,063 | ) | |||||||
Blueprint Medicines Corp. | 2,100 | (37,905 | ) | |||||||
Brainstorm Cell Therapeutics, Inc. | 2,100 | (5,607 | ) | |||||||
Caladrius Biosciences, Inc. | 10,800 | (8,100 | ) | |||||||
Calithera Biosciences, Inc. | 500 | (2,840 | ) | |||||||
Catalyst Pharmaceutical Partners, Inc. | 1,400 | (1,638 | ) | |||||||
Celator Pharmaceuticals, Inc. | 1,000 | (11,030 | ) | |||||||
Celldex Therapeutics, Inc. | 2,200 | (8,316 | ) | |||||||
Cempra, Inc. | 400 | (7,008 | ) | |||||||
Conatus Pharmaceuticals, Inc. | 6,400 | (13,696 | ) | |||||||
CorMedix, Inc. | 700 | (1,855 | ) | |||||||
CTI BioPharma Corp. | 16,700 | (8,874 | ) | |||||||
CytRx Corp. | 37,500 | (100,500 | ) | |||||||
Dicerna Pharmaceuticals, Inc. | 1,900 | (10,184 | ) | |||||||
Discovery Laboratories, Inc. | 64 | (106 | ) | |||||||
Dynavax Technologies Corp. | 10 | (192 | ) | |||||||
Eagle Pharmaceuticals, Inc. | 12,300 | (498,150 | ) | |||||||
Enanta Pharmaceuticals, Inc. | 6,700 | (196,779 | ) | |||||||
Endocyte, Inc. | 6,000 | (18,600 | ) | |||||||
EPIRUS Biopharmaceuticals, Inc. | 200 | (538 | ) | |||||||
Epizyme, Inc. | 3,000 | (36,360 | ) | |||||||
Esperion Therapeutics, Inc. | 1,500 | (25,365 | ) | |||||||
Fortress Biotech, Inc. | 5,100 | (15,810 | ) | |||||||
Galectin Therapeutics, Inc. | 2,100 | (3,003 | ) | |||||||
Galena Biopharma, Inc. | 76,600 | (104,176 | ) | |||||||
Geron Corp. | 2,400 | (7,008 | ) | |||||||
Global Blood Therapeutics, Inc. | 100 | (1,586 | ) | |||||||
Heron Therapeutics, Inc. | 14,300 | (271,557 | ) | |||||||
Idera Pharmaceuticals, Inc. | 16,800 | (33,264 | ) | |||||||
See Notes to Consolidated Financial Statements.
47
Blackstone Alternative Multi-Manager Fund and Subsidiaries
Consolidated Schedule of Investments (Continued)
March 31, 2016
Security Description | Shares | Value | ||||||||
Incyte Corp. | 7,465 | $ | (540,989 | ) | ||||||
Inovio Pharmaceuticals, Inc. | 46,700 | (406,757 | ) | |||||||
Intra-Cellular Therapies, Inc. | 200 | (5,560 | ) | |||||||
Johnson & Johnson (b) | 3,820 | (413,324 | ) | |||||||
Karyopharm Therapeutics, Inc. | 6,300 | (56,196 | ) | |||||||
Keryx Biopharmaceuticals, Inc. | 94,300 | (440,381 | ) | |||||||
Kite Pharma, Inc. | 47 | (2,158 | ) | |||||||
La Jolla Pharmaceutical Co. | 700 | (14,637 | ) | |||||||
Lipocine, Inc. | 200 | (2,030 | ) | |||||||
MannKind Corp. | 71,200 | (114,632 | ) | |||||||
Mast Therapeutics, Inc. | 7,700 | (2,110 | ) | |||||||
MEI Pharma, Inc. | 3,700 | (4,662 | ) | |||||||
Mylan NV (b) | 10,900 | (505,215 | ) | |||||||
NanoViricides, Inc. | 600 | (1,314 | ) | |||||||
NantKwest, Inc. | 2,500 | (20,550 | ) | |||||||
Natural Health Trends Corp. | 3,900 | (129,285 | ) | |||||||
Neuralstem, Inc. | 9,700 | (7,275 | ) | |||||||
Northwest Biotherapeutics, Inc. | 3,900 | (5,694 | ) | |||||||
Ocular Therapeutix, Inc. | 100 | (966 | ) | |||||||
Ohr Pharmaceutical, Inc. | 6,600 | (21,186 | ) | |||||||
OncoGenex Pharmaceuticals, Inc. | 300 | (205 | ) | |||||||
Oncothyreon, Inc. | 5,100 | (6,477 | ) | |||||||
Opexa Therapeutics, Inc. | 100 | (232 | ) | |||||||
Orexigen Therapeutics, Inc. | 24,900 | (14,011 | ) | |||||||
Organovo Holdings, Inc. | 40,800 | (88,536 | ) | |||||||
OXiGENE, Inc. | 6,000 | (4,765 | ) | |||||||
Peregrine Pharmaceuticals, Inc. | 10,700 | (4,499 | ) | |||||||
Pernix Therapeutics Holdings, Inc. | 31,600 | (33,180 | ) | |||||||
Perrigo Co. PLC | 4,510 | (576,964 | ) | |||||||
Pfizer, Inc. | 27,223 | (806,890 | ) | |||||||
Pluristem Therapeutics, Inc. | 400 | (644 | ) | |||||||
Provectus Biopharmaceuticals, Inc. Class A | 2,100 | (794 | ) | |||||||
Puma Biotechnology, Inc. | 4,900 | (143,913 | ) | |||||||
Raptor Pharmaceutical Corp. | 600 | (2,760 | ) | |||||||
Regeneron Pharmaceuticals, Inc. (b) | 680 | (245,099 | ) | |||||||
REGENXBIO, Inc. | 200 | (2,160 | ) | |||||||
Repros Therapeutics, Inc. | 7,600 | (7,372 | ) | |||||||
Revance Therapeutics, Inc. | 1,800 | (31,428 | ) | |||||||
Rexahn Pharmaceuticals, Inc. | 26,800 | (8,847 | ) | |||||||
RXI Pharmaceuticals | 4,200 | (1,134 | ) | |||||||
Sarepta Therapeutics, Inc. | 7,200 | (140,544 | ) | |||||||
StemCells, Inc. | 9,100 | (2,371 | ) | |||||||
Sunesis Pharmaceuticals, Inc. | 600 | (324 | ) | |||||||
Synergy Pharmaceuticals, Inc. | 5,200 | (14,352 | ) | |||||||
Synta Pharmaceuticals Corp. | 3,100 | (744 | ) | |||||||
Synthetic Biologics, Inc. | 24,300 | (57,348 | ) | |||||||
Teligent, Inc. | 10,500 | (51,450 | ) | |||||||
See Notes to Consolidated Financial Statements.
48
Blackstone Alternative Multi-Manager Fund and Subsidiaries
Consolidated Schedule of Investments (Continued)
March 31, 2016
Security Description | Shares | Value | ||||||||
Tenax Therapeutics, Inc. | 1,700 | $ | (3,485 | ) | ||||||
TG Therapeutics, Inc. | 3,500 | (29,820 | ) | |||||||
TherapeuticsMD, Inc. | 21,200 | (135,680 | ) | |||||||
Tonix Pharmaceuticals Holding Corp. | 5,400 | (13,014 | ) | |||||||
Venaxis, Inc. | 12 | (32 | ) | |||||||
Vertex Pharmaceuticals, Inc. | 1,790 | (142,287 | ) | |||||||
Vitae Pharmaceuticals, Inc. | 400 | (2,652 | ) | |||||||
Vital Therapies, Inc. | 1,800 | (16,326 | ) | |||||||
VIVUS, Inc. | 46,100 | (64,540 | ) | |||||||
Xencor, Inc. | 500 | (6,710 | ) | |||||||
Zafgen, Inc. | 11,500 | (76,820 | ) | |||||||
ZIOPHARM Oncology, Inc. | 43,973 | (326,280 | ) | |||||||
Zogenix, Inc. | 2,312 | (21,363 | ) | |||||||
|
| |||||||||
| (8,307,892 | ) | |||||||||
|
| |||||||||
Chemicals — (0.1)% | ||||||||||
Balchem Corp. | 3,000 | (186,060 | ) | |||||||
Ferro Corp. | 600 | (7,122 | ) | |||||||
iBio, Inc. | 7,300 | (4,162 | ) | |||||||
Marrone Bio Innovations, Inc. | 100 | (90 | ) | |||||||
Platform Specialty Products Corp. | 27,100 | (233,060 | ) | |||||||
Rayonier Advanced Materials, Inc. | 14,000 | (133,000 | ) | |||||||
Rentech, Inc. | 2,280 | (5,062 | ) | |||||||
Tronox Ltd. Class A | 28,800 | (184,032 | ) | |||||||
|
| |||||||||
| (752,588 | ) | |||||||||
|
| |||||||||
Commercial Services — (0.2)% | ||||||||||
ADT Corp. | 28,100 | (1,159,406 | ) | |||||||
Ascent Capital Group, Inc. Class A | 800 | (11,848 | ) | |||||||
InterCloud Systems, Inc. | 16,000 | (15,200 | ) | |||||||
LifeLock, Inc. | 4,300 | (51,901 | ) | |||||||
|
| |||||||||
| (1,238,355 | ) | |||||||||
|
| |||||||||
Construction Materials — (0.0)% | ||||||||||
Martin Marietta Materials, Inc. | 30 | (4,785 | ) | |||||||
|
| |||||||||
Consumer Products — (0.1)% | ||||||||||
22nd Century Group, Inc. | 1,900 | (1,488 | ) | |||||||
Alliance One International, Inc. | 40 | (702 | ) | |||||||
Avon Products, Inc. | 123,300 | (593,073 | ) | |||||||
Coty, Inc. Class A | 9,940 | (276,630 | ) | |||||||
Elizabeth Arden, Inc. | 800 | (6,552 | ) | |||||||
Tootsie Roll Industries, Inc. | 18 | (629 | ) | |||||||
Vector Group Ltd. | 18 | (411 | ) | |||||||
|
| |||||||||
| (879,485 | ) | |||||||||
|
| |||||||||
See Notes to Consolidated Financial Statements.
49
Blackstone Alternative Multi-Manager Fund and Subsidiaries
Consolidated Schedule of Investments (Continued)
March 31, 2016
Security Description | Shares | Value | ||||||||
Consumer Services — (0.1)% | ||||||||||
ITT Educational Services, Inc. | 2,300 | $ | (7,107 | ) | ||||||
Weight Watchers International, Inc. | 33,900 | (492,567 | ) | |||||||
|
| |||||||||
| (499,674 | ) | |||||||||
|
| |||||||||
Distributors—Consumer Staples — (0.1)% | ||||||||||
Core-Mark Holding Co., Inc. | 4,000 | (326,240 | ) | |||||||
|
| |||||||||
Electrical Equipment — (0.0)% | ||||||||||
Capstone Turbine Corp. | 2,120 | (3,392 | ) | |||||||
Energous Corp. | 5,600 | (56,560 | ) | |||||||
Energy Focus, Inc. | 1,500 | (11,145 | ) | |||||||
General Cable Corp. | 14,000 | (170,940 | ) | |||||||
Giga-tronics, Inc. | 2,500 | (3,650 | ) | |||||||
Revolution Lighting Technology, Inc. | 820 | (4,313 | ) | |||||||
|
| |||||||||
| (250,000 | ) | |||||||||
|
| |||||||||
Engineering & Construction Services — (0.0)% | ||||||||||
Willbros Group, Inc. | 600 | (1,278 | ) | |||||||
|
| |||||||||
Gaming, Lodging & Restaurants — (0.1)% | ||||||||||
Fogo De Chao, Inc. | 900 | (14,049 | ) | |||||||
Jamba, Inc. | 2,900 | (35,844 | ) | |||||||
Morgans Hotel Group Co. | 400 | (552 | ) | |||||||
Rave Restaurant Group, Inc. | 300 | (1,596 | ) | |||||||
Scientific Games Corp. Class A | 18,100 | (170,683 | ) | |||||||
Zoe’s Kitchen, Inc. | 5,800 | (226,142 | ) | |||||||
|
| |||||||||
| (448,866 | ) | |||||||||
|
| |||||||||
Hardware — (0.3)% | ||||||||||
3D Systems Corp. | 700 | (10,829 | ) | |||||||
Aerohive Networks, Inc. | 1,000 | (4,990 | ) | |||||||
Ciena Corp. | 48,000 | (912,960 | ) | |||||||
Digital Ally, Inc. | 5,100 | (25,245 | ) | |||||||
ExOne Co. | 7,900 | (103,806 | ) | |||||||
FEI Co. | 3,100 | (275,931 | ) | |||||||
GoPro, Inc. Class A | 34,600 | (413,816 | ) | |||||||
Identiv, Inc. | 1,200 | (2,592 | ) | |||||||
MicroVision, Inc. | 16,300 | (30,481 | ) | |||||||
Mitel Networks Corp. | 200 | (1,636 | ) | |||||||
Neonode, Inc. | 8,000 | (16,320 | ) | |||||||
Nimble Storage, Inc. | 1,200 | (9,408 | ) | |||||||
Novatel Wireless, Inc. | 5,800 | (10,266 | ) | |||||||
NXT-ID, Inc. | 200 | (116 | ) | |||||||
Ruckus Wireless, Inc. | 11,700 | (114,777 | ) | |||||||
Silicon Graphics International Corp. | 300 | (2,136 | ) | |||||||
Turtle Beach Corp. | 5,100 | (5,814 | ) | |||||||
See Notes to Consolidated Financial Statements.
50
Blackstone Alternative Multi-Manager Fund and Subsidiaries
Consolidated Schedule of Investments (Continued)
March 31, 2016
Security Description | Shares | Value | ||||||||
Uni-Pixel, Inc. | 2,200 | $ | (2,024 | ) | ||||||
VeriFone Systems, Inc. | 1 | (28 | ) | |||||||
Violin Memory, Inc. | 2,200 | (1,149 | ) | |||||||
|
| |||||||||
| (1,944,324 | ) | |||||||||
|
| |||||||||
Health Care Facilities & Services — (0.8)% | ||||||||||
Adeptus Health, Inc. Class A | 1,300 | (72,202 | ) | |||||||
Aetna, Inc. | 2,762 | (310,311 | ) | |||||||
BioScrip, Inc. | 28,200 | (60,348 | ) | |||||||
Brookdale Senior Living, Inc. | 6 | (95 | ) | |||||||
DaVita HealthCare Partners, Inc. (b) | 8,170 | (599,514 | ) | |||||||
Diplomat Pharmacy, Inc. | 12,600 | (345,240 | ) | |||||||
ExamWorks Group, Inc. | 800 | (23,648 | ) | |||||||
Express Scripts Holding Co. (b) | 15,900 | (1,092,171 | ) | |||||||
HealthEquity, Inc. | 400 | (9,868 | ) | |||||||
Henry Schein, Inc. (b) | 5,860 | (1,011,612 | ) | |||||||
Kindred Healthcare, Inc. | 497 | (6,138 | ) | |||||||
MEDNAX, Inc. | 17,900 | (1,156,698 | ) | |||||||
Nobilis Health Corp. | 300 | (936 | ) | |||||||
OvaScience, Inc. | 4,300 | (40,807 | ) | |||||||
Tenet Healthcare Corp. | 5,200 | (150,436 | ) | |||||||
UnitedHealth Group, Inc. (b) | 1,260 | (162,414 | ) | |||||||
|
| |||||||||
| (5,042,438 | ) | |||||||||
|
| |||||||||
Home & Office Products — (0.4)% | ||||||||||
Beazer Homes USA, Inc. | 23,900 | (208,408 | ) | |||||||
Century Communities, Inc. | 1,100 | (18,777 | ) | |||||||
Green Brick Partners, Inc. | 2,900 | (22,011 | ) | |||||||
Hovnanian Enterprises, Inc. Class A | 104,100 | (162,396 | ) | |||||||
LGI Homes, Inc. | 4,200 | (101,682 | ) | |||||||
M/I Homes, Inc. | 400 | (7,460 | ) | |||||||
MDC Holdings, Inc. | 200 | (5,012 | ) | |||||||
Taylor Morrison Home Corp. Class A | 1,200 | (16,944 | ) | |||||||
Tempur Sealy International, Inc. | 11,900 | (723,401 | ) | |||||||
TRI Pointe Homes, Inc. | 87,000 | (1,024,860 | ) | |||||||
William Lyon Homes Class A | 15,500 | (224,595 | ) | |||||||
|
| |||||||||
| (2,515,546 | ) | |||||||||
|
| |||||||||
Industrial Services — (0.0)% | ||||||||||
WW Grainger, Inc. | 885 | (206,586 | ) | |||||||
|
| |||||||||
Institutional Financial Services — (0.0)% | ||||||||||
FXCM, Inc. Class A | 1,400 | (15,036 | ) | |||||||
Intercontinental Exchange, Inc. | 31 | (7,289 | ) | |||||||
|
| |||||||||
| (22,325 | ) | |||||||||
|
| |||||||||
See Notes to Consolidated Financial Statements.
51
Blackstone Alternative Multi-Manager Fund and Subsidiaries
Consolidated Schedule of Investments (Continued)
March 31, 2016
Security Description | Shares | Value | ||||||||
Insurance — (0.1)% | ||||||||||
American International Group, Inc. | 200 | $ | (10,810 | ) | ||||||
Amtrust Financial Services, Inc. | 40 | (1,035 | ) | |||||||
HCI Group, Inc. | 300 | (9,990 | ) | |||||||
State Auto Financial Corp. | 36 | (794 | ) | |||||||
Torchmark Corp. | 49 | (2,654 | ) | |||||||
Travelers Cos., Inc. | 2,778 | (324,221 | ) | |||||||
|
| |||||||||
| (349,504 | ) | |||||||||
|
| |||||||||
Iron & Steel — (0.1)% | ||||||||||
AK Steel Holding Corp. | 88,100 | (363,853 | ) | |||||||
AM Castle & Co. | 1,300 | (3,510 | ) | |||||||
Cliffs Natural Resources, Inc. | 136,900 | (410,700 | ) | |||||||
|
| |||||||||
| (778,063 | ) | |||||||||
|
| |||||||||
Leisure Products — (0.0)% | ||||||||||
Winnebago Industries, Inc. | 1,800 | (40,410 | ) | |||||||
|
| |||||||||
Machinery — (0.0)% | ||||||||||
Arotech Corp. | 500 | (1,215 | ) | |||||||
Caterpillar, Inc. | 605 | (46,307 | ) | |||||||
Milacron Holdings Corp. | 5,400 | (89,046 | ) | |||||||
Power Solutions International, Inc. | 1,300 | (17,940 | ) | |||||||
|
| |||||||||
| (154,508 | ) | |||||||||
|
| |||||||||
Manufactured Goods — (0.0)% | ||||||||||
Proto Labs, Inc. | 1,800 | (138,762 | ) | |||||||
|
| |||||||||
Media — (0.5)% | ||||||||||
Angie’s List, Inc. | 21,600 | (174,312 | ) | |||||||
Charter Communications, Inc. Class A | 1,978 | (400,407 | ) | |||||||
Covisint Corp. | 122 | (244 | ) | |||||||
Cumulus Media, Inc. Class A | 27,300 | (12,675 | ) | |||||||
DraftDay Fantasy Sports, Inc. | 6,700 | (1,608 | ) | |||||||
EW Scripps Co. Class A | 3,756 | (58,556 | ) | |||||||
Expedia, Inc. | 20 | (2,156 | ) | |||||||
Liberty Broadband Corp. Class C | 28 | (1,623 | ) | |||||||
Liberty Media Corp. | 33 | (1,275 | ) | |||||||
Live Ventures, Inc. | 4,300 | (5,977 | ) | |||||||
Marin Software, Inc. | 1,000 | (3,020 | ) | |||||||
Media General, Inc. | 52,700 | (859,537 | ) | |||||||
Pandora Media, Inc. | 98,800 | (884,260 | ) | |||||||
Rocket Fuel, Inc. | 17,700 | (55,755 | ) | |||||||
Time Warner Cable, Inc. | 24 | (4,911 | ) | |||||||
Walt Disney Co. | 1,356 | (134,664 | ) | |||||||
World Wrestling Entertainment, Inc. Class A | 1,800 | (31,788 | ) | |||||||
Yelp, Inc. | 4,100 | (81,508 | ) | |||||||
See Notes to Consolidated Financial Statements.
52
Blackstone Alternative Multi-Manager Fund and Subsidiaries
Consolidated Schedule of Investments (Continued)
March 31, 2016
Security Description | Shares | Value | ||||||||
YOU On Demand Holdings, Inc. | 1,100 | $ | (1,991 | ) | ||||||
Zillow Group, Inc. Class A | 28,945 | (739,545 | ) | |||||||
|
| |||||||||
| (3,455,812 | ) | |||||||||
|
| |||||||||
Medical Equipment & Devices — (1.0)% | ||||||||||
Abbott Laboratories (b) | 1,940 | (81,150 | ) | |||||||
Accelerate Diagnostics, Inc. | 8,900 | (127,893 | ) | |||||||
Amedica Corp. | 1,000 | (1,550 | ) | |||||||
Atossa Genetics, Inc. | 1,700 | (585 | ) | |||||||
Baxter International, Inc. (b) | 27,990 | (1,149,829 | ) | |||||||
Becton Dickinson and Co. (b) | 600 | (91,092 | ) | |||||||
Biolase, Inc. | 3,646 | (4,776 | ) | |||||||
Cerus Corp. | 1,700 | (10,081 | ) | |||||||
ConforMIS, Inc. | 1,500 | (16,125 | ) | |||||||
Cooper Cos., Inc. (b) | 2,490 | (383,385 | ) | |||||||
Cytori Therapeutics, Inc. | 22,200 | (4,731 | ) | |||||||
CytoSorbents Corp. | 100 | (392 | ) | |||||||
Dentsply Sirona, Inc. | 18,400 | (1,133,992 | ) | |||||||
EnteroMedics, Inc. | 46 | (45 | ) | |||||||
Exact Sciences Corp. | 3,400 | (22,916 | ) | |||||||
Foundation Medicine, Inc. | 11,035 | (200,616 | ) | |||||||
Hansen Medical, Inc. | 1,400 | (3,654 | ) | |||||||
Illumina, Inc. (b) | 1,310 | (212,364 | ) | |||||||
ImmunoCellular Therapeutics Ltd. | 7,900 | (2,291 | ) | |||||||
Intuitive Surgical, Inc. (b) | 215 | (129,226 | ) | |||||||
InVivo Therapeutics Holdings Corp. | 900 | (6,282 | ) | |||||||
IsoRay, Inc. | 7,800 | (7,020 | ) | |||||||
Medtronic PLC | 39 | (2,925 | ) | |||||||
Nanosphere, Inc. | 60 | (48 | ) | |||||||
Navidea Biopharmaceuticals, Inc. | 7,800 | (7,367 | ) | |||||||
Novocure Ltd. | 100 | (1,448 | ) | |||||||
Qiagen NV | 3 | (67 | ) | |||||||
Rockwell Medical, Inc. | 19,200 | (144,192 | ) | |||||||
Rosetta Genomics Ltd. | 2,400 | (2,616 | ) | |||||||
Second Sight Medical Products, Inc. | 17,500 | (84,525 | ) | |||||||
Spectranetics Corp. | 600 | (8,712 | ) | |||||||
Stereotaxis, Inc. | 1,500 | (1,650 | ) | |||||||
Stryker Corp. (b) | 9,980 | (1,070,754 | ) | |||||||
Sunshine Heart, Inc. | 300 | (252 | ) | |||||||
TearLab Corp. | 5,400 | (3,402 | ) | |||||||
TransEnterix, Inc. | 18,000 | (76,500 | ) | |||||||
Trovagene, Inc. | 1,100 | (5,115 | ) | |||||||
Unilife Corp. | 9,200 | (6,256 | ) | |||||||
Varian Medical Systems, Inc. (b) | 14,151 | (1,132,363 | ) | |||||||
|
| |||||||||
| (6,138,187 | ) | |||||||||
|
| |||||||||
See Notes to Consolidated Financial Statements.
53
Blackstone Alternative Multi-Manager Fund and Subsidiaries
Consolidated Schedule of Investments (Continued)
March 31, 2016
Security Description | Shares | Value | ||||||||
Metals & Mining — (0.1)% | ||||||||||
Coeur Mining, Inc. | 30 | $ | (169 | ) | ||||||
Gold Resource Corp. | 200 | (466 | ) | |||||||
Golden Star Resources Ltd. | 11,200 | (5,107 | ) | |||||||
Hecla Mining Co. | 10,300 | (28,634 | ) | |||||||
Tahoe Resources, Inc. | 24,700 | (247,741 | ) | |||||||
Ur-Energy, Inc. | 200 | (100 | ) | |||||||
Uranium Energy Corp. | 46,100 | (34,483 | ) | |||||||
US Silica Holdings, Inc. | 1,800 | (40,896 | ) | |||||||
|
| |||||||||
| (357,596 | ) | |||||||||
|
| |||||||||
Oil, Gas & Coal — (0.2)% | ||||||||||
Alon USA Energy, Inc. | 19,100 | (197,112 | ) | |||||||
Approach Resources, Inc. | 1,400 | (1,624 | ) | |||||||
Basic Energy Services, Inc. | 7,300 | (20,148 | ) | |||||||
CARBO Ceramics, Inc. | 4,500 | (63,900 | ) | |||||||
Clayton Williams Energy, Inc. | 100 | (892 | ) | |||||||
Clean Energy Fuels Corp. | 8,100 | (23,733 | ) | |||||||
Cobalt International Energy, Inc. | 22,200 | (65,934 | ) | |||||||
Comstock Resources, Inc. | 5,300 | (4,057 | ) | |||||||
Eclipse Resources Corp. | 5,300 | (7,632 | ) | |||||||
Enbridge Energy Management LLC | 22 | (395 | ) | |||||||
Energy XXI Ltd. | 86,689 | (53,999 | ) | |||||||
Erin Energy Corp. | 400 | (752 | ) | |||||||
EXCO Resources, Inc. | 159,000 | (157,267 | ) | |||||||
Fairmount Santrol Holdings, Inc. | 11,900 | (29,869 | ) | |||||||
Flotek Industries, Inc. | 34,200 | (250,686 | ) | |||||||
Gastar Exploration, Inc. | 4,100 | (4,510 | ) | |||||||
Gulfmark Offshore, Inc. Class A | 4,500 | (27,765 | ) | |||||||
Halcon Resources Corp. | 20 | (19 | ) | |||||||
Harvest Natural Resources, Inc. | 2,100 | (1,266 | ) | |||||||
Jones Energy, Inc. | 10,300 | (34,299 | ) | |||||||
Key Energy Services, Inc. | 19,400 | (7,167 | ) | |||||||
Kosmos Energy Ltd. | 3,400 | (19,788 | ) | |||||||
Northern Oil and Gas, Inc. | 27,800 | (110,922 | ) | |||||||
Pacific Drilling SA | 9,800 | (4,802 | ) | |||||||
PetroQuest Energy, Inc. | 200 | (121 | ) | |||||||
Resolute Energy Corp. | 1,900 | (969 | ) | |||||||
Rex Energy Corp. | 5,900 | (4,533 | ) | |||||||
Sanchez Energy Corp. | 48,900 | (268,461 | ) | |||||||
Seventy Seven Energy, Inc. | 12,900 | (7,483 | ) | |||||||
Targa Resources Corp. | 2,200 | (65,692 | ) | |||||||
Tidewater, Inc. | 2,300 | (15,709 | ) | |||||||
Triangle Petroleum Corp. | 17,700 | (9,599 | ) | |||||||
W&T Offshore, Inc. | 42,500 | (93,075 | ) | |||||||
Westmoreland Coal Co. | 16,600 | (119,686 | ) | |||||||
|
| |||||||||
| (1,673,866 | ) | |||||||||
|
| |||||||||
See Notes to Consolidated Financial Statements.
54
Blackstone Alternative Multi-Manager Fund and Subsidiaries
Consolidated Schedule of Investments (Continued)
March 31, 2016
Security Description | Shares | Value | ||||||||
Real Estate — (0.3)% | ||||||||||
Ashford Hospitality Trust, Inc. | 15,600 | $ | (99,528 | ) | ||||||
Bluerock Residential Growth REIT, Inc. | 3,200 | (34,816 | ) | |||||||
CorEnergy Infrastructure Trust, Inc. | 20 | (402 | ) | |||||||
Extra Space Storage, Inc. | 1,281 | (119,722 | ) | |||||||
Farmland Partners, Inc. | 1,600 | (17,168 | ) | |||||||
Gaming and Leisure Properties, Inc. | 32 | (990 | ) | |||||||
Government Properties Income Trust | 4,400 | (78,540 | ) | |||||||
Gramercy Property Trust REIT | 9 | (76 | ) | |||||||
New Senior Investment Group, Inc. | 25,045 | (257,964 | ) | |||||||
NorthStar Realty Finance Corp. | 89,550 | (1,174,896 | ) | |||||||
Omega Healthcare Investors, Inc. | 20 | (706 | ) | |||||||
Public Storage | 575 | (158,602 | ) | |||||||
STAG Industrial, Inc. | 4,300 | (87,548 | ) | |||||||
|
| |||||||||
| (2,030,958 | ) | |||||||||
|
| |||||||||
Renewable Energy — (0.3)% | ||||||||||
American Superconductor Corp. | 10 | (76 | ) | |||||||
Enphase Energy, Inc. | 7,300 | (17,009 | ) | |||||||
FuelCell Energy, Inc. | 8,625 | (58,391 | ) | |||||||
Gevo, Inc. | 23,860 | (6,442 | ) | |||||||
Plug Power, Inc. | 136,400 | (279,620 | ) | |||||||
Silver Spring Networks, Inc. | 600 | (8,850 | ) | |||||||
SolarCity Corp. | 49,000 | (1,204,420 | ) | |||||||
Solazyme, Inc. | 12,500 | (25,375 | ) | |||||||
SunEdison, Inc. | 260,000 | (140,452 | ) | |||||||
Sunworks, Inc. | 1,700 | (4,709 | ) | |||||||
Vivint Solar, Inc. | 9,200 | (24,380 | ) | |||||||
|
| |||||||||
| (1,769,724 | ) | |||||||||
|
| |||||||||
Retail—Consumer Staples — (0.0)% | ||||||||||
Fairway Group Holdings Corp. | 3,500 | (1,225 | ) | |||||||
|
| |||||||||
Retail—Discretionary — (0.4)% | ||||||||||
Aeropostale, Inc. | 2,900 | (576 | ) | |||||||
Ascena Retail Group, Inc. | 8,100 | (89,586 | ) | |||||||
bebe stores, Inc. | 3,800 | (2,089 | ) | |||||||
Bon-Ton Stores, Inc. | 10,400 | (23,608 | ) | |||||||
Boot Barn Holdings, Inc. | 4,700 | (44,180 | ) | |||||||
Buckle, Inc. | 1,700 | (57,579 | ) | |||||||
Cabela’s, Inc. | 400 | (19,476 | ) | |||||||
Conn’s, Inc. | 7,300 | (90,958 | ) | |||||||
Container Store Group, Inc. | 3,800 | (22,306 | ) | |||||||
DSW, Inc. Class A | 19,700 | (544,508 | ) | |||||||
Freshpet, Inc. | 1,900 | (13,927 | ) | |||||||
Guess?, Inc. | 30,400 | (570,608 | ) | |||||||
See Notes to Consolidated Financial Statements.
55
Blackstone Alternative Multi-Manager Fund and Subsidiaries
Consolidated Schedule of Investments (Continued)
March 31, 2016
Security Description | Shares | Value | ||||||||
Net Element International, Inc. | 8,000 | $ | (2,534 | ) | ||||||
Office Depot, Inc. | 3 | (21 | ) | |||||||
Pacific Sunwear of California, Inc. | 1,000 | (126 | ) | |||||||
Pier 1 Imports, Inc. | 29,500 | (206,795 | ) | |||||||
Sears Holdings Corp. | 35,100 | (537,381 | ) | |||||||
Stage Stores, Inc. | 2,100 | (16,926 | ) | |||||||
Tailored Brands, Inc. | 11,300 | (202,270 | ) | |||||||
|
| |||||||||
| (2,445,454 | ) | |||||||||
|
| |||||||||
Semiconductors — (0.3)% | ||||||||||
Advanced Micro Devices, Inc. | 239,900 | (683,715 | ) | |||||||
Ambarella, Inc. | 13,800 | (616,860 | ) | |||||||
Applied Optoelectronics, Inc. | 700 | (10,437 | ) | |||||||
Cypress Semiconductor Corp. | 50,030 | (433,260 | ) | |||||||
Microsemi Corp. | 5,300 | (203,043 | ) | |||||||
ParkerVision, Inc. | 250 | (783 | ) | |||||||
Pixelworks, Inc. | 6,300 | (13,797 | ) | |||||||
Qorvo, Inc. | 13 | (655 | ) | |||||||
QuickLogic Corp. | 7,600 | (8,056 | ) | |||||||
Rubicon Technology, Inc. | 2,800 | (2,044 | ) | |||||||
|
| |||||||||
| (1,972,650 | ) | |||||||||
|
| |||||||||
Software — (0.2)% | ||||||||||
2U, Inc. | 13,800 | (311,880 | ) | |||||||
Amber Road, Inc. | 1,200 | (6,492 | ) | |||||||
Benefitfocus, Inc. | 1,900 | (63,365 | ) | |||||||
Castlight Health, Inc. Class B | 8,000 | (26,640 | ) | |||||||
Datawatch Corp. | 1,200 | (5,940 | ) | |||||||
Demandware, Inc. | 4,000 | (156,400 | ) | |||||||
Digital Turbine, Inc. | 2,192 | (2,608 | ) | |||||||
Envestnet, Inc. | 2,600 | (70,720 | ) | |||||||
Glu Mobile, Inc. | 51,700 | (145,794 | ) | |||||||
MobileIron, Inc. | 200 | (904 | ) | |||||||
Opower, Inc. | 2,700 | (18,387 | ) | |||||||
Paycom Software, Inc. | 6,100 | (217,160 | ) | |||||||
PROS Holdings, Inc. | 4,100 | (48,339 | ) | |||||||
Q2 Holdings, Inc. | 100 | (2,404 | ) | |||||||
Rapid7, Inc. | 3,700 | (48,359 | ) | |||||||
Rosetta Stone, Inc. | 700 | (4,697 | ) | |||||||
Textura Corp. | 100 | (1,863 | ) | |||||||
TubeMogul, Inc. | 4,500 | (58,230 | ) | |||||||
VirnetX Holding Corp. | 21,400 | (98,226 | ) | |||||||
Vringo, Inc. | 4,950 | (8,118 | ) | |||||||
|
| |||||||||
| (1,296,526 | ) | |||||||||
|
| |||||||||
See Notes to Consolidated Financial Statements.
56
Blackstone Alternative Multi-Manager Fund and Subsidiaries
Consolidated Schedule of Investments (Continued)
March 31, 2016
Security Description | Shares | Value | ||||||||
Specialty Finance — (0.6)% | ||||||||||
Ally Financial, Inc. | 31,000 | $ | (580,320 | ) | ||||||
Altisource Portfolio Solutions SA | 4,200 | (101,430 | ) | |||||||
Apollo Residential Mortgage, Inc. | 11,200 | (150,304 | ) | |||||||
Arlington Asset Investment Corp. Class A | 800 | (10,024 | ) | |||||||
ARMOUR Residential REIT, Inc. | 15,816 | (340,518 | ) | |||||||
Chimera Investment Corp. | 3 | (41 | ) | |||||||
Encore Capital Group, Inc. | 6,600 | (169,884 | ) | |||||||
Everi Holdings, Inc. | 1,200 | (2,748 | ) | |||||||
Invesco Mortgage Capital, Inc. | 50,596 | (616,259 | ) | |||||||
JAVELIN Mortgage Investment Corp. | 2,710 | (19,458 | ) | |||||||
JG Wentworth Co. Class A | 700 | (854 | ) | |||||||
Ladder Capital Corp. | 19 | (237 | ) | |||||||
LendingClub Corp. | 62,700 | (520,410 | ) | |||||||
Nationstar Mortgage Holdings, Inc. | 65,000 | (643,500 | ) | |||||||
New Residential Investment Corp. | 50 | (581 | ) | |||||||
New York Mortgage Trust, Inc. | 2,100 | (9,954 | ) | |||||||
Ocwen Financial Corp. | 108,600 | (268,242 | ) | |||||||
Orchid Island Capital, Inc. | 12,500 | (129,625 | ) | |||||||
PHH Corp. | 600 | (7,524 | ) | |||||||
PRA Group, Inc. | 45 | (1,323 | ) | |||||||
RAIT Financial Trust | 37,100 | (116,494 | ) | |||||||
Resource Capital Corp. REIT | 9,400 | (105,750 | ) | |||||||
Stonegate Mortgage Corp. | 1,100 | (6,314 | ) | |||||||
Walter Investment Management Corp. | 16,200 | (123,768 | ) | |||||||
Western Asset Mortgage Capital Corp. | 27,435 | (275,722 | ) | |||||||
|
| |||||||||
| (4,201,284 | ) | |||||||||
|
| |||||||||
Technology Services — (0.1)% | ||||||||||
Fair Isaac Corp. | 2,300 | (244,007 | ) | |||||||
IMS Health Holdings, Inc. (b) | 5,470 | (145,229 | ) | |||||||
Spherix, Inc. | 42 | (76 | ) | |||||||
|
| |||||||||
| (389,312 | ) | |||||||||
|
| |||||||||
Telecommunications — (0.1)% | ||||||||||
AT&T, Inc. | 11 | (431 | ) | |||||||
Globalstar, Inc. | 106,000 | (155,820 | ) | |||||||
HC2 Holdings, Inc. | 300 | (1,146 | ) | |||||||
Sprint Corp. | 25,000 | (87,000 | ) | |||||||
Straight Path Communications, Inc. | 7,300 | (226,519 | ) | |||||||
Voltari Corp. | 5,000 | (19,700 | ) | |||||||
WidePoint Corp. | 500 | (300 | ) | |||||||
Windstream Holdings, Inc. | 2,000 | (15,360 | ) | |||||||
|
| |||||||||
| (506,276 | ) | |||||||||
|
| |||||||||
See Notes to Consolidated Financial Statements.
57
Blackstone Alternative Multi-Manager Fund and Subsidiaries
Consolidated Schedule of Investments (Continued)
March 31, 2016
Security Description | Shares | Value | ||||||||
Transportation & Logistics — (0.2)% | ||||||||||
DHT Holdings, Inc. | 7,400 | $ | (42,624 | ) | ||||||
Dorian LPG Ltd. | 2,200 | (20,680 | ) | |||||||
Eagle Bulk Shipping, Inc. | 900 | (324 | ) | |||||||
Nordic American Tankers Ltd. | 44,300 | (624,187 | ) | |||||||
Odyssey Marine Exploration, Inc. | 125 | (849 | ) | |||||||
Scorpio Bulkers, Inc. | 1,333 | (4,372 | ) | |||||||
XPO Logistics, Inc. | 13,500 | (414,450 | ) | |||||||
|
| |||||||||
| (1,107,486 | ) | |||||||||
|
| |||||||||
Transportation Equipment — (0.1)% | ||||||||||
Clean Diesel Technologies, Inc. | 4,700 | (3,384 | ) | |||||||
Navistar International Corp. | 38,700 | (484,524 | ) | |||||||
|
| |||||||||
| (487,908 | ) | |||||||||
|
| |||||||||
Utilities — (0.1)% | ||||||||||
Atlantic Power Corp. | 26,900 | (66,174 | ) | |||||||
Dynegy, Inc. | 15,500 | (222,735 | ) | |||||||
Genie Energy Ltd. Class B | 1,200 | (9,132 | ) | |||||||
Pattern Energy Group, Inc. | 21,400 | (408,098 | ) | |||||||
|
| |||||||||
| (706,139 | ) | |||||||||
|
| |||||||||
Waste & Environmental Services & Equipment — (0.1)% |
| |||||||||
Energy Recovery, Inc. | 1,700 | (17,578 | ) | |||||||
MagneGas Corp. | 6,900 | (7,176 | ) | |||||||
Stericycle, Inc. (b) | 3,260 | (411,379 | ) | |||||||
Vertex Energy, Inc. | 700 | (1,365 | ) | |||||||
|
| |||||||||
| (437,498 | ) | |||||||||
|
| |||||||||
Total United States | (55,026,688 | ) | ||||||||
|
| |||||||||
TOTAL COMMON STOCK | (65,395,449 | ) | ||||||||
|
| |||||||||
EXCHANGE-TRADED FUNDS — (1.6)% | ||||||||||
Consumer Discretionary Select Sector SPDR Fund | 22,810 | (1,803,130 | ) | |||||||
Consumer Staples Select Sector SPDR Fund | 23,806 | (1,262,908 | ) | |||||||
Health Care Select Sector SPDR Fund (b) | 23,483 | (1,591,678 | ) | |||||||
iShares Nasdaq Biotechnology ETF (b) | 12,094 | (3,154,236 | ) | |||||||
iShares Russell 1000 Growth ETF | 3,043 | (303,631 | ) | |||||||
iShares Russell 2000 ETF (b) | 6,081 | (672,680 | ) | |||||||
iShares U.S. Healthcare ETF (b) | 3,180 | (446,949 | ) | |||||||
iShares U.S. Healthcare Providers ETF (b) | 2,363 | (288,239 | ) | |||||||
SPDR S&P 500 ETF Trust (b) | 1,700 | (349,452 | ) | |||||||
See Notes to Consolidated Financial Statements.
58
Blackstone Alternative Multi-Manager Fund and Subsidiaries
Consolidated Schedule of Investments (Continued)
March 31, 2016
Security Description | Shares | Value | ||||||||
SPDR S&P Biotech ETF (b) | 9,760 | $ | (504,202 | ) | ||||||
|
| |||||||||
TOTAL EXCHANGE-TRADED FUNDS | (10,377,105 | ) | ||||||||
|
| |||||||||
TOTAL SECURITIES SOLD SHORT — (12.0)% | (75,772,554 | ) | ||||||||
|
| |||||||||
Footnote Legend:
| (a) | Non-income producing. |
| (b) | Security is held by a consolidated wholly-owned subsidiary of Blackstone Alternative Multi-Manager Fund. |
| (c) | All or a portion of this security is pledged as collateral for derivative financial instruments. |
| (d) | All or a portion of this security is temporarily on loan to unaffiliated broker/dealers. In addition, “Other Assets” may include pending sales that are also on loan. |
| (e) | Security is exempt from registration pursuant to Rule 144A under the Securities Act of 1933, as amended. Security may only be sold to qualified institutional buyers unless registered under the Securities Act of 1933, as amended, or otherwise exempt from registration. |
| (f) | Variable/floating interest rate security. Rate presented is as of March 31, 2016. |
| (g) | Security considered illiquid. |
| (h) | All or a portion of this security is pledged as collateral in connection with reverse repurchase agreements. |
| (i) | Security is perpetual in nature and has no stated maturity. |
| (j) | Rate disclosed, the 7 day net yield, is as of March 31, 2016. |
| (k) | The cost of investments for federal tax purposes amounts to $203,381,511. |
| (l) | Assets, other than investments in securities, less liabilities other than securities sold short. |
Options Written Contracts Outstanding at March 31, 2016
Strike | Expiration | Contracts | Premium | Market | Unrealized | |||||||||||||||
Exchange-Traded Call Options Written | ||||||||||||||||||||
Apple, Inc. | 115.00 USD | 05/20/16 | 182 | $ | (21,223 | ) | $ | (29,848 | ) | $ | (8,625 | ) | ||||||||
Imperial Brands PLC | 39.00 GBP | 05/20/16 | 4 | (4,596 | ) | (6,721 | ) | (2,125 | ) | |||||||||||
| $ | (25,819 | ) | $ | (36,569 | ) | $ | (10,750 | ) | ||||||||||||
Exchange-Traded Put Options Written | ||||||||||||||||||||
Apple, Inc. | 100.00 USD | 05/20/16 | 91 | $ | (17,760 | ) | $ | (12,467 | ) | $ | 5,293 | |||||||||
DAX Index | 9,100.00 EUR | 04/15/16 | 40 | (24,385 | ) | (3,368 | ) | 21,017 | ||||||||||||
DAX Index | 8,900.00 EUR | 06/17/16 | 42 | (31,166 | ) | (27,003 | ) | 4,163 | ||||||||||||
Imperial Brands PLC | 36.00 GBP | 05/20/16 | 4 | (4,942 | ) | (2,298 | ) | 2,644 | ||||||||||||
Vodafone Group PLC | 1.90 GBP | 09/16/16 | 132 | (13,842 | ) | (9,005 | ) | 4,837 | ||||||||||||
| $ | (92,095 | ) | $ | (54,141 | ) | $ | 37,954 | |||||||||||||
See Notes to Consolidated Financial Statements.
59
Blackstone Alternative Multi-Manager Fund and Subsidiaries
Consolidated Schedule of Investments (Continued)
March 31, 2016
Counterparty | Strike | Expiration | Contracts | Premium | Market | Unrealized | ||||||||||||||||||
OTC Put Options Written | ||||||||||||||||||||||||
SPDR S&P 500 ETF Trust | Morgan Stanley & Co. International plc | 190.00 USD | 05/20/16 | 13,800 | $ | (11,040 | ) | $ | (11,880 | ) | $ | (840 | ) | |||||||||||
Total Options Written Outstanding |
| $ | (128,954 | ) | $ | (102,590 | ) | $ | 26,364 | |||||||||||||||
Reverse Repurchase Agreements Outstanding at March 31, 2016
Counterparty | Interest Rate | Trade Date | Maturity Date | Face Value | Face Value Including Accrued Interest | |||||||||||
Credit Suisse Securities (USA) LLC | 2.47% | 01/20/16 | 04/20/16 | $ | 1,914,000 | $ | 1,923,470 | |||||||||
Credit Suisse Securities (USA) LLC | 2.47% | 01/20/16 | 04/20/16 | 1,493,000 | 1,500,387 | |||||||||||
Credit Suisse Securities (USA) LLC | 2.47% | 01/20/16 | 04/20/16 | 295,000 | 296,460 | |||||||||||
Credit Suisse Securities (USA) LLC | 2.47% | 01/20/16 | 04/20/16 | 773,000 | 776,825 | |||||||||||
JPMorgan Chase Bank, N.A. | 2.12% | 02/18/16 | 05/16/16 | 155,000 | 155,392 | |||||||||||
Total Reverse Repurchase Agreements Outstanding |
| $ | 4,630,000 | $ | 4,652,534 | |||||||||||
Futures Contracts Outstanding at March 31, 2016
Description | Contracts | Exchange | Notional | Expiration | Unrealized | |||||||||||||||
Long Futures | ||||||||||||||||||||
Australian 10-Year Bond | 11 | SFE | 1,419,930 AUD | 06/15/16 | $ | 15,763 | ||||||||||||||
CAC40 10 Euro | 37 | Euronext | 1,648,836 EUR | 04/15/16 | (30,657 | ) | ||||||||||||||
Cocoa | 31 | ICE | 920,024 USD | 07/14/16 | (2,734 | ) | ||||||||||||||
Coffee | 23 | ICE | 1,120,889 USD | 07/19/16 | (3,520 | ) | ||||||||||||||
Corn | 127 | CBOT | 2,326,053 USD | 05/13/16 | (94,028 | ) | ||||||||||||||
Cotton No. 2 | 103 | ICE | 3,030,549 USD | 05/06/16 | (20,889 | ) | ||||||||||||||
Cotton No. 2 | 37 | ICE | 1,045,953 USD | 07/07/16 | 32,782 | |||||||||||||||
DAX Index | 11 | Eurex | 2,740,393 EUR | 06/17/16 | 10,932 | |||||||||||||||
Euro FX | 22 | CME | 3,088,310 USD | 06/13/16 | 49,990 | |||||||||||||||
Euro Stoxx 50 | 115 | Eurex | 3,438,308 EUR | 06/17/16 | (76,988 | ) | ||||||||||||||
Euro-Bund | 89 | Eurex | 14,438,988 EUR | 06/08/16 | 109,798 | |||||||||||||||
FTSE/MIB Index | 33 | IDEM | 3,050,953 EUR | 06/17/16 | (149,193 | ) | ||||||||||||||
Gasoline RBOB | 12 | NYMEX | 709,104 USD | 04/29/16 | 20,033 | |||||||||||||||
Gasoline RBOB | 6 | NYMEX | 314,064 USD | 09/30/16 | 4,641 | |||||||||||||||
Gold 100 Oz | 22 | COMEX | 2,690,745 USD | 06/28/16 | 27,575 | |||||||||||||||
Hang Seng Index | 4 | HKFE | 4,074,481 HKD | 04/28/16 | 11,205 | |||||||||||||||
Japan 10-Year Bond | 2 | OSE | 302,472,300 JPY | 06/13/16 | 1,135 | |||||||||||||||
Japanese Yen Currency | 59 | CME | 6,539,941 USD | 06/13/16 | 26,759 | |||||||||||||||
Live Cattle | 27 | CME | 1,367,625 USD | 06/30/16 | (28,155 | ) | ||||||||||||||
Long Gilt | 2 | ICE | 242,942 GBP | 06/28/16 | (721 | ) | ||||||||||||||
Mex Bolsa Index | 161 | Mex Der | 71,842,003 MXN | 06/17/16 | 121,202 | |||||||||||||||
See Notes to Consolidated Financial Statements.
60
Blackstone Alternative Multi-Manager Fund and Subsidiaries
Consolidated Schedule of Investments (Continued)
March 31, 2016
Description | Contracts | Exchange | Notional | Expiration | Unrealized | |||||||||||||||
Nasdaq100 E-Mini | 1 | CME | 87,049 USD | 06/17/16 | $ | 2,476 | ||||||||||||||
Nikkei 225 | 10 | OSE | 167,243,300 JPY | 06/09/16 | 3,169 | |||||||||||||||
OMXS30 Index | 263 | Nasdaq OMX | 36,059,849 SEK | 04/15/16 | (86,164 | ) | ||||||||||||||
S&P 500 E-Mini | 32 | CME | 3,206,497 USD | 06/17/16 | 75,903 | |||||||||||||||
Sugar 11 | 8 | ICE | 136,745 USD | 04/29/16 | 791 | |||||||||||||||
Swiss Franc Currency | 24 | CME | 3,066,215 USD | 06/13/16 | 66,985 | |||||||||||||||
Swiss Market Index | 14 | Eurex | 1,091,460 CHF | 06/17/16 | (18,221 | ) | ||||||||||||||
TOPIX Index | 6 | OSE | 80,641,830 JPY | 06/09/16 | 1,850 | |||||||||||||||
U.S. Treasury 10-Year Note | 336 | CBOT | 43,704,688 USD | 06/21/16 | 106,562 | |||||||||||||||
Wheat | 23 | CBOT | 521,666 USD | 05/13/16 | 22,859 | |||||||||||||||
|
| |||||||||||||||||||
| $ | 201,140 | |||||||||||||||||||
|
| |||||||||||||||||||
Short Futures | ||||||||||||||||||||
AUD/USD Currency | 54 | CME | 4,006,924 USD | 06/13/16 | $ | (124,076 | ) | |||||||||||||
Australian 10-Year Bond | 106 | SFE | 13,778,723 AUD | 06/15/16 | (78,488 | ) | ||||||||||||||
British Pound Currency | 38 | CME | 3,393,772 USD | 06/13/16 | (19,816 | ) | ||||||||||||||
Canada 10-Year Bond | 76 | CDE | 10,756,348 CAD | 06/21/16 | 26,385 | |||||||||||||||
Canadian Currency | 41 | CME | 3,072,839 USD | 06/14/16 | (87,031 | ) | ||||||||||||||
CBOE Volatility Index | 99 | CFE | 1,959,628 USD | 05/18/16 | 214,753 | |||||||||||||||
Copper | 18 | COMEX | 994,797 USD | 05/26/16 | 12,447 | |||||||||||||||
DAX Index | 6 | Eurex | 1,504,496 EUR | 06/17/16 | 5,115 | |||||||||||||||
Euro Stoxx 50 | 472 | Eurex | 14,069,090 EUR | 06/17/16 | 267,145 | |||||||||||||||
Euro-BOBL | 4 | Eurex | 525,556 EUR | 06/08/16 | 1,316 | |||||||||||||||
Euro-BTP | 31 | Eurex | 4,312,706 EUR | 06/08/16 | (52,928 | ) | ||||||||||||||
Euro-Bund | 9 | Eurex | 1,462,044 EUR | 06/08/16 | (8,917 | ) | ||||||||||||||
Euro-Oat | 51 | Eurex | 7,950,404 EUR | 06/08/16 | (136,361 | ) | ||||||||||||||
FTSE 100 Index | 26 | ICE | 1,582,186 GBP | 06/17/16 | (10,332 | ) | ||||||||||||||
FTSE/JSE Top 40 | 47 | Safex | 21,867,705 ZAR | 06/15/16 | (8,467 | ) | ||||||||||||||
IBEX 35 Index | 12 | MEFF | 1,084,350 EUR | 04/15/16 | 47,293 | |||||||||||||||
Lean Hogs | 13 | CME | 431,876 USD | 06/14/16 | 11,456 | |||||||||||||||
Long Gilt | 90 | ICE | 10,874,374 GBP | 06/28/16 | (50,880 | ) | ||||||||||||||
Low Sulphur Gasoil | 10 | ICE | 382,347 USD | 10/12/16 | (4,403 | ) | ||||||||||||||
Low Sulphur Gasoil | 14 | ICE | 498,616 USD | 05/12/16 | (3,284 | ) | ||||||||||||||
Natural Gas | 51 | NYMEX | 1,195,056 USD | 10/27/16 | (62,095 | ) | ||||||||||||||
Natural Gas | 38 | NYMEX | 680,371 USD | 04/27/16 | (64,049 | ) | ||||||||||||||
NY Harbor ULSD | 13 | NYMEX | 713,871 USD | 11/30/16 | (9,143 | ) | ||||||||||||||
Platinum | 9 | NYMEX | 430,897 USD | 07/27/16 | (8,978 | ) | ||||||||||||||
S&P 500 | 5 | CME | 2,482,048 USD | 06/16/16 | (82,327 | ) | ||||||||||||||
S&P 500 E-Mini | 129 | CME | 12,837,997 USD | 06/17/16 | (394,178 | ) | ||||||||||||||
S&P/TSX 60 Index | 35 | CDE | 5,501,260 CAD | 06/16/16 | (5,959 | ) | ||||||||||||||
SGX Nifty 50 | 642 | SGX | 9,907,774 USD | 04/28/16 | (91,376 | ) | ||||||||||||||
Silver | 13 | COMEX | 986,194 USD | 05/26/16 | (18,966 | ) | ||||||||||||||
Soybean Meal | 1 | CBOT | 26,880 USD | 05/13/16 | (150 | ) | ||||||||||||||
Soybean Oil | 66 | CBOT | 1,221,466 USD | 05/13/16 | (133,646 | ) | ||||||||||||||
See Notes to Consolidated Financial Statements.
61
Blackstone Alternative Multi-Manager Fund and Subsidiaries
Consolidated Schedule of Investments (Continued)
March 31, 2016
Description | Contracts | Exchange | Notional | Expiration | Unrealized | |||||||||||||||
SPI 200 | 42 | SFE | 5,364,449 AUD | 06/16/16 | $ | 34,609 | ||||||||||||||
TOPIX Index | 38 | OSE | 501,232,540 JPY | 06/09/16 | (96,117 | ) | ||||||||||||||
U.S. Treasury 10-Year Note | 2 | CBOT | 261,231 USD | 06/21/16 | 450 | |||||||||||||||
U.S. Treasury 5-Year Note | 2 | CBOT | 242,138 USD | 06/30/16 | (190 | ) | ||||||||||||||
WTI Crude | 15 | NYMEX | 570,530 USD | 04/20/16 | (4,570 | ) | ||||||||||||||
|
| |||||||||||||||||||
| $ | (935,758 | ) | ||||||||||||||||||
|
| |||||||||||||||||||
Total Futures Contracts Outstanding |
| $ | (734,618 | ) | ||||||||||||||||
|
| |||||||||||||||||||
Forward Foreign Currency Exchange Contracts Outstanding at March 31, 2016
Currency | Amount in | Currency | Amount in | Counterparty | Settlement | Unrealized | ||||||||||||||||
AUD | 48,663 | USD | 36,378 | Morgan Stanley & Co. LLC | 06/15/16 | $ | 802 | |||||||||||||||
AUD | 2,404,000 | USD | 1,788,696 | State Street Bank and Trust Company | 06/15/16 | 48,031 | ||||||||||||||||
BRL | 16,409,000 | USD | 3,975,241 | State Street Bank and Trust Company | 06/02/16 | 517,062 | ||||||||||||||||
BRL | 355,000 | USD | 88,308 | State Street Bank and Trust Company | 06/02/16 | 8,880 | ||||||||||||||||
BRL | 3,843,000 | USD | 995,596 | State Street Bank and Trust Company | 06/02/16 | 56,505 | ||||||||||||||||
CAD | 265,117 | USD | 200,522 | Morgan Stanley & Co. LLC | 06/15/16 | 3,623 | ||||||||||||||||
CAD | 2,473,734 | USD | 1,852,741 | State Street Bank and Trust Company | 06/15/16 | 52,083 | ||||||||||||||||
CHF | 1,270,577 | USD | 1,281,064 | Morgan Stanley & Co. LLC | 06/15/16 | 44,524 | ||||||||||||||||
CHF | 554,296 | USD | 566,811 | Morgan Stanley & Co. LLC | 06/15/16 | 11,483 | ||||||||||||||||
CHF | 793,681 | USD | 807,852 | Morgan Stanley & Co. LLC | 06/15/16 | 20,192 | ||||||||||||||||
CHF | 534,000 | USD | 543,677 | State Street Bank and Trust Company | 06/15/16 | 13,442 | ||||||||||||||||
CHF | 812,321 | USD | 844,182 | Morgan Stanley & Co. LLC | 06/15/16 | 3,309 | ||||||||||||||||
CHF | 514,356 | USD | 533,622 | Morgan Stanley & Co. LLC | 06/15/16 | 3,003 | ||||||||||||||||
CHF | 421,579 | USD | 435,165 | Morgan Stanley & Co. LLC | 06/15/16 | 4,667 | ||||||||||||||||
CHF | 597,994 | USD | 622,554 | State Street Bank and Trust Company | 06/13/16 | 1,301 | ||||||||||||||||
CHF | 297,081 | USD | 300,000 | State Street Bank and Trust Company | 06/13/16 | 9,929 | ||||||||||||||||
CHF | 895,075 | USD | 901,385 | State Street Bank and Trust Company | 04/04/16 | 29,482 | ||||||||||||||||
CNH | 4,756,500 | USD | 700,000 | State Street Bank and Trust Company | 05/13/16 | 34,915 | ||||||||||||||||
CNH | 6,700,000 | USD | 1,016,306 | State Street Bank and Trust Company | 05/13/16 | 18,894 | ||||||||||||||||
CNH | 6,709,270 | USD | 1,028,477 | State Street Bank and Trust Company | 05/13/16 | 8,156 | ||||||||||||||||
See Notes to Consolidated Financial Statements.
62
Blackstone Alternative Multi-Manager Fund and Subsidiaries
Consolidated Schedule of Investments (Continued)
March 31, 2016
Currency | Amount in | Currency | Amount in | Counterparty | Settlement | Unrealized | ||||||||||||||||
CZK | 3,416,000 | USD | 140,715 | State Street Bank and Trust Company | 06/15/16 | $ | 3,257 | |||||||||||||||
DKK | 1,611,925 | USD | 238,722 | Morgan Stanley & Co. LLC | 06/15/16 | 7,982 | ||||||||||||||||
DKK | 363,798 | USD | 54,748 | Morgan Stanley & Co. LLC | 06/15/16 | 931 | ||||||||||||||||
DKK | 386,777 | USD | 57,838 | Morgan Stanley & Co. LLC | 06/15/16 | 1,358 | ||||||||||||||||
EUR | 1,380,000 | USD | 1,518,255 | State Street Bank and Trust Company | 06/15/16 | 55,493 | ||||||||||||||||
EUR | 2,063 | USD | 2,341 | Morgan Stanley & Co. LLC | 06/15/16 | 11 | ||||||||||||||||
EUR | 58,372 | USD | 65,647 | Morgan Stanley & Co. LLC | 06/15/16 | 920 | ||||||||||||||||
EUR | 100,000 | USD | 112,265 | Morgan Stanley & Co. LLC | 06/15/16 | 1,775 | ||||||||||||||||
EUR | 1,300,000 | USD | 1,459,523 | Morgan Stanley & Co. LLC | 06/15/16 | 22,993 | ||||||||||||||||
EUR | 100,000 | USD | 113,766 | Morgan Stanley & Co. LLC | 06/15/16 | 274 | ||||||||||||||||
EUR | 630,000 | USD | 718,780 | Morgan Stanley & Co. LLC | 06/15/16 | (329 | ) | |||||||||||||||
EUR | 1,527,367 | USD | 1,735,242 | State Street Bank and Trust Company | 06/13/16 | 6,408 | ||||||||||||||||
EUR | 577,367 | USD | 637,529 | State Street Bank and Trust Company | 04/04/16 | 19,457 | ||||||||||||||||
EUR | 950,000 | USD | 1,048,990 | State Street Bank and Trust Company | 04/04/16 | 32,015 | ||||||||||||||||
GBP | 650,000 | USD | 930,683 | Morgan Stanley & Co. LLC | 06/15/16 | 3,088 | ||||||||||||||||
GBP | 1,003 | USD | 1,452 | Morgan Stanley & Co. LLC | 06/15/16 | (11 | ) | |||||||||||||||
GBP | 716 | USD | 1,018 | Morgan Stanley & Co. LLC | 06/15/16 | 11 | ||||||||||||||||
GBP | 300,000 | USD | 423,171 | Morgan Stanley & Co. LLC | 06/15/16 | 7,800 | ||||||||||||||||
GBP | 1,356,500 | USD | 1,950,647 | State Street Bank and Trust Company | 06/13/16 | (1,988 | ) | |||||||||||||||
GBP | 1,356,500 | USD | 1,924,331 | State Street Bank and Trust Company | 04/04/16 | 23,941 | ||||||||||||||||
HKD | 380,000 | USD | 49,028 | Morgan Stanley & Co. LLC | 06/15/16 | (22 | ) | |||||||||||||||
HKD | 1,000,000 | USD | 129,045 | Morgan Stanley & Co. LLC | 06/15/16 | (82 | ) | |||||||||||||||
HKD | 1,082,000 | USD | 139,540 | Morgan Stanley & Co. LLC | 06/15/16 | (2 | ) | |||||||||||||||
HKD | 750,000 | USD | 96,788 | Morgan Stanley & Co. LLC | 06/15/16 | (66 | ) | |||||||||||||||
HUF | 1,541,741,000 | USD | 5,448,618 | State Street Bank and Trust Company | 06/15/16 | 134,131 | ||||||||||||||||
HUF | 291,121,000 | USD | 1,043,770 | State Street Bank and Trust Company | 06/15/16 | 10,399 | ||||||||||||||||
ILS | 2,031,000 | USD | 522,675 | State Street Bank and Trust Company | 06/15/16 | 18,910 | ||||||||||||||||
JPY | 168,742,700 | USD | 1,491,292 | State Street Bank and Trust Company | 06/15/16 | 11,098 | ||||||||||||||||
JPY | 157,098,000 | USD | 1,393,949 | State Street Bank and Trust Company | 06/15/16 | 4,764 | ||||||||||||||||
JPY | 8,000,000 | USD | 71,162 | Morgan Stanley & Co. LLC | 06/15/16 | 66 | ||||||||||||||||
JPY | 120,000,000 | USD | 1,062,050 | Morgan Stanley & Co. LLC | 06/15/16 | 6,362 | ||||||||||||||||
JPY | 37,000,000 | USD | 331,919 | Morgan Stanley & Co. LLC | 06/15/16 | (2,492 | ) | |||||||||||||||
JPY | 38,000,000 | USD | 338,651 | Morgan Stanley & Co. LLC | 06/15/16 | (320 | ) | |||||||||||||||
See Notes to Consolidated Financial Statements.
63
Blackstone Alternative Multi-Manager Fund and Subsidiaries
Consolidated Schedule of Investments (Continued)
March 31, 2016
Currency | Amount in | Currency | Amount in | Counterparty | Settlement | Unrealized | ||||||||||||||||
JPY | 14,500,000 | USD | 130,079 | State Street Bank and Trust Company | 06/13/16 | $ | (983 | ) | ||||||||||||||
JPY | 6,638,810 | USD | 58,970 | State Street Bank and Trust Company | 04/04/16 | 18 | ||||||||||||||||
MXN | 43,699,500 | USD | 2,446,712 | State Street Bank and Trust Company | 06/15/16 | 66,408 | ||||||||||||||||
MXN | 21,689,265 | USD | 1,251,761 | State Street Bank and Trust Company | 06/13/16 | (4,111 | ) | |||||||||||||||
MXN | 21,689,265 | USD | 1,211,691 | State Street Bank and Trust Company | 04/04/16 | 43,682 | ||||||||||||||||
NZD | 568,000 | USD | 375,726 | State Street Bank and Trust Company | 06/15/16 | 15,428 | ||||||||||||||||
NZD | 228,563 | USD | 154,792 | State Street Bank and Trust Company | 06/13/16 | 2,614 | ||||||||||||||||
RUB | 9,051,000 | USD | 124,618 | State Street Bank and Trust Company | 06/15/16 | 7,694 | ||||||||||||||||
SEK | 14,191,000 | USD | 1,682,195 | State Street Bank and Trust Company | 06/15/16 | 70,335 | ||||||||||||||||
TRY | 14,499,000 | USD | 4,895,995 | State Street Bank and Trust Company | 06/15/16 | 146,064 | ||||||||||||||||
ZAR | 22,376,000 | USD | 1,445,852 | State Street Bank and Trust Company | 06/15/16 | 48,402 | ||||||||||||||||
USD | 7,282,946 | AUD | 9,766,000 | State Street Bank and Trust Company | 06/15/16 | (178,567 | ) | |||||||||||||||
USD | 34,967 | AUD | 45,942 | Morgan Stanley & Co. LLC | 06/15/16 | (134 | ) | |||||||||||||||
USD | 2,200 | AUD | 2,901 | Morgan Stanley & Co. LLC | 06/15/16 | (17 | ) | |||||||||||||||
USD | 300,000 | BRL | 1,221,600 | State Street Bank and Trust Company | 06/02/16 | (34,438 | ) | |||||||||||||||
USD | 2,838,985 | BRL | 11,637,000 | State Street Bank and Trust Company | 06/02/16 | (346,884 | ) | |||||||||||||||
USD | 99,789 | BRL | 378,000 | State Street Bank and Trust Company | 06/02/16 | (3,696 | ) | |||||||||||||||
USD | 1,866,800 | CAD | 2,473,734 | State Street Bank and Trust Company | 06/15/16 | (38,025 | ) | |||||||||||||||
USD | 563,589 | CHF | 552,368 | Morgan Stanley & Co. LLC | 06/15/16 | (12,694 | ) | |||||||||||||||
USD | 6,300,846 | CHF | 6,258,000 | State Street Bank and Trust Company | 06/15/16 | (228,099 | ) | |||||||||||||||
USD | 3,490,270 | CHF | 3,412,960 | Morgan Stanley & Co. LLC | 06/15/16 | (70,457 | ) | |||||||||||||||
USD | 842,370 | CHF | 823,770 | Morgan Stanley & Co. LLC | 06/15/16 | (17,066 | ) | |||||||||||||||
USD | 831,577 | CHF | 816,990 | Morgan Stanley & Co. LLC | 06/15/16 | (20,785 | ) | |||||||||||||||
USD | 832,006 | CHF | 800,605 | Morgan Stanley & Co. LLC | 06/15/16 | (3,261 | ) | |||||||||||||||
USD | 409,435 | CHF | 394,653 | Morgan Stanley & Co. LLC | 06/15/16 | (2,304 | ) | |||||||||||||||
USD | 340,201 | CHF | 330,504 | Morgan Stanley & Co. LLC | 06/15/16 | (4,612 | ) | |||||||||||||||
USD | 322,193 | CHF | 308,110 | Morgan Stanley & Co. LLC | 06/15/16 | 743 | ||||||||||||||||
USD | 905,314 | CHF | 895,075 | State Street Bank and Trust Company | 06/13/16 | (28,470 | ) | |||||||||||||||
See Notes to Consolidated Financial Statements.
64
Blackstone Alternative Multi-Manager Fund and Subsidiaries
Consolidated Schedule of Investments (Continued)
March 31, 2016
Currency | Amount in | Currency | Amount in | Counterparty | Settlement | Unrealized | ||||||||||||||||
USD | 2,787,016 | CNH | 18,165,770 | State Street Bank and Trust Company | 05/13/16 | $ | (19,733 | ) | ||||||||||||||
USD | 1,296,900 | CZK | 31,894,668 | State Street Bank and Trust Company | 06/15/16 | (47,340 | ) | |||||||||||||||
USD | 12,360 | DKK | 81,250 | Morgan Stanley & Co. LLC | 06/15/16 | (76 | ) | |||||||||||||||
USD | 3,014 | DKK | 20,000 | Morgan Stanley & Co. LLC | 06/15/16 | (47 | ) | |||||||||||||||
USD | 168,277 | DKK | 1,099,746 | Morgan Stanley & Co. LLC | 06/15/16 | (39 | ) | |||||||||||||||
USD | 47,777 | EUR | 43,293 | Morgan Stanley & Co. LLC | 06/15/16 | (1,594 | ) | |||||||||||||||
USD | 4,289,612 | EUR | 3,833,434 | Morgan Stanley & Co. LLC | 06/15/16 | (82,025 | ) | |||||||||||||||
USD | 178,024 | EUR | 160,000 | Morgan Stanley & Co. LLC | 06/15/16 | (4,440 | ) | |||||||||||||||
USD | 1,441,102 | EUR | 1,294,000 | State Street Bank and Trust Company | 06/15/16 | (34,572 | ) | |||||||||||||||
USD | 51,672 | EUR | 45,946 | Morgan Stanley & Co. LLC | 06/15/16 | (724 | ) | |||||||||||||||
USD | 639,359 | EUR | 577,367 | State Street Bank and Trust Company | 06/13/16 | (19,010 | ) | |||||||||||||||
USD | 1,051,954 | EUR | 950,000 | State Street Bank and Trust Company | 06/13/16 | (31,326 | ) | |||||||||||||||
USD | 12,955 | GBP | 9,107 | Morgan Stanley & Co. LLC | 06/15/16 | (128 | ) | |||||||||||||||
USD | 1,830,287 | GBP | 1,286,000 | State Street Bank and Trust Company | 06/15/16 | (17,143 | ) | |||||||||||||||
USD | 1,570,909 | GBP | 1,091,834 | Morgan Stanley & Co. LLC | 06/15/16 | 2,412 | ||||||||||||||||
USD | 1,468,123 | GBP | 1,032,000 | State Street Bank and Trust Company | 06/15/16 | (14,418 | ) | |||||||||||||||
USD | 144,916 | GBP | 100,000 | Morgan Stanley & Co. LLC | 06/15/16 | 1,259 | ||||||||||||||||
USD | 1,000,000 | GBP | 694,854 | State Street Bank and Trust Company | 04/21/16 | 1,965 | ||||||||||||||||
USD | 285,094 | GBP | 200,000 | Morgan Stanley & Co. LLC | 06/15/16 | (2,220 | ) | |||||||||||||||
USD | 469,170 | GBP | 325,000 | Morgan Stanley & Co. LLC | 06/15/16 | 2,285 | ||||||||||||||||
USD | 1,924,968 | GBP | 1,356,500 | State Street Bank and Trust Company | 06/13/16 | (23,691 | ) | |||||||||||||||
USD | 2,684,668 | HKD | 20,820,000 | Morgan Stanley & Co. LLC | 06/15/16 | (344 | ) | |||||||||||||||
USD | 9,502,225 | ILS | 36,938,000 | State Street Bank and Trust Company | 06/15/16 | (347,636 | ) | |||||||||||||||
USD | 26,476 | JPY | 3,000,000 | Morgan Stanley & Co. LLC | 06/15/16 | (234 | ) | |||||||||||||||
USD | 7,522,407 | JPY | 852,642,248 | Morgan Stanley & Co. LLC | 06/15/16 | (69,039 | ) | |||||||||||||||
USD | 59,137 | JPY | 6,638,810 | State Street Bank and Trust Company | 06/13/16 | 30 | ||||||||||||||||
USD | 70,058 | JPY | 7,861,190 | State Street Bank and Trust Company | 06/13/16 | 68 | ||||||||||||||||
USD | 1,779,708 | KRW | 2,142,324,000 | State Street Bank and Trust Company | 06/15/16 | (86,950 | ) | |||||||||||||||
USD | 1,418,279 | KRW | 1,694,701,000 | State Street Bank and Trust Company | 06/15/16 | (58,355 | ) | |||||||||||||||
USD | 355,751 | MXN | 6,406,000 | State Street Bank and Trust Company | 06/15/16 | (12,653 | ) | |||||||||||||||
See Notes to Consolidated Financial Statements.
65
Blackstone Alternative Multi-Manager Fund and Subsidiaries
Consolidated Schedule of Investments (Continued)
March 31, 2016
Currency | Amount in | Currency | Amount in | Counterparty | Settlement | Unrealized | ||||||||||||||||
USD | 1,202,454 | MXN | 21,689,265 | State Street Bank and Trust Company | 06/13/16 | $ | (45,196 | ) | ||||||||||||||
USD | 155,583 | NZD | 228,563 | State Street Bank and Trust Company | 04/04/16 | (2,400 | ) | |||||||||||||||
USD | 3,470,408 | NZD | 5,224,000 | State Street Bank and Trust Company | 06/15/16 | (127,114 | ) | |||||||||||||||
USD | 154,147 | NZD | 228,563 | State Street Bank and Trust Company | 06/13/16 | (3,259 | ) | |||||||||||||||
USD | 685,033 | RUB | 49,569,000 | State Street Bank and Trust Company | 06/15/16 | (39,591 | ) | |||||||||||||||
USD | 187,480 | SEK | 1,560,000 | State Street Bank and Trust Company | 06/15/16 | (5,174 | ) | |||||||||||||||
USD | 492,791 | TRY | 1,456,000 | State Street Bank and Trust Company | 06/15/16 | (13,536 | ) | |||||||||||||||
USD | 163,818 | ZAR | 2,615,000 | State Street Bank and Trust Company | 06/15/16 | (10,809 | ) | |||||||||||||||
|
| |||||||||||||||||||||
Total Forward Foreign Currency Exchange Contracts Outstanding |
| $ | (447,597 | ) | ||||||||||||||||||
|
| |||||||||||||||||||||
Centrally Cleared Credit Default Swaps on Index (Buy Protection) — Outstanding at March 31, 2016
Reference | The | Maturity | Counterparty | Notional | Market | Upfront | Unrealized | |||||||||||||||||||
CDX.NA.HY.25 | (5.00)% | 12/20/20 | Credit Suisse Securities (USA) LLC | 4,388,995 USD | $ | (125,552) | $ | 164,751 | $ | (290,303) | ||||||||||||||||
Total Centrally Cleared Credit Default Swaps on Index (Buy Protection) |
| $ | (125,552) | $ | 164,751 | $ | (290,303) | |||||||||||||||||||
OTC Total Return Swaps Outstanding at March 31, 2016
Reference | Termination | Counterparty | Notional | Unrealized | |||||||||||||
Buys | |||||||||||||||||
Adecco SA REG | 02/09/17 | Credit Suisse Securities (Europe) Limited | 308,216 CHF | $ | (1,020 | ) | |||||||||||
Airbus Group | 08/18/16 | Credit Suisse Securities (Europe) Limited | 163,205 EUR | (5,976 | ) | ||||||||||||
Amadeus IT Holding SA | 09/18/17 | Credit Suisse Securities (Europe) Limited | 358,804 EUR | 6,997 | |||||||||||||
Atlantia SpA | 08/18/16 | Credit Suisse Securities (Europe) Limited | 445,909 EUR | 3,564 | |||||||||||||
Atos | 08/18/16 | Credit Suisse Securities (Europe) Limited | 1,044,792 EUR | 30,207 | |||||||||||||
Bayer AG | 08/18/16 | Credit Suisse Securities (Europe) Limited | 373,100 EUR | 14,010 | |||||||||||||
BNP Paribas SA | 08/18/16 | Credit Suisse Securities (Europe) Limited | 534,749 EUR | (36,045 | ) | ||||||||||||
Casino Guichard Perrachon | 08/18/16 | Credit Suisse Securities (Europe) Limited | 231,309 EUR | 13,627 | |||||||||||||
See Notes to Consolidated Financial Statements.
66
Blackstone Alternative Multi-Manager Fund and Subsidiaries
Consolidated Schedule of Investments (Continued)
March 31, 2016
Reference | Termination | Counterparty | Notional | Unrealized | |||||||||||||
Cie de St-Gobain | 08/18/16 | Credit Suisse Securities (Europe) Limited | 233,456 EUR | $ | 5,210 | ||||||||||||
Credit Agricole SA | 08/18/16 | Credit Suisse Securities (Europe) Limited | 351,571 EUR | (31,447 | ) | ||||||||||||
Criteo SA ADR | 11/14/16 | Credit Suisse Securities (Europe) Limited | 352,953 USD | 42,484 | |||||||||||||
Croda International PLC | 08/17/16 | Credit Suisse Securities (Europe) Limited | 216,513 GBP | 18,311 | |||||||||||||
Dassault Aviation SA | 08/18/16 | Credit Suisse Securities (Europe) Limited | 280,947 EUR | 13,903 | |||||||||||||
Delhaize Group | 01/23/17 | Credit Suisse Securities (Europe) Limited | 404,503 EUR | (9,579 | ) | ||||||||||||
Endesa SA | 09/18/17 | Credit Suisse Securities (Europe) Limited | 357,154 EUR | (10,787 | ) | ||||||||||||
Enel SpA | 08/18/16 | Credit Suisse Securities (Europe) Limited | 169,304 EUR | 396 | |||||||||||||
ENI SpA Italia | 08/18/16 | Credit Suisse Securities (Europe) Limited | 159,073 EUR | 1,371 | |||||||||||||
Ferrovial SA | 09/25/17 | Credit Suisse Securities (Europe) Limited | 287,941 EUR | (2,044 | ) | ||||||||||||
Fresenius Medical Care AG & Co. KgaA | 08/18/16 | Credit Suisse Securities (Europe) Limited | 591,745 EUR | 7,257 | |||||||||||||
GlaxoSmithKline PLC | 08/10/17 | Morgan Stanley Capital Services LLC | 204,722 GBP | 8,746 | |||||||||||||
Imperial Tobaco Group PLC | 08/17/16 | Credit Suisse Securities (Europe) Limited | 551,753 GBP | 22,358 | |||||||||||||
ING Groep NV | 08/18/16 | Credit Suisse Securities (Europe) Limited | 524,088 EUR | (49,868 | ) | ||||||||||||
Intercontinental Hotels Group | 08/17/16 | Credit Suisse Securities (Europe) Limited | 339,943 GBP | 15,439 | |||||||||||||
Intesa San Paolo | 08/18/16 | Credit Suisse Securities (Europe) Limited | 146,821 EUR | (13,618 | ) | ||||||||||||
Koninklijke DSM NV | 08/18/16 | Credit Suisse Securities (Europe) Limited | 360,616 EUR | (42 | ) | ||||||||||||
Koninklijke Philips NV | 08/18/16 | Credit Suisse Securities (Europe) Limited | 276,859 EUR | 8,863 | |||||||||||||
Linde AG | 08/18/16 | Credit Suisse Securities (Europe) Limited | 316,282 EUR | (3,203 | ) | ||||||||||||
Lloyds Banking Group PLC | 08/17/16 | Credit Suisse Securities (Europe) Limited | 247,840 GBP | (6,120 | ) | ||||||||||||
Nokia Oyj | 10/17/16 | Credit Suisse Securities (Europe) Limited | 648,365 EUR | (33,045 | ) | ||||||||||||
Orange | 08/18/16 | Credit Suisse Securities (Europe) Limited | 228,885 EUR | (14,460 | ) | ||||||||||||
Prudential PLC | 08/17/16 | Credit Suisse Securities (Europe) Limited | 276,517 GBP | (4,974 | ) | ||||||||||||
Publicis Groupe | 08/18/16 | Credit Suisse Securities (Europe) Limited | 233,789 EUR | 4,739 | |||||||||||||
Puma SE | 08/18/16 | Credit Suisse Securities (Europe) Limited | 468,550 EUR | (1,233 | ) | ||||||||||||
Renault SA | 08/18/16 | Credit Suisse Securities (Europe) Limited | 334,687 EUR | 14,817 | |||||||||||||
Roche Holding AG Genusschein | 02/09/17 | Credit Suisse Securities (Europe) Limited | 411,242 CHF | (16,837 | ) | ||||||||||||
Royal Dutch Shell PLC | 08/17/16 | Credit Suisse Securities (Europe) Limited | 462,466 GBP | 15,800 | |||||||||||||
RSA Insurance Group PLC | 08/17/16 | Credit Suisse Securities (Europe) Limited | 534,841 GBP | 28,296 | |||||||||||||
Sanofi Aventis | 08/09/17 | Morgan Stanley Capital Services LLC | 260,531 EUR | (12,634 | ) | ||||||||||||
Sanofi Aventis | 08/18/16 | Credit Suisse Securities (Europe) Limited | 459,088 EUR | (23,448 | ) | ||||||||||||
Shire PLC | 12/28/16 | Credit Suisse Securities (Europe) Limited | 316,481 GBP | 5,461 | |||||||||||||
Skandinaviska Enskilda Banken AB | 08/18/16 | Credit Suisse Securities (Europe) Limited | 2,760,723 SEK | (42,244 | ) | ||||||||||||
See Notes to Consolidated Financial Statements.
67
Blackstone Alternative Multi-Manager Fund and Subsidiaries
Consolidated Schedule of Investments (Continued)
March 31, 2016
Reference | Termination | Counterparty | Notional | Unrealized | |||||||||||||
Smith & Nephew PLC | 08/17/16 | Credit Suisse Securities (Europe) Limited | 805,764 GBP | $ | 26,818 | ||||||||||||
Starwood Hotels & Resorts | 11/14/16 | Credit Suisse Securities (Europe) Limited | 814,962 USD | 17,169 | |||||||||||||
TDC A/S | 09/29/17 | Credit Suisse Securities (Europe) Limited | 2,417,883 DKK | 98 | |||||||||||||
Tim Participacoes ADR | 11/14/16 | Credit Suisse Securities (Europe) Limited | 269,149 USD | 29,725 | |||||||||||||
TUI AG DI | 08/18/16 | Credit Suisse Securities (Europe) Limited | 270,920 EUR | 9,261 | |||||||||||||
UBM PLC | 08/17/16 | Credit Suisse Securities (Europe) Limited | 370,247 GBP | 3,563 | |||||||||||||
Vodafone Group PLC | 08/17/16 | Credit Suisse Securities (Europe) Limited | 422,558 GBP | 3,588 | |||||||||||||
Vodafone Group PLC | 12/28/16 | Credit Suisse Securities (Europe) Limited | 773,258 GBP | 41,905 | |||||||||||||
|
| ||||||||||||||||
Total Buys | $ | 95,359 | |||||||||||||||
|
| ||||||||||||||||
Sells | |||||||||||||||||
ABB Ltd. REG | 02/09/17 | Credit Suisse Securities (Europe) Limited | 393,627 CHF | $ | (13,298 | ) | |||||||||||
Air Liquide SA | 08/18/16 | Credit Suisse Securities (Europe) Limited | 167,557 EUR | (1,083 | ) | ||||||||||||
Allianz SE REG | 08/18/16 | Credit Suisse Securities (Europe) Limited | 246,617 EUR | 6,050 | |||||||||||||
Altran Technologies SA | 08/18/16 | Credit Suisse Securities (Europe) Limited | 24,725 EUR | (735 | ) | ||||||||||||
America Movil ADR | 07/25/16 | Credit Suisse Securities (Europe) Limited | 24,601 USD | (1,894 | ) | ||||||||||||
Atlas Copco AB | 08/18/16 | Credit Suisse Securities (Europe) Limited | 1,640,796 SEK | (3,012 | ) | ||||||||||||
AXA SA | 08/18/16 | Credit Suisse Securities (Europe) Limited | 275,906 EUR | 15,026 | |||||||||||||
Bovespa Index | 09/18/17 | Morgan Stanley Capital Services LLC | 3,430,450 BRL | (50,618 | ) | ||||||||||||
British American Tobacco PLC | 08/17/16 | Credit Suisse Securities (Europe) Limited | 37,812 GBP | 500 | |||||||||||||
Bureau Veritas SA | 08/18/16 | Credit Suisse Securities (Europe) Limited | 163,843 EUR | (7,841 | ) | ||||||||||||
Cap Gemini | 08/18/16 | Credit Suisse Securities (Europe) Limited | 22,631 EUR | (1,310 | ) | ||||||||||||
CSL LTD | 03/02/17 | Morgan Stanley Capital Services LLC | 869,757 AUD | 15,404 | |||||||||||||
Danone | 08/18/16 | Credit Suisse Securities (Europe) Limited | 11,306 EUR | (10 | ) | ||||||||||||
Distribuidora Internacional | 09/18/17 | Credit Suisse Securities (Europe) Limited | 101,086 EUR | 825 | |||||||||||||
Elekta AB | 08/18/16 | Credit Suisse Securities (Europe) Limited | 1,548,284 SEK | 6,822 | |||||||||||||
Ericsson LM | 08/18/16 | Credit Suisse Securities (Europe) Limited | 159,415 SEK | (472 | ) | ||||||||||||
Fresenius Medical Care AG & Co KGaA | 08/09/17 | Morgan Stanley Capital Services LLC | 445,907 EUR | (33,790 | ) | ||||||||||||
iShares MSCI Brazil Capped ETF | 11/14/16 | Credit Suisse Securities (Europe) Limited | 50,435 USD | (1,981 | ) | ||||||||||||
Italcementi SpA | 08/18/16 | Credit Suisse Securities (Europe) Limited | 40,141 EUR | (9 | ) | ||||||||||||
KOSPI 200 Index | 09/18/17 | Morgan Stanley Capital Services LLC | 4,320,923,600 KRW | (99,927 | ) | ||||||||||||
L’Oreal | 08/18/16 | Credit Suisse Securities (Europe) Limited | 37,048 EUR | 54 | |||||||||||||
Marriott International | 11/14/16 | Credit Suisse Securities (Europe) Limited | 242,852 USD | 5,111 | |||||||||||||
See Notes to Consolidated Financial Statements.
68
Blackstone Alternative Multi-Manager Fund and Subsidiaries
Consolidated Schedule of Investments (Continued)
March 31, 2016
Reference | Termination | Counterparty | Notional | Unrealized | |||||||||||||
Merck KgaA | 08/09/17 | Morgan Stanley Capital Services LLC | 293,530 EUR | $ | 45,209 | ||||||||||||
Nestle SA REG | 02/09/17 | Credit Suisse Securities (Europe) Limited | 21,063 CHF | (138 | ) | ||||||||||||
Philip Morris International | 11/14/16 | Credit Suisse Securities (Europe) Limited | 76,381 USD | (1,323 | ) | ||||||||||||
Sainsbury (J) PLC | 08/17/16 | Credit Suisse Securities (Europe) Limited | 93,648 GBP | 630 | |||||||||||||
Sandvik AB | 08/18/16 | Credit Suisse Securities (Europe) Limited | 1,660,387 SEK | (9,824 | ) | ||||||||||||
SAP SE | 08/18/16 | Credit Suisse Securities (Europe) Limited | 13,401 EUR | (123 | ) | ||||||||||||
Siemens AG REG | 08/18/16 | Credit Suisse Securities (Europe) Limited | 182,056 EUR | (5,995 | ) | ||||||||||||
Telefonica Brasil | 11/14/16 | Credit Suisse Securities (Europe) Limited | 143,836 USD | (20,982 | ) | ||||||||||||
Telefonica SA | 09/18/17 | Credit Suisse Securities (Europe) Limited | 720,625 EUR | 11,727 | |||||||||||||
|
| ||||||||||||||||
Total Sells | $ | (147,007 | ) | ||||||||||||||
|
| ||||||||||||||||
Total OTC Total Return Swaps Outstanding |
| $ | (51,648 | ) | |||||||||||||
|
| ||||||||||||||||
Abbreviation Legend: | ||||
| ADR | American Depository Receipt | |||
| CBOT | Chicago Board of Trade | |||
| CDE | Montreal Exchange | |||
| CFE | CBOE Futures Exchange | |||
| CME | Chicago Mercantile Exchange | |||
| COMEX | Commodities Exchange Center | |||
| Eurex | Eurex Exchange | |||
| Euronext | Euronext Paris | |||
| HKFE | Hong Kong Futures Exchange Ltd. | |||
| ICE | Ice Futures Europe | |||
| IDEM | Italian Derivatives Exchange Market | |||
| MEFF | MEFF Renta Variable | |||
| NYMEX | New York Mercantile Exchange | |||
| OSE | Osaka Exchange | |||
| OTC | Over the Counter | |||
| REIT | Real Estate Investment Trust | |||
| Safex | South African Futures Exchange | |||
| SFE | ASX Trade24 | |||
| SGX | Singapore Exchange | |||
See Notes to Consolidated Financial Statements.
69
Blackstone Alternative Multi-Manager Fund and Subsidiaries
Consolidated Schedule of Investments (Continued)
March 31, 2016
Currency Legend: | ||||
| AUD | Australian Dollar | |||
| BRL | Brazilian Real | |||
| CAD | Canadian Dollar | |||
| CHF | Swiss Franc | |||
| CNH | Chinese Renminbi | |||
| CZK | Czech Koruna | |||
| DKK | Danish Krone | |||
| EUR | Euro | |||
| GBP | British Pound | |||
| HKD | Hong Kong Dollar | |||
| HUF | Hungarian Forint | |||
| ILS | Israeli Shekel | |||
| JPY | Japanese Yen | |||
| KRW | South Korean Won | |||
| MXN | Mexican Peso | |||
| NZD | New Zealand Dollar | |||
| RUB | Russian Ruble | |||
| SEK | Swedish Krona | |||
| TRY | Turkish Lira | |||
| USD | United States Dollar | |||
| ZAR | South African Rand | |||
See Notes to Consolidated Financial Statements.
70
Blackstone Alternative Multi-Strategy Fund and Subsidiaries
Consolidated Schedule of Investments
March 31, 2016
Security Description | Shares | Value | ||||||||
INVESTMENTS IN SECURITIES — 100.0% | ||||||||||
COMMON STOCK — 36.1% | ||||||||||
Argentina — 0.0% | ||||||||||
Gaming, Lodging & Restaurants — 0.0% | ||||||||||
Arcos Dorados Holdings, Inc. A Shares (a) | 11,400 | $ | 42,750 | |||||||
|
| |||||||||
Total Argentina | 42,750 | |||||||||
|
| |||||||||
Australia — 0.0% | ||||||||||
Iron & Steel — 0.0% | ||||||||||
BHP Billiton PLC ADR | 36,900 | 838,737 | ||||||||
|
| |||||||||
Total Australia | 838,737 | |||||||||
|
| |||||||||
Belgium — 0.0% | ||||||||||
Biotechnology & Pharmaceuticals — 0.0% | ||||||||||
Galapagos NV (a),(b) | 12,764 | 537,248 | ||||||||
|
| |||||||||
Insurance — 0.0% | ||||||||||
Ageas | 32,851 | 1,303,481 | ||||||||
|
| |||||||||
Transportation & Logistics — 0.0% | ||||||||||
Euronav NV | 4,700 | 48,128 | ||||||||
|
| |||||||||
Total Belgium | 1,888,857 | |||||||||
|
| |||||||||
Bermuda — 0.1% | ||||||||||
Insurance — 0.0% | ||||||||||
Aspen Insurance Holdings Ltd. | 100 | 4,770 | ||||||||
|
| |||||||||
Media — 0.0% | ||||||||||
Central European Media Enterprises Ltd. A Shares (a) | 5,200 | 13,260 | ||||||||
|
| |||||||||
Semiconductors — 0.1% | ||||||||||
Marvell Technology Group Ltd. | 216,900 | 2,236,239 | ||||||||
|
| |||||||||
Transportation & Logistics — 0.0% | ||||||||||
Teekay Corp. | 3,200 | 27,712 | ||||||||
|
| |||||||||
Total Bermuda | 2,281,981 | |||||||||
|
| |||||||||
Brazil — 0.0% | ||||||||||
Consumer Products — 0.0% | ||||||||||
BRF SA ADR | 2,400 | 34,128 | ||||||||
|
| |||||||||
Forest & Paper Products — 0.0% | ||||||||||
Fibria Celulose SA ADR | 100 | 848 | ||||||||
|
| |||||||||
Iron & Steel — 0.0% | ||||||||||
Gerdau SA ADR | 1,100 | 1,958 | ||||||||
|
| |||||||||
See Notes to Consolidated Financial Statements.
71
Blackstone Alternative Multi-Strategy Fund and Subsidiaries
Consolidated Schedule of Investments (Continued)
March 31, 2016
Security Description | Shares | Value | ||||||||
Oil, Gas & Coal — 0.0% | ||||||||||
Cosan Ltd. A Shares | 2,600 | $ | 12,792 | |||||||
|
| |||||||||
Utilities — 0.0% | ||||||||||
Cia Energetica de Minas Gerais ADR | 31,400 | 70,964 | ||||||||
|
| |||||||||
Total Brazil | 120,690 | |||||||||
|
| |||||||||
Canada — 0.2% | ||||||||||
Asset Management — 0.0% | ||||||||||
Fairfax India Holdings Corp. (a) | 97,600 | 1,058,960 | ||||||||
|
| |||||||||
Automotive — 0.0% | ||||||||||
Magna International, Inc. | 48,000 | 2,062,080 | ||||||||
|
| |||||||||
Banking — 0.1% | ||||||||||
Canadian Imperial Bank of Commerce | 17,050 | 1,273,679 | ||||||||
National Bank of Canada | 36,400 | 1,190,865 | ||||||||
|
| |||||||||
| 2,464,544 | ||||||||||
|
| |||||||||
Biotechnology & Pharmaceuticals — 0.0% | ||||||||||
Aralez Pharmaceuticals, Inc. (a) | 4,200 | 14,910 | ||||||||
QLT, Inc. (a) | 6,400 | 12,736 | ||||||||
Sophiris Bio, Inc. (a) | 1,300 | 1,872 | ||||||||
|
| |||||||||
| 29,518 | ||||||||||
|
| |||||||||
Consumer Products — 0.0% | ||||||||||
Cott Corp. | 1,900 | 26,391 | ||||||||
SunOpta, Inc. (a) | 4,200 | 18,732 | ||||||||
|
| |||||||||
| 45,123 | ||||||||||
|
| |||||||||
Forest & Paper Products — 0.0% | ||||||||||
Mercer International, Inc. (c) | 9,300 | 87,885 | ||||||||
|
| |||||||||
Gaming, Lodging & Restaurants — 0.0% | ||||||||||
Restaurant Brands International | 21 | 815 | ||||||||
|
| |||||||||
Media — 0.0% | ||||||||||
Points International Ltd. (a) | 100 | 871 | ||||||||
|
| |||||||||
Metals & Mining — 0.0% | ||||||||||
Dominion Diamond Corp. (c) | 20,300 | 225,127 | ||||||||
Eldorado Gold Corp. (a) | 3,900 | 12,324 | ||||||||
Fortuna Silver Mines, Inc. (a) | 4,900 | 19,110 | ||||||||
IAMGOLD Corp. (a) | 100 | 221 | ||||||||
Kinross Gold Corp. (a) | 14,500 | 49,300 | ||||||||
MFC Industrial Ltd. (a) | 400 | 792 | ||||||||
Nevsun Resources Ltd. | 7,200 | 23,328 | ||||||||
Sandstorm Gold Ltd. (a) | 900 | 2,961 | ||||||||
See Notes to Consolidated Financial Statements.
72
Blackstone Alternative Multi-Strategy Fund and Subsidiaries
Consolidated Schedule of Investments (Continued)
March 31, 2016
Security Description | Shares | Value | ||||||||
Taseko Mines Ltd. (a) | 200 | $ | 112 | |||||||
Turquoise Hill Resources Ltd. (a) | 2,000 | 5,080 | ||||||||
|
| |||||||||
| 338,355 | ||||||||||
|
| |||||||||
Oil, Gas & Coal — 0.0% | ||||||||||
Advantage Oil & Gas Ltd. (a),(c) | 5,300 | 29,097 | ||||||||
Gran Tierra Energy, Inc. (a),(c) | 21,600 | 53,352 | ||||||||
TransGlobe Energy Corp. (c) | 800 | 1,328 | ||||||||
|
| |||||||||
| 83,777 | ||||||||||
|
| |||||||||
Passenger Transportation — 0.0% | ||||||||||
Student Transportation, Inc. | 1,800 | 9,126 | ||||||||
|
| |||||||||
Renewable Energy — 0.1% | ||||||||||
Canadian Solar, Inc. (a),(d) | 118,115 | 2,277,257 | ||||||||
|
| |||||||||
Total Canada | 8,458,311 | |||||||||
|
| |||||||||
Cayman Islands — 0.0% | ||||||||||
Utilities — 0.0% | ||||||||||
Consolidated Water Co. Ltd. | 100 | 1,217 | ||||||||
|
| |||||||||
Total Cayman Islands | 1,217 | |||||||||
|
| |||||||||
Chile — 0.0% | ||||||||||
Chemicals — 0.0% | ||||||||||
Sociedad Quimica y Minera de Chile SA ADR | 3,900 | 80,145 | ||||||||
|
| |||||||||
Utilities — 0.0% | ||||||||||
Enersis SA ADR | 22,500 | 312,750 | ||||||||
|
| |||||||||
Total Chile | 392,895 | |||||||||
|
| |||||||||
China — 0.5% | ||||||||||
Automotive — 0.0% | ||||||||||
China Automotive Systems, Inc. (a) | 1,900 | 8,816 | ||||||||
|
| |||||||||
Biotechnology & Pharmaceuticals — 0.0% | ||||||||||
Sinovac Biotech Ltd. (a) | 700 | 4,473 | ||||||||
|
| |||||||||
Consumer Services — 0.0% | ||||||||||
New Oriental Education & Technology Group, Inc. ADR | 34,600 | 1,196,814 | ||||||||
Tarena International, Inc. ADR | 400 | 4,324 | ||||||||
|
| |||||||||
| 1,201,138 | ||||||||||
|
| |||||||||
Gaming, Lodging & Restaurants — 0.1% | ||||||||||
Homeinns Hotel Group ADR (a) | 52,000 | 1,853,800 | ||||||||
|
| |||||||||
Health Care Facilities & Services — 0.0% | ||||||||||
iKang Healthcare Group, Inc. ADR (a) | 800 | 17,488 | ||||||||
|
| |||||||||
See Notes to Consolidated Financial Statements.
73
Blackstone Alternative Multi-Strategy Fund and Subsidiaries
Consolidated Schedule of Investments (Continued)
March 31, 2016
Security Description | Shares | Value | ||||||||
Insurance — 0.0% | ||||||||||
China Life Insurance Co. Ltd. ADR | 25,900 | $ | 318,311 | |||||||
CNinsure, Inc. ADR (a) | 4,400 | 35,288 | ||||||||
|
| |||||||||
| 353,599 | ||||||||||
|
| |||||||||
Machinery — 0.0% | ||||||||||
Hollysys Automation Technologies Ltd. (a) | 7,700 | 162,085 | ||||||||
|
| |||||||||
Media — 0.4% | ||||||||||
Baidu, Inc. ADR (a) | 77,009 | 14,699,478 | ||||||||
Leju Holdings Ltd. ADR | 700 | 3,647 | ||||||||
SINA Corp. (a) | 7,400 | 350,538 | ||||||||
Sohu.com, Inc. (a) | 23,600 | 1,169,144 | ||||||||
Xunlei Ltd. ADR (a) | 200 | 1,222 | ||||||||
Zhaopin Ltd. ADR (a) | 1,840 | 29,219 | ||||||||
|
| |||||||||
| 16,253,248 | ||||||||||
|
| |||||||||
Metals & Mining — 0.0% | ||||||||||
Aluminum Corp. of China Ltd. ADR (a) | 300 | 2,394 | ||||||||
|
| |||||||||
Passenger Transportation — 0.0% | ||||||||||
China Southern Airlines Co. Ltd. ADR | 4,300 | 134,332 | ||||||||
Guangshen Railway Co. Ltd. ADR | 200 | 4,282 | ||||||||
|
| |||||||||
| 138,614 | ||||||||||
|
| |||||||||
Real Estate — 0.0% | ||||||||||
E-House China Holdings Ltd. ADR | 6,100 | 37,942 | ||||||||
Xinyuan Real Estate Co. Ltd. ADR | 12,800 | 56,704 | ||||||||
|
| |||||||||
| 94,646 | ||||||||||
|
| |||||||||
Renewable Energy — 0.0% | ||||||||||
JA Solar Holdings Co. Ltd. ADR (a) | 5,500 | 47,355 | ||||||||
Trina Solar Ltd. ADR (a) | 100 | 994 | ||||||||
|
| |||||||||
| 48,349 | ||||||||||
|
| |||||||||
Retail—Discretionary — 0.0% | ||||||||||
E-Commerce China Dangdang, Inc. A Shares ADR (a) | 3,300 | 23,529 | ||||||||
|
| |||||||||
Software — 0.0% | ||||||||||
Changyou.com Ltd. ADR (a) | 800 | 15,024 | ||||||||
NetEase, Inc. ADR | 3,200 | 459,456 | ||||||||
|
| |||||||||
| 474,480 | ||||||||||
|
| |||||||||
Technology Services — 0.0% | ||||||||||
Baozun, Inc. (a) | 100 | 584 | ||||||||
|
| |||||||||
See Notes to Consolidated Financial Statements.
74
Blackstone Alternative Multi-Strategy Fund and Subsidiaries
Consolidated Schedule of Investments (Continued)
March 31, 2016
Security Description | Shares | Value | ||||||||
Utilities — 0.0% | ||||||||||
Huaneng Power International, Inc. ADR | 600 | $ | 21,336 | |||||||
|
| |||||||||
Total China | 20,658,579 | |||||||||
|
| |||||||||
Cyprus — 0.0% | ||||||||||
Oil, Gas & Coal — 0.0% | ||||||||||
Ocean Rig UDW, Inc. | 3,400 | 2,789 | ||||||||
|
| |||||||||
Total Cyprus | 2,789 | |||||||||
|
| |||||||||
France — 0.1% | ||||||||||
Asset Management — 0.1% | ||||||||||
Amundi SA (a) | 31,157 | 1,483,554 | ||||||||
|
| |||||||||
Banking — 0.0% | ||||||||||
BNP Paribas SA | 23,423 | 1,178,863 | ||||||||
|
| |||||||||
Total France | 2,662,417 | |||||||||
|
| |||||||||
Greece — 0.0% | ||||||||||
Real Estate — 0.0% | ||||||||||
Grivalia Properties REIC | 109,825 | 921,028 | ||||||||
|
| |||||||||
Transportation & Logistics — 0.0% | ||||||||||
Aegean Marine Petroleum Network, Inc. | 13,100 | 99,167 | ||||||||
Costamare, Inc. | 15,300 | 136,170 | ||||||||
Safe Bulkers, Inc. | 13,000 | 10,445 | ||||||||
StealthGas, Inc. (a) | 1,500 | 5,295 | ||||||||
Tsakos Energy Navigation Ltd. | 32,500 | 200,850 | ||||||||
|
| |||||||||
| 451,927 | ||||||||||
|
| |||||||||
Total Greece | 1,372,955 | |||||||||
|
| |||||||||
Hong Kong — 0.0% | ||||||||||
Health Care Facilities & Services — 0.0% | ||||||||||
China Cord Blood Corp. (a) | 1,300 | 7,891 | ||||||||
|
| |||||||||
Insurance — 0.0% | ||||||||||
AIA Group Ltd. | 204,600 | 1,159,181 | ||||||||
|
| |||||||||
Media — 0.0% | ||||||||||
Global Sources Ltd. (a) | 1,500 | 12,150 | ||||||||
|
| |||||||||
Total Hong Kong | 1,179,222 | |||||||||
|
| |||||||||
India — 0.1% | ||||||||||
Banking — 0.1% | ||||||||||
ICICI Bank Ltd. ADR | 285,047 | 2,040,937 | ||||||||
|
| |||||||||
Total India | 2,040,937 | |||||||||
|
| |||||||||
See Notes to Consolidated Financial Statements.
75
Blackstone Alternative Multi-Strategy Fund and Subsidiaries
Consolidated Schedule of Investments (Continued)
March 31, 2016
Security Description | Shares | Value | ||||||||
Ireland — 0.3% | ||||||||||
Biotechnology & Pharmaceuticals — 0.1% | ||||||||||
Shire PLC ADR (d) | 26,888 | $ | 4,622,047 | |||||||
|
| |||||||||
Insurance — 0.1% | ||||||||||
XL Group PLC | 39,613 | 1,457,758 | ||||||||
|
| |||||||||
Medical Equipment & Devices — 0.0% | ||||||||||
Trinity Biotech PLC ADR | 5,400 | 62,964 | ||||||||
|
| |||||||||
Passenger Transportation — 0.0% | ||||||||||
Ryanair Holdings PLC ADR | 12,975 | 1,113,515 | ||||||||
|
| |||||||||
Specialty Finance — 0.1% | ||||||||||
AerCap Holdings NV (a) | 119,117 | 4,616,975 | ||||||||
Fly Leasing Ltd. ADR | 9,300 | 118,203 | ||||||||
|
| |||||||||
| 4,735,178 | ||||||||||
|
| |||||||||
Total Ireland | 11,991,462 | |||||||||
|
| |||||||||
Israel — 0.6% | ||||||||||
Biotechnology & Pharmaceuticals — 0.5% | ||||||||||
Teva Pharmaceutical Industries Ltd. ADR (b) | 418,408 | 22,389,012 | ||||||||
|
| |||||||||
Electrical Equipment — 0.0% | ||||||||||
Magal Security Systems Ltd. (a) | 100 | 497 | ||||||||
Orbotech Ltd. (a) | 16,500 | 392,370 | ||||||||
|
| |||||||||
| 392,867 | ||||||||||
|
| |||||||||
Hardware — 0.0% | ||||||||||
AudioCodes Ltd. (a) | 100 | 465 | ||||||||
Ceragon Networks Ltd. (a) | 300 | 381 | ||||||||
Radware Ltd. (a) | 2,600 | 30,758 | ||||||||
Silicom Ltd. | 200 | 6,828 | ||||||||
|
| |||||||||
| 38,432 | ||||||||||
|
| |||||||||
Media — 0.0% | ||||||||||
Wix.com Ltd. (a) | 500 | 10,135 | ||||||||
|
| |||||||||
Medical Equipment & Devices — 0.0% | ||||||||||
Syneron Medical Ltd. (a) | 7,100 | 51,901 | ||||||||
|
| |||||||||
Semiconductors — 0.0% | ||||||||||
Mellanox Technologies Ltd. (a) | 300 | 16,299 | ||||||||
Nova Measuring Instruments Ltd. (a) | 1,800 | 18,738 | ||||||||
Tower Semiconductor Ltd. (a) | 600 | 7,272 | ||||||||
|
| |||||||||
| 42,309 | ||||||||||
|
| |||||||||
See Notes to Consolidated Financial Statements.
76
Blackstone Alternative Multi-Strategy Fund and Subsidiaries
Consolidated Schedule of Investments (Continued)
March 31, 2016
Security Description | Shares | Value | ||||||||
Software — 0.1% | ||||||||||
Attunity Ltd. (a) | 500 | $ | 3,580 | |||||||
Check Point Software Technologies Ltd. (a),(b),(d) | 22,005 | 1,924,777 | ||||||||
Mind CTI Ltd. | 200 | 404 | ||||||||
Sapiens International Corp. NV | 1,400 | 16,772 | ||||||||
|
| |||||||||
| 1,945,533 | ||||||||||
|
| |||||||||
Technology Services — 0.0% | ||||||||||
Magic Software Enterprises Ltd. | 600 | 4,062 | ||||||||
|
| |||||||||
Telecommunications — 0.0% | ||||||||||
Allot Communications Ltd. (a) | 1,200 | 6,276 | ||||||||
|
| |||||||||
Total Israel | 24,880,527 | |||||||||
|
| |||||||||
Italy — 0.4% | ||||||||||
Asset Management — 0.1% | ||||||||||
Anima Holding SpA | 276,393 | 2,022,283 | ||||||||
|
| |||||||||
Banking — 0.1% | ||||||||||
Banca Generali SpA | 50,753 | 1,492,885 | ||||||||
Banca Popolare dell’Emilia Romagna (a) | 229,802 | 1,094,081 | ||||||||
|
| |||||||||
| 2,586,966 | ||||||||||
|
| |||||||||
Technology Services — 0.0% | ||||||||||
Cerved Information Solutions SpA | 220,632 | 1,815,143 | ||||||||
|
| |||||||||
Telecommunications — 0.2% | ||||||||||
Telecom Italia SpA (b) | 8,771,697 | 9,462,284 | ||||||||
|
| |||||||||
Total Italy | 15,886,676 | |||||||||
|
| |||||||||
Japan — 1.4% | ||||||||||
Automotive — 0.2% | ||||||||||
Aisin Seiki Co. Ltd. (d) | 35,200 | 1,326,118 | ||||||||
Mazda Motor Corp. | 512,300 | 7,949,993 | ||||||||
|
| |||||||||
| 9,276,111 | ||||||||||
|
| |||||||||
Chemicals — 0.0% | ||||||||||
Nitto Denko Corp. (d) | 17,500 | 972,922 | ||||||||
|
| |||||||||
Consumer Products — 0.1% | ||||||||||
Ajinomoto Co., Inc. | 199,000 | 4,490,297 | ||||||||
|
| |||||||||
Electrical Equipment — 0.2% | ||||||||||
Daikin Industries Ltd. (d) | 70,400 | 5,261,938 | ||||||||
Keyence Corp. (d) | 3,800 | 2,072,789 | ||||||||
SMC Corp. | 5,300 | 1,230,992 | ||||||||
|
| |||||||||
| 8,565,719 | ||||||||||
|
| |||||||||
See Notes to Consolidated Financial Statements.
77
Blackstone Alternative Multi-Strategy Fund and Subsidiaries
Consolidated Schedule of Investments (Continued)
March 31, 2016
Security Description | Shares | Value | ||||||||
Hardware — 0.2% | ||||||||||
Panasonic Corp. | 294,800 | $ | 2,707,146 | |||||||
Sony Corp. | 176,900 | 4,547,263 | ||||||||
|
| |||||||||
| 7,254,409 | ||||||||||
|
| |||||||||
Passenger Transportation — 0.2% | ||||||||||
ANA Holdings, Inc. | 2,529,000 | 7,125,558 | ||||||||
|
| |||||||||
Real Estate — 0.5% | ||||||||||
Mitsubishi Estate Co. Ltd. | 526,000 | 9,770,341 | ||||||||
Mitsui Fudosan Co. Ltd. | 410,000 | 10,229,508 | ||||||||
|
| |||||||||
| 19,999,849 | ||||||||||
|
| |||||||||
Specialty Finance — 0.0% | ||||||||||
Orix Corp. ADR | 100 | 7,139 | ||||||||
|
| |||||||||
Telecommunications — 0.0% | ||||||||||
SoftBank Group Corp. (b) | 23,800 | 1,134,753 | ||||||||
|
| |||||||||
Total Japan | 58,826,757 | |||||||||
|
| |||||||||
Luxembourg — 0.0% | ||||||||||
Consumer Products — 0.0% | ||||||||||
Adecoagro SA (a) | 12,600 | 145,530 | ||||||||
|
| |||||||||
Iron & Steel — 0.0% | ||||||||||
Ternium SA ADR | 15,100 | 271,498 | ||||||||
|
| |||||||||
Total Luxembourg | 417,028 | |||||||||
|
| |||||||||
Netherlands — 0.5% | ||||||||||
Banking — 0.0% | ||||||||||
ING Groep NV CVA | 81,711 | 988,366 | ||||||||
|
| |||||||||
Media — 0.1% | ||||||||||
Altice NV (a) | 261,550 | 4,663,434 | ||||||||
|
| |||||||||
Metals & Mining — 0.0% | ||||||||||
Constellium NV Class A (a),(b) | 9,472 | 49,160 | ||||||||
|
| |||||||||
Oil, Gas & Coal — 0.0% | ||||||||||
Royal Dutch Shell PLC ADR | 27,449 | 1,329,904 | ||||||||
|
| |||||||||
Semiconductors — 0.1% | ||||||||||
NXP Semiconductor NV (a),(b),(d) | 17,722 | 1,436,723 | ||||||||
|
| |||||||||
Software — 0.0% | ||||||||||
InterXion Holding NV (a) | 22,600 | 781,508 | ||||||||
|
| |||||||||
See Notes to Consolidated Financial Statements.
78
Blackstone Alternative Multi-Strategy Fund and Subsidiaries
Consolidated Schedule of Investments (Continued)
March 31, 2016
Security Description | Shares | Value | ||||||||
Telecommunications — 0.3% | ||||||||||
Koninklijke KPN NV | 2,761,280 | $ | 11,572,207 | |||||||
|
| |||||||||
Total Netherlands | 20,821,302 | |||||||||
|
| |||||||||
Norway — 0.0% | ||||||||||
Transportation & Logistics — 0.0% | ||||||||||
Ship Finance International Ltd. | 400 | 5,556 | ||||||||
|
| |||||||||
Total Norway | 5,556 | |||||||||
|
| |||||||||
Peru — 0.0% | ||||||||||
Banking — 0.0% | ||||||||||
Credicorp Ltd. | 1,800 | 235,818 | ||||||||
|
| |||||||||
Total Peru | 235,818 | |||||||||
|
| |||||||||
Puerto Rico — 0.0% | ||||||||||
Banking — 0.0% | ||||||||||
First BanCorp (a) | 21,600 | 63,072 | ||||||||
Popular, Inc. | 17,190 | 491,806 | ||||||||
|
| |||||||||
| 554,878 | ||||||||||
|
| |||||||||
Health Care Facilities & Services — 0.0% | ||||||||||
Triple-S Management Corp. B Shares (a) | 4,100 | 101,926 | ||||||||
|
| |||||||||
Technology Services — 0.0% | ||||||||||
Evertec, Inc. | 18,900 | 264,222 | ||||||||
|
| |||||||||
Total Puerto Rico | 921,026 | |||||||||
|
| |||||||||
Republic of Korea — 0.0% | ||||||||||
Hardware — 0.0% | ||||||||||
LG Display Co. Ltd. ADR | 14,700 | 168,021 | ||||||||
|
| |||||||||
Iron & Steel — 0.0% | ||||||||||
POSCO ADR | 4,100 | 194,053 | ||||||||
|
| |||||||||
Telecommunications — 0.0% | ||||||||||
KT Corp. ADR | 5,900 | 79,178 | ||||||||
SK Telecom Co. Ltd. ADR | 18,200 | 367,094 | ||||||||
|
| |||||||||
| 446,272 | ||||||||||
|
| |||||||||
Total Republic of Korea | 808,346 | |||||||||
|
| |||||||||
Russian Federation — 0.0% | ||||||||||
Media — 0.0% | ||||||||||
Yandex NV A Shares (a) | 11,900 | 182,308 | ||||||||
|
| |||||||||
Total Russian Federation | 182,308 | |||||||||
|
| |||||||||
See Notes to Consolidated Financial Statements.
79
Blackstone Alternative Multi-Strategy Fund and Subsidiaries
Consolidated Schedule of Investments (Continued)
March 31, 2016
Security Description | Shares | Value | ||||||||
Singapore — 0.5% | ||||||||||
Machinery — 0.0% | ||||||||||
China Yuchai International Ltd. | 2,502 | $ | 24,645 | |||||||
|
| |||||||||
Semiconductors — 0.5% | ||||||||||
Broadcom Ltd. (b),(d) | 140,320 | 21,679,440 | ||||||||
Kulicke & Soffa Industries, Inc. (a) | 25,900 | 293,188 | ||||||||
|
| |||||||||
| 21,972,628 | ||||||||||
|
| |||||||||
Total Singapore | 21,997,273 | |||||||||
|
| |||||||||
South Africa — 0.0% | ||||||||||
Metals & Mining — 0.0% | ||||||||||
AngloGold Ashanti Ltd. ADR (a) | 84,400 | 1,155,436 | ||||||||
Gold Fields Ltd. ADR | 126,600 | 498,804 | ||||||||
Harmony Gold Mining Co. Ltd. ADR | 20,100 | 73,164 | ||||||||
|
| |||||||||
| 1,727,404 | ||||||||||
|
| |||||||||
Specialty Finance — 0.0% | ||||||||||
Net 1 UEPS Technologies, Inc. (a) | 26,800 | 246,560 | ||||||||
|
| |||||||||
Total South Africa | 1,973,964 | |||||||||
|
| |||||||||
Spain — 0.0% | ||||||||||
Banking — 0.0% | ||||||||||
Banco Bilbao Vizcaya Argentaria SA ADR | 16,500 | 107,580 | ||||||||
|
| |||||||||
Biotechnology & Pharmaceuticals — 0.0% | ||||||||||
Grifols SA ADR | 17,300 | 267,631 | ||||||||
|
| |||||||||
Total Spain | 375,211 | |||||||||
|
| |||||||||
Switzerland — 0.3% | ||||||||||
Apparel & Textile Products — 0.0% | ||||||||||
Cie Financiere Richemont SA (b) | 2,753 | 181,949 | ||||||||
Swatch Group AG (The) (b) | 163 | 56,467 | ||||||||
|
| |||||||||
| 238,416 | ||||||||||
|
| |||||||||
Asset Management — 0.1% | ||||||||||
Julius Baer Group Ltd. (b) | 27,567 | 1,184,044 | ||||||||
Leonteq AG | 9,460 | 896,267 | ||||||||
UBS Group AG (b) | 19,270 | 310,429 | ||||||||
|
| |||||||||
| 2,390,740 | ||||||||||
|
| |||||||||
Biotechnology & Pharmaceuticals — 0.1% | ||||||||||
Actelion Ltd. (b) | 542 | 81,000 | ||||||||
Novartis AG (b) | 12,137 | 879,776 | ||||||||
Roche Holding AG (b) | 3,707 | 912,534 | ||||||||
|
| |||||||||
| 1,873,310 | ||||||||||
|
| |||||||||
See Notes to Consolidated Financial Statements.
80
Blackstone Alternative Multi-Strategy Fund and Subsidiaries
Consolidated Schedule of Investments (Continued)
March 31, 2016
Security Description | Shares | Value | ||||||||
Chemicals — 0.0% | ||||||||||
Givaudan SA (b) | 52 | $ | 101,994 | |||||||
Syngenta AG (b) | 487 | 202,589 | ||||||||
|
| |||||||||
| 304,583 | ||||||||||
|
| |||||||||
Commercial Services — 0.0% | ||||||||||
Adecco SA (b) | 897 | 58,444 | ||||||||
SGS SA (b) | 29 | 61,285 | ||||||||
|
| |||||||||
| 119,729 | ||||||||||
|
| |||||||||
Construction Materials — 0.0% | ||||||||||
LafargeHolcim Ltd. (b) | 1,269 | 59,692 | ||||||||
|
| |||||||||
Consumer Products — 0.0% | ||||||||||
Nestle SA (b) | 17,016 | 1,271,488 | ||||||||
|
| |||||||||
Electrical Equipment — 0.1% | ||||||||||
ABB Ltd. (a),(b) | 11,606 | 226,194 | ||||||||
TE Connectivity Ltd. | 87,100 | 5,393,232 | ||||||||
|
| |||||||||
| 5,619,426 | ||||||||||
|
| |||||||||
Home & Office Products — 0.0% | ||||||||||
Geberit AG (b) | 201 | 75,107 | ||||||||
|
| |||||||||
Institutional Financial Services — 0.0% | ||||||||||
Credit Suisse Group AG (b) | 8,058 | 114,055 | ||||||||
|
| |||||||||
Insurance — 0.0% | ||||||||||
Swiss Re AG (b) | 1,860 | 171,966 | ||||||||
Zurich Insurance Group AG (b) | 791 | 183,693 | ||||||||
|
| |||||||||
| 355,659 | ||||||||||
|
| |||||||||
Semiconductors — 0.0% | ||||||||||
STMicroelectronics NV | 900 | 5,022 | ||||||||
|
| |||||||||
Telecommunications — 0.0% | ||||||||||
Swisscom AG (b) | 123 | 66,837 | ||||||||
|
| |||||||||
Total Switzerland | 12,494,064 | |||||||||
|
| |||||||||
Taiwan — 0.0% | ||||||||||
Hardware — 0.0% | ||||||||||
AU Optronics Corp. ADR | 18,400 | 54,280 | ||||||||
|
| |||||||||
Semiconductors — 0.0% | ||||||||||
Advanced Semiconductor Engineering, Inc. ADR | 1,400 | 8,190 | ||||||||
ChipMOS Technologies Bermuda Ltd. | 1,500 | 26,070 | ||||||||
Himax Technologies, Inc. ADR | 12,300 | 138,252 | ||||||||
Siliconware Precision Industries Co. Ltd. ADR | 20 | 159 | ||||||||
See Notes to Consolidated Financial Statements.
81
Blackstone Alternative Multi-Strategy Fund and Subsidiaries
Consolidated Schedule of Investments (Continued)
March 31, 2016
Security Description | Shares | Value | ||||||||
United Microelectronics Corp. ADR | 26,500 | $ | 55,120 | |||||||
|
| |||||||||
| 227,791 | ||||||||||
|
| |||||||||
Total Taiwan | 282,071 | |||||||||
|
| |||||||||
Thailand — 0.0% | ||||||||||
Design, Manufacturing & Distribution — 0.0% | ||||||||||
Fabrinet (a) | 20,800 | 672,880 | ||||||||
|
| |||||||||
Total Thailand | 672,880 | |||||||||
|
| |||||||||
United Kingdom — 1.0% | ||||||||||
Asset Management — 0.0% | ||||||||||
Jupiter Fund Management PLC | 161,277 | 948,078 | ||||||||
|
| |||||||||
Banking — 0.3% | ||||||||||
HSBC Holdings PLC | 1,193,600 | 7,447,162 | ||||||||
Metro Bank PLC (a) | 95,708 | 2,584,258 | ||||||||
|
| |||||||||
| 10,031,420 | ||||||||||
|
| |||||||||
Consumer Products — 0.0% | ||||||||||
SABMiller PLC (a),(b) | 16,409 | 1,003,029 | ||||||||
Unilever NV | 24 | 1,072 | ||||||||
|
| |||||||||
| 1,004,101 | ||||||||||
|
| |||||||||
Gaming, Lodging & Restaurants — 0.0% | ||||||||||
Belmond Ltd. Class A (a) | 34,100 | 323,609 | ||||||||
InterContinental Hotels Group PLC ADR | 800 | 33,016 | ||||||||
|
| |||||||||
| 356,625 | ||||||||||
|
| |||||||||
Insurance — 0.0% | ||||||||||
Aviva PLC ADR | 222,986 | 1,460,722 | ||||||||
Prudential PLC ADR | 37 | 1,376 | ||||||||
|
| |||||||||
| 1,462,098 | ||||||||||
|
| |||||||||
Media — 0.6% | ||||||||||
Liberty Global PLC (a),(d) | 676,664 | 25,415,500 | ||||||||
Pearson PLC ADR | 7,800 | 97,812 | ||||||||
|
| |||||||||
| 25,513,312 | ||||||||||
|
| |||||||||
Medical Equipment & Devices — 0.0% | ||||||||||
Smith & Nephew PLC ADR | 3,400 | 113,288 | ||||||||
|
| |||||||||
Oil, Gas & Coal — 0.0% | ||||||||||
Seadrill Ltd. (a) | 56,800 | 187,440 | ||||||||
|
| |||||||||
Real Estate — 0.1% | ||||||||||
Kennedy Wilson Europe Real Estate PLC | 176,226 | 2,963,853 | ||||||||
|
| |||||||||
See Notes to Consolidated Financial Statements.
82
Blackstone Alternative Multi-Strategy Fund and Subsidiaries
Consolidated Schedule of Investments (Continued)
March 31, 2016
Security Description | Shares | Value | ||||||||
Recreation Facilities & Services — 0.0% | ||||||||||
Manchester United PLC Class A | 1,100 | $ | 15,884 | |||||||
|
| |||||||||
Total United Kingdom | 42,596,099 | |||||||||
|
| |||||||||
United States — 30.1% | ||||||||||
Aerospace & Defense — 0.2% | ||||||||||
AAR Corp. | 1,500 | 34,905 | ||||||||
Aerojet Rocketdyne Holdings (a) | 1,300 | 21,294 | ||||||||
B/E Aerospace, Inc. (c) | 52,300 | 2,412,076 | ||||||||
Ducommun, Inc. (a) | 600 | 9,150 | ||||||||
General Dynamics Corp. (c) | 21,300 | 2,798,181 | ||||||||
HEICO Corp. | 2,100 | 126,273 | ||||||||
Huntington Ingalls Industries, Inc. (c) | 9,600 | 1,314,624 | ||||||||
KLX, Inc. (a) | 2,300 | 73,922 | ||||||||
L-3 Communications Holdings, Inc. | 3,700 | 438,450 | ||||||||
LMI Aerospace, Inc. (a) | 200 | 1,702 | ||||||||
Moog, Inc. Class A (a) | 600 | 27,408 | ||||||||
Orbital ATK, Inc. (c) | 8 | 696 | ||||||||
Smith & Wesson Holding Corp. (a) | 1,100 | 29,282 | ||||||||
Spirit AeroSystems Holdings, Inc. Class A (a),(c) | 15,600 | 707,616 | ||||||||
Triumph Group, Inc. | 1,300 | 40,924 | ||||||||
|
| |||||||||
| 8,036,503 | ||||||||||
|
| |||||||||
Apparel & Textile Products — 0.2% | ||||||||||
Albany International Corp. Class A | 1,400 | 52,626 | ||||||||
Carter’s, Inc. | 2,600 | 273,988 | ||||||||
Culp, Inc. | 3,200 | 83,904 | ||||||||
Fossil Group, Inc. (a) | 13,300 | 590,786 | ||||||||
Hanesbrands, Inc. | 600 | 17,004 | ||||||||
Kate Spade & Co. (a) | 11,000 | 280,720 | ||||||||
NIKE, Inc. Class B (c) | 68,800 | 4,229,136 | ||||||||
Perry Ellis International, Inc. (a),(c) | 5,600 | 103,096 | ||||||||
PVH Corp. | 13,900 | 1,376,934 | ||||||||
Ralph Lauren Corp. | 700 | 67,382 | ||||||||
Rocky Brands, Inc. | 300 | 3,822 | ||||||||
Skechers U.S.A., Inc. Class A (a),(b),(d) | 96,990 | 2,953,345 | ||||||||
Vince Holding Corp. (a),(c) | 15,300 | 96,849 | ||||||||
|
| |||||||||
| 10,129,592 | ||||||||||
|
| |||||||||
Asset Management — 0.3% | ||||||||||
Affiliated Managers Group, Inc. (a) | 1,500 | 243,600 | ||||||||
Apollo Investment Corp. | 15,400 | 85,470 | ||||||||
Ares Capital Corp. | 123,700 | 1,835,708 | ||||||||
BlackRock Kelso Capital Corp. (c) | 29,100 | 273,831 | ||||||||
Calamos Asset Management, Inc. Class A | 3,500 | 29,715 | ||||||||
Capital Southwest Corp. | 200 | 2,774 | ||||||||
See Notes to Consolidated Financial Statements.
83
Blackstone Alternative Multi-Strategy Fund and Subsidiaries
Consolidated Schedule of Investments (Continued)
March 31, 2016
Security Description | Shares | Value | ||||||||
Capitala Finance Corp. | 8,900 | $ | 106,800 | |||||||
Charles Schwab Corp. (b),(c),(d) | 108,859 | 3,050,229 | ||||||||
E*TRADE Financial Corp. (a) | 11,000 | 269,390 | ||||||||
Fidus Investment Corp. | 4,100 | 63,591 | ||||||||
Fifth Street Finance Corp. | 20,800 | 104,416 | ||||||||
Fifth Street Senior Floating Rate Corp. | 200 | 1,586 | ||||||||
Financial Engines, Inc. | 300 | 9,429 | ||||||||
Firsthand Technology Value Fund, Inc. (a) | 900 | 6,750 | ||||||||
FS Investment Corp. | 10,700 | 98,119 | ||||||||
Garrison Capital, Inc. (c) | 4,200 | 45,066 | ||||||||
Gladstone Capital Corp. (c) | 9,600 | 71,520 | ||||||||
Gladstone Investment Corp. | 15,200 | 106,704 | ||||||||
Golub Capital BDC, Inc. | 600 | 10,386 | ||||||||
GSV Capital Corp. | 200 | 1,120 | ||||||||
Hercules Technology Growth Capital, Inc. | 5,800 | 69,658 | ||||||||
Horizon Technology Finance Corp. | 5,700 | 66,177 | ||||||||
Invesco Ltd. | 97,780 | 3,008,691 | ||||||||
KCAP Financial, Inc. | 12,000 | 43,200 | ||||||||
Legg Mason, Inc. (c) | 97,724 | 3,389,068 | ||||||||
Manning & Napier, Inc. | 1,000 | 8,070 | ||||||||
Medallion Financial Corp. (c) | 8,900 | 82,147 | ||||||||
Monroe Capital Corp. | 700 | 9,695 | ||||||||
MVC Capital, Inc. | 2,500 | 18,650 | ||||||||
NorthStar Asset Management Group, Inc. | 300 | 3,405 | ||||||||
OHA Investment Corp. (c) | 2,700 | 9,153 | ||||||||
Oppenheimer Holdings, Inc. Class A | 600 | 9,468 | ||||||||
PennantPark Floating Rate Capital Ltd. | 8,762 | 102,515 | ||||||||
PennantPark Investment Corp. (c) | 29,800 | 180,588 | ||||||||
Prospect Capital Corp. | 21,200 | 154,124 | ||||||||
Solar Capital Ltd. | 14,900 | 257,472 | ||||||||
Solar Senior Capital Ltd. | 2,200 | 32,076 | ||||||||
Stellus Capital Investment Corp. | 4,600 | 47,012 | ||||||||
TCP Capital Corp. | 4,000 | 59,640 | ||||||||
THL Credit, Inc. | 10,100 | 109,383 | ||||||||
TICC Capital Corp. (c) | 27,300 | 131,040 | ||||||||
TPG Specialty Lending, Inc. | 10,000 | 161,300 | ||||||||
Triangle Capital Corp. | 1,800 | 37,044 | ||||||||
TriplePoint Venture Growth BDC Corp. | 6,100 | 64,050 | ||||||||
WhiteHorse Finance, Inc. (c) | 3,500 | 36,330 | ||||||||
|
| |||||||||
| 14,506,160 | ||||||||||
|
| |||||||||
Automotive — 0.1% | ||||||||||
American Axle & Manufacturing Holdings, Inc. (a) | 2,500 | 38,475 | ||||||||
BorgWarner, Inc. | 400 | 15,360 | ||||||||
Cooper-Standard Holding, Inc. (a) | 13,300 | 955,472 | ||||||||
Goodyear Tire & Rubber Co. | 74,600 | 2,460,308 | ||||||||
Horizon Global Corp. (a) | 1,300 | 16,354 | ||||||||
See Notes to Consolidated Financial Statements.
84
Blackstone Alternative Multi-Strategy Fund and Subsidiaries
Consolidated Schedule of Investments (Continued)
March 31, 2016
Security Description | Shares | Value | ||||||||
Lear Corp. | 2,300 | $ | 255,691 | |||||||
Modine Manufacturing Co. (a) | 3,400 | 37,434 | ||||||||
Standard Motor Products, Inc. | 100 | 3,465 | ||||||||
Superior Industries International, Inc. | 900 | 19,872 | ||||||||
Tenneco, Inc. (a),(c) | 12,800 | 659,328 | ||||||||
Tower International, Inc. (c) | 5,800 | 157,760 | ||||||||
Visteon Corp. (c) | 10,300 | 819,777 | ||||||||
|
| |||||||||
| 5,439,296 | ||||||||||
|
| |||||||||
Banking — 0.7% | ||||||||||
Anchor BanCorp Wisconsin, Inc. (a) | 100 | 4,506 | ||||||||
Arrow Financial Corp. (c) | 816 | 21,681 | ||||||||
Associated Banc-Corp | 700 | 12,558 | ||||||||
Astoria Financial Corp. | 1,100 | 17,424 | ||||||||
Bancorp, Inc. (a) | 1,000 | 5,720 | ||||||||
Bank Mutual Corp. | 3,300 | 24,981 | ||||||||
Bank of the Ozarks, Inc. (c) | 40,880 | 1,715,734 | ||||||||
BankUnited, Inc. (c) | 64,329 | 2,215,491 | ||||||||
BBCN Bancorp, Inc. | 2,800 | 42,532 | ||||||||
Beneficial Bancorp, Inc. (a) | 5,982 | 81,894 | ||||||||
BofI Holding, Inc. (a) | 500 | 10,670 | ||||||||
Boston Private Financial Holdings, Inc. | 800 | 9,160 | ||||||||
Bridge Bancorp, Inc. | 400 | 12,188 | ||||||||
Bryn Mawr Bank Corp. | 200 | 5,146 | ||||||||
Centerstate Banks, Inc. | 2,229 | 33,190 | ||||||||
Central Pacific Financial Corp. | 9,100 | 198,107 | ||||||||
Charter Financial Corp. | 500 | 6,750 | ||||||||
Chemical Financial Corp. (c) | 2,400 | 85,656 | ||||||||
Citigroup, Inc. (c) | 75,301 | 3,143,817 | ||||||||
Citizens Financial Group, Inc. | 99,889 | 2,092,675 | ||||||||
City Holding Co. | 300 | 14,334 | ||||||||
Clifton Bancorp, Inc. | 500 | 7,560 | ||||||||
CoBiz Financial, Inc. | 800 | 9,456 | ||||||||
Comerica, Inc. | 100 | 3,787 | ||||||||
CU Bancorp (a) | 300 | 6,351 | ||||||||
Dime Community Bancshares, Inc. | 2,400 | 42,288 | ||||||||
East West Bancorp, Inc. | 21,900 | 711,312 | ||||||||
Enterprise Financial Services Corp. | 500 | 13,520 | ||||||||
Farmers Capital Bank Corp. | 100 | 2,642 | ||||||||
FCB Financial Holdings, Inc. Class A (a) | 33,604 | 1,117,669 | ||||||||
Fidelity Southern Corp. | 4,100 | 65,764 | ||||||||
Fifth Third Bancorp | 27,100 | 452,299 | ||||||||
Financial Institutions, Inc. | 200 | 5,814 | ||||||||
First Bancorp/Southern Pines | 1,000 | 18,850 | ||||||||
First Busey Corp. | 466 | 9,544 | ||||||||
First Business Financial Services, Inc. | 600 | 13,758 | ||||||||
See Notes to Consolidated Financial Statements.
85
Blackstone Alternative Multi-Strategy Fund and Subsidiaries
Consolidated Schedule of Investments (Continued)
March 31, 2016
Security Description | Shares | Value | ||||||||
First Citizens BancShares, Inc. Class A (c) | 6,553 | $ | 1,645,262 | |||||||
First Community Bancshares, Inc. | 1,200 | 23,808 | ||||||||
First Defiance Financial Corp. | 1,200 | 46,092 | ||||||||
First Financial Bancorp | 1,000 | 18,180 | ||||||||
First Financial Corp. | 400 | 13,684 | ||||||||
First Financial Northwest, Inc. | 1,700 | 22,389 | ||||||||
First Interstate BancSystem, Inc. Class A | 2,800 | 78,764 | ||||||||
First Niagara Financial Group, Inc. (c) | 191,736 | 1,856,004 | ||||||||
First Republic Bank | 45,377 | 3,023,923 | ||||||||
FirstMerit Corp. | 300 | 6,315 | ||||||||
Flushing Financial Corp. | 200 | 4,324 | ||||||||
FNB Corp. | 37 | 481 | ||||||||
Franklin Financial Network, Inc. (a) | 900 | 24,300 | ||||||||
Great Western Bancorp, Inc. | 24,200 | 659,934 | ||||||||
Guaranty Bancorp | 800 | 12,368 | ||||||||
Hanmi Financial Corp. | 200 | 4,404 | ||||||||
Heartland Financial USA, Inc. | 300 | 9,237 | ||||||||
Heritage Financial Corp. | 400 | 7,028 | ||||||||
Huntington Bancshares, Inc. | 11,500 | 109,710 | ||||||||
Independent Bank Corp. | 5,600 | 81,480 | ||||||||
Independent Bank Group, Inc. | 400 | 10,960 | ||||||||
Investors Bancorp, Inc. | 23,800 | 277,032 | ||||||||
KeyCorp | 132,700 | 1,465,008 | ||||||||
Lakeland Bancorp, Inc. | 2,400 | 24,360 | ||||||||
Mercantile Bank Corp. | 1,800 | 40,356 | ||||||||
National Bankshares, Inc. | 200 | 6,864 | ||||||||
Northrim BanCorp, Inc. | 1,000 | 23,910 | ||||||||
OceanFirst Financial Corp. | 900 | 15,912 | ||||||||
Opus Bank | 4,600 | 156,400 | ||||||||
Oritani Financial Corp. | 300 | 5,091 | ||||||||
Pacific Premier Bancorp, Inc. (a) | 5,500 | 117,535 | ||||||||
Park Sterling Corp. | 800 | 5,336 | ||||||||
Peapack Gladstone Financial Corp. | 500 | 8,450 | ||||||||
Peoples Bancorp, Inc. | 500 | 9,770 | ||||||||
PNC Financial Services Group, Inc. (c) | 53,092 | 4,489,990 | ||||||||
Preferred Bank | 800 | 24,200 | ||||||||
Regions Financial Corp. (c) | 122,200 | 959,270 | ||||||||
Southwest Bancorp, Inc. | 2,000 | 30,100 | ||||||||
Stonegate Bank | 1,100 | 32,956 | ||||||||
Sun Bancorp, Inc. (a) | 20 | 414 | ||||||||
SunTrust Banks, Inc. | 31,000 | 1,118,480 | ||||||||
SVB Financial Group (a) | 1,200 | 122,460 | ||||||||
Synovus Financial Corp. | 9,300 | 268,863 | ||||||||
Talmer Bancorp, Inc. Class A | 9,000 | 162,810 | ||||||||
TCF Financial Corp. | 7,700 | 94,402 | ||||||||
Trico Bancshares | 1,600 | 40,512 | ||||||||
TriState Capital Holdings, Inc. (a),(c) | 2,900 | 36,540 | ||||||||
See Notes to Consolidated Financial Statements.
86
Blackstone Alternative Multi-Strategy Fund and Subsidiaries
Consolidated Schedule of Investments (Continued)
March 31, 2016
Security Description | Shares | Value | ||||||||
Triumph Bancorp, Inc. (a) | 2,200 | $ | 34,826 | |||||||
TrustCo Bank Corp. | 200 | 1,212 | ||||||||
Umpqua Holdings Corp. | 2,900 | 45,994 | ||||||||
Union Bankshares Corp. | 100 | 2,463 | ||||||||
United Financial Bancorp, Inc. | 100 | 1,259 | ||||||||
Univest Corp. of Pennsylvania | 2,000 | 39,020 | ||||||||
Wells Fargo & Co. | 32,312 | 1,562,608 | ||||||||
Western Alliance Bancorp (a) | 2,181 | 72,802 | ||||||||
Wilshire Bancorp, Inc. | 7,200 | 74,160 | ||||||||
WSFS Financial Corp. | 400 | 13,008 | ||||||||
Yadkin Financial Corp. | 1,050 | 24,853 | ||||||||
|
| |||||||||
| 31,302,701 | ||||||||||
|
| |||||||||
Biotechnology & Pharmaceuticals — 5.9% | ||||||||||
AbbVie, Inc. (c) | 207,700 | 11,863,824 | ||||||||
Acorda Therapeutics, Inc. (a) | 14,400 | 380,880 | ||||||||
Albany Molecular Research, Inc. (a) | 500 | 7,645 | ||||||||
Alexion Pharmaceuticals, Inc. (a),(b),(c) | 88,100 | 12,265,282 | ||||||||
Alkermes PLC (a) | 15,400 | 526,526 | ||||||||
Allergan PLC (a),(b) | 134,050 | 35,929,421 | ||||||||
Alnylam Pharmaceuticals, Inc. (a) | 1,500 | 94,155 | ||||||||
Amgen, Inc. | 14,900 | 2,233,957 | ||||||||
Amphastar Pharmaceuticals, Inc. (a) | 6,000 | 72,000 | ||||||||
Anacor Pharmaceuticals, Inc. (a),(c),(d) | 185,891 | 9,935,874 | ||||||||
Anika Therapeutics, Inc. (a) | 3,300 | 147,576 | ||||||||
Applied Genetic Technologies Corp. (a) | 400 | 5,592 | ||||||||
ArQule, Inc. (a) | 2,100 | 3,360 | ||||||||
Array BioPharma, Inc. (a) | 15,400 | 45,430 | ||||||||
Avalanche Biotechnologies, Inc. (a) | 400 | 2,068 | ||||||||
Baxalta, Inc. (c) | 652,296 | 26,352,758 | ||||||||
Biogen Idec, Inc. (a),(c) | 6,900 | 1,796,208 | ||||||||
BioMarin Pharmaceutical, Inc. (a) | 1,400 | 115,472 | ||||||||
BioSpecifics Technologies Corp. (a) | 100 | 3,482 | ||||||||
Bristol-Myers Squibb Co. (b),(c),(d) | 227,090 | 14,506,509 | ||||||||
Cara Therapeutics, Inc. (a) | 200 | 1,244 | ||||||||
Celgene Corp. (a),(b),(d) | 105,000 | 10,509,450 | ||||||||
ChemoCentryx, Inc. (a) | 100 | 249 | ||||||||
Chimerix, Inc. (a) | 500 | 2,555 | ||||||||
Corcept Therapeutics, Inc. (a) | 15,200 | 71,136 | ||||||||
Cytokinetics, Inc. (a) | 3,900 | 27,495 | ||||||||
Depomed, Inc. (a),(b),(d) | 4,305 | 59,969 | ||||||||
Eiger BioPharmaceuticals, Inc. (a) | 620 | 10,397 | ||||||||
Eli Lilly & Co. | 10,300 | 741,703 | ||||||||
Emergent Biosolutions, Inc. (a) | 2,000 | 72,700 | ||||||||
Endo International PLC (a),(d) | 271,045 | 7,629,917 | ||||||||
Exelixis, Inc. (a) | 63,900 | 255,600 | ||||||||
Five Prime Therapeutics, Inc. (a) | 100 | 4,063 | ||||||||
See Notes to Consolidated Financial Statements.
87
Blackstone Alternative Multi-Strategy Fund and Subsidiaries
Consolidated Schedule of Investments (Continued)
March 31, 2016
Security Description | Shares | Value | ||||||||
Gilead Sciences, Inc. (b),(c) | 159,415 | $ | 14,643,862 | |||||||
Ignyta, Inc. (a) | 200 | 1,354 | ||||||||
Impax Laboratories, Inc. (a) | 12,400 | 397,048 | ||||||||
Incyte Corp. (a),(c) | 74,700 | 5,413,509 | ||||||||
Inotek Pharmaceuticals Corp. (a) | 600 | 4,440 | ||||||||
Insys Therapeutics, Inc. (a) | 1,300 | 20,787 | ||||||||
Ionis Pharmaceuticals, Inc. (a) | 11,200 | 453,600 | ||||||||
Ironwood Pharmaceuticals, Inc. (a) | 300 | 3,282 | ||||||||
Lannett Co., Inc. (a) | 4,000 | 71,720 | ||||||||
Mallinckrodt PLC (a),(b) | 589,256 | 36,109,608 | ||||||||
Medicines Co. (a) | 800 | 25,416 | ||||||||
Medivation, Inc. (a),(b),(c) | 465,255 | 21,392,425 | ||||||||
Merrimack Pharmaceuticals, Inc. (a) | 100 | 837 | ||||||||
Momenta Pharmaceuticals, Inc. (a) | 100 | 924 | ||||||||
Mylan NV (a) | 800 | 37,080 | ||||||||
Neothetics, Inc. (a) | 1,100 | 671 | ||||||||
Omega Protein Corp. (a) | 11,300 | 191,422 | ||||||||
Osiris Therapeutics, Inc. | 100 | 571 | ||||||||
PDL BioPharma, Inc. | 47,400 | 157,842 | ||||||||
Pfizer, Inc. (b),(c),(d) | 421,570 | 12,495,335 | ||||||||
Phibro Animal Health Corp. Class A (c) | 2,000 | 54,080 | ||||||||
Portola Pharmaceuticals, Inc. (a) | 600 | 12,240 | ||||||||
pSivida Corp. (a) | 100 | 268 | ||||||||
PTC Therapeutics, Inc. (a) | 46,500 | 299,460 | ||||||||
Regeneron Pharmaceuticals, Inc. (a) | 28,900 | 10,416,716 | ||||||||
Repligen Corp. (a) | 300 | 8,046 | ||||||||
Retrophin, Inc. (a) | 7,700 | 105,182 | ||||||||
Rigel Pharmaceuticals, Inc. (a),(c) | 7,400 | 15,392 | ||||||||
SciClone Pharmaceuticals, Inc. (a),(c) | 6,700 | 73,700 | ||||||||
Seattle Genetics, Inc. (a) | 300 | 10,527 | ||||||||
Sucampo Pharmaceuticals, Inc. Class A (a) | 2,400 | 26,232 | ||||||||
Tetraphase Pharmaceuticals, Inc. (a) | 500 | 2,315 | ||||||||
Threshold Pharmaceuticals, Inc. (a) | 11,400 | 5,244 | ||||||||
United Therapeutics Corp. (a) | 8,200 | 913,726 | ||||||||
USANA Health Sciences, Inc. (a) | 900 | 109,278 | ||||||||
Verastem, Inc. (a) | 2,300 | 3,634 | ||||||||
Vertex Pharmaceuticals, Inc. (a),(c) | 37,000 | 2,941,130 | ||||||||
Vical, Inc. (a) | 5,000 | 1,955 | ||||||||
XOMA Corp. (a),(c) | 61,200 | 47,308 | ||||||||
Zoetis, Inc. (b),(d) | 279,360 | 12,384,029 | ||||||||
|
| |||||||||
| 254,526,692 | ||||||||||
|
| |||||||||
Chemicals — 1.3% | ||||||||||
Air Products & Chemicals, Inc. (c) | 42,900 | 6,179,745 | ||||||||
Axalta Coating Systems Ltd. (a) | 4,300 | 125,560 | ||||||||
Axiall Corp. | 1,300 | 28,392 | ||||||||
Celanese Corp. | 5,700 | 373,350 | ||||||||
See Notes to Consolidated Financial Statements.
88
Blackstone Alternative Multi-Strategy Fund and Subsidiaries
Consolidated Schedule of Investments (Continued)
March 31, 2016
Security Description | Shares | Value | ||||||||
Chemours Co. (The) | 40,100 | $ | 280,700 | |||||||
Dow Chemical Co. | 241,300 | 12,272,518 | ||||||||
EI du Pont de Nemours & Co. (c) | 235,000 | 14,880,200 | ||||||||
FutureFuel Corp. | 1,100 | 12,969 | ||||||||
Huntsman Corp. | 200 | 2,660 | ||||||||
Innophos Holdings, Inc. | 4,700 | 145,277 | ||||||||
Intrepid Potash, Inc. (a),(c) | 17,500 | 19,425 | ||||||||
KMG Chemicals, Inc. | 3,000 | 69,210 | ||||||||
Landec Corp. (a) | 300 | 3,150 | ||||||||
LSB Industries, Inc. (a) | 4,200 | 53,550 | ||||||||
LyondellBasell Industries NV Class A | 70,500 | 6,033,390 | ||||||||
Monsanto Co. | 64,900 | 5,694,326 | ||||||||
OMNOVA Solutions, Inc. (a) | 1,500 | 8,340 | ||||||||
Orion Engineered Carbons SA | 5,100 | 72,012 | ||||||||
PPG Industries, Inc. (c) | 60,200 | 6,711,698 | ||||||||
RPM International, Inc. | 25,300 | 1,197,449 | ||||||||
Stepan Co. | 2,300 | 127,167 | ||||||||
Trinseo SA (a) | 10,300 | 379,143 | ||||||||
Univar, Inc. (a) | 300 | 5,154 | ||||||||
WR Grace & Co. (a) | 17,600 | 1,252,768 | ||||||||
|
| |||||||||
| 55,928,153 | ||||||||||
|
| |||||||||
Commercial Services — 0.3% | ||||||||||
AMN Healthcare Services, Inc. (a) | 6,600 | 221,826 | ||||||||
ARAMARK Holdings Corp. | 113,900 | 3,772,368 | ||||||||
ARC Document Solutions, Inc. (a) | 14,400 | 64,800 | ||||||||
Brady Corp. Class A | 2,900 | 77,836 | ||||||||
Brink’s Co. | 1,100 | 36,949 | ||||||||
Care.com, Inc. (a) | 100 | 615 | ||||||||
CBIZ, Inc. (a) | 3,800 | 38,342 | ||||||||
CDI Corp. | 4,700 | 29,516 | ||||||||
Collectors Universe, Inc. | 700 | 11,620 | ||||||||
Computer Task Group, Inc. (c) | 2,800 | 14,308 | ||||||||
CorVel Corp. (a) | 400 | 15,768 | ||||||||
CRA International, Inc. (a),(c) | 2,600 | 51,064 | ||||||||
Cross Country Healthcare, Inc. (a) | 4,600 | 53,498 | ||||||||
Ennis, Inc. | 800 | 15,640 | ||||||||
GP Strategies Corp. (a) | 100 | 2,740 | ||||||||
Hackett Group, Inc. | 1,900 | 28,728 | ||||||||
Heidrick & Struggles International, Inc. | 200 | 4,740 | ||||||||
HMS Holdings Corp. (a) | 1,400 | 20,090 | ||||||||
Information Services Group, Inc. (a) | 1,500 | 5,895 | ||||||||
Insperity, Inc. (c) | 7,700 | 398,321 | ||||||||
KAR Auction Services, Inc. | 44,700 | 1,704,858 | ||||||||
Kforce, Inc. | 700 | 13,706 | ||||||||
Navigant Consulting, Inc. (a) | 6,500 | 102,765 | ||||||||
Patriot National, Inc. (a) | 2,600 | 20,020 | ||||||||
See Notes to Consolidated Financial Statements.
89
Blackstone Alternative Multi-Strategy Fund and Subsidiaries
Consolidated Schedule of Investments (Continued)
March 31, 2016
Security Description | Shares | Value | ||||||||
PRGX Global, Inc. (a) | 5,300 | $ | 25,016 | |||||||
Quad/Graphics, Inc. | 17,600 | 227,744 | ||||||||
Resources Connection, Inc. | 1,100 | 17,116 | ||||||||
Robert Half International, Inc. | 20,400 | 950,232 | ||||||||
RPX Corp. (a) | 6,800 | 76,568 | ||||||||
RR Donnelley & Sons Co. | 26,300 | 431,320 | ||||||||
ServiceMaster Global Holdings, Inc. (a),(c) | 68,500 | 2,581,080 | ||||||||
Sotheby’s | 3,900 | 104,247 | ||||||||
SP Plus Corp. (a) | 400 | 9,624 | ||||||||
Viad Corp. | 200 | 5,832 | ||||||||
|
| |||||||||
| 11,134,792 | ||||||||||
|
| |||||||||
Construction Materials — 0.1% | ||||||||||
Advanced Drainage Systems, Inc. | 300 | 6,390 | ||||||||
Apogee Enterprises, Inc. | 6,700 | 294,063 | ||||||||
Boise Cascade Co. (a) | 3,000 | 62,160 | ||||||||
Carlisle Cos., Inc. | 7,700 | 766,150 | ||||||||
Continental Building Products, Inc. (a),(c) | 28,000 | 519,680 | ||||||||
Eagle Materials, Inc. | 3,700 | 259,407 | ||||||||
Headwaters, Inc. (a),(c) | 29,200 | 579,328 | ||||||||
Owens Corning | 8,000 | 378,240 | ||||||||
Patrick Industries, Inc. (a) | 2,350 | 106,666 | ||||||||
Ply Gem Holdings, Inc. (a) | 100 | 1,405 | ||||||||
Universal Forest Products, Inc. | 4,200 | 360,444 | ||||||||
US Concrete, Inc. (a),(c) | 2,400 | 142,992 | ||||||||
Vulcan Materials Co. | 2,600 | 274,482 | ||||||||
|
| |||||||||
| 3,751,407 | ||||||||||
|
| |||||||||
Consumer Products — 0.7% | ||||||||||
Amplify Snack Brands, Inc. (a) | 200 | 2,864 | ||||||||
Archer-Daniels-Midland Co. | 94,000 | 3,413,140 | ||||||||
Blue Buffalo Pet Products, Inc. (a) | 9,200 | 236,072 | ||||||||
Boston Beer Co., Inc. Class A (a) | 2,900 | 536,703 | ||||||||
Central Garden and Pet Co. Class A (a) | 4,700 | 76,563 | ||||||||
Clearwater Paper Corp. (a) | 1,100 | 53,361 | ||||||||
Colgate-Palmolive Co. (c) | 83,700 | 5,913,405 | ||||||||
Constellation Brands, Inc. Class A | 62,300 | 9,412,907 | ||||||||
Craft Brew Alliance, Inc. (a) | 100 | 823 | ||||||||
Darling Ingredients, Inc. (a) | 5,500 | 72,435 | ||||||||
Energizer Holdings, Inc. | 2,300 | 93,173 | ||||||||
Estee Lauder Cos., Inc. (The) Class A | 2,000 | 188,620 | ||||||||
Female Health Co. (a) | 900 | 1,683 | ||||||||
Herbalife Ltd. (a) | 27,500 | 1,692,900 | ||||||||
HRG Group, Inc. (a) | 7,700 | 107,261 | ||||||||
Jarden Corp. (a) | 24,000 | 1,414,800 | ||||||||
JM Smucker Co. | 6,400 | 830,976 | ||||||||
John B. Sanfilippo & Son, Inc. | 2,800 | 193,452 | ||||||||
See Notes to Consolidated Financial Statements.
90
Blackstone Alternative Multi-Strategy Fund and Subsidiaries
Consolidated Schedule of Investments (Continued)
March 31, 2016
Security Description | Shares | Value | ||||||||
Kimberly-Clark Corp. | 17,300 | $ | 2,327,023 | |||||||
Mondelez International, Inc. Class A | 18,200 | 730,184 | ||||||||
PepsiCo, Inc. | 15,100 | 1,547,448 | ||||||||
Philip Morris International, Inc. | 4,200 | 412,062 | ||||||||
PICO Holdings, Inc. (a) | 100 | 1,023 | ||||||||
Pilgrim’s Pride Corp. (a),(c) | 10,900 | 276,860 | ||||||||
Pinnacle Foods, Inc. | 10,100 | 451,268 | ||||||||
Post Holdings, Inc. (a) | 6,800 | 467,636 | ||||||||
Revlon, Inc. Class A (a) | 100 | 3,641 | ||||||||
Spectrum Brands Holdings, Inc. | 100 | 10,928 | ||||||||
Vector Group Ltd. (c) | 28,447 | 649,729 | ||||||||
|
| |||||||||
| 31,118,940 | ||||||||||
|
| |||||||||
Consumer Services — 0.0% | ||||||||||
Aaron’s, Inc. | 100 | 2,510 | ||||||||
American Public Education, Inc. (a),(c) | 4,300 | 88,709 | ||||||||
Apollo Education Group, Inc. (a) | 89,500 | 735,243 | ||||||||
Bridgepoint Education, Inc. (a) | 4,800 | 48,384 | ||||||||
Capella Education Co. | 5,200 | 273,728 | ||||||||
Career Education Corp. (a) | 2,100 | 9,534 | ||||||||
Carriage Services, Inc. | 3,500 | 75,635 | ||||||||
DeVry Education Group, Inc. | 14,300 | 246,961 | ||||||||
K12, Inc. (a) | 2,700 | 26,703 | ||||||||
Medifast, Inc. | 2,200 | 66,418 | ||||||||
Rent-A-Center, Inc. | 800 | 12,680 | ||||||||
Service Corp. International/US | 7,100 | 175,228 | ||||||||
Universal Technical Institute, Inc. | 3,100 | 13,361 | ||||||||
|
| |||||||||
| 1,775,094 | ||||||||||
|
| |||||||||
Containers & Packaging — 0.2% | ||||||||||
AEP Industries, Inc. | 600 | 39,600 | ||||||||
Ball Corp. | 800 | 57,032 | ||||||||
Berry Plastics Group, Inc. (a),(c) | 103,500 | 3,741,525 | ||||||||
Crown Holdings, Inc. (a) | 100 | 4,959 | ||||||||
Graphic Packaging Holding Co. | 262,600 | 3,374,410 | ||||||||
Myers Industries, Inc. | 300 | 3,858 | ||||||||
Owens-Illinois, Inc. (a) | 12,500 | 199,500 | ||||||||
Sealed Air Corp. | 26,400 | 1,267,464 | ||||||||
WestRock Co. | 1,900 | 74,157 | ||||||||
|
| |||||||||
| 8,762,505 | ||||||||||
|
| |||||||||
Design, Manufacturing & Distribution — 0.1% | ||||||||||
Benchmark Electronics, Inc. (a) | 13,600 | 313,480 | ||||||||
Flextronics International Ltd. (a) | 237,900 | 2,869,074 | ||||||||
Sanmina Corp. (a),(c) | 12,200 | 285,236 | ||||||||
|
| |||||||||
| 3,467,790 | ||||||||||
|
| |||||||||
See Notes to Consolidated Financial Statements.
91
Blackstone Alternative Multi-Strategy Fund and Subsidiaries
Consolidated Schedule of Investments (Continued)
March 31, 2016
Security Description | Shares | Value | ||||||||
Distributors—Consumer Staples — 0.1% | ||||||||||
Andersons, Inc. | 1,000 | $ | 31,410 | |||||||
Bunge Ltd. | 30,600 | 1,734,102 | ||||||||
United Natural Foods, Inc. (a) | 2,400 | 96,720 | ||||||||
|
| |||||||||
| 1,862,232 | ||||||||||
|
| |||||||||
Distributors—Discretionary — 0.0% | ||||||||||
Bassett Furniture Industries, Inc. | 1,300 | 41,418 | ||||||||
Insight Enterprises, Inc. (a) | 1,500 | 42,960 | ||||||||
ScanSource, Inc. (a) | 700 | 28,266 | ||||||||
|
| |||||||||
| 112,644 | ||||||||||
|
| |||||||||
Electrical Equipment — 0.5% | ||||||||||
Acuity Brands, Inc. | 1,900 | 414,466 | ||||||||
Allegion PLC | 68,800 | 4,383,248 | ||||||||
Babcock & Wilcox Enterprises, Inc. (a) | 12,000 | 256,800 | ||||||||
Belden, Inc. (b),(d) | 10,320 | 633,442 | ||||||||
BWX Technologies, Inc. | 4,400 | 147,664 | ||||||||
Checkpoint Systems, Inc. (a) | 12,200 | 123,464 | ||||||||
Eaton Corp. PLC | 154,500 | 9,665,520 | ||||||||
Global Power Equipment Group, Inc. (a) | 200 | 400 | ||||||||
Houston Wire & Cable Co. | 6,900 | 48,231 | ||||||||
Ingersoll-Rand PLC | 82,700 | 5,128,227 | ||||||||
Itron, Inc. (a) | 600 | 25,032 | ||||||||
Lennox International, Inc. (b),(c),(d) | 11,545 | 1,560,768 | ||||||||
Littelfuse, Inc. (b),(d) | 2,329 | 286,723 | ||||||||
LSI Industries, Inc. | 3,200 | 37,600 | ||||||||
Powell Industries, Inc. | 500 | 14,905 | ||||||||
Stoneridge, Inc. (a) | 500 | 7,280 | ||||||||
Trimble Navigation Ltd. (a) | 1,900 | 47,120 | ||||||||
|
| |||||||||
| 22,780,890 | ||||||||||
|
| |||||||||
Engineering & Construction Services — 0.1% | ||||||||||
Comfort Systems USA, Inc. (c) | 14,600 | 463,842 | ||||||||
Great Lakes Dredge & Dock Corp. (a) | 100 | 446 | ||||||||
Kratos Defense & Security Solutions, Inc. (a) | 1,700 | 8,415 | ||||||||
Layne Christensen Co. (a) | 100 | 719 | ||||||||
MasTec, Inc. (a) | 300 | 6,072 | ||||||||
Mistras Group, Inc. (a) | 3,400 | 84,218 | ||||||||
MYR Group, Inc. (a) | 6,400 | 160,704 | ||||||||
Orion Marine Group, Inc. (a),(c) | 4,700 | 24,346 | ||||||||
Quanta Services, Inc. (a),(c) | 57,400 | 1,294,944 | ||||||||
SBA Communications Corp. Class A (a) | 400 | 40,068 | ||||||||
Sterling Construction Co., Inc. (a) | 1,500 | 7,725 | ||||||||
Team, Inc. (a) | 1,100 | 33,418 | ||||||||
TopBuild Corp. (a) | 7,255 | 215,764 | ||||||||
See Notes to Consolidated Financial Statements.
92
Blackstone Alternative Multi-Strategy Fund and Subsidiaries
Consolidated Schedule of Investments (Continued)
March 31, 2016
Security Description | Shares | Value | ||||||||
TRC Cos., Inc. (a) | 200 | $ | 1,450 | |||||||
Tutor Perini Corp. (a) | 2,100 | 32,634 | ||||||||
|
| |||||||||
| 2,374,765 | ||||||||||
|
| |||||||||
Forest & Paper Products — 0.0% | ||||||||||
PH Glatfelter Co. | 600 | 12,438 | ||||||||
Resolute Forest Products, Inc. (a) | 5,000 | 27,550 | ||||||||
|
| |||||||||
| 39,988 | ||||||||||
|
| |||||||||
Gaming, Lodging & Restaurants — 0.8% | ||||||||||
BJ’s Restaurants, Inc. (a) | 17,600 | 731,632 | ||||||||
Bloomin’ Brands, Inc. (c) | 24,800 | 418,376 | ||||||||
Bojangles’, Inc. (a) | 200 | 3,402 | ||||||||
Bravo Brio Restaurant Group, Inc. (a),(c) | 6,100 | 47,275 | ||||||||
Caesars Acquisition Co. Class A (a) | 700 | 4,284 | ||||||||
Caesars Entertainment Corp. (a) | 19,000 | 129,200 | ||||||||
Carrols Restaurant Group, Inc. (a) | 18,900 | 272,916 | ||||||||
Choice Hotels International, Inc. | 1,300 | 70,265 | ||||||||
Churchill Downs, Inc. (c) | 4,800 | 709,824 | ||||||||
Cracker Barrel Old Country Store, Inc. | 100 | 15,267 | ||||||||
Dave & Buster’s Entertainment, Inc. (a) | 13,300 | 515,774 | ||||||||
Del Frisco’s Restaurant Group, Inc. (a) | 5,700 | 94,506 | ||||||||
Denny’s Corp. (a),(c) | 32,300 | 334,628 | ||||||||
Domino’s Pizza, Inc. (c) | 55,900 | 7,370,974 | ||||||||
Dunkin’ Brands Group, Inc. | 3,600 | 169,812 | ||||||||
El Pollo Loco Holdings, Inc. (a) | 1,600 | 21,344 | ||||||||
Eldorado Resorts, Inc. (a) | 14,800 | 169,312 | ||||||||
Famous Dave’s of America, Inc. (a) | 1,700 | 10,353 | ||||||||
Hilton Worldwide Holdings, Inc. | 155,300 | 3,497,356 | ||||||||
Hyatt Hotels Corp. Class A (a),(c) | 3,000 | 148,470 | ||||||||
International Game Technology PLC | 100 | 1,825 | ||||||||
Interval Leisure Group, Inc. | 2,800 | 40,432 | ||||||||
Isle of Capri Casinos, Inc. (a),(c) | 28,600 | 400,400 | ||||||||
La Quinta Holdings, Inc. (a) | 12,900 | 161,250 | ||||||||
Marriott International, Inc. Class A | 54,400 | 3,872,192 | ||||||||
McDonald’s Corp. | 14,900 | 1,872,632 | ||||||||
MGM Resorts International (a) | 2,500 | 53,600 | ||||||||
Monarch Casino & Resort, Inc. (a) | 700 | 13,622 | ||||||||
Papa John’s International, Inc. | 4,600 | 249,274 | ||||||||
Penn National Gaming, Inc. (a) | 100 | 1,669 | ||||||||
Popeyes Louisiana Kitchen, Inc. (a) | 9,400 | 489,364 | ||||||||
Potbelly Corp. (a) | 1,900 | 25,859 | ||||||||
Royal Caribbean Cruises Ltd. (b),(d) | 19,325 | 1,587,549 | ||||||||
Ruth’s Hospitality Group, Inc. | 500 | 9,205 | ||||||||
Shake Shack, Inc. Class A (a) | 700 | 26,124 | ||||||||
Sonic Corp. (b),(d) | 46,355 | 1,629,842 | ||||||||
See Notes to Consolidated Financial Statements.
93
Blackstone Alternative Multi-Strategy Fund and Subsidiaries
Consolidated Schedule of Investments (Continued)
March 31, 2016
Security Description | Shares | Value | ||||||||
Starwood Hotels & Resorts Worldwide, Inc. | 97,200 | $ | 8,109,396 | |||||||
Wingstop, Inc. (a) | 2,500 | 56,700 | ||||||||
Wyndham Worldwide Corp. | 11,100 | 848,373 | ||||||||
Yum! Brands, Inc. | 6,600 | 540,210 | ||||||||
|
| |||||||||
| 34,724,488 | ||||||||||
|
| |||||||||
Hardware — 0.9% | ||||||||||
A10 Networks, Inc. (a) | 1,400 | 8,288 | ||||||||
ADTRAN, Inc. (b),(d) | 44,300 | 895,746 | ||||||||
Apple, Inc. | 11,841 | 1,290,551 | ||||||||
Arista Networks, Inc. (a) | 3,400 | 214,540 | ||||||||
Brocade Communications Systems, Inc. | 12,500 | 132,250 | ||||||||
Clearfield, Inc. (a) | 100 | 1,607 | ||||||||
CommScope Holding Co., Inc. (a) | 200 | 5,584 | ||||||||
Comtech Telecommunications Corp. (c) | 2,400 | 56,088 | ||||||||
Cray, Inc. (a) | 2,300 | 96,393 | ||||||||
Daktronics, Inc. | 1,200 | 9,480 | ||||||||
Datalink Corp. (a) | 4,200 | 38,388 | ||||||||
Dolby Laboratories, Inc. Class A (c) | 34,100 | 1,481,986 | ||||||||
Eastman Kodak Co. (a) | 600 | 6,510 | ||||||||
Electronics For Imaging, Inc. (a),(b),(d) | 31,985 | 1,355,844 | ||||||||
EMC Corp. (b) | 6,556 | 174,718 | ||||||||
Emcore Corp. (a) | 20,100 | 100,500 | ||||||||
F5 Networks, Inc. (a) | 23,700 | 2,508,645 | ||||||||
Finisar Corp. (a) | 62,400 | 1,138,176 | ||||||||
Gigamon, Inc. (a) | 300 | 9,306 | ||||||||
Harmonic, Inc. (a) | 1,600 | 5,232 | ||||||||
HP, Inc. | 183,000 | 2,254,560 | ||||||||
Hutchinson Technology, Inc. (a) | 4,800 | 17,568 | ||||||||
Imation Corp. (a) | 900 | 1,395 | ||||||||
Immersion Corp. (a) | 5,000 | 41,300 | ||||||||
Imprivata, Inc. (a) | 5,300 | 66,939 | ||||||||
Infinera Corp. (a),(b),(d) | 63,100 | 1,013,386 | ||||||||
Infoblox, Inc. (a) | 4,900 | 83,790 | ||||||||
InterDigital, Inc. | 900 | 50,085 | ||||||||
Ixia (a) | 200 | 2,492 | ||||||||
Knowles Corp. (a) | 13 | 171 | ||||||||
KVH Industries, Inc. (a) | 700 | 6,685 | ||||||||
Lexmark International, Inc. Class A | 3,500 | 117,005 | ||||||||
Lumentum Holdings, Inc. (a) | 27,700 | 747,069 | ||||||||
Mercury Systems, Inc. (a) | 4,000 | 81,200 | ||||||||
Motorola Solutions, Inc. | 71,800 | 5,435,260 | ||||||||
Multi-Fineline Electronix, Inc. (a) | 3,300 | 76,593 | ||||||||
NETGEAR, Inc. (a) | 500 | 20,185 | ||||||||
Polycom, Inc. (a) | 1,300 | 14,495 | ||||||||
Rovi Corp. (a) | 59,800 | 1,226,498 | ||||||||
ShoreTel, Inc. (a) | 27,900 | 207,576 | ||||||||
See Notes to Consolidated Financial Statements.
94
Blackstone Alternative Multi-Strategy Fund and Subsidiaries
Consolidated Schedule of Investments (Continued)
March 31, 2016
Security Description | Shares | Value | ||||||||
Skullcandy, Inc. (a) | 3,600 | $ | 12,816 | |||||||
Sonus Networks, Inc. (a) | 20,400 | 153,612 | ||||||||
Stratasys Ltd. (a) | 15,871 | 411,376 | ||||||||
Telenav, Inc. (a),(c) | 2,600 | 15,340 | ||||||||
TTM Technologies, Inc. (a) | 11,500 | 76,475 | ||||||||
VeriFone Systems, Inc. (a),(c) | 15,500 | 437,720 | ||||||||
Viavi Solutions, Inc. (a),(c) | 38,600 | 264,796 | ||||||||
Vicor Corp. (a) | 500 | 5,240 | ||||||||
Vishay Precision Group, Inc. (a) | 5,300 | 74,253 | ||||||||
Vocera Communications, Inc. (a) | 6,800 | 86,700 | ||||||||
VOXX International Corp. (a),(c) | 1,800 | 8,046 | ||||||||
Western Digital Corp. (c) | 307,100 | 14,507,404 | ||||||||
|
| |||||||||
| 37,047,862 | ||||||||||
|
| |||||||||
Health Care Facilities & Services — 3.1% | ||||||||||
Addus HomeCare Corp. (a) | 1,900 | 32,661 | ||||||||
Aetna, Inc. (b),(d) | 86,850 | 9,757,598 | ||||||||
Almost Family, Inc. (a) | 2,100 | 78,204 | ||||||||
Amedisys, Inc. (a) | 700 | 33,838 | ||||||||
AmerisourceBergen Corp. (b),(d) | 93,000 | 8,049,150 | ||||||||
Brookdale Senior Living, Inc. (a),(b),(c),(d) | 83,161 | 1,320,597 | ||||||||
Capital Senior Living Corp. (a) | 900 | 16,668 | ||||||||
Centene Corp. (a),(b) | 1,615 | 99,448 | ||||||||
Civitas Solutions, Inc. (a) | 100 | 1,743 | ||||||||
Community Health Systems, Inc. (a) | 5,200 | 96,252 | ||||||||
Digirad Corp. (c) | 1,900 | 9,424 | ||||||||
Envision Healthcare Holdings, Inc. (a),(c) | 14,200 | 289,680 | ||||||||
Enzo Biochem, Inc. (a) | 700 | 3,185 | ||||||||
Five Star Quality Care, Inc. (a) | 6,100 | 13,969 | ||||||||
Great Basin Scientific, Inc. (a) | 455 | 3,262 | ||||||||
HCA Holdings, Inc. (a),(b),(c) | 249,630 | 19,483,621 | ||||||||
Healthways, Inc. (a) | 12,100 | 122,089 | ||||||||
Humana, Inc. (b),(c),(d) | 84,823 | 15,518,368 | ||||||||
Inc. Research Holdings, Inc. Class A (a) | 1,400 | 57,694 | ||||||||
Laboratory Corp. of America Holdings (a),(b),(c),(d) | 207,430 | 24,296,276 | ||||||||
LHC Group, Inc. (a) | 700 | 24,892 | ||||||||
Magellan Health, Inc. (a) | 3,300 | 224,169 | ||||||||
McKesson Corp. (b),(c) | 47,900 | 7,532,275 | ||||||||
Molina Healthcare, Inc. (a) | 1,700 | 109,633 | ||||||||
PharMerica Corp. (a) | 1,400 | 30,954 | ||||||||
Premier, Inc. Class A (a) | 15,800 | 527,088 | ||||||||
Quest Diagnostics, Inc. (b),(d) | 301,150 | 21,517,167 | ||||||||
Quintiles Transnational Holdings, Inc. (a) | 22,300 | 1,451,730 | ||||||||
RadNet, Inc. (a),(c) | 5,500 | 26,565 | ||||||||
Select Medical Holdings Corp. | 100 | 1,181 | ||||||||
Surgical Care Affiliates, Inc. (a) | 1,000 | 46,280 | ||||||||
See Notes to Consolidated Financial Statements.
95
Blackstone Alternative Multi-Strategy Fund and Subsidiaries
Consolidated Schedule of Investments (Continued)
March 31, 2016
Security Description | Shares | Value | ||||||||
UnitedHealth Group, Inc. (b),(d) | 17,500 | $ | 2,255,750 | |||||||
Universal American Corp. | 8,200 | 58,548 | ||||||||
Universal Health Services, Inc. Class B (b),(c),(d) | 143,380 | 17,882,354 | ||||||||
VCA, Inc. (a),(c) | 9,100 | 524,979 | ||||||||
|
| |||||||||
| 131,497,292 | ||||||||||
|
| |||||||||
Home & Office Products — 0.3% | ||||||||||
American Woodmark Corp. (a),(c) | 7,700 | 574,343 | ||||||||
Armstrong World Industries, Inc. (a) | 44,100 | 2,133,117 | ||||||||
Blount International, Inc. (a) | 5,100 | 50,898 | ||||||||
CalAtlantic Group, Inc. | 80 | 2,674 | ||||||||
Hooker Furniture Corp. | 1,400 | 45,990 | ||||||||
Interface, Inc. | 1,200 | 22,248 | ||||||||
Kimball International, Inc. Class B | 5,700 | 64,695 | ||||||||
Knoll, Inc. | 1,000 | 21,650 | ||||||||
La-Z-Boy, Inc. | 3,200 | 85,568 | ||||||||
Libbey, Inc. | 3,300 | 61,380 | ||||||||
Masco Corp. (c) | 263,400 | 8,283,930 | ||||||||
Masonite International Corp. (a) | 1,400 | 91,700 | ||||||||
Mohawk Industries, Inc. (a),(b),(c),(d) | 2,520 | 481,068 | ||||||||
NACCO Industries, Inc. Class A | 100 | 5,741 | ||||||||
Quanex Building Products Corp. | 3,400 | 59,024 | ||||||||
Scotts Miracle-Gro Co. Class A | 18,600 | 1,353,522 | ||||||||
Toll Brothers, Inc. (a) | 13,700 | 404,287 | ||||||||
|
| |||||||||
| 13,741,835 | ||||||||||
|
| |||||||||
Industrial Services — 0.2% | ||||||||||
Electro Rent Corp. | 2,400 | 22,224 | ||||||||
HD Supply Holdings, Inc. (a),(c) | 161,900 | 5,354,033 | ||||||||
McGrath RentCorp | 400 | 10,032 | ||||||||
Titan Machinery, Inc. (a) | 600 | 6,936 | ||||||||
United Rentals, Inc. (a) | 200 | 12,438 | ||||||||
Watsco, Inc. | 100 | 13,474 | ||||||||
WESCO International, Inc. (a),(c) | 42,200 | 2,307,074 | ||||||||
|
| |||||||||
| 7,726,211 | ||||||||||
|
| |||||||||
Institutional Financial Services — 0.1% | ||||||||||
BGC Partners, Inc. Class A | 5,400 | 48,870 | ||||||||
Evercore Partners, Inc. Class A | 21,273 | 1,100,878 | ||||||||
Goldman Sachs Group, Inc. (The) (c) | 6,017 | 944,548 | ||||||||
Houlihan Lokey, Inc. | 800 | 19,920 | ||||||||
INTL. FCStone, Inc. (a) | 600 | 16,038 | ||||||||
Investment Technology Group, Inc. | 300 | 6,630 | ||||||||
KCG Holdings, Inc. Class A (a) | 11,700 | 139,815 | ||||||||
Piper Jaffray Cos. (a) | 3,500 | 173,460 | ||||||||
|
| |||||||||
| 2,450,159 | ||||||||||
|
| |||||||||
See Notes to Consolidated Financial Statements.
96
Blackstone Alternative Multi-Strategy Fund and Subsidiaries
Consolidated Schedule of Investments (Continued)
March 31, 2016
Security Description | Shares | Value | ||||||||
Insurance — 0.4% | ||||||||||
Allied World Assurance Co. Holdings AG | 900 | $ | 31,446 | |||||||
American Equity Investment Life Holding Co. | 13,300 | 223,440 | ||||||||
American International Group, Inc. (c) | 97,705 | 5,280,955 | ||||||||
Arthur J Gallagher & Co. | 47,500 | 2,112,800 | ||||||||
Assured Guaranty Ltd. | 210,308 | 5,320,792 | ||||||||
Atlas Financial Holdings, Inc. (a) | 100 | 1,814 | ||||||||
Citizens, Inc. (a) | 200 | 1,448 | ||||||||
eHealth, Inc. (a) | 400 | 3,756 | ||||||||
Employers Holdings, Inc. (c) | 8,600 | 242,004 | ||||||||
Genworth Financial, Inc. Class A (a) | 34,900 | 95,277 | ||||||||
Greenlight Capital Re Ltd. A Shares (a) | 1,600 | 34,864 | ||||||||
Hartford Financial Services Group, Inc. (c) | 33,947 | 1,564,278 | ||||||||
Heritage Insurance Holdings, Inc. | 5,000 | 79,850 | ||||||||
Lincoln National Corp. | 34,500 | 1,352,400 | ||||||||
Maiden Holdings Ltd. | 2,700 | 34,938 | ||||||||
Old Republic International Corp. | 18,200 | 332,696 | ||||||||
OneBeacon Insurance Group Ltd. Class A | 7,400 | 94,202 | ||||||||
Principal Financial Group, Inc. | 7,000 | 276,150 | ||||||||
Prudential Financial, Inc. (c) | 12,026 | 868,518 | ||||||||
Radian Group, Inc. | 11,200 | 138,880 | ||||||||
State Auto Financial Corp. | 82 | 1,809 | ||||||||
State National Cos., Inc. | 1,500 | 18,900 | ||||||||
Universal Insurance Holdings, Inc. | 600 | 10,680 | ||||||||
Validus Holdings Ltd. | 1,100 | 51,909 | ||||||||
Voya Financial, Inc. | 2,700 | 80,379 | ||||||||
|
| |||||||||
| 18,254,185 | ||||||||||
|
| |||||||||
Iron & Steel — 0.1% | ||||||||||
Allegheny Technologies, Inc. | 300 | 4,890 | ||||||||
Commercial Metals Co. | 500 | 8,485 | ||||||||
Nucor Corp. | 84,400 | 3,992,120 | ||||||||
Ryerson Holding Corp. (a) | 1,300 | 7,228 | ||||||||
Steel Dynamics, Inc. | 27,000 | 607,770 | ||||||||
SunCoke Energy, Inc. | 13,000 | 84,500 | ||||||||
United States Steel Corp. | 9,100 | 146,055 | ||||||||
Worthington Industries, Inc. (c) | 3,100 | 110,484 | ||||||||
|
| |||||||||
| 4,961,532 | ||||||||||
|
| |||||||||
Leisure Products — 0.0% | ||||||||||
Black Diamond, Inc. (a) | 600 | 2,712 | ||||||||
Callaway Golf Co. | 1,200 | 10,944 | ||||||||
JAKKS Pacific, Inc. (a) | 500 | 3,720 | ||||||||
LeapFrog Enterprises, Inc. (a) | 9,200 | 9,154 | ||||||||
Malibu Boats, Inc. (a) | 100 | 1,640 | ||||||||
|
| |||||||||
| 28,170 | ||||||||||
|
| |||||||||
See Notes to Consolidated Financial Statements.
97
Blackstone Alternative Multi-Strategy Fund and Subsidiaries
Consolidated Schedule of Investments (Continued)
March 31, 2016
Security Description | Shares | Value | ||||||||
Machinery — 0.1% | ||||||||||
Alamo Group, Inc. | 100 | $ | 5,571 | |||||||
Colfax Corp. (a) | 16,300 | 466,017 | ||||||||
Columbus McKinnon Corp. | 1,400 | 22,064 | ||||||||
Federal Signal Corp. | 10,700 | 141,882 | ||||||||
Graham Corp. | 1,700 | 33,847 | ||||||||
Hyster-Yale Materials Handling, Inc. | 400 | 26,640 | ||||||||
Intevac, Inc. (a),(c) | 1,100 | 4,950 | ||||||||
Joy Global, Inc. | 97,000 | 1,558,790 | ||||||||
Kadant, Inc. (c) | 1,900 | 85,804 | ||||||||
Raven Industries, Inc. | 1,100 | 17,622 | ||||||||
Rofin-Sinar Technologies, Inc. (a),(c) | 2,200 | 70,884 | ||||||||
Sensata Technologies Holding NV (a) | 7,800 | 302,952 | ||||||||
SPX Corp. | 11,600 | 174,232 | ||||||||
SPX FLOW, Inc. (a) | 5,000 | 125,400 | ||||||||
Toro Co. | 500 | 43,060 | ||||||||
Xerium Technologies, Inc. (a) | 4,300 | 22,446 | ||||||||
|
| |||||||||
| 3,102,161 | ||||||||||
|
| |||||||||
Manufactured Goods — 0.0% | ||||||||||
Aegion Corp. (a),(c) | 3,500 | 73,815 | ||||||||
Chart Industries, Inc. (a),(c) | 12,100 | 262,812 | ||||||||
Dynamic Materials Corp. | 1,900 | 12,312 | ||||||||
Gibraltar Industries, Inc. (a) | 8,400 | 240,240 | ||||||||
Global Brass & Copper Holdings, Inc. | 5,300 | 132,235 | ||||||||
Insteel Industries, Inc. | 3,400 | 103,938 | ||||||||
LB Foster Co. Class A | 7,000 | 127,120 | ||||||||
NCI Building Systems, Inc. (a) | 2,800 | 39,760 | ||||||||
|
| |||||||||
| 992,232 | ||||||||||
|
| |||||||||
Media — 2.8% | ||||||||||
A H Belo Corp. Class A | 2,100 | 10,101 | ||||||||
Alphabet, Inc. Class C (a),(b),(c) | 2,767 | 2,061,277 | ||||||||
Autobytel, Inc. (a) | 2,300 | 39,928 | ||||||||
Bankrate, Inc. (a) | 13,900 | 127,463 | ||||||||
Blucora, Inc. (a) | 600 | 3,096 | ||||||||
Boingo Wireless, Inc. (a) | 6,800 | 52,496 | ||||||||
Cablevision Systems Corp. Class A (c) | 492,904 | 16,265,832 | ||||||||
CBS Corp. Class B (c) | 195,400 | 10,764,586 | ||||||||
Charter Communications, Inc. Class A (a),(c) | 74,800 | 15,141,764 | ||||||||
Clear Channel Outdoor Holdings, Inc. Class A | 8,700 | 40,890 | ||||||||
Comcast Corp. Class A (c) | 214,246 | 13,086,146 | ||||||||
DHI Group, Inc. (a) | 600 | 4,842 | ||||||||
Discovery Communications, Inc. Class A (a) | 200 | 5,726 | ||||||||
DISH Network Corp. Class A (a),(c) | 48,900 | 2,262,114 | ||||||||
EchoStar Corp. Class A (a) | 400 | 17,716 | ||||||||
See Notes to Consolidated Financial Statements.
98
Blackstone Alternative Multi-Strategy Fund and Subsidiaries
Consolidated Schedule of Investments (Continued)
March 31, 2016
Security Description | Shares | Value | ||||||||
Entercom Communications Corp. Class A (a) | 3,700 | $ | 39,146 | |||||||
Entravision Communications Corp. Class A | 500 | 3,720 | ||||||||
Eros International PLC (a) | 1,700 | 19,567 | ||||||||
Everyday Health, Inc. (a) | 800 | 4,480 | ||||||||
Expedia, Inc. | 74,716 | 8,055,879 | ||||||||
Gannett Co., Inc. | 200 | 3,028 | ||||||||
Gray Television, Inc. (a) | 14,300 | 167,596 | ||||||||
Harte-Hanks, Inc. (c) | 19,200 | 48,576 | ||||||||
IAC/InterActiveCorp | 3,600 | 169,488 | ||||||||
Interpublic Group of Cos., Inc. | 20,400 | 468,180 | ||||||||
Lee Enterprises, Inc. (a) | 300 | 540 | ||||||||
Liberty Broadband Corp. Class A (a),(b) | 2,779 | 161,627 | ||||||||
Liberty Broadband Corp. Class C (a),(b) | 7,005 | 405,940 | ||||||||
Liberty Media Corp. (a),(b) | 32,887 | 1,261,993 | ||||||||
Liberty TripAdvisor Holdings, Inc. Class A (a) | 10,900 | 241,544 | ||||||||
Marin Software, Inc. (a) | 100 | 302 | ||||||||
Match Group, Inc. (a) | 2,400 | 26,544 | ||||||||
McClatchy Co. Class A (a) | 2,000 | 2,100 | ||||||||
MDC Partners, Inc. Class A | 1,000 | 23,600 | ||||||||
MSG Networks, Inc. (a),(c) | 36,900 | 638,001 | ||||||||
National CineMedia, Inc. | 9,100 | 138,411 | ||||||||
New York Times Co. Class A | 9,000 | 112,140 | ||||||||
News Corp. Class A | 132,400 | 1,690,748 | ||||||||
RetailMeNot, Inc. (a) | 17,000 | 136,170 | ||||||||
Rubicon Project, Inc. (a) | 800 | 14,624 | ||||||||
Shutterfly, Inc. (a) | 3,300 | 153,021 | ||||||||
Stamps.com, Inc. (a) | 4,300 | 457,004 | ||||||||
Starz (a) | 12,700 | 334,391 | ||||||||
TechTarget, Inc. (a),(c) | 4,800 | 35,616 | ||||||||
TEGNA, Inc. | 100 | 2,346 | ||||||||
Time Warner Cable, Inc. (b),(c) | 150,941 | 30,885,547 | ||||||||
Townsquare Media, Inc. Class A (a) | 100 | 1,121 | ||||||||
VeriSign, Inc. (a),(c) | 27,100 | 2,399,434 | ||||||||
Viacom, Inc. | 18,000 | 743,040 | ||||||||
WebMD Health Corp. (a),(c) | 31,000 | 1,941,530 | ||||||||
XO Group, Inc. (a),(c) | 5,200 | 83,460 | ||||||||
Yahoo!, Inc. (a),(b),(c) | 228,800 | 8,422,128 | ||||||||
YuMe, Inc. (a) | 300 | 1,122 | ||||||||
|
| |||||||||
| 119,177,681 | ||||||||||
|
| |||||||||
Medical Equipment & Devices — 3.0% | ||||||||||
Affymetrix, Inc. (a) | 11,200 | 156,912 | ||||||||
Agilent Technologies, Inc. (c) | 94,400 | 3,761,840 | ||||||||
AngioDynamics, Inc. (a) | 7,300 | 89,717 | ||||||||
AtriCure, Inc. (a) | 100 | 1,683 | ||||||||
Baxter International, Inc. (c) | 36,200 | 1,487,096 | ||||||||
Bruker Corp. | 8,200 | 229,600 | ||||||||
See Notes to Consolidated Financial Statements.
99
Blackstone Alternative Multi-Strategy Fund and Subsidiaries
Consolidated Schedule of Investments (Continued)
March 31, 2016
Security Description | Shares | Value | ||||||||
CONMED Corp. | 300 | $ | 12,582 | |||||||
CR Bard, Inc. (b),(c) | 61,925 | 12,550,340 | ||||||||
CryoLife, Inc. | 3,700 | 39,775 | ||||||||
Cutera, Inc. (a) | 2,100 | 23,625 | ||||||||
Dentsply Sirona, Inc. (c),(d) | 372,710 | 22,970,117 | ||||||||
Derma Sciences, Inc. (a) | 300 | 930 | ||||||||
DexCom, Inc. (a),(b),(c),(d) | 363,330 | 24,673,740 | ||||||||
Edwards Lifesciences Corp. (a),(b),(c) | 149,130 | 13,154,757 | ||||||||
Exactech, Inc. (a) | 1,800 | 36,468 | ||||||||
Genomic Health, Inc. (a),(c) | 3,800 | 94,126 | ||||||||
Harvard Bioscience, Inc. (a) | 500 | 1,510 | ||||||||
HeartWare International, Inc. (a) | 5,200 | 163,384 | ||||||||
Hologic, Inc. (a) | 56,200 | 1,938,900 | ||||||||
ICU Medical, Inc. (a) | 700 | 72,870 | ||||||||
IDEXX Laboratories, Inc. (a) | 100 | 7,832 | ||||||||
Inogen, Inc. (a) | 600 | 26,988 | ||||||||
Intuitive Surgical, Inc. (a) | 500 | 300,525 | ||||||||
LeMaitre Vascular, Inc. | 300 | 4,656 | ||||||||
Luminex Corp. (a),(c) | 8,000 | 155,200 | ||||||||
Masimo Corp. (a) | 500 | 20,920 | ||||||||
Medtronic PLC (b),(d) | 22,000 | 1,650,000 | ||||||||
Merit Medical Systems, Inc. (a) | 14,300 | 264,407 | ||||||||
Myriad Genetics, Inc. (a) | 1,600 | 59,888 | ||||||||
NuVasive, Inc. (a) | 2,500 | 121,625 | ||||||||
NxStage Medical, Inc. (a) | 5,800 | 86,942 | ||||||||
OraSure Technologies, Inc. (a) | 28,500 | 206,055 | ||||||||
Orthofix International NV (a) | 8,500 | 352,920 | ||||||||
QIAGEN NV (a) | 3,183 | 71,108 | ||||||||
ResMed, Inc. | 2,600 | 150,332 | ||||||||
RTI Surgical, Inc. (a) | 15,800 | 63,200 | ||||||||
St Jude Medical, Inc. | 23,700 | 1,303,500 | ||||||||
STAAR Surgical Co. (a) | 900 | 6,651 | ||||||||
SurModics, Inc. (a) | 2,800 | 51,548 | ||||||||
Teleflex, Inc. | 1,400 | 219,814 | ||||||||
Thermo Fisher Scientific, Inc. (b),(d) | 74,660 | 10,571,110 | ||||||||
VWR Corp. (a),(b),(c),(d) | 60,189 | 1,628,714 | ||||||||
Waters Corp. (a),(b) | 21,331 | 2,813,986 | ||||||||
Wright Medical Group NV (a) | 19,399 | 322,023 | ||||||||
Zeltiq Aesthetics, Inc. (a),(c) | 2,700 | 73,332 | ||||||||
Zimmer Holdings, Inc. (b),(c),(d) | 246,204 | 26,252,733 | ||||||||
|
| |||||||||
| 128,245,981 | ||||||||||
|
| |||||||||
Metals & Mining — 0.0% | ||||||||||
Alcoa, Inc. | 7 | 67 | ||||||||
Century Aluminum Co. (a) | 13,200 | 93,060 | ||||||||
Encore Wire Corp. | 800 | 31,144 | ||||||||
Ferroglobe PLC | 4,800 | 42,288 | ||||||||
See Notes to Consolidated Financial Statements.
100
Blackstone Alternative Multi-Strategy Fund and Subsidiaries
Consolidated Schedule of Investments (Continued)
March 31, 2016
Security Description | Shares | Value | ||||||||
Freeport-McMoRan, Inc. | 94,300 | $ | 975,062 | |||||||
Harsco Corp. | 300 | 1,635 | ||||||||
McEwen Mining, Inc. | 1,700 | 3,196 | ||||||||
Newmont Mining Corp. | 13,200 | 350,856 | ||||||||
Royal Gold, Inc. | 1,800 | 92,322 | ||||||||
Stillwater Mining Co. (a) | 9,800 | 104,370 | ||||||||
|
| |||||||||
| 1,694,000 | ||||||||||
|
| |||||||||
Oil, Gas & Coal — 1.3% | ||||||||||
Anadarko Petroleum Corp. | 3,500 | 162,995 | ||||||||
Apache Corp. | 2,600 | 126,906 | ||||||||
Archrock, Inc. | 5,000 | 40,000 | ||||||||
Atwood Oceanics, Inc. | 50,800 | 465,836 | ||||||||
Baker Hughes, Inc. (c) | 206,100 | 9,033,363 | ||||||||
Bill Barrett Corp. (a) | 1,300 | 8,086 | ||||||||
Bristow Group, Inc. | 2,100 | 39,732 | ||||||||
California Resources Corp. | 219,304 | 225,883 | ||||||||
Chesapeake Energy Corp. | 283,300 | 1,167,196 | ||||||||
Cimarex Energy Co. | 2,900 | 282,083 | ||||||||
Civeo Corp. (a) | 1,300 | 1,599 | ||||||||
Concho Resources, Inc. (a),(c) | 33,400 | 3,374,736 | ||||||||
CONSOL Energy, Inc. | 56,100 | 633,369 | ||||||||
Contango Oil & Gas Co. (a) | 300 | 3,537 | ||||||||
Continental Resources, Inc. (a) | 5,800 | 176,088 | ||||||||
CVR Energy, Inc. | 300 | 7,830 | ||||||||
Dawson Geophysical Co. (a) | 740 | 3,382 | ||||||||
Denbury Resources, Inc. | 102,300 | 227,106 | ||||||||
Diamond Offshore Drilling, Inc. | 10,000 | 217,300 | ||||||||
Dril-Quip, Inc. (a),(c) | 700 | 42,392 | ||||||||
Energen Corp. | 2,500 | 91,475 | ||||||||
Ensco PLC Class A | 400 | 4,148 | ||||||||
EP Energy Corp. Class A (a) | 4,100 | 18,532 | ||||||||
EQT Corp. | 25,100 | 1,688,226 | ||||||||
Evolution Petroleum Corp. (c) | 1,200 | 5,832 | ||||||||
FMC Technologies, Inc. (a),(c) | 279,700 | 7,652,592 | ||||||||
Forum Energy Technologies, Inc. (a) | 5,700 | 75,240 | ||||||||
Gulf Island Fabrication, Inc. | 4,000 | 31,400 | ||||||||
Gulfport Energy Corp. (a),(c) | 43,000 | 1,218,620 | ||||||||
Hallador Energy Co. | 600 | 2,742 | ||||||||
Halliburton Co. (c) | 306,400 | 10,944,608 | ||||||||
Helix Energy Solutions Group, Inc. (a),(c) | 44,300 | 248,080 | ||||||||
Hess Corp. | 19,500 | 1,026,675 | ||||||||
ION Geophysical Corp. (a) | 386 | 3,119 | ||||||||
Marathon Oil Corp. | 14,500 | 161,530 | ||||||||
Marathon Petroleum Corp. (b) | 80,141 | 2,979,642 | ||||||||
Matrix Service Co. (a) | 5,400 | 95,580 | ||||||||
McDermott International, Inc. (a) | 800 | 3,272 | ||||||||
See Notes to Consolidated Financial Statements.
101
Blackstone Alternative Multi-Strategy Fund and Subsidiaries
Consolidated Schedule of Investments (Continued)
March 31, 2016
Security Description | Shares | Value | ||||||||
Mitcham Industries, Inc. (a) | 200 | $ | 612 | |||||||
MRC Global, Inc. (a) | 4,900 | 64,386 | ||||||||
Nabors Industries Ltd. | 77,100 | 709,320 | ||||||||
Natural Gas Services Group, Inc. (a) | 1,700 | 36,771 | ||||||||
Newfield Exploration Co. (a) | 59,200 | 1,968,400 | ||||||||
Newpark Resources, Inc. (a) | 15,600 | 67,392 | ||||||||
Noble Energy, Inc. | 31,203 | 980,086 | ||||||||
NOW, Inc. (a) | 15,800 | 279,976 | ||||||||
Oasis Petroleum, Inc. (a) | 100 | 728 | ||||||||
Oceaneering International, Inc. | 10,300 | 342,372 | ||||||||
Oil States International, Inc. (a),(c) | 20,200 | 636,704 | ||||||||
Parsley Energy, Inc. Class A (a) | 3,600 | 81,360 | ||||||||
PBF Energy, Inc. Class A | 100 | 3,320 | ||||||||
PDC Energy, Inc. (a) | 15,000 | 891,750 | ||||||||
Peabody Energy Corp. | 7,680 | 17,818 | ||||||||
QEP Resources, Inc. (c) | 55,100 | 777,461 | ||||||||
Range Resources Corp. | 900 | 29,142 | ||||||||
Rowan Cos. PLC Class A | 1,500 | 24,150 | ||||||||
SemGroup Corp. Class A | 1,200 | 26,880 | ||||||||
SM Energy Co. | 14,300 | 267,982 | ||||||||
Southwestern Energy Co. (a),(c) | 315,400 | 2,545,278 | ||||||||
Stone Energy Corp. (a) | 23,200 | 18,328 | ||||||||
Tesco Corp. | 1,500 | 12,915 | ||||||||
Tesoro Corp. (b) | 20,382 | 1,753,056 | ||||||||
TETRA Technologies, Inc. (a) | 12,300 | 78,105 | ||||||||
TransAtlantic Petroleum Ltd. (a) | 300 | 225 | ||||||||
Transocean Ltd. (b) | 1,912 | 17,001 | ||||||||
Ultra Petroleum Corp. (a) | 24,400 | 12,151 | ||||||||
Unit Corp. (a) | 5,900 | 51,979 | ||||||||
VAALCO Energy, Inc. (a) | 4,000 | 3,760 | ||||||||
Weatherford International PLC (a) | 28,100 | 218,618 | ||||||||
Western Refining, Inc. (b) | 7,620 | 221,666 | ||||||||
Whiting Petroleum Corp. (a) | 136,453 | 1,088,895 | ||||||||
Williams Cos., Inc. (a) | 12,000 | 192,840 | ||||||||
World Fuel Services Corp. | 4,000 | 194,320 | ||||||||
|
| |||||||||
| 56,106,479 | ||||||||||
|
| |||||||||
Passenger Transportation — 0.2% | ||||||||||
Delta Air Lines, Inc. | 24,600 | 1,197,528 | ||||||||
Era Group, Inc. (a) | 100 | 938 | ||||||||
Hawaiian Holdings, Inc. (a),(c) | 39,600 | 1,868,724 | ||||||||
SkyWest, Inc. | 300 | 5,997 | ||||||||
Southwest Airlines Co. | 15,500 | 694,400 | ||||||||
Spirit Airlines, Inc. (a),(c) | 76,700 | 3,680,066 | ||||||||
Virgin America, Inc. (a) | 3,900 | 150,384 | ||||||||
|
| |||||||||
| 7,598,037 | ||||||||||
|
| |||||||||
See Notes to Consolidated Financial Statements.
102
Blackstone Alternative Multi-Strategy Fund and Subsidiaries
Consolidated Schedule of Investments (Continued)
March 31, 2016
Security Description | Shares | Value | ||||||||
Real Estate — 1.6% | ||||||||||
Agree Realty Corp. | 1,900 | $ | 73,093 | |||||||
American Tower Corp. (b),(c),(d) | 32,717 | 3,349,239 | ||||||||
Apartment Investment & Management Co. Class A | 1,600 | 66,912 | ||||||||
Armada Hoffler Properties, Inc. (c) | 17,800 | 200,250 | ||||||||
Ashford Hospitality Prime, Inc. | 78 | 910 | ||||||||
Care Capital Properties, Inc. | 500 | 13,420 | ||||||||
CareTrust REIT, Inc. | 500 | 6,350 | ||||||||
CBRE Group, Inc. (a),(c) | 109,800 | 3,164,436 | ||||||||
Cedar Realty Trust, Inc. | 2,000 | 14,460 | ||||||||
Colony Starwood Homes | 498 | 12,326 | ||||||||
CorEnergy Infrastructure Trust, Inc. | 100 | 2,011 | ||||||||
Crown Castle International Corp. | 29,500 | 2,551,750 | ||||||||
Equinix, Inc. | 373 | 123,355 | ||||||||
Equity Commonwealth (a) | 3,900 | 110,058 | ||||||||
FelCor Lodging Trust, Inc. | 36,100 | 293,132 | ||||||||
Forest City Realty Trust, Inc.—Class A, (REIT) | 109,644 | 2,312,392 | ||||||||
Gaming and Leisure Properties, Inc. | 4,400 | 136,048 | ||||||||
Geo Group, Inc. (The) | 2,500 | 86,675 | ||||||||
Getty Realty Corp. | 1,700 | 33,711 | ||||||||
Gladstone Commercial Corp. | 7,900 | 129,402 | ||||||||
Gramercy Property Trust REIT | 61 | 515 | ||||||||
InfraREIT, Inc. | 8,000 | 136,400 | ||||||||
Investors Real Estate Trust | 400 | 2,904 | ||||||||
Iron Mountain, Inc. | 300 | 10,173 | ||||||||
Jones Lang LaSalle, Inc. (c) | 3,700 | 434,084 | ||||||||
Kennedy-Wilson Holdings, Inc. (c) | 131,155 | 2,872,295 | ||||||||
Lamar Advertising Co. Class A (c),(d) | 360,046 | 22,142,829 | ||||||||
Monmouth Real Estate Investment Corp. Class A | 200 | 2,378 | ||||||||
Monogram Residential Trust, Inc. | 2,300 | 22,678 | ||||||||
New York REIT, Inc. (c) | 1,034,775 | 10,451,227 | ||||||||
NexPoint Residential Trust, Inc. | 200 | 2,618 | ||||||||
NorthStar Realty Europe Corp. (c) | 69,508 | 806,293 | ||||||||
NorthStar Realty Finance Corp. (c) | 710,989 | 9,328,176 | ||||||||
One Liberty Properties, Inc. | 1,200 | 26,892 | ||||||||
Outfront Media, Inc. | 19,000 | 400,900 | ||||||||
Potlatch Corp. | 700 | 22,050 | ||||||||
Realogy Holdings Corp. (a),(c) | 130,900 | 4,726,799 | ||||||||
Ryman Hospitality Properties, Inc. | 200 | 10,296 | ||||||||
Saul Centers, Inc. | 100 | 5,302 | ||||||||
Silver Bay Realty Trust Corp. | 600 | 8,910 | ||||||||
Taubman Centers, Inc. | 27,200 | 1,937,456 | ||||||||
UDR, Inc. | 1,100 | 42,383 | ||||||||
Urstadt Biddle Properties, Inc. Class A | 1,500 | 31,425 | ||||||||
Winthrop Realty Trust | 13,300 | 174,629 | ||||||||
WP Carey, Inc. | 200 | 12,448 | ||||||||
|
| |||||||||
| 66,291,990 | ||||||||||
|
| |||||||||
See Notes to Consolidated Financial Statements.
103
Blackstone Alternative Multi-Strategy Fund and Subsidiaries
Consolidated Schedule of Investments (Continued)
March 31, 2016
Security Description | Shares | Value | ||||||||
Recreation Facilities & Services — 0.1% | ||||||||||
AMC Entertainment Holdings, Inc. Class A | 100 | $ | 2,799 | |||||||
Cinemark Holdings, Inc. | 5,800 | 207,814 | ||||||||
ClubCorp Holdings, Inc. | 1,000 | 14,040 | ||||||||
International Speedway Corp. Class A | 1,100 | 40,601 | ||||||||
Intrawest Resorts Holdings, Inc. (a) | 2,606 | 22,281 | ||||||||
Live Nation Entertainment, Inc. (a) | 2,600 | 58,006 | ||||||||
Marcus Corp. | 1,600 | 30,320 | ||||||||
Planet Fitness, Inc. Class A (a) | 100 | 1,624 | ||||||||
RCI Hospitality Holdings, Inc. | 200 | 1,772 | ||||||||
Regal Entertainment Group Class A | 13,300 | 281,162 | ||||||||
Six Flags Entertainment Corp. | 43,900 | 2,436,011 | ||||||||
Speedway Motorsports, Inc. | 1,600 | 31,728 | ||||||||
Town Sports International Holdings, Inc. (a) | 900 | 2,583 | ||||||||
|
| |||||||||
| 3,130,741 | ||||||||||
|
| |||||||||
Renewable Energy — 0.2% | ||||||||||
Advanced Energy Industries, Inc. (a) | 1,500 | 52,185 | ||||||||
Ameresco, Inc. Class A (a) | 400 | 1,908 | ||||||||
Broadwind Energy, Inc. (a) | 200 | 602 | ||||||||
First Solar, Inc. (a),(c) | 104,000 | 7,120,880 | ||||||||
Renewable Energy Group, Inc. (a) | 12,800 | 120,832 | ||||||||
|
| |||||||||
| 7,296,407 | ||||||||||
|
| |||||||||
Retail—Consumer Staples — 0.2% | ||||||||||
Chefs’ Warehouse, Inc. (The) (a) | 500 | 10,145 | ||||||||
Dollar Tree, Inc. (a),(b),(c),(d) | 16,210 | 1,336,677 | ||||||||
Rite Aid Corp. (a),(b) | 67,081 | 546,710 | ||||||||
SpartanNash Co. | 1,900 | 57,589 | ||||||||
Sprouts Farmers Market, Inc. (a),(b),(d) | 126,025 | 3,659,766 | ||||||||
SUPERVALU, Inc. (a) | 120,600 | 694,656 | ||||||||
TravelCenters of America LLC (a) | 1,100 | 7,447 | ||||||||
|
| |||||||||
| 6,312,990 | ||||||||||
|
| |||||||||
Retail—Discretionary — 0.9% | ||||||||||
1-800-Flowers.com, Inc. Class A (a) | 1,300 | 10,244 | ||||||||
Amazon.com, Inc. (a),(b) | 2,346 | 1,392,679 | ||||||||
American Eagle Outfitters, Inc. | 11,500 | 191,705 | ||||||||
AutoNation, Inc. (a) | 1,000 | 46,680 | ||||||||
Big 5 Sporting Goods Corp. | 6,600 | 73,326 | ||||||||
BMC Stock Holdings, Inc. (a) | 100 | 1,662 | ||||||||
Chegg, Inc. (a) | 500 | 2,230 | ||||||||
Christopher & Banks Corp. (a) | 100 | 239 | ||||||||
Citi Trends, Inc. (c) | 2,800 | 49,924 | ||||||||
Destination Maternity Corp. | 500 | 3,420 | ||||||||
Destination XL Group, Inc. (a) | 300 | 1,551 | ||||||||
See Notes to Consolidated Financial Statements.
104
Blackstone Alternative Multi-Strategy Fund and Subsidiaries
Consolidated Schedule of Investments (Continued)
March 31, 2016
Security Description | Shares | Value | ||||||||
eBay, Inc. (a) | 11,900 | $ | 283,934 | |||||||
Etsy, Inc. (a) | 400 | 3,480 | ||||||||
EVINE Live, Inc. (a) | 1,800 | 2,106 | ||||||||
Express, Inc. (a) | 49,600 | 1,061,936 | ||||||||
Ezcorp, Inc. Class A (a) | 1,600 | 4,752 | ||||||||
Genesco, Inc. (a) | 100 | 7,225 | ||||||||
GNC Holdings, Inc. Class A | 31,600 | 1,003,300 | ||||||||
Hertz Global Holdings, Inc. (a) | 12,600 | 132,678 | ||||||||
Home Depot, Inc. (c) | 116,300 | 15,517,909 | ||||||||
Kirkland’s, Inc. | 6,500 | 113,815 | ||||||||
L Brands, Inc. | 20,300 | 1,782,543 | ||||||||
Lands’ End, Inc. (a) | 1,000 | 25,510 | ||||||||
Liberty Interactive Corp. Class A (a),(c) | 32,204 | 813,151 | ||||||||
Liquidity Services, Inc. (a) | 2,500 | 12,950 | ||||||||
Lululemon Athletica, Inc. (a),(b),(c),(d) | 16,035 | 1,085,730 | ||||||||
Michaels Cos., Inc. (a) | 7,400 | 206,978 | ||||||||
New York & Co., Inc. (a) | 400 | 1,584 | ||||||||
Office Depot, Inc. (a) | 200 | 1,420 | ||||||||
Restoration Hardware Holdings, Inc. (a) | 5,700 | 238,830 | ||||||||
Sally Beauty Holdings, Inc. (a),(c) | 53,400 | 1,729,092 | ||||||||
Sears Hometown and Outlet Stores, Inc. (a) | 400 | 2,568 | ||||||||
Signet Jewelers Ltd. (b),(d) | 14,900 | 1,848,047 | ||||||||
Staples, Inc. | 47,900 | 528,337 | ||||||||
Stein Mart, Inc. | 6,800 | 49,844 | ||||||||
Tile Shop Holdings, Inc. (a) | 9,700 | 144,627 | ||||||||
Tilly’s, Inc. Class A (a) | 300 | 2,007 | ||||||||
Tuesday Morning Corp. (a) | 400 | 3,272 | ||||||||
Ulta Salon Cosmetics & Fragrance, Inc. (a),(c) | 41,800 | 8,098,332 | ||||||||
United Online, Inc. (a),(c) | 4,200 | 48,468 | ||||||||
Vera Bradley, Inc. (a) | 7,400 | 150,516 | ||||||||
Williams-Sonoma, Inc. | 500 | 27,370 | ||||||||
|
| |||||||||
| 36,705,971 | ||||||||||
|
| |||||||||
Semiconductors — 0.9% | ||||||||||
Alpha & Omega Semiconductor Ltd. (a) | 5,400 | 63,990 | ||||||||
Amkor Technology, Inc. (a) | 29,100 | 171,399 | ||||||||
Analog Devices, Inc. | 17,400 | 1,029,906 | ||||||||
Applied Materials, Inc. (c) | 578,900 | 12,261,102 | ||||||||
Applied Micro Circuits Corp. (a) | 100 | 646 | ||||||||
Axcelis Technologies, Inc. (a) | 11,000 | 30,800 | ||||||||
Cascade Microtech, Inc. (a) | 400 | 8,248 | ||||||||
CEVA, Inc. (a),(c) | 700 | 15,750 | ||||||||
Cohu, Inc. | 5,800 | 68,904 | ||||||||
Cree, Inc. (a),(c) | 38,600 | 1,123,260 | ||||||||
DSP Group, Inc. (a) | 2,900 | 26,448 | ||||||||
Electro Scientific Industries, Inc. (a) | 11,100 | 79,365 | ||||||||
See Notes to Consolidated Financial Statements.
105
Blackstone Alternative Multi-Strategy Fund and Subsidiaries
Consolidated Schedule of Investments (Continued)
March 31, 2016
Security Description | Shares | Value | ||||||||
Exar Corp. (a) | 100 | $ | 575 | |||||||
FormFactor, Inc. (a) | 11,300 | 82,151 | ||||||||
GSI Technology, Inc. (a) | 418 | 1,714 | ||||||||
II-VI, Inc. (a) | 2,900 | 62,959 | ||||||||
Inphi Corp. (a) | 500 | 16,670 | ||||||||
Intel Corp. | 19 | 614 | ||||||||
InvenSense, Inc. (a) | 12,400 | 104,160 | ||||||||
IXYS Corp. | 8,300 | 93,126 | ||||||||
Kemet Corp. (a) | 2,400 | 4,632 | ||||||||
KLA-Tencor Corp. | 100,500 | 7,317,405 | ||||||||
Lam Research Corp. | 86,300 | 7,128,380 | ||||||||
Lattice Semiconductor Corp. (a),(c) | 2,600 | 14,768 | ||||||||
Linear Technology Corp. | 9,400 | 418,864 | ||||||||
Maxim Integrated Products, Inc. | 19,500 | 717,210 | ||||||||
Micron Technology, Inc. (a),(c) | 170,000 | 1,779,900 | ||||||||
Oclaro, Inc. (a) | 22,800 | 123,120 | ||||||||
ON Semiconductor Corp. (a) | 65,100 | 624,309 | ||||||||
Park Electrochemical Corp. | 1,700 | 27,217 | ||||||||
Photronics, Inc. (a),(c) | 20,500 | 213,405 | ||||||||
Qualcomm, Inc. | 101,000 | 5,165,140 | ||||||||
Rudolph Technologies, Inc. (a),(c) | 7,900 | 107,914 | ||||||||
Semtech Corp. (a) | 3,800 | 83,562 | ||||||||
SunEdison Semiconductor Ltd. (a) | 2,500 | 16,200 | ||||||||
Tessera Technologies, Inc. | 4,500 | 139,500 | ||||||||
Ultra Clean Holdings, Inc. (a) | 5,700 | 30,552 | ||||||||
Vishay Intertechnology, Inc. | 2,000 | 24,420 | ||||||||
Xcerra Corp. (a) | 300 | 1,956 | ||||||||
Xilinx, Inc. | 8,600 | 407,898 | ||||||||
|
| |||||||||
| 39,588,139 | ||||||||||
|
| |||||||||
Software — 1.0% | ||||||||||
Activision Blizzard, Inc. | 3,200 | 108,288 | ||||||||
Adobe Systems, Inc. (a) | 3,000 | 281,400 | ||||||||
Agilysys, Inc. (a) | 700 | 7,147 | ||||||||
Akamai Technologies, Inc. (a) | 54,900 | 3,050,793 | ||||||||
Allscripts Healthcare Solutions, Inc. (a) | 300 | 3,963 | ||||||||
Apigee Corp. (a) | 1,400 | 11,634 | ||||||||
Autodesk, Inc. (a),(c) | 82,100 | 4,787,251 | ||||||||
AVG Technologies NV (a) | 900 | 18,675 | ||||||||
Bazaarvoice, Inc. (a) | 14,300 | 45,045 | ||||||||
Box, Inc. Class A (a) | 200 | 2,452 | ||||||||
Brightcove, Inc. (a) | 2,000 | 12,480 | ||||||||
Calix, Inc. (a) | 1,600 | 11,344 | ||||||||
Carbonite, Inc. (a) | 6,500 | 51,805 | ||||||||
ChannelAdvisor Corp. (a) | 1,300 | 14,625 | ||||||||
Citrix Systems, Inc. (a),(c) | 15,800 | 1,241,564 | ||||||||
CommVault Systems, Inc. (a),(b) | 36,270 | 1,565,776 | ||||||||
See Notes to Consolidated Financial Statements.
106
Blackstone Alternative Multi-Strategy Fund and Subsidiaries
Consolidated Schedule of Investments (Continued)
March 31, 2016
Security Description | Shares | Value | ||||||||
Cvent, Inc. (a) | 100 | $ | 2,140 | |||||||
Digi International, Inc. (a) | 5,300 | 49,979 | ||||||||
Electronic Arts, Inc. (a),(b),(c),(d) | 41,855 | 2,767,034 | ||||||||
Five9, Inc. (a) | 1,700 | 15,113 | ||||||||
Fortinet, Inc. (a) | 14,300 | 438,009 | ||||||||
InnerWorkings, Inc. (a) | 300 | 2,385 | ||||||||
Interactive Intelligence Group, Inc. (a) | 300 | 10,926 | ||||||||
Intralinks Holdings, Inc. (a) | 8,900 | 70,132 | ||||||||
KEYW Holding Corp. (The) (a) | 300 | 1,992 | ||||||||
Limelight Networks, Inc. (a) | 14,800 | 26,788 | ||||||||
Lionbridge Technologies, Inc. (a) | 2,500 | 12,650 | ||||||||
LivePerson, Inc. (a) | 200 | 1,170 | ||||||||
Marketo, Inc. (a) | 100 | 1,957 | ||||||||
Mentor Graphics Corp. | 10,500 | 213,465 | ||||||||
Microsoft Corp. | 72,343 | 3,995,504 | ||||||||
MicroStrategy, Inc. Class A (a) | 4,000 | 718,880 | ||||||||
Model N, Inc. (a) | 3,500 | 37,695 | ||||||||
Monotype Imaging Holdings, Inc. | 2,000 | 47,840 | ||||||||
Nuance Communications, Inc. (a) | 40,700 | 760,683 | ||||||||
Paycom Software, Inc. (a),(b),(d) | 49,860 | 1,775,016 | ||||||||
PDF Solutions, Inc. (a) | 1,100 | 14,718 | ||||||||
QAD, Inc. Class A | 2,900 | 61,625 | ||||||||
Rackspace Hosting, Inc. (a) | 139,900 | 3,020,441 | ||||||||
Red Hat, Inc. (a),(b),(c) | 25,125 | 1,872,064 | ||||||||
salesforce.com, Inc. (a),(b),(c),(d) | 20,720 | 1,529,758 | ||||||||
SciQuest, Inc. (a) | 2,200 | 30,536 | ||||||||
Seachange International, Inc. (a) | 1,600 | 8,832 | ||||||||
SS&C Technologies Holdings, Inc. (c) | 30,696 | 1,946,740 | ||||||||
Support.com, Inc. (a) | 1,400 | 1,204 | ||||||||
Symantec Corp. | 18,500 | 340,030 | ||||||||
Tableau Software, Inc. Class A (a) | 400 | 18,348 | ||||||||
Take-Two Interactive Software, Inc. (a) | 23,900 | 900,313 | ||||||||
VASCO Data Security International, Inc. (a) | 500 | 7,700 | ||||||||
VMware, Inc. Class A (a),(c) | 167,000 | 8,735,770 | ||||||||
Web.com Group, Inc. (a) | 900 | 17,838 | ||||||||
Zendesk, Inc. (a) | 10,500 | 219,765 | ||||||||
Zynga, Inc. Class A (a) | 27,000 | 61,560 | ||||||||
|
| |||||||||
| 40,950,842 | ||||||||||
|
| |||||||||
Specialty Finance — 0.3% | ||||||||||
AG Mortgage Investment Trust, Inc. | 13,900 | 181,673 | ||||||||
Aircastle Ltd. | 400 | 8,896 | ||||||||
Altisource Residential Corp. | 300 | 3,600 | ||||||||
American Capital Agency Corp. (c) | 38 | 708 | ||||||||
American Capital Mortgage Investment Corp. | 21,800 | 320,024 | ||||||||
Annaly Capital Management, Inc. | 7,300 | 74,898 | ||||||||
Anworth Mortgage Asset Corp. | 14,300 | 66,638 | ||||||||
See Notes to Consolidated Financial Statements.
107
Blackstone Alternative Multi-Strategy Fund and Subsidiaries
Consolidated Schedule of Investments (Continued)
March 31, 2016
Security Description | Shares | Value | ||||||||
Apollo Commercial Real Estate Finance, Inc. | 14,000 | $ | 228,200 | |||||||
Arbor Realty Trust, Inc. | 9,200 | 62,284 | ||||||||
Blackhawk Network Holdings, Inc. (a) | 400 | 13,720 | ||||||||
Blackstone Mortgage Trust, Inc. Class A | 600 | 16,116 | ||||||||
Capital One Financial Corp. | 36,582 | 2,535,498 | ||||||||
Cherry Hill Mortgage Investment Corp. | 600 | 8,496 | ||||||||
Chimera Investment Corp. | 11,558 | 157,073 | ||||||||
Consumer Portfolio Services, Inc. (a) | 1,400 | 5,922 | ||||||||
CoreLogic, Inc. (a) | 32,100 | 1,113,870 | ||||||||
Dynex Capital, Inc. | 1,400 | 9,310 | ||||||||
Ellie Mae, Inc. (a) | 1,600 | 145,024 | ||||||||
Ellington Residential Mortgage REIT | 3,500 | 41,895 | ||||||||
Enova International, Inc. (a) | 700 | 4,417 | ||||||||
Essent Group Ltd. (a) | 2,800 | 58,240 | ||||||||
Fidelity National Information Services, Inc. (b),(d) | 27,600 | 1,747,356 | ||||||||
First Data Corp. Class A (a) | 1,700 | 21,998 | ||||||||
FNF Group | 1,200 | 40,680 | ||||||||
HFF, Inc. Class A | 1,600 | 44,048 | ||||||||
Higher One Holdings, Inc. (a) | 3,700 | 14,467 | ||||||||
Ladder Capital Corp. | 52 | 647 | ||||||||
Meta Financial Group, Inc. | 1,300 | 59,280 | ||||||||
MFA Financial, Inc. | 46,700 | 319,895 | ||||||||
MGIC Investment Corp. (a) | 180,463 | 1,384,151 | ||||||||
MoneyGram International, Inc. (a) | 700 | 4,284 | ||||||||
Newcastle Investment Corp. | 8,033 | 34,783 | ||||||||
Newtek Business Services Corp. | 1,813 | 22,663 | ||||||||
Nicholas Financial, Inc. (a) | 700 | 7,553 | ||||||||
On Deck Capital, Inc. (a) | 600 | 4,674 | ||||||||
OneMain Holdings, Inc. (a),(c) | 55,662 | 1,526,809 | ||||||||
Regional Management Corp. (a) | 600 | 10,266 | ||||||||
Santander Consumer USA Holdings, Inc. (a) | 62,700 | 657,723 | ||||||||
Square, Inc. (a) | 8,200 | 125,296 | ||||||||
Synchrony Financial (a),(c) | 96,444 | 2,764,085 | ||||||||
Two Harbors Investment Corp. | 62,100 | 493,074 | ||||||||
ZAIS Financial Corp. | 1,900 | 28,348 | ||||||||
|
| |||||||||
| 14,368,582 | ||||||||||
|
| |||||||||
Technology Services — 0.4% | ||||||||||
Black Box Corp. | 4,200 | 56,574 | ||||||||
CDW Corp. | 9,000 | 373,500 | ||||||||
Ciber, Inc. (a) | 3,800 | 8,018 | ||||||||
Cognizant Technology Solutions Corp. Class A (a),(b),(c) | 68,370 | 4,286,799 | ||||||||
CSG Systems International, Inc. | 600 | 27,096 | ||||||||
CSRA, Inc. | 3,200 | 86,080 | ||||||||
Forrester Research, Inc. | 100 | 3,361 | ||||||||
Hewlett Packard Enterprise Co. | 10,700 | 189,711 | ||||||||
See Notes to Consolidated Financial Statements.
108
Blackstone Alternative Multi-Strategy Fund and Subsidiaries
Consolidated Schedule of Investments (Continued)
March 31, 2016
Security Description | Shares | Value | ||||||||
ICF International, Inc. (a) | 200 | $ | 6,874 | |||||||
IHS, Inc. Class A (a) | 600 | 74,496 | ||||||||
Leidos Holdings, Inc. (c) | 19,600 | 986,272 | ||||||||
MarketAxess Holdings, Inc. (b),(d) | 10,000 | 1,248,300 | ||||||||
Markit Ltd. (a) | 600 | 21,210 | ||||||||
MSCI, Inc. (c) | 25,240 | 1,869,779 | ||||||||
Perficient, Inc. (a) | 800 | 17,376 | ||||||||
PFSweb, Inc. (a) | 3,200 | 41,984 | ||||||||
Rightside Group Ltd. (a) | 200 | 1,610 | ||||||||
Sabre Corp. (c) | 187,900 | 5,434,068 | ||||||||
ServiceSource International, Inc. (a) | 600 | 2,556 | ||||||||
Teradata Corp. (a) | 700 | 18,368 | ||||||||
TransUnion (a),(b),(c) | 49,367 | 1,363,023 | ||||||||
Travelport Worldwide Ltd. | 25,500 | 348,330 | ||||||||
|
| |||||||||
| 16,465,385 | ||||||||||
|
| |||||||||
Telecommunications — 0.1% | ||||||||||
8x8, Inc. (a) | 1,700 | 17,102 | ||||||||
Alaska Communications Systems Group, Inc. (a) | 6,200 | 11,036 | ||||||||
Cogent Communications Holdings, Inc. | 11,200 | 437,136 | ||||||||
DigitalGlobe, Inc. (a) | 4,900 | 84,770 | ||||||||
EarthLink Holdings Corp. | 600 | 3,402 | ||||||||
FairPoint Communications, Inc. (a),(c) | 4,500 | 66,960 | ||||||||
General Communication, Inc. Class A (a),(c) | 5,600 | 102,592 | ||||||||
Hawaiian Telcom Holdco, Inc. (a) | 1,200 | 28,260 | ||||||||
IDT Corp. Class B | 7,800 | 121,602 | ||||||||
Inteliquent, Inc. (c) | 6,400 | 102,720 | ||||||||
Internap Network Services Corp. (a) | 3,700 | 10,101 | ||||||||
j2 Global, Inc. (b),(d) | 22,125 | 1,362,457 | ||||||||
Level 3 Communications, Inc. (a) | 20 | 1,057 | ||||||||
Lumos Networks Corp. (a) | 4,200 | 53,928 | ||||||||
Spok Holdings, Inc. | 2,700 | 47,277 | ||||||||
Telephone & Data Systems, Inc. (c) | 8,400 | 252,756 | ||||||||
Vonage Holdings Corp. (a) | 2,800 | 12,796 | ||||||||
West Corp. (c) | 20,700 | 472,374 | ||||||||
Zayo Group Holdings, Inc. (a) | 29,000 | 702,960 | ||||||||
Zix Corp. (a),(c) | 36,700 | 144,231 | ||||||||
|
| |||||||||
| 4,035,517 | ||||||||||
|
| |||||||||
Transportation & Logistics — 0.1% | ||||||||||
Air Transport Services Group, Inc. (a),(c) | 20,300 | 312,214 | ||||||||
ArcBest Corp. | 4,300 | 92,837 | ||||||||
Atlas Air Worldwide Holdings, Inc. (a) | 200 | 8,454 | ||||||||
Celadon Group, Inc. | 600 | 6,288 | ||||||||
Covenant Transportation Group, Inc. Class A (a) | 600 | 14,514 | ||||||||
CSX Corp. | 4,300 | 110,725 | ||||||||
Expeditors International of Washington, Inc. | 3,500 | 170,835 | ||||||||
See Notes to Consolidated Financial Statements.
109
Blackstone Alternative Multi-Strategy Fund and Subsidiaries
Consolidated Schedule of Investments (Continued)
March 31, 2016
Security Description | Shares | Value | ||||||||
Hub Group, Inc. Class A (a) | 6,600 | $ | 269,214 | |||||||
JB Hunt Transport Services, Inc. | 10,700 | 901,368 | ||||||||
Kirby Corp. (a) | 4,800 | 289,392 | ||||||||
Marten Transport Ltd. | 800 | 14,976 | ||||||||
ModusLink Global Solutions, Inc. (a) | 2,500 | 3,675 | ||||||||
Navios Maritime Acquisition Corp. | 9,300 | 14,787 | ||||||||
Roadrunner Transportation Systems, Inc. (a) | 800 | 9,968 | ||||||||
Ryder System, Inc. (c) | 33,400 | 2,163,652 | ||||||||
Saia, Inc. (a) | 4,800 | 135,120 | ||||||||
Swift Transportation Co. (a) | 68,600 | 1,278,018 | ||||||||
USA Truck, Inc. (a) | 700 | 13,188 | ||||||||
Werner Enterprises, Inc. | 400 | 10,864 | ||||||||
YRC Worldwide, Inc. (a) | 6,000 | 55,920 | ||||||||
|
| |||||||||
| 5,876,009 | ||||||||||
|
| |||||||||
Transportation Equipment — 0.3% | ||||||||||
Accuride Corp. (a) | 7,700 | 11,935 | ||||||||
Allison Transmission Holdings, Inc. (c) | 38,800 | 1,046,824 | ||||||||
American Railcar Industries, Inc. | 800 | 32,584 | ||||||||
Commercial Vehicle Group, Inc. (a) | 1,700 | 4,505 | ||||||||
Cummins, Inc. | 119,000 | 13,082,860 | ||||||||
FreightCar America, Inc. | 900 | 14,022 | ||||||||
Greenbrier Cos., Inc. (The) | 4,800 | 132,672 | ||||||||
Spartan Motors, Inc. (c) | 200 | 790 | ||||||||
Trinity Industries, Inc. | 100 | 1,831 | ||||||||
|
| |||||||||
| 14,328,023 | ||||||||||
|
| |||||||||
Utilities — 0.0% | ||||||||||
Cleco Corp. (b) | 5,465 | 301,723 | ||||||||
ITC Holdings Corp. (b) | 22,000 | 958,540 | ||||||||
Middlesex Water Co. | 500 | 15,425 | ||||||||
NRG Yield, Inc. Class C | 200 | 2,848 | ||||||||
Sempra Energy | 1,600 | 166,480 | ||||||||
|
| |||||||||
| 1,445,016 | ||||||||||
|
| |||||||||
Waste & Environmental Services & Equipment — 0.0% |
| |||||||||
Casella Waste Systems, Inc. Class A (a) | 11,300 | 75,710 | ||||||||
Covanta Holding Corp. | 5,700 | 96,102 | ||||||||
Waste Connections, Inc. | 45 | 2,907 | ||||||||
Waste Management, Inc. (c) | 24,500 | 1,445,500 | ||||||||
|
| |||||||||
| 1,620,219 | ||||||||||
|
| |||||||||
Total United States | 1,292,814,280 | |||||||||
|
| |||||||||
TOTAL COMMON STOCK | 1,550,124,985 | |||||||||
|
| |||||||||
See Notes to Consolidated Financial Statements.
110
Blackstone Alternative Multi-Strategy Fund and Subsidiaries
Consolidated Schedule of Investments (Continued)
March 31, 2016
Security Description | Principal Amount | Value | ||||||||
ASSET-BACKED SECURITIES — 8.7% | ||||||||||
Cayman Islands — 3.9% | ||||||||||
ACIS CLO Ltd., Series 2015-6A, Class D, | $ | 2,300,000 | $ | 1,924,180 | ||||||
Adirondack Park CLO Ltd., Series 2013-1A, Class E, 5.27%, 04/15/24 (b),(e),(f) | 373,000 | 286,128 | ||||||||
ALESCO Preferred Funding VII Ltd., Series 7A, | 1,232,283 | 1,010,472 | ||||||||
ALESCO Preferred Funding XIIII Ltd., Series 13A, Class A2, | 996,000 | 478,080 | ||||||||
Allegro CLO I Ltd., Series 2013-1A, Class C, | 4,000,000 | 3,478,000 | ||||||||
Allegro CLO II Ltd., Series 2014-1A, Class C, | 1,900,000 | 1,734,320 | ||||||||
AMMC CDO, Series 2015-16A, Class E, | �� | 600,000 | 463,320 | |||||||
APIDOS CLO, Series 2012-10A, Class E, | 1,000,000 | 880,000 | ||||||||
Ares CLO Ltd., Series 2012-2A, Class E, | 3,621,000 | 3,153,891 | ||||||||
ARES XII CLO Ltd., Series 2007-12A, Class E, | 1,351,071 | 1,285,950 | ||||||||
Ares XXVIII CLO Ltd., Series 2013-3A, Class D, | 650,000 | 563,420 | ||||||||
Atlas Senior Loan Fund II Ltd., Series 2012-2A, Class D, 4.87%, 01/30/24 (b),(e),(f) | 1,726,000 | 1,605,180 | ||||||||
Atlas Senior Loan Fund V Ltd., Series 2014-1A, Class C, 3.62%, 07/16/26 (b),(e),(f) | 1,100,000 | 1,065,240 | ||||||||
Attentus CDO III Ltd., Series 2007-3A, Class A1B, 0.88%, 10/11/42 (b),(e),(f),(g) | 792,317 | 713,085 | ||||||||
Babson CLO Ltd., | ||||||||||
Series 2013-IA, Class D, 4.12%, 04/20/25 (b),(e),(f) | 3,200,000 | 2,795,520 | ||||||||
Series 2015-2A, Class E, 6.17%, 07/20/27 (b),(e),(f) | 650,000 | 548,730 | ||||||||
Benefit Street Partners CLO II Ltd., Series 2013-IIA, Class D, | 2,823,000 | 1,933,755 | ||||||||
BlueMountain CLO Ltd., Series 2014-1A, Class D, | 1,388,000 | 1,221,718 | ||||||||
Bridgeport CLO Ltd., Series 2006-1A, Class C, | 500,000 | 459,750 | ||||||||
Canyon Capital CLO Ltd., Series 2012-1A, Class D, 4.92%, 01/15/24 (b),(e),(f) | 400,000 | 379,520 | ||||||||
See Notes to Consolidated Financial Statements.
111
Blackstone Alternative Multi-Strategy Fund and Subsidiaries
Consolidated Schedule of Investments (Continued)
March 31, 2016
Security Description | Principal Amount | Value | ||||||||
Carlyle Global Market Strategies CLO Ltd., | ||||||||||
Series 2014-2A, Class D, 4.12%, 05/15/25 (b),(e),(f) | $ | 1,900,000 | $ | 1,634,570 | ||||||
Series 2014-3A, Class D1, 5.72%, 07/27/26 (b),(e),(f) | 660,000 | 514,008 | ||||||||
Catamaran CLO Ltd., | ||||||||||
Series 2015-1A, Class D, 4.27%, 04/22/27 (b),(e),(f) | 1,600,000 | 1,389,760 | ||||||||
Series 2015-1A, Class E, 5.77%, 04/22/27 (b),(e),(f) | 600,000 | 467,880 | ||||||||
Cathedral Lake CLO Ltd., Series 2013-1A, Class C, 4.27%, 01/15/26 (b),(e),(f) | 1,000,000 | 883,000 | ||||||||
Cedar Funding III CLO Ltd., Series 2014-3A, Class E, 5.52%, 05/20/26 (b),(e),(f) | 1,600,000 | 1,262,560 | ||||||||
CIFC Funding II Ltd., Series 2013-2A, Class A3L, | 1,000,000 | 954,400 | ||||||||
CIFC Funding III Ltd., | ||||||||||
Series 2012-3A, Class A3L, 3.62%, 01/29/25 (b),(e),(f) | 1,000,000 | 976,400 | ||||||||
Series 2014-3A, Class E, 5.37%, 07/22/26 (b),(e),(f) | 1,500,000 | 1,112,850 | ||||||||
Series 2015-3A, Class E, 6.67%, 10/19/27 (b),(e),(f) | 800,000 | 662,160 | ||||||||
CIFC Funding IV Ltd., Series 2015-4A, Class D, | 1,000,000 | 791,300 | ||||||||
CIFC Funding Ltd., | ||||||||||
Series 2012-2A, Class B2R, 6.39%, 12/05/24 (b),(e),(f) | 2,544,000 | 2,168,251 | ||||||||
Series 2013-1A, Class D, 5.86%, 04/16/25 (b),(e),(f) | 2,709,000 | 2,174,243 | ||||||||
Series 2014-4A, Class D, 4.02%, 10/17/26 (b),(e),(f) | 1,200,000 | 1,031,160 | ||||||||
Series 2015-1A, Class D, 4.62%, 01/22/27 (b),(e),(f) | 800,000 | 721,840 | ||||||||
ColumbusNova CLO IV Ltd., Series 2007-2A, Class D, 5.12%, 10/15/21 (b),(e),(f) | 250,000 | 244,025 | ||||||||
Crown Point CLO Ltd., Series 2012-1A, Class B1L, 5.62%, 11/21/22 (b),(e),(f) | 1,800,000 | 1,678,680 | ||||||||
Cutwater Ltd., |
| |||||||||
Series 2014-1A, Class C, 4.32%, 07/15/26 (b),(e),(f) | 1,512,000 | 1,165,298 | ||||||||
Series 2015-1A, Class D1, 4.52%, 07/15/27 (b),(e),(f) | 4,500,000 | 3,721,500 | ||||||||
Series 2015-1A, Class E, 6.62%, 07/15/27 (b),(e),(f) | 733,000 | 528,713 | ||||||||
See Notes to Consolidated Financial Statements.
112
Blackstone Alternative Multi-Strategy Fund and Subsidiaries
Consolidated Schedule of Investments (Continued)
March 31, 2016
Security Description | Principal Amount | Value | ||||||||
Diamond Head Aviation, Series 2015-1, Class B, | $ | 4,249,036 | $ | 4,158,956 | ||||||
Dryden Senior Loan Fund, Series 2014-36A, Class D, 4.37%, 11/09/25 (b),(e),(f) | 3,150,000 | 2,786,490 | ||||||||
Duane Street CLO, Series 2007-5X, Class B, REG S, 8.37%, 10/14/21 (b),(f) | 467,000 | 463,311 | ||||||||
Eastland CLO Ltd., Series 2007-1A, Class C, | 400,000 | 333,280 | ||||||||
Flagship CLO VIII Ltd., Series 2014-8A, Class D, | 789,000 | 597,036 | ||||||||
Fore CLO Ltd., Series 2007-1A, Class D, | 1,332,899 | 1,253,192 | ||||||||
Galaxy XIV CLO Ltd., | ||||||||||
Series 2012-14A, Class D, 5.02%, 11/15/24 (b),(e),(f) | 1,400,000 | 1,304,520 | ||||||||
Series 2012-14A, Class E, 6.02%, 11/15/24 (b),(e),(f) | 4,057,000 | 3,383,944 | ||||||||
Golub Capital Partners CLO Ltd., | ||||||||||
Series 2011-10AR, Class DR, 4.17%, 10/20/21 (b),(e),(f) | 250,000 | 237,800 | ||||||||
Series 2015-22A, Class C, 4.77%, 02/20/27 (b),(e),(f) | 1,200,000 | 1,089,840 | ||||||||
Halcyon Loan Advisors Funding Ltd., Series 2014-2A, Class C, | 1,800,000 | 1,392,480 | ||||||||
Halcyon Loan Investors CLO I, Inc., Series 2006-1A, Class D, | 500,000 | 428,000 | ||||||||
Harbourview CDO III Ltd., Series 3A, Class A, | 5,236,116 | 4,699,415 | ||||||||
ING IM CLO Ltd., | ||||||||||
Series 2013-1A, Class C, | 1,900,000 | 1,654,900 | ||||||||
Series 2013-2A, Class C, 4.12%, 04/25/25 (b),(e),(f) | 658,000 | 559,168 | ||||||||
Series 2013-2A, Class D, 5.62%, 04/25/25 (b),(e),(f) | 600,000 | 469,140 | ||||||||
Jamestown Ltd., | ||||||||||
Series 2015-7A, Class C, 4.37%, 07/25/27 (b),(e),(f) | 2,300,000 | 2,037,800 | ||||||||
Series 2015-7A, Class D, 6.12%, 07/25/27 (b),(e),(f) | 1,100,000 | 787,160 | ||||||||
Kingsland VI Ltd., Series 2013-6A, Class D, | 900,000 | 783,090 | ||||||||
KKR Financial CLO Ltd., Series 2012-1A, Class C, 5.13%, 12/15/24 (b),(e),(f) | 3,500,000 | 3,341,100 | ||||||||
See Notes to Consolidated Financial Statements.
113
Blackstone Alternative Multi-Strategy Fund and Subsidiaries
Consolidated Schedule of Investments (Continued)
March 31, 2016
Security Description | Principal Amount | Value | ||||||||
Kodiak CDO Ltd., | ||||||||||
Series 2006-1A, Class A1, | $ | 5,351,016 | $ | 4,976,445 | ||||||
Series 2006-1A, Class A2, 1.10%, 08/07/37 (b),(e),(f),(g) | 1,250,000 | 837,500 | ||||||||
LCM Ltd. Partnership, Series 9A, Class E, | 4,890,000 | 4,755,036 | ||||||||
LCM XI LP, Series 11A, Class D2, | 2,130,000 | 1,994,745 | ||||||||
Madison Park Funding X Ltd., Series 2012-10A, Class E, 5.87%, 01/20/25 (b),(e),(f) | 1,900,000 | 1,648,250 | ||||||||
Madison Park Funding XIV Ltd., Series 2014-14A, Class E, | 3,400,000 | 2,701,980 | ||||||||
Madison Park Funding XVI Ltd., | ||||||||||
Series 2015-16A, Class B, 3.62%, 04/20/26 (b),(e),(f) | 3,000,000 | 2,965,800 | ||||||||
Series 2015-16A, Class C, 4.32%, 04/20/26 (b),(e),(f) | 600,000 | 541,980 | ||||||||
Magnetite XV Ltd., Series 2015-15A, Class E, | 950,000 | 885,780 | ||||||||
MidOcean Credit CLO III, | ||||||||||
Series 2014-3A, Class D, 4.37%, 07/21/26 (b),(e),(f) | 982,000 | 843,636 | ||||||||
Series 2014-3A, Class E, 5.87%, 07/21/26 (b),(e),(f) | 346,000 | 260,538 | ||||||||
Muir Grove CLO Ltd., Series 2007-1A, Class E, | 769,091 | 733,790 | ||||||||
Nelder Grove CLO Ltd., Series 2014-1A, Class D1, 5.16%, 08/28/26 (b),(e),(f) | 1,800,000 | 1,625,760 | ||||||||
Ocean Trails CLO IV, Series 2013-4A, Class D, | 300,000 | 266,400 | ||||||||
Ocean Trails CLO V, | ||||||||||
Series 2014-5A, Class D, 4.58%, 10/13/26 (b),(e),(f) | 1,800,000 | 1,569,060 | ||||||||
Series 2014-5A, Class E, 5.97%, 10/13/26 (b),(e),(f) | 800,000 | 574,640 | ||||||||
Octagon Investment Partners X Ltd., Series 2006-10A, Class D, | 500,000 | 467,950 | ||||||||
Octagon Investment Partners XII Ltd., Series 2012-1AR, Class DR, 4.08%, 05/05/23 (b),(e),(f) | 1,400,000 | 1,315,020 | ||||||||
Octagon Investment Partners XIV Ltd., Series 2012-1A, Class C, 4.62%, 01/15/24 (b),(e),(f) | 250,000 | 226,225 | ||||||||
See Notes to Consolidated Financial Statements.
114
Blackstone Alternative Multi-Strategy Fund and Subsidiaries
Consolidated Schedule of Investments (Continued)
March 31, 2016
Security Description | Principal Amount | Value | ||||||||
Octagon Investment Partners XVII Ltd., Series 2013-1A, Class E, | $ | 800,000 | $ | 567,120 | ||||||
Octagon Investment Partners XX Ltd., Series 2014-1A, Class E, | 600,000 | 423,420 | ||||||||
Octagon Investment Partners XXI Ltd., Series 2014-1A, Class D, | 1,100,000 | 851,180 | ||||||||
Octagon Investment Partners XXII Ltd., Series 2014-1A, Class E1, 5.87%, 11/25/25 (b),(e),(f) | 900,000 | 734,850 | ||||||||
OHA Loan Funding Ltd., Series 2013-1A, Class E, | 1,012,000 | 814,761 | ||||||||
OZLM Funding IV Ltd., | ||||||||||
Series 2013-4A, Class C, 3.82%, 07/22/25 (b),(e),(f) | 800,000 | 699,120 | ||||||||
Series 2013-4A, Class D, 5.27%, 07/22/25 (b),(e),(f) | 900,000 | 679,770 | ||||||||
OZLM Funding V Ltd., Series 2013-5A, Class D, | 2,050,000 | 1,691,865 | ||||||||
OZLM Ltd., Series 2015-13A, Class D, | 1,100,000 | 865,040 | ||||||||
OZLM VII Ltd., Series 2014-7A, Class C, | 1,500,000 | 1,304,250 | ||||||||
OZLM VIII Ltd., Series 2014-8A, Class B, | 3,000,000 | 2,902,800 | ||||||||
OZLM XI Ltd., Series 2015-11A, Class D, | 800,000 | 648,480 | ||||||||
Preferred Term Securities X Ltd. / Preferred Term Securities X, Inc., | 232,184 | 197,357 | ||||||||
Preferred Term Securities XIX Ltd/Preferred Term Securities XIX, Inc., | 586,644 | 310,921 | ||||||||
Preferred Term Securities XVIII Ltd. / Preferred Term Securities XVIII, Inc., | 198,952 | 107,434 | ||||||||
Preferred Term Securities XXIV Ltd. / Preferred Term Securities XXIV, Inc., | 936,986 | 651,206 | ||||||||
Preferred Term Securities XXIV Ltd/Preferred Term Securities XXIV, Inc., | 968,152 | 493,757 | ||||||||
Preferred Term Securities XXV Ltd/Preferred Term Securities XXV, Inc., | 276,341 | 146,461 | ||||||||
See Notes to Consolidated Financial Statements.
115
Blackstone Alternative Multi-Strategy Fund and Subsidiaries
Consolidated Schedule of Investments (Continued)
March 31, 2016
Security Description | Principal Amount | Value | ||||||||
Preferred Term Securities XXVI Ltd/Preferred Term Securities XXVI, Inc., | $ | 268,701 | $ | 139,725 | ||||||
Sound Point CLO I Ltd., |
| |||||||||
Series 2012-1A, Class D, 5.20%, 10/20/23 (b),(e),(f) | 900,000 | 877,050 | ||||||||
Series 2012-1A, Class E, 6.62%, 10/20/23 (b),(e),(f) | 300,000 | 271,350 | ||||||||
Sound Point CLO IX Ltd., |
| |||||||||
Series 2015-2A, Class D, 4.17%, 07/20/27 (b),(e),(f) | 1,700,000 | 1,508,240 | ||||||||
Series 2015-2A, Class E, 6.12%, 07/20/27 (b),(e),(f) | 1,100,000 | 873,180 | ||||||||
Sound Point CLO V Ltd., Series 2014-1A, Class D, 4.02%, 04/18/26 (b),(e),(f) | 1,200,000 | 1,050,480 | ||||||||
Stone Tower CLO VI Ltd., Series 2007-6A, Class D, 4.22%, 04/17/21 (b),(e),(f) | 7,189,000 | 6,507,483 | ||||||||
Symphony CLO IV Ltd., Series 2007-4A, Class E, | 739,000 | 716,461 | ||||||||
Symphony CLO IX Ltd., Series 2012-9A, Class D, | 2,775,000 | 2,682,870 | ||||||||
Symphony CLO XI Ltd., Series 2013-11A, Class D, 4.62%, 01/17/25 (b),(e),(f) | 2,100,000 | 1,960,980 | ||||||||
Symphony CLO XII Ltd., Series 2013-12A, Class D, 4.12%, 10/15/25 (b),(e),(f) | 250,000 | 218,750 | ||||||||
Taberna Preferred Funding VII Ltd., Series 2006-7A, Class A1LA, | 236,976 | 201,430 | ||||||||
Trapeza CDO XII Ltd., Series 2007-12A, Class A2, 0.96%, 04/06/42 (b),(e),(f),(g) | 375,000 | 180,000 | ||||||||
Trapeza CDO XIII Ltd., Series 2007-13A, Class A2A, | 431,000 | 211,190 | ||||||||
Venture CDO Ltd., |
| |||||||||
Series 2007-13A, Class A3, 1.05%, 11/09/42 (b),(e),(f),(g) | 270,000 | 126,900 | ||||||||
Series 2013-15A, Class C, 3.72%, 07/15/25 (b),(e),(f) | 5,700,000 | 5,491,950 | ||||||||
Series 2014-16A, Class B1L, 4.07%, 04/15/26 (b),(e),(f) | 5,800,000 | 4,639,420 | ||||||||
Venture X CLO Ltd., Series 2012-10A, Class D, 4.82%, 07/20/22 (b),(e),(f) | 500,000 | 446,900 | ||||||||
Venture XIII CLO Ltd., Series 2013-13A, Class D, | 5,000,000 | 4,414,000 | ||||||||
Venture XIV CLO Ltd., Series 2013-14A, Class D, | 1,775,000 | 1,461,003 | ||||||||
See Notes to Consolidated Financial Statements.
116
Blackstone Alternative Multi-Strategy Fund and Subsidiaries
Consolidated Schedule of Investments (Continued)
March 31, 2016
Security Description | Principal Amount | Value | ||||||||
Venture XIX CLO Ltd., Series 2014-19A, Class D, | $ | 2,500,000 | $ | 2,234,750 | ||||||
Vibrant CLO Ltd., Series 2015-3A, Class C, | 1,082,000 | 933,982 | ||||||||
Voya CLO 2 Ltd., Series 2014-2A, Class D, | 700,000 | 484,050 | ||||||||
WhiteHorse Ltd., Series 2014-1A, Class D, | 2,912,100 | 2,180,289 | ||||||||
|
| |||||||||
Total Cayman Islands |
| 164,916,239 | ||||||||
|
| |||||||||
Ireland — 0.0% | ||||||||||
Trade Maps Ltd., Series 2013-1A, Class D, | 2,000,000 | 1,982,800 | ||||||||
|
| |||||||||
Total Ireland |
| 1,982,800 | ||||||||
|
| |||||||||
United States — 4.8% | ||||||||||
AmeriCredit Automobile Receivables, Series 2016-1, Class D, 3.59%, 02/08/22 (b) | 1,400,000 | 1,397,060 | ||||||||
AMPLIT Trust, |
| |||||||||
Series 2015-A, Class B, 6.75%, 09/15/21 (b),(e) | 1,207,000 | 1,193,119 | ||||||||
Series 2015-A, Class C, 8.75%, 09/15/21 (b),(e),(g) | 915,000 | 907,497 | ||||||||
Series 2015-A SEQ, Class A, 5.00%, 09/15/21 (b),(e) | 3,482,261 | 3,446,742 | ||||||||
Apollo Aviation Securitization, Series 2016-1A, Class B, 6.50%, 03/17/36 (b),(e),(f) | 4,572,000 | 4,479,188 | ||||||||
Ascentium Equipment Receivables LLC, |
| |||||||||
Series 2015-1A, Class E, 5.92%, 06/12/23 (b),(e),(g) | 758,000 | 747,994 | ||||||||
Series 2015-2A, Class E, 6.52%, 10/12/21 (b),(e),(g) | 1,299,000 | 1,282,113 | ||||||||
Associates Manufactured Housing Pass-Through Certificates, Series 1997-2, Class B1, 7.15%, 03/15/28 (b),(f),(g) | 279,422 | 323,711 | ||||||||
AVANT Loans Funding Trust, Series 2016-A, Class B, 7.65%, 06/15/20 (b),(e) | 1,262,000 | 1,261,874 | ||||||||
Bayview Opportunity Master Fund Trust, |
| |||||||||
Series 2012-4NR3, Class A, 3.72%, 02/28/35 (b),(e),(f) | 3,409,673 | 3,400,126 | ||||||||
Series 2014-16RP, Class A, 3.84%, 11/28/29 (b),(e),(f) | 3,757,621 | 3,759,875 | ||||||||
Bear Stearns Asset-Backed Securities Trust, Series 2007-2, Class A2, | 3,701,153 | 3,433,559 | ||||||||
See Notes to Consolidated Financial Statements.
117
Blackstone Alternative Multi-Strategy Fund and Subsidiaries
Consolidated Schedule of Investments (Continued)
March 31, 2016
Security Description | Principal Amount | Value | ||||||||
Capital Auto Receivables Asset, Series 2016-1, Class D, 4.03%, 08/21/23 (b) | $ | 2,800,000 | $ | 2,820,720 | ||||||
Carlyle Global Market Strategies CLO Ltd., | ||||||||||
Series 2014-1A, Class D, 4.07%, 04/17/25 (b),(e),(f) | 1,700,000 | 1,500,590 | ||||||||
Series 2015-3A, Class D, 6.32%, 07/28/28 (b),(e),(f) | 1,100,000 | 924,990 | ||||||||
Chrysler Capital Auto Receivables Trust, Series 2015-BA, Class D, 4.17%, 01/16/23 (b),(e) | 5,300,000 | 5,267,670 | ||||||||
Conn Funding II LP, Series 2016-A, Class B, | 813,000 | 813,000 | ||||||||
Conseco Financial Corp., Series 1998-4 SEQ, Class A5, 6.18%, 04/01/30 (b) | 397,703 | 414,367 | ||||||||
Countrywide Home Equity Loan Trust, | ||||||||||
Series 2004-I, Class A, 0.73%, 02/15/34 (b),(f) | 1,084,174 | 976,733 | ||||||||
Series 2004-P, Class 2A, 0.76%, 03/15/34 (b),(f) | 24,183 | 20,892 | ||||||||
Series 2006-G, Class 2A, 0.59%, 10/15/36 (b),(f) | 253,932 | 214,725 | ||||||||
CPS Auto Receivables Trust, | ||||||||||
Series 2014-B, Class D, 4.62%, 05/15/20 (b),(e) | 156,000 | 148,574 | ||||||||
Series 2014-C, Class D, 4.83%, 08/17/20 (b),(e) | 391,000 | 368,283 | ||||||||
Credit Suisse Mortgage Trust, | ||||||||||
Series 2015-RPL2, Class A1A, 3.75%, 11/25/57 (b),(e),(f) | 6,614,756 | 6,502,966 | ||||||||
Series 2015-RPL3, Class A1, 3.75%, 12/25/56 (b),(e),(f),(h) | 6,763,921 | 6,666,521 | ||||||||
Series 2015-RPL5, Class A1, 3.51%, 11/26/55 (b),(e),(f) | 35,264,517 | 34,411,116 | ||||||||
Drive Auto Receivables Trust, | ||||||||||
Series 2015-AA, Class D, 4.12%, 07/15/22 (b),(e) | 5,300,000 | 5,221,030 | ||||||||
Series 2015-DA, Class C, 3.38%, 11/15/21 (b),(e) | 5,375,000 | 5,357,262 | ||||||||
Series 2015-DA, Class D, 4.59%, 01/17/23 (b),(e) | 2,500,000 | 2,453,000 | ||||||||
DT Auto Owner Trust, | ||||||||||
Series 2014-3A, Class D, 4.47%, 11/15/21 (b),(e) | 600,000 | 593,280 | ||||||||
Series 2015-1A, Class D, 4.26%, 02/15/22 (b),(e) | 1,000,000 | 989,200 | ||||||||
Education Funding LLC, Series 2006-1A, Class A2, 0.87%, 10/25/29 (b),(e),(f) | 5,898,195 | 5,465,268 | ||||||||
See Notes to Consolidated Financial Statements.
118
Blackstone Alternative Multi-Strategy Fund and Subsidiaries
Consolidated Schedule of Investments (Continued)
March 31, 2016
Security Description | Principal Amount | Value | ||||||||
Exeter Automobile Receivables Trust, | ||||||||||
Series 2013-1A, Class C, 3.52%, 02/15/19 (b),(e) | $ | 2,700,000 | $ | 2,683,530 | ||||||
Series 2013-1A, Class D, 5.05%, 10/15/19 (b),(e) | 3,300,000 | 3,239,610 | ||||||||
Series 2013-2A, Class D, 6.81%, 08/17/20 (b),(e) | 2,200,000 | 2,211,000 | ||||||||
Series 2014-1A, Class D, 5.53%, 02/16/21 (b),(e) | 4,300,000 | 4,235,930 | ||||||||
Series 2014-2A, Class D, 4.93%, 12/15/20 (b),(e) | 2,700,000 | 2,630,340 | ||||||||
Series 2014-3A, Class C, 4.17%, 06/15/20 (b),(e) | 1,900,000 | 1,870,170 | ||||||||
Series 2014-3A, Class D, 5.69%, 04/15/21 (b),(e) | 3,000,000 | 2,939,400 | ||||||||
FFCA Secured Lending Corp., Series 1999-2, Class WA1C, | 920,595 | 925,383 | ||||||||
Flagship Credit Auto Trust, Series 2015-2, Class C, 4.08%, 12/15/21 (b),(e) | 1,800,000 | 1,706,040 | ||||||||
GE Business Loan Trust, Series 2005-1A, Class C, | 33,997 | 30,308 | ||||||||
HOA Funding LLC, Series 2015-1A, Class A2, | 2,255,665 | 2,036,189 | ||||||||
InCaps Funding II Ltd. / InCaps Funding II Corp., | 1,416,825 | 1,331,815 | ||||||||
Mid-State Trust XI, Series 11, Class B, 8.22%, 07/15/38 (b) | 33,326 | 35,742 | ||||||||
Morgan Stanley ABS Capital I, Inc. Trust, Series 2006-HE3, Class A2C, | 486,869 | 479,761 | ||||||||
Nationstar HECM Loan Trust, | ||||||||||
Series 2015-2A, Class M2, 6.66%, 11/25/25 (b),(e) | 3,253,000 | 3,253,000 | ||||||||
Series 2016-1A, Class M2, 7.39%, 02/25/26 (b),(e) | 2,509,000 | 2,509,000 | ||||||||
Nationstar Home Equity Loan Trust, Series 2007-C, Class 2AV2, | 947,477 | 924,169 | ||||||||
NCT Funding Ltd., Series 2013-6A, Class IMM2, | 573,000 | 550,080 | ||||||||
OneMain Financial Issuance Trust, Series 2015-2A SEQ, Class A, | 1,200,000 | 1,185,000 | ||||||||
Pinnacle Park CLO Ltd., Series 2014-1A, Class C, | 800,000 | 796,000 | ||||||||
See Notes to Consolidated Financial Statements.
119
Blackstone Alternative Multi-Strategy Fund and Subsidiaries
Consolidated Schedule of Investments (Continued)
March 31, 2016
Security Description | Principal Amount | Value | ||||||||
Preferred Term Securities XVII Ltd. / Preferred Term Securities XVII, Inc., 1.14%, 06/23/35 (b),(e),(f),(g) | $ | 211,000 | $ | 109,720 | ||||||
Pretium Mortgage Credit Partners LLC, Series 2016-NPL1 SEQ, Class A1, | 8,271,000 | 8,285,061 | ||||||||
RMAT LLC, Series 2015-RPL1, Class A1, | 3,140,446 | 3,104,958 | ||||||||
SLM Private Credit Student Loan Trust, | ||||||||||
Series 2004-A, Class C, 1.58%, 06/15/33 (b),(f) | 2,833,789 | 2,607,086 | ||||||||
Series 2004-B, Class C, 1.50%, 09/15/33 (b),(f) | 2,396,232 | 2,214,358 | ||||||||
Series 2005-B, Class C, 1.33%, 06/15/39 (b),(f) | 2,826,907 | 2,610,366 | ||||||||
Soundview Home Loan Trust, Series 2007-OPT3, Class 2A2, | 812,117 | 792,463 | ||||||||
Stone Tower CLO Ltd., Series 2006-5A, Class D, | 1,000,000 | 960,700 | ||||||||
US Residential Opportunity Fund Trust, Series 2015-1III, Class A, | 2,477,936 | 2,456,378 | ||||||||
Vericrest Opportunity Loan Trust, | ||||||||||
Series 2015-NP12, Class A1, 3.88%, 09/25/45 (b),(e),(f) | 5,186,740 | 5,131,761 | ||||||||
Series 2015-NPL4, Class A1, 3.50%, 02/25/55 (b),(e),(f) | 1,786,299 | 1,768,615 | ||||||||
Series 2015-NPL9, Class A1, 3.50%, 06/26/45 (b),(e),(f),(h) | 9,600,877 | 9,511,589 | ||||||||
Vericrest Opportunity Loan XXXI LLC, Series 2015-NPL2, Class A1, | 1,562,399 | 1,535,214 | ||||||||
VOLT XXXVI LLC, Series 2015-NP10, Class A1, | 21,070,627 | 20,908,384 | ||||||||
Westgate Resorts LLC, Series 2014-1A, Class C, | 2,361,140 | 2,341,070 | ||||||||
|
| |||||||||
Total United States | 206,673,235 | |||||||||
|
| |||||||||
TOTAL ASSET-BACKED SECURITIES | 373,572,274 | |||||||||
|
| |||||||||
BANK LOANS — 0.1% | ||||||||||
Luxembourg — 0.0% | ||||||||||
Aerospace & Defense — 0.0% | ||||||||||
Silver II US Holdings LLC, 1.00%, 12/13/19 (b),(f),(g) | 135,029 | 117,475 | ||||||||
|
| |||||||||
Total Luxembourg | 117,475 | |||||||||
|
| |||||||||
See Notes to Consolidated Financial Statements.
120
Blackstone Alternative Multi-Strategy Fund and Subsidiaries
Consolidated Schedule of Investments (Continued)
March 31, 2016
Security Description | Principal Amount | Value | ||||||||
Netherlands — 0.0% | ||||||||||
Exploration & Production — 0.0% | ||||||||||
Endeavour International Holding BV, | $ | 1,243,399 | $ | 130,557 | ||||||
|
| |||||||||
Total Netherlands | 130,557 | |||||||||
|
| |||||||||
United Kingdom — 0.0% | ||||||||||
Transportation & Logistics — 0.0% | ||||||||||
Ceva Group PLC, 1.00%, 03/19/21 (b),(f),(g) | 48,595 | 39,929 | ||||||||
Ceva Intercompany BV, 1.00%, 03/19/21 (b),(f),(g) | 50,236 | 41,277 | ||||||||
Ceva Logistics Canada, 1.00%, 03/19/21 (b),(f),(g) | 8,661 | 7,117 | ||||||||
Ceva Logistics U.S. Holdings, 1.00%, 03/19/21 (b),(f),(g) | 69,292 | 56,935 | ||||||||
|
| |||||||||
Total United Kingdom | 145,258 | |||||||||
|
| |||||||||
United States — 0.1% | ||||||||||
Advertising & Marketing — 0.0% | ||||||||||
Affinion Group, Inc., 1.50%, 04/30/18 (b),(f),(g) | 103,633 | 91,641 | ||||||||
|
| |||||||||
Manufactured Goods — 0.0% | ||||||||||
WireCo WorldGroup, Inc., 1.25%, 02/15/17 (b),(f),(g) | 51,823 | 50,873 | ||||||||
|
| |||||||||
Pharmaceuticals — 0.0% | ||||||||||
Valeant Pharmaceuticals International, Inc., | 72,189 | 68,183 | ||||||||
|
| |||||||||
Pipeline — 0.0% | ||||||||||
NGPL PipeCo LLC, 1.25%, 09/15/17 (b),(f),(g) | 513,227 | 493,555 | ||||||||
|
| |||||||||
Publishing & Broadcasting — 0.0% | ||||||||||
LBI Media, Inc., 1.00%, 03/31/18 (b),(f),(g) | 98,280 | 98,280 | ||||||||
|
| |||||||||
Transportation & Logistics — 0.0% | ||||||||||
OSG Bulk Ships, Inc., 1.00%, 08/05/19 (b),(f),(g) | 257,488 | 231,739 | ||||||||
|
| |||||||||
Wireless Telecommunication Services — 0.1% | ||||||||||
New Lightsquared LLC, 1.00%, 06/15/20 (b),(f),(g) | 1,632,805 | 1,439,595 | ||||||||
|
| |||||||||
Total United States | 2,473,866 | |||||||||
|
| |||||||||
TOTAL BANK LOANS | 2,867,156 | |||||||||
|
| |||||||||
See Notes to Consolidated Financial Statements.
121
Blackstone Alternative Multi-Strategy Fund and Subsidiaries
Consolidated Schedule of Investments (Continued)
March 31, 2016
Security Description | Principal Amount | Value | ||||||||
CONVERTIBLE BOND — 0.3% | ||||||||||
Spain — 0.3% | ||||||||||
Wireless Telecommunication Services — 0.3% | ||||||||||
Telefonica Participacion Co. REG S, | 12,900,000 | EUR | $ | 13,184,595 | ||||||
|
| |||||||||
TOTAL CONVERTIBLE BOND | 13,184,595 | |||||||||
|
| |||||||||
CORPORATE BONDS & NOTES — 5.3% | ||||||||||
Brazil — 0.4% | ||||||||||
Integrated Oils — 0.4% | ||||||||||
Petrobras Global Finance BV, | ||||||||||
4.88%, 03/17/20 | $ | 9,108,000 | 7,579,678 | |||||||
6.85%, 06/05/15 | 12,151,000 | 8,350,167 | ||||||||
|
| |||||||||
Total Brazil | 15,929,845 | |||||||||
|
| |||||||||
Canada — 0.0% | ||||||||||
Aerospace & Defense — 0.0% | ||||||||||
Bombardier, Inc., 7.50%, 03/15/25 (b),(e) | 1,850,000 | 1,424,500 | ||||||||
|
| |||||||||
Electrical Equipment Manufacturing — 0.0% | ||||||||||
NCSG Crane & Heavy Haul Services, Inc., 9.50%, 08/15/19 (b),(e) | 574,000 | 195,160 | ||||||||
|
| |||||||||
Publishing & Broadcasting — 0.0% | ||||||||||
Postmedia Network, Inc., 12.50%, 07/15/18 (b),(c) | 943,000 | 103,730 | ||||||||
|
| |||||||||
Total Canada | 1,723,390 | |||||||||
|
| |||||||||
Ecuador — 0.1% | ||||||||||
Refining & Marketing — 0.1% | ||||||||||
EP PetroEcuador via Noble Sovereign Funding I Ltd. REG S, | 5,442,316 | 4,721,209 | ||||||||
|
| |||||||||
Total Ecuador | 4,721,209 | |||||||||
|
| |||||||||
France — 0.4% | ||||||||||
Oil & Gas Services & Equipment — 0.1% | ||||||||||
CGG SA, | ||||||||||
6.50%, 06/01/21 (b) | 7,400,000 | 2,997,000 | ||||||||
6.88%, 01/15/22 (b) | 2,600,000 | 1,014,000 | ||||||||
|
| |||||||||
| 4,011,000 | ||||||||||
|
| |||||||||
Property & Casualty Insurance — 0.1% | ||||||||||
Groupama SA REG S, 6.38% (b),(f),(j) | 4,700,000 | EUR | 4,840,057 | |||||||
|
| |||||||||
See Notes to Consolidated Financial Statements.
122
Blackstone Alternative Multi-Strategy Fund and Subsidiaries
Consolidated Schedule of Investments (Continued)
March 31, 2016
Security Description | Principal Amount | Value | ||||||||
Publishing & Broadcasting — 0.2% | ||||||||||
PagesJaunes Finance & Co. SCA REG S, 8.88%, 06/01/18 (b) | 15,506,000 | EUR | $ | 9,545,552 | ||||||
|
| |||||||||
Total France | 18,396,609 | |||||||||
|
| |||||||||
Germany — 0.1% | ||||||||||
Banks — 0.1% | ||||||||||
HSH Nordbank AG REG S, | ||||||||||
MTN, 0.62%, 02/14/17 (b),(f) | 1,680,000 | EUR | 1,738,187 | |||||||
MTN, 0.66%, 02/14/17 (b),(f) | 1,117,000 | EUR | 1,156,641 | |||||||
|
| |||||||||
Total Germany | 2,894,828 | |||||||||
|
| |||||||||
Ireland — 0.1% | ||||||||||
Banks — 0.1% | ||||||||||
UT2 Funding PLC, 5.32%, 06/30/16 (b) | 4,645,000 | EUR | 5,318,579 | |||||||
|
| |||||||||
Total Ireland | 5,318,579 | |||||||||
|
| |||||||||
Mexico — 0.1% | ||||||||||
Exploration & Production — 0.1% | ||||||||||
Petroleos Mexicanos, | ||||||||||
4.25%, 01/15/25 | $ | 2,129,000 | 1,971,986 | |||||||
6.88%, 08/04/26 | 1,655,000 | 1,791,538 | ||||||||
|
| |||||||||
Total Mexico | 3,763,524 | |||||||||
|
| |||||||||
New Zealand — 0.0% | ||||||||||
Containers & Packaging — 0.0% | ||||||||||
Beverage Packaging Holdings Luxembourg II SA / Beverage Packaging Holdings II Is, 5.63%, 12/15/16 (b),(d),(e) | 631,000 | 629,028 | ||||||||
|
| |||||||||
Total New Zealand | 629,028 | |||||||||
|
| |||||||||
Poland — 0.1% | ||||||||||
Food & Beverage — 0.1% | ||||||||||
CEDC Finance Corp. International, Inc., 10.00%, 04/30/18 (b),(f),(k) | 4,153,752 | 3,239,927 | ||||||||
|
| |||||||||
Total Poland | 3,239,927 | |||||||||
|
| |||||||||
Sweden — 0.1% | ||||||||||
Chemicals — 0.1% | ||||||||||
Perstorp Holding AB, | ||||||||||
8.75%, 05/15/17 (b),(e) | 847,000 | 844,882 | ||||||||
11.00%, 08/15/17 (b),(e) | 2,200,000 | 2,057,000 | ||||||||
|
| |||||||||
Total Sweden | 2,901,882 | |||||||||
|
| |||||||||
See Notes to Consolidated Financial Statements.
123
Blackstone Alternative Multi-Strategy Fund and Subsidiaries
Consolidated Schedule of Investments (Continued)
March 31, 2016
Security Description | Principal Amount | Value | ||||||||
United Kingdom — 0.2% | ||||||||||
Transportation & Logistics — 0.2% | ||||||||||
Algeco Scotsman Global Finance PLC, | ||||||||||
8.50%, 10/15/18 (b),(e) | $ | 5,419,000 | $ | 4,172,630 | ||||||
9.00%, 10/15/18 (b) | 200,000 | EUR | 170,230 | |||||||
10.75%, 10/15/19 (b),(e) | $ | 141,000 | 41,947 | |||||||
CEVA Group PLC, 4.00%, 05/01/18 (b),(e) | 6,111,796 | 5,256,145 | ||||||||
|
| |||||||||
Total United Kingdom | 9,640,952 | |||||||||
|
| |||||||||
United States — 3.6% | ||||||||||
Cable & Satellite — 0.1% | ||||||||||
Cequel Communications Holdings I LLC / Cequel Capital Corp., 6.38%, 09/15/20 (b),(c),(d),(e) | 2,219,000 | 2,196,810 | ||||||||
|
| |||||||||
Casinos & Gaming — 0.3% | ||||||||||
Caesars Entertainment Operating Co., Inc., | ||||||||||
10.00%, 12/15/18 (a),(b),(i) | 3,632,577 | 1,489,356 | ||||||||
10.75%, 02/01/16 (a),(b),(i) | 7,000 | 3,325 | ||||||||
Downstream Development Authority of the Quapaw Tribe of Oklahoma, 10.50%, 07/01/19 (b),(e) | 5,952,000 | 5,684,160 | ||||||||
Golden Nugget Escrow, Inc., 8.50%, 12/01/21 (b),(c),(e) | 4,726,000 | 4,726,000 | ||||||||
International Game Technology PLC, | 3,319,000 | 3,285,810 | ||||||||
|
| |||||||||
| 15,188,651 | ||||||||||
|
| |||||||||
Commercial Finance — 0.1% | ||||||||||
NewStar Financial, Inc., 7.25%, 05/01/20 (b) | 2,763,000 | 2,486,700 | ||||||||
|
| |||||||||
Consumer Finance — 0.1% | ||||||||||
DFC Finance Corp., 10.50%, 06/15/20 (b),(e) | 7,070,000 | 4,524,800 | ||||||||
|
| |||||||||
Consumer Services — 0.0% | ||||||||||
Constellis Holdings LLC / Constellis Finance Corp., 9.75%, 05/15/20 (b),(e) | 26,000 | 22,620 | ||||||||
|
| |||||||||
Electrical Equipment Manufacturing — 0.0% | ||||||||||
Dispensing Dynamics International, 12.50%, 01/01/18 (b),(e) | 7,000 | 6,248 | ||||||||
|
| |||||||||
Entertainment Resources — 0.1% | ||||||||||
Mohegan Tribal Gaming Authority, 9.75%, 09/01/21 (b),(d) | 1,560,000 | 1,599,000 | ||||||||
Production Resource Group, Inc., 8.88%, 05/01/19 (b),(g) | 2,064,000 | 1,424,160 | ||||||||
|
| |||||||||
| 3,023,160 | ||||||||||
|
| |||||||||
See Notes to Consolidated Financial Statements.
124
Blackstone Alternative Multi-Strategy Fund and Subsidiaries
Consolidated Schedule of Investments (Continued)
March 31, 2016
Security Description | Principal Amount | Value | ||||||||
Financial Services — 0.4% | ||||||||||
MF Global Holdings Ltd., | ||||||||||
1.88%, 02/01/16 (a),(b),(g),(i) | $ | 18,687,000 | $ | 4,298,010 | ||||||
3.38%, 08/01/18 (a),(b),(i),(g) | 4,776,000 | 1,098,480 | ||||||||
6.25%, 08/08/16 (a),(b),(g),(i) | 4,026,000 | 925,980 | ||||||||
ROC Finance LLC / ROC Finance 1 Corp., 12.13%, 09/01/18 (b),(c),(e) | 9,847,000 | 10,203,954 | ||||||||
|
| |||||||||
| 16,526,424 | ||||||||||
|
| |||||||||
Forest & Paper Products Manufacturing — 0.0% | ||||||||||
Resolute Forest Products, Inc., 5.88%, 05/15/23 (b) | 726,000 | 490,050 | ||||||||
|
| |||||||||
Hardware — 0.3% | ||||||||||
Everi Payments, Inc., 10.00%, 01/15/22 (b),(c),(d) | 8,704,000 | 7,354,880 | ||||||||
Real Alloy Holding, Inc., 10.00%, 01/15/19 (b),(d),(e) | 3,549,000 | 3,549,000 | ||||||||
|
| |||||||||
| 10,903,880 | ||||||||||
|
| |||||||||
Health Care Facilities & Services — 0.5% | ||||||||||
IASIS Healthcare LLC / IASIS Capital Corp., 8.38%, 05/15/19 (b) | 1,432,000 | 1,412,310 | ||||||||
inVentiv Health, Inc., | ||||||||||
10.00%, 08/15/18 (b),(c) | 6,956,000 | 6,880,770 | ||||||||
PIK, 10.00%, 08/15/18 (b),(e) | 2,670,596 | 2,697,302 | ||||||||
Kindred Healthcare, Inc., 8.75%, 01/15/23 (b) | 3,555,000 | 3,395,025 | ||||||||
Tenet Healthcare Corp., 8.13%, 04/01/22 (b) | 2,265,000 | 2,323,686 | ||||||||
Universal Hospital Services, Inc., 7.63%, 08/15/20 (b),(c),(d) | 6,386,000 | 5,907,050 | ||||||||
|
| |||||||||
| 22,616,143 | ||||||||||
|
| |||||||||
Industrial Other — 0.0% | ||||||||||
Michael Baker International LLC / CDL Acquisition Co., Inc., 8.25%, 10/15/18 (b),(e) | 14,000 | 12,040 | ||||||||
|
| |||||||||
Managed Care — 0.0% | ||||||||||
Opal Acquisition, Inc., 8.88%, 12/15/21 (b),(e) | 1,497,000 | 1,044,158 | ||||||||
|
| |||||||||
Manufactured Goods — 0.0% | ||||||||||
Wise Metals Group LLC / Wise Alloys Finance Corp., 8.75%, 12/15/18 (b),(e) | 1,469,000 | 1,292,720 | ||||||||
|
| |||||||||
Medical Equipment & Devices Manufacturing — 0.0% |
| |||||||||
Immucor, Inc., 11.13%, 08/15/19 (b) | 532,000 | 489,440 | ||||||||
|
| |||||||||
See Notes to Consolidated Financial Statements.
125
Blackstone Alternative Multi-Strategy Fund and Subsidiaries
Consolidated Schedule of Investments (Continued)
March 31, 2016
Security Description | Principal Amount | Value | ||||||||
Metals & Mining — 0.1% | ||||||||||
AK Steel Corp., 7.625%, 05/15/20 - 10/01/21 (b),(c) | $ | 5,569,000 | $ | 3,286,640 | ||||||
Aleris International, Inc., | ||||||||||
7.63%, 02/15/18 (b) | 1,502,000 | 1,532,040 | ||||||||
7.88%, 11/01/20 (b) | 67,000 | 56,615 | ||||||||
Aleris International, Inc., 9.50%, 04/01/21 (b),(e) | 285,000 | 290,522 | ||||||||
Allegheny Technologies, Inc., 9.38%, 06/01/19 (b) | 255,000 | 242,250 | ||||||||
|
| |||||||||
| 5,408,067 | ||||||||||
|
| |||||||||
Pharmaceuticals — 0.0% | ||||||||||
Valeant Pharmaceuticals International, Inc., | ||||||||||
6.13%, 04/15/25 (b),(e) | 72,000 | 55,440 | ||||||||
6.38%, 10/15/20 (b),(e) | 260,000 | 215,800 | ||||||||
6.75%, 08/15/18 (b),(e) | 441,000 | 400,207 | ||||||||
7.00%, 10/01/20 (b),(e) | 129,000 | 108,360 | ||||||||
7.25%, 07/15/22 (b),(e) | 127,000 | 101,600 | ||||||||
7.50%, 07/15/21 (b),(e) | 141,000 | 117,470 | ||||||||
|
| |||||||||
| 998,877 | ||||||||||
|
| |||||||||
Pipeline — 0.1% | ||||||||||
Kinder Morgan, Inc., MTN, 8.05%, 10/15/30 (b) | 1,819,000 | 1,951,969 | ||||||||
NGPL PipeCo LLC, | ||||||||||
7.12%, 12/15/17 (b),(e) | 1,004,000 | 970,115 | ||||||||
9.63%, 06/01/19 (b),(e) | 930,000 | 911,400 | ||||||||
|
| |||||||||
| 3,833,484 | ||||||||||
|
| |||||||||
Publishing & Broadcasting — 0.9% | ||||||||||
American Media, Inc., | ||||||||||
7.00%, 07/15/20 (b),(e) | 13,589,139 | 12,502,008 | ||||||||
11.50%, 12/15/17 (b) | 331,000 | 340,103 | ||||||||
iHeartCommunications, Inc., 9.00%, 03/01/21 (b) | 425,000 | 295,906 | ||||||||
LBI Media, Inc., | ||||||||||
10.00%, 04/15/19 (b),(e) | 4,102,000 | 3,917,410 | ||||||||
13.50%, 04/15/20 (b),(e) | 4,064,631 | 3,780,107 | ||||||||
Lee Enterprises, Inc., 9.50%, 03/15/22 (b),(c),(d),(e) | 5,960,000 | 5,863,150 | ||||||||
McClatchy Co., 9.00%, 12/15/22 (b) | 4,908,000 | 4,573,642 | ||||||||
Time, Inc., 5.75%, 04/15/22 (b),(d),(e) | 6,835,000 | 6,066,062 | ||||||||
|
| |||||||||
| 37,338,388 | ||||||||||
|
| |||||||||
Retail—Consumer Discretionary — 0.3% | ||||||||||
Claire’s Stores, Inc., | ||||||||||
6.13%, 03/15/20 (b),(e) | 471,000 | 294,375 | ||||||||
9.00%, 03/15/19 (b),(e) | 1,505,000 | 1,072,313 | ||||||||
See Notes to Consolidated Financial Statements.
126
Blackstone Alternative Multi-Strategy Fund and Subsidiaries
Consolidated Schedule of Investments (Continued)
March 31, 2016
Security Description | Principal Amount | Value | ||||||||
DriveTime Automotive Group, Inc. / DT Acceptance Corp., 8.00%, 06/01/21 (b),(e) | $ | 11,055,000 | $ | 9,562,575 | ||||||
GameStop Corp., 6.75%, 03/15/21 (b),(d),(e) | 1,884,000 | 1,822,770 | ||||||||
|
| |||||||||
| 12,752,033 | ||||||||||
|
| |||||||||
Software & Services — 0.2% | ||||||||||
iPayment, Inc., 9.50%, 12/15/19 (b),(c),(e) | 7,769,793 | 8,100,009 | ||||||||
|
| |||||||||
Transportation & Logistics — 0.0% | ||||||||||
Overseas Shipholding Group, Inc., 8.13%, 03/30/18 (b) | 240,000 | 237,900 | ||||||||
|
| |||||||||
Wireline Telecommunication Services — 0.1% | ||||||||||
Frontier Communications Corp., | ||||||||||
9.00%, 08/15/31 (b),(c),(d) | 2,515,000 | 2,144,037 | ||||||||
11.00%, 09/15/25 (b),(e) | 1,775,000 | 1,783,875 | ||||||||
Level 3 Financing, Inc., 5.25%, 03/15/26 (b),(e) | 253,000 | 254,898 | ||||||||
|
| |||||||||
| 4,182,810 | ||||||||||
|
| |||||||||
Total United States | 153,675,412 | |||||||||
|
| |||||||||
Venezuela — 0.1% | ||||||||||
Integrated Oils — 0.1% | ||||||||||
Petroleos de Venezuela SA REG S, 6.00%, 11/15/26 | 14,754,000 | 4,551,609 | ||||||||
|
| |||||||||
Total Venezuela | 4,551,609 | |||||||||
|
| |||||||||
TOTAL CORPORATE BONDS & NOTES | 227,386,794 | |||||||||
|
| |||||||||
MORTGAGE-BACKED SECURITIES — 20.5% | ||||||||||
Cayman Islands — 0.9% | ||||||||||
Collateralized Debt Obligation (Commercial) — 0.7% |
| |||||||||
Arbor Realty Collateralized Loan Obligation Ltd., | ||||||||||
Series 2014-1A, Class B, | 250,000 | 228,875 | ||||||||
Series 2015-FL1A, Class B, | 639,000 | 570,308 | ||||||||
Gramercy Real Estate CDO Ltd., | ||||||||||
Series 2005-1A, Class D, 1.42%, 07/25/35 (b),(e),(f) | 2,000,000 | 1,890,000 | ||||||||
Series 2005-1A, Class E, 1.52%, 07/25/35 (b),(e),(f) | 2,440,000 | 2,273,104 | ||||||||
Series 2006-1A, Class D, 1.18%, 07/25/41 (b),(e),(f) | 1,100,000 | 1,006,500 | ||||||||
Series 2006-1A, Class E, 1.32%, 07/25/41 (b),(e),(f) | 4,248,000 | 3,759,480 | ||||||||
Series 2007-1A, Class A1, 0.90%, 08/15/56 (b),(e),(f) | 1,876,222 | 1,660,456 | ||||||||
See Notes to Consolidated Financial Statements.
127
Blackstone Alternative Multi-Strategy Fund and Subsidiaries
Consolidated Schedule of Investments (Continued)
March 31, 2016
Security Description | Principal Amount | Value | ||||||||
Marathon Real Estate CDO Ltd., Series 2006-1A, Class B, | $ | 2,040,337 | $ | 1,946,073 | ||||||
N-Star Real Estate CDO VI Ltd., Series 2006-6A, Class B, | 3,718,000 | 2,714,140 | ||||||||
RAIT Preferred Funding II Ltd., Series 2007-2A, Class A2, | 2,284,000 | 1,982,740 | ||||||||
Resource Capital Corp. Ltd., Series 2015-CRE3, Class D, | 1,500,000 | 1,372,500 | ||||||||
SRERS Funding Ltd., Series 2011-RS, Class A1B1, 0.69%, 05/09/46 (b),(e),(f) | 10,926,609 | 10,380,278 | ||||||||
|
| |||||||||
| 29,784,454 | ||||||||||
|
| |||||||||
Commercial Mortgage-Backed Securities — 0.2% | ||||||||||
ACRE Commercial Mortgage Trust, Series 2014-FL2, Class D, 3.84%, 08/15/31 (b),(e),(f) | 2,200,000 | 2,113,100 | ||||||||
PFP III Ltd., | ||||||||||
Series 2014-1, Class D, 4.54%, 06/14/31 (b),(e),(f) | 1,000,000 | 947,000 | ||||||||
Series 2015-2, Class D, 4.44%, 07/14/34 (b),(e),(f) | 2,250,000 | 2,089,575 | ||||||||
Series 2015-2, Class E, 5.04%, 07/14/34 (b),(e),(f) | 2,400,000 | 2,199,840 | ||||||||
|
| |||||||||
| 7,349,515 | ||||||||||
|
| |||||||||
Total Cayman Islands | 37,133,969 | |||||||||
|
| |||||||||
United States — 19.6% | ||||||||||
Collateralized Debt Obligation (Commercial) — 0.0% |
| |||||||||
NCT VI Funding Ltd., Series 2013-6A, Class IMM1, 0.68%, 04/25/40 (b),(e),(f) | 305,617 | 302,561 | ||||||||
|
| |||||||||
Collateralized Mortgage Obligation (Residential) — 9.0% |
| |||||||||
Banc of America Funding Corp., Series 2007-B, Class A1, 0.64%, 04/20/47 (b),(f) | 2,864,974 | 2,173,942 | ||||||||
Bellemeade Re Ltd., Series 2015-1A, Class M2, | 6,214,000 | 6,085,370 | ||||||||
Chase Mortgage Finance Trust, Series 2007-A2, Class 3A2, 2.82%, 07/25/37 (b),(f) | 253,078 | 238,374 | ||||||||
CHL Mortgage Pass-Through Trust, Series 2005-HYB3, Class 3A2, | 2,977,237 | 2,872,438 | ||||||||
Citicorp Mortgage Securities Trust, Series 2006-3, Class 1A10, | 616,118 | 614,147 | ||||||||
Citigroup Mortgage Loan Trust, Inc., Series 2005-3, Class 2A2, | 3,223,253 | 3,020,188 | ||||||||
See Notes to Consolidated Financial Statements.
128
Blackstone Alternative Multi-Strategy Fund and Subsidiaries
Consolidated Schedule of Investments (Continued)
March 31, 2016
Security Description | Principal Amount | Value | ||||||||
Connecticut Avenue Securities, | ||||||||||
Series 2014-C01, Class M2, 4.83%, 01/25/24 (b),(f),(h) | $ | 6,254,577 | $ | 6,237,690 | ||||||
Series 2014-C02, Class 2M2, 3.03%, 05/25/24 (b),(f) | 5,577,000 | 5,036,589 | ||||||||
Series 2014-C02, Class 1M2, | 18,536,501 | 16,473,388 | ||||||||
Series 2014-C03, Class 2M2, | 9,722,522 | 8,904,858 | ||||||||
Series 2014-C03, Class 1M2, | 3,375,184 | 3,094,706 | ||||||||
Series 2014-C04, Class 1M2, | 3,803,000 | 3,831,523 | ||||||||
Series 2014-C04, Class 2M2, | 4,895,492 | 4,974,309 | ||||||||
Series 2015-C01, Class 1M2, | 13,999,910 | 13,999,910 | ||||||||
Series 2015-C01, Class 2M2, | 13,399,257 | 13,553,348 | ||||||||
Series 2015-C02, Class 1M2, | 28,639,250 | 27,722,794 | ||||||||
Series 2015-C02, Class 2M2, | 15,534,000 | 15,072,640 | ||||||||
Series 2015-C03, Class 1M2, | 4,541,000 | 4,541,000 | ||||||||
Series 2015-C03, Class 2M2, | 7,283,000 | 7,323,785 | ||||||||
Series 2015-C04, Class 2M2, | 9,664,000 | 9,746,144 | ||||||||
Series 2015-C04, Class 1M2, | 7,759,000 | 7,852,884 | ||||||||
Series 2016-C01, Class 1M2, | 12,291,000 | 13,273,051 | ||||||||
Series 2016-C01, Class 2M2, | 15,363,000 | 16,618,157 | ||||||||
Series 2016-C02, Class 1M2, | 24,303,000 | 24,947,029 | ||||||||
Countrywide Alternative Loan Trust, | ||||||||||
Series 2005-21CB, Class A17, 6.00%, 06/25/35 (b) | 1,425,398 | 1,376,222 | ||||||||
Series 2005-J2, Class 1A5, 0.93%, 04/25/35 (b),(f) | 495,710 | 426,905 | ||||||||
Countrywide Asset-Backed Certificates, | ||||||||||
Series 2005-15, Class 1AF6, 4.38%, 04/25/36 (b),(f) | 101,816 | 103,262 | ||||||||
See Notes to Consolidated Financial Statements.
129
Blackstone Alternative Multi-Strategy Fund and Subsidiaries
Consolidated Schedule of Investments (Continued)
March 31, 2016
Security Description | Principal Amount | Value | ||||||||
Series 2006-BC4, Class 2A2, | $ | 534,311 | $ | 509,572 | ||||||
Federal Home Loan Mortgage Corp., Series 2015-SC02, Class M3, | 866,000 | 596,328 | ||||||||
Federal National Mortgage Association, | 30,050,000 | 31,447,325 | ||||||||
First Horizon Alternative Mortgage Securities Trust, Series 2005-AA9, Class 3A1, 2.43%, 11/25/35 (b),(f) | 3,356,144 | 2,814,798 | ||||||||
Invitation Homes Trust, Series 2015-SFR3, Class D, 3.19%, 08/17/32 (b),(e),(f) | 4,100,000 | 3,887,620 | ||||||||
JP Morgan Alternative Loan Trust, Series 2005-A2, Class 1A1, | 766,852 | 711,178 | ||||||||
Structured Adjustable Rate Mortgage Loan Trust, Series 2006-4, Class 6A, | 1,870,495 | 1,530,626 | ||||||||
Structured Agency Credit Risk, | ||||||||||
Series 2013-DN2, Class M2, | 23,777,000 | 23,489,298 | ||||||||
Series 2014-DN1, Class M3, | 2,013,142 | 2,000,459 | ||||||||
Series 2014-DN2, Class M3, 4.03%, 04/25/24 (b),(f) | 3,772,000 | 3,546,812 | ||||||||
Series 2014-DN4, Class M3, 4.98%, 10/25/24 (b),(f) | 2,423,624 | 2,384,361 | ||||||||
Series 2014-HQ2, Class M3, 4.18%, 09/25/24 (b),(f) | 1,743,835 | 1,614,966 | ||||||||
Series 2014-HQ3, Class M3, 5.18%, 10/25/24 (b),(f) | 783,000 | 787,620 | ||||||||
Series 2015-DN1, Class M3, | 4,938,785 | 4,965,948 | ||||||||
Series 2015-DNA1, Class M3, | 8,641,869 | 8,177,801 | ||||||||
Series 2015-DNA2, Class M2, | 5,000,000 | 4,991,500 | ||||||||
Series 2015-DNA3, Class M3, | 5,300,088 | 5,144,795 | ||||||||
Series 2015-HQ1, Class M3, 4.23%, 03/25/25 (b),(f) | 1,503,958 | 1,433,272 | ||||||||
Series 2015-HQA1, Class M3, | 4,242,000 | 4,073,593 | ||||||||
Series 2015-HQA1, Class B, | 5,400,000 | 4,422,060 | ||||||||
See Notes to Consolidated Financial Statements.
130
Blackstone Alternative Multi-Strategy Fund and Subsidiaries
Consolidated Schedule of Investments (Continued)
March 31, 2016
Security Description | Principal Amount | Value | ||||||||
Series 2015-HQA2, Class M3, | $ | 5,130,000 | $ | 4,941,729 | ||||||
Series 2016-DNA1, Class M3, | 35,921,000 | 36,265,842 | ||||||||
Tricon American Homes Trust, Series 2015-SFR1, Class D, | 4,297,000 | 3,981,171 | ||||||||
WaMu Mortgage Pass-Through Certificates Trust, | ||||||||||
Series 2006-AR12, Class 1A2, | 2,856,747 | 2,539,933 | ||||||||
Series 2006-AR17, Class 1A, | 5,318,873 | 4,043,408 | ||||||||
Series 2006-AR18, Class 1A1, | 2,806,096 | 2,375,922 | ||||||||
Series 2007-HY6, Class 2A3, | 2,382,200 | 2,125,637 | ||||||||
Wells Fargo Mortgage-Backed Securities Trust, Series 2007-14, Class 1A1, | 495,857 | 481,477 | ||||||||
|
| |||||||||
| 385,399,704 | ||||||||||
|
| |||||||||
Commercial Mortgage-Backed Securities — 9.9% | ||||||||||
BAMLL Commercial Mortgage Securities Trust, | ||||||||||
Series 2013-DSNY, Class F, | 1,000,000 | 959,800 | ||||||||
Series 2014-ICTS, Class E, | 3,150,000 | 2,934,225 | ||||||||
Series 2014-INLD, Class D, | 1,500,000 | 1,459,650 | ||||||||
BAMLL Mezzanine Securities Trust, Series 2015-ASMB, Class MZB, 9.36%, 01/09/17 (b),(e),(f),(g) | 19,075,000 | 18,712,575 | ||||||||
Banc of America Commercial Mortgage Trust, | ||||||||||
Series 2006-6, Class B, 5.48%, 10/10/45 (b) | 3,935,000 | 3,812,228 | ||||||||
Series 2007-2, Class AJ, 5.62%, 04/10/49 (f),(h) | 2,406,779 | 2,191,372 | ||||||||
Banc of America Merrill Lynch, | ||||||||||
Series 2013-FRR1, Class A1, | 662,000 | 474,588 | ||||||||
Series 2013-FRR1, Class A2, | 935,000 | 682,924 | ||||||||
Banc of America Merrill Lynch, | 34,800,000 | 34,800,000 | ||||||||
Barclays Commercial Mortgage, Series 2015-RRI, Class F, | 4,989,000 | 4,683,174 | ||||||||
See Notes to Consolidated Financial Statements.
131
Blackstone Alternative Multi-Strategy Fund and Subsidiaries
Consolidated Schedule of Investments (Continued)
March 31, 2016
Security Description | Principal Amount | Value | ||||||||
BBCMS Trust, | ||||||||||
Series 2014-BXO, Class D, | $ | 4,320,000 | $ | 4,090,176 | ||||||
Series 2014-BXO, Class E, | 1,000,000 | 957,300 | ||||||||
Series 2015-RRMZ, Class M1, | 4,700,000 | 4,136,000 | ||||||||
Bear Stearns Commercial Mortgage Securities Trust, | ||||||||||
Series 2005-PW10, Class AJ, | 11,920,714 | 11,626,272 | ||||||||
Series 2006-PW14, Class B, 5.33%, 12/11/38 (b),(e) | 879,000 | 773,520 | ||||||||
Series 2006-PW14 SEQ, Class AJ, 5.27%, 12/11/38 (b) | 1,826,000 | 1,752,412 | ||||||||
Series 2006-T24, Class AJ, 5.60%, 10/12/41 (f) | 3,818,441 | 3,666,085 | ||||||||
Series 2007-PW15, Class AM, 5.36%, 02/11/44 (h) | 3,958,091 | 3,950,175 | ||||||||
Series 2007-PW15, Class AMFX, | 4,556,930 | 4,547,816 | ||||||||
Boca Hotel Portfolio Trust, Series 2013-BOCA, Class E, 4.19%, 08/15/26 (b),(e),(f) | 950,000 | 929,955 | ||||||||
CD Commercial Mortgage Trust, | 3,432,713 | 2,797,661 | ||||||||
CDGJ Commercial Mortgage Trust, | ||||||||||
Series 2014-BXCH, Class DPB, | 5,046,442 | 4,833,483 | ||||||||
Series 2014-BXCH, Class EPA, | 2,800,000 | 2,682,680 | ||||||||
CFCRE Commercial Mortgage Trust, | 33,288,517 | 302,926 | ||||||||
CGBAM Commercial Mortgage Trust, | 900,000 | 845,550 | ||||||||
Citigroup Commercial Mortgage Trust, | ||||||||||
Series 2006-C5, Class AJ, 5.48%, 10/15/49 (h) | 4,834,790 | 4,327,137 | ||||||||
Series 2015-GC29, Class D, | 1,395,000 | 880,524 | ||||||||
Series 2015-GC31, Class D, 4.06%, 06/10/48 (b),(f) | 1,850,000 | 1,251,895 | ||||||||
Series 2015-P1, Class D, 3.23%, 09/15/48 (b),(e) | 1,193,000 | 811,837 | ||||||||
See Notes to Consolidated Financial Statements.
132
Blackstone Alternative Multi-Strategy Fund and Subsidiaries
Consolidated Schedule of Investments (Continued)
March 31, 2016
Security Description | Principal Amount | Value | ||||||||
Citigroup Mortgage Loan Trust, Inc., | $ | 650,000 | $ | 599,040 | ||||||
COBALT CMBS Commercial Mortgage Trust, | ||||||||||
Series 2006-C1, Class AM SEQ, | 7,356,480 | 7,323,376 | ||||||||
Series 2007-C3, Class C, 5.76%, 05/15/46 (b),(f) | 32,000 | 26,720 | ||||||||
Commercial Mortgage Loan Trust, | 1,554,393 | 1,275,069 | ||||||||
Commercial Mortgage Trust, | ||||||||||
Series 2006-C7, Class AJ, 5.87%, 06/10/46 (f) | 7,168,485 | 6,473,859 | ||||||||
Series 2007-C9, Class G, 5.81%, 12/10/49 (b),(e),(f) | 2,400,000 | 2,307,600 | ||||||||
Series 2014-PAT, Class E, | 1,800,000 | 1,726,740 | ||||||||
Series 2014-TWC, Class E, | 2,300,000 | 2,182,930 | ||||||||
Series 2015-CR23, Class D, 4.26%, 05/10/48 (b),(f) | 1,745,000 | 1,244,185 | ||||||||
Series 2015-CR26, Class C, 4.50%, 10/10/48 (b),(f) | 4,525,000 | 4,036,300 | ||||||||
Credit Suisse Commercial Mortgage Trust, | ||||||||||
Series 2007-C1, Class AMFX, 5.42%, 02/15/40 (h) | 1,897,865 | 1,911,909 | ||||||||
Series 2007-C1, Class AM, 5.42%, 02/15/40 (b),(h) | 17,337,024 | 17,097,773 | ||||||||
Series 2007-C2, Class AJ, | 12,840,254 | 12,471,739 | ||||||||
Series 2007-C5, Class AM, | 718,641 | 690,255 | ||||||||
Series 2007-C5, Class A1AM, | 686,943 | 660,015 | ||||||||
Series 2015-SAND, Class E, | 2,400,000 | 2,295,840 | ||||||||
Credit Suisse Mortgage Trust, | ||||||||||
Series 2006-C4, Class AJ, 5.54%, 09/15/39 (f),(h) | 8,716,796 | 8,414,323 | ||||||||
Series 2007-C1, Class AMFL, | 32,000 | 29,949 | ||||||||
Series 2007-C2, Class C, | 883,000 | 813,066 | ||||||||
Series 2015-DEAL, Class D, | 3,025,000 | 2,918,520 | ||||||||
See Notes to Consolidated Financial Statements.
133
Blackstone Alternative Multi-Strategy Fund and Subsidiaries
Consolidated Schedule of Investments (Continued)
March 31, 2016
Security Description | Principal Amount | Value | ||||||||
Series 2015-DEAL, Class E, | $ | 2,900,000 | $ | 2,710,920 | ||||||
CSAIL Commercial Mortgage Trust, | ||||||||||
Series 2015-C2, Class D, 4.21%, 06/15/57 (b),(f) | 1,282,000 | 927,142 | ||||||||
Series 2015-C3, Class D, 3.36%, 08/15/48 (b),(f) | 732,000 | 508,154 | ||||||||
FHLMC Multi-Family Structured, | ||||||||||
Series K011, Class X3, 2.58%, 12/25/43 (b),(f) | 11,453,000 | 1,151,027 | ||||||||
Series K043, Class X3, 1.64%, 02/25/43 (b),(f) | 6,874,000 | 653,030 | ||||||||
Great Wolf Trust, | ||||||||||
Series 2015-WOLF, Class D, | 3,758,000 | 3,529,514 | ||||||||
Series 2015-WOLF, Class E, | 1,889,000 | 1,752,803 | ||||||||
Series 2015-WOLF, Class F, | 3,141,000 | 2,858,310 | ||||||||
GS Mortgage Securities Trust, | ||||||||||
Series 2005-GG4, Class D, 4.94%, 07/10/39 (b),(f) | 194,512 | 184,300 | ||||||||
Series 2007-GG10, Class AM, | 9,068,221 | 8,768,970 | ||||||||
Series 2015-GC32, Class C, | 1,205,000 | 1,099,924 | ||||||||
Hilton Mortgage Trust, Series 2014-ORL, Class F, | 2,467,268 | 2,173,663 | ||||||||
Hilton USA Trust, | ||||||||||
Series 2013-HLF, Class EFL, | 1,858,764 | 1,836,088 | ||||||||
Series 2013-HLT, Class DFX, | 800,000 | 800,880 | ||||||||
Series 2013-HLT, Class EFX, | 3,550,000 | 3,550,000 | ||||||||
Series 2014-ORL, Class E, | 280,000 | 255,724 | ||||||||
Hyatt Hotel Portfolio Trust, Series 2014-HYMZ, Class M, | 3,990,000 | 3,711,498 | ||||||||
JP Morgan Chase Commercial Mortgage Securities Trust, | ||||||||||
Series 2005-CB13, Class AJ, | 4,519,983 | 4,285,847 | ||||||||
Series 2006-CB14, Class AJ, | 776,859 | 738,016 | ||||||||
See Notes to Consolidated Financial Statements.
134
Blackstone Alternative Multi-Strategy Fund and Subsidiaries
Consolidated Schedule of Investments (Continued)
March 31, 2016
Security Description | Principal Amount | Value | ||||||||
Series 2006-CB15, Class AM, | $ | 2,169,945 | $ | 2,168,860 | ||||||
Series 2007-CB20, Class AJ, | 8,387,271 | 8,170,879 | ||||||||
Series 2007-LD11, Class AM, | 13,707,175 | 13,672,907 | ||||||||
Series 2014-BXH, Class E, | 1,630,000 | 1,575,721 | ||||||||
Series 2014-C20, Class D, | 5,325,000 | 4,078,418 | ||||||||
Series 2014-CBM, Class E, | 7,100,000 | 6,609,390 | ||||||||
Series 2014-FL5, Class D, | 5,625,000 | 5,358,375 | ||||||||
Series 2014-INMZ, Class M, | 8,990,000 | 8,431,721 | ||||||||
Series 2014-INN, Class E, | 8,195,000 | 7,635,281 | ||||||||
Series 2015-CSMO, Class E, | 6,000,000 | 5,741,400 | ||||||||
Series 2015-CSMO, Class D, | 10,400,000 | 10,103,600 | ||||||||
JPMBB Commercial Mortgage Securities Trust, | ||||||||||
Series 2015-C28, Class D, | 5,074,000 | 3,523,386 | ||||||||
Series 2015-C30, Class D, | 2,259,000 | 1,532,957 | ||||||||
Series 2015-C30, Class C, | 11,768,000 | 9,978,087 | ||||||||
JPMCC Commercial Mortgage Securities Trust, Series 2014-FRR1, Class B707, | 1,816,000 | 1,484,217 | ||||||||
LB UBS Commercial Mortgage Trust, Series 2008-C1, Class AM, | 1,619,133 | 1,609,094 | ||||||||
Lone Star Portfolio Trust, Series 2015-LSP, Class E, 6.04%, 09/15/28 (b),(e),(f) | 7,789,514 | 7,593,997 | ||||||||
LSTAR Commercial Mortgage Trust, | 3,194,000 | 2,005,832 | ||||||||
Merrill Lynch Mortgage Trust, | ||||||||||
Series 2006-C2, Class AJ, 5.80%, 08/12/43 (f) | 2,795,757 | 2,750,466 | ||||||||
Series 2007-C1, Class AM, | 7,043,396 | 6,939,154 | ||||||||
See Notes to Consolidated Financial Statements.
135
Blackstone Alternative Multi-Strategy Fund and Subsidiaries
Consolidated Schedule of Investments (Continued)
March 31, 2016
Security Description | Principal Amount | Value | ||||||||
ML-CFC Commercial Mortgage Trust, | ||||||||||
Series 2006-4, Class B, 5.30%, 12/12/49 (b),(f) | $ | 3,823,000 | $ | 3,566,859 | ||||||
Series 2006-4, Class C, | 508,000 | 372,618 | ||||||||
Series 2007-7, Class AM, | 5,852,398 | 5,740,032 | ||||||||
Series 2007-8, Class AMA, | 4,910,938 | 4,937,948 | ||||||||
Morgan Stanley Bank of America Merrill Lynch Trust, | ||||||||||
Series 2014-C19, Class D, | 3,660,000 | 2,407,914 | ||||||||
Series 2015-C21, Class D, | 6,557,000 | 4,955,781 | ||||||||
Series 2015-C23, Class D, | 2,195,000 | 1,624,959 | ||||||||
Series 2015-C25, Class D, 3.07%, 10/15/48 (b) | 1,023,000 | 676,203 | ||||||||
Series 2015-C27, Class D, | 1,466,500 | 918,322 | ||||||||
Morgan Stanley Capital I Trust, | ||||||||||
Series 2007-IQ14, Class AM, | 6,039,747 | 6,030,083 | ||||||||
Series 2007-IQ14, Class AMFX, 5.67%, 04/15/49 (f),(h) | 2,196,432 | 2,192,918 | ||||||||
Series 2015-UBS8, Class D, | 1,523,000 | 1,084,224 | ||||||||
Wachovia Bank Commercial Mortgage Trust, | ||||||||||
Series 2005-C22, Class D, | 107,763 | 107,730 | ||||||||
Series 2006-C25, Class D, | 2,564,000 | 2,530,924 | ||||||||
Series 2006-C27, Class AJ, | 6,766,191 | 6,637,633 | ||||||||
Series 2006-C29, Class AJ, | 5,271,000 | 5,062,268 | ||||||||
Series 2006-C29, Class B, | 1,663,000 | 1,468,429 | ||||||||
Wells Fargo Commercial Mortgage Trust, | ||||||||||
Series 2015-C27, Class D, | 5,238,000 | 3,499,508 | ||||||||
Series 2015-C31, Class D, 3.85%, 11/15/48 (b) | 2,440,000 | 1,671,644 | ||||||||
Series 2015-LC20, Class D, | 1,740,000 | 1,255,236 | ||||||||
See Notes to Consolidated Financial Statements.
136
Blackstone Alternative Multi-Strategy Fund and Subsidiaries
Consolidated Schedule of Investments (Continued)
March 31, 2016
Security Description | Principal Amount | Value | ||||||||
Series 2015-NXS2, Class C, | $ | 9,532,000 | $ | 8,419,616 | ||||||
Series 2015-NXS4, Class E, 3.60%, 12/15/48 (b),(e),(f) | 2,629,000 | 1,651,801 | ||||||||
Series 2016-C32, Class XA, | 35,433,623 | 3,288,240 | ||||||||
Wells Fargo REMIC Trust, Series 2013-FRR1, Class AK16, 0.01%, 12/27/43 (b),(e),(g) | 609,000 | 386,289 | ||||||||
|
| |||||||||
| 423,319,879 | ||||||||||
|
| |||||||||
Interest Only Commercial Mortgage-Backed Securities — 0.7% |
| |||||||||
Citigroup Commercial Mortgage Trust, | 14,441,012 | 1,015,203 | ||||||||
Commercial Mortgage Trust, | ||||||||||
Series 2014-UBS4, Class XA, | 20,997,973 | 1,404,764 | ||||||||
Series 2014-UBS5, Class XA, | 4,088,970 | 224,076 | ||||||||
Series 2015-CR23, Class XA, | 12,462,605 | 729,062 | ||||||||
CSAIL Commercial Mortgage Trust, | ||||||||||
Series 2015-C1, Class XA, | 5,513,830 | 323,110 | ||||||||
Series 2015-C2, Class XA, | 41,395,425 | 2,285,027 | ||||||||
Series 2015-C3, Class XA, | 34,911,067 | 1,836,322 | ||||||||
GS Mortgage Securities Trust, | ||||||||||
Series 2014-GC24, Class XA, | 14,151,424 | 706,156 | ||||||||
Series 2015-GC32, Class XA, 0.90%, 07/10/48 (b),(f),(h) | 24,353,859 | 1,337,027 | ||||||||
JPMBB Commercial Mortgage Securities Trust, | ||||||||||
Series 2014-C22, Class XA, | 2,794,467 | 157,887 | ||||||||
Series 2015-C30, Class XA, | 53,477,357 | 2,123,051 | ||||||||
Morgan Stanley Bank of America Merrill Lynch Trust, | ||||||||||
Series 2014-C17, Class XA, | 25,679,271 | 1,622,930 | ||||||||
Series 2014-C19, Class XA, | 12,848,169 | 786,308 | ||||||||
Series 2015-C22, Class XA, | 40,161,149 | 2,787,184 | ||||||||
See Notes to Consolidated Financial Statements.
137
Blackstone Alternative Multi-Strategy Fund and Subsidiaries
Consolidated Schedule of Investments (Continued)
March 31, 2016
Security Description | Principal Amount | Value | ||||||||
Series 2015-C23, Class XA, | $ | 57,602,733 | $ | 2,482,678 | ||||||
Series 2015-C25, Class XA, | 36,580,496 | 2,769,144 | ||||||||
Morgan Stanley Capital I Trust, | 14,219,280 | 962,645 | ||||||||
Wells Fargo Commercial Mortgage Trust, | ||||||||||
Series 2015-C28, Class XA, 0.78%, 05/15/48 (b),(f),(h) | 26,355,003 | 1,286,124 | ||||||||
Series 2015-C29, Class XA, 0.77%, 06/15/48 (b),(f),(h) | 124,142,851 | 6,033,343 | ||||||||
WFRBS Commercial Mortgage Trust, Series 2014-C22, Class XA, | 1,863,337 | 98,571 | ||||||||
|
| |||||||||
| 30,970,612 | ||||||||||
|
| |||||||||
Total United States | 839,992,756 | |||||||||
|
| |||||||||
TOTAL MORTGAGE-BACKED SECURITIES | 877,126,725 | |||||||||
|
| |||||||||
SOVEREIGN DEBT — 4.7% | ||||||||||
Argentine Republic Government International Bond, | ||||||||||
7.82%, 12/31/33 (a),(i) | 16,382,515 | EUR | 20,692,243 | |||||||
8.28%, 12/31/33 (a),(i) | $ | 3,249,231 | 3,793,478 | |||||||
8.75%, 06/02/17 (a),(i) | 10,368,690 | 12,260,976 | ||||||||
Bahrain Government International Bond, | 8,887,000 | 8,808,172 | ||||||||
Deutsche Bundesrepublik Inflation Linked Bond REG S, 0.10%, 04/15/26 (b) | 4,269,685 | EUR | 5,306,595 | |||||||
Federal Republic of Brazil, 6.00%, 04/07/26 | $ | 5,830,000 | 5,923,280 | |||||||
France Government Bond OAT REG S, | 5,333,451 | EUR | 6,467,237 | |||||||
Hellenic Republic Government Bond REG S, | ||||||||||
3.00%, 02/24/23 - 02/24/42 (f),(k) | 27,892,000 | EUR | 19,470,320 | |||||||
3.38%, 07/17/17 (e) | 16,231,000 | EUR | 17,175,370 | |||||||
4.75%, 04/17/19 (e) | 13,701,000 | EUR | 13,689,588 | |||||||
Japan Treasury Discount Bill, 0.00%, 06/20/16 (b),(n) | 3,000,000,000 | JPY | 26,660,776 | |||||||
Mexican Bonos, 10.00%, 12/05/24 (b) | 135,050,000 | MXN | 10,034,737 | |||||||
Mexico Government International Bond, | $ | 4,154,000 | 4,351,315 | |||||||
Pakistan Government International Bond REG S, | 4,184,000 | 4,372,686 | ||||||||
Paraguay Government International Bond, 4.63%, 01/25/23 | 2,855,000 | 2,890,687 | ||||||||
See Notes to Consolidated Financial Statements.
138
Blackstone Alternative Multi-Strategy Fund and Subsidiaries
Consolidated Schedule of Investments (Continued)
March 31, 2016
Security Description | Principal Amount | Value | ||||||||
Republic of Cyprus REG S, 3.88%, 05/06/22 | 4,556,000 | EUR | $ | 5,290,031 | ||||||
Republic of Indonesia REG S, 4.75%, 01/08/26 | $ | 1,187,000 | 1,245,290 | |||||||
Republic of Iraq REG S, 5.80%, 01/15/28 | 5,180,000 | 3,558,660 | ||||||||
Republic of Sri Lanka REG S, 6.85%, 11/03/25 | 4,111,000 | 3,918,724 | ||||||||
Russian Federation REG S, 5.63%, 04/04/42 | 10,200,000 | 10,311,058 | ||||||||
United Kingdom Gilt Inflation Linked Bond REG S, 0.125%, 03/22/24 - 03/22/26 (b) | 9,611,872 | GBP | 15,265,092 | |||||||
|
| |||||||||
TOTAL SOVEREIGN DEBT | 201,486,315 | |||||||||
|
| |||||||||
U.S. GOVERNMENT SPONSORED AGENCY SECURITIES — 0.6% | ||||||||||
United States — 0.6% | ||||||||||
Inverse Interest Only Collateralized Mortgage Obligations — 0.6% |
| |||||||||
Federal National Mortgage Association, | $ | 18,758,246 | 3,903,591 | |||||||
Government National Mortgage Association, | ||||||||||
Series 2009-106, Class SL, 5.67%, 04/20/36 (b),(f) | 15,013,464 | 2,606,337 | ||||||||
Series 2011-157, Class LS, 6.20%, 12/20/41 (b),(f) | 9,043,355 | 2,209,292 | ||||||||
Series 2012-96, Class SA, 5.67%, 08/20/42 (b),(f) | 9,216,855 | 1,971,485 | ||||||||
Series 2013-188, Class SA, 5.72%, 12/20/43 (b),(f) | 10,728,141 | 1,706,847 | ||||||||
Series 2015-148, Class SL, 5.25%, 10/20/45 (b),(f) | 24,359,669 | 5,091,171 | ||||||||
Series 2015-161, Class AS, 5.77%, 11/20/45 (b),(f) | 11,636,650 | 2,921,963 | ||||||||
Series 2015-162, Class LS, 5.77%, 11/20/45 (b),(f) | 16,832,914 | 4,174,563 | ||||||||
|
| |||||||||
TOTAL U.S. GOVERNMENT SPONSORED AGENCY SECURITIES | 24,585,249 | |||||||||
|
| |||||||||
U.S. TREASURY OBLIGATIONS — 1.7% | ||||||||||
United States — 1.7% | ||||||||||
U.S. Treasury Inflation Indexed Notes, | ||||||||||
0.38%, 07/15/25 (b) | 46,952,530 | 47,987,551 | ||||||||
0.63%, 01/15/26 (b) | 23,928,480 | 25,023,950 | ||||||||
|
| |||||||||
TOTAL U.S. TREASURY OBLIGATIONS | 73,011,501 | |||||||||
|
| |||||||||
See Notes to Consolidated Financial Statements.
139
Blackstone Alternative Multi-Strategy Fund and Subsidiaries
Consolidated Schedule of Investments (Continued)
March 31, 2016
Security Description | Shares | Value | ||||||||
EXCHANGE-TRADED FUNDS — 0.7% | ||||||||||
SPDR Dow Jones International Real Estate ETF (b) | 137,030 | $ | 5,681,264 | |||||||
SPDR S&P Regional Banking ETF (d) | 47,373 | 1,783,120 | ||||||||
Vanguard Global ex-U.S. Real Estate ETF (b) | 165,219 | 8,840,869 | ||||||||
Vanguard REIT ETF (b) | 160,655 | 13,462,889 | ||||||||
|
| |||||||||
TOTAL EXCHANGE-TRADED FUNDS | 29,768,142 | |||||||||
|
| |||||||||
RIGHTS — 0.0% | ||||||||||
United States — 0.0% | ||||||||||
Vince Holding Corp. (a) | 15,300 | 2,887 | ||||||||
|
| |||||||||
TOTAL RIGHTS | 2,887 | |||||||||
|
| |||||||||
INVESTMENT IN INVESTEE FUNDS — 2.9% | ||||||||||
Cayman Islands — 0.7% | ||||||||||
GCM Offshore Equity Partners LP (g) | 1 | 30,663,258 | ||||||||
|
| |||||||||
Total Cayman Islands | 30,663,258 | |||||||||
|
| |||||||||
United States — 2.2% | ||||||||||
GCM Equity Partners LP (g) | 1 | 93,172,998 | ||||||||
|
| |||||||||
Total United States | 93,172,998 | |||||||||
|
| |||||||||
TOTAL INVESTMENT IN INVESTEE FUNDS | 123,836,256 | |||||||||
|
| |||||||||
Security Description | Contracts | Value | ||||||||
PURCHASED OPTIONS — 0.3% | ||||||||||
Exchange-Traded Call Options — 0.1% | ||||||||||
Apple, Inc. Strike Price 110.00 USD | 1,347 | 168,375 | ||||||||
Apple, Inc. Strike Price 110.00 USD | 2,694 | 940,206 | ||||||||
CBOE SPX Volatility Index Strike Price 29.00 | 545 | 5,450 | ||||||||
CBOE SPX Volatility Index Strike Price 28.00 | 691 | 31,786 | ||||||||
CBOE SPX Volatility Index Strike Price 40.00 | 1,443 | 43,290 | ||||||||
Comerica, Inc. Strike Price 50.00 USD | 585 | 2,925 | ||||||||
DAX Index Strike Price 10,150.00 EUR | 643 | 285,351 | ||||||||
See Notes to Consolidated Financial Statements.
140
Blackstone Alternative Multi-Strategy Fund and Subsidiaries
Consolidated Schedule of Investments (Continued)
March 31, 2016
Security Description | Shares | Value | ||||||||
DAX Index Strike Price 10,500.00 EUR | 332 | $ | 21,911 | |||||||
DAX Index Strike Price 10,600.00 EUR | 669 | 496,338 | ||||||||
Euro Stoxx 50 Strike Price 3,000.00 EUR | 124 | 68,998 | ||||||||
Euro Stoxx 50 Strike Price 3,100.00 EUR | 123 | 15,536 | ||||||||
Euro Stoxx 50 Strike Price 3,100.00 EUR | 252 | 87,172 | ||||||||
FTSE 100 Index Strike Price 6,200.00 GBP | 63 | 121,701 | ||||||||
iShares 20+ Year Treasury Bond Strike Price 133.00 USD Expires 09/16/16 | 266 | 85,386 | ||||||||
Netflix, Inc. Strike Price 105.00 USD | 55 | 32,890 | ||||||||
S&P 500 Index Strike Price 2,050.00 USD | 136 | 380,800 | ||||||||
S&P 500 Index Strike Price 2,065.00 USD | 395 | 400,530 | ||||||||
S&P 500 Index Strike Price 2,075.00 USD | 126 | 611,100 | ||||||||
SPDR S&P 500 ETF Trust Strike Price 215.00 USD | 254 | 135,890 | ||||||||
SPDR S&P 500 ETF Trust Strike Price 225.00 USD | 702 | 124,254 | ||||||||
Vodafone Group PLC Strike Price 2.30 GBP | 2,062 | 222,116 | ||||||||
|
| |||||||||
| 4,282,005 | ||||||||||
|
| |||||||||
Exchange-Traded Put Options — 0.1% | ||||||||||
FTSE 100 Index Strike Price 6,000.00 GBP | 63 | 126,225 | ||||||||
iShares Russell 2000 ETF Strike Price 104.00 USD | 428 | 83,460 | ||||||||
Marriott International, Inc. Strike Price 70.00 USD | 355 | 48,635 | ||||||||
Microsoft Corp. Strike Price 55.00 USD | 1,447 | 1,143,130 | ||||||||
S&P 500 Index Strike Price 1,900.00 USD | 177 | 14,691 | ||||||||
S&P 500 Index Strike Price 2,000.00 USD | 111 | 127,650 | ||||||||
S&P 500 Index Strike Price 2,040.00 USD | 16 | 19,760 | ||||||||
See Notes to Consolidated Financial Statements.
141
Blackstone Alternative Multi-Strategy Fund and Subsidiaries
Consolidated Schedule of Investments (Continued)
March 31, 2016
Security Description | Shares | Value | ||||||||
SPDR S&P 500 ETF Trust Strike Price 139.00 USD | 305 | $ | 153 | |||||||
SPDR S&P 500 ETF Trust Strike Price 147.00 USD | 483 | 2,173 | ||||||||
SPDR S&P 500 ETF Trust Strike Price 189.00 USD | 1,333 | 10,664 | ||||||||
SPDR S&P 500 ETF Trust Strike Price 202.00 USD | 2,138 | 81,244 | ||||||||
SPDR S&P 500 ETF Trust Strike Price 205.00 USD | 2,138 | 64,140 | ||||||||
SPDR S&P 500 ETF Trust Strike Price 172.00 USD | 448 | 25,536 | ||||||||
SPDR S&P 500 ETF Trust Strike Price 180.00 USD | 407 | 15,059 | ||||||||
Telefonica SA Strike Price 9.89 EUR | 4,664 | 780,153 | ||||||||
Telefonica SA Strike Price 9.89 EUR | 660 | 100,636 | ||||||||
|
| |||||||||
| 2,643,309 | ||||||||||
|
| |||||||||
OTC Call Options — 0.0% | ||||||||||
Bank of America Corp. Strike Price 14.00 USD Expires 05/20/16 Counterparty Deutsche Bank AG | 1,372,000 | 495,147 | ||||||||
Charles Schwab Corp. Strike Price 28.00 USD Expires 09/16/16 Counterparty Deutsche Bank AG | 497,600 | 1,216,653 | ||||||||
Charles Schwab Corp. Strike Price 30.00 USD Expires 06/17/16 Counterparty Deutsche Bank AG | 245,900 | 205,477 | ||||||||
SPDR S&P 500 ETF Trust Strike Price 206.00 USD Expires 04/15/16 Counterparty Morgan Stanley & Co. International plc | 57,600 | 93,909 | ||||||||
|
| |||||||||
| 2,011,186 | ||||||||||
|
| |||||||||
OTC Put Options — 0.1% | ||||||||||
Allergan PLC Strike Price 260.00 USD Expires 04/15/16 Counterparty Morgan Stanley & Co. International plc | 76,200 | 367,842 | ||||||||
Financial Select Sector SPDR Strike Price 20.00 USD Expires 08/17/16 Counterparty Morgan Stanley & Co. International plc | 485,100 | 117,255 | ||||||||
iShares PHLX Semiconductor ETF Strike Price 87.00 USD Expires 01/20/17 Counterparty Morgan Stanley & Co. International plc | 109,600 | 695,574 | ||||||||
See Notes to Consolidated Financial Statements.
142
Blackstone Alternative Multi-Strategy Fund and Subsidiaries
Consolidated Schedule of Investments (Continued)
March 31, 2016
Security Description | Contracts | Value | ||||||||
iShares PHLX Semiconductor ETF Strike Price 87.00 USD Expires 01/20/17 Counterparty Credit Suisse International | 163,400 | $ | 1,037,015 | |||||||
KOSPI 200 Index Strike Price 171.29 KRW Expires 01/12/17 Counterparty JPMorgan Chase Bank, N.A. | 19,093,472 | 16,217 | ||||||||
Liberty Global, Inc. Strike Price 35.00 USD Expires 04/15/16 Counterparty Bank of America, N.A. | 357,600 | 38,940 | ||||||||
SPDR S&P 500 ETF Trust Strike Price 200.00 USD Expires 05/20/16 Counterparty Morgan Stanley & Co. International plc | 110,300 | 248,350 | ||||||||
SX5E Index Strike Price 2,399.39 EUR Expires 01/20/17 Counterparty JPMorgan Chase Bank, N.A. | 293 | 27,830 | ||||||||
SX5E Index Strike Price 2,428.69 EUR Expires 01/20/17 Counterparty Credit Suisse International | 286 | 28,882 | ||||||||
|
| |||||||||
| 2,577,905 | ||||||||||
|
| |||||||||
TOTAL PURCHASED OPTIONS | 11,514,405 | |||||||||
|
| |||||||||
Security Description | Shares | Value | ||||||||
SHORT-TERM INVESTMENT — MONEY MARKET FUND — 18.1% | ||||||||||
State Street Institutional Liquid Reserves Fund, 0.45% (b),(m) | 774,303,004 | 774,303,004 | ||||||||
|
| |||||||||
TOTAL SHORT-TERM INVESTMENT — MONEY MARKET FUND | 774,303,004 | |||||||||
|
| |||||||||
TOTAL INVESTMENTS IN SECURITIES — 100.0% |
| 4,282,770,288 | ||||||||
|
| |||||||||
TOTAL SECURITIES SOLD SHORT — (25.8)% | (1,104,445,099 | ) | ||||||||
|
| |||||||||
Other Assets (p) — 25.8% | 1,105,124,970 | |||||||||
|
| |||||||||
Net Assets — 100.0% | $ | 4,283,450,159 | ||||||||
|
| |||||||||
| Shares | Value | |||||||||
SECURITIES SOLD SHORT — (25.8)% | ||||||||||
COMMON STOCK — (20.9)% | ||||||||||
Australia — (0.0)% | ||||||||||
Banking — (0.0)% | ||||||||||
Westpac Banking Corp. ADR | 100 | (2,326 | ) | |||||||
|
| |||||||||
See Notes to Consolidated Financial Statements.
143
Blackstone Alternative Multi-Strategy Fund and Subsidiaries
Consolidated Schedule of Investments (Continued)
March 31, 2016
Security Description | Shares | Value | ||||||||
Iron & Steel — (0.0)% | ||||||||||
BHP Billiton Ltd. ADR | 4,800 | $ | (124,320 | ) | ||||||
|
| |||||||||
Total Australia | (126,646 | ) | ||||||||
|
| |||||||||
Belgium — (0.0)% | ||||||||||
Software — (0.0)% | ||||||||||
Materialise NV ADR | 1,800 | (13,680 | ) | |||||||
|
| |||||||||
Total Belgium | (13,680 | ) | ||||||||
|
| |||||||||
Bermuda — (0.1)% | ||||||||||
Insurance — (0.1)% | ||||||||||
Arch Capital Group Ltd. | 15,400 | (1,094,940 | ) | |||||||
RenaissanceRe Holdings Ltd. | 17,800 | (2,132,974 | ) | |||||||
|
| |||||||||
| (3,227,914 | ) | |||||||||
|
| |||||||||
Transportation & Logistics — (0.0)% | ||||||||||
Golar LNG Ltd. | 68,700 | (1,234,539 | ) | |||||||
Teekay Tankers Ltd. Class A | 2,700 | (9,909 | ) | |||||||
|
| |||||||||
| (1,244,448 | ) | |||||||||
|
| |||||||||
Total Bermuda | (4,472,362 | ) | ||||||||
|
| |||||||||
Brazil — (0.1)% | ||||||||||
Aerospace & Defense — (0.0)% | ||||||||||
Embraer SA ADR | 3,500 | (92,260 | ) | |||||||
|
| |||||||||
Banking — (0.1)% | ||||||||||
Banco Bradesco SA ADR | 72,700 | (541,615 | ) | |||||||
Banco Santander Brasil SA ADR | 14,500 | (67,425 | ) | |||||||
Itau Unibanco Holding SA ADR | 34,700 | (298,073 | ) | |||||||
|
| |||||||||
| (907,113 | ) | |||||||||
|
| |||||||||
Chemicals — (0.0)% | ||||||||||
Braskem SA ADR | 3,900 | (50,349 | ) | |||||||
|
| |||||||||
Consumer Products — (0.0)% | ||||||||||
AMBEV SA ADR | 12,800 | (66,304 | ) | |||||||
|
| |||||||||
Iron & Steel — (0.0)% | ||||||||||
Cia Siderurgica Nacional SA ADR | 99,000 | (195,030 | ) | |||||||
Vale SA ADR | 75,400 | (317,434 | ) | |||||||
|
| |||||||||
| (512,464 | ) | |||||||||
|
| |||||||||
Oil, Gas & Coal — (0.0)% | ||||||||||
Petroleo Brasileiro SA ADR | 44,800 | (261,632 | ) | |||||||
|
| |||||||||
See Notes to Consolidated Financial Statements.
144
Blackstone Alternative Multi-Strategy Fund and Subsidiaries
Consolidated Schedule of Investments (Continued)
March 31, 2016
Security Description | Shares | Value | ||||||||
Passenger Transportation — (0.0)% | ||||||||||
Gol Linhas Aereas Inteligentes SA ADR | 6,150 | $ | (46,309 | ) | ||||||
|
| |||||||||
Real Estate — (0.0)% | ||||||||||
Gafisa SA ADR | 1,100 | (1,562 | ) | |||||||
|
| |||||||||
Telecommunications — (0.0)% | ||||||||||
Oi SA ADR | 15,719 | �� | (5,115 | ) | ||||||
Telefonica Brasil SA ADR | 900 | (11,241 | ) | |||||||
|
| |||||||||
| (16,356 | ) | |||||||||
|
| |||||||||
Utilities — (0.0)% | ||||||||||
Centrais Eletricas Brasileiras SA ADR | 1,300 | (2,314 | ) | |||||||
Cia de Saneamento Basico do Estado de Sao Paulo ADR | 900 | (5,940 | ) | |||||||
Cia Paranaense de Energia ADR | 3,100 | (24,552 | ) | |||||||
CPFL Energia SA ADR | 3,400 | (37,026 | ) | |||||||
|
| |||||||||
| (69,832 | ) | |||||||||
|
| |||||||||
Total Brazil | (2,024,181 | ) | ||||||||
|
| |||||||||
Canada — (1.2)% | ||||||||||
Apparel & Textile Products — (0.0)% | ||||||||||
Gildan Activewear, Inc. | 39,500 | (1,205,145 | ) | |||||||
|
| |||||||||
Automotive — (0.0)% | ||||||||||
Westport Innovations, Inc. | 12,100 | (31,520 | ) | |||||||
|
| |||||||||
Banking — (0.3)% | ||||||||||
Bank of Montreal | 17,500 | (1,062,075 | ) | |||||||
Bank of Nova Scotia | 20,700 | (1,011,402 | ) | |||||||
Canadian Imperial Bank of Commerce | 22,700 | (1,695,917 | ) | |||||||
Royal Bank of Canada | 53,500 | (3,079,460 | ) | |||||||
Royal Bank of Canada | 49,460 | (2,849,734 | ) | |||||||
Toronto-Dominion Bank | 102,100 | (4,403,573 | ) | |||||||
|
| |||||||||
| (14,102,161 | ) | |||||||||
|
| |||||||||
Biotechnology & Pharmaceuticals — (0.0)% | ||||||||||
Aeterna Zentaris, Inc. | 14,305 | (47,493 | ) | |||||||
Aquinox Pharmaceuticals, Inc. (b) | 4,400 | (38,808 | ) | |||||||
Arbutus Biopharma Corp. | 25,300 | (104,489 | ) | |||||||
Concordia Healthcare Corp. | 300 | (7,680 | ) | |||||||
|
| |||||||||
| (198,470 | ) | |||||||||
|
| |||||||||
Chemicals — (0.0)% | ||||||||||
BioAmber, Inc. | 500 | (2,100 | ) | |||||||
Methanex Corp. | 2,100 | (67,452 | ) | |||||||
|
| |||||||||
| (69,552 | ) | |||||||||
|
| |||||||||
See Notes to Consolidated Financial Statements.
145
Blackstone Alternative Multi-Strategy Fund and Subsidiaries
Consolidated Schedule of Investments (Continued)
March 31, 2016
Security Description | Shares | Value | ||||||||
Consumer Products — (0.0)% | ||||||||||
DavidsTea, Inc. | 3,600 | $ | (43,596 | ) | ||||||
|
| |||||||||
Design, Manufacturing & Distribution — (0.0)% | ||||||||||
Celestica, Inc. | 2,700 | (29,646 | ) | |||||||
|
| |||||||||
Engineering & Construction Services — (0.0)% | ||||||||||
Stantec, Inc. | 200 | (5,072 | ) | |||||||
|
| |||||||||
Hardware — (0.1)% | ||||||||||
Blackberry Ltd. (b) | 322,285 | (2,607,286 | ) | |||||||
Sierra Wireless, Inc. | 5,200 | (75,608 | ) | |||||||
|
| |||||||||
| (2,682,894 | ) | |||||||||
|
| |||||||||
Industrial Services — (0.0)% | ||||||||||
Ritchie Bros Auctioneers, Inc. | 23,000 | (622,840 | ) | |||||||
|
| |||||||||
Insurance — (0.0)% | ||||||||||
Manulife Financial Corp. | 13,100 | (185,103 | ) | |||||||
Sun Life Financial, Inc. | 14,200 | (458,234 | ) | |||||||
|
| |||||||||
| (643,337 | ) | |||||||||
|
| |||||||||
Media — (0.0)% | ||||||||||
Shaw Communications, Inc. B Shares | 3,500 | (67,585 | ) | |||||||
|
| |||||||||
Medical Equipment & Devices — (0.0)% | ||||||||||
Alpha Pro Tech Ltd. | 200 | (364 | ) | |||||||
Novadaq Technologies, Inc. | 2,600 | (28,834 | ) | |||||||
|
| |||||||||
| (29,198 | ) | |||||||||
|
| |||||||||
Metals & Mining — (0.2)% | ||||||||||
Agnico Eagle Mines Ltd. | 36,500 | (1,319,840 | ) | |||||||
B2GOLD Corp. | 1,200 | (1,992 | ) | |||||||
Barrick Gold Corp. | 12,200 | (165,676 | ) | |||||||
Endeavour Silver Corp. | 1,800 | (4,428 | ) | |||||||
First Majestic Silver Corp. | 26,900 | (174,312 | ) | |||||||
Franco-Nevada Corp. | 44,900 | (2,755,962 | ) | |||||||
Goldcorp, Inc. | 34,000 | (551,820 | ) | |||||||
New Gold, Inc. | 3,200 | (11,936 | ) | |||||||
NOVAGOLD Resources, Inc. | 25,300 | (127,512 | ) | |||||||
Pan American Silver Corp. | 95,000 | (1,032,650 | ) | |||||||
Pretium Resources, Inc. | 1,000 | (5,350 | ) | |||||||
Primero Mining Corp. | 7,100 | (12,851 | ) | |||||||
Seabridge Gold, Inc. | 23,700 | (259,752 | ) | |||||||
Silver Wheaton Corp. | 5,300 | (87,874 | ) | |||||||
Teck Resources Ltd. | 33,800 | (257,218 | ) | |||||||
See Notes to Consolidated Financial Statements.
146
Blackstone Alternative Multi-Strategy Fund and Subsidiaries
Consolidated Schedule of Investments (Continued)
March 31, 2016
Security Description | Shares | Value | ||||||||
Yamana Gold, Inc. | 24,900 | $ | (75,696 | ) | ||||||
|
| |||||||||
| (6,844,869 | ) | |||||||||
|
| |||||||||
Oil, Gas & Coal — (0.2)% | ||||||||||
Baytex Energy Corp. | 17,000 | (67,490 | ) | |||||||
Bellatrix Exploration Ltd. | 2,900 | (2,929 | ) | |||||||
Canadian Natural Resources Ltd. | 7,000 | (189,000 | ) | |||||||
Cenovus Energy, Inc. | 55,800 | (725,400 | ) | |||||||
Crescent Point Energy Corp. | 9,600 | (132,864 | ) | |||||||
Enbridge, Inc. | 11,900 | (463,029 | ) | |||||||
Encana Corp. | 167,900 | (1,022,511 | ) | |||||||
Enerplus Corp. | 71,900 | (282,567 | ) | |||||||
Imperial Oil Ltd. | 2,900 | (96,860 | ) | |||||||
Pembina Pipeline Corp. | 27,700 | (747,346 | ) | |||||||
Pengrowth Energy Corp. | 44,300 | (58,033 | ) | |||||||
Penn West Petroleum Ltd. | 18,200 | (16,924 | ) | |||||||
Precision Drilling Corp. | 64,200 | (269,640 | ) | |||||||
Suncor Energy, Inc. | 4,300 | (119,583 | ) | |||||||
TransCanada Corp. | 88,700 | (3,486,797 | ) | |||||||
Vermilion Energy, Inc. | 2,900 | (84,738 | ) | |||||||
|
| |||||||||
| (7,765,711 | ) | |||||||||
|
| |||||||||
Real Estate — (0.1)% | ||||||||||
Brookfield Asset Management, Inc. Class A | 58,650 | (2,040,433 | ) | |||||||
|
| |||||||||
Renewable Energy — (0.0)% | ||||||||||
Ballard Power Systems, Inc. | 31,800 | (44,520 | ) | |||||||
Hydrogenics Corp. | 300 | (2,454 | ) | |||||||
|
| |||||||||
| (46,974 | ) | |||||||||
|
| |||||||||
Software — (0.0)% | ||||||||||
Descartes Systems Group, Inc. (The) | 100 | (1,951 | ) | |||||||
Open Text Corp. | 16,200 | (839,160 | ) | |||||||
Sphere 3D Corp. | 200 | (248 | ) | |||||||
|
| |||||||||
| (841,359 | ) | |||||||||
|
| |||||||||
Technology Services — (0.0)% | ||||||||||
CGI Group, Inc. Class A | 15,400 | (735,812 | ) | |||||||
|
| |||||||||
Telecommunications — (0.1)% | ||||||||||
BCE, Inc. | 61,600 | (2,805,264 | ) | |||||||
Rogers Communications, Inc. B Shares | 32,800 | (1,312,656 | ) | |||||||
TELUS Corp. | 9,800 | (318,794 | ) | |||||||
|
| |||||||||
| (4,436,714 | ) | |||||||||
|
| |||||||||
See Notes to Consolidated Financial Statements.
147
Blackstone Alternative Multi-Strategy Fund and Subsidiaries
Consolidated Schedule of Investments (Continued)
March 31, 2016
Security Description | Shares | Value | ||||||||
Transportation & Logistics — (0.2)% | ||||||||||
Canadian National Railway Co. | 97,700 | $ | (6,102,342 | ) | ||||||
Canadian Pacific Railway Ltd. | 800 | (106,152 | ) | |||||||
|
| |||||||||
| (6,208,494 | ) | |||||||||
|
| |||||||||
Utilities — (0.0)% | ||||||||||
Fortis, Inc. (b) | 16,544 | (522,476 | ) | |||||||
Just Energy Group, Inc. | 6,800 | (40,460 | ) | |||||||
TransAlta Corp. | 2,200 | (10,230 | ) | |||||||
|
| |||||||||
| (573,166 | ) | |||||||||
|
| |||||||||
Total Canada | (49,224,548 | ) | ||||||||
|
| |||||||||
Cayman Islands — (0.0)% | ||||||||||
Biotechnology & Pharmaceuticals — (0.0)% | ||||||||||
Theravance Biopharma, Inc. | 4,600 | (86,480 | ) | |||||||
|
| |||||||||
Total Cayman Islands | (86,480 | ) | ||||||||
|
| |||||||||
Chile — (0.0)% | ||||||||||
Banking — (0.0)% | ||||||||||
Banco de Chile ADR | 100 | (6,445 | ) | |||||||
|
| |||||||||
Passenger Transportation — (0.0)% | ||||||||||
Latam Airlines Group SA ADR | 42,800 | (299,600 | ) | |||||||
|
| |||||||||
Retail—Consumer Staples — (0.0)% | ||||||||||
Cencosud SA ADR | 300 | (2,304 | ) | |||||||
|
| |||||||||
Total Chile | (308,349 | ) | ||||||||
|
| |||||||||
China — (0.7)% | ||||||||||
Automotive — (0.0)% | ||||||||||
Kandi Technologies Group, Inc. | 20,700 | (149,040 | ) | |||||||
|
| |||||||||
Chemicals — (0.0)% | ||||||||||
Tantech Holdings Ltd. | 100 | (583 | ) | |||||||
|
| |||||||||
Gaming, Lodging & Restaurants — (0.0)% | ||||||||||
500.com Ltd. Class A ADR | 40,100 | (669,670 | ) | |||||||
|
| |||||||||
Media — (0.2)% | ||||||||||
58.com, Inc. ADR | 41,600 | (2,315,040 | ) | |||||||
Autohome, Inc. ADR | 1,900 | (53,086 | ) | |||||||
Renren, Inc. ADR | 1,700 | (5,559 | ) | |||||||
SouFun Holdings Ltd. ADR | 465,900 | (2,790,741 | ) | |||||||
Weibo Corp. ADR | 9,100 | (163,345 | ) | |||||||
|
| |||||||||
| (5,327,771 | ) | |||||||||
|
| |||||||||
See Notes to Consolidated Financial Statements.
148
Blackstone Alternative Multi-Strategy Fund and Subsidiaries
Consolidated Schedule of Investments (Continued)
March 31, 2016
Security Description | Shares | Value | ||||||||
Oil, Gas & Coal — (0.0)% | ||||||||||
CNOOC Ltd. ADR | 1,100 | $ | (128,766 | ) | ||||||
Yanzhou Coal Mining Co. Ltd. ADR | 400 | (2,108 | ) | |||||||
|
| |||||||||
| (130,874 | ) | |||||||||
|
| |||||||||
Renewable Energy — (0.0)% | ||||||||||
JinkoSolar Holding Co. Ltd. ADR | 21,400 | (447,474 | ) | |||||||
ReneSola Ltd. ADR | 7,500 | (10,800 | ) | |||||||
Yingli Green Energy Holding ADR | 6,840 | (31,259 | ) | |||||||
|
| |||||||||
| (489,533 | ) | |||||||||
|
| |||||||||
Retail—Discretionary — (0.5)% | ||||||||||
Alibaba Group Holding Ltd. ADR (b) | 239,616 | (18,936,852 | ) | |||||||
JD.com, Inc. ADR | 2,300 | (60,950 | ) | |||||||
Jumei International Holding Ltd. ADR | 34,300 | (223,293 | ) | |||||||
LightInTheBox Holding Co. Ltd. ADR | 1,000 | (2,400 | ) | |||||||
|
| |||||||||
| (19,223,495 | ) | |||||||||
|
| |||||||||
Software — (0.0)% | ||||||||||
iDreamsky Technology Ltd. ADR | 1,500 | (20,610 | ) | |||||||
Momo, Inc. ADR | 36,100 | (405,764 | ) | |||||||
NQ Mobile, Inc. ADR | 56,300 | (257,854 | ) | |||||||
|
| |||||||||
| (684,228 | ) | |||||||||
|
| |||||||||
Technology Services — (0.0)% | ||||||||||
China Information Technology, Inc. | 100 | (147 | ) | |||||||
|
| |||||||||
Telecommunications — (0.0)% | ||||||||||
21Vianet Group, Inc. ADR | 47,100 | (940,587 | ) | |||||||
|
| |||||||||
Total China | (27,615,928 | ) | ||||||||
|
| |||||||||
Colombia — (0.0)% | ||||||||||
Banking — (0.0)% | ||||||||||
Bancolombia SA ADR | 36,500 | (1,247,570 | ) | |||||||
Grupo Aval Acciones y Valores SA ADR | 4,900 | (37,877 | ) | |||||||
|
| |||||||||
| (1,285,447 | ) | |||||||||
|
| |||||||||
Oil, Gas & Coal — (0.0)% | ||||||||||
Ecopetrol SA ADR | 800 | (6,888 | ) | |||||||
|
| |||||||||
Passenger Transportation — (0.0)% | ||||||||||
Avianca Holdings SA ADR | 8,700 | (43,239 | ) | |||||||
|
| |||||||||
Total Colombia | (1,335,574 | ) | ||||||||
|
| |||||||||
See Notes to Consolidated Financial Statements.
149
Blackstone Alternative Multi-Strategy Fund and Subsidiaries
Consolidated Schedule of Investments (Continued)
March 31, 2016
Security Description | Shares | Value | ||||||||
Denmark — (0.1)% | ||||||||||
Biotechnology & Pharmaceuticals — (0.1)% | ||||||||||
Novo Nordisk A/S ADR | 7,100 | $ | (384,749 | ) | ||||||
Novo Nordisk A/S B Shares (b) | 36,630 | (1,986,864 | ) | |||||||
|
| |||||||||
Total Denmark | (2,371,613 | ) | ||||||||
|
| |||||||||
Finland — (0.0)% | ||||||||||
Hardware — (0.0)% | ||||||||||
Nokia Oyj ADR | 134,200 | (793,122 | ) | |||||||
|
| |||||||||
Total Finland | (793,122 | ) | ||||||||
|
| |||||||||
Germany — (0.1)% | ||||||||||
Banking — (0.0)% | ||||||||||
Deutsche Bank AG | 117,300 | (1,987,062 | ) | |||||||
|
| |||||||||
Biotechnology & Pharmaceuticals — (0.0)% | ||||||||||
Affimed NV | 4,500 | (16,830 | ) | |||||||
|
| |||||||||
Hardware — (0.0)% | ||||||||||
voxeljet AG ADR | 7,300 | (44,530 | ) | |||||||
|
| |||||||||
Semiconductors — (0.0)% | ||||||||||
Aixtron SE ADR | 100 | (485 | ) | |||||||
|
| |||||||||
Software — (0.1)% | ||||||||||
SAP SE ADR | 33,600 | (2,702,112 | ) | |||||||
|
| |||||||||
Total Germany | (4,751,019 | ) | ||||||||
|
| |||||||||
Greece — (0.0)% | ||||||||||
Oil, Gas & Coal — (0.0)% | ||||||||||
Dryships, Inc. (a) | 32 | (75 | ) | |||||||
|
| |||||||||
Transportation & Logistics — (0.0)% | ||||||||||
Diana Containerships, Inc. | 200 | (116 | ) | |||||||
Diana Shipping, Inc. | 7,100 | (18,957 | ) | |||||||
Star Bulk Carriers Corp. | 11,900 | (8,925 | ) | |||||||
|
| |||||||||
| (27,998 | ) | |||||||||
|
| |||||||||
Total Greece | (28,073 | ) | ||||||||
|
| |||||||||
Hong Kong — ((0.1))% | ||||||||||
Gaming, Lodging & Restaurants — (0.1)% | ||||||||||
Melco Crown Entertainment Ltd. ADR | 222,400 | (3,671,824 | ) | |||||||
|
| |||||||||
Total Hong Kong | (3,671,824 | ) | ||||||||
|
| |||||||||
See Notes to Consolidated Financial Statements.
150
Blackstone Alternative Multi-Strategy Fund and Subsidiaries
Consolidated Schedule of Investments (Continued)
March 31, 2016
Security Description | Shares | Value | ||||||||
India — (0.0)% | ||||||||||
Banking — (0.0)% | ||||||||||
HDFC Bank Ltd. ADR | 14,700 | $ | (905,961 | ) | ||||||
|
| |||||||||
Biotechnology & Pharmaceuticals — (0.0)% | ||||||||||
Dr. Reddy’s Laboratories Ltd. ADR | 400 | (18,076 | ) | |||||||
|
| |||||||||
Media — (0.0)% | ||||||||||
MakeMyTrip Ltd. | 5,800 | (104,922 | ) | |||||||
|
| |||||||||
Technology Services — (0.0)% | ||||||||||
Infosys Ltd. ADR (b) | 26,126 | (496,917 | ) | |||||||
Wipro Ltd. ADR | 7,100 | (89,318 | ) | |||||||
|
| |||||||||
| (586,235 | ) | |||||||||
|
| |||||||||
Total India | (1,615,194 | ) | ||||||||
|
| |||||||||
Indonesia — (0.0)% | ||||||||||
Telecommunications — (0.0)% | ||||||||||
PT Telekomunikasi Indonesia Persero Tbk ADR | 3,300 | (167,805 | ) | |||||||
|
| |||||||||
Total Indonesia | (167,805 | ) | ||||||||
|
| |||||||||
Ireland — (0.3)% | ||||||||||
Biotechnology & Pharmaceuticals — (0.0)% | ||||||||||
Amarin Corp. PLC ADR | 20,200 | (30,906 | ) | |||||||
|
| |||||||||
Insurance — (0.1)% | ||||||||||
XL Group PLC | 148,254 | (5,455,747 | ) | |||||||
|
| |||||||||
Specialty Finance — (0.2)% | ||||||||||
AerCap Holdings NV | 192,900 | (7,476,804 | ) | |||||||
|
| |||||||||
Transportation & Logistics — (0.0)% | ||||||||||
Ardmore Shipping Corp. | 5,100 | (43,095 | ) | |||||||
|
| |||||||||
Total Ireland | (13,006,552 | ) | ||||||||
|
| |||||||||
Israel — (0.0)% | ||||||||||
Aerospace & Defense — (0.0)% | ||||||||||
RADA Electronic Industries Ltd. | 4,100 | (1,640 | ) | |||||||
|
| |||||||||
Biotechnology & Pharmaceuticals — (0.0)% | ||||||||||
Alcobra Ltd. | 3,800 | (14,402 | ) | |||||||
Neuroderm Ltd. | 3,700 | (52,244 | ) | |||||||
Oramed Pharmaceuticals, Inc. | 1,900 | (12,654 | ) | |||||||
Vascular Biogenics Ltd. | 1,800 | (6,264 | ) | |||||||
|
| |||||||||
| (85,564 | ) | |||||||||
|
| |||||||||
See Notes to Consolidated Financial Statements.
151
Blackstone Alternative Multi-Strategy Fund and Subsidiaries
Consolidated Schedule of Investments (Continued)
March 31, 2016
Security Description | Shares | Value | ||||||||
Consumer Products — (0.0)% | ||||||||||
SodaStream International Ltd. (b) | 19,257 | $ | (271,139 | ) | ||||||
|
| |||||||||
Hardware — (0.0)% | ||||||||||
SuperCom Ltd. | 200 | (796 | ) | |||||||
|
| |||||||||
Medical Equipment & Devices — (0.0)% | ||||||||||
ReWalk Robotics Ltd. | 5,200 | (48,880 | ) | |||||||
|
| |||||||||
Telecommunications — (0.0)% | ||||||||||
magicJack VocalTec Ltd. | 400 | (2,624 | ) | |||||||
|
| |||||||||
Total Israel | (410,643 | ) | ||||||||
|
| |||||||||
Italy — (0.0)% | ||||||||||
Automotive — (0.0)% | ||||||||||
Ferrari NV | 1,000 | (41,700 | ) | |||||||
|
| |||||||||
Total Italy | (41,700 | ) | ||||||||
|
| |||||||||
Japan — (0.0)% | ||||||||||
Automotive — (0.0)% | ||||||||||
Toyota Motor Corp. ADR | 800 | (85,056 | ) | |||||||
|
| |||||||||
Banking — (0.0)% | ||||||||||
Sumitomo Mitsui Financial Group, Inc. ADR | 400 | (2,404 | ) | |||||||
|
| |||||||||
Hardware — (0.0)% | ||||||||||
Sony Corp. ADR | 38,900 | (1,000,508 | ) | |||||||
|
| |||||||||
Media — (0.0)% | ||||||||||
Yahoo Japan Corp. (b) | 81,100 | (345,168 | ) | |||||||
|
| |||||||||
Telecommunications — (0.0)% | ||||||||||
Nippon Telegraph & Telephone Corp. ADR | 1,400 | (60,536 | ) | |||||||
NTT Docomo, Inc. ADR | 2,500 | (56,925 | ) | |||||||
|
| |||||||||
| (117,461 | ) | |||||||||
|
| |||||||||
Total Japan |
| (1,550,597 | ) | |||||||
|
| |||||||||
Jersey — (0.0)% | ||||||||||
Metals & Mining — (0.0)% | ||||||||||
Randgold Resources Ltd. ADR | 8,600 | (780,966 | ) | |||||||
|
| |||||||||
Total Jersey | (780,966 | ) | ||||||||
|
| |||||||||
Monaco — (0.0)% | ||||||||||
Transportation & Logistics — (0.0)% | ||||||||||
GasLog Ltd. | 76,600 | (746,084 | ) | |||||||
Navios Maritime Holdings, Inc. | 24,400 | (27,572 | ) | |||||||
See Notes to Consolidated Financial Statements.
152
Blackstone Alternative Multi-Strategy Fund and Subsidiaries
Consolidated Schedule of Investments (Continued)
March 31, 2016
Security Description | Shares | Value | ||||||||
Scorpio Tankers, Inc. | 110,100 | $ | (641,883 | ) | ||||||
|
| |||||||||
Total Monaco |
| (1,415,539 | ) | |||||||
|
| |||||||||
Netherlands — (0.0)% | ||||||||||
Insurance — (0.0)% | ||||||||||
Aegon NV | 31 | (170 | ) | |||||||
|
| |||||||||
Retail—Discretionary — (0.0)% | ||||||||||
Cnova NV | 3,500 | (10,500 | ) | |||||||
|
| |||||||||
Semiconductors — (0.0)% | ||||||||||
ASML Holding NV New York Shares (b) | 2,740 | (275,069 | ) | |||||||
|
| |||||||||
Telecommunications — (0.0)% | ||||||||||
VimpelCom Ltd. ADR | 63,400 | (270,084 | ) | |||||||
|
| |||||||||
Total Netherlands |
| (555,823 | ) | |||||||
|
| |||||||||
Norway — (0.0)% | ||||||||||
Oil, Gas & Coal — (0.0)% | ||||||||||
North Atlantic Drilling Ltd. | 900 | (2,466 | ) | |||||||
Statoil ASA ADR | 1,100 | (17,116 | ) | |||||||
|
| |||||||||
| (19,582 | ) | |||||||||
|
| |||||||||
Transportation & Logistics — (0.0)% | ||||||||||
Frontline Ltd. | 17,540 | (146,810 | ) | |||||||
Golden Ocean Group Ltd. | 15,300 | (10,633 | ) | |||||||
Nordic American Offshore Ltd. | 1,200 | (5,376 | ) | |||||||
|
| |||||||||
| (162,819 | ) | |||||||||
|
| |||||||||
Total Norway |
| (182,401 | ) | |||||||
|
| |||||||||
Panama — (0.0)% | ||||||||||
Banking — (0.0)% | ||||||||||
Banco Latinoamericano de Comercio Exterior SA E Shares | 1,600 | (38,752 | ) | |||||||
|
| |||||||||
Passenger Transportation — (0.0)% | ||||||||||
Copa Holdings SA Class A | 18,100 | (1,226,275 | ) | |||||||
|
| |||||||||
Total Panama |
| (1,265,027 | ) | |||||||
|
| |||||||||
Peru — (0.1)% |
| |||||||||
Metals & Mining — (0.1)% | ||||||||||
Southern Copper Corp. | 83,300 | (2,308,243 | ) | |||||||
|
| |||||||||
Total Peru |
| (2,308,243 | ) | |||||||
|
| |||||||||
See Notes to Consolidated Financial Statements.
153
Blackstone Alternative Multi-Strategy Fund and Subsidiaries
Consolidated Schedule of Investments (Continued)
March 31, 2016
Security Description | Shares | Value | ||||||||
Puerto Rico — (0.0)% | ||||||||||
Banking — (0.0)% | ||||||||||
OFG Bancorp | 700 | $ | (4,893 | ) | ||||||
|
| |||||||||
Total Puerto Rico |
| (4,893 | ) | |||||||
|
| |||||||||
Republic of Korea — (0.0)% | ||||||||||
Banking — (0.0)% | ||||||||||
KB Financial Group, Inc. ADR | 100 | (2,759 | ) | |||||||
|
| |||||||||
Semiconductors — (0.0)% | ||||||||||
Magnachip Semiconductor Corp. | 600 | (3,264 | ) | |||||||
|
| |||||||||
Total Republic of Korea |
| (6,023 | ) | |||||||
|
| |||||||||
Singapore — (0.0)% | ||||||||||
Semiconductors — (0.0)% | ||||||||||
Broadcom Ltd. (b) | 38 | (5,871 | ) | |||||||
|
| |||||||||
Total Singapore |
| (5,871 | ) | |||||||
|
| |||||||||
Spain — (0.0)% | ||||||||||
Banking — (0.0)% | ||||||||||
Banco Santander SA ADR | 64,248 | (280,121 | ) | |||||||
|
| |||||||||
Telecommunications — (0.0)% | ||||||||||
Telefonica SA ADR | 4,201 | (46,757 | ) | |||||||
|
| |||||||||
Utilities — (0.0)% | ||||||||||
Abengoa Yield PLC | 21,018 | (373,700 | ) | |||||||
|
| |||||||||
Total Spain |
| (700,578 | ) | |||||||
|
| |||||||||
Sweden — (0.0)% | ||||||||||
Automotive — (0.0)% | ||||||||||
Autoliv, Inc. | 700 | (82,936 | ) | |||||||
|
| |||||||||
Total Sweden |
| (82,936 | ) | |||||||
|
| |||||||||
Switzerland — (0.1)% | ||||||||||
Asset Management — (0.0)% | ||||||||||
UBS Group AG | 12,800 | (205,056 | ) | |||||||
|
| |||||||||
Construction Materials — (0.0)% | ||||||||||
LafargeHolcim Ltd. | 15,973 | (751,348 | ) | |||||||
|
| |||||||||
Institutional Financial Services — (0.0)% | ||||||||||
Credit Suisse Group AG ADR | 114,283 | (1,614,819 | ) | |||||||
|
| |||||||||
See Notes to Consolidated Financial Statements.
154
Blackstone Alternative Multi-Strategy Fund and Subsidiaries
Consolidated Schedule of Investments (Continued)
March 31, 2016
Security Description | Shares | Value | ||||||||
Retail—Consumer Staples — (0.1)% | ||||||||||
Galenica AG (b) | 2,670 | $ | (4,015,205 | ) | ||||||
|
| |||||||||
Total Switzerland |
| (6,586,428 | ) | |||||||
|
| |||||||||
Taiwan — (0.0)% | ||||||||||
Semiconductors — (0.0)% | ||||||||||
Taiwan Semiconductor Manufacturing Co. Ltd. ADR | 1,100 | (28,820 | ) | |||||||
|
| |||||||||
Total Taiwan |
| (28,820 | ) | |||||||
|
| |||||||||
United Kingdom — (0.1)% | ||||||||||
Automotive — (0.0)% | ||||||||||
Fiat Chrysler Automobiles NV | 27,400 | (220,844 | ) | |||||||
|
| |||||||||
Banking — (0.0)% | ||||||||||
Barclays PLC ADR | 1,004 | (8,655 | ) | |||||||
Lloyds Banking Group PLC ADR | 900 | (3,555 | ) | |||||||
Royal Bank of Scotland Group PLC ADR | 1,400 | (8,932 | ) | |||||||
|
| |||||||||
| (21,142 | ) | |||||||||
|
| |||||||||
Insurance — (0.0)% | ||||||||||
Aviva PLC ADR | 200 | (2,612 | ) | |||||||
|
| |||||||||
Iron & Steel — (0.0)% | ||||||||||
Rio Tinto PLC ADR | 400 | (11,308 | ) | |||||||
|
| |||||||||
Machinery — (0.1)% | ||||||||||
CNH Industrial NV | 17,900 | (121,004 | ) | |||||||
Pentair PLC | 28,400 | (1,540,984 | ) | |||||||
|
| |||||||||
| (1,661,988 | ) | |||||||||
|
| |||||||||
Media — (0.0)% | ||||||||||
WPP PLC ADR | 100 | (11,643 | ) | |||||||
|
| |||||||||
Oil, Gas & Coal — (0.0)% | ||||||||||
BP PLC ADR | 34 | (1,026 | ) | |||||||
Noble Corp. PLC | 45,700 | (472,995 | ) | |||||||
|
| |||||||||
| (474,021 | ) | |||||||||
|
| |||||||||
Semiconductors — (0.0)% | ||||||||||
ARM Holdings PLC ADR (b) | 24,400 | (1,066,036 | ) | |||||||
|
| |||||||||
Software — (0.0)% | ||||||||||
Atlassian Corp. PLC Class A (b) | 5,000 | (125,750 | ) | |||||||
|
| |||||||||
See Notes to Consolidated Financial Statements.
155
Blackstone Alternative Multi-Strategy Fund and Subsidiaries
Consolidated Schedule of Investments (Continued)
March 31, 2016
Security Description | Shares | Value | ||||||||
Utilities — (0.0)% | ||||||||||
National Grid PLC ADR | 1 | $ | (71 | ) | ||||||
|
| |||||||||
Total United Kingdom |
| (3,595,415 | ) | |||||||
|
| |||||||||
United States — (17.9)% | ||||||||||
Aerospace & Defense — (0.1)% | ||||||||||
Boeing Co. (The) | 7,200 | (913,968 | ) | |||||||
Harris Corp. | 18 | (1,402 | ) | |||||||
Sturm Ruger & Co., Inc. | 4,100 | (280,358 | ) | |||||||
Taser International, Inc. | 95,100 | (1,866,813 | ) | |||||||
Teledyne Technologies, Inc. | 2,200 | (193,908 | ) | |||||||
Woodward, Inc. | 8,500 | (442,170 | ) | |||||||
|
| |||||||||
| (3,698,619 | ) | |||||||||
|
| |||||||||
Apparel & Textile Products — (0.4)% | ||||||||||
Columbia Sportswear Co. | 800 | (48,072 | ) | |||||||
Crocs, Inc. | 3,700 | (35,594 | ) | |||||||
Deckers Outdoor Corp. | 1,000 | (59,910 | ) | |||||||
Iconix Brand Group, Inc. | 44,700 | (359,835 | ) | |||||||
Lakeland Industries, Inc. | 2,100 | (25,767 | ) | |||||||
Michael Kors Holdings Ltd. | 17,400 | (991,104 | ) | |||||||
Sequential Brands Group, Inc. | 1,700 | (10,863 | ) | |||||||
Steven Madden Ltd. | 8,300 | (307,432 | ) | |||||||
Tumi Holdings, Inc. | 8,100 | (217,242 | ) | |||||||
Under Armour, Inc. Class A (b) | 183,670 | (15,580,726 | ) | |||||||
VF Corp. | 2,500 | (161,900 | ) | |||||||
Wolverine World Wide, Inc. | 300 | (5,526 | ) | |||||||
|
| |||||||||
| (17,803,971 | ) | |||||||||
|
| |||||||||
Asset Management — (0.3)% | ||||||||||
Acacia Research Corp. | 8,600 | (32,594 | ) | |||||||
American Capital Ltd. | 2,300 | (35,052 | ) | |||||||
Ameriprise Financial, Inc. | 21,403 | (2,012,096 | ) | |||||||
Artisan Partners Asset Management, Inc. Class A | 19,400 | (598,296 | ) | |||||||
BlackRock, Inc. | 800 | (272,456 | ) | |||||||
Eaton Vance Corp. (b) | 22,415 | (751,351 | ) | |||||||
Fifth Street Asset Management, Inc. | 1,900 | (5,814 | ) | |||||||
Franklin Resources, Inc. (b) | 12,025 | (469,576 | ) | |||||||
Full Circle Capital Corp. | 4,400 | (11,352 | ) | |||||||
Ladenburg Thalmann Financial Services, Inc. | 100 | (250 | ) | |||||||
Medley Capital Corp. | 16,600 | (109,560 | ) | |||||||
T Rowe Price Group, Inc. | 90,225 | (6,627,928 | ) | |||||||
Waddell & Reed Financial, Inc. Class A (b) | 17,935 | (422,190 | ) | |||||||
WisdomTree Investments, Inc. | 48,800 | (557,784 | ) | |||||||
|
| |||||||||
| (11,906,299 | ) | |||||||||
|
| |||||||||
See Notes to Consolidated Financial Statements.
156
Blackstone Alternative Multi-Strategy Fund and Subsidiaries
Consolidated Schedule of Investments (Continued)
March 31, 2016
Security Description | Shares | Value | ||||||||
Automotive — (0.5)% | ||||||||||
Cooper Tire & Rubber Co. | 5,300 | $ | (196,206 | ) | ||||||
Dorman Products, Inc. | 2,400 | (130,608 | ) | |||||||
Federal-Mogul Holdings Corp. | 1,809 | (17,873 | ) | |||||||
Ford Motor Co. | 52,300 | (706,050 | ) | |||||||
Gentherm, Inc. | 5,100 | (212,109 | ) | |||||||
Harley-Davidson, Inc. (b) | 5,710 | (293,094 | ) | |||||||
Harman International Industries, Inc. (b) | 3,010 | (268,011 | ) | |||||||
Metaldyne Performance Group, Inc. | 300 | (5,043 | ) | |||||||
Mobileye NV | 66,000 | (2,461,140 | ) | |||||||
Tesla Motors, Inc. | 67,500 | (15,509,475 | ) | |||||||
|
| |||||||||
| (19,799,609 | ) | |||||||||
|
| |||||||||
Banking — (0.2)% | ||||||||||
Banc of California, Inc. | 7,500 | (131,250 | ) | |||||||
Bank of America Corp. | 485,725 | (6,567,002 | ) | |||||||
Bank of Hawaii Corp. | 9,700 | (662,316 | ) | |||||||
BOK Financial Corp. | 2,200 | (120,164 | ) | |||||||
Commerce Bancshares, Inc. | 2,580 | (115,971 | ) | |||||||
Community Bank System, Inc. | 2,400 | (91,704 | ) | |||||||
ConnectOne Bancorp, Inc. | 23 | (376 | ) | |||||||
CVB Financial Corp. | 300 | (5,235 | ) | |||||||
Eagle Bancorp, Inc. | 2,000 | (96,000 | ) | |||||||
EverBank Financial Corp. | 6,200 | (93,558 | ) | |||||||
First Financial Bankshares, Inc. | 1,900 | (56,202 | ) | |||||||
Fulton Financial Corp. | 100 | (1,338 | ) | |||||||
Hilltop Holdings, Inc. | 200 | (3,776 | ) | |||||||
Home BancShares, Inc. | 1,000 | (40,950 | ) | |||||||
JPMorgan Chase & Co. | 3,600 | (213,192 | ) | |||||||
Kearny Financial Corp. | 7,100 | (87,685 | ) | |||||||
LegacyTexas Financial Group, Inc. | 2,700 | (53,055 | ) | |||||||
MB Financial, Inc. | 1,736 | (56,333 | ) | |||||||
Northwest Bancshares, Inc. | 3,100 | (41,881 | ) | |||||||
PacWest Bancorp | 1 | (37 | ) | |||||||
People’s United Financial, Inc. | 56,500 | (900,045 | ) | |||||||
Renasant Corp. | 200 | (6,582 | ) | |||||||
Sterling Bancorp | 44,108 | (702,641 | ) | |||||||
Texas Capital Bancshares, Inc. | 6,400 | (245,632 | ) | |||||||
TFS Financial Corp. | 18,552 | (322,248 | ) | |||||||
Towne Bank | 40 | (768 | ) | |||||||
UMB Financial Corp. | 1,100 | (56,793 | ) | |||||||
Valley National Bancorp | 4,700 | (44,838 | ) | |||||||
Webster Financial Corp. | 1,000 | (35,900 | ) | |||||||
|
| |||||||||
| (10,753,472 | ) | |||||||||
|
| |||||||||
See Notes to Consolidated Financial Statements.
157
Blackstone Alternative Multi-Strategy Fund and Subsidiaries
Consolidated Schedule of Investments (Continued)
March 31, 2016
Security Description | Shares | Value | ||||||||
Biotechnology & Pharmaceuticals — (1.5)% | ||||||||||
Abeona Therapeutics, Inc. | 600 | $ | (1,536 | ) | ||||||
ACADIA Pharmaceuticals, Inc. | 26,600 | (743,736 | ) | |||||||
Acceleron Pharma, Inc. | 200 | (5,278 | ) | |||||||
AcelRx Pharmaceuticals, Inc. | 300 | (924 | ) | |||||||
Achillion Pharmaceuticals, Inc. | 62,500 | (482,500 | ) | |||||||
Actinium Pharmaceuticals, Inc. | 32,800 | (65,272 | ) | |||||||
Advaxis, Inc. | 16,600 | (149,898 | ) | |||||||
Aegerion Pharmaceuticals, Inc. | 36,400 | (134,680 | ) | |||||||
Aerie Pharmaceuticals, Inc. | 16,100 | (195,776 | ) | |||||||
Agenus, Inc. | 8,900 | (37,024 | ) | |||||||
Aimmune Therapeutics, Inc. | 500 | (6,780 | ) | |||||||
Akebia Therapeutics, Inc. | 22,500 | (202,725 | ) | |||||||
Alder Biopharmaceuticals, Inc. | 9,000 | (220,410 | ) | |||||||
Alimera Sciences, Inc. | 300 | (525 | ) | |||||||
Allergan PLC (b) | 8,830 | (2,366,705 | ) | |||||||
AMAG Pharmaceuticals, Inc. | 2,800 | (65,520 | ) | |||||||
Amicus Therapeutics, Inc. | 32,400 | (273,780 | ) | |||||||
Ampio Pharmaceuticals, Inc. | 17,400 | (39,150 | ) | |||||||
Anacor Pharmaceuticals, Inc. | 3,400 | (181,730 | ) | |||||||
Anavex Life Sciences Corp. | 22,500 | (110,250 | ) | |||||||
ANI Pharmaceuticals, Inc. | 800 | (26,928 | ) | |||||||
Anthera Pharmaceuticals, Inc. | 16,700 | (60,454 | ) | |||||||
Aratana Therapeutics, Inc. | 6,100 | (33,672 | ) | |||||||
Arena Pharmaceuticals, Inc. | 31,000 | (61,070 | ) | |||||||
ARIAD Pharmaceuticals, Inc. | 3,800 | (24,282 | ) | |||||||
Arrowhead Pharmaceuticals, Inc. | 78,300 | (377,406 | ) | |||||||
Atara Biotherapeutics, Inc. | 3,000 | (57,090 | ) | |||||||
AVEO Pharmaceuticals, Inc. | 5,200 | (4,784 | ) | |||||||
Axovant Sciences Ltd. | 400 | (4,592 | ) | |||||||
BIND Therapeutics, Inc. | 1,500 | (3,300 | ) | |||||||
Biocept, Inc. | 1,000 | (1,290 | ) | |||||||
BioCryst Pharmaceuticals, Inc. | 9,800 | (27,734 | ) | |||||||
BioDelivery Sciences International, Inc. | 79,800 | (257,754 | ) | |||||||
BioTime, Inc. | 200 | (574 | ) | |||||||
Bluebird Bio, Inc. | 7,400 | (314,500 | ) | |||||||
Blueprint Medicines Corp. | 4,700 | (84,835 | ) | |||||||
Brainstorm Cell Therapeutics, Inc. | 3,200 | (8,544 | ) | |||||||
Caladrius Biosciences, Inc. | 11,600 | (8,700 | ) | |||||||
Calithera Biosciences, Inc. | 1,200 | (6,816 | ) | |||||||
Cambrex Corp. | 500 | (22,000 | ) | |||||||
Catalyst Pharmaceutical Partners, Inc. | 2,500 | (2,925 | ) | |||||||
Celator Pharmaceuticals, Inc. | 5,500 | (60,665 | ) | |||||||
Celgene Corp. (b) | 1,500 | (150,135 | ) | |||||||
Celldex Therapeutics, Inc. | 39,200 | (148,176 | ) | |||||||
Cellular Biomedicine Group, Inc. | 100 | (1,865 | ) | |||||||
See Notes to Consolidated Financial Statements.
158
Blackstone Alternative Multi-Strategy Fund and Subsidiaries
Consolidated Schedule of Investments (Continued)
March 31, 2016
Security Description | Shares | Value | ||||||||
Cempra, Inc. | 10,900 | $ | (190,968 | ) | ||||||
Clovis Oncology, Inc. | 500 | (9,600 | ) | |||||||
Coherus Biosciences, Inc. | 1,400 | (29,722 | ) | |||||||
Conatus Pharmaceuticals, Inc. | 9,700 | (20,758 | ) | |||||||
CorMedix, Inc. | 1,200 | (3,180 | ) | |||||||
CTI BioPharma Corp. | 15,800 | (8,396 | ) | |||||||
CytRx Corp. | 49,000 | (131,320 | ) | |||||||
Dicerna Pharmaceuticals, Inc. | 2,800 | (15,008 | ) | |||||||
Discovery Laboratories, Inc. | 28 | (46 | ) | |||||||
Dynavax Technologies Corp. | 30 | (577 | ) | |||||||
Eagle Pharmaceuticals, Inc. | 25,900 | (1,048,950 | ) | |||||||
Egalet Corp. | 100 | (686 | ) | |||||||
Enanta Pharmaceuticals, Inc. | 13,600 | (399,432 | ) | |||||||
Endo International PLC | 29,700 | (836,055 | ) | |||||||
Endocyte, Inc. | 12,100 | (37,510 | ) | |||||||
EPIRUS Biopharmaceuticals, Inc. | 700 | (1,883 | ) | |||||||
Epizyme, Inc. | 7,900 | (95,748 | ) | |||||||
Esperion Therapeutics, Inc. | 8,500 | (143,735 | ) | |||||||
FibroGen, Inc. | 500 | (10,645 | ) | |||||||
Fortress Biotech, Inc. | 100 | (310 | ) | |||||||
Galectin Therapeutics, Inc. | 1,800 | (2,574 | ) | |||||||
Galena Biopharma, Inc. | 98,600 | (134,096 | ) | |||||||
Geron Corp. | 27,700 | (80,884 | ) | |||||||
Global Blood Therapeutics, Inc. | 1,500 | (23,790 | ) | |||||||
Heron Therapeutics, Inc. | 36,400 | (691,236 | ) | |||||||
Idera Pharmaceuticals, Inc. | 30,900 | (61,182 | ) | |||||||
ImmunoGen, Inc. (b) | 8,800 | (74,976 | ) | |||||||
Immunomedics, Inc. | 500 | (1,250 | ) | |||||||
Incyte Corp. (b) | 83,685 | (6,064,652 | ) | |||||||
Infinity Pharmaceuticals, Inc. | 100 | (527 | ) | |||||||
Inovio Pharmaceuticals, Inc. | 96,900 | (843,999 | ) | |||||||
Insmed, Inc. | 1,100 | (13,937 | ) | |||||||
Intercept Pharmaceuticals, Inc. | 1,200 | (154,164 | ) | |||||||
Intersect ENT, Inc. | 1,100 | (20,900 | ) | |||||||
Intra-Cellular Therapies, Inc. | 7,400 | (205,720 | ) | |||||||
Intrexon Corp. | 9,700 | (328,733 | ) | |||||||
Johnson & Johnson (b) | 42,810 | (4,632,042 | ) | |||||||
Juno Therapeutics, Inc. | 25,800 | (982,722 | ) | |||||||
Karyopharm Therapeutics, Inc. | 13,700 | (122,204 | ) | |||||||
Keryx Biopharmaceuticals, Inc. | 142,200 | (664,074 | ) | |||||||
Kite Pharma, Inc. | 16,600 | (762,106 | ) | |||||||
La Jolla Pharmaceutical Co. | 3,100 | (64,821 | ) | |||||||
Lexicon Pharmaceuticals, Inc. | 11,085 | (132,466 | ) | |||||||
Lion Biotechnologies, Inc. | 1,500 | (7,620 | ) | |||||||
Lipocine, Inc. | 900 | (9,135 | ) | |||||||
MannKind Corp. | 106,200 | (170,982 | ) | |||||||
See Notes to Consolidated Financial Statements.
159
Blackstone Alternative Multi-Strategy Fund and Subsidiaries
Consolidated Schedule of Investments (Continued)
March 31, 2016
Security Description | Shares | Value | ||||||||
Mast Therapeutics, Inc. | 8,900 | $ | (2,439 | ) | ||||||
Medivation, Inc. | 12,000 | (551,760 | ) | |||||||
MEI Pharma, Inc. | 6,300 | (7,938 | ) | |||||||
Mylan NV (b) | 122,220 | (5,664,897 | ) | |||||||
NanoViricides, Inc. | 400 | (876 | ) | |||||||
NantKwest, Inc. | 5,100 | (41,922 | ) | |||||||
Natural Health Trends Corp. | 8,700 | (288,405 | ) | |||||||
Nektar Therapeutics | 11,700 | (160,875 | ) | |||||||
Neuralstem, Inc. | 12,400 | (9,300 | ) | |||||||
NewLink Genetics Corp. | 5,100 | (92,820 | ) | |||||||
Northwest Biotherapeutics, Inc. | 6,500 | (9,490 | ) | |||||||
Novavax, Inc. | 200 | (1,032 | ) | |||||||
Ocular Therapeutix, Inc. | 800 | (7,728 | ) | |||||||
Ohr Pharmaceutical, Inc. | 13,000 | (41,730 | ) | |||||||
Omeros Corp. | 2,900 | (44,486 | ) | |||||||
OncoGenex Pharmaceuticals, Inc. | 1,000 | (684 | ) | |||||||
OncoMed Pharmaceuticals, Inc. | 200 | (2,022 | ) | |||||||
Oncothyreon, Inc. | 11,700 | (14,859 | ) | |||||||
Opexa Therapeutics, Inc. | 200 | (464 | ) | |||||||
Orexigen Therapeutics, Inc. | 37,398 | (21,044 | ) | |||||||
Organovo Holdings, Inc. | 91,700 | (198,989 | ) | |||||||
Otonomy, Inc. | 300 | (4,476 | ) | |||||||
OXiGENE, Inc. | 9,700 | (7,703 | ) | |||||||
Pacira Pharmaceuticals, Inc. | 800 | (42,384 | ) | |||||||
Peregrine Pharmaceuticals, Inc. | 4,800 | (2,018 | ) | |||||||
Pernix Therapeutics Holdings, Inc. | 50,700 | (53,235 | ) | |||||||
Perrigo Co. PLC (b) | 65,080 | (8,325,684 | ) | |||||||
Pfizer, Inc. (b) | 444,882 | (13,186,302 | ) | |||||||
Pluristem Therapeutics, Inc. | 800 | (1,288 | ) | |||||||
Progenics Pharmaceuticals, Inc. | 700 | (3,052 | ) | |||||||
Provectus Biopharmaceuticals, Inc. Class A | 1,400 | (529 | ) | |||||||
Puma Biotechnology, Inc. | 20,600 | (605,022 | ) | |||||||
Raptor Pharmaceutical Corp. (b) | 24,600 | (113,160 | ) | |||||||
Regeneron Pharmaceuticals, Inc. (b) | 7,620 | (2,746,553 | ) | |||||||
REGENXBIO, Inc. | 200 | (2,160 | ) | |||||||
Regulus Therapeutics, Inc. | 1,800 | (12,474 | ) | |||||||
Relypsa, Inc. | 9,700 | (131,435 | ) | |||||||
Repros Therapeutics, Inc. | 17,400 | (16,878 | ) | |||||||
Retrophin, Inc. (b) | 4,800 | (65,568 | ) | |||||||
Revance Therapeutics, Inc. | 6,000 | (104,760 | ) | |||||||
Rexahn Pharmaceuticals, Inc. | 26,600 | (8,781 | ) | |||||||
RXI Pharmaceuticals | 6,700 | (1,809 | ) | |||||||
Sage Therapeutics, Inc. | 2,700 | (86,562 | ) | |||||||
Sagent Pharmaceuticals, Inc. | 500 | (6,085 | ) | |||||||
Sarepta Therapeutics, Inc. | 20,200 | (394,304 | ) | |||||||
Seres Therapeutics, Inc. (b) | 3,400 | (90,304 | ) | |||||||
See Notes to Consolidated Financial Statements.
160
Blackstone Alternative Multi-Strategy Fund and Subsidiaries
Consolidated Schedule of Investments (Continued)
March 31, 2016
Security Description | Shares | Value | ||||||||
Sorrento Therapeutics, Inc. | 1,900 | $ | (10,222 | ) | ||||||
StemCells, Inc. | 10,300 | (2,684 | ) | |||||||
Sunesis Pharmaceuticals, Inc. | 1,400 | (756 | ) | |||||||
Supernus Pharmaceuticals, Inc. | 3,700 | (56,425 | ) | |||||||
Synergy Pharmaceuticals, Inc. | 31,800 | (87,768 | ) | |||||||
Synta Pharmaceuticals Corp. | 9,000 | (2,160 | ) | |||||||
Synthetic Biologics, Inc. | 40,400 | (95,344 | ) | |||||||
Teligent, Inc. | 18,200 | (89,180 | ) | |||||||
Tenax Therapeutics, Inc. | 1,700 | (3,485 | ) | |||||||
TESARO, Inc. | 500 | (22,015 | ) | |||||||
TG Therapeutics, Inc. | 11,000 | (93,720 | ) | |||||||
TherapeuticsMD, Inc. | 65,300 | (417,920 | ) | |||||||
Tonix Pharmaceuticals Holding Corp. | 7,900 | (19,039 | ) | |||||||
Trevena, Inc. | 100 | (827 | ) | |||||||
Ultragenyx Pharmaceutical, Inc. | 2,600 | (164,606 | ) | |||||||
Valeant Pharmaceuticals International, Inc. | 46,800 | (1,230,840 | ) | |||||||
Versartis, Inc. | 100 | (802 | ) | |||||||
Vertex Pharmaceuticals, Inc. (b) | 20,030 | (1,592,185 | ) | |||||||
Vitae Pharmaceuticals, Inc. | 2,500 | (16,575 | ) | |||||||
Vital Therapies, Inc. | 3,800 | (34,466 | ) | |||||||
VIVUS, Inc. | 57,900 | (81,060 | ) | |||||||
Xencor, Inc. | 1,500 | (20,130 | ) | |||||||
Zafgen, Inc. | 17,200 | (114,896 | ) | |||||||
ZIOPHARM Oncology, Inc. | 105,546 | (783,151 | ) | |||||||
Zogenix, Inc. | 7,925 | (73,227 | ) | |||||||
|
| |||||||||
| (64,459,380 | ) | |||||||||
|
| |||||||||
Chemicals — (0.1)% | ||||||||||
Albemarle Corp. | 13,375 | (855,064 | ) | |||||||
Amyris, Inc. | 100 | (111 | ) | |||||||
Balchem Corp. | 7,200 | (446,544 | ) | |||||||
Ferro Corp. | 10,000 | (118,700 | ) | |||||||
HB Fuller Co. | 500 | (21,225 | ) | |||||||
iBio, Inc. | 10,800 | (6,158 | ) | |||||||
International Flavors & Fragrances, Inc. | 3,100 | (352,687 | ) | |||||||
Kronos Worldwide, Inc. | 2,100 | (12,012 | ) | |||||||
Marrone Bio Innovations, Inc. | 100 | (90 | ) | |||||||
Mosaic Co. (The) | 2,300 | (62,100 | ) | |||||||
Olin Corp. | 15,600 | (270,972 | ) | |||||||
Platform Specialty Products Corp. | 157,500 | (1,354,500 | ) | |||||||
PolyOne Corp. | 100 | (3,025 | ) | |||||||
Rayonier Advanced Materials, Inc. | 41,300 | (392,350 | ) | |||||||
Rentech, Inc. | 4,390 | (9,746 | ) | |||||||
Sensient Technologies Corp. | 400 | (25,384 | ) | |||||||
Tronox Ltd. Class A | 64,200 | (410,238 | ) | |||||||
Valspar Corp. (The) | 1,900 | (203,338 | ) | |||||||
|
| |||||||||
| (4,544,244 | ) | |||||||||
|
| |||||||||
See Notes to Consolidated Financial Statements.
161
Blackstone Alternative Multi-Strategy Fund and Subsidiaries
Consolidated Schedule of Investments (Continued)
March 31, 2016
Security Description | Shares | Value | ||||||||
Commercial Services — (0.2)% | ||||||||||
ADT Corp. | 140,000 | $ | (5,776,400 | ) | ||||||
Advisory Board Co. (The) | 2,500 | (80,625 | ) | |||||||
Ascent Capital Group, Inc. Class A | 2,000 | (29,620 | ) | |||||||
Barrett Business Services, Inc. | 200 | (5,750 | ) | |||||||
CEB, Inc. | 3,300 | (213,609 | ) | |||||||
FTI Consulting, Inc. | 600 | (21,306 | ) | |||||||
H&R Block, Inc. | 3,400 | (89,828 | ) | |||||||
Healthcare Services Group, Inc. | 1,600 | (58,896 | ) | |||||||
Huron Consulting Group, Inc. | 100 | (5,819 | ) | |||||||
InterCloud Systems, Inc. | 21,940 | (20,843 | ) | |||||||
LifeLock, Inc. | 27,600 | (333,132 | ) | |||||||
On Assignment, Inc. | 400 | (14,768 | ) | |||||||
Rollins, Inc. | 50 | (1,356 | ) | |||||||
TriNet Group, Inc. | 5,900 | (84,665 | ) | |||||||
|
| |||||||||
| (6,736,617 | ) | |||||||||
|
| |||||||||
Construction Materials — (0.0)% | ||||||||||
Louisiana-Pacific Corp. | 19,600 | (335,552 | ) | |||||||
Martin Marietta Materials, Inc. | 30 | (4,785 | ) | |||||||
Trex Co., Inc. | 1,300 | (62,309 | ) | |||||||
|
| |||||||||
| (402,646 | ) | |||||||||
|
| |||||||||
Consumer Products — (1.0)% | ||||||||||
22nd Century Group, Inc. | 1,000 | (783 | ) | |||||||
Alliance One International, Inc. | 100 | (1,756 | ) | |||||||
Avon Products, Inc. | 293,700 | (1,412,697 | ) | |||||||
B&G Foods, Inc. | 2,700 | (93,987 | ) | |||||||
Boston Beer Co., Inc. (The) Class A (b) | 2,430 | (449,720 | ) | |||||||
Brown-Forman Corp. Class B (b) | 7,250 | (713,908 | ) | |||||||
Campbell Soup Co. | 700 | (44,653 | ) | |||||||
Coca-Cola Bottling Co. Consolidated | 100 | (15,976 | ) | |||||||
Coca-Cola Co. (The) | 50,900 | (2,361,251 | ) | |||||||
Coty, Inc. Class A | 51,680 | (1,438,254 | ) | |||||||
Dr Pepper Snapple Group, Inc. (b) | 2,300 | (205,666 | ) | |||||||
Elizabeth Arden, Inc. | 1,600 | (13,104 | ) | |||||||
Flowers Foods, Inc. | 18,400 | (339,664 | ) | |||||||
General Mills, Inc. | 88,900 | (5,631,815 | ) | |||||||
Hain Celestial Group, Inc. (b) | 5,970 | (244,233 | ) | |||||||
Helen of Troy Ltd. | 1,400 | (145,166 | ) | |||||||
Hormel Foods Corp. | 149,200 | (6,451,408 | ) | |||||||
Inventure Foods, Inc. | 300 | (1,695 | ) | |||||||
Kraft Heinz Co. (The) | 174,200 | (13,685,152 | ) | |||||||
Lancaster Colony Corp. | 1,700 | (187,969 | ) | |||||||
McCormick & Co., Inc. | 22,400 | (2,228,352 | ) | |||||||
See Notes to Consolidated Financial Statements.
162
Blackstone Alternative Multi-Strategy Fund and Subsidiaries
Consolidated Schedule of Investments (Continued)
March 31, 2016
Security Description | Shares | Value | ||||||||
National Beverage Corp. | 100 | $ | (4,232 | ) | ||||||
Procter & Gamble Co. | 1,000 | (82,310 | ) | |||||||
Reynolds American, Inc. | 78,300 | (3,939,273 | ) | |||||||
Sanderson Farms, Inc. | 2,300 | (207,414 | ) | |||||||
Snyder’s-Lance, Inc. | 2,800 | (88,144 | ) | |||||||
Tootsie Roll Industries, Inc. | 2,575 | (89,970 | ) | |||||||
TreeHouse Foods, Inc. | 14,800 | (1,283,900 | ) | |||||||
Universal Corp. | 900 | (51,129 | ) | |||||||
WhiteWave Foods Co. (The) | 13,100 | (532,384 | ) | |||||||
|
| |||||||||
| (41,945,965 | ) | |||||||||
|
| |||||||||
Consumer Services — (0.0)% | ||||||||||
Bright Horizons Family Solutions, Inc. | 100 | (6,478 | ) | |||||||
Grand Canyon Education, Inc. | 600 | (25,644 | ) | |||||||
ITT Educational Services, Inc. | 3,800 | (11,742 | ) | |||||||
Weight Watchers International, Inc. | 89,400 | (1,298,982 | ) | |||||||
|
| |||||||||
| (1,342,846 | ) | |||||||||
|
| |||||||||
Containers & Packaging — (0.0)% | ||||||||||
3M Co. | 100 | (16,663 | ) | |||||||
International Paper Co. | 3,900 | (160,056 | ) | |||||||
KapStone Paper and Packaging Corp. | 4,800 | (66,480 | ) | |||||||
Packaging Corp. of America | 1,600 | (96,640 | ) | |||||||
ZAGG, Inc. | 100 | (901 | ) | |||||||
|
| |||||||||
| (340,740 | ) | |||||||||
|
| |||||||||
Design, Manufacturing & Distribution — (0.0)% | ||||||||||
Jabil Circuit, Inc. | 7,900 | (152,233 | ) | |||||||
Sanmina Corp. (b) | 13,890 | (324,748 | ) | |||||||
|
| |||||||||
| (476,981 | ) | |||||||||
|
| |||||||||
Distributors—Consumer Staples — (0.0)% | ||||||||||
Calavo Growers, Inc. | 100 | (5,706 | ) | |||||||
Core-Mark Holding Co., Inc. | 12,600 | (1,027,656 | ) | |||||||
Sysco Corp. (b) | 4,500 | (210,285 | ) | |||||||
|
| |||||||||
| (1,243,647 | ) | |||||||||
|
| |||||||||
Distributors—Discretionary — (0.1)% | ||||||||||
Fastenal Co. | 50,100 | (2,454,900 | ) | |||||||
FTD Cos., Inc. | 1,600 | (42,000 | ) | |||||||
Ingram Micro, Inc. Class A | 1,200 | (43,092 | ) | |||||||
LKQ Corp. | 20,400 | (651,372 | ) | |||||||
Pool Corp. | 200 | (17,548 | ) | |||||||
Tech Data Corp. (b) | 2,800 | (214,956 | ) | |||||||
|
| |||||||||
| (3,423,868 | ) | |||||||||
|
| |||||||||
See Notes to Consolidated Financial Statements.
163
Blackstone Alternative Multi-Strategy Fund and Subsidiaries
Consolidated Schedule of Investments (Continued)
March 31, 2016
Security Description | Shares | Value | ||||||||
Electrical Equipment — (0.1)% | ||||||||||
Allied Motion Technologies, Inc. | 100 | $ | (1,800 | ) | ||||||
Badger Meter, Inc. | 1,000 | (66,510 | ) | |||||||
Capstone Turbine Corp. | 1,585 | (2,536 | ) | |||||||
Cognex Corp. | 6,800 | (264,860 | ) | |||||||
Energous Corp. | 9,200 | (92,920 | ) | |||||||
Energy Focus, Inc. | 5,100 | (37,893 | ) | |||||||
General Cable Corp. | 31,500 | (384,615 | ) | |||||||
General Electric Co. | 40,400 | (1,284,316 | ) | |||||||
Giga-tronics, Inc. | 2,800 | (4,088 | ) | |||||||
Keysight Technologies, Inc. | 200 | (5,548 | ) | |||||||
Landauer, Inc. | 100 | (3,307 | ) | |||||||
Revolution Lighting Technology, Inc. | 860 | (4,524 | ) | |||||||
Roper Industries, Inc. (b) | 2,700 | (493,479 | ) | |||||||
|
| |||||||||
| (2,646,396 | ) | |||||||||
|
| |||||||||
Engineering & Construction Services — (0.0)% | ||||||||||
AECOM | 2,080 | (64,043 | ) | |||||||
Dycom Industries, Inc. | 1,800 | (116,406 | ) | |||||||
Installed Building Products, Inc. | 200 | (5,322 | ) | |||||||
KBR, Inc. | 30,600 | (473,688 | ) | |||||||
Primoris Services Corp. | 100 | (2,430 | ) | |||||||
Willbros Group, Inc. | 1,100 | (2,343 | ) | |||||||
|
| |||||||||
| (664,232 | ) | |||||||||
|
| |||||||||
Forest & Paper Products — (0.0)% | ||||||||||
Neenah Paper, Inc. | 200 | (12,732 | ) | |||||||
Schweitzer-Mauduit International, Inc. | 100 | (3,148 | ) | |||||||
|
| |||||||||
| (15,880 | ) | |||||||||
|
| |||||||||
Gaming, Lodging & Restaurants — (0.9)% | ||||||||||
Brinker International, Inc. | 3,800 | (174,610 | ) | |||||||
Cheesecake Factory, Inc. | 12,700 | (674,243 | ) | |||||||
Chipotle Mexican Grill, Inc. | 32,100 | (15,118,137 | ) | |||||||
Fogo De Chao, Inc. | 1,700 | (26,537 | ) | |||||||
Jamba, Inc. | 6,700 | (82,812 | ) | |||||||
Las Vegas Sands Corp. | 88,900 | (4,594,352 | ) | |||||||
Morgans Hotel Group Co. | 900 | (1,242 | ) | |||||||
Norwegian Cruise Line Holdings Ltd. | 400 | (22,116 | ) | |||||||
Panera Bread Co. Class A | 7,800 | (1,597,674 | ) | |||||||
Papa Murphy’s Holdings, Inc. | 400 | (4,780 | ) | |||||||
Pinnacle Entertainment, Inc. | 16,200 | (568,620 | ) | |||||||
Rave Restaurant Group, Inc. | 500 | (2,660 | ) | |||||||
Scientific Games Corp. Class A | 51,800 | (488,474 | ) | |||||||
Wynn Resorts Ltd. | 164,100 | (15,331,863 | ) | |||||||
See Notes to Consolidated Financial Statements.
164
Blackstone Alternative Multi-Strategy Fund and Subsidiaries
Consolidated Schedule of Investments (Continued)
March 31, 2016
Security Description | Shares | Value | ||||||||
Zoe’s Kitchen, Inc. | 18,700 | $ | (729,113 | ) | ||||||
|
| |||||||||
| (39,417,233 | ) | |||||||||
|
| |||||||||
Hardware — (0.5)% | ||||||||||
3D Systems Corp. | 69,000 | (1,067,430 | ) | |||||||
ADTRAN, Inc. | 800 | (16,176 | ) | |||||||
Aerohive Networks, Inc. | 2,800 | (13,972 | ) | |||||||
Apple, Inc. | 85,300 | (9,296,847 | ) | |||||||
ARRIS International PLC | 8,300 | (190,236 | ) | |||||||
Ciena Corp. (b) | 224,600 | (4,271,892 | ) | |||||||
Cisco Systems, Inc. (b) | 7,200 | (204,984 | ) | |||||||
Diebold, Inc. | 4,300 | (124,313 | ) | |||||||
Digital Ally, Inc. | 9,800 | (48,510 | ) | |||||||
ExOne Co. | 8,100 | (106,434 | ) | |||||||
Extreme Networks, Inc. | 3,800 | (11,818 | ) | |||||||
F5 Networks, Inc. (b) | 3,900 | (412,815 | ) | |||||||
FEI Co. | 16,200 | (1,441,962 | ) | |||||||
Fitbit, Inc. | 22,900 | (346,935 | ) | |||||||
GoPro, Inc. Class A | 175,100 | (2,094,196 | ) | |||||||
Identiv, Inc. | 1,700 | (3,672 | ) | |||||||
Imax Corp. | 7,900 | (245,611 | ) | |||||||
MicroVision, Inc. | 19,700 | (36,839 | ) | |||||||
Mitel Networks Corp. | 5,278 | (43,174 | ) | |||||||
Neonode, Inc. | 6,100 | (12,444 | ) | |||||||
NETGEAR, Inc. (b) | 4,700 | (189,739 | ) | |||||||
NetScout Systems, Inc. | 900 | (20,673 | ) | |||||||
Nimble Storage, Inc. | 15,500 | (121,520 | ) | |||||||
Novatel Wireless, Inc. | 8,200 | (14,514 | ) | |||||||
NXT-ID, Inc. | 400 | (232 | ) | |||||||
Plantronics, Inc. | 600 | (23,514 | ) | |||||||
Quantum Corp. | 1,100 | (671 | ) | |||||||
Ruckus Wireless, Inc. | 49,400 | (484,614 | ) | |||||||
Silicon Graphics International Corp. | 2,100 | (14,952 | ) | |||||||
Turtle Beach Corp. | 6,400 | (7,296 | ) | |||||||
Ubiquiti Networks, Inc. | 10,700 | (355,989 | ) | |||||||
ViaSat, Inc. | 3,400 | (249,832 | ) | |||||||
Violin Memory, Inc. | 8,300 | (4,334 | ) | |||||||
Zebra Technologies Corp. Class A | 100 | (6,900 | ) | |||||||
|
| |||||||||
| (21,485,040 | ) | |||||||||
|
| |||||||||
Health Care Facilities & Services — (1.2)% | ||||||||||
AAC Holdings, Inc. | 400 | (7,916 | ) | |||||||
Acadia Healthcare Co., Inc. | 8,200 | (451,902 | ) | |||||||
Adeptus Health, Inc. Class A | 8,700 | (483,198 | ) | |||||||
Aetna, Inc. | 36,549 | (4,106,280 | ) | |||||||
Amsurg Corp. | 100 | (7,460 | ) | |||||||
See Notes to Consolidated Financial Statements.
165
Blackstone Alternative Multi-Strategy Fund and Subsidiaries
Consolidated Schedule of Investments (Continued)
March 31, 2016
Security Description | Shares | Value | ||||||||
BioScrip, Inc. | 40,000 | $ | (85,600 | ) | ||||||
Brookdale Senior Living, Inc. | 44,891 | (712,869 | ) | |||||||
Charles River Laboratories International, Inc. (b) | 2,000 | (151,880 | ) | |||||||
Chemed Corp. | 200 | (27,076 | ) | |||||||
DaVita HealthCare Partners, Inc. (b) | 101,145 | (7,422,020 | ) | |||||||
Diplomat Pharmacy, Inc. | 39,700 | (1,087,780 | ) | |||||||
ExamWorks Group, Inc. | 8,500 | (251,260 | ) | |||||||
Express Scripts Holding Co. (b) | 178,150 | (12,237,124 | ) | |||||||
Genesis Healthcare, Inc. | 500 | (1,160 | ) | |||||||
HealthEquity, Inc. | 6,500 | (160,355 | ) | |||||||
Henry Schein, Inc. (b) | 65,700 | (11,341,791 | ) | |||||||
ICON PLC (b) | 6,900 | (518,190 | ) | |||||||
Kindred Healthcare, Inc. | 18,649 | (230,315 | ) | |||||||
MEDNAX, Inc. | 79,500 | (5,137,290 | ) | |||||||
Natera, Inc. | 300 | (2,856 | ) | |||||||
NeoGenomics, Inc. | 100 | (674 | ) | |||||||
Nobilis Health Corp. | 1,000 | (3,120 | ) | |||||||
OvaScience, Inc. | 9,200 | (87,308 | ) | |||||||
Owens & Minor, Inc. | 800 | (32,336 | ) | |||||||
PAREXEL International Corp. (b) | 4,900 | (307,377 | ) | |||||||
PRA Health Sciences, Inc. (b) | 4,800 | (205,248 | ) | |||||||
Quest Diagnostics, Inc. (b) | 7,175 | (512,654 | ) | |||||||
Quintiles Transnational Holdings, Inc. (b) | 2,300 | (149,730 | ) | |||||||
Signal Genetics, Inc. | 100 | (51 | ) | |||||||
Surgery Partners, Inc. | 300 | (3,978 | ) | |||||||
Teladoc, Inc. | 800 | (7,680 | ) | |||||||
Tenet Healthcare Corp. | 80,100 | (2,317,293 | ) | |||||||
UnitedHealth Group, Inc. (b) | 16,710 | (2,153,919 | ) | |||||||
|
| |||||||||
| (50,205,690 | ) | |||||||||
|
| |||||||||
Home & Office Products — (0.4)% | ||||||||||
Beazer Homes USA, Inc. | 44,100 | (384,552 | ) | |||||||
Century Communities, Inc. | 2,700 | (46,089 | ) | |||||||
Green Brick Partners, Inc. | 2,300 | (17,457 | ) | |||||||
Hovnanian Enterprises, Inc. Class A | 173,700 | (270,972 | ) | |||||||
iRobot Corp. | 4,100 | (144,730 | ) | |||||||
KB Home | 59,000 | (842,520 | ) | |||||||
LGI Homes, Inc. | 12,500 | (302,625 | ) | |||||||
M/I Homes, Inc. | 3,200 | (59,680 | ) | |||||||
MDC Holdings, Inc. | 33,600 | (842,016 | ) | |||||||
PGT, Inc. | 300 | (2,952 | ) | |||||||
PulteGroup, Inc. | 4,500 | (84,195 | ) | |||||||
St Joe Co. (The) | 2,600 | (44,590 | ) | |||||||
Taylor Morrison Home Corp. Class A | 15,400 | (217,448 | ) | |||||||
Tempur Sealy International, Inc. | 67,400 | (4,097,246 | ) | |||||||
See Notes to Consolidated Financial Statements.
166
Blackstone Alternative Multi-Strategy Fund and Subsidiaries
Consolidated Schedule of Investments (Continued)
March 31, 2016
Security Description | Shares | Value | ||||||||
TRI Pointe Homes, Inc. | 156,300 | $ | (1,841,214 | ) | ||||||
Whirlpool Corp. | 37,100 | (6,690,614 | ) | |||||||
William Lyon Homes Class A | 38,700 | (560,763 | ) | |||||||
|
| |||||||||
| (16,449,663 | ) | |||||||||
|
| |||||||||
Industrial Services — (0.1)% | ||||||||||
DXP Enterprises, Inc. | 1,300 | (22,828 | ) | |||||||
Kaman Corp. | 800 | (34,152 | ) | |||||||
United Rentals, Inc. (b) | 2,290 | (142,415 | ) | |||||||
WW Grainger, Inc. | 14,778 | (3,449,629 | ) | |||||||
|
| |||||||||
| (3,649,024 | ) | |||||||||
|
| |||||||||
Institutional Financial Services — (0.3)% | ||||||||||
CBOE Holdings, Inc. | 46,000 | (3,005,180 | ) | |||||||
FXCM, Inc. Class A | 1,850 | (19,869 | ) | |||||||
Goldman Sachs Group, Inc. | 75,400 | (11,836,292 | ) | |||||||
Morgan Stanley | 1,500 | (37,515 | ) | |||||||
|
| |||||||||
| (14,898,856 | ) | |||||||||
|
| |||||||||
Insurance — (0.4)% | ||||||||||
Ambac Financial Group, Inc. | 800 | (12,640 | ) | |||||||
American International Group, Inc. | 42,200 | (2,280,910 | ) | |||||||
American National Insurance Co. | 100 | (11,550 | ) | |||||||
Assurant, Inc. | 600 | (46,290 | ) | |||||||
Berkshire Hathaway, Inc. Class B | 24,300 | (3,447,684 | ) | |||||||
CNO Financial Group, Inc. | 4,000 | (71,680 | ) | |||||||
Endurance Specialty Holdings Ltd. | 25 | (1,633 | ) | |||||||
Everest Re Group Ltd. | 13,800 | (2,724,534 | ) | |||||||
HCI Group, Inc. | 1,900 | (63,270 | ) | |||||||
MBIA, Inc. | 7,700 | (68,145 | ) | |||||||
National General Holdings Corp. | 300 | (6,477 | ) | |||||||
RLI Corp. | 9,800 | (655,228 | ) | |||||||
Torchmark Corp. | 3,649 | (197,630 | ) | |||||||
Travelers Cos., Inc. | 51,889 | (6,055,965 | ) | |||||||
Willis Towers Watson PLC | 12 | (1,424 | ) | |||||||
|
| |||||||||
| (15,645,060 | ) | |||||||||
|
| |||||||||
Iron & Steel — (0.0)% | ||||||||||
AK Steel Holding Corp. | 225,800 | (932,554 | ) | |||||||
AM Castle & Co. | 1,700 | (4,590 | ) | |||||||
Cliffs Natural Resources, Inc. | 242,700 | (728,100 | ) | |||||||
TimkenSteel Corp. | 3,800 | (34,580 | ) | |||||||
|
| |||||||||
| (1,699,824 | ) | |||||||||
|
| |||||||||
See Notes to Consolidated Financial Statements.
167
Blackstone Alternative Multi-Strategy Fund and Subsidiaries
Consolidated Schedule of Investments (Continued)
March 31, 2016
Security Description | Shares | Value | ||||||||
Leisure Products — (0.1)% | ||||||||||
Arctic Cat, Inc. | 300 | $ | (5,040 | ) | ||||||
Brunswick Corp. | 38,600 | (1,852,028 | ) | |||||||
Mattel, Inc. | 69,500 | (2,336,590 | ) | |||||||
Polaris Industries, Inc. | 200 | (19,696 | ) | |||||||
Thor Industries, Inc. | 800 | (51,016 | ) | |||||||
Winnebago Industries, Inc. | 13,700 | (307,565 | ) | |||||||
|
| |||||||||
| (4,571,935 | ) | |||||||||
|
| |||||||||
Machinery — (0.2)% | ||||||||||
Actuant Corp. Class A | 900 | (22,239 | ) | |||||||
Caterpillar, Inc. (b) | 17,242 | (1,319,703 | ) | |||||||
CIRCOR International, Inc. | 300 | (13,917 | ) | |||||||
Colfax Corp. (b) | 8,143 | (232,808 | ) | |||||||
Deere & Co. | 24,900 | (1,917,051 | ) | |||||||
Dover Corp. | 27,300 | �� | (1,756,209 | ) | ||||||
Graco, Inc. | 5,800 | (486,968 | ) | |||||||
IDEX Corp. | 200 | (16,576 | ) | |||||||
Kennametal, Inc. | 8,600 | (193,414 | ) | |||||||
Middleby Corp. | 4,100 | (437,757 | ) | |||||||
Milacron Holdings Corp. | 10,500 | (173,145 | ) | |||||||
MSA Safety, Inc. | 100 | (4,835 | ) | |||||||
NN, Inc. | 4,600 | (62,928 | ) | |||||||
Oshkosh Corp. | 200 | (8,174 | ) | |||||||
Parker-Hannifin Corp. | 5,500 | (610,940 | ) | |||||||
Power Solutions International, Inc. | 1,600 | (22,080 | ) | |||||||
Titan International, Inc. | 200 | (1,076 | ) | |||||||
|
| |||||||||
| (7,279,820 | ) | |||||||||
|
| |||||||||
Manufactured Goods — (0.0)% | ||||||||||
AZZ, Inc. | 500 | (28,300 | ) | |||||||
Proto Labs, Inc. | 12,900 | (994,461 | ) | |||||||
Timken Co. (The) | 200 | (6,698 | ) | |||||||
|
| |||||||||
| (1,029,459 | ) | |||||||||
|
| |||||||||
Media — (0.9)% | ||||||||||
Angie’s List, Inc. | 50,500 | (407,535 | ) | |||||||
Cablevision Systems Corp. Class A | 36,000 | (1,188,000 | ) | |||||||
Charter Communications, Inc. Class A (b) | 36,186 | (7,325,132 | ) | |||||||
Covisint Corp. | 35 | (70 | ) | |||||||
Cumulus Media, Inc. Class A | 25,200 | (11,700 | ) | |||||||
DraftDay Fantasy Sports, Inc. | 10,400 | (2,496 | ) | |||||||
DreamWorks Animation SKG, Inc. Class A | 17,900 | (446,605 | ) | |||||||
EW Scripps Co. Class A | 14,436 | (225,057 | ) | |||||||
Expedia, Inc. (b) | 1,000 | (107,820 | ) | |||||||
See Notes to Consolidated Financial Statements.
168
Blackstone Alternative Multi-Strategy Fund and Subsidiaries
Consolidated Schedule of Investments (Continued)
March 31, 2016
Security Description | Shares | Value | ||||||||
Groupon, Inc. | 200 | $ | (798 | ) | ||||||
GrubHub, Inc. (b) | 47,095 | (1,183,497 | ) | |||||||
Liberty Broadband Corp. Class C | 1,300 | (75,335 | ) | |||||||
LinkedIn Corp. | 2,600 | (297,310 | ) | |||||||
Lions Gate Entertainment Corp. | 14,800 | (323,380 | ) | |||||||
Live Ventures, Inc. | 5,800 | (8,062 | ) | |||||||
Media General, Inc. | 170,500 | (2,780,855 | ) | |||||||
MeetMe, Inc. | 500 | (1,420 | ) | |||||||
Monster Worldwide, Inc. | 2,500 | (8,150 | ) | |||||||
Netflix, Inc. (b) | 5,700 | (582,711 | ) | |||||||
New Media Investment Group, Inc. | 600 | (9,984 | ) | |||||||
Omnicom Group, Inc. | 2,600 | (216,398 | ) | |||||||
Pandora Media, Inc. (b) | 403,800 | (3,614,010 | ) | |||||||
Quotient Technology, Inc. | 3,500 | (37,100 | ) | |||||||
Rocket Fuel, Inc. | 28,500 | (89,775 | ) | |||||||
Scholastic Corp. | 500 | (18,685 | ) | |||||||
Sirius XM Holdings, Inc. (b) | 237,709 | (938,951 | ) | |||||||
Tribune Media Co. | 2,600 | (99,710 | ) | |||||||
TripAdvisor, Inc. (b) | 5,600 | (372,400 | ) | |||||||
TrueCar, Inc. | 12,100 | (67,639 | ) | |||||||
Twitter, Inc. | 662,100 | (10,957,755 | ) | |||||||
Walt Disney Co. (b) | 26,109 | (2,592,885 | ) | |||||||
World Wrestling Entertainment, Inc. Class A | 14,500 | (256,070 | ) | |||||||
Yelp, Inc. (b) | 113,800 | (2,262,344 | ) | |||||||
YOU On Demand Holdings, Inc. | 1,200 | (2,172 | ) | |||||||
Zillow Group, Inc. Class A | 65,023 | (1,661,338 | ) | |||||||
|
| |||||||||
| (38,173,149 | ) | |||||||||
|
| |||||||||
Medical Equipment & Devices — (1.8)% | ||||||||||
Abaxis, Inc. | 200 | (9,078 | ) | |||||||
Abbott Laboratories (b) | 21,700 | (907,711 | ) | |||||||
Accelerate Diagnostics, Inc. | 17,000 | (244,290 | ) | |||||||
Accuray, Inc. | 7,600 | (43,928 | ) | |||||||
Alere, Inc. | 600 | (30,366 | ) | |||||||
Amedica Corp. | 1,100 | (1,705 | ) | |||||||
Analogic Corp. | 100 | (7,901 | ) | |||||||
Atossa Genetics, Inc. | 2,300 | (791 | ) | |||||||
Baxter International, Inc. (b) | 313,720 | (12,887,617 | ) | |||||||
Becton Dickinson and Co. (b) | 6,700 | (1,017,194 | ) | |||||||
Cepheid | 34,200 | (1,140,912 | ) | |||||||
Cerus Corp. | 13,700 | (81,241 | ) | |||||||
ConforMIS, Inc. | 3,800 | (40,850 | ) | |||||||
Cooper Cos., Inc. (b) | 32,110 | (4,943,977 | ) | |||||||
CR Bard, Inc. (b) | 1,195 | (242,191 | ) | |||||||
Cynosure, Inc. Class A (b) | 10,500 | (463,260 | ) | |||||||
Cytori Therapeutics, Inc. | 27,800 | (5,924 | ) | |||||||
See Notes to Consolidated Financial Statements.
169
Blackstone Alternative Multi-Strategy Fund and Subsidiaries
Consolidated Schedule of Investments (Continued)
March 31, 2016
Security Description | Shares | Value | ||||||||
CytoSorbents Corp. | 500 | $ | (1,960 | ) | ||||||
Dentsply Sirona, Inc. (b) | 206,255 | (12,711,496 | ) | |||||||
DexCom, Inc. | 1,300 | (88,283 | ) | |||||||
EndoChoice Holdings, Inc. | 100 | (521 | ) | |||||||
EnteroMedics, Inc. | 60 | (58 | ) | |||||||
Exact Sciences Corp. | 36,300 | (244,662 | ) | |||||||
Fluidigm Corp. | 800 | (6,456 | ) | |||||||
Foundation Medicine, Inc. | 21,000 | (381,780 | ) | |||||||
Hansen Medical, Inc. | 1,400 | (3,654 | ) | |||||||
Illumina, Inc. (b) | 14,680 | (2,379,775 | ) | |||||||
ImmunoCellular Therapeutics Ltd. | 2,500 | �� | (725 | ) | ||||||
Intuitive Surgical, Inc. (b) | 2,359 | (1,417,877 | ) | |||||||
InVivo Therapeutics Holdings Corp. | 2,600 | (18,148 | ) | |||||||
IsoRay, Inc. | 19,500 | (17,550 | ) | |||||||
LDR Holding Corp. | 2,100 | (53,529 | ) | |||||||
Medtronic PLC | 130,103 | (9,757,725 | ) | |||||||
MiMedx Group, Inc. | 500 | (4,370 | ) | |||||||
Nanosphere, Inc. | 90 | (71 | ) | |||||||
Navidea Biopharmaceuticals, Inc. | 500 | (472 | ) | |||||||
Neogen Corp. | 200 | (10,070 | ) | |||||||
Nevro Corp. (b) | 5,000 | (281,300 | ) | |||||||
Novocure Ltd. | 900 | (13,032 | ) | |||||||
Pacific Biosciences of California, Inc. | 8,000 | (68,000 | ) | |||||||
Penumbra, Inc. | 100 | (4,600 | ) | |||||||
Rockwell Medical, Inc. | 32,300 | (242,573 | ) | |||||||
Rosetta Genomics Ltd. | 2,900 | (3,161 | ) | |||||||
Second Sight Medical Products, Inc. | 28,400 | (137,172 | ) | |||||||
Sequenom, Inc. | 1,900 | (2,679 | ) | |||||||
Spectranetics Corp. | 10,500 | (152,460 | ) | |||||||
Stereotaxis, Inc. | 100 | (110 | ) | |||||||
Stryker Corp. (b) | 117,210 | (12,575,461 | ) | |||||||
Sunshine Heart, Inc. | 300 | (252 | ) | |||||||
Tandem Diabetes Care, Inc. | 200 | (1,742 | ) | |||||||
TearLab Corp. | 700 | (441 | ) | |||||||
TransEnterix, Inc. | 29,200 | (124,100 | ) | |||||||
Trovagene, Inc. | 4,200 | (19,530 | ) | |||||||
Unilife Corp. | 9,900 | (6,732 | ) | |||||||
Varian Medical Systems, Inc. (b) | 158,649 | (12,695,093 | ) | |||||||
West Pharmaceutical Services, Inc. | 1,100 | (76,252 | ) | |||||||
Zimmer Holdings, Inc. (b) | 7,475 | (797,059 | ) | |||||||
|
| |||||||||
| (76,369,867 | ) | |||||||||
|
| |||||||||
Metals & Mining — (0.1)% | ||||||||||
Coeur Mining, Inc. | 264 | (1,484 | ) | |||||||
Compass Minerals International, Inc. | 16,600 | (1,176,276 | ) | |||||||
Gold Resource Corp. | 100 | (233 | ) | |||||||
See Notes to Consolidated Financial Statements.
170
Blackstone Alternative Multi-Strategy Fund and Subsidiaries
Consolidated Schedule of Investments (Continued)
March 31, 2016
Security Description | Shares | Value | ||||||||
Hecla Mining Co. | 10,000 | $ | (27,800 | ) | ||||||
Kaiser Aluminum Corp. | 300 | (25,362 | ) | |||||||
Tahoe Resources, Inc. | 62,900 | (630,887 | ) | |||||||
Ur-Energy, Inc. | 200 | (100 | ) | |||||||
Uranium Energy Corp. | 56,600 | (42,337 | ) | |||||||
US Silica Holdings, Inc. | 59,900 | (1,360,928 | ) | |||||||
|
| |||||||||
| (3,265,407 | ) | |||||||||
|
| |||||||||
Oil, Gas & Coal — (0.4)% | ||||||||||
Abraxas Petroleum Corp. | 100 | (101 | ) | |||||||
Alon USA Energy, Inc. | 58,200 | (600,624 | ) | |||||||
Approach Resources, Inc. | 8,800 | (10,208 | ) | |||||||
Basic Energy Services, Inc. | 31,200 | (86,112 | ) | |||||||
Bonanza Creek Energy, Inc. | 100 | (159 | ) | |||||||
C&J Energy Services Ltd. | 24,200 | (34,122 | ) | |||||||
Callon Petroleum Co. | 200 | (1,770 | ) | |||||||
CARBO Ceramics, Inc. | 16,800 | (238,560 | ) | |||||||
Carrizo Oil & Gas, Inc. | 100 | (3,092 | ) | |||||||
Cheniere Energy, Inc. | 73,100 | (2,472,973 | ) | |||||||
Clayton Williams Energy, Inc. | 2,600 | (23,192 | ) | |||||||
Clean Energy Fuels Corp. | 27,900 | (81,747 | ) | |||||||
Cloud Peak Energy, Inc. | 3,800 | (7,410 | ) | |||||||
Cobalt International Energy, Inc. | 93,500 | (277,695 | ) | |||||||
Comstock Resources, Inc. | 8,400 | (6,430 | ) | |||||||
Core Laboratories NV | 3,700 | (415,917 | ) | |||||||
Eclipse Resources Corp. | 14,100 | (20,304 | ) | |||||||
Enbridge Energy Management LLC | 4,749 | (85,245 | ) | |||||||
Energy XXI Ltd. | 87,200 | (54,317 | ) | |||||||
EnLink Midstream LLC | 4,700 | (52,875 | ) | |||||||
EOG Resources, Inc. | 800 | (58,064 | ) | |||||||
Erin Energy Corp. | 700 | (1,316 | ) | |||||||
EXCO Resources, Inc. | 127,000 | (125,616 | ) | |||||||
Exxon Mobil Corp. | 62,200 | (5,199,298 | ) | |||||||
Fairmount Santrol Holdings, Inc. | 24,700 | (61,997 | ) | |||||||
Flotek Industries, Inc. | 82,800 | (606,924 | ) | |||||||
Gastar Exploration, Inc. | 10,100 | (11,110 | ) | |||||||
Geospace Technologies Corp. | 700 | (8,638 | ) | |||||||
Gulfmark Offshore, Inc. Class A | 12,500 | (77,125 | ) | |||||||
Halcon Resources Corp. | 10,960 | (10,534 | ) | |||||||
Harvest Natural Resources, Inc. | 2,500 | (1,507 | ) | |||||||
HollyFrontier Corp. | 2,800 | (98,896 | ) | |||||||
Jones Energy, Inc. | 15,300 | (50,949 | ) | |||||||
Key Energy Services, Inc. | 45,200 | (16,697 | ) | |||||||
Kinder Morgan, Inc. | 3,932 | (70,225 | ) | |||||||
Kosmos Energy Ltd. | 32,200 | (187,404 | ) | |||||||
Laredo Petroleum, Inc. | 1,700 | (13,481 | ) | |||||||
See Notes to Consolidated Financial Statements.
171
Blackstone Alternative Multi-Strategy Fund and Subsidiaries
Consolidated Schedule of Investments (Continued)
March 31, 2016
Security Description | Shares | Value | ||||||||
LinnCo LLC | 14,900 | $ | (5,327 | ) | ||||||
Matador Resources Co. | 7,600 | (144,096 | ) | |||||||
National Oilwell Varco, Inc. | 4,600 | (143,060 | ) | |||||||
Northern Oil and Gas, Inc. | 66,700 | (266,133 | ) | |||||||
Occidental Petroleum Corp. | 32,600 | (2,230,818 | ) | |||||||
ONEOK, Inc. | 35,200 | (1,051,072 | ) | |||||||
Pacific Drilling SA | 18,300 | (8,967 | ) | |||||||
Par Pacific Holdings, Inc. | 600 | (11,256 | ) | |||||||
PetroQuest Energy, Inc. | 1,900 | (1,151 | ) | |||||||
Resolute Energy Corp. | 500 | (255 | ) | |||||||
Rex Energy Corp. | 19,300 | (14,828 | ) | |||||||
Ring Energy, Inc. | 400 | (2,020 | ) | |||||||
RPC, Inc. | 11,500 | (163,070 | ) | |||||||
Sanchez Energy Corp. | 92,200 | (506,178 | ) | |||||||
Seventy Seven Energy, Inc. | 30,300 | (17,577 | ) | |||||||
Synergy Resources Corp. | 38,200 | (296,814 | ) | |||||||
Targa Resources Corp. | 46,200 | (1,379,532 | ) | |||||||
Thermon Group Holdings, Inc. | 1,300 | (22,828 | ) | |||||||
Tidewater, Inc. | 31,900 | (217,877 | ) | |||||||
Triangle Petroleum Corp. | 40,400 | (21,909 | ) | |||||||
W&T Offshore, Inc. | 76,800 | (168,192 | ) | |||||||
Warren Resources, Inc. | 1,600 | (273 | ) | |||||||
Westmoreland Coal Co. | 33,700 | (242,977 | ) | |||||||
WPX Energy, Inc. | 3,300 | (23,067 | ) | |||||||
|
| |||||||||
| (18,011,911 | ) | |||||||||
|
| |||||||||
Real Estate — (0.8)% | ||||||||||
American Homes 4 Rent | 60,300 | (958,770 | ) | |||||||
Apple Hospitality REIT, Inc. | 3,300 | (65,373 | ) | |||||||
Ashford Hospitality Trust, Inc. | 47,800 | (304,964 | ) | |||||||
AvalonBay Communities, Inc. | 9,100 | (1,730,820 | ) | |||||||
Bluerock Residential Growth REIT, Inc. | 7,200 | (78,336 | ) | |||||||
Boston Properties, Inc. | 3,200 | (406,656 | ) | |||||||
Camden Property Trust | 4,600 | (386,814 | ) | |||||||
Chatham Lodging Trust | 1,900 | (40,717 | ) | |||||||
Columbia Property Trust, Inc. | 19,900 | (437,601 | ) | |||||||
Communications Sales & Leasing, Inc. | 7,700 | (171,325 | ) | |||||||
Corporate Office Properties Trust | 5,700 | (149,568 | ) | |||||||
CyrusOne, Inc. | 30,200 | (1,378,630 | ) | |||||||
DCT Industrial Trust, Inc. | 200 | (7,894 | ) | |||||||
Douglas Emmett, Inc. | 24,300 | (731,673 | ) | |||||||
Duke Realty Corp. | 3,600 | (81,144 | ) | |||||||
Education Realty Trust, Inc. | 30,666 | (1,275,706 | ) | |||||||
Extra Space Storage, Inc. | 24,087 | (2,251,171 | ) | |||||||
Farmland Partners, Inc. | 2,700 | (28,971 | ) | |||||||
Global Net Lease, Inc. | 7,500 | (64,200 | ) | |||||||
See Notes to Consolidated Financial Statements.
172
Blackstone Alternative Multi-Strategy Fund and Subsidiaries
Consolidated Schedule of Investments (Continued)
March 31, 2016
Security Description | Shares | Value | ||||||||
Government Properties Income Trust | 50,900 | $ | (908,565 | ) | ||||||
Hannon Armstrong Sustainable Infrastructure Capital, Inc. | 2,400 | (46,128 | ) | |||||||
Healthcare Realty Trust, Inc. | 26,600 | (821,674 | ) | |||||||
Hersha Hospitality Trust | 8,100 | (172,854 | ) | |||||||
Highwoods Properties, Inc. | 29,700 | (1,419,957 | ) | |||||||
Host Hotels & Resorts, Inc. | 22,700 | (379,090 | ) | |||||||
iStar, Inc. | 4,600 | (44,436 | ) | |||||||
Kennedy-Wilson Holdings, Inc. | 2,600 | (56,940 | ) | |||||||
LaSalle Hotel Properties | 32,800 | (830,168 | ) | |||||||
Medical Properties Trust, Inc. | 35,500 | (460,790 | ) | |||||||
Mid-America Apartment Communities, Inc. | 5,100 | (521,271 | ) | |||||||
New Senior Investment Group, Inc. | 63,101 | (649,940 | ) | |||||||
New York REIT, Inc. | 11,900 | (120,190 | ) | |||||||
NorthStar Realty Finance Corp. | 351,550 | (4,612,336 | ) | |||||||
Omega Healthcare Investors, Inc. | 40 | (1,412 | ) | |||||||
Parkway Properties Inc/Md | 15,200 | (238,032 | ) | |||||||
Pennsylvania REIT | 10,400 | (227,240 | ) | |||||||
Physicians Realty Trust | 38,700 | (719,046 | ) | |||||||
Piedmont Office Realty Trust, Inc. Class A | 15,900 | (322,929 | ) | |||||||
Public Storage | 20,188 | (5,568,456 | ) | |||||||
RE/MAX Holdings, Inc. Class A | 1,377 | (47,231 | ) | |||||||
Realty Income Corp. | 18,800 | (1,175,188 | ) | |||||||
Regency Centers Corp. | 15,500 | (1,160,175 | ) | |||||||
STAG Industrial, Inc. | 35,300 | (718,708 | ) | |||||||
STORE Capital Corp. | 7,000 | (181,160 | ) | |||||||
Sunstone Hotel Investors, Inc. | 7,867 | (110,138 | ) | |||||||
Tier REIT, Inc. | 100 | (1,344 | ) | |||||||
Ventas, Inc. | 100 | (6,296 | ) | |||||||
Vereit, Inc. REIT | 304,800 | (2,703,576 | ) | |||||||
Welltower, Inc. | 200 | (13,868 | ) | |||||||
Weyerhaeuser Co. | 20 | (620 | ) | |||||||
|
| |||||||||
| (34,790,091 | ) | |||||||||
|
| |||||||||
Recreation Facilities & Services — (0.0)% | ||||||||||
Carmike Cinemas, Inc. | 300 | (9,012 | ) | |||||||
Live Nation Entertainment, Inc. (b) | 5,510 | (122,928 | ) | |||||||
Vail Resorts, Inc. | 200 | (26,740 | ) | |||||||
|
| |||||||||
| (158,680 | ) | |||||||||
|
| |||||||||
Renewable Energy — (0.2)% | ||||||||||
Enphase Energy, Inc. | 14,500 | (33,785 | ) | |||||||
FuelCell Energy, Inc. | 12,158 | (82,310 | ) | |||||||
Gevo, Inc. | 31,106 | (8,398 | ) | |||||||
Green Plains, Inc. | 10,400 | (165,984 | ) | |||||||
Pacific Ethanol, Inc. | 7,500 | (35,100 | ) | |||||||
See Notes to Consolidated Financial Statements.
173
Blackstone Alternative Multi-Strategy Fund and Subsidiaries
Consolidated Schedule of Investments (Continued)
March 31, 2016
Security Description | Shares | Value | ||||||||
Plug Power, Inc. | 227,500 | $ | (466,375 | ) | ||||||
Real Goods Solar, Inc. Class A | 100 | (72 | ) | |||||||
REX American Resources Corp. | 1,500 | (83,205 | ) | |||||||
Silver Spring Networks, Inc. | 5,000 | (73,750 | ) | |||||||
SolarCity Corp. | 211,400 | (5,196,212 | ) | |||||||
SolarEdge Technologies, Inc. | 2,200 | (55,308 | ) | |||||||
Solazyme, Inc. | 8,000 | (16,240 | ) | |||||||
SunEdison, Inc. | 679,700 | (367,174 | ) | |||||||
Sunrun, Inc. | 1,700 | (11,016 | ) | |||||||
Sunworks, Inc. | 3,100 | (8,587 | ) | |||||||
TerraForm Global, Inc. Class A | 2,300 | (5,474 | ) | |||||||
Vivint Solar, Inc. | 20,800 | (55,120 | ) | |||||||
|
| |||||||||
| (6,664,110 | ) | |||||||||
|
| |||||||||
Retail—Consumer Staples — (0.6)% | ||||||||||
Casey’s General Stores, Inc. | 1,100 | (124,652 | ) | |||||||
Dollar General Corp. | 15,600 | (1,335,360 | ) | |||||||
Dollar Tree, Inc. | 21,400 | (1,764,644 | ) | |||||||
Fairway Group Holdings Corp. | 3,900 | (1,366 | ) | |||||||
Five Below, Inc. | 11,600 | (479,544 | ) | |||||||
Fresh Market, Inc. | 5,500 | (156,915 | ) | |||||||
Natural Grocers by Vitamin Cottage, Inc. | 100 | (2,127 | ) | |||||||
PriceSmart, Inc. | 900 | (76,122 | ) | |||||||
Target Corp. | 59,900 | (4,928,572 | ) | |||||||
Wal-Mart Stores, Inc. (b) | 225,720 | (15,459,563 | ) | |||||||
Whole Foods Market, Inc. (b) | 3,030 | (94,263 | ) | |||||||
|
| |||||||||
| (24,423,128 | ) | |||||||||
|
| |||||||||
Retail—Discretionary — (1.5)% | ||||||||||
Abercrombie & Fitch Co. Class A | 105,100 | (3,314,854 | ) | |||||||
Advance Auto Parts, Inc. | 64,800 | (10,390,032 | ) | |||||||
Aeropostale, Inc. | 3,200 | (635 | ) | |||||||
Ascena Retail Group, Inc. | 63,300 | (700,098 | ) | |||||||
Barnes & Noble, Inc. | 20,100 | (248,436 | ) | |||||||
bebe stores, Inc. | 4,800 | (2,639 | ) | |||||||
Bed Bath & Beyond, Inc. | 47,800 | (2,372,792 | ) | |||||||
Bon-Ton Stores, Inc. | 9,000 | (20,430 | ) | |||||||
Boot Barn Holdings, Inc. | 14,000 | (131,600 | ) | |||||||
Buckle, Inc. | 24,700 | (836,589 | ) | |||||||
Build-A-Bear Workshop, Inc. | 1,800 | (23,382 | ) | |||||||
Burlington Stores, Inc. | 21,400 | (1,203,536 | ) | |||||||
Cabela’s, Inc. | 53,100 | (2,585,439 | ) | |||||||
CarMax, Inc. | 10,600 | (541,660 | ) | |||||||
Cato Corp. Class A | 1,900 | (73,245 | ) | |||||||
Chico’s FAS, Inc. | 77,900 | (1,033,733 | ) | |||||||
Children’s Place, Inc. | 17,700 | (1,477,419 | ) | |||||||
See Notes to Consolidated Financial Statements.
174
Blackstone Alternative Multi-Strategy Fund and Subsidiaries
Consolidated Schedule of Investments (Continued)
March 31, 2016
Security Description | Shares | Value | ||||||||
Coach, Inc. | 164,100 | $ | (6,578,769 | ) | ||||||
Conn’s, Inc. | 18,700 | (233,002 | ) | |||||||
Container Store Group, Inc. | 4,900 | (28,763 | ) | |||||||
Dick’s Sporting Goods, Inc. | 1,500 | (70,125 | ) | |||||||
DSW, Inc. Class A | 117,600 | (3,250,464 | ) | |||||||
eBay, Inc. (b) | 6,000 | (143,160 | ) | |||||||
Finish Line, Inc. Class A | 20,000 | (422,000 | ) | |||||||
Foot Locker, Inc. | 31,600 | (2,038,200 | ) | |||||||
Francesca’s Holdings Corp. | 8,200 | (157,112 | ) | |||||||
Freshpet, Inc. | 5,400 | (39,582 | ) | |||||||
GameStop Corp. Class A | 400 | (12,692 | ) | |||||||
Gap, Inc. | 241,100 | (7,088,340 | ) | |||||||
Guess?, Inc. | 95,100 | (1,785,027 | ) | |||||||
Hibbett Sports, Inc. (b) | 15,625 | (560,938 | ) | |||||||
JC Penney Co., Inc. | 43,900 | (485,534 | ) | |||||||
Kohl’s Corp. (b) | 55,805 | (2,601,071 | ) | |||||||
Lithia Motors, Inc. Class A | 13,200 | (1,152,756 | ) | |||||||
Lumber Liquidators Holdings, Inc. | 19,500 | (255,840 | ) | |||||||
Macy’s, Inc. | 30,400 | (1,340,336 | ) | |||||||
Monro Muffler Brake, Inc. | 9,300 | (664,671 | ) | |||||||
Net Element International, Inc. | 9,900 | (3,136 | ) | |||||||
Outerwall, Inc. | 300 | (11,097 | ) | |||||||
Overstock.com, Inc. | 200 | (2,876 | ) | |||||||
Pacific Sunwear of California, Inc. | 900 | (113 | ) | |||||||
Party City Holdco, Inc. | 800 | (12,032 | ) | |||||||
Pier 1 Imports, Inc. | 102,200 | (716,422 | ) | |||||||
Ross Stores, Inc. | 44,300 | (2,564,970 | ) | |||||||
Rush Enterprises, Inc. Class A | 1,000 | (18,240 | ) | |||||||
Sears Holdings Corp. | 54,200 | (829,802 | ) | |||||||
Select Comfort Corp. | 200 | (3,878 | ) | |||||||
Sonic Automotive, Inc. Class A (b) | 6,100 | (112,728 | ) | |||||||
Stage Stores, Inc. | 9,900 | (79,794 | ) | |||||||
Tailored Brands, Inc. | 62,700 | (1,122,330 | ) | |||||||
Tiffany & Co. (b) | 9,890 | (725,728 | ) | |||||||
TJX Cos., Inc. | 24,000 | (1,880,400 | ) | |||||||
Tractor Supply Co. | 41,900 | (3,790,274 | ) | |||||||
Wayfair, Inc. Class A | 11,000 | (475,420 | ) | |||||||
Williams-Sonoma, Inc. (b) | 2,715 | (148,619 | ) | |||||||
Zumiez, Inc. | 2,600 | (51,792 | ) | |||||||
|
| |||||||||
| (66,414,552 | ) | |||||||||
|
| |||||||||
Semiconductors — (0.3)% | ||||||||||
Advanced Micro Devices, Inc. | 438,400 | (1,249,440 | ) | |||||||
Ambarella, Inc. | 62,700 | (2,802,690 | ) | |||||||
Analog Devices, Inc. (b) | 11,725 | (694,003 | ) | |||||||
Applied Materials, Inc. (b) | 13,410 | (284,024 | ) | |||||||
See Notes to Consolidated Financial Statements.
175
Blackstone Alternative Multi-Strategy Fund and Subsidiaries
Consolidated Schedule of Investments (Continued)
March 31, 2016
Security Description | Shares | Value | ||||||||
Applied Optoelectronics, Inc. | 6,600 | $ | (98,406 | ) | ||||||
Cypress Semiconductor Corp. | 270,935 | (2,346,297 | ) | |||||||
IPG Photonics Corp. (b) | 7,555 | (725,884 | ) | |||||||
MaxLinear, Inc. Class A | 40 | (740 | ) | |||||||
Microchip Technology, Inc. | 46,376 | (2,235,323 | ) | |||||||
Microsemi Corp. | 55,400 | (2,122,374 | ) | |||||||
Monolithic Power Systems, Inc. | 4,700 | (299,108 | ) | |||||||
Pixelworks, Inc. | 10,500 | (22,995 | ) | |||||||
Power Integrations, Inc. | 300 | (14,898 | ) | |||||||
Qorvo, Inc. | 23 | (1,160 | ) | |||||||
QuickLogic Corp. | 5,000 | (5,300 | ) | |||||||
Rambus, Inc. | 800 | (11,000 | ) | |||||||
Rubicon Technology, Inc. | 900 | (657 | ) | |||||||
Synaptics, Inc. | 3,200 | (255,168 | ) | |||||||
|
| |||||||||
| (13,169,467 | ) | |||||||||
|
| |||||||||
Software — (0.6)% | ||||||||||
2U, Inc. | 35,500 | (802,300 | ) | |||||||
ACI Worldwide, Inc. | 2,500 | (51,975 | ) | |||||||
Adobe Systems, Inc. (b) | 1,300 | (121,940 | ) | |||||||
Allscripts Healthcare Solutions, Inc. (b) | 41,400 | (546,894 | ) | |||||||
Amber Road, Inc. | 2,400 | (12,984 | ) | |||||||
ANSYS, Inc. | 5,300 | (474,138 | ) | |||||||
Appfolio, Inc. | 100 | (1,224 | ) | |||||||
Aspen Technology, Inc. | 17,400 | (628,662 | ) | |||||||
athenahealth, Inc. | 800 | (111,024 | ) | |||||||
Autodesk, Inc. (b) | 2,000 | (116,620 | ) | |||||||
Avid Technology, Inc. | 2,900 | (19,604 | ) | |||||||
Barracuda Networks, Inc. | 5,000 | (77,000 | ) | |||||||
Benefitfocus, Inc. | 6,300 | (210,105 | ) | |||||||
Black Knight Financial Services, Inc. Class A | 800 | (24,824 | ) | |||||||
CA, Inc. (b) | 22,290 | (686,309 | ) | |||||||
Callidus Software, Inc. | 5,200 | (86,736 | ) | |||||||
Castlight Health, Inc. Class B | 20,100 | (66,933 | ) | |||||||
Cerner Corp. | 77,200 | (4,088,512 | ) | |||||||
Cornerstone OnDemand, Inc. (b) | 5,900 | (193,343 | ) | |||||||
Datawatch Corp. | 800 | (3,960 | ) | |||||||
Demandware, Inc. | 22,300 | (871,930 | ) | |||||||
Digital Turbine, Inc. | 3,100 | (3,689 | ) | |||||||
Envestnet, Inc. | 13,700 | (372,640 | ) | |||||||
FireEye, Inc. (b) | 130,200 | (2,342,298 | ) | |||||||
FleetMatics Group PLC | 11,500 | (468,165 | ) | |||||||
Glu Mobile, Inc. | 95,200 | (268,464 | ) | |||||||
Guidance Software, Inc. | 200 | (860 | ) | |||||||
Guidewire Software, Inc. (b) | 7,400 | (403,152 | ) | |||||||
Hortonworks, Inc. | 3,000 | (33,900 | ) | |||||||
See Notes to Consolidated Financial Statements.
176
Blackstone Alternative Multi-Strategy Fund and Subsidiaries
Consolidated Schedule of Investments (Continued)
March 31, 2016
Security Description | Shares | Value | ||||||||
HubSpot, Inc. (b) | 6,200 | $ | (270,444 | ) | ||||||
Imperva, Inc. | 10,600 | (535,300 | ) | |||||||
inContact, Inc. | 1,000 | (8,890 | ) | |||||||
Intuit, Inc. (b) | 1,200 | (124,812 | ) | |||||||
LogMeIn, Inc. (b) | 3,400 | (171,564 | ) | |||||||
Marketo, Inc. (b) | 5,300 | (103,721 | ) | |||||||
MobileIron, Inc. | 2,600 | (11,752 | ) | |||||||
NetSuite, Inc. (b) | 1,800 | (123,282 | ) | |||||||
New Relic, Inc. (b) | 7,600 | (198,208 | ) | |||||||
Opower, Inc. | 7,600 | (51,756 | ) | |||||||
Oracle Corp. (b) | 17,585 | (719,402 | ) | |||||||
Palo Alto Networks, Inc. (b) | 11,900 | (1,941,366 | ) | |||||||
Paycom Software, Inc. | 24,000 | (854,400 | ) | |||||||
Paylocity Holding Corp. | 3,800 | (124,412 | ) | |||||||
Press Ganey Holdings, Inc. | 1,300 | (39,104 | ) | |||||||
Proofpoint, Inc. | 14,600 | (785,188 | ) | |||||||
PROS Holdings, Inc. (b) | 41,615 | (490,641 | ) | |||||||
Q2 Holdings, Inc. | 2,100 | (50,484 | ) | |||||||
Qualys, Inc. | 2,500 | (63,275 | ) | |||||||
Rapid7, Inc. | 5,700 | (74,499 | ) | |||||||
Rosetta Stone, Inc. | 1,400 | (9,394 | ) | |||||||
salesforce.com, Inc. | 6,200 | (457,746 | ) | |||||||
ServiceNow, Inc. (b) | 4,900 | (299,782 | ) | |||||||
Splunk, Inc. (b) | 24,700 | (1,208,571 | ) | |||||||
Tableau Software, Inc. Class A (b) | 2,600 | (119,262 | ) | |||||||
Textura Corp. | 2,800 | (52,164 | ) | |||||||
TubeMogul, Inc. | 11,300 | (146,222 | ) | |||||||
Tyler Technologies, Inc. | 7,500 | (964,575 | ) | |||||||
Varonis Systems, Inc. | 400 | (7,300 | ) | |||||||
Veeva Systems, Inc. Class A | 21,900 | (548,376 | ) | |||||||
VirnetX Holding Corp. | 35,700 | (163,863 | ) | |||||||
VMware, Inc. Class A (b) | 581 | (30,392 | ) | |||||||
Vringo, Inc. | 4,150 | (6,806 | ) | |||||||
Workday, Inc. Class A (b) | 7,870 | (604,731 | ) | |||||||
|
| |||||||||
| (24,451,869 | ) | |||||||||
|
| |||||||||
Specialty Finance — (0.5)% | ||||||||||
Alliance Data Systems Corp. | 45 | (9,900 | ) | |||||||
Ally Financial, Inc. | 284,600 | (5,327,712 | ) | |||||||
Altisource Portfolio Solutions SA | 17,000 | (410,550 | ) | |||||||
American Express Co. | 6,400 | (392,960 | ) | |||||||
Apollo Residential Mortgage, Inc. | 23,100 | (310,002 | ) | |||||||
Ares Commercial Real Estate Corp. | 1,400 | (15,330 | ) | |||||||
Arlington Asset Investment Corp. Class A | 10,800 | (135,324 | ) | |||||||
ARMOUR Residential REIT, Inc. | 55,762 | (1,200,556 | ) | |||||||
Cardtronics, Inc. | 12,700 | (457,073 | ) | |||||||
See Notes to Consolidated Financial Statements.
177
Blackstone Alternative Multi-Strategy Fund and Subsidiaries
Consolidated Schedule of Investments (Continued)
March 31, 2016
Security Description | Shares | Value | ||||||||
CIT Group, Inc. | 300 | $ | (9,309 | ) | ||||||
Encore Capital Group, Inc. | 17,500 | (450,450 | ) | |||||||
Euronet Worldwide, Inc. | 1,400 | (103,754 | ) | |||||||
Everi Holdings, Inc. | 4,100 | (9,389 | ) | |||||||
Flagstar Bancorp, Inc. | 900 | (19,314 | ) | |||||||
FNFV Group | 33 | (358 | ) | |||||||
GATX Corp. | 2,100 | (99,750 | ) | |||||||
HomeStreet, Inc. | 300 | (6,243 | ) | |||||||
Impac Mortgage Holdings, Inc. | 300 | (4,161 | ) | |||||||
Invesco Mortgage Capital, Inc. | 109,867 | (1,338,180 | ) | |||||||
Jack Henry & Associates, Inc. | 32,900 | (2,782,353 | ) | |||||||
JAVELIN Mortgage Investment Corp. | 4,500 | (32,310 | ) | |||||||
JG Wentworth Co. Class A | 2,400 | (2,928 | ) | |||||||
LendingClub Corp. | 265,100 | (2,200,330 | ) | |||||||
Nationstar Mortgage Holdings, Inc. | 103,400 | (1,023,660 | ) | |||||||
New Residential Investment Corp. | 300 | (3,489 | ) | |||||||
New York Mortgage Trust, Inc. | 15,700 | (74,418 | ) | |||||||
Ocwen Financial Corp. | 194,700 | (480,909 | ) | |||||||
Orchid Island Capital, Inc. | 27,500 | (285,175 | ) | |||||||
PayPal Holdings, Inc. (b) | 2,600 | (100,360 | ) | |||||||
PennyMac Mortgage Investment Trust | 800 | (10,912 | ) | |||||||
PHH Corp. | 19,000 | (238,260 | ) | |||||||
PRA Group, Inc. | 700 | (20,573 | ) | |||||||
RAIT Financial Trust | 56,000 | (175,840 | ) | |||||||
Resource Capital Corp. REIT | 20,300 | (228,375 | ) | |||||||
Santander Consumer USA Holdings, Inc. | 27,300 | (286,377 | ) | |||||||
SLM Corp. | 50,400 | (320,544 | ) | |||||||
Stonegate Mortgage Corp. | 1,200 | (6,888 | ) | |||||||
Walter Investment Management Corp. | 27,600 | (210,864 | ) | |||||||
Western Asset Mortgage Capital Corp. | 56,700 | (569,835 | ) | |||||||
|
| |||||||||
| (19,354,715 | ) | |||||||||
|
| |||||||||
Technology Services — (0.5)% | ||||||||||
Booz Allen Hamilton Holding Corp. | 1,100 | (33,308 | ) | |||||||
Bottomline Technologies de, Inc. | 1,000 | (30,490 | ) | |||||||
Computer Sciences Corp. | 13,900 | (478,021 | ) | |||||||
comScore, Inc. | 1,470 | (44,159 | ) | |||||||
CoStar Group, Inc. | 1,800 | (338,706 | ) | |||||||
DST Systems, Inc. | 1,100 | (124,047 | ) | |||||||
Endurance International Group Holdings, Inc. | 300 | (3,159 | ) | |||||||
EPAM Systems, Inc. | 4,600 | (343,482 | ) | |||||||
FactSet Research Systems, Inc. | 2,100 | (318,213 | ) | |||||||
Fair Isaac Corp. | 19,100 | (2,026,319 | ) | |||||||
Gartner, Inc. | 8,600 | (768,410 | ) | |||||||
IMS Health Holdings, Inc. (b) | 66,370 | (1,762,123 | ) | |||||||
International Business Machines Corp. (b) | 29,700 | (4,498,065 | ) | |||||||
See Notes to Consolidated Financial Statements.
178
Blackstone Alternative Multi-Strategy Fund and Subsidiaries
Consolidated Schedule of Investments (Continued)
March 31, 2016
Security Description | Shares | Value | ||||||||
Luxoft Holding, Inc. | 2,100 | $ | (115,563 | ) | ||||||
MarketAxess Holdings, Inc. | 10,700 | (1,335,681 | ) | |||||||
MAXIMUS, Inc. | 21,300 | (1,121,232 | ) | |||||||
Medidata Solutions, Inc. | 4,700 | (181,937 | ) | |||||||
Morningstar, Inc. | 100 | (8,827 | ) | |||||||
Spherix, Inc. | 26 | (47 | ) | |||||||
Thomson Reuters Corp. | 53,200 | (2,153,536 | ) | |||||||
Unisys Corp. | 400 | (3,080 | ) | |||||||
Verisk Analytics, Inc. Class A | 55,000 | (4,395,600 | ) | |||||||
|
| |||||||||
| (20,084,005 | ) | |||||||||
|
| |||||||||
Telecommunications — (0.1)% | ||||||||||
AT&T, Inc. | 80,219 | (3,142,178 | ) | |||||||
Global Eagle Entertainment, Inc. | 2,900 | (24,708 | ) | |||||||
Globalstar, Inc. | 162,100 | (238,287 | ) | |||||||
Gogo, Inc. | 7,100 | (78,171 | ) | |||||||
GTT Communications, Inc. | 3,400 | (56,236 | ) | |||||||
HC2 Holdings, Inc. | 600 | (2,292 | ) | |||||||
Intelsat SA | 1,000 | (2,520 | ) | |||||||
Iridium Communications, Inc. | 9,900 | (77,913 | ) | |||||||
RingCentral, Inc. Class A (b) | 6,700 | (105,525 | ) | |||||||
Sprint Corp. | 204,500 | (711,660 | ) | |||||||
Straight Path Communications, Inc. | 11,600 | (359,948 | ) | |||||||
Verizon Communications, Inc. | 11,800 | (638,144 | ) | |||||||
Voltari Corp. | 4,800 | (18,912 | ) | |||||||
WidePoint Corp. | 1,300 | (780 | ) | |||||||
Windstream Holdings, Inc. | 42,100 | (323,328 | ) | |||||||
|
| |||||||||
| (5,780,602 | ) | |||||||||
|
| |||||||||
Transportation & Logistics — (0.1)% | ||||||||||
DHT Holdings, Inc. | 25,200 | (145,152 | ) | |||||||
Dorian LPG Ltd. | 9,200 | (86,480 | ) | |||||||
Eagle Bulk Shipping, Inc. | 1,200 | (432 | ) | |||||||
Echo Global Logistics, Inc. | 1,000 | (27,160 | ) | |||||||
Forward Air Corp. | 500 | (22,660 | ) | |||||||
Knight Transportation, Inc. | 8,900 | (232,735 | ) | |||||||
Macquarie Infrastructure Co. LLC | 15,100 | (1,018,344 | ) | |||||||
Nordic American Tankers Ltd. | 102,500 | (1,444,225 | ) | |||||||
Odyssey Marine Exploration, Inc. | 66 | (448 | ) | |||||||
Scorpio Bulkers, Inc. | 7,300 | (23,944 | ) | |||||||
Union Pacific Corp. | 1,200 | (95,460 | ) | |||||||
XPO Logistics, Inc. | 65,200 | (2,001,640 | ) | |||||||
|
| |||||||||
| (5,098,680 | ) | |||||||||
|
| |||||||||
Transportation Equipment — (0.0)% | ||||||||||
Clean Diesel Technologies, Inc. | 11,800 | (8,496 | ) | |||||||
See Notes to Consolidated Financial Statements.
179
Blackstone Alternative Multi-Strategy Fund and Subsidiaries
Consolidated Schedule of Investments (Continued)
March 31, 2016
Security Description | Shares | Value | ||||||||
Cummins, Inc. (b) | 1,665 | $ | (183,050 | ) | ||||||
Navistar International Corp. | 118,300 | (1,481,116 | ) | |||||||
Wabash National Corp. | 100 | (1,320 | ) | |||||||
|
| |||||||||
| (1,673,982 | ) | |||||||||
|
| |||||||||
Utilities — (0.8)% | ||||||||||
Alliant Energy Corp. | 36,100 | (2,681,508 | ) | |||||||
Ameren Corp. | 4,200 | (210,420 | ) | |||||||
American States Water Co., Inc. | 3,400 | (133,824 | ) | |||||||
American Water Works Co., Inc. | 38,400 | (2,646,912 | ) | |||||||
Aqua America, Inc. | 28,100 | (894,142 | ) | |||||||
Atlantic Power Corp. | 34,900 | (85,854 | ) | |||||||
California Water Service Group | 100 | (2,672 | ) | |||||||
Calpine Corp. | 100 | (1,517 | ) | |||||||
CenterPoint Energy, Inc. | 52,300 | (1,094,116 | ) | |||||||
Consolidated Edison, Inc. | 11,100 | (850,482 | ) | |||||||
Duke Energy Corp. | 13,600 | (1,097,248 | ) | |||||||
Dynegy, Inc. | 112,800 | (1,620,936 | ) | |||||||
Genie Energy Ltd. Class B | 2,000 | (15,220 | ) | |||||||
Great Plains Energy, Inc. | 86,300 | (2,783,175 | ) | |||||||
IDACORP, Inc. | 2,900 | (216,311 | ) | |||||||
Laclede Group, Inc. | 16,100 | (1,090,775 | ) | |||||||
MGE Energy, Inc. | 200 | (10,450 | ) | |||||||
New Jersey Resources Corp. | 1,300 | (47,359 | ) | |||||||
NextEra Energy, Inc. | 20,000 | (2,366,800 | ) | |||||||
NiSource, Inc. | 7,200 | (169,632 | ) | |||||||
NorthWestern Corp. | 21,600 | (1,333,800 | ) | |||||||
NRG Energy, Inc. | 98,700 | (1,284,087 | ) | |||||||
ONE Gas, Inc. | 3,700 | (226,070 | ) | |||||||
Pattern Energy Group, Inc. | 72,500 | (1,382,575 | ) | |||||||
PNM Resources, Inc. | 26,900 | (907,068 | ) | |||||||
Portland General Electric Co. | 20,900 | (825,341 | ) | |||||||
Questar Corp. | 20,500 | (508,400 | ) | |||||||
SCANA Corp. | 1,200 | (84,180 | ) | |||||||
South Jersey Industries, Inc. | 2,400 | (68,280 | ) | |||||||
Southern Co. | 500 | (25,865 | ) | |||||||
Southwest Gas Corp. | 5,800 | (381,930 | ) | |||||||
TerraForm Power, Inc. | 22,200 | (192,030 | ) | |||||||
WEC Energy Group, Inc. | 126,371 | (7,591,106 | ) | |||||||
Westar Energy, Inc. | 3,500 | (173,635 | ) | |||||||
WGL Holdings, Inc. | 1,000 | (72,370 | ) | |||||||
Xcel Energy, Inc. | 4,700 | (196,554 | ) | |||||||
|
| |||||||||
| (33,272,644 | ) | |||||||||
|
| |||||||||
Waste & Environmental Services & Equipment — (0.1)% |
| |||||||||
Cantel Medical Corp. | 2,800 | (199,808 | ) | |||||||
See Notes to Consolidated Financial Statements.
180
Blackstone Alternative Multi-Strategy Fund and Subsidiaries
Consolidated Schedule of Investments (Continued)
March 31, 2016
Security Description | Shares | Value | ||||||||
Energy Recovery, Inc. | 4,600 | $ | (47,564 | ) | ||||||
MagneGas Corp. | 9,600 | (9,984 | ) | |||||||
Stericycle, Inc. (b) | 36,550 | (4,612,245 | ) | |||||||
US Ecology, Inc. | 100 | (4,416 | ) | |||||||
Vertex Energy, Inc. | 600 | (1,170 | ) | |||||||
| (4,875,187 | ) | |||||||||
|
| |||||||||
Total United States | (764,569,062 | ) | ||||||||
|
| |||||||||
TOTAL COMMON STOCK | (895,703,915 | ) | ||||||||
|
| |||||||||
Security Description | Principal Amount | Value | ||||||||
CORPORATE BONDS & NOTES — (0.1)% | ||||||||||
Canada — (0.0)% | ||||||||||
Aerospace & Defense — (0.0)% | ||||||||||
Bombardier, Inc. (b),(e) | $ | 452,000 | (348,040 | ) | ||||||
|
| |||||||||
Total Canada | (348,040 | ) | ||||||||
|
| |||||||||
United States — (0.1)% | ||||||||||
Cable & Satellite — (0.0)% | ||||||||||
CCO Holdings LLC / CCO Holdings Capital Corp., 5.88%, 04/01/24 (b),(e) | 361,000 | (379,953 | ) | |||||||
|
| |||||||||
Department Store — (0.0)% | ||||||||||
Macy’s Retail Holdings, Inc., 6.38%, 03/15/37 (b) | 316,000 | (312,811 | ) | |||||||
|
| |||||||||
Exploration & Production — (0.0)% | ||||||||||
Carrizo Oil & Gas, Inc., 7.50%, 09/15/20 (b) | 121,000 | (114,042 | ) | |||||||
|
| |||||||||
Medical Equipment & Devices Manufacturing — (0.0)% |
| |||||||||
Crimson Merger Sub, Inc., 6.63%, 05/15/22 (b),(e) | 181,000 | (137,560 | ) | |||||||
|
| |||||||||
Semiconductors — (0.0)% | ||||||||||
Amkor Technology, Inc., 6.38%, 10/01/22 (b) | 361,000 | (345,658 | ) | |||||||
|
| |||||||||
Software & Services — (0.1)% | ||||||||||
Italics Merger Sub, Inc., 7.13%, 07/15/23 (b),(e) | 497,000 | (484,575 | ) | |||||||
|
| |||||||||
Total United States | (1,774,599 | ) | ||||||||
|
| |||||||||
TOTAL CORPORATE BONDS & NOTES | (2,122,639 | ) | ||||||||
|
| |||||||||
Security Description | Shares | Value | ||||||||
EXCHANGE-TRADED FUNDS — (4.8)% | ||||||||||
Consumer Discretionary Select Sector SPDR Fund | 346,334 | (27,377,703 | ) | |||||||
Consumer Staples Select Sector SPDR Fund | 264,246 | (14,018,250 | ) | |||||||
Financial Select Sector SPDR Fund | 369,817 | (8,324,581 | ) | |||||||
See Notes to Consolidated Financial Statements.
181
Blackstone Alternative Multi-Strategy Fund and Subsidiaries
Consolidated Schedule of Investments (Continued)
March 31, 2016
Security Description | Shares | Value | ||||||||
Health Care Select Sector SPDR Fund (b) | 296,609 | $ | (20,104,158 | ) | ||||||
iShares iBoxx $ Investment Grade Corporate Bond ETF | 18,294 | (2,173,693 | ) | |||||||
iShares Nasdaq Biotechnology ETF (b) | 162,329 | (42,337,027 | ) | |||||||
iShares Russell 1000 Growth ETF (b) | 57,526 | (5,739,944 | ) | |||||||
iShares Russell 2000 ETF (b) | 107,665 | (11,909,902 | ) | |||||||
iShares U.S. Healthcare ETF (b) | 35,600 | (5,003,580 | ) | |||||||
iShares U.S. Healthcare Providers ETF (b) | 26,505 | (3,233,080 | ) | |||||||
iShares US Real Estate ETF | 226,069 | (17,601,732 | ) | |||||||
SPDR S&P 500 ETF Trust (b) | 103,182 | (21,210,092 | ) | |||||||
SPDR S&P Biotech ETF (b) | 109,390 | (5,651,087 | ) | |||||||
SPDR S&P Regional Banking ETF | 250,043 | (9,411,619 | ) | |||||||
Vanguard FTSE Developed Markets ETF | 349,194 | (12,522,097 | ) | |||||||
|
| |||||||||
TOTAL EXCHANGE-TRADED FUNDS |
| (206,618,545 | ) | |||||||
|
| |||||||||
TOTAL SECURITIES SOLD SHORT — (25.8)% |
| $ | (1,104,445,099 | ) | ||||||
|
| |||||||||
Footnote Legend:
| (a) | Non-income producing. |
| (b) | Security is held by a consolidated wholly-owned subsidiary of Blackstone Alternative Multi-Strategy Fund. |
| (c) | All or a portion of this security is pledged as collateral for derivative financial instruments. |
| (d) | All or a portion of this security is temporarily on loan to unaffiliated broker/dealers. In addition, “Other Assets” may include pending sales that are also on loan. |
| (e) | Security is exempt from registration pursuant to Rule 144A under the Securities Act of 1933, as amended. Security may only be sold to qualified institutional buyers unless registered under the Securities Act of 1933, as amended, or otherwise exempt from registration. |
| (f) | Variable/floating interest rate security. Rate presented is as of March 31, 2016. |
| (g) | Security considered illiquid. |
| (h) | All or a portion of this security is pledged as collateral in connection with reverse repurchase agreements. |
| (i) | Security is currently in default due to bankruptcy or failure to make payment of principal or interest. |
| (j) | Security is perpetual in nature and has no stated maturity. |
| (k) | Represents a step-up bond. Coupon rate increases in increments to maturity. Rate presented is as of March 31, 2016. Maturity date presented is the ultimate maturity. |
| (l) | When issued or delayed delivery security. |
| (m) | Rate disclosed, the 7 day net yield, is as of March 31, 2016. |
| (n) | Non-interest bearing bond. |
| (o) | The cost of investments for federal tax purposes amounts to $4,363,296,624. |
| (p) | Assets, other than investments in securities, less liabilities other than securities sold short. |
See Notes to Consolidated Financial Statements.
182
Blackstone Alternative Multi-Strategy Fund and Subsidiaries
Consolidated Schedule of Investments (Continued)
March 31, 2016
Options Written Contracts Outstanding at March 31, 2016
Strike | Expiration | Contracts | Premium | Market | Unrealized | |||||||||||||||||
Exchange-Traded Call Options Written | ||||||||||||||||||||||
Apple, Inc. | 115.00 USD | 05/20/16 | 2,694 | $ | (314,140 | ) | $ | (441,816 | ) | $ | (127,676 | ) | ||||||||||
Imperial Brands PLC | 39.00 GBP | 05/20/16 | 37 | (42,522 | ) | (62,175 | ) | (19,653 | ) | |||||||||||||
Netflix, Inc. | 120.00 USD | 04/22/16 | 55 | (10,118 | ) | (8,800 | ) | 1,318 | ||||||||||||||
| $ | (366,780 | ) | $ | (512,791 | ) | $ | (146,011 | ) | ||||||||||||||
Exchange-Traded Put Options Written | ||||||||||||||||||||||
Apple, Inc. | 100.00 USD | 05/20/16 | 1,347 | $ | (262,884 | ) | $ | (184,539 | ) | $ | 78,345 | |||||||||||
Comerica, Inc. | 40.00 USD | 04/15/16 | 229 | (27,699 | ) | (62,975 | ) | (35,276 | ) | |||||||||||||
DAX Index | 9,100.00 EUR | 04/15/16 | 643 | (391,986 | ) | (54,143 | ) | 337,843 | ||||||||||||||
DAX Index | 8,900.00 EUR | 06/17/16 | 669 | (496,425 | ) | (430,109 | ) | 66,316 | ||||||||||||||
Imperial Brands PLC | 36.00 GBP | 05/20/16 | 37 | (45,713 | ) | (21,257 | ) | 24,456 | ||||||||||||||
iShares Russell 2000 ETF | 92.00 USD | 06/30/16 | 428 | (23,094 | ) | (22,684 | ) | 410 | ||||||||||||||
Netflix, Inc. | 80.00 USD | 04/22/16 | 55 | (6,488 | ) | (5,225 | ) | 1,263 | ||||||||||||||
S&P 500 Index | 1,675.00 USD | 04/15/16 | 93 | (203,387 | ) | (1,395 | ) | 201,992 | ||||||||||||||
Vodafone Group PLC | 1.90 GBP | 09/16/16 | 2,062 | (242,671 | ) | (140,673 | ) | 101,998 | ||||||||||||||
| $ | (1,700,347 | ) | $ | (923,000 | ) | $ | 777,347 | |||||||||||||||
Counterparty | Strike | Expiration | Contracts | Premium | Market | Unrealized | ||||||||||||||||||||
OTC Put Options Written |
| |||||||||||||||||||||||||
Financial Select Sector SPDR | Morgan Stanley & Co. International plc | 16.75 USD | 08/17/16 | 485,100 | $ | (101,673 | ) | $ | (10,254 | ) | $ | 91,419 | ||||||||||||||
SPDR S&P 500 ETF Trust | Morgan Stanley & Co. International plc | 190.00 USD | 05/20/16 | 220,600 | (176,480 | ) | (189,908 | ) | (13,428 | ) | ||||||||||||||||
| $ | (278,153 | ) | $ | (200,162 | ) | $ | 77,991 | |||||||||||||||||||
Total Options Written Outstanding |
| $ | (2,345,280 | ) | $ | (1,635,953 | ) | $ | 709,327 | |||||||||||||||||
See Notes to Consolidated Financial Statements.
183
Blackstone Alternative Multi-Strategy Fund and Subsidiaries
Consolidated Schedule of Investments (Continued)
March 31, 2016
Reverse Repurchase Agreements Outstanding at March 31, 2016
Counterparty | Interest Rate | Trade Date | Maturity Date | Face Value | Face Value Including Accrued Interest | |||||||||||
BNP Paribas Securities Corp. | 1.89% | 03/04/16 | 04/04/16 | $ | 4,134,000 | $ | 4,140,063 | |||||||||
BNP Paribas Securities Corp. | 2.23% | 03/09/16 | 04/11/16 | 3,829,000 | 3,834,467 | |||||||||||
BNP Paribas Securities Corp. | 2.24% | 03/04/16 | 04/04/16 | 960,000 | 961,669 | |||||||||||
Credit Suisse Securities (USA) LLC | 2.12% | 02/04/16 | 05/04/16 | 927,000 | 930,110 | |||||||||||
Credit Suisse Securities (USA) LLC | 2.37% | 02/16/16 | 05/12/16 | 4,824,000 | 4,838,280 | |||||||||||
Credit Suisse Securities (USA) LLC | 2.37% | 02/16/16 | 05/12/16 | 11,478,000 | 11,511,978 | |||||||||||
Credit Suisse Securities (USA) LLC | 2.37% | 02/16/16 | 05/12/16 | 5,112,000 | 5,127,133 | |||||||||||
Credit Suisse Securities (USA) LLC | 2.39% | 03/31/16 | 05/27/16 | 1,119,000 | 1,119,074 | |||||||||||
Credit Suisse Securities (USA) LLC | 2.47% | 02/04/16 | 04/20/16 | 1,888,000 | 1,895,381 | |||||||||||
Credit Suisse Securities (USA) LLC | 2.47% | 01/22/16 | 04/21/16 | 4,154,000 | 4,173,961 | |||||||||||
Credit Suisse Securities (USA) LLC | 2.47% | 01/22/16 | 04/21/16 | 2,709,000 | 2,722,018 | |||||||||||
Credit Suisse Securities (USA) LLC | 2.47% | 01/20/16 | 04/20/16 | 1,221,000 | 1,227,041 | |||||||||||
Credit Suisse Securities (USA) LLC | 2.47% | 01/20/16 | 04/20/16 | 1,352,000 | 1,358,689 | |||||||||||
Credit Suisse Securities (USA) LLC | 2.47% | 01/20/16 | 04/20/16 | 188,000 | 188,930 | |||||||||||
Credit Suisse Securities (USA) LLC | 2.47% | 01/20/16 | 04/20/16 | 653,000 | 656,231 | |||||||||||
Credit Suisse Securities (USA) LLC | 2.47% | 01/20/16 | 04/20/16 | 1,455,000 | 1,462,199 | |||||||||||
Credit Suisse Securities (USA) LLC | 2.47% | 01/20/16 | 04/20/16 | 952,000 | 956,710 | |||||||||||
Credit Suisse Securities (USA) LLC | 2.47% | 01/20/16 | 04/20/16 | 493,000 | 495,439 | |||||||||||
Credit Suisse Securities (USA) LLC | 2.47% | 01/20/16 | 04/20/16 | 1,295,000 | 1,301,407 | |||||||||||
Credit Suisse Securities (USA) LLC | 2.47% | 01/20/16 | 04/20/16 | 348,000 | 349,722 | |||||||||||
Credit Suisse Securities (USA) LLC | 2.47% | 03/24/16 | 04/20/16 | 1,930,000 | 1,931,061 | |||||||||||
Credit Suisse Securities (USA) LLC | 2.48% | 03/15/16 | 06/13/16 | 2,340,000 | 2,342,745 | |||||||||||
Credit Suisse Securities (USA) LLC | 2.49% | 03/01/16 | 05/27/16 | 625,000 | 626,337 | |||||||||||
Credit Suisse Securities (USA) LLC | 2.49% | 03/16/16 | 06/14/16 | 7,208,000 | 7,215,975 | |||||||||||
Credit Suisse Securities (USA) LLC | 2.58% | 03/15/16 | 06/13/16 | 577,000 | 577,704 | |||||||||||
JPMorgan Chase Bank, N.A. | 2.12% | 02/18/16 | 05/16/16 | 1,320,000 | 1,323,340 | |||||||||||
JPMorgan Chase Bank, N.A. | 2.12% | 02/18/16 | 05/16/16 | 2,793,000 | 2,800,066 | |||||||||||
JPMorgan Chase Bank, N.A. | 2.12% | 03/21/16 | 05/16/16 | 2,461,000 | 2,462,593 | |||||||||||
JPMorgan Chase Bank, N.A. | 2.13% | 03/18/16 | 04/15/16 | 1,557,000 | 1,558,291 | |||||||||||
JPMorgan Chase Bank, N.A. | 2.13% | 03/30/16 | 04/28/16 | 826,000 | 826,098 | |||||||||||
JPMorgan Chase Bank, N.A. | 2.21% | 03/31/16 | 05/27/16 | 3,531,000 | 3,531,217 | |||||||||||
JPMorgan Chase Bank, N.A. | 2.32% | 03/08/16 | 05/16/16 | 4,620,000 | 4,627,140 | |||||||||||
JPMorgan Chase Bank, N.A. | 2.32% | 01/21/16 | 04/20/16 | 1,366,000 | 1,372,254 | |||||||||||
JPMorgan Chase Bank, N.A. | 2.32% | 01/21/16 | 04/20/16 | 2,992,000 | 3,005,698 | |||||||||||
JPMorgan Chase Bank, N.A. | 2.34% | 02/29/16 | 05/27/16 | 1,569,000 | 1,572,257 | |||||||||||
Merrill Lynch, Pierce, Fenner & Smith, Inc. | 2.13% | 03/28/16 | 04/28/16 | 966,000 | 966,229 | |||||||||||
Merrill Lynch, Pierce, Fenner & Smith, Inc. | 2.13% | 03/21/16 | 04/21/16 | 283,000 | 283,184 | |||||||||||
Merrill Lynch, Pierce, Fenner & Smith, Inc. | 2.14% | 03/16/16 | 04/18/16 | 433,000 | 433,412 | |||||||||||
Merrill Lynch, Pierce, Fenner & Smith, Inc. | 2.14% | 03/16/16 | 04/18/16 | 1,414,000 | 1,415,345 | |||||||||||
Merrill Lynch, Pierce, Fenner & Smith, Inc. | 2.17% | 01/29/16 | 04/15/16 | 1,431,000 | 1,436,434 | |||||||||||
Merrill Lynch, Pierce, Fenner & Smith, Inc. | 2.18% | 03/28/16 | 04/28/16 | 1,478,000 | 1,478,358 | |||||||||||
Merrill Lynch, Pierce, Fenner & Smith, Inc. | 2.18% | 03/28/16 | 04/28/16 | 191,000 | 191,046 | |||||||||||
Merrill Lynch, Pierce, Fenner & Smith, Inc. | 2.22% | 01/29/16 | 04/15/16 | 1,150,000 | 1,154,468 | |||||||||||
Merrill Lynch, Pierce, Fenner & Smith, Inc. | 2.24% | 03/08/16 | 04/08/16 | 1,351,000 | 1,353,017 | |||||||||||
Merrill Lynch, Pierce, Fenner & Smith, Inc. | 2.24% | 03/08/16 | 04/08/16 | 476,000 | 476,711 | |||||||||||
Merrill Lynch, Pierce, Fenner & Smith, Inc. | 2.24% | 03/08/16 | 04/08/16 | 967,000 | 968,444 | |||||||||||
Merrill Lynch, Pierce, Fenner & Smith, Inc. | 2.24% | 03/29/16 | 04/08/16 | 2,105,000 | 2,105,393 | |||||||||||
See Notes to Consolidated Financial Statements.
184
Blackstone Alternative Multi-Strategy Fund and Subsidiaries
Consolidated Schedule of Investments (Continued)
March 31, 2016
Counterparty | Interest Rate | Trade Date | Maturity Date | Face Value | Face Value Including Accrued Interest | |||||||||||
Merrill Lynch, Pierce, Fenner & Smith, Inc. | 2.27% | 02/05/16 | 05/05/16 | $ | 1,227,000 | $ | 1,231,333 | |||||||||
Merrill Lynch, Pierce, Fenner & Smith, Inc. | 2.27% | 02/05/16 | 05/05/16 | 1,911,000 | 1,917,748 | |||||||||||
Merrill Lynch, Pierce, Fenner & Smith, Inc. | 2.27% | 02/05/16 | 05/05/16 | 1,897,000 | 1,903,699 | |||||||||||
Merrill Lynch, Pierce, Fenner & Smith, Inc. | 2.32% | 01/26/16 | 04/26/16 | 1,358,000 | 1,363,776 | |||||||||||
Merrill Lynch, Pierce, Fenner & Smith, Inc. | 2.32% | 01/13/16 | 04/13/16 | 1,954,000 | 1,963,948 | |||||||||||
Merrill Lynch, Pierce, Fenner & Smith, Inc. | 2.32% | 01/13/16 | 04/13/16 | 432,000 | 434,199 | |||||||||||
Merrill Lynch, Pierce, Fenner & Smith, Inc. | 2.32% | 01/14/16 | 04/14/16 | 837,000 | 841,207 | |||||||||||
Merrill Lynch, Pierce, Fenner & Smith, Inc. | 2.32% | 01/19/16 | 04/19/16 | 107,000 | 107,503 | |||||||||||
Merrill Lynch, Pierce, Fenner & Smith, Inc. | 2.32% | 01/26/16 | 04/26/16 | 1,666,000 | 1,673,086 | |||||||||||
Merrill Lynch, Pierce, Fenner & Smith, Inc. | 2.32% | 01/19/16 | 04/19/16 | 134,000 | 134,630 | |||||||||||
Merrill Lynch, Pierce, Fenner & Smith, Inc. | 2.37% | 01/28/16 | 04/15/16 | 5,006,000 | 5,027,092 | |||||||||||
Merrill Lynch, Pierce, Fenner & Smith, Inc. | 2.37% | 01/27/16 | 04/18/16 | 6,461,000 | 6,488,648 | |||||||||||
Merrill Lynch, Pierce, Fenner & Smith, Inc. | 2.37% | 01/27/16 | 04/18/16 | 5,033,000 | 5,054,537 | |||||||||||
Merrill Lynch, Pierce, Fenner & Smith, Inc. | 2.37% | 01/28/16 | 04/15/16 | 15,300,000 | 15,364,464 | |||||||||||
Merrill Lynch, Pierce, Fenner & Smith, Inc. | 2.37% | 01/28/16 | 04/15/16 | 7,179,000 | 7,209,248 | |||||||||||
Merrill Lynch, Pierce, Fenner & Smith, Inc. | 2.39% | 03/18/16 | 06/20/16 | 2,363,000 | 2,365,196 | |||||||||||
Merrill Lynch, Pierce, Fenner & Smith, Inc. | 2.41% | 01/05/16 | 04/05/16 | 1,031,000 | 1,037,005 | |||||||||||
Merrill Lynch, Pierce, Fenner & Smith, Inc. | 2.43% | 03/23/16 | 04/25/16 | 7,800,000 | 7,804,739 | |||||||||||
Royal Bank of Canada | 1.67% | 10/20/15 | 04/20/16 | 709,000 | 714,389 | |||||||||||
Royal Bank of Canada | 1.72% | 02/05/16 | 05/05/16 | 1,061,000 | 1,063,840 | |||||||||||
Royal Bank of Canada | 1.78% | 03/04/16 | 04/04/16 | 4,895,000 | 4,901,777 | |||||||||||
Royal Bank of Canada | 1.79% | 11/12/15 | 05/12/16 | 694,000 | 698,870 | |||||||||||
Royal Bank of Canada | 1.81% | 11/23/15 | 05/23/16 | 3,063,000 | 3,083,039 | |||||||||||
Royal Bank of Canada | 1.81% | 11/23/15 | 05/23/16 | 2,173,000 | 2,187,217 | |||||||||||
Royal Bank of Canada | 1.81% | 11/23/15 | 05/23/16 | 479,000 | 482,134 | |||||||||||
Royal Bank of Canada | 1.82% | 02/17/16 | 05/17/16 | 1,742,000 | 1,745,871 | |||||||||||
Royal Bank of Canada | 1.97% | 11/09/15 | 05/06/16 | 625,000 | 629,927 | |||||||||||
Royal Bank of Canada | 2.06% | 03/28/16 | 04/27/16 | 2,190,000 | 2,190,502 | |||||||||||
Royal Bank of Canada | 2.10% | 03/11/16 | 04/11/16 | 1,050,000 | 1,051,285 | |||||||||||
Royal Bank of Canada | 2.10% | 03/11/16 | 04/11/16 | 784,000 | 784,960 | |||||||||||
Royal Bank of Canada | 2.10% | 03/11/16 | 04/11/16 | 2,017,000 | 2,019,469 | |||||||||||
Royal Bank of Canada | 2.12% | 02/03/16 | 08/03/16 | 4,348,000 | 4,362,816 | |||||||||||
Royal Bank of Canada | 2.12% | 02/03/16 | 08/03/16 | 3,338,000 | 3,349,374 | |||||||||||
Royal Bank of Canada | 2.16% | 02/05/16 | 08/05/16 | 884,000 | 886,974 | |||||||||||
Royal Bank of Canada | 2.31% | 03/28/16 | 04/27/16 | 8,378,000 | 8,380,153 | |||||||||||
Royal Bank of Canada | 2.31% | 02/08/16 | 08/08/16 | 517,000 | 518,762 | |||||||||||
Royal Bank of Canada | 2.37% | 02/03/16 | 08/03/16 | 3,662,000 | 3,675,953 | |||||||||||
Royal Bank of Canada | 2.37% | 02/03/16 | 08/03/16 | 414,000 | 415,577 | |||||||||||
Royal Bank of Canada | 2.37% | 02/03/16 | 08/03/16 | 1,039,000 | 1,042,959 | |||||||||||
Royal Bank of Canada | 2.40% | 03/11/16 | 04/11/16 | 651,000 | 651,911 | |||||||||||
Royal Bank of Canada | 2.40% | 03/11/16 | 04/11/16 | 913,000 | 914,277 | |||||||||||
Wells Fargo Securities LLC | 2.43% | 03/29/16 | 04/29/16 | 825,000 | 825,167 | |||||||||||
Wells Fargo Securities LLC | 2.44% | 03/16/16 | 04/15/16 | 1,069,000 | 1,070,157 | |||||||||||
Wells Fargo Securities LLC | 2.44% | 03/16/16 | 04/15/16 | 526,000 | 526,570 | |||||||||||
Total Reverse Repurchase Agreements Outstanding |
| $ | 206,793,000 | $ | 207,381,307 | |||||||||||
See Notes to Consolidated Financial Statements.
185
Blackstone Alternative Multi-Strategy Fund and Subsidiaries
Consolidated Schedule of Investments (Continued)
March 31, 2016
Futures Contracts Outstanding at March 31, 2016
Description | Contracts | Exchange | Notional | Expiration | Unrealized | |||||||||||||||
Long Futures | ||||||||||||||||||||
90 Day Eurodollar | 1 | CME | 245,250 USD | 03/15/21 | $ | 12 | ||||||||||||||
Amsterdam Index | 19 | Euronext | 1,674,417 EUR | 04/15/16 | (4,048 | ) | ||||||||||||||
Australian 10-Year Bond | 125 | SFE | 16,143,187 AUD | 06/15/16 | 173,280 | |||||||||||||||
CAC40 10 Euro | 263 | Euronext | 11,725,868 EUR | 04/15/16 | (224,466 | ) | ||||||||||||||
Canada 10-Year Bond | 44 | CDE | 6,242,830 CAD | 06/21/16 | (27,187 | ) | ||||||||||||||
Cocoa | 235 | ICE | 6,974,031 USD | 07/14/16 | (20,381 | ) | ||||||||||||||
Coffee | 186 | ICE | 9,064,582 USD | 07/19/16 | (28,469 | ) | ||||||||||||||
Copper | 10 | COMEX | 535,732 USD | 05/26/16 | 10,018 | |||||||||||||||
Corn | 1,002 | CBOT | 18,338,008 USD | 05/13/16 | (727,858 | ) | ||||||||||||||
Cotton No. 2 | 810 | ICE | 25,164,011 USD | 05/06/16 | (1,495,811 | ) | ||||||||||||||
Cotton No. 2 | 291 | ICE | 8,196,821 USD | 07/07/16 | 287,284 | |||||||||||||||
DAX Index | 77 | Eurex | 19,188,081 EUR | 06/17/16 | 70,457 | |||||||||||||||
Euro FX | 99 | CME | 13,860,268 USD | 06/13/16 | 262,082 | |||||||||||||||
Euro Stoxx 50 | 961 | Eurex | 28,739,962 EUR | 06/17/16 | (652,076 | ) | ||||||||||||||
Euro-Bund | 883 | Eurex | 143,223,034 EUR | 06/08/16 | 1,124,843 | |||||||||||||||
FTSE 100 Index | 38 | ICE | 2,311,970 GBP | 06/17/16 | 15,755 | |||||||||||||||
FTSE/MIB Index | 258 | IDEM | 23,854,019 EUR | 06/17/16 | (1,167,689 | ) | ||||||||||||||
Gasoline RBOB | 91 | NYMEX | 5,300,582 USD | 04/29/16 | 228,706 | |||||||||||||||
Gasoline RBOB | 51 | NYMEX | 2,670,353 USD | 09/30/16 | 38,634 | |||||||||||||||
Gold 100 Oz | 184 | COMEX | 22,504,925 USD | 06/28/16 | 230,115 | |||||||||||||||
H-Shares Index | 26 | HKFE | 11,463,861 HKD | 04/28/16 | 30,776 | |||||||||||||||
Hang Seng Index | 34 | HKFE | 34,664,149 HKD | 04/28/16 | 91,236 | |||||||||||||||
Japan 10-Year Bond | 13 | OSE | 1,964,974,050 JPY | 06/13/16 | 17,113 | |||||||||||||||
Japanese Yen Currency | 265 | CME | 29,370,939 USD | 06/13/16 | 123,561 | |||||||||||||||
Live Cattle | 208 | CME | 10,549,580 USD | 06/30/16 | (230,700 | ) | ||||||||||||||
Long Gilt | 22 | ICE | 2,657,632 GBP | 06/28/16 | 13,226 | |||||||||||||||
Mex Bolsa Index | 1,275 | Mex Der | 569,245,582 MXN | 06/17/16 | 941,861 | |||||||||||||||
MSCI Singapore Index | 58 | SGX | 1,854,960 SGD | 04/28/16 | (3,962 | ) | ||||||||||||||
MSCI Taiwan Index | 78 | SGX | 2,504,799 USD | 04/28/16 | 6,801 | |||||||||||||||
Nasdaq100 E-Mini | 9 | CME | 783,437 USD | 06/17/16 | 22,288 | |||||||||||||||
Natural Gas | 10 | NYMEX | 289,287 USD | 02/24/17 | (7,087 | ) | ||||||||||||||
Natural Gas | 5 | NYMEX | 147,046 USD | 12/28/16 | (3,646 | ) | ||||||||||||||
Natural Gas | 106 | NYMEX | 2,091,850 USD | 04/27/16 | (15,310 | ) | ||||||||||||||
Nikkei 225 | 85 | OSE | 1,428,818,550 JPY | 06/09/16 | (37,483 | ) | ||||||||||||||
NY Harbor ULSD | 10 | NYMEX | 520,899 USD | 04/29/16 | (22,989 | ) | ||||||||||||||
OMXS30 Index | 1,640 | Nasdaq OMX | 225,049,979 SEK | 04/15/16 | (560,709 | ) | ||||||||||||||
Platinum | 10 | NYMEX | 476,882 USD | 07/27/16 | 11,868 | |||||||||||||||
Russell 2000 Mini | 16 | ICE | 1,708,949 USD | 06/17/16 | 66,411 | |||||||||||||||
S&P 500 E-Mini | 249 | CME | 24,946,322 USD | 06/17/16 | 594,852 | |||||||||||||||
S&P/TSX 60 Index | 30 | CDE | 4,698,652 CAD | 06/16/16 | 17,977 | |||||||||||||||
Silver | 7 | COMEX | 532,952 USD | 05/26/16 | 8,287 | |||||||||||||||
SPI 200 | 46 | SFE | 5,860,861 AUD | 06/16/16 | (26,799 | ) | ||||||||||||||
See Notes to Consolidated Financial Statements.
186
Blackstone Alternative Multi-Strategy Fund and Subsidiaries
Consolidated Schedule of Investments (Continued)
March 31, 2016
Description | Contracts | Exchange | Notional | Expiration | Unrealized | |||||||||||||||
Sugar 11 | 76 | ICE | 1,296,314 USD | 04/29/16 | $ | 10,277 | ||||||||||||||
Swiss Franc Currency | 110 | CME | 14,029,166 USD | 06/13/16 | 331,334 | |||||||||||||||
Swiss Market Index | 113 | Eurex | 8,809,640 CHF | 06/17/16 | (147,065 | ) | ||||||||||||||
TOPIX Index | 117 | OSE | 1,549,714,411 JPY | 06/09/16 | 238,665 | |||||||||||||||
U.S. Treasury 10-Year Note | 2,459 | CBOT | 318,464,889 USD | 06/21/16 | 2,165,657 | |||||||||||||||
Wheat | 171 | CBOT | 3,836,135 USD | 05/13/16 | 212,290 | |||||||||||||||
WTI Crude | 10 | NYMEX | 375,842 USD | 06/21/16 | 31,058 | |||||||||||||||
WTI Crude | 58 | NYMEX | 2,707,436 USD | 05/20/16 | (401,936 | ) | ||||||||||||||
WTI Crude | 135 | NYMEX | 6,245,585 USD | 11/20/17 | (57,185 | ) | ||||||||||||||
|
| |||||||||||||||||||
| $ | 1,513,868 | |||||||||||||||||||
|
| |||||||||||||||||||
Short Futures | ||||||||||||||||||||
90 Day Eurodollar | 89 | CME | 21,958,072 USD | 03/13/17 | $ | (98,353 | ) | |||||||||||||
90 Day Eurodollar | 51 | CME | 12,505,932 USD | 06/18/18 | (96,168 | ) | ||||||||||||||
90 Day Eurodollar | 49 | CME | 12,014,947 USD | 09/17/18 | (84,990 | ) | ||||||||||||||
90 Day Eurodollar | 14 | CME | 3,414,214 USD | 03/16/20 | (28,736 | ) | ||||||||||||||
90 Day Eurodollar | 143 | CME | 35,463,851 USD | 06/13/16 | (39,474 | ) | ||||||||||||||
90 Day Eurodollar | 81 | CME | 19,959,099 USD | 06/19/17 | (104,601 | ) | ||||||||||||||
90 Day Eurodollar | 8 | CME | 1,951,800 USD | 06/15/20 | (14,300 | ) | ||||||||||||||
90 Day Eurodollar | 14 | CME | 3,430,708 USD | 03/18/19 | (21,692 | ) | ||||||||||||||
90 Day Eurodollar | 16 | CME | 3,912,040 USD | 12/17/18 | (35,960 | ) | ||||||||||||||
90 Day Eurodollar | 16 | CME | 3,911,922 USD | 06/17/19 | (30,878 | ) | ||||||||||||||
90 Day Eurodollar | 138 | CME | 34,171,961 USD | 09/19/16 | (65,839 | ) | ||||||||||||||
90 Day Eurodollar | 120 | CME | 29,662,645 USD | 12/19/16 | (89,855 | ) | ||||||||||||||
90 Day Eurodollar | 64 | CME | 15,720,153 USD | 12/18/17 | (114,247 | ) | ||||||||||||||
90 Day Eurodollar | 73 | CME | 17,972,901 USD | 09/18/17 | (100,074 | ) | ||||||||||||||
90 Day Eurodollar | 59 | CME | 14,478,139 USD | 03/19/18 | (111,086 | ) | ||||||||||||||
90 Day Eurodollar | 15 | CME | 3,660,374 USD | 12/16/19 | (30,751 | ) | ||||||||||||||
90 Day Eurodollar | 16 | CME | 3,907,540 USD | 09/16/19 | (32,660 | ) | ||||||||||||||
90 Day Eurodollar | 3 | CME | 735,742 USD | 12/14/20 | (495 | ) | ||||||||||||||
90 Day Eurodollar | 6 | CME | 1,467,735 USD | 09/14/20 | (5,790 | ) | ||||||||||||||
90 Day Eurodollar | 1 | CME | 244,675 USD | 06/14/21 | (425 | ) | ||||||||||||||
AUD/USD Currency | 243 | CME | 18,030,085 USD | 06/13/16 | (559,415 | ) | ||||||||||||||
Australian 10-Year Bond | 475 | SFE | 61,669,556 AUD | 06/15/16 | (408,994 | ) | ||||||||||||||
Brent Crude | 15 | ICE | 660,375 USD | 04/29/16 | 55,425 | |||||||||||||||
Brent Crude | 46 | ICE | 2,517,243 USD | 10/31/16 | 530,043 | |||||||||||||||
British Pound Currency | 171 | CME | 15,224,130 USD | 06/13/16 | (137,014 | ) | ||||||||||||||
Canada 10-Year Bond | 577 | CDE | 81,196,055 CAD | 06/21/16 | (159,465 | ) | ||||||||||||||
Canadian Currency | 186 | CME | 13,936,248 USD | 06/14/16 | (398,772 | ) | ||||||||||||||
CBOE Volatility Index | 774 | CFE | 15,324,581 USD | 05/18/16 | 1,682,831 | |||||||||||||||
Copper | 145 | COMEX | 7,970,984 USD | 05/26/16 | 57,609 | |||||||||||||||
DAX Index | 105 | Eurex | 26,347,884 EUR | 06/17/16 | 111,382 | |||||||||||||||
Euro Stoxx 50 | 10,172 | Eurex | 303,158,334 EUR | 06/17/16 | 5,708,859 | |||||||||||||||
Euro-BOBL | 42 | Eurex | 5,518,342 EUR | 06/08/16 | 13,817 | |||||||||||||||
See Notes to Consolidated Financial Statements.
187
Blackstone Alternative Multi-Strategy Fund and Subsidiaries
Consolidated Schedule of Investments (Continued)
March 31, 2016
Description | Contracts | Exchange | Notional | Expiration | Unrealized | |||||||||||||||
Euro-BTP | 254 | Eurex | 35,362,177 EUR | 06/08/16 | $ | (404,299 | ) | |||||||||||||
Euro-Bund | 42 | Eurex | 6,819,044 EUR | 06/08/16 | (45,966 | ) | ||||||||||||||
Euro-Oat | 408 | Eurex | 63,679,648 EUR | 06/08/16 | (1,003,938 | ) | ||||||||||||||
FTSE 100 Index | 240 | ICE | 14,620,723 GBP | 06/17/16 | (72,497 | ) | ||||||||||||||
FTSE/JSE Top 40 | 368 | Safex | 171,288,860 ZAR | 06/15/16 | (61,595 | ) | ||||||||||||||
Gasoline RBOB | 18 | NYMEX | 1,208,467 USD | 05/31/16 | 103,724 | |||||||||||||||
IBEX 35 Index | 97 | MEFF | 8,765,163 EUR | 04/15/16 | 382,288 | |||||||||||||||
Lean Hogs | 93 | CME | 3,089,573 USD | 06/14/16 | 81,953 | |||||||||||||||
Long Gilt | 406 | ICE | 48,984,330 GBP | 06/28/16 | (331,759 | ) | ||||||||||||||
Low Sulphur Gasoil | 76 | ICE | 2,905,832 USD | 10/12/16 | (33,468 | ) | ||||||||||||||
Low Sulphur Gasoil | 107 | ICE | 3,810,850 USD | 05/12/16 | (25,100 | ) | ||||||||||||||
Nasdaq 100 E-Mini | 15 | CME | 1,307,113 USD | 06/17/16 | (35,762 | ) | ||||||||||||||
Natural Gas | 88 | NYMEX | 2,275,538 USD | 09/28/16 | 261,218 | |||||||||||||||
Natural Gas | 396 | NYMEX | 9,611,930 USD | 10/27/16 | (149,470 | ) | ||||||||||||||
Natural Gas | 300 | NYMEX | 5,402,303 USD | 04/27/16 | (474,697 | ) | ||||||||||||||
NY Harbor ULSD | 108 | NYMEX | 5,618,727 USD | 11/30/16 | (387,845 | ) | ||||||||||||||
NY Harbor ULSD | 12 | NYMEX | 785,602 USD | 05/31/16 | 179,946 | |||||||||||||||
Platinum | 70 | NYMEX | 3,351,424 USD | 07/27/16 | (69,826 | ) | ||||||||||||||
S&P 500 | 19 | CME | 9,457,220 USD | 06/16/16 | (287,405 | ) | ||||||||||||||
S&P 500 E-Mini | 3,940 | CME | 394,108,927 USD | 06/17/16 | (10,036,573 | ) | ||||||||||||||
S&P/TSX 60 Index | 267 | CDE | 41,940,793 CAD | 06/16/16 | (65,453 | ) | ||||||||||||||
SGX Nifty 50 | 5,059 | SGX | 78,073,878 USD | 04/28/16 | (720,047 | ) | ||||||||||||||
Silver | 102 | COMEX | 7,653,193 USD | 05/26/16 | (233,447 | ) | ||||||||||||||
Soybean Meal | 17 | CBOT | 457,014 USD | 05/13/16 | (2,496 | ) | ||||||||||||||
Soybean Oil | 517 | CBOT | 9,478,485 USD | 05/13/16 | (1,136,560 | ) | ||||||||||||||
SPI 200 | 297 | SFE | 37,891,863 AUD | 06/16/16 | 212,191 | |||||||||||||||
TOPIX Index | 495 | OSE | 6,529,213,350 JPY | 06/09/16 | (1,252,047 | ) | ||||||||||||||
U.S. Treasury 10-Year Note | 141 | CBOT | 18,376,764 USD | 06/21/16 | (8,314 | ) | ||||||||||||||
U.S. Treasury 2-Year Note | 62 | CBOT | 13,526,510 USD | 06/30/16 | (35,990 | ) | ||||||||||||||
U.S. Treasury 5-Year Note | 15 | CBOT | 1,816,033 USD | 06/30/16 | (1,428 | ) | ||||||||||||||
U.S. Treasury Long Bond | 71 | CBOT | 11,677,086 USD | 06/21/16 | 2,023 | |||||||||||||||
WTI Crude | 119 | NYMEX | 4,246,134 USD | 04/20/16 | (316,326 | ) | ||||||||||||||
WTI Crude | 89 | NYMEX | 3,902,104 USD | 11/21/16 | 73,324 | |||||||||||||||
|
| |||||||||||||||||||
| $ | (10,505,709 | ) | ||||||||||||||||||
|
| |||||||||||||||||||
Total Futures Contracts Outstanding |
| $ | (8,991,841 | ) | ||||||||||||||||
|
| |||||||||||||||||||
See Notes to Consolidated Financial Statements.
188
Blackstone Alternative Multi-Strategy Fund and Subsidiaries
Consolidated Schedule of Investments (Continued)
March 31, 2016
Forward Foreign Currency Exchange Contracts Outstanding at March 31, 2016
Currency | Amount in | Currency | Amount in | Counterparty | Settlement | Unrealized | ||||||||||||||||
AUD | 566,098 | USD | 423,181 | Morgan Stanley & Co. LLC | 06/15/16 | $ | 9,335 | |||||||||||||||
AUD | 15,587,000 | USD | 11,597,507 | State Street Bank and Trust Company | 06/15/16 | 311,422 | ||||||||||||||||
AUD | 1,085,000 | USD | 824,977 | JPMorgan Chase Bank, N.A. | 04/29/16 | 5,771 | ||||||||||||||||
BRL | 59,943,087 | USD | 14,521,800 | State Street Bank and Trust Company | 06/02/16 | 1,888,858 | ||||||||||||||||
BRL | 8,503,000 | USD | 2,115,174 | State Street Bank and Trust Company | 06/02/16 | 212,698 | ||||||||||||||||
BRL | 33,591,327 | USD | 8,759,147 | Morgan Stanley Capital Services LLC | 04/04/16 | 583,066 | ||||||||||||||||
BRL | 23,543,483 | USD | 6,164,829 | Morgan Stanley Capital Services LLC | 04/04/16 | 382,939 | ||||||||||||||||
CAD | 161,874 | USD | 122,434 | Morgan Stanley & Co. LLC | 06/15/16 | 2,214 | ||||||||||||||||
CAD | 17,742,811 | USD | 13,288,753 | State Street Bank and Trust Company | 06/15/16 | 373,565 | ||||||||||||||||
CHF | 7,425,654 | USD | 7,486,943 | Morgan Stanley & Co. LLC | 06/15/16 | 260,210 | ||||||||||||||||
CHF | 2,129,081 | USD | 2,150,000 | State Street Bank and Trust Company | 06/13/16 | 71,155 | ||||||||||||||||
CHF | 3,251,758 | USD | 3,325,178 | Morgan Stanley & Co. LLC | 06/15/16 | 67,367 | ||||||||||||||||
CHF | 4,630,606 | USD | 4,713,285 | Morgan Stanley & Co. LLC | 06/15/16 | 117,807 | ||||||||||||||||
CHF | 2,075,000 | USD | 2,112,604 | State Street Bank and Trust Company | 06/15/16 | 52,234 | ||||||||||||||||
CHF | 4,745,454 | USD | 4,931,580 | Morgan Stanley & Co. LLC | 06/15/16 | 19,332 | ||||||||||||||||
CHF | 3,010,656 | USD | 3,123,424 | Morgan Stanley & Co. LLC | 06/15/16 | 17,580 | ||||||||||||||||
CHF | 2,462,823 | USD | 2,542,190 | Morgan Stanley & Co. LLC | 06/15/16 | 27,262 | ||||||||||||||||
CNH | 17,667,000 | USD | 2,600,000 | State Street Bank and Trust Company | 05/13/16 | 129,685 | ||||||||||||||||
CZK | 24,268,000 | USD | 999,670 | State Street Bank and Trust Company | 06/15/16 | 23,135 | ||||||||||||||||
DKK | 9,475,250 | USD | 1,403,258 | Morgan Stanley & Co. LLC | 06/15/16 | 46,922 | ||||||||||||||||
DKK | 2,109,160 | USD | 317,408 | Morgan Stanley & Co. LLC | 06/15/16 | 5,397 | ||||||||||||||||
DKK | 2,261,730 | USD | 338,213 | Morgan Stanley & Co. LLC | 06/15/16 | 7,943 | ||||||||||||||||
EUR | 10,319,556 | USD | 11,353,421 | State Street Bank and Trust Company | 06/15/16 | 414,972 | ||||||||||||||||
EUR | 225,785 | USD | 250,000 | State Street Bank and Trust Company | 06/13/16 | 7,461 | ||||||||||||||||
EUR | 5,681 | USD | 6,448 | Morgan Stanley & Co. LLC | 06/15/16 | 31 | ||||||||||||||||
EUR | 541,138 | USD | 608,582 | Morgan Stanley & Co. LLC | 06/15/16 | 8,530 | ||||||||||||||||
EUR | 820,000 | USD | 920,573 | Morgan Stanley & Co. LLC | 06/15/16 | 14,531 | ||||||||||||||||
EUR | 4,900,000 | USD | 5,501,279 | Morgan Stanley & Co. LLC | 06/15/16 | 86,539 | ||||||||||||||||
EUR | 1,300,000 | USD | 1,478,958 | Morgan Stanley & Co. LLC | 06/15/16 | 3,524 | ||||||||||||||||
EUR | 5,050,000 | USD | 5,761,646 | Morgan Stanley & Co. LLC | 06/15/16 | (2,773 | ) | |||||||||||||||
GBP | 209,856 | USD | 301,986 | Morgan Stanley & Co. LLC | 06/15/16 | (518 | ) | |||||||||||||||
GBP | 40,000 | USD | 57,273 | Morgan Stanley & Co. LLC | 06/15/16 | 189 | ||||||||||||||||
GBP | 5,857 | USD | 8,479 | Morgan Stanley & Co. LLC | 06/15/16 | (65 | ) | |||||||||||||||
GBP | 4,184 | USD | 5,946 | Morgan Stanley & Co. LLC | 06/15/16 | 64 | ||||||||||||||||
See Notes to Consolidated Financial Statements.
189
Blackstone Alternative Multi-Strategy Fund and Subsidiaries
Consolidated Schedule of Investments (Continued)
March 31, 2016
Currency | Amount in | Currency | Amount in | Counterparty | Settlement | Unrealized | ||||||||||||||||
GBP | 800,000 | USD | 1,128,456 | Morgan Stanley & Co. LLC | 06/15/16 | $ | 20,784 | |||||||||||||||
HKD | 600,000 | USD | 77,412 | Morgan Stanley & Co. LLC | 06/15/16 | (29 | ) | |||||||||||||||
HKD | 12,000,000 | USD | 1,548,541 | Morgan Stanley & Co. LLC | 06/15/16 | (868 | ) | |||||||||||||||
HKD | 5,789,000 | USD | 746,578 | Morgan Stanley & Co. LLC | 06/15/16 | 46 | ||||||||||||||||
HKD | 6,490,000 | USD | 837,540 | Morgan Stanley & Co. LLC | 06/15/16 | (507 | ) | |||||||||||||||
HUF | 11,717,271,000 | USD | 41,409,637 | State Street Bank and Trust Company | 06/15/16 | 1,019,396 | ||||||||||||||||
HUF | 2,669,161,000 | USD | 9,569,869 | State Street Bank and Trust Company | 06/15/16 | 95,344 | ||||||||||||||||
ILS | 3,574,000 | USD | 919,764 | State Street Bank and Trust Company | 06/15/16 | 33,277 | ||||||||||||||||
JPY | 1,270,267,836 | USD | 11,226,208 | State Street Bank and Trust Company | 06/15/16 | 83,541 | ||||||||||||||||
JPY | 50,000,000 | USD | 440,956 | Morgan Stanley & Co. LLC | 06/15/16 | 4,237 | ||||||||||||||||
JPY | 1,312,025,000 | USD | 11,641,748 | State Street Bank and Trust Company | 06/15/16 | 39,783 | ||||||||||||||||
JPY | 100,000,000 | USD | 887,430 | Morgan Stanley & Co. LLC | 06/15/16 | 2,957 | ||||||||||||||||
JPY | 130,000,000 | USD | 1,169,696 | Morgan Stanley & Co. LLC | 06/15/16 | (12,193 | ) | |||||||||||||||
JPY | 65,000,000 | USD | 583,101 | Morgan Stanley & Co. LLC | 06/15/16 | (4,349 | ) | |||||||||||||||
JPY | 96,000,000 | USD | 861,211 | State Street Bank and Trust Company | 06/13/16 | (6,508 | ) | |||||||||||||||
JPY | 65,000,000 | USD | 578,189 | Morgan Stanley & Co. LLC | 06/15/16 | 562 | ||||||||||||||||
JPY | 1,700,000,000 | USD | 15,045,712 | Morgan Stanley & Co. LLC | 06/15/16 | 90,862 | ||||||||||||||||
JPY | 90,000,000 | USD | 796,185 | Morgan Stanley & Co. LLC | 06/15/16 | 5,163 | ||||||||||||||||
JPY | 150,000,000 | USD | 1,336,779 | Morgan Stanley & Co. LLC | 06/15/16 | (1,199 | ) | |||||||||||||||
JPY | 90,000,000 | USD | 802,432 | Morgan Stanley & Co. LLC | 06/15/16 | (1,084 | ) | |||||||||||||||
MXN | 123,337,668 | USD | 6,866,207 | Morgan Stanley Capital Services LLC | 06/15/16 | 227,471 | ||||||||||||||||
MXN | 329,207,211 | USD | 18,432,139 | State Street Bank and Trust Company | 06/15/16 | 500,280 | ||||||||||||||||
MXN | 77,785,227 | USD | 4,357,583 | Morgan Stanley Capital Services LLC | 06/15/16 | 116,179 | ||||||||||||||||
NZD | 1,511,876 | USD | 1,023,903 | State Street Bank and Trust Company | 06/13/16 | 17,291 | ||||||||||||||||
NZD | 2,827,000 | USD | 1,870,032 | State Street Bank and Trust Company | 06/15/16 | 76,789 | ||||||||||||||||
RUB | 50,481,096 | USD | 695,045 | State Street Bank and Trust Company | 06/15/16 | 42,913 | ||||||||||||||||
SEK | 106,149,602 | USD | 12,582,931 | State Street Bank and Trust Company | 06/15/16 | 526,113 | ||||||||||||||||
SGD | 220,000 | USD | 161,407 | JPMorgan Chase Bank, N.A. | 04/29/16 | 1,816 | ||||||||||||||||
TRY | 108,745,750 | USD | 36,721,061 | State Street Bank and Trust Company | 06/15/16 | 1,095,515 | ||||||||||||||||
ZAR | 168,776,358 | USD | 10,905,684 | State Street Bank and Trust Company | 06/15/16 | 365,080 | ||||||||||||||||
USD | 54,551,246 | AUD | 73,149,999 | State Street Bank and Trust Company | 06/15/16 | (1,337,517 | ) | |||||||||||||||
USD | 203,834 | AUD | 267,815 | Morgan Stanley & Co. LLC | 06/15/16 | (784 | ) | |||||||||||||||
See Notes to Consolidated Financial Statements.
190
Blackstone Alternative Multi-Strategy Fund and Subsidiaries
Consolidated Schedule of Investments (Continued)
March 31, 2016
Currency | Amount in | Currency | Amount in | Counterparty | Settlement | Unrealized | ||||||||||||||||
USD | 12,825 | AUD | 16,914 | Morgan Stanley & Co. LLC | 06/15/16 | $ | (98 | ) | ||||||||||||||
USD | 396,251 | BRL | 1,501,000 | State Street Bank and Trust Company | 06/02/16 | (14,678 | ) | |||||||||||||||
USD | 6,513,621 | BRL | 23,543,483 | Morgan Stanley Capital Services LLC | 04/04/16 | (34,147 | ) | |||||||||||||||
USD | 2,000,000 | BRL | 8,144,000 | State Street Bank and Trust Company | 06/02/16 | (229,588 | ) | |||||||||||||||
USD | 1,000,000 | BRL | 4,083,500 | State Street Bank and Trust Company | 06/02/16 | (117,942 | ) | |||||||||||||||
USD | 8,378,979 | BRL | 33,591,327 | Morgan Stanley Capital Services LLC | 04/04/16 | (963,234 | ) | |||||||||||||||
USD | 13,389,588 | CAD | 17,742,811 | State Street Bank and Trust Company | 06/15/16 | (272,730 | ) | |||||||||||||||
USD | 5,634,021 | CHF | 5,570,300 | State Street Bank and Trust Company | 06/13/16 | (177,173 | ) | |||||||||||||||
USD | 3,305,896 | CHF | 3,240,074 | Morgan Stanley & Co. LLC | 06/15/16 | (74,459 | ) | |||||||||||||||
USD | 47,312,745 | CHF | 46,991,018 | State Street Bank and Trust Company | 06/15/16 | (1,712,782 | ) | |||||||||||||||
USD | 9,914,459 | CHF | 9,694,854 | Morgan Stanley & Co. LLC | 06/15/16 | (200,635 | ) | |||||||||||||||
USD | 4,920,035 | CHF | 4,811,400 | Morgan Stanley & Co. LLC | 06/15/16 | (99,678 | ) | |||||||||||||||
USD | 4,857,000 | CHF | 4,771,800 | Morgan Stanley & Co. LLC | 06/15/16 | (121,399 | ) | |||||||||||||||
USD | 4,859,506 | CHF | 4,676,100 | Morgan Stanley & Co. LLC | 06/15/16 | (19,049 | ) | |||||||||||||||
USD | 888,586 | CHF | 875,000 | State Street Bank and Trust Company | 06/13/16 | (24,254 | ) | |||||||||||||||
USD | 2,391,389 | CHF | 2,305,050 | Morgan Stanley & Co. LLC | 06/15/16 | (13,460 | ) | |||||||||||||||
USD | 1,976,794 | CHF | 1,920,447 | Morgan Stanley & Co. LLC | 06/15/16 | (26,800 | ) | |||||||||||||||
USD | 826,708 | CHF | 810,000 | State Street Bank and Trust Company | 06/13/16 | (18,322 | ) | |||||||||||||||
USD | 5,387,135 | CNH | 35,209,159 | Morgan Stanley Capital Services LLC | 06/15/16 | (44,103 | ) | |||||||||||||||
USD | 3,000,000 | CNH | 19,432,500 | State Street Bank and Trust Company | 05/13/16 | (2,468 | ) | |||||||||||||||
USD | 7,392,317 | CNH | 50,282,543 | Morgan Stanley Capital Services LLC | 08/22/16 | (337,520 | ) | |||||||||||||||
USD | 4,207,427 | CNH | 27,790,053 | Morgan Stanley Capital Services LLC | 08/22/16 | (64,684 | ) | |||||||||||||||
USD | 2,770,557 | CNH | 18,415,337 | Morgan Stanley Capital Services LLC | 08/22/16 | (60,397 | ) | |||||||||||||||
USD | 7,878,490 | CNH | 51,352,000 | State Street Bank and Trust Company | 05/13/16 | (55,782 | ) | |||||||||||||||
USD | 9,966,272 | CZK | 245,100,525 | State Street Bank and Trust Company | 06/15/16 | (363,796 | ) | |||||||||||||||
USD | 72,437 | DKK | 476,190 | Morgan Stanley & Co. LLC | 06/15/16 | (444 | ) | |||||||||||||||
USD | 17,666 | DKK | 117,216 | Morgan Stanley & Co. LLC | 06/15/16 | (274 | ) | |||||||||||||||
USD | 4,429,280 | EUR | 4,000,000 | State Street Bank and Trust Company | 06/13/16 | (131,900 | ) | |||||||||||||||
USD | 6,164,384 | EUR | 5,566,689 | State Street Bank and Trust Company | 06/13/16 | (183,284 | ) | |||||||||||||||
See Notes to Consolidated Financial Statements.
191
Blackstone Alternative Multi-Strategy Fund and Subsidiaries
Consolidated Schedule of Investments (Continued)
March 31, 2016
Currency | Amount in | Currency | Amount in | Counterparty | Settlement | Unrealized | ||||||||||||||||
USD | 464,259 | EUR | 420,684 | Morgan Stanley & Co. LLC | 06/15/16 | $ | (15,488 | ) | ||||||||||||||
USD | 27,803,805 | EUR | 24,847,011 | Morgan Stanley & Co. LLC | 06/15/16 | (531,004 | ) | |||||||||||||||
USD | 20,663,583 | EUR | 18,555,582 | Morgan Stanley Capital Services LLC | 06/15/16 | (496,663 | ) | |||||||||||||||
USD | 5,026,064 | EUR | 4,513,329 | Morgan Stanley Capital Services LLC | 06/15/16 | (120,805 | ) | |||||||||||||||
USD | 48,943,119 | EUR | 43,950,173 | Morgan Stanley Capital Services LLC | 06/15/16 | (1,176,381 | ) | |||||||||||||||
USD | 1,557,710 | EUR | 1,400,000 | Morgan Stanley & Co. LLC | 06/15/16 | (38,809 | ) | |||||||||||||||
USD | 10,930,769 | EUR | 9,815,000 | State Street Bank and Trust Company | 06/15/16 | (262,229 | ) | |||||||||||||||
USD | 1,843,862 | EUR | 1,660,000 | State Street Bank and Trust Company | 06/13/16 | (49,028 | ) | |||||||||||||||
USD | 79,010,820 | EUR | 70,000,000 | State Street Bank and Trust Company | 04/21/16 | (683,092 | ) | |||||||||||||||
USD | 8,031,287 | EUR | 7,155,000 | JPMorgan Chase Bank, N.A. | 04/29/16 | (116,399 | ) | |||||||||||||||
USD | 527,104 | EUR | 468,689 | Morgan Stanley & Co. LLC | 06/15/16 | (7,388 | ) | |||||||||||||||
USD | 2,924,610 | EUR | 2,600,000 | State Street Bank and Trust Company | 04/25/16 | (35,798 | ) | |||||||||||||||
USD | 339,781 | EUR | 303,821 | Morgan Stanley Capital Services LLC | 06/15/16 | (6,688 | ) | |||||||||||||||
USD | 1,929,376 | EUR | 1,720,000 | State Street Bank and Trust Company | 06/13/16 | (31,932 | ) | |||||||||||||||
USD | 1,541,066 | EUR | 1,377,972 | Morgan Stanley Capital Services LLC | 06/15/16 | (30,333 | ) | |||||||||||||||
USD | 11,166,662 | GBP | 7,869,000 | State Street Bank and Trust Company | 06/13/16 | (137,430 | ) | |||||||||||||||
USD | 75,676 | GBP | 53,197 | Morgan Stanley & Co. LLC | 06/15/16 | (745 | ) | |||||||||||||||
USD | 14,188,280 | GBP | 9,969,000 | State Street Bank and Trust Company | 06/15/16 | (132,893 | ) | |||||||||||||||
USD | 11,746,408 | GBP | 8,257,000 | State Street Bank and Trust Company | 06/15/16 | (115,355 | ) | |||||||||||||||
USD | 1,057,887 | GBP | 730,000 | Morgan Stanley & Co. LLC | 06/15/16 | 9,205 | ||||||||||||||||
USD | 1,891,182 | GBP | 1,340,000 | State Street Bank and Trust Company | 06/13/16 | (33,774 | ) | |||||||||||||||
USD | 7,196,885 | GBP | 5,000,000 | State Street Bank and Trust Company | 04/21/16 | 15,272 | ||||||||||||||||
USD | 7,907,381 | GBP | 5,565,000 | JPMorgan Chase Bank, N.A. | 04/29/16 | (85,893 | ) | |||||||||||||||
USD | 2,668,063 | GBP | 1,842,000 | State Street Bank and Trust Company | 06/13/16 | 21,966 | ||||||||||||||||
USD | 2,480,318 | GBP | 1,740,000 | Morgan Stanley & Co. LLC | 06/15/16 | (19,280 | ) | |||||||||||||||
USD | 14,204,754 | HKD | 110,160,000 | Morgan Stanley & Co. LLC | 06/15/16 | (2,881 | ) | |||||||||||||||
USD | 71,392,060 | ILS | 277,522,353 | State Street Bank and Trust Company | 06/15/16 | (2,611,860 | ) | |||||||||||||||
USD | 416,896 | JPY | 46,801,610 | State Street Bank and Trust Company | 06/13/16 | 214 | ||||||||||||||||
USD | 238,284 | JPY | 27,000,000 | Morgan Stanley & Co. LLC | 06/15/16 | (2,120 | ) | |||||||||||||||
USD | 91,682,147 | JPY | 10,391,896,311 | Morgan Stanley & Co. LLC | 06/15/16 | (845,922 | ) | |||||||||||||||
See Notes to Consolidated Financial Statements.
192
Blackstone Alternative Multi-Strategy Fund and Subsidiaries
Consolidated Schedule of Investments (Continued)
March 31, 2016
Currency | Amount in | Currency | Amount in | Counterparty | Settlement | Unrealized | ||||||||||||||||
USD | 5,213,981 | JPY | 591,167,057 | Morgan Stanley Capital Services LLC | 06/15/16 | $ | (49,692 | ) | ||||||||||||||
USD | 273,513 | JPY | 31,000,000 | Morgan Stanley & Co. LLC | 06/15/16 | (2,507 | ) | |||||||||||||||
USD | 26,990,796 | JPY | 3,000,000,000 | State Street Bank and Trust Company | 06/20/16 | 273,821 | ||||||||||||||||
USD | 171,242 | JPY | 19,226,000 | JPMorgan Chase Bank, N.A. | 04/28/16 | 285 | ||||||||||||||||
USD | 13,794,470 | KRW | 16,605,093,000 | State Street Bank and Trust Company | 06/15/16 | (673,948 | ) | |||||||||||||||
USD | 8,193,073 | KRW | 9,800,144,819 | Morgan Stanley Capital Services LLC | 04/18/16 | (363,666 | ) | |||||||||||||||
USD | 11,351,328 | KRW | 13,563,702,000 | State Street Bank and Trust Company | 06/15/16 | (467,052 | ) | |||||||||||||||
USD | 7,145,293 | MXN | 128,883,223 | State Street Bank and Trust Company | 06/13/16 | (268,569 | ) | |||||||||||||||
USD | 2,079,580 | MXN | 37,447,000 | State Street Bank and Trust Company | 06/15/16 | (73,964 | ) | |||||||||||||||
USD | 1,718,975 | MXN | 31,000,000 | State Street Bank and Trust Company | 06/13/16 | (64,265 | ) | |||||||||||||||
USD | 5,794,210 | MXN | 100,523,753 | Morgan Stanley Capital Services LLC | 06/15/16 | 12,658 | ||||||||||||||||
USD | 5,816,324 | MXN | 100,599,141 | Morgan Stanley Capital Services LLC | 06/15/16 | 30,436 | ||||||||||||||||
USD | 26,113,221 | NZD | 39,308,196 | State Street Bank and Trust Company | 06/15/16 | (956,476 | ) | |||||||||||||||
USD | 5,091,722 | RUB | 368,437,000 | State Street Bank and Trust Company | 06/15/16 | (294,271 | ) | |||||||||||||||
USD | 10,746,941 | SAR | 41,268,255 | Morgan Stanley Capital Services LLC | 01/19/17 | (183,792 | ) | |||||||||||||||
USD | 833,564 | SEK | 6,936,000 | State Street Bank and Trust Company | 06/15/16 | (23,004 | ) | |||||||||||||||
USD | 2,177,621 | TRY | 6,434,000 | State Street Bank and Trust Company | 06/15/16 | (59,816 | ) | |||||||||||||||
USD | 886,749 | ZAR | 14,155,000 | State Street Bank and Trust Company | 06/15/16 | (58,511 | ) | |||||||||||||||
|
| |||||||||||||||||||||
Total Forward Foreign Currency Exchange Contracts Outstanding |
| $ | (7,982,203 | ) | ||||||||||||||||||
|
| |||||||||||||||||||||
See Notes to Consolidated Financial Statements.
193
Blackstone Alternative Multi-Strategy Fund and Subsidiaries
Consolidated Schedule of Investments (Continued)
March 31, 2016
Centrally Cleared Credit Default Swaps on Single-Name Issues (Buy Protection) — Outstanding at March 31, 2016
Reference Obligation | The | Maturity | Counterparty | Notional | Market | Upfront | Unrealized | |||||||||||||||||||
Federative Republic of Brazil | (1.00)% | 06/20/20 | Credit Suisse Securities (USA) LLC | 4,722,000 USD | $ | 382,161 | $ | 328,236 | $ | 53,925 | ||||||||||||||||
Republic of South Africa | (1.00)% | 06/20/21 | Credit Suisse Securities (USA) LLC | 6,200,000 USD | 576,120 | 567,549 | 8,571 | |||||||||||||||||||
Republic of Turkey | (1.00)% | 09/20/20 | Credit Suisse Securities (USA) LLC | 4,178,000 USD | 217,816 | 333,473 | (115,657) | |||||||||||||||||||
Republic of Turkey | (1.00)% | 12/20/20 | Credit Suisse Securities (USA) LLC | 9,719,000 USD | 571,924 | 660,064 | (88,140) | |||||||||||||||||||
Total Centrally Cleared Credit Default Swaps on Single-Name Issues (Buy Protection) |
| $ | 1,748,021 | $ | 1,889,322 | $ | (141,301) | |||||||||||||||||||
Centrally Cleared Credit Default Swaps on Single-Name Issues (Sell Protection) — Outstanding at March 31, 2016
Reference Obligation | The | Maturity | Counterparty | Notional | Market | Upfront | Unrealized | |||||||||||||||||||
Russian Federation | 1.00% | 09/20/20 | Credit Suisse Securities (USA) LLC | 6,551,141 USD | $ | (414,739) | $ | (750,762) | $ | 336,023 | ||||||||||||||||
Total Centrally Cleared Credit Default Swap on Single-Name Issues (Sell Protection) |
| $ | (414,739) | $ | (750,762) | $ | 336,023 | |||||||||||||||||||
Centrally Cleared Credit Default Swaps on Index (Buy Protection) — Outstanding at March 31, 2016
Reference Obligation | The | Maturity | Counterparty | Notional | Market | Upfront | Unrealized | |||||||||||||||||||
CDX.NA.HY.25 | (5.00)% | 12/20/20 | Credit Suisse Securities (USA) LLC | 20,878,862 USD | $ | (597,263) | $ | 573,405 | $ | (1,170,668) | ||||||||||||||||
Total Centrally Cleared Credit Default Swaps on Index (Buy Protection) |
| $ | (597,263) | $ | 573,405 | $ | (1,170,668) | |||||||||||||||||||
See Notes to Consolidated Financial Statements.
194
Blackstone Alternative Multi-Strategy Fund and Subsidiaries
Consolidated Schedule of Investments (Continued)
March 31, 2016
Centrally Cleared Credit Default Swaps on Index (Sell Protection) — Outstanding at March 31, 2016
Reference Obligation | The | Maturity | Counterparty | Notional | Market | Upfront | Unrealized | |||||||||||||||||||
CDX.NA.HY.25 | 5.00% | 12/20/20 | Merrill Lynch, Pierce, Fenner & Smith, Inc. | 28,750,000 USD | $ | 822,425 | $ | 271,750 | $ | 550,675 | ||||||||||||||||
CDX.NA.IG.25 | 1.00% | 12/20/20 | Merrill Lynch, Pierce, Fenner & Smith, Inc. | 62,250,000 USD | 306,309 | 273,200 | 33,109 | |||||||||||||||||||
iTraxx Europe Crossover Series 24 Version 1 | 5.00% | 12/20/20 | Merrill Lynch, Pierce, Fenner & Smith, Inc. | 25,125,000 EUR | 2,106,492 | 1,806,041 | 300,451 | |||||||||||||||||||
iTraxx Europe Series 24 Version 1 | 1.00% | 12/20/20 | Merrill Lynch, Pierce, Fenner & Smith, Inc. | 21,250,000 EUR | 301,685 | 147,212 | 154,473 | |||||||||||||||||||
Total Centrally Cleared Credit Default Swaps on Index (Sell Protection) |
| $ | 3,536,911 | $ | 2,498,203 | $ | 1,038,708 | |||||||||||||||||||
OTC Credit Default Swaps on Index (Buy Protection) — Outstanding at March 31, 2016
Reference Obligation | The | Maturity | Counterparty | Notional | Market | Upfront | Unrealized | |||||||||||||||||||
CMBX.NA.AAA.6 | (0.50)% | 05/11/63 | JPMorgan Chase Bank, N.A. | 86,772,151 USD | $ | 1,773,717 | $ | 1,692,034 | $ | 81,683 | ||||||||||||||||
CMBX.NA.AAA.8 | (0.50)% | 10/17/57 | JPMorgan Chase Bank, N.A. | 105,061,955 USD | 4,730,533 | 4,831,367 | (100,834) | |||||||||||||||||||
CMBX.NA.AAA.8 | (0.50)% | 10/17/57 | Credit Suisse International | 29,872,422 USD | 1,345,040 | 1,310,295 | 34,745 | |||||||||||||||||||
CMBX.NA.AAA.8 | (0.50)% | 10/17/57 | Deutsche Bank AG | 4,635,362 USD | 208,712 | 238,899 | (30,187) | |||||||||||||||||||
CMBX.NA.AAA.8 | (0.50)% | 10/17/57 | Morgan Stanley Capital Services LLC | 13,032,023 USD | 586,782 | 620,020 | (33,238) | |||||||||||||||||||
CMBX.NA.BBB-.7 | (3.00)% | 01/17/47 | JPMorgan Chase Bank, N.A. | 7,433,840 USD | 673,858 | 828,922 | (155,064) | |||||||||||||||||||
CMBX.NA.BBB-.7 | (3.00)% | 01/17/47 | Credit Suisse International | 1,019,600 USD | 92,424 | 176,557 | (84,133) | |||||||||||||||||||
CMBX.NA.BBB-.7 | (3.00)% | 01/17/47 | Deutsche Bank AG | 4,813,338 USD | 436,316 | 471,561 | (35,245) | |||||||||||||||||||
Total OTC Credit Default Swaps on Index (Buy Protection) |
| $ | 9,847,382 | $ | 10,169,655 | $ | (322,273) | |||||||||||||||||||
See Notes to Consolidated Financial Statements.
195
Blackstone Alternative Multi-Strategy Fund and Subsidiaries
Consolidated Schedule of Investments (Continued)
March 31, 2016
OTC Credit Default Swaps on Index (Sell Protection) — Outstanding at March 31, 2016
Reference Obligation | The | Maturity | Counterparty | Notional | Market | Upfront | Unrealized | |||||||||||||||||||
CMBX.NA.A.8 | 2.00% | 10/17/57 | Credit Suisse International | 6,248,000 USD | $ | (635,099) | $ | (844,810) | $ | 209,711 | ||||||||||||||||
CMBX.NA.A.8 | 2.00% | 10/17/57 | Morgan Stanley Capital Services LLC | 2,800,000 USD | (284,616) | (188,750) | (95,866) | |||||||||||||||||||
CMBX.NA.AA.6 | 1.50% | 05/11/63 | Credit Suisse International | 2,845,549 USD | (92,106) | (176,908) | 84,802 | |||||||||||||||||||
CMBX.NA.AA.7 | 1.50% | 01/17/47 | Credit Suisse International | 7,635,867 USD | (339,481) | (642,904) | 303,423 | |||||||||||||||||||
CMBX.NA.AAA.8 | 0.50% | 10/17/57 | Credit Suisse International | 47,000,000 USD | (2,116,228) | (2,532,991) | 416,763 | |||||||||||||||||||
CMBX.NA.AAA.9 | 0.50% | 09/17/58 | Morgan Stanley Capital Services LLC | 10,500,000 USD | (662,281) | (699,173) | 36,892 | |||||||||||||||||||
CMBX.NA.BBB-.8 | 3.00% | 10/17/57 | Credit Suisse International | 8,455,000 USD | (1,467,806) | (951,016) | (516,790) | |||||||||||||||||||
Total OTC Credit Default Swaps on Index (Sell Protection) |
| $ | (5,597,617) | $ | (6,036,552) | $ | 438,935 | |||||||||||||||||||
OTC Total Return Swaps Outstanding at March 31, 2016
Reference | Termination | Counterparty | Notional | Unrealized | ||||||||||
Buys |
| |||||||||||||
Adecco SA REG | 12/27/16 | Credit Suisse Securities (Europe) Limited | 7,094,005 CHF | $ | (23,477 | ) | ||||||||
Advance Auto Parts, Inc. | 05/24/17 | Morgan Stanley Capital Services LLC | 8,672,949 USD | 59,969 | ||||||||||
Airbus Group | 12/19/16 | Credit Suisse Securities (Europe) Limited | 3,612,215 EUR | (132,262 | ) | |||||||||
Allergan PLC | 05/24/17 | Morgan Stanley Capital Services LLC | 15,361,615 USD | (737,630 | ) | |||||||||
Alphabet, Inc. | 10/25/16 | Credit Suisse Securities (Europe) Limited | 4,978,797 USD | 79,230 | ||||||||||
Alphabet, Inc. | 05/24/17 | Morgan Stanley Capital Services LLC | 16,030,871 USD | 250,178 | ||||||||||
Altice NV | 11/07/16 | Credit Suisse Securities (Europe) Limited | 1,867,630 EUR | (1,427 | ) | |||||||||
Altice NV | 05/24/17 | Morgan Stanley Capital Services LLC | 781,973 EUR | (641 | ) | |||||||||
Altice NV | 11/07/16 | Credit Suisse Securities (Europe) Limited | 3,588,739 EUR | (15,092 | ) | |||||||||
Altice NV | 05/24/17 | Morgan Stanley Capital Services LLC | 80,189 EUR | (314 | ) | |||||||||
Amadeus IT Holding SA | 12/20/16 | Credit Suisse Securities (Europe) Limited | 7,946,556 EUR | 154,957 | ||||||||||
Amazon.com, Inc. | 10/25/16 | Credit Suisse Securities (Europe) Limited | 7,566,678 USD | 209,412 | ||||||||||
Amazon.com, Inc. | 05/24/17 | Morgan Stanley Capital Services LLC | 4,135,986 USD | 114,476 | ||||||||||
Atlantia SpA | 06/26/17 | Credit Suisse Securities (Europe) Limited | 9,868,736 EUR | 78,886 | ||||||||||
Atos | 12/19/16 | Credit Suisse Securities (Europe) Limited | 23,951,362 EUR | 700,421 | ||||||||||
Bayer AG | 12/19/16 | Credit Suisse Securities (Europe) Limited | 8,263,700 EUR | 310,308 | ||||||||||
See Notes to Consolidated Financial Statements.
196
Blackstone Alternative Multi-Strategy Fund and Subsidiaries
Consolidated Schedule of Investments (Continued)
March 31, 2016
Reference | Termination | Counterparty | Notional | Unrealized | ||||||||||
Beazer Homes USA, Inc. | 10/25/16 | Credit Suisse Securities (Europe) Limited | 2,033,273 USD | $ | 106,624 | |||||||||
Beazer Homes USA, Inc. | 05/24/17 | Morgan Stanley Capital Services LLC | 38,927 USD | 1,970 | ||||||||||
BNP Paribas SA | 12/19/16 | Credit Suisse Securities (Europe) Limited | 11,914,024 EUR | (803,066 | ) | |||||||||
Cadence Design Systems, Inc. | 10/25/16 | Credit Suisse Securities (Europe) Limited | 960,049 USD | 36,017 | ||||||||||
Cadence Design Systems, Inc. | 05/24/17 | Morgan Stanley Capital Services LLC | 5,802,858 USD | 218,955 | ||||||||||
Casino Guiichard Perrachon | 12/19/16 | Credit Suisse Securities (Europe) Limited | 5,119,025 EUR | 301,583 | ||||||||||
Compagnie de Saint Gobain | 12/19/16 | Credit Suisse Securities (Europe) Limited | 5,168,847 EUR | 115,356 | ||||||||||
Credit Agricole SA | 12/19/16 | Credit Suisse Securities (Europe) Limited | 7,782,725 EUR | (696,132 | ) | |||||||||
Criteo SA ADR | 08/25/16 | Credit Suisse Securities (Europe) Limited | 7,811,243 USD | 940,223 | ||||||||||
Croda International PLC | 12/19/16 | Credit Suisse Securities (Europe) Limited | 4,709,354 GBP | 398,287 | ||||||||||
Dassault Aviation SA | 12/19/16 | Credit Suisse Securities (Europe) Limited | 6,226,307 EUR | 308,116 | ||||||||||
Delhaize Group | 06/13/16 | Credit Suisse Securities (Europe) Limited | 8,955,659 EUR | (212,078 | ) | |||||||||
Dollar General Corp. | 10/25/16 | Credit Suisse Securities (Europe) Limited | 15,804,151 USD | 69,855 | ||||||||||
Dollar General Corp. | 05/24/17 | Morgan Stanley Capital Services LLC | 5,549,879 USD | 16,433 | ||||||||||
Endesa SA | 12/20/16 | Credit Suisse Securities (Europe) Limited | 7,909,967 EUR | (238,912 | ) | |||||||||
Enel SpA | 06/26/17 | Credit Suisse Securities (Europe) Limited | 3,759,557 EUR | 8,798 | ||||||||||
ENI SpA Italia | 06/26/17 | Credit Suisse Securities (Europe) Limited | 3,530,063 EUR | 30,431 | ||||||||||
Ferrovial SA | 09/25/17 | Credit Suisse Securities (Europe) Limited | 5,366,548 EUR | 2,839 | ||||||||||
Fresenius Medical Care AG & Co. KgaA | 12/19/16 | Credit Suisse Securities (Europe) Limited | 12,931,673 EUR | 158,595 | ||||||||||
GlaxoSmithKline PLC | 06/23/16 | Morgan Stanley Capital Services LLC | 2,294,864 GBP | 98,038 | ||||||||||
HCA Holdings, Inc. | 10/25/16 | Credit Suisse Securities (Europe) Limited | 3,115,346 USD | 157,759 | ||||||||||
HCA Holdings, Inc. | 05/24/17 | Morgan Stanley Capital Services LLC | 8,279,014 USD | 492,089 | ||||||||||
Home Depot, Inc. | 10/25/16 | Credit Suisse Securities (Europe) Limited | 11,599,434 USD | 323,470 | ||||||||||
Home Depot, Inc. | 05/24/17 | Morgan Stanley Capital Services LLC | 9,028,734 USD | 222,501 | ||||||||||
iBoxx Liquid High Yield Index | 06/20/16 | JPMorgan Chase Bank, N.A. | 5,548,000 USD | 18,325 | ||||||||||
Imperial Tobacco Group PLC | 12/19/16 | Credit Suisse Securities (Europe) Limited | 11,297,524 GBP | 457,802 | ||||||||||
ING Groep NV | 12/19/16 | Credit Suisse Securities (Europe) Limited | 11,601,717 EUR | (1,103,926 | ) | |||||||||
Intercontinental Hotels Group | 12/19/16 | Credit Suisse Securities (Europe) Limited | 7,529,100 GBP | 341,934 | ||||||||||
Intesa San Paolo | 06/26/17 | Credit Suisse Securities (Europe) Limited | 3,250,169 EUR | (301,452 | ) | |||||||||
Koninklijke DSM NV | 12/19/16 | Credit Suisse Securities (Europe) Limited | 8,021,636 EUR | (944 | ) | |||||||||
See Notes to Consolidated Financial Statements.
197
Blackstone Alternative Multi-Strategy Fund and Subsidiaries
Consolidated Schedule of Investments (Continued)
March 31, 2016
Reference | Termination | Counterparty | Notional | Unrealized | ||||||||||
Koninklijke Philips NV | 12/19/16 | Credit Suisse Securities (Europe) Limited | 6,129,236 EUR | $ | 196,201 | |||||||||
Linde AG | 12/19/16 | Credit Suisse Securities (Europe) Limited | 7,017,240 EUR | (71,073 | ) | |||||||||
Lloyds Banking Group PLC | 12/19/16 | Credit Suisse Securities (Europe) Limited | 5,477,281 GBP | (135,261 | ) | |||||||||
Masonite International Corp. | 10/25/16 | Credit Suisse Securities (Europe) Limited | 3,276,385 USD | 243,258 | ||||||||||
Masonite International Corp. | 05/24/17 | Morgan Stanley Capital Services LLC | 5,569,655 USD | 346,305 | ||||||||||
Mead Johnson Nutrition Co. | 08/25/16 | Credit Suisse Securities (Europe) Limited | 9,290,993 USD | 125,637 | ||||||||||
Microsoft Corp. | 05/24/17 | Morgan Stanley Capital Services LLC | 8,642,253 USD | 266,015 | ||||||||||
Nokia Oyj | 10/17/16 | Credit Suisse Securities (Europe) Limited | 14,713,080 EUR | (749,871 | ) | |||||||||
Numericable SFR | 11/07/16 | Credit Suisse Securities (Europe) Limited | 6,685,351 EUR | (190,883 | ) | |||||||||
Numericable SFR | 05/24/17 | Morgan Stanley Capital Services LLC | 4,773,519 EUR | (143,863 | ) | |||||||||
Orange | 12/19/16 | Credit Suisse Securities (Europe) Limited | 5,060,596 EUR | (319,718 | ) | |||||||||
Pilgrim’s Pride Corp. | 05/24/17 | Morgan Stanley Capital Services LLC | 137,747 USD | 5,763 | ||||||||||
Prudential PLC | 12/19/16 | Credit Suisse Securities (Europe) Limited | 6,121,816 GBP | (110,114 | ) | |||||||||
Publicis Groupe | 12/19/16 | Credit Suisse Securities (Europe) Limited | 5,180,288 EUR | 105,001 | ||||||||||
Pultegroup, Inc. | 10/25/16 | Credit Suisse Securities (Europe) Limited | 11,890,438 USD | 323,955 | ||||||||||
Pultegroup, Inc. | 05/24/17 | Morgan Stanley Capital Services LLC | 7,371,927 USD | 181,674 | ||||||||||
Puma SE | 12/19/16 | Credit Suisse Securities (Europe) Limited | 520,482 EUR | (1,370 | ) | |||||||||
Renault SA | 12/19/16 | Credit Suisse Securities (Europe) Limited | 7,408,335 EUR | 327,970 | ||||||||||
Roche Holding AG Genusschein | 12/27/16 | Credit Suisse Securities (Europe) Limited | 9,106,205 CHF | (372,818 | ) | |||||||||
Royal Dutch Shell PLC | 12/19/16 | Credit Suisse Securities (Europe) Limited | 10,236,783 GBP | 349,745 | ||||||||||
RSA Insurance Group PLC | 12/19/16 | Credit Suisse Securities (Europe) Limited | 11,429,841 GBP | 604,691 | ||||||||||
Sanofi Aventis | 07/07/16 | Morgan Stanley Capital Services LLC | 2,923,567 EUR | (141,779 | ) | |||||||||
Sanofi Aventis | 12/19/16 | Credit Suisse Securities (Europe) Limited | 10,181,613 EUR | (520,019 | ) | |||||||||
Shire PLC | 12/28/16 | Credit Suisse Securities (Europe) Limited | 5,880,260 GBP | 53,055 | ||||||||||
Six Flags Entertainment Corp. | 10/25/16 | Credit Suisse Securities (Europe) Limited | 13,204,602 USD | 636,214 | ||||||||||
Six Flags Entertainment Corp. | 05/24/17 | Morgan Stanley Capital Services LLC | 11,911,229 USD | 501,662 | ||||||||||
Skandinaviska Enskilda Banken AB | 12/19/16 | Credit Suisse Securities (Europe) Limited | 61,138,639 SEK | (935,529 | ) | |||||||||
Smith & Nephew PLC | 12/19/16 | Credit Suisse Securities (Europe) Limited | 17,851,862 GBP | 594,147 | ||||||||||
See Notes to Consolidated Financial Statements.
198
Blackstone Alternative Multi-Strategy Fund and Subsidiaries
Consolidated Schedule of Investments (Continued)
March 31, 2016
Reference | Termination | Counterparty | Notional | Unrealized | ||||||||||
Starwood Hotels & Resorts | 08/25/16 | Credit Suisse Securities (Europe) Limited | 17,760,855 USD | $ | 974,686 | |||||||||
TDC A/S | 06/06/16 | Credit Suisse Securities (Europe) Limited | 26,225,220 DKK | 579 | ||||||||||
Tim Participacoes ADR | 08/25/16 | Credit Suisse Securities (Europe) Limited | 5,987,623 USD | 661,284 | ||||||||||
TripAdvisor, Inc. | 10/25/16 | Credit Suisse Securities (Europe) Limited | 1,190,376 USD | (5,346 | ) | |||||||||
TripAdvisor, Inc. | 05/24/17 | Morgan Stanley Capital Services LLC | 21,449,932 USD | 326,025 | ||||||||||
TUI AG DI | 12/19/16 | Credit Suisse Securities (Europe) Limited | 6,049,377 EUR | 206,792 | ||||||||||
UBM PLC | 12/19/16 | Credit Suisse Securities (Europe) Limited | 8,239,490 GBP | 79,290 | ||||||||||
Union Pacific Corp. | 10/25/16 | Credit Suisse Securities (Europe) Limited | 7,954,587 USD | (10,963 | ) | |||||||||
Union Pacific Corp. | 05/24/17 | Morgan Stanley Capital Services LLC | 11,557,848 USD | (67,805 | ) | |||||||||
United Rentals, Inc. | 10/25/16 | Credit Suisse Securities (Europe) Limited | 5,585,345 USD | 238,437 | ||||||||||
United Rentals, Inc. | 05/24/17 | Morgan Stanley Capital Services LLC | 4,121,868 USD | 119,241 | ||||||||||
Visa, Inc. | 05/24/17 | Morgan Stanley Capital Services LLC | 8,275,522 USD | 499,181 | ||||||||||
Visa, Inc. | 10/25/16 | Credit Suisse Securities (Europe) Limited | 5,849,108 USD | 306,231 | ||||||||||
Vodafone Group PLC | 12/28/16 | Credit Suisse Securities (Europe) Limited | 12,502,946 GBP | 103,235 | ||||||||||
Vodafone Group PLC | 12/19/16 | Credit Suisse Securities (Europe) Limited | 9,355,751 GBP | 79,438 | ||||||||||
|
| |||||||||||||
Total Buys | $ | 7,195,784 | ||||||||||||
|
| |||||||||||||
Sells |
| |||||||||||||
ABB Ltd. REG | 12/27/16 | Credit Suisse Securities (Europe) Limited | 8,685,502 CHF | $ | (319,392 | ) | ||||||||
Air Liquide SA | 12/19/16 | Credit Suisse Securities (Europe) Limited | 3,853,637 EUR | (26,114 | ) | |||||||||
Allianz SE REG | 12/19/16 | Credit Suisse Securities (Europe) Limited | 5,460,488 EUR | 133,966 | ||||||||||
Altran Technologies SA | 12/19/16 | Credit Suisse Securities (Europe) Limited | 552,133 EUR | (16,408 | ) | |||||||||
America Movil ADR | 09/01/16 | Credit Suisse Securities (Europe) Limited | 560,592 USD | (43,152 | ) | |||||||||
Atlas Copco AB | 12/19/16 | Credit Suisse Securities (Europe) Limited | 34,710,562 SEK | (63,720 | ) | |||||||||
AXA SA | 12/19/16 | Credit Suisse Securities (Europe) Limited | 6,101,067 EUR | 332,264 | ||||||||||
Blackberry Ltd. | 10/25/16 | Credit Suisse Securities (Europe) Limited | 5,157,585 USD | (217,112 | ) | |||||||||
Blackberry Ltd. | 05/24/17 | Morgan Stanley Capital Services LLC | 6,244,502 USD | (169,088 | ) | |||||||||
Bovespa Index | 04/13/16 | Morgan Stanley Capital Services LLC | 27,205,374 BRL | (401,432 | ) | |||||||||
British American Tobacco PLC | 12/19/16 | Credit Suisse Securities (Europe) Limited | 850,863 GBP | 11,249 | ||||||||||
Bureau Veritas SA | 12/19/16 | Credit Suisse Securities (Europe) Limited | 3,625,336 EUR | (173,487 | ) | |||||||||
Cap Gemini | 12/19/16 | Credit Suisse Securities (Europe) Limited | 504,575 EUR | (29,775 | ) | |||||||||
Chesapeake Energy Corp. | 10/25/16 | Credit Suisse Securities (Europe) Limited | 1,078,829 USD | 15,276 | ||||||||||
Chesapeake Energy Corp. | 05/24/17 | Morgan Stanley Capital Services LLC | 1,973,637 USD | 23,509 | ||||||||||
CSL LTD | 03/02/17 | Morgan Stanley Capital Services LLC | 9,270,030 AUD | (199,112 | ) | |||||||||
Danone | 12/19/16 | Credit Suisse Securities (Europe) Limited | 252,786 EUR | (218 | ) | |||||||||
Deere & Co. | 10/25/16 | Credit Suisse Securities (Europe) Limited | 12,318,427 USD | 552,738 | ||||||||||
Deere & Co. | 05/24/17 | Morgan Stanley Capital Services LLC | 8,563,136 USD | 370,630 | ||||||||||
See Notes to Consolidated Financial Statements.
199
Blackstone Alternative Multi-Strategy Fund and Subsidiaries
Consolidated Schedule of Investments (Continued)
March 31, 2016
Reference | Termination | Counterparty | Notional | Unrealized | ||||||||||
Distribuidora Internacional | 12/20/16 | Credit Suisse Securities (Europe) Limited | 2,242,762 EUR | $ | 18,312 | |||||||||
Elekta AB | 12/19/16 | Credit Suisse Securities (Europe) Limited | 34,284,085 SEK | 151,064 | ||||||||||
Ericsson LM | 12/19/16 | Credit Suisse Securities (Europe) Limited | 3,728,810 SEK | (12,370 | ) | |||||||||
Fresenius Medical Care AG & Co. KgaA | 07/07/16 | Morgan Stanley Capital Services LLC | 5,209,503 EUR | (136,777 | ) | |||||||||
Groupon, Inc. | 10/25/16 | Credit Suisse Securities (Europe) Limited | 7,742,527 USD | (86,858 | ) | |||||||||
Groupon, Inc. | 05/24/17 | Morgan Stanley Capital Services LLC | 6,257,564 USD | (34,502 | ) | |||||||||
Guess?, Inc. | 10/25/16 | Credit Suisse Securities (Europe) Limited | 1,208,848 USD | 164,185 | ||||||||||
Guess?, Inc. | 05/24/17 | Morgan Stanley Capital Services LLC | 8,265,448 USD | 855,165 | ||||||||||
International Business Machines Corp. | 05/24/17 | Morgan Stanley Capital Services LLC | 8,278,076 USD | (153,449 | ) | |||||||||
iShares MSCI Brazil Capped ETF | 08/25/16 | Credit Suisse Securities (Europe) Limited | 822,863 USD | (50,718 | ) | |||||||||
Italcementi SpA | 06/26/17 | Credit Suisse Securities (Europe) Limited | 891,449 EUR | (6,922 | ) | |||||||||
J.C. Penney Co., Inc. | 10/25/16 | Credit Suisse Securities (Europe) Limited | 4,826,079 USD | 56,067 | ||||||||||
J.C. Penney Co., Inc. | 05/24/17 | Morgan Stanley Capital Services LLC | 4,455,170 USD | 54,009 | ||||||||||
K S AG REG | 11/07/16 | Credit Suisse Securities (Europe) Limited | 1,693,580 EUR | (6,189 | ) | |||||||||
K S AG REG | 05/24/17 | Morgan Stanley Capital Services LLC | 2,184,794 EUR | (11,760 | ) | |||||||||
KOSPI 200 Index | 06/13/16 | Morgan Stanley Capital Services LLC | 33,317,105,400 KRW | (599,943 | ) | |||||||||
L’Oreal | 12/19/16 | Credit Suisse Securities (Europe) Limited | 778,003 EUR | 1,123 | ||||||||||
Marriott International | 08/25/16 | Credit Suisse Securities (Europe) Limited | 6,373,270 USD | 19,744 | ||||||||||
Mattel, Inc. | 10/25/16 | Credit Suisse Securities (Europe) Limited | 3,997,888 USD | (167,597 | ) | |||||||||
Mattel, Inc. | 05/24/17 | Morgan Stanley Capital Services LLC | 2,184,391 USD | (90,776 | ) | |||||||||
Merck KgaA | 07/07/16 | Morgan Stanley Capital Services LLC | 3,358,112 EUR | 588,442 | ||||||||||
Mosaic Co. | 05/24/17 | Morgan Stanley Capital Services LLC | 14,031,110 USD | 719,651 | ||||||||||
Mosaic Co. | 10/25/16 | Credit Suisse Securities (Europe) Limited | 7,661,642 USD | 285,026 | ||||||||||
Nestle SA REG | 12/27/16 | Credit Suisse Securities (Europe) Limited | 444,465 CHF | (2,913 | ) | |||||||||
Philp Morris International | 08/25/16 | Credit Suisse Securities (Europe) Limited | 1,717,693 USD | (29,744 | ) | |||||||||
Pilgrim’s Pride Corp. | 10/25/16 | Credit Suisse Securities (Europe) Limited | 5,073,250 USD | (319,728 | ) | |||||||||
Potash Corp. of Saskatchewan | 10/25/16 | Credit Suisse Securities (Europe) Limited | 7,310,460 USD | 354,999 | ||||||||||
Potash Corp. of Saskatchewan | 05/24/17 | Morgan Stanley Capital Services LLC | 8,310,689 USD | 543,306 | ||||||||||
Procter & Gamble Co. | 10/25/16 | Credit Suisse Securities (Europe) Limited | 9,128,780 USD | (58,086 | ) | |||||||||
Procter & Gamble Co. | 05/24/17 | Morgan Stanley Capital Services LLC | 10,413,654 USD | (116,429 | ) | |||||||||
Sainsbury (J) PLC | 12/19/16 | Credit Suisse Securities (Europe) Limited | 2,077,758 GBP | 13,975 | ||||||||||
See Notes to Consolidated Financial Statements.
200
Blackstone Alternative Multi-Strategy Fund and Subsidiaries
Consolidated Schedule of Investments (Continued)
March 31, 2016
Reference | Termination | Counterparty | Notional | Unrealized | ||||||||||
Sandvik AB | 12/19/16 | Credit Suisse Securities (Europe) Limited | 36,756,950 SEK | $ | (217,487 | ) | ||||||||
SAP SE | 12/19/16 | Credit Suisse Securities (Europe) Limited | 545,151 EUR | (4,986 | ) | |||||||||
Siemens AG REG | 12/19/16 | Credit Suisse Securities (Europe) Limited | 4,038,091 EUR | (132,981 | ) | |||||||||
Sprint Corp. | 10/25/16 | Credit Suisse Securities (Europe) Limited | 2,891,023 USD | (51,853 | ) | |||||||||
Sprint Corp. | 05/24/17 | Morgan Stanley Capital Services LLC | 5,079,320 USD | 76,413 | ||||||||||
Stora Enso Oyj | 11/07/16 | Credit Suisse Securities (Europe) Limited | 4,784,365 EUR | (52,034 | ) | |||||||||
Stora Enso Oyj | 05/24/17 | Morgan Stanley Capital Services LLC | 3,363,275 EUR | (32,330 | ) | |||||||||
Telefonica Brasil | 08/25/16 | Credit Suisse Securities (Europe) Limited | 3,261,291 USD | (475,730 | ) | |||||||||
Telefonica SA | 12/20/16 | Credit Suisse Securities (Europe) Limited | 5,642,000 EUR | 94,938 | ||||||||||
Twitter, Inc. | 10/25/16 | Credit Suisse Securities (Europe) Limited | 2,497,675 USD | (89,306 | ) | |||||||||
Twitter, Inc. | 05/24/17 | Morgan Stanley Capital Services LLC | 16,105,250 USD | (427,356 | ) | |||||||||
United States Steel Corp. | 10/25/16 | Credit Suisse Securities (Europe) Limited | 2,215,977 USD | (266,878 | ) | |||||||||
United States Steel Corp. | 05/24/17 | Morgan Stanley Capital Services LLC | 1,842,001 USD | (154,539 | ) | |||||||||
UPM-Kymmene Oyj | 11/07/16 | Credit Suisse Securities (Europe) Limited | 5,815,089 EUR | (55,553 | ) | |||||||||
UPM-Kymmene Oyj | 05/24/17 | Morgan Stanley Capital Services LLC | 5,801,747 EUR | 12,107 | ||||||||||
Whole Foods Market, Inc. | 10/25/16 | Credit Suisse Securities (Europe) Limited | 187,105 USD | 12,018 | ||||||||||
Whole Foods Market, Inc. | 05/24/17 | Morgan Stanley Capital Services LLC | 8,870,524 USD | 476,548 | ||||||||||
Wynn Resorts Ltd. | 05/24/17 | Morgan Stanley Capital Services LLC | 2,563,203 USD | (242,313 | ) | |||||||||
Yelp, Inc. | 10/25/16 | Credit Suisse Securities (Europe) Limited | 3,613,129 USD | (37,415 | ) | |||||||||
Yelp, Inc. | 05/24/17 | Morgan Stanley Capital Services LLC | 6,831,053 USD | (44,604 | ) | |||||||||
|
| |||||||||||||
Total Sells | $ | 107,588 | ||||||||||||
|
| |||||||||||||
Total OTC Total Return Swaps Outstanding | $ | 7,303,372 | ||||||||||||
|
| |||||||||||||
Centrally Cleared Interest Rate Swaps Outstanding at March 31, 2016
The | Floating | Fixed | Maturity | Counterparty | Notional | Market | Upfront | Unrealized | ||||||||||||||||||
Receives | Three-Month LIBOR | 1.095% | 04/06/20 | Morgan Stanley & Co. LLC | 3,000,000 USD | $ | (2,061) | $ | — | $ | (2,061) | |||||||||||||||
Receives | Three-Month LIBOR | 1.175% | 02/24/20 | Merrill Lynch, Pierce, Fenner & Smith, Inc. | 23,000,000 USD | (11,314) | — | (11,314) | ||||||||||||||||||
Receives | Three-Month LIBOR | 1.297% | 08/13/18 | Morgan Stanley & Co. LLC | 5,500,000 USD | (52,072) | — | (52,072) | ||||||||||||||||||
See Notes to Consolidated Financial Statements.
201
Blackstone Alternative Multi-Strategy Fund and Subsidiaries
Consolidated Schedule of Investments (Continued)
March 31, 2016
The | Floating | Fixed | Maturity | Counterparty | Notional | Market | Upfront | Unrealized | ||||||||||||||||||
Receives | Three-Month LIBOR | 1.772% | 10/25/21 | Merrill Lynch, Pierce, Fenner & Smith, Inc. | 18,500,000 USD | $ | (417,453) | $ | — | $ | (417,453) | |||||||||||||||
Receives | Three-Month LIBOR | 1.861% | 12/11/20 | Merrill Lynch, Pierce, Fenner & Smith, Inc. | 15,000,000 USD | (371,908) | — | (371,908) | ||||||||||||||||||
Receives | Three-Month LIBOR | 1.919% | 09/30/19 | Morgan Stanley & Co. LLC | 2,311,250 USD | (72,004) | — | (72,004) | ||||||||||||||||||
Receives | Three-Month LIBOR | 2.043% | 10/27/25 | Morgan Stanley & Co. LLC | 3,900,000 USD | (144,595) | — | (144,595) | ||||||||||||||||||
Receives | Three-Month LIBOR | 2.268% | 01/26/26 | Morgan Stanley & Co. LLC | 2,000,000 USD | (114,454) | — | (114,454) | ||||||||||||||||||
Receives | Three-Month LIBOR | 2.304% | 01/27/25 | Morgan Stanley & Co. LLC | 2,430,000 USD | (148,735) | — | (148,735) | ||||||||||||||||||
Receives | Three-Month LIBOR | 2.331% | 08/26/25 | Morgan Stanley & Co. LLC | 38,000,000 USD | (2,408,276) | — | (2,408,276) | ||||||||||||||||||
Receives | Three-Month LIBOR | 2.534% | 09/25/24 | Morgan Stanley & Co. LLC | 2,130,000 USD | (170,234) | — | (170,234) | ||||||||||||||||||
Total Centrally Cleared Interest Rate Swaps Outstanding |
| $ | (3,913,106) | $ | — | $ | (3,913,106) | |||||||||||||||||||
| Abbreviation Legend: | ||||
| ADR | American Depository Receipt | |||
| CBOT | Chicago Board of Trade | |||
| CDE | Montreal Exchange | |||
| CFE | CBOE Futures Exchange | |||
| CME | Chicago Mercantile Exchange | |||
| COMEX | Commodities Exchange Center | |||
| Eurex | Eurex Exchange | |||
| Euronext | Euronext Paris | |||
| HKFE | Hong Kong Futures Exchange Ltd. | |||
| ICE | Ice Futures Europe | |||
| IDEM | Italian Derivatives Exchange Market | |||
| LIBOR | London Interbank Offered Rate | |||
| MEFF | MEFF Renta Variable | |||
| MTN | Medium Term Note | |||
| NYMEX | New York Mercantile Exchange | |||
| OSE | Osaka Exchange | |||
| OTC | Over the Counter | |||
See Notes to Consolidated Financial Statements.
202
Blackstone Alternative Multi-Strategy Fund and Subsidiaries
Consolidated Schedule of Investments (Continued)
March 31, 2016
| PIK | Payment in Kind | |||
| REG S | Regulation-S | |||
| REIC | Real Estate Investment Company | |||
| REIT | Real Estate Investment Trust | |||
| Safex | South African Futures Exchange | |||
| SFE | ASX Trade24 | |||
| SGX | Singapore Exchange | |||
Currency Legend: | ||||
| AUD | Australian Dollar | |||
| BRL | Brazilian Real | |||
| CAD | Canadian Dollar | |||
| CHF | Swiss Franc | |||
| CNH | Chinese Renminbi | |||
| CZK | Czech Koruna | |||
| DKK | Danish Krone | |||
| EUR | Euro | |||
| GBP | British Pound | |||
| HKD | Hong Kong Dollar | |||
| HUF | Hungarian Forint | |||
| ILS | Israeli Shekel | |||
| JPY | Japanese Yen | |||
| KRW | South Korean Won | |||
| MXN | Mexican Peso | |||
| NZD | New Zealand Dollar | |||
| RUB | Russian Ruble | |||
| SAR | Saudi Arabian Riyal | |||
| SEK | Swedish Krona | |||
| SGD | Singapore Dollar | |||
| TRY | Turkish Lira | |||
| USD | United States Dollar | |||
| ZAR | South African Rand | |||
See Notes to Consolidated Financial Statements.
203
Blackstone Alternative Investment Funds and Subsidiaries
Consolidated Statement of Assets and Liabilities
As of March 31, 2016
Multi-Manager | Multi-Strategy | |||||||
Assets: | ||||||||
Total investments in securities, at value (cost of $179,919,278 and $4,316,750,335, respectively)1 | $ | 177,311,454 | $ | 4,282,770,288 | ||||
Cash | 329,423,891 | 69,940,159 | ||||||
Cash denominated in foreign currencies (cost of $0 and $20,765,094, respectively) | — | 21,396,145 | ||||||
Segregated cash balance with broker for securities sold short | 163,691,483 | 1,119,271,433 | ||||||
Segregated cash balance with custodian for derivative financial instruments | 9,064,214 | 125,609,593 | ||||||
Segregated cash balance with broker for futures contracts | 9,592,289 | 116,162,131 | ||||||
Segregated cash balance with counterparties for swaps, other derivative financial instruments and reverse repurchase agreements | 1,927,053 | 53,909,865 | ||||||
Unrealized appreciation on forward foreign currency exchange contracts | 1,673,134 | 9,880,994 | ||||||
Income receivable | 1,148,077 | 16,505,761 | ||||||
Receivable for investments sold2 | 147,837,992 | 91,072,601 | ||||||
Receivable for Fund shares sold | 2,663 | 8,858,019 | ||||||
Receivable for periodic payments from swap contracts | 2,172,677 | 1,890,508 | ||||||
Variation margin receivable | 2,295,503 | 9,015,210 | ||||||
Swap contracts, premium paid | — | 10,169,655 | ||||||
Unrealized appreciation on swap contracts | 521,341 | 22,344,292 | ||||||
Receivable from Investment Adviser | 156,932 | — | ||||||
Prepaid expenses and other assets | 47,964 | 84,245 | ||||||
|
|
|
| |||||
Total Assets | 846,866,667 | 5,958,880,899 | ||||||
|
|
|
| |||||
Liabilities: | ||||||||
Securities sold short, at value (proceeds of $90,451,992 and $1,121,390,883, respectively) | 75,772,554 | 1,104,445,099 | ||||||
Securities lending collateral payable | 23,898,259 | 120,918,878 | ||||||
Cash received as collateral with broker for swaps and reverse repurchase agreements | 1,250,659 | 3,542,433 | ||||||
Cash received as collateral with custodian for derivative financial instruments | — | 1,162,865 | ||||||
Options written, at value (premiums received $128,954 and $2,345,280, respectively) | 102,590 | 1,635,953 | ||||||
Unrealized depreciation on forward foreign currency exchange contracts | 2,120,731 | 17,863,197 | ||||||
Payable for reverse repurchase agreements | 4,652,534 | 207,381,307 | ||||||
Payable for investments purchased | 99,459,772 | 151,693,314 | ||||||
Payable for Fund shares redeemed | 415,078 | 11,789,432 | ||||||
Swap contracts, premium received | — | 6,037,320 | ||||||
Unrealized depreciation on swap contracts | 572,989 | 14,924,258 | ||||||
Variation margin payable | 188,270 | 3,123,518 | ||||||
Payable for periodic payments from swap contracts | 656,198 | 5,548,251 | ||||||
Dividend and interest income payable on securities sold short | 862,566 | 3,163,466 | ||||||
Management fee payable | 5,277,039 | 19,272,351 | ||||||
Accrued expenses and other liabilities | 1,006,564 | 2,929,098 | ||||||
|
|
|
| |||||
Total Liabilities | 216,235,803 | 1,675,430,740 | ||||||
|
|
|
| |||||
Net Assets | $ | 630,630,864 | $ | 4,283,450,159 | ||||
|
|
|
| |||||
See Notes to Consolidated Financial Statements.
204
Blackstone Alternative Investment Funds and Subsidiaries
Consolidated Statement of Assets and Liabilities (Continued)
As of March 31, 2016
Multi-Manager | Multi-Strategy | |||||||
Net Assets Consist of: | ||||||||
Paid-in capital | $ | 748,605,375 | $ | 4,477,582,233 | ||||
Accumulated undistributed net investment loss | (14,546,062 | ) | (19,592,526 | ) | ||||
Accumulated undistributed net realized loss | (113,923,655 | ) | (146,143,542 | ) | ||||
Net unrealized appreciation (depreciation) | 10,495,206 | (28,396,006 | ) | |||||
|
|
|
| |||||
Net Assets | $ | 630,630,864 | $ | 4,283,450,159 | ||||
|
|
|
| |||||
Net Asset Value: | ||||||||
Class I Shares | ||||||||
Net Assets | $ | 630,630,864 | $ | 3,921,026,505 | ||||
Class I Shares outstanding, no par value, unlimited shares authorized | 66,129,773 | 399,185,175 | ||||||
|
|
|
| |||||
Net asset value per share | $ | 9.54 | $ | 9.82 | ||||
|
|
|
| |||||
Class D Shares3 | ||||||||
Net Assets | $ | 22,810,934 | ||||||
Class D Shares outstanding, no par value, unlimited shares authorized | 2,325,127 | |||||||
|
| |||||||
Net asset value per share | $ | 9.81 | ||||||
|
| |||||||
Class Y Shares3 | ||||||||
Net Assets | $ | 339,612,720 | ||||||
Class Y Shares outstanding, no par value, unlimited shares authorized | 34,829,511 | |||||||
|
| |||||||
Net asset value per share | $ | 9.75 | ||||||
|
| |||||||
| 1 | Includes $5,816,914 and $116,876,693, respectively, of investments in securities on loan. |
| 2 | Includes $17,479,265 of securities on loan pending sale for Multi-Manager Fund. These securities will be released from loan prior to the contractual settlement date. |
| 3 | Class D Shares and Class Y Shares are offered only by the Multi-Strategy Fund. See Note 6. |
See Notes to Consolidated Financial Statements.
205
Blackstone Alternative Investment Funds and Subsidiaries
Consolidated Statement of Operations
For the Year Ended March 31, 2016
Multi-Manager | Multi-Strategy | |||||||
Investment Income: | ||||||||
Interest | $ | 30,262,746 | $ | 60,831,747 | ||||
Dividends (including net foreign taxes withheld of $135,780 and $247,774, respectively) | 8,585,295 | 19,852,739 | ||||||
|
|
|
| |||||
Total income | 38,848,041 | 80,684,486 | ||||||
|
|
|
| |||||
Expenses: | ||||||||
Management fees | $ | 24,775,275 | $ | 54,840,602 | ||||
Administration fees | 2,445,785 | 3,713,160 | ||||||
Custodian fees | 1,520,545 | 2,186,452 | ||||||
Trustees’ fees | 101,733 | 97,439 | ||||||
Distribution fees – Class D | — | 34,559 | ||||||
Shareholder service fees | 103,889 | 3,129,134 | ||||||
Registration fees | 32,114 | 368,093 | ||||||
Printing and postage fees | 493,770 | 320,212 | ||||||
Professional fees | 932,316 | 1,199,341 | ||||||
Dividends and interest on securities sold short | 7,134,438 | 15,729,940 | ||||||
Financing fees on securities sold short | 4,694,510 | 7,405,586 | ||||||
Line of credit fee | 111,569 | 73,674 | ||||||
Interest fees | 2,699,729 | 2,555,568 | ||||||
Offering costs | — | 52,107 | ||||||
Other | 163,684 | 217,426 | ||||||
|
|
|
| |||||
Total expenses | 45,209,357 | 91,923,293 | ||||||
|
|
|
| |||||
Expenses recouped (reimbursed) by Investment Adviser | 548,252 | 1,245,166 | ||||||
|
|
|
| |||||
Net expenses | 45,757,609 | 93,168,459 | ||||||
|
|
|
| |||||
Net investment income (loss) | (6,909,568 | ) | (12,483,973 | ) | ||||
|
|
|
| |||||
Net Realized and Unrealized Gain (Loss): | ||||||||
Net realized gain (loss) on investments in securities | (108,639,391 | ) | (155,889,892 | ) | ||||
Net realized gain (loss) on securities sold short | 59,685,577 | 76,332,087 | ||||||
Net realized gain (loss) on forward foreign currency exchange contracts | (405,288 | ) | (10,880,138 | ) | ||||
Net realized gain (loss) on foreign currency transactions | (1,083,308 | ) | (2,200,019 | ) | ||||
Net realized gain (loss) on futures contracts | 21,180,192 | 38,038,271 | ||||||
Net realized gain (loss) on options written | 6,711,186 | 10,787,442 | ||||||
Net realized gain (loss) on swap contracts | 590,585 | (22,671,202 | ) | |||||
Net change in unrealized appreciation (depreciation) on investments in securities | (25,421,276 | ) | (51,253,700 | ) | ||||
Net change in unrealized appreciation (depreciation) on securities sold short | 2,773,380 | 13,102,770 | ||||||
Net change in unrealized appreciation (depreciation) on forward foreign currency exchange contracts | (1,508,659 | ) | (8,699,686 | ) | ||||
Net change in unrealized appreciation (depreciation) on foreign currency translations | 118,804 | 1,408,668 | ||||||
Net change in unrealized appreciation (depreciation) on futures contracts | (1,733,665 | ) | (9,970,671 | ) | ||||
Net change in unrealized appreciation (depreciation) on options written | 19,197 | 518,736 | ||||||
Net change in unrealized appreciation (depreciation) on swap contracts | (645,330 | ) | 3,909,519 | |||||
|
|
|
| |||||
Net realized and unrealized gain (loss) | (48,357,996 | ) | (117,467,815 | ) | ||||
|
|
|
| |||||
Net decrease in net assets resulting from operations | $ | (55,267,564 | ) | $ | (129,951,788 | ) | ||
|
|
|
| |||||
See Notes to Consolidated Financial Statements.
206
Blackstone Alternative Investment Funds and Subsidiaries
Consolidated Statement of Changes in Net Assets
| Multi-Manager Fund | ||||||||
| Year Ended 3/31/2016 | Year Ended 3/31/2015 | |||||||
Increase (Decrease) in Net Assets | ||||||||
Operations: | ||||||||
Net investment loss | $ | (6,909,568 | ) | $ | (6,748,871 | ) | ||
Net realized gain (loss) | (21,960,447 | ) | 71,174,284 | |||||
Net unrealized appreciation (depreciation) | (26,397,549 | ) | 1,137,196 | |||||
|
|
|
| |||||
Net increase (decrease) in net assets resulting from operations | (55,267,564 | ) | 65,562,609 | |||||
|
|
|
| |||||
Distributions: | ||||||||
Distributions from net investment income | (3,476,913 | ) | (9,088,938 | ) | ||||
Distributions from net realized capital gains | (49,254,177 | ) | (93,347,991 | ) | ||||
|
|
|
| |||||
Total distributions to shareholders | (52,731,090 | ) | (102,436,929 | ) | ||||
|
|
|
| |||||
Capital Transactions: | ||||||||
Proceeds from sale of Class I Shares | 177,595,213 | 253,883,210 | ||||||
Net asset value of Class I Shares issued to shareholders in payment of distributions declared | 52,731,090 | 102,434,576 | ||||||
Cost of Class I Shares redeemed | (821,055,681 | ) | (172,989,869 | ) | ||||
|
|
|
| |||||
Net increase (decrease) in net assets resulting from capital transactions | (590,729,378 | ) | 183,327,917 | |||||
|
|
|
| |||||
Net increase (decrease) in net assets | (698,728,032 | ) | 146,453,597 | |||||
|
|
|
| |||||
Net Assets: | ||||||||
Beginning of period | 1,329,358,896 | 1,182,905,299 | ||||||
|
|
|
| |||||
End of period | $ | 630,630,864 | $ | 1,329,358,896 | ||||
|
|
|
| |||||
| Accumulated undistributed net investment loss | $ | (14,546,062 | ) | $ | (14,761,581 | ) | ||
|
|
|
| |||||
Share Transactions: | ||||||||
Beginning of period | 128,717,599 | 110,951,809 | ||||||
Class I Shares sold | 17,293,030 | 23,965,692 | ||||||
Class I Shares reinvested | 5,353,410 | 10,301,507 | ||||||
Class I Shares redeemed | (85,234,266 | ) | (16,501,409 | ) | ||||
|
|
|
| |||||
Net change in shares resulting from share transactions | (62,587,826 | ) | 17,765,790 | |||||
|
|
|
| |||||
End of period | 66,129,773 | 128,717,599 | ||||||
|
|
|
| |||||
See Notes to Consolidated Financial Statements.
207
Blackstone Alternative Investment Funds and Subsidiaries
Consolidated Statement of Changes in Net Assets (Continued)
| Multi-Strategy Fund | ||||||||
| Year Ended 3/31/2016 | Period Ended 3/31/20151 | |||||||
Increase (Decrease) in Net Assets | ||||||||
Operations: | ||||||||
Net investment loss | $ | (12,483,973 | ) | $ | (5,395,359 | ) | ||
Net realized gain (loss) | (66,483,451 | ) | 20,941,539 | |||||
Net unrealized appreciation (depreciation) | (50,984,364 | ) | 22,588,358 | |||||
|
|
|
| |||||
Net increase (decrease) in net assets resulting from operations | (129,951,788 | ) | 38,134,538 | |||||
|
|
|
| |||||
Distributions: | ||||||||
Distributions from net investment income: | ||||||||
Class I Shares | (3,702,838 | ) | (1,545,443 | ) | ||||
Class D Shares | — | (2,255 | ) | |||||
Class Y Shares | (488,507 | ) | — | |||||
Distributions from net realized capital gains: | ||||||||
Class I Shares | (73,631,835 | ) | (2,768,920 | ) | ||||
Class D Shares | (441,956 | ) | (7,654 | ) | ||||
Class Y Shares | (7,796,834 | ) | — | |||||
|
|
|
| |||||
Total distributions to shareholders | (86,061,970 | ) | (4,324,272 | ) | ||||
|
|
|
| |||||
Capital Transactions: | ||||||||
Shareholder subscriptions: | ||||||||
Proceeds from sale of Class I Shares | 3,910,819,502 | 1,227,560,311 | ||||||
Proceeds from sale of Class D Shares | 22,137,119 | 5,979,685 | ||||||
Proceeds from sale of Class Y Shares | 526,320,778 | 103,401,481 | ||||||
Shareholder reinvestments: | ||||||||
Net asset value of Class I Shares issued to shareholders in payment of distributions declared | 51,201,807 | 3,060,022 | ||||||
Net asset value of Class D Shares issued to shareholders in payment of distributions declared | 433,787 | 9,908 | ||||||
Net asset value of Class Y Shares issued to shareholders in payment of distributions declared | 8,117,600 | — | ||||||
Shareholder redemptions: | ||||||||
Cost of Class I Shares redeemed | (947,827,550 | ) | (164,142,829 | ) | ||||
Cost of Class D Shares redeemed | (4,664,169 | ) | (126,526 | ) | ||||
Cost of Class Y Shares redeemed | (276,627,275 | ) | — | |||||
|
|
|
| |||||
Net increase in net assets resulting from capital transactions | 3,289,911,599 | 1,175,742,052 | ||||||
|
|
|
| |||||
Net increase in net assets | 3,073,897,841 | 1,209,552,318 | ||||||
|
|
|
| |||||
Net Assets: | ||||||||
Beginning of period | 1,209,552,318 | — | ||||||
|
|
|
| |||||
End of period | $ | 4,283,450,159 | $ | 1,209,552,318 | ||||
|
|
|
| |||||
| Accumulated undistributed net investment loss | $ | (19,592,526 | ) | $ | (4,814,384 | ) | ||
|
|
|
| |||||
See Notes to Consolidated Financial Statements.
208
Blackstone Alternative Investment Funds and Subsidiaries
Consolidated Statement of Changes in Net Assets (Continued)
| Multi-Strategy Fund | ||||||||
| Year Ended 3/31/2016 | Period Ended 3/31/20151 | |||||||
Share Transactions: | ||||||||
Class I Shares | ||||||||
Beginning of period | 105,770,058 | — | ||||||
Shares issued | 382,065,472 | 121,648,983 | ||||||
Reinvestment in Shares | 5,074,510 | 306,002 | ||||||
Shares redeemed | (93,724,865 | ) | (16,184,927 | ) | ||||
|
|
|
| |||||
Net change in shares resulting from share transactions | 293,415,117 | 105,770,058 | ||||||
|
|
|
| |||||
End of period | 399,185,175 | 105,770,058 | ||||||
|
|
|
| |||||
Class D Shares | ||||||||
Beginning of period | 579,311 | — | ||||||
Shares issued | 2,170,565 | 590,597 | ||||||
Reinvestment in Shares | 43,034 | 990 | ||||||
Shares redeemed | (467,783 | ) | (12,276 | ) | ||||
|
|
|
| |||||
Net change in shares resulting from share transactions | 1,745,816 | 579,311 | ||||||
|
|
|
| |||||
End of period | 2,325,127 | 579,311 | ||||||
|
|
|
| |||||
Class Y Shares | ||||||||
Beginning of period | 10,263,435 | — | ||||||
Shares issued | 50,691,043 | 10,263,435 | ||||||
Reinvestment in Shares | 810,949 | — | ||||||
Shares redeemed | (26,935,916 | ) | — | |||||
|
|
|
| |||||
Net change in shares resulting from share transactions | 24,566,076 | 10,263,435 | ||||||
|
|
|
| |||||
End of period | 34,829,511 | 10,263,435 | ||||||
|
|
|
| |||||
| 1 | For the period June 16, 2014 (commencement of operations) to March 31, 2015. |
See Notes to Consolidated Financial Statements.
209
Blackstone Alternative Investment Funds and Subsidiaries
Consolidated Statement of Cash Flows
| Multi-Manager Fund | ||||
Year | ||||
Cash Flows from Operating Activities: | ||||
Net decrease in net assets resulting from operations | $ | (55,267,564 | ) | |
Adjustments to reconcile net increase (decrease) in net assets resulting from operations to net cash used for operating activities: | ||||
Purchases of investments in securities | (3,456,050,347 | ) | ||
Proceeds from disposition of investments in securities | 4,217,186,196 | |||
Proceeds from securities sold short | 1,311,559,427 | |||
Payments to cover securities sold short | (1,390,010,140 | ) | ||
Premiums paid on closing options written | (5,816,759 | ) | ||
Proceeds from premiums received from options written | 10,592,436 | |||
Net realized loss on investments in securities | 108,639,391 | |||
Net realized gain on securities sold short | (59,685,577 | ) | ||
Net realized gain on options written | (6,711,186 | ) | ||
Net change in accretion of bond discount and amortization of bond and swap premium | (2,562,558 | ) | ||
Net change in unrealized depreciation on investments in securities | 25,421,276 | |||
Net change in unrealized appreciation on securities sold short | (2,773,380 | ) | ||
Net change in unrealized appreciation on options written | (19,197 | ) | ||
Changes in assets and liabilities: | ||||
(Increase) decrease in assets: | ||||
Segregated cash balance with broker for securities sold short | 126,144,386 | |||
Segregated cash balance with custodian for derivative financial instruments | 7,150,013 | |||
Segregated cash balance with broker for futures contracts | 17,544,877 | |||
Segregated cash balance with counterparties for swaps, other derivative financial instruments and reverse repurchase agreements | 2,935,653 | |||
Unrealized appreciation on forward foreign currency exchange contracts | 1,311,262 | |||
Income receivable | 4,035,941 | |||
Receivable for periodic payments from swap contracts | (1,689,531 | ) | ||
Variation margin receivable | 304,294 | |||
Swap contracts, premium paid | 160,433 | |||
Unrealized appreciation on swap contracts | 3,583,363 | |||
Receivable from Investment Adviser | 382,046 | |||
Prepaid expenses and other assets | (28,300 | ) | ||
Increase (decrease) in liabilities: | ||||
Securities lending collateral payable | (51,051,136 | ) | ||
Cash received as collateral with broker for swaps and reverse repurchase agreements | (455,149 | ) | ||
Unrealized depreciation on forward foreign currency exchange contracts | 197,397 | |||
Swap contracts, premium received | (103,385 | ) | ||
Unrealized depreciation on swap contracts | (2,726,214 | ) | ||
Variation margin payable | 167,427 | |||
Payable for periodic payments from swap contracts | 482,328 | |||
Dividend and interest income payable on securities sold short | 460,893 | |||
Interest payable on reverse repurchase agreements | (123,053 | ) | ||
Management fee payable | (1,050,301 | ) | ||
Accrued expenses and other liabilities | (516,873 | ) | ||
|
| |||
Net cash from in operating activities | 801,618,389 | |||
|
| |||
Cash Flows from Financing Activities: | ||||
Proceeds from shares sold | 178,519,671 | |||
Cost of shares repurchased | (821,337,179 | ) | ||
Proceeds from reverse repurchase agreements | 842,254,089 | |||
Repayment of reverse repurchase agreements | (957,224,195 | ) | ||
|
| |||
Net cash provided by financing activities | (757,787,614 | ) | ||
|
| |||
Net increase (decrease) in cash and foreign currency | 43,830,775 | |||
Cash and foreign currency, beginning of period | 285,593,116 | |||
|
| |||
Cash and foreign currency, end of period | $ | 329,423,891 | ||
|
| |||
Supplemental disclosure of cash flow information: | ||||
Cash paid during the period for interest | $ | 2,238,836 | ||
|
| |||
Non-Cash Financing Activities: | ||||
Capital shares issued in reinvestment of distribution | $ | 52,731,090 | ||
|
| |||
See Notes to Consolidated Financial Statements.
210
Blackstone Alternative Investment Funds and Subsidiaries
Consolidated Statement of Cash Flows (Continued)
| Multi-Strategy Fund | ||||
Year | ||||
Cash Flows from Operating Activities: | ||||
Net decrease in net assets resulting from operations | $ | (129,951,788 | ) | |
Adjustments to reconcile net increase (decrease) in net assets resulting from operations to net cash used for operating activities: | ||||
Purchases of investments in securities | (10,221,295,722 | ) | ||
Proceeds from disposition of investments in securities | 6,657,824,139 | |||
Proceeds from securities sold short | 3,281,611,220 | |||
Payments to cover securities sold short | (2,318,187,810 | ) | ||
Premiums paid on closing options written | (12,063,631 | ) | ||
Proceeds from premiums received from options written | 24,100,864 | |||
Net realized loss on investments in securities | 155,889,892 | |||
Net realized gain on securities sold short | (76,332,087 | ) | ||
Net realized gain on options written | (10,787,442 | ) | ||
Net change in accretion of bond discount and amortization of bond and swap premium | (6,526,059 | ) | ||
Net change in unrealized depreciation on investments in securities | 51,253,700 | |||
Net change in unrealized appreciation on securities sold short | (13,102,770 | ) | ||
Net change in unrealized appreciation on options written | (518,736 | ) | ||
Changes in assets and liabilities: | ||||
(Increase) decrease in assets: | ||||
Segregated cash balance with broker for securities sold short | (863,796,985 | ) | ||
Segregated cash balance with custodian for derivative financial instruments | (111,442,999 | ) | ||
Segregated cash balance with broker for futures contracts | (92,364,843 | ) | ||
Segregated cash balance with counterparties for swaps, other derivative financial instruments and reverse repurchase agreements | (52,610,968 | ) | ||
Unrealized appreciation on forward foreign currency exchange contracts | (7,546,059 | ) | ||
Income receivable | (12,976,766 | ) | ||
Receivable for periodic payments from swap contracts | (1,483,504 | ) | ||
Variation margin receivable | (7,124,779 | ) | ||
Swap contracts, premium paid | (10,071,440 | ) | ||
Unrealized appreciation on swap contracts | (19,417,124 | ) | ||
Receivable from Investment Adviser | 356,446 | |||
Prepaid expenses and other assets | (9,495 | ) | ||
Increase (decrease) in liabilities: | ||||
Securities lending collateral payable | 49,559,504 | |||
Cash received as collateral with broker for swaps and reverse repurchase agreements | 2,290,555 | |||
Cash received as collateral with custodian for derivative financial instruments | 1,162,865 | |||
Unrealized depreciation on forward foreign currency exchange contracts | 16,245,745 | |||
Swap contracts, premium received | 5,975,305 | |||
Unrealized depreciation on swap contracts | 11,993,419 | |||
Variation margin payable | 3,083,819 | |||
Payable for periodic payments from swap contracts | 5,408,793 | |||
Dividend and interest income payable on securities sold short | 2,865,802 | |||
Interest payable on reverse repurchase agreements | 545,539 | |||
Management fee payable | 14,628,871 | |||
Accrued expenses and other liabilities | 970,777 | |||
|
| |||
Net cash used in operating activities | (3,681,843,752 | ) | ||
|
| |||
Cash Flows from Financing Activities: | ||||
Proceeds from shares sold | 4,484,304,921 | |||
Cost of shares repurchased | (1,235,654,103 | ) | ||
Proceeds from reverse repurchase agreements | 987,321,866 | |||
Repayment of reverse repurchase agreements | (815,817,576 | ) | ||
Distributions paid (net of reinvestment) | (26,308,776 | ) | ||
|
| |||
Net cash provided by financing activities | 3,393,846,332 | |||
|
| |||
Net increase (decrease) in cash and foreign currency | (287,997,420 | ) | ||
Cash and foreign currency, beginning of period | 379,333,724 | |||
|
| |||
Cash and foreign currency, end of period | $ | 91,336,304 | ||
|
| |||
Supplemental disclosure of cash flow information: | ||||
Cash received during the period for interest | $ | (310,234 | ) | |
|
| |||
Non-Cash Financing Activities: | ||||
Capital shares issued in reinvestment of distribution | $ | 59,753,194 | ||
|
| |||
See Notes to Consolidated Financial Statements.
211
Blackstone Alternative Investment Funds and Subsidiaries
Consolidated Financial Highlights
(For a Share Outstanding Throughout the Period)
| Multi-Manager Fund—Class I | ||||||||||||
Year | Year | Period | ||||||||||
Net Asset Value, Beginning of Period | $ | 10.33 | $ | 10.66 | $ | 10.00 | ||||||
Income From Investment Operations: | ||||||||||||
Net investment loss2 | (0.06 | ) | (0.06 | ) | (0.05 | ) | ||||||
Net realized and unrealized gain (loss) | (0.31 | ) | 0.59 | 0.75 | ||||||||
|
|
|
|
|
| |||||||
Total From Investment Operations | (0.37 | ) | 0.53 | 0.70 | ||||||||
|
|
|
|
|
| |||||||
Less Distributions to Shareholders: | ||||||||||||
From net investment income | (0.03 | ) | (0.08 | ) | (0.04 | ) | ||||||
From net realized capital gains | (0.39 | ) | (0.78 | ) | — | |||||||
|
|
|
|
|
| |||||||
Total Distributions | (0.42 | ) | (0.86 | ) | (0.04 | ) | ||||||
|
|
|
|
|
| |||||||
Net Asset Value, End of Period | $ | 9.54 | $ | 10.33 | $ | 10.66 | ||||||
|
|
|
|
|
| |||||||
Total Return | (3.71 | )% | 5.24 | % | 7.04 | %3 | ||||||
|
|
|
|
|
| |||||||
Ratios to Average Net Assets:4 | ||||||||||||
Total expenses before recoupment (reimbursement) from Investment Adviser | 3.56 | % | 3.08 | % | 3.33 | %5 | ||||||
Recoupment (reimbursement) from Investment Adviser | 0.04 | % | 0.04 | % | (0.27 | )%5 | ||||||
|
|
|
|
|
| |||||||
Net expenses after recoupment (reimbursement) from Investment Adviser | 3.60 | % | 3.12 | % | 3.06 | %5 | ||||||
Excluded Expenses6 | (1.20 | )% | (0.72 | )% | (0.66 | )%5 | ||||||
|
|
|
|
|
| |||||||
Expenses, net of impact of excluded expenses | 2.40 | % | 2.40 | % | 2.40 | %5 | ||||||
|
|
|
|
|
| |||||||
Net investment loss | (0.54 | )% | (0.54 | )% | (0.69 | )%5 | ||||||
|
|
|
|
|
| |||||||
Supplemental Data: | ||||||||||||
Net assets, end of period (in thousands) | $ | 630,631 | $ | 1,329,359 | $ | 1,182,905 | ||||||
Portfolio turnover | 200 | % | 265 | % | 135 | %3 | ||||||
| 1 | For the period August 6, 2013 (commencement of operations) to March 31, 2014. |
| 2 | Calculated using average shares outstanding during the period. |
| 3 | Percentage represents the results for the period and is not annualized. |
| 4 | The ratios do not reflect the Fund’s share of the income and expenses of the underlying Investee Fund. |
| 5 | Financial ratios have been annualized except for non-recurring costs. |
| 6 | Represents expenses excluded from reimbursement by the Investment Adviser, as defined in the Expense Limitation and Reimbursement Agreement, except for Management Fees. See Note 7. |
See Notes to Consolidated Financial Statements.
212
Blackstone Alternative Investment Funds and Subsidiaries
Consolidated Financial Highlights (Continued)
(For a Share Outstanding Throughout the Period)
| Multi-Strategy Fund—Class I | ||||||||
Year Ended 3/31/2016 | Period Ended 3/31/20151 | |||||||
Net Asset Value, Beginning of Period | $ | 10.38 | $ | 10.00 | ||||
Income From Investment Operations: | ||||||||
Net investment loss2 | (0.05 | ) | (0.09 | ) | ||||
Net realized and unrealized gain (loss) | (0.26 | ) | 0.53 | |||||
|
|
|
| |||||
Total From Investment Operations | (0.31 | ) | 0.44 | |||||
|
|
|
| |||||
Less Distributions to Shareholders: | ||||||||
From net investment income | (0.01 | ) | (0.02 | ) | ||||
From net realized capital gains | (0.24 | ) | (0.04 | ) | ||||
|
|
|
| |||||
Total Distributions | (0.25 | ) | (0.06 | ) | ||||
|
|
|
| |||||
Net Asset Value, End of Period | $ | 9.82 | $ | 10.38 | ||||
|
|
|
| |||||
Total Return | (3.01 | )% | 4.43 | %3 | ||||
|
|
|
| |||||
Ratios to Average Net Assets:4 | ||||||||
Total expenses before recoupment (reimbursement) from Investment Adviser | 3.22 | % | 3.41 | %5 | ||||
Recoupment (reimbursement) from Investment Adviser | 0.05 | % | (0.24 | )%5 | ||||
|
|
|
| |||||
Net expenses after recoupment (reimbursement) from Investment Adviser | 3.27 | % | 3.17 | %5 | ||||
Excluded expenses6 | (0.93 | )% | (0.77 | )%5 | ||||
|
|
|
| |||||
Expenses, net of impact of excluded expenses | 2.34 | % | 2.40 | %5 | ||||
|
|
|
| |||||
Net investment loss | (0.45 | )% | (1.11 | )%5 | ||||
|
|
|
| |||||
Supplemental Data: | ||||||||
Net assets, end of period (in thousands) | $ | 3,921,027 | $ | 1,097,917 | ||||
Portfolio turnover | 172 | % | 194 | %3 | ||||
| 1 | For the period June 16, 2014 (commencement of operations) to March 31, 2015. |
| 2 | Calculated using average shares outstanding during the period. |
| 3 | Percentage represents the results for the period and is not annualized. |
| 4 | The ratios do not reflect the Fund’s share of the income and expenses of the underlying Investee Funds. |
| 5 | Financial ratios have been annualized except for non-recurring costs. |
| 6 | Represents expenses excluded from reimbursement by the Investment Adviser, as defined in the Expense Limitation and Reimbursement Agreement, except for Management Fees. See Note 7. |
See Notes to Consolidated Financial Statements.
213
Blackstone Alternative Investment Funds and Subsidiaries
Consolidated Financial Highlights (Continued)
(For a Share Outstanding Throughout the Period)
| Multi-Strategy Fund—Class D | ||||||||
Year | Period Ended 3/31/20151 | |||||||
Net Asset Value, Beginning of Period | $ | 10.38 | $ | 10.00 | ||||
Income From Investment Operations: | ||||||||
Net investment loss2 | (0.07 | ) | (0.05 | ) | ||||
Net realized and unrealized gain (loss) | (0.26 | ) | 0.48 | |||||
|
|
|
| |||||
Total From Investment Operations | (0.33 | ) | 0.43 | |||||
|
|
|
| |||||
Less Distributions to Shareholders: | ||||||||
From net investment income | — | (0.01 | ) | |||||
From net realized capital gains | (0.24 | ) | (0.04 | ) | ||||
|
|
|
| |||||
Total Distributions | (0.24 | ) | (0.05 | ) | ||||
|
|
|
| |||||
Net Asset Value, End of Period | $ | 9.81 | $ | 10.38 | ||||
|
|
|
| |||||
Total Return | (3.22 | )% | 4.32 | %3 | ||||
|
|
|
| |||||
Ratios to Average Net Assets:4 | ||||||||
Total expenses before recoupment (reimbursement) from Investment Adviser | 3.47 | % | 3.54 | %5 | ||||
Recoupment (reimbursement) from Investment Adviser | 0.02 | % | (0.14 | )%5 | ||||
|
|
|
| |||||
Net expenses after recoupment (reimbursement) from Investment Adviser | 3.49 | % | 3.40 | %5 | ||||
Excluded expenses6 | (1.18 | )% | (1.00 | )%5 | ||||
|
|
|
| |||||
Expenses, net of impact of excluded expenses | 2.31 | % | 2.40 | %5 | ||||
|
|
|
| |||||
Net investment loss | (0.66 | )% | (1.29 | )%5 | ||||
|
|
|
| |||||
Supplemental Data: | ||||||||
Net assets, end of period (in thousands) | $ | 22,811 | $ | 6,012 | ||||
Portfolio turnover | 172 | % | 194 | %3 | ||||
| 1 | For the period November 17, 2014 (commencement of operations) to March 31, 2015. |
| 2 | Calculated using average shares outstanding during the period. |
| 3 | Percentage represents the results for the period and is not annualized. |
| 4 | The ratios do not reflect the Fund’s share of the income and expenses of the underlying Investee Funds. |
| 5 | Financial ratios have been annualized except for non-recurring costs. |
| 6 | Represents expenses excluded from reimbursement by the Investment Adviser, as defined in the Expense Limitation and Reimbursement Agreement, except for Management Fees. See Note 7. |
See Notes to Consolidated Financial Statements.
214
Blackstone Alternative Investment Funds and Subsidiaries
Consolidated Financial Highlights (Continued)
(For a Share Outstanding Throughout the Period)
| Multi-Strategy Fund—Class Y | ||||||||
Year | Period Ended 3/31/20151 | |||||||
Net Asset Value, Beginning of Period | $ | 10.29 | $ | 10.00 | ||||
Income From Investment Operations: | ||||||||
Net investment loss2 | (0.03 | ) | (0.02 | ) | ||||
Net realized and unrealized gain (loss) | (0.25 | ) | 0.31 | |||||
|
|
|
| |||||
Total From Investment Operations | (0.28 | ) | 0.29 | |||||
|
|
|
| |||||
Less Distributions to Shareholders: | ||||||||
From net investment income | (0.02 | ) | — | |||||
From net realized capital gains | (0.24 | ) | — | |||||
|
|
|
| |||||
Total Distributions | (0.26 | ) | — | |||||
|
|
|
| |||||
Net Asset Value, End of Period | $ | 9.75 | $ | 10.29 | ||||
|
|
|
| |||||
Total Return | (2.90 | )% | 2.90 | %3 | ||||
|
|
|
| |||||
Ratios to Average Net Assets:4 | ||||||||
Total expenses before recoupment (reimbursement) from Investment Adviser | 3.12 | % | 3.26 | %5 | ||||
Recoupment (reimbursement) from Investment Adviser | 0.00 | %6 | (0.07 | )%5 | ||||
|
|
|
| |||||
Net expenses after recoupment (reimbursement) from Investment Adviser | 3.12 | % | 3.19 | %5 | ||||
Excluded expenses7 | (0.92 | )% | (0.79 | )%5 | ||||
|
|
|
| |||||
Expenses, net of impact of excluded expenses | 2.20 | % | 2.40 | %5 | ||||
|
|
|
| |||||
Net investment loss | (0.34 | )% | (1.03 | )%5 | ||||
|
|
|
| |||||
Supplemental Data: | ||||||||
Net assets, end of period (in thousands) | $ | 339,613 | $ | 105,624 | ||||
Portfolio turnover | 172 | % | 194 | %3 | ||||
| 1 | For the period January 28, 2015 (commencement of operations) to March 31, 2015. |
| 2 | Calculated using average shares outstanding during the period. |
| 3 | Percentage represents the results for the period and is not annualized. |
| 4 | The ratios do not reflect the Fund’s share of the income and expenses of the underlying Investee Funds. |
| 5 | Financial ratios have been annualized except for non-recurring costs. |
| 6 | Represents less than 0.01%. |
| 7 | Represents expenses excluded from reimbursement by the Investment Adviser, as defined in the Expense Limitation and Reimbursement Agreement, except for Management Fees. See Note 7. |
See Notes to Consolidated Financial Statements.
215
Blackstone Alternative Investment Funds and Subsidiaries
Notes to Consolidated Financial Statements
For the Year Ended March 31, 2016
1. Organization
Blackstone Alternative Investment Funds (the “Trust”) is a Massachusetts business trust authorized to issue an unlimited number of shares of beneficial interest, which may be divided into different series and classes. The Trust is registered as an open-end management investment company under the Investment Company Act of 1940, as amended (the “1940 Act”). The Trust consists of two series, Blackstone Alternative Multi-Manager Fund (“Multi-Manager Fund”) and Blackstone Alternative Multi-Strategy Fund (“Multi-Strategy Fund”) (each individually referred to as a “Fund”, and collectively, the “Funds”). The Multi-Manager Fund and the Multi-Strategy Fund are non-diversified funds that commenced operations offering Class I Shares on August 6, 2013 and June 16, 2014, respectively. The Multi-Strategy Fund also offers Class D Shares, Class Y Shares and Class R Shares, of which, Class D Shares and Class Y Shares commenced operations on November 17, 2014 and January 28, 2015, respectively.
The investment adviser of the Funds is Blackstone Alternative Investment Advisors LLC (“BAIA” or the “Investment Adviser”), a registered investment adviser under the Investment Advisers Act of 1940, as amended. The Board of Trustees (the “Board” and each member a “Trustee”) of the Trust supervises the conduct of each Fund’s affairs and, pursuant to an investment management agreement, has engaged BAIA to manage each Fund’s day-to-day investment activities. Each Fund’s investment objective is to seek capital appreciation. The Investment Adviser seeks to achieve the Funds’ objectives by allocating the Funds’ assets among a variety of non-traditional, or “alternative,” investment strategies. The Investment Adviser determines the allocations of the Funds’ assets and allocates a majority of the Funds’ assets among the sub-advisers (the “Sub-Advisers”) with experience managing alternative investment strategies and among investment funds, and may also manage a portion of the Funds’ assets directly. Each Sub-Adviser is responsible for the day-to-day management of the Funds’ assets that the Investment Adviser allocates to it. The Investment Adviser has the responsibility to oversee each Sub-Adviser (subject to the oversight of the Board).
Each Fund’s assets may be invested in three wholly-owned and controlled subsidiaries of the Fund (collectively, the “Subsidiaries”), each of which has the same investment objective as the Funds. One of each Fund’s Subsidiaries, Blackstone Alternative Multi-Manager Sub Fund II Ltd. and Blackstone Alternative Multi-Strategy Sub Fund II Ltd. (the “Cayman Subsidiaries”), is a Cayman Islands exempted company. Each of the other Subsidiaries, Blackstone Alternative Multi-Manager Sub Fund III L.L.C. and Blackstone Alternative Multi-Strategy Sub Fund III L.L.C., (the “Domestic Subsidiaries III”), and Blackstone Alternative Multi-Manager Sub Fund IV L.L.C. and Blackstone Alternative Multi-Strategy Sub Fund IV L.L.C. (the “Domestic Subsidiaries IV”), are Delaware limited liability companies. The Cayman Subsidiaries invest, directly or indirectly through the use of derivatives, in securities and commodity interests. The Domestic Subsidiaries III and the Domestic Subsidiaries IV invest, directly or indirectly through the use of derivatives, almost entirely in securities (with only de minimis exposure to commodity interests). The consolidated financial statements include the financial statements of the Multi-Manager Fund and its applicable Subsidiaries and the Multi-Strategy Fund and its applicable Subsidiaries. Except where context otherwise requires, the term “Fund” refers to the Fund together with the applicable Subsidiaries.
The Funds and the Cayman Subsidiaries are each a commodity pool subject to regulation by the Commodity Futures Trading Commission (“CFTC”). BAIA, the commodity pool operator of the Funds and the Cayman Subsidiaries, is registered as such with the CFTC, but has claimed relief under Rules 4.12(c)(3) and 4.7 of the Commodity Exchange Act (“CEA”), respectively, from certain disclosure, reporting, and recordkeeping requirements otherwise applicable to commodity pools. None of the Domestic Subsidiaries III and Domestic Subsidiaries IV intend to invest more than a de minimis level of its net assets in “commodity interests” (as defined under the CEA). Accordingly, BAIA has claimed an exemption under Rule 4.13(a)(3) from registration as a commodity pool operator with respect to the Domestic Subsidiaries III and the Domestic Subsidiaries IV, and such pools are not subject to regulation by the CFTC.
216
Blackstone Alternative Investment Funds and Subsidiaries
Notes to Consolidated Financial Statements (Continued)
For the Year Ended March 31, 2016
Capitalized terms used, but not defined herein, shall have the meaning assigned to them in the respective Prospectus of each of the Funds.
2. Basis of Presentation
Each Fund’s consolidated financial statements are prepared in accordance with accounting principles generally accepted in the United States of America (“U.S. GAAP”) and are stated in U.S. dollars. All inter-company accounts and transactions have been eliminated in consolidation. The preparation of financial statements in accordance with U.S. GAAP requires management to make certain estimates and assumptions that affect the reported amount of assets and liabilities, the disclosure of contingent assets and liabilities, and the reported amounts of income and expenses during the period. Actual results could differ from these estimates and these differences could be material.
The Funds are investment companies in accordance with Accounting Standards Codification 946, Financial Services – Investment Companies (“ASC 946”), which defines investment companies and prescribes specialized accounting and reporting requirements for investment companies.
3. Significant Accounting Policies
The net asset value (“NAV”) of each Fund’s shares is calculated as of the close of regular trading on the New York Stock Exchange (“NYSE”) (generally 4:00 pm Eastern Time) on each day that the NYSE is open for business (a “Business Day”).
Valuation Policy
For purposes of calculating the NAV, each Fund values its investments in securities, securities sold short, derivative financial instruments and other investments at fair value. U.S. GAAP defines fair value as the price that each Fund would receive to sell an asset or pay to transfer a liability (i.e. the exit price) in an orderly transaction between market participants at the measurement date. The Board has established procedures for determining the fair value of securities, including securities sold short, and derivative financial instruments and other investments (together the “investments”) (the “Valuation Procedures”). The Board has delegated to the Investment Adviser day-to-day responsibility for implementing the Valuation Procedures. The Investment Adviser’s management has formed the Fair Value Committee (the “FVC”), which provides oversight of the valuation and pricing function of each Fund for all investments. Pursuant to the Valuation Procedures, if market quotations are not readily available (or are otherwise not reliable for a particular investment), the fair value will be determined, in good faith by the FVC, and such determinations shall be reported to the Board. Due to the inherent uncertainty, estimates of fair value may differ from the values that would have been used had a ready market for these investments existed and the differences could be material.
Market quotes are considered not readily available in circumstances where there is an absence of current or reliable market-based data (e.g., trade information, bid/ask information, or broker-dealer quotations), including where events occur after the close of the relevant market, but prior to the close of the NYSE, that materially affect the values of a Fund’s investments. In addition, market quotes are considered not readily available when, due to extraordinary circumstances, the exchanges or markets on which securities trade do not open for trading for the entire day and no other market prices are available. The Board has delegated to the FVC and the Investment Adviser the responsibility for monitoring significant events that may materially affect the values of each Fund’s investments and for determining whether the value of the applicable investments should be re-evaluated in light of such significant events. There were no instances of such determination made as of March 31, 2016.
217
Blackstone Alternative Investment Funds and Subsidiaries
Notes to Consolidated Financial Statements (Continued)
For the Year Ended March 31, 2016
Fair Value Measurements
Fair value guidance defines fair value, establishes a framework for measuring fair value, and expands disclosures about fair value measurements. The hierarchy established under the fair value guidance gives the highest priority to unadjusted quoted prices in active markets for identical assets or liabilities (Level 1) and the lowest priority to unobservable inputs (Level 3).
The availability of observable inputs can vary from security to security and is affected by a wide variety of factors, including, for example, the type of security, whether the security is new and not yet established in the marketplace, the liquidity of markets, and other characteristics particular to the security. To the extent that valuation is based on models or inputs that are less observable or unobservable in the market, the determination of fair value requires more judgment. Accordingly, the degree of judgment exercised in determining fair value is greatest for investments categorized in Level 3. The inputs or methodology used for valuing an investment are not necessarily an indication of the risk associated with investing in those securities.
Investments measured and reported at fair value are classified and disclosed in one of the following levels within the fair value hierarchy based on the lowest level of input that is significant to the fair value measurement:
Level 1 – quoted prices are available in active markets for identical investments as of the measurement date. The Funds do not adjust the quoted price for these investments.
The types of investments categorized within Level 1 generally include actively traded domestic and certain foreign equity securities, and derivative financial instruments actively traded on recognized exchanges.
Level 2 – quoted prices are available in markets that are not active or model inputs are based on inputs that are either directly or indirectly observable as of the measurement date.
The types of investments categorized within Level 2 generally include certain foreign equities; fixed income securities including corporate and convertible bonds, loans, trade claims, sovereign debt obligations, U.S. Treasury obligations, and asset-backed and mortgage-backed securities; over-the-counter (“OTC”) derivative financial instruments such as total return swaps, interest rate swaps, credit default swaps, OTC options; and forward foreign currency exchange contracts.
Level 3 – pricing inputs are unobservable and include instances where there is little, if any, market activity for the investment. Inputs reflect the best estimate of what market participants would use in determining fair value of investments as of the measurement date.
Changes in valuation techniques may result in transfers in or out of an investment’s assigned level within the fair value hierarchy. In addition, in periods of market dislocation, the observability of prices and inputs may be reduced for many instruments. This condition, as well as changes related to liquidity of investments, could cause an investment to be reclassified between Level 1, Level 2, or Level 3.
A description of the valuation techniques applied to each Fund’s major categories of investments measured at fair value on a recurring basis are as follows:
Exchange-Traded Securities
Equity securities, including common stock, listed preferred stock, exchange-traded funds, and derivative financial instruments, such as futures contracts and option contracts, that are traded on a recognized securities exchange or on the NASDAQ Global Market System (“NASDAQ”) are valued at the last reported sales price
218
Blackstone Alternative Investment Funds and Subsidiaries
Notes to Consolidated Financial Statements (Continued)
For the Year Ended March 31, 2016
(or the official closing price of certain foreign exchanges) or the NASDAQ official closing price, as applicable. For securities traded on more than one exchange, the last reported sales price on the exchange where the security is primarily traded is used. To the extent these securities and derivative financial instruments are actively traded and adjustments are not applied, they are categorized as Level 1 within the fair value hierarchy.
The Funds may use a third-party fair valuation service provider to value foreign equity securities that are primarily traded outside of North and South America. The third-party fair valuation service provider calculates a factor (“Fair Value Factor”) that is applied to adjust the last price of each such security in the event that there is movement in excess of a specified trigger (“Fair Value Trigger”) as measured by the movement between the prior close and the current close of the U.S. market. Foreign equities for which the last price has been adjusted by such factor will generally be categorized as Level 2 within the fair value hierarchy. As of March 31, 2016, certain foreign equity securities were classified in Level 2 as a Fair Value Factor was applied to the prices of these securities.
Short-Term Investments
Short-term investments, such as money market funds, are valued at NAV. These securities are categorized as Level 1 within the fair value hierarchy.
OTC Derivative Financial Instruments
Derivative financial instruments, such as forward foreign currency exchange contracts, OTC options contracts, or swap agreements, derive their value from underlying referenced instruments or obligations, indices, reference rates, and other inputs or a combination thereof. These contracts are normally valued by pricing service providers or based on broker dealer quotations. Depending on the nature of the instruments and the terms of the transaction, the value of derivative financial instruments can be estimated by a pricing service provider using a series of techniques, including simulation pricing models. The pricing models use inputs that are observed from actively quoted markets such as issuer details, indices, spreads, interest rates, yield curves, dividends and exchange rates. Derivative financial instruments that use similar valuation techniques and inputs as described above are categorized as Level 2 within the fair value hierarchy.
Centrally cleared swaps listed or traded on a multilateral or trade facility platform, such as a registered exchange, are valued at the daily settlement price determined by the respective exchange. For centrally cleared credit default swaps, the clearing facility requires its members to provide actionable levels across complete term structures. These levels along with external third-party prices are used to produce daily settlement prices. Centrally cleared interest rate swaps are valued using a pricing model that references the underlying rates to produce the daily settlement price. These securities are categorized as Level 2 within the fair value hierarchy.
Fixed Income Securities
Fixed income securities, including corporate and convertible bonds, U.S. Treasury obligations, foreign debt obligations, bank loans, and trade claims, are normally valued by pricing service providers on the basis of last available bid price. In determining the value of a particular investment, pricing service providers may use broker-dealer quotations, reported trades or valuation estimates from their internal pricing models to determine the reported price. The pricing service providers’ internal models use observable inputs such as issuer details, interest rates, yield curves, prepayment speeds, credit risks/spreads, default rates and quoted prices for similar assets. Securities that use similar valuation techniques and inputs as described above are categorized as Level 2 within the fair value hierarchy.
219
Blackstone Alternative Investment Funds and Subsidiaries
Notes to Consolidated Financial Statements (Continued)
For the Year Ended March 31, 2016
Mortgage-related and asset-backed securities (“ABS”) are usually issued as separate tranches, or classes, of securities within each deal. These securities are also normally valued by pricing service providers that use broker-dealer quotations or valuation estimates from their internal pricing models. The pricing models for these securities usually consider tranche-level attributes, current market data, estimated cash flows and market-based yield spreads for each tranche, and incorporate deal collateral performance, as available. Mortgage-related and ABS that use similar valuation techniques and inputs as described above are categorized as Level 2 within the fair value hierarchy.
Level 3 securities are valued by broker quotes or pricing services that may employ valuation techniques with unobservable inputs. At March 31, 2016, the values of these Level 3 securities for Multi-Manager Fund and Multi-Strategy Fund were $326,210 and $460,576, respectively. The appropriateness of fair values for these securities are monitored on an ongoing basis which may include results of backtesting, results of pricing due diligence, unchanged price review, use of specialists, and consideration of macro security specific events.
Investment in Investee Fund
The fair value of investments in unaffiliated hedge funds, funds traded publicly on foreign exchanges, funds that are Undertakings for Collective Investment in Transferable Securities, and open-end and closed-end management investment companies in which the Funds may invest (collectively, the “Investee Funds”) is generally determined using the reported net asset value per share of the Investee Fund, or its equivalent, as a practical expedient for fair value, unless the investment in Investee Fund is traded on a recognized securities exchange and a quoted price is available as of the measurement date. If there is no quoted price available, the Funds may, as a practical expedient, estimate the fair value of an Investee Fund based on the reported net asset value per share or its equivalent if the reported net asset value per share or its equivalent of the Investee Fund is calculated in a manner consistent with the measurement principles applied to investment companies, in accordance with ASC 946.
Securities and Other Investments
Bank Loans
The Funds may invest in bank loans including, for example, corporate loans, loan participations, direct debt, bank debt, and bridge debt. Each Fund invests in loans through novations, assignments, and participation interests. In a novation, a Fund typically assumes all of the rights of a lending institution in a loan, including the right to receive payments of principal and interest and other amounts directly from the borrower and to enforce its rights as a lender directly against the borrower. When a Fund takes an assignment of a loan, the Fund acquires some or all of the interest of another lender (or assignee) in the loan. In such cases, the Funds may be required generally to rely upon the assignor to demand payment and enforce rights under the loan. If a Fund acquires a participation in the loan, the Fund purchases an indirect interest in a loan held by a third-party and the Fund typically will have a contractual relationship only with the third-party loan investor, not with the borrower. As a result, the Fund may have the right to receive payments of principal, interest, and any fees to which it is entitled only from the loan investor selling the participation and only upon receipt by such loan investor of such payments from the borrower. In such cases, the Fund assumes the credit risk of both the borrower and the loan investor selling the participation, and the Fund may be unable to realize some or all of the value of its interest in the loan in the event of the insolvency of the third-party. Changes in the financial condition of the borrower or economic conditions or other circumstances may reduce the capacity of the borrower to make principal and interest payments on such instruments and may lead to defaults.
220
Blackstone Alternative Investment Funds and Subsidiaries
Notes to Consolidated Financial Statements (Continued)
For the Year Ended March 31, 2016
Mortgage-Related and Other Asset-Backed Securities
The Funds may invest in mortgage-related securities (residential and commercial) and other ABS. These securities include mortgage pass-through securities, collateralized mortgage obligations (“CMO”), commercial mortgage-backed securities (“CMBS”), residential mortgage-backed securities (“RMBS”), collateralized debt obligations (“CDO”) and other securities that directly or indirectly represent a participation, or are secured by and payable from mortgage loans on real property. Mortgage related and other ABS represent interests in pools of mortgages, loans or other assets. Mortgage-related securities are created from pools of residential or commercial mortgage loans, including loans made by savings and loans institutions, mortgage bankers, commercial banks and others. These securities typically provide a monthly payment which consists of both interest and principal payments. Interest payments may be determined by fixed or adjustable rates. Although ABS and CMBS generally experience less prepayment risk than RMBS, each of RMBS, CMBS and ABS, like traditional fixed-income securities, are subject to credit, interest rate, prepayment and extension risks.
Small movements in interest rates (both increases and decreases) may quickly and significantly reduce the value of certain mortgage-backed securities. The Funds’ investments in ABS are subject to risks similar to those associated with mortgage-related securities, as well as additional risks associated with the nature of the assets and the servicing of those assets. These securities also are subject to the risk of default on the underlying mortgage or assets, particularly during periods of economic downturn. The timely payment of principal and interest of certain mortgage-related securities is guaranteed by the full faith and credit of the U.S. Government.
Mortgage-backed securities may be either pass-through securities or CMO. Pass-through securities represent a right to receive principal and interest payments collected on a pool of mortgages, which are passed through to security holders. CMO are created by dividing the principal and interest payments collected on a pool of mortgages into several revenue streams (tranches) with different priority rights to portions of the underlying mortgage payments. Certain CMO tranches may represent a right to receive interest only (“IOs”), principal only (“POs”) or an amount that remains after floating-rate tranches are paid (an “inverse floater”). These securities may be extremely sensitive to changes in interest rates. Interest rates on inverse floaters, for example, vary inversely with a short-term floating rate (which may be reset periodically). Interest rates on inverse floaters will decrease when short-term rates increase, and will increase when short-term rates decrease. These securities have the effect of providing a degree of investment leverage. In response to changes in market interest rates or other market conditions, the value of an inverse floater may increase or decrease at a multiple of the increase or decrease in the value of the underlying securities. If a Fund invests in
CMO tranches (including CMO tranches issued by government agencies) and interest rates move in a manner not anticipated by the Investment Adviser, it is possible that the Fund could lose all or substantially all of its investment.
Securities Sold Short
The Funds may sell securities short (a “Short Sale”). A Short Sale is a transaction whereby a Fund sells securities it does not own in anticipation of a decline in the market price of those securities, whereby a Fund’s broker will execute a borrow transaction to deliver the securities resulting from the Fund’s Short Sale. The Funds are obligated to repurchase the securities at the market price at the time of replacement. The Fund’s obligations to replace the securities in connection with a Short Sale are secured by collateral.
Upon entering into a Short Sale, the Funds establish a liability which is recorded as securities sold short in the Consolidated Statement of Assets and Liabilities to represent securities due under the Short Sale agreement. The Funds are liable to pay any dividends declared and/or interest income earned during the period the Short Sale is open. These dividends and interest are recorded as dividend and interest expense on
221
Blackstone Alternative Investment Funds and Subsidiaries
Notes to Consolidated Financial Statements (Continued)
For the Year Ended March 31, 2016
securities sold short in the Consolidated Statement of Operations. Unrealized appreciation or depreciation for the difference between the proceeds received and the fair value of the open Short Sale position is recorded as net unrealized appreciation or depreciation from investments on securities sold short in the Consolidated Statement of Operations. A realized gain or loss is recognized when the short position is closed as a net realized gain or loss from investments on securities sold short in the Consolidated Statement of Operations.
Investment Transactions and Related Investment Income
Investment transactions are recorded as of the trade date for financial reporting purposes. Dividend income is recorded on the ex-dividend date or, for certain foreign securities, when notified. Interest income, which includes amortization of premiums and accretion of discounts on non-defaulted fixed income securities, is recorded on an accrual basis. Realized gains and losses on investments are determined on the identified cost basis, which is the same basis used for federal income tax purposes. Foreign income and foreign capital gains on some foreign securities may be subject to foreign taxes, which are accrued as applicable.
Cash
At March 31, 2016, the Multi-Manager Fund and the Multi-Strategy Fund had $329,423,891 and $69,940,159, respectively, in domestic cash and $0 and $21,396,145, respectively, in foreign cash held at a major U.S. bank.
Foreign Currency
The functional currency of each Fund is the U.S. dollar. Assets and liabilities denominated in foreign currencies are translated into U.S. dollars at the closing prices of such currencies on each Business Day. Purchases and sales of investments and income and expenses are translated on the respective dates of such transactions or when accrued. The Funds do not isolate the portion of realized or unrealized gains or losses resulting from changes in the foreign exchange rate on investments from fluctuations arising from changes in the fair value of the investments. Such gains and losses are included with net realized and unrealized gain or loss on investments. Net realized gains and losses on foreign currency transactions represent net realized exchange gains or losses on disposition of foreign currencies and currency gains and losses realized between trade and settlement dates on investment transactions. Net unrealized appreciation and deprecation of assets and liabilities, other than investments, attributable to foreign currency fluctuations are recorded as net unrealized appreciation or depreciation on foreign currency translations in the Consolidated Statement of Operations.
Contingencies
Under the Trust’s Declaration of Trust, each of the Funds’ officers and Trustees are indemnified against certain liabilities that may arise out of the performance of their duties to the Funds. Additionally, in the normal course of business, the Funds may enter into contracts that contain a variety of representations and indemnifications. The Funds expect the risk of loss pursuant to these indemnifications to be remote.
Income Taxes
The Funds’ policy is to comply with the provisions of the Internal Revenue Code, as amended, applicable to regulated investment companies and to distribute all of its investment company taxable income and net long-term capital gains to its shareholders. Therefore, no federal income tax provision is expected to be required. The Funds plan to file U.S. federal and various state and local tax returns.
For the open tax years and all major jurisdictions, management of the Funds has concluded that there are no significant uncertain tax positions that would require recognition in the consolidated financial statements.
222
Blackstone Alternative Investment Funds and Subsidiaries
Notes to Consolidated Financial Statements (Continued)
For the Year Ended March 31, 2016
Organization Costs
Organizational expenses associated with the establishment of the Funds were expensed by the Funds as incurred and reimbursed by the Investment Adviser in accordance with the terms of the Expense Limitation and Reimbursement Agreement (see Note 7).
Offering Costs
Offering costs are amortized over 12 months on a straight-line basis beginning on the date of commencement of operations.
Dividends and Distributions to Shareholders
Dividends from net investment income and distributions of net realized capital gains of the Funds, if any, are generally declared and paid in December, however, the Funds may make additional distributions at other times. Dividends and capital gain distributions paid by the Funds will be reinvested in additional Shares (see Note 6) of the Funds or, if elected by the Shareholder, paid in cash.
Segregation and Collateralization
In cases in which the 1940 Act and the interpretive positions of the Securities and Exchange Commission (“SEC”) and its staff require that a Fund either delivers collateral or segregates assets in connection with certain investments (e.g., futures contracts, forward foreign currency exchange contracts, swaps and options written), or transactions considered to reflect borrowings (e.g., reverse repurchase agreements), the Fund will, consistent with SEC rules and/or certain interpretive guidance issued by the SEC, segregate collateral or designate on its books and records cash or liquid securities having a market value at least equal to the amount that would otherwise be required to be physically segregated. Furthermore, based on requirements and agreements with certain exchanges and third party broker-dealers, a Fund engaging in such transactions may have requirements to deliver/deposit securities to/with an exchange or broker-dealer as collateral for certain investments to the extent consistent with the 1940 Act and interpretive positions of the SEC and its staff. The Funds may mitigate counterparty risk by procuring collateral and through netting provisions included within an International Swaps and Derivatives Association, Inc. Master Agreement (“ISDA Master Agreement”) implemented between each Fund and each of its respective counterparties. An ISDA Master Agreement may contain certain provisions regarding, among other things, the parties’ general obligations, representations, agreements, collateral requirements, events of default and early termination. Certain ISDA Master Agreements, or similar agreements, may allow the Funds to offset certain derivative financial instruments’ with collateral. At March 31, 2016, the Funds used the gross method of presentation in their consolidated financial statements and did not elect to offset amounts eligible for offset under enforceable master netting arrangements or similar agreements. The amount of collateral moved to/from applicable counterparties is generally based upon minimum transfer amounts of up to $250,000. Collateral pledged by the Funds is segregated by the Funds’ custodian and identified as such in each Fund’s portfolio. Collateral can be in the form of cash or securities as agreed to by the Funds and the applicable counterparty. Typically, the Funds and counterparties are not permitted to sell, repledge or use the collateral they receive unless explicitly permitted by each respective governing agreement.
The Funds manage counterparty risk by entering into agreements only with counterparties that are believed to have the financial resources to honor their obligations and by monitoring the financial stability of those counterparties. The agreements entered into by the Funds may contain credit risk related contingent features that may be triggered in certain circumstances to protect either party from a deterioration in creditworthiness of the other. Such circumstances may include a decrease in credit rating or, in the case of a Fund, a decrease in net asset value. If triggered, the Fund or counterparty may be entitled to additional cash margin and/or to
223
Blackstone Alternative Investment Funds and Subsidiaries
Notes to Consolidated Financial Statements (Continued)
For the Year Ended March 31, 2016
terminate the contract. See Note 9 for a further discussion of the risks of a Fund, including Credit and Counterparty Risk.
Reverse Repurchase Agreements
The Funds may enter into reverse repurchase agreements. In a reverse repurchase agreement, a Fund sells a security in exchange for cash to a financial institution, the counterparty, with a simultaneous agreement to repurchase the same or substantially the same security at an agreed upon price and date, under the terms of a Master Repurchase Agreement (“MRA”). The Fund is entitled to receive principal and interest payments, if any, made on the security delivered to the counterparty during the term of the agreement. Cash received in exchange for securities delivered plus accrued interest payments to be made by the Fund to counterparties is reflected as a liability. Reverse repurchase agreements involve the risk that the market value of the securities purchased with the proceeds from the sale of securities received by the Fund may decline below the price of the securities the Fund is obligated to repurchase. Reverse repurchase agreements also involve credit risk with the counterparty to the extent that the value of securities subject to repurchase exceed the Fund’s liability under the reverse repurchase agreement. Securities subject to repurchase under reverse repurchase agreements, if any, are designated as such in the Consolidated Schedule of Investments. Due to the short term nature of the reverse repurchase agreements, face value approximates fair value. As of March 31, 2016, the face values of open reverse repurchase agreements for Multi-Manager Fund and Multi-Strategy Fund were $4,630,000 and $206,793,000, respectively. The weighted average daily balances of reverse repurchase agreements outstanding during the year ended March 31, 2016 for Multi-Manager Fund and Multi-Strategy Fund were approximately $128,422,032 and $155,231,786, respectively, at a weighted average weekly interest rate of 1.89% and 1.97%, respectively.
An MRA contains provisions for, among other things, initiation, income payments, events of default and maintenance of securities for repurchase agreements. An MRA also permits offsetting with collateral to create one single net payment in the event of default or similar events, including the bankruptcy or insolvency of a counterparty. The following tables present the reverse repurchase agreements, which are subject to enforceable MRAs, as well as the collateral delivered related to those reverse repurchase agreements by class of collateral and summarized by the remaining contractual maturity of the transactions.
Multi-Manager Fund
Counterparty | Reverse Repurchase Agreements | Fair Value of Non-Cash Collateral(1) | Cash Collateral Pledged(1) | Net Amount | ||||||||||||||||
Credit Suisse Securities (USA) LLC | $ | (4,497,142 | ) | $ | 4,497,142 | $ | — | $ | — | |||||||||||
JPMorgan Chase Bank, N.A. | (155,392 | ) | 155,392 | — | — | |||||||||||||||
|
|
|
|
|
|
|
| |||||||||||||
Total | $ | (4,652,534 | ) | $ | 4,652,534 | $ | — | $ | — | |||||||||||
|
|
|
|
|
|
|
| |||||||||||||
| (1) | Additional required collateral pledged is not shown for financial reporting purposes. The total fair value of non-cash and cash collateral pledged at March 31, 2016 was $6,041,388 and $1,055,296, respectively. |
224
Blackstone Alternative Investment Funds and Subsidiaries
Notes to Consolidated Financial Statements (Continued)
For the Year Ended March 31, 2016
| Remaining Contractual Maturity of the Agreements As of March 31, 2016 | |||||||||||||||||||||||||
Overnight | <30 days | Between | >90 days | Total | |||||||||||||||||||||
Reverse Repurchase Agreements |
| ||||||||||||||||||||||||
Mortgage-Backed Securities | $ | — | $ | 3,816,628 | $ | 144,062 | $ | — | $ | 3,960,690 | |||||||||||||||
Cash | — | 691,844 | — | — | 691,844 | ||||||||||||||||||||
|
|
|
|
|
|
|
|
|
| ||||||||||||||||
Total | $ | — | $ | 4,508,472 | $ | 144,062 | $ | — | $ | 4,652,534 | |||||||||||||||
|
|
|
|
|
|
|
|
|
| ||||||||||||||||
Gross amount of recognized liabilities for reverse repurchase agreements | $ | 4,652,534 | |||||||||||||||||||||||
|
| ||||||||||||||||||||||||
Multi-Strategy Fund
Counterparty | Reverse Repurchase Agreements | Fair Value of Non-Cash Collateral(1) | Cash Collateral Pledged(1) | Net Amount | ||||||||||||||||
BNP Paribas Securities Corp. | $ | (8,936,199 | ) | $ | 8,936,199 | $ | — | $ | — | |||||||||||
Credit Suisse Securities (USA) LLC | (53,008,125 | ) | 53,008,125 | — | — | |||||||||||||||
JPMorgan Chase Bank, N.A. | (23,078,954 | ) | 23,078,954 | — | — | |||||||||||||||
Merrill Lynch, Pierce, Fenner & Smith, Inc. | (74,184,099 | ) | 74,184,099 | — | — | |||||||||||||||
Royal Bank of Canada | (45,752,036 | ) | 45,752,036 | — | — | |||||||||||||||
Wells Fargo Securities LLC | (2,421,894 | ) | 2,421,894 | — | — | |||||||||||||||
|
|
|
|
|
|
|
| |||||||||||||
Total | $ | (207,381,307 | ) | $ | 207,381,307 | $ | — | $ | — | |||||||||||
|
|
|
|
|
|
|
| |||||||||||||
| (1) | Additional required collateral pledged is not shown for financial reporting purposes. The total fair value of non-cash and cash collateral pledged at March 31, 2016 was $284,447,501 and $6,960,834, respectively. |
| Remaining Contractual Maturity of the Agreements As of March 31, 2016 | |||||||||||||||||||||||||
Overnight | <30 days | Between | >90 days | Total | |||||||||||||||||||||
Reverse Repurchase Agreements |
| ||||||||||||||||||||||||
Mortgage-Backed Securities | $ | — | $ | 124,706,696 | $ | 42,401,993 | $ | 11,043,433 | $ | 178,152,122 | |||||||||||||||
Asset-Backed Securities | — | — | 24,275,494 | — | 24,275,494 | ||||||||||||||||||||
Cash | — | 4,953,691 | — | — | 4,953,691 | ||||||||||||||||||||
|
|
|
|
|
|
|
|
|
| ||||||||||||||||
Total | $ | — | $ | 129,660,387 | $ | 66,677,487 | $ | 11,043,433 | $ | 207,381,307 | |||||||||||||||
|
|
|
|
|
|
|
|
|
| ||||||||||||||||
Gross amount of recognized liabilities for reverse repurchase agreements | $ | 207,381,307 | |||||||||||||||||||||||
|
| ||||||||||||||||||||||||
Securities Lending
The Funds may lend securities, through their agent, to certain qualified financial institutions. The loans are collateralized by cash in an amount at least equal to the market value of the securities loaned. The market value of securities loaned is determined daily and any additional required collateral is allocated to each Fund on the next Business Day. The initial collateral received by each Fund should have a value of at least 102%
225
Blackstone Alternative Investment Funds and Subsidiaries
Notes to Consolidated Financial Statements (Continued)
For the Year Ended March 31, 2016
of the current value of loaned securities for U.S. securities and at least 105% for all other securities. The risk of borrower default will be borne by the Fund’s agent; the Funds will bear the risk of loss with respect to the investment of the cash collateral. The advantage of such loans is that each Fund continues to receive income on loaned securities while earning returns on the cash amounts which may be reinvested for the purchase of investment in securities. Income from securities lending is included in investment income on the Consolidated Statement of Operations. As of March 31, 2016, the market value of securities loaned for Multi-Manager Fund and Multi-Strategy Fund amounted to $23,296,179 and $116,876,693, respectively, and each Fund had received cash collateral of $23,898,259 and $120,918,878, respectively. The market value of securities on loan are classified as common stock, corporate and convertible bonds and notes in each Fund’s Consolidated Schedule of Investments and as a component of investments in securities, at value in the Consolidated Statement of Assets and Liabilities. In addition, the value of the related collateral is shown separately as securities lending collateral payable in the Consolidated Statement of Assets and Liabilities. All of the security lending agreements are continuous.
The securities lending agreement entered into by each Fund provides the right, in the event of default, for the non-defaulting party to liquidate the collateral and calculate a net exposure to the defaulting party or request additional collateral. Under the agreement, the Funds can reinvest cash collateral.
The following tables present the securities lending agreements by borrower/counterparty, which are subject to offset under the securities lending agreement, as well as the collateral delivered related to those securities lending agreements by class of collateral and summarized by the remaining contractual maturity of the transactions.
Multi-Manager Fund
Borrower/Counterparty | Securities Loaned at Value | Cash Collateral Received(1) | Net Amount(2) | ||||||||||||
BNP Paribas Prime Brokerage, Inc. | $ | 171,226 | $ | (171,226 | ) | $ | — | ||||||||
Citigroup Global Markets, Inc. | 1,786,475 | (1,786,475 | ) | — | |||||||||||
Credit Suisse Securities (USA) LLC | 775,852 | (775,852 | ) | — | |||||||||||
Deutsche Bank Securities, Inc. | 4,105,655 | (4,105,655 | ) | — | |||||||||||
Goldman Sachs & Co. | 1,558,294 | (1,558,294 | ) | — | |||||||||||
Janney Montgomery Scott LLC | 526,538 | (526,538 | ) | — | |||||||||||
Jefferies LLC | 10,808 | (10,808 | ) | — | |||||||||||
JP Morgan Clearing Corp. | 1,309,726 | (1,309,726 | ) | — | |||||||||||
Merrill Lynch, Pierce, Fenner & Smith, Inc. | 971,880 | (971,880 | ) | — | |||||||||||
Mitsubishi UFJ Securities (USA) Inc. | 12,276 | (12,276 | ) | — | |||||||||||
Pershing LLC | 349,860 | (349,860 | ) | — | |||||||||||
RBC Capital Markets, LLC | 358,810 | (358,810 | ) | — | |||||||||||
State Street Bank and Trust Company | 10,350,359 | (10,350,359 | ) | — | |||||||||||
Timber Hill LLC | 662,870 | (662,870 | ) | — | |||||||||||
UBS Securities LLC | 118,801 | (118,801 | ) | — | |||||||||||
Wedbush Securities, Inc. | 226,749 | (226,749 | ) | — | |||||||||||
|
| ||||||||||||||
Total | $ | 23,296,179 | $ | (23,296,179 | ) | $ | — | ||||||||
|
| ||||||||||||||
226
Blackstone Alternative Investment Funds and Subsidiaries
Notes to Consolidated Financial Statements (Continued)
For the Year Ended March 31, 2016
| Remaining Contractual Maturity of the Agreements As of March 31, 2016 | |||||||||||||||||||||||||
Overnight | <30 days | Between | >90 days | Total | |||||||||||||||||||||
Securities Lending Agreements | |||||||||||||||||||||||||
Common Stock | $ | (23,223,609 | ) | $ | — | $ | — | $ | — | $ | (23,223,609 | ) | |||||||||||||
Exchange-Traded Funds | (72,570 | ) | — | — | — | (72,570 | ) | ||||||||||||||||||
|
|
|
|
|
|
|
|
|
| ||||||||||||||||
Total | $ | (23,296,179 | ) | $ | — | $ | — | $ | — | $ | (23,296,179 | ) | |||||||||||||
|
|
|
|
|
|
|
|
|
| ||||||||||||||||
Gross amount of recognized liabilities for securities lending agreements |
| $ | (23,296,179 | ) | |||||||||||||||||||||
|
| ||||||||||||||||||||||||
Multi-Strategy Fund
Borrower/Counterparty | Securities Loaned at Value | Cash Collateral Received(1) | Net Amount(2) | ||||||||||||
BNP Paribas Prime Brokerage, Inc. | $ | 111,650 | $ | (111,650 | ) | $ | — | ||||||||
BNP Paribas Securities Corp. | 16,646,704 | (16,646,704 | ) | — | |||||||||||
Citadel Clearing LLC | 2,142,608 | (2,142,608 | ) | — | |||||||||||
Citigroup Global Markets, Inc. | 14,230,309 | (14,230,309 | ) | — | |||||||||||
Deutsche Bank Securities, Inc. | 14,684,296 | (14,684,296 | ) | — | |||||||||||
Goldman Sachs & Co. | 12,026,453 | (12,026,453 | ) | — | |||||||||||
Janney Montgomery Scott LLC | 1,405,451 | (1,405,451 | ) | — | |||||||||||
JP Morgan Clearing Corp. | 5,257,279 | (5,257,279 | ) | — | |||||||||||
JP Morgan Securities LLC | 498,438 | (498,438 | ) | — | |||||||||||
Merrill Lynch International | 2,120,813 | (2,120,813 | ) | — | |||||||||||
Merrill Lynch, Pierce, Fenner & Smith, Inc. | 11,887,744 | (11,887,744 | ) | — | |||||||||||
Morgan Stanley & Co. LLC | 10,799,815 | (10,799,815 | ) | — | |||||||||||
National Financial Services LLC | 3,794,667 | (3,794,667 | ) | — | |||||||||||
Natixis Securities Americas, LLC | 49,612 | (48,900 | ) | 712 | |||||||||||
Pershing LLC | 377,730 | (375,950 | ) | 1,780 | |||||||||||
Sanford C. Bernstein & Co. LLC | 100 | (100 | ) | — | |||||||||||
SG Americas Securities, LLC | 9,997,638 | (9,997,638 | ) | — | |||||||||||
TD Ameritrade Clearing, Inc. | 107 | (107 | ) | — | |||||||||||
Timber Hill LLC | 4,451,926 | (4,451,926 | ) | — | |||||||||||
UBS Securities LLC | 1,446,912 | (1,446,912 | ) | — | |||||||||||
Wedbush Securities, Inc. | 2,553,653 | (2,553,653 | ) | — | |||||||||||
Wells Fargo Bank National Association | 406,258 | (406,258 | ) | — | |||||||||||
Wells Fargo Securities, Inc. | 1,986,530 | (1,986,530 | ) | — | |||||||||||
|
| ||||||||||||||
Total | $ | 116,876,693 | $ | (116,874,201 | ) | $ | 2,492 | ||||||||
|
| ||||||||||||||
227
Blackstone Alternative Investment Funds and Subsidiaries
Notes to Consolidated Financial Statements (Continued)
For the Year Ended March 31, 2016
| Remaining Contractual Maturity of the Agreements As of March 31, 2016 | |||||||||||||||||||||||||
Overnight | <30 days | Between | >90 days | Total | |||||||||||||||||||||
Securities Lending Agreements | |||||||||||||||||||||||||
Common Stock | $ | (101,518,616 | ) | $ | — | $ | — | $ | — | $ | (101,518,616 | ) | |||||||||||||
Corporate Bonds & Notes | (13,611,543 | ) | — | — | — | (13,611,543 | ) | ||||||||||||||||||
Exchange-Traded Funds | (1,746,534 | ) | — | — | — | (1,746,534 | ) | ||||||||||||||||||
|
|
|
|
|
|
|
|
|
| ||||||||||||||||
Total | $ | (116,876,693 | ) | $ | — | $ | — | $ | — | $ | (116,876,693 | ) | |||||||||||||
|
|
|
|
|
|
|
|
|
| ||||||||||||||||
Gross amount of recognized liabilities for securities lending agreements |
| $ | (116,876,693 | ) | |||||||||||||||||||||
|
| ||||||||||||||||||||||||
| (1) | Additional required collateral received from the individual counterparty is not shown for financial reporting purposes. |
| (2) | The net amount represents additional collateral to be allocated to each Fund on the next business day. |
When-Issued and Delayed-Delivery Transactions
The Funds may engage in when-issued or delayed-delivery transactions. The Funds record when-issued securities on the trade date and maintains security positions such that sufficient liquid assets will be available to make payment for the securities purchased. Securities purchased on a when-issued or delayed-delivery basis are marked-to-market daily and begin earning interest on the settlement date. Losses may occur on these transactions due to changes in market conditions or the failure of counterparties to perform under the contract.
The Funds may transact in To Be Announced Securities (TBAs). As with other delayed delivery transactions, a seller agrees to issue TBAs at a future date. However, the seller does not specify the particular securities to be delivered. Instead, the Funds agree to accept any security that meets specified terms such as issuer, interest rate and terms of underlying mortgages. The Funds record TBAs on the trade date utilizing information associated with the specified terms of the transaction as opposed to the specific mortgages. TBAs are marked-to-market daily and begin earning interest on the settlement date. Losses may occur due to the fact that the actual underlying mortgages received may be less favorable than those anticipated by the Funds.
Recent Accounting Pronouncements
In January 2016, the Financial Standards Board (“FASB”) issued Accounting Standards Update (“ASU”) No. 2016-01, Recognition and Measurement of Financial Assets and Financial Liabilities. The new guidance is intended to enhance the reporting model for financial instruments to provide users of financial statements with more decision-useful information and addresses certain aspects of the recognition, measurement, presentation, and disclosure of financial instruments. The new standard affects all entities that hold financial assets or owe financial liabilities. The new guidance is effective for public companies for fiscal years beginning after December 15, 2017, including interim periods within those fiscal years. The adoption of ASU No. 2016-01 is not expected to have a material impact on the consolidated financial statements.
In May 2015, the FASB issued ASU No. 2015-07, Disclosures for Investments in Certain Entities That Calculate Net Asset Value per Share (or Its Equivalent). The amendment removes the requirement to categorize within the fair value hierarchy all investments for which fair value is measured using the NAV as a practical expedient. The guidance is effective for fiscal years beginning after December 15, 2016 and for interim periods within those years and early adoption is permitted. The Funds have elected to early adopt and
228
Blackstone Alternative Investment Funds and Subsidiaries
Notes to Consolidated Financial Statements (Continued)
For the Year Ended March 31, 2016
apply this guidance as of year-end. Prior to the issuance of the amended guidance, investments that were fair valued using the NAV as a practical expedient were categorized within the fair value hierarchy based on the Funds’ ability to redeem its investment on the measurement date. As of year-end, all of the Funds’ investments in Investee Funds were valued using the practical expedient. As a result of adoption of this guidance, disclosure of investments in Investee Funds within the fair value hierarchy is excluded.
In August 2014, the FASB issued ASU No. 2014-15, Disclosure of Uncertainties about an Entity’s Ability to Continue as a Going Concern. The amendment provides guidance on management’s responsibility in evaluating whether there is substantial doubt about a Fund’s ability to continue as a going concern and related footnote disclosures. For each reporting period, management is required to evaluate whether there are conditions or events, in the aggregate, that raise substantial doubt about a Fund’s ability to continue as a going concern within one year from the date the financial statements are issued or are available to be issued. This evaluation should include consideration of conditions and events that are either known or are reasonably knowable at the date the financial statements are issued or are available to be issued, as well as whether it is probable that management’s plans to address the substantial doubt will be implemented and, if so, whether it is probable that the plans will alleviate the substantial doubt. The guidance is effective for annual periods ending after December 15, 2016, and interim periods and annual periods thereafter. Early adoption is permitted. The adoption of this guidance did not have a material impact on the consolidated financial statements with the exception of additional disclosure reflected in Note 13.
In June 2014, the FASB issued ASU No. 2014-11, Transfers and Servicing (Topic 860) – Repurchase-to-Maturity Transactions, Repurchase Financings, and Disclosures. The guidance requires that repurchase-to-maturity transactions and repurchase agreements executed as a repurchase financing be accounted for as secured borrowings. The guidance also requires new disclosure for transactions economically similar to repurchase agreements in which the transferor retains substantially all of the exposure to the economic return on the transferred financial assets throughout the term of the transaction and expanded disclosures about the nature of collateral pledged in repurchase agreements and similar transactions accounted for as secured borrowings. The guidance is effective for interim and annual periods beginning after December 15, 2014. The adoption of this guidance did not have a material impact on the consolidated financial statements with exception of additional disclosure reflected in Note 3.
4. Derivative Financial Instruments
In the normal course of business, the Funds enter into derivative financial instrument contracts for trading and/or economic hedging purposes to increase the returns of the Funds or to protect against exposure to certain risks such as credit risk, equity risk, interest rate risk, foreign currency exchange risk or other risk (e.g. inflation risk). These contracts may be transacted on a recognized exchange or OTC. The following disclosures contain information on how the Funds use derivative financial instruments. The derivative financial instruments outstanding as of period end are disclosed in the Consolidated Schedule of Investments.
Forward Foreign Currency Exchange Contracts
The Funds may enter into forward foreign currency exchange contracts to obtain investment exposure, to seek enhanced returns or hedge or protect its portfolio holdings against the risk of future movements in certain foreign currency exchange rates. Forward foreign currency exchange contracts are agreements between two parties to receive or deliver a fixed quantity of foreign currency for an agreed upon price on an agreed upon future date. The market value of a forward foreign currency contract fluctuates with the changes in foreign currency exchange rates. These contracts are valued daily and the change in market value is recorded as an unrealized gain or loss on forward foreign currency exchange contracts. When a contract is
229
Blackstone Alternative Investment Funds and Subsidiaries
Notes to Consolidated Financial Statements (Continued)
For the Year Ended March 31, 2016
closed, each Fund recognizes a realized gain or loss equal to the difference between the value of the contract at the time it was opened and the value at the time it was closed.
The use of forward foreign currency exchange contracts does not eliminate fluctuations in the underlying prices of the securities of the Funds, but it does establish a rate of exchange that can be achieved in the future. Although forward foreign currency exchange contracts may limit the risk of loss due to a decline in the value of the currency holdings, they also limit any potential gain that might result should the value of the currency increase. In addition, the Funds could be exposed to losses if the counterparties to the contracts are unable to meet the terms of the contracts. Each Fund’s maximum potential loss from such contracts is the aggregate face value in U.S. dollars at the time the contract was opened. These contracts involve market and/or credit risk in excess of the amount recognized in the Consolidated Statement of Assets and Liabilities.
Futures Contracts
The Funds may enter into futures contracts to maintain investment exposure to a target asset class or to seek enhanced returns. The Funds may be subject to fluctuations in equity prices, interest rates, commodity prices and foreign currency exchange rates in the normal course of pursuing its investment objective. Futures contracts are standardized agreements to buy or sell a security, or deliver a final cash settlement price in connection with an index, interest rate, currency, or other asset. A Fund must deposit an amount (“initial margin”) equal to a certain percentage of the face value of the futures contract. The initial margin may be in the form of cash or securities which is returned when the Fund’s obligations under the contract have been satisfied. If cash is deposited as the initial margin, it is shown as segregated cash balance with broker for futures contracts on the Consolidated Statement of Assets and Liabilities. Futures contracts are marked-to-market daily and subsequent payments (“variation margin”) are made or received by a Fund depending on whether unrealized gains or losses are incurred. When the contract is closed or expires, a Fund records a realized gain or loss equal to the difference between the value of the contract at the time it was opened and the value at the time it was closed. The potential risk to the Funds is that the change in value of futures contracts may not correspond to the change in the value of the hedge investments. In addition, losses may arise from changes in the value of the underlying instrument, if interest or exchange rates move unexpectedly or if the counterparty is unable to perform. With futures, there is minimal counterparty credit risk to the Funds since futures are exchange traded and the exchanges’ clearinghouse, as counterparty to all exchange traded futures, guarantees the futures against default.
Options Contracts
The Funds purchase and write call and put options. An option contract purchased by a Fund gives the Fund the right, but not the obligation, to buy (call) or sell (put) an underlying instrument at a fixed exercise price during a specified period. Call options written by a Fund give the holder the right to buy the underlying instrument from the Fund at a fixed exercise price; put options written by a Fund give the holder the right to sell the underlying instrument to the Fund at a fixed exercise price. The Funds may use options to hedge against changes in values of securities or currencies it owns or expects to own, to gain or to maintain exposure to interest rates, currencies or broad equity markets, to generate additional income or to enhance returns.
Options trading involve certain additional risks. Specific market movements of the option and the instruments underlying the option cannot be predicted. No assurance can be given that a liquid secondary market will exist for any particular option or at any particular time. A Fund might not be able to enter into a closing transaction for the option as a result of an illiquid market for the option. To realize any profit in the case of an option, therefore, the option holder would need to exercise the option and comply with margin requirements for the underlying instrument. A writer could not terminate the obligation until the option expired or the
230
Blackstone Alternative Investment Funds and Subsidiaries
Notes to Consolidated Financial Statements (Continued)
For the Year Ended March 31, 2016
writer was assigned an exercise notice. The purchaser of an option is subject to the risk of losing the entire purchase price of the option. The writer of an option is subject to the risk of loss resulting from the difference between the premium received for the option and the price of the futures contract underlying the option that the writer must purchase or deliver upon exercise of the option. The writer of a naked option may have to purchase the underlying contract in the market for substantially more than the exercise price of the option in order to satisfy his delivery obligations. This could result in a large net loss.
Equity, foreign currency or index options that may be purchased or sold by the Funds may include options not traded on a securities exchange. The risk of nonperformance by the counterparty on such option may be greater and the ability of a Fund to enter into a closing transaction with respect to such option may be less than in the case of an exchange traded option.
Purchases of put and call options are recorded as investments, the value of which are marked-to-market daily. When a purchased option expires without being exercised, the Fund will realize a loss equal to the premium paid. When a Fund enters into a closing sale transaction, the Fund will realize a gain or loss depending on whether the sales proceeds from the closing sale transaction are greater or less than the premium initially paid for the option. When a Fund exercises a put option, it will realize a gain or loss from the sale of the underlying instrument and the proceeds from such sale will be decreased by the premium originally paid for the put option. When a Fund exercises a call option, the cost of the security which the Fund purchases upon exercise will be increased by the premium originally paid for the call option. Realized gains and losses on purchased options are included in realized gains and losses on investments.
The premium received for a written option is recorded as an asset and an equivalent liability. The liability is marked-to-market daily in accordance with the option’s valuation policy. When a written option expires without being exercised or a Fund enters into a closing purchase transaction, the Fund realizes a gain (or loss if the cost of the closing purchase transaction exceeds the premium received when the option was sold) without regard to any unrealized gain or loss on the underlying instrument and the liability related to such option is eliminated. When a written call option is exercised, the Fund realizes a gain or loss, as adjusted for the premium received, from the sale of the underlying instrument. When a written put option is exercised, the premium received is offset against the amount paid for the purchase of the underlying instrument.
Options Written
Each Fund’s transactions in written call and put options during the year ended March 31, 2016 were as follows:
Multi-Manager Fund
| Calls | Puts | |||||||||||||||||||||||||||||
| Contracts | Notional | Premiums | Contracts | Notional | Premiums | |||||||||||||||||||||||||
Options Outstanding, March 31, 2015 | 2,634 | 50,315,600 | $ | 1,210,896 | 525,564 | 7,285,400 | $ | 853,569 | ||||||||||||||||||||||
Options written | 631,173 | 6,674,400 | 4,260,456 | 40,980,310 | — | 6,331,980 | ||||||||||||||||||||||||
Options bought back | (599,863 | ) | (56,990,000 | ) | (3,087,091 | ) | (40,634,384 | ) | (7,285,400 | ) | (4,616,649 | ) | ||||||||||||||||||
Options expired | (33,758 | ) | — | (2,358,442 | ) | (857,381 | ) | — | (2,465,765 | ) | ||||||||||||||||||||
|
|
|
|
|
|
|
|
|
|
|
| |||||||||||||||||||
Options Outstanding, March 31, 2016 | 186 | — | $ | 25,819 | 14,109 | — | $ | 103,135 | ||||||||||||||||||||||
|
|
|
|
|
|
|
|
|
|
|
| |||||||||||||||||||
231
Blackstone Alternative Investment Funds and Subsidiaries
Notes to Consolidated Financial Statements (Continued)
For the Year Ended March 31, 2016
Multi-Strategy Fund
| Calls | Puts | |||||||||||||||||||||||||||||
| Contracts | Notional | Premiums | Contracts | Notional | Premiums | |||||||||||||||||||||||||
Options Outstanding, March 31, 2015 | 2,015 | 10,960,000 | $ | 543,384 | 448,893 | 3,170,000 | $ | 552,105 | ||||||||||||||||||||||
Options written | 2,011,683 | 17,700,000 | 9,153,398 | 108,891,826 | — | 14,947,466 | ||||||||||||||||||||||||
Options bought back | (1,927,249 | ) | (28,660,000 | ) | (5,219,602 | ) | (1,904,255 | ) | (3,170,000 | ) | (8,778,324 | ) | ||||||||||||||||||
Options expired | (83,663 | ) | — | (4,110,400 | ) | (106,725,201 | ) | — | (4,742,747 | ) | ||||||||||||||||||||
|
|
|
|
|
|
|
|
|
|
|
| |||||||||||||||||||
Options Outstanding, March 31, 2016 | 2,786 | — | $ | 366,780 | 711,263 | — | $ | 1,978,500 | ||||||||||||||||||||||
|
|
|
|
|
|
|
|
|
|
|
| |||||||||||||||||||
Swap Agreements
The Funds may enter into total return, interest rate, and credit default swap agreements (“Swaps”). Swaps are bilaterally negotiated agreements between a Fund and a counterparty in which the Fund and counterparty agree to make either periodic net payments on a specified notional amount or a net payment upon termination. Swap agreements are privately negotiated in the OTC market or may be executed in a multilateral or other trade facility platform, such as a registered exchange (“centrally cleared swaps”). A Fund may enter into swap agreements for the purposes of managing exposure to interest rate, credit or market risk, or for other purposes. In connection with these agreements, securities or cash (“segregated cash” or “collateral”) may be paid or received, as applicable, by the Funds as collateral or margin in accordance with the terms of the respective swap agreements to provide assets of value and recourse in the event of default or bankruptcy/insolvency. Securities posted by a Fund as collateral for swaps are identified in the Consolidated Schedule of Investments and segregated cash, if any, is reflected on the Consolidated Statement of Assets and Liabilities.
Swap transactions involve, to varying degrees, elements of interest rate, credit and market risk in excess of the amounts recognized in the Consolidated Statement of Assets and Liabilities. Such risks involve the possibility that there will be no liquid market for these agreements, that the counterparty to the agreements may default on its obligation to perform, or that there may be unfavorable changes in market conditions or interest rates. In addition, entering into swap agreements involves documentation risk resulting from the possibility that the parties to a swap agreement may disagree as to the meaning of contractual terms in the agreement. A Fund’s maximum risk of loss from counterparty credit risk is the discounted value of the net cash flows to be received from the counterparty over the contract’s remaining life, to the extent that amount is positive, or the fair value of the contract. The risk may be mitigated by having a master netting arrangement between a Fund and the counterparty and by the posting of collateral by the counterparty to cover the Fund’s exposure to the counterparty. Counterparty risk related to centrally cleared swaps is mitigated due to the protection against defaults provided by the exchange on which these contracts trade.
Interest Rate Swaps: The Funds may enter into OTC and/or centrally cleared interest rate swap contracts to hedge interest rate risk, to gain exposure on interest rates and to hedge prepayment risk. The Funds are subject to interest rate risk exposure in the normal course of pursuing their investment objectives. The Funds may hold fixed rate bonds, and the value of these bonds may decrease if interest rates rise. Interest rate swaps are agreements in which one party pays a stream of interest payments, either fixed or floating rate, for another party’s stream of interest payments, either fixed or floating, on the same notional amount for a specified period of time. A Fund’s maximum risk of loss from counterparty credit risk, as opposed to investment and other types of risk, in respect of interest rate swaps is typically the discounted net value of the cash flows to be received from the counterparty over the contracts remaining life, to the extent that amount is positive.
232
Blackstone Alternative Investment Funds and Subsidiaries
Notes to Consolidated Financial Statements (Continued)
For the Year Ended March 31, 2016
Interest rate swaps can be purchased or sold with an upfront premium. An upfront payment received by a Fund is recorded as a liability on the Fund’s Consolidated Statement of Assets and Liabilities and an upfront payment made by a Fund is recorded as an asset on the Consolidated Statement of Assets and Liabilities. Interest rate swaps are marked-to-market daily and any change is recorded as an unrealized gain or loss on swaps. Daily fluctuations in the value of centrally cleared interest rate swaps are recorded as a receivable or payable for variation margin on the Fund’s Consolidated Statement of Assets and Liabilities. Payments, including upfront premiums, received or made are recorded as realized gains or losses at the closing of the contract.
Total Return Swaps: The Funds may enter into total return swap agreements to obtain exposure to a security, index or market without owning such security or investing directly in that security, index or market or to transfer the risk/return of one market (e.g., fixed income) to another market (e.g., equity) (equity risk and/or interest rate risk). Total return swaps are agreements in which one party agrees to make periodic payments to another party based on the change in market value of the underlying instrument, which may include a specified security, index, basket of securities or securities indices during the specific period, in return for periodic payments based on a fixed or floating rate or the total return from other underlying assets. To the extent the total return of the instrument underlying the transaction exceeds or falls short of the offsetting interest rate obligation, a Fund will receive a payment from or make a payment to the counterparty. Total return swaps can also be structured without an interest payment, so that one party pays the other party if the value of the underlying instrument increases and receives payment from the other party if the value of the underlying asset decreases.
Credit Default Swaps: The Funds may enter into OTC and/or centrally cleared credit default swap contracts to hedge credit risk, to hedge market risk, or to gain exposure on single-name issues and/or baskets of securities.
In a credit default swap contract, the protection buyer typically makes an upfront payment and a periodic stream of payments to a counterparty, the protection seller, in exchange for the right to receive a contingent payment upon the occurrence of a credit event on the reference obligation or all other equally ranked obligations of the reference entity. Credit events are contract specific but may include bankruptcy, failure to pay, restructurings and obligation acceleration. An upfront payment received by a Fund or made by a Fund is recorded as a liability or asset, respectively, in the Consolidated Statement of Assets and Liabilities. Periodic payments received or paid by a Fund are recorded as realized gains or losses. Credit default swap contracts are marked-to-market daily and the change is recorded as an unrealized gain or loss on swaps. Upon the occurrence of a credit event, the difference between the par value and the market value of the reference obligation, net of any proportional amount of upfront payment, is recorded as a realized gain or loss on swaps.
Interest rate swaps, total return swaps and credit default swaps outstanding at period end are listed after the Funds’ Consolidated Schedule of Investments.
233
Blackstone Alternative Investment Funds and Subsidiaries
Notes to Consolidated Financial Statements (Continued)
For the Year Ended March 31, 2016
At March 31, 2016, the Multi-Manager Fund had the following derivative financial instruments, presented on a gross basis and categorized by risk exposure:
Multi-Manager Fund
Asset Derivatives | Liability Derivatives | |||||||||||
Risk Exposure | Consolidated Statement of | Fair Value | Consolidated Statement of | Fair Value | ||||||||
Interest Rate | Centrally cleared swaps, at fair value (b) | $ | — | Centrally cleared swaps, at fair value (b) | $ | — | ||||||
| Unrealized appreciation on futures contracts (b) | 261,409 | Unrealized depreciation on futures contracts (b) | (328,485 | ) | ||||||||
Equity | Swap contracts, at fair value (a) | 521,341 | Swap contracts, at fair value (a) | (572,989 | ) | |||||||
| Unrealized appreciation on futures contracts (b) | 795,652 | Unrealized depreciation on futures contracts (b) | (1,049,979 | ) | ||||||||
| Purchased options, at fair value (c) | 662,963 | Options written, at value | (102,590 | ) | ||||||||
Commodity | Unrealized appreciation on futures contracts (b) | 132,584 | Unrealized depreciation on futures contracts (b) | (458,610 | ) | |||||||
Credit | Swap contracts, at fair value (a) | — | Swap contracts, at fair value (a) | — | ||||||||
| Centrally cleared swaps, at fair value (b) | — | Centrally cleared swaps, at fair value (b) | (125,552 | ) | ||||||||
Foreign Exchange | Unrealized appreciation on forward foreign currency exchange contracts | 1,673,134 | Unrealized depreciation on forward foreign currency exchange contracts | (2,120,731 | ) | |||||||
| Unrealized appreciation on futures contracts (b) | 143,734 | Unrealized depreciation on futures contracts (b) | (230,923 | ) | ||||||||
|
|
|
| |||||||||
Total | $ | 4,190,817 | $ | (4,989,859 | ) | |||||||
|
|
|
| |||||||||
Amounts not subject to MNA(1) | (1,867,813 | ) | 2,579,823 | |||||||||
|
|
|
| |||||||||
Total gross amounts subject to MNA | $ | 2,323,004 | $ | (2,410,036 | ) | |||||||
|
|
|
| |||||||||
| (1) | See below for disclosure of financial instruments assets and liabilities subject to offset enforceable master netting arrangements. |
234
Blackstone Alternative Investment Funds and Subsidiaries
Notes to Consolidated Financial Statements (Continued)
For the Year Ended March 31, 2016
The following tables present information about the amount of net realized gain (loss) and net unrealized appreciation (depreciation) on derivative financial instruments for the year ended March 31, 2016:
Consolidated | Average Notional USD(1) | Commodity | Interest | Credit | Equity | Foreign Exchange | Total | ||||||||||||||||||||||||||||
Swap contracts | $ | 521,754,402 | $ | — | $ | (208,339 | ) | $ | 380,794 | $ | 418,130 | $ | — | $ | 590,585 | ||||||||||||||||||||
Future contracts | 968,108,417 | (2,078,383 | ) | (3,830,208 | ) | — | 25,334,344 | 1,754,439 | 21,180,192 | ||||||||||||||||||||||||||
Purchased options (c),(d) | 41,840,924 | — | — | — | (18,542,353 | ) | 60,974 | (18,481,379 | ) | ||||||||||||||||||||||||||
Options Written (e) | 47,900,800 | — | — | — | 6,595,045 | 116,141 | 6,711,186 | ||||||||||||||||||||||||||||
Forward foreign currency exchange contracts | 508,398,419 | — | — | — | — | (405,288 | ) | (405,288 | ) | ||||||||||||||||||||||||||
|
|
|
|
|
|
|
|
|
|
|
| ||||||||||||||||||||||||
| $ | (2,078,383 | ) | $ | (4,038,547 | ) | $ | 380,794 | $ | 13,805,166 | $ | 1,526,266 | $ | 9,595,296 | ||||||||||||||||||||||
|
|
|
|
|
|
|
|
|
|
|
| ||||||||||||||||||||||||
| (1) | Averages are generally based on monthly activity levels during the year ended March 31, 2016. |
Consolidated Statement of | Commodity | Interest Rate | Credit | Equity | Foreign Exchange | Total | ||||||||||||||||||||||||
Swap contracts (b) | $ | — | $ | 507,546 | $ | (230,013 | ) | $ | (922,863 | ) | $ | — | $ | (645,330 | ) | |||||||||||||||
Future contracts (b) | (510,096 | ) | (63,748 | ) | — | (1,072,632 | ) | (87,189 | ) | (1,733,665 | ) | |||||||||||||||||||
Purchased options (c) | — | — | — | 332,637 | (434,321 | ) | (101,684 | ) | ||||||||||||||||||||||
Options Written | — | — | — | (132,698 | ) | 151,895 | 19,197 | |||||||||||||||||||||||
Forward foreign currency exchange contracts | — | — | — | — | (1,508,659 | ) | (1,508,659 | ) | ||||||||||||||||||||||
|
|
|
|
|
|
|
|
|
|
|
| |||||||||||||||||||
| $ | (510,096 | ) | $ | 443,798 | $ | (230,013 | ) | $ | (1,795,556 | ) | $ | (1,878,274 | ) | $ | (3,970,141 | ) | ||||||||||||||
|
|
|
|
|
|
|
|
|
|
|
| |||||||||||||||||||
At March 31, 2016, the Multi-Strategy Fund had the following derivative financial instruments, presented on a gross basis and categorized by risk exposure:
Multi-Strategy Fund
Asset Derivatives | Liability Derivatives | |||||||||||
Risk Exposure | Consolidated Statement of | Fair Value | Consolidated Statement of | Fair Value | ||||||||
Interest Rate | Centrally cleared swaps, at fair value (b) | $ | — | Centrally cleared swaps, at fair value (b) | $ | (3,913,106 | ) | |||||
| Unrealized appreciation on futures contracts (b) | 3,509,971 | Unrealized depreciation on futures contracts (b) | (3,533,714 | ) | ||||||||
Equity | Swap contracts, at fair value (a) | 21,176,273 | Swap contracts, at fair value (a) | (13,872,901 | ) | |||||||
| Unrealized appreciation on futures contracts (b) | 10,194,630 | Unrealized depreciation on futures contracts (b) | (15,355,676 | ) | ||||||||
| Purchased options, at fair value (c) | 11,514,405 | Options written, at value | (1,635,953 | ) | ||||||||
235
Blackstone Alternative Investment Funds and Subsidiaries
Notes to Consolidated Financial Statements (Continued)
For the Year Ended March 31, 2016
Asset Derivatives | Liability Derivatives | |||||||||||
Risk Exposure | Consolidated Statement of | Fair Value | Consolidated Statement of | Fair Value | ||||||||
Commodity | Unrealized appreciation on futures contracts (b) | $ | 2,411,779 | Unrealized depreciation on futures contracts (b) | $ | (5,840,607 | ) | |||||
Credit | Swap contracts, at fair value (a) | 9,847,382 | Swap contracts, at fair value (a) | (5,597,617 | ) | |||||||
| Centrally cleared swaps, at fair value (b) | 5,284,932 | Centrally cleared swaps, at fair value (b) | (1,012,002 | ) | ||||||||
Foreign Exchange | Unrealized appreciation on forward foreign currency exchange contracts | 9,880,994 | Unrealized depreciation on forward foreign currency exchange contracts | (17,863,197 | ) | |||||||
| Unrealized appreciation on futures contracts (b) | 716,977 | Unrealized depreciation on futures contracts (b) | (1,095,201 | ) | ||||||||
|
|
|
| |||||||||
Total | $ | 74,537,343 | $ | (69,719,974 | ) | |||||||
|
|
|
| |||||||||
Amounts not subject to MNA(1) | (29,872,196 | ) | 34,232,906 | |||||||||
|
|
|
| |||||||||
Total gross amounts subject to MNA | $ | 44,665,147 | $ | (35,487,068 | ) | |||||||
|
|
|
| |||||||||
| (1) | See below for disclosure of financial instruments assets and liabilities subject to offset enforceable master netting arrangements. |
The following tables present information about the amount of net realized gain (loss) and net unrealized appreciation (depreciation) on derivative financial instruments for the year ended March 31, 2016:
Consolidated | Average Notional USD(1) | Commodity | Interest Rate | Credit | Equity | Foreign Exchange | Total | ||||||||||||||||||||||||||||
Swap contracts | $ | 1,131,017,799 | $ | — | $ | (1,241,143 | ) | $ | 2,373,921 | $ | (23,803,980 | ) | $ | — | $ | (22,671,202 | ) | ||||||||||||||||||
Future contracts | 2,258,737,995 | (3,350,395 | ) | (8,032,640 | ) | — | 45,917,879 | 3,503,427 | 38,038,271 | ||||||||||||||||||||||||||
Purchased options (c),(d) | 11,151,574 | — | — | — | (37,919,662 | ) | (38,245 | ) | (37,957,907 | ) | |||||||||||||||||||||||||
Options Written (e) | 13,764,000 | — | — | — | 10,760,711 | 26,731 | 10,787,442 | ||||||||||||||||||||||||||||
Forward foreign currency exchange contracts | 1,113,797,292 | — | — | — | — | (10,880,138 | ) | (10,880,138 | ) | ||||||||||||||||||||||||||
|
|
|
|
|
|
|
|
|
|
|
| ||||||||||||||||||||||||
| $ | (3,350,395 | ) | $ | (9,273,783 | ) | $ | 2,373,921 | $ | (5,045,052 | ) | $ | (7,388,225 | ) | $ | (22,683,534 | ) | |||||||||||||||||||
|
|
|
|
|
|
|
|
|
|
|
| ||||||||||||||||||||||||
| (1) | Averages are generally based on monthly activity levels during the year ended March 31, 2016. |
236
Blackstone Alternative Investment Funds and Subsidiaries
Notes to Consolidated Financial Statements (Continued)
For the Year Ended March 31, 2016
Consolidated Statement of | Commodity | Interest Rate | Credit | Equity | Foreign Exchange | Total | ||||||||||||||||||||||||
Swap contracts (b) | $ | — | $ | (3,573,489 | ) | $ | 217,246 | $ | 7,265,762 | $ | — | $ | 3,909,519 | |||||||||||||||||
Future contracts (b) | (3,649,531 | ) | (175,403 | ) | — | (5,767,513 | ) | (378,224 | ) | (9,970,671 | ) | |||||||||||||||||||
Purchased options (c) | — | — | — | (1,474,074 | ) | (28,280 | ) | (1,502,354 | ) | |||||||||||||||||||||
Options Written | — | — | — | 578,526 | (59,790 | ) | 518,736 | |||||||||||||||||||||||
Forward foreign currency exchange contracts | — | — | — | — | (8,699,686 | ) | (8,699,686 | ) | ||||||||||||||||||||||
|
|
|
|
|
|
|
|
|
|
|
| |||||||||||||||||||
| $ | (3,649,531 | ) | $ | (3,748,892 | ) | $ | 217,246 | $ | 602,701 | $ | (9,165,980 | ) | $ | (15,744,456 | ) | |||||||||||||||
|
|
|
|
|
|
|
|
|
|
|
| |||||||||||||||||||
| (a) | Includes swap contracts premium paid/received and unrealized appreciation/depreciation on swap contracts. |
| (b) | Includes unrealized appreciation/depreciation of futures contracts and centrally cleared swaps as reported in the Notes to Consolidated Schedule of Investments. Only the current day’s variation margin is reported within the Consolidated Statement of Assets and Liabilities. |
| (c) | Includes options purchased that are part of investments in securities as shown in the Consolidated Statement of Assets and Liabilities and net realized gain (loss) on investments in securities and net unrealized appreciation (depreciation) on investments in securities as shown in the Consolidated Statement of Operations. |
| (d) | The notional of FX OTC options purchased is disclosed above. Additionally, the average number of Exchange-Traded Options and other OTC options purchased for Multi-Manager Fund and Multi-Strategy Fund were contracts of approximately 21,145,979 and 41,427,897, respectively, for the year ended March 31, 2016. |
| (e) | The notional of FX OTC options written is disclosed above. Additionally, the average number of Exchange-Traded Options and other OTC options written for Multi-Manager Fund and Multi-Strategy Fund were contracts of approximately 6,998,858 and 18,306,411, respectively, for the year ended March 31, 2016. |
Netting Arrangements
The Funds use master netting arrangements, which allow certain derivative financial instruments and collateral with the same counterparty to be offset to minimize counterparty credit exposure.
237
Blackstone Alternative Investment Funds and Subsidiaries
Notes to Consolidated Financial Statements (Continued)
For the Year Ended March 31, 2016
Multi-Manager Fund
The following table represents the Multi-Manager Fund’s derivative financial instrument assets and liabilities by counterparty net of amounts available for offset under an MNA and net of related collateral received/pledged by the Multi-Manager Fund as of March 31, 2016:
| Gross Amounts Not Offset in the Consolidated Statement of Assets and Liabilities | |||||||||||||||||||||||||
Gross Amounts of | Derivative | Cash | Non-Cash | Net | |||||||||||||||||||||
By Counterparty(1) | |||||||||||||||||||||||||
Bank of America, N.A. | $ | 2,218 | $ | — | $ | — | $ | — | $ | 2,218 | |||||||||||||||
Credit Suisse International | 78,696 | — | — | — | 78,696 | ||||||||||||||||||||
Credit Suisse Securities (Europe) Limited | 47,366 | (2,044 | ) | (45,322 | ) | — | — | ||||||||||||||||||
Deutsche Bank AG | 118,878 | — | (118,878 | ) | — | — | |||||||||||||||||||
Morgan Stanley & Co. International plc | 80,610 | (11,880 | ) | — | — | 68,730 | |||||||||||||||||||
Cayman Subsidiary | |||||||||||||||||||||||||
State Street Bank and Trust Company | 1,519,296 | (1,519,296 | ) | — | — | — | |||||||||||||||||||
Domestic Subsidiary III | |||||||||||||||||||||||||
Credit Suisse Securities (Europe) Limited | 404,616 | (373,976 | ) | — | — | 30,640 | |||||||||||||||||||
State Street Bank and Trust Company | 1,965 | (1,965 | ) | — | — | — | |||||||||||||||||||
Domestic Subsidiary IV | |||||||||||||||||||||||||
Morgan Stanley Capital Services LLC | 69,359 | (46,424 | ) | (14,189 | ) | — | 8,746 | ||||||||||||||||||
|
|
|
|
|
|
|
|
|
| ||||||||||||||||
Total | $ | 2,323,004 | $ | (1,955,585 | ) | $ | (178,389 | ) | $ | — | $ | 189,030 | |||||||||||||
|
|
|
|
|
|
|
|
|
| ||||||||||||||||
238
Blackstone Alternative Investment Funds and Subsidiaries
Notes to Consolidated Financial Statements (Continued)
For the Year Ended March 31, 2016
| Gross Amounts Not Offset in the Consolidated Statement of Assets and Liabilities | |||||||||||||||||||||||||
Gross Amounts of | Derivative | Cash | Non-Cash | Net | |||||||||||||||||||||
By Counterparty (1) | |||||||||||||||||||||||||
Credit Suisse Securities (Europe) Limited | $ | (2,044 | ) | $ | 2,044 | $ | — | $ | — | $ | — | ||||||||||||||
Morgan Stanley & Co. International plc | (11,880 | ) | 11,880 | — | — | — | |||||||||||||||||||
Cayman Subsidiary | |||||||||||||||||||||||||
Morgan Stanley Capital Services LLC | (150,545 | ) | — | 150,545 | — | — | |||||||||||||||||||
State Street Bank and Trust Company | (1,790,729 | ) | 1,519,296 | 271,433 | — | — | |||||||||||||||||||
Domestic Subsidiary III | |||||||||||||||||||||||||
Credit Suisse Securities (Europe) Limited | (373,976 | ) | 373,976 | — | — | — | |||||||||||||||||||
State Street Bank and Trust Company | (34,438 | ) | 1,965 | — | — | (32,473 | ) | ||||||||||||||||||
Domestic Subsidiary IV | |||||||||||||||||||||||||
Morgan Stanley Capital Services LLC | (46,424 | ) | 46,424 | — | — | — | |||||||||||||||||||
|
|
|
|
|
|
|
|
|
| ||||||||||||||||
Total | $ | (2,410,036 | ) | $ | 1,955,585 | $ | 421,978 | $ | — | $ | (32,473 | ) | |||||||||||||
|
|
|
|
|
|
|
|
|
| ||||||||||||||||
239
Blackstone Alternative Investment Funds and Subsidiaries
Notes to Consolidated Financial Statements (Continued)
For the Year Ended March 31, 2016
Multi-Strategy Fund
The following table represents the Multi-Strategy Fund’s derivative financial instrument assets and liabilities by counterparty net of amounts available for offset under an MNA and net of related collateral received/pledged by the Multi-Strategy Fund as of March 31, 2016:
| Gross Amounts Not Offset in the Consolidated Statement of Assets and Liabilities | |||||||||||||||||||||||||
Gross Amounts of | Derivative | Cash | Non-Cash | Net | |||||||||||||||||||||
By Counterparty (1) | |||||||||||||||||||||||||
Bank of America, N.A. | $ | 38,940 | $ | — | $ | — | $ | — | $ | 38,940 | |||||||||||||||
Credit Suisse International | 2,503,361 | (431,587 | ) | (1,130,000 | ) | — | 941,774 | ||||||||||||||||||
Credit Suisse Securities (Europe) Limited | 4,329,900 | (1,632,320 | ) | — | — | 2,697,580 | |||||||||||||||||||
Deutsche Bank AG | 2,562,305 | — | (2,139,673 | ) | — | 422,632 | |||||||||||||||||||
JPMorgan Chase Bank, N.A. | 7,230,027 | (202,292 | ) | (1,162,865 | ) | — | 5,864,870 | ||||||||||||||||||
Morgan Stanley & Co. International plc | 1,522,930 | (200,162 | ) | — | — | 1,322,768 | |||||||||||||||||||
Morgan Stanley Capital Services LLC | 8,693,306 | (6,359,505 | ) | — | — | 2,333,801 | |||||||||||||||||||
Cayman Subsidiary | |||||||||||||||||||||||||
State Street Bank and Trust Company | 7,676,508 | (7,676,508 | ) | — | — | — | |||||||||||||||||||
Domestic Subsidiary III | |||||||||||||||||||||||||
Credit Suisse Securities (Europe) Limited | 9,387,793 | (8,334,139 | ) | — | — | 1,053,654 | |||||||||||||||||||
JPMorgan Chase Bank, N.A. | 18,325 | — | — | — | 18,325 | ||||||||||||||||||||
State Street Bank and Trust Company | 15,272 | (15,272 | ) | — | — | — | |||||||||||||||||||
Domestic Subsidiary IV | |||||||||||||||||||||||||
Morgan Stanley Capital Services LLC | 686,480 | (477,668 | ) | (208,812 | ) | — | — | ||||||||||||||||||
|
|
|
|
|
|
|
|
|
| ||||||||||||||||
Total | $ | 44,665,147 | $ | (25,329,453 | ) | $ | (4,641,350 | ) | $ | — | $ | 14,694,344 | |||||||||||||
|
|
|
|
|
|
|
|
|
| ||||||||||||||||
240
Blackstone Alternative Investment Funds and Subsidiaries
Notes to Consolidated Financial Statements (Continued)
For the Year Ended March 31, 2016
| Gross Amounts Not Offset in the Consolidated Statement of Assets and Liabilities | |||||||||||||||||||||||||
Gross Amounts of | Derivative | Cash | Non-Cash | Net | |||||||||||||||||||||
By Counterparty (1) | |||||||||||||||||||||||||
Credit Suisse International | $ | (431,587 | ) | $ | 431,587 | $ | — | $ | — | $ | — | ||||||||||||||
Credit Suisse Securities (Europe) Limited | (1,632,320 | ) | 1,632,320 | — | — | — | |||||||||||||||||||
JPMorgan Chase Bank, N.A. | (202,292 | ) | 202,292 | — | — | — | |||||||||||||||||||
Morgan Stanley & Co. International plc | (200,162 | ) | 200,162 | — | — | — | |||||||||||||||||||
Morgan Stanley Capital Services LLC | (6,359,505 | ) | 6,359,505 | — | — | — | |||||||||||||||||||
Cayman Subsidiary | |||||||||||||||||||||||||
Credit Suisse International | (2,116,228 | ) | — | 2,116,228 | — | — | |||||||||||||||||||
Morgan Stanley Capital Services LLC | (1,948,271 | ) | — | 1,948,271 | — | — | |||||||||||||||||||
State Street Bank and Trust Company | (10,615,571 | ) | 7,676,508 | 2,490,000 | — | (449,063 | ) | ||||||||||||||||||
Domestic Subsidiary III | |||||||||||||||||||||||||
Credit Suisse International | (2,102,905 | ) | — | 2,102,905 | — | — | |||||||||||||||||||
Credit Suisse Securities (Europe) Limited | (8,334,139 | ) | 8,334,139 | — | — | — | |||||||||||||||||||
State Street Bank and Trust Company | (1,030,622 | ) | 15,272 | 710,000 | — | (305,350 | ) | ||||||||||||||||||
Domestic Subsidiary IV | |||||||||||||||||||||||||
Morgan Stanley Capital Services LLC | (477,668 | ) | 477,668 | — | — | — | |||||||||||||||||||
State Street Bank and Trust Company | (35,798 | ) | — | — | — | (35,798 | ) | ||||||||||||||||||
|
|
|
|
|
|
|
|
|
| ||||||||||||||||
Total | $ | (35,487,068 | ) | $ | 25,329,453 | $ | 9,367,404 | $ | — | $ | (790,211 | ) | |||||||||||||
|
|
|
|
|
|
|
|
|
| ||||||||||||||||
| (1) | The Fund and each Subsidiary are subject to separate MNA’s with each individual counterparty. |
| (2) | Net amount represents the net amount receivable from the counterparty in the event of default. |
| (3) | Net amount represents the net amount payable to the individual counterparty in the event of default. |
| (4) | Additional required collateral received from the individual counterparty is not shown for financial reporting purposes. |
| (5) | Additional required collateral pledged to the individual counterparty is not shown for financial reporting purposes. |
241
Blackstone Alternative Investment Funds and Subsidiaries
Notes to Consolidated Financial Statements (Continued)
For the Year Ended March 31, 2016
5. Fair Value Measurements
The following table presents information about the classification of each Fund’s investments measured at fair value within the fair value hierarchy as of March 31, 2016.
Multi-Manager Fund
| Assets: | Level 1 | Level 2 | Level 3 | Total | ||||||||||||||||
Investments in Securities: | ||||||||||||||||||||
Common Stock | $ | 103,827,697 | $ | — | $ | — | $ | 103,827,697 | ||||||||||||
Asset-Backed Securities | — | 959,440 | — | 959,440 | ||||||||||||||||
Convertible Bond | — | 1,328,680 | — | 1,328,680 | ||||||||||||||||
Bank Loans | — | 10,318,933 | 326,210 | 10,645,143 | ||||||||||||||||
Corporate Bonds & Notes | — | 2,150,965 | — | 2,150,965 | ||||||||||||||||
Mortgage-Backed Securities | — | 19,495,939 | — | 19,495,939 | ||||||||||||||||
Exchange-Traded Funds | 110,323 | — | — | 110,323 | ||||||||||||||||
Rights | 2,170 | — | — | 2,170 | ||||||||||||||||
Purchased Options | 382,561 | 280,402 | — | 662,963 | ||||||||||||||||
Short-Term Investment – Money Market Fund | 38,128,134 | — | — | 38,128,134 | ||||||||||||||||
Total Investments in Securities | $ | 142,450,885 | $ | 34,534,359 | $ | 326,210 | $ | 177,311,454 | ||||||||||||
Forward Foreign Currency Exchange Contracts | — | 1,673,134 | — | 1,673,134 | ||||||||||||||||
Futures Contracts | 1,333,379 | — | — | 1,333,379 | ||||||||||||||||
OTC Total Return Swaps | — | 521,341 | — | 521,341 | ||||||||||||||||
Total Assets | $ | 143,784,264 | $ | 36,728,834 | $ | 326,210 | $ | 180,839,308 | ||||||||||||
| Liabilities: | Level 1 | Level 2 | Level 3 | Total | ||||||||||||||||
Securities Sold Short | $ | 75,772,554 | $ | — | $ | — | $ | 75,772,554 | ||||||||||||
Options Written | 90,710 | 11,880 | — | 102,590 | ||||||||||||||||
Reverse Repurchase Agreements | — | 4,652,534 | — | 4,652,534 | ||||||||||||||||
Securities Lending Collateral Payable | — | 23,898,259 | — | 23,898,259 | ||||||||||||||||
Forward Foreign Currency Exchange Contracts | — | 2,120,731 | — | 2,120,731 | ||||||||||||||||
Futures Contracts | 2,067,997 | — | — | 2,067,997 | ||||||||||||||||
Centrally Cleared Credit Default Swaps | — | 125,552 | — | 125,552 | ||||||||||||||||
OTC Total Return Swaps | — | 572,989 | — | 572,989 | ||||||||||||||||
Total Liabilities | $ | 77,931,261 | $ | 31,381,945 | $ | — | $ | 109,313,206 | ||||||||||||
As a result of an amendment to fair value guidance, investments that are measured at fair value using NAV as a practical expedient have not been classified in the fair value hierarchy. The fair value amounts presented in this table are intended to permit reconciliation of the fair value hierarchy to the amounts presented in the Consolidated Schedule of Investments.
During the year ended March 31, 2016, the amount of transfers from Level 2 to Level 1 was $7,992,085 and $(1,425,346) for Common Stock and Securities Sold Short, respectively, as a result of the Fair Value Trigger. As of March 31, 2016, no Fair Value Factor was applied as price movements did not meet the Fair Value Trigger. For more detail on the fair value of foreign equity securities, please refer to the discussion of fair value measurements for exchange-traded securities in Note 3.
242
Blackstone Alternative Investment Funds and Subsidiaries
Notes to Consolidated Financial Statements (Continued)
For the Year Ended March 31, 2016
The Fund recognizes transfers within the fair value hierarchy as of the beginning of the period. Transfers into Level 3 were primarily related to a decrease in observable activity and inputs and transfers out of Level 3 were primarily related to an update to the valuation methodology that is based on observable inputs.
The changes in investments measured at fair value for which the Multi-Manager Fund used Level 3 inputs to determine fair value are as follows:
Multi-Manager Fund
Assets: Investment in Securities | Bank Loans | Mortgage- Backed Securities | Total | ||||||||||||
Balance as of March 31, 2015 | $ | — | $ | 11,930,962 | $ | 11,930,962 | |||||||||
Transfers In | 2,063,127 | — | 2,063,127 | ||||||||||||
Transfers Out | — | (11,930,962 | ) | (11,930,962 | ) | ||||||||||
Purchases | 175,282 | — | 175,282 | ||||||||||||
Sales | (30,108 | ) | — | (30,108 | ) | ||||||||||
Amortization | — | — | — | ||||||||||||
Net realized gain (loss) | — | — | — | ||||||||||||
Net change in unrealized appreciation (depreciation) | (1,882,091 | ) | — | (1,882,091 | ) | ||||||||||
|
|
|
|
|
| ||||||||||
Balance as of March 31, 2016 | $ | 326,210 | $ | — | $ | 326,210 | |||||||||
|
|
|
|
|
| ||||||||||
Net change in unrealized appreciation (depreciation) related to investments still held as of March 31, 2016 | $ | (1,882,091 | ) | $ | — | $ | (1,882,091 | ) | |||||||
|
|
|
|
|
| ||||||||||
The following table summarizes the quantitative inputs and assumptions used for investments in securities classified within Level 3 of the fair value hierarchy as of March 31, 2016.
Assets | Fair Value at | Valuation Technique | Unobservable Inputs | Range of inputs (Weighted | ||||||||||||||||
Bank Loans | $ | 326,210 | Broker-dealer Quotations | Indicative Bid | N/A | |||||||||||||||
243
Blackstone Alternative Investment Funds and Subsidiaries
Notes to Consolidated Financial Statements (Continued)
For the Year Ended March 31, 2016
Multi-Strategy Fund
| Assets: | Level 1 | Level 2 | Level 3 | Total | ||||||||||||||||
Investments in Securities: | ||||||||||||||||||||
Common Stock | $ | 1,550,124,985 | $ | — | $ | — | $ | 1,550,124,985 | ||||||||||||
Asset-Backed Securities | — | 373,572,274 | — | 373,572,274 | ||||||||||||||||
Convertible Bond | — | 13,184,595 | — | 13,184,595 | ||||||||||||||||
Bank Loans | — | 2,406,580 | 460,576 | 2,867,156 | ||||||||||||||||
Corporate Bonds & Notes | — | 227,386,794 | — | 227,386,794 | ||||||||||||||||
Sovereign Debt | — | 201,486,315 | — | 201,486,315 | ||||||||||||||||
Mortgage-Backed Securities | — | 877,126,725 | — | 877,126,725 | ||||||||||||||||
U.S. Government Sponsored Agency Securities | — | 24,585,249 | — | 24,585,249 | ||||||||||||||||
U.S. Treasury Obligations | — | 73,011,501 | — | 73,011,501 | ||||||||||||||||
Exchange-Traded Funds | 29,768,142 | — | — | 29,768,142 | ||||||||||||||||
Rights | 2,887 | — | — | 2,887 | ||||||||||||||||
Purchased Options | 6,925,314 | 4,589,091 | — | 11,514,405 | ||||||||||||||||
Short-Term Investment – Money Market Fund | 774,303,004 | — | — | 774,303,004 | ||||||||||||||||
Subtotal | $ | 2,361,124,332 | $ | 1,797,349,124 | $ | 460,576 | $ | 4,158,934,032 | ||||||||||||
Investments Valued at NAV | 123,836,256 | |||||||||||||||||||
Total Investments in Securities | $ | 4,282,770,288 | ||||||||||||||||||
Forward Foreign Currency Exchange Contracts | — | 9,880,994 | — | 9,880,994 | ||||||||||||||||
Futures Contracts | 16,833,357 | — | — | 16,833,357 | ||||||||||||||||
Centrally Cleared Credit Default Swaps | — | 5,284,932 | — | 5,284,932 | ||||||||||||||||
OTC Credit Default Swaps | — | 9,847,382 | — | 9,847,382 | ||||||||||||||||
OTC Total Return Swaps | — | 21,176,273 | — | 21,176,273 | ||||||||||||||||
Total Assets | $ | 2,377,957,689 | $ | 1,843,538,705 | $ | 460,576 | $ | 4,345,793,226 | ||||||||||||
| Liabilities: | Level 1 | Level 2 | Level 3 | Total | ||||||||||||||||
Securities Sold Short | $ | 1,102,322,460, | $ | 2,122,639 | $ | — | $ | 1,104,445,099 | ||||||||||||
Options Written | 1,435,791 | 200,162 | — | 1,635,953 | ||||||||||||||||
Reverse Repurchase Agreements | — | 207,381,307 | — | 207,381,307 | ||||||||||||||||
Securities Lending Collateral Payable | — | 120,918,878 | — | 120,918,878 | ||||||||||||||||
Forward Foreign Currency Exchange Contracts | — | 17,863,197 | — | 17,863,197 | ||||||||||||||||
Futures Contracts | 25,825,198 | — | — | 25,825,198 | ||||||||||||||||
Centrally Cleared Credit Default Swaps | — | 1,012,002 | — | 1,012,002 | ||||||||||||||||
OTC Credit Default Swaps | — | 5,597,617 | — | 5,597,617 | ||||||||||||||||
OTC Total Return Swaps | — | 13,872,901 | — | 13,872,901 | ||||||||||||||||
Centrally Cleared Interest Rate Swaps | — | 3,913,106 | — | 3,913,106 | ||||||||||||||||
Total Liabilities | $ | 1,129,583,449 | $ | 372,881,809 | $ | — | $ | 1,502,465,258 | ||||||||||||
244
Blackstone Alternative Investment Funds and Subsidiaries
Notes to Consolidated Financial Statements (Continued)
For the Year Ended March 31, 2016
As a result of an amendment to fair value guidance, investments that are measured at fair value using NAV as a practical expedient have not been classified in the fair value hierarchy. The fair value amounts presented in this table are intended to permit reconciliation of the fair value hierarchy to the amounts presented in the Consolidated Schedule of Investments.
During the year ended March 31, 2016, the amount of transfers from Level 2 to Level 1 was $24,509,411 and $(1,249,180) for Common Stock and Securities Sold Short, respectively, as a result of the Fair Value Trigger. As of March 31, 2016, no Fair Value Factor was applied as price movements did not meet the Fair Value Trigger. For more detail on the fair value of foreign equity securities, please refer to the discussion of fair value measurements for exchange-traded securities in Note 3.
The Fund recognizes transfers within the fair value hierarchy as of the beginning of the period. Transfers into Level 3 were primarily related to a decrease in observable activity and inputs and transfers out of Level 3 were primarily related to an update to the valuation methodology that is based on observable inputs.
The changes in investments measured at fair value for which the Multi-Strategy Fund used Level 3 inputs to determine fair value are as follows:
Multi-Strategy Fund
Assets: Investment in Securities | Bank Loans | Mortgage- Backed Securities | Total | ||||||||||||
Balance as of March 31, 2015 | $ | — | $ | 19,084,537 | $ | 19,084,537 | |||||||||
Transfers In | 825,713 | — | 825,713 | ||||||||||||
Transfers Out | — | (19,084,537 | ) | (19,084,537 | ) | ||||||||||
Purchases | 410,419 | — | 410,419 | ||||||||||||
Sales | (31,989 | ) | — | (31,989 | ) | ||||||||||
Amortization | 841 | — | 841 | ||||||||||||
Net realized gain (loss) | 2,253 | — | 2,253 | ||||||||||||
Net change in unrealized appreciation (depreciation) | (746,661 | ) | — | (746,661 | ) | ||||||||||
|
|
|
|
|
| ||||||||||
Balance as of March 31, 2016 | $ | 460,576 | $ | — | $ | 460,576 | |||||||||
|
|
|
|
|
| ||||||||||
Net change in unrealized appreciation (depreciation) related to investments still held as of March 31, 2016 | $ | (746,661 | ) | $ | — | $ | (746,661 | ) | |||||||
|
|
|
|
|
| ||||||||||
The following table summarizes the quantitative inputs and assumptions used for investments in securities classified within Level 3 of the fair value hierarchy as of March 31, 2016.
Assets | Fair Value at | Valuation Technique | Unobservable Inputs | Range of inputs (Weighted | ||||||||||||||||
Bank Loans | $ | 460,576 | Broker- dealer Quotations | Indicative Bid | N/A | |||||||||||||||
6. Purchase and Sale of Fund Shares
The Multi-Manager Fund currently offers Class I Shares and the Multi-Strategy Fund currently offers Class D Shares, Class I Shares, Class R Shares and Class Y Shares. For the year ended March 31, 2016, only Class D Shares, Class I Shares and Class Y Shares are outstanding.
245
Blackstone Alternative Investment Funds and Subsidiaries
Notes to Consolidated Financial Statements (Continued)
For the Year Ended March 31, 2016
Multi-Manager Fund Class I Shares are offered to investors who are clients of investment advisors, consultants, broker-dealers or other financial intermediaries who: (a) charge such clients fees for advisory, investment, consulting or similar services and (b) have entered into an agreement with Blackstone Advisory Partners L.P. (the “Distributor”) to offer shares. Multi-Manager Fund Class I Shares may also be offered for investment by personnel of the Investment Adviser, and as otherwise may be determined by the Board. Class I Shares of Multi-Manager Fund are held exclusively by a single financial advisor who holds shares on behalf of its clients.
Multi-Strategy Fund Class D Shares are offered primarily through broker-dealers and other financial intermediaries that have entered into an agreement with the Distributor for the use of the Multi-Strategy Fund in investment products, programs, or accounts such as mutual fund supermarkets or other no transaction fee platforms. Multi-Strategy Fund Class I Shares are offered to institutional investors (e.g. banks, insurance companies, corporations, and other financial institutions) and individual investors who are clients of financial intermediaries, broker-dealers, financial institutions or registered investment advisors that: (a) may charge such clients fees for advisory, investment, consulting or similar services and (b) have entered into an arrangement approved by the Distributor to provide certain administrative services to investors. Multi-Strategy Fund Class Y Shares are offered for institutional investors and individuals (including through individual retirement accounts) who purchase directly from the Fund. Class Y Shares of Multi-Strategy Fund may also be offered to employees, officers and directors/trustees of the Adviser, the Fund or their respective affiliates. Class Y Shares have no investment minimum requirements. Multi-Strategy Class R Shares do not have a minimum investment requirement and are generally available only to certain benefit plans.
Shares of the Funds may be purchased or redeemed each Business Day.
7. Investment Adviser Fees and Other Transactions with Affiliates
Management Fee
Pursuant to the investment management agreement between the Investment Adviser and the Trust, on behalf of the Funds, each Fund pays the Investment Adviser a management fee (the “Fund Management Fee”) at an annual rate based on each Fund’s average daily net assets, excluding the net assets of the applicable Subsidiaries. The Investment Adviser receives additional compensation at an annual rate based on each Subsidiary’s average daily net assets for providing management services to the Subsidiaries. For collective net assets of each Fund and the respective Subsidiaries up to $2.5 billion, the Fund Management Fee shall be 1.95% (annualized) and for collective net assets greater than or equal to $2.5 billion, the Fund Management Fee shall be 1.80% (annualized). During the year ended March 31, 2016, the Multi-Manager Fund paid the Investment Adviser $24,775,275 in management fees. From this amount, the Investment Adviser paid $12,595,664 in sub-advisory fees to non-affiliated Sub-Advisers with respect to the Multi-Manager Fund, which amounted to 1.00% of the Fund’s average daily net assets. The Investment Adviser also paid $727,675 in sub-advisory fees to Blackstone Senfina Advisors LLC (“Senfina”), a Sub-Adviser that, during the year ended March 31, 2016, was an affiliate of the Investment Adviser, with respect to the Multi-Manager Fund, which amounted to 0.06% of the Fund’s average daily net assets. During the year ended March 31, 2016, the Multi-Strategy Fund paid the Investment Adviser $54,840,602 in management fees. From this amount, the Investment Adviser paid $27,001,737 in sub-advisory fees to non-affiliated Sub-Advisers with respect to the Multi-Strategy Fund, which amounted to 0.94% of the Fund’s average daily net assets. The Investment Adviser also paid $1,267,874 in sub-advisory fees to Senfina with respect to the Multi-Strategy Fund, which amounted to 0.04% of the Fund’s average daily net assets.
246
Blackstone Alternative Investment Funds and Subsidiaries
Notes to Consolidated Financial Statements (Continued)
For the Year Ended March 31, 2016
Sub-Advisory Fees
Pursuant to the sub-advisory agreements between the Investment Adviser and the Sub-Advisers, the Sub-Advisers are compensated for the services they provide to the Funds by the Investment Adviser from the Management Fee received by the Investment Adviser.
Distribution and Service Fees
Pursuant to the amended and restated Distribution and Service Plan, Multi-Strategy Fund Class D Shares bear distribution and service fees at an annual rate of 0.25% of the average daily net assets of the Fund attributable to Class D Shares. Payments of the distribution and service fee may be made without regard to expenses actually incurred. Multi-Manager Fund Class I Shares and Multi-Strategy Fund Class I Shares, Class Y Shares and Class R Shares are not subject to distribution and service fees.
Expense Limitation and Reimbursement
The Investment Adviser has entered into an Expense Limitation and Reimbursement Agreement (the “Multi-Manager Fund Agreement”) with the Multi-Manager Fund to limit the amount of Specified Expenses (as defined below) of the Fund to 0.45% per annum of the Fund’s net assets (the “Multi-Manager Fund Total Expense Cap”). Specified Expenses include all expenses incurred by the Multi-Manager Fund with the exception of (i) the Management Fee, (ii) the distribution and service fees, (iii) acquired fund fees and expenses, (iv) brokerage and trading costs, (v) interest payments (including any interest expenses, commitment fees, or other expenses related to any line of credit of the Fund), (vi) taxes, (vii) dividends and interest on short positions, and (viii) extraordinary expenses (as determined in the sole discretion of BAIA) (together, the “Multi-Manager Fund Excluded Expenses”).
The Investment Adviser has also entered into an Expense Limitation and Reimbursement Agreement (the “Multi-Strategy Fund Agreement”) with the Multi-Strategy Fund to limit the amount of Specified Expenses (as defined below) of the Fund to 2.40% per annum of the Fund’s net assets for Class D Shares, Class I Shares and Class Y Shares and 2.55% per annum of the Fund’s net assets for Class R Shares (collectively, the “Multi-Strategy Total Expense Cap”). Specified Expenses include all expenses incurred by the Multi-Strategy Fund with the exception of (i) the distribution or service fees, (ii) acquired fund fees and expenses, (iii) brokerage and trading costs, (iv) interest payments (including any interest expenses, commitment fees, or other expenses related to any line of credit of the Fund), (v) taxes, (vi) dividends and interest on short positions, and (vii) extraordinary expenses (as determined in the sole discretion of BAIA) (together, the “Multi-Strategy Excluded Expenses”).
To the extent the estimated annualized specified expenses for any month exceeds the total expense cap, the Investment Adviser will waive its fees and/or make payments to the Funds for expenses to the extent necessary to eliminate such excess. The Investment Adviser may discontinue its obligations under the agreements at any time in its sole discretion after August 21, 2018 upon written notice to a Fund. The Funds have agreed to repay the amounts borne by the Investment Adviser under their respective agreements within the thirty-six month period after the Investment Adviser bears the expense, to the extent the estimated annualized Specified Expenses for a given month are less than the lower of the Total Expense Cap or any expense limitation agreement then in effect. The repayment may not raise the level of estimated annualized specified expenses in the month of repayment to exceed the total expense cap.
During the year ended March 31, 2016, repayments to the Investment Adviser were as follows:
Multi-Manager Fund - Class I | $ | 548,252 | |||
Multi-Strategy Fund - Class I | 1,226,650 | ||||
Multi-Strategy Fund - Class D | 2,288 | ||||
Multi-Strategy Fund - Class Y | 16,228 |
247
Blackstone Alternative Investment Funds and Subsidiaries
Notes to Consolidated Financial Statements (Continued)
For the Year Ended March 31, 2016
As of March 31, 2016, the repayments that potentially may be made by the Funds are as follows:
| Expenses subject to repayment until maximum expiration date of March 31, | |||||||||||||||
| 2017(a) | 2018(b) | 2019(c) | |||||||||||||
Multi-Manager Fund - Class I | $ | 1,965,653 | $ | — | $ | — | |||||||||
Multi-Strategy Fund - Class I(1) | N/A | — | — | ||||||||||||
Multi-Strategy Fund - Class D(2) | N/A | — | — | ||||||||||||
Multi-Strategy Fund - Class Y(3) | N/A | — | — | ||||||||||||
| (1) | Multi-Strategy Fund - Class I commenced operations on June 16, 2014. |
| (2) | Multi-Strategy Fund - Class D commenced operations on November 17, 2014. |
| (3) | Multi-Strategy Fund - Class Y commenced operations on January 28, 2015. |
| (a) | Expenses reimbursed in fiscal period ending March 31, 2014. |
| (b) | Expenses reimbursed in fiscal period ending March 31, 2015. |
| (c) | Expenses reimbursed in fiscal period ending March 31, 2016. |
Interfund Trades
The Funds may purchase from or sell securities to other affiliated Funds under procedures adopted by the Board. The procedures have been designed to ensure these interfund trades are executed in accordance with Rule 17a-7 of the 1940 Act. For the year ended March 31, 2016, these purchases and sales were as follows:
| Purchases | Sales | |||||||||
Multi-Manager Fund | $ | — | $ | 75,082,613 | ||||||
Multi-Strategy Fund | $ | 75,082,613 | $ | — | ||||||
8. Other Agreements
State Street Bank and Trust Company serves as the administrator, custodian and transfer agent to the Funds. Blackstone Advisory Partners L.P., an affiliate of the Investment Adviser, serves as the Funds’ distributor.
9. Financial Instruments and Off-Balance Sheet Risk
Market Risk: In the normal course of business, the Funds invest in securities and enters into transactions where risks exist due to fluctuations in the market (market risk) or failure of the other party to a transaction to perform (credit and counterparty risk). The value of securities held by the Funds may decline in response to certain events, including those directly involving the companies whose securities are owned by the Funds; conditions affecting the general economy; overall market changes; local, regional or global political, social or economic instability; and currency and interest rate and price fluctuations.
Credit and Counterparty Risk: The Funds may be exposed to counterparty risk, or the risk that an entity with which the Funds have unsettled or open transactions may default. The potential loss could exceed the value of the financial assets and liabilities recorded in the consolidated financial statements. Financial assets that potentially expose the Funds to credit and counterparty risk consist principally of cash due from counterparties and investments. The Funds manage counterparty risk by entering into agreements only with
248
Blackstone Alternative Investment Funds and Subsidiaries
Notes to Consolidated Financial Statements (Continued)
For the Year Ended March 31, 2016
counterparties that they believe have the financial resources to honor their obligations and by monitoring the financial stability of those counterparties. The Funds’ Investment Adviser attempts to mitigate counterparty risk by (i) periodically assessing the creditworthiness of its trading partners, (ii) monitoring and/or limiting the amount of its net exposure to each individual counterparty based on its assessment and (iii) requiring collateral from the counterparty for certain transactions. In order to preserve certain safeguards for non-standard settlement trades, the Funds restrict exposure to credit and counterparty losses by entering into master netting agreements with counterparties (approved brokers) with whom they undertake a significant volume of transactions. Collateral requirements may differ by type of derivative or investment, as applicable. Collateral or margin requirements are set by the broker or exchange clearing house for exchange traded derivatives (e.g., futures contracts and exchange traded options) while collateral terms are contract specific for OTC traded derivatives (e.g., forward foreign currency exchange contracts, swap agreements and OTC options). For derivatives traded under an ISDA Master Agreement or similar master agreement, the collateral requirements may be netted across all transactions traded under such agreement and certain counterparties may allow one amount to be posted from one party to the other to collateralized such obligations. The ISDA Master Agreement gives each party to the agreement the right to terminate all transactions traded under such agreement if there is a certain deterioration in the credit quality of the other party. The ISDA Master Agreement gives each Fund the right, upon an event of default by the applicable counterparty or a termination of the agreement, to close out all transactions traded under such agreement and may permit net amounts owed under each transaction to be netted to derive one net amount payable by one party to the other. This right to close out and net payments across all transactions traded under the ISDA Master Agreement could result in a reduction of the Fund’s credit risk to such counterparty equal to any amounts payable by the Fund under the applicable transactions, if any. The enforceability of the right to offset may vary by jurisdiction. Cash collateral that has been pledged to cover obligations of a Fund under derivative financial instrument contracts, if any, will be reported separately in the Consolidated Statement of Assets and Liabilities. Securities pledged as collateral, if any, for the same purpose are noted in the Consolidated Schedule of Investments.
Foreign Investment Risk: The investments by the Funds in foreign securities may involve risks not present in domestic investments. Since securities may be denominated in, require settlement in and pay interest or dividends in foreign currencies, changes in the relationship of these foreign currencies to the U.S. dollar can significantly affect the value of the investments and earnings of the Funds. Foreign investments may also subject the Funds to foreign government exchange restrictions, expropriation, taxation or other political, social or economic developments, all of which could affect the market and/or credit risk of the investments. In addition to the risks described above, risks may arise from forward foreign currency exchange contracts with respect to the potential inability of counterparties to meet the terms of their contracts.
Liquidity Risk: Some securities held by the Funds may be difficult to sell, or illiquid, particularly during times of market turmoil. Illiquid securities may also be difficult to value. If a Fund is forced to sell an illiquid asset to meet redemption requests or other cash needs, the Fund may be forced to sell at a loss.
Non-Diversification Risk: Each Fund is classified as a “non-diversified” investment company, which means that the percentage of its assets that may be invested in the securities of a single issuer is not limited by the 1940 Act. As a result, the Funds’ investment portfolios may be subject to greater risk and volatility than if investments had been made in the securities of a broad range of issuers.
Additional risks associated with each type of investment are described within the respective security type notes. Each Fund’s Prospectus includes a discussion of the principal risks of investing in the Fund.
249
Blackstone Alternative Investment Funds and Subsidiaries
Notes to Consolidated Financial Statements (Continued)
For the Year Ended March 31, 2016
10. Investment Transactions
The aggregate cost of purchases and proceeds of sales of investments in securities (excluding U.S. Treasury obligations and U.S. government sponsored agency securities) (including maturities), other than short-term investments (if applicable), for the year ended March 31, 2016 were as follows:
Multi-Manager | Multi-Strategy | |||||||||
Purchases | $ | 2,101,074,391 | $ | 6,345,468,041 | ||||||
Sales | $ | 2,947,351,969 | $ | 3,729,358,503 | ||||||
11. Income Tax Information
The Funds intend to qualify each tax year as a regulated investment company under Subchapter M of the Internal Revenue Code of 1986, as amended (the “Code”). The Funds have adopted a tax year-end of October 31, therefore the consolidated financial statements, unless otherwise indicated, reflect tax adjusted balances as of October 31, 2015. The Funds intend to distribute substantially all of its net investment income and all of its net realized short-term and long-term capital gain, if any, after giving effect to any available capital loss carryforwards for U.S. federal income tax purposes. Therefore, the Funds make no provision for U.S. federal income or excise taxes.
Each Fund’s policy is to declare and pay distributions from net investment income and from net realized short-term and long-term capital gain, if any, at least annually. All distributions are reinvested in additional shares of the Funds, at net asset value, unless the shareholder elects to receive cash distributions. Distributions to shareholders are recorded by the Funds on the ex-dividend date.
Income and capital gain distributions are determined in accordance with U.S. federal income tax regulations, which may differ from U.S. GAAP. Certain capital accounts in the financial statements are periodically adjusted for permanent differences in order to reflect their tax character. These adjustments have no impact on net assets or net asset value per share. Temporary differences that arise from recognizing certain items of income, expense, gain or loss in different periods for financial statement and tax purposes will reverse at some time in the future. Distributions in excess of net investment income or net realized gains are temporary over-distributions for financial statement purposes resulting from differences in the recognition or classification of income or distributions for financial statement and tax purposes.
The Funds made the following reclassification at March 31, 2016 due to permanent book and tax differences primarily attributable to gain or loss from passive foreign investment companies, certain derivative financial instrument transactions, certain shareholder redemption activity treated as distributions for tax and income from the wholly-owned Cayman Subsidiaries from their tax year-ended October 31, 2015:
Paid-in Capital | Accumulated Investment | Accumulated Net Realized | |||||||||||||
Multi-Manager Fund | $ | 53,010,810 | $ | 10,602,000 | $ | (63,612,810 | ) | ||||||||
Multi-Strategy Fund | $ | 13,347,200 | $ | 1,897,176 | $ | (15,244,376 | ) | ||||||||
250
Blackstone Alternative Investment Funds and Subsidiaries
Notes to Consolidated Financial Statements (Continued)
For the Year Ended March 31, 2016
The tax basis components of distributable earnings of the Funds at their tax year-ended October 31, 2015 was:
Undistributed | Undistributed Long- | Capital Loss | |||||||||||||
Multi-Manager Fund | $ | 50,255,979 | $ | — | $ | — | |||||||||
Multi-Strategy Fund | $ | 82,501,163 | $ | — | $ | — | |||||||||
In addition, the tax character of distributions paid to shareholders for the tax year-ended October 31, 2015 by the Funds are as follows:
Ordinary Income | Long-Term Capital | |||||||||
Multi-Manager Fund | $ | 102,436,929 | $ | — | ||||||
Multi-Strategy Fund | $ | 4,324,263 | $ | — | ||||||
As of March 31, 2016, the approximate cost for U.S. federal income tax purposes and gross and net unrealized appreciation (depreciation) in value of investments were as follows:
Aggregate Cost | Gross Unrealized | Gross Unrealized | Net Unrealized | |||||||||||||||||
Multi-Manager Fund | $ | 203,381,511 | $ | 8,595,703 | $ | (34,665,760 | ) | $ | (26,070,057 | ) | ||||||||||
Multi-Strategy Fund | $ | 4,363,296,624 | $ | 104,757,838 | $ | (185,284,174 | ) | $ | (80,526,336 | ) | ||||||||||
The Funds are subject to authoritative guidance related to the accounting and disclosure of uncertain tax positions under U.S. GAAP. This guidance sets forth a minimum threshold for the financial statement recognition of tax positions taken based on the technical merits of such positions. United States and non-U.S. tax rules (including the interpretation and application of tax laws) are subject to change. The Funds file tax returns and/or adopt certain tax positions in various jurisdictions. Non-U.S. taxes are provided for based on the Funds’ understanding of the prevailing tax rules of the non-U.S. markets in which they invest. Recently enacted tax rules, including interpretations of tax laws (e.g., regulations pertaining to the U.S. Foreign Account Tax Compliance Act) and proposed legislation currently under consideration in various jurisdictions, including the U.S., might affect the way the Funds and their investors are taxed prospectively and/or retroactively. Prior to the expiration of the relevant statutes of limitations, if any, the Funds are subject to examination by U.S. federal, state, local and non-U.S. jurisdictions with respect to the tax returns they have filed and the tax positions they have adopted. The Funds’ U.S. federal income tax returns are generally subject to examination by the Internal Revenue Service for a period of three years after they were filed. State, local and/or non-U.S. tax returns and/or other filings may be subject to examination for different periods, depending upon the tax rules of each applicable jurisdiction.
12. Borrowings Under Credit Facility
The Funds have a secured revolving borrowing facility (the “Facility”) with State Street Bank and Trust Company (the “Bank”) in an aggregate principal amount of up to $30,000,000 for each Fund or $60,000,000 for both Funds, subject to a maximum loan value of not more than 25% of the Fund’s NAV (the “Aggregate Commitment Amount”). Borrowings under the Facility are used primarily for bridge financing purposes and are secured by the assets of the respective borrowing Fund. Under the terms of the agreement, the Aggregate Commitment Amount may be terminated or reduced from time to time upon written notice from the Funds to the Bank. Outstanding borrowings bear interest at a rate equal to 1.25% plus the One-Month LIBOR Rate per
251
Blackstone Alternative Investment Funds and Subsidiaries
Notes to Consolidated Financial Statements (Continued)
For the Year Ended March 31, 2016
annum (1.69% at March 31, 2016). A commitment fee is charged in the amount of 0.25% per annum as well as an upfront underwriting fee equal to 0.10% of the Commitment Amount per annum. Commitment fees accrued through the end of each calendar quarter are due no later than the 15th day of the immediately succeeding calendar month during the term of the Facility. Accrued interest is due no later than January 30, 2017, the termination date of the Facility at which time the Funds and the Bank can agree to extend the existing agreement. For the year ended March 31, 2016, the Funds made no borrowings under each Fund’s respective Facility. Effective April 5, 2016, the Multi-Manager Fund was terminated from the Facility, the Multi-Strategy Fund’s Aggregate Commitment Amount was increased to a total of $60,000,000.
13. Subsequent Events
The Investment Adviser has evaluated the impact of subsequent events through the date of financial statement issuance.
On April 4, 2016, the Board of Trustees of BAIF approved a plan to liquidate the Multi-Manager Fund on or about May 31, 2016 (“Liquidation Date”). Any shares of the Fund outstanding on the Liquidation Date are to be automatically redeemed on that date.
On May 24, 2016, a liquidating distribution of $212,987,318 was made to the shareholders of the Multi-Manager Fund.
252
REPORT OF INDEPENDENT REGISTERED PUBLIC ACCOUNTING FIRM
To the Shareholders of Blackstone Alternative Multi-Manager Fund and Blackstone Alternative Multi-Strategy Fund and Board of Trustees of Blackstone Alternative Investment Funds:
We have audited the accompanying consolidated statements of assets and liabilities, including the consolidated schedules of investments, of Blackstone Alternative Investment Funds (the “Funds”) comprising the Blackstone Alternative Multi-Manager Fund and Subsidiaries and Blackstone Alternative Multi-Strategy Fund and Subsidiaries as of March 31, 2016, and the related consolidated statements of operations and cash flows for the year then ended, the consolidated statement of changes in net assets for each of the two years in the period then ended, and the consolidated financial highlights for each of the periods presented. These financial statements and financial highlights are the responsibility of the Funds’ management. Our responsibility is to express an opinion on these consolidated financial statements and consolidated financial highlights based on our audits.
We conducted our audits in accordance with the standards of the Public Company Accounting Oversight Board (United States). Those standards require that we plan and perform the audit to obtain reasonable assurance about whether the financial statements and financial highlights are free of material misstatement. The Funds are not required to have, nor were we engaged to perform, an audit of their internal control over financial reporting. Our audits included consideration of internal control over financial reporting as a basis for designing audit procedures that are appropriate in the circumstances, but not for the purpose of expressing an opinion on the effectiveness of the Funds’ internal control over financial reporting. Accordingly, we express no such opinion. An audit also includes examining, on a test basis, evidence supporting the amounts and disclosures in the financial statements, assessing the accounting principles used and significant estimates made by management, as well as evaluating the overall financial statement presentation. Our procedures included confirmation of securities owned as of March 31, 2016, by correspondence with the custodian, brokers and agent banks; when replies were not received from brokers and agent banks, we performed other auditing procedures. We believe that our audits provide a reasonable basis for our opinion.
In our opinion, the consolidated financial statements and consolidated financial highlights referred to above present fairly, in all material respects, the consolidated financial position of Blackstone Alternative Multi-Manager Fund and Blackstone Alternative Multi-Strategy Fund, each of Blackstone Alternative Investment Funds, as of March 31, 2016, the consolidated results of their operations and their cash flows for the year then ended, the consolidated changes in their net assets for each of the two years in the period then ended, and the consolidated financial highlights for each of the periods presented, in conformity with accounting principles generally accepted in the United States of America.
Emphasis of Matter Regarding Blackstone Alternative Multi-Manager Fund’s Ability to Continue as a Going Concern
As discussed in Note 13 to the consolidated financial statements, on April 4, 2016, the Board of Trustees approved a plan to liquidate Blackstone Alternative Multi-Manager Fund on or about May 31, 2016 (“Liquidation Date”). Any shares outstanding on the Liquidation Date are to be automatically redeemed on that date. Our opinion is not modified with respect to this matter.
Deloitte & Touche LLP
New York, New York
May 26, 2016
253
Blackstone Alternative Multi-Manager Fund and Subsidiaries
Shareholder Fee Example (Unaudited)
As a shareholder of the Multi-Manager Fund, you incur ongoing costs, including management fees and to the extent applicable, distribution (12b-1) fees and/or shareholder services fees and other Fund expenses. This Example is intended to help you to understand your ongoing costs (in dollars) of investing in the Fund and to compare these costs with the ongoing costs of investing in other mutual funds.
Actual Expenses
The actual expense example is based on an investment of $1,000 invested at the beginning of a six month period and held through the year ended March 31, 2016. The first line in the table below provides information about actual account values and actual expenses. You may use the information in this line, together with the amount you invested, to estimate the expenses that you paid over the period. Simply divide your account value by $1,000 (for example, an $8,600 account value divided by $1,000 = 8.6), then multiply the result by the number in the first line under the heading “Expenses Paid During Period” to estimate the expenses you paid on your account during this period.
Hypothetical Example for Comparison Purposes
The hypothetical expense example is based on an investment of $1,000 invested at the beginning of a six month period. The second line of the table below provides information about hypothetical account values and hypothetical expenses based on the Fund’s actual expense ratio and an assumed rate of return of 5% per year before expenses, which is not the actual return of the Fund. The hypothetical amount account values and expenses may not be used to estimate the actual ending account balance or expenses you paid for the period. You may use this information to compare the ongoing costs of investing in the Fund and other funds. To do so, compare this 5% hypothetical example with the 5% hypothetical examples that appear in the shareholder reports of the other funds. Please note that the expenses shown in the table are meant to highlight your ongoing costs only and do not reflect any transactional costs, such as sales charges (loads) or redemption/exchange fees. Therefore, the second line of the table is useful in comparing ongoing costs only, and will not help you determine the relative total costs of owning different funds. In addition, if these transactional costs were included, your costs would have been higher.
| Beginning Account Value 10/1/2015 | Ending Account Value 3/31/2016 | Expenses Paid During Period1 | Annualized Expense Ratio | |||||||||||||||||
Actual | $1,000.00 | $ 962.90 | $18.60 | 3.79% | ||||||||||||||||
Hypothetical (assuming a 5% return before expenses) | $1,000.00 | $1,006.05 | $19.01 | 3.79% | ||||||||||||||||
| 1 | Expenses are calculated using the annualized expense ratio, multiplied by the average account value over the period, multiplied by 183/366 (to reflect the one-half-year period). |
254
Blackstone Alternative Multi-Strategy Fund and Subsidiaries
Shareholder Fee Example (Unaudited)
As a shareholder of the Multi-Strategy Fund, you incur ongoing costs, including management fees and to the extent applicable, distribution (12b-1) fees and/or shareholder services fees and other Fund expenses. This Example is intended to help you to understand your ongoing costs (in dollars) of investing in the Fund and to compare these costs with the ongoing costs of investing in other mutual funds.
Actual Expenses
The actual expense example is based on an investment of $1,000 invested at the beginning of a six month period and held through the year ended March 31, 2016. The first line in the table below provides information about actual account values and actual expenses. You may use the information in this line, together with the amount you invested, to estimate the expenses that you paid over the period. Simply divide your account value by $1,000 (for example, an $8,600 account value divided by $1,000 = 8.6), then multiply the result by the number in the first line under the heading “Expenses Paid During Period” to estimate the expenses you paid on your account during this period.
Hypothetical Example for Comparison Purposes
The hypothetical expense example is based on an investment of $1,000 invested at the beginning of a six month period. The second line of the table below provides information about hypothetical account values and hypothetical expenses based on the Fund’s actual expense ratio and an assumed rate of return of 5% per year before expenses, which is not the actual return of the Fund. The hypothetical amount account values and expenses may not be used to estimate the actual ending account balance or expenses you paid for the period. You may use this information to compare the ongoing costs of investing in the Fund and other funds. To do so, compare this 5% hypothetical example with the 5% hypothetical examples that appear in the shareholder reports of the other funds. Please note that the expenses shown in the table are meant to highlight your ongoing costs only and do not reflect any transactional costs, such as sales charges (loads) or redemption/exchange fees. Therefore, the second line of the table is useful in comparing ongoing costs only, and will not help you determine the relative total costs of owning different funds. In addition, if these transactional costs were included, your costs would have been higher.
| Beginning Account Value 10/1/2015 | Ending Account Value 3/31/2016 | Expenses Paid During Period1 | Annualized Expense Ratio | |||||||||||||||||
Class I | ||||||||||||||||||||
Actual | $ | 1,000.00 | $ | 970.90 | $ | 16.21 | 3.29% | |||||||||||||
Hypothetical (assuming a 5% return before expenses) | $ | 1,000.00 | $ | 1,008.55 | $ | 16.52 | 3.29% | |||||||||||||
Class D | ||||||||||||||||||||
Actual | $ | 1,000.00 | $ | 969.70 | $ | 17.33 | 3.52% | |||||||||||||
Hypothetical (assuming a 5% return before expenses) | $ | 1,000.00 | $ | 1,007.40 | $ | 17.67 | 3.52% | |||||||||||||
Class Y | ||||||||||||||||||||
Actual | $ | 1,000.00 | $ | 971.90 | $ | 15.73 | 3.19% | |||||||||||||
Hypothetical (assuming a 5% return before expenses) | $ | 1,000.00 | $ | 1,009.05 | $ | 16.02 | 3.19% | |||||||||||||
| 1 | For each class of the Multi-Strategy Fund, expenses are calculated using the annualized expense ratio for the respective class, multiplied by the average account value over the period, multiplied by 183/366 (to reflect the one-half-year period). |
255
Blackstone Alternative Investment Funds and Subsidiaries
Supplemental Information
March 31, 2016
Management of the Fund
The Funds’ operations are managed by the Investment Adviser and the Sub-Advisers (defined below), under the direction and oversight of the Board. A majority of the Trustees are not “interested persons” (as defined in the 1940 Act) of the Funds (the “Independent Trustees”). The Trustees and the Funds’ officers are subject to removal or replacement in accordance with Massachusetts law and the Trust’s Declaration of Trust. The Trustees were elected by the initial shareholder of the Trust.
Sub-Advisers
During the period covered by this report, the Investment Adviser engaged the following entities as sub-advisers (each, a “Sub-Adviser”, and together, the “Sub-Advisers”) to provide investment management services to the Funds or to one or more Subsidiaries.
| • | AlphaParity, LLC |
| • | Bayview Asset Management, LLC |
| • | Blackstone Senfina Advisors L.L.C. |
| • | Boussard & Gavaudan Investment Management, LLP |
| • | BTG Pactual Asset Management US, LLC (until December 15, 2015) |
| • | Caspian Capital LP |
| • | Cerberus Sub-Advisory I, LLC |
| • | Chatham Asset Management, LLC |
| • | D.E. Shaw Investment Management, L.L.C. |
| • | Emso Partners Limited |
| • | Good Hill Partners LP |
| • | GS Investment Strategies, LLC |
| • | HealthCor Management, L.P. |
| • | IPM Informed Portfolio Management AB |
| • | Nephila Capital, Ltd. |
| • | Rail-Splitter Capital Management, LLC |
| • | Sorin Capital Management, LLC |
| • | Two Sigma Advisers, LLC |
| • | Union Point Advisors, LLC (until July 15, 2015) |
| • | Verde Serviços Internacionais S.A. (until October 15, 2015) |
| • | Waterfall Asset Management, LLC |
| • | Wellington Management Company LLP |
Trustees and Officers
The following tables set forth information concerning the Trustees and officers (“Officers”) of the Funds. Unless otherwise noted, the business address of each Officer and Trustee is c/o Blackstone Alternative Investment Advisors LLC, 345 Park Avenue, 28th Floor, New York, NY 10154.
256
Blackstone Alternative Investment Funds and Subsidiaries
Supplemental Information (Continued)
March 31, 2016
Independent Trustees:
Name and Year of Birth of Trustee | Position Held with the Funds | Term of Length of | Principal Occupation(s) During Past 5 Years | Number of Portfolios in Fund Complex2 Overseen by Trustee | Other Trusteeships Held by Trustee | |||||
John M. Brown (1959) | Trustee | March 2013 to present | Retired (2012 – Present) Independent Consultant (2010 – 2012) | 5 | None | |||||
Frank J. Coates (1964) | Trustee | March 2013 to present | CEO, Wheelhouse Analytics, LLC (2010 – Present) (Technology Solutions) | 5 | Member of Board of Managers of Evermore Global Advisors, LLC | |||||
Peter M. Gilbert (1947) | Trustee | February 2016 to present | Chief Investment Officer, Lehigh University Endowment Fund (2007 – 2015) | 5 | None | |||||
Paul J. Lawler (1948) | Trustee | March 2013 to present | Retired (2010 –Present) | 5 | Trustee, First Eagle Variable Funds (1 portfolio); Trustee, First Eagle Funds (8 portfolios) | |||||
Kristen Leopold (1967) | Trustee | March 2013 to present | CFO, KL Associates LLC (Hedge Fund Consulting) CFO, WFL Real Estate Services, LLC (2007 – Present) | 5 | Trustee, CPG Alternative Strategies Fund LLC; Trustee, CPG Carlyle Fund LLC; Trustee, CPG Carlyle Master Fund, LLC | |||||
257
Blackstone Alternative Investment Funds and Subsidiaries
Supplemental Information (Continued)
March 31, 2016
Interested Trustee:
Name and Birth of | Position | Term of Office1 Time Served | Principal Occupation(s) During Past 5 Years | Number of Portfolios in Fund Complex2 Overseen by Trustee | Other Trusteeships Held by Trustee | |||||
Peter Koffler3 (1956) | Trustee | August 2012 to present | Senior Managing Director,4 Blackstone Alternative Asset Management L.P. (“BAAM”) (2012 – Present); Chief Compliance Officer, The Blackstone Group L.P. (2013 – Present); General Counsel, Blackstone Alternative Investment Advisors LLC (“BAIA”) and BAAM (2010 – Present); Managing Director,4 BAAM (2006 – 2011); Chief Compliance Officer, BAAM (2008 – 2012) | 5 | None |
| 1 | Term of office of each Trustee is indefinite until his or her resignation, removal, or death. Any Trustee of the Funds may be removed from office in accordance with the provisions of the Trust’s Agreement and Declaration of Trust and Bylaws. |
| 2 | The “Fund Complex” consists of the Funds, Blackstone Alternative Alpha Fund, Blackstone Alternative Alpha Fund II, and Blackstone Alternative Alpha Master Fund. |
| 3 | Mr. Koffler is an “interested person” of the Trust, as defined in the 1940 Act, due to his position with BAIA and its affiliates. |
| 4 | Executive title, not a board directorship. |
258
Blackstone Alternative Investment Funds and Subsidiaries
Supplemental Information (Continued)
March 31, 2016
Officers:
| Name and Year of Birth of Officer | Position(s) Held with the Fund | Term of Office1 and Length of Time Served | Principal Occupation(s) During Past 5 Years | |||
Stephen Buehler (1977) | Secretary | August 2012 to present | Managing Director,2 BAAM (2014 – Present); Vice President, BAAM (2012 – 2013); Associate, BAAM (2010 – 2011) | |||
Brian F. Gavin (1969) | President (Principal Executive Officer) | August 2012 to present | Chief Operating Officer & Senior Managing Director,2 BAAM (2007 – Present) | |||
Hayley Stein (1977) | Chief Compliance Officer and Anti- Money Laundering Officer | March 2013 to present | Managing Director,2 BAAM (2011 – Present); Chief Compliance Officer, BAIA and BAAM (2013 – Present); Vice President, BAAM (2006 – 2010) | |||
Arthur Liao (1972) | Treasurer (Principal Financial and Accounting Officer) | August 2012 to present | Senior Managing Director,2 (2016 – Present) Chief Financial Officer, BAIA and BAAM (2007 – Present) Managing Director,2 BAAM (2007 – 2015) | |||
James Hannigan (1983) | Chief Legal Officer | March 2015 to present | Vice President, BAAM (2014 – Present); Associate, BAAM (2012 – 2013); Assistant Vice President, FRM Americas LLC (2011 – 2012); Associate, Willkie Farr & Gallagher LLP (2008 – 2011) |
| 1 | Term of office of each officer is indefinite until his or her death, resignation, removal, or disqualification. |
| 2 | Executive title, not a board directorship. |
Compensation for Trustees
The Trust pays no compensation to any of its officers or to Trustees who are not Independent Trustees. Each Independent Trustee is paid $72,000 per fiscal year for his or her services to the Trust, and the Chairpersons of the Board and the Audit Committee are each paid an additional $3,000 per fiscal year from the Trust. Trustees are reimbursed by the Trust for their travel expenses related to Board meetings, continuing education and conferences.
259
Blackstone Alternative Investment Funds and Subsidiaries
Supplemental Information (Continued)
March 31, 2016
Form N-Q Filings
The Funds file complete schedules of portfolio holdings with the Securities and Exchange Commission (“SEC”) for the first and third quarters of each fiscal year on Form N-Q. The Funds’ Form N-Q is available on the SEC’s website at http://www.sec.gov within 60 days after the Funds’ first and third fiscal quarters. The Funds’ Form N-Q may be reviewed and copied at the SEC’s Public Reference Room in Washington, D.C., and information regarding the operation of the Public Reference Room may be obtained by calling 1-800-SEC-0330. Holdings and allocations shown on any Form N-Q are as of the date indicated in the filing and may not be representative of future investments. Holdings and allocations should not be considered research or investment advice and should not be relied upon in making investment decisions.
Proxy Voting Policies
A description of the policies and procedures used to vote proxies related to the Funds’ portfolio securities and information regarding how the Funds voted proxies relating to their portfolio securities during the 12-month period ended June 30, 2015 will be available (1) without charge, upon request, by calling toll free, 1-855-890-7725 and (2) on the SEC’s website at http://www.sec.gov.
Board Approval of the Sub-Advisory Agreements
At meetings of the Board held in person on November 17, 2015 and February 23-24, 2016, the Board, including all of the Independent Trustees, considered and unanimously approved the sub-advisory agreements for the Funds (“Amended and Restated Sub-Advisory Agreements” and “Renewed Sub-Advisory Agreements,” together the “Sub-Advisory Agreements”) between BAIA and each of the following Sub-Advisers:
Amended and Restated Sub-Advisory Agreements
| • | Cerberus Sub-Advisory I, LLC (at November meeting) |
| • | Wellington Management Company LLP (at November meeting) |
| • | Bayview Asset Management, LLC (at February meeting) |
| • | Chatham Asset Management, LLC (at February meeting) |
| • | HealthCor Management L.P. (at February meeting) |
Renewed Sub-Advisory Agreements
| • | AlphaParity, LLC (at February meeting) |
| • | Emso Partners Limited (at February meeting) |
| • | GS Investment Strategies, LLC (at February meeting) |
The Independent Trustees were assisted in their review of the Sub-Advisory Agreements by independent legal counsel. The Board requested and evaluated all the information it deemed reasonably necessary under the circumstances in connection with the approval of the Sub-Advisory Agreements. The Board noted that BAIA and the Funds rely on an exemptive order from the SEC that permitted the Funds to add or replace Sub-Advisers without a shareholder vote, provided that the Board, including a majority of Independent Trustees, approves the new Sub-Advisers and certain other conditions are met.
Before the meetings, the Board received, among other things, (a) materials prepared by independent legal counsel regarding the relevant factors to consider in evaluating the Sub-Advisory Agreements; (b) materials prepared by BAIA and BAAM relating to each Sub-Adviser, including (1) summary information regarding: the investment thesis; strengths; performance and positioning; a firm-wide risk evaluation and a strategy risk
260
Blackstone Alternative Investment Funds and Subsidiaries
Supplemental Information (Continued)
March 31, 2016
evaluation; an assessment of business infrastructure and relevant valuation, liquidity, trade execution, allocation, and compliance matters; and a summary of the key terms of the relevant Sub-Advisory Agreement; (2) a Manager Investment Review, which covered, in greater detail, each Sub-Adviser’s investment thesis, organizational history and ownership, quantitative analysis, peer group analysis, risk review, business and financial evaluation, and personnel (and for certain Sub-Advisers, investment strategy, investment process, and portfolio construction); (3) a Back Office Review, which covered, among other things, information regarding the Sub-Adviser’s product offerings and personnel, business viability, related entities, product and operational complexity, valuation procedures, internal controls, counterparties, service providers, and regulatory and compliance infrastructure; (4) information regarding updates to each Sub-Adviser’s compliance program; and (5) information regarding the role of each Sub-Adviser as part of the Funds’ portfolios; and (c) materials prepared by each Sub-Adviser that addressed, among other things: (1) general financial information; (2) services and personnel; (3) material business dealings with Blackstone and the Funds’ service providers; (4) the Sub-Adviser’s business plan for the Funds for the coming year; (5) costs, fees, other benefits, and profitability; and (6) risk management and regulatory compliance matters.
With respect to the Amended and Restated Sub-Advisory Agreements, the Board received, among other things, information about the changes from the original sub-advisory agreements, as well as copies of the information reviewed in connection with the approvals of that Sub-Adviser’s original sub-advisory agreements.
At the meetings, there was discussion regarding the materials that had been provided to the Board, the terms of the Sub-Advisory Agreements, and other relevant considerations. Additionally, the Board (and separately, the Independent Trustees) conferred with their independent legal counsel to consider the information provided. In evaluating the Sub-Advisory Agreements, the Board took into account the fact that the compensation paid to the Sub-Advisers would be paid by BAIA from the investment management fee it receives from the Funds and would not increase the fees or expenses otherwise incurred by the Funds or their shareholders. In the case of the Amended and Restated Sub-Advisory Agreements, the Board also took into account its recent consideration and approval of the original sub-advisory agreements with those Sub-Advisers, and the fact that the proposed changes to the original sub-advisory agreements were not substantive, and were not expected to result in any change in the nature, extent and quality of the services provided to the Funds. Following this discussion, the Board, including all of the Independent Trustees, determined to approve all of the Sub-Advisory Agreements on the basis of the following considerations, among others:
Nature, Extent, and Quality of the Services
The Board discussed and considered with respect to each Sub-Adviser (1) personnel, operations, and financial condition; (2) investment expertise and strengths; (3) percentage of assets that are allocated to the Sub-Adviser; (4) investment return on the assets that are managed by the Sub-Adviser and related investment risks; (5) the Sub-Adviser’s experience and performance as a sub-adviser to the Funds; (6) where applicable, the Sub-Adviser’s experience and performance in managing hedge funds and the extent to which the Sub-Adviser’s strategy for the Funds would overlap with its hedge fund strategy; and (7) the experience and depth of the Sub-Adviser’s portfolio management team and its ability to manage risk. Where applicable, the Board also considered information about the experience of BAIA’s affiliates in investing in hedge funds managed by the Sub-Adviser. The Board concluded that the nature, extent, and quality of the sub-advisory services to be provided by each Sub-Adviser were appropriate and thus supported a decision to approve the Sub-Advisory Agreements.
261
Blackstone Alternative Investment Funds and Subsidiaries
Supplemental Information (Continued)
March 31, 2016
Costs of Services and Profitability
In analyzing the cost of services and profitability of each Sub-Adviser, the Board discussed the following factors: the proposed sub-advisory fee for managing the allocated Fund assets, including any breakpoints, the Sub-Adviser’s resources devoted to the Funds, and (where available) the information provided by each Sub-Adviser regarding the anticipated profitability to the Sub-Adviser from providing sub-advisory services to the Funds. Where applicable, the Board reviewed the performance of the Sub-Adviser’s comparable hedge fund as compared to a custom index defined by BAIA and/or another comparable fund, as well as information about the management fees borne by those funds. The Board noted that the compensation paid to the Sub-Adviser was paid by BAIA, not the Funds, and, accordingly, that the retention of the Sub-Adviser did not increase the fees or expenses otherwise incurred by the Funds’ shareholders. The Board also considered information about the anticipated average sub-advisory fees that BAIA would pay in light of expected portfolio allocations and the resulting division of fees as between BAIA and the Sub-Advisers. On the basis of the Board’s review of the fees to be charged by each Sub-Adviser for investment sub-advisory services, the relatively unique and highly specialized nature of the portfolio that the Sub-Adviser would manage, and (where available) the costs associated with managing the portfolio, the Board concluded that the level of investment sub-advisory fees was appropriate in light of the services to be provided. It was noted that all of the Sub-Advisory Agreements were the result of arms-length negotiations.
Economies of Scale
The Board discussed various financial and economic considerations relating to the proposed arrangement with each Sub-Adviser, including economies of scale and the breakpoints in place for certain Sub-Advisers. The Board also noted that although not directly related to the sub-advisory fees payable to the Sub-Advisers, certain expenses of the Funds would be subject to an expense cap. The Board noted that it would have the opportunity to periodically re-examine whether each of the Funds had achieved economies of scale, as well as the appropriateness of sub-advisory fees payable to each Sub-Adviser, with respect to different asset sizes of the portfolio managed by such Sub-Adviser, in the future.
Investment Performance of the Sub-Advisers
The Board considered the investment performance of the Sub-Advisers. Where applicable, the Board considered information about the year-to-date, 2015 and inception-to-date investment return of the Funds’ assets that are managed by each Sub-Adviser (net of trading expenses but gross of investment management fees and fund operating expenses), all as compared to the investment returns of (i) a custom index defined by BAIA and (ii) in the case of certain Sub-Advisers, such Sub-Adviser’s hedge fund strategy. In addition, the Board considered information about performance risk measurements of the assets that are managed by the Sub-Adviser, the custom index and the Sub-Adviser’s strategy such as annualized return, volatility, Sharpe ratio, beta statistics, and alpha statistics. On the basis of the Board’s assessment, the Board concluded that the investment performance generated by the Sub-Advisers was generally satisfactory and that the Sub-Advisers were capable of generating an appropriate level of services to the Funds.
Other Benefits
The Board discussed other potential benefits that each Sub-Adviser might receive from the Funds, including soft dollar arrangements, receipt of brokerage and research services, and the opportunity to offer additional products and services to the Funds’ shareholders. The Board concluded that other benefits (including ancillary or “fall out” benefits) derived by each Sub-Adviser from its relationship with BAIA, BAAM, or the Funds, to the extent such benefits were identifiable or determinable, were reasonable and fair, resulted from the provision of appropriate services to the Funds and investors therein, and were consistent with industry practice and the best interests of the Funds and their shareholders.
262
Blackstone Alternative Investment Funds and Subsidiaries
Supplemental Information (Continued)
March 31, 2016
Conclusion
The Board, including all of the Independent Trustees, concluded that the fees payable under each of the Sub-Advisory Agreements were fair and reasonable with respect to the services that the relevant Sub-Adviser would provide to the Funds and in light of the other factors described above and additional factors that the Board deemed relevant. The Board noted that both BAIA and the Board had previously determined that each Sub-Adviser’s compliance program was reasonably designed to prevent the violation of federal securities laws within the meaning of Rule 38a-1 under the 1940 Act. After review and consideration of certain terms and conditions of the Sub-Advisory Agreements, the Board concluded that the terms of each Sub-Advisory Agreement were reasonable and fair and noted that they would have the opportunity to periodically re-examine the terms of the Sub-Advisory Agreements in the future. The Board based its approval on a comprehensive consideration of all information presented to the Board at its meetings throughout the year and not as a result of any single controlling factor. The Board was assisted by the advice of independent counsel in making these determinations.
Additional Information
The Funds’ Statement of Additional Information includes additional information about the Trustees. The Statement of Additional Information is available upon request, without charge, by calling toll free 1-855-890-7725.
Copies of this annual shareholder report are available upon request to prior shareholders of the Multi-Manager Fund, without charge, by calling toll free 1-855-890-7725.
263
Blackstone Registered Funds
Privacy Notice
FACTS | WHAT DO BLACKSTONE REGISTERED FUNDS DO WITH YOUR PERSONAL INFORMATION? |
Why? | Financial companies choose how they share your personal information. Federal law gives consumers the right to limit some but not all sharing. Federal law also requires us to tell you how we collect, share, and protect your personal information. Please read this notice carefully to understand what we do. |
What? | The types of personal information we collect and share depend on the product or service you have with us. This information can include: n Social Security number and income n Assets and investment experience n Risk tolerance and transaction history |
How? | All financial companies need to share customers’ personal information to run their everyday business. In the section below, we list the reasons financial companies can share their customers’ personal information; the reasons Blackstone Registered Funds (as defined below) choose to share; and whether you can limit this sharing. |
| Reasons we can share your personal information | Do Blackstone Registered Funds share? | Can you limit this sharing? | ||
For our everyday business purposes— such as to process your transactions, maintain your account(s), respond to court orders and legal investigations, or report to credit bureaus | Yes | No | ||
For our marketing purposes— to offer our products and services to you | Yes | No | ||
| For joint marketing with other financial companies | No | We don’t share | ||
For our affiliates’ everyday business purposes— information about your transactions and experiences | No | We don’t share | ||
For our affiliates’ everyday business purposes— information about your creditworthiness | No | We don’t share | ||
| For our affiliates to market to you | No | We don’t share | ||
| For nonaffiliates to market to you | No | We don’t share | ||
| Questions? | Email us at GLB.privacy@blackstone.com | |
264
Blackstone Registered Funds Privacy Notice (Continued)
| Who we are | ||
| Who is providing this notice? | Blackstone Registered Funds include Blackstone Alternative Alpha Fund, Blackstone Alternative Alpha Fund II, Blackstone Real Estate Income Fund, Blackstone Real Estate Income Fund II, Blackstone Alternative Investment Funds, on behalf of its series Blackstone Alternative Multi-Manager Fund and Blackstone Alternative Multi-Strategy Fund, and the GSO Funds, consisting of Blackstone/GSO Senior Floating Rate Term Fund, Blackstone/GSO Long-Short Credit Income Fund and Blackstone/GSO Strategic Income Fund | |
| What we do | ||
| How do Blackstone Registered Funds protect my personal information? | To protect your personal information from unauthorized access and use, we use security measures that comply with federal law. These measures include computer safeguards and secured files and buildings. | |
| How do Blackstone Registered Funds collect my personal information? | We collect your personal information, for example, when you: n open an account or give us your income information n provide employment information or give us your contact information n tell us about your investment or retirement portfolio We also collect your personal information from others, such as credit bureaus, affiliates, or other companies. | |
| Why can’t I limit all sharing? | Federal law gives you the right to limit only: n sharing for affiliates’ everyday business purposes— information about your creditworthiness n affiliates from using your information to market to you n sharing for nonaffiliates to market to you State laws and individual companies may give you additional rights to limit sharing. See below for more on your rights under state law. | |
| What happens when I limit sharing for an account I hold jointly with someone else? | Your choices will apply to everyone on your account—unless you tell us otherwise. | |
| Definitions | ||
| Affiliates | Companies related by common ownership or control. They can be financial and nonfinancial companies. n Our affiliates include companies with a Blackstone name and financial companies such as GSO Capital Partners LP and Strategic Partners Fund Solutions. | |
| Nonaffiliates | Companies not related by common ownership or control. They can be financial and nonfinancial companies. n Blackstone Registered Funds do not share with nonaffiliates so they can market to you. | |
| Joint marketing | A formal agreement between nonaffiliated financial companies that together market financial products or services to you. n Our joint marketing partners include financial services companies. | |
| Other important information | ||
California Residents—In accordance with California law, we will not share information we collect about California residents with nonaffiliates except as permitted by law, such as with the consent of the customer or to service the customer’s accounts. We will also limit the sharing of information about you with our affiliates to the extent required by applicable California law.
Vermont Residents—In accordance with Vermont law, we will not share information we collect about Vermont residents with nonaffiliates except as permitted by law, such as with the consent of the customer or to service the customer’s accounts. We will not share creditworthiness information about Vermont residents among Blackstone Registered Funds’ affiliates except with the authorization or consent of the Vermont resident.
265
Blackstone Alternative Multi-Manager Fund
Blackstone Alternative Multi-Strategy Fund
Series of Blackstone Alternative Investment Funds
Trustees
John M. Brown, Chairman
Frank J. Coates
Peter M. Gilbert
Paul J. Lawler
Kristen M. Leopold
Peter Koffler
Investment Manager
Blackstone Alternative Investment Advisors LLC
345 Park Avenue
New York, New York 10154
Administrator and Custodian
State Street Bank and Trust Company
One Lincoln Street
Boston, MA 02111
Transfer Agent
State Street Bank and Trust Company
One Heritage Drive
North Quincy, MA 02171
Officers
Brian F. Gavin, President and Principal Executive Officer
Arthur Liao, Treasurer and Principal Financial and Accounting Officer
Hayley Stein, Chief Compliance Officer
James Hannigan, Chief Legal Officer
Stephen Buehler, Secretary
Independent Registered Public Accounting Firm
Deloitte & Touche LLP
30 Rockefeller Plaza
New York, New York 10112
Legal Counsel
Ropes & Gray LLP
Prudential Tower
800 Boylston Street
Boston, Massachusetts 02199-3600
This report, including the financial information herein, is transmitted to the shareholders of Blackstone Alternative Multi-Manager Fund and Blackstone Alternative Multi-Strategy Fund for their information. It is not a prospectus or representation intended for use in the purchase of shares of the Funds or any securities mentioned in this report.
You can find each Fund’s prospectus and other information about the Funds, including each Fund’s statements of additional information, on the Funds’ website at www.blackstone.com/blackstone-alternative-investment-funds. You can also get this information at no cost by calling the Funds at 1-855-890-7725.
| Item 2. | Code of Ethics. |
(a) The registrant, as of the end of the period covered by the report, has adopted a code of ethics that applies to the registrant’s principal executive officer, principal financial officer, principal accounting officer or controller, or persons performing similar functions. This code of ethics is included as Exhibit 12(a)(1).
(b) During the period covered by the report, with respect to the registrant’s code of ethics that applies to its principal executive officer, principal financial officer, principal accounting officer or controller, or persons performing similar functions, there have been no amendments to, nor any waivers granted from, a provision that relates to any element of the code of ethics definition enumerated in paragraph (b) of this Item 2.
| Item 3. | Audit Committee Financial Expert. |
(a)(1) The registrant’s Board of Trustees has determined that the registrant has at least one audit committee financial expert serving on its Audit Committee (the “Committee”).
(b)(2) The audit committee financial expert is Kristen M. Leopold, who is “independent” for purposes of this Item 3 of Form N-CSR.
| Item 4. | Principal Accountant Fees and Services. |
| Current Year | Previous Year | |||||
(a) | Audit Fees | $290,000 | $300,000 | |||
(b) | Audit-Related Fees | $ 0 | $ 0 | |||
(c) | Tax Fees(1) | $ 70,800 | $ 70,800 | |||
(d) | All Other Fees | $ 0 | $ 0 |
| (1) | The nature of the services includes tax compliance, tax advice and tax planning. |
(e)(1) Disclose the Committee’s pre-approval policies and procedures described in paragraph (c)(7) of Rule 2-01 of Regulation S-X.
The charter for the Committee requires that the Committee pre-approve (i) all audit and non-audit services that the registrant’s independent auditors provide to the registrant, and (ii) all non-audit services that the registrant’s independent auditors provide to Blackstone Alternative Investment Advisors LLC, the investment adviser of the registrant (“BAIA”), and any entity controlling, controlled by, or under common control with BAIA that provides ongoing services to the registrant, if the engagement relates directly to the operations and financial reporting of the registrant; provided that the Committee may implement policies and procedures by which such services are approved other than by the full Committee prior to their ratification by the Committee.
(2) Disclose the percentage of services described in each of paragraphs (b) through (d) of this item that were approved by the Committee pursuant to paragraph (c)(7)(i)(C) of Rule 2-01 of Regulation S-X.
Current Year | Previous Year | |
| 0% | 0% |
(f) Not applicable.
(g) Disclose the aggregate non-audit fees billed by the registrant’s accountant for services rendered to the registrant, and rendered to the registrant’s investment adviser, and any entity controlling, controlled by, or under common control with the adviser that provides ongoing services to the registrant for each of the last two fiscal years of the registrant.
Current Year | Previous Year | |
| $0 | $0 |
(h) Not applicable.
| Item 5. | Audit Committee of Listed Registrants. |
Not applicable.
| Item 6. | Schedule of Investments. |
(a) The registrant’s Consolidated Schedule of Investments as of the close of the reporting period is included in the Report to Shareholders filed under item 1 of this form.
(b) Not applicable.
| Item 7. | Disclosure of Proxy Voting Policies and Procedures for Closed-End Management Investment Companies. |
Not applicable.
| Item 8. | Portfolio Managers of Closed-End Investment Management Companies. |
Not applicable.
| Item 9. | Purchases of Equity Securities by Closed-End Management Investment Company and Affiliated Purchasers. |
Not applicable.
| Item 10. | Submission of Matters to a Vote of Security Holders. |
There have been no material changes to procedures by which the shareholders may recommend nominees to the registrant’s Board of Trustees.
| Item 11. | Controls and Procedures. |
| (a) | The registrant’s principal executive officer and principal financial officers, or persons performing similar functions, have concluded that the registrant’s disclosure controls and procedures as defined in Rule 30a-3(c) under the Investment Company Act of 1940, as amended (the “1940 Act”), are effective as of the date within 90 days of the filing date of this report based on the evaluation of these controls and procedures required by Rule 30a-3(b) under the 1940 Act and Rules 13a-15(b) or 15d-15(b) under the Securities Exchange Act of 1934, as amended. |
| (b) | There were no changes in the registrant’s internal control over financial reporting (as defined in Rule 30a-3(d) under the 1940 Act) that occurred during the second fiscal quarter of the period covered by this report that have materially affected or are reasonably likely to materially affect, the registrant’s internal control over financial reporting. |
| Item 12. | Exhibits. |
| (a)(1) | Code of ethics, or any amendment thereto, that is the subject of disclosure required by Item 2 is attached hereto. |
| (a)(2) | Certifications pursuant to Rule 30a-2(a) are attached hereto. |
| (a)(3) | Not applicable. |
| (b) | Certifications pursuant to Rule 30a-2(b) are attached hereto. |
SIGNATURES
Pursuant to the requirements of the Securities Exchange Act of 1934 and the Investment Company Act of 1940, the registrant has duly caused this report to be signed on its behalf by the undersigned, thereunto duly authorized.
| (Registrant) | Blackstone Alternative Investment Funds |
| By (Signature and Title) | /s/ Brian F. Gavin | |
| Brian F. Gavin, President (Principal Executive Officer) |
| Date | June 2, 2016 |
Pursuant to the requirements of the Securities Exchange Act of 1934 and the Investment Company Act of 1940, this report has been signed below by the following persons on behalf of the registrant and in the capacities and on the dates indicated.
| By (Signature and Title) | /s/ Brian F. Gavin | |
| Brian F. Gavin, President (Principal Executive Officer) |
| Date | June 2, 2016 |
| By (Signature and Title) | /s/ Arthur Liao | |
| Arthur Liao, Treasurer (Principal Financial and Accounting Officer) |
| Date | June 2, 2016 |