UNITED STATES
SECURITIES AND EXCHANGE COMMISSION
Washington, D.C. 20549
FORM N-CSR
CERTIFIED SHAREHOLDER REPORT OF REGISTERED
MANAGEMENT INVESTMENT COMPANIES
Investment Company Act file number: 811-22747
ALPS SERIES TRUST
(Exact name of registrant as specified in charter)
1290 Broadway, Suite 1100, Denver, Colorado 80203
(Address of principal executive offices) (Zip code)
303.623.5277
(Registrant’s telephone number, including area code)
JoEllen L. Legg, Esq., Secretary
ALPS Series Trust
1290 Broadway, Suite 1100
Denver, CO 80203
(Name and address of agent for service)
Date of fiscal year end: September 30
Date of reporting period: October 1, 2014 – March 31, 2015
Item 1. Reports to Stockholders.
| Table of Contents |
| Shareholder Letter | 1 |
| Portfolio Update | 4 |
| Disclosure of Fund Expenses | 7 |
| Portfolio of Investments | 8 |
| Statement of Assets and Liabilities | 14 |
| Statement of Operations | 15 |
| Statements of Changes in Net Assets | 16 |
| Statement of Cash Flows | 17 |
| Financial Highlights | 18 |
| Notes to Financial Statements | 22 |
| Additional Information | 30 |
| 1-855-254-6467 | www.cogniosfunds.com |
Cognios Market Neutral Large Cap Fund
| Shareholder Letter | March 31, 2015 (Unaudited) |
Dear Shareholder,
Thank you for investing in the Cognios Market Neutral Large Cap Fund (the “Fund”) and for taking the time to review this semi-annual report for the six months ended March 31, 2015. We value this opportunity to offer insight into the Fund’s investment strategy and offer commentary on the Fund’s performance.
For additional information about the Fund’s investment strategy, updated performance information and additional commentary from the Fund’s investment adviser, Cognios Capital, we encourage you to visit the Fund’s website, www.cogniosfunds.com.
The Cognios Market Neutral Large Cap Fund employs a Beta-adjusted market neutral investment strategy that seeks to provide investors with returns that are non-correlated to the returns of the stock market. By attempting to hedge out all of the market Beta1, the Fund’s returns over time should be essentially “pure Alpha” (i.e., Alpha is the excess return of a portfolio after considering its Beta exposure.) Additionally, by hedging out the general market movements in this Beta-adjusted market neutral fashion, we believe that the total returns of the Fund will be independent of those broad “systemic” risk factors and macro events that move the entire stock market either positively or negatively over time.
Also, as you have already been notified, effective April 1, 2015, the maximum expense ratio of the Fund was reduced as we believe this is in the best interest of the Fund’s shareholders and aligns with Cognios’ long-term value proposition in helping to ensure that all investors have greater access to the strategies needed to diversify their portfolios.
Below you will find performance updates for the Fund.
Regarding performance of the Fund, the total return for the Institutional Class Shares (COGIX) was 1.01% and the total return for the Investor Class Shares (COGMX) was 0.91% during the six months ended March 31, 2015. For the twelve months ended March 31, 2015, the total return for COGIX shares was 7.68%, while the total return for the COGMX shares was 7.39%.
Over the course of the six months ended March 31, 2015, the Fund held seventy-two separate long positions and one hundred fifty-seven separate short positions. Forty-three of the seventy-two long positions were profitable and forty-five of the one hundred fifty-seven short positions were profitable for the period. Total profits generated by the long positions were $1,013,210 while losses generated by the short positions were $602,089 during the period. The long positions generated 6.7% gains on average equity capital while the short positions generated losses of 4.0% on average equity capital. The table below displays the top five most profitable long and short positions for the six months ended March 31, 2015.
| Ticker | Long Positions | Profits | Ticker | Short Positions | Profits | ||||||
| AAPL | Apple, Inc. | $ | 230,068 | WMB | Williams Companies, Inc. | $ | 110,179 | ||||
| HRS | Harris Corp. | $ | 147,978 | FCX | Freeport-McMoran, Inc. | $ | 103,361 | ||||
| EW | Edwards Lifesciences Corp. | $ | 141,964 | AA | Alcoa, Inc. | $ | 53,295 | ||||
| VRSN | Verisign, Inc. | $ | 118,497 | APA | Apache Corp. | $ | 50,291 | ||||
| FISV | Fiserv, Inc. | $ | 109,452 | HES | Hess Corp. | $ | 47,735 | ||||
| Semi-Annual Report | March 31, 2015 | 1 |
Cognios Market Neutral Large Cap Fund
| Shareholder Letter | March 31, 2015 (Unaudited) |
Beta to the S&P 500 | Annualized Alpha to the S&P 500 | |
| COGIX | 0.23 | 1.27% |
| COGMX | 0.23 | 0.99% |
| Correlation of Returns to the HFRX EH: Equity Market Neutral Index | R Squared of Returns to the HFRX EH: Equity Market Neutral Index3 | |
| COGIX | 19.21% | 3.69% |
| COGMX | 18.78% | 3.53% |
As the tables above indicate, Beta, Correlation and R Squared are all low, meaning that the performance of the Fund is statistically independent of the performance of the S&P 500. Meanwhile, the Alpha of the Fund is positive, which is good, but we hope this statistic moves higher in the future with improved performance.
We at Cognios look forward to future opportunities to connect with our shareholders. We strive to continuously add value to your investment experience by providing access to fund information, portfolio updates and straightforward commentary.
If you have any questions regarding the Cognios Market Neutral Large Cap Fund, please contact your account manager or financial adviser, or call one of our shareholder associates at 855-254-6467. We also invite you to visit Cognios’ website at www.cognios.com to learn more about our firm, our team and our values.
We thank you for investing with Cognios and for the trust you have placed in us.
Sincerely,
 |  |  |
Jonathan Angrist | Brian Machtley | Francisco Bido |
Portfolio Managers
Cognios Capital, LLC
1 | Beta is a measure of the sensitivity of a stock’s price changes to broad stock market movements over time. |
2 | Correlation is a statistical measure of how two securities move in relation to each other. |
3 | R Squared is the coefficient of determination and indicates how well data points fit in a model. In the example in the above table, 3.69% of the monthly movement in share price of COGIX can be explained by the movement of the S&P 500. |
| 2 | www.cogniosfunds.com |
Cognios Market Neutral Large Cap Fund
| Shareholder Letter | March 31, 2015 (Unaudited) |
The views and information discussed in this commentary are as of the date of publication, are subject to change, and may not reflect the writer’s current views. The views expressed are those of the Fund’s adviser only, and represent an assessment of market conditions at a specific point in time, are opinions only and should not be relied upon as investment advice regarding a particular investment or markets in general. Such information does not constitute a recommendation to buy or sell specific securities or investment vehicles. It should not be assumed that any investment will be profitable or will equal the performance of the fund(s) or any securities or any sectors mentioned in this letter. The subject matter contained in this letter has been derived from several sources believed to be reliable and accurate at the time of compilation. Neither the Fund nor the Adviser accepts any liability for losses either direct or consequential caused by the use of this information.
| Semi-Annual Report | March 31, 2015 | 3 |
Cognios Market Neutral Large Cap Fund
| Portfolio Update | March 31, 2015 (Unaudited) |
Performance (as of March 31, 2015)
| Six Month | 1 Year | Since Inception* (annualized) | ||||
| Cognios Market Neutral Large Cap Fund - Investor | 0.91% | 7.39% | 5.32% | |||
| Cognios Market Neutral Large Cap Fund - Institutional | 1.01% | 7.68% | 5.58% | |||
S&P 500® Total Return Index(a) | 5.93% | 12.73% | 20.47% | |||
HFRX Equity Hedge Market Neutral Index(b) | 2.67% | 3.22% | 3.14% | |||
HFRI Equity Hedge Market Neutral Index(c) | 2.88% | 3.54% | 4.99% |
The performance data quoted above represents past performance. Past performance is not a guarantee of future results. Investment return and value of the Fund shares will fluctuate so that an investor’s shares, when sold or redeemed, may be worth more or less than their original cost. Performance may be lower or higher than performance data quoted. Fund performance current to the most recent month-end is available by calling 855.254.6467 or by visiting www.cogniosfunds.com.
| * | Fund’s inception date is December 31, 2012. |
| (a) | The S&P 500® Total Return Index is an unmanaged index of 500 common stocks chosen for the market size, liquidity and industry group representation. It is a market-value weighted index. |
| (b) | The HFRX Equity Hedge Market Neutral Index – As of September 30, 2014, the secondary benchmark for the Fund was changed from the HFRI Equity Hedge Market Neutral Index to the HFRX Equity Market Neutral Index. The methodology used to construct the HFRX Equity Market Neutral Index requires that funds have a performance record of at least 12 months and assets greater than $50 million to be included as a constituent of the Index. The HFRX Equity Market Neutral Index also required funds to trade on a transparent basis and be open to new investors. As such, the Adviser believes that the methodology used and components of the HFRX Equity Hedge Market Neutral Index represent a more mature and accessible peer group for performance comparison and help to minimize selection, survivorship and reporting bias for the index. Both index returns and index methodology are provided by Hedge Fund Research Inc. |
| (c) | The HFRI Equity Hedge Market Neutral Index is a common benchmark for long/short market neutral hedge funds (funds traditionally only available to high net-worth accredited and institutional investors that are also “qualified clients” as defined by the SEC). More information about this index may be found at www.hedgefundresearch.com. Both index returns and index methodology are provided by Hedge Fund Research Inc. |
Returns of less than one year are cumulative.
Indices are not actively managed and do not reflect deduction for fees, expenses or taxes. An investor cannot invest directly into an index.
The returns shown above do not reflect the deduction of taxes a shareholder would pay on Fund distributions or redemption of Fund shares.
The total annual operating expenses and total annual operating expenses after fee waivers and/or reimbursement you may pay as an investor in the Fund's Investor Class and Institutional Class shares (as reported in the supplement dated March 31, 2015 to the January 28, 2015 Prospectus) are 6.16% and 3.96% and 5.44% and 3.71% respectively.
| 4 | www.cogniosfunds.com |
Cognios Market Neutral Large Cap Fund
| Portfolio Update | March 31, 2015 (Unaudited) |
Performance of $10,000 Initial Investment (as of March 31, 2015)
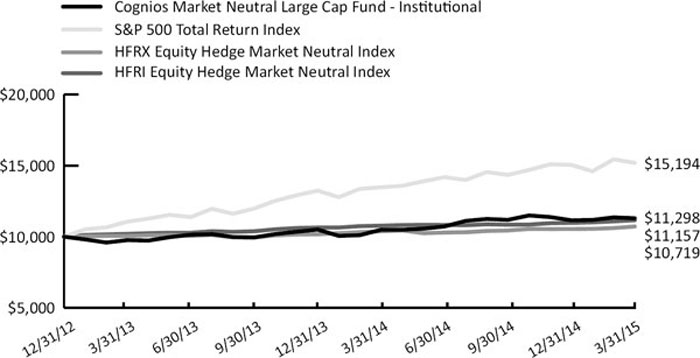
The graph shown above represents historical performance of a hypothetical investment of $10,000 in the Fund since inception. Past performance does not guarantee future results. All returns reflect reinvested dividends, but do not reflect the deduction of taxes that a shareholder would pay on Fund distributions or the redemption of Fund shares.
Sector Allocation (as a % of Net Assets)*
| Basic Materials - Long | 0.64 | % | ||
| Basic Materials (Short) | -8.34 | % | ||
| Communications - Long | 15.95 | % | ||
| Communications (Short) | -9.40 | % | ||
| Consumer Cyclical - Long | 5.25 | % | ||
| Consumer Cyclical (Short) | -12.51 | % | ||
| Consumer Non-cyclical - Long | 40.67 | % | ||
| Consumer Non-cyclical (Short) | -6.41 | % | ||
| Diversified (Short) | -0.06 | % | ||
| Energy - Long | 5.62 | % | ||
| Energy (Short) | -9.17 | % | ||
| Financials (Short) | -11.17 | % | ||
| Industrials - Long | 11.12 | % | ||
| Industrials (Short) | -9.34 | % | ||
| Technology - Long | 36.92 | % | ||
| Technology (Short) | -4.97 | % | ||
| Utilities - Long | 0.60 | % | ||
| Cash, Cash Equivalents, & Other Net Assets | 54.60 | % | ||
| TOTAL | 100.00 | % |
| * | Holdings are subject to change. Table presents indicative values only. |
| Semi-Annual Report | March 31, 2015 | 5 |
Cognios Market Neutral Large Cap Fund
| Portfolio Update | March 31, 2015 (Unaudited) |
Top 10 Long Positions (as a % of Net Assets)*
| Security | Ticker | Weight |
| Quest Diagnostics, Inc. | DGX | 5.90% |
| DaVita HealthCare Partners, Inc. | DVA | 5.88% |
| General Mills, Inc. | GIS | 5.76% |
| Accenture PLC | ACN | 5.63% |
| The Clorox Co. | CLX | 5.48% |
| Harris Corp. | HRS | 5.48% |
| Fiserv, Inc. | FISV | 5.47% |
| Campbell Soup Co. | CPB | 5.44% |
| International Business Machines Corp. | IBM | 5.44% |
| Total System Services, Inc. | TSS | 5.41% |
| * | Holdings are subject to change. Table presents indicative values only. |
| 6 | www.cogniosfunds.com |
Cognios Market Neutral Large Cap Fund
| Disclosure of Fund Expenses | March 31, 2015 (Unaudited) |
Examples. As a shareholder of the Cognios Market Neutral Large Cap Fund (the “Fund”), you will incur two types of costs: (1) transaction costs, (2) ongoing costs, including management fees, distribution and service (12b-1) fees and other Fund expenses. The following examples are intended to help you understand your ongoing costs (in dollars) of investing in the Fund and to compare these costs with the ongoing costs of investing in other mutual funds. The examples are based on an investment of $1,000 invested on October 1, 2014 and held until March 31, 2015.
Actual Expenses. The first line under each class in the table below provides information about actual account values and actual expenses. You may use the information in this line, together with the amount you invested, to estimate the expenses that you paid over the period. Simply divide your account value by $1,000 (for example, an $8,600 account value divided by $1,000 = 8.6), then multiply the result by the number in the first line under the heading “Expenses Paid During Period October 1, 2014 – March 31, 2015” to estimate the expenses you paid on your account during
this period.
this period.
Hypothetical Example for Comparison Purposes. The second line under each class in the table below provides information about hypothetical account values and hypothetical expenses based on the Fund’s actual expense ratio and an assumed rate of return of 5% per year before expenses, which is not the Fund’s actual return. The hypothetical account values and expenses may not be used to estimate the actual ending account balance or expenses you paid for the period. You may use this information to compare the ongoing costs of investing in the Fund and other mutual funds. To do so, compare this 5% hypothetical example with the 5% hypothetical examples that appear in the shareholder reports of the other funds.
Please note that the expenses shown in the table are meant to highlight your ongoing costs only and do not reflect any transactional costs, such as redemption fees. Therefore, the second line under each class in the table below is useful in comparing ongoing costs only and will not help you determine the relative total costs of owning different funds. In addition, if these transactional costs were included, your costs would have been higher.
| Beginning | Ending | Expenses Paid During Period | |||||||||
| Account Value | Account Value | Expense | October 1, 2014 - | ||||||||
| October 1, 2014 | March 31, 2015 | Ratio(a) | March 31, 2015(b) | ||||||||
| Investor Class | |||||||||||
| Actual | $ | 1,000.00 | $ | 1,009.10 | 4.44% | $ | 22.24 | ||||
| Hypothetical (5% return before expenses) | $ | 1,000.00 | $ | 1,002.79 | 4.44% | $ | 22.17 | ||||
| Institutional Class | |||||||||||
| Actual | $ | 1,000.00 | $ | 1,010.10 | 4.19% | $ | 21.00 | ||||
| Hypothetical (5% return | |||||||||||
| before expenses) | $ | 1,000.00 | $ | 1,004.04 | 4.19% | $ | 20.93 | ||||
(a) | Annualized, based on the Fund's most recent fiscal half-year expenses. Expense ratio excluding interest expense and dividends paid on borrowed securities is 2.25% and 2.00% for Investor Class and Institutional Class, respectively. |
(b) | Expenses are equal to the Fund’s annualized expense ratio, multiplied by the average account value over the period, multiplied by the number of days in the most recent fiscal half year (182), divided by 365. |
| Semi-Annual Report | March 31, 2015 | 7 |
| Cognios Market Neutral Large Cap Fund |
| Portfolio of Investments | March 31, 2015 (Unaudited) |
| Value | ||||||||
| Shares | (Note 2) | |||||||
| COMMON STOCKS (116.77%) | ||||||||
| Basic Materials (0.64%) | ||||||||
LyondellBasell Industries NV ‐ Class A(a) | 1,110 | $ | 97,458 | |||||
| Total Basic Materials | 97,458 | |||||||
| Communications (15.95%) | ||||||||
DIRECTV(a)(b) | 9,406 | 800,450 | ||||||
Harris Corp.(a) | 10,672 | 840,527 | ||||||
Viacom, Inc. ‐ Class B(a) | 11,819 | 807,238 | ||||||
| Total Communications | 2,448,215 | |||||||
| Consumer Cyclical (5.25%) | ||||||||
McDonald's Corp.(a) | 8,274 | 806,218 | ||||||
| Total Consumer Cyclical | 806,218 | |||||||
| Consumer Non‐cyclical (40.67%) | ||||||||
AmerisourceBergen Corp.(a) | 902 | 102,530 | ||||||
Archer‐Daniels‐Midland Co.(a) | 1,916 | 90,818 | ||||||
Campbell Soup Co.(a) | 17,948 | 835,479 | ||||||
The Clorox Co.(a) | 7,616 | 840,730 | ||||||
DaVita HealthCare Partners, Inc.(a)(b) | 11,113 | 903,265 | ||||||
General Mills, Inc.(a) | 15,611 | 883,583 | ||||||
Philip Morris International, Inc.(a) | 10,102 | 760,984 | ||||||
Quest Diagnostics, Inc.(a) | 11,790 | 906,062 | ||||||
Total System Services, Inc.(a) | 21,770 | 830,526 | ||||||
United Rentals, Inc.(a)(b) | 971 | 88,516 | ||||||
| Total Consumer Non‐cyclical | 6,242,493 | |||||||
| Energy (5.62%) | ||||||||
Apache Corp.(a) | 1,426 | 86,031 | ||||||
Denbury Resources, Inc.(a) | 11,181 | 81,510 | ||||||
Diamond Offshore Drilling, Inc.(a) | 3,131 | 83,879 | ||||||
Ensco PLC ‐ Class A(a) | 3,896 | 82,089 | ||||||
Marathon Oil Corp.(a) | 3,349 | 87,442 | ||||||
Murphy Oil Corp.(a) | 1,860 | 86,676 | ||||||
Nabors Industries, Ltd.(a) | 2,809 | 38,343 | ||||||
Newfield Exploration Co.(a)(b) | 1,196 | 41,968 | ||||||
Noble Corp. PLC(a) | 2,412 | 34,443 | ||||||
Occidental Petroleum Corp.(a) | 1,194 | 87,162 | ||||||
QEP Resources, Inc.(a) | 1,726 | 35,987 | ||||||
Southwestern Energy Co.(a)(b) | 3,568 | 82,742 | ||||||
Transocean, Ltd.(a) | 2,287 | 33,550 | ||||||
| Total Energy | 861,822 | |||||||
| See Notes to Financial Statements. |
| 8 | www.cogniosfunds.com |
| Cognios Market Neutral Large Cap Fund |
| Portfolio of Investments | March 31, 2015 (Unaudited) |
| Value | ||||||||
| Shares | (Note 2) | |||||||
| Industrials (11.12%) | ||||||||
3M Co.(a) | 4,919 | $ | 811,389 | |||||
Corning, Inc.(a) | 3,785 | 85,844 | ||||||
Emerson Electric Co.(a) | 14,297 | 809,496 | ||||||
| Total Industrials | 1,706,729 | |||||||
| Technology (36.92%) | ||||||||
Accenture PLC ‐ Class A(a) | 9,225 | 864,290 | ||||||
Apple, Inc.(a) | 6,440 | 801,329 | ||||||
EMC Corp.(a) | 28,844 | 737,253 | ||||||
Fiserv, Inc.(a)(b) | 10,571 | 839,337 | ||||||
International Business Machines Corp.(a) | 5,201 | 834,761 | ||||||
Microsoft Corp.(a) | 18,910 | 768,786 | ||||||
Oracle Corp.(a) | 19,046 | 821,835 | ||||||
| Total Technology | 5,667,591 | |||||||
| Utilities (0.60%) | ||||||||
Entergy Corp.(a) | 1,196 | 92,678 | ||||||
| Total Utilities | 92,678 | |||||||
| TOTAL COMMON STOCKS (Cost $17,792,863) | 17,923,204 | |||||||
| Value | ||||||||||||
| 7-Day Yield | Shares | (Note 2) | ||||||||||
| SHORT TERM INVESTMENTS (1.32%) | ||||||||||||
| Money Market Fund (1.32%) | ||||||||||||
| Daily Income Fund ‐ U.S. Treasury Portfolio ‐ Fiduciary Class | 0.01000 | % | 202,913 | 202,913 | ||||||||
| TOTAL SHORT TERM INVESTMENTS (Cost $202,913) | 202,913 | |||||||||||
| TOTAL INVESTMENTS (118.09%) (Cost $17,995,776) | $ | 18,126,117 | ||||||||||
| SECURITIES SOLD SHORT (‐71.37%) (Proceeds $10,653,029) | (10,955,047 | ) | ||||||||||
| Other Assets In Excess Of Liabilities (53.28%) | 8,178,333 | (c) | ||||||||||
| NET ASSETS (100.00%) | $ | 15,349,403 | ||||||||||
See Notes to Financial Statements.
| Semi‐Annual Report | March 31, 2015 | 9 |
| Cognios Market Neutral Large Cap Fund |
| Portfolio of Investments | March 31, 2015 (Unaudited) |
| Value | ||||||||
| Shares | (Note 2) | |||||||
| SCHEDULE OF SECURITIES SOLD SHORT | ||||||||
| COMMON STOCKS (-71.37%) | ||||||||
| Basic Materials (‐8.34%) | ||||||||
| Air Products & Chemicals, Inc. | (1,052 | ) | $ | (159,146 | ) | |||
| Alcoa, Inc. | (17,346 | ) | (224,110 | ) | ||||
| Allegheny Technologies, Inc. | (1,583 | ) | (47,506 | ) | ||||
| EI du Pont de Nemours & Co. | (3,342 | ) | (238,853 | ) | ||||
| Monsanto Co. | (2,157 | ) | (242,749 | ) | ||||
| Nucor Corp. | (4,565 | ) | (216,974 | ) | ||||
| PPG Industries, Inc. | (666 | ) | (150,210 | ) | ||||
| Total Basic Materials | (1,279,548 | ) | ||||||
| Communications (‐9.40%) | ||||||||
| CBS Corp. ‐ Class B | (2,232 | ) | (135,326 | ) | ||||
| Interpublic Group of Cos., Inc. | (3,818 | ) | (84,454 | ) | ||||
| Level 3 Communications, Inc. | (3,157 | ) | (169,973 | ) | ||||
| News Corp. ‐ Class A | (3,546 | ) | (56,771 | ) | ||||
| The Priceline Group, Inc. | (207 | ) | (240,979 | ) | ||||
| Time Warner, Inc. | (3,140 | ) | (265,142 | ) | ||||
| Twenty‐First Century Fox, Inc. ‐ Class A | (6,527 | ) | (220,874 | ) | ||||
| Yahoo! Inc | (6,078 | ) | (270,076 | ) | ||||
| Total Communications | (1,443,595 | ) | ||||||
| Consumer Cyclical (‐12.51%) | ||||||||
| Best Buy Co., Inc | (3,246 | ) | (122,666 | ) | ||||
| BorgWarner, Inc. | (1,085 | ) | (65,621 | ) | ||||
| CarMax, Inc. | (1,946 | ) | (134,293 | ) | ||||
| DR Horton, Inc. | (3,408 | ) | (97,060 | ) | ||||
| Ford Motor Co. | (16,220 | ) | (261,791 | ) | ||||
| GameStop Corp. ‐ Class A | (1,361 | ) | (51,664 | ) | ||||
| Goodyear Tire & Rubber Co. | (2,480 | ) | (67,158 | ) | ||||
| Johnson Controls, Inc. | (5,171 | ) | (260,825 | ) | ||||
| Lennar Corp. ‐ Class A | (1,631 | ) | (84,502 | ) | ||||
| Mohawk Industries, Inc. | (672 | ) | (124,824 | ) | ||||
| Newell Rubbermaid, Inc. | (1,324 | ) | (51,729 | ) | ||||
| PulteGroup, Inc. | (5,755 | ) | (127,934 | ) | ||||
| Royal Caribbean Cruises Ltd. | (2,004 | ) | (164,027 | ) | ||||
| Tiffany & Co. | (1,185 | ) | (104,292 | ) | ||||
| Tractor Supply Co. | (664 | ) | (56,480 | ) | ||||
| Whirlpool Corp. | (718 | ) | (145,079 | ) | ||||
| Total Consumer Cyclical | (1,919,945 | ) | ||||||
See Notes to Financial Statements.
| 10 | www.cogniosfunds.com |
| Cognios Market Neutral Large Cap Fund |
| Portfolio of Investments | March 31, 2015 (Unaudited) |
| Value | ||||||||
| Shares | (Note 2) | |||||||
| Consumer Non‐cyclical (‐6.41%) | ||||||||
| AbbVie, Inc. | (4,300 | ) | $ | (251,722 | ) | |||
| Avery Dennison Corp. | (970 | ) | (51,323 | ) | ||||
| Avon Products, Inc. | (6,031 | ) | (48,188 | ) | ||||
| Estee Lauder Cos., Inc. ‐ Class A | (1,139 | ) | (94,719 | ) | ||||
| Express Scripts Holding Co. | (3,064 | ) | (265,863 | ) | ||||
| McGraw Hill Financial, Inc. | (307 | ) | (31,744 | ) | ||||
| Moody’s Corp. | (236 | ) | (24,497 | ) | ||||
| Mylan, Inc. | (1,844 | ) | (109,441 | ) | ||||
| Robert Half International, Inc. | (832 | ) | (50,352 | ) | ||||
| Tenet Healthcare Corp. | (1,141 | ) | (56,491 | ) | ||||
| Total Consumer Non‐cyclical | (984,340 | ) | ||||||
| Diversified (‐0.06%) | ||||||||
| Leucadia National Corp. | (413 | ) | (9,206 | ) | ||||
| Total Diversified | (9,206 | ) | ||||||
| Energy (‐9.17%) | ||||||||
| Baker Hughes, Inc. | (6,276 | ) | (399,028 | ) | ||||
| Cameron International Corp. | (1,828 | ) | (82,479 | ) | ||||
| Chesapeake Energy Corp. | (704 | ) | (9,969 | ) | ||||
| CONSOL Energy, Inc. | (2,201 | ) | (61,386 | ) | ||||
| Hess Corp. | (2,714 | ) | (184,199 | ) | ||||
| Tesoro Corp. | (1,179 | ) | (107,631 | ) | ||||
| Valero Energy Corp. | (4,499 | ) | (286,227 | ) | ||||
| The Williams Cos., Inc. | (5,465 | ) | (276,474 | ) | ||||
| Total Energy | (1,407,393 | ) | ||||||
| Financials (‐11.17%) | ||||||||
| Affiliated Managers Group, Inc. | (63 | ) | (13,531 | ) | ||||
| Aflac, Inc. | (503 | ) | (32,197 | ) | ||||
| American Express Co. | (1,139 | ) | (88,979 | ) | ||||
| Ameriprise Financial, Inc. | (207 | ) | (27,084 | ) | ||||
| Bank of America Corp. | (11,720 | ) | (180,371 | ) | ||||
| BB&T Corp. | (804 | ) | (31,348 | ) | ||||
| BlackRock, Inc. | (184 | ) | (67,314 | ) | ||||
| Capital One Financial Corp. | (618 | ) | (48,711 | ) | ||||
| CBRE Group, Inc. ‐ Class A | (367 | ) | (14,207 | ) | ||||
| Charles Schwab Corp. | (1,441 | ) | (43,864 | ) | ||||
| Citigroup, Inc. | (3,364 | ) | (173,313 | ) | ||||
| Comerica, Inc. | (203 | ) | (9,161 | ) | ||||
| E*Trade Financial Corp. | (324 | ) | (9,252 | ) | ||||
| Fifth Third Bancorp | (919 | ) | (17,323 | ) | ||||
See Notes to Financial Statements.
| Semi‐Annual Report | March 31, 2015 | 11 |
| Cognios Market Neutral Large Cap Fund |
| Portfolio of Investments | March 31, 2015 (Unaudited) |
| Value | ||||||||
| Shares | (Note 2) | |||||||
| Financials (continued) | ||||||||
| Franklin Resources, Inc. | (696 | ) | $ | (35,719 | ) | |||
| General Growth Properties, Inc. ‐ REIT | (991 | ) | (29,284 | ) | ||||
| Host Hotels & Resorts, Inc. ‐ REIT | (831 | ) | (16,770 | ) | ||||
| Hudson City Bancorp, Inc. | (589 | ) | (6,173 | ) | ||||
| Huntington Bancshares, Inc. | (909 | ) | (10,044 | ) | ||||
| Invesco Ltd. | (481 | ) | (19,091 | ) | ||||
| JPMorgan Chase & Co. | (4,170 | ) | (252,619 | ) | ||||
| KeyCorp | (968 | ) | (13,707 | ) | ||||
| Kimco Realty Corp. ‐ REIT | (445 | ) | (11,948 | ) | ||||
| Legg Mason, Inc. | (127 | ) | (7,010 | ) | ||||
| Macerich Co. ‐ REIT | (171 | ) | (14,420 | ) | ||||
| Morgan Stanley | (2,177 | ) | (77,697 | ) | ||||
| The NASDAQ OMX Group, Inc. | (183 | ) | (9,322 | ) | ||||
| Navient Corp. | (460 | ) | (9,352 | ) | ||||
| Principal Financial Group, Inc. | (330 | ) | (16,952 | ) | ||||
| Prologis, Inc. ‐ REIT | (605 | ) | (26,354 | ) | ||||
| Prudential Financial, Inc. | (512 | ) | (41,119 | ) | ||||
| Regions Financial Corp. | (1,548 | ) | (14,629 | ) | ||||
| Torchmark Corp. | (143 | ) | (7,853 | ) | ||||
| Unum Group | (282 | ) | (9,512 | ) | ||||
| Wells Fargo & Co. | (5,736 | ) | (312,038 | ) | ||||
| XL Group PLC | (282 | ) | (10,378 | ) | ||||
| Zions Bancorporation | (226 | ) | (6,102 | ) | ||||
| Total Financials | (1,714,748 | ) | ||||||
| Industrials (‐9.34%) | ||||||||
| Allegion PLC | (891 | ) | (54,503 | ) | ||||
| Amphenol Corp. | (1,522 | ) | (89,691 | ) | ||||
| Eaton Corp. PLC | (2,330 | ) | (158,300 | ) | ||||
| Expeditors International of Washington, Inc. | (1,077 | ) | (51,890 | ) | ||||
| Fluor Corp. | (1,380 | ) | (78,881 | ) | ||||
| Illinois Tool Works, Inc. | (1,856 | ) | (180,292 | ) | ||||
| Ingersoll‐Rand PLC | (1,285 | ) | (87,483 | ) | ||||
| Leggett & Platt, Inc. | (1,137 | ) | (52,404 | ) | ||||
| Martin Marietta Materials, Inc. | (628 | ) | (87,794 | ) | ||||
| MeadWestvaco Corp. | (1,575 | ) | (78,545 | ) | ||||
| Pall Corp. | (518 | ) | (52,002 | ) | ||||
| Ryder System, Inc. | (565 | ) | (53,613 | ) | ||||
| Snap‐on, Inc. | (352 | ) | (51,765 | ) | ||||
| Textron, Inc. | (2,568 | ) | (113,839 | ) | ||||
| Tyco International, Ltd. | (2,043 | ) | (87,972 | ) | ||||
See Notes to Financial Statements.
| 12 | www.cogniosfunds.com |
| Cognios Market Neutral Large Cap Fund |
| Portfolio of Investments | March 31, 2015 (Unaudited) |
| Value | ||||||||
| Shares | (Note 2) | |||||||
| Industrials (continued) | ||||||||
| Vulcan Materials Co. | (1,226 | ) | $ | (103,352 | ) | |||
| Xylem, Inc. | (1,448 | ) | (50,709 | ) | ||||
| Total Industrials | (1,433,035 | ) | ||||||
| Technology (‐4.97%) | ||||||||
| Adobe Systems, Inc. | (2,455 | ) | (181,523 | ) | ||||
| Analog Devices, Inc. | (1,513 | ) | (95,319 | ) | ||||
| Applied Materials, Inc. | (5,945 | ) | (134,119 | ) | ||||
| Autodesk, Inc. | (1,126 | ) | (66,029 | ) | ||||
| Cognizant Technology Solutions Corp. ‐ Class A | (2,985 | ) | (186,234 | ) | ||||
| KLA‐Tencor Corp. | (788 | ) | (45,932 | ) | ||||
| Lam Research Corp. | (770 | ) | (54,081 | ) | ||||
| Total Technology | (763,237 | ) | ||||||
| TOTAL COMMON STOCKS (Proceeds $10,653,029) | (10,955,047 | ) | ||||||
| TOTAL SECURITIES SOLD SHORT (‐71.37%) (Proceeds $10,653,029) | $ | (10,955,047 | ) | |||||
| (a) | Security, or a portion of security, is being held as collateral for short sales. As of March 31, 2015, the aggregate market value of those securities was $8,572,390, which represents approximately 55.85% of the Fund’s net assets. |
| (b) | Non-income producing security. |
| (c) | Includes segregated cash that is being held as collateral for securities sold short. |
Common Abbreviations:
Ltd. - Limited.
NV - Naamloze Vennootschap is the Dutch term for a public limited liability corporation. PLC - Public Limited Company.
REIT - Real Estate Investment Trust.
For Fund compliance purposes, the Fund’s industry classifications refer to any one or more of the industry sub-classifications used by one or more widely recognized market indices or ratings group indices and/or as defined by Fund management. This definition may not apply for purposes of this report, which may combine industry sub-classifications for reporting ease. Industries are shown as a percent of the Fund's net assets. (Unaudited)
See Notes to Financial Statements.
| Semi‐Annual Report | March 31, 2015 | 13 |
| Cognios Market Neutral Large Cap Fund |
| Statement of Assets and Liabilities | March 31, 2015 (Unaudited) |
| ASSETS: | ||||
| Investments, at value (cost $17,995,776) | $ | 18,126,117 | ||
| Segregated cash with brokers (Note 2) | 21,574 | |||
| Deposit with broker for securities sold short (Note 2) | 8,148,222 | |||
| Due from advisor | 3,818 | |||
| Dividends receivable | 7,850 | |||
| Prepaid assets | 24,282 | |||
| Total Assets | 26,331,863 | |||
| LIABILITIES: | ||||
| Securities sold short (proceeds $10,653,029) | 10,955,047 | |||
| Payable for distribution and service fees | 1,245 | |||
| Payable to trustees | 89 | |||
| Payable to chief compliance officer | 1,645 | |||
| Payable to principal financial officer | 820 | |||
| Accrued expenses and other liabilities | 23,614 | |||
| Total Liabilities | 10,982,460 | |||
| NET ASSETS | $ | 15,349,403 | ||
| NET ASSETS CONSIST OF: | ||||
| Paid‐in capital (Note 5) | $ | 15,595,020 | ||
| Accumulated net investment loss | (162,612 | ) | ||
| Accumulated net realized gain on investments and securities sold short | 88,672 | |||
| Net unrealized depreciation on investments and securities sold short | (171,677 | ) | ||
| NET ASSETS | $ | 15,349,403 | ||
| PRICING OF SHARES | ||||
Investor Class: | ||||
| Net Asset Value, offering and redemption price per share | $ | 9.35 | ||
| Net Assets | $ | 5,897,722 | ||
| Shares of beneficial interest outstanding | 630,529 | |||
Institutional Class: | ||||
| Net Asset Value, offering and redemption price per share | $ | 9.41 | ||
| Net Assets | $ | 9,451,681 | ||
| Shares of beneficial interest outstanding | 1,004,435 | |||
| See Notes to Financial Statements. |
| 14 | www.cogniosfunds.com |
| Cognios Market Neutral Large Cap Fund |
| Statement of Operations | For the Six Months Ended March 31, 2015 (Unaudited) |
| INVESTMENT INCOME: | ||||
| Dividends | $ | 160,926 | ||
| Total Investment Income | 160,926 | |||
| EXPENSES: | ||||
| Investment advisory fee (Note 6) | 113,139 | |||
| Dividend expense on securities sold short | 112,194 | |||
| Interest expense | 53,149 | |||
| Administration fee | 70,457 | |||
| Distribution and service fees | ||||
| Investor Class | 7,299 | |||
| Custodian fee | 4,987 | |||
| Legal fees | 18,354 | |||
| Audit fees | 8,275 | |||
| Transfer agent fee | 19,892 | |||
| Trustees fees and expenses | 5,830 | |||
| Registration and filing fees | 16,535 | |||
| Printing fees | 3,859 | |||
| Chief compliance officer fee | 9,978 | |||
| Principal financial officer fee | 4,987 | |||
| Insurance expense | 3,248 | |||
| Other expenses | 3,908 | |||
| Total Expenses | 456,091 | |||
| Less fees waived/reimbursed by investment adviser | ||||
| Investor Class | (51,321 | ) | ||
| Institutional Class | (81,277 | ) | ||
| Total fees waived/reimbursed by investment adviser (Note 6) | (132,598 | ) | ||
| Net Expenses | 323,493 | |||
| NET INVESTMENT LOSS | (162,567 | ) | ||
| REALIZED AND UNREALIZED GAIN/(LOSS) ON INVESTMENTS: | ||||
| Net realized gain on: | ||||
| Investments | 689,898 | |||
| Securities sold short | 142,199 | |||
| Net realized gain | 832,097 | |||
| Change in (depreciation) on: | ||||
| Investments | (163,660 | ) | ||
| Securities sold short | (378,218 | ) | ||
| Net change | (541,878 | ) | ||
| NET REALIZED AND UNREALIZED GAIN ON INVESTMENTS AND SECURITIES SOLD SHORT | 290,219 | |||
| NET INCREASE IN NET ASSETS RESULTING FROM OPERATIONS | $ | 127,652 | ||
| See Notes to Financial Statements. |
| Semi‐Annual Report | March 31, 2015 | 15 |
| Cognios Market Neutral Large Cap Fund |
| Statements of Changes in Net Assets | ||||||||
| For the Six | For the Year | |||||||
| Months Ended | Ended | |||||||
| March 31, 2015 | September 30, | |||||||
| (Unaudited) | 2014 | |||||||
| OPERATIONS: | ||||||||
| Net investment loss | $ | (162,567 | ) | $ | (226,799 | ) | ||
| Net realized gain on investments and securities sold short | 832,097 | 1,759,181 | ||||||
| Net change in unrealized appreciation/(depreciation) on investments and securities sold short | (541,878 | ) | 605,237 | |||||
| Net increase in net assets resulting from operations | 127,652 | 2,137,619 | ||||||
| DISTRIBUTIONS TO SHAREHOLDERS: | ||||||||
| From net realized gains on investments: | ||||||||
| Investor Class | (790,016 | ) | (170,799 | ) | ||||
| Institutional Class | (1,258,654 | ) | (215,970 | ) | ||||
| Total distributions | (2,048,670 | ) | (386,769 | ) | ||||
| BENEFICIAL SHARE TRANSACTIONS (Note 5): | ||||||||
| Investor Class: | ||||||||
| Shares sold | 415,417 | 125,097 | ||||||
| Dividends reinvested | 789,357 | 170,799 | ||||||
| Shares redeemed | (258,534 | ) | (105,773 | ) | ||||
| Net increase from beneficial share transactions | 946,240 | 190,122 | ||||||
| Institutional Class: | ||||||||
| Shares sold | 632,461 | 35,902,787 | ||||||
| Dividends reinvested | 1,221,472 | 215,970 | ||||||
| Shares redeemed | (136,047 | ) | (34,648,888 | ) | ||||
| Net increase from beneficial share transactions | 1,717,886 | 1,469,870 | ||||||
| Net increase in net assets | 743,108 | 3,410,842 | ||||||
| NET ASSETS: | ||||||||
| Beginning of period | 14,606,295 | 11,195,453 | ||||||
| End of period (including accumulated net investment loss of $(162,612) and $(45)) | $ | 15,349,403 | $ | 14,606,295 | ||||
| See Notes to Financial Statements. |
| 16 | www.cogniosfunds.com | ||
| Cognios Market Neutral Large Cap Fund |
| Statement of Cash Flows | For the Six Months Ended March 31, 2015 (Unaudited) |
| CASH FLOWS FROM OPERATING ACTIVITIES: | ||||
| Net increase in net assets from operations | $ | 127,652 | ||
| Adjustments to reconcile net increase in net assets from operations to net cash used in operating activities: | ||||
| Purchases of investment securities | (33,946,165 | ) | ||
| Proceeds from disposition of investment securities | 33,751,024 | |||
| Proceeds from securities sold short transactions | 15,362,257 | |||
| Purchases to cover securities sold short transactions | (18,096,445 | ) | ||
| Net purchases from short‐term investment securities | (156,534 | ) | ||
| Net realized gain on investments and securities sold short | (832,097 | ) | ||
| Net change in unrealized depreciation on investments and securities sold short | ||||
| 541,878 | ||||
| Changes in assets and liabilities: | ||||
| Increase in segregated cash with brokers | (2,020 | ) | ||
| Decrease in deposit with broker for securities sold short | 2,655,856 | |||
| Increase in receivable due from adviser | (35 | ) | ||
| Increase in dividends receivable | (555 | ) | ||
| Increase in interest receivable | (2 | ) | ||
| Increase in prepaid assets | (14,923 | ) | ||
| Decrease in payable for dividends on short sales | (11,000 | ) | ||
| Increase in payable for distribution and service fees | 82 | |||
| Decrease in payable to trustees | (55 | ) | ||
| Decrease in payable to chief compliance officer | (22 | ) | ||
| Decrease in payable to principal financial officer | (13 | ) | ||
| Decrease in other accrued expenses and other liabilities | (34,339 | ) | ||
| Net cash used in operating activities | (655,456 | ) | ||
| CASH FLOWS PROVIDED BY FINANCING ACTIVITIES: | ||||
| Proceeds from sale of shares | 1,087,878 | |||
| Cost of shares redeemed | (394,581 | ) | ||
| Cash distributions paid | (37,841 | ) | ||
| Net cash provided by financing activities | 655,456 | |||
| NET INCREASE IN CASH FOR THE PERIOD | — | |||
| CASH, BEGINNING OF PERIOD | $ | — | ||
| CASH, END OF PERIOD | $ | — | ||
| SUPPLEMENTAL DISCLOSURE OF CASH FLOW INFORMATION: | ||||
| Non‐cash financing activities not included herein consist of reinvestment of distributions of: | $ | 2,048,670 | ||
| See Notes to Financial Statements. |
| Semi‐Annual Report | March 31, 2015 | 17 |
| Cognios Market Neutral Large Cap Fund‐ Investor Class |
| Financial Highlights | For a share outstanding throughout the periods presented. |
| For the Six | For the Year | For the Period | ||||||||||
| Months Ended | Ended | Ended | ||||||||||
| March 31, 2015 | September 30, | September 30, | ||||||||||
| (Unaudited) | 2014 | 2013(a) | ||||||||||
| NET ASSET VALUE, BEGINNING OF PERIOD | $ | 10.77 | $ | 9.93 | $ | 10.00 | ||||||
| INCOME/(LOSS) FROM OPERATIONS: | ||||||||||||
Net investment loss(b) | (0.11 | ) | (0.17 | ) | (0.12 | ) | ||||||
| Net realized and unrealized gain on investments | 0.18 | 1.35 | 0.05 | |||||||||
| Total from Investment Operations | 0.07 | 1.18 | (0.07 | ) | ||||||||
| LESS DISTRIBUTIONS: | �� | |||||||||||
| From net realized gains on investments | (1.49 | ) | (0.34 | ) | — | |||||||
| Total Distributions | (1.49 | ) | (0.34 | ) | — | |||||||
| NET INCREASE/(DECREASE) IN NET | ||||||||||||
| ASSET VALUE | (1.42 | ) | 0.84 | (0.07 | ) | |||||||
| NET ASSET VALUE, END OF PERIOD | $ | 9.35 | $ | 10.77 | $ | 9.93 | ||||||
TOTAL RETURN(c) | 0.91 | %(d) | 12.12 | % | (0.70 | )%(d) | ||||||
| See Notes to Financial Statements. |
| 18 | www.cogniosfunds.com |
| Cognios Market Neutral Large Cap Fund‐ Investor Class | ||||||
| Financial Highlights (continued) | For a share outstanding throughout the periods presented. |
| For the Six | For the Year | For the Period | ||||||||||
| Months Ended | Ended | Ended | ||||||||||
| March 31, 2015 | September 30, | September 30, | ||||||||||
| (Unaudited) | 2014 | 2013(a) | ||||||||||
| SUPPLEMENTAL DATA: | ||||||||||||
| Net assets, End of Period (in 000s) | $ | 5,898 | $ | 5,699 | $ | 5,067 | ||||||
| RATIOS TO AVERAGE NET ASSETS (including interest expense and dividend expense on securities sold short) | ||||||||||||
| Operating expenses excluding reimbursement/waiver | 6.20 | %(e) | 6.16 | % | 6.27 | %(e) | ||||||
| Operating expenses including reimbursement/waiver | 4.44 | %(e) | 4.26 | % | 4.13 | %(e) | ||||||
| Net investment loss including reimbursement/waiver | (2.31 | )%(e) | (1.71 | )% | (1.69 | )%(e) | ||||||
| RATIOS TO AVERAGE NET ASSETS (excluding interest expense and dividend expense on securities sold short) | ||||||||||||
| Operating expenses excluding reimbursement/waiver | 4.01 | %(e) | 4.15 | % | 4.38 | %(e) | ||||||
| Operating expenses including reimbursement/waiver | 2.25 | %(e) | 2.25 | % | 2.25 | %(e) | ||||||
| Net investment income including reimbursement/waiver | (0.12 | )%(e) | 0.30 | % | 0.19 | %(e) | ||||||
| PORTFOLIO TURNOVER RATE | 157 | %(d) | 461 | % | 155 | %(d) | ||||||
| (a) | Commenced operations on January 2, 2013. |
| (b) | Per share amounts are based upon average shares outstanding. |
| (c) | The total return would have been lower had certain expenses not been reimbursed/waived during the period. The return shown does not reflect the deduction of taxes that a shareholder would pay on Fund distributions or the redemption of Fund shares. |
| (d) | Not annualized. |
| (e) | Annualized. |
| See Notes to Financial Statements. |
| Semi‐Annual Report | March 31, 2015 | 19 |
| Cognios Market Neutral Large Cap Fund ‐ Investor Class |
| Financial Highlights | For a share outstanding throughout the periods presented. |
| For the Six | For the Year | For the Period | ||||||||||
| Months Ended | Ended | Ended | ||||||||||
| March 31, 2015 | September 30, | September 30, | ||||||||||
| (Unaudited) | 2014 | 2013(a) | ||||||||||
| NET ASSET VALUE, BEGINNING OF PERIOD | $ | 10.82 | $ | 9.95 | $ | 10.00 | ||||||
| INCOME/(LOSS) FROM OPERATIONS: | ||||||||||||
Net investment loss(b) | (0.10 | ) | (0.14 | ) | (0.10 | ) | ||||||
| Net realized and unrealized gain on investments | 0.18 | 1.35 | 0.05 | |||||||||
| Total from Investment Operations | 0.08 | 1.21 | (0.05 | ) | ||||||||
| LESS DISTRIBUTIONS: | ||||||||||||
| From net realized gains on investments | (1.49 | ) | (0.34 | ) | — | |||||||
| Total Distributions | (1.49 | ) | (0.34 | ) | — | |||||||
| NET INCREASE/(DECREASE) IN NET ASSET VALUE | (1.41 | ) | 0.87 | (0.05 | ) | |||||||
| NET ASSET VALUE, END OF PERIOD | $ | 9.41 | $ | 10.82 | $ | 9.95 | ||||||
TOTAL RETURN(c) | 1.01 | %(d) | 12.41 | % | (0.50 | )%(d) | ||||||
| See Notes to Financial Statements. |
| 20 | www.cogniosfunds.com |
| Cognios Market Neutral Large Cap Fund ‐ Institutional Class |
| Financial Highlights (continued) | For a share outstanding throughout the periods presented. |
| For the Six | For the Year | For the Period | ||||||||||
| Months Ended | Ended | Ended | ||||||||||
| March 31, 2015 | September 30, | September 30, | ||||||||||
| (Unaudited) | 2014 | 2013(a) | ||||||||||
| SUPPLEMENTAL DATA: | ||||||||||||
| Net assets, End of Period (in 000s) | $ | 9,452 | $ | 8,907 | $ | 6,128 | ||||||
| RATIOS TO AVERAGE NET ASSETS (including interest expense and dividend expense on securities sold short) | ||||||||||||
| Operating expenses excluding reimbursement/waiver | 5.95 | %(e) | 5.45 | % | 6.02 | %(e) | ||||||
| Operating expenses including reimbursement/waiver | 4.19 | %(e) | 4.01 | % | 3.88 | %(e) | ||||||
| Net investment loss including reimbursement/waiver | (2.06 | )%(e) | (1.37 | )% | (1.42 | )%(e) | ||||||
| RATIOS TO AVERAGE NET ASSETS (excluding interest expense and dividend expense on securities sold short) | ||||||||||||
| Operating expenses excluding reimbursement/waiver | 3.76 | %(e) | 3.43 | % | 4.13 | %(e) | ||||||
| Operating expenses including reimbursement/waiver | 2.00 | %(e) | 2.00 | % | 2.00 | %(e) | ||||||
| Net investment income including reimbursement/waiver | 0.13 | %(e) | 0.65 | % | 0.46 | %(e) | ||||||
| PORTFOLIO TURNOVER RATE | 157 | %(d) | 461 | % | 155 | %(d) | ||||||
| (a) | Commenced operations on January 2, 2013. |
| (b) | Per share amounts are based upon average shares outstanding. |
| (c) | The total return would have been lower had certain expenses not been reimbursed/waived during the period. The return shown does not reflect the deduction of taxes that a shareholder would pay on Fund distributions or the redemption of Fund shares. |
| (d) | Not annualized. |
| (e) | Annualized. |
| See Notes to Financial Statements. |
| Semi‐Annual Report | March 31, 2015 | 21 |
| Cognios Market Neutral Large Cap Fund |
| Notes to Financial Statements | March 31, 2015 (Unaudited) |
1. ORGANIZATION
ALPS Series Trust (the “Trust”), a Delaware statutory trust, is an open-end management investment company registered under the Investment Company Act of 1940, as amended (the “1940 Act”). As of March 31, 2015, the Trust had nine registered funds. This semi-annual report describes the Cognios Market Neutral Large Cap Fund (the “Fund”). The Fund seeks long-term growth of capital independent of stock market direction. The Fund currently offers Investor Class shares and Institutional Class shares. Each share class has identical rights to earnings, assets and voting privileges, except for class specific expensive and exclusive rights to vote on matters affecting only individual classes. The Trust has an unlimited number of shares with no par value per share. The Board of Trustees (the “Board”) may establish additional funds and classes of shares at any time in the future without shareholder approval.
2. SIGNIFICANT ACCOUNTING POLICIES
The accompanying financial statements were prepared in accordance with accounting principles generally accepted in the United States of America for investment companies (“U.S. GAAP”). The Fund is considered an investment company for financial reporting purposes. The preparation of financial statements in conformity with U.S. GAAP requires management to make certain estimates and assumptions that affect the reported amounts of assets and liabilities and disclosures of contingent assets and liabilities at the date of the financial statements and the reported amounts of revenue and expenses during the period. Actual results could differ from those estimates. The following is a summary of significant accounting policies consistently followed by the Fund in preparation of the financial statements.
Investment Valuation: The Fund generally values its securities based on market prices determined at the close of regular trading on the New York Stock Exchange (“NYSE”), normally 4:00 p.m. Eastern Time, on each day the NYSE is open for trading.
For equity securities and mutual funds that are traded on an exchange, the market price is usually the closing sale or official closing price on that exchange. In the case of equity securities not traded on an exchange, or if such closing prices are not otherwise available, the securities are valued at the mean of the most recent bid and ask prices on such day.
Redeemable securities issued by open-end registered investment companies are valued at the investment company’s applicable net asset value, with the exception of exchange-traded open-end investment companies, which are priced as equity securities.
When such prices or quotations are not available, or when the Fair Value Committee appointed by the Board believes that they are unreliable, securities may be priced using fair value procedures approved by the Board.
Fair Value Measurements: The Fund discloses the classification of its fair value measurements following a three-tier hierarchy based on the inputs used to measure fair value. Inputs refer broadly to the assumptions that market participants would use in pricing the asset or liability, including assumptions about risk. Inputs may be observable or unobservable. Observable inputs
| 22 | www.cogniosfunds.com |
| Cognios Market Neutral Large Cap Fund |
| Notes to Financial Statements | March 31, 2015 (Unaudited) |
Various inputs are used in determining the value of the Fund’s investments as of the end of the reporting period. When inputs used fall into different levels of the fair value hierarchy, the level in the hierarchy within which the fair value measurement falls is determined based on the lowest level input that is significant to the fair value measurement in its entirety. The designated input levels are not necessarily an indication of the risk or liquidity associated with these investments. These inputs are categorized in the following hierarchy under applicable financial accounting standards:
| Level 1 – | Unadjusted quoted prices in active markets for identical investments, unrestricted assets or liabilities that the Fund has the ability to access at the measurement date; |
| Level 2 – | Quoted prices which are not active, quoted prices for similar assets or liabilities in active markets or inputs other than quoted prices that are observable (either directly or indirectly) for substantially the full term of the asset or liability; and |
| Level 3 – | Significant unobservable prices or inputs (including the Fund’s own assumptions in determining the fair value of investments) where there is little or no market activity for the asset or liability at the measurement date. |
The following is a summary of the inputs used to value the Fund’s investments as of March 31, 2015:
| Investments in Securities at Value | Level 1 - Quoted Prices | Level 2 - Other Significant Observable Inputs | Level 3 - Significant Unobservable Inputs | Total | ||||||||||||
| Common Stocks | ||||||||||||||||
| Basic Materials | $ | 97,458 | $ | — | $ | — | $ | 97,458 | ||||||||
| Communications | 2,448,215 | — | — | 2,448,215 | ||||||||||||
| Consumer Cyclical | 806,218 | — | — | 806,218 | ||||||||||||
| Consumer Non-cyclical | 6,242,493 | — | — | 6,242,493 | ||||||||||||
| Energy | 861,822 | — | — | 861,822 | ||||||||||||
| Industrials | 1,706,729 | — | — | 1,706,729 | ||||||||||||
| Technology | 5,667,591 | — | — | 5,667,591 | ||||||||||||
| Utilities | 92,678 | — | — | 92,678 | ||||||||||||
| Short Term Investments | 202,913 | — | — | 202,913 | ||||||||||||
| Total | $ | 18,126,117 | $ | — | $ | — | $ | 18,126,117 | ||||||||
| Semi-Annual Report | March 31, 2015 | 23 |
| Cognios Market Neutral Large Cap Fund |
| Notes to Financial Statements | March 31, 2015 (Unaudited) |
| Other Financial Instruments | ||||||||||||||||
| Liabilities | ||||||||||||||||
| Securities Sold Short | ||||||||||||||||
| Basic Materials | $ | (1,279,548 | ) | $ | — | $ | — | $ | (1,279,548 | ) | ||||||
| Communications | (1,443,595 | ) | — | — | (1,443,595 | ) | ||||||||||
| Consumer Cyclical | (1,919,945 | ) | — | — | (1,919,945 | ) | ||||||||||
| Consumer Non-cyclical | (984,340 | ) | — | — | (984,340 | ) | ||||||||||
| Diversified | (9,206 | ) | — | — | (9,206 | ) | ||||||||||
| Energy | (1,407,393 | ) | — | — | (1,407,393 | ) | ||||||||||
| Financials | (1,714,748 | ) | — | — | (1,714,748 | ) | ||||||||||
| Industrials | (1,433,035 | ) | — | — | (1,433,035 | ) | ||||||||||
| Technology | (763,237 | ) | — | — | (763,237 | ) | ||||||||||
| Total | $ | (10,955,047 | ) | $ | — | $ | — | $ | (10,955,047 | ) | ||||||
The Fund recognizes transfers between levels as of the end of the period. For the period ended March 31, 2015, the Fund did not have any transfers between Level 1 and Level 2 securities. There were no Level 3 securities held during the period.
Trust Expenses: Some expenses of the Trust can be directly attributed to the Fund. Expenses that cannot be directly attributed to the Fund are apportioned among all funds in the Trust based on average net assets of each fund.
Fund Expenses: Some expenses can be directly attributed to the Fund and are apportioned among the classes based on average net assets of each class.
Class Expenses: Expenses that are specific to a class of shares are charged directly to that share class. Fees provided under the distribution (Rule 12b-1) and/or shareholder service plans for a particular class of the Fund are charged to the operations of such class.
Federal Income Taxes: The Fund complies with the requirements under Subchapter M of the Internal Revenue Code of 1986, as amended, applicable to regulated investment companies and intends to distribute substantially all of its net taxable income and net capital gains, if any, each year so that it will not be subject to excise tax on undistributed income and gains. The Fund is not subject to income taxes to the extent such distributions are made.
As of and during the period ended March 31, 2015, the Fund did not have a liability for any unrecognized tax benefits in the accompanying financial statements. The Fund files U.S. federal, state and local income tax returns as required. The Fund’s tax returns are subject to examination by the relevant tax authorities until expiration of the applicable statute of limitations, which is generally three years after the filing of the tax return for federal purposes and four years for most state returns. The Fund’s administrator has analyzed the Fund’s tax positions taken on federal and state income tax returns for all open tax years and has concluded that as of March 31, 2015, no provision for income tax is required in the Fund’s financial statements related to these tax positions.
| 24 | www.cogniosfunds.com |
| Cognios Market Neutral Large Cap Fund |
| Notes to Financial Statements | March 31, 2015 (Unaudited) |
Investment Transactions and Investment Income: Investment transactions are accounted for on the date the investments are purchased or sold (trade date basis). Net realized gains and losses from investment transactions are reported on an identified cost basis. Interest income, which includes accretion of discounts and amortization of premiums, is accrued and recorded as earned. Dividend income is recognized on the ex-dividend date. All of the realized and unrealized gains and losses and net investment income, are allocated daily to each class in proportion to its average daily net assets.
Distributions to Shareholders: The Fund normally pays dividends and distributes capital gains, if any, on an annual basis. Income dividend distributions are derived from interest and other income the Fund receives from its investments, including short term capital gains. Long term capital gain distributions are derived from gains realized when the Fund sells a security it has owned for more than one year. The Fund may make additional distributions and dividends at other times if its portfolio manager or managers believe doing so may be necessary for the Fund to avoid or reduce taxes. Net investment income/(loss) and net realized gain/(loss) may differ for financial statement and tax purposes.
Short Sales: The Fund may sell securities short. To do this, Cognios Capital, LLC (the “Adviser”) will borrow and then sell (take short positions in) equity securities of U.S. companies that the Adviser believes are likely to underperform the long positions over time. To complete such a transaction, the Fund must borrow the security to deliver to the buyer. The Fund then is obligated to replace the security borrowed by purchasing it in the open market at some later date. The Fund bears the risk of a loss if the market price of the security increases between the date of the short sale and the date on which the Fund replaces the borrowed security. The Fund will realize a gain if the security declines in value between those dates. There can be no assurance that securities necessary to cover a short position will be available for purchase. To mitigate leverage risk, the Fund will segregate liquid assets (which may include its long positions) at least equal to its short position exposure, marked-to-market daily. The Fund maintains collateral consisting of cash, U.S. Government securities or other liquid assets in an amount at least equal to the market value of their respective short positions. The Fund is liable for any dividends or interest payable on securities while those securities are in a short position. The Fund typically intends to hold securities sold short for the short term, therefore, they are excluded from the purchase and sales of investments in Note 4 and the Fund’s Portfolio Turnover Calculation in the Financial Highlights. As of March 31, 2015, the Fund held securities sold short with a market value of $10,955,047.
3. TAX BASIS INFORMATION
Tax Basis of Distributions to Shareholders: The character of distributions made during the period from net investment income or net realized gains may differ from its ultimate characterization for federal income tax purposes. Also, due to the timing of dividend distributions, the fiscal year in which amounts are distributed may differ from the fiscal year in which the income or realized gain were recorded by the Fund. The amounts and characteristics of tax basis distributions and composition of distributable earnings/(accumulated losses) are finalized at fiscal year‐end. Accordingly, tax basis balances have not been determined as of the date of the semi-annual.
| Semi-Annual Report | March 31, 2015 | 25 |
| Cognios Market Neutral Large Cap Fund |
| Notes to Financial Statements | March 31, 2015 (Unaudited) |
The tax character of distributions paid by the Fund for the fiscal year ended September 30, 2014 were as follows:
| Distributions Paid From: | 2014 | |||
| Ordinary Income | $ | 386,769 | ||
| Total | $ | 386,769 | ||
Unrealized Appreciation and Depreciation on Investments: As of March 31, 2015, the aggregate cost of investments, gross unrealized appreciation/(depreciation) and net unrealized appreciation for Federal tax purposes were as follows:
| Gross unrealized appreciation (excess of value over tax cost) | $ | 443,348 | ||
| Gross unrealized depreciation (excess of tax cost over value) | (602,591 | ) | ||
| Net unrealized depreciation | $ | (159,243 | ) | |
| Cost of investments for income tax purposes | $ | 18,285,360 |
4. SECURITIES TRANSACTIONS
Purchases and sales of securities, excluding securities sold short intended to be held for less than one year and short-term securities, during the period ended March 31, 2015, were as follows:
| Purchases of Securities | Proceeds from Sales of Securities | |||||||
| $ | 49,308,423 | $ | 51,847,469 | |||||
5. BENEFICIAL SHARE TRANSACTIONS
The capitalization of the Trust consists of an unlimited number of shares of beneficial interest with no par value per share. Holders of the shares of the Fund have one vote for each share held and a proportionate fraction of a vote for each fractional share. All shares issued and outstanding are fully paid and are non-assessable, transferable and redeemable at the option of the shareholder. Shares have no pre-emptive rights.
| 26 | www.cogniosfunds.com |
| Cognios Market Neutral Large Cap Fund |
| Notes to Financial Statements | March 31, 2015 (Unaudited) |
Transactions in common shares were as follows:
| For the Six Months Ended March 31, 2015 (Unaudited) | For the Year Ended September 30, 2014 | |||||||
| Investor Class | ||||||||
| Shares sold | 40,255 | 12,035 | ||||||
| Shares issued in reinvestment of distributions to shareholders | 85,987 | 17,200 | ||||||
| Shares redeemed | (24,704 | ) | (10,519 | ) | ||||
| Net increase in shares outstanding | 101,538 | 18,716 | ||||||
| Institutional Class | ||||||||
| Shares sold | 63,256 | 3,511,372 | ||||||
| Shares issued in reinvestment of distributions to shareholders | 132,337 | 21,706 | ||||||
| Shares redeemed | (14,531 | ) | (3,325,663 | ) | ||||
| Net increase in shares outstanding | 181,062 | 207,415 | ||||||
Control is defined by the 1940 Act as the beneficial ownership, either directly or through one or more controlled companies, of more than 25% of the voting securities of a company. The Fund has one affiliated shareholder representing approximately 73% of total Fund shares. Investment activities of these shareholders could have a material impact on the Fund.
6. MANAGEMENT AND RELATED PARTY TRANSACTIONS
Investment Advisory: Cognios Capital, LLC (“Cognios Capital” or the “Adviser”), subject to the authority of the Board, is responsible for the overall management and administration of the Fund’s business affairs. The Adviser manages the investments of the Fund in accordance with the Fund’s investment objective, policies and limitations and investment guidelines established by the Adviser and the Board.
Pursuant to the Investment Advisory Agreement (the “Advisory Agreement”), the Fund pays the Adviser an annual management fee of 1.50% based on the Fund’s average daily net assets. The management fees are paid on a monthly basis. The initial term of the Advisory Agreement is two years. The Board may extend the Advisory Agreement for additional one-year terms. The Board, shareholders of the Fund or Adviser may terminate the Advisory Agreement upon 60 days’ notice.
Pursuant to a fee waiver letter agreement (the “Fee Waiver Agreement”), the Adviser has agreed contractually to reduce the fees payable to it under the Advisory Agreement (but not below zero) and/or reimburse other expenses of the Fund attributable to services provided by the Fund’s administrator and its affiliates (including, but not limited to, organizational expenses and offering costs), to the extent necessary to limit the Total Annual Fund Operating Expenses of each of the Investor Class and Institutional Class shares of the Fund (exclusive of brokerage costs, interest, taxes, dividends, litigation expenses, indemnification amounts, borrowing costs, brokerage expenses and dividend expenses on securities sold short, distribution/12b‐1 fees and extraordinary expenses) to 2.00% of the Fund’s average annual net assets until March 31, 2015. Effective
| Semi-Annual Report | March 31, 2015 | 27 |
| Cognios Market Neutral Large Cap Fund |
| Notes to Financial Statements | March 31, 2015 (Unaudited) |
April 1, 2015, the Adviser will further reduce the fees payable to it as noted above to 1.70% of the Fund’s average annual net assets. The Fee Waiver Agreement is in effect through January 31, 2016 and may not be terminated or modified prior to this date except with the approval of the Fund’s Board of Trustees. The Adviser will be permitted to recover expenses on a class-by-class basis expenses it has borne through the Fee Waiver Agreement to the extent that the Fund’s expenses in later periods fall below the annual rates set forth in the Fee Waiver Agreement. The Fund will not be obligated to pay any such deferred fees and expenses more than three years after the end of the fiscal year in which the fees and expenses were deferred.
For the six-month period ended March 31, 2015, the fee waivers and/or reimbursements were as follows:
Fees Waived/ Reimbursed by Adviser | ||||
| Investor Class | $ | (51,321 | ) | |
| Institutional Class | (81,277 | ) | ||
| TOTAL | $ | (132,598 | ) | |
As of March 31, 2015, the balances of recoupable expenses for each class were as follows:
| Expiring in 2016 | Expiring in 2017 | Expiring in 2018 | ||||||||||
| Investor Class | (79,516 | ) | (92,011 | ) | (51,321 | ) | ||||||
| Institutional Class | (88,889 | ) | (125,422 | ) | (81,277 | ) | ||||||
Administrator: ALPS Fund Services, Inc. (“ALPS”) (an affiliate of ALPS Distributors, Inc.) serves as administrator to the Fund. The Fund has agreed to pay expenses incurred in connection with its administrative activities. Pursuant to the Administration, Bookkeeping and Pricing Services Agreement, ALPS will provide operational services to the Fund including, but not limited to, fund accounting and fund administration and generally assist in the Fund’s operations. The Fund’s administration fee is accrued on a daily basis and paid on a monthly basis following the end of the month. The officers of the Trust are employees of ALPS. Administration fees paid by the Fund for the six months ended March 31, 2015 are disclosed in the Statement of Operations.
ALPS is reimbursed by the Fund for certain out-of-pocket expenses.
Transfer Agent: ALPS serves as transfer agent for the Fund under a Transfer Agency and Services Agreement with the Trust. Under this agreement, ALPS is paid an annual fee for services performed on behalf of the Fund plus fees for open accounts and is reimbursed for certain out-of-pocket expenses.
Compliance Services: ALPS provides services as the Fund’s Chief Compliance Officer to monitor and test the policies and procedures of the Fund in conjunction with requirements under Rule 38a-1 of the 1940 Act under a Chief Compliance Officer Services Agreement. Under this agreement, ALPS is paid an annual fee for services performed on behalf of the Fund and is reimbursed for certain out-of-pocket expenses.
| 28 | www.cogniosfunds.com |
| Cognios Market Neutral Large Cap Fund |
| Notes to Financial Statements | March 31, 2015 (Unaudited) |
Principal Financial Officer: ALPS receives an annual fee for providing Principal Financial Officer services to the Fund and is reimbursed for certain out-of-pocket expenses.
Distribution: ALPS Distributors, Inc. (the “Distributor”) (an affiliate of ALPS) acts as the principal underwriter of the Fund’s shares pursuant to a Distribution Agreement with the Trust. Shares of the Fund are offered on a continuous basis through the Distributor, as agent of the Fund. The Distributor is not obligated to sell any particular amount of shares and is not entitled to any compensation for its services as the Fund’s principal underwriter pursuant to the Distribution Agreement.
The Fund has adopted a Distribution and Services Plan (the “Plan”) pursuant to Rule 12b-1 of the 1940 Act for its Investor Class shares. The Plan allows the Fund to use Investor Class assets to pay fees in connection with the distribution and marketing of Investor Class shares and/or the provision of shareholder services to Investor Class shareholders. The Plan permits payment for services in connection with the administration of plans or programs that use Investor Class shares of the Fund, if any, as their funding medium and for related expenses. The Plan permits the Fund to make total payments at an annual rate of up to 0.25% of the Fund’s average daily net assets attributable to its Investor Class shares. Because these fees are paid out of the Fund’s Investor Class assets, if any, on an ongoing basis, over time they will increase the cost of an investment in the Investor Class shares, if any, and Plan fees may cost an investor more than other types of sales charges. Plan fees are shown as distribution and service fees on the Statement of Operations.
7. TRUSTEES
As of March 31, 2015, there were four Trustees, three of whom are not “interested persons” (as defined in the 1940 Act) of the Trust (the “Independent Trustees”). The Independent Trustees receive a quarterly retainer of $4,000, plus $2,000 for each regular Board or Committee meeting attended, $2,000 for each special telephonic Board or Committee meeting attended and $2,000 for each special in-person Board meeting attended. The Independent Trustees are also reimbursed for all reasonable out-of-pocket expenses relating to attendance at meetings and for meeting-related expenses. Officers of the Trust and Trustees who are interested persons of the Trust receive no salary or fees from the Trust.
8. INDEMNIFICATIONS
Under the Trust’s organizational documents, its officers and Trustees are indemnified against certain liabilities arising out of the performance of their duties to the Trust. Additionally, in the normal course of business, the Trust enters into contracts with service providers that may contain general indemnification clauses which may permit indemnification to the extent permissible under applicable law. The Trust’s maximum exposure under these arrangements is unknown, as this would involve future claims that may be made against the Trust that have not yet occurred.
| Semi-Annual Report | March 31, 2015 | 29 |
| Cognios Market Neutral Large Cap Fund |
| Additional Information | March 31, 2015 (Unaudited) |
1. PROXY VOTING POLICIES AND VOTING RECORD
A description of the policies and procedures that the Fund uses to determine how to vote proxies relating to portfolio securities is available without charge, upon request, (i) by calling the Fund (toll-free) at 1-855-254-6467, or (ii) on the website of the Securities and Exchange Commission (the “SEC”) at http://www.sec.gov.
Information regarding how the Fund voted proxies relating to portfolio securities during the most recent 12-month period ended June 30 is available (i) without charge, upon request, by calling the Fund (toll-free) at 1-855-254-6467 or (ii) on the SEC’s website at http://www.sec.gov.
2. PORTFOLIO HOLDINGS
The Fund files its complete schedule of portfolio holdings with the SEC for the first and third quarters of each fiscal year on Form N-Q. The Fund’s Form N-Q is available on the SEC website at http://www.sec.gov. The Fund’s Form N-Q may be reviewed and copied at the SEC’s Public Reference Room in Washington, D.C., and information on the operation of the Public Reference Room may be obtained by calling 1-800-SEC-0330.
3. DISCLOSURE REGARDING RENEWAL AND APPROVAL OF FUND ADVISORY AGREEMENT
On November 20, 2014, the Trustees met in person to discuss, among other things, the renewal and approval of the Investment Advisory Agreement between the Trust and the Adviser (the “Advisory Agreement”) in accordance with Section 15(c) of the 1940 Act. The Independent Trustees met with independent legal counsel during executive session and discussed the Advisory Agreement and other related materials.
In renewing and approving the Advisory Agreement with the Adviser, the Trustees, including the Independent Trustees, considered the following factors with respect to the Fund:
Investment Advisory Fee Rate: The Trustees reviewed and considered the contractual annual advisory fee to be paid by the Trust, on behalf of the Fund, to the Adviser of 1.50% of the Fund’s daily average net assets, in light of the extent and quality of the advisory services to be provided by the Adviser to the Fund.
The Trustees considered the information they received comparing the Fund’s contractual annual advisory fee and overall expenses (net of waivers) with those of funds in both the relevant expense group and universe of funds provided by an independent provider of investment company data. The Trustees noted the following: (i) the Fund’s Investor Class total expense ratio of 2.25% is within the range for the expense group of 1.60% to 3.84%, above the expense group median of 1.92%, within the range for the expense universe of 1.07% to 3.84% and above the expense universe median of 1.78%; and (ii) the Fund’s Institutional Class total expense ratio of 2.00% is within the range for the expense group of 1.25% to 3.59%, above the expense group median of 1.60%, within the range for the expense universe of 0.89% to 3.59% and above the expense universe median of 1.52%. After consideration, the Trustees further determined that the contractual annual advisory fee of 1.50% of the Fund and the total expense ratio of 2.25% for the
| 30 | www.cogniosfunds.com |
| Cognios Market Neutral Large Cap Fund |
| Additional Information | March 31, 2015 (Unaudited) |
Fund’s Investor Class and 2.00% for the Fund’s Institutional Class, taking into account the contractual fee waiver in place, is comparable to others within the Fund’s peer group and universe.
Nature, Extent and Quality of the Services under the Investment Advisory Agreement: The Trustees received and considered information regarding the nature, extent and quality of services to be provided to the Fund under the Advisory Agreement. The Trustees reviewed certain background materials supplied by the Adviser in its presentation, including its Form ADV.
The Trustees reviewed and considered the Adviser’s investment advisory personnel, its history as an asset manager and its performance and the amount of assets currently under management by the Adviser and its affiliated entities. The Trustees also reviewed the research and decision-making processes utilized by the Adviser, including the methods adopted to seek to achieve compliance with the investment objectives, policies and restrictions of the Fund.
The Trustees considered the background and experience of the Adviser’s management in connection with the Fund, including reviewing the qualifications, backgrounds and responsibilities of the management team primarily responsible for the day-to-day portfolio management of the Fund and the extent of the resources devoted to research and analysis of actual and potential investments.
The Trustees also reviewed, among other things, the Adviser’s insider trading policies and procedures and its Code of Ethics.
Performance: The Trustees reviewed performance information for the Investor Class and Institutional Class of the Fund for the one-year and year-to-date periods ended September 30, 2014. That review included a comparison of the Fund’s performance to the performance of a universe of comparable funds selected by an independent provider of investment company data. The Trustees noted the performance of the Fund was generally above its peer universe median for the most recent one-year period. The Trustees also considered the Adviser’s discussion of the top contributors to and detractors from the Fund’s performance results, as well as the Adviser’s performance and reputation generally and its investment techniques, risk management controls and decision-making processes.
The Adviser’s Profitability: The Trustees received and considered a profitability analysis prepared by the Adviser based on the fees payable under the Advisory Agreement. The Trustees considered the profits, if any, that have been realized or are anticipated to be realized by the Adviser in connection with the operation of the Fund. The Trustees also reviewed the unaudited financial statements for the Adviser for its fiscal year ended December 31, 2013, as well as for the year-to-date period ended September 30, 2014.
Economies of Scale: The Trustees considered whether economies of scale in the provision of services to the Fund will be passed along to the shareholders under the proposed Advisory Agreement.
| Semi-Annual Report | March 31, 2015 | 31 |
| Cognios Market Neutral Large Cap Fund |
| Additional Information | March 31, 2015 (Unaudited) |
Other Benefits to the Adviser: The Trustees reviewed and considered any other incidental benefits derived or to be derived by the Adviser from its relationship with the Fund, noting that the Adviser does not use soft dollars and does not have any soft-dollar arrangements.
The Board summarized its deliberations with respect to the proposed renewal of the Advisory Agreement with the Adviser. In selecting the Adviser as the Fund’s investment adviser and determining to renew the Advisory Agreement and the fees charged under the Investment Advisory Agreement, the Trustees concluded that no single factor reviewed by the Trustees was determinative. Further, the Board noted that the Independent Trustees were advised by separate independent legal counsel throughout the process. The Trustees, including all of the Independent Trustees, concluded that:
| · | the contractual annual advisory fees of 1.50% of the Fund’s daily average net assets paid to the Adviser under the Advisory Agreement and the total expense ratios outlined above for the Fund, continue to be fair to the Fund’s shareholders; |
| · | the nature, extent and quality of services to be rendered by the Adviser under the Advisory Agreement were adequate; |
| · | the performance history of the Fund was short in that the Fund did not have a three-year track record, and generally better than the performance of the funds in its FUSE peer universe for the most recent one-year period; |
| · | bearing in mind the limitations of comparing different types of managed accounts and the different levels of service typically associated with such accounts, the fee structures applicable to the Adviser’s other clients employing a comparable strategy to the Fund were not indicative of any unreasonableness with respect to the advisory fee payable by the Fund; |
| · | the terms and provisions of the fee waiver letter agreement between the Trust, on behalf of the Fund, and the Adviser, were not unreasonable; |
| · | the profit, if any, anticipated to be realized by the Adviser in connection with the operation of the Fund was not unreasonable to the Fund, noting that the Adviser had not realized a profit and did not expect to realize any future profits in connection with the operation of the Fund in 2014 or 2015; and |
| · | there were no material economies of scale or other incidental benefits accruing to the Adviser in connection with its relationship with the Fund. |
Based on the Trustees’ deliberations and their evaluation of the information described above, the Trustees, including all of the Independent Trustees, concluded that the Adviser’s compensation for investment advisory services is consistent with the best interests of the Fund and its shareholders.
| 32 | www.cogniosfunds.com |


| Shareholder Letter | 1 |
| Portfolio Update | 4 |
| Disclosure of Fund Expenses | 13 |
| Portfolio of Investments | 16 |
| Statements of Assets and Liabilities | 29 |
| Statements of Operations | 31 |
| Statements of Changes in Net Assets | 33 |
| Financial Highlights | 36 |
| Notes to Financial Statements | 54 |
| Additional Information | 72 |
Crystal Strategy Family of Funds | Shareholder Letter |
March 31, 2015 (Unaudited)
Dear Investors,
In our September 30, 2014 letter, we wrote that we were optimistic as we looked towards 2015. At the risk of reiterating a rather contradictory statement, our optimism was rooted in a somewhat pessimistic view that markets would exhibit more volatility going forward, which we felt would provide us with more investible opportunities. Since our last writing, the Federal Reserve has ended its Quantitative Easing program. Oil has decreased -47.5%. The U.S. Dollar and Long-Term U.S. Treasuries have increased 14.0% and 13.9%, respectively. Expectations for 2015 earnings growth have declined nearly 70%, from 8.3% to 2.5%. Yet, U.S. equities managed to eke out a small gain, and market implied volatility for the S&P 500¹ has remained muted. So while 2015 is far from over, to date, we would give our outlook partial credit for being correct on higher volatility, but still unfulfilled when it comes to greater price swings for U.S. stocks in particular. Fortunately for Crystal investors, we are not limited to investing strictly in U.S. equities and we remain globally diversified across many strategies and countries.
Over the past few months, our allocations outside of domestic equities have resulted in our more favorable risk adjusted performance. Across all three of our funds, our exposure to longer-dated U.S. Treasuries was one of the largest contributors to performance. While our initial thesis for adding the long bond to portfolios was to serve as a more effective hedge (versus shorting equities in a trending market), we entered the position as mounting pressures of deflation were pushing bond prices higher. Thus, while our exposure to long-term U.S. Treasuries served its purpose as a hedge against equity volatility, we ultimately experienced a larger and faster gain in this position than we had originally expected. We took advantage of this excessive strength to exit the position by the end of the quarter. In addition to our exposure in Fixed Income, our international equity exposure was also a large contributor to recent performance; principally for the Crystal Absolute Return and Crystal Absolute Return Plus Funds. Strong results out of the Chinese A-Share² market, Germany, India, and Japan all helped contribute to portfolio performance. Additionally, our currency hedges to the Germany and Japan positions helped us realize the full potential of these gains given the sharp upward move in the U.S. Dollar. As valuations in the U.S. have reached a point that is less compelling than history would suggest, we have continued to rotate our equity exposure away from the United States and more towards some of the more notable mentions above. Our timing of entry has been favorable and we were fortunate that the initial results were strong. Yet, we also believe that the relative underperformance of the United States could persist for a while. Thus, we remain positive on international equities.
As we look forward to the rest of the year, little has changed in the way of our outlook. Rich valuations, less easing of monetary policy, a stronger dollar, slow economic growth, and stalling earnings are all headwinds for U.S. stocks. While many of these concerns can be overcome, in aggregate they represent a headwind. We believe future returns in US stocks will be less robust than recent strong gains of the last several years. Additionally, we believe returns will come with a higher volatility as well. Today, we remain positioned with a barbell approach. On one end of the barbell, we have strategies with reliable cash flow and yield where we are paid to wait out higher
| Semi-Annual Report | March 31, 2015 | 1 |
Crystal Strategy Family of Funds | Shareholder Letter |
March 31, 2015 (Unaudited)
equity volatility. We believe these strategies can post returns equivalent to or higher than U.S. equities, but with far less volatility. On the other end of the barbell, we have exposures in higher conviction equities, predominately outside of the United States. We expect that as investors continue to seek out better valuations and higher returns outside the U.S., many of these exposures will continue to benefit. Put together, we believe our portfolio can post solid risk adjusted returns, but also with less correlation than traditional equity investments.
Crystal Strategy Absolute Income Fund Performance Review
Driven by strong performance on both the long and short side of the portfolio, returns for the Crystal Absolute Income Fund were strong with the Institutional share class finishing up 1.89% over the past six months. On the long side of the portfolio, diversified ETF positons in Germany and the China A-Share market helped drive capital appreciation, despite their lower relative contribution to our yield. We also saw good performance from our position in Zurich Insurance Group, thanks in part to a higher Swiss Franc. Separately, due to a strong U.S. Dollar and lower oil prices, short positions in Canada, Brazil, and Emerging Markets contributed to performance as those markets came under pressure. Outside of International Equities, we also saw good performance in a number of our REIT holdings including Colony Capital, Starwood Property and NorthStar Realty Finance. Detracting from performance were our large cap U.S. equity hedges in the S&P 500 and QQQ. We also had very minor exposure to select Energy E&P (Exploration and Production) companies and MLP Pipelines which detracted from performance. Heading into April, we remain overweight to International Equities and we remain focused on strategies with consistent and stable yields.
Crystal Strategy Absolute Return Fund Performance Review
Performance for the Crystal Absolute Return Fund was largely flat over the past six months with the Institutional share class finishing down -0.27%. We saw strong performance predominantly out of our international equity exposure. Positions in the China A-Share market, hedged currency Japanese equities, and hedged-currency German equities were our largest contributors to performance on the long side. We also saw strong outperformance in a number of our short positions including Canada, Brazil, and Emerging Markets. However, the outperformance in International Equities was more than offset by underperformance in our U.S. Domestic Equity asset class. Short positions in the S&P 500 and QQQ worked against us and were the biggest detractors to overall performance. We also experienced some weakness in some of our smaller positions such as CEMEX, MLPs, Goldminers, and Frontier Markets. Currently, we remain positioned with a slight tilt towards equities with the bulk of our net exposure being focused the international side.
Crystal Strategy Absolute Return Plus Fund Performance Review
Similar to the Crystal Absolute Return Fund, the Plus Fund was slightly negative over the prior six months with the Institutional share class finishing down -0.33%. Given the larger exposures in the Crystal Absolute Return Plus Fund, our major contributors and detractors were identical to the Crystal Absolute Return Fund. International equities was the largest contributor to performance
| 2 | www.crystalstrategyfunds.com |
Crystal Strategy Family of Funds | Shareholder Letter |
March 31, 2015 (Unaudited)
with our positions in the China A-Share Market, hedged currency Japanese equities, and hedged currency German equities being our largest contributors. Similarly, short positions in Emerging Markets, Canada, and Brazil also contributed to performance as well. Detracting from performance were short positions and hedges within U.S Domestic Equities as well as certain satellite positions in names such as CEMEX, MLPs, Goldminers, and Frontier Markets. We are currently positioned with a moderate tilt towards equities, but with the majority of our net long exposure towards international markets.
Sincerely,
The Crystal Strategy Funds Portfolio Management Team
| ¹ | S&P 500 - An index of 500 stocks chosen for market size, liquidity and industry grouping, among other factors. The S&P 500 is designed to be a leading indicator of U.S. equities and is meant to reflect the risk/return characteristics of the large cap universe. |
| ² | Chinese A-Shares - Shares in mainland China-based companies that trade on Chinese stock exchanges such as the Shanghai Stock Exchange and the Shenzhen Stock Exchange. A-shares are generally only available for purchase by mainland citizens; foreign investment is only allowed through a tightly-regulated structure known as the Qualified Foreign Institutional Investor (QFII) system. |
The views and information discussed in this commentary are as of the date of publication, are subject to change, and may not reflect the writer’s current views. The views expressed are those of the Fund’s adviser only, and represent an assessment of market conditions at a specific point in time, are opinions only and should not be relied upon as investment advice regarding a particular investment or markets in general. Such information does not constitute a recommendation to buy or sell specific securities or investment vehicles. It should not be assumed that any investment will be profitable or will equal the performance of the fund(s) or any securities or any sectors mentioned in this letter. The subject matter contained in this letter has been derived from several sources believed to be reliable and accurate at the time of compilation. Neither the Fund nor the Adviser accepts any liability for losses either direct or consequential caused by the use of this information.
The Crystal Strategy Family of Funds is subject to investment risks, including possible loss of the principal amount invested and therefore are not suitable for all investors. The Funds may not achieve their objectives. Diversification does not ensure a profit or guarantee against loss.
Not FDIC Insured – No Bank Guarantee – May Lose Value
| Semi-Annual Report | March 31, 2015 | 3 |
| Crystal Strategy Absolute Income Fund | Portfolio Update |
March 31, 2015 (Unaudited)
Performance (as of March 31, 2015)
Three Months | Six Months | One Year | Since Inception* | |
| Crystal Strategy Absolute Income Fund - A NAV | 2.32% | 1.78% | 2.91% | 2.90% |
| Crystal Strategy Absolute Income Fund - A MOP | -3.33% | -3.85% | -2.78% | -1.64% |
| Crystal Strategy Absolute Income Fund - I | 2.32% | 1.89% | 2.96% | 3.02% |
| Crystal Strategy Absolute Income Fund - R | 2.23% | 1.63% | 2.49% | 2.56% |
HFRX Global Hedge Fund Index(a) | 2.06% | 0.28% | 0.36% | 1.31% |
US CPI Urban Consumers NSA(b) | 0.56% | -0.80% | -0.07% | 1.05% |
The performance data quoted above represents past performance. Past performance is not a guarantee of future results. Investment return and value of the Fund shares will fluctuate so that an investor’s shares, when sold or redeemed, may be worth more or less than their original cost. Performance may be lower or higher than performance data quoted. Fund performance current to the most recent month-end is available by calling (855) 572-1722 or by visiting www.crystalstrategyfunds.com.
| * | The Fund’s inception date is December 30, 2013. |
| (a) | HFRX Global Hedge Fund Index (USD): The Fund’s investment adviser uses the HFRX Global Hedge Fund Index as a performance reference point because it is designed to be representative of the overall composition of the hedge fund universe. Such index will have a different level of volatility than the actual investment portfolio. |
| (b) | US CPI (Consumer Price Index) Urban Consumers NSA: Published by the Bureau of Labor Statistics in the Department of Labor, the CPI is a widely used cost-of-living benchmark that measures the price of a fixed basket of goods purchased by a typical consumer. |
Returns of less than 1 year are cumulative.
Indices are not actively managed and do not reflect deduction for fees, expenses or taxes. An investor cannot invest directly in an index.
The returns shown above do not reflect the deduction of taxes a shareholder would pay on Fund distributions or redemption of Fund shares.
Maximum Offering Price (MOP) for Class A shares includes the Fund’s maximum sales charge of 5.50%. Performance shown at NAV does not include these sales charges and would have been lower had it been taken into account. If you invest $1 million or more, either as a lump sum or through the Fund’s accumulation or letter of intent programs, you can purchase Class A shares without an initial sales charge (load); however, a Contingent Deferred Sales Charge (“CDSC”) of 1.00% may apply to Class A shares redeemed within the first 12 months after a purchase in excess of $1 million. The total annual operating expenses and total annual operating expenses after fee waivers and/or reimbursement you may pay as an investor in the Fund’s Class A, Class I and Class R shares (as reported in the January 28, 2015 Prospectus) are 13.61% and 1.66%, 15.07% and 1.41%, and 49.27% and 1.91%, respectively.
| 4 | www.crystalstrategyfunds.com |
| Crystal Strategy Absolute Income Fund | Portfolio Update |
March 31, 2015 (Unaudited)
Performance of $10,000 Initial Investment (as of March 31, 2015)
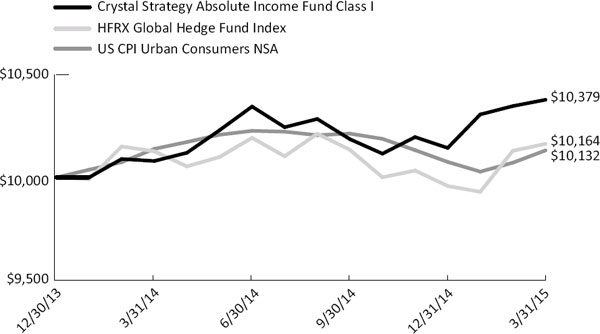
The graph shown above represents historical performance of a hypothetical investment of $10,000 in the Fund since inception. Past performance does not guarantee future results. All returns reflect reinvested dividends, but do not reflect the deduction of taxes that a shareholder would pay on Fund distributions or the redemption of Fund shares.
Top Ten Long Holdings (as a % of Net Assets)*
| DoubleLine Total Return Bond Fund - Institutional Class | 12.10 | % | |
| Vanguard Short-Term Bond ETF | 8.49 | % | |
| SPDR Barclays High Yield Bond ETF | 6.24 | % | |
| DoubleLine Income Solutions Fund | 5.55 | % | |
| Forward Select Income Fund - Institutional Class | 4.95 | % | |
ProShares® Short Real Estate | 4.45 | % | |
| Starwood Property Trust, Inc. - REIT | 4.39 | % | |
| NorthStar Realty Finance Corp. - REIT | 4.39 | % | |
| AllianceBernstein Income Fund, Inc. | 4.20 | % | |
| RiverPark Strategic Income Fund - Institutional Class | 3.52 | % | |
| 58.28 | % |
| * | Holdings are subject to change, excludes cash and cash equivalents. |
| Semi-Annual Report | March 31, 2015 | 5 |
| Crystal Strategy Absolute Income Fund | Portfolio Update |
March 31, 2015 (Unaudited)
Sector Allocation (as a % of Net Assets)*
| Exchange-Traded Funds (Long) | 26.29 | % | |
| Open-End Mutual Funds | 22.93 | % | |
| Financials | 22.76 | % | |
| Closed-End Mutual Funds | 13.17 | % | |
| Master Limited Partnerships | 5.35 | % | |
| Energy | 0.96 | % | |
| Exchange-Traded Funds (Short) | -15.48 | % | |
| Cash, Cash Equivalents, & Other Net Assets | 24.02 | % | |
| 100.00 | % |
| * | Holdings are subject to change. |
| 6 | www.crystalstrategyfunds.com |
| Crystal Strategy Absolute Return Fund | Portfolio Update |
March 31, 2015 (Unaudited)
Performance (as of March 31, 2015)
Three Months | Six Months | One Year | Since Inception* | |
| Crystal Strategy Absolute Return Fund - A NAV | 0.53% | -0.53% | -3.35% | -3.63% |
| Crystal Strategy Absolute Return Fund - A MOP | -5.03% | -6.02% | -8.71% | -7.88% |
| Crystal Strategy Absolute Return Fund - I | 0.64% | -0.27% | -2.90% | -3.19% |
| Crystal Strategy Absolute Return Fund - R | 0.53% | -0.50% | -3.52% | -3.77% |
HFRX Global Hedge Fund Index(a) | 2.06% | 0.28% | 0.36% | 1.31% |
US CPI Urban Consumers NSA(b) | 0.56% | -0.80% | -0.07% | 1.05% |
The performance data quoted above represents past performance. Past performance is not a guarantee of future results. Investment return and value of the Fund shares will fluctuate so that an investor’s shares, when sold or redeemed, may be worth more or less than their original cost. Performance may be lower or higher than performance data quoted. Fund performance current to the most recent month-end is available by calling (855) 572-1722 or by visiting www.crystalstrategyfunds.com.
| * | The Fund’s inception date is December 30, 2013. |
| (a) | HFRX Global Hedge Fund Index (USD): The Fund’s investment adviser uses the HFRX Global Hedge Fund Index as a performance reference point because it is designed to be representative of the overall composition of the hedge fund universe. Such index will have a different level of volatility than the actual investment portfolio. |
| (b) | US CPI (Consumer Price Index) Urban Consumers NSA: Published by the Bureau of Labor Statistics in the Department of Labor, the CPI is a widely used cost-of-living benchmark that measures the price of a fixed basket of goods purchased by a typical consumer. |
Returns of less than 1 year are cumulative.
Indices are not actively managed and do not reflect deduction for fees, expenses or taxes. An investor cannot invest directly in an index.
The returns shown above do not reflect the deduction of taxes a shareholder would pay on Fund distributions or redemption of Fund shares.
Maximum Offering Price (MOP) for Class A shares includes the Fund’s maximum sales charge of 5.50%. Performance shown at NAV does not include these sales charges and would have been lower had it been taken into account. If you invest $1 million or more, either as a lump sum or through the Fund’s accumulation or letter of intent programs, you can purchase Class A shares without an initial sales charge (load); however, a Contingent Deferred Sales Charge (“CDSC”) of 1.00% may apply to Class A shares redeemed within the first 12 months after a purchase in excess of $1 million. The total annual operating expenses and total annual operating expenses after fee waivers and/or reimbursement you may pay as an investor in the Fund’s Class A, Class I and Class R shares (as reported in the January 28, 2015 Prospectus) are 11.42% and 1.83%, 14.45% and 1.58%, and 24.48% and 2.08%, respectively.
| Semi-Annual Report | March 31, 2015 | 7 |
| Crystal Strategy Absolute Return Fund | Portfolio Update |
March 31, 2015 (Unaudited)
Performance of $10,000 Initial Investment (as of March 31, 2015)
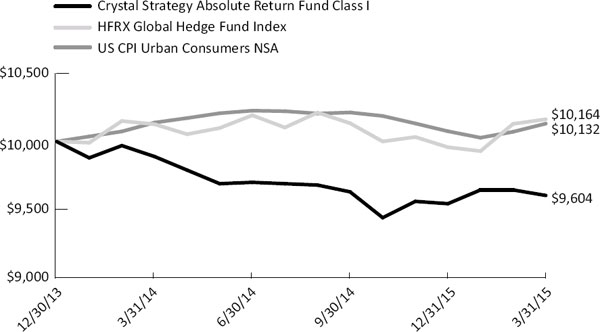
The graph shown above represents historical performance of a hypothetical investment of $10,000 in the Fund since inception. Past performance does not guarantee future results. All returns reflect reinvested dividends, but do not reflect the deduction of taxes that a shareholder would pay on Fund distributions or the redemption of Fund shares.
Top Ten Long Holdings (as a % of Net Assets)*
| SPDR Barclays High Yield Bond ETF | 5.59 | % | |
WisdomTree® Japan Hedged Equity Fund | 3.32 | % | |
iShares® India 50 ETF | 3.24 | % | |
| AllianceBernstein Income Fund, Inc. | 2.98 | % | |
| Huntington Bancshares, Inc. | 2.44 | % | |
| Morgan Stanley China Fund, Inc. - Class A | 2.43 | % | |
| iShares MSCI Italy Capped ETF | 2.34 | % | |
iShares® Currency Hedged MSCI Germany ETF | 2.22 | % | |
| Bogle Investment Management Small Cap Growth Fund -Institutional Class | 2.21 | % | |
| Lazard, Ltd. - Class A | 2.10 | % | |
| 28.87 | % |
| * | Holdings are subject to change, excludes cash and cash equivalents. |
| 8 | www.crystalstrategyfunds.com |
| Crystal Strategy Absolute Return Fund | Portfolio Update |
March 31, 2015 (Unaudited)
Sector Allocation (as a % of Net Assets)*
| Exchange-Traded Funds (Long) | 30.38 | % | |
| Financials | 9.34 | % | |
| Open-End Mutual Funds | 9.25 | % | |
| Closed-End Mutual Funds | 8.75 | % | |
| Master Limited Partnerships | 4.92 | % | |
| Energy | 1.96 | % | |
| Communications | 1.77 | % | |
| Consumer Non-cyclical | 0.67 | % | |
| Technology | 0.54 | % | |
| Purchased Option Contracts | 0.18 | % | |
| Exchange-Traded Funds (Short) | -17.59 | % | |
| Cash, Cash Equivalents, & Other Net Assets | 49.83 | % | |
| 100.00 | % |
| * | Holdings are subject to change. |
| Semi-Annual Report | March 31, 2015 | 9 |
| Crystal Strategy Absolute Return Plus Fund | Portfolio Update |
March 31, 2015 (Unaudited)
Performance (as of March 31, 2015)
Three Months | Six Months | One Year | Since Inception* | |
| Crystal Strategy Absolute Return Plus Fund - A - NAV | 0.32% | -0.50% | -3.74% | -4.25% |
| Crystal Strategy Absolute Return Plus Fund - A - MOP | -5.18% | -5.93% | -9.01% | -8.47% |
| Crystal Strategy Absolute Return Plus Fund - I | 0.43% | -0.33% | -3.37% | -3.96% |
| Crystal Strategy Absolute Return Plus Fund - R | 0.22% | -0.65% | -3.99% | -4.45% |
HFRX Global Hedge Fund Index(a) | 2.06% | 0.28% | 0.36% | 1.31% |
US CPI Urban Consumers NSA(b) | 0.56% | -0.80% | -0.07% | 1.05% |
The performance data quoted above represents past performance. Past performance is not a guarantee of future results. Investment return and value of the Fund shares will fluctuate so that an investor’s shares, when sold or redeemed, may be worth more or less than their original cost. Performance may be lower or higher than performance data quoted. Fund performance current to the most recent month-end is available by calling (855) 572-1722 or by visiting www.crystalstrategyfunds.com.
| * | The Fund’s inception date is December 30, 2013. |
| (a) | HFRX Global Hedge Fund Index (USD): The Fund’s investment adviser uses the HFRX Global Hedge Fund Index as a performance reference point because it is designed to be representative of the overall composition of the hedge fund universe. Such index will have a different level of volatility than the actual investment portfolio. |
| (b) | US CPI (Consumer Price Index) Urban Consumers NSA: Published by the Bureau of Labor Statistics in the Department of Labor, the CPI is a widely used cost-of-living benchmark that measures the price of a fixed basket of goods purchased by a typical consumer. |
Returns of less than 1 year are cumulative.
Indices are not actively managed and do not reflect deduction for fees, expenses or taxes. An investor cannot invest directly in an index.
The returns shown above do not reflect the deduction of taxes a shareholder would pay on Fund distributions or redemption of Fund shares.
Maximum Offering Price (MOP) for Class A shares includes the Fund’s maximum sales charge of 5.50%. Performance shown at NAV does not include these sales charges and would have been lower had it been taken into account. If you invest $1 million or more, either as a lump sum or through the Fund’s accumulation or letter of intent programs, you can purchase Class A shares without an initial sales charge (load); however, a Contingent Deferred Sales Charge (“CDSC”) of 1.00% may apply to Class A shares redeemed within the first 12 months after a purchase in excess of $1 million. The total annual operating expenses and total annual operating expenses after fee waivers and/or reimbursement you may pay as an investor in the Fund’s Class A, Class I and Class R shares (as reported in the January 28, 2015 Prospectus) are 9.45% and 1.93%, 9.45% and 1.68%, and 15.30% and 2.18%, respectively.
| 10 | www.crystalstrategyfunds.com |
| Crystal Strategy Absolute Return Plus Fund | Portfolio Update |
March 31, 2015 (Unaudited)
Performance of $10,000 Initial Investment (as of March 31, 2015)
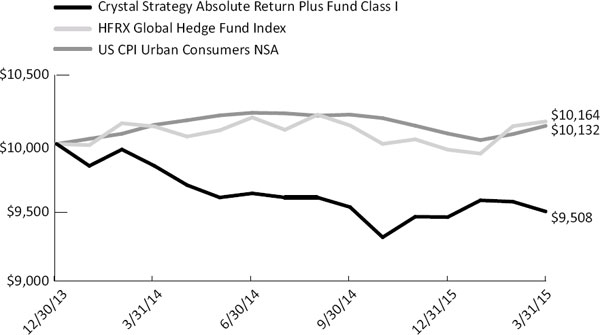
The graph shown above represents historical performance of a hypothetical investment of $10,000 in the Fund since inception. Past performance does not guarantee future results. All returns reflect reinvested dividends, but do not reflect the deduction of taxes that a shareholder would pay on Fund distributions or the redemption of Fund shares.
Top Ten Long Holdings (as a % of Net Assets)*
| SPDR Barclays High Yield Bond ETF | 9.28 | % | |
| AllianceBernstein Income Fund, Inc. | 6.68 | % | |
iShares® India 50 ETF | 6.00 | % | |
WisdomTree® Japan Hedged Equity Fund | 5.22 | % | |
| Morgan Stanley China Fund, Inc. - Class A | 4.35 | % | |
iShares® Currency Hedged MSCI Germany ETF | 4.29 | % | |
| iShares MSCI Italy Capped ETF | 4.10 | % | |
| Huntington Bancshares, Inc. | 4.09 | % | |
| ING Groep NV - Sponsored ADR | 3.69 | % | |
| Bogle Investment Management Small Cap Growth Fund - Institutional Class | 3.68 | % | |
| 51.38 | % |
| * | Holdings are subject to change, excludes cash and cash equivalents. |
| Semi-Annual Report | March 31, 2015 | 11 |
| Crystal Strategy Absolute Return Plus Fund | Portfolio Update |
March 31, 2015 (Unaudited)
Sector Allocation (as a % of Net Assets)*
| Exchange-Traded Funds (Long) | 50.11 | % | |
| Open-End Mutual Funds | 16.71 | % | |
| Financials | 16.63 | % | |
| Closed-End Mutual Funds | 16.49 | % | |
| Master Limited Partnerships | 8.57 | % | |
| Energy | 3.20 | % | |
| Communications | 2.95 | % | |
| Consumer Non-cyclical | 1.54 | % | |
| Technology | 1.24 | % | |
| Purchased Option Contracts | 0.23 | % | |
| Exchange-Traded Funds (Short) | -30.36 | % | |
| Cash, Cash Equivalents, & Other Net Assets | 12.69 | % | |
| 100.00 | % |
| * | Holdings are subject to change. |
| 12 | www.crystalstrategyfunds.com |
| Crystal Strategy Family of Funds | Disclosure of Fund Expenses |
March 31, 2015 (Unaudited)
Examples. As a shareholder of the Crystal Strategy Absolute Income Fund, the Crystal Strategy Absolute Return Fund or the Crystal Strategy Absolute Return Plus Fund (the “Funds”), you will incur two types of costs: (1) transaction costs, including sales charges on purchase payments and applicable redemption fees; and (2) ongoing costs, including management fees, distribution and service (12b-1) fees and other Fund expenses. The following examples are intended to help you understand your ongoing costs (in dollars) of investing in a Fund and to compare these costs with the ongoing costs of investing in other mutual funds. The examples are based on an investment of $1,000 invested on October 1, 2014 and held until March 31, 2015.
Actual Expenses. The first line under each class in the table below provides information about actual account values and actual expenses. You may use the information in this line, together with the amount you invested, to estimate the expenses that you paid over the period. Simply divide your account value by $1,000 (for example, an $8,600 account value divided by $1,000 = 8.6), then multiply the result by the number in the first line under each class in the table under the heading “Expenses Paid During Period October 1, 2014 – March 31, 2015” to estimate the expenses you paid on your account during this period.
Hypothetical Example for Comparison Purposes. The second line under each class in the table below provides information about hypothetical account values and hypothetical expenses based on a Fund’s actual expense ratio and an assumed rate of return of 5% per year before expenses, which is not the Fund’s actual return. The hypothetical account values and expenses may not be used to estimate the actual ending account balance or expenses you paid for the period. You may use this information to compare the ongoing costs of investing in a Fund and other mutual funds. To do so, compare this 5% hypothetical example with the 5% hypothetical examples that appear in the shareholder reports of the other funds.
Please note that the expenses shown in the table are meant to highlight your ongoing costs only and do not reflect any transactional costs, such as sales charges (loads) or redemption fees. Therefore, the second line under each class in the tables below is useful in comparing ongoing costs only and will not help you determine the relative total costs of owning different funds. In addition, if these transactional costs were included, your costs would have been higher.
| Semi-Annual Report | March 31, 2015 | 13 |
| Crystal Strategy Family of Funds | Disclosure of Fund Expenses |
March 31, 2015 (Unaudited)
Beginning Account Value | Ending Account Value | Expense Ratio(a) | Expenses Paid During Period | |||||||||||
| Crystal Strategy Absolute Income Fund | ||||||||||||||
| Class A | ||||||||||||||
| Actual | $ | 1,000.00 | $ | 1,017.80 | 1.71% | $ | 8.60 | |||||||
| Hypothetical (5% return before expenses) | $ | 1,000.00 | $ | 1,016.40 | 1.71% | $ | 8.60 | |||||||
| Class I | ||||||||||||||
| Actual | $ | 1,000.00 | $ | 1,018.90 | 1.46% | $ | 7.35 | |||||||
| Hypothetical (5% return before expenses) | $ | 1,000.00 | $ | 1,017.65 | 1.46% | $ | 7.34 | |||||||
| Class R | ||||||||||||||
| Actual | $ | 1,000.00 | $ | 1,016.30 | 1.96% | $ | 9.85 | |||||||
| Hypothetical (5% return before expenses) | $ | 1,000.00 | $ | 1,015.16 | 1.96% | $ | 9.85 | |||||||
Beginning Account Value | Ending Account Value | Expense Ratio(a) | Expenses Paid During Period | |||||||||||
| Crystal Strategy Absolute Return Fund | ||||||||||||||
| Class A | ||||||||||||||
| Actual | $ | 1,000.00 | $ | 994.70 | 1.83% | $ | 9.10 | |||||||
| Hypothetical (5% return before expenses) | $ | 1,000.00 | $ | 1,015.81 | 1.83% | $ | 9.20 | |||||||
| Class I | ||||||||||||||
| Actual | $ | 1,000.00 | $ | 996.20 | 1.58% | $ | 7.86 | |||||||
| Hypothetical (5% return before expenses) | $ | 1,000.00 | $ | 1,017.05 | 1.58% | $ | 7.95 | |||||||
| Class R | ||||||||||||||
| Actual | $ | 1,000.00 | $ | 995.00 | 2.08% | $ | 10.35 | |||||||
| Hypothetical (5% return before expenses) | $ | 1,000.00 | $ | 1,014.56 | 2.08% | $ | 10.45 | |||||||
| 14 | www.crystalstrategyfunds.com |
| Crystal Strategy Family of Funds | Disclosure of Fund Expenses |
March 31, 2015 (Unaudited)
| Expenses Paid | ||||||||||||||
| Beginning | Ending | During Period | ||||||||||||
| Account Value | Account Value | Expense | October 1, 2014 - | |||||||||||
| October 1, 2014 | March 31, 2015 | Ratio(a) | March 31, 2015(b) | |||||||||||
| Crystal Strategy Absolute Return Plus Fund | ||||||||||||||
| Class A | ||||||||||||||
| Actual | $ | 1,000.00 | $ | 995.00 | 2.04% | $ | 10.15 | |||||||
| Hypothetical (5% return before expenses) | $ | 1,000.00 | $ | 1,014.76 | 2.04% | $ | 10.25 | |||||||
| Class I | ||||||||||||||
| Actual | $ | 1,000.00 | $ | 995.60 | 1.79% | $ | 8.91 | |||||||
| Hypothetical (5% return before expenses) | $ | 1,000.00 | $ | 1,016.01 | 1.79% | $ | 9.00 | |||||||
| Class R | ||||||||||||||
| Actual | $ | 1,000.00 | $ | 993.50 | 2.29% | $ | 11.38 | |||||||
| Hypothetical (5% return before expenses) | $ | 1,000.00 | $ | 1,013.51 | 2.29% | $ | 11.50 | |||||||
(a) | The Fund’s expense ratios have been annualized based on the Fund’s most recent fiscal half- year expenses. Expense ratios excluding interest expense and dividends paid on borrowed securities are disclosed in the financial highlights. |
(b) | Expenses are equal to the Fund’s annualized expense ratio, multiplied by the average account value over the period, multiplied by the number of days in the most recent fiscal half year (182), divided by 365. |
| Semi-Annual Report | March 31, 2015 | 15 |
| Crystal Strategy Absolute Income Fund | Portfolio of Investments |
March 31, 2015 (Unaudited) | |
| Value | ||||||||
| Shares | (Note 2) | |||||||
| CLOSED‐END MUTUAL FUNDS (13.17%) | ||||||||
| AllianceBernstein Income Fund, Inc. | 33,035 | $ | 255,030 | |||||
DoubleLine Income Solutions Fund(a) | 16,970 | 336,855 | ||||||
Morgan Stanley China Fund, Inc. ‐ Class A(a) | 2,565 | 84,440 | ||||||
| Tortoise MLP Fund, Inc. | 5,100 | 122,706 | ||||||
| TOTAL CLOSED‐END MUTUAL FUNDS (Cost $797,084) | 799,031 | |||||||
| COMMON STOCKS (23.72%) | ||||||||
Energy (0.96%) | ||||||||
| Phillips 66 Partners LP | 825 | 58,303 | ||||||
Financials (22.76%) | ||||||||
| Ares Capital Corp. | 3,135 | 53,828 | ||||||
Colony Financial, Inc. ‐ REIT(a) | 8,015 | 207,749 | ||||||
| Hercules Technology Growth Capital, Inc. | 3,485 | 46,978 | ||||||
| Huntington Bancshares, Inc. | 11,155 | 123,263 | ||||||
ICICI Bank, Ltd. ‐ Sponsored ADR(a) | 7,055 | 73,090 | ||||||
ING Groep NV ‐ Sponsored ADR(b) | 12,650 | 184,816 | ||||||
NorthStar Realty Finance Corp. ‐ REIT(a) | 14,695 | 266,273 | ||||||
| Outfront Media, Inc. ‐ REIT | 2,641 | 79,019 | ||||||
Starwood Property Trust, Inc. ‐ REIT(a) | 10,970 | 266,571 | ||||||
| Zurich Insurance Group AG ‐ ADR | 2,360 | 79,638 | ||||||
| Total Financials | 1,381,225 | |||||||
| TOTAL COMMON STOCKS (Cost $1,385,169) | 1,439,528 | |||||||
| EXCHANGE‐TRADED FUNDS (26.29%) | ||||||||
iShares® Currency Hedged MSCI Germany ETF | 5,075 | 144,840 | ||||||
iShares® MSCI Italy Capped ETF | 7,400 | 109,520 | ||||||
PowerShares® Global Listed Private Equity Portfolio(a) | 10,299 | 116,379 | ||||||
ProShares® Short Real Estate(b) | 13,910 | 270,132 | ||||||
SPDR® Barclays High Yield Bond ETF | 9,650 | 378,473 | ||||||
Vanguard® Short‐Term Bond ETF | 6,400 | 515,328 | ||||||
See Notes to Financial Statements.
| 16 | www.crystalstrategyfunds.com |
| Crystal Strategy Absolute Income Fund | Portfolio of Investments |
March 31, 2015 (Unaudited) | |
| Value | ||||||||
| Shares | (Note 2) | |||||||
| EXCHANGE‐TRADED FUNDS (26.29%) (continued) | ||||||||
WisdomTree® Japan Hedged Real Estate Fund(a) | 2,170 | $ | 60,543 | |||||
| TOTAL EXCHANGE‐TRADED FUNDS (Cost $1,591,023) | 1,595,215 | |||||||
| MASTER LIMITED PARTNERSHIPS (5.35%) | ||||||||
Apollo Global Management LLC ‐ Class A(a) | 540 | 11,664 | ||||||
Blackstone Group LP(a) | 2,370 | 92,169 | ||||||
Carlyle Group LP(a) | 885 | 23,983 | ||||||
KKR & Co. LP(a) | 855 | 19,503 | ||||||
Lazard, Ltd. ‐ Class A(a) | 2,230 | 117,276 | ||||||
Oaktree Capital Group LLC(a) | 1,165 | 60,184 | ||||||
| TOTAL MASTER LIMITED PARTNERSHIPS (Cost $314,311) | 324,779 | |||||||
| OPEN‐END MUTUAL FUNDS (22.93%) | ||||||||
| DoubleLine Total Return Bond Fund ‐ Institutional Class | 66,485 | 733,991 | ||||||
| Driehaus Active Income Fund ‐ Retail Class | 8,130 | 84,957 | ||||||
| Forward Select Income Fund ‐ Institutional Class | 11,567 | 300,273 | ||||||
| Goldman Sachs Strategic Income Fund ‐ Institutional Class | 5,819 | 58,539 | ||||||
| RiverPark Strategic Income Fund ‐ Institutional Class | 21,276 | 213,614 | ||||||
| TOTAL OPEN‐END MUTUAL FUNDS (Cost $1,394,331) | 1,391,374 | |||||||
See Notes to Financial Statements.
| Semi-Annual Report | March 31, 2015 | 17 |
| Crystal Strategy Absolute Income Fund | Portfolio of Investments |
March 31, 2015 (Unaudited) | |
| 7-Day | Value | |||||||||||
| Yield | Shares | (Note 2) | ||||||||||
| SHORT TERM INVESTMENTS (9.94%) | ||||||||||||
| Money Market Fund (9.94%) | ||||||||||||
| Fidelity Institutional Money Market Portfolio | 0.09830 | % | 603,024 | $ | 603,024 | |||||||
| TOTAL SHORT TERM INVESTMENTS (Cost $603,024) | 603,024 | |||||||||||
TOTAL INVESTMENTS (101.40%) (Cost $6,084,942) | $ | 6,152,951 | ||||||||||
SECURITIES SOLD SHORT (‐15.48%) (Proceeds $952,607) | (938,993 | ) | ||||||||||
| Other Assets in Excess of Liabilities (14.08%) | 853,833 | |||||||||||
| NET ASSETS (100.00%) | $ | 6,067,791 | ||||||||||
(a) Security, or a portion of security, is being held as collateral for short sales. As of March 31, 2015, the aggregate market value of those securities was $1,366,839, which represents approximately 22.53% of the Fund’s net assets.
(b) Non-income producing security.
| Value | ||||||||
| Shares | (Note 2) | |||||||
| SCHEDULE OF SECURITIES SOLD SHORT | ||||||||
| EXCHANGE‐TRADED FUNDS (‐15.48%) | ||||||||
Financial Select Sector SPDR® Fund | (5,350 | ) | $ | (128,989 | ) | |||
Industrial Select Sector SPDR® Fund | (2,255 | ) | (125,761 | ) | ||||
iShares® MSCI Brazil Capped ETF | (3,790 | ) | (118,892 | ) | ||||
iShares® MSCI Canada ETF | (5,450 | ) | (148,131 | ) | ||||
iShares® MSCI South Africa ETF | (1,330 | ) | (89,137 | ) | ||||
iShares® MSCI Turkey ETF | (1,910 | ) | (88,624 | ) | ||||
SPDR® S&P 500® ETF Trust | (1,160 | ) | (239,459 | ) | ||||
| TOTAL EXCHANGE‐TRADED FUNDS (Proceeds $952,607) | (938,993 | ) | ||||||
| TOTAL SECURITIES SOLD SHORT (‐15.48%) (Proceeds $952,607) | $ | (938,993 | ) | |||||
See Notes to Financial Statements.
| 18 | www.crystalstrategyfunds.com |
| Crystal Strategy Absolute Income Fund | Portfolio of Investments |
March 31, 2015 (Unaudited) | |
| Common Abbreviations: |
| ADR - American Depositary Receipt. |
| AG - Aktiengesellschaft is a German term that refers to a corporation that is limited by shares, i.e., owned by shareholders. |
| ETF - Exchange-Traded Fund. |
| LLC - Limited Liability Company. |
| LP - Limited Partnership. |
| Ltd. - Limited. |
| MLP - Master Limited Partnership. |
| MSCI - Morgan Stanley Capital International. |
| REIT - Real Estate Investment Trust. |
| S&P - Standard & Poor’s. |
| SPDR - Standard & Poor’s Depositary Receipt. |
| For Fund compliance purposes, the Fund’s industry classifications refer to any one or more of the industry sub-classifications used by one or more widely recognized market indices or ratings group indices, and/or as defined by Fund’s management. This definition may not apply for purposes of this report, which may combine industry sub-classifications for reporting ease. Industries are shown as a percentage of the Fund’s net assets. (Unaudited) |
See Notes to Financial Statements.
| Semi-Annual Report | March 31, 2015 | 19 |
| Crystal Strategy Absolute Return Fund | Portfolio of Investments |
March 31, 2015 (Unaudited) | |
| Value | ||||||||
| Shares | (Note 2) | |||||||
| CLOSED‐END MUTUAL FUNDS (8.75%) | ||||||||
| AllianceBernstein Income Fund, Inc. | 28,490 | $ | 219,943 | |||||
DoubleLine Income Solutions Fund(a) | 5,050 | 100,243 | ||||||
Morgan Stanley China Fund, Inc. ‐ Class A(a) | 5,445 | 179,249 | ||||||
| Tortoise MLP Fund, Inc. | 6,055 | 145,683 | ||||||
| TOTAL CLOSED‐END MUTUAL FUNDS (Cost $616,333) | 645,118 | |||||||
| COMMON STOCKS (14.28%) | ||||||||
Communications (1.77%) | ||||||||
FireEye, Inc.(b) | 1,655 | 64,959 | ||||||
| SoftBank Corp., Unsponsored ADR | 2,255 | 65,564 | ||||||
| Total Communications | 130,523 | |||||||
Consumer Non‐cyclical (0.67%) | ||||||||
Odyssey Marine Exploration, Inc.(a)(b) | 70,410 | 49,287 | ||||||
Energy (1.96%) | ||||||||
| Phillips 66 Partners LP | 985 | 69,610 | ||||||
SolarCity Corp.(b) | 1,460 | 74,869 | ||||||
| Total Energy | 144,479 | |||||||
Financials (9.34%) | ||||||||
Huntington Bancshares, Inc.(a) | 16,295 | 180,060 | ||||||
ICICI Bank, Ltd. ‐ Sponsored ADR(a) | 9,580 | 99,249 | ||||||
ING Groep NV ‐ Sponsored ADR(b) | 9,840 | 143,762 | ||||||
NorthStar Realty Finance Corp. ‐ REIT(a) | 4,740 | 85,889 | ||||||
| Outfront Media, Inc. ‐ REIT | 1,452 | 43,444 | ||||||
Starwood Property Trust, Inc. ‐ REIT(a) | 5,585 | 135,715 | ||||||
| Total Financials | 688,119 | |||||||
Technology (0.54%) | ||||||||
Zayo Group Holdings, Inc.(b) | 1,435 | 40,122 | ||||||
| TOTAL COMMON STOCKS (Cost $1,040,858) | 1,052,530 | |||||||
See Notes to Financial Statements.
| 20 | www.crystalstrategyfunds.com |
| Crystal Strategy Absolute Return Fund | Portfolio of Investments |
March 31, 2015 (Unaudited) | |
| Value | ||||||||
| Shares | (Note 2) | |||||||
| EXCHANGE‐TRADED FUNDS (30.38%) | ||||||||
First Trust NASDAQ Technology Dividend Index Fund(a) | 5,710 | $ | 153,770 | |||||
Global X Guru Index ETF(a) | 3,525 | 92,496 | ||||||
Guggenheim Insider Sentiment ETF(a) | 1,485 | 73,626 | ||||||
Guggenheim Spin‐Off ETF(a) | 2,190 | 104,047 | ||||||
iShares® Currency Hedged MSCI Germany ETF | 5,735 | 163,677 | ||||||
iShares® Gold Trust(a)(b) | 8,145 | 93,260 | ||||||
iShares® India 50 ETF | 7,610 | 238,498 | ||||||
iShares® MSCI Frontier 100 ETF(a) | 1,860 | 55,317 | ||||||
iShares® MSCI Italy Capped ETF | 11,650 | 172,420 | ||||||
Market Vectors® Semiconductor ETF(a) | 2,109 | 116,628 | ||||||
PowerShares® Deutsche Bank U.S. Dollar Index Bullish Fund(b) | 3,910 | 101,269 | ||||||
PowerShares® Global Listed Private Equity Portfolio(a) | 13,020 | 147,126 | ||||||
SPDR® Barclays High Yield Bond ETF | 10,515 | 412,398 | ||||||
WisdomTree® Japan Hedged Equity Fund(a) | 4,435 | 244,457 | ||||||
WisdomTree® Japan Hedged Real Estate Fund(a) | 2,540 | 70,866 | ||||||
| TOTAL EXCHANGE‐TRADED FUNDS (Cost $2,187,455) | 2,239,855 | |||||||
| MASTER LIMITED PARTNERSHIPS (4.92%) | ||||||||
Apollo Global Management LLC ‐ Class A(a) | 685 | 14,796 | ||||||
Blackstone Group LP(a) | 1,775 | 69,030 | ||||||
Carlyle Group LP(a) | 960 | 26,016 | ||||||
KKR & Co. LP(a) | 875 | 19,959 | ||||||
Lazard, Ltd. ‐ Class A(a) | 2,945 | 154,877 | ||||||
Oaktree Capital Group LLC(a) | 1,510 | 78,007 | ||||||
| TOTAL MASTER LIMITED PARTNERSHIPS (Cost $356,743) | 362,685 | |||||||
| OPEN‐END MUTUAL FUNDS (9.25%) | ||||||||
| Absolute Opportunities Fund ‐ Institutional Class | 2,846 | 28,232 | ||||||
| ASG Global Alternatives Fund ‐ Institutional Class | 3,811 | 45,429 | ||||||
See Notes to Financial Statements.
| Semi-Annual Report | March 31, 2015 | 21 |
| Crystal Strategy Absolute Return Fund | Portfolio of Investments |
March 31, 2015 (Unaudited) | |
| Value | ||||||||
| Shares | (Note 2) | |||||||
| OPEN‐END MUTUAL FUNDS (9.25%) (continued) | ||||||||
| ASG Managed Futures Strategy Fund ‐ Institutional Class | 3,915 | $ | 48,154 | |||||
| Aston/River Road Long‐Short Fund ‐ Institutional Class | 3,601 | 41,268 | ||||||
| Bogle Investment Management Small Cap Growth Fund ‐Institutional Class | 4,945 | 163,221 | ||||||
| DoubleLine Total Return Bond Fund ‐ Institutional Class | 9,293 | 102,590 | ||||||
| Goldman Sachs Strategic Income Fund ‐ Institutional Class | 4,108 | 41,324 | ||||||
MainStay Marketfield Fund ‐Institutional Class(b) | 3,685 | 59,738 | ||||||
| Whitebox Tactical Opportunities Fund ‐ Institutional Class | 6,807 | 79,577 | ||||||
| William Blair Macro Allocation Fund ‐ Institutional Class | 5,611 | 72,556 | ||||||
| TOTAL OPEN‐END MUTUAL FUNDS(Cost $702,982) | 682,089 | |||||||
| Expiration | Value | ||||||||||
| Date | Strike Price | Contracts | (Note 2) | ||||||||
PURCHASED OPTIONS (0.18%) | |||||||||||
| Put Options Purchased (0.18%) | |||||||||||
SPDR® S&P 500® ETF Trust(b) | 09/18/2015 | 185 | 35 | 13,300 | |||||||
| TOTAL PURCHASED OPTIONS (Cost $11,187) | 13,300 | ||||||||||
| 7-Day | Value | ||||||||||
| Yield | Shares | (Note 2) | |||||||||
| SHORT TERM INVESTMENTS (29.65%) | |||||||||||
Money Market Fund (29.65%) | |||||||||||
| Fidelity Institutional Money Market Portfolio | 0.09830% | 2,185,918 | 2,185,918 | ||||||||
| TOTAL SHORT TERM INVESTMENTS (Cost $2,185,918) | 2,185,918 | ||||||||||
See Notes to Financial Statements.
| 22 | www.crystalstrategyfunds.com |
| Crystal Strategy Absolute Return Fund | Portfolio of Investments |
March 31, 2015 (Unaudited) | |
| Value | ||||
| (Note 2) | ||||
TOTAL INVESTMENTS (97.41%) (Cost $7,101,476) | $ | 7,181,495 | ||
SECURITIES SOLD SHORT (‐17.59%) (Proceeds $1,293,154) | (1,296,790 | ) | ||
| Other Assets In Excess Of Liabilities (20.18%) | 1,487,392 | |||
| NET ASSETS (100.00%) | $ | 7,372,097 | ||
(a) | Security, or a portion of security, is being held as collateral for short sales. As of March 31, 2015, the aggregate market value of those securities was $1,726,610, which represents approximately 23.42% of the Fund’s net assets. |
(b) | Non-income producing security. |
| Value | |||||||
| Shares | (Note 2) | ||||||
| SCHEDULE OF SECURITIES SOLD SHORT EXCHANGE‐TRADED FUNDS (‐17.59%) | |||||||
Financial Select Sector SPDR® Fund | (5,665 | ) | $ | (136,583 | ) | ||
Industrial Select Sector SPDR® Fund | (2,340 | ) | (130,502 | ) | |||
iShares® MSCI Brazil Capped ETF | (3,380 | ) | (106,031 | ) | |||
iShares® MSCI Canada ETF | (3,885 | ) | (105,594 | ) | |||
iShares® MSCI Emerging Markets ETF | (4,475 | ) | (179,582 | ) | |||
iShares® MSCI South Africa ETF | (1,055 | ) | (70,706 | ) | |||
iShares® MSCI Turkey ETF | (1,515 | ) | (70,296 | ) | |||
SPDR® S&P 500® ETF Trust | (2,410 | ) | (497,496 | ) | |||
| TOTAL EXCHANGE‐TRADED FUNDS (Proceeds $1,293,154) | (1,296,790 | ) | |||||
| TOTAL SECURITIES SOLD SHORT (‐17.59%) (Proceeds $1,293,154) | $ | (1,296,790 | ) | ||||
| Common Abbreviations: |
| ADR - American Depositary Receipt. |
| ETF - Exchange-Traded Fund. |
| LLC - Limited Liability Company. |
| LP - Limited Partnership. |
| Ltd. - Limited. |
| MLP - Master Limited Partnership. |
| MSCI - Morgan Stanley Capital International. |
| REIT - Real Estate Investment Trust. |
| S&P - Standard & Poor’s. |
| SPDR - Standard & Poor’s Depositary Receipt. |
See Notes to Financial Statements.
| Semi-Annual Report | March 31, 2015 | 23 |
| Crystal Strategy Absolute Return Fund | Portfolio of Investments |
March 31, 2015 (Unaudited) | |
For Fund compliance purposes, the Fund’s industry classifications refer to any one or more of the industry sub-classifications used by one or more widely recognized market indices or ratings group indices, and/or as defined by Fund’s management. This definition may not apply for purposes of this report, which may combine industry sub-classifications for reporting ease. Industries are shown as a percentage of the Fund’s net assets. (Unaudited)
See Notes to Financial Statements.
| 24 | www.crystalstrategyfunds.com |
| Crystal Strategy Absolute Return Plus Fund | Portfolio of Investments |
March 31, 2015 (Unaudited) | |
| Value | ||||||||
| Shares | (Note 2) | |||||||
| CLOSED‐END MUTUAL FUNDS (16.49%) | ||||||||
| AllianceBernstein Income Fund, Inc. | 42,925 | $ | 331,381 | |||||
DoubleLine Income Solutions Fund(a) | 5,850 | 116,122 | ||||||
Morgan Stanley China Fund, Inc. ‐ Class A(a) | 6,555 | 215,791 | ||||||
| Tortoise MLP Fund, Inc. | 6,425 | 154,586 | ||||||
| TOTAL CLOSED‐END MUTUAL FUNDS (Cost $770,623) | 817,880 | |||||||
| COMMON STOCKS (25.56%) | ||||||||
Communications (2.95%) | ||||||||
FireEye, Inc.(a)(b) | 1,865 | 73,201 | ||||||
SoftBank Corp., Unsponsored ADR(a) | 2,515 | 73,124 | ||||||
| Total Communications | 146,325 | |||||||
Consumer Non‐cyclical (1.54%) | ||||||||
Odyssey Marine Exploration, Inc.(a)(b) | 109,450 | 76,615 | ||||||
Energy (3.20%) | ||||||||
| Phillips 66 Partners LP | 1,100 | 77,737 | ||||||
SolarCity Corp.(b) | 1,575 | 80,766 | ||||||
| Total Energy | 158,503 | |||||||
Financials (16.63%) | ||||||||
Huntington Bancshares, Inc.(a) | 18,370 | 202,988 | ||||||
ICICI Bank, Ltd. ‐ Sponsored ADR(a) | 11,535 | 119,503 | ||||||
ING Groep NV ‐ Sponsored ADR(a)(b) | 12,530 | 183,063 | ||||||
NorthStar Realty Finance Corp. ‐ REIT(a) | 6,385 | 115,696 | ||||||
| Outfront Media, Inc. ‐ REIT | 1,407 | 42,097 | ||||||
Starwood Property Trust, Inc. ‐ REIT(a) | 6,645 | 161,474 | ||||||
| Total Financials | 824,821 | |||||||
Technology (1.24%) | ||||||||
Zayo Group Holdings, Inc.(b) | 2,205 | 61,652 | ||||||
| TOTAL COMMON STOCKS (Cost $1,281,108) | 1,267,916 | |||||||
See Notes to Financial Statements.
| Semi-Annual Report | March 31, 2015 | 25 |
| Crystal Strategy Absolute Return Plus Fund | Portfolio of Investments |
March 31, 2015 (Unaudited) | |
| Value | ||||||||
| Shares | (Note 2) | |||||||
| EXCHANGE‐TRADED FUNDS (50.11%) | ||||||||
First Trust NASDAQ Technology Dividend Index Fund(a) | 5,275 | $ | 142,056 | |||||
Global X Guru Index ETF(a) | 3,988 | 104,645 | ||||||
Guggenheim Insider Sentiment ETF(a) | 1,625 | 80,567 | ||||||
Guggenheim Spin‐Off ETF(a) | 1,730 | 82,192 | ||||||
iShares® Currency Hedged MSCI Germany ETF | 7,450 | 212,623 | ||||||
iShares® Gold Trust(a)(b) | 9,530 | 109,118 | ||||||
iShares® India 50 ETF(a) | 9,495 | 297,573 | ||||||
iShares® MSCI Frontier 100 ETF(a) | 1,740 | 51,748 | ||||||
iShares® MSCI Italy Capped ETF | 13,735 | 203,278 | ||||||
Market Vectors® Semiconductor ETF(a) | 2,315 | 128,020 | ||||||
PowerShares® Deutsche Bank U.S. Dollar Index Bullish Fund(b) | 5,255 | 136,105 | ||||||
PowerShares® Global Listed Private Equity Portfolio(a) | 11,750 | 132,775 | ||||||
SPDR® Barclays High Yield Bond ETF | 11,735 | 460,247 | ||||||
WisdomTree® Japan Hedged Equity Fund(a) | 4,700 | 259,064 | ||||||
WisdomTree® Japan Hedged Real Estate Fund(a) | 3,050 | 85,095 | ||||||
| TOTAL EXCHANGE‐TRADED FUNDS (Cost $2,436,562) | 2,485,106 | |||||||
| MASTER LIMITED PARTNERSHIPS (8.57%) | ||||||||
Apollo Global Management LLC ‐ Class A(a) | 750 | 16,200 | ||||||
Blackstone Group LP(a) | 2,300 | 89,447 | ||||||
Carlyle Group LP(a) | 1,784 | 48,346 | ||||||
KKR & Co. LP(a) | 1,395 | 31,820 | ||||||
Lazard, Ltd. ‐ Class A(a) | 2,660 | 139,889 | ||||||
Oaktree Capital Group LLC(a) | 1,919 | 99,136 | ||||||
| TOTAL MASTER LIMITED PARTNERSHIPS (Cost $427,150) | 424,838 | |||||||
| OPEN‐END MUTUAL FUNDS (16.71%) | ||||||||
| Absolute Opportunities Fund ‐ Institutional Class | 7,155 | 70,980 | ||||||
| ASG Global Alternatives Fund ‐ Institutional Class | 3,585 | 42,730 | ||||||
See Notes to Financial Statements.
| 26 | www.crystalstrategyfunds.com |
| Crystal Strategy Absolute Return Plus Fund | Portfolio of Investments |
March 31, 2015 (Unaudited) | |
| Value | ||||||||
| Shares | (Note 2) | |||||||
| OPEN‐END MUTUAL FUNDS (16.71%) (continued) | ||||||||
| Aston/River Road Long‐Short Fund ‐ Institutional Class | 6,853 | $ | 78,536 | |||||
| Bogle Investment Management Small Cap Growth Fund ‐Institutional Class | 5,529 | 182,509 | ||||||
| DoubleLine Total Return Bond Fund ‐ Institutional Class | 14,508 | 160,164 | ||||||
| Goldman Sachs Strategic Income Fund ‐Institutional Class | 5,642 | 56,761 | ||||||
MainStay Marketfield Fund ‐ Institutional Class(b) | 4,870 | 78,936 | ||||||
| Whitebox Tactical Opportunities Fund ‐ Institutional Class | 8,123 | 94,962 | ||||||
| William Blair Macro Allocation Fund ‐ Institutional Class | 4,883 | 63,139 | ||||||
| TOTAL OPEN‐END MUTUAL FUNDS (Cost $872,119) | 828,717 | |||||||
| Expiration | Value | |||||||||||||
| Date | Strike Price | Contracts | (Note 2) | |||||||||||
| PURCHASED OPTIONS (0.23%) | ||||||||||||||
| Put Options Purchased (0.23%) | ||||||||||||||
SPDR® S&P 500® ETF Trust(b) | 09/18/2015 | 185 | 30 | 11,400 | ||||||||||
TOTAL PURCHASED OPTIONS (Cost $9,589) | 11,400 | |||||||||||||
TOTAL INVESTMENTS (117.67%) (Cost $5,797,151) | $ | 5,835,857 | ||||||||||||
SECURITIES SOLD SHORT (‐30.36%) (Proceeds $1,512,625) | (1,505,593 | ) | ||||||||||||
| Other Assets in Excess of Liabilities (12.69%) | 629,337 | |||||||||||||
| NET ASSETS (100.00%) | $ | 4,959,601 | ||||||||||||
See Notes to Financial Statements.
| Semi-Annual Report | March 31, 2015 | 27 |
| Crystal Strategy Absolute Return Plus Fund | Portfolio of Investments |
March 31, 2015 (Unaudited) | |
(a) Security, or a portion of security, is being held as collateral for short sales. As of March 31, 2015, the aggregate market value of those securities was $2,816,626, which represents approximately 56.79% of the Fund’s net assets.
(b) Non-income producing security.
| Value | ||||||||
| Shares | (Note 2) | |||||||
| SCHEDULE OF SECURITIES SOLD SHORT | ||||||||
| EXCHANGE‐TRADED FUNDS (‐30.35%) | ||||||||
Financial Select Sector SPDR® Fund | (8,350 | ) | $ | (201,319 | ) | |||
Industrial Select Sector SPDR® Fund | (3,605 | ) | (201,051 | ) | ||||
iShares® MSCI Brazil Capped ETF | (4,780 | ) | (149,949 | ) | ||||
iShares® MSCI Canada ETF | (5,495 | ) | (149,354 | ) | ||||
iShares® MSCI Emerging Markets ETF | (5,065 | ) | (203,258 | ) | ||||
iShares® MSCI South Africa ETF | (1,490 | ) | (99,860 | ) | ||||
iShares® MSCI Turkey ETF | (2,140 | ) | (99,296 | ) | ||||
SPDR® S&P 500® ETF Trust | (1,945 | ) | (401,506 | ) | ||||
| TOTAL EXCHANGE‐TRADED FUNDS (Proceeds $1,512,625) | (1,505,593 | ) | ||||||
| TOTAL SECURITIES SOLD SHORT (‐30.35%)(Proceeds $1,512,625) | $ | (1,505,593 | ) | |||||
| Common Abbreviations: |
| ADR - American Depositary Receipt. |
| ETF - Exchange-Traded Fund. |
| LLC - Limited Liability Company. |
| LP - Limited Partnership. |
| Ltd. - Limited. |
| MLP - Master Limited Partnership. |
| MSCI - Morgan Stanley Capital International. |
| REIT - Real Estate Investment Trust. |
| S&P - Standard & Poor’s. |
| SPDR - Standard & Poor’s Depositary Receipt. |
| For Fund compliance purposes, the Fund’s industry classifications refer to any one or more of the industry sub-classifications used by one or more widely recognized market indices or ratings group indices, and/or as defined by Fund’s management. This definition may not apply for purposes of this report, which may combine industry sub-classifications for reporting ease. Industries are shown as a percentage of the Fund’s net assets. (Unaudited) |
See Notes to Financial Statements.
| 28 | www.crystalstrategyfunds.com |
| Crystal Strategy Family of Funds | Statements of Assets and Liabilities |
March 31, 2015 (Unaudited) | |
| Crystal Strategy | Crystal Strategy | Crystal Strategy | ||||||||||
| Absolute Income | Absolute Return | Absolute Return | ||||||||||
| Fund | Fund | Plus Fund | ||||||||||
| ASSETS: | ||||||||||||
| Investments, at value | $ | 6,152,951 | $ | 7,181,495 | $ | 5,835,857 | ||||||
| Deposit with broker for securities sold short (Note 2) | 828,798 | 1,234,269 | 505,280 | |||||||||
| Receivable for investments sold | — | 183,813 | 207,930 | |||||||||
| Receivable for shares sold | — | 67,163 | — | |||||||||
| Receivable due from adviser | 13,138 | 14,445 | 11,772 | |||||||||
| Dividends receivable | 11,653 | 4,284 | 4,989 | |||||||||
| Prepaid assets | 26,616 | 26,110 | 28,134 | |||||||||
| Total Assets | 7,033,156 | 8,711,579 | 6,593,962 | |||||||||
| LIABILITIES: | ||||||||||||
| Securities sold short (proceeds $952,607, $1,293,154 and $1,512,625) | 938,993 | 1,296,790 | 1,505,593 | |||||||||
| Payable for shares redeemed | — | 9,500 | 44,264 | |||||||||
| Payable for distribution and service fees | 188 | 491 | 55 | |||||||||
| Payable to trustees | 87 | 76 | 81 | |||||||||
| Payable to custodian due to overdraft | — | — | 59,471 | |||||||||
| Payable to chief compliance officer | 376 | 540 | 1,559 | |||||||||
| Accrued expenses and other liabilities | 25,721 | 32,085 | 23,338 | |||||||||
| Total Liabilities | 965,365 | 1,339,482 | 1,634,361 | |||||||||
| NET ASSETS | $ | 6,067,791 | $ | 7,372,097 | $ | 4,959,601 | ||||||
| NET ASSETS CONSIST OF: | ||||||||||||
| Paid‐in capital (Note 6) | $ | 6,058,050 | $ | 7,515,947 | $ | 5,234,147 | ||||||
| Accumulated net investment income | 43,897 | 39,992 | 61,264 | |||||||||
| Accumulated net realized loss on investments | (115,780 | ) | (260,225 | ) | (381,549 | ) | ||||||
| Net unrealized appreciation on investments and securities sold short | 81,624 | 76,383 | 45,739 | |||||||||
| NET ASSETS | $ | 6,067,791 | $ | 7,372,097 | $ | 4,959,601 | ||||||
See Notes to Financial Statements.
| Semi-Annual Report | March 31, 2015 | 29 |
| Crystal Strategy Family of Funds | Statements of Assets and Liabilities |
March 31, 2015 (Unaudited) | |
| Crystal Strategy | Crystal Strategy | Crystal Strategy | ||||||||||
| Absolute Income | Absolute Return | Absolute Return | ||||||||||
| Fund | Fund | Plus Fund | ||||||||||
| INVESTMENTS, AT COST | $ | 6,084,942 | $ | 7,101,476 | $ | 5,797,151 | ||||||
| PRICING OF SHARES | ||||||||||||
Class A: | ||||||||||||
Net Asset Value, offering and redemption price per share(a) | $ | 10.16 | $ | 9.45 | $ | 9.33 | ||||||
| Net Assets | $ | 872,156 | $ | 1,850,414 | $ | 132,799 | ||||||
| Shares of beneficial interest outstanding | 85,878 | 195,808 | 14,234 | |||||||||
| Maximum offering price per share (NAV/0.945, based on maximum sales charge of 5.50% of the offering price) | $ | 10.75 | $ | 10.00 | $ | 9.87 | ||||||
Class I: | ||||||||||||
| Net Asset Value, offering and redemption price per share | $ | 10.16 | $ | 9.49 | $ | 9.35 | ||||||
| Net Assets | $ | 5,184,176 | $ | 5,285,240 | $ | 4,822,080 | ||||||
| Shares of beneficial interest outstanding | 510,149 | 556,797 | 515,661 | |||||||||
Class R: | ||||||||||||
| Net Asset Value, offering and redemption price per share | $ | 10.08 | $ | 9.45 | $ | 9.31 | ||||||
| Net Assets | $ | 11,459 | $ | 236,443 | $ | 4,722 | ||||||
| Shares of beneficial interest outstanding | 1,137 | 25,032 | 507 | |||||||||
(a) Redemption price per share may be reduced for any applicable contingent deferred sales charge. For a description of a possible sales charge, please see the Fund’s Prospectus.
See Notes to Financial Statements.
| 30 | www.crystalstrategyfunds.com |
| Crystal Strategy Family of Funds | Statements of Operations |
For the Period Ended March 31, 2015 (Unaudited) | |
| Crystal Strategy | Crystal Strategy | Crystal Strategy | ||||||||||
| Absolute Income | Absolute Return | Absolute Return | ||||||||||
| Fund | Fund | Plus Fund | ||||||||||
| INVESTMENT INCOME: | ||||||||||||
| Interest | $ | 397 | $ | 561 | $ | 96 | ||||||
| Dividends | 130,028 | 145,270 | 177,919 | |||||||||
| Foreign taxes withheld | (39 | ) | — | — | ||||||||
| Total Investment Income | 130,386 | 145,831 | 178,015 | |||||||||
| EXPENSES: | ||||||||||||
| Investment advisory fee (Note 7) | 20,955 | 25,540 | 24,514 | |||||||||
| Dividend expense on securities sold short | 5,982 | 7,371 | 6,634 | |||||||||
| Interest expense | 3,391 | 5,439 | 7,423 | |||||||||
| Administration fee | 40,280 | 46,085 | 39,771 | |||||||||
| Distribution and service fees | ||||||||||||
| Class A | 1,022 | 2,438 | 323 | |||||||||
| Class R | 16 | 400 | 11 | |||||||||
| Custodian fee | 2,535 | 2,535 | 2,536 | |||||||||
| Legal fees | 4,036 | 6,407 | 3,634 | |||||||||
| Audit fees | 9,037 | 9,037 | 9,037 | |||||||||
| Transfer agent fee | 14,104 | 21,178 | 13,177 | |||||||||
| Trustees fees and expenses | 2,015 | 2,144 | 2,095 | |||||||||
| Registration and filing fees | 16,074 | 15,688 | 16,507 | |||||||||
| Printing fees | 1,160 | 1,407 | 1,278 | |||||||||
| Chief compliance officer fee | 4,837 | 5,230 | 4,908 | |||||||||
| Insurance expense | 352 | 413 | 1,104 | |||||||||
| Offering cost expense | 18,707 | 17,207 | 18,707 | |||||||||
| Other expenses | 4,392 | 4,609 | 4,622 | |||||||||
| Total Expenses | 148,895 | 173,128 | 156,281 | |||||||||
| Less fees waived/reimbursed by investment adviser | ||||||||||||
| Class A | (17,445 | ) | (41,265 | ) | (5,475 | ) | ||||||
| Class I | (92,096 | ) | (78,563 | ) | (104,059 | ) | ||||||
| Class R | (130 | ) | (3,096 | ) | (99 | ) | ||||||
| Total fees waived/reimbursed by investment adviser (Note 7) | (109,671 | ) | (122,924 | ) | (109,633 | ) | ||||||
| Net Expenses | 39,224 | 50,204 | 46,648 | |||||||||
| NET INVESTMENT INCOME | $ | 91,162 | $ | 95,627 | $ | 131,367 | ||||||
See Notes to Financial Statements.
| Semi-Annual Report | March 31, 2015 | 31 |
| Crystal Strategy Family of Funds | Statements of Operations |
For the Period Ended March 31, 2015 (Unaudited) | |
| Crystal Strategy | Crystal Strategy | Crystal Strategy | ||||||||||
| Absolute Income | Absolute Return | Absolute Return | ||||||||||
| Fund | Fund | Plus Fund | ||||||||||
| REALIZED AND UNREALIZED GAIN/(LOSS) ON INVESTMENTS: | ||||||||||||
| Net realized loss on: | ||||||||||||
| Investments | $ | (108,327 | ) | $ | (225,673 | ) | $ | (314,261 | ) | |||
| Written options | (2,152 | ) | (1,915 | ) | (1,817 | ) | ||||||
| Net realized loss | (110,479 | ) | (227,588 | ) | (316,078 | ) | ||||||
| Net change in unrealized appreciation/(depreciation) on: | ||||||||||||
| Investments | 102,962 | 123,610 | 155,810 | |||||||||
| Securities sold short | 13,615 | (3,636 | ) | 7,033 | ||||||||
| Net change in unrealized appreciation | 116,577 | 119,974 | 162,843 | |||||||||
| NET REALIZED AND UNREALIZED GAIN/(LOSS) ON INVESTMENTS | 6,098 | (107,614 | ) | (153,235 | ) | |||||||
| NET INCREASE/(DECREASE) IN NET ASSETS RESULTING FROM OPERATIONS | $ | 97,260 | $ | (11,987 | ) | $ | (21,868 | ) | ||||
See Notes to Financial Statements.
| 32 | www.crystalstrategyfunds.com |
| Crystal Strategy Absolute Income Fund | Statements of Changes in Net Assets |
| Six Months | For the Period | |||||||
| Ended | Ended | |||||||
| March 31, 2015 | September 30, | |||||||
| (Unaudited) | 2014(a) | |||||||
| OPERATIONS: | ||||||||
| Net investment income | $ | 91,162 | $ | 32,501 | ||||
| Net realized loss on investments | (108,327 | ) | (7,494 | ) | ||||
| Net realized loss on written options | (2,152 | ) | — | |||||
| Net change in unrealized appreciation/ (depreciation) on investments and securities sold short | 116,577 | (34,953 | ) | |||||
| Net increase/(decrease) in net assets resulting from operations | 97,260 | (9,946 | ) | |||||
| DISTRIBUTIONS TO SHAREHOLDERS: | ||||||||
| From net investment income | ||||||||
| Class A | (6,920 | ) | (4,452 | ) | ||||
| Class I | (47,086 | ) | (23,816 | ) | ||||
| Class R | (46 | ) | (73 | ) | ||||
| Total distributions | (54,052 | ) | (28,341 | ) | ||||
| BENEFICIAL SHARE TRANSACTIONS: | ||||||||
| Class A | ||||||||
| Shares sold | 292,319 | 1,129,757 | ||||||
| Dividends reinvested | 4,224 | 3,512 | ||||||
| Shares redeemed | (553,833 | ) | (300 | ) | ||||
| Redemption fees (Note 6) | 482 | 2 | ||||||
| Net increase/(decrease) from beneficial share transactions | (256,808 | ) | 1,132,971 | |||||
| Class I | ||||||||
| Shares sold | 2,643,350 | 3,411,813 | ||||||
| Dividends reinvested | 46,915 | 23,742 | ||||||
| Shares redeemed | (920,292 | ) | (30,193 | ) | ||||
| Net increase from beneficial share transactions | 1,769,973 | 3,405,362 | ||||||
| Class R | ||||||||
| Shares sold | 6,250 | 5,203 | ||||||
| Dividends reinvested | 46 | 73 | ||||||
| Shares redeemed | — | (200 | ) | |||||
| Net increase from beneficial share transactions | 6,296 | 5,076 | ||||||
| Net increase in net assets | 1,562,669 | 4,505,122 | ||||||
| NET ASSETS: | ||||||||
| Beginning of period | 4,505,122 | — | ||||||
| End of period (including accumulated net investment income of $43,897 and $6,787) | $ | 6,067,791 | $ | 4,505,122 | ||||
(a) Commenced operations on December 31, 2013.
See Notes to Financial Statements.
| Semi-Annual Report | March 31, 2015 | 33 |
| Crystal Strategy Absolute Return Fund | Statements of Changes in Net Assets |
| Six Months | For the Period | |||||||
| Ended | Ended | |||||||
| March 31, 2015 | September 30, | |||||||
| (Unaudited) | 2014(a) | |||||||
| OPERATIONS: | ||||||||
| Net investment income | $ | 95,627 | $ | 5,582 | ||||
| Net realized loss on investments | (225,673 | ) | (36,210 | ) | ||||
| Net realized loss on written options | (1,915 | ) | — | |||||
| Long‐term capital gain distributions from other investment companies | — | 150 | ||||||
| Net change in unrealized appreciation/ (depreciation) on investments and securities sold short | 119,974 | (43,591 | ) | |||||
| Net decrease in net assets resulting from operations | (11,987 | ) | (74,069 | ) | ||||
| DISTRIBUTIONS TO SHAREHOLDERS: | ||||||||
| From net investment income | ||||||||
| Class A | (25,845 | ) | — | |||||
| Class I | (36,097 | ) | — | |||||
| Class R | (1,973 | ) | — | |||||
| Total distributions | (63,915 | ) | — | |||||
| BENEFICIAL SHARE TRANSACTIONS: | ||||||||
| Class A | ||||||||
| Shares sold | 1,274,925 | 2,051,212 | ||||||
| Dividends reinvested | 12,278 | — | ||||||
| Shares redeemed | (1,386,243 | ) | (34,508 | ) | ||||
| Redemption fees (Note 6) | 2 | 210 | ||||||
| Net increase/(decrease) from beneficial share transactions | (99,038 | ) | 2,016,914 | |||||
| Class I | ||||||||
| Shares sold | 3,153,675 | 3,171,305 | ||||||
| Dividends reinvested | 34,915 | — | ||||||
| Shares redeemed | (795,739 | ) | (199,919 | ) | ||||
| Redemption fees (Note 6) | 386 | 748 | ||||||
| Net increase from beneficial share transactions | 2,393,237 | 2,972,134 | ||||||
| Class R | ||||||||
| Shares sold | 231,845 | 5,203 | ||||||
| Dividends reinvested | 1,973 | — | ||||||
| Shares redeemed | — | (200 | ) | |||||
| Net increase from beneficial share transactions | 233,818 | 5,003 | ||||||
| Net increase in net assets | 2,452,115 | 4,919,982 | ||||||
| NET ASSETS: | ||||||||
| Beginning of period | 4,919,982 | — | ||||||
| End of period (including accumulated net investment income of $39,992 and $8,280) | $ | 7,372,097 | $ | 4,919,982 | ||||
(a) Commenced operations on December 31, 2013.
See Notes to Financial Statements.
| 34 | www.crystalstrategyfunds.com |
| Crystal Strategy Absolute Return Plus Fund | Statements of Changes in Net Assets |
| Six Months | For the Period | |||||||
| Ended | Ended | |||||||
| March 31, 2015 | September 30, | |||||||
| (Unaudited) | 2014(a) | |||||||
| OPERATIONS: | ||||||||
| Net investment income | $ | 131,367 | $ | 13,478 | ||||
| Net realized loss on investments | (314,261 | ) | (76,882 | ) | ||||
| Net realized loss on written options | (1,817 | ) | — | |||||
| Net change in unrealized appreciation/ (depreciation) on investments and securities sold short | 162,843 | (117,104 | ) | |||||
| Net decrease in net assets resulting from operations | (21,868 | ) | (180,508 | ) | ||||
| DISTRIBUTIONS TO SHAREHOLDERS: | ||||||||
| From net investment income | ||||||||
| Class A | (3,948 | ) | — | |||||
| Class I | (77,411 | ) | — | |||||
| Class R | (69 | ) | — | |||||
| Total distributions | (81,428 | ) | — | |||||
| BENEFICIAL SHARE TRANSACTIONS: | ||||||||
| Class A | ||||||||
| Shares sold | — | 267,943 | ||||||
| Dividends reinvested | 3,948 | — | ||||||
| Shares redeemed | (129,265 | ) | (240 | ) | ||||
| Net increase/(decrease) from beneficial share transactions | (125,317 | ) | 267,703 | |||||
| Class I | ||||||||
| Shares sold | 558,722 | 5,115,539 | ||||||
| Dividends reinvested | 56,053 | — | ||||||
| Shares redeemed | (551,355 | ) | (83,022 | ) | ||||
| Redemption fees (Note 6) | 10 | — | ||||||
| Net increase from beneficial share transactions | 63,430 | 5,032,517 | ||||||
| Class R | ||||||||
| Shares sold | — | 5,203 | ||||||
| Dividends reinvested | 69 | — | ||||||
| Shares redeemed | — | (200 | ) | |||||
| Net increase from beneficial share transactions | 69 | 5,003 | ||||||
| Net increase/(decrease) in net assets | (165,114 | ) | 5,124,715 | |||||
| NET ASSETS: | ||||||||
| Beginning of period | 5,124,715 | — | ||||||
| End of period (including accumulated net investment income of $61,264 and $11,325) | $ | 4,959,601 | $ | 5,124,715 | ||||
(a) Commenced operations on December 31, 2013.
See Notes to Financial Statements.
| Semi-Annual Report | March 31, 2015 | 35 |
Crystal Strategy Absolute Income Fund – Class A | Financial Highlights |
For a share outstanding throughout the periods presented.
| Six Months | ||||||||
| Ended | For the Period | |||||||
| March 31, 2015 | Ended | |||||||
| (Unaudited) | September 30, 2014(a) | |||||||
| NET ASSET VALUE, BEGINNING OF PERIOD | $ | 10.09 | $ | 10.00 | ||||
| INCOME/(LOSS) FROM OPERATIONS: | ||||||||
Net investment income(b) | 0.15 | 0.28 | ||||||
| Net realized and unrealized gain/(loss) on investments | 0.02 | (0.10 | ) | |||||
| Total from Investment Operations | 0.17 | 0.18 | ||||||
| LESS DISTRIBUTIONS: | ||||||||
| From investment income | (0.11 | ) | (0.09 | ) | ||||
| Total Distributions | (0.11 | ) | (0.09 | ) | ||||
| REDEMPTION FEES ADDED TO PAID IN CAPITAL | 0.01 | 0.00 | (c) | |||||
| NET INCREASE IN NET ASSET VALUE | 0.07 | 0.09 | ||||||
| NET ASSET VALUE, END OF PERIOD | $ | 10.16 | $ | 10.09 | ||||
TOTAL RETURN(d) | 1.78 | % | 1.83 | % | ||||
| SUPPLEMENTAL DATA: | ||||||||
| Net assets, End of Period (in 000s) | $ | 872 | $ | 1,124 | ||||
| RATIOS TO AVERAGE NET ASSETS (including interest expense and dividend expense on securities sold short) | ||||||||
Operating expenses excluding fee waivers/reimbursements(e) | 5.98 | %(f) | N/ | A | ||||
Operating expenses including fee waivers/reimbursements(e) | �� | 1.71 | %(f) | N/ | A | |||
Net investment income including fee waivers/reimbursements(e) | 2.89 | %(f) | N/ | A | ||||
| RATIOS TO AVERAGE NET ASSETS (excluding interest expense and dividend expense on securities sold short) | ||||||||
Operating expenses excluding fee waivers/reimbursements(e) | 5.62 | %(f) | 13.76 | %(f) | ||||
Operating expenses including fee waivers/reimbursements(e) | 1.35 | %(f) | 1.35 | %(f) | ||||
Net investment income including fee waivers/reimbursements(e) | 2.54 | %(f) | 2.92 | %(f) | ||||
| PORTFOLIO TURNOVER RATE | 78 | %(g) | 81 | %(g) | ||||
See Notes to Financial Statements.
| 36 | www.crystalstrategyfunds.com |
Crystal Strategy Absolute Income Fund – Class A | Financial Highlights |
For a share outstanding throughout the periods presented.
| (a) | Commenced operations on December 31, 2013. |
| (b) | Per share amounts are based upon average shares outstanding. |
| (c) | Less than $0.005 per share. |
| (d) | Total return is for the period indicated and has not been annualized. The total return would have been lower had certain expenses not been waived / reimbursed during the period. The return shown does not reflect the deduction of taxes that a shareholder would pay on Fund distributions or the redemption of Fund shares. |
| (e) | The ratios exclude the impact of expenses of the underlying funds in which the Fund invests as represented in the Portfolio of Investments. |
| (f) | Annualized. |
| (g) | Portfolio turnover rate for periods less than one full year have not been annualized. |
See Notes to Financial Statements.
| Semi-Annual Report | March 31, 2015 | 37 |
Crystal Strategy Absolute Income Fund – Class I | Financial Highlights |
For a share outstanding throughout the periods presented.
| Six Months | ||||||||
| Ended | For the Period | |||||||
| March 31, 2015 | Ended | |||||||
| (Unaudited) | September 30, 2014(a) | |||||||
| NET ASSET VALUE, BEGINNING OF PERIOD | $ | 10.07 | $ | 10.00 | ||||
| INCOME/(LOSS) FROM OPERATIONS: | ||||||||
Net investment income(b) | 0.18 | 0.31 | ||||||
| Net realized and unrealized gain/(loss) on investments | 0.01 | (0.12 | ) | |||||
| Total from Investment Operations | 0.19 | 0.19 | ||||||
| LESS DISTRIBUTIONS: | ||||||||
| From investment income | (0.10 | ) | (0.12 | ) | ||||
| Total Distributions | (0.10 | ) | (0.12 | ) | ||||
| NET INCREASE IN NET ASSET VALUE | 0.09 | 0.07 | ||||||
| NET ASSET VALUE, END OF PERIOD | $ | 10.16 | $ | 10.07 | ||||
TOTAL RETURN(c) | 1.89 | % | 1.87 | % | ||||
| SUPPLEMENTAL DATA: | ||||||||
| Net assets, End of Period (in 000s) | $ | 5,184 | $ | 3,376 | ||||
| RATIOS TO AVERAGE NET ASSETS (including interest expense and dividend expense on securities sold short) | ||||||||
Operating expenses excluding fee waivers/reimbursements(d) | 5.63 | %(e) | N/ | A | ||||
Operating expenses including fee waivers/reimbursements(d) | 1.46 | %(e) | N/ | A | ||||
Net investment income including fee waivers/reimbursements(d) | 3.59 | %(e) | N/ | A | ||||
| RATIOS TO AVERAGE NET ASSETS (excluding interest expense and dividend expense on securities sold short) | ||||||||
Operating expenses excluding fee waivers/reimbursements(d) | 5.27 | %(e) | 15.22 | %(e) | ||||
Operating expenses including fee waivers/reimbursements(d) | 1.10 | %(e) | 1.10 | %(e) | ||||
Net investment income including fee waivers/reimbursements(d) | 3.23 | %(e) | 3.06 | %(e) | ||||
| PORTFOLIO TURNOVER RATE | 78 | %(f) | 81 | %(f) | ||||
See Notes to Financial Statements.
| 38 | www.crystalstrategyfunds.com |
Crystal Strategy Absolute Income Fund – Class I | Financial Highlights |
For a share outstanding throughout the periods presented.
| (a) | Commenced operations on December 31, 2013. |
| (b) | Per share amounts are based upon average shares outstanding. |
| (c) | Total return is for the period indicated and has not been annualized. The total return would have been lower had certain expenses not been waived / reimbursed during the period. The return shown does not reflect the deduction of taxes that a shareholder would pay on Fund distributions or the redemption of Fund shares. |
| (d) | The ratios exclude the impact of expenses of the underlying funds in which the Fund invests as represented in the Portfolio of Investments. |
| (e) | Annualized. |
| (f) | Portfolio turnover rate for periods less than one full year have not been annualized. |
See Notes to Financial Statements.
| Semi-Annual Report | March 31, 2015 | 39 |
Crystal Strategy Absolute Income Fund – Class R | Financial Highlights |
For a share outstanding throughout the periods presented.
| Six Months | ||||||||
| Ended | For the Period | |||||||
| March 31, 2015 | Ended | |||||||
| (Unaudited) | September 30, 2014(a) | |||||||
| NET ASSET VALUE, BEGINNING OF PERIOD | $ | 10.01 | $ | 10.00 | ||||
| INCOME/(LOSS) FROM OPERATIONS: | ||||||||
Net investment income(b) | 0.15 | 0.17 | ||||||
| Net realized and unrealized gain/(loss) on investments | 0.01 | (0.01 | ) | |||||
| Total from Investment Operations | 0.16 | 0.16 | ||||||
| LESS DISTRIBUTIONS: | ||||||||
| From investment income | (0.09 | ) | (0.15 | ) | ||||
| Total Distributions | (0.09 | ) | (0.15 | ) | ||||
| NET INCREASE IN NET ASSET VALUE | 0.07 | 0.01 | ||||||
| NET ASSET VALUE, END OF PERIOD | $ | 10.08 | $ | 10.01 | ||||
TOTAL RETURN(c) | 1.63 | % | 1.55 | % | ||||
| SUPPLEMENTAL DATA: | ||||||||
| Net assets, End of Period (in 000s) | $ | 11 | $ | 5 | ||||
| RATIOS TO AVERAGE NET ASSETS (including interest expense and dividend expense on securities sold short) | ||||||||
Operating expenses excluding fee waivers/reimbursements(d) | 6.06 | %(e) | N/ | A | ||||
Operating expenses including fee waivers/reimbursements(d) | 1.96 | %(e) | N/ | A | ||||
Net investment income including fee waivers/reimbursements(d) | 3.08 | %(e) | N/ | A | ||||
| RATIOS TO AVERAGE NET ASSETS (excluding interest expense and dividend expense on securities sold short) | ||||||||
Operating expenses excluding fee waivers/reimbursements(d) | 5.70 | %(e) | 49.42 | %(e) | ||||
Operating expenses including fee waivers/reimbursements(d) | 1.60 | %(e) | 1.60 | %(e) | ||||
Net investment income including fee waivers/reimbursements(d) | 2.72 | %(e) | 2.18 | %(e) | ||||
| PORTFOLIO TURNOVER RATE | 78 | %(f) | 81 | %(f) | ||||
See Notes to Financial Statements.
| 40 | www.crystalstrategyfunds.com |
Crystal Strategy Absolute Income Fund – Class R | Financial Highlights |
For a share outstanding throughout the periods presented.
| (a) | Commenced operations on December 31, 2013. |
| (b) | Per share amounts are based upon average shares outstanding. |
| (c) | Total return is for the period indicated and has not been annualized. The total return would have been lower had certain expenses not been waived / reimbursed during the period. The return shown does not reflect the deduction of taxes that a shareholder would pay on Fund distributions or the redemption of Fund shares. |
| (d) | The ratios exclude the impact of expenses of the underlying funds in which the Fund invests as represented in the Portfolio of Investments. |
| (e) | Annualized. |
| (f) | Portfolio turnover rate for periods less than one full year have not been annualized. |
See Notes to Financial Statements.
| Semi-Annual Report | March 31, 2015 | 41 |
Crystal Strategy Absolute Return Fund – Class A | Financial Highlights |
For a share outstanding throughout the periods presented.
| Six Months | ||||||||
| Ended | For the Period | |||||||
| March 31, 2015 | Ended | |||||||
| (Unaudited) | September 30, 2014(a) | |||||||
| NET ASSET VALUE, BEGINNING OF PERIOD | $ | 9.60 | $ | 10.00 | ||||
| INCOME/(LOSS) FROM OPERATIONS: | ||||||||
Net investment income(b) | 0.17 | 0.02 | ||||||
| Net realized and unrealized loss on investments | (0.22 | ) | (0.42 | ) | ||||
| Total from Investment Operations | (0.05 | ) | (0.40 | ) | ||||
| LESS DISTRIBUTIONS: | ||||||||
| From investment income | (0.10 | ) | — | |||||
| Total Distributions | (0.10 | ) | — | |||||
| REDEMPTION FEES ADDED TO PAID IN CAPITAL | 0.00 | (c) | 0.00 | (c) | ||||
| NET DECREASE IN NET ASSET VALUE | (0.15 | ) | (0.40 | ) | ||||
| NET ASSET VALUE, END OF PERIOD | $ | 9.45 | $ | 9.60 | ||||
TOTAL RETURN(d) | (0.53 | )% | (4.00 | )% | ||||
| SUPPLEMENTAL DATA: | ||||||||
| Net assets, End of Period (in 000s) | $ | 1,850 | $ | 1,982 | ||||
| RATIOS TO AVERAGE NET ASSETS (including interest expense and dividend expense on securities sold short) | ||||||||
Operating expenses excluding fee waivers/reimbursements(e) | 6.06 | %(f) | N/ | A | ||||
Operating expenses including fee waivers/reimbursements(e) | 1.83 | %(f) | N/ | A | ||||
Net investment income including fee waivers/reimbursements(e) | 3.62 | %(f) | N/ | A | ||||
| RATIOS TO AVERAGE NET ASSETS (excluding interest expense and dividend expense on securities sold short) | ||||||||
Operating expenses excluding fee waivers/reimbursements(e) | 5.63 | %(f) | 11.32 | %(f) | ||||
Operating expenses including fee waivers/reimbursements(e) | 1.40 | %(f) | 1.40 | %(f) | ||||
Net investment income including fee waivers/reimbursements(e) | 3.19 | %(f) | 0.26 | %(f) | ||||
| PORTFOLIO TURNOVER RATE | 134 | %(g) | 159 | %(g) | ||||
See Notes to Financial Statements.
| 42 | www.crystalstrategyfunds.com |
Crystal Strategy Absolute Return Fund – Class A | Financial Highlights |
For a share outstanding throughout the periods presented.
| (a) | Commenced operations on December 31, 2013. |
| (b) | Per share amounts are based upon average shares outstanding. |
(c) | Less than $0.005 per share. |
| (d) | Total return is for the period indicated and has not been annualized. The total return would have been lower had certain expenses not been waived / reimbursed during the period. The return shown does not reflect the deduction of taxes that a shareholder would pay on Fund distributions or the redemption of Fund shares. |
| (e) | The ratios exclude the impact of expenses of the underlying funds in which the Fund invests as represented in the Portfolio of Investments. |
| (f) | Annualized. |
| (g) | Portfolio turnover rate for periods less than one full year have not been annualized. |
See Notes to Financial Statements.
| Semi-Annual Report | March 31, 2015 | 43 |
Crystal Strategy Absolute Return Fund – Class I | Financial Highlights |
For a share outstanding throughout the periods presented.
| Six Months | ||||||||
| Ended | For the Period | |||||||
| March 31, 2015 | Ended | |||||||
| (Unaudited) | September 30, 2014(a) | |||||||
| NET ASSET VALUE, BEGINNING OF PERIOD | $ | 9.63 | $ | 10.00 | ||||
| INCOME/(LOSS) FROM OPERATIONS: | ||||||||
Net investment income(b) | 0.14 | 0.04 | ||||||
| Net realized and unrealized loss on investments | (0.18 | ) | (0.42 | ) | ||||
| Total from Investment Operations | (0.04 | ) | (0.38 | ) | ||||
| LESS DISTRIBUTIONS: | ||||||||
| From investment income | (0.10 | ) | — | |||||
| Total Distributions | (0.10 | ) | — | |||||
| REDEMPTION FEES ADDED TO PAID IN CAPITAL | 0.00 | (c) | 0.01 | |||||
| NET DECREASE IN NET ASSET VALUE | (0.14 | ) | (0.37 | ) | ||||
| NET ASSET VALUE, END OF PERIOD | $ | 9.49 | $ | 9.63 | ||||
TOTAL RETURN(d) | (0.38 | )% | (3.70 | )% | ||||
| SUPPLEMENTAL DATA: | ||||||||
| Net assets, End of Period (in 000s) | $ | 5,285 | $ | 2,933 | ||||
| RATIOS TO AVERAGE NET ASSETS (including interest expense and dividend expense on securities sold short) | ||||||||
Operating expenses excluding fee waivers/reimbursements(e) | 5.61 | %(f) | N/ | A | ||||
Operating expenses including fee waivers/reimbursements(e) | 1.58 | %(f) | N/ | A | ||||
Net investment income including fee waivers/reimbursements(e) | 2.94 | %(f) | N/ | A | ||||
| RATIOS TO AVERAGE NET ASSETS (excluding interest expense and dividend expense on securities sold short) | ||||||||
Operating expenses excluding fee waivers/reimbursements(e) | 5.18 | %(f) | 14.36 | %(f) | ||||
Operating expenses including fee waivers/reimbursements(e) | 1.15 | %(f) | 1.15 | %(f) | ||||
Net investment income including fee waivers/reimbursements(e) | 2.52 | %(f) | 0.45 | %(f) | ||||
| PORTFOLIO TURNOVER RATE | 134 | %(g) | 159 | %(g) | ||||
See Notes to Financial Statements.
| 44 | www.crystalstrategyfunds.com |
Crystal Strategy Absolute Return Fund – Class I | Financial Highlights |
For a share outstanding throughout the periods presented.
(a) | Commenced operations on December 31, 2013. |
(b) | Per share amounts are based upon average shares outstanding. |
(c) | Less than $0.005 per share. |
(d) | Total return is for the period indicated and has not been annualized. The total return would have been lower had certain expenses not been waived / reimbursed during the period. The return shown does not reflect the deduction of taxes that a shareholder would pay on Fund distributions or the redemption of Fund shares. |
(e) | The ratios exclude the impact of expenses of the underlying funds in which the Fund invests as represented in the Portfolio of Investments. |
(f) | Annualized. |
(g) | Portfolio turnover rate for periods less than one full year have not been annualized. |
See Notes to Financial Statements.
| Semi-Annual Report | March 31, 2015 | 45 |
| Crystal Strategy Absolute Return Fund – Class R | Financial Highlights |
For a share outstanding throughout the periods presented.
| Six Months | ||||||||
| Ended | For the Period | |||||||
| March 31, 2015 | Ended | |||||||
| (Unaudited) | September 30, 2014(a) | |||||||
| NET ASSET VALUE, BEGINNING OF PERIOD | $ | 9.58 | $ | 10.00 | ||||
| INCOME/(LOSS) FROM OPERATIONS: | ||||||||
Net investment income/(loss)(b) | 0.17 | (0.02 | ) | |||||
| Net realized and unrealized loss on investments | (0.22 | ) | (0.40 | ) | ||||
| Total from Investment Operations | (0.05 | ) | (0.42 | ) | ||||
| LESS DISTRIBUTIONS: | ||||||||
| From investment income | (0.08 | ) | — | |||||
| Total Distributions | (0.08 | ) | — | |||||
| NET DECREASE IN NET ASSET VALUE | (0.13 | ) | (0.42 | ) | ||||
| NET ASSET VALUE, END OF PERIOD | $ | 9.45 | $ | 9.58 | ||||
TOTAL RETURN(c) | (0.50 | )% | (4.20 | )% | ||||
| SUPPLEMENTAL DATA: | ||||||||
| Net assets, End of Period (in 000s) | $ | 236 | $ | 5 | ||||
| RATIOS TO AVERAGE NET ASSETS (including interest expense and dividend expense on securities sold short) | ||||||||
Operating expenses excluding fee waivers/reimbursements(d) | 5.94 | %(e) | N/ | A | ||||
Operating expenses including fee waivers/reimbursements(d) | 2.08 | %(e) | N/ | A | ||||
Net investment income including fee waivers/reimbursements(d) | 3.66 | %(e) | N/ | A | ||||
| RATIOS TO AVERAGE NET ASSETS (excluding interest expense and dividend expense on securities sold short) | ||||||||
Operating expenses excluding fee waivers/reimbursements(d) | 5.51 | %(e) | 24.38 | %(e) | ||||
Operating expenses including fee waivers/reimbursements(d) | 1.65 | %(e) | 1.65 | %(e) | ||||
Net investment income/(loss) including fee waivers/reimbursements(d) | 3.23 | %(e) | (0.33 | )%(e) | ||||
| PORTFOLIO TURNOVER RATE | 134 | %(f) | 159 | %(f) | ||||
See Notes to Financial Statements.
| 46 | www.crystalstrategyfunds.com |
| Crystal Strategy Absolute Return Fund – Class R | Financial Highlights |
For a share outstanding throughout the periods presented.
| (a) | Commenced operations on December 31, 2013. |
| (b) | Per share amounts are based upon average shares outstanding. |
| (c) | Total return is for the period indicated and has not been annualized. The total return would have been lower had certain expenses not been waived / reimbursed during the period. The return shown does not reflect the deduction of taxes that a shareholder would pay on Fund distributions or the redemption of Fund shares. |
| (d) | The ratios exclude the impact of expenses of the underlying funds in which the Fund invests as represented in the Portfolio of Investments. |
| (e) | Annualized. |
| (f) | Portfolio turnover rate for periods less than one full year have not been annualized. |
See Notes to Financial Statements.
| Semi-Annual Report | March 31, 2015 | 47 |
| Crystal Strategy Absolute Return Plus Fund – Class A | Financial Highlights |
For a share outstanding throughout the periods presented.
| Six Months | ||||||||
| Ended | For the Period | |||||||
| March 31, 2015 | Ended | |||||||
| (Unaudited) | September 30, 2014(a) | |||||||
| NET ASSET VALUE, BEGINNING OF PERIOD | $ | 9.52 | $ | 10.00 | ||||
| INCOME/(LOSS) FROM OPERATIONS: | ||||||||
Net investment income(b) | 0.23 | 0.03 | ||||||
| Net realized and unrealized loss on investments | (0.28 | ) | (0.51 | ) | ||||
| Total from Investment Operations | (0.05 | ) | (0.48 | ) | ||||
| LESS DISTRIBUTIONS: | ||||||||
| From investment income | (0.14 | ) | — | |||||
| Total Distributions | (0.14 | ) | — | |||||
| NET DECREASE IN NET ASSET VALUE | (0.19 | ) | (0.48 | ) | ||||
| NET ASSET VALUE, END OF PERIOD | $ | 9.33 | $ | 9.52 | ||||
TOTAL RETURN(c) | (0.50 | )% | (4.80 | )% | ||||
| SUPPLEMENTAL DATA: | ||||||||
| Net assets, End of Period (in 000s) | $ | 133 | $ | 264 | ||||
| RATIOS TO AVERAGE NET ASSETS (including interest expense and dividend expense on securities sold short) | ||||||||
Operating expenses excluding fee waivers/reimbursements(d) | 6.28 | %(e) | N/ | A | ||||
Operating expenses including fee waivers/reimbursements(d) | 2.04 | %(e) | N/ | A | ||||
Net investment income including fee waivers/reimbursements(d) | 4.86 | %(e) | N/ | A | ||||
| RATIOS TO AVERAGE NET ASSETS (excluding interest expense and dividend expense on securities sold short) | ||||||||
Operating expenses excluding fee waivers/reimbursements(d) | 5.74 | %(e) | 9.24 | %(e) | ||||
Operating expenses including fee waivers/reimbursements(d) | 1.50 | %(e) | 1.50 | %(e) | ||||
Net investment income including fee waivers/reimbursements(d) | 4.32 | %(e) | 0.33 | %(e) | ||||
| PORTFOLIO TURNOVER RATE | 132 | %(f) | 270 | %(f) | ||||
See Notes to Financial Statements.
| 48 | www.crystalstrategyfunds.com |
| Crystal Strategy Absolute Return Plus Fund – Class A | Financial Highlights |
For a share outstanding throughout the periods presented.
| (a) | Commenced operations on December 31, 2013. |
| (b) | Per share amounts are based upon average shares outstanding. |
| (c) | Total return is for the period indicated and has not been annualized. The total return would have been lower had certain expenses not been waived / reimbursed during the period. The return shown does not reflect the deduction of taxes that a shareholder would pay on Fund distributions or the redemption of Fund shares. |
| (d) | The ratios exclude the impact of expenses of the underlying funds in which the Fund invests as represented in the Portfolio of Investments. |
| (e) | Annualized. |
| (f) | Portfolio turnover rate for periods less than one full year have not been annualized. |
See Notes to Financial Statements.
| Semi-Annual Report | March 31, 2015 | 49 |
| Crystal Strategy Absolute Return Plus Fund – Class I | Financial Highlights |
For a share outstanding throughout the periods presented.
| Six Months | ||||||||
| Ended | For the Period | |||||||
| March 31, 2015 | Ended | |||||||
| (Unaudited) | September 30, 2014(a) | |||||||
| NET ASSET VALUE, BEGINNING OF PERIOD | $ | 9.54 | $ | 10.00 | ||||
| INCOME/(LOSS) FROM OPERATIONS: | ||||||||
Net investment income(b) | 0.24 | 0.04 | ||||||
| Net realized and unrealized loss on investments | (0.28 | ) | (0.50 | ) | ||||
| Total from Investment Operations | (0.04 | ) | (0.46 | ) | ||||
| LESS DISTRIBUTIONS: | ||||||||
| From investment income | (0.15 | ) | — | |||||
| Total Distributions | (0.15 | ) | — | |||||
| REDEMPTION FEES ADDED TO PAID IN CAPITAL | 0.00 | (c) | — | |||||
| NET DECREASE IN NET ASSET VALUE | (0.19 | ) | (0.46 | ) | ||||
| NET ASSET VALUE, END OF PERIOD | $ | 9.35 | $ | 9.54 | ||||
TOTAL RETURN(d) | (0.44 | )% | (4.60 | )% | ||||
| SUPPLEMENTAL DATA: | ||||||||
| Net assets, End of Period (in 000s) | $ | 4,822 | $ | 4,856 | ||||
| RATIOS TO AVERAGE NET ASSETS (including interest expense and dividend expense on securities sold short) | ||||||||
Operating expenses excluding fee waivers/reimbursements(e) | 6.04 | %(f) | N/ | A | ||||
Operating expenses including fee waivers/reimbursements(e) | 1.79 | %(f) | N/ | A | ||||
Net investment income including fee waivers/reimbursements(e) | 5.10 | %(f) | N/ | A | ||||
| RATIOS TO AVERAGE NET ASSETS (excluding interest expense and dividend expense on securities sold short) | ||||||||
Operating expenses excluding fee waivers/reimbursements(e) | 5.50 | %(f) | 9.23 | %(f) | ||||
Operating expenses including fee waivers/reimbursements(e) | 1.25 | %(f) | 1.25 | %(f) | ||||
Net investment income including fee waivers/reimbursements(e) | 4.56 | %(f) | 0.43 | %(f) | ||||
| PORTFOLIO TURNOVER RATE | 132 | %(g) | 270 | %(g) | ||||
See Notes to Financial Statements.
| 50 | www.crystalstrategyfunds.com |
| Crystal Strategy Absolute Return Plus Fund – Class I | Financial Highlights |
For a share outstanding throughout the periods presented.
| (a) | Commenced operations on December 31, 2013. |
| (b) | Per share amounts are based upon average shares outstanding. |
(c) | Less than $0.005 per share. |
| (d) | Total return is for the period indicated and has not been annualized. The total return would have been lower had certain expenses not been waived / reimbursed during the period. The return shown does not reflect the deduction of taxes that a shareholder would pay on Fund distributions or the redemption of Fund shares. |
| (e) | The ratios exclude the impact of expenses of the underlying funds in which the Fund invests as represented in the Portfolio of Investments. |
| (f) | Annualized. |
| (g) | Portfolio turnover rate for periods less than one full year have not been annualized. |
See Notes to Financial Statements.
| Semi-Annual Report | March 31, 2015 | 51 |
| Crystal Strategy Absolute Return Plus Fund – Class R | Financial Highlights |
For a share outstanding throughout the periods presented.
| Six Months | ||||||||
| Ended | For the Period | |||||||
| March 31, 2015 | Ended | |||||||
| (Unaudited) | September 30, 2014(a) | |||||||
| NET ASSET VALUE, BEGINNING OF PERIOD | $ | 9.51 | $ | 10.00 | ||||
| INCOME/(LOSS) FROM OPERATIONS: | ||||||||
Net investment income/(loss)(b) | 0.21 | (0.02 | ) | |||||
| Net realized and unrealized loss on investments | (0.27 | ) | (0.47 | ) | ||||
| Total from Investment Operations | (0.06 | ) | (0.49 | ) | ||||
| LESS DISTRIBUTIONS: | ||||||||
| From investment income | (0.14 | ) | — | |||||
| Total Distributions | (0.14 | ) | — | |||||
| NET DECREASE IN NET ASSET VALUE | (0.20 | ) | (0.49 | ) | ||||
| NET ASSET VALUE, END OF PERIOD | $ | 9.31 | $ | 9.51 | ||||
TOTAL RETURN(c) | (0.65 | )% | (4.90 | )% | ||||
| SUPPLEMENTAL DATA: | ||||||||
| Net assets, End of Period (in 000s) | $ | 5 | $ | 5 | ||||
| RATIOS TO AVERAGE NET ASSETS (including interest expense and dividend expense on securities sold short) | ||||||||
Operating expenses excluding fee waivers/reimbursements(d) | 6.52 | %(e) | N/ | A | ||||
Operating expenses including fee waivers/reimbursements(d) | 2.29 | %(e) | N/ | A | ||||
Net investment income including fee waivers/reimbursements(d) | 4.54 | %(e) | N/ | A | ||||
| RATIOS TO AVERAGE NET ASSETS (excluding interest expense and dividend expense on securities sold short) | ||||||||
Operating expenses excluding fee waivers/reimbursements(d) | 5.98 | %(e) | 15.08 | %(e) | ||||
Operating expenses including fee waivers/reimbursements(d) | 1.75 | %(e) | 1.75 | %(e) | ||||
Net investment income/(loss) including fee waivers/reimbursements(d) | 4.00 | %(e) | (0.22 | )%(e) | ||||
| PORTFOLIO TURNOVER RATE | 132 | %(f) | 270 | %(f) | ||||
See Notes to Financial Statements.
| 52 | www.crystalstrategyfunds.com |
| Crystal Strategy Absolute Return Plus Fund – Class R | Financial Highlights |
For a share outstanding throughout the periods presented.
| (a) | Commenced operations on December 31, 2013. |
| (b) | Per share amounts are based upon average shares outstanding. |
| (c) | Total return is for the period indicated and has not been annualized. The total return would have been lower had certain expenses not been waived / reimbursed during the period. The return shown does not reflect the deduction of taxes that a shareholder would pay on Fund distributions or the redemption of Fund shares. |
| (d) | The ratios exclude the impact of expenses of the underlying funds in which the Fund invests as represented in the Portfolio of Investments. |
| (e) | Annualized. |
| (f) | Portfolio turnover rate for periods less than one full year have not been annualized. |
See Notes to Financial Statements.
| Semi-Annual Report | March 31, 2015 | 53 |
| Crystal Strategy Family of Funds | Notes to Financial Statements |
| March 31, 2015 (Unaudited) |
1. ORGANIZATION
ALPS Series Trust (the “Trust”), a Delaware statutory trust, is an open-end management investment company registered under the Investment Company Act of 1940, as amended (the “1940 Act”). As of March 31, 2015, the Trust had nine registered funds. This semi-annual report describes the Crystal Strategy Absolute Income Fund, the Crystal Strategy Absolute Return Fund and the Crystal Strategy Absolute Return Plus Fund (prior to November 21, 2014 known as the Crystal Strategy Leveraged Alternative Fund) (individually a “Fund” and collectively, the “Funds”). The Crystal Strategy Absolute Income Fund seeks to provide current income and downside protection to conventional equity markets, with absolute (positive) returns over full market cycles as a secondary objective. The Crystal Strategy Absolute Return Fund seeks to provide absolute (positive) returns over full market cycles. The Crystal Strategy Absolute Return Plus Fund seeks to provide long-term absolute (positive) returns with reduced correlation to conventional equity markets as a secondary objective. The Funds currently offer Class A shares, Class I shares and Class R shares. All classes of shares have identical rights to earnings, assets and voting privileges, except for class specific expenses and exclusive rights to vote on matters affecting only individual classes. The Trust has an unlimited number of shares with no par value per share. The Board of Trustees (the “Board”) may establish additional funds and classes of shares at any time in the future without shareholder approval.
2. SIGNIFICANT ACCOUNTING POLICIES
The accompanying financial statements were prepared in accordance with accounting principles generally accepted in the United States of America for investment companies (“U.S. GAAP”). Each Fund is considered an investment company for financial reporting purposes. The preparation of financial statements in conformity with U.S. GAAP requires management to make certain estimates and assumptions that affect the reported amounts of assets and liabilities and disclosures of contingent assets and liabilities at the date of the financial statements and the reported amounts of revenue and expenses during the period. Actual results could differ from those estimates. The following is a summary of significant accounting policies consistently followed by the Funds in preparation of their financial statements.
Investment Valuation: The Funds generally value their securities based on market prices determined at the close of regular trading on the New York Stock Exchange (“NYSE”), normally 4:00 p.m. Eastern Time, on each day the NYSE is open for trading.
For equity securities and mutual funds that are traded on an exchange, the market price is usually the closing sale or official closing price on that exchange. In the case of equity securities not traded on an exchange, or if such closing prices are not otherwise available, the securities are valued at the mean of the most recent bid and ask prices on such day.
Redeemable securities issued by open-end registered investment companies are valued at the investment company’s applicable net asset value, with the exception of exchange-traded open-end investment companies, which are priced as equity securities.
The market price for debt obligations is generally the price supplied by an independent third-party pricing service approved by the Board, which may use a matrix, formula or other objective method that takes into consideration quotations from dealers, market transactions in comparable
| 54 | www.crystalstrategyfunds.com |
| Crystal Strategy Family of Funds | Notes to Financial Statements |
| March 31, 2015 (Unaudited) |
investments, market indices and yield curves. If vendors are unable to supply a price, or if the price supplied is deemed to be unreliable, the market price may be determined using quotations received from one or more broker dealers that make a market in the security. Investments in non-exchange traded funds are fair valued at their respective net asset values.
When such prices or quotations are not available, or when the fair value committee appointed by the Board believes that they are unreliable, securities may be priced using fair value procedures approved by the Board.
Fair Value Measurements: The Funds disclose the classification of their fair value measurements following a three-tier hierarchy based on the inputs used to measure fair value. Inputs refer broadly to the assumptions that market participants would use in pricing the asset or liability, including assumptions about risk. Inputs may be observable or unobservable. Observable inputs reflect the assumptions market participants would use in pricing the asset or liability that are developed based on market data obtained from sources independent of the reporting entity. Unobservable inputs reflect the reporting entity’s own assumptions about the assumptions market participants would use in pricing the asset or liability that are developed based on the best information available.
Various inputs are used in determining the value of the Funds’ investments as of the end of the reporting period. When inputs used fall into different levels of the fair value hierarchy, the level in the hierarchy within which the fair value measurement falls is determined based on the lowest level input that is significant to the fair value measurement in its entirety. The designated input levels are not necessarily an indication of the risk or liquidity associated with these investments. These inputs are categorized in the following hierarchy under applicable financial accounting standards:
| Level 1 – | Unadjusted quoted prices in active markets for identical investments, unrestricted assets or liabilities that the Funds have the ability to access at the measurement date; |
| Level 2 – | Quoted prices which are not active, quoted prices for similar assets or liabilities in active markets or inputs other than quoted prices that are observable (either directly or indirectly) for substantially the full term of the asset or liability; and |
| Level 3 – | Significant unobservable prices or inputs (including the Funds’ own assumptions in determining the fair value of investments) where there is little or no market activity for the asset or liability at the measurement date. |
| Semi-Annual Report | March 31, 2015 | 55 |
| Crystal Strategy Family of Funds | Notes to Financial Statements |
| March 31, 2015 (Unaudited) |
The following is a summary of the inputs used to value the Funds’ investments as of March 31, 2015:
Crystal Strategy Absolute Income Fund
| Investments in Securities at Value | Level 1 - Unadjusted Quoted Prices | Level 2 - Other Significant Observable Inputs | Level 3 - Significant Unobservable Inputs | Total | ||||||||||||
| Closed‐End Mutual Funds | $ | 799,031 | $ | — | $ | — | $ | 799,031 | ||||||||
| Common Stocks | ||||||||||||||||
| Energy | 58,303 | — | — | 58,303 | ||||||||||||
| Financials | 1,381,225 | — | — | 1,381,225 | ||||||||||||
| Exchange‐Traded Funds | 1,595,215 | — | — | 1,595,215 | ||||||||||||
| Master Limited Partnerships | 324,779 | — | — | 324,779 | ||||||||||||
| Open‐End Mutual Funds | 1,391,374 | — | — | 1,391,374 | ||||||||||||
| Short Term Investments | 603,024 | — | — | 603,024 | ||||||||||||
| TOTAL | $ | 6,152,951 | $ | — | $ | — | $ | 6,152,951 | ||||||||
| Valuation Inputs | ||||||||||||||||
| Other Financial Instruments | Level 1 | Level 2 | Level 3 | Total | ||||||||||||
| Liabilities | ||||||||||||||||
| Securities Sold Short Exchange‐Traded Funds | $ | (938,993 | ) | $ | — | $ | — | $ | (938,993 | ) | ||||||
| TOTAL | $ | (938,993 | ) | $ | — | $ | — | $ | (938,993 | ) | ||||||
| 56 | www.crystalstrategyfunds.com |
| Crystal Strategy Family of Funds | Notes to Financial Statements |
| March 31, 2015 (Unaudited) |
Crystal Strategy Absolute Return Fund
| Investments in Securities at Value | Level 1 - Unadjusted Quoted Prices | Level 2 - Other Significant Observable Inputs | Level 3 - Significant Unobservable Inputs | Total | ||||||||||||
| Closed‐End Mutual Funds | $ | 645,118 | $ | — | $ | — | $ | 645,118 | ||||||||
| Common Stocks | ||||||||||||||||
| Communications | 130,523 | — | — | 130,523 | ||||||||||||
| Consumer Non‐cyclical | 49,287 | — | — | 49,287 | ||||||||||||
| Energy | 144,479 | — | — | 144,479 | ||||||||||||
| Financials | 688,119 | — | — | 688,119 | ||||||||||||
| Technology | 40,122 | — | — | 40,122 | ||||||||||||
| Exchange‐Traded Funds | 2,239,855 | — | — | 2,239,855 | ||||||||||||
| Master Limited Partnerships | 362,685 | — | — | 362,685 | ||||||||||||
| Open‐End Mutual Funds | 682,089 | — | — | 682,089 | ||||||||||||
| Purchased Options | 13,300 | — | — | 13,300 | ||||||||||||
| Short Term Investments | 2,185,918 | — | — | 2,185,918 | ||||||||||||
| TOTAL | $ | 7,181,495 | $ | — | $ | — | $ | 7,181,495 | ||||||||
| Valuation Inputs | ||||||||||||||||
| Other Financial Instruments | Level 1 | Level 2 | Level 3 | Total | ||||||||||||
| Liabilities | ||||||||||||||||
| Securities Sold Short Exchange‐Traded Funds | $ | (1,296,790 | ) | $ | — | $ | — | $ | (1,296,790 | ) | ||||||
| TOTAL | $ | (1,296,790 | ) | $ | — | $ | — | $ | (1,296,790 | ) | ||||||
| Semi-Annual Report | March 31, 2015 | 57 |
| Crystal Strategy Family of Funds | Notes to Financial Statements |
| March 31, 2015 (Unaudited) |
Crystal Strategy Absolute Return Plus Fund
| Investments in Securities at Value | Level 1 - Unadjusted Quoted Prices | Level 2 - Other Significant Observable Inputs | Level 3 - Significant Unobservable Inputs | Total | ||||||||||||
Closed‐End Mutual Funds | $ | 817,880 | $ | — | $ | — | $ | 817,880 | ||||||||
Common Stocks | ||||||||||||||||
| Communications | 146,325 | — | — | 146,325 | ||||||||||||
| Consumer Non‐cyclical | 76,615 | — | — | 76,615 | ||||||||||||
| Energy | 158,503 | — | — | 158,503 | ||||||||||||
| Financials | 824,821 | — | — | 824,821 | ||||||||||||
| Technology | 61,652 | — | — | 61,652 | ||||||||||||
Exchange‐Traded Funds | 2,485,106 | — | — | 2,485,106 | ||||||||||||
Master Limited Partnerships | 424,838 | — | — | 424,838 | ||||||||||||
Open‐End Mutual Funds | 828,717 | — | — | 828,717 | ||||||||||||
Purchased Options | 11,400 | — | — | 11,400 | ||||||||||||
TOTAL | $ | 5,835,857 | $ | — | $ | — | $ | 5,835,857 | ||||||||
Valuation Inputs | ||||||||||||||||
Other Financial Instruments | Level 1 | Level 2 | Level 3 | Total | ||||||||||||
Liabilities | ||||||||||||||||
Securities Sold Short | ||||||||||||||||
| Exchange‐Traded Funds | $ | (1,505,593 | ) | $ | — | $ | — | $ | (1,505,593 | ) | ||||||
TOTAL | $ | (1,505,593 | ) | $ | — | $ | — | $ | (1,505,593 | ) | ||||||
The Funds recognize transfers between levels as of the end of the period. For the period ended March 31, 2015, the Funds did not have any transfers between Level 1 and Level 2 securities. There were no Level 3 securities held during the period.
Offering Costs: The Funds incurred offering costs during the period ended March 31, 2015. These offering costs, including fees for printing initial prospectuses, legal and registration fees, were amortized over the first twelve months from the inception date of the Funds. Amounts amortized during the period ended March 31, 2015 are shown on each Fund’s Statement of Operations.
Trust Expenses: Some expenses of the Trust can be directly attributed to the Funds. Expenses which cannot be directly attributed to the Funds are apportioned among all funds in the Trust based on average net assets of each fund.
Fund Expenses: Some expenses can be directly attributed to each Fund and are apportioned among the classes based on average net assets of each class. Additionally, some expenses are attributed to the fund family and are apportioned among the Funds based on average net assets of each Fund.
Class Expenses: Expenses that are specific to a class of shares are charged directly to that share class. Fees provided under the distribution (Rule 12b-1) and/or shareholder service plans for a particular class of the Funds are charged to the operations of such class.
| 58 | www.crystalstrategyfunds.com |
| Crystal Strategy Family of Funds | Notes to Financial Statements |
| March 31, 2015 (Unaudited) |
Federal Income Taxes: The Funds comply with the requirements under Subchapter M of the Internal Revenue Code of 1986, as amended, applicable to regulated investment companies and intend to distribute substantially all net taxable income and net capital gains, if any, each year so that they will not be subject to excise tax on undistributed income and gains. The Funds are not subject to income taxes to the extent such distributions are made.
As of and during the period ended March 31, 2015, the Funds did not have a liability for any unrecognized tax benefits in the accompanying financial statements. The Funds file U.S. federal, state and local income tax returns as required. The Funds’ tax returns are subject to examination by the relevant tax authorities until expiration of the applicable statute of limitations, which is generally three years after the filing of the tax return for federal purposes and four years for most state returns. The Funds’ administrator has analyzed the Funds’ tax positions taken on federal and state income tax returns for all open tax years and has concluded that as of March 31, 2015, no provision for income tax is required in the Funds’ financial statements related to these tax positions.
Investment Transactions and Investment Income: Investment transactions are accounted for on the date the investments are purchased or sold (trade date basis). Realized gains and losses from investment transactions are reported on an identified cost basis. Interest income, which includes accretion of discounts and amortization of premiums, is accrued and recorded as earned. Dividend income is recognized on the ex-dividend date, or for certain foreign securities, as soon as information is available to the Funds. All of the realized and unrealized gains and losses and net investment income are allocated daily to each class in proportion to its average daily net assets.
Foreign Securities: The Funds may directly purchase securities of foreign issuers. Investing in securities of foreign issuers involves special risks not typically associated with investing in securities of U.S. issuers. The risks include possible reevaluation of currencies, the inability to repatriate foreign currency, less complete financial information about companies and possible future adverse political and economic developments. Moreover, securities of many foreign issuers and their markets may be less liquid and their prices more volatile than those of securities of comparable U.S. issuers.
Foreign Currency Translation: The books and records of the Funds are maintained in U.S. dollars. Investment valuations and other assets and liabilities initially expressed in foreign currencies are converted each business day into U.S. dollars based upon current exchange rates. The portion of realized and unrealized gains or losses on investments due to fluctuations in foreign currency exchange rates is not separately disclosed and is included in realized and unrealized gains or losses on investments, when applicable.
Foreign Exchange Transactions: The Funds may enter into foreign currency spot contracts to facilitate transactions in foreign securities or to convert foreign currency receipts into U.S. dollars. A foreign currency spot contract is an agreement between two parties to buy and sell currencies at the current market rate, for settlement generally within two business days. The U.S. dollar value of the contracts is determined using current currency exchange rates supplied by a pricing service. The contract is marked-to-market daily for settlements beyond one day and any change in market value is recorded as an unrealized gain or loss. When the contract is closed, the Fund records a realized gain or loss equal to the difference between the value on the open and close date. Losses
| Semi-Annual Report | March 31, 2015 | 59 |
| Crystal Strategy Family of Funds | Notes to Financial Statements |
| March 31, 2015 (Unaudited) |
may arise from changes in the value of the foreign currency, or if the counterparties do not perform under the contract’s terms. The maximum potential loss from such contracts is the aggregate face value in U.S. dollars at the time the contract was opened.
Distributions to Shareholders: The Crystal Strategy Absolute Income Fund pays dividends on a quarterly basis, and the Crystal Strategy Absolute Return Fund and the Crystal Strategy Absolute Return Plus Fund pay dividends on an annual basis. All Funds distribute capital gains, if any, on an annual basis. Income dividend distributions are derived from interest and other income a Fund receives from its investments and include distributions of short-term capital gains. Capital gain distributions are derived from gains realized when the Fund sells a security it has owned for more than one year. The Funds may make additional distributions and dividends at other times if its portfolio manager or managers believe doing so may be necessary for the Funds to avoid or reduce taxes. Net investment income/(loss) and net realized gain/(loss) may differ for financial statement and tax purposes.
Short Sales: The Funds may sell securities short. To do this, Brinker Capital, Inc. (the “Adviser”), the Funds’ investment adviser, will borrow and then sell (take short positions in) equity securities of U.S. companies that the Adviser believes are likely to underperform the long positions over time. To complete such a transaction, the Funds must borrow the security to deliver to the buyer. The Funds then are obligated to replace the security borrowed by purchasing it in the open market at some later date. The Funds bear the risk of a loss if the market price of the security increases between the date of the short sale and the date on which the Funds replace the borrowed security. The Funds will realize a gain if the security declines in value between those dates. There can be no assurance that securities necessary to cover a short position will be available for purchase. To mitigate leverage risk, the Funds will segregate liquid assets (which may include its long positions), marked-to-market daily. The Funds maintain collateral consisting of cash, U.S. Government securities or other liquid assets in an amount at least equal to the market value of their respective short positions. The Funds are liable for any dividends or interest payable on securities while those securities are in a short position. The Funds typically intend to hold securities sold short for the short term, therefore, they are excluded from the purchase and sales of investments in Note 5 and the Fund’s Portfolio Turnover Calculation in the Financial Highlights. As of March 31, 2015, the Crystal Strategy Absolute Income Fund, the Crystal Strategy Absolute Return Fund and the Crystal Strategy Absolute Return Plus Fund held securities sold short with a fair value of $938,993, $1,296,790 and $1,505,593, respectively.
3. DERIVATIVE INSTRUMENTS
The Funds’ investment objectives permit the Funds to enter into various types of derivatives contracts, including, but not limited to, futures contracts, forward foreign currency contracts, currency swaps and purchased and written options. In doing so, the Funds may employ strategies in differing combinations to permit them to increase, decrease, or change the level or types of exposure to market factors. Central to those strategies are features inherent in derivatives that make them more attractive for this purpose than equity or debt securities; they require little or no initial cash investment, they can focus exposure on only certain selected risk factors, and they may not require the ultimate receipt or delivery of the underlying security (or securities) to the contract. This may allow the Funds to pursue their objectives more quickly and efficiently than if they were to make direct purchases or sales of securities capable of affecting a similar response to market factors.
| 60 | www.crystalstrategyfunds.com |
| Crystal Strategy Family of Funds | Notes to Financial Statements |
| March 31, 2015 (Unaudited) |
Risk of Investing in Derivatives: The Funds’ use of derivatives can result in losses due to unanticipated changes in the market risk factors and the overall market. In instances where the Funds are using derivatives to decrease, or hedge, exposures to market risk factors for securities held by the Funds, there are also risks that those derivatives may not perform as expected resulting in losses for the combined or hedged positions.
Derivatives may have little or no initial cash investment relative to their market value exposure and therefore can produce significant gains or losses in excess of their cost. This use of embedded leverage allows the Funds to increase their market value exposure relative to their net assets and can substantially increase the volatility of the Funds’ performance.
Additional associated risks from investing in derivatives also exist and potentially could have significant effects on the valuation of the derivative and the Funds. Typically, the associated risks are not the risks that the Funds are attempting to increase or decrease exposure to, per their investment objectives, but are the additional risks from investing in derivatives.
Examples of these associated risks are liquidity risk, which is the risk that the Funds will not be able to sell or close out the derivative in a timely manner, and counterparty credit risk, which is the risk that the counterparty will not fulfill its obligation to the Funds. In addition, use of derivatives may increase or decrease exposure to the following risk factors:
Equity Risk: Equity risk relates to the change in value of equity securities as they relate to increases or decreases in the general market. Associated risks can be different for each type of derivative.
Commodity Risk: Exposure to the commodities markets may subject the Funds to greater volatility than investments in traditional securities. Prices of various commodities may also be affected by factors, such as drought, floods, weather, livestock disease, embargoes, tariffs and other regulatory developments, which are unpredictable. The prices of commodities can also fluctuate widely due to supply and demand disruptions in major producing or consuming regions.
Foreign Currency Risk: Currency trading involves significant risks, including market risk, interest rate risk, country risk, counterparty credit risk and short sale risk. Market risk results from the price movement of foreign currency values in response to shifting market supply and demand.
Interest Rate Risk: Interest rate risk is the risk that fixed income securities will decline in value because of changes in interest rates. As nominal interest rates rise, the value of fixed income securities held by the Funds are likely to decrease. Securities with longer durations tend to be more sensitive to changes in interest rates, and are usually more volatile than equity securities.
Option Contracts: Each Fund may enter into options transactions for hedging purposes and for non-hedging purposes such as seeking to enhance return. Each Fund may write covered put and call options on any stocks or stock indices, currencies traded on domestic and foreign securities exchanges, or futures contracts on stock indices, interest rates and currencies traded on domestic
| Semi-Annual Report | March 31, 2015 | 61 |
| Crystal Strategy Family of Funds | Notes to Financial Statements |
| March 31, 2015 (Unaudited) |
and, to the extent permitted by the CFTC, foreign exchanges. A call option on an asset written by a Fund obligates the Fund to sell the specified asset to the holder (purchaser) at a stated price (the exercise price) if the option is exercised before a specified date (the expiration date). A put option on an asset written by a Fund obligates the Fund to buy the specified asset from the purchaser at the exercise price if the option is exercised before the expiration date. Premiums received when writing options are recorded as liabilities and are subsequently adjusted to the current value of the options written. Premiums received from writing options that expire are treated as realized gains. Premiums received from writing options, which are either exercised or closed, are offset against the proceeds received or amount paid on the transaction to determine realized gains or losses which are recorded on the Statement of Operations.
The Crystal Strategy Absolute Income Fund had the following transactions in written covered call/put options during the six months ended March 31, 2015:
| Contracts | Premiums | |||||||
| Balance as of October 1, 2014 | $ | — | $ | — | ||||
| Options Written | 750 | 9,946 | ||||||
| Options Expired | — | — | ||||||
| Options Closed | (750 | ) | (9,946 | ) | ||||
| Options Exercised | — | — | ||||||
| Balance as of March 31, 2015 | $ | — | $ | — | ||||
The Crystal Strategy Absolute Return Fund had the following transactions in written covered call/put options during the six months ended March 31, 2015:
| Contracts | Premiums | |||||||
| Balance as of October 1, 2014 | $ | — | $ | — | ||||
| Options Written | 1,510 | 19,940 | ||||||
| Options Expired | (10 | ) | (34 | ) | ||||
| Options Closed | (1,500 | ) | (19,906 | ) | ||||
| Options Exercised | — | — | ||||||
| Balance as of March 31, 2015 | $ | — | $ | — | ||||
The Crystal Strategy Absolute Return Plus Fund had the following transactions in written covered call/put options during the six months ended March 31, 2015:
| Contracts | Premiums | |||||||
| Balance as of October 1, 2014 | $ | — | $ | — | ||||
| Options Written | 1,452 | 19,309 | ||||||
| Options Expired | (2 | ) | (67 | ) | ||||
| Options Closed | (1,450 | ) | (19,242 | ) | ||||
| Options Exercised | — | — | ||||||
| Balance as of March 31, 2015 | $ | — | $ | — | ||||
| 62 | www.crystalstrategyfunds.com |
| Crystal Strategy Family of Funds | Notes to Financial Statements |
| March 31, 2015 (Unaudited) |
Derivative Instruments: The following tables disclose the amounts related to each Fund’s use of derivative instruments.
The effect of derivative instruments on the Statement of Assets and Liabilities as of March 31, 2015:
| Risk Exposure | Statement of Assets and Liabilities Location | Asset Derivatives Fair Value | Liability Derivatives Fair Value | |||||||
| Crystal Strategy Absolute Return Fund | ||||||||||
| Equity Contracts (Purchased options contracts) | Investments at value | $ | 13,300 | $ | — | |||||
| TOTAL | $ | 13,300 | $ | — | ||||||
| Crystal Strategy Absolute Return Plus Fund | ||||||||||
| Equity Contracts (Purchased options contracts) | Investments at value | $ | 11,400 | $ | — | |||||
| TOTAL | $ | 11,400 | $ | — | ||||||
| Semi-Annual Report | March 31, 2015 | 63 |
| Crystal Strategy Family of Funds | Notes to Financial Statements |
March 31, 2015 (Unaudited)
The effect of derivative instruments on the Statement of Operations for the period ended March 31, 2015:
| Risk Exposure | Statement of Operations Location | Realized Gain/(Loss) | Change in Unrealized | |||||||
| Crystal Strategy Absolute Income Fund | ||||||||||
| Equity Contracts (Written option contracts) | Net realized gain/(loss) on investments/Change in unrealized appreciation on investments | $ | (2,152 | ) | $ | — | ||||
| TOTAL | $ | (2,152 | ) | $ | — | |||||
| Crystal Strategy Absolute Return Fund | ||||||||||
| Equity Contracts (Purchased option contracts) | Net realized gain/(loss) on investments/Change in unrealized appreciation on investments | $ | — | $ | 2,113 | |||||
| Equity Contracts (Written option contracts) | Net realized gain/(loss) on investments/Change in unrealized appreciation on investments | $ | (1,915 | ) | $ | — | ||||
| TOTAL | $ | (1,915 | ) | $ | 2,113 | |||||
| Crystal Strategy Absolute Return Plus Fund | ||||||||||
| Equity Contracts (Purchased option contracts) | Net realized gain/(loss) on investments/Change in unrealized appreciation on investments | $ | — | $ | 1,811 | |||||
| Equity Contracts (Written option contracts) | Net realized gain/(loss) on investments/Change in unrealized appreciation on investments | $ | (1,817 | ) | $ | — | ||||
| TOTAL | $ | (1,817 | ) | $ | 1,811 | |||||
| 64 | www.crystalstrategyfunds.com |
| Crystal Strategy Family of Funds | Notes to Financial Statements |
March 31, 2015 (Unaudited)
| 4. | TAX BASIS INFORMATION |
Tax Basis of Distributions to Shareholders: The character of distributions made during the period from net investment income or net realized gains may differ from its ultimate characterization for federal income tax purposes. Also, due to the timing of dividend distributions, the fiscal year in which amounts are distributed may differ from the fiscal year in which the income or realized gain were recorded by the Funds. The amounts and characteristics of tax basis distributions and composition of distributable earnings/(accumulated losses) are finalized at fiscal year-end. Accordingly, tax basis balances have not been determined as of the date of the semi-annual.
The tax character of distributions paid by the Funds for the fiscal period ended September 30, 2014 were as follows:
| Crystal Strategy Absolute | ||||
| Income Fund | ||||
| Distributions Paid From: | 2014 | |||
| Ordinary Income | $ | 28,341 | ||
Unrealized Appreciation and Depreciation on Investments: As of March 31, 2015, the aggregate cost of investments, gross unrealized appreciation/(depreciation) and net unrealized appreciation/(depreciation) for Federal tax purposes were as follows:
| Crystal | ||||||||||||
| Crystal | Crystal | Strategy | ||||||||||
| Strategy | Strategy | Absolute | ||||||||||
Absolute Income Fund | Absolute Return Fund | Return Plus Fund | ||||||||||
| Gross unrealized appreciation (excess of value over tax cost) | $ | 150,326 | $ | 139,930 | $ | 183,873 | ||||||
| Gross unrealized depreciation (excess of tax cost over value) | (76,378 | ) | (111,771 | ) | (171,363 | ) | ||||||
| Net unrealized appreciation | $ | 73,948 | $ | 28,159 | $ | 12,510 | ||||||
| Cost of investments for income tax purposes | $ | 6,079,003 | $ | 7,153,336 | $ | 5,823,347 | ||||||
| 5. | SECURITIES TRANSACTIONS |
Purchases and sales of securities, excluding securities sold short intended to be held for less than one year and short-term securities, during the period ended March 31, 2015 were as follows:
Purchases of Securities | Proceeds from Sales of Securities | |||||||
| Crystal Strategy Absolute Income Fund | $ | 4,790,772 | $ | 3,352,204 | ||||
| Crystal Strategy Absolute Return Fund | 6,873,842 | 6,020,120 | ||||||
| Crystal Strategy Absolute Return Plus Fund | 8,364,280 | 7,246,543 | ||||||
| Semi-Annual Report | March 31, 2015 | 65 |
| Crystal Strategy Family of Funds | Notes to Financial Statements |
March 31, 2015 (Unaudited)
| 6. | BENEFICIAL SHARE TRANSACTIONS |
The capitalization of the Trust consists of an unlimited number of shares of beneficial interest with no par value per share. Holders of the shares of the Funds have one vote for each share held and a proportionate fraction of a vote for each fractional share. All shares issued and outstanding are fully paid and are non-assessable, transferable and redeemable at the option of the shareholder. Shares have no pre-emptive rights.
Shares redeemed within 60 days of purchase may incur a 1.50% short-term redemption fee deducted from the redemption amount. For the period ended March 31, 2015, the redemption fees charged by the Funds are presented in the Statements of Changes in Net Assets.
Transactions in common shares were as follows:
| For the Period Ended March 31, 2015 | For the Period Ended September 30, 2014(a) | |||||||
| Crystal Strategy Absolute Income Fund: | ||||||||
| Class A | ||||||||
| Shares sold | 29,090 | 111,098 | ||||||
| Shares issued in reinvestment of distributions to shareholders | 426 | 349 | ||||||
| Shares redeemed | (55,055 | ) | (30 | ) | ||||
| Net increase/(decrease) from share transactions | (25,539 | ) | 111,417 | |||||
| Class I | ||||||||
| Shares sold | 262,321 | 335,697 | ||||||
| Shares issued in reinvestment of distributions to shareholders | 4,734 | 2,348 | ||||||
| Shares redeemed | (92,002 | ) | (2,949 | ) | ||||
| Net increase from share transactions | 175,053 | 335,096 | ||||||
| Class R | ||||||||
| Shares sold | 625 | 520 | ||||||
| Shares issued in reinvestment of distributions to shareholders | 5 | 7 | ||||||
| Shares redeemed | — | (20 | ) | |||||
| Net increase from share transactions | 630 | 507 | ||||||
| 66 | www.crystalstrategyfunds.com |
| Crystal Strategy Family of Funds | Notes to Financial Statements |
March 31, 2015 (Unaudited)
Transactions in common shares were as follows:
For the Period Ended March 31, 2015 | For the Period Ended September 30, 2014(a) | |||||||
| Crystal Strategy Absolute Return Fund: | ||||||||
| Class A | ||||||||
| Shares sold | 134,648 | 210,152 | ||||||
| Shares issued in reinvestment of distributions to shareholders | 1,301 | — | ||||||
| Shares redeemed | (146,729 | ) | (3,564 | ) | ||||
| Net increase/(decrease) from share transactions | (10,780 | ) | 206,588 | |||||
| Class I | ||||||||
| Shares sold | 331,980 | 325,351 | ||||||
| Shares issued in reinvestment of distributions to shareholders | 3,687 | — | ||||||
| Shares redeemed | (83,533 | ) | (20,688 | ) | ||||
| Net increase from share transactions | 252,134 | 304,663 | ||||||
| Class R | ||||||||
| Shares sold | 24,323 | 520 | ||||||
| Shares issued in reinvestment of distributions to shareholders | 209 | — | ||||||
| Shares redeemed | — | (20 | ) | |||||
| Net increase from share transactions | 24,532 | 500 | ||||||
| Semi-Annual Report | March 31, 2015 | 67 |
| Crystal Strategy Family of Funds | Notes to Financial Statements |
March 31, 2015 (Unaudited)
Transactions in common shares were as follows:
| For the Period Ended March 31, 2015 | For the Period Ended September 30, 2014(a) | |||||||
| Crystal Strategy Absolute Return Plus Fund: | ||||||||
| Class A | ||||||||
| Shares sold | — | 27,738 | ||||||
| Shares issued in reinvestment of distributions to shareholders | 424 | — | ||||||
| Shares redeemed | (13,904 | ) | (24 | ) | ||||
| Net increase/(decrease) from share transactions | (13,480 | ) | 27,714 | |||||
| Class I | ||||||||
| Shares sold | 59,358 | 517,564 | ||||||
| Shares issued in reinvestment of distributions to shareholders | 5,994 | — | ||||||
| Shares redeemed | (58,658 | ) | (8,597 | ) | ||||
| Net increase from share transactions | 6,694 | 508,967 | ||||||
| Class R | ||||||||
| Shares sold | — | 520 | ||||||
| Shares issued in reinvestment of distributions to shareholders | 7 | — | ||||||
| Shares redeemed | — | (20 | ) | |||||
| Net increase from share transactions | 7 | 500 | ||||||
(a) Commenced operations on December 31, 2013.
Control is defined by the 1940 Act as the beneficial ownership, either directly or through one or more controlled companies, of more than 25% of the voting securities of a company. Approximately 79%, 47% and 79% of the shares outstanding of the Crystal Strategy Absolute Income Fund, the Crystal Strategy Absolute Return Fund and the Crystal Strategy Absolute Return Plus Fund, respectively, are held within one omnibus account. Investment activities of these shareholders could have a material impact on the Funds.
| 7. | MANAGEMENT AND RELATED PARTY TRANSACTIONS |
Investment Advisory: Brinker Capital, Inc. (“Brinker Capital” or the “Adviser”), subject to the authority of the Board, is responsible for the overall management and administration of the Funds’ business affairs. The Adviser manages the investments of the Funds in accordance with the Funds’ investment objectives, policies and limitations and investment guidelines established jointly by the Adviser and the Board.
Pursuant to the Investment Advisory Agreement (the “Advisory Agreement”) with the Adviser, the Funds pay the Adviser an annual management fee of 0.80%, 0.85% and 0.95% based on the average daily net assets of the Crystal Strategy Absolute Income Fund, the Crystal Strategy Absolute Return Fund and the Crystal Strategy Absolute Return Plus Fund, respectively. The management fees are paid
| 68 | www.crystalstrategyfunds.com |
| Crystal Strategy Family of Funds | Notes to Financial Statements |
March 31, 2015 (Unaudited)
on a monthly basis. The initial term of the Advisory Agreement is two years. The Board may extend the Advisory Agreement for additional one-year terms. The Board, shareholders of the Funds or the Adviser may terminate the Advisory Agreement upon 60 days’ notice.
Pursuant to a fee waiver letter agreement (the “Fee Waiver Agreement”), the Adviser has contractually agreed to limit the amount of each Fund’s Total Annual Fund Operating Expenses, exclusive of Distribution and Service (12b-1) fees, Acquired Fund Fees and Expenses, brokerage expenses, interest expenses, taxes and extraordinary expenses, to 1.10%, 1.15% and 1.25% of the average daily net assets of the Crystal Strategy Absolute Income Fund, the Crystal Strategy Absolute Return Fund and the Crystal Strategy Absolute Return Plus Fund, respectively. The Fee Waiver Agreement is in effect through January 31, 2016. The Adviser will be permitted to recover, on a class-by-class basis, expenses it has borne through the Fee Waiver Agreement to the extent that a Fund��s expenses in later periods fall below the annual rates set forth in the Fee Waiver Agreement. The Funds will not be obligated to pay any such deferred fees and expenses more than three years after the end of the fiscal year in which the fees and expenses were deferred. The Adviser may not discontinue the Fee Waiver Agreement without the approval by the Trust’s Board.
For the six-month period ended March 31, 2015, the fee waivers and/or reimbursements were as follows:
| Fees Waived/Reimbursed | ||||
| by Adviser | ||||
| Crystal Strategy Absolute Income Fund | ||||
| Class A | $ | (17,445 | ) | |
| Class I | (92,096 | ) | ||
| Class R | (130 | ) | ||
| TOTAL | $ | (109,671 | ) | |
| Crystal Strategy Absolute Return Fund | ||||
| Class A | $ | (41,265 | ) | |
| Class I | (78,563 | ) | ||
| Class R | (3,096 | ) | ||
| TOTAL | $ | (122,924 | ) | |
| Crystal Strategy Absolute Return Plus Fund | ||||
| Class A | $ | (5,475 | ) | |
| Class I | (104,059 | ) | ||
| Class R | (99 | ) | ||
| TOTAL | $ | (109,633 | ) | |
| Semi-Annual Report | March 31, 2015 | 69 |
| Crystal Strategy Family of Funds | Notes to Financial Statements |
March 31, 2015 (Unaudited)
As of March 31, 2015, the balances of recoupable expenses were as follows:
| Crystal Strategy Absolute Income Fund | Expires 2017 | Expires 2018 | ||||||
| Class A | $ | (20,113 | ) | $ | (17,445 | ) | ||
| Class I | (122,906 | ) | (92,096 | ) | ||||
| Class R | (1,804 | ) | (130 | ) | ||||
| Crystal Strategy Absolute Return Fund | Expires 2017 | Expires 2018 | ||||||
| Class A | $ | (58,887 | ) | $ | (41,265 | ) | ||
| Class I | (116,207 | ) | (78,563 | ) | ||||
| Class R | (822 | ) | (3,096 | ) | ||||
| Crystal Strategy Absolute Return Plus Fund | Expires 2017 | Expires 2018 | ||||||
| Class A | $ | (6,120 | ) | $ | (5,475 | ) | ||
| Class I | (236,372 | ) | (104,059 | ) | ||||
| Class R | (479 | ) | (99 | ) | ||||
Administrator: ALPS Fund Services, Inc. (“ALPS”) serves as administrator to the Funds. The Funds have agreed to pay expenses incurred in connection with their administrative activities. Pursuant to the Administration, Bookkeeping and Pricing Services Agreement with the Trust, ALPS will provide operational services to the Funds including, but not limited to, fund accounting and fund administration and generally assist in the Funds’ operations. The administration fees for the Fund Family are accrued on a daily basis and paid on a monthly basis following the end of the month. The officers of the Trust are employees of ALPS. Administration fees paid by the Fund for the six months ended March 31, 2015 are disclosed in the Statement of Operations.
ALPS is reimbursed by the Funds for certain out-of-pocket expenses.
Transfer Agent: ALPS serves as transfer agent for the Funds under a Transfer Agency and Services Agreement with the Trust. Under this agreement, ALPS is paid an annual fee for services performed on behalf of the funds plus fees for open accounts and is reimbursed for certain out-of-pocket expenses.
Compliance Services: ALPS provides services as the Funds’ Chief Compliance Officer to monitor and test the policies and procedures of the Funds in conjunction with the requirements under Rule 38a-1 of the 1940 Act pursuant to a Chief Compliance Officer Services Agreement with the Trust. Under this agreement, ALPS is paid an annual fee for services performed on behalf of the Funds and is reimbursed for certain out-of-pockets expenses.
| 70 | www.crystalstrategyfunds.com |
| Crystal Strategy Family of Funds | Notes to Financial Statements |
March 31, 2015 (Unaudited)
Distributor: ALPS Distributors, Inc. (the “Distributor”) (an affiliate of ALPS) acts as the principal underwriter of the Funds’ shares pursuant to a Distribution Agreement with the Trust. Shares of the Funds are offered on a continuous basis through the Distributor, as agent of the Funds. The Distributor is not obligated to sell any particular amount of shares and is not entitled to any compensation for its services as the Funds’ principal underwriter pursuant to the Distribution Agreement.
Each Fund has adopted a Distribution and Services Plan (the “Plans”) pursuant to Rule 12b-1 of the 1940 Act for its Class A shares and Class R shares. The Plans allow the Funds to use Class A and Class R assets to pay fees in connection with the distribution and marketing of Class A shares and Class R shares and/or the provision of shareholder services to Class A and Class R shareholders. The Plans permit payment for services in connection with the administration of plans or programs that use Class A and Class R shares of the Funds, if any, as their funding medium and for related expenses. The Plans permit the Funds to make total payments at an annual rate of up to 0.25% of the Funds’ average daily net assets attributable to its Class A shares and 0.50% of the Funds’ average daily net assets attributable to its Class R shares. Because these fees are paid out of a Funds’ Class A and Class R assets, if any, on an ongoing basis, over time they will increase the cost of an investment in Class A and Class R shares, if any, and Plan fees may cost an investor more than other types of sales charges. Plan fees are shown as distribution and service fees on the Statement of Operations.
| 8. | TRUSTEES |
As of March 31, 2015, there were four Trustees, three of whom are not “interested persons” (as defined in the 1940 Act) of the Trust (the “Independent Trustees”). The Independent Trustees receive a quarterly retainer of $4,000, plus $2,000 for each regular Board or Committee meeting attended, $2,000 for each special telephonic Board or Commission meeting attended and $2,000 for each special in-person Board meeting attended. The Independent Trustees are also reimbursed for all reasonable out-of-pocket expenses relating to attendance at meetings and for meeting-related expenses. Officers of the Trust and Trustees who are interested persons of the Trust receive no salary or fees from the Trust.
| 9. | INDEMNIFICATIONS |
Under the Trust’s organizational documents, its officers and Trustees are indemnified against certain liabilities arising out of the performance of their duties to the Trust. Additionally, in the normal course of business, the Trust enters into contracts with service providers that may contain general indemnification clauses which may permit indemnification to the extent permissible under applicable law. The Trust’s maximum exposure under these arrangements is unknown, as this would involve future claims that may be made against the Trust that have not yet occurred.
| Semi-Annual Report | March 31, 2015 | 71 |
| Crystal Strategy Family of Funds | Additional Information |
March 31, 2015 (Unaudited)
| 1. | PROXY VOTING POLICIES AND VOTING RECORD |
A description of the policies and procedures that the Funds use to determine how to vote proxies relating to portfolio securities is available without charge, upon request, (i) by calling the Funds (toll-free) at 1-855-572-1722 or (ii) on the website of the Securities and Exchange Commission (the “SEC”) at http://www.sec.gov.
Information regarding how the Funds voted proxies relating to portfolio securities during the most recent 12-month period ended June 30 is available (i) without charge, upon request, by calling the Funds (toll-free) at 1-855-572-1722 or (ii) on the SEC’s website at http://www.sec.gov.
| 2. | PORTFOLIO HOLDINGS |
The Funds file their complete schedule of portfolio holdings with the SEC for the first and third quarters of each fiscal year on Form N-Q. The Funds’ Forms N-Q are available on the SEC website at http://www.sec.gov. The Funds’ Forms N-Q may be reviewed and copied at the SEC’s Public Reference Room in Washington, D.C., and information on the operation of the Public Reference Room may be obtained by calling 1-800-SEC-0330.
| 72 | www.crystalstrategyfunds.com |

| TABLE OF CONTENTS | |
| Shareholder Letter | 1 |
| Portfolio Update | 2 |
| Disclosure of Fund Expenses | 4 |
| Portfolio of Investments | 5 |
| Statement of Assets and Liabilities | 7 |
| Statement of Operations | 8 |
| Statements of Changes in Net Assets | 9 |
| Financial Highlights | 10 |
| Notes to Financial Statements | 11 |
| Additional Information | 15 |
| Cupps All Cap Growth Fund | Shareholder Letter |
| March 31, 2015 (Unaudited) |
Investment Environment
Economic data points continue to produce plentiful evidence of both strength and weakness in the economy. The February jobs report was the highlight on the side of strength, with many more jobs created than consensus expectations and job gains in almost every sector of the economy. The report also featured rising hourly earnings and the unemployment rate falling to 5.5%.1 On the negative side, durable goods, retail sales and housing starts all posted negative growth.
The mixed economic data points fueled the noisy and probably overly detailed debate about which month the Fed will raise rates. Such a discussion risks underemphasizing the more powerful condition, which is that the economy is reasonably strong and rates are in the process of normalizing higher. In addition to the long string of upward tilting economic statistics, the U.S. dollar appreciation over the last few quarters has also affirmed the economic strength and highlighted that the U.S. economy has more positive underpinnings than any other global region.
For equity investors, the muddling, moderate economic growth backdrop has been, and will likely continue to be, a very positive backdrop for corporations to drive their earnings higher. While there is a possibility that the official earnings tally for the first quarter will show negative growth, such a result would be almost purely a function of lower earnings in the energy sector due to lower oil prices and not reflective of earnings across the broader economy.
Performance
The six month period ended March 31, 2015 was a good one for growth stocks with the benchmark Russell 3000® Growth Index advancing 9.43% and the Cupps All Cap Growth fund up 7.43%. Specific thematic allocations included wireless communication semiconductors, cyber security and data analytics software and companies related to “next generation” autos. In addition to those secular growth areas, our team made a concerted effort to increase exposure to consumer services late last year as unemployment, interest rates and oil prices all moved in consumer-friendly directions. Our selections in electronic technology and health technology were the major contributors over this period. Our largest detractors came from non-energy minerals, consumer non-durables, utilities, and industrial services.
Outlook
We believe the environment for 2015 is shaping up well for the strategy as a function of moderate economic growth, increasing consumer and corporate confidence and many examples of innovative companies disrupting mature industries to become rapidly growing market leaders. Such disruption has occurred for years in the technology sector, but is increasingly occurring in other sectors including healthcare, media, transportation, manufacturing and retail. The broadening out of such innovation-led disruption potentially sets the stage for a very special period of growth style investing.
The Federal Reserve continues to contemplate its first rate increase, and we welcome the prospect of a more normalized interest rate environment. We believe such an environment will tend to shift investors’ focus away from yield oriented and slower growing companies and, at the margin, attract investors back toward true organic earnings growth, which is the focus of our investment process.
Finally, we highlight that two key conditions of today’s environment, the rising dollar and weak prices throughout the commodity complex, were conditions that also prevailed 20 years ago in the 1990’s. Though widely viewed as negatives for growth, the 1990’s experience was that U.S. corporate profits continued to grow and the U.S. economy was resilient and ultimately proved to be the strongest, freest, most innovative economy in the world in that period; we suspect similar dynamics will prevail in the years ahead.
1 | www.forbes.com, “Jobs Report”, 3/6/2015 |
RISKS: Investment in mutual funds involves risk, including possible loss of principal invested. You could lose money on your investment in the Fund or the Fund could underperform because of the following risks: common stocks are susceptible to general stock market fluctuations and to volatile increases and decreases in value as market confidence in and perceptions of their issues change. Individual investments of the Fund may not perform as expected and the Fund’s portfolio management practices may not achieve the desired result. Funds focusing on small/mid-cap companies generally experience greater price volatility. Because the Fund focuses on growth-style stocks, its performance may at times be better or worse than the performance of funds that focus on other types of stocks or that have a broader investment style. From time to time, the trading market for a particular security or type of security in which the Fund invests may become less liquid or even illiquid. Reduced liquidity will have an adverse impact on the Fund’s ability to sell such securities when necessary to meet the Fund’s liquidity needs or in response to a specific economic event. There is no guarantee that the objective will be met and diversification does not eliminate risk.
The Russell 3000® Index is a widely recognized, unmanaged index that measures the performance of the broad growth segment of the U.S. equity universe. It includes those Russell 3000 companies with higher price-to-book ratios and higher forecasted growth values. As of June 1, 2014, the Russell 3000® Growth Index included securities issued by companies that ranged in size between $24 million and $545 billion. One cannot invest directly in an index.
Not FDIC Insured – No Bank Guarantee – May Lose Value
The views and information discussed in this commentary are as of the date of publication, are subject to change, and may not reflect the writer’s current views. The views expressed are those of the Fund’s adviser only, and represent an assessment of market conditions at a specific point in time, are opinions only and should not be relied upon as investment advice regarding a particular investment or markets in general. Such information does not constitute a recommendation to buy or sell specific securities or investment vehicles. It should not be assumed that any investment will be profitable or will equal the performance of the fund(s) or any securities or any sectors mentioned in this letter. The subject matter contained in this letter has been derived from several sources believed to be reliable and accurate at the time of compilation. Neither the Fund nor the Adviser accepts any liability for losses either direct or consequential caused by the use of this information.
| Semi-Annual Report | March 31, 2015 | 1 |
| Cupps All Cap Growth Fund | Portfolio Update |
| March 31, 2015 (Unaudited) |
Performance(as of March 31, 2015)
| 3 Month | 6 Month | Since Inception* | |
| Cupps All Cap Growth Fund | 4.04% | 7.43% | 5.60% |
Russell 3000® Growth Index | 4.05% | 9.43% | 10.40% |
The performance data quoted above represents past performance. Past performance is not a guarantee of future results. Investment return and value of the Fund shares will fluctuate so that an investor’s shares, when sold or redeemed, may be worth more or less than their original cost. Performance may be lower or higher than performance data quoted. Fund performance current to the most recent month-end is available by calling (844) 751-5731 or by visiting www.cuppsfunds.com.
| * | Fund’s inception date is June 30, 2014. |
Returns of less than 1 year are cumulative.
Indices are not actively managed and do not reflect deduction for fees, expenses or taxes. An investor cannot invest directly in an index.
The returns shown above do not reflect the deduction of taxes a shareholder would pay on Fund distributions or redemption of Fund shares.
The total annual operating expenses and total annual operating expenses after fee waivers and/or reimbursement you may pay as an investor in the Fund (as reported in the January 28, 2015 Prospectus) are 3.29% and 1.05%, respectively.
The Fund is new and has a limited operating history.
Performance of $10,000 Initial Investment (as of March 31, 2015)

The graph shown above represents historical performance of a hypothetical investment of $10,000 in the Fund since inception. Past performance does not guarantee future results. All returns reflect reinvested dividends, but do not reflect the deduction of taxes that a shareholder would pay on Fund distributions or the redemption of Fund shares.
| 2 | www.cuppsfunds.com |
| Cupps All Cap Growth Fund | Portfolio Update |
| March 31, 2015 (Unaudited) |
Sector Allocation (as a % of Net Assets)*
| Technology | 31.30% | |
| Consumer, Cyclical | 20.22% | |
| Consumer, Non-cyclical | 16.19% | |
| Communications | 15.57% | |
| Financial | 7.18% | |
| Industrial | 4.43% | |
| Energy | 4.23% | |
| Cash, Cash Equivalents, & Other Net Assets | 0.88% | |
| Totals | 100.00% |
Top 10 Long Holdings(as a % of Net Assets)*
| Apple, Inc. | 4.62% | |
| Palo Alto Networks, Inc. | 3.62% | |
| Tableau Software, Inc. - Class A | 3.55% | |
| Cavium, Inc. | 3.17% | |
| Electronic Arts, Inc. | 2.99% | |
| salesforce.com, Inc. | 2.98% | |
| Facebook, Inc. - Class A | 2.51% | |
| FireEye, Inc. | 2.27% | |
| Restoration Hardware Holdings, Inc. | 2.09% | |
| Skyworks Solutions, Inc. | 2.08% | |
| Top Ten Holdings | 29.88% |
| * | Holdings are subject to change. Tables present indicative values only. |
| Semi-Annual Report | March 31, 2015 | 3 |
| Cupps All Cap Growth Fund | Disclosure of Fund Expenses |
| March 31, 2015 (Unaudited) |
Examples. As a shareholder of the Cupps All Cap Growth Fund (the “Fund”), you will incur two types of costs: (1) transaction costs, including applicable redemption fees; and (2) ongoing costs, including management fees and other Fund expenses. The following example is intended to help you understand your ongoing costs (in dollars) of investing in the Fund and to compare these costs with the ongoing costs of investing in other mutual funds. The examples are based on an investment of $1,000 invested on October 1, 2014 and held through March 31, 2015.
Actual Expenses. The first line of the table below provides information about actual account values and actual expenses. You may use the information in this line, together with the amount you invested, to estimate the expenses that you paid over the period. Simply divide your account value by $1,000 (for example, an $8,600 account value divided by $1,000 = 8.6), then multiply the result by the number in the first line under the heading “Expenses Paid During Period October 1, 2014 – March 31, 2015” to estimate the expenses you paid on your account during this period.
Hypothetical Example for Comparison Purposes. The second line of the table below provides information about hypothetical account values and hypothetical expenses based on the Fund’s actual expense ratio and an assumed rate of return of 5% per year before expenses, which is not the Fund’s actual return. The hypothetical account values and expenses may not be used to estimate the actual ending account balance or expenses you paid for the period. You may use this information to compare the ongoing costs of investing in the Fund and other mutual funds. To do so, compare this 5% hypothetical example with the 5% hypothetical examples that appear in the shareholder reports of the other mutual funds.
Please note that the expenses shown in the table are meant to highlight your ongoing costs only and do not reflect any transactional costs, such as redemption fees. Therefore, the second line of the table below is useful in comparing ongoing costs only and may not help you determine the relative total costs of owning different funds. In addition, if these transactional costs were included, your costs would have been higher.
Beginning Account Value October 1, 2014 | Ending Account Value March 31, 2015 | Expense Ratio(a) | Expense Paid During Period | |||||||||||||
| Cupps All Cap Growth Fund | ||||||||||||||||
| Actual | $ | 1,000.00 | $ | 1,074.30 | 1.05% | $ | 5.43 | |||||||||
| Hypothetical (5% return before expenses) | $ | 1,000.00 | $ | 1,019.70 | 1.05% | $ | 5.29 | |||||||||
| (a) | The Fund’s expenses have been annualized based on the Fund’s most recent fiscal half-year expenses. |
| (b) | Expenses are equal to the Fund’s annualized expense ratio, multiplied by the average account value over the period, multiplied by the number of days in the most recent fiscal half year (182), divided by 365. |
| 4 | www.cuppsfunds.com |
| Cupps All Cap Growth Fund | Portfolio of Investments |
| March 31, 2015 (Unaudited) |
| Value | ||||||||
| Shares | (Note 2) | |||||||
| COMMON STOCKS (99.12%) | ||||||||
| COMMUNICATIONS (15.57%) | ||||||||
Amazon.com, Inc.(a) | 117 | $ | 43,536 | |||||
Facebook, Inc. - Class A(a) | 674 | 55,413 | ||||||
FireEye, Inc.(a) | 1,279 | 50,201 | ||||||
Google, Inc. - Class A(a) | 57 | 31,618 | ||||||
Netflix, Inc.(a) | 82 | 34,168 | ||||||
Palo Alto Networks, Inc.(a) | 547 | 79,906 | ||||||
Splunk, Inc.(a) | 219 | 12,965 | ||||||
Vipshop Holdings Ltd. - ADR(a) | 847 | 24,935 | ||||||
Zillow, Inc. - Class A(a) | 110 | 11,033 | ||||||
| TOTAL COMMUNICATIONS | 343,775 | |||||||
| CONSUMER, CYCLICAL (20.22%) | ||||||||
| American Airlines Group, Inc. | 624 | 32,935 | ||||||
Chipotle Mexican Grill, Inc.(a) | 48 | 31,226 | ||||||
| Delphi Automotive PLC | 550 | 43,857 | ||||||
| Delta Air Lines, Inc. | 486 | 21,851 | ||||||
Hilton Worldwide Holdings, Inc.(a) | 1,502 | 44,489 | ||||||
| Lennar Corp. - Class A | 670 | 34,713 | ||||||
Qunar Cayman Islands Ltd. - ADR(a) | 265 | 10,931 | ||||||
Restoration Hardware Holdings, Inc.(a) | 466 | 46,222 | ||||||
| Royal Caribbean Cruises Ltd. | 344 | 28,156 | ||||||
Skechers U.S.A. Inc. - Class A(a) | 459 | 33,007 | ||||||
| Starbucks Corp. | 327 | 30,967 | ||||||
Tesla Motors, Inc.(a) | 140 | 26,428 | ||||||
Under Armour, Inc. - Class A(a) | 435 | 35,126 | ||||||
| Vail Resorts, Inc. | 255 | 26,372 | ||||||
| TOTAL CONSUMER, CYCLICAL | 446,280 | |||||||
| CONSUMER, NON-CYCLICAL (16.19%) | ||||||||
Alnylam Pharmaceuticals, Inc.(a) | 275 | 28,715 | ||||||
BioMarin Pharmaceutical, Inc.(a) | 167 | 20,812 | ||||||
Cepheid(a) | 665 | 37,839 | ||||||
CoStar Group, Inc.(a) | 112 | 22,157 | ||||||
DexCom, Inc.(a) | 422 | 26,307 | ||||||
Edwards Lifesciences Corp.(a) | 305 | 43,450 | ||||||
Envision Healthcare Holdings, Inc.(a) | 729 | 27,957 | ||||||
Exact Sciences Corp.(a) | 1,060 | 23,341 | ||||||
FleetCor Technologies, Inc.(a) | 249 | 37,579 | ||||||
Gilead Sciences, Inc.(a) | 160 | 15,701 | ||||||
Illumina, Inc.(a) | 70 | 12,995 | ||||||
| Keurig Green Mountain, Inc. | 146 | 16,313 | ||||||
United Rentals, Inc.(a) | 180 | 16,409 | ||||||
| Universal Health Services, Inc. - Class B | 237 | 27,897 | ||||||
| TOTAL CONSUMER, NON-CYCLICAL | 357,472 | |||||||
| ENERGY (4.23%) | ||||||||
Concho Resources, Inc.(a) | 155 | 17,967 | ||||||
| Halliburton Co. | 235 | 10,312 | ||||||
| Pioneer Natural Resources Co. | 131 | 21,420 | ||||||
SolarCity Corp.(a) | 214 | 10,974 | ||||||
| Value | ||||||||
| Shares | (Note 2) | |||||||
| ENERGY (continued) | ||||||||
SunEdison, Inc.(a) | 1,361 | $ | 32,664 | |||||
| TOTAL ENERGY | 93,337 | |||||||
| FINANCIAL (7.18%) | ||||||||
| Charles Schwab Corp. | 1,045 | 31,810 | ||||||
E*Trade Financial Corp.(a) | 1,574 | 44,945 | ||||||
LendingClub Corp.(a) | 695 | 13,657 | ||||||
| Morgan Stanley | 903 | 32,228 | ||||||
| Visa, Inc. - Class A | 548 | 35,845 | ||||||
| TOTAL FINANCIAL | 158,485 | |||||||
| INDUSTRIAL (4.43%) | ||||||||
| Acuity Brands, Inc. | 195 | 32,791 | ||||||
| Boeing Co. | 181 | 27,164 | ||||||
Mobileye NV(a) | 255 | 10,718 | ||||||
XPO Logistics, Inc.(a) | 595 | 27,055 | ||||||
| TOTAL INDUSTRIAL | 97,728 | |||||||
| TECHNOLOGY (31.30%) | ||||||||
| Apple, Inc. | 820 | 102,033 | ||||||
| Applied Materials, Inc. | 931 | 21,003 | ||||||
| Avago Technologies Ltd. | 334 | 42,411 | ||||||
Cavium, Inc.(a) | 989 | 70,041 | ||||||
| Cypress Semiconductor Corp. | 1,250 | 17,638 | ||||||
Electronic Arts, Inc.(a) | 1,121 | 65,932 | ||||||
Envestnet, Inc.(a) | 120 | 6,730 | ||||||
Freescale Semiconductor Ltd.(a) | 1,040 | 42,390 | ||||||
IPG Photonics Corp. (a) | 348 | 32,260 | ||||||
NetSuite, Inc.(a) | 219 | 20,314 | ||||||
salesforce.com, Inc. (a) | 984 | 65,741 | ||||||
ServiceNow, Inc.(a) | 553 | 43,565 | ||||||
| Skyworks Solutions, Inc. | 467 | 45,901 | ||||||
Tableau Software, Inc. - Class A(a) | 848 | 78,457 | ||||||
Ultimate Software Group, Inc.(a) | 214 | 36,370 | ||||||
| TOTAL TECHNOLOGY | 690,786 | |||||||
TOTAL COMMON STOCKS (Cost $1,915,459) | 2,187,863 | |||||||
| 7-Day | Value | |||||||||||
| Yield | Shares | (Note 2) | ||||||||||
| SHORT-TERM INVESTMENTS (2.43%) | ||||||||||||
| MONEY MARKET FUND (2.43%) | ||||||||||||
| Fidelity Institutional Money Market Portfolio | 0.09741 | % | 53,654 | 53,654 | ||||||||
TOTAL SHORT-TERM INVESTMENTS (Cost $53,654) | 53,654 | |||||||||||
See Notes to Financial Statements.
| Semi-Annual Report | March 31, 2015 | 5 |
| Cupps All Cap Growth Fund | Portfolio of Investments |
| March 31, 2015 (Unaudited) |
| Value | ||||
| (Note 2) | ||||
TOTAL INVESTMENTS (101.55%) (Cost $1,969,113) | $ | 2,241,517 | ||
| Liabilities In Excess Of Other Assets (-1.55%) | (34,161 | ) | ||
| NET ASSETS (100.00%) | $ | 2,207,356 | ||
(a) | Non-income producing security. |
Common Abbreviations:
ADR - American Depositary Receipt. Ltd. - Limited.
NV - Naamloze Vennootschap is the Dutch term used for a public limited liability company.
PLC - Public Limited Company.
For Fund compliance purposes, the Fund’s industry classifications refer to any one or more of the industry sub-classifications used by one or more widely recognized market indices or ratings group indices, and/or as defined by Fund management. This definition may not apply for purposes of this report, which may combine industry sub-classifications for reporting ease. Industries are shown as a percentage of the Fund’s net assets. (unaudited)
See Notes to Financial Statements.
| 6 | www.cuppsfunds.com |
| Cupps All Cap Growth Fund | Statement of Assets and Liabilities |
| March 31, 2015 (Unaudited) |
| ASSETS | ||||
| Investments, at value (Cost $1,969,113) | $ | 2,241,517 | ||
| Receivable for investments sold | 28,738 | |||
| Dividend and interest receivable | 411 | |||
| Receivable due from advisor | 23,144 | |||
| Prepaid offering costs | 14,910 | |||
| Prepaid expenses and other assets | 5,757 | |||
| Total Assets | 2,314,477 | |||
| LIABILITIES | ||||
| Payable for investments purchased | 64,499 | |||
| Payable due to Chief Compliance Officer | 1,639 | |||
| Administration and transfer agency fees payable | 22,888 | |||
| Trustees’ fees and expenses payable | 76 | |||
| Legal fees payable | 4,172 | |||
| Audit and tax fees payable | 11,470 | |||
| Accrued expenses and other liabilities | 2,377 | |||
| Total Liabilities | 107,121 | |||
| NET ASSETS | $ | 2,207,356 | ||
| NET ASSETS CONSIST OF | ||||
| Paid-in capital | $ | 2,063,320 | ||
| Accumulated net investment loss | (7,045 | ) | ||
| Accumulated net realized loss on investments | (121,323 | ) | ||
| Net unrealized appreciation on investments | 272,404 | |||
| NET ASSETS | $ | 2,207,356 | ||
| PRICING OF SHARES | ||||
| Net Asset Value, offering and redemption price per share | $ | 10.56 | ||
| Net Assets | $ | 2,207,356 | ||
| Shares of beneficial interest outstanding (unlimited number of shares, no par value common stock authorized) | 209,096 | |||
See Notes to Financial Statements.
| Semi-Annual Report | March 31, 2015 | 7 |
| Cupps All Cap Growth Fund | Statement of Operations |
| For the Six Months Ended March 31, 2015 (Unaudited) |
| INVESTMENT INCOME | ||||
| Dividends | $ | 3,261 | ||
| Total Investment Income | 3,261 | |||
| EXPENSES | ||||
| Investment advisory fees | 8,960 | |||
| Administrative and transfer agency fees | 74,714 | |||
| Legal fees | 7,505 | |||
| Audit and tax fees | 8,370 | |||
| Reports to shareholders and printing fees | 607 | |||
| Insurance fees | 104 | |||
| Custody fees | 2,493 | |||
| Chief Compliance Officer Fees | 9,973 | |||
| Trustees’ fees and expenses | 622 | |||
| Offering costs | 33,010 | |||
| Miscellaneous expenses | 4,868 | |||
| Total Expenses | 151,226 | |||
| Less fees waived/reimbursed by investment advisor (Note 6) | (141,323 | ) | ||
| Net Expenses | 9,903 | |||
| Net Investment Loss | (6,642 | ) | ||
| Net realized loss on investments | (114,220 | ) | ||
| Net change in unrealized appreciation on investments | 276,742 | |||
| NET REALIZED AND UNREALIZED GAIN ON INVESTMENTS | 162,522 | |||
| NET INCREASE IN NET ASSETS RESULTING FROM OPERATIONS | $ | 155,880 | ||
See Notes to Financial Statements.
| 8 | www.cuppsfunds.com |
| Cupps All Cap Growth Fund | Statements of Changes in Net Assets |
| For the Six | ||||||||
| Months Ended | ||||||||
| March 31, 2015 | For the Period Ended | |||||||
| (Unaudited) | September 30, 2014(a) | |||||||
| OPERATIONS | ||||||||
| Net investment loss | $ | (6,642 | ) | $ | (467 | ) | ||
| Net realized loss on investments | (114,220 | ) | (7,208 | ) | ||||
| Net change in unrealized appreciation/(depreciation) on investments | 276,742 | (4,338 | ) | |||||
| Net increase/(decrease) in net assets resulting from operations | 155,880 | (12,013 | ) | |||||
| BENEFICIAL SHARE TRANSACTIONS | ||||||||
| Shares sold | 1,289,979 | 773,510 | ||||||
| Net increase in net assets derived from beneficial share transactions | 1,289,979 | 773,510 | ||||||
| Net increase in net assets | 1,445,859 | 761,497 | ||||||
| NET ASSETS | ||||||||
| Beginning of period | 761,497 | — | ||||||
| End of period (Including accumulated net investment loss of $(7,045) and $(403)) | $ | 2,207,356 | $ | 761,497 | ||||
| (a) | Commenced operations on July 1, 2014. |
See Notes to Financial Statements.
| Semi-Annual Report | March 31, 2015 | 9 |
| Cupps All Cap Growth Fund | Financial Highlights |
| For a Share Outstanding Throughout the Periods Presented |
| For the | ||||||||
| Six Months Ended | ||||||||
| March 31, 2015 | For the Period Ended | |||||||
| (Unaudited) | September 30, 2014(a) | |||||||
| Net asset value, beginning of period | $ | 9.83 | $ | 10.00 | ||||
| INCOME FROM INVESTMENT OPERATIONS: | ||||||||
Net investment loss(b) | (0.04 | ) | (0.01 | ) | ||||
| Net realized and unrealized gain/(loss) | 0.77 | (0.16 | ) | |||||
| Total from investment operations | 0.73 | (0.17 | ) | |||||
| Net increase/(decrease) in net asset value | 0.73 | (0.17 | ) | |||||
| Net asset value, end of period | $ | 10.56 | $ | 9.83 | ||||
TOTAL RETURN(c) | 7.43 | % | (1.70 | )% | ||||
| RATIOS/SUPPLEMENTAL DATA: | ||||||||
| Net assets, end of period (000s) | $ | 2,207 | $ | 761 | ||||
| Ratio of expenses to average net assets excluding fee waivers and reimbursements | 16.03 | %(d) | 106.03 | %(d) | ||||
| Ratio of expenses to average net assets including fee waivers and reimbursements | 1.05 | %(d) | 1.05 | %(d) | ||||
| Ratio of net investment loss to average net assets | (0.70 | )%(d) | (0.62 | )%(d) | ||||
Portfolio turnover rate(e) | 75 | % | 25 | % | ||||
| (a) | Commenced operations on July 1, 2014. |
| (b) | Calculated using the average shares method. |
| (c) | The total return is for the period indicated and have not been annualized. The total return would have been lower had certain expenses not been reimbursed/waived during the period. The return shown does not reflect the deduction of taxes that a shareholder would pay on Fund distributions or the redemption of Fund shares. |
| (d) | Annualized. |
| (e) | Portfolio turnover rate for periods less than one full year have not been annualized. |
See Notes to Financial Statements.
| 10 | www.cuppsfunds.com |
| Cupps All Cap Growth Fund | Notes to Financial Statements |
March 31, 2015 (Unaudited)
1. ORGANIZATION
The ALPS Series Trust (the “Trust”), a Delaware statutory trust, is an open-end management investment company registered under the Investment Company Act of 1940, as amended (the “1940 Act”). As of March 31, 2015, the Trust had nine registered funds. This semi-annual report describes the Cupps All Cap Growth Fund (the “Fund”). The Fund’s primary investment objective is to achieve growth of capital over the long term. The Fund currently offers Institutional Class shares. The Trust has an unlimited number of shares with no par value per share. The Board of Trustees (the “Board”) may establish additional funds and classes of shares at any time in the future without shareholder approval.
2. SIGNIFICANT ACCOUNTING POLICIES
The accompanying financial statements were prepared in accordance with accounting principles generally accepted in the United States of America for investment companies (“U.S. GAAP”). The Fund is considered an investment company for financial reporting purposes. The preparation of financial statements in conformity with U.S. GAAP requires management to make certain estimates and assumptions that affect the reported amounts of assets and liabilities and disclosures of contingent assets and liabilities at the date of the financial statements and the reported amounts of revenue and expenses during the period. Actual results could differ from those estimates. The following is a summary of significant accounting policies consistently followed by the Fund in preparation of its financial statements.
Investment Valuation: The Fund generally values its securities based on market prices determined at the close of regular trading on the New York Stock Exchange (“NYSE”), normally 4:00 p.m. Eastern Time, on each day the NYSE is open for trading.
For equity securities and mutual funds that are traded on an exchange, the market price is usually the closing sale or official closing price on that exchange. In the case of equity securities not traded on an exchange, or if such closing prices are not otherwise available, the securities are valued at the mean of the most recent bid and ask prices on such day.
Redeemable securities issued by open-end registered investment companies are valued at the investment company’s applicable net asset value, with the exception of exchange-traded open-end investment companies, which are priced as equity securities.
When such prices or quotations are not available, or when the Fair Value Committee appointed by the Board believes that they are unreliable, securities may be priced using fair value procedures approved by the Board.
Fair Value Measurements: The Fund discloses the classification of its fair value measurements following a three-tier hierarchy based on the inputs used to measure fair value. Inputs refer broadly to the assumptions that market participants would use in pricing the asset or liability, including assumptions about risk. Inputs may be observable or unobservable. Observable inputs reflect the assumptions market participants would use in pricing the asset or liability that are developed based on market data obtained from sources independent of the reporting entity. Unobservable inputs reflect the reporting entity’s own assumptions about the assumptions market participants would use in pricing the asset or liability that are developed based on the best information available.
Various inputs are used in determining the value of the Fund’s investments as of the end of the reporting period. When inputs used fall into different levels of the fair value hierarchy, the level in the hierarchy within which the fair value measurement falls is determined based on the lowest level input that is significant to the fair value measurement in its entirety. The designated input levels are not necessarily an indication of the risk or liquidity associated with these investments. These inputs are categorized in the following hierarchy under applicable financial
accounting standards:
accounting standards:
| Level 1 – | Unadjusted quoted prices in active markets for identical investments, unrestricted assets or liabilities that the Fund has the ability to access at the measurement date; |
| Level 2 – | Quoted prices which are not active, quoted prices for similar assets or liabilities in active markets or inputs other than quoted prices that are observable (either directly or indirectly) for substantially the full term of the asset or liability; and |
| Level 3 – | Significant unobservable prices or inputs (including the Fund’s own assumptions in determining the fair value of investments) where there is little or no market activity for the asset or liability at the measurement date. |
| Semi-Annual Report | March 31, 2015 | 11 |
| Cupps All Cap Growth Fund | Notes to Financial Statements |
March 31, 2015 (Unaudited)
The following is a summary of the inputs used to value the Fund’s investments as of March 31, 2015:
| Level 2 - Other | ||||||||||||||||
| Level 1 - Unadjusted | Significant Observable | Level 3 - Significant | ||||||||||||||
| Investments in Securities at Value | Quoted Prices | Inputs | Unobservable Inputs | Total | ||||||||||||
| Common Stocks | ||||||||||||||||
| Communications | $ | 343,775 | $ | — | $ | — | $ | 343,775 | ||||||||
| Consumer, Cyclical | 446,280 | — | — | 446,280 | ||||||||||||
| Consumer, Non‐cyclical | 357,472 | — | — | 357,472 | ||||||||||||
| Energy | 93,337 | — | — | 93,337 | ||||||||||||
| Financial | 158,485 | — | — | 158,485 | ||||||||||||
| Industrial | 97,728 | — | — | 97,728 | ||||||||||||
| Technology | 690,786 | — | — | 690,786 | ||||||||||||
| Short‐Term Investments | 53,654 | — | — | 53,654 | ||||||||||||
| TOTAL | $ | 2,241,517 | $ | — | $ | — | $ | 2,241,517 | ||||||||
The Fund recognizes transfers between levels as of the end of the period. For the period ended March 31, 2015, the Fund did not have any transfers between Level 1 and Level 2 securities. There were no Level 3 securities held during the period.
Offering Costs: The Fund incurred offering costs during the period ended March 31, 2015. These offering costs, including fees for printing initial prospectuses, legal and registration fees, are being amortized over the first twelve months from the inception date of the Fund. Amounts amortized through March 31, 2015 are shown on the Fund’s Statement of Operations and amounts that remain to be amortized are shown on the Fund’s Statement of Assets and Liabilities.
Trust Expenses: Some expenses of the Trust can be directly attributed to the Fund. Expenses which cannot be directly attributed to the Fund are apportioned among all funds in the Trust based on average net assets of each fund.
Federal Income Taxes: The Fund complies with the requirements under Subchapter M of the Internal Revenue Code of 1986, as amended, applicable to regulated investment companies and intends to distribute substantially all of its net taxable income and net capital gains, if any, each year so that it will not be subject to excise tax on undistributed income and gains. The Fund is not subject to income taxes to the extent such distributions are made.
As of and during the period ended March 31, 2015, the Fund did not have a liability for any unrecognized tax benefits in the accompanying financial statements. The Fund files U.S. federal, state and local income tax returns as required. The Fund’s tax returns are subject to examination by the relevant tax authorities until expiration of the applicable statute of limitations, which is generally three years after the filing of the tax return for federal purposes and four years for most state returns. If applicable, the Fund’s administrator has analyzed the Fund’s tax positions taken on federal and state income tax returns for all open tax years and has concluded that as of March 31, 2015, no provision for income tax is required in the Fund’s financial statements related to these tax positions.
Investment Transactions and Investment Income: Investment transactions are accounted for on the date the investments are purchased or sold (trade date basis). Realized gains and losses from investment transactions are reported on an identified cost basis. Interest income, which includes accretion of discounts and amortization of premiums, is accrued and recorded as earned. Dividend income is recognized on the ex-dividend date, or for certain foreign securities, as soon as information is available to the Fund.
Distributions to Shareholders: The Fund normally pays dividends, if any, and distributes capital gains, if any, on an annual basis. Income dividend distributions are derived from interest and other income the Fund receives from its investments, including short term capital gains. Long term capital gain distributions are derived from gains realized when the Fund sells a security it has owned for more than one year. Net investment income/(loss) and net realized gain/(loss) may differ for financial statement and tax purposes.
| 12 | www.cuppsfunds.com |
| Cupps All Cap Growth Fund | Notes to Financial Statements |
March 31, 2015 (Unaudited)
3. TAX BASIS INFORMATION
Tax Basis of Distributions to Shareholders: The character of distributions made during the period from net investment income or net realized gains may differ from its ultimate characterization for federal income tax purposes. Also, due to the timing of dividend distributions, the fiscal year in which amounts are distributed may differ from the fiscal year in which the income or realized gain were recorded by the Fund. The amounts and characteristics of tax basis distributions and composition of distributable earnings/(accumulated losses) are finalized at fiscal year-end. Accordingly, tax basis balances have not been determined as of the date of the semi-annual. There were no distributions paid by the Fund for the fiscal period ended September 30, 2014.
Unrealized Appreciation and Depreciation on Investments: As of March 31, 2015, the aggregate costs of investments, gross unrealized appreciation/(depreciation) and net unrealized appreciation for Federal tax purposes were as follows:
| Gross unrealized appreciation (excess of value over tax cost) | $ | 263,121 | ||
| Gross unrealized depreciation (excess of tax cost over value) | (21,166 | ) | ||
| Net unrealized appreciation | $ | 241,955 | ||
| Cost of investments for income tax purposes | $ | 1,999,562 |
4. SECURITIES TRANSACTIONS
Purchases and sales of securities, excluding short‐term securities, during the six months ended March 31, 2015 were as follows:
Purchases of Securities | Proceeds from Sales of Securities | |||||||
| $ | 2,667,718 | $ | 1,398,415 | |||||
5. BENEFICIAL SHARE TRANSACTIONS
The capitalization of the Trust consists of an unlimited number of shares of beneficial interest with no par value per share. Holders of the shares of the Fund have one vote for each share held and a proportionate fraction of a vote for each fractional share. All shares issued and outstanding are fully paid and are non-assessable, transferable and redeemable at the option of the shareholder. Shares have no pre-emptive rights.
Transactions in common shares were as follows:
| For the | ||||||||
| Six Months Ended | ||||||||
| March 31, 2015 | For the Period Ended | |||||||
| (Unaudited) | September 30, 2014(a) | |||||||
| Shares sold | 131,605 | 77,491 | ||||||
| Dividends reinvested | — | — | ||||||
| Shares redeemed | — | — | ||||||
| Net increase in shares outstanding | 131,605 | 77,491 | ||||||
(a) | Commenced operations on July 1, 2014. |
Control is defined by the 1940 Act as the beneficial ownership, either directly or through one or more controlled companies, of more than 25% of the voting securities of a company. Approximately 65% of the shares outstanding are held within one omnibus account. Investment activities of these shareholders could have a material impact on the Fund.
6. MANAGEMENT AND RELATED PARTY TRANSACTIONS
Investment Advisory: Cupps Capital Management, LLC (“Cupps” or the “Adviser”), subject to the authority of the Board, is responsible for the overall management and administration of the Fund’s business affairs. The Adviser manages the investments of the Fund in accordance with the Fund’s investment objective, policies and limitations and investment guidelines established jointly by the Adviser and the Board.
| Semi-Annual Report | March 31, 2015 | 13 |
| Cupps All Cap Growth Fund | Notes to Financial Statements |
March 31, 2015 (Unaudited)
Pursuant to the Investment Advisory Agreement (the “Advisory Agreement”) with the Adviser, the Fund pays the Adviser an annual management fee of 0.95% based on the Fund’s average daily net assets. The management fee is paid on a monthly basis. The initial term of the Advisory Agreement is two years. The Board may extend the Advisory Agreement for additional one-year terms. The Board, shareholders of the Fund or the Adviser may terminate the Advisory Agreement upon 60 days’ notice.
Pursuant to a fee waiver letter agreement (the “Fee Waiver Agreement”), the Adviser has contractually agreed to limit the amount of the Fund’s Total Annual Fund Operating Expenses, exclusive of Distribution and Service (12b-1) Fees, Acquired Fund Fees and Expenses, brokerage expenses, interest expenses, taxes and extraordinary expenses, Fund liquidation expenses and Fund reorganization expenses to 1.05% of the Fund’s average daily net assets. The Fee Waiver Agreement is in effect through January 31, 2016. The Adviser will be permitted to recover, on a class-by-class basis, expenses it has borne through the Fee Waiver Agreement to the extent that the Fund’s expenses in later periods fall below the annual rates set forth in the Fee Waiver Agreement. The Fund will not be obligated to pay any such deferred fees and expenses more than three years after the end of the fiscal year in which the fees and expense were deferred. The Adviser may not discontinue this waiver without the approval by the Trust’s Board.
For the six-month period ended March 31, 2015, the fee waivers and/or reimbursements were $141,323.
As of March 31, 2015, the balance of recoupable expenses was $220,129, of which $78,806 expires in 2017 and $141,323 expires in 2018.
Administrator: ALPS Fund Services, Inc. (“ALPS”) serves as administrator to the Fund. The Fund has agreed to pay expenses incurred in connection with its administrative activities. Pursuant to the Administration, Bookkeeping and Pricing Services Agreement with the Trust, ALPS will provide operational services to the Fund including, but not limited to, fund accounting and fund administration and generally assist in the Fund’s operations. The Fund’s administration fee is accrued on a daily basis and paid monthly. The officers of the Trust are employees of ALPS. Administration fees paid by the Fund for the six months ended March 31, 2015 are disclosed in the Statement of Operations.
Transfer Agent: ALPS serves as transfer agent for the Fund under a Transfer Agency and Services Agreement with the Trust. Under this agreement, ALPS is paid an annual fee for services performed on behalf of the Fund plus fees for open accounts and is reimbursed for certain out-of-pocket expenses.
Compliance Services: ALPS provides services as the Fund’s Chief Compliance Officer to monitor and test the policies and procedures of the Fund in conjunction with requirements under Rule 38a-1 of the 1940 Act pursuant to a Chief Compliance Officer Services Agreement with the Trust. Under this agreement, ALPS is paid an annual fee for services performed on behalf of the Fund and is reimbursed for certain out-of-pocket expenses.
Distribution: ALPS Distributors, Inc. (the “Distributor”) (an affiliate of ALPS) acts as the principal underwriter of the Fund’s shares pursuant to a Distribution Agreement with the Trust. Shares of the Fund are offered on a continuous basis through the Distributor, as agent of the Fund. The Distributor is not obligated to sell any particular amount of shares and is not entitled to any compensation for its services as the Fund’s principal underwriter pursuant to the Distribution Agreement.
7. TRUSTEES
As of March 31, 2015, there were four Trustees, three of whom are not “interested persons” (as defined in the 1940 Act) of the Trust (the “Independent Trustees”). The Independent Trustees receive a quarterly retainer of $4,000, plus $2,000 for each regular Board or Committee meeting attended, $2,000 for each special telephonic Board or Committee meeting attended and $2,000 for each special in-person Board meeting attended. The Independent Trustees are also reimbursed for all reasonable out-of-pocket expenses relating to attendance at meetings and for meeting-related expenses. Officers of the Trust and Trustees who are interested persons of the Trust receive no salary or fees from the Trust.
8. INDEMNIFICATIONS
Under the Trust’s organizational documents, its officers and Trustees are indemnified against certain liabilities arising out of the performance of their duties to the Trust. Additionally, in the normal course of business, the Trust enters into contracts with service providers that may contain general indemnification clauses which may permit indemnification to the extent permissible under applicable law. The Trust’s maximum exposure under these arrangements is unknown, as this would involve future claims that may be made against the Trust that have not yet occurred.
| 14 | www.cuppsfunds.com |
| Cupps All Cap Growth Fund | Additional Information |
March 31, 2015 (Unaudited)
1. PROXY VOTING POLICIES AND VOTING RECORD
A description of the policies and procedures that the Fund uses to determine how to vote proxies relating to portfolio securities is available without charge, upon request, (i) by calling the Fund (toll‐free) at 1‐855‐674‐4642 or (ii) on the website of the Securities and Exchange Commission (the “SEC”) at http://www.sec.gov.
Information regarding how the Fund voted proxies relating to portfolio securities during the most recent 12‐month period ended June 30 is available (i) without charge, upon request, by calling the Fund (toll‐free) at 1‐855‐674‐4642 or (ii) on the SEC’s website at http://www.sec.gov.
2. PORTFOLIO HOLDINGS
The Fund files its complete schedule of portfolio holdings with the SEC for the first and third quarters of each fiscal year on Form N‐Q. The Fund’s Forms N‐Q are available on the SEC website at http://www.sec.gov. The Fund’s Forms N‐Q may be reviewed and copied at the SEC’s Public Reference Room in Washington, D.C., and information on the operation of the Public Reference Room may be obtained by calling 1‐800‐SEC‐0330.
| Semi-Annual Report | March 31, 2015 | 15 |

TABLE OF CONTENTS
| Shareholder Letter | 1 |
| Portfolio Update | 4 |
| Disclosure of Fund Expenses | 6 |
| Portfolio of Investments | 7 |
| Statement of Assets and Liabilities | 14 |
| Statement of Operations | 15 |
| Statements of Changes in Net Assets | 16 |
| Financial Highlights | 17 |
| Notes to Financial Statements | 18 |
| Additional Information | 29 |
| GKE Asian Opportunities Fund | Shareholder Letter |
March 31, 2015 (Unaudited)
Dear Shareholder,
The GaveKal Evergreen Asian Opportunities Fund posted a strong 1st quarter in 2015, rising +5.19% in USD terms. The fund benefitted from many of the themes we have been discussing over the past 6 months including reforms in China, lower interest rates in India and better capital management in Japan. Further, we have been expounding at length about the benefits from falling commodity prices that most of Asia is profiting from. Slower inflation leads to lower interest rates while falling commodity imports brings an improvement in the terms of trade for all countries but Malaysia and Australia. This is largely playing out as we expected and we believe this is one reason Asian markets have stated to outperform. If there has been one surprise to us this year it has been the resilience of the Australian equity market. The Australian equity market has risen thanks to its high dividend yield and strong local funding base. However, this rise should be set against weakening profit trends and global macro trends which appear to be conspiring against it. Aside from being very underweight Australia, the fund remains overweight China, India, and the Philippines.
Rather than re-examine the trend of weakening commodities again, we will use this shareholder letter to address another recent concern of Asian investors. This concern is that a rising US Dollar could negate any benefits from weaker commodities, potentially even putting Asia in some mini-crisis. This line of thinking, while understandable given Asia’s history, is outdated as the structure of financing has changed over the past decade and a half. Today the Asian financial system is now much more stable and Asia will avoid any worst case scenario in our view. We expect Asian currencies to hold up well, even in the face of a rising US Dollar. This doesn’t mean Asian currencies will appreciate but any weakness should be orderly and measured. And indeed this is what we have seen so far this year.
Long time investors will remember vividly the 1998 crisis which occurred after a +30% appreciation of the USD. Thailand, Malaysia, South Korea, Indonesia and the Philippines had gorged themselves on cheap USD debts to fund economic growth and asset bubbles at home. As the USD kept rising through the late 90’s these debts become increasingly onerous. The situation came to a head in June of 1997 when the Thai Bot finally cracked. Over the coming 6 months the Bot fell by nearly -50%. Other Asian currencies soon followed suit. Most Asian investors were completely wiped out. Fast forward to the global crisis of 2008 and even by then most Asian countries had learned their lessons about foreign debt. Only South Korea really got into a real mess. Today we believe a rising USD is no serious threat for several reasons: Asia no longer relies on USD funding in the same way, banking systems in Asia have evolved and are now much safer, and finally, domestic funding institutions are growing to support local capital bases.
Today Asian companies by-and-large are wary to run large currency mismatches with the memory of 1998 still hanging overhead. Additionally, thanks to lower yield spreads, corporates are now less interested in borrowing in foreign currencies. For example, in the Philippines the spread with USD treasuries has fallen from over 7% to just over 2% in the last 5 years. As the chart below shows levels of foreign borrowing have been largely stable over the past 10 years. Indeed, the only country to have shown much increase in foreign borrowing over the past 5 years is Taiwan. This is due to Taiwan’s closer integration with China and its’ companies desire to finance its China operations using Renminbi (RMB), not speculative leverage.
| Semi-Annual Report | March 31, 2015 | 1 |
| GKE Asian Opportunities Fund | Shareholder Letter |
March 31, 2015 (Unaudited)
Source: Macrobond
The second reason we believe Asian currencies will remain stable is because the banking systems in Asia have improved vastly. No longer are banks used as captive funding vehicles for family-run conglomerates. Banking practices are now typically commercially driven and done prudently. This is especially the case at the large-cap listed banks. Further, post the 2008 crisis all banks have increased the amount of capital buffer held, reducing leverage. Prior to 2008 Asian banks’ tier 1 equity ratios were commonly in the range of 8-10%, with many even below 8%. Today, most listed banks have a tier 1 equity ratio in the range of 10-12%. Places like Indonesia, the Philippines and Singapore even have banks with tier 1 ratios above 14%. This all means that any losses to the banking system caused by a US Dollar rise should be easily covered and not have systemic consequences.
Finally, the establishment of domestic financing institutions and the growth in local capital bases has made Asian economies and stock markets less reliant on foreign portfolio flows. Part of this is due to smaller current account deficits which reduce the need for foreign financing. The other factor is local investors are saving more and creating domestic pools of capital, both regionally and nationally. Whether it be pension funds like Malaysia or Japan, government investment vehicles
| 2 | www.gkefund.com |
| GKE Asian Opportunities Fund | Shareholder Letter |
March 31, 2015 (Unaudited)
like Singapore or China or the growth in insurance pools like in the Philippines, India and Thailand, the same trends can be seen all over Asia. Even China’s new Asian Infrastructure Investment Bank (AIIB) provides a good example of new local funding institutions coming up which will make Asian funding more stable.
After the taper tantrum in 2013 foreign investors have been wary to return, knowing US interest rates would have to rise at some point. Yet Asian markets are making new highs, supported by local institutions. Even more beneficial, these local investors are often long-term investors who will not run for the doors just because the Fed will hike rates. The growth of domestic funding institutions should continue to help provide liquidity and reduce volatility in the markets.
This brings us back to where we are today. Despite a +20% appreciation in the USD over the past 6 months, Asian currencies have stayed remarkably stable. Asian central banks are even moving in the opposite direction of the Fed, easing while the Fed tightens; a great sign of how confident central bankers are in the stability of their economies. To conclude, lower current account deficits, lower foreign borrowings, more sound banking systems and larger domestic pools of capital mean that hot-money flows are becoming less disruptive. This should reduce the volatility of currencies and equity markets and could lead to a re-rating of market valuations. We believe the prospects for Asia remain very bright and the nascent outperformance is set to continue.

Louis-Vincent Gave
CEO and Portfolio Manager, GaveKal Capital Limited
The views and information discussed in this commentary are as of the date of publication, are subject to change, and may not reflect the writer’s current views. The views expressed are those of the Fund’s adviser only, and represent an assessment of market conditions at a specific point in time, are opinions only and should not be relied upon as investment advice regarding a particular investment or markets in general. Such information does not constitute a recommendation to buy or sell specific securities or investment vehicles. It should not be assumed that any investment will be profitable or will equal the performance of the fund(s) or any securities or any sectors mentioned in this letter. The subject matter contained in this letter has been derived from several sources believed to be reliable and accurate at the time of compilation. Neither the Fund nor the Adviser accepts any liability for losses either direct or consequential caused by the use of this information.
Emerging markets are often less stable politically and economically than developed markets such as the United States and investing in emerging markets involves different and greater risks. There may be less publicly available information about companies in emerging markets. The stock exchanges and brokerage industries of emerging markets do not have the level of government oversight as do those in the United States. Securities markets of such countries are substantially smaller, less liquid and more volatile than securities markets in the United States. Emerging markets may be especially prone to currency-related risks.
Past performance does not guarantee future results.
| Semi-Annual Report | March 31, 2015 | 3 |
| GKE Asian Opportunities Fund | Portfolio Update |
March 31, 2015 (Unaudited)
Performance (as of March 31, 2015)
3 Month | 6 Month | 1 Year | Since Inception* | |
| GKE Asian Opportunities Fund - NAV | 5.19% | 8.62% | 13.40% | 9.71% |
MSCI AC Asia Pacific TR USD(a) | 6.79% | 5.32% | 8.89% | 7.73% |
The performance data quoted above represents past performance. Past performance is not a guarantee of future results. Investment return and value of the Fund shares will fluctuate so that an investor’s shares, when sold or redeemed, may be worth more or less than their original cost. Performance may be lower or higher than performance data quoted. Fund performance current to the most recent month-end is available by calling 1-855-331-6240 or by visiting www.gkefund.com.
| * | Fund’s inception date is August 5, 2013. |
| (a) | The MSCI AC Asia Pacific TR USD Index is designed to measure the equity market performance of the developed and emerging markets in the Pacific region. The Index consists of the following 12 developed and emerging market countries: Australia, China, Hong Kong, Indonesia, Japan, Korea, Malaysia, New Zealand, Philippines, Singapore, Taiwan and Thailand. |
Returns of less than 1 year are cumulative.
Indexes are not actively managed and do not reflect deduction for fees, expenses or taxes. An investor cannot invest directly into an index.
The returns shown above do not reflect the deduction of taxes a shareholder would pay on Fund distributions or redemption of Fund shares.
The total annual operating expenses and total annual operating expenses after fee waivers and/or reimbursement you may pay as an investor in the Fund (as reported in the January 28, 2015 Prospectus) are 4.93% and 1.81%, respectively.
Performance of $10,000 Initial Investment (as of March 31, 2015)
The graph shown above represents historical performance of a hypothetical investment of $10,000 in the Fund since inception. Past performance does not guarantee future results. All returns reflect reinvested dividends, but do not reflect the deduction of taxes that a shareholder would pay on Fund distributions or the redemption of Fund shares.
| 4 | www.gkefund.com |
Sector Allocation (as a % of Net Assets)*
| GKE Asian Opportunities Fund | Portfolio Update |
March 31, 2015 (Unaudited)
| Financials | 30.64% |
| Industrial | 18.00% |
| Government | 11.30% |
| Communications | 9.30% |
| Utilities | 8.07% |
| Consumer, Cyclical | 7.04% |
| Technology | 4.24% |
| Consumer, Non-cyclical | 1.50% |
| Diversified | 0.37% |
| Cash, Cash Equivalents, & Other Net Assets | 9.54% |
| TOTALS | 100.00% |
Top 10 Long Positions (as a % of Net Assets)*
| Philippine Government International Bond | 7.68% |
| Optus Finance Proprietary Ltd., Sr. Unsec. Notes | 3.86% |
| Indonesia Government International Bond, Sr. Unsec. Notes | 3.63% |
| Yes Bank Ltd., (Loan Participation Notes issued by Citigroup Global Markets Holdings Inc.) | 3.27% |
| FANUC Corp. | 3.25% |
| AIA Group Ltd. | 3.14% |
| Tencent Holdings Ltd. | 3.06% |
| Guangdong Investment Ltd. | 3.01% |
| Megaworld Corp. | 2.97% |
| Industrial & Commercial Bank of China Ltd., Jr. Sub. Notes | 2.93% |
| * | Holdings are subject to change. Tables present indicative values only. |
| Semi-Annual Report | March 31, 2015 | 5 |
| GKE Asian Opportunities Fund | Disclosure of Fund Expenses |
March 31, 2015 (Unaudited)
Examples. As a shareholder of the GKE Asian Opportunities Fund (the “Fund”), you will incur two types of costs: (1) transaction costs, including redemption fees; and (2) ongoing costs, including management fees and other Fund expenses. The following examples are intended to help you understand your ongoing costs (in dollars) of investing in the Fund and to compare these costs with the ongoing costs of investing in other mutual funds. The examples are based on an investment of $1,000 invested on October 1, 2014 and held until March 31, 2015.
Actual Expenses. The first line of each table below provides information about actual account values and actual expenses. You may use the information in this line, together with the amount you invested, to estimate the expenses that you paid over the period. Simply divide your account value by $1,000 (for example, an $8,600 account value divided by $1,000 = 8.6), then multiply the result by the number in the first line under the heading “Expenses Paid During Period October 1, 2014 – March 31, 2015” to estimate the expenses you paid on your account during this period.
Hypothetical Example for Comparison Purposes. The second line of the table below provides information about hypothetical account values and hypothetical expenses based on the Fund’s actual expense ratio and an assumed rate of return of 5% per year before expenses, which is not the Fund’s actual return. The hypothetical account values and expenses may not be used to estimate the actual ending account balance or expenses you paid for the period. You may use this information to compare the ongoing costs of investing in the Fund and other mutual funds. To do so, compare this 5% hypothetical example with the 5% hypothetical examples that appear in the shareholder reports of the other mutual funds.
Please note that the expenses shown in the table are meant to highlight your ongoing costs only and do not reflect any transactional costs, such as redemption fees. Therefore, the second line of the table below is useful in comparing ongoing costs only and may not help you determine the relative total costs of owning different funds. In addition, if these transactional costs were included, your costs would have been higher.
| Expenses Paid | |||||||||||||||
| Beginning Account | Ending Account | During period | |||||||||||||
| Value | Value | Expense | October 1, 2014 - | ||||||||||||
| October 1, 2014 | March 31, 2015 | Ratio(a) | March 31, 2015(b) | ||||||||||||
| Actual | $ | 1,000.00 | $ | 1,086.20 | 1.81% | $ | 9.41 | ||||||||
| Hypothetical (5% return before expenses) | $ | 1,000.00 | $ | 1,015.91 | 1.81% | $ | 9.10 | ||||||||
| (a) | The Fund’s expense ratios have been annualized based on the Fund’s most recent fiscal half-year expenses. |
| (b) | Expenses are equal to the Fund’s annualized expense ratio, multiplied by the average account value over the period, multiplied by the number of days in the most recent fiscal half year (182), divided by 365. |
| 6 | www.gkefund.com |
| GKE Asian Opportunities Fund | Portfolio of Investments |
March 31, 2015 (Unaudited)
| Value | ||||||||
| Shares | (Note 2) | |||||||
| COMMON STOCKS (58.85%) | ||||||||
| COMMUNICATIONS (5.44%) | ||||||||
| Internet (5.44%) | ||||||||
Baidu, Inc. ‐ Sponsored ADR(a) | 700 | $ | 145,880 | |||||
| Tencent Holdings Ltd. | 27,100 | 514,549 | ||||||
| Trend Micro, Inc. | 7,700 | 254,238 | ||||||
| 914,667 | ||||||||
| TOTAL COMMUNICATIONS | 914,667 | |||||||
| CONSUMER, CYCLICAL (6.59%) | ||||||||
| Auto Manufacturers (4.06%) | ||||||||
| Fuji Heavy Industries Ltd. | 2,900 | 96,501 | ||||||
| Great Wall Motor Co. Ltd. ‐ Class H | 32,500 | 229,728 | ||||||
| Toyota Motor Corp. | 5,100 | 356,471 | ||||||
| 682,700 | ||||||||
| Home Furnishings (2.53%) | ||||||||
| Panasonic Corp. | 19,300 | 253,772 | ||||||
Sony Corp.(a) | 6,500 | 172,885 | ||||||
| 426,657 | ||||||||
| TOTAL CONSUMER, CYCLICAL | 1,109,357 | |||||||
| CONSUMER, NON‐CYCLICAL (1.50%) | ||||||||
| Healthcare‐Products (1.50%) | ||||||||
| Hengan International Group Co. Ltd. | 21,000 | 252,185 | ||||||
| TOTAL CONSUMER, NON‐CYCLICAL | 252,185 | |||||||
| DIVERSIFIED (0.37%) | ||||||||
| Holding Companies‐Divers (0.37%) | ||||||||
| China Merchants Holdings International Co. Ltd. | 16,000 | 62,636 | ||||||
| TOTAL DIVERSIFIED | 62,636 | |||||||
| FINANCIAL (18.70%) | ||||||||
| Banks (5.10%) | ||||||||
| BDO Unibank, Inc. | 130,630 | 361,497 | ||||||
| Metropolitan Bank & Trust | 167,929 | 366,476 | ||||||
| Resona Holdings, Inc. | 26,300 | 130,826 | ||||||
| 858,799 | ||||||||
See Notes to Financial Statements.
| Semi-Annual Report | March 31, 2015 | 7 |
| GKE Asian Opportunities Fund | Portfolio of Investments |
March 31, 2015 (Unaudited)
| Value | ||||||||
| Shares | (Note 2) | |||||||
| FINANCIAL (continued) | ||||||||
| Insurance (5.23%) | ||||||||
| AIA Group Ltd. | 83,800 | $ | 527,490 | |||||
| Ping An Insurance Group Co. of China Ltd. | 20,000 | 240,434 | ||||||
| T&D Holdings, Inc. | 8,100 | 111,739 | ||||||
| 879,663 | ||||||||
| Investment Companies (2.68%) | ||||||||
| CK Hutchison Holdings Ltd. | 22,000 | 450,633 | ||||||
| Real Estate (5.69%) | ||||||||
| Country Garden Holdings Co. Ltd. | 146,000 | 58,945 | ||||||
| Megaworld Corp. | 4,108,900 | 499,135 | ||||||
| Mitsui Fudosan Co. Ltd. | 4,000 | 117,714 | ||||||
| Shimao Property Holdings Ltd. | 133,500 | 280,684 | ||||||
| 956,478 | ||||||||
| TOTAL FINANCIAL | 3,145,573 | |||||||
| INDUSTRIAL (17.38%) | ||||||||
| Electrical Components & Equipment (1.29%) | ||||||||
| Nidec Corp. | 800 | 53,276 | ||||||
| Zhuzhou CSR Times Electric Co. Ltd. | 25,000 | 164,137 | ||||||
| 217,413 | ||||||||
| Electronics (5.46%) | ||||||||
| Murata Manufacturing Co. Ltd. | 3,400 | 468,746 | ||||||
| NEC Corp. | 62,000 | 182,482 | ||||||
| Omron Corp. | 5,900 | 266,628 | ||||||
| 917,856 | ||||||||
| Engineering & Construction (2.84%) | ||||||||
| Beijing Capital International Airport Co. Ltd. | 58,000 | 56,559 | ||||||
| Cheung Kong Infrastructure Holdings Ltd. | 49,000 | 421,256 | ||||||
| 477,815 | ||||||||
| Hand & Machine Tools (1.78%) | ||||||||
| SMC Corp. | 1,000 | 298,870 | ||||||
| Machinery ‐ Construction & Mining (1.06%) | ||||||||
| Mitsubishi Electric Corp. | 15,000 | 178,659 | ||||||
See Notes to Financial Statements.
| 8 | www.gkefund.com |
| GKE Asian Opportunities Fund | Portfolio of Investments |
March 31, 2015 (Unaudited)
| Value | ||||||||
| Shares | (Note 2) | |||||||
| INDUSTRIAL (continued) | ||||||||
| Machinery ‐ Diversified (3.25%) | ||||||||
| FANUC Corp. | 2,500 | $ | 547,171 | |||||
| Transportation (1.70%) | ||||||||
| East Japan Railway Co. | 1,800 | 144,679 | ||||||
| West Japan Railway Co. | 2,700 | 141,894 | ||||||
| 286,573 | ||||||||
| TOTAL INDUSTRIAL | 2,924,357 | |||||||
| TECHNOLOGY (0.80%) | ||||||||
| Semiconductors (0.80%) | ||||||||
| Samsung Electronics Co. Ltd. | 103 | 133,781 | ||||||
| TOTAL TECHNOLOGY | 133,781 | |||||||
| UTILITIES (8.07%) | ||||||||
| Electric (5.06%) | ||||||||
| Huadian Fuxin Energy Corp. Ltd. ‐ Class H | 802,000 | 393,104 | ||||||
| Huadian Power International Corp. Ltd. | 124,000 | 103,165 | ||||||
| Huaneng Power International, Inc. | 84,000 | 99,465 | ||||||
| Huaneng Renewables Corp. Ltd. ‐ Class H | 708,000 | 256,620 | ||||||
| 852,354 | ||||||||
| Water (3.01%) | ||||||||
| Guangdong Investment Ltd. | 386,000 | 505,860 | ||||||
| TOTAL UTILITIES | 1,358,214 | |||||||
| TOTAL COMMON STOCKS | ||||||||
| (Cost $8,878,268) | 9,900,770 | |||||||
| PARTICIPATION NOTES (11.60%) | ||||||||
| CONSUMER, CYCLICAL (0.45%) | ||||||||
| Retail (0.45%) | ||||||||
Titan Co. Ltd., (Loan Participation Notes issued by Citigroup Global Markets Holdings Inc.),(a) expiring 02/12/2016 | 12,087 | 75,634 | ||||||
| TOTAL CONSUMER, CYCLICAL | 75,634 | |||||||
See Notes to Financial Statements.
| Semi-Annual Report | March 31, 2015 | 9 |
| GKE Asian Opportunities Fund | Portfolio of Investments |
March 31, 2015 (Unaudited)
| Value | ||||||||
| Shares | (Note 2) | |||||||
| FINANCIAL (7.09%) | ||||||||
| Banks (7.09%) | ||||||||
Axis Bank Ltd., (Loan Participation Notes issued by Citigroup Global Markets Holdings Inc.),(a) expiring 02/12/2016 | 50,184 | $ | 449,227 | |||||
Federal Bank Ltd., (Loan Participation Notes issued by Citigroup Global Markets Holdings, Inc.),(a) expiring 02/12/2016 | 91,649 | 193,389 | ||||||
Yes Bank Ltd., (Loan Participation Notes issued by Citigroup Global Markets Holdings Inc.),(a) expiring 02/12/2016 | 42,244 | 550,655 | ||||||
| 1,193,271 | ||||||||
| TOTAL FINANCIAL | 1,193,271 | |||||||
| INDUSTRIAL (0.62%) | ||||||||
| Miscellaneous Manufacturing (0.62%) | ||||||||
Largan Precision Co., (Loan Participation Notes issued by Macquarie Bank Ltd.),(a) expiring 07/25/2016 | 1,200 | 103,356 | ||||||
| TOTAL INDUSTRIAL | 103,356 | |||||||
| TECHNOLOGY (3.44%) | ||||||||
| Computers (0.54%) | ||||||||
King Slide Works Co, (Loan Participation Notes issued by Citigroup Global Markets Holdings Inc.),(a) expiring 01/20/2017 | 6,000 | 90,508 | ||||||
| Semiconductors (2.90%) | ||||||||
Taiwan Semiconductor, (Loan Participation Notes issued by Citigroup Global Markets Holdings Inc.),(a) expiring 01/17/2017 | 105,000 | 488,250 | ||||||
| TOTAL TECHNOLOGY | 578,758 | |||||||
| TOTAL PARTICIPATION NOTES | ||||||||
| (Cost $1,811,934) | 1,951,019 | |||||||
See Notes to Financial Statements.
| 10 | www.gkefund.com |
| GKE Asian Opportunities Fund | Portfolio of Investments |
March 31, 2015 (Unaudited)
| Currency | Principal Amount | Value (Note 2) | ||||||||
| CONTINGENT CONVERTIBLE CAPITAL (2.93%) | ||||||||||
| FINANCIAL (2.93%) | ||||||||||
| Banks (2.93%) | ||||||||||
| Industrial & Commercial Bank of China Ltd., Jr. Sub. Notes, Series 144A | ||||||||||
6.000% Perpetual Maturity (b)(c)(d) | CNY | $ | 3,000,000 | $ | 493,667 | |||||
| TOTAL FINANCIAL | 493,667 | |||||||||
| TOTAL CONTINGENT CONVERTIBLE CAPITAL | ||||||||||
| (Cost $487,805) | 493,667 | |||||||||
| CORPORATE BONDS (5.78%) | ||||||||||
| COMMUNICATIONS (3.86%) | ||||||||||
| Telecommunications (3.86%) | ||||||||||
| Optus Finance Proprietary Ltd., Sr. Unsec. | ||||||||||
| Notes | ||||||||||
| 4.750% 12/12/2018 | AUD | 800,000 | 649,365 | |||||||
| TOTAL COMMUNICATIONS | 649,365 | |||||||||
| FINANCIAL (1.92%) | ||||||||||
| Diversified Financial Services (1.92%) | ||||||||||
| Far East Horizon Ltd., Sr. Unsec. Notes | ||||||||||
| 5.500% 10/18/2015 | CNH | 2,000,000 | 322,682 | |||||||
| TOTAL FINANCIAL | 322,682 | |||||||||
| TOTAL CORPORATE BONDS | ||||||||||
| (Cost $1,045,452) | 972,047 | |||||||||
| GOVERNMENT BONDS (11.30%) | ||||||||||
| Indonesia Government International Bond, Sr. Unsec. Notes | ||||||||||
6.625% 02/17/2037 (e) | USD | 500,000 | 610,000 | |||||||
See Notes to Financial Statements.
| Semi-Annual Report | March 31, 2015 | 11 |
| GKE Asian Opportunities Fund | Portfolio of Investments |
March 31, 2015 (Unaudited)
| Principal | Value | ||||||||||
| Currency | Amount | (Note 2) | |||||||||
| GOVERNMENT BONDS (continued) | |||||||||||
| Philippine Government International Bond, Sr. Unsec. Notes | |||||||||||
| 9.875% 01/15/2019 | USD | $ | 1,000,000 | $ | 1,291,250 | ||||||
| TOTAL GOVERNMENT BONDS | |||||||||||
| (Cost $1,852,295) | 1,901,250 | ||||||||||
| 7-Day | Value | |||||||||||
| Yield | Shares | (Note 2) | ||||||||||
| SHORT‐TERM INVESTMENTS (0.95%) | ||||||||||||
| MONEY MARKET FUND (0.95%) | ||||||||||||
| Blackrock Liquidity Temporary Fund, Investor Class | 0.074 | % | 159,519 | 159,519 | ||||||||
| TOTAL SHORT‐TERM INVESTMENTS | ||||||||||||
| (Cost $159,519) | 159,519 | |||||||||||
TOTAL INVESTMENTS (91.41%) | ||||||||||||
| (Cost $14,235,273) | 15,378,272 | |||||||||||
| Other Assets In Excess Of Liabilities (8.59%) | 1,444,346 | (f) | ||||||||||
| NET ASSETS (100.00%) | $ | 16,822,618 | ||||||||||
| (a) | Non-income producing security. |
| (b) | This security has no contractual maturity date, is not redeemable and contractually pays an indefinite stream of interest. |
| (c) | Security exempt from registration under Rule 144A of the Securities Act of 1933, as amended (the “1933 Act”). These securities have been deemed liquid under procedures approved by the Fund’s Board of Trustees and may normally be sold to qualified institutional buyers in transactions exempt from registration. Total market Value of Rule 144A securities amounts to $493,667, which represents approximately 2.93% of the Fund’s net assets as March 31, 2015. |
| (d) | Floating or variable rate security. Interest rate disclosed is that which is in effect at March 31, 2015. |
| (e) | Securities were purchased pursuant to Regulation S under the 1933 Act, which exempts securities offered and sold outside of the United States from registration. Such securities cannot be sold in the United States without either an effective registration statement filed pursuant to the 1933 Act or pursuant to an exemption from registration. These securities have been deemed liquid under procedures approved by the Fund’s Board of Trustees. As of March 31, 2015, the aggregate market value of those securities was $610,000, representing 3.63% of the Fund’s net assets. |
See Notes to Financial Statements.
| 12 | www.gkefund.com |
| GKE Asian Opportunities Fund | Portfolio of Investments |
March 31, 2015 (Unaudited)
| (f) | Includes cash which is being held as collateral for futures contracts. |
| Common Abbreviations: |
| ADR - American Depositary Receipt. |
| Ltd. - Limited. |
| Jr. Junior |
| Sr. - Senior. |
| Sub. - Subordinated. |
| Unsec. - Unsecured. |
| Currency Abbreviations: |
| AUD - Australian Dollar |
| CNH - People’s Republic of China Renminbi |
| CNY - Chinese Yuan |
For Fund compliance purposes, the Fund’s industry classifications refer to any one or more of the industry sub-classifications used by one or more widely recognized market indices or ratings group indices, and/or as defined by Fund management. This definition may not apply for purposes of this report, which may combine industry sub-classifications for reporting ease. Industries are shown as a percentage of the Fund’s net assets. (Unaudited)
OUTSTANDING FORWARD FOREIGN CURRENCY CONTRACTS
Foreign Currency | Contracted Amount* | Purchase/Sale Contract | Settlement Date | Current Value | Unrealized Appreciation/(Depreciation) | |||||||||
| AUD | 900,000 | Sale | 04/07/2015 | $ | 685,195 | $ | 13,025 | |||||||
| $ | 13,025 | |||||||||||||
| * | The contracted amount is stated in the currency in which the security is denominated. |
FUTURES CONTRACTS
| Description | Position | Contracts | Expiration Date | Underlying Face Amount at Value(Note 2) | Unrealized Appreciation/(Depreciation) | |||||||||
| Hang Seng China Index | Long | 4 | 04/30/15 | $ | 2,478,200 | $ | 11,590 | |||||||
| $ | 2,478,200 | $ | 11,590 | |||||||||||
See Notes to Financial Statements.
| Semi-Annual Report | March 31, 2015 | 13 |
| GKE Asian Opportunities Fund | Statement of Assets and Liabilities |
March 31, 2015 (Unaudited)
| ASSETS: | ||||
| Investments, at value (Cost $14,235,273) | $ | 15,378,272 | ||
| Foreign currency, at value (Cost $1,318,681) | 1,309,775 | |||
| Receivable for investments sold | 102,965 | |||
| Deposit with broker for futures contracts (Note 3) | 100,000 | |||
| Unrealized gain on forward foreign currency contracts | 13,025 | |||
| Dividends and interest receivable | 81,805 | |||
| Receivable from variation margin | 11,590 | |||
| Other assets | 10,935 | |||
| Total assets | 17,008,367 | |||
| LIABILITIES: | ||||
| Payable for investments purchased | 118,794 | |||
| Payable for administration fees | 18,860 | |||
| Payable for transfer agency fees | 4,148 | |||
| Payable to trustees | 85 | |||
| Payable to Chief Compliance Officer | 1,645 | |||
| Due to broker | 15,008 | |||
| Legal fees payable | 7,087 | |||
| Audit and tax fees payable | 12,261 | |||
| Accrued expenses and other liabilities | 7,861 | |||
| Total liabilities | 185,749 | |||
| NET ASSETS | $ | 16,822,618 | ||
| NET ASSETS CONSIST OF: | ||||
| Paid‐in capital (Note 6) | $ | 15,627,239 | ||
| Accumulated net investment loss | (78,412 | ) | ||
| Accumulated net realized gain on investments, futures contracts and foreign currency transactions | 115,843 | |||
| Net unrealized appreciation on investments, futures contracts and translation of assets and liabilities denominated in foreign currencies | 1,157,948 | |||
| NET ASSETS | $ | 16,822,618 | ||
| PRICING OF SHARES: | ||||
| Net Asset Value, offering and redemption price per share | $ | 11.35 | ||
| Shares of beneficial interest outstanding | 1,482,405 | |||
See Notes to Financial Statements.
| 14 | www.gkefund.com |
| GKE Asian Opportunities Fund | Statement of Operations |
For the Six Months Ended March 31, 2015 (Unaudited)
| INVESTMENT INCOME: | ||||
| Dividends | $ | 46,015 | ||
| Foreign taxes withheld | (4,092 | ) | ||
| Interest | 62,400 | |||
| Total investment income | 104,323 | |||
| EXPENSES: | ||||
| Investment advisory fees (Note 7) | 96,994 | |||
| Administrative fees | 73,423 | |||
| Transfer agency fees | 17,291 | |||
| Legal and audit fees | 19,936 | |||
| Registration fees | 8,841 | |||
| Custodian fees | 15,278 | |||
| Compliance fees | 9,978 | |||
| Trustees’ fees and expenses | 4,527 | |||
| Other expenses | 8,402 | |||
| Total Expenses | 254,670 | |||
| Less fees waived/reimbursed by investment adviser (Note 7) | (137,631 | ) | ||
| Net Expenses | 117,039 | |||
| NET INVESTMENT LOSS | (12,716 | ) | ||
| REALIZED AND UNREALIZED GAIN/(LOSS) ON INVESTMENTS: | ||||
| Net realized gain/(loss) on: | ||||
| Investments | (48,413 | ) | ||
| Futures contracts | 100,692 | |||
| Forward hedge contracts | 34,232 | |||
| Foreign currency transactions | 167,650 | |||
| Net realized gain | 254,161 | |||
| Net Change in appreciation/(depreciation) on: | ||||
| Investments | 902,210 | |||
| Futures contracts | 5,484 | |||
| Forward hedge contracts | (29,613 | ) | ||
| Translation of assets and liabilities denominated in foreign currencies | (6,795 | ) | ||
| Net Change | 871,286 | |||
| NET REALIZED AND UNREALIZED GAIN ON INVESTMENTS | 1,125,447 | |||
| NET INCREASE IN NET ASSETS RESULTING FROM OPERATIONS | $ | 1,112,731 | ||
See Notes to Financial Statements.
| Semi-Annual Report | March 31, 2015 | 15 |
| GKE Asian Opportunities Fund | Statements of Changes in Net Assets |
| For the Six | For the | |||||||
| Months Ended | Year Ended | |||||||
| March 31, 2015 | September 30, | |||||||
| (Unaudited) | 2014 | |||||||
| OPERATIONS: | ||||||||
| Net investment income/(loss) | $ | (12,716 | ) | $ | 53,160 | |||
| Net realized gain/(loss) on investments, futures contracts and foreign currency transactions | 254,161 | (30,891 | ) | |||||
| Net change in unrealized appreciation on investments, futures contracts and translation of assets and liabilities denominated in foreign currencies | 871,286 | 223,724 | ||||||
| Net increase in net assets resulting from operations | 1,112,731 | 245,993 | ||||||
| DISTRIBUTIONS: | ||||||||
| From net investment income | (256,420 | ) | (2,146 | ) | ||||
| From net realized gains on investments | — | (40,567 | ) | |||||
| Net decrease in net assets from distributions | (256,420 | ) | (42,713 | ) | ||||
| BENEFICIAL SHARE TRANSACTIONS (Note 6): | ||||||||
| Shares sold | 4,745,577 | 9,797,904 | ||||||
| Dividends reinvested | 163,710 | 29,943 | ||||||
| Shares redeemed | (289,170 | ) | (1,169,307 | ) | ||||
| Redemption fees | — | 473 | ||||||
| Net increase from capital share transactions | 4,620,117 | 8,659,013 | ||||||
| Net increase in net assets | 5,476,428 | 8,862,293 | ||||||
| NET ASSETS: | ||||||||
| Beginning of period | 11,346,190 | 2,483,897 | ||||||
| End of period (Including accumulated net investment income/(loss) of $(78,412) and $190,724) | $ | 16,822,618 | $ | 11,346,190 | ||||
See Notes to Financial Statements.
| 16 | www.gkefund.com |
| GKE Asian Opportunities Fund | Financial Highlights |
For a share outstanding through the periods presented.
| For the Six | For the Year | For the Period | ||||||||||
| Months Ended | Ended | Ended | ||||||||||
| March 31, 2015 | September 30, | September 30, | ||||||||||
| (Unaudited) | 2014 | 2013(a) | ||||||||||
| NET ASSET VALUE, BEGINNING OF PERIOD | $ | 10.69 | $ | 10.38 | $ | 10.00 | ||||||
| INCOME/(LOSS) FROM OPERATIONS: | ||||||||||||
Net investment income/(loss)(b) | (0.01 | ) | 0.05 | 0.00 | (c) | |||||||
| Net realized and unrealized gain on investments | 0.91 | 0.30 | 0.38 | |||||||||
| Total from investment operations | 0.90 | 0.35 | 0.38 | |||||||||
| LESS DISTRIBUTIONS: | ||||||||||||
| From net investment income | (0.24 | ) | (0.00 | )(c) | — | |||||||
| From net realized gain on investments | — | (0.04 | ) | — | ||||||||
| Total distributions | (0.24 | ) | (0.04 | ) | — | |||||||
| REDEMPTION FEES (Note 6) | — | 0.00 | (c) | — | ||||||||
| NET INCREASE IN NET ASSET VALUE | 0.66 | 0.31 | 0.38 | |||||||||
| NET ASSET VALUE, END OF PERIOD | $ | 11.35 | $ | 10.69 | $ | 10.38 | ||||||
TOTAL RETURN(d) | 8.62 | % | 3.37 | % | 3.80 | % | ||||||
| SUPPLEMENTAL DATA: | ||||||||||||
| Net assets, end of period (000’s) | $ | 16,823 | $ | 11,346 | $ | 2,484 | ||||||
| RATIOS TO AVERAGE NET ASSETS | ||||||||||||
| Operating expenses excluding reimbursement/waiver | 3.94 | %(e) | 4.93 | % | 23.95 | %(e) | ||||||
| Operating expenses including reimbursement/waiver | 1.81 | %(e) | 1.81 | % | 1.81 | %(e) | ||||||
| Net investment income/(loss) including reimbursement/waiver | (0.20 | )%(e) | 0.51 | % | 0.10 | %(e) | ||||||
| PORTFOLIO TURNOVER RATE | 78 | %(f) | 219 | % | 22 | %(f) | ||||||
(a) | Commenced operations on August 5, 2013. |
(b) | Per share amounts are based upon average shares outstanding. |
(c) | Less than $0.005 per share. |
(d) | Total returns are for the period indicated and have not been annualized. Total returns would have been lower had certain expenses not been reimbursed/waived during the period. Returns shown do not reflect the deduction of taxes that a shareholder would pay on Fund distributions or the redemption of Fund shares. |
(e) | Annualized. |
(f) | Not annualized. |
See Notes to Financial Statements.
| Semi-Annual Report | March 31, 2015 | 17 |
| GKE Asian Opportunities Fund | Notes to Financial Statements |
March 31, 2015 (Unaudited)
1. ORGANIZATION
ALPS Series Trust (the “Trust”), a Delaware statutory trust, is an open-end management investment company registered under the Investment Company Act of 1940, as amended (the “1940 Act”). As of March 31, 2015, the Trust had nine registered funds. This semi-annual report describes the GKE Asian Opportunities Fund (the “Fund”). The Fund’s primary investment objective is to achieve capital appreciation through asset allocation among equities, currencies and bonds of the Asia-Pacific region. The Fund currently offers Institutional Class shares. The Board of Trustees (the “Board”) may establish additional funds and classes of shares at any time in the future without shareholder approval.
2. SIGNIFICANT ACCOUNTING POLICIES
The accompanying financial statements were prepared in accordance with accounting principles generally accepted in the United States of America for investment companies (“U.S. GAAP”). The Fund is considered an investment company for financial reporting purposes. The preparation of financial statements in conformity with U.S. GAAP requires management to make certain estimates and assumptions that affect the reported amounts of assets and liabilities and disclosures of contingent assets and liabilities at the date of the financial statements and the reported amounts of revenue and expenses during the period. Actual results could differ from those estimates. The following is a summary of significant accounting policies consistently followed by the Fund in preparation of the financial statements.
Investment Valuation: The Fund generally values its securities based on market prices determined at the close of regular trading on the New York Stock Exchange (“NYSE”), normally 4:00 p.m. Eastern Time, on each day the NYSE is open for trading.
For equity securities and mutual funds that are traded on an exchange, the market price is usually the closing sale or official closing price on that exchange. In the case of equity securities not traded on an exchange, or if such closing prices are not otherwise available, the securities are valued at the mean of the most recent bid and ask prices on such day.
Equity securities that are primarily traded on foreign securities exchanges are valued at the closing values of such securities on their respective foreign exchanges, except when an event occurs subsequent to the close of the foreign exchange and the close of the NYSE that was likely to have changed such value. In such an event, the fair values of those securities are determined in good faith through consideration of other factors in accordance with procedures established by and under the general supervision of the Board. The Fund will use a fair valuation model provided by an independent pricing service, which is intended to reflect fair value when a security’s value or a meaningful portion of the Fund’s portfolio is believed to have been materially affected by a valuation event that has occurred between the close of the exchange or market on which the security is traded and the close of the regular trading day on the NYSE.
The market price for debt obligations is generally the price supplied by an independent third-party pricing service approved by the Board, which may use a matrix, formula or other objective method that takes into consideration quotations from dealers, market transactions in comparable investments, market indices and yield curves. If vendors are unable to supply a price, or if the
| 18 | www.gkefund.com |
| GKE Asian Opportunities Fund | Notes to Financial Statements |
March 31, 2015 (Unaudited)
price supplied is deemed to be unreliable, the market price may be determined using quotations received from one or more broker dealers that make a market in the security. Investments in non-exchange traded funds are fair valued at their respective net asset values.
Redeemable securities issued by open-end registered investment companies are valued at the investment company’s applicable net asset value, with the exception of exchange-traded open-end investment companies, which are priced as equity securities.
Futures contracts that are listed or traded on a national securities exchange, commodities exchange, contract market or comparable over the counter market, and that are freely transferable, are valued at their closing settlement price on the exchange on which they are primarily traded or based upon the current settlement price for a like instrument acquired on the day on which the instrument is being valued. A settlement price may not be used if the market makes a limit move with respect to a particular commodity.
Forward foreign currency contracts have a market value determined by the prevailing foreign currency exchange daily rates and current foreign currency exchange forward rates. The foreign currency exchange forward rates are calculated using an automated system that estimates rates on the basis of the current day foreign currency exchange rates and forward foreign currency exchange rates supplied by a pricing service. Foreign exchange rates and forward foreign currency exchange rates may generally be obtained at the close of the NYSE, normally 4:00 p.m. Eastern Time.
When such prices or quotations are not available, or when the fair value committee appointed by the Board believes that they are unreliable, securities may be priced using fair value procedures approved by the Board.
Fair Value Measurements: The Fund discloses the classification of its fair value measurements following a three-tier hierarchy based on the inputs used to measure fair value. Inputs refer broadly to the assumptions that market participants would use in pricing the asset or liability, including assumptions about risk. Inputs may be observable or unobservable. Observable inputs reflect the assumptions market participants would use in pricing the asset or liability that are developed based on market data obtained from sources independent of the reporting entity. Unobservable inputs reflect the reporting entity’s own assumptions about the assumptions market participants would use in pricing the asset or liability that are developed based on the best information available.
Various inputs are used in determining the value of the Fund’s investments as of the end of the reporting period. When inputs used fall into different levels of the fair value hierarchy, the level in the hierarchy within which the fair value measurement falls is determined based on the lowest level input that is significant to the fair value measurement in its entirety. The designated input levels are not necessarily an indication of the risk or liquidity associated with these investments. These inputs are categorized in the following hierarchy under applicable financial accounting standards:
| Level 1 – | Unadjusted quoted prices in active markets for identical investments, unrestricted assets or liabilities that the Fund has the ability to access at the measurement date; |
| Level 2 – | Quoted prices which are not active, quoted prices for similar assets or liabilities in active markets or inputs other than quoted prices that are observable (either directly or indirectly) for substantially the full term of the asset or liability; and |
| Semi-Annual Report | March 31, 2015 | 19 |
| GKE Asian Opportunities Fund | Notes to Financial Statements |
March 31, 2015 (Unaudited)
| Level 3 – | Significant unobservable prices or inputs (including the Fund’s own assumptions in determining the fair value of investments) where there is little or no market activity for the asset or liability at the measurement date. |
The following is a summary of the inputs used to value the Fund’s investments as of March 31, 2015:
| Level 2 - Other | Level 3 - | |||||||||||||||
| Level 1 - | Significant | Significant | ||||||||||||||
| Unadjusted | Observable | Unobservable | ||||||||||||||
| Investments in Securities at Value | Quoted Prices | Inputs | Inputs | Total | ||||||||||||
| Common Stocks | ||||||||||||||||
| Communications | $ | 914,667 | $ | — | $ | — | $ | 914,667 | ||||||||
| Consumer, Cyclical | 1,109,357 | — | — | 1,109,357 | ||||||||||||
| Consumer, Non‐cyclical | 252,185 | — | — | 252,185 | ||||||||||||
| Diversified | 62,636 | — | — | 62,636 | ||||||||||||
| Financial | 3,145,573 | — | — | 3,145,573 | ||||||||||||
| Industrial | 2,924,357 | — | — | 2,924,357 | ||||||||||||
| Technology | 133,781 | — | — | 133,781 | ||||||||||||
| Utilities | 1,358,214 | — | — | 1,358,214 | ||||||||||||
| Participation Notes | ||||||||||||||||
| Consumer, Cyclical | — | 75,634 | — | 75,634 | ||||||||||||
| Financial | — | 1,193,271 | — | 1,193,271 | ||||||||||||
| Industrial | — | 103,356 | — | 103,356 | ||||||||||||
| Technology | — | 578,758 | — | 578,758 | ||||||||||||
| Contingent Convertible Capital | — | 493,667 | — | 493,667 | ||||||||||||
| Corporate Bonds | ||||||||||||||||
| Communications | — | 649,365 | — | 649,365 | ||||||||||||
| Financial | — | 322,682 | — | 322,682 | ||||||||||||
| Government Bonds | — | 1,901,250 | — | 1,901,250 | ||||||||||||
| Short‐Term Investments | 159,519 | — | — | 159,519 | ||||||||||||
| TOTAL | $ | 10,060,289 | $ | 5,317,983 | $ | — | $ | 15,378,272 | ||||||||
| Valuation Inputs | ||||||||||||||||
| Other Financial Instruments | Level 1 | Level 2 | Level 3 | Total | ||||||||||||
| Assets | ||||||||||||||||
| Forward Foreign Currency Contracts | $ | — | $ | 13,025 | $ | — | $ | 13,025 | ||||||||
| Futures Contracts | 11,590 | — | — | 11,590 | ||||||||||||
| TOTAL | $ | 11,590 | $ | 13,025 | $ | — | $ | 24,615 | ||||||||
The Fund recognizes transfers between levels as of the end of the period. For the period ended March 31, 2015, the Fund did not have any transfers between Level 1 and Level 2 securities. There were no Level 3 securities held during the period.
Trust Expenses: Some expenses of the Trust can be directly attributed to the Fund. Expenses which cannot be directly attributed to the Fund are apportioned among all funds in the Trust based on average net assets of each fund.
| 20 | www.gkefund.com |
| GKE Asian Opportunities Fund | Notes to Financial Statements |
March 31, 2015 (Unaudited)
Federal Income Taxes: The Fund complies with the requirements under Subchapter M of the Internal Revenue Code of 1986, as amended, applicable to regulated investment companies and intends to distribute substantially all of its net taxable income and net capital gains, if any, each year so that it will not be subject to excise tax on undistributed income and gains. The Fund is not subject to income taxes to the extent such distributions are made.
As of and during the period ended March 31, 2015, the Fund did not have a liability for any unrecognized tax benefits in the accompanying financial statements. The Fund files U.S. federal, state and local income tax returns as required. The Fund’s tax returns are subject to examination by the relevant tax authorities until expiration of the applicable statute of limitations, which is generally three years after the filing of the tax return for federal purposes and four years for most state returns. The Fund’s administrator has analyzed the Fund’s tax positions taken on federal and state income tax returns for all open tax years and has concluded that as of March 31, 2015, no provision for income tax is required in the Fund’s financial statements related to these
tax positions.
tax positions.
Investment Transactions and Investment Income: Investment transactions are accounted for on the date the investments are purchased or sold (trade date basis). Realized gains and losses from investment transactions are reported on an identified cost basis. Interest income, which includes accretion of discounts and amortization of premiums, is accrued and recorded as earned. Dividend income is recognized on the ex-dividend date, or for certain foreign securities, as soon as information is available to the Fund.
Foreign Securities: The Fund may directly purchase securities of foreign issuers. Investing in securities of foreign issuers involves special risks not typically associated with investing in securities of U.S. issuers. The risks include possible reevaluation of currencies, the inability to repatriate foreign currency, less complete financial information about companies and possible future adverse political and economic developments. Moreover, securities of many foreign issuers and their markets may be less liquid and their prices more volatile than those of securities of comparable U.S. issuers.
Foreign Currency Translation: The books and records of the Fund are maintained in U.S. dollars. Investment valuations and other assets and liabilities initially expressed in foreign currencies are converted each business day into U.S. dollars based upon current exchange rates. The portion of realized and unrealized gains or losses on investments due to fluctuations in foreign currency exchange rates is not separately disclosed and is included in realized and unrealized gains or losses on investments, when applicable.
Foreign Exchange Transactions: The Fund may enter into foreign currency spot contracts to facilitate transactions in foreign securities or to convert foreign currency receipts into U.S. dollars. A foreign currency spot contract is an agreement between two parties to buy and sell currencies at the current market rate, for settlement generally within two business days. The U.S. dollar value of the contracts is determined using current currency exchange rates supplied by a pricing service. The contract is marked-to-market daily for settlements beyond one day and any change in market value is recorded as an unrealized gain or loss. When the contract is closed, the Fund records a realized gain or loss equal to the difference between the value on the open and close date. Losses may arise from changes in the value of the foreign currency, or if the counterparties do not
| Semi-Annual Report | March 31, 2015 | 21 |
| GKE Asian Opportunities Fund | Notes to Financial Statements |
March 31, 2015 (Unaudited)
perform under the contract’s terms. The maximum potential loss from such contracts is the aggregate face value in U.S. dollars at the time the contract was opened.
Distributions to Shareholders: The Fund normally pays dividends and distributes capital gains, if any, on an annual basis. Income dividend distributions are derived from interest and other income the Fund receives from its investments, including distributions of short term capital gains. Long term capital gain distributions are derived from gains realized when the Fund sells a security it has owned for more than one year. The Fund may make additional distributions and dividends at other times if its portfolio manager or managers believe doing so may be necessary for the Fund to avoid or reduce taxes. Net investment income/(loss) and net realized gain/(loss) may differ for financial statement and tax purposes.
3. DERIVATIVE INSTRUMENTS
The Fund’s investment objective permits the Fund to enter into various types of derivatives contracts, including, but not limited to, futures contracts, forward foreign currency contracts, currency swaps and purchased and written options. In doing so, the Fund will employ strategies in differing combinations to permit it to increase, decrease, or change the level or types of exposure to market factors. Central to those strategies are features inherent in derivatives that make them more attractive for this purpose than equity or debt securities; they require little or no initial cash investment, they can focus exposure on only certain selected risk factors, and they may not require the ultimate receipt or delivery of the underlying security (or securities) to the contract. This may allow the Fund to pursue its objectives more quickly and efficiently than if it were to make direct purchases or sales of securities capable of affecting a similar response to market factors.
Risk of Investing in Derivatives: The Fund’s use of derivatives can result in losses due to unanticipated changes in the market risk factors and the overall market. In instances where the Fund is using derivatives to decrease, or hedge, exposures to market risk factors for securities held by the Fund, there are also risks that those derivatives may not perform as expected resulting in losses for the combined or hedged positions.
Derivatives may have little or no initial cash investment relative to their market value exposure and therefore can produce significant gains or losses in excess of their cost. This use of embedded leverage allows the Fund to increase its market value exposure relative to its net assets and can substantially increase the volatility of the Fund’s performance.
Additional associated risks from investing in derivatives also exist and potentially could have significant effects on the valuation of the derivative and the Fund. Typically, the associated risks are not the risks that the Fund is attempting to increase or decrease exposure to, per its investment objective, but are the additional risks from investing in derivatives.
Examples of these associated risks are liquidity risk, which is the risk that the Fund will not be able to sell or close out the derivative in a timely manner, and counterparty credit risk, which is the risk that the counterparty will not fulfill its obligation to the Fund. In addition, use of derivatives may increase or decrease exposure to the following risk factors:
| 22 | www.gkefund.com |
| GKE Asian Opportunities Fund | Notes to Financial Statements |
March 31, 2015 (Unaudited)
Equity Risk: Equity risk relates to the change in value of equity securities as they relate to increases or decreases in the general market. Associated risks can be different for each type of derivative and are discussed by each derivative type in the notes that follow.
Foreign Currency Risk: Currency trading involves significant risks, including market risk, interest rate risk, country risk, counterparty credit risk and short sale risk. Market risk results from the price movement of foreign currency values in response to shifting market supply and demand.
Forward Foreign Currency Contracts: The Fund invests in foreign currency exchange contracts to reduce the risks of fluctuating exchange rates and to generate returns uncorrelated to the other strategies employed. A forward foreign currency exchange contract involves an obligation to purchase or sell a specific currency at a future date, which may be a fixed number of days from the date of the contract agreed upon by the parties, at a price set at the time of the contract. By entering into a forward foreign currency exchange contract, the Fund “locks in” the exchange rate between the currency it will deliver and the currency it will receive for the duration of the contract. As a result, the Fund reduces its exposure to changes in the value of the currency it will deliver and increases its exposure to changes in the value of the currency it will exchange into. The Fund may enter into these contracts for the purpose of hedging against foreign exchange risk arising from the Fund’s investment or anticipated investment in securities denominated in foreign currencies. The Fund also may enter into these contracts for purposes of increasing exposure to a foreign currency or to shift exposure to foreign currency fluctuations from one country to another. The Fund may use one currency (or a basket of currencies) to hedge against adverse changes in the value of another currency (or a basket of currencies) when exchange rates between the two currencies are positively correlated. The unrealized appreciation/(depreciation) is reported in the Statement of Assets and Liabilities as receivable or payable and in the Statement of Operations within the change in unrealized appreciation/(depreciation). At contract close, the difference between the original cost of the contract and the value at the close date is recorded as a realized gain/(loss) in the Statement of Operations. As of March 31, 2015, the Fund held forward foreign currency contracts with net unrealized appreciation of $13,025.
Futures: The Fund may invest in futures contracts in accordance with its investment objectives. The Fund does so for a variety of reasons including for cash management, hedging or non-hedging purposes in an attempt to achieve investment returns consistent with the Fund’s investment objective. A futures contract provides for the future sale by one party and purchase by another party of a specified quantity of the security or other financial instrument at a specified price and time. A futures contract on an index is an agreement pursuant to which two parties agree to take or make delivery of an amount of cash equal to the difference between the value of the index at the close of the last trading day of the contract and the price at which the index contract was originally written. Futures transactions may result in losses in excess of the amount invested in the futures contract. There can be no guarantee that there will be a correlation between price movements in the hedging vehicle and in the portfolio securities being hedged. An incorrect correlation could result in a loss on both the hedged securities in a Fund and the hedging vehicle so that the portfolio return might have been greater had hedging not been attempted. There can be no assurance that a liquid market will exist at a time when a Fund seeks to close out a futures contract or a futures option position. Lack of a liquid market for any reason may prevent a Fund from liquidating an unfavorable position, and the Fund would remain obligated to meet margin
| Semi-Annual Report | March 31, 2015 | 23 |
| GKE Asian Opportunities Fund | Notes to Financial Statements |
March 31, 2015 (Unaudited)
requirements until the position is closed. In addition, a Fund could be exposed to risk if the counterparties to the contracts are unable to meet the terms of their contracts. With exchange traded futures, there is minimal counterparty credit risk to the Fund since futures are exchange traded and the exchange’s clearinghouse, as counterparty to all exchange traded futures, guarantees the futures against default. When a purchase or sale of a futures contract is made by a Fund, the Fund is required to deposit with its custodian (or broker, if legally permitted) a specified amount of liquid assets (“initial margin”). The margin required for a futures contract is set by the exchange on which the contract is traded and may be modified during the term of the contract. The initial margin is in the nature of a performance bond or good faith deposit on the futures contract that is returned to a Fund upon termination of the contract, assuming all contractual obligations have been satisfied. Each day a Fund may pay or receive cash, called “variation margin,” equal to the daily change in value of the futures contract. Such payments or receipts are recorded for financial statement purposes as unrealized gains or losses by a Fund. Variation margin does not represent a borrowing or loan by a Fund but is instead a settlement between a Fund and the broker of the amount one would owe the other if the futures contract expired. When the contract is closed, a Fund records a realized gain or loss equal to the difference between the value of the contract at the time it was opened and the value at the time it was closed. As of March 31, 2015, the Fund had futures contracts outstanding with net unrealized appreciation of $11,590. The number of futures contracts held at March 31, 2015, as disclosed in the Portfolio of Investments, is representative of futures contracts activity during the period ended March 31, 2015.
Derivative Instruments: The following tables disclose the amounts related to the Fund’s use of derivative instruments.
The effect of derivative instruments on the Statement of Assets and Liabilities as of March 31, 2015:
| Liability | ||||||||||
| Derivatives Not | Asset Derivatives | Derivatives | ||||||||
| Accounted for As | Statement of Assets | Statement of | ||||||||
| Hedging | and Liabilities | Assets and | ||||||||
| Instruments | Location | Fair Value | Liabilities Location | Fair Value | ||||||
| Foreign Exchange Contracts (Forward foreign currency contracts) | Unrealized gain on forward foreign currency contracts | $ | 13,025 | Unrealized loss on forward foreign currency contracts | $ | — | ||||
| Equity Contracts (Futures contracts) | Receivable from variation margin | 11,590 | Payable for variation margin | — | ||||||
| Total | $ | 24,615 | $ | — | ||||||
| 24 | www.gkefund.com |
| GKE Asian Opportunities Fund | Notes to Financial Statements |
March 31, 2015 (Unaudited)
The effect of derivative instruments on the Statement of Operations for the period ended March 31, 2015:
| Realized | Change in | |||||||||
| Gain/(Loss) | Unrealized | |||||||||
| Derivatives Not | On | Gain/(Loss) | ||||||||
| Accounted for As | Location of Gains/(Losses) On | Derivatives | on Derivatives | |||||||
| Hedging Instruments | Derivatives Recognized in Income | Recognized | Recognized | |||||||
| Foreign Exchange Contracts (Forward foreign currency contracts) | Net realized gain/(loss) on: Forward hedge contracts / Net Change in appreciation/(depreciation) on: Forward hedge contracts | $ | 34,232 | $ | (29,613 | ) | ||||
| Equity Contracts (Futures contracts) | Net realized gain/(loss) on: Futures contracts / Net Change in appreciation/(depreciation) on: Futures contracts | 100,692 | 5,484 | |||||||
| Total | $ | 134,924 | $ | (24,129 | ) | |||||
4. TAX BASIS INFORMATION
Tax Basis of Distributions to Shareholders: The character of distributions made during the period from net investment income or net realized gains may differ from its ultimate characterization for federal income tax purposes. Also, due to the timing of dividend distributions, the fiscal year in which amounts are distributed may differ from the fiscal year in which the income or realized gain were recorded by the Fund. The amounts and characteristics of tax basis distributions and composition of distributable earnings/(accumulated losses) are finalized at fiscal year‐end. Accordingly, tax basis balances have not been determined as of the date of the semi-annual.
The tax character of distributions paid by the Fund for the fiscal year ended September 30, 2014 were as follows:
| Ordinary Income | Long-Term Capital Gain | |||||||
| $ | 42,713 | $ | — | |||||
Unrealized Appreciation and Depreciation on Investments: As of March 31, 2015, the aggregate cost of investments, gross unrealized appreciation/(depreciation) and net unrealized appreciation for Federal tax purposes were as follows:
| Gross unrealized appreciation (excess of value over tax cost) | $ | 1,315,457 | ||
| Gross unrealized depreciation (excess of tax cost over value) | (214,663 | ) | ||
| Net unrealized appreciation | $ | 1,100,794 | ||
| Cost of investments for income tax purposes | $ | 14,277,478 |
| Semi-Annual Report | March 31, 2015 | 25 |
| GKE Asian Opportunities Fund | Notes to Financial Statements |
March 31, 2015 (Unaudited)
5. SECURITIES TRANSACTIONS
Purchases and sales of securities, excluding short‐term securities, during the period ended March 31, 2015 were as follows:
| Proceeds from Sales of | ||||||||
| Purchases of Securities | Securities | |||||||
| $ | 13,408,331 | $ | 8,918,936 | |||||
6. BENEFICIAL SHARE TRANSACTIONS
The capitalization of the Trust consists of an unlimited number of shares of beneficial interest with no par value per share. Holders of the shares of the Fund have one vote for each share held and a proportionate fraction of a vote for each fractional share. All shares issued and outstanding are fully paid and are non‐assessable, transferable and redeemable at the option of the shareholder. Shares have no pre‐emptive rights.
Shares redeemed within 45 calendar days of purchase may incur a 2% short‐term redemption fee deducted from the redemption amount. For the fiscal year ended March 31, 2015, the redemption fees charged by the Fund are presented in the Statements of Changes in Net Assets.
For the Six Months Ended | For the Year Ended September 30, 2014 | |||||||
| Shares Sold | 432,869 | 932,878 | ||||||
| Shares issued in reinvestment of distributions to shareholders | 15,503 | 2,862 | ||||||
| Shares Redeemed | (26,930 | ) | (113,990 | ) | ||||
| Net increase from share transactions | 421,442 | 821,750 | ||||||
Control is defined by the 1940 Act as the beneficial ownership, either directly or through one or more controlled companies, of more than 25% of the voting securities of a company. Approximately 98% of the shares outstanding are held within two omnibus accounts. Investment activities of these shareholders could have a material impact on the Fund.
7. MANAGEMENT AND RELATED PARTY TRANSACTIONS
Investment Advisory: Evergreen Capital Management, LLC (“Evergreen Capital” or the “Adviser”), subject to the authority of the Board, is responsible for the overall management and administration of the Fund’s business affairs. The Adviser has delegated daily management of the Fund to GaveKal Capital Limited (the “Sub-Adviser”). The Sub-Adviser manages the investments of the Fund in accordance with the Fund’s investment objective, policies and limitations and investment guidelines established by the Adviser and the Board.
| 26 | www.gkefund.com |
| GKE Asian Opportunities Fund | Notes to Financial Statements |
March 31, 2015 (Unaudited)
Pursuant to the Investment Advisory Agreement with the Adviser (the “Advisory Agreement”), the Fund pays the Adviser an annual management fee of 1.50% based on the Fund’s average daily net assets, computed daily and payable monthly. Pursuant to an Investment Sub-Advisory Agreement (the “Sub-Advisor” Agreement) with the Sub-Adviser, the Adviser pays the Sub-Adviser an annual sub-advisory management fee of 0.825% based on the Fund’s average daily net assets, computed daily and payable monthly. The Adviser is required to pay all fees due to the Sub-Adviser out of the management fee the Adviser receives from the Fund. The initial term for both the Advisory Agreement and the Sub-Advisory Agreement is two years. The Board may extend the Advisory Agreement and/or the Sub-Advisory Agreement for additional one-year terms. The Board, shareholders of the Fund or the Adviser may terminate the Advisory Agreement or the
Sub-Advisory Agreement upon 60 days’ notice.
Sub-Advisory Agreement upon 60 days’ notice.
Pursuant to a fee waiver letter agreement (the “Fee Waiver Agreement”), the Adviser has contractually agreed to waive and/or reimburse fees or expenses in order to limit the Total Annual Fund Operating Expenses After Fee Waiver/Expense reimbursement to 1.81% of the Fund’s average daily net assets for the Institutional Class Shares. The obligation excludes brokerage expenses, interest expenses, taxes and extraordinary expenses. The Fee Waiver Agreement is in effect through January 31, 2016 and may not be terminated or modified prior to this date except with the approval of the Fund’s Board. The Adviser will be permitted to recover expenses it has borne through the Fee Waiver Agreement to the extent that the Fund’s expenses in later periods fall below the annual rates set forth in the Fee Waiver Agreement. The Fund will not be obligated to pay any such deferred fees and expenses more than three years after the end of the fiscal year(s) in which the fees and expenses were deferred.
For the six-month period ended March 31, 2015, the fee waivers and/or reimbursements were $137,631.
As of March 31, 2015, the balance of recoupable expenses was $497,756, of which $53,646 expires in 2016, $306,479 expires in 2017 and $137,631 expires in 2018.
Administrator: ALPS Fund Services, Inc. (“ALPS”) (an affiliate of ALPS Distributors, Inc.) serves as administrator to the Fund. The Fund has agreed to pay expenses incurred in connection with its administrative activities. Pursuant to the Administration, Bookkeeping and Pricing Services Agreement with the Trust, ALPS will provide operational services to the Fund including, but not limited to, fund accounting and fund administration and generally assist in the Fund’s operations. The Fund’s administration fee is accrued on a daily basis and paid on a monthly basis following the end of the month. The officers of the Trust are employees of ALPS. Administration fees paid by the Fund for the six months ended March 31, 2015 are disclosed in the Statement of Operations.
ALPS is reimbursed by the Fund for certain out-of-pocket expenses.
Transfer Agent: ALPS serves as transfer agent for the Fund under a Transfer Agency and Services Agreement with the Trust. Under this agreement, ALPS is paid an annual fee for services performed on behalf of the Fund plus fees for open accounts and is reimbursed for certain out-of-pocket expenses.
| Semi-Annual Report | March 31, 2015 | 27 |
| GKE Asian Opportunities Fund | Notes to Financial Statements |
March 31, 2015 (Unaudited)
Compliance Services: ALPS provides services as the Fund’s Chief Compliance Officer to monitor and test the policies and procedures of the Fund in conjunction with requirements of Rule 38a-1 of the 1940 Act pursuant to a Chief Compliance Officer Services Agreement with the Trust. Under this agreement, ALPS is paid an annual fee for services performed on behalf of the Fund and is reimbursed for certain out-of-pocket expenses.
Distribution: ALPS Distributors, Inc. (the “Distributor”) (an affiliate of ALPS) acts as the principal underwriter of the Fund’s shares pursuant to a Distribution Agreement with the Trust. Shares of the Fund are offered on a continuous basis through the Distributor, as agent of the Fund. The Distributor is not obligated to sell any particular amount of shares and is not entitled to any compensation for its services as the Fund’s principal underwriter pursuant to the Distribution Agreement.
8. TRUSTEES
As of March 31, 2015, there were four Trustees, three of whom are not “interested persons” (as defined in the 1940 Act) of the Trust (the “Independent Trustees”). The Independent Trustees receive a quarterly retainer of $4,000, plus $2,000 for each regular Board or Committee meeting attended, $2,000 for each special telephonic Board or Committee meeting attended and $2,000 for each special in-person Board meeting attended. The Independent Trustees are also reimbursed for all reasonable out-of-pocket expenses relating to attendance at meetings and for meeting-related expenses. Officers of the Trust and Trustees who are interested persons of the Trust receive no salary or fees from the Trust.
9. INDEMNIFICATIONS
Under the Trust’s organizational documents, its officers and Trustees are indemnified against certain liabilities arising out of the performance of their duties to the Trust. Additionally, in the normal course of business, the Trust enters into contracts with service providers that may contain general indemnification clauses which may permit indemnification to the extent permissible under applicable law. The Trust’s maximum exposure under these arrangements is unknown, as this would involve future claims that may be made against the Trust that have not yet occurred.
| 28 | www.gkefund.com |
| GKE Asian Opportunities Fund | Additional Information |
March 31, 2015 (Unaudited)
1. PROXY VOTING POLICIES AND VOTING RECORD
A description of the policies and procedures that the Fund uses to determine how to vote proxies relating to portfolio securities is available without charge, upon request, (i) by calling the Fund (toll free) at 1-855-331-6240 or (ii) on the website of the Securities and Exchange Commission (the “SEC”) at http://www.sec.gov.
Information regarding how the Fund voted proxies relating to portfolio securities during the most recent 12 month period ended June 30 is available (i) without charge, upon request, by calling the Fund (toll free) at 1-855-331-6240 or (ii) on the SEC's website at http://www.sec.gov.
2. PORTFOLIO HOLDINGS
The Fund files its complete schedule of portfolio holdings with the SEC for the first and third quarters of each fiscal year on Form N‐Q. The Fund’s Forms N‐Q are available on the SEC website at http://www.sec.gov. The Fund’s Forms N‐Q may be reviewed and copied at the SEC’s Public Reference Room in Washington, D.C., and information on the operation of the Public Reference Room may be obtained by calling 1‐800‐SEC‐0330.
| Semi-Annual Report | March 31, 2015 | 29 |
TABLE OF CONTENTS
| Portfolio Update | 1 |
| Disclosure of Fund Expenses | 3 |
| Consolidated Portfolio of Investments | 4 |
| Consolidated Statement of Assets and Liabilities | 12 |
| Consolidated Statement of Operations | 13 |
| Consolidated Statements of Changes in Net Assets | 14 |
| Consolidated Financial Highlights | 15 |
| Notes to Consolidated Financial Statements | 17 |
| Additional Information | 29 |
| Insignia Macro Fund | Portfolio Update |
| March 31, 2015 (Unaudited) |
Performance (as of March 31, 2015)
| 3 Month | 6 Month | 1 Year | Since Inception* | |
| Insignia Macro Fund - A NAV | 4.82% | 6.95% | 12.11% | 9.08% |
| Insignia Macro Fund - A MOP | -0.98% | 1.03% | 5.93% | 4.25% |
| Insignia Macro Fund - I | 4.82% | 7.00% | 12.16% | 9.12% |
HFRI Macro (Total) Index(a) | 3.39% | 5.74% | 9.50% | 7.26% |
S&P 500® Total Return Index(b) | 0.95% | 5.93% | 12.73% | 11.68% |
The performance data quoted above represents past performance. Past performance is not a guarantee of future results. Investment return and value of the Fund shares will fluctuate so that an investor’s shares, when sold or redeemed, may be worth more or less than their original cost. Performance may be lower or higher than performance data quoted. Fund performance current to the most recent month-end is available by calling (855) 674-4642 or by visiting www.insigniafunds.com.
| * | Fund’s inception date is December 31, 2013. |
| (a) | The HFRI Macro (Total) Index is an equally weighted performance index. It uses the HFR database and consists only of macro funds with a minimum of US$50 million AUM or a 12-month track record and that report assets in USD. It is calculated and rebalanced monthly, and shown net of all fees and expenses. It is an index comprising of investment managers which trade a broad range of strategies in which the investment process is predicated on movements in underlying economic variables and the impact these have on equity, fixed income, hard currency and commodity markets. Managers employ a variety of techniques, both discretionary and systematic analysis, combinations of top down and bottom up theses, quantitative and fundamental approaches and long and short term holding periods. Both index returns and index methodology are provided by Hedge Fund Research Inc. |
| (b) | S&P 500® Total Return Index is the Standard & Poor’s composite index of 500 stocks, a widely recognized, unmanaged index of common stock prices. |
Returns of less than 1 year are cumulative.
Indices are not actively managed and do not reflect deduction for fees, expenses or taxes. An investor cannot invest directly in an index.
The returns shown above do not reflect the deduction of taxes a shareholder would pay on Fund distributions or redemption of Fund shares.
Maximum Offering Price (MOP) for Class A shares includes the Fund’s maximum sales charge of 5.50%. Performance shown at NAV does not include these sales charges and would have been lower had it been taken into account. The total annual operating expenses and total annual operating expenses after fee waivers and/or reimbursement you may pay as an investor in the Fund’s Class A and Class I shares (as reported in the January 28, 2015 Prospectus) are 3.87% and 2.00% and 3.62% and 1.75%, respectively.
| Semi-Annual Report | March 31, 2015 | 1 |
| Insignia Macro Fund | Portfolio Update |
| March 31, 2015 (Unaudited) |
Performance of $10,000 Initial Investment (as of March 31, 2015)

The graph shown above represents historical performance of a hypothetical investment of $10,000 in the Fund since inception. Past performance does not guarantee future results. All returns reflect reinvested dividends, but do not reflect the deduction of taxes that a shareholder would pay on Fund distributions or the redemption of Fund shares.
Sector Allocation (as a % of Net Assets)*
| Corporate Bonds | 31.88 | % | ||
| Mortgage Backed Securities | 15.70 | % | ||
| U.S. Treasury Notes & Bonds | 12.99 | % | ||
| Asset Backed Securities | 6.22 | % | ||
| Municipal Bonds | 0.79 | % | ||
| Cash, Cash Equivalents, & Other Net Assets | 32.42 | % | ||
| Total | 100.00 | % |
| * | Holdings are subject to change. Tables present indicative values only. |
| 2 | www.insigniafunds.com |
| Insignia Macro Fund | Disclosure of Fund Expenses |
| March 31, 2015 (Unaudited) |
Examples. As a shareholder of the Insignia Macro Fund (the “Fund”), you will incur two types of costs: (1) transaction costs, including applicable redemption fees; and (2) ongoing costs, including management fees, distribution and service (12b-1) fees and other Fund expenses. The following examples are intended to help you understand your ongoing costs (in dollars) of investing in the Fund and to compare these costs with the ongoing costs of investing in other mutual funds. The examples are based on an investment of $1,000 invested on October 1, 2014 and held until March 31, 2015.
Actual Expenses. The first line under each class in the table below provides information about actual account values and actual expenses. You may use the information in this line, together with the amount you invested, to estimate the expenses that you paid over the period. Simply divide your account value by $1,000 (for example, an $8,600 account value divided by $1,000 = 8.6), then multiply the result by the number in the first line under the heading “Expenses Paid During Period October 1, 2014 – March 31, 2015” to estimate the expenses you paid on your account during this period.
Hypothetical Example for Comparison Purposes. The second line under each class in the table below provides information about hypothetical account values and hypothetical expenses based on the Fund’s actual expense ratio and an assumed rate of return of 5% per year before expenses, which is not the Fund’s actual return. The hypothetical account values and expenses may not be used to estimate the actual ending account balance or expenses you paid for the period. You may use this information to compare the ongoing costs of investing in the Fund and other mutual funds. To do so, compare this 5% hypothetical example with the 5% hypothetical examples that appear in the shareholder reports of the other funds.
Please note that the expenses shown in the table are meant to highlight your ongoing costs only and do not reflect any transactional costs, such as redemption fees. Therefore, the second line under each class in the table below is useful in comparing ongoing costs only and will not help you determine the relative total costs of owning different funds. In addition, if these transactional costs were included, your costs would have been higher.
| Expenses Paid | |||||||||||||||
| Beginning | Ending | During Period | |||||||||||||
| Account Value | Account Value | Expense | October 1, 2014 - | ||||||||||||
| October 1, 2014 | March 31, 2015 | Ratio(a)(b) | March 31, 2015(c) | ||||||||||||
| Class A | |||||||||||||||
| Actual | $ | 1,000.00 | $ | 1,069.50 | 1.85% | $ | 9.55 | ||||||||
Hypothetical (5% return before expenses) | $ | 1,000.00 | $ | 1,015.71 | 1.85% | $ | 9.30 | ||||||||
| Class I | |||||||||||||||
| Actual | $ | 1,000.00 | $ | 1,070.00 | 1.60% | $ | 8.26 | ||||||||
| Hypothetical (5% return before expenses) | $ | 1,000.00 | $ | 1,016.95 | 1.60% | $ | 8.05 | ||||||||
| (a) | The Fund’s expense ratios have been annualized based on the Fund’s most recent fiscal half-year expenses. |
| (b) | Includes expenses of Insignia Global Macro Offshore Ltd. (a wholly owned subsidiary of the Fund), exclusive of the subsidiary’s management fee. |
(c) | Expenses are equal to the Fund’s annualized expense ratio, multiplied by the average account value over the period, multiplied by the number of days in the most recent fiscal half year (182), divided by 365. |
| Semi-Annual Report | March 31, 2015 | 3 |
| Insignia Macro Fund | Consolidated Portfolio of Investments |
| March 31, 2015 (Unaudited) |
| Principal | Value | |||||||
| Amount | (Note 2) | |||||||
ASSET-BACKED SECURITIES (6.22%) | ||||||||
| Automobile (5.30%) | ||||||||
| Ally Auto Receivables Trust | ||||||||
| Series 2012-5, 0.620% 01/15/2016 | $ | 367,573 | $ | 367,692 | ||||
| AmeriCredit Automobile Receivables Trust | ||||||||
Series 2013-5, 0.551% 07/08/2015(a) | 135,038 | 135,042 | ||||||
| CarMax Auto Owner Trust | ||||||||
| Series 2013-4, 0.520% 11/15/2016 | 267,136 | 267,095 | ||||||
| Series 2013-3, 0.590% 08/15/2016 | 31,437 | 31,438 | ||||||
| Series 2013-1, 0.600% 10/16/2017 | 373,309 | 373,303 | ||||||
| Ford Credit Auto Owner Trust | ||||||||
| Series 2014-A, 0.480% 11/15/2016 | 101,493 | 101,488 | ||||||
| Series 2013-B, 0.570% 06/15/2016 | 396,961 | 397,082 | ||||||
| Hyundai Auto Receivables Trust | ||||||||
| Series 2014-B, 0.440% 02/15/2017 | 109,734 | 109,736 | ||||||
| Series 2012-C, 0.530% 12/15/2015 | 160,305 | 160,282 | ||||||
| Series 2013-C, 0.570% 06/15/2016 | 18,064 | 18,064 | ||||||
| Mercedes-Benz Auto Receivables Trust | ||||||||
| Series 2012-1, 0.470% 08/15/2015 | 150,714 | 150,751 | ||||||
| Nissan Auto Receivables Owner Trust | ||||||||
| Series 2012-B, 0.460% 08/15/2015 | 206,014 | 206,006 | ||||||
| Toyota Auto Receivables Owner Trust | ||||||||
| Series 2012-B, 0.460% 09/15/2015 | 404,103 | 404,175 | ||||||
| World Omni Auto Receivables Trust | ||||||||
| Series 2012-A, 0.640% 10/15/2015 | 241,235 | 241,303 | ||||||
| Total Automobile | 2,963,457 | |||||||
| Credit Card (0.87%) | ||||||||
| Cabela’s Credit Card Master Note Trust | ||||||||
Series 2014-1, 0.523% 03/16/2020(a) | 85,000 | 85,042 | ||||||
| Citibank Credit Card Issuance Trust | ||||||||
| Series 2003-A7, 4.150% 07/07/2017 | 395,000 | 398,888 | ||||||
| Total Credit Card | 483,930 | |||||||
| Other (0.05%) | ||||||||
| GE Equipment Midticket LLC | ||||||||
| Series 2012-1, 0.600% 05/22/2015 | 28,821 | 28,823 | ||||||
TOTAL ASSET-BACKED SECURITIES (Cost $3,476,965) | 3,476,210 | |||||||
See Notes to Consolidated Financial Statements.
| 4 | www.insigniafunds.com |
| Insignia Macro Fund | Consolidated Portfolio of Investments |
| March 31, 2015 (Unaudited) |
| Principal | Value | |||||||
| Amount | (Note 2) | |||||||
| CORPORATE BONDS (31.88%) | ||||||||
| Basic Materials (2.08%) | ||||||||
| Barrick Gold Corp., Sr. Unsec. Notes | ||||||||
| 2.900 %05/30/2016 | $ | 400,000 | $ | 406,964 | ||||
| The Dow Chemical Co., Sr. Unsec. Notes | ||||||||
| 2.500% 02/15/2016 | 375,000 | 380,712 | ||||||
| Potash Corp. of Saskatchewan, Inc., Sr. Unsec. Notes | ||||||||
| 3.750% 09/30/2015 | 370,000 | 375,355 | ||||||
| Total Basic Materials | 1,163,031 | |||||||
| Communications (5.78%) | ||||||||
| Amazon.com, Inc., Sr. Unsec. Notes | ||||||||
| 0.650% 11/27/2015 | 380,000 | 380,461 | ||||||
| AT&T, Inc., Sr. Unsec. Notes | ||||||||
| 2.500% 08/15/2015 | 413,000 | 415,817 | ||||||
| Comcast Corp., Sr. Unsec. Notes | ||||||||
| 5.850% 11/15/2015 | 385,000 | 397,574 | ||||||
| DIRECTV Holdings LLC / DIRECTV Financing Co. Inc, Sr. Unsec. Notes | ||||||||
| 3.125% 02/15/2016 | 375,000 | 382,170 | ||||||
| eBay, Inc., Sr. Unsec. Notes | ||||||||
| 0.700% 07/15/2015 | 260,000 | 260,185 | ||||||
| Time Warner, Inc., Sr. Unsec. Notes | ||||||||
| 3.150% 07/15/2015 | 605,000 | 609,642 | ||||||
| Verizon Communications, Inc., Sr. Unsec. Notes | ||||||||
| 2.500% 09/15/2016 | 371,000 | 378,988 | ||||||
| Vodafone Group PLC, Sr. Unsec. Notes | ||||||||
| 1.625% 03/20/2017 | 400,000 | 402,564 | ||||||
| Total Communications | 3,227,401 | |||||||
| Consumer, Cyclical (1.40%) | ||||||||
| AutoZone, Inc., Sr. Unsec. Notes | ||||||||
| 5.500% 11/15/2015 | 389,000 | 400,518 | ||||||
| CVS Caremark Corp., Sr. Unsec. Notes | ||||||||
| 1.200% 12/05/2016 | 380,000 | 382,628 | ||||||
| Total Consumer, Cyclical | 783,146 | |||||||
| Consumer, Non-cyclical (6.23%) | ||||||||
| AbbVie, Inc., Sr. Unsec. Notes | ||||||||
| 1.200% 11/06/2015 | 380,000 | 380,606 | ||||||
| Altria Group, Inc., Sr. Unsec. Notes | ||||||||
| 4.125% 09/11/2015 | 375,000 | 380,690 | ||||||
| Anheuser-Busch InBev Finance, Inc., Sr. Unsec. Notes | ||||||||
0.446% 01/27/2017(a) | 330,000 | 329,489 | ||||||
See Notes to Consolidated Financial Statements.
| Semi-Annual Report | March 31, 2015 | 5 |
| Insignia Macro Fund | Consolidated Portfolio of Investments |
| March 31, 2015 (Unaudited) |
| Principal | Value | |||||||
| Amount | (Note 2) | |||||||
| Consumer, Non-cyclical (continued) | ||||||||
| Clorox Co., Sr. Unsec. Notes | ||||||||
| 3.550% 11/01/2015 | $ | 395,000 | $ | 401,733 | ||||
| ConAgra Foods, Inc., Sr. Unsec. Notes | ||||||||
| 1.350% 09/10/2015 | 380,000 | 380,821 | ||||||
| Dr Pepper Snapple Group, Inc., Sr. Unsec. Notes | ||||||||
| 2.900% 01/15/2016 | 395,000 | 401,409 | ||||||
| Kraft Foods Group, Inc., Sr. Unsec. Notes | ||||||||
| 1.625% 06/04/2015 | 405,000 | 405,695 | ||||||
| The Kroger Co., Sr. Unsec. Notes | ||||||||
| 2.200% 01/15/2017 | 395,000 | 401,844 | ||||||
| Mondelez International, Inc., Sr. Unsec. Notes | ||||||||
| 4.125% 02/09/2016 | 390,000 | 400,569 | ||||||
| Total Consumer, Non-cyclical | 3,482,856 | |||||||
| Energy (2.04%) | ||||||||
| BP Capital Markets PLC, Sr. Unsec. Notes | ||||||||
| 0.700% 11/06/2015 | 380,000 | 380,295 | ||||||
| Enterprise Products Operating LLC, Sr. Unsec. Notes | ||||||||
| 3.200% 02/01/2016 | 375,000 | 381,698 | ||||||
| Talisman Energy, Inc., Sr. Unsec. Notes | ||||||||
| 5.125% 05/15/2015 | 375,000 | 376,526 | ||||||
| Total Energy | 1,138,519 | |||||||
| Financial (10.67%) | ||||||||
| American Express Credit Corp., Sr. Unsec. Notes | ||||||||
0.763% 07/29/2016(a) | 360,000 | 361,340 | ||||||
| American International Group, Inc., Sr. Unsec. Notes | ||||||||
| 5.050% 10/01/2015 | 320,000 | 326,840 | ||||||
| Bank of America Corp., Sr. Unsec. Notes | ||||||||
| 4.500% 04/01/2015 | 140,000 | 140,000 | ||||||
1.085% 03/22/2016(a) | 285,000 | 286,081 | ||||||
| Bear Stearns Cos. LLC, Sr. Unsec. Notes | ||||||||
| 5.300% 10/30/2015 | 420,000 | 430,857 | ||||||
| Capital One Financial Corp., Sr. Unsec. Notes | ||||||||
| 5.500% 06/01/2015 | 205,000 | 206,621 | ||||||
| 1.000% 11/06/2015 | 395,000 | 395,528 | ||||||
| Citigroup, Inc., Sr. Unsec. Notes | ||||||||
1.045% 04/01/2016(a) | 285,000 | 285,829 | ||||||
| Citigroup, Inc., Sub. Notes | ||||||||
| 4.875% 05/07/2015 | 270,000 | 270,954 | ||||||
| First Horizon National Corp., Sr. Unsec. Notes | ||||||||
| 5.375% 12/15/2015 | 155,000 | 159,025 | ||||||
| The Goldman Sachs Group, Inc., Sr. Unsec. Notes | ||||||||
| 1.600% 11/23/2015 | 360,000 | 362,146 | ||||||
See Notes to Consolidated Financial Statements.
| 6 | www.insigniafunds.com |
| Insignia Macro Fund | Consolidated Portfolio of Investments |
| March 31, 2015 (Unaudited) |
| Principal | Value | |||||||
| Amount | (Note 2) | |||||||
| Financial (continued) | ||||||||
| Health Care REIT, Inc., Sr. Unsec. Notes | ||||||||
| 3.625% 03/15/2016 | $ | 170,000 | $ | 174,306 | ||||
| JP Morgan Chase & Co., Sr. Unsec. Notes | ||||||||
| Series MTN, 0.800% 04/23/2015 | 144,000 | 144,016 | ||||||
| JPMorgan Chase & Co., Senior Unsec. Notes | ||||||||
| 2.600% 01/15/2016 | 400,000 | 405,576 | ||||||
| Lloyds Bank PLC, Sr. Unsec. Notes | ||||||||
| 4.875% 01/21/2016 | 200,000 | 206,483 | ||||||
| MetLife, Inc., Sr. Unsec. Notes | ||||||||
| 5.000% 06/15/2015 | 418,000 | 421,740 | ||||||
| Morgan Stanley, Sr. Unsec. Notes | ||||||||
| 5.375% 10/15/2015 | 400,000 | 409,829 | ||||||
| Prudential Financial, Inc., Sr. Unsec. Notes | ||||||||
| Series MTN, 4.750% 09/17/2015 | 400,000 | 407,182 | ||||||
| Royal Bank of Canada, Sr. Unsec. Notes | ||||||||
Series GMTN, 0.724% 09/09/2016(a) | 287,000 | 288,113 | ||||||
| Santander Holdings USA, Inc., Sr. Unsec. Notes | ||||||||
| 3.000% 09/24/2015 | 280,000 | 282,215 | ||||||
| Total Financial | 5,964,681 | |||||||
| Industrial (1.17%) | ||||||||
| Ryder System, Inc., Sr. Unsec. Notes | ||||||||
| Series MTN, 3.600% 03/01/2016 | 269,000 | 275,442 | ||||||
| United Technologies Corp., Sr. Unsec. Notes | ||||||||
| 4.875% 05/01/2015 | 375,000 | 375,880 | ||||||
| Total Industrial | 651,322 | |||||||
| Technology (0.72%) | ||||||||
| Hewlett-Packard Co., Sr. Unsec. Notes | ||||||||
| 2.125% 09/13/2015 | 400,000 | 402,580 | ||||||
| Utilities (1.79%) | ||||||||
| Exelon Corp. Sr. Unsec. Notes | ||||||||
| 4.900% 06/15/2015 | 379,000 | 382,007 | ||||||
| Georgia Power Co., Sr. Unsec. Notes | ||||||||
0.591% 03/15/2016(a) | 220,000 | 219,930 | ||||||
| Progress Energy, Inc., Sr. Unsec. Notes | ||||||||
| 5.625% 01/15/2016 | 385,000 | 399,447 | ||||||
| Total Utilities | 1,001,384 | |||||||
TOTAL CORPORATE BONDS (Cost $17,819,772) | 17,814,920 | |||||||
See Notes to Consolidated Financial Statements.
| Semi-Annual Report | March 31, 2015 | 7 |
| Insignia Macro Fund | Consolidated Portfolio of Investments |
| March 31, 2015 (Unaudited) |
| Principal | Value | |||||||
| Amount | (Note 2) | |||||||
MORTGAGE-BACKED SECURITIES (15.70%) | ||||||||
| Commercial (15.27%) | ||||||||
| Ally Master Owner Trust | ||||||||
| Series 2013-1, 1.000% 02/15/2018 | $ | 175,000 | $ | 175,392 | ||||
| Bank of America Merrill Lynch Commercial Mortgage, Inc. | ||||||||
Series 2005-5, 5.115% 10/10/2045(a) | 269,453 | 270,910 | ||||||
Series 2005-6, 5.178% 11/10/2015(a) | 122,852 | 124,304 | ||||||
| Bear Stearns Commercial Mortgage Securities Trust | ||||||||
| Series 2005-PWR9, 4.871% 09/11/2042 | 262,950 | 264,258 | ||||||
Series 2005-T20, 5.140% 10/12/2042(a) | 276,368 | 278,836 | ||||||
| Series 2006-T24, 5.537% 09/12/2016 | 384,286 | 403,366 | ||||||
| CD Commercial Mortgage Trust | ||||||||
Series 2005-CD1, 5.225% 07/15/2044(a) | 352,199 | 353,986 | ||||||
| Chase Issuance Trust | ||||||||
| Series 2012-A5, 0.590% 08/15/2017 | 710,000 | 710,398 | ||||||
| Citibank Credit Card Issuance Trust | ||||||||
Series 2013-A1, 0.274% 04/24/2017(a) | 215,000 | 214,973 | ||||||
| Citigroup Commercial Mortgage Trust | ||||||||
| Series 2006-C4, 5.768% 03/15/2049 | 370,000 | 387,700 | ||||||
| Credit Suisse First Boston Mortgage Securities Corp. | ||||||||
| Series 2005-C3, 4.730% 07/15/2037 | 506,000 | 506,062 | ||||||
Series 2005-C4, 5.104% 08/15/2038(a) | 90,839 | 91,067 | ||||||
| Discover Card Execution Note Trust | ||||||||
Series 2012-A5, 0.375% 01/16/2018(a) | 350,000 | 350,089 | ||||||
| Ford Credit Floorplan Master Owner Trust | ||||||||
Series 2013-5, 0.645% 09/15/2018(a) | 400,000 | 400,812 | ||||||
| GE Dealer Floorplan Master Note Trust | ||||||||
Series 2012-3, 0.666% 06/20/2017(a) | 300,000 | 300,116 | ||||||
| GS Mortgage Securities Trust | ||||||||
| Series 2011-GC5, 2.999% 08/10/2016 | 350,000 | 358,352 | ||||||
| Series 2006-GG6, 5.622% 01/10/2016 | 275,000 | 282,912 | ||||||
| JP Morgan Chase Commercial Mortgage Securities Trust | ||||||||
| Series 2005-LDP2, 4.738% 07/15/2042 | 48,312 | 48,243 | ||||||
| LB-UBS Commercial Mortgage Trust | ||||||||
| Series 2005-C3, 4.843% 07/15/2040 | 145,000 | 145,225 | ||||||
| Series 2006-C1, 5.156% 01/15/2016 | 188,506 | 191,335 | ||||||
Series 2005-C7, 5.197% 11/15/2030(a) | 86,918 | 87,347 | ||||||
| Merrill Lynch Mortgage Trust | ||||||||
Series 2005-CKI1, 5.282% 11/12/2037(a) | 405,000 | 412,665 | ||||||
Series 2005-LC1, 5.291% 01/12/2044(a) | 218,544 | 222,134 | ||||||
Series 2006-C1, 5.659% 05/12/2039(a) | 375,000 | 386,965 | ||||||
| Morgan Stanley Capital I Trust | ||||||||
| Series 2005-T19, 4.890% 06/12/2047 | 126,157 | 126,304 | ||||||
Series 2006-T21, 5.162% 10/12/2052(a) | 270,000 | 273,795 | ||||||
See Notes to Consolidated Financial Statements.
| 8 | www.insigniafunds.com |
| Insignia Macro Fund | Consolidated Portfolio of Investments |
| March 31, 2015 (Unaudited) |
| Principal | Value | |||||||
| Amount | (Note 2) | |||||||
| Commercial (continued) | ||||||||
| Wachovia Bank Commercial Mortgage Trust | ||||||||
| Series 2005-C19, 4.750% 05/15/2044 | $ | 470,064 | $ | 469,981 | ||||
Series 2005-C20, 5.118% 07/15/2042(a) | 194,548 | 195,003 | ||||||
Series 2005-C20, 5.179% 07/15/2042(a) | 237,000 | 238,865 | ||||||
Series 2005-C21, 5.272% 10/15/2044(a) | 255,910 | 257,830 | ||||||
| Total Commercial | 8,529,225 | |||||||
| U.S. Government Agency (0.43%) | ||||||||
| Fannie Mae Connecticut Avenue Securities | ||||||||
Series 2014-C03, 1.374% 07/25/2024(a) | 240,310 | 240,530 | ||||||
| TOTAL MORTGAGE-BACKED SECURITIES (Cost $8,845,208) | 8,769,755 | |||||||
| MUNICIPAL BONDS (0.79%) | ||||||||
| State of California Pre-refunded Various Purpose, General Obligation Unlimited Bonds (AD Valorem Property Tax), | ||||||||
| 5.450% 04/01/2015 | 390,000 | 390,000 | ||||||
| State of California Taxable Various Purpose, General Obligation Bonds | ||||||||
| 5.950% 04/01/2016 | 50,000 | 52,653 | ||||||
TOTAL MUNICIPAL BONDS (Cost $442,465) | 442,653 | |||||||
| U.S. TREASURY NOTES & BONDS (12.98%) | ||||||||
| U.S. Treasury Notes | ||||||||
| 0.250% 05/31/2015 | 1,000,000 | 1,000,078 | ||||||
| 0.250% 09/15/2015 | 2,350,000 | 2,351,102 | ||||||
| 0.250% 11/30/2015 | 1,200,000 | 1,200,281 | ||||||
| 0.375% 03/31/2016 | 2,700,000 | 2,702,533 | ||||||
TOTAL U.S. TREASURY NOTES & BONDS (Cost $7,253,670) | 7,253,994 | |||||||
See Notes to Consolidated Financial Statements.
| Semi-Annual Report | March 31, 2015 | 9 |
| Insignia Macro Fund | Consolidated Portfolio of Investments |
| March 31, 2015 (Unaudited) |
| 7-Day | Value | |||||||||||
| Yield | Shares | (Note 2) | ||||||||||
| SHORT-TERM INVESTMENTS (12.82%) | ||||||||||||
| Money Market Funds (12.82%) | ||||||||||||
| Morgan Stanley Liquidity Fund - Prime Portfolio, Institutional Class | 0.06962 | % | 3,863,133 | $ | 3,863,133 | |||||||
| Morgan Stanley Liquidity Fund - Tax-Exempt Portfolio, Institutional Class | 0.01000 | % | 3,299,722 | 3,299,722 | ||||||||
| Total Money Market Funds | 7,162,855 | |||||||||||
TOTAL SHORT-TERM INVESTMENTS (Cost $7,162,855) | 7,162,855 | |||||||||||
TOTAL INVESTMENTS (80.39%) (Cost $45,000,935) | $ | 44,920,387 | ||||||||||
| Other Assets In Excess Of Liabilities (19.61%) | 10,954,529 | (b) | ||||||||||
| NET ASSETS (100.00%) | $ | 55,874,916 | ||||||||||
| (a) | Floating or variable rate security. Interest rate disclosed is that which is in effect at March 31, 2015. |
| (b) | Includes cash which is being held as collateral for swap contracts. |
Common Abbreviations:
GMTN - Global Medium Term Notes.
LLC - Limited Liability Company.
MTN - Medium Term Notes
PLC - Public Limited Company.
Sr. - Senior.
Sub. - Subordinated.
Unsec. - Unsecured.
For Fund compliance purposes, the Fund’s industry classifications refer to any one or more of the industry sub-classifications used by one or more widely recognized market indices or ratings group indices, and/or as defined by Fund management. This definition may not apply for purposes of this report, which may combine industry sub-classifications for reporting ease. Industries are shown as a percentage of the Fund’s net assets. (Unaudited)
See Notes to Consolidated Financial Statements.
| 10 | www.insigniafunds.com |
| Insignia Macro Fund | Consolidated Portfolio of Investments |
| March 31, 2015 (Unaudited) |
TOTAL RETURN SWAP CONTRACTS
Total return swap with Deutsche Bank AG, London Branch. The swap provides exposure to the total returns on a basket of independent managers that is calculated on a daily basis with reference to a customized index that is also proprietary to Deutsche Bank. The basket is comprised of a diversified collection of global macroeconomic and managed futures trading strategies including discretionary and systematic trading programs. Under the terms of the swap, the manager has the ability to periodically adjust the notional level of the swap, the notional allocation to each manager and the mix of trading programs. The swap was effective on March 5, 2014 and has a term of five years unless earlier terminated. In addition, the swap provides for a 0.50% fee to Deutsche Bank. (Notional Value $33,271,902)
Exposure by Manager
| Underlying Manager | Exposure | Strategy Description |
| H2O Asset Management | 16.53% | Discretionary Macro | Fundamental |
| QMS Capital management | 15.03% | Quantative | Fundamental & Technical Models |
| The Cambridge Strategy | 14.61% | Quantative | Fundamental & Technical Models |
| Cabel Capital Management | 13.84% | Quantative | Short Term |
| Blackwater Capital Management | 9.17% | Trend Follower | Pattern Recognition |
| Unrealized Appreciation | ||||
| $ | 23,196 | |||
Total return swap with Newedge USA, LLC. The swap provides exposure to the total returns on a basket of independent managers that is calculated on a daily basis with reference to a customized index that is also proprietary to Newedge USA, LLC. The basket is comprised of a diversified collection of global macroeconomic and managed futures trading strategies including discretionary and systematic trading programs. Under the terms of the swap, the adviser has the ability to periodically adjust the notional level of the swap, the notional allocation to each manager, and the mix of trading programs. The swap was effective on October 15, 2014 and may be terminated by either party with at least two business days notice to the other party. In addition, the swap provides for a 0.50% fee to Newedge USA, LLC. (Notional Value $15,991,478)
Exposure by Manager
| Underlying Manager | Exposure | Strategy Description |
| Willowbridge Associates | 16.29% | Discretionary Macro | Fundamental |
| Tialoc Capital | 14.52% | Discretionary Macro | Fundamental |
| Unrealized Appreciation | ||||
| $ | 588,276 | |||
| Unrealized Appreciation | ||||
| Total Net Unrealized Appreciation on Swap Contracts | $ | 611,472 | ||
See Notes to Consolidated Financial Statements.
| Semi-Annual Report | March 31, 2015 | 11 |
| Insignia Macro Fund | Consolidated Statement of Assets and Liabilities |
| March 31, 2015 (Unaudited) |
| ASSETS: | ||||
| Investments, at value (cost $45,000,935) | $ | 44,920,387 | ||
| Cash | 3,512,027 | |||
| Deposit with broker for swap contracts (Note 3) | 3,199,864 | |||
| Unrealized gain on swap contracts | 611,472 | |||
| Receivable for swap contract payments | 4,117,715 | |||
| Receivable for shares sold | 500,174 | |||
| Interest and dividends receivable | 183,620 | |||
| Prepaid expenses and other assets | 33,304 | |||
| Total Assets | 57,078,563 | |||
| LIABILITIES: | ||||
| Payable for swap contract payments | 622,007 | |||
| Payable for investments purchased | 496,905 | |||
| Payable for shares redeemed | 3,100 | |||
| Payable to advisor | 34,602 | |||
| Professional fees payable | 25,636 | |||
| Payable for legal fees | 191 | |||
| Payable to trustees | 2,278 | |||
| Payable to chief compliance officer | 2,056 | |||
| Accrued expenses and other liabilities | 16,872 | |||
| Total Liabilities | 1,203,647 | |||
| NET ASSETS | $ | 55,874,916 | ||
| NET ASSETS CONSIST OF: | ||||
| Paid‐in capital (Note 7) | $ | 51,710,737 | ||
| Accumulated net investment loss | (212,494 | ) | ||
| Accumulated net realized gain on investments and swap contracts | 3,845,749 | |||
| Net unrealized appreciation on investments and swap contracts | 530,924 | |||
| NET ASSETS | $ | 55,874,916 | ||
| PRICING OF SHARES | ||||
Class A: | ||||
| Net Asset Value, offering and redemption price per share | $ | 11.09 | ||
| Net Assets | $ | 255,467 | ||
| Shares of beneficial interest outstanding | 23,043 | |||
| Maximum offering price per share (NAV/0.945, based on maximum sales charge of 5.50% of the offering price) | $ | 11.74 | ||
Class I: | ||||
| Net Asset Value, offering and redemption price per share | $ | 11.09 | ||
| Net Assets | $ | 55,619,449 | ||
| Shares of beneficial interest outstanding | 5,016,575 | |||
See Notes to Consolidated Financial Statements.
| 12 | www.insigniafunds.com |
| Insignia Macro Fund | Consolidated Statement of Operations |
| For the Six Months ended March 31, 2015 (Unaudited) |
| INVESTMENT INCOME: | ||||
| Interest | $ | 119,870 | ||
| Dividends | 1,126 | |||
| Total Investment Income | 120,996 | |||
| EXPENSES: | ||||
| Investment advisory fee (Note 8) | 261,041 | |||
| Administration fee | 86,571 | |||
| Distribution and service fees | ||||
| Class A | 143 | |||
| Custodian fee | 6,682 | |||
| Legal fees | 15,699 | |||
| Audit fees | 9,037 | |||
| Transfer agent fee | 20,864 | |||
| Trustees fees and expenses | 13,169 | |||
| Registration fees | 11,474 | |||
| Printing fees | 1,764 | |||
| Chief compliance officer fee | 12,473 | |||
| Insurance expense | 2,108 | |||
| Offering costs | 36,616 | |||
| Other expenses | 6,618 | |||
| Total Expenses | 484,259 | |||
| Less fees waived/reimbursed by investment advisor | ||||
| Class A | (419 | ) | ||
| Class I | (150,357 | ) | ||
| Total fees waived/reimbursed by investment adviser (Note 8) | (150,776 | ) | ||
| Net Expenses | 333,483 | |||
| NET INVESTMENT LOSS | (212,487 | ) | ||
| REALIZED AND UNREALIZED GAIN/(LOSS) ON INVESTMENTS AND SWAP CONTRACTS: | ||||
| Net realized gain on: | ||||
| Investments | 494 | |||
| Swap contracts | 3,845,278 | |||
| Net realized gain | 3,845,772 | |||
| Change in unrealized (depreciation) on: | ||||
| Investments | (36,704 | ) | ||
| Swap contracts | (286,621 | ) | ||
| Net change | (323,325 | ) | ||
| NET REALIZED AND UNREALIZED GAIN ON INVESTMENTS AND SWAP CONTRACTS | 3,522,447 | |||
| NET INCREASE IN NET ASSETS RESULTING FROM OPERATIONS | $ | 3,309,960 | ||
| See Notes to Consolidated Financial Statements. |
| Semi-Annual Report | March 31, 2015 | 13 |
| Insignia Macro Fund | Consolidated Statements of Changes in Net Assets | |||
| Six Months | For the Period | |||||||
| Ended | Ended | |||||||
| March 31, 2015 | September 30, | |||||||
| (Unaudited) | 2014(a) | |||||||
| OPERATIONS | ||||||||
| Net investment loss | $ | (212,487 | ) | $ | (112,138 | ) | ||
| Net realized gain/(loss) on investments | 494 | (3,787 | ) | |||||
| Net realized gain on swap contracts | 3,845,278 | 249,006 | ||||||
| Net change in unrealized appreciation/(depreciation) on investments and swap contracts | (323,325 | ) | 854,249 | |||||
| Net increase in net assets resulting from operations | 3,309,960 | 987,330 | ||||||
| DISTRIBUTIONS TO SHAREHOLDERS | ||||||||
| From net investment income | ||||||||
| Advisor Class | (465 | ) | — | |||||
| Institutional Class | (193,741 | ) | — | |||||
| From net realized gains on investments | ||||||||
| Advisor Class | (81 | ) | — | |||||
| Institutional Class | (30,286 | ) | — | |||||
| Total distributions | (224,573 | ) | — | |||||
| BENEFICIAL SHARE TRANSACTIONS (Note 7) | ||||||||
| Class A | ||||||||
| Shares sold | 189,090 | 80,158 | ||||||
| Dividends reinvested | 546 | — | ||||||
| Shares redeemed | (26,331 | ) | — | |||||
| Net increase from beneficial share transactions | 163,305 | 80,158 | ||||||
| Class I | ||||||||
| Shares sold | 30,875,160 | 24,941,071 | ||||||
| Dividends reinvested | 10,918 | — | ||||||
| Shares redeemed | (2,362,186 | ) | (1,908,664 | ) | ||||
| Redemption fees | 47 | 2,390 | ||||||
| Net increase from beneficial share transactions | 28,523,939 | 23,034,796 | ||||||
| Net increase in net assets | 31,772,631 | 24,102,285 | ||||||
| NET ASSETS | ||||||||
| Beginning of period | 24,102,285 | — | ||||||
| End of period (including accumulated net investment income/(loss) of $(212,494) and $194,199) | $ | 55,874,916 | $ | 24,102,285 | ||||
| (a) | Commenced operations on January 2, 2014. |
| See Notes to Consolidated Financial Statements. |
| 14 | www.insigniafunds.com |
| Insignia Macro Fund - Class A | Consolidated Financial Highlights |
| For a share outstanding through the periods presented. |
| Six Months | ||||||||
| Ended | For the Period | |||||||
| March 31, 2015 | Ended | |||||||
| (Unaudited) | September 30, 2014(a) | |||||||
| NET ASSET VALUE, BEGINNING OF PERIOD | $ | 10.42 | $ | 10.00 | ||||
| INCOME/(LOSS) FROM OPERATIONS: | ||||||||
Net investment loss(b) | (0.07 | ) | (0.08 | ) | ||||
| Net realized and unrealized gain on investments and swap contracts | 0.79 | 0.50 | ||||||
| Total from Investment Operations | 0.72 | 0.42 | ||||||
| LESS DISTRIBUTIONS: | ||||||||
| From investment income | (0.04 | ) | — | |||||
| From net realized gain on investments | (0.01 | ) | — | |||||
| Total Distributions | (0.05 | ) | — | |||||
| NET INCREASE IN NET ASSET VALUE | 0.67 | 0.42 | ||||||
| NET ASSET VALUE, END OF PERIOD | $ | 11.09 | $ | 10.42 | ||||
TOTAL RETURN(c) | 6.95 | % | 4.20 | % | ||||
| SUPPLEMENTAL DATA: | ||||||||
| Net assets, End of Period (in 000s) | $ | 255 | $ | 85 | ||||
| RATIOS TO AVERAGE NET ASSETS | ||||||||
| Operating expenses excluding reimbursement/waiver | 2.59 | %(d) | 80.48 | %(d) | ||||
| Operating expenses including reimbursement/waiver | 1.85% | (d),(e) | 1.75 | %(d) | ||||
| Net investment loss including reimbursement/waiver | (1.27 | )%(d) | (1.03 | )%(d) | ||||
| PORTFOLIO TURNOVER RATE | 53 | %(f) | 43 | %(f) | ||||
| (a) | Commenced operations on January 2, 2014. |
| (b) | Per share amounts are based upon average shares outstanding. |
| (c) | Total return is for the period indicated and has not been annualized. The total return would have been lower had certain expenses not been reimbursed/waived during the period. The return shown does not reflect the deduction of taxes that a shareholder would pay on Fund distributions or the redemption of Fund shares. |
| (d) | Annualized. |
| (e) | Contractual expense limitation changed from 1.75% to 2.00% effective February 1, 2015. |
| (f) | Not annualized. |
| See Notes to Consolidated Financial Statements. |
| Semi-Annual Report | March 31, 2015 | 15 |
| Insignia Macro Fund - Class I | Consolidated Financial Highlights |
| For a share outstanding through the periods presented. |
| Six Months | ||||||||
| Ended | For the Period | |||||||
| March 31, 2015 | Ended | |||||||
| (Unaudited) | September 30, 2014(a) | |||||||
| NET ASSET VALUE, BEGINNING OF PERIOD | $ | 10.42 | $ | 10.00 | ||||
| INCOME/(LOSS) FROM OPERATIONS: | ||||||||
Net investment loss(b) | (0.05 | ) | (0.06 | ) | ||||
| Net realized and unrealized gain on investments and swap contracts | 0.78 | 0.48 | ||||||
| Total from Investment Operations | 0.73 | 0.42 | ||||||
| LESS DISTRIBUTIONS: | ||||||||
| From investment income | (0.05 | ) | — | |||||
| From net realized gain on investments | (0.01 | ) | — | |||||
| Total Distributions | (0.06 | ) | — | |||||
| REDEMPTION FEES (Note 7) | 0.00 | (c) | 0.00 | (c) | ||||
| NET INCREASE IN NET ASSET VALUE | 0.67 | 0.42 | ||||||
| NET ASSET VALUE, END OF PERIOD | $ | 11.09 | $ | 10.42 | ||||
TOTAL RETURN(d) | 7.00 | % | 4.20 | % | ||||
| SUPPLEMENTAL DATA: | ||||||||
| Net assets, End of Period (in 000s) | $ | 55,619 | $ | 24,017 | ||||
| RATIOS TO AVERAGE NET ASSETS | ||||||||
| Operating expenses excluding reimbursement/waiver | 2.32 | %(e) | 3.62 | %(e) | ||||
| Operating expenses including reimbursement/waiver | 1.60 | %(e),(f) | 1.50 | %(e) | ||||
| Net investment loss including reimbursement/waiver | (1.02 | )%(e) | (0.85 | )%(e) | ||||
| PORTFOLIO TURNOVER RATE | 53 | %(g) | 43 | %(g) | ||||
| (a) | Commenced operations on January 2, 2014. |
| (b) | Per share amounts are based upon average shares outstanding. |
| (c) | Less than $0.005 per share. |
| (d) | Total return is for the period indicated and has not been annualized. The total return would have been lower had certain expenses not been reimbursed/waived during the period. The return shown does not reflect the deduction of taxes that a shareholder would pay on Fund distributions or the redemption of Fund shares. |
| (e) | Annualized. |
| (f) | Contractual expense limitation changed from 1.50% to 1.75% effective February 1, 2015. |
| (g) | Not annualized. |
| See Notes to Consolidated Financial Statements. |
| 16 | www.insigniafunds.com |
| Insignia Macro Fund | Notes to Consolidated Financial Statements |
March 31, 2015 (Unaudited)
1. ORGANIZATION
The ALPS Series Trust (the “Trust”), a Delaware statutory trust, is an open-end management investment company registered under the Investment Company Act of 1940, as amended (the “1940 Act”). As of March 31, 2015, the Trust had nine registered funds. This semi-annual report describes the Insignia Macro Fund (the “Fund”). The Fund’s primary investment objective is to seek long-term risk-adjusted total return. The Fund currently offers Class A shares and Class I shares. All classes of shares have identical rights to earnings, assets and voting privileges, except for class specific expenses and exclusive rights to vote on matters affecting only individual classes. The Trust has an unlimited number of shares with no par value per share. The Board of Trustees (the “Board”) may establish additional funds and classes of shares at any time in the future without shareholder approval.
Basis of Consolidation: Insignia Global Macro Offshore Ltd. (the “Subsidiary”), a Cayman Islands exempted company, was incorporated on September 27, 2013 and is a wholly owned subsidiary of the Fund. The Subsidiary acts as an investment vehicle for the Fund in order to effect certain commodity-related investments on behalf of the Fund. The Fund is the sole shareholder of the Subsidiary, and it is intended that the Fund will remain the sole shareholder and will continue to wholly own and control the Subsidiary. Under the Articles of Association of the Subsidiary, shares issued by the Subsidiary confer upon a shareholder the right to vote at general meetings of the Subsidiary and certain rights in connection with any winding-up or repayment of capital, as well as the right to participate in the profits or assets of the Subsidiary. The Fund may invest up to 25% of its total assets in shares of the Subsidiary. As a wholly owned subsidiary of the Fund, the investments of the Subsidiary are included in the consolidated statements of investments and financial highlights of the Fund. All investments held by the Subsidiary are disclosed in the accounts of the Fund. As of March 31, 2015, net assets of the Fund were $55,874,916, of which $10,606,025, or 18.98%, represented the Fund’s ownership of all issued shares and voting rights of the Subsidiary.
2. SIGNIFICANT ACCOUNTING POLICIES
The accompanying financial statements were prepared in accordance with accounting principles generally accepted in the United States of America for investment companies (“U.S. GAAP”). The Fund is considered an investment company for financial reporting purposes. The preparation of financial statements in conformity with U.S. GAAP requires management to make certain estimates and assumptions that affect the reported amounts of assets and liabilities and disclosures of contingent assets and liabilities at the date of the financial statements and the reported amounts of revenue and expenses during the period. Actual results could differ from those estimates. The following is a summary of significant accounting policies consistently followed by the Fund in preparation of its financial statements.
Investment Valuation: The Fund generally values its securities based on market prices determined at the close of regular trading on the New York Stock Exchange (“NYSE”), normally 4:00 p.m. Eastern Time, on each day the NYSE is open for trading.
Over‐the‐counter swap contracts for which market quotations are readily available are valued based on quotes received from independent pricing services or dealers that make markets in such securities.
| Semi-Annual Report | March 31, 2015 | 17 |
| Insignia Macro Fund | Notes to Consolidated Financial Statements |
March 31, 2015 (Unaudited)
Redeemable securities issued by open-end registered investment companies are valued at the investment company’s applicable net asset value with the exception of exchange-traded open-end investment companies, which are priced as equity securities.
The market price for debt obligations is generally the price supplied by an independent third-party pricing service approved by the Board, which may use a matrix, formula or other objective method that takes into consideration quotations from dealers, market transactions in comparable investments, market indices and yield curves. If vendors are unable to supply a price, or if the price supplied is deemed to be unreliable, the market price may be determined using quotations received from one or more broker dealers that make a market in the security.
When such prices or quotations are not available, or when the fair value committee appointed by the Board believes that they are unreliable, securities may be priced using fair value procedures approved by the Board.
Fair Value Measurements: The Fund discloses the classification of its fair value measurements following a three-tier hierarchy based on the inputs used to measure fair value. Inputs refer broadly to the assumptions that market participants would use in pricing the asset or liability, including assumptions about risk. Inputs may be observable or unobservable. Observable inputs reflect the assumptions market participants would use in pricing the asset or liability that are developed based on market data obtained from sources independent of the reporting entity. Unobservable inputs reflect the reporting entity’s own assumptions about the assumptions market participants would use in pricing the asset or liability that are developed based on the best information available.
Various inputs are used in determining the value of the Fund’s investments as of the end of the reporting period. When inputs used fall into different levels of the fair value hierarchy, the level in the hierarchy within which the fair value measurement falls is determined based on the lowest level input that is significant to the fair value measurement in its entirety. The designated input levels are not necessarily an indication of the risk or liquidity associated with these investments. These inputs are categorized in the following hierarchy under applicable financial accounting standards:
| Level 1 – | Unadjusted quoted prices in active markets for identical investments, unrestricted assets or liabilities that the Fund has the ability to access at the measurement date; |
| Level 2 – | Quoted prices which are not active, quoted prices for similar assets or liabilities in active markets or inputs other than quoted prices that are observable (either directly or indirectly) for substantially the full term of the asset or liability; and |
| Level 3 – | Significant unobservable prices or inputs (including the Fund’s own assumptions in determining the fair value of investments) where there is little or no market activity for the asset or liability at the measurement date. |
| 18 | www.insigniafunds.com |
| Insignia Macro Fund | Notes to Consolidated Financial Statements |
March 31, 2015 (Unaudited)
The following is a summary of the inputs used to value the Fund’s investments as of March 31, 2015:
| Level 2 - Other | Level 3 - | |||||||||||||||
| Level 1 - | Significant | Significant | ||||||||||||||
| Unadjusted | Observable | Unobservable | ||||||||||||||
| Investments in Securities at Value | Quoted Prices | Inputs | Inputs | Total | ||||||||||||
| Asset‐Backed Securities | $ | — | $ | 3,476,210 | $ | — | $ | 3,476,210 | ||||||||
| Corporate Bonds | ||||||||||||||||
| Basic Materials | — | 1,163,031 | — | 1,163,031 | ||||||||||||
| Communications | — | 3,227,401 | — | 3,227,401 | ||||||||||||
| Consumer, Cyclical | — | 783,146 | — | 783,146 | ||||||||||||
| Consumer, Non‐cyclical | — | 3,482,856 | — | 3,482,856 | ||||||||||||
| Energy | — | 1,138,519 | — | 1,138,519 | ||||||||||||
| Financial | — | 5,964,681 | — | 5,964,681 | ||||||||||||
| Industrial | — | 651,322 | — | 651,322 | ||||||||||||
| Technology | — | 402,580 | — | 402,580 | ||||||||||||
| Utilities | — | 1,001,384 | — | 1,001,384 | ||||||||||||
| Mortgage‐Backed Securities | — | 8,769,755 | — | 8,769,755 | ||||||||||||
| Municipal Bonds | — | 442,653 | — | 442,653 | ||||||||||||
| U.S. Treasury Notes & Bonds | — | 7,253,994 | — | 7,253,994 | ||||||||||||
| Short‐Term Investments | 7,162,855 | — | — | 7,162,855 | ||||||||||||
| TOTAL | $ | 7,162,855 | $ | 37,757,532 | $ | — | $ | 44,920,387 | ||||||||
| Valuation Inputs | ||||||||||||||||
| Other Financial Instruments | Level 1 | Level 2 | Level 3 | Total | ||||||||||||
| Assets: | ||||||||||||||||
| Total Return Swap Contracts | $ | — | $ | 611,472 | $ | — | $ | 611,472 | ||||||||
| TOTAL | $ | — | $ | 611,472 | $ | — | $ | 611,472 | ||||||||
The Fund recognizes transfers between levels as of the end of the period. For the period ended March 31, 2015, the Fund did not have any transfers between Level 1 and Level 2 securities. There were no Level 3 securities held during the period.
Offering Costs: The Fund incurred offering costs during the period ended March 31, 2015. These offering costs, including fees for printing initial prospectuses, legal and registration fees, are being amortized over the first twelve months from the inception date of the Fund. Amounts amortized through March 31, 2015 are shown on the Fund’s Statement of Operations.
Trust Expenses: Some expenses of the Trust can be directly attributed to the Fund. Expenses which cannot be directly attributed to the Fund are apportioned among all funds in the Trust based on average net assets of each fund.
Fund Expenses: Some expenses can be directly attributed to the Fund and are apportioned among the classes based on average net assets of each class.
| Semi-Annual Report | March 31, 2015 | 19 |
| Insignia Macro Fund | Notes to Consolidated Financial Statements |
March 31, 2015 (Unaudited)
Class Expenses: Expenses that are specific to a class of shares are charged directly to that share class. Fees provided under the distribution (Rule 12b-1) and/or shareholder service plans for a particular class of the Fund are charged to the operations of such class.
Federal Income Taxes: The Fund complies with the requirements under Subchapter M of the Internal Revenue Code of 1986, as amended, applicable to regulated investment companies and intends to distribute substantially all of its net taxable income and net capital gains, if any, each year so that it will not be subject to excise tax on undistributed income and gains. The Fund is not subject to income taxes to the extent such distributions are made.
As of and during the period ended March 31, 2015, the Fund did not have a liability for any unrecognized tax benefits in the accompanying financial statements. The Fund files U.S. federal, state and local income tax returns as required. The Fund’s tax returns are subject to examination by the relevant tax authorities until expiration of the applicable statute of limitations, which is generally three years after the filing of the tax return for federal purposes and four years for most state returns. The Fund’s administrator has analyzed the Fund’s tax positions taken on federal and state income tax returns for all open tax years and has concluded that as of March 31, 2015, no provision for income tax is required in the Fund’s financial statements related to these tax positions.
Investment Transactions and Investment Income: Investment transactions are accounted for on the date the investments are purchased or sold (trade date basis). Realized gains and losses from investment transactions are reported on an identified cost basis. Interest income, which includes accretion of discounts and amortization of premiums, is accrued and recorded as earned. Dividend income is recognized on the ex-dividend date, or for certain foreign securities, as soon as information is available to the Fund. All of the realized and unrealized gains and losses and net investment income are allocated daily to each class in proportion to its average daily net assets.
Foreign Securities: The Fund may directly purchase securities of foreign issuers. Investing in securities of foreign issuers involves special risks not typically associated with investing in securities of U.S. issuers. The risks include possible reevaluation of currencies, the inability to repatriate foreign currency, less complete financial information about companies and possible future adverse political and economic developments. Moreover, securities of many foreign issuers and their markets may be less liquid and their prices more volatile than those of securities of comparable U.S. issuers.
Foreign Currency Translation: The books and records of the Fund are maintained in U.S. dollars. Investment valuations and other assets and liabilities initially expressed in foreign currencies are converted each business day into U.S. dollars based upon current exchange rates. The portion of realized and unrealized gains or losses on investments due to fluctuations in foreign currency exchange rates is not separately disclosed and is included in realized and unrealized gains or losses on investments, when applicable.
Foreign Exchange Transactions: The Fund may enter into foreign currency spot contracts to facilitate transactions in foreign securities or to convert foreign currency receipts into U.S. dollars. A foreign currency spot contract is an agreement between two parties to buy and sell currencies at the current market rate, for settlement generally within two business days. The U.S. dollar value of
| 20 | www.insigniafunds.com |
| Insignia Macro Fund | Notes to Consolidated Financial Statements |
March 31, 2015 (Unaudited)
the contracts is determined using current currency exchange rates supplied by a pricing service. The contract is marked-to-market daily for settlements beyond one day and any change in market value is recorded as an unrealized gain or loss. When the contract is closed, the Fund records a realized gain or loss equal to the difference between the value on the open and close date. Losses may arise from changes in the value of the foreign currency, or if the counterparties do not perform under the contract’s terms. The maximum potential loss from such contracts is the aggregate face value in U.S. dollars at the time the contract was opened.
Distributions to Shareholders: The Fund normally pays dividends, if any, and distributes capital gains, if any, on an annual basis. Income dividend distributions are derived from interest and other income the Fund receives from its investments, including short term capital gains. Long term capital gain distributions are derived from gains realized when the Fund sells a security it has owned for more than one year. The Fund may make additional distributions and dividends at other times if its portfolio manager or managers believe doing so may be necessary for the Fund to avoid or reduce taxes. Net investment income/(loss) and net realized gain/(loss) may differ for financial statement and tax purposes.
3. DERIVATIVE INSTRUMENTS
The Fund’s investment objectives permit the Fund to enter into various types of derivatives contracts, including, but not limited to, total return swaps and structured notes. In doing so, the Fund will employ strategies in differing combinations to permit it to increase, decrease, or change the level or types of exposure to market factors. Central to those strategies are features inherent in derivatives that make them more attractive for this purpose than equity or debt securities; they require little or no initial cash investment, they can focus exposure on only certain selected risk factors, and they may not require the ultimate receipt or delivery of the underlying security (or securities) to the contract. This may allow the Fund to pursue its objectives more quickly and efficiently than if it were to make direct purchases or sales of securities capable of affecting a similar response to market factors.
Risk of Investing in Derivatives: The Fund’s use of derivatives can result in losses due to unanticipated changes in the market risk factors and the overall market. In instances where the Fund is using derivatives to decrease, or hedge, exposures to market risk factors for securities held by the Fund, there are also risks that those derivatives may not perform as expected resulting in losses for the combined or hedged positions.
Derivatives may have little or no initial cash investment relative to their market value exposure and therefore can produce significant gains or losses in excess of their cost. This use of embedded leverage allows the Fund to increase its market value exposure relative to its net assets and can substantially increase the volatility of the Fund’s performance.
Additional associated risks from investing in derivatives also exist and potentially could have significant effects on the valuation of the derivative and the Fund. Typically, the associated risks are not the risks that the Fund is attempting to increase or decrease exposure to, per its investment objective, but are the additional risks from investing in derivatives.
| Semi-Annual Report | March 31, 2015 | 21 |
| Insignia Macro Fund | Notes to Consolidated Financial Statements |
March 31, 2015 (Unaudited)
Examples of these associated risks are liquidity risk, which is the risk that the Fund will not be able to sell or close out the derivative in a timely manner, and counterparty credit risk, which is the risk that the counterparty will not fulfill its obligation to the Fund. In addition, use of derivatives may increase or decrease exposure to the following risk factors:
Equity Risk: Equity risk relates to the change in value of equity securities as they relate to increases or decreases in the general market. Associated risks can be different for each type of derivative and are discussed by each derivative type in the notes
that follow.
that follow.
Commodity Risk: Exposure to the commodities markets may subject the Fund to greater volatility than investments in traditional securities. Prices of various commodities may also be affected by factors, such as drought, floods, weather, livestock disease, embargoes, tariffs and other regulatory developments, which are unpredictable. The prices of commodities can also fluctuate widely due to supply and demand disruptions in major producing or consuming regions.
Foreign Currency Risk: Currency trading involves significant risks, including market risk, interest rate risk, country risk, counterparty credit risk and short sale risk. Market risk results from the price movement of foreign currency values in response to shifting market supply and demand.
Interest Rate Risk: Interest rate risk is the risk that fixed income securities will decline in value because of changes in interest rates. As nominal interest rates rise, the value of fixed income securities held by the Fund are likely to decrease. Securities with longer durations tend to be more sensitive to changes in interest rates, and are usually more volatile than equity securities.
Swap Contracts: The Fund may enter into swap transactions to seek to increase total return. Risks may arise as a result of the failure of the counterparty to the swap contract to comply with the terms of the swap contract. The loss incurred by the failure of a counterparty is generally limited to the net payment to be received by the Fund and/or the termination value at the end of the contract.
Therefore, the Fund considers the creditworthiness of each counterparty to a contract in evaluating potential credit risk. Additionally, risks may arise from unanticipated movements in interest rates or in the value of the underlying reference asset or index. Entering into these agreements involves, to varying degrees, market risk, liquidity risk and elements of credit, legal and documentation risk that are not directly reflected in the amounts recognized in the Consolidated Statement of Assets and Liabilities.
The Fund may pay or receive cash as collateral on these contracts which may be recorded as an asset and/or liability. The Fund must set aside liquid assets, or engage in other appropriate measures, to cover its obligations under these contracts. Swaps are marked to market daily using either pricing vendor quotations, counterparty prices or model prices and the change in value, if any, is recorded as an unrealized gain or loss. Upfront payments made and/or received by the Fund are recorded as an asset and/or liability and realized gains or losses are recognized ratably over the contract’s term/event, with the exception of forward starting interest rate swaps, whose
| 22 | www.insigniafunds.com |
| Insignia Macro Fund | Notes to Consolidated Financial Statements |
March 31, 2015 (Unaudited)
realized gains or losses are recognized ratably from the effective start date. Periodic payments received or made on swap contracts are recorded as realized gains or losses. Gains or losses are realized upon termination of a swap contract and are recorded on the Statement of Operations.
The Fund invests in total return swaps to obtain exposure to a security or market without owning such security or investing directly in that market. Total return swaps are agreements in which there is an exchange of cash flows whereby one party commits to make payments based on the total return (coupons plus capital gains/losses) of an underlying instrument in exchange for fixed or floating rate interest payments. To the extent the total return of the instrument or index underlying the transaction exceeds or falls short of the offsetting interest rate obligation, the Fund will receive a payment from or make a payment to the counterparty. Swap agreements held at March 31, 2015 are disclosed in the Consolidated Portfolio of Investments.
The average notional shares of the Fund’s swap positions for the period ended March 31, 2015 was 41,439,686.
Derivative Instruments: The following tables disclose the amounts related to the Fund’s use of derivative instruments.
The effect of derivative instruments on the Consolidated Statement of Assets and Liabilities as of March 31, 2015:
| Asset | ||||||||||
| Derivatives | ||||||||||
| Consolidated Statement of | Gross | Liability Derivatives | ||||||||
| Assets and Liabilities | Unrealized | Gross Unrealized | ||||||||
| Risk Exposure | Location | Appreciaition | Depreciation | |||||||
| Commodity Contracts (total return swap contracts) | Unrealized appreciation on swap contracts | $ | 611,472 | $ | — | |||||
| Total | $ | 611,472 | $ | — | ||||||
The effect of derivative instruments on the Consolidated Statement of Operations for the period ended March 31, 2015:
| Change in Unrealized | ||||||||||
| Consolidated Statement | Realized Gain on | Depreciation on | ||||||||
| Risk Exposure | of Operations Location | Derivatives Recognized | Derivatives Recognized | |||||||
| Commodity Contracts (total return swap contracts) | Net realized gain on Swap Contracts/ Change in unrealized appreciation on swap contracts | $ | 3,845,278 | $ | (286,621 | ) | ||||
| Total | $ | 3,845,278 | $ | (286,621 | ) | |||||
| Semi-Annual Report | March 31, 2015 | 23 |
| Insignia Macro Fund | Notes to Consolidated Financial Statements |
March 31, 2015 (Unaudited)
4. OFFSETTING AGREEMENTS
Certain derivative contracts are executed under standardized netting agreements. A derivative netting arrangement creates an enforceable right of set‐off that becomes effective, and affects the realization of settlement on individual assets, liabilities and collateral amounts, only following a specified event of default or early termination. Default events may include the failure to make payments or deliver securities timely, material adverse changes in financial condition or insolvency, the breach of minimum regulatory capital requirements, or loss of license, charter or other legal authorization necessary to perform under the contract. The Fund may manage counterparty risk by entering into enforceable collateral arrangements with counterparties to securities lending agreements. These agreements mitigate counterparty credit risk by providing for a single net settlement with a counterparty of all financial transactions covered by the agreement in an event of default as defined under such agreement.
The following table presents derivative financial instruments and securities lending arrangements that are subject to enforceable netting arrangements, collateral arrangements or other similar agreements as of March 31, 2015.
| Gross Amounts Not Offset in the | ||||||||||||||||||||||||
| Statement of Assets and Liabilities | ||||||||||||||||||||||||
| Gross | Net Amounts | |||||||||||||||||||||||
| Amounts | Presented in | |||||||||||||||||||||||
| Offset in the | the | |||||||||||||||||||||||
| Gross | Consolidated | Consolidated | ||||||||||||||||||||||
| Amounts of | Statement of | Statement of | Cash | |||||||||||||||||||||
| Recognized | Assets and | Assets and | Financial | Collateral | Net Amount | |||||||||||||||||||
| Description | Assets | Liabilities | Liabilities | Instruments (a) | Received(a) | Receivable | ||||||||||||||||||
| Assets | ||||||||||||||||||||||||
| Total Return Swaps | $ | 611,472 | $ | — | $ | 611,472 | $ | — | $ | — | $ | 611,472 | ||||||||||||
| Total | $ | 611,472 | $ | — | $ | 611,472 | $ | — | $ | — | $ | 611,472 | ||||||||||||
(a) | These amounts are limited to the derivative liability balance and, accordingly, do not include excess collateral pledged. |
5. TAX BASIS INFORMATION
Tax Basis of Distributions to Shareholders: The character of distributions made during the period from net investment income or net realized gains may differ from its ultimate characterization for federal income tax purposes. Also, due to the timing of dividend distributions, the fiscal year in which amounts are distributed may differ from the fiscal year in which the income or realized gain were recorded by the Fund. The amounts and characteristics of tax basis distributions and composition of distributable earnings/(accumulated losses) are finalized at fiscal year‐end. Accordingly, tax basis balances have not been determined as of the date of the semi-annual.
| 24 | www.insigniafunds.com |
| Insignia Macro Fund | Notes to Consolidated Financial Statements |
March 31, 2015 (Unaudited)
Unrealized Appreciation and Depreciation on Investments: As of March 31, 2015, the aggregate cost of investments, gross unrealized appreciation/(depreciation) and net unrealized appreciation for Federal tax purposes were as follows:
| Gross unrealized appreciation (excess of value over tax cost) | $ | 9,722 | ||
| Gross unrealized depreciation (excess of tax cost over value) | (90,270 | ) | ||
| Net appreciation of foreign currency and derivatives | — | |||
| Net unrealized depreciation | $ | (80,548 | ) | |
| Cost of investments for income tax purposes | $ | 45,000,935 |
6. SECURITIES TRANSACTIONS
Purchases and sales of securities, excluding short‐term securities, during the six months ended March 31, 2015 were as follows:
| Purchases of Securities | Proceeds From Sales of Securities | |||||||
| $ | 29,766,909 | $ | 12,653,421 | |||||
Purchases and sales of U.S. Government Obligations during the period ended March 31, 2015 were as follows:
| Purchases of Securities | Proceeds From Sales of Securities | |||||||
| $ | 7,255,706 | $ | 2,080,000 | |||||
7. BENEFICIAL SHARE TRANSACTIONS
The capitalization of the Trust consists of an unlimited number of shares of beneficial interest with no par value per share. Holders of the shares of the Fund have one vote for each share held and a proportionate fraction of a vote for each fractional share. All shares issued and outstanding are fully paid and are non-assessable, transferable and redeemable at the option of the shareholder. Shares have no pre-emptive rights.
Shares redeemed within 60 days of purchase may incur a 1.00% short-term redemption fee deducted from the redemption amount. For the period ended March 31, 2015, the redemption fees charged by the Fund are presented in the Statements of Changes in Net Assets.
| Semi-Annual Report | March 31, 2015 | 25 |
| Insignia Macro Fund | Notes to Consolidated Financial Statements |
March 31, 2015 (Unaudited)
Transactions in common shares were as follows:
| Six Months | For the Period | |||||||
| Ended | Ended | |||||||
March 31, 2015 | September 30, 2014(a) | |||||||
| Class A: | ||||||||
| Shares sold | 17,253 | 8,162 | ||||||
| Shares issued in reinvestment of distributions to shareholders | 52 | — | ||||||
| Shares redeemed | (2,424 | ) | — | |||||
| Net increase from share transactions | 14,881 | 8,162 | ||||||
| Class I: | ||||||||
| Shares sold | 2,927,668 | 2,498,179 | ||||||
| Shares issued in reinvestment of distributions to shareholders | 1,032 | — | ||||||
| Shares redeemed | (217,284 | ) | (193,020 | ) | ||||
| Net increase from share transactions | 2,711,416 | 2,305,159 | ||||||
(a) | Commenced operations on January 2, 2014. |
Control is defined by the 1940 Act as the beneficial ownership, either directly or through one or more controlled companies, of more than 25% of the voting securities of a company. The Fund has two unaffiliated shareholders representing approximately 80% of total Fund shares. Investment activities of these shareholders could have a material impact on the Fund.
8. MANAGEMENT AND RELATED PARTY TRANSACTIONS
Investment Advisory: Meritage Capital, LLC (“Meritage Capital” or the “Adviser”), subject to the authority of the Board, is responsible for the overall management and administration of the Fund’s business affairs. The Adviser has delegated a portion of the daily management of the Fund to Sage Advisory Services, Ltd. Co. (the “Sub-Adviser”). The Adviser and the Sub-Adviser manage the investments of the Fund in accordance with the Fund’s investment objective, policies and limitations and investment guidelines established jointly by the Adviser and the Trustees.
Pursuant to the Investment Advisory Agreement (the “Advisory Agreement”) with the Adviser, the Fund pays the Adviser an annual management fee of 1.25%. Pursuant to an Investment Sub-Advisory Agreement (the “Sub-Advisory Agreement”), the Adviser pays the Sub-Adviser an annual sub-advisory management fee of 0.10% for the first $25 million, 0.18% basis points for the subsequent $25 million and 0.10% basis points once assets have reached over $50 million, with a minimum annual fee of $25,000. These management fees are based on the Fund’s average daily net assets during the month and are paid on a monthly basis. The Adviser is required to pay all fees due to the Sub-Adviser out of the management fee the Adviser receives from the Fund. The initial term for both the Advisory Agreement and Sub-Advisory Agreement is two years. The Board may extend the Advisory Agreement and/or the Sub-Advisory Agreement for additional one-year terms. The Board, shareholders of the Fund or the Adviser may terminate the Advisory Agreement or the Sub-Advisory Agreement upon 60 days’ notice.
| 26 | www.insigniafunds.com |
| Insignia Macro Fund | Notes to Consolidated Financial Statements |
March 31, 2015 (Unaudited)
Pursuant to a fee waiver letter agreement (the “Fee Waiver Agreement”), the Adviser has contractually agreed to limit the amount of the Fund’s Total Annual Fund Operating Expenses, exclusive of Distribution and Service (12b-1) fees, Shareholder Service Fees, Acquired Fund Fees and Expenses, brokerage expenses, interest expenses, taxes and extraordinary expenses, to 1.75% of the Fund’s average daily net assets for Class A and Class I shares. The Fee Waiver Agreement is in effect through January 31, 2016. The Adviser will be permitted to recover, on a class-by-class basis, expenses it has borne through the Fee Waiver Agreement to the extent that the Fund’s expenses in later periods fall below the annual rates set forth in the Fee Waiver Agreement. The Fund will not be obligated to pay any such deferred fees and expenses more than three years after the end of the fiscal year in which the fees and expense were deferred. The Adviser may not discontinue the Fee Waiver Agreement without the approval by the Fund’s Board.
For the six-months ended March 31, 2015, the fee waivers and/or reimbursements were as follows:
| Fees | ||||
| Waived/Reimbursed | ||||
| by Adviser | ||||
| Class A | $ | (419 | ) | |
| Class I | (150,357 | ) | ||
| TOTAL | $ | (150,776 | ) | |
As of March 31, 2015, the balances of recoupable expenses were as follows:
| Expires 2018 | Expires 2017 | |||||||
| Class A | $ | (419 | ) | $ | (27,075 | ) | ||
| Class I | (150,357 | ) | (272,155 | ) | ||||
Administrator: ALPS Fund Services, Inc (“ALPS”) (an affiliate of ALPS Distributors, Inc.) serves as administrator to the Fund. The Fund has agreed to pay expenses incurred in connection with its administrative activities. Pursuant to the Administration, Bookkeeping and Pricing Services Agreement with the Trust, ALPS will provide operational services to the Fund including, but not limited to, fund accounting and fund administration and generally assist in the Fund’s operations. The Fund’s administration fee is accrued on a daily basis and paid monthly. The officers of the Trust are employees of ALPS. Administration fees paid by the Fund for the six months ended March 31, 2015 are disclosed in the Statement of Operations.
ALPS is reimbursed by the Fund for certain out-of-pocket expenses.
Transfer Agent: ALPS serves as transfer agent for the Fund under a Transfer Agency and Services Agreement with the Trust. Under this agreement, ALPS is paid an annual fee for services performed on behalf of the Fund plus fees for open accounts and is reimbursed for certain out-of-pocket expenses.
Compliance Services: ALPS provides services as the Fund’s Chief Compliance Officer to monitor and test the policies and procedures of the Fund in conjunction with requirements under Rule 38a-1 under the 1940 Act pursuant to a Chief Compliance Officer Services Agreement with the Trust.
| Semi-Annual Report | March 31, 2015 | 27 |
| Insignia Macro Fund | Notes to Consolidated Financial Statements |
March 31, 2015 (Unaudited)
Under this agreement, ALPS is paid an annual fee for services performed on behalf of the Fund and is reimbursed for certain out-of-pocket expenses.
Distribution: ALPS Distributors, Inc. (the “Distributor”) (an affiliate of ALPS) acts as the principal underwriter of the Fund’s shares pursuant to a Distribution Agreement with the Trust. Shares of the Fund are offered on a continuous basis through the Distributor, as agent of the Fund. The Distributor is not obligated to sell any particular amount of shares and is not entitled to any compensation for its services as the Fund’s principal underwriter pursuant to the Distribution Agreement.
The Fund has adopted a separate plan of distribution for Class A shares pursuant to Rule 12b-1 under the 1940 Act (the “Plan”). The Plan allows the Fund to use Class A assets to pay fees in connection with the distribution and marketing of Class A shares and/or the provision of shareholder services to Class A shareholders. The Plan permits payment for services in connection with the administration of plans or programs that use Class A shares of the Fund as their funding medium and for related expenses. The Plan permits the Fund to make total payments at an annual rate of up to 0.25% of a Fund’s average daily net assets attributable to its Class A shares. Because these fees are paid out of the Fund’s Class A assets on an ongoing basis, over time they will increase the cost of an investment in Class A shares, and Plan fees may cost an investor more than other types of sales charges. Plan fees are shown as distribution and service fees on the Statement of Operations.
9. TRUSTEES
As of March 31, 2015, there were four Trustees, three of whom are not “interested persons” (as defined in the 1940 Act) of the Trust (the “Independent Trustees”). The Independent Trustees receive a quarterly retainer of $4,000, plus $2,000 for each regular Board or Committee meeting attended, $2,000 for each special telephonic Board or Commission meeting attended and $2,000 for each special in-person Board meeting attended. The Independent Trustees are also reimbursed for all reasonable out-of-pocket expenses relating to attendance at meetings and for meeting-related expenses. Officers of the Trust and Trustees who are interested persons of the Trust receive no salary or fees from the Trust.
10. INDEMNIFICATIONS
Under the Trust’s organizational documents, its officers and Trustees are indemnified against certain liabilities arising out of the performance of their duties to the Trust. Additionally, in the normal course of business, the Trust enters into contracts with service providers that may contain general indemnification clauses which may permit indemnification to the extent permissible under applicable law. The Trust’s maximum exposure under these arrangements is unknown, as this would involve future claims that may be made against the Trust that have not yet occurred.
| 28 | www.insigniafunds.com |
| Insignia Macro Fund | Additional Information |
March 31, 2015 (Unaudited)
1. PROXY VOTING POLICIES AND VOTING RECORD
A description of the policies and procedures that the Fund uses to determine how to vote proxies relating to portfolio securities is available without charge, upon request, (i) by calling the Fund (toll‐free) at 1‐855‐674‐4642 or (ii) on the website of the Securities and Exchange Commission (the “SEC”) at http://www.sec.gov.
Information regarding how the Fund voted proxies relating to portfolio securities during the most recent 12‐month period ended June 30 will be available (i) without charge, upon request, by calling the Fund (toll‐free) at 1‐855‐674‐4642 or (ii) on the SEC’s website at http://www.sec.gov.
2. PORTFOLIO HOLDINGS
The Fund files its complete schedule of portfolio holdings with the SEC for the first and third quarters of each fiscal year on Form N‐Q. The Fund’s Forms N‐Q are available on the SEC website at http://www.sec.gov. The Fund’s Forms N‐Q may be reviewed and copied at the SEC’s Public Reference Room in Washington, D.C., and information on the operation of the Public Reference Room may be obtained by calling 1‐800‐SEC‐0330.
| Semi-Annual Report | March 31, 2015 | 29 |
Table of Contents
| Shareholder Letter | 1 |
| Portfolio Update | 3 |
| Disclosure of Fund Expenses | 5 |
| Portfolio of Investments | 6 |
| Statement of Assets and Liabilities | 8 |
| Statement of Operations | 9 |
| Statements of Changes in Net Assets | 10 |
| Financial Highlights | 11 |
| Notes to Financial Statements | 12 |
| Additional Information | 17 |
| New Sheridan Developing World Fund | Shareholder Letter |
March 31, 2015 (Unaudited)
Dear Shareholders,
During the period of October 1st 2014 to March 31st 2015, the New Sheridan Developing World Fund (the “Fund”) depreciated 4.91% versus the MSCI Emerging Markets Index which depreciated 2.37%. From a geographic and sector perspective, the largest detractor of the Fund relative to the benchmark was our overweight in Mexican equities and overweight position in healthcare. We have steadily reduced our position in Mexican equities to reflect oil price weakness, and the resulting change in economic outlook. The highest positive contribution relative to the benchmark was attributed to our overweight position in the Philippines and our individual selections in financials, which outperformed the benchmark despite representing an underweight position in the sector.
The precipitous decline in oil during the 4th quarter of 2014 created both opportunities and challenges for many economies across the globe. For net energy importers, lower oil prices decreased trade imbalances, current account deficits, and served to strengthen the currencies. Several of these countries used the oil price decline to reduce or remove multi-year fuel subsidies that historically strained government budgets and created disincentives for oil and gas investment. India is an example where the oil price decline has served as an important tailwind for the economy, for both the government and the consumer.
For net energy exporters, lower oil prices increased trade imbalances, current account deficits and weakened currencies. Anticipating that oil revenues would drop severely in 2015, some countries aggressively decreased the fiscal budget and downwardly adjusted spending programs. Mexico is an example where the oil price decline has served as an impediment to the economy, and has dampened optimism surrounding the country’s important energy reform program.
Viewed as a whole, we believe lower oil prices are a net tailwind for the developing world. First, lower government expenditures on energy enable higher spending on infrastructure, healthcare, and education; spending in these important categories generate elevated returns on investment versus simply importing fuel. Secondly, a consumer in the developing world allocates a large percentage of wages towards basic needs, such as food and transportation, versus consumers in the developed world. While we believe lower oil prices benefit consumers worldwide, the positive effect on consumers in the developing world is greater than those in the developed world.
Global investing is incredibly dynamic. We anticipate a wide performance divergence amongst countries in the developing world to continue for the foreseeable future. The effect of the oil price decline on economies across the globe supports this view and further reinforces an active approach to portfolio management.
Thank you for your support and we look forward to future communication with our shareholders.
 |  |
| Russell Hoss, CFA Managing Partner | Richard Hoss Managing Partner |
The New Sheridan Developing World Fund is not suitable for all investors. Subject to investment risks, including possible loss of principal amount invested.
Carefully consider the risks and special considerations associated with investing in the Fund. You may lose money by investing in the Fund. Small-cap stocks are subject to substantial risks such as market, business, size volatility, management experience, product diversification, financial resource, competitive strength, liquidity and potential to fall out of favor that may cause their prices to fluctuate over time, sometimes rapidly and unpredictably. Foreign investments also present risks due to currency fluctuations, economic and political factors, lower liquidity, government regulations, differences in securities regulations and accounting standards, possible changes in taxation, limited public information and other factors. The risks are magnified in countries with emerging markets, since these countries may have relatively unstable governments and less established markets and economies.
Not FDIC Insured – No Bank Guarantee – May Lose Value
The views and information discussed in this commentary are as of the date of publication, are subject to change, and may not reflect the writer’s current views. The views expressed are those of the Fund’s adviser only, and represent an assessment of market conditions at a specific point in time,
| Semi-Annual Report | March 31, 2015 | 1 |
| New Sheridan Developing World Fund | Shareholder Letter |
March 31, 2015 (Unaudited)
are opinions only and should not be relied upon as investment advice regarding a particular investment or markets in general. Such information does not constitute a recommendation to buy or sell specific securities or investment vehicles. It should not be assumed that any investment will be profitable or will equal the performance of the fund(s) or any securities or any sectors mentioned in this letter. The subject matter contained in this letter has been derived from several sources believed to be reliable and accurate at the time of compilation. Neither the Fund nor the Adviser accepts any liability for losses either direct or consequential caused by the use of this information.
| 2 | 1.844.805.5999 | www.newsheridanadvisors.com |
| New Sheridan Developing World Fund | Portfolio Update |
March 31, 2015 (Unaudited)
Performance (for the period ended March 31, 2015)
| 3 Month | 6 Month | Since Inception* | ||
| New Sheridan Developing World Fund | 3.91% | -4.91% | -6.91% | |
MSCI Emerging Markets Index (a) | 2.24% | -2.37% | -10.25% | |
MSCI Frontier Markets Index (b) | -3.11% | -15.18% | -14.96% |
The performance data quoted above represents past performance. Past performance is not a guarantee of future results. Investment return and value of the Fund shares will fluctuate so that an investor’s shares, when sold or redeemed, may be worth more or less than their original cost. Performance may be lower or higher than performance data quoted. Fund performance current to the most recent month-end is available by calling (844) 805-5999 or by visiting www.newsheridanadvisors.com.
| * | Fund’s inception date is September 8, 2014. |
| (a) | MSCI Emerging Markets Index is a free float-adjusted market capitalization index that is designed to measure equity market performance in the global emerging markets. The index currently consists of 23 emerging economies. |
| (b) | MSCI Frontier Markets Index is a free float weighted index. MSCI currently classifies 33 countries as Frontier Markets, 24 of which are currently included in the MSCI Frontier Markets Index. |
Returns of less than 1 year are cumulative.
Indices are not actively managed and do not reflect deduction for fees, expenses or taxes. An investor cannot invest directly in an index.
The returns shown above do not reflect the deduction of taxes a shareholder would pay on Fund distributions or redemption of Fund shares.
The total annual operating expenses and total annual operating expenses after fee waivers and/or reimbursement you may pay as an investor in the Fund (as reported in the January 28, 2015 Prospectus) are 2.30% and 1.86%, respectively. The Fund’s investment adviser has contractually agreed to limit expenses through January 31, 2016.
The Fund is new and has a limited operating history.
Performance of $10,000 Initial Investment (for the period ended March 31, 2015)
The graph shown above represents historical performance of a hypothetical investment of $10,000 in the Fund since inception. Past performance does not guarantee future results. All returns reflect reinvested dividends, but do not reflect the deduction of taxes that a shareholder would pay on Fund distributions or the redemption of Fund shares.
| Semi-Annual Report | March 31, 2015 | 3 |
| New Sheridan Developing World Fund | Portfolio Update |
March 31, 2015 (Unaudited)
Top Ten Long Holdings (as a % of Net Assets)*
| AIA Group Ltd. | 5.69 | % | ||
| PT Bank Rakyat Indonesia Persero Tbk | 4.49 | % | ||
| Universal Robina Corp. | 3.47 | % | ||
| Great Wall Motor Co. Ltd.- Class H | 3.32 | % | ||
| GT Capital Holdings, Inc. | 2.58 | % | ||
| Fortis Healthcare Ltd. | 2.58 | % | ||
| Robinsons Retail Holdings, Inc. | 2.51 | % | ||
| BDO Unibank, Inc. | 2.50 | % | ||
| PT Siloam International Hospitals Tbk | 2.41 | % | ||
| Techtronic Industries Co. Ltd. | 2.38 | % | ||
| Top Ten Holdings | 31.93 | % |
Country Allocation (as a % of Net Assets)*
| Philippines | 15.10 | % | ||
| Indonesia | 13.38 | % | ||
| China | 11.23 | % | ||
| India | 10.89 | % | ||
| Hong Kong | 8.07 | % | ||
| Taiwan | 6.62 | % | ||
| Vietnam | 5.33 | % | ||
| Mexico | 4.71 | % | ||
| South Korea | 3.61 | % | ||
| Thailand | 3.46 | % | ||
| Egypt | 3.20 | % | ||
| United States | 2.22 | % | ||
| South Africa | 2.10 | % | ||
| Malaysia | 2.04 | % | ||
| Singapore | 2.04 | % | ||
| Chile | 1.12 | % | ||
| Argentina | 1.12 | % | ||
| Cash, Cash Equivalents, & Other Net Assets | 3.76 | % | ||
| Total | 100.00 | % |
| * | Holdings are subject to change. Tables present indicative values only. |
| 4 | 1.844.805.5999 | www.newsheridanadvisors.com |
| New Sheridan Developing World Fund | Disclosure of Fund Expenses |
March 31, 2015 (Unaudited)
Examples. As a shareholder of the New Sheridan Developing World Fund (the “Fund”), you incur two types of costs: (1) transaction costs, including applicable redemption fees; and (2) ongoing costs, including management fees, distribution and service (12b-1) fees and other Fund expenses. The following examples are intended to help you understand your ongoing costs (in dollars) of investing in the Fund and to compare these costs with the ongoing costs of investing in other mutual funds. The examples are based on an investment of $1,000 invested on October 1, 2014 and held through March 31, 2015.
Actual Expenses. The first line of the table below provides information about actual account values and actual expenses. You may use the information in this line, together with the amount you invested, to estimate the expenses that you paid over the period. Simply divide your account value by $1,000 (for example, an $8,600 account value divided by $1,000 = 8.6), then multiply the result by the number in the first line under the heading “Expenses Paid During Period October 1, 2014 – March 31, 2015” to estimate the expenses you paid on your account during this period.
Hypothetical Example for Comparison Purposes. The second line of the table below provides information about hypothetical account values and hypothetical expenses based on the Fund’s actual expense ratio and an assumed rate of return of 5% per year before expenses, which is not the Fund’s actual return. The hypothetical account values and expenses may not be used to estimate the actual ending account balance or expenses you paid for the period. You may use this information to compare the ongoing costs of investing in the Fund and other mutual funds. To do so, compare this 5% hypothetical example with the 5% hypothetical examples that appear in the shareholder reports of the other mutual funds.
Please note that the expenses shown in the table are meant to highlight your ongoing Fund costs only and do not reflect any transactional costs, such as redemption fees. Therefore, the second line of the table below is useful in comparing ongoing costs only and may not help you determine the relative total costs of owning different funds. In addition, if these transactional costs were included, your costs would have been higher.
| Expense Paid | ||||||||||||||||
| During Period | ||||||||||||||||
| Beginning Account Value | Ending Account Value | Expense | October 1, 2014- | |||||||||||||
| October 1, 2014 | March 31, 2015 | Ratio(a) | March 31, 2015(b) | |||||||||||||
| New Sheridan Developing World Fund Investor | ||||||||||||||||
| Actual | $ | 1,000.00 | $ | 950.90 | 1.85 | % | $ | 9.00 | ||||||||
| Hypothetical (5% return before expenses) | $ | 1,000.00 | $ | 1,015.71 | 1.85 | % | $ | 9.30 | ||||||||
| (a) | The Fund’s expense ratios have been annualized based on the Fund's most recent fiscal half-year expenses. |
| (b) | Expenses are equal to the Fund's annualized expense ratio multiplied by the average account value over the period, multiplied by the number of days in the most recent fiscal half year (182), divided by 365. |
| Semi-Annual Report | March 31, 2015 | 5 |
| New Sheridan Developing World Fund | Portfolio of Investments |
March 31, 2015 (Unaudited)
| Value | ||||||||
| Shares | (Note 2) | |||||||
| COMMON STOCKS (96.24%) | ||||||||
| Argentina (1.12%) | ||||||||
| Banco Macro SA ADR | 500 | $ | 28,600 | |||||
| Chile (1.12%) | ||||||||
| E.CL SA | 18,258 | 28,616 | ||||||
| China (11.23%) | ||||||||
Alibaba Group Holding Ltd. Sponsored ADR(a) | 600 | 49,944 | ||||||
| Great Wall Motor Co. Ltd.‐ Class H | 12,000 | 84,596 | ||||||
| Ping An Insurance Group Co. of China Ltd.‐ Class H | 5,000 | 59,983 | ||||||
| Sihuan Pharmaceutical Holdings Group Ltd. | 66,000 | 37,543 | ||||||
WuXi PharmaTech Cayman, Inc. ADR(a) | 1,400 | 54,292 | ||||||
| Total China | 286,358 | |||||||
| Egypt (3.20%) | ||||||||
| Commercial International Bank Egypt SAE | 6,300 | 46,441 | ||||||
| Oriental Weavers | 25,000 | 35,069 | ||||||
| Total Egypt | 81,510 | |||||||
| Hong Kong (8.07%) | ||||||||
| AIA Group Ltd. | 23,100 | 145,033 | ||||||
| Techtronic Industries Co. Ltd. | 18,000 | 60,685 | ||||||
| Total Hong Kong | 205,718 | |||||||
| India (10.89%) | ||||||||
| Axis Bank Ltd. | 5,400 | 48,431 | ||||||
| Bharat Forge Ltd. | 2,800 | 57,158 | ||||||
Fortis Healthcare Ltd. (a) | 25,000 | 65,755 | ||||||
| Motherson Sumi Systems Ltd. | 6,900 | 56,713 | ||||||
| Tata Motors Ltd. Sponsored ADR | 1,100 | 49,566 | ||||||
| Total India | 277,623 | |||||||
| Indonesia (13.38%) | ||||||||
| PT Bank Rakyat Indonesia Persero Tbk | 113,000 | 114,618 | ||||||
| PT Global Mediacom Tbk | 400,000 | 53,458 | ||||||
| PT Indofood CBP Sukses Makmur Tbk | 50,000 | 56,047 | ||||||
| PT Matahari Department Store Tbk | 37,000 | 55,641 | ||||||
PT Siloam International Hospitals Tbk (a) | 60,000 | 61,491 | ||||||
| Total Indonesia | 341,255 | |||||||
| Malaysia (2.04%) | ||||||||
| IHH Healthcare Bhd | 32,000 | 51,929 | ||||||
| Mexico (4.71%) | ||||||||
| Credito Real SAB de CV | 18,110 | 42,706 | ||||||
| Value | ||||||||
| Shares | (Note 2) | |||||||
| Mexico (continued) | ||||||||
Grupo Industrial Saltillo SAB de CV (a) | 16,000 | $ | 33,744 | |||||
| Infraestructura Energetica Nova SAB de CV | 8,000 | 43,694 | ||||||
| Total Mexico | 120,144 | |||||||
| Philippines (15.10%) | ||||||||
| Ayala Corp. | 3,000 | 53,314 | ||||||
| BDO Unibank, Inc. | 23,000 | 63,738 | ||||||
| GT Capital Holdings, Inc. | 2,200 | 65,866 | ||||||
| Robinsons Retail Holdings, Inc. | 34,000 | 63,893 | ||||||
SSI Group, Inc. (a)(b) | 220,000 | 50,070 | ||||||
| Universal Robina Corp. | 17,500 | 88,397 | ||||||
| Total Philippines | 385,278 | |||||||
| Singapore (2.04%) | ||||||||
| Silverlake Axis Ltd. | 52,000 | 51,911 | ||||||
| South Africa (2.10%) | ||||||||
| Mr Price Group Ltd. | 2,500 | 53,470 | ||||||
| South Korea (3.61%) | ||||||||
i‐SENS, Inc. (a) | 1,000 | 44,045 | ||||||
| Koh Young Technology, Inc. | 1,200 | 48,044 | ||||||
| Total South Korea | 92,089 | |||||||
| Taiwan (6.62%) | ||||||||
| Advantech Co. Ltd. | 7,600 | 57,791 | ||||||
| Delta Electronics, Inc. | 8,500 | 53,562 | ||||||
| Hermes Microvision, Inc. | 1,000 | 57,532 | ||||||
| Total Taiwan | 168,885 | |||||||
| Thailand (3.46%) | ||||||||
Kasikornbank Pub Co. PCL (a) | 7,000 | 49,220 | ||||||
| MC Group PCL | 87,000 | 39,029 | ||||||
| Total Thailand | 88,249 | |||||||
| United States (2.22%) | ||||||||
| Nexteer Automotive Group Ltd. | 56,000 | 56,492 | ||||||
| Vietnam (5.33%) | ||||||||
| Bank for Foreign Trade of Vietnam JSC | 28,900 | 47,061 | ||||||
| Japan Vietnam Medical Instrument JSC | 50,000 | 47,784 | ||||||
Mobile World Investment Corp. (a) | 8,290 | 41,152 | ||||||
| Total Vietnam | 135,997 | |||||||
| TOTAL COMMON STOCKS | ||||||||
| (Cost $2,313,117) | 2,454,124 | |||||||
See Notes to Financial Statements.
| 6 | 1.844.805.5999 | www.newsheridanadvisors.com |
| New Sheridan Developing World Fund | Portfolio of Investments |
March 31, 2015 (Unaudited)
| Value | ||||||||||||
| 7 Day Yield | Shares | (Note 2) | ||||||||||
| SHORT TERM INVESTMENTS (2.80%) | ||||||||||||
| Morgan Stanley Institutional Liquidity Funds | 0.071 | % | 71,358 | 71,358 | ||||||||
| TOTAL SHORT TERM INVESTMENTS (Cost $71,358) | 71,358 | |||||||||||
| TOTAL INVESTMENTS (99.04%) (Cost $2,384,475) | $ | 2,525,482 | ||||||||||
| Net Other Assets Less Liabilities (0.96%) | 24,633 | |||||||||||
| NET ASSETS (100.00%) | $ | 2,550,115 | ||||||||||
(a) | Non-income producing security. |
(b) | These securities were initially sold to other parties pursuant to Regulation S under the Securities Act of 1933, as amended, and subsequently resold to the Fund. As of March 31, 2015, the aggregate market values of these securities were $50,070, representing 1.96% of the Fund’s net assets. |
Common Abbreviations:
| ADR | - | American Depositary Receipt. |
| Bhd | - | Berhad, Public Limited Company in Malaysia. |
| JSC | - | Joint Stock Company |
| Ltd. | - | Limited. |
| PCL | - | A rearrangement of the letters for Public Limited Company, used in Thailand. |
| PT | - | Perseroan Terbatas, meaning “private limited”, which is the equivalent of an incorporated entity in the U.S. |
| SA | - | Generally designated corporations in various countries, mostly those employing civil law. |
| SAB de CV | - | A variable capital company. |
| SAE | - | SAE, Societe Anonyme Egyptienne ( Egyptian Joint Stock Company) |
| Tbk | - | Terbuka is appended after the corporation name if the shares become publicly listed for trading. |
See Notes to Financial Statements.
| Semi-Annual Report | March 31, 2015 | 7 |
| New Sheridan Developing World Fund | Statement of Assets and Liabilities |
March 31, 2015 (Unaudited)
| ASSETS: | ||||
| Investments, at value (Cost $2,384,475) | $ | 2,525,482 | ||
| Foreign currency, at value (Cost $8,007) | 7,916 | |||
| Dividends receivable | 3,398 | |||
| Receivable due from advisor | 44,782 | |||
| Prepaid offering costs | 6,050 | |||
| Prepaid expenses and other assets | 5,279 | |||
| Total Assets | 2,592,907 | |||
| LIABILITIES: | ||||
| Foreign capital gains tax | 3,766 | |||
| Payable administration and transfer agency fees | 13,336 | |||
| Payable distribution and services fees | 540 | |||
| Trustees’ fees and expenses payable | 28 | |||
| Payable to chief compliance officer | 1,628 | |||
| Payable for shareholder reports | 785 | |||
| Payable legal fees | 6,934 | |||
| Payable audit and tax fees | 11,646 | |||
| Custody fees payable | 2,259 | |||
| Accrued expenses and other liabilities | 1,870 | |||
| Total Liabilities | 42,792 | |||
| NET ASSETS | $ | 2,550,115 | ||
| NET ASSETS CONSIST OF: | ||||
| Paid‐in capital (Note 5) | $ | 2,703,734 | ||
| Accumulated net investment loss | (17,688 | ) | ||
| Accumulated net realized loss on investments and foreign currency transactions | (273,069 | ) | ||
| Net unrealized appreciation on investments and translation of assets and liabilities denominated in foreign currencies | 137,138 | |||
| NET ASSETS | $ | 2,550,115 | ||
| PRICING OF SHARES | ||||
| Net Asset Value, offering and redemption price per share | $ | 9.30 | ||
| Shares of beneficial interest outstanding | 274,217 | |||
See Notes to Financial Statements.
| 8 | 1.844.805.5999 | www.newsheridanadvisors.com |
| New Sheridan Developing World Fund | Statement of Operations |
For the Period Ended March 31, 2015 (Unaudited)
| INVESTMENT INCOME: | ||||
| Dividends | $ | 5,974 | ||
| Foreign taxes withheld on dividends | (866 | ) | ||
| Total Investment Income | 5,108 | |||
| EXPENSES: | ||||
| Investment advisory fees (Note 6) | 16,028 | |||
| Administrative and transfer agency fees | 77,842 | |||
| Distribution and service fees | 2,968 | |||
| Legal fees | 6,852 | |||
| Audit and tax fees | 8,646 | |||
| Printing fees | 38 | |||
| State registration fees | 1,723 | |||
| SEC registration fees | 27 | |||
| Insurance fees | 129 | |||
| Custody fees | 8,173 | |||
| Trustees’ fees and expenses | 848 | |||
| Chief compliance officer fees | 9,978 | |||
| Offering costs | 32,713 | |||
| Other expenses | 5,678 | |||
| Total Expenses | 171,643 | |||
| Less fees waived/reimbursed by investment advisor (Note 6) | (149,678 | ) | ||
| Net Expenses | 21,965 | |||
| NET INVESTMENT LOSS | (16,857 | ) | ||
| REALIZED AND UNREALIZED GAIN/(LOSS) ON INVESTMENTS: | ||||
| Net realized gain/(loss) on: | ||||
| Investments | (273,207 | ) | ||
| Foreign currency transactions | 138 | |||
| Net realized loss | (273,069 | ) | ||
| Net change in appreciation/(depreciation) on: | ||||
Investments (net of foreign capital gains tax of $(3,766)) | 182,192 | |||
| Translation of assets and liabilities denominated in foreign currencies | (103 | ) | ||
| Net change | 182,089 | |||
| NET REALIZED AND UNREALIZED LOSS ON INVESTMENTS | (90,980 | ) | ||
| NET DECREASE IN NET ASSETS RESULTING FROM OPERATIONS | $ | (107,837 | ) | |
See Notes to Financial Statements.
| Semi-Annual Report | March 31, 2015 | 9 |
| New Sheridan Developing World Fund | Statements of Changes in Net Assets |
| For the Six | For the Period | |||||||
| Months Ended | Ended | |||||||
| March 31, 2015 | September 30, | |||||||
| (Unaudited) | 2014(a) | |||||||
| OPERATIONS: | ||||||||
| Net investment loss | $ | (16,857 | ) | $ | (1,913 | ) | ||
| Net realized gain/(loss) on investments and foreign currency transactions | (273,069 | ) | 2,989 | |||||
| Net change in unrealized appreciation/(depreciation) on investments and translation of assets and liabilities in foreign currencies | 182,089 | (44,951 | ) | |||||
| Net Decrease in Net Assets Resulting from Operations | (107,837 | ) | (43,875 | ) | ||||
| DISTRIBUTIONS: | ||||||||
| Dividends to shareholders from net investment income Investor Class | (2,251 | ) | — | |||||
| Net Decrease in Net Assets from Distributions | (2,251 | ) | — | |||||
| BENEFICIAL INTEREST TRANSACTIONS (NOTE 5): | ||||||||
| Shares sold | 630,890 | 2,070,937 | ||||||
| Dividends reinvested | 2,251 | 0 | ||||||
| Net Increase from capital share transactions | 633,141 | 2,070,937 | ||||||
| Net increase in net assets | 523,053 | 2,027,062 | ||||||
| NET ASSETS | ||||||||
| Beginning of period | 2,027,062 | — | ||||||
| End of period (Including accumulated net investment income/(loss) of $(17,688) and $1,420) | $ | 2,550,115 | $ | 2,027,062 | ||||
(a) | Commenced operations on September 9, 2014. |
See Notes to Financial Statements.
| 10 | 1.844.805.5999 | www.newsheridanadvisors.com |
| New Sheridan Developing World Fund | Financial Highlights |
For a Share Outstanding Throughout the Periods Presented
| For the | ||||||||
| Six Months Ended | For the Period | |||||||
| March 31, 2015 | Ended | |||||||
| (Unaudited) | September 30, 2014(a) | |||||||
| Net asset value, beginning of period | $ | 9.79 | $ | 10.00 | ||||
| INCOME FROM INVESTMENT OPERATIONS: | ||||||||
Net investment loss(b) | (0.07 | ) | (0.01 | ) | ||||
| Net realized and unrealized loss | (0.41 | ) | (0.20 | ) | ||||
| Total from investment operations | (0.48 | ) | (0.21 | ) | ||||
| DISTRIBUTIONS: | ||||||||
| From net investment income | (0.01 | ) | (0.01 | ) | ||||
| Total distributions | (0.01 | ) | — | |||||
| Net decrease in net asset value | (0.49 | ) | (0.21 | ) | ||||
| Net asset value, end of period | $ | 9.30 | $ | 9.79 | ||||
TOTAL RETURN(c) | (4 .91 | )% | (2.10 | )% | ||||
| SUPPLEMENTAL DATA: | ||||||||
| Net assets, end of period (000s) | $ | 2,550 | $ | 2,027 | ||||
| RATIOS TO AVERAGE NET ASSETS | ||||||||
| Ratio of expenses to average net assets excluding fee waivers and reimbursements | 14 .46 | %(d) | 34.14 | %(d) | ||||
| Ratio of expenses to average net assets including fee waivers and reimbursements | 1 .85 | %(d) | 1.85 | %(d) | ||||
| Ratio of net investment loss to average net assets | (1 .42 | )%(d) | (1.82 | )%(d) | ||||
Portfolio turnover rate(e) | 55 .0 | % | 0.0 | % | ||||
(a) | Commenced operations on September 9, 2014. |
(b) | Calculated using the average shares method. |
(c) | Total returns are for the period indicated and have not been annualized. Total returns would have been lower had certain expenses not been waived during the period. Returns shown do not reflect the deduction of taxes that a shareholder would pay on Fund distributions or the redemption of Fund shares. |
(d) | Annualized. |
(e) | Portfolio turnover rate for periods less than one full year have not been annualized. |
See Notes to Financial Statements.
| Semi-Annual Report | March 31, 2015 | 11 |
| New Sheridan Developing World Fund | Notes to Financial Statements |
| March 31, 2015 (Unaudited) |
| 1. ORGANIZATION |
The ALPS Series Trust (the “Trust”), a Delaware statutory trust, is an open-end management investment company registered under the Investment Company Act of 1940, as amended (the “1940 Act”). As of March 31, 2015, the Trust had nine registered funds. This semi-annual report describes the New Sheridan Developing World Fund (the “Fund”). The Fund’s primary investment objective is to seek long term capital appreciation. The Fund currently offers Investor Class shares. The Trust has an unlimited number of shares with no par value per share. The Board of Trustees (the “Board”) may establish additional funds and classes of shares at any time in the future without shareholder approval.
| 2. SIGNIFICANT ACCOUNTING POLICIES |
The accompanying financial statements were prepared in accordance with accounting principles generally accepted in the United States of America for investment companies (“U.S. GAAP”). The Fund is considered an investment company for financial reporting purposes. The preparation of financial statements in conformity with U.S. GAAP requires management to make certain estimates and assumptions that affect the reported amounts of assets and liabilities and disclosures of contingent assets and liabilities at the date of the financial statements and the reported amounts of revenue and expenses during the period. Actual results could differ from those estimates. The following is a summary of significant accounting policies consistently followed by the Fund in preparation of its financial statements.
Investment Valuation: The Fund generally values its securities based on market prices determined at the close of regular trading on the New York Stock Exchange (“NYSE”), normally 4:00 p.m. Eastern Time, on each day the NYSE is open for trading.
For equity securities and mutual funds that are traded on an exchange, the market price is usually the closing sale or official closing price on that exchange. In the case of equity securities not traded on an exchange, or if such closing prices are not otherwise available, the securities are valued at the mean of the most recent bid and ask prices on such day.
Equity securities that are primarily traded on foreign securities exchanges are valued at the closing values of such securities on their respective foreign exchanges, except when an event occurs subsequent to the close of the foreign exchange and the close of the NYSE that was likely to have changed such value. In such an event, the fair values of those securities are determined in good faith through consideration of other factors in accordance with procedures established by and under the general supervision of the Board. The Fund will use a fair valuation model provided by an independent pricing service, which is intended to reflect fair value when a security’s value or a meaningful portion of the Fund’s portfolio is believed to have been materially affected by a valuation event that has occurred between the close of the exchange or market on which the security is traded and the close of the regular trading day on the NYSE.
Redeemable securities issued by open-end registered investment companies are valued at the investment company’s applicable net asset value, with the exception of exchange-traded open-end investment companies, which are priced as equity securities.
When such prices or quotations are not available, or when the Fair Value Committee appointed by the Board believes that they are unreliable, securities may be priced using fair value procedures approved by the Board.
Fair Value Measurements: The Fund discloses the classification of their fair value measurements following a three-tier hierarchy based on the inputs used to measure fair value. Inputs refer broadly to the assumptions that market participants would use in pricing the asset or liability, including assumptions about risk. Inputs may be observable or unobservable. Observable inputs reflect the assumptions market participants would use in pricing the asset or liability that are developed based on market data obtained from sources independent of the reporting entity. Unobservable inputs reflect the reporting entity’s own assumptions about the assumptions market participants would use in pricing the asset or liability that are developed based on the best information available.
Various inputs are used in determining the value of the Fund’s investments as of the end of the reporting period. When inputs used fall into different levels of the fair value hierarchy, the level in the hierarchy within which the fair value measurement falls is determined based on the lowest level input that is significant to the fair value measurement in its entirety. The designated input levels are not necessarily an indication of the risk or liquidity associated with these investments. These inputs are categorized in the following hierarchy under applicable financial accounting standards:
| Level 1 – | Unadjusted quoted prices in active markets for identical investments, unrestricted assets or liabilities that the Funds have the ability to access at the measurement date; |
| Level 2 – | Quoted prices which are not active, quoted prices for similar assets or liabilities in active markets or inputs other than quoted prices that are observable (either directly or indirectly) for substantially the full term of the asset or liability; and |
| 12 | 1.844.805.5999 | www.newsheridanadvisors.com |
| New Sheridan Developing World Fund | Notes to Financial Statements |
| March 31, 2015 (Unaudited) |
| Level 3 – | Significant unobservable prices or inputs (including the Fund’s own assumptions in determining the fair value of investments) where there is little or no market activity for the asset or liability at the measurement date. |
The following is a summary of the inputs used to value the Fund’s investments as of March 31, 2015:
| New Sheridan Developing World Fund | ||||||||||||||||
| Level 2 - Other Significant | Level 3 - Significant | |||||||||||||||
| Investments in Securities at Value | Level 1 - Quoted Prices | Observable Inputs | Unobservable Inputs | Total | ||||||||||||
| Common Stocks | ||||||||||||||||
| Argentina | $ | 28,600 | $ | — | $ | — | $ | 28,600 | ||||||||
| Chile | 28,616 | — | — | 28,616 | ||||||||||||
| China | 104,236 | 182,122 | — | 286,358 | ||||||||||||
| Egypt | — | 81,510 | — | 81,510 | ||||||||||||
| Hong Kong | — | 205,718 | — | 205,718 | ||||||||||||
| India | 115,321 | 162,302 | — | 277,623 | ||||||||||||
| Indonesia | 61,491 | 279,764 | — | 341,255 | ||||||||||||
| Malaysia | 51,929 | — | — | 51,929 | ||||||||||||
| Mexico | 120,144 | — | — | 120,144 | ||||||||||||
| Philippines | 63,893 | 321,385 | — | 385,278 | ||||||||||||
| Singapore | 51,911 | — | — | 51,911 | ||||||||||||
| South Africa | — | 53,470 | — | 53,470 | ||||||||||||
| South Korea | — | 92,089 | — | 92,089 | ||||||||||||
| Taiwan | — | 168,885 | — | 168,885 | ||||||||||||
| Thailand | — | 88,249 | — | 88,249 | ||||||||||||
| United States | — | 56,492 | — | 56,492 | ||||||||||||
| Vietnam | 135,997 | — | — | 135,997 | ||||||||||||
| Short Term Investments | 71,358 | — | — | 71,358 | ||||||||||||
| TOTAL | $ | 833,496 | $ | 1,691,986 | $ | — | $ | 2,525,482 | ||||||||
The Fund recognizes transfers between levels as of the end of the period. For the period ended March 31, 2015, the Fund did not have any transfers between Level 1 and Level 2 securities. There were no Level 3 securities held during the period.
Offering Costs: The Fund incurred offering costs during the period ended March 31, 2015. These offering costs, including fees for printing initial prospectuses, legal and registration fees, are being amortized over the first twelve months from the inception date of the Fund. Amounts amortized through March 31, 2015 are shown on the Fund’s Statement of Operations and amounts that remain to be amortized are shown on the Fund’s Statement of Assets and Liabilities.
Trust Expenses: Some expenses of the Trust can be directly attributed to the Fund. Expenses which cannot be directly attributed to the Fund are apportioned among all funds in the Trust based on average net assets of each fund.
Federal Income Taxes: The Fund complies with the requirements under Subchapter M of the Internal Revenue Code of 1986, as amended, applicable to regulated investment companies and intends to distribute substantially all of its net taxable income and net capital gains, if any, each year so that it will not be subject to excise tax on undistributed income and gains. The Fund is not subject to income taxes to the extent such distributions are made.
As of and during the period ended March 31, 2015, the Fund did not have a liability for any unrecognized tax benefits in the accompanying financial statements. The Fund files U.S federal, state and local income tax returns as required. The Fund’s tax returns are subject to examination by the relevant tax authorities until expiration of the applicable statute of limitations, which is generally three years after the filing of the tax return for federal purposes and four years for most state returns. The Fund’s administrator has analyzed the Fund’s tax positions taken on federal and state income tax returns for all open tax years and has concluded that as of March 31, 2015, no provision for income tax is required in the Fund’s financial statements related to these tax positions.
Investment Transactions and Investment Income: Investment transactions are accounted for on the date the investments are purchased or sold (trade date basis). Realized gains and losses from investment transactions are reported on an identified cost basis. Interest income, which includes accretion of discounts and amortization of premiums, is accrued and recorded as earned. Dividend income is recognized on the
| Semi-Annual Report | March 31, 2015 | 13 |
| New Sheridan Developing World Fund | Notes to Financial Statements |
| March 31, 2015 (Unaudited) |
ex-dividend date, or for certain foreign securities, as soon as information is available to the Fund. All of the realized and unrealized gains and losses and net investment income are allocated daily to each class in proportion to its average daily net assets.
Foreign Securities: The Fund may directly purchase securities of foreign issuers. Investing in securities of foreign issuers involves special risks not typically associated with investing in securities of U.S. issuers. The risks include possible reevaluation of currencies, the inability to repatriate foreign currency, less complete financial information about companies and possible future adverse political and economic developments. Moreover, securities of many foreign issuers and their markets may be less liquid and their prices more volatile than those of securities of comparable U.S. issuers.
Foreign Currency Translation: The books and records of the Fund are maintained in U.S. dollars. Investment valuations and other assets and liabilities initially expressed in foreign currencies are converted each business day into U.S. dollars based upon current exchange rates. The portion of realized and unrealized gains or losses on investments due to fluctuations in foreign currency exchange rates is not separately disclosed and is included in realized and unrealized gains or losses on investments, when applicable.
Foreign Exchange Transactions: The Fund may enter into foreign currency spot contracts to facilitate transactions in foreign securities or to convert foreign currency receipts into U.S. dollars. A foreign currency spot contract is an agreement between two parties to buy and sell currencies at the current market rate, for settlement generally within two business days. The U.S. dollar value of the contracts is determined using current currency exchange rates supplied by a pricing service. The contract is marked-to-market daily for settlements beyond one day and any change in market value is recorded as an unrealized gain or loss. When the contract is closed, the Fund records a realized gain or loss equal to the difference between the value on the open and close date. Losses may arise from changes in the value of the foreign currency, or if the counterparties do not perform under the contract’s terms. The maximum potential loss from such contracts is the aggregate face value in U.S. dollars at the time the contract was opened.
Distributions to Shareholders: The Fund normally pays dividends, if any, and distributes capital gains, if any, on an annual basis. Income dividend distributions are derived from interest and other income the Fund receives from its investments, including short term capital gains. Long term capital gain distributions are derived from gains realized when the Fund sells a security it has owned for more than one year. The Fund may make additional distributions and dividends at other times if its portfolio manager or managers believe doing so may be necessary for the Fund to avoid or reduce taxes. Net investment income/(loss) and net realized gain/(loss) may differ for financial statement and tax purposes.
| 3. TAX BASIS INFORMATION |
Tax Basis of Distributions to Shareholders: The character of distributions made during the period from net investment income or net realized gains may differ from its ultimate characterization for federal income tax purposes. Also, due to the timing of dividend distributions, the fiscal year in which amounts are distributed may differ from the fiscal year in which the income or realized gain were recorded by the Fund. The amounts and characteristics of tax basis distributions and composition of distributable earnings/(accumulated losses) are finalized at fiscal year‐end. Accordingly, tax basis balances have not been determined as of the date of the semi-annual.
Unrealized Appreciation and Depreciation on Investments: As of March 31, 2015, the aggregate costs of investments, gross unrealized appreciation/(depreciation) and net unrealized appreciation for Federal tax purposes were as follows:
| Gross unrealized appreciation (excess of value over tax cost) | $ | 238,930 | ||
| Gross unrealized depreciation (excess of tax cost over value) | (97,923 | ) | ||
| Net unrealized appreciation (depreciation) | 141,007 | |||
| Cost of investments for income tax purposes | $ | 2,384,475 |
| 14 | 1.844.805.5999 | www.newsheridanadvisors.com |
| New Sheridan Developing World Fund | Notes to Financial Statements |
| March 31, 2015 (Unaudited) |
| 4. SECURITIES TRANSACTIONS |
Purchases and sales of securities, excluding short‐term securities, during the period ended March 31, 2015 were as follows:
| Proceeds from Sales of | ||||||||
| Purchases of Securities | Securities | |||||||
| $ | 1,972,303 | $ | 1,283,106 | |||||
| 5. BENEFICIAL SHARE TRANSACTIONS |
The capitalization of the Trust consists of an unlimited number of shares of beneficial interest with no par value per share. Holders of the shares of the Fund have one vote for each share held and a proportionate fraction of a vote for each fractional share. All shares issued and outstanding are fully paid and are non-assessable, transferable and redeemable at the option of the shareholder. Shares have no pre-emptive rights.
Shares redeemed within 30 calendar days of purchase may incur a 2% short-term redemption fee deducted from the redemption amount. For the six-month period ended March 31, 2015, the redemption fees charged by the Fund are presented in the Statements of Changes in Net Assets.
Transactions in common shares were as follows:
| For the | |||||||||
| Six Months Ended | For the | ||||||||
| March 31, 2015 | Period Ended | ||||||||
| (Unaudited) | September 30, 2014(a) | ||||||||
| Shares sold | 66,853 | 207,105 | |||||||
| Dividends reinvested | 259 | — | |||||||
| Shares redeemed | — | — | |||||||
| Net increase in shares outstanding | 67,112 | 207,105 | |||||||
(a) | Commenced operations on September 9, 2014. |
Control is defined by the 1940 Act as the beneficial ownership, either directly or through one or more controlled companies, of more than 25% of the voting securities of a company. The Fund had two affiliated shareholders representing approximately 32% of total Fund shares. Investment activities of these shareholders could have a material impact on the Fund.
| 6. MANAGEMENT AND RELATED PARTY TRANSACTIONS |
Investment Advisory: New Sheridan Advisors, LLC (“New Sheridan” or the “Adviser”), subject to the authority of the Board, is responsible for the overall management and administration of the Fund’s business affairs. The Adviser manages the investments of the Fund in accordance with the Fund’s investment objective, policies and limitations and investment guidelines established jointly by the Adviser and the Board.
Pursuant to the Investment Advisory Agreement (the “Advisory Agreement”) with the Adviser, the Fund pays the Adviser an annual management fee of 1.35% based on the Fund’s average daily net assets. The management fee is paid on a monthly basis. The initial term of the Advisory Agreement is two years. The Board may extend the Advisory Agreement for additional one-year terms. The Board, shareholders of the Fund or the Adviser may terminate the Advisory Agreement upon 60 days’ notice.
Pursuant to a fee waiver letter agreement (the “Fee Waiver Agreement”), the Adviser has contractually agreed to limit the amount of the Fund’s Total Annual Fund Operating Expenses, exclusive of Distribution and Service (12b-1) fees, Acquired Fund Fees and Expenses, brokerage expenses, interest expenses, taxes and extraordinary expenses, to 1.60% of the Fund’s average daily net assets. The Fee Waiver Agreement is in effect through January 31, 2016. The Adviser will be permitted to recover expenses it has borne through the Fee Waiver Agreement to the extent that the Fund’s expenses in later periods fall below the annual rates set forth in the Fee Waiver Agreement. The Fund will not be obligated to pay any such deferred fees and expenses more than three years after the end of the fiscal year in which the fees and expense were deferred. The Adviser may not discontinue the Fee Waiver Agreement without the approval by the Fund’s Board.
For the period ended March 31, 2015, the fee waivers and/or reimbursements were $149,678.
| Semi-Annual Report | March 31, 2015 | 15 |
| New Sheridan Developing World Fund | Notes to Financial Statements |
| March 31, 2015 (Unaudited) |
As of March 31, 2015, the balance of recoupable expenses was $183,542, of which $149,678 will expire in 2018 and $53,864 will expire in 2017.
Administrator: ALPS Fund Services, Inc. (“ALPS”) (an affiliate of ALPS Distributors, Inc.) serves as administrator to the Fund. The Fund has agreed to pay expenses incurred in connection with its administrative activities. Pursuant to the Administration, Bookkeeping and Pricing Services Agreement with the Trust, ALPS will provide operational services to the Fund including, but not limited to fund accounting and fund administration and generally assist in the Fund’s operations. The Fund’s administration fee is accrued on a daily basis, and paid on a monthly basis following the end of the month.
The officers of the Trust are employees of ALPS. Administration fees paid by the Fund for the six months ended March 31, 2015 are disclosed in the Statement of Operations.
ALPS is reimbursed by the Fund for certain out-of-pocket expenses.
Transfer Agent: ALPS serves as transfer agent for the Fund under a Transfer Agency and Services Agreement with the Trust. Under this agreement, ALPS is paid an annual fee for services performed on behalf of the Fund plus fees for open accounts and is reimbursed for certain out-of-pocket expenses.
Compliance Services: ALPS provides services as the Fund’s Chief Compliance Officer to monitor and test the policies and procedures of the Fund in conjunction with requirements under Rule 38a-1 under the 1940 Act pursuant to a Chief Compliance Officer Services Agreement with the Trust. Under this agreement, ALPS is paid an annual fee for services performed on behalf of the Fund and is reimbursed for certain out-of-pocket expenses.
Distribution: ALPS Distributors, Inc. (the “Distributor”) (as affiliate of ALPS) acts as the principal underwriter of the Fund’s shares pursuant to a Distribution Agreement with the Trust. Shares of the Fund are offered on a continuous basis through the Distributor, as agent of the Fund. The Distributor is not obligated to sell any particular amount of shares and is not entitled to any compensation for its services as the Fund’s principal underwriter pursuant to the Distribution Agreement.
The Fund has adopted a separate plan of distribution for the Investor Class shares pursuant to Rule 12b‐1 of the 1940 Act (the “Plan”). The Plan allows the Fund to use Investor Class assets to pay fees in connection with the distribution and marketing of the Investor Class shares and/or the provision of shareholder services to the Investor Class shareholders. The Plan permits payment for services in connection with the administration of plans or programs that use Investor Class assets of the Fund as their funding medium and for related expenses. The Plan permits the Fund to make total payments at an annual rate of up to 0.25% of the Investor Class’ average daily net assets attributable to the Investor Class shares. Because these fees are paid out of the Fund’s Investor Class assets on an ongoing basis, over time they will increase the cost of an investment in the Investor Class shares, and Plan fees may cost an investor more than other types of sales charges. Plan fees are shown as distribution and service fees on the Statement of Operations.
| 7. TRUSTEES |
As of March 31, 2015, there were four Trustees, three of whom are not “interested persons” (within the meaning of the 1940 Act) of the Trust (the “Independent Trustees”). The Independent Trustees receive a quarterly retainer of $4,000, plus $2,000 for each regular Board or Committee meeting attended, $2,000 for each special telephonic Board or Committee meeting attended and $2,000 for each special in-person Board meeting attended. The Independent Trustees are also reimbursed for all reasonable out-of-pocket expenses relating to attendance at meetings and for meeting-related expenses. Officers of the Trust and Trustees who are interested persons of the Trust receive no salary or fees from the Trust.
| 8. INDEMNIFICATIONS |
Under the Trust’s organizational documents, its officers and Trustees are indemnified against certain liabilities arising out of the performance of their duties to the Trust. Additionally, in the normal course of business, the Trust enters into contracts with service providers that may contain general indemnification clauses which may permit indemnification to the extent permissible under applicable law. The Trust’s maximum exposure under these arrangements is unknown, as this would involve future claims that may be made against the Trust that have not yet occurred.
| 16 | 1.844.805.5999 | www.newsheridanadvisors.com |
| New Sheridan Developing World Fund | Additional Information |
| March 31, 2015 (Unaudited) |
| 1. PROXY VOTING POLICIES AND VOTING RECORD |
A description of the policies and procedures that the Fund uses to determine how to vote proxies relating to portfolio securities is available without charge, upon request, (i) by calling the Fund (toll‐free) at 1‐855‐674‐4642 or (ii) on the website of the Securities and Exchange Commission (the “SEC”) at http://www.sec.gov.
Information regarding how the Fund voted proxies relating to portfolio securities during the most recent 12‐month period ended June 30 will be available (i) without charge, upon request, by calling the Fund (toll‐free) at 1‐855‐674‐4642 or (ii) on the SEC’s website at http://www.sec.gov.
| 2. PORTFOLIO HOLDINGS |
The Fund files its complete schedule of portfolio holdings with the SEC for the first and third quarters of each fiscal year on Form N‐Q. The Fund’s Forms N‐Q are available on the SEC website at http://www.sec.gov. The Fund’s Forms N‐Q may be reviewed and copied at the SEC’s Public Reference Room in Washington, D.C., and information on the operation of the Public Reference Room may be obtained by calling 1‐800‐SEC‐0330.
| Semi-Annual Report | March 31, 2015 | 17 |

| Riverside Frontier Markets Fund | Table of Contents |
| Shareholder Letter | 1 | ||
| Portfolio Update | 7 | ||
| Disclosure of Fund Expenses | 9 | ||
| Portfolio of Investments | 10 | ||
| Statement of Assets and Liabilities | 17 | ||
| Statement of Operations | 19 | ||
| Statements of Changes in Net Assets | 20 | ||
| Financial Highlights | 21 | ||
| Notes to Financial Statements | 23 | ||
| Additional Information | 35 |
| Riverside Frontier Markets Fund | Shareholder Letter |
| March 31, 2015 (Unaudited) |
Overview:
The last six months represented the toughest two consecutive quarters for the frontier markets since the period trailing 3/31/09, which marked the global markets’ lows post financial crisis. The MSCI Frontier Markets Total Return Net Index (MSEUFMSN) (“FM Index”) lost -15.2% over the half year period, and underperformed both the MSCI Developed Markets Total Return Net Index (NDDUWI) (“DM Index”) which gained 3.3% and the MSCI Emerging Markets Total Return Net Index (NDUEEGF) (“EM Index”) which lost -2.4%. Riverside Frontier Markets Fund (the “Fund”) managed to cut about a third of the FM Index losses and ended the half a year period with -9.9% loss for the Institutional Class (RFMIX) and -10.0% for the Investor Class (RFMFX). The Fund benefited by significant underexposure to Kuwait and Nigeria, which represented approximately 40% of the very concentrated FM Index and contributed about two thirds of the total FM Index loss during the period. The Fund continued to have much lower country concentrations relative to the benchmark as we believe the superior long term opportunities lie in a broader array of countries that we specified as our investable universe.
Investment Strategy:
The Fund utilizes a value driven, bottom‐up investment process. We begin with an investment universe of over 1500 companies, meeting certain liquidity requirement and domiciled in what we deem to be frontier markets in regions located around the world. Utilizing our proprietary fundamentals-based investment model, we rank the companies in our universe from a valuation perspective, which helps to filter the universe down to approximately 300 attractively ranked companies. Next, we subject these roughly 300 securities to what we call “corporate risk analysis”. In this phase of the process, we attempt to evaluate the risks facing the remaining companies for a variety of internal and external factors. The objective of this step of the process is to try to avoid those companies that we believe face risks that outweigh their attractive valuation rankings. Factors considered include an evaluation of the financial statements, management performance consistency, and corporate governance. Through this evaluation, we filter the list of purchase candidates down to approximately 125‐150 names from which we construct the portfolio. In the portfolio construction phase of the process, we focus primarily on mitigating total portfolio risk and maximizing diversification. In this phase, we consider such factors as individual position size, sector and industry diversification as well as country diversification. We also seek to statistically diversify the portfolio by considering the correlation of each security to the overall portfolio. The end result of the portfolio construction phase is a diversified portfolio of approximately 75‐120 companies that we believe offer attractive reward/risk ratios within the context of a fully diversified portfolio.
Portfolio Review:
We believe that the valuation and growth metrics of the portfolio are very compelling as noted in the table below:
| Weighted Average Portfolio Valuation, March 31, 2015 | ||||||||||||||||||||||
| 3-Yr EPS | 3-Yr Div | |||||||||||||||||||||
| Mkt Cap | Trl P/E | Est P/E | Gth | Gth | P/B | P/CF | ||||||||||||||||
| $1.8 Bil | 9.1 | 7.6 | 16.4% | 22.0% | 1.7 | 6.8 | ||||||||||||||||
| Semi-Annual Report | March 31, 2015 | 1 |
| Riverside Frontier Markets Fund | Shareholder Letter |
| March 31, 2015 (Unaudited) |
In our judgment, stocks within frontier markets have become even more attractively priced following the recent six month sell-off, while still offering strong long-term growth potential. We were able to build a diversified portfolio with the average correlation (R-squared) between individual holdings at only 2%. The weighted average trailing Price to Earnings ratio (“P/E”) for the portfolio was at 9.1x; and with trailing 3-year earnings per share (“EPS”) growth of 16%, it was trading at a P/E to Growth (“PEG”) ratio of only 0.6x. In comparison, S&P 500 PEG ratio as of March 31, 2015 was five times higher at 3.6x.
The last six months have seen a decline of almost 50% in oil prices, combined with US Dollar strength, as it is widely expected for the U.S. Federal Reserve to start increasing interest rates this year. This is in stark contrast to many of the world’s central banks that are expected to pursue more accommodative monetary policies. Lower oil prices have translated into lower inflation in many of the emerging and frontier markets allowing central banks to cut local interest rates. The Fund was able to cut a significant portion of the downside partly due to its relatively low exposure to countries that are net oil exporters as well as companies whose economics are directly tied to price of oil. As of the end of first quarter, the Fund’s exposure to net oil exporting countries was at about 27%. The direct exposure to the oil & gas industry was at 8%, while the exposure to the petrochemicals industry (which has historically exhibited a high correlation to oil prices) was at 5%. We have taken care to ensure that the portfolio only owns companies within these industries that are both very attractively priced and have strong balance sheets, which we feel will allow them to withstand longer periods of lower oil prices. We believe these companies should also benefit from the rapidly growing economies in their respective countries of domicile. About 19% of the Fund’s equity exposure was pegged to the US dollar, while most of the remainder of the portfolio is held in other foreign currencies that we generally deem to be fundamentally sound. The average external debt/gross domestic product (“GDP”) for the countries we have been invested in as of 3/31/15 was at about 38% and current account balance/GDP at 2.6%.
As the price of oil dropped during the fourth quarter, in general, the performance of portfolio stocks in countries highly dependent on oil exports suffered while those in net oil importing countries benefited. The Fund’s positions in Pakistan, Egypt and Turkey delivered positive returns, while positions in Saudi Arabia, Malaysia and Nigeria contributed the largest losses. As oil prices stabilized during first quarter our largest positive contributors to performance were in positions in Saudi Arabia, Israel and UAE, while the largest detractors from performance came from our stocks in Vietnam, Romania and Egypt.
The Fund’s Pakistani holdings continued to represent a significant weight in the portfolio. Despite the strong market performance over the last three years, Pakistan was still trading at discount to its peers. The weighted average dividend yield of our Pakistani holdings was 8.2%, with a 3-year average dividend growth of 12%, a P/E ratio of 8.1x, and an average 3-year EPS growth rate of 8.7%. The Pakistani market was quite volatile during period as a result of political concerns, yet it still ended up with a slight gain. Our stock selection added to the positive market performance over the time period. The macroeconomic situation continued to improve with Moody’s upgrading its outlook to positive, Pakistan successfully completed the International Monetary Fund’s sixth review, and lastly, Pakistan was able to reduce the discount rate as a result of lower inflation and an improving external account outlook. These factors contributed to the Pakistani Rupee being one of the very few currencies the appreciated against the US dollar for the period.
| 2 | www.riversidefunds.com |
| Riverside Frontier Markets Fund | Shareholder Letter |
| March 31, 2015 (Unaudited) |
We lowered the Saudi Arabian exposure during first quarter as the market rebounded on the relative stabilization of oil prices, orderly transition of power after the death of Saudi King Abdullah, and on preparations for opening of the Saudi market for direct investment by foreign investors. The strong relative market performance caused the equity valuation compared to growth to become relatively less attractive, warranting a lower portfolio weight.
As we mentioned earlier, the Fund benefitted over the time period by being roughly 35% underweight to Kuwait and Nigeria compared to the FM Index. While Nigerian banks exhibited some of the most attractive valuations in the universe, we have focused our investments only in those selective few we deem to be of higher quality and positioned to be able to continue to deliver good results in a lower oil price environment. The Nigerian Naira was one of the worst performing currencies over time period declining about 18% vs. the USD as the government finances are largely dependent on oil with 90% of exports and about two-thirds of the fiscal revenue derived from oil sales. Nigerian equities did stage a rebound following the elections at the end of March, which marked the first opposition victory in the presidential election. Nigeria is the largest economy in Africa and presents ample long-term opportunities. However, we still see significant headwinds from lower oil prices and worsening fiscal position and will continue to invest selectively.
Disappointing performance came from our Vietnamese positions where both our higher weight versus the FM Index as well as our stock selection detracted from the Fund’s relative performance. The market was especially hit hard in March, partly due to foreign selling. As of 3/31/15 we held what we deem to be a set of attractively priced, diversified holdings in Vietnam with a weighted average dividend yield of 6.6%, P/E ratio of 8.2x and Price to Cash Flow of 6.7x. Romania was also one of the disappointing performers where most of our positions’ losses were associated with exposure to the oil and gas industry. The portfolio’s total exposure to Romanian holdings at the end of March was below 3%.
The Fund’s performance relative to the FM Index was negatively affected during the first quarter due to Fund’s underweight exposure to Argentina, which at a 9% weight in the benchmark, contributed about 2% to its return. We have not invested in Argentina due to what we deem an unfavorable risk-reward scenario. In our view, Argentina is a country with a long history of economic mismanagement and a lack of protection for private investors. Moreover, with current capital flow restrictions, unofficial local currency rates over 40% weaker than official rates and non-government estimates of inflation over 40%, we believe there is a significant potential for another currency devaluation at some point in the future. Persistency of this situation has also contributed to no Argentine stocks passing our valuation and qualitative stock screening process.
| Semi-Annual Report | March 31, 2015 | 3 |
| Riverside Frontier Markets Fund | Shareholder Letter |
| March 31, 2015 (Unaudited) |
In terms of diversification, as of March 31st, the Fund held 98 securities across 24 different countries (see country exposure below).

| * | The composition of the Fund’s country exposure is subject to change and represents market value or notional exposure. |
Outlook
As long-term value investors, the Fund’s discipline is focused on identifying undervalued securities with very attractive reward/risk ratios, while mitigating idiosyncratic risk by diversifying across the Fund’s frontier markets universe. Comparing the estimated P/E ratios for the FM Index versus the MSCI U.S. and MSCI All Country World Indexes, we note that the FM Index was selling at a discount of 42% and 38%, respectively as of March 31st, despite also having relatively higher long-term growth expectations. We also note that the long-term volatility of the FM Index is roughly 30% lower than the other two indexes as a result of the very low correlations across the constituent countries of the FM Index.
The Fund will continue to take advantage of these favorable investment characteristics of frontier markets by systematically implementing the long-term valuation discipline that is a core investment principle of Riverside Advisors. That discipline is focused on a 3 step process of (1) identifying the most attractively priced securities based on long-term metrics of value; (2) conducting corporate risk analysis to eliminate from consideration those securities with unappealing levels of idiosyncratic risk; and (3) constructing a portfolio consisting of those remaining securities that offers strong diversification benefits to the Fund’s portfolio.
Thank you for your interest in the Riverside Frontier Markets Fund.
Ana Kolar
Portfolio Manager
| 4 | www.riversidefunds.com |
| Riverside Frontier Markets Fund | Shareholder Letter |
| March 31, 2015 (Unaudited) |
Notes:
3 Yr Dividend Growth: Annualized 3 year gross dividend growth rate.
3 Yr EPS Growth: Annualized 3 year growth in earnings per share before extraordinary items.
Correlation: A statistical measure of how two securities move in relation to each other.
Current Account Balance/GDP: The net balance of all transactions in the balance of payments covering the exports and imports of goods and services, payments of income, and current transfers between residents of a country and nonresidents.
Dividend Yield: The most recently announced gross dividend, annualized based on the dividend frequency, then divided by the current market price.
Earnings Per Share (EPS): A company’s net profit minus its preferred stock obligations, with the difference divided by the number of outstanding shares of common stock.
Estimated P/E Ratio: The ratio of a stock’s price to the company’s estimated earnings for the current fiscal year, using the Bloomberg consensus estimates.
External Debt/GDP: Defined by IMF as outstanding amount of those actual current, and not contingent, liabilities that require payment(s) of principal and/or interest by the debtor at some point(s) in the future and that are owed to nonresidents by residents of an economy. GDP, the most commonly used single measure of a country’s overall economic activity, represents the total value of final goods and services produced within a country during a specified time period, such as one year.
International Monetary Fund (IMF): An international organization concerned with promoting international monetary cooperation and exchange rate stability, fostering economic growth and providing temporary financial assistance to countries to help ease balance of payments problems.
Market Capitalization: The company’s worth, calculated by multiplying the shares outstanding by the price per share.
MSCI All Country World Total Return Net Index: A market capitalization weighted index designed to provide a broad measure of equity market performance throughout the world.
MSCI Developed Markets Total Return Net Index: A free-float weighted equity index, with dividends reinvested net of withholding taxes. The index covers 23 developed markets, started with a base value of 100 as of December 31, 1969.
MSCI Emerging Markets Total Return Net Index: A free-float weighted equity index, with dividends reinvested net of withholding taxes. The index covers 23 emerging markets and has daily data since January 1988.
MSCI Frontier Markets Total Return Net Index: A free-float weighted index, with dividends reinvested net of withholding taxes. MSCI classifies 33 countries as Frontier Markets, 24 of which are currently included in the MSCI Frontier Markets Index. An investor cannot invest directly in this index.
MSCI USA Index: A free-float weighted equity index. Developed with a base of 100 as of December 31, 1969.
P/B: Ratio of stock’s price to book value per share.
P/CF: Ratio of stock’s price to cash flow per share.
Price/Earnings to Growth (PEG) Ratio: A stock’s price to earnings ratio divided by the growth rate of its earnings for a specified time period (3 year trailing).
R-squared: A statistical measure that represents the percentage of a security’s movements that can be explained by movements in a benchmark.
S&P 500 Index: A capitalization-weighted index of 500 U.S. stocks.
Trailing P/E ratio: The ratio of a stock’s price to the company’s earnings per share in the past 12 months.
| Semi-Annual Report | March 31, 2015 | 5 |
| Riverside Frontier Markets Fund | Shareholder Letter |
| March 31, 2015 (Unaudited) |
The Riverside Frontier Markets Fund is not suitable for all investors. The Fund is subject to investment risks, including possible loss of the principal amount invested.
Diversification does not eliminate the risk of experiencing investment losses.
The Fund is subject to the following principal investment risks: concentration risk, counterparty, credit and custodial risk, currency risk, derivatives risk, emerging and frontier markets risk, foreign securities risk, foreign tax risk, small- and micro- cap risk and value investing risk. See the Fund’s Prospectus for additional information regarding the risks.
The views and information discussed in this commentary are as of the date of publication, are subject to change, and may not reflect the writer’s current views. The views expressed are those of the Fund’s adviser only, and represent an assessment of market conditions at a specific point in time, are opinions only and should not be relied upon as investment advice regarding a particular investment or markets in general. Such information does not constitute a recommendation to buy or sell specific securities or investment vehicles. It should not be assumed that any investment will be profitable or will equal the performance of the fund(s) or any securities or any sectors mentioned in this letter. The subject matter contained in this letter has been derived from several sources believed to be reliable and accurate at the time of compilation. Neither the Fund nor the Adviser accepts any liability for losses either direct or consequential caused by the use of this information.
| 6 | www.riversidefunds.com |
| Riverside Frontier Markets Fund | Portfolio Update |
| March 31, 2015 (Unaudited) |
Performance (as of March 31, 2015)
| 3 Month | 6 Month | 1 Year | Since Inception* | |
| Riverside Frontier Markets Fund - Investor | -4.02% | -9.99% | -5.18% | -3.99% |
| Riverside Frontier Markets Fund - Institutional | -3.92% | -9.87% | -4.95% | -3.78% |
MSCI Frontier Markets Index(a) | -3.11% | -15.18% | -3.62% | -0.72% |
MSCI All Country World Index(b) | 2.31% | 2.73% | 5.42% | 5.41% |
The performance data quoted above represents past performance. Past performance is not a guarantee of future results. Investment return and value of the Fund shares will fluctuate so that an investor’s shares, when sold or redeemed, may be worth more or less than their original cost. Performance may be lower or higher than performance data quoted. Fund performance current to the most recent month-end is available by calling (855) 384-2813 or by visiting www.riversidefunds.com.
| * | Fund’s inception date is February 28, 2014. |
| (a) | MSCI Frontier Markets Index is a free float weighted index. MSCI classifies 33 countries as Frontier Markets, 24 of which are currently included in the MSCI Frontier Markets Index. |
| (b) | MSCI All Country World Index is a market capitalization weighted index designed to provide a broad measure of equity-market performance throughout the world. |
Returns of less than 1 year are cumulative.
Indices are not actively managed and do not reflect deduction for fees, expenses or taxes. An investor cannot invest directly in an index.
The returns shown above do not reflect the deduction of taxes a shareholder would pay on Fund distributions or redemption of Fund shares.
The total annual operating expenses and total annual operating expenses after fee waivers and/or reimbursement you may pay as an investor in the Fund’s Investor Class and Institutional Class shares (as reported in the January 28, 2015 Prospectus) are 11.15% and 2.34% and 5.53% and 2.09%, respectively.
Performance of $10,000 Initial Investment (as of March 31, 2015)

The graph shown above represents historical performance of a hypothetical investment of $10,000 in the Fund since inception. Past performance does not guarantee future results. All returns reflect reinvested dividends, but do not reflect the deduction of taxes that a shareholder would pay on Fund distributions or the redemption of Fund shares.
| Semi-Annual Report | March 31, 2015 | 7 |
| Riverside Frontier Markets Fund | Portfolio Update |
| March 31, 2015 (Unaudited) |
Geographical Breakdown (Market Value and Notional Exposure as a % of Net Assets)*
| Asia/Pacific-Rim | 30.35 | % | ||
| Middle East | 21.43 | % | ||
| Europe | 12.40 | % | ||
| Latin America | 6.73 | % | ||
| Africa | 6.14 | % | ||
| Cash | 22.95 | % | ||
| TOTAL | 100.00 | % |
Sector Allocation (Market Value and Notional Exposure as a % of Net Assets)*
| Financials | 23.56 | % | ||
| Industrials | 11.40 | % | ||
| Materials | 11.37 | % | ||
| Energy | 9.38 | % | ||
| Utilities | 5.60 | % | ||
| Consumer Staples | 4.34 | % | ||
| Basic Materials | 3.63 | % | ||
| Consumer Discretionary | 2.86 | % | ||
| Consumer, Cyclical | 2.54 | % | ||
| Communications | 1.00 | % | ||
| Technology | 0.96 | % | ||
| Consumer, Non-cyclical | 0.32 | % | ||
| Diversified | 0.09 | % | ||
| Cash & Equivalents | 22.95 | % | ||
| TOTAL | 100.00 | % |
Top 10 Holdings (Market Value and Notional Exposure as a % of Net Assets)*
| Koza Altin Isletmeleri AS | 1.23 | % | ||
| Zenith Bank PLC | 1.15 | % | ||
| United Bank Africa | 1.14 | % | ||
| Guaranty Trust Bank | 1.14 | % | ||
| Reit 1 Ltd. - REIT | 1.13 | % | ||
| Delek Automotive Systems Ltd. | 1.12 | % | ||
| KazMunaiGas Exploration Production JSC - GDR | 1.08 | % | ||
| BBVA Banco Continental SA | 1.05 | % | ||
| Banco Latinoamericano de Comercio Exterior SA - Class E | 1.05 | % | ||
| Fatima Fertilizer Co. | 1.04 | % |
| * | Holdings are subject to change. Tables present indicative values only. |
| 8 | www.riversidefunds.com |
| Riverside Frontier Markets Fund | Disclosure of Fund Expenses |
| March 31, 2015 (Unaudited) |
Examples: As a shareholder of the Riverside Frontier Markets Fund (the “Fund”), you will incur two types of costs: (1) transaction costs, including applicable redemption fees; and (2) ongoing costs, including management fees, distribution and service (12b-1) fees and other Fund expenses. The following examples are intended to help you understand your ongoing costs (in dollars) of investing in the Fund and to compare these costs with the ongoing costs of investing in other mutual funds. The examples are based on an investment of $1,000 invested on October 1, 2014 and held until March 31, 2015.
Actual Expenses. The first line under each class in the table below provides information about actual account values and actual expenses. You may use the information in this line, together with the amount you invested, to estimate the expenses that you paid over the period. Simply divide your account value by $1,000 (for example, an $8,600 account value divided by $1,000 = 8.6), then multiply the result by the number in the first line under the heading “Expenses Paid During Period October 1, 2014 – March 31, 2015” to estimate the expenses you paid on your account during this period.
Hypothetical Example for Comparison Purposes. The second line under each class in the table below provides information about hypothetical account values and hypothetical expenses based on the Fund’s actual expense ratio and an assumed rate of return of 5% per year before expenses, which is not the Fund’s actual return. The hypothetical account values and expenses may not be used to estimate the actual ending account balance or expenses you paid for the period. You may use this information to compare the ongoing costs of investing in the Fund and other mutual funds. To do so, compare this 5% hypothetical example with the 5% hypothetical examples that appear in the shareholder reports of the other funds.
Please note that the expenses shown in the table are meant to highlight your ongoing costs only and do not reflect any transactional costs, such as redemption fees. Therefore, the second line under each class in the table below is useful in comparing ongoing costs only and will not help you determine the relative total costs of owning different funds. In addition, if these transactional costs were included, your costs would have been higher.
| Expenses Paid | |||||||||||||||
| Beginning | Ending | During Period | |||||||||||||
| Account Value | Account Value | Expense | October 1, 2014 - | ||||||||||||
| October 1, 2014 | March 31, 2015 | Ratio(a) | March 31, 2015(b) | ||||||||||||
| Investor Class | |||||||||||||||
| Actual | $ | 1,000.00 | $ | 901.90 | 2.20% | $ | 10.43 | ||||||||
| Hypothetical (5% return before expenses) | $ | 1,000.00 | $ | 1,013.96 | 2.20% | $ | 11.05 | ||||||||
| Institutional Class | |||||||||||||||
| Actual | $ | 1,000.00 | $ | 902.30 | 1.95% | $ | 9.25 | ||||||||
| Hypothetical (5% return before expenses) | $ | 1,000.00 | $ | 1,015.21 | 1.95% | $ | 9.80 | ||||||||
(a) | The Fund’s expense ratios have been annualized based on the Fund’s most recent fiscal half-year expenses. |
(b) | Expenses are equal to the Fund’s annualized expense ratio, multiplied by the average account value over the period, multiplied by the number of days in the most recent fiscal half year (182), divided by 365. |
| Semi-Annual Report | March 31, 2015 | 9 |
| Riverside Frontier Markets Fund | Portfolio of Investments |
| March 31, 2015 (Unaudited) |
| Value | ||||||||
| Shares | (Note 2) | |||||||
| COMMON STOCKS (30.48%) | ||||||||
Chile (1.90%) | ||||||||
| A.F.P. Habitat SA | 144,613 | $ | 213,059 | |||||
| Gasco SA | 21,700 | 180,616 | ||||||
| Total Chile | 393,675 | |||||||
Gabon (0.86%) | ||||||||
| Total Gabon | 574 | 177,727 | ||||||
| Total Gabon | 177,727 | |||||||
Georgia (0.95%) | ||||||||
| Bank of Georgia Holdings PLC | 7,700 | 198,175 | ||||||
| Total Georgia | 198,175 | |||||||
Israel (2.25%) | ||||||||
| Delek Automotive Systems Ltd. | 19,700 | 231,788 | ||||||
| Reit 1 Ltd. ‐ REIT | 76,333 | 234,027 | ||||||
| Total Israel | 465,815 | |||||||
Kazakhstan (1.08%) | ||||||||
KazMunaiGas Exploration Production JSC ‐ GDR(a) | 18,150 | 224,153 | ||||||
| Total Kazakhstan | 224,153 | |||||||
Malaysia (3.24%) | ||||||||
| BIMB Holdings Bhd | 6,013 | 6,657 | ||||||
| Faber Group Bhd | 70,417 | 62,745 | ||||||
| George Kent Malaysia Bhd | 279,800 | 92,171 | ||||||
| Homeritz Corp. Bhd | 288,850 | 90,473 | ||||||
| Hong Leong Industries Bhd | 117,000 | 141,531 | ||||||
| Hua Yang Bhd | 348,000 | 193,568 | ||||||
| Sunway Real Estate Investment Trust ‐ REIT | 207,000 | 87,752 | ||||||
| Total Malaysia | 674,897 | |||||||
See Notes to Financial Statements
| 10 | www.riversidefunds.com |
| Riverside Frontier Markets Fund | Portfolio of Investments |
| March 31, 2015 (Unaudited) |
| Value | ||||||||
| Shares | (Note 2) | |||||||
Panama (1.05%) | ||||||||
Banco Latinoamericano de Comercio Exterior SA ‐ Class E | 6,630 | $ | 217,398 | |||||
| Total Panama | 217,398 | |||||||
Philippines (0.60%) | ||||||||
| Marcventures Holdings, Inc. | 1,115,987 | 124,831 | ||||||
| Total Philippines | 124,831 | |||||||
Thailand (7.21%) | ||||||||
| Asia Sermkij Leasing PCL | 291,900 | 178,513 | ||||||
| Bangkok Expressway PCL | 150,100 | 179,899 | ||||||
| Krung Thai Bank PCL | 300,000 | 210,203 | ||||||
| Lalin Property PCL | 1,520,800 | 184,141 | ||||||
| MFEC PCL | 790,000 | 199,078 | ||||||
| Thai Wah Starch PCL | 151,000 | 170,536 | ||||||
| TKS Technologies PCL | 264,000 | 66,933 | ||||||
TRUE Telecommunication Growth Infrastructure Fund ‐ Class F | 570,000 | 206,699 | ||||||
| United Paper PCL | 760,114 | 99,978 | ||||||
| Total Thailand | 1,495,980 | |||||||
Turkey (8.74%) | ||||||||
| Adana Cimento Sanayii TAS ‐ Class A | 76,100 | 195,605 | ||||||
| Akcansa Cimento AS | 30,700 | 206,726 | ||||||
Aksa Akrilik Kimya Sanayii AS | 52,400 | 195,377 | ||||||
Cimsa Cimento Sanayi VE Ticaret AS | 30,300 | 178,383 | ||||||
| Despec Bilgisayar Pazarlama ve Ticaret AS | 190,300 | 191,116 | ||||||
| EGE Seramik Sanayi ve Ticaret AS | 124,100 | 200,080 | ||||||
Eregli Demir ve Celik Fabrikalari TAS | 118,000 | 183,435 | ||||||
| Koza Altin Isletmeleri AS | 23,500 | 254,545 | ||||||
| Pinar SUT Mamulleri Sanayii AS | 22,600 | 209,577 | ||||||
| Total Turkey | 1,814,844 | |||||||
See Notes to Financial Statements
| Semi-Annual Report | March 31, 2015 | 11 |
| Riverside Frontier Markets Fund | Portfolio of Investments |
| March 31, 2015 (Unaudited) |
| Value | ||||||||
| Shares | (Note 2) | |||||||
United Arab Emirates (2.60%) | ||||||||
| Air Arabia PJSC | 470,144 | $ | 181,765 | |||||
| Dragon Oil PLC | 13,000 | 112,287 | ||||||
| Emirates NBD PJSC | 1,710 | 4,302 | ||||||
| First Gulf Bank PJSC | 8,401 | 33,395 | ||||||
| National Bank of Ras Al‐Khaimah PSC | 94,451 | 207,011 | ||||||
| Total United Arab Emirates | 538,760 | |||||||
| TOTAL COMMON STOCKS | ||||||||
| (Cost $6,746,633) | 6,326,255 | |||||||
| 7-Day | Value | |||||||||||
| Yield | Shares | (Note 2) | ||||||||||
| SHORT‐TERM SECURITY (42.89%) | ||||||||||||
| Money Market Fund (42.89%) | ||||||||||||
Fidelity Institutional Money Market Portfolio | 0.09830 | % | 8,903,441 | 8,903,441 | ||||||||
| TOTAL SHORT‐TERM SECURITY | ||||||||||||
| (Cost $8,903,441) | 8,903,441 | |||||||||||
TOTAL INVESTMENTS (73.37%) | ||||||||||||
| (Cost $15,650,074) | $ | 15,229,696 | ||||||||||
| Other Assets In Excess Of Liabilities (26.63%) | 5,528,389 | (b) | ||||||||||
| NET ASSETS (100.00%) | $ | 20,758,085 | ||||||||||
| (a) | Securities were purchased pursuant to Regulation S under the Securities Act of 1933, as amended (the “1933 Act”), which exempts securities offered and sold outside of the United States from registration. Such securities cannot be sold in the United States without either an effective registration statement filed pursuant to the 1933 Act or pursuant to an exemption from registration. These securities have been deemed liquid under procedures approved by the Fund’s Board of Trustees. As of March 31, 2015, the aggregate market value of those securities was $224,153 representing 1.08% of the Fund’s net assets. |
| (b) | Includes cash which is being held as collateral for swap contracts. |
See Notes to Financial Statements
| 12 | www.riversidefunds.com |
| Riverside Frontier Markets Fund | Portfolio of Investments |
| March 31, 2015 (Unaudited) |
Common Abbreviations:
AS - Andonim Sirketi, Joint Stock Company in Turkey.
Bhd - Berhad is the Malaysian term for public company.
GDR - Global Depositary Receipt.
JSC - Joint Stock Company.
KSCP - Designates a Closed Joint Stock Company in Kuwait.
Ltd. - Limited.
PCL - A rearrangement of the letters for Public Limited Company, used in Thailand.
PJSC - Private Joint Stock Company.
PLC - Public Limited Company.
PSC - Public Stock Company.
REIT - Real Estate Investment Trust.
SA - Generally designates corporations in various countries, mostly those employing the civil law.
TAS - TüRk Anonim Sirketi is the Turkish term for Joint Stock Company.
Holdings are subject to change.
For Fund compliance purposes, the Fund’s industry classifications refer to any one or more of the industry sub-classifications used by one or more widely recognized market indices or ratings group indices and/or as defined by Fund management. This definition may not apply for purposes of this report, which may combine industry sub-classifications for reporting ease. Industries are shown as a percentage of the Fund’s net assets. (Unaudited)
TOTAL RETURN SWAP CONTRACTS (a)
| Rate Paid | Notional | ||||||||||||||
| Swap | by the | Termination | Amount | Unrealized | |||||||||||
| Reference Obligation | Counterparty | Fund | Date | (Shares) | Appreciation | ||||||||||
| Africa | |||||||||||||||
Kenya Commercial Bank Ltd. | Morgan Stanley | 3.92 | % | 03/03/2016 | 291,500 | $ | 13,322 | ||||||||
| Total Africa | 291,500 | 13,322 | |||||||||||||
| Asia/Pacific‐Rim | |||||||||||||||
| Fatima Fertilizer Co. | JPMorgan | 2.08 | % | 04/06/2015 | 571,200 | 50,854 | |||||||||
Fauji Cement Co., Ltd. | JPMorgan | 2.08 | % | 04/06/2015 | 684,000 | 48,880 | |||||||||
| Fauji Fertilizer Co. | JPMorgan | 2.08 | % | 04/06/2015 | 147,000 | 23,316 | |||||||||
| Hub Power Co. | JPMorgan | 2.08 | % | 04/06/2015 | 237,500 | 48,342 | |||||||||
| Khulna Power Co., Ltd. | Morgan Stanley | 3.07 | % | 12/02/2016 | 63,000 | 5,318 | |||||||||
Total Asia/Pacific ‐Rim | 1,702,700 | 176,710 | |||||||||||||
| Latin America | |||||||||||||||
| Edelnor SA | JPMorgan | 1.18 | % | 04/04/2016 | 123,000 | 3,745 | |||||||||
| Total Latin America | 123,000 | 3,745 | |||||||||||||
| Middle East | |||||||||||||||
Bank Muscat SAOG ‐ Convertible Debt(b) | JPMorgan | 1.28 | % | 04/04/2016 | 20,250 | 0 | |||||||||
See Notes to Financial Statements
| Semi-Annual Report | March 31, 2015 | 13 |
| Riverside Frontier Markets Fund | Portfolio of Investments |
| March 31, 2015 (Unaudited) |
TOTAL RETURN SWAP CONTRACTS (a) (continued) | ||||||||||||||
| Reference Obligation | Swap Counterparty | Rate Paid by the Fund | Termination Date | Notional Amount (Shares) | Unrealized Appreciation | |||||||||
| Eastern Tobacco | JPMorgan | 2.03 | % | 04/06/2015 | 6,885 | $ | 18,559 | |||||||
| Qatar Navigation | JPMorgan | 2.08 | % | 04/06/2015 | 7,294 | 6,008 | ||||||||
| Zamil Industrial Inv | JPMorgan | 2.08 | % | 04/04/2016 | 13,900 | 4,914 | ||||||||
| Total Middle East | 48,329 | 29,481 | ||||||||||||
| 2,165,529 | $ | 223,258 | ||||||||||||
| Reference Obligation | Swap Counterparty | Rate Paid by the Fund | Termination Date | Notional Amount (Shares) | Unrealized Depreciation | |||||||||
| Africa | ||||||||||||||
| British American Tobacco | Morgan Stanley | 3.87 | % | 10/20/2016 | 3,200 | $ | (8,787 | ) | ||||||
| Guaranty Trust Bank | Morgan Stanley | 3.92 | % | 03/03/2016 | 1,145,150 | (54,901 | ) | |||||||
| Guaranty Trust Bank | Morgan Stanley | 3.86 | % | 10/20/2016 | 642,936 | (12,613 | ) | |||||||
| Kenya Com Bank | Morgan Stanley | 3.87 | % | 10/20/2016 | 31,500 | (139 | ) | |||||||
| Lafarge Africa PLC | Morgan Stanley | 3.87 | % | 10/20/2016 | 351,000 | (1,682 | ) | |||||||
| United Bank Africa PLC | Morgan Stanley | 3.92 | % | 03/03/2016 | 720,600 | (17,859 | ) | |||||||
| United Bank Africa PLC | Morgan Stanley | 3.87 | % | 10/20/2016 | 10,846,035 | (10,096 | ) | |||||||
| Zenith Bank PLC | Morgan Stanley | 3.92 | % | 03/03/2016 | 1,430,610 | (62,819 | ) | |||||||
| Zenith Bank PLC | Morgan Stanley | 3.87 | % | 10/20/2016 | 826,212 | (15,759 | ) | |||||||
| Total Africa | 15,997,243 | (184,655 | ) | |||||||||||
| Asia/Pacific-Rim | ||||||||||||||
| Adamjee Insurance Co. | JPMorgan | 2.08 | % | 04/04/2016 | 372,000 | (50,517 | ) | |||||||
| Allied Bank Limited | JPMorgan | 2.08 | % | 10/05/2015 | 117,300 | (25,408 | ) | |||||||
| Bank Alfalah Ltd. | JPMorgan | 2.08 | % | 04/06/2015 | 666,500 | (20,909 | ) | |||||||
| Dabaco Corporation | JPMorgan | 2.08 | % | 04/04/2016 | 13,200 | (507 | ) | |||||||
| Hatton National Bank | Morgan Stanley | 3.07 | % | 02/27/2017 | 119,000 | (11,939 | ) | |||||||
| Indus Motor Co., Ltd. | JPMorgan | 2.08 | % | 04/04/2016 | 20,500 | (16,171 | ) | |||||||
| One Bank Ltd. | Morgan Stanley | 3.07 | % | 12/02/2016 | 81,113 | (847 | ) | |||||||
| Pakistan Oilfields Ltd. | JPMorgan | 2.08 | % | 04/06/2015 | 51,000 | (114,506 | ) | |||||||
| Pakistan Oilfields Ltd. | Morgan Stanley | 3.07 | % | 12/02/2016 | 5,400 | (5,201 | ) | |||||||
| Pakistan Petroleum | JPMorgan | 2.08 | % | 10/05/2015 | 123,300 | (45,121 | ) | |||||||
| People’s Leasing & Finance PLC | Morgan Stanley | 3.07 | % | 02/27/2017 | 505,920 | (15,888 | ) | |||||||
| Petroleum Equip Asmb | JPMorgan | 2.08 | % | 10/05/2015 | 119,630 | (6,212 | ) | |||||||
| PetroVietnam Fertilizer and Chemicals Co. | JPMorgan | 2.08 | % | 04/06/2015 | 142,400 | (28,210 | ) | |||||||
| PetroVietnam Gas | JPMorgan | 2.08 | % | 04/06/2015 | 57,150 | (129,507 | ) | |||||||
| PetroVietnam Southern Gas JSC | JPMorgan | 2.08 | % | 10/05/2015 | 217,895 | (50,906 | ) | |||||||
| PetroVietnam Tech Sv | JPMorgan | 2.08 | % | 04/04/2016 | 169,000 | (37,361 | ) | |||||||
| Refrigeration Electrical Eng. | JPMorgan | 2.08 | % | 01/04/2016 | 161,356 | (30,190 | ) | |||||||
| Southeast Bank Ltd. | Morgan Stanley | 3.07 | % | 12/02/2016 | 295,000 | (15,596 | ) | |||||||
See Notes to Financial Statements
| 14 | www.riversidefunds.com |
| Riverside Frontier Markets Fund | Portfolio of Investments |
| March 31, 2015 (Unaudited) |
TOTAL RETURN SWAP CONTRACTS (a) (continued) | ||||||||||||||
| Reference Obligation | Swap Counterparty | Rate Paid by the Fund | Termination Date | Notional Amount (Shares) | Unrealized Depreciation | |||||||||
| Southeast Bank Ltd. | Morgan Stanley | 3.07 | % | 03/04/2016 | 418,500 | $ | (17,029 | ) | ||||||
| Southern Rubber Ind. | JPMorgan | 2.08 | % | 10/05/2015 | 111,570 | (16,093 | ) | |||||||
| Titas Gas Transmission & Distribution Co. | Morgan Stanley | 3.07 | % | 03/04/2016 | 93,000 | (15,369 | ) | |||||||
| Titas Gas Transmission & Distribution Co. | Morgan Stanley | 3.07 | % | 12/02/2016 | 123,400 | (6,968 | ) | |||||||
| Vallibel Pwr Erathna | Morgan Stanley | 3.07 | % | 02/27/2017 | 202,986 | (786 | ) | |||||||
| Total Asia/Pacific-Rim | 4,187,119 | (661,241 | ) | |||||||||||
| Europe | ||||||||||||||
| OMV Pertom SA | Morgan Stanley | 3.92 | % | 03/03/2016 | 1,339,700 | (74,178 | ) | |||||||
| OMV Pertom SA | Morgan Stanley | 3.87 | % | 10/20/2016 | 780,800 | (26,135 | ) | |||||||
| Transelectrica SA | Morgan Stanley | 3.91 | % | 03/03/2016 | 4,900 | (762 | ) | |||||||
| Transelectrica SA | Morgan Stanley | 3.87 | % | 10/20/2016 | 21,365 | (18,776 | ) | |||||||
| Transgaz SA Medias | Morgan Stanley | 3.92 | % | 03/03/2016 | 500 | (854 | ) | |||||||
| Transgaz SA Medias | Morgan Stanley | 3.87 | % | 10/20/2016 | 2,390 | (7,219 | ) | |||||||
| Total Europe | 2,149,655 | (127,924 | ) | |||||||||||
| Latin America | ||||||||||||||
| BBVA Banco Continental SA | JPMorgan | 1.17 | % | 05/06/2016 | 155,460 | (47,113 | ) | |||||||
| Edegel SAA | JPMorgan | 1.18 | % | 04/04/2016 | 119,554 | (1,100 | ) | |||||||
| Intercorp Financial Services, Inc. | JPMorgan | 1.17 | % | 05/06/2016 | 7,064 | (16,614 | ) | |||||||
| Total Latin America | 282,078 | (64,827 | ) | |||||||||||
| Middle East | ||||||||||||||
| Advanced Petrochemicals Co. | JPMorgan | 2.08 | % | 04/06/2015 | 16,925 | (53,366 | ) | |||||||
| Al-Anwar Ceramic | JPMorgan | 1.28 | % | 04/04/2016 | 33,937 | (3,618 | ) | |||||||
| Alexandria Mineral Oils Co. | JPMorgan | 2.03 | % | 04/06/2015 | 28,395 | (112,021 | ) | |||||||
| Arabian Cement Co. | JPMorgan | 2.08 | % | 04/04/2016 | 10,100 | (7,746 | ) | |||||||
| Bank Muscat SAOG | JPMorgan | 1.28 | % | 04/04/2016 | 141,750 | (18,505 | ) | |||||||
| Boubyan Petrochemicals Co., KSCP | JPMorgan | 2.08 | % | 04/06/2015 | 103,521 | (68,958 | ) | |||||||
| Credit Agricole Egypt | JPMorgan | 2.03 | % | 10/05/2015 | 44,742 | (6,763 | ) | |||||||
| Emirates NBD PJSC | JPMorgan | 1.28 | % | 04/06/2015 | 53,230 | (2,697 | ) | |||||||
| Mannai Corporation | JPMorgan | 2.08 | % | 10/08/2015 | 7,119 | (15,212 | ) | |||||||
| National Co. For Maize Products | JPMorgan | 2.03 | % | 04/06/2015 | 64,130 | (31,342 | ) | |||||||
| North Cairo Flour Mills | JPMorgan | 2.03 | % | 04/06/2015 | 41,840 | (54,889 | ) | |||||||
| Oman Inv & Fin Co. | JPMorgan | 1.28 | % | 10/08/2015 | 333,637 | (20,207 | ) | |||||||
| Riyad Bank | JPMorgan | 2.08 | % | 04/06/2015 | 43,780 | (26,740 | ) | |||||||
| Saudi Vitrified Clay | JPMorgan | 2.08 | % | 10/05/2015 | 7,840 | (3,794 | ) | |||||||
See Notes to Financial Statements
| Semi-Annual Report | March 31, 2015 | 15 |
| Riverside Frontier Markets Fund | Portfolio of Investments |
| March 31, 2015 (Unaudited) |
TOTAL RETURN SWAP CONTRACTS (a) (continued) | ||||||||||||||
| Reference Obligation | Swap Counterparty | Rate Paid by the Fund | Termination Date | Notional Amount (Shares) | Unrealized Depreciation | |||||||||
| Sidi Kerir Petrochemical Co. | JPMorgan | 2.03 | % | 04/06/2015 | 106,111 | $ | (71,087 | ) | ||||||
| Suez Cement Co. | JPMorgan | 2.03 | % | 04/06/2015 | 16,950 | (6,319 | ) | |||||||
| Yanbu National Petro | JPMorgan | 2.08 | % | 10/05/2015 | 16,312 | (56,128 | ) | |||||||
| Total Middle East | 1,070,319 | (559,392 | ) | |||||||||||
| 23,686,414 | $ | (1,598,039 | ) | |||||||||||
(a) | The Fund receives payments based on any positive return of the Reference Obligation at termination. The Fund makes payments on any negative return of such Reference Obligation at termination. |
(b) | Fair valued security under the procedures approved by the Fund’s Board of Trustees. |
See Notes to Financial Statements
| 16 | www.riversidefunds.com |
| Riverside Frontier Markets Fund | Statement of Assets and Liabilities |
| March 31, 2015 (Unaudited) |
| ASSETS: | ||||
| Investments, at value (Cost $15,650,074) | $ | 15,229,696 | ||
| Deposit with broker for swap contracts (Note 3) | 6,470,000 | |||
| Unrealized appreciation on total return swap contracts | 223,258 | |||
| Receivable for swap contract payments | 70,988 | |||
| Receivable for investments sold | 301,312 | |||
| Receivable for shares sold | 39,950 | |||
| Receivable due from adviser | 8,894 | |||
| Dividends and interest receivable | 111,169 | |||
| Prepaid assets | 25,534 | |||
| Total Assets | 22,480,801 | |||
| LIABILITIES: | ||||
| Unrealized depreciation on total return swap contracts | 1,598,039 | |||
| Payable for swap contract payments | 81,409 | |||
| Payable for distribution and service fees | 61 | |||
| Payable to trustees | 148 | |||
| Payable for administration fees | 10,617 | |||
| Payable for transfer agency fees | 5,303 | |||
| Professional fees payable | 13,462 | |||
| Payable to custodian due to overdraft | 3,631 | |||
| Payable to chief compliance officer | 1,644 | |||
| Payable for printing | 1,941 | |||
| Payable for custody | 2,302 | |||
| Accrued expenses and other liabilities | 4,159 | |||
| Total Liabilities | 1,722,716 | |||
| NET ASSETS | $ | 20,758,085 | ||
| NET ASSETS CONSIST OF: | ||||
| Paid‐in capital (Note 7) | $ | 23,113,196 | ||
| Accumulated net investment loss | (118,810 | ) | ||
| Accumulated net realized loss on investments, swap contracts and foreign currency transactions | (441,222 | ) | ||
| Net unrealized depreciation on investments, swap contracts and translation of assets and liabilities denominated in foreign currencies | (1,795,079 | ) | ||
| NET ASSETS | $ | 20,758,085 | ||
See Notes to Financial Statements
| Semi-Annual Report | March 31, 2015 | 17 |
| Riverside Frontier Markets Fund | Statement of Assets and Liabilities |
| March 31, 2015 (Unaudited) |
| PRICING OF SHARES | ||||
| Investor Class: | ||||
| Net Asset Value, offering and redemption price per share | $ | 9.56 | ||
| Net Assets | $ | 292,750 | ||
| Shares of beneficial interest outstanding | 30,636 | |||
| Institutional Class: | ||||
| Net Asset Value, offering and redemption price per share | $ | 9.58 | ||
| Net Assets | $ | 20,465,335 | ||
| Shares of beneficial interest outstanding | 2,137,175 | |||
See Notes to Financial Statements
| 18 | www.riversidefunds.com |
| Riverside Frontier Markets Fund | Statement of Operations |
| For the Six Months Ended March 31, 2015 (Unaudited) |
| INVESTMENT INCOME: | ||||
| Dividends | $ | 123,521 | ||
| Foreign taxes withheld | (20,759 | ) | ||
| Total Investment Income | 102,762 | |||
| EXPENSES: | ||||
| Investment advisory fee (Note 8) | 155,662 | |||
| Administration fee | 64,017 | |||
| Distribution and service fees Investor Class | 351 | |||
| Custodian fee | 17,988 | |||
| Legal fees | 15,964 | |||
| Audit fees | 9,049 | |||
| Transfer agent fee | 20,236 | |||
| Trustees fees and expenses | 8,515 | |||
| Registration and filing fees | 9,185 | |||
| Printing fees | 2,119 | |||
| Chief compliance officer fee | 9,978 | |||
| Insurance fee | 1,247 | |||
| Offering cost expense | 63,598 | |||
| Other expenses | 4,046 | |||
| Total Expenses | 381,955 | |||
| Less fees waived/reimbursed by investment adviser | ||||
| Investor Class | (2,244 | ) | ||
| Institutional Class | (170,021 | ) | ||
| Total fees waived/reimbursed by investment adviser (Note 8) | (172,265 | ) | ||
| Net Expenses | 209,690 | |||
| NET INVESTMENT LOSS | (106,928 | ) | ||
| REALIZED AND UNREALIZED GAIN/(LOSS) ON INVESTMENTS: | ||||
| Net realized gain/(loss) on: | ||||
| Investments | (12,232 | ) | ||
| Swap contracts | (207,609 | ) | ||
| Foreign currency transactions | (194,405 | ) | ||
| Net realized loss | (414,246 | ) | ||
| Change in unrealized appreciation/(depreciation): | ||||
| Investments | (395,275 | ) | ||
| Swap contracts | (1,372,606 | ) | ||
| Translation of assets and liabilities denominated in foreign currencies | 1,669 | |||
| Net change | (1,766,212 | ) | ||
| NET REALIZED AND UNREALIZED LOSS ON INVESTMENTS, SWAP CONTRACTS AND TRANSLATION OF ASSETS AND LIABILITIES DENOMINATED IN FOREIGN CURRENCIES | (2,180,458 | ) | ||
| NET DECREASE IN NET ASSETS RESULTING FROM OPERATIONS | $ | (2,287,386 | ) | |
See Notes to Financial Statements
| Semi-Annual Report | March 31, 2015 | 19 |
| Riverside Frontier Markets Fund | Statements of Changes in Net Assets |
| Six Months | ||||||||
| Ended | For the Period | |||||||
| March 31, 2015 | Ended | |||||||
| (Unaudited) | September 30, 2014(a) | |||||||
| OPERATIONS: | ||||||||
| Net investment loss | $ | (106,928 | ) | $ | (68,905 | ) | ||
| Net realized gain/(loss) on investments, swap contracts, and foreign currency transactions | (414,246 | ) | 43,419 | |||||
| Net change in unrealized depreciation on investments, swap contracts, and translation of assets and liabilities denominated in foreign currencies | (1,766,212 | ) | (28,867 | ) | ||||
| Net decrease in net assets resulting from operations | (2,287,386 | ) | (54,353 | ) | ||||
| DISTRIBUTIONS TO SHAREHOLDERS: | ||||||||
| From net investment income | ||||||||
| Investor Class | (424 | ) | – | |||||
| Institutional Class | (39,701 | ) | – | |||||
| Total distributions | (40,125 | ) | – | |||||
| BENEFICIAL SHARE TRANSACTIONS: | ||||||||
| Investor Class | ||||||||
| Shares sold | 98,829 | 364,573 | ||||||
| Dividends reinvested | 424 | – | ||||||
| Shares redeemed | (67,280 | ) | (85,266 | ) | ||||
| Net increase from beneficial share transactions | 31,973 | 279,307 | ||||||
| Institutional Class | ||||||||
| Shares sold | 15,441,759 | 25,240,534 | ||||||
| Dividends reinvested | 39,702 | – | ||||||
| Shares redeemed | (17,893,301 | ) | (25 | ) | ||||
| Net increase/(decrease) from beneficial share transactions | (2,411,840 | ) | 25,240,509 | |||||
| Net increase/(decrease) in net assets | (4,707,378 | ) | 25,465,463 | |||||
| NET ASSETS: | ||||||||
| Beginning of period | 25,465,463 | 0 | ||||||
| End of period (including accumulated net investment income/(loss) of $(118,810) and $28,243) | $ | 20,758,085 | $ | 25,465,463 | ||||
(a) Commenced operations on March 1, 2014.
See Notes to Financial Statements
| 20 | www.riversidefunds.com |
| Riverside Frontier Markets Fund | Financial Highlights |
Investor Class | For a share outstanding throughout the periods presented. |
| Six Months | ||||||||
| Ended | For the Period | |||||||
| March 31, 2015 | Ended | |||||||
| (Unaudited) | September 30, 2014(a) | |||||||
| NET ASSET VALUE, BEGINNING OF PERIOD | $ | 10.62 | $ | 10.00 | ||||
| INCOME/(LOSS) FROM OPERATIONS: | ||||||||
Net investment loss(b) | (0.06 | ) | (0.09 | ) | ||||
| Net realized and unrealized gain/(loss) on investments | (0.98 | ) | 0.71 | |||||
| Total from Investment Operations | (1.04 | ) | 0.62 | |||||
| LESS DISTRIBUTIONS: | ||||||||
| From investment income | (0.02 | ) | – | |||||
| Total Distributions | (0.02 | ) | – | |||||
| NET INCREASE/(DECREASE) IN NET ASSET VALUE | (1.06 | ) | 0.62 | |||||
| NET ASSET VALUE, END OF PERIOD | $ | 9.56 | $ | 10.62 | ||||
TOTAL RETURN(c) | (9.81 | )% | 6.20 | % | ||||
| SUPPLEMENTAL DATA: | ||||||||
| Net assets, End of Period (in 000s) | $ | 293 | $ | 292 | ||||
| RATIOS TO AVERAGE NET ASSETS | ||||||||
| Operating expenses excluding reimbursement/waiver | 3.80 | %(d) | 11.10 | %(d) | ||||
| Operating expenses including reimbursement/waiver | 2.20 | %(d) | 2.20 | %(d) | ||||
| Net investment loss including reimbursement/waiver | (1.21 | )%(d) | (1.47 | )%(d) | ||||
PORTFOLIO TURNOVER RATE(e) | 74 | % | 16 | % | ||||
(a) | Commenced operations on March 1, 2014. |
(b) | Per share amounts are based upon average shares outstanding. |
(c) | Total return is for the period indicated and has not been annualized. The total return would have been lower had certain expenses not been reimbursed/waived during the period. The return shown does not reflect the deduction of taxes that a shareholder would pay on Fund distributions or the redemption of Fund shares. |
(d) | Annualized. |
(e) | Not annualized. |
See Notes to Financial Statements
| Semi-Annual Report | March 31, 2015 | 21 |
| Riverside Frontier Markets Fund | Financial Highlights |
Institutional Class | For a share outstanding throughout the periods presented. |
| Six Months | ||||||||
| Ended | For the Period | |||||||
| March 31, 2015 | Ended | |||||||
| (Unaudited) | September 30, 2014(a) | |||||||
| NET ASSET VALUE, BEGINNING OF PERIOD | $ | 10.64 | $ | 10.00 | ||||
| INCOME/(LOSS) FROM OPERATIONS: | ||||||||
Net investment loss(b) | (0.05 | ) | (0.08 | ) | ||||
| Net realized and unrealized gain/(loss) on investments | (0.99 | ) | 0.72 | |||||
| Total from Investment Operations | (1.04 | ) | 0.64 | |||||
| LESS DISTRIBUTIONS: | ||||||||
| From investment income | (0.02 | ) | – | |||||
| Total Distributions | (0.02 | ) | – | |||||
| NET INCREASE/(DECREASE) IN NET ASSET VALUE | (1.06 | ) | 0.64 | |||||
| NET ASSET VALUE, END OF PERIOD | $ | 9.58 | $ | 10.64 | ||||
TOTAL RETURN(c) | (9.77 | )% | 6.40 | % | ||||
| SUPPLEMENTAL DATA: | ||||||||
| Net assets, End of Period (in 000s) | $ | 20,465 | $ | 25,174 | ||||
| RATIOS TO AVERAGE NET ASSETS | ||||||||
| Operating expenses excluding reimbursement/waiver | 3.55 | %(d) | 5.48 | %(d) | ||||
| Operating expenses including reimbursement/waiver | 1.95 | %(d) | 1.95 | %(d) | ||||
| Net investment loss including reimbursement/waiver | (0.99 | )%(d) | (1.33 | )%(d) | ||||
PORTFOLIO TURNOVER RATE(e) | 74 | % | 16 | % | ||||
(a) | Commenced operations on March 1, 2014. |
(b) | Per share amounts are based upon average shares outstanding. |
(c) | Total return is for the period indicated and has not been annualized. The total return would have been lower had certain expenses not been reimbursed/waived during the period. The return shown does not reflect the deduction of taxes that a shareholder would pay on Fund distributions or the redemption of Fund shares. |
(d) | Annualized. |
(e) | Not annualized. |
See Notes to Financial Statements
| 22 | www.riversidefunds.com |
| Riverside Frontier Markets Fund | Notes to Financial Statements |
| March 31, 2015 (Unaudited) |
1. ORGANIZATION
ALPS Series Trust (the “Trust”), a Delaware statutory trust, is an open-end management investment company registered under the Investment Company Act of 1940, as amended (the “1940 Act”). As of March 31, 2015, the Trust had nine registered funds. This semi-annual report describes the Riverside Frontier Markets Fund (the “Fund”). The Fund’s primary investment objective is to provide capital appreciation as a primary objective and income as a secondary objective by investing at least 80% of its total assets in undervalued equity securities of companies located in “Frontier Markets” countries. The Fund currently offers Investor class shares and Institutional class shares. All classes of shares have identical rights to earnings, assets and voting privileges, except for class-specific expenses and exclusive rights to vote on matters affecting only individual classes. The Trust has an unlimited number of shares with no par value per share. The Board of Trustees (the “Board”) may establish additional funds and classes of shares at any time in the future without shareholder approval.
2. SIGNIFICANT ACCOUNTING POLICIES
The accompanying financial statements were prepared in accordance with accounting principles generally accepted in the United States of America for investment companies (“U.S. GAAP”). The Fund is considered an investment company for financial reporting purposes. The preparation of financial statements in conformity with U.S. GAAP requires management to make certain estimates and assumptions that affect the reported amounts of assets and liabilities and disclosures of contingent assets and liabilities at the date of the financial statements and the reported amounts of revenue and expenses during the period. Actual results could differ from those estimates. The following is a summary of significant accounting policies consistently followed by the Fund in preparation of its financial statements.
Investment Valuation: The Fund generally values its securities based on market prices determined at the close of regular trading on the New York Stock Exchange (“NYSE”), normally 4:00 p.m. Eastern Time, on each day the NYSE is open for trading. Equity securities that are primarily traded on foreign securities exchanges are valued at the closing values of such securities on their respective foreign exchanges.
Over‐the‐counter swap contracts for which market quotations are readily available are valued based on quotes received from independent pricing services or dealers that make markets in such securities.
Redeemable securities issued by open-end registered investment companies are valued at the investment company’s applicable net asset value.
When such prices or quotations are not available, or when the fair value committee appointed by the Board believes that they are unreliable, securities may be priced using fair value procedures approved by the Board.
Fair Value Measurements: The Fund discloses the classification of their fair value measurements following a three-tier hierarchy based on the inputs used to measure fair value. Inputs refer broadly to the assumptions that market participants would use in pricing the asset or liability,
| Semi-Annual Report | March 31, 2015 | 23 |
| Riverside Frontier Markets Fund | Notes to Financial Statements |
| March 31, 2015 (Unaudited) |
including assumptions about risk. Inputs may be observable or unobservable. Observable inputs reflect the assumptions market participants would use in pricing the asset or liability that are developed based on market data obtained from sources independent of the reporting entity. Unobservable inputs reflect the reporting entity’s own assumptions about the assumptions market participants would use in pricing the asset or liability that are developed based on the best information available.
Various inputs are used in determining the value of the Fund’s investments as of the end of the reporting period. When inputs used fall into different levels of the fair value hierarchy, the level in the hierarchy within which the fair value measurement falls is determined based on the lowest level input that is significant to the fair value measurement in its entirety. The designated input levels are not necessarily an indication of the risk or liquidity associated with these investments. These inputs are categorized in the following hierarchy under applicable financial accounting standards:
| Level 1 – | Unadjusted quoted prices in active markets for identical investments, unrestricted assets or liabilities that the Funds have the ability to access at the measurement date; |
| Level 2 – | Quoted prices which are not active, quoted prices for similar assets or liabilities in active markets or inputs other than quoted prices that are observable (either directly or indirectly) for substantially the full term of the asset or liability; and |
| Level 3 – | Significant unobservable prices or inputs (including the Fund’s own assumptions in determining the fair value of investments) where there is little or no market activity for the asset or liability at the measurement date. |
The following is a summary of the inputs used to value the Fund’s investments as of March 31, 2015:
| Level 2 - Other | Level 3 - | |||||||||||||||
| Level 1 - | Significant | Significant | ||||||||||||||
| Investments in Securities at | Unadjusted | Observable | Unobservable | |||||||||||||
| Value | Quoted Prices | Inputs | Inputs | Total | ||||||||||||
| Common Stocks | ||||||||||||||||
| Chile | $ | 393,675 | $ | — | $ | — | $ | 393,675 | ||||||||
| Gabon | 177,727 | — | — | 177,727 | ||||||||||||
| Georgia | 198,175 | — | — | 198,175 | ||||||||||||
| Israel | 465,815 | — | — | 465,815 | ||||||||||||
| Kazakhstan | 224,153 | — | — | 224,153 | ||||||||||||
| Malaysia | 674,897 | — | — | 674,897 | ||||||||||||
| Panama | 217,398 | — | — | 217,398 | ||||||||||||
| Philippines | 124,831 | — | — | 124,831 | ||||||||||||
| Thailand | 1,495,980 | — | — | 1,495,980 | ||||||||||||
| Turkey | 1,814,844 | — | — | 1,814,844 | ||||||||||||
| United Arab Emirates | 538,760 | — | — | 538,760 | ||||||||||||
| Short‐Term Security | 8,903,441 | — | — | 8,903,441 | ||||||||||||
| TOTAL | $ | 15,229,696 | $ | — | $ | — | $ | 15,229,696 | ||||||||
| 24 | www.riversidefunds.com |
| Riverside Frontier Markets Fund | Notes to Financial Statements |
| March 31, 2015 (Unaudited) |
| Other Financial Instruments | Level 1 | Level 2 | Level 3 | Total | |||||||||||||
| Assets | |||||||||||||||||
| Total Return Swap Contracts | $ | — | $ | 223,258 | $ | 0 | $ | 223,258 | |||||||||
| Liabilities | |||||||||||||||||
| Total Return Swap Contracts | — | (1,598,039 | ) | — | (1,598,039 | ) | |||||||||||
| TOTAL | $ | — | $ | (1,374,781 | ) | $ | 0 | $ | (1,374,781 | ) | |||||||
The Fund recognizes transfers between levels as of the end of the period. For the period ended March 31, 2015, the Fund did not have any transfers between Level 1 and Level 2 securities. For the period ended March 31, 2015, the Fund had one position that used Level 3 inputs to determine the fair value. As a result of a corporate action, the Fund received a total return swap representing 20,250 convertible bond shares of the Bank of Muscat SOAG. Due to limited details regarding the terms of the security at the period end, the Fund’s Fair Value Committee valued the position at zero. The holding did not change in value during the period nor realize any gain or losses.
Offering Costs: The Fund incurred offering costs during the period ended March 31, 2015. These offering costs, including fees for printing initial prospectuses, legal and registration fees, are being amortized over the first twelve months from the inception date of the Fund. Amounts amortized through March 31, 2015 are shown on the Fund’s Statement of Operations.
Trust Expenses: Some expenses of the Trust can be directly attributed to the Fund. Expenses which cannot be directly attributed to the Fund are apportioned among all funds in the Trust based on average net assets of each fund.
Fund Expenses: Some expenses can be directly attributed to the Fund and are apportioned among the classes based on average net assets of each class.
Class Expenses: Expenses that are specific to a class of shares are charged directly to that share class. Fees provided under the distribution (Rule 12b‐1) and/or shareholder service plans for a particular class of the Fund are charged to the operations of such class.
Federal Income Taxes: The Fund complies with the requirements under Subchapter M of the Internal Revenue Code of 1986, as amended, applicable to regulated investment companies and intends to distribute substantially all of its net taxable income and net capital gains, if any, each year so that it will not be subject to excise tax on undistributed income and gains. The Fund is not subject to income taxes to the extent such distributions are made.
As of and during the period ended March 31, 2015, the Fund did not have a liability for any unrecognized tax benefits in the accompanying financial statements. The Fund files U.S. federal, state and local income tax returns as required. The Fund’s tax returns are subject to examination by the relevant tax authorities until expiration of the applicable statute of limitations, which is generally three years after the filing of the tax return for federal purposes and four years for most state returns. The Fund’s administrator has analyzed the Fund’s tax positions taken on federal and state income tax returns for all open tax years and has concluded that as of March 31, 2015, no provision for income tax is required in the Fund’s financial statements related to these tax positions.
| Semi-Annual Report | March 31, 2015 | 25 |
| Riverside Frontier Markets Fund | Notes to Financial Statements |
| March 31, 2015 (Unaudited) |
Investment Transactions and Investment Income: Investment transactions are accounted for on the date the investments are purchased or sold (trade date basis). Realized gains and losses from investment transactions are reported on an identified cost basis. Interest income, which includes accretion of discounts and amortization of premiums, is accrued and recorded as earned. Dividend income is recognized on the ex-dividend date, or for certain foreign securities, as soon as information is available to the Fund. All of the realized and unrealized gains and losses and net investment income are allocated daily to each class in proportion to its average daily net assets.
Foreign Securities: The Fund may directly purchase securities of foreign issuers. Investing in securities of foreign issuers involves special risks not typically associated with investing in securities of U.S. issuers. The risks include possible reevaluation of currencies, the inability to repatriate foreign currency, less complete financial information about companies and possible future adverse political and economic developments. Moreover, securities of many foreign issuers and their markets may be less liquid and their prices more volatile than those of securities of comparable U.S. issuers.
Foreign Currency Translation: The books and records of the Fund are maintained in U.S. dollars. Investment valuations and other assets and liabilities initially expressed in foreign currencies are converted each business day into U.S. dollars based upon current exchange rates. The portion of realized and unrealized gains or losses on investments due to fluctuations in foreign currency exchange rates is not separately disclosed and is included in realized and unrealized gains or losses on investments, when applicable.
Foreign Exchange Transactions: The Fund may enter into foreign currency spot contracts to facilitate transactions in foreign securities or to convert foreign currency receipts into U.S. dollars. A foreign currency spot contract is an agreement between two parties to buy and sell currencies at the current market rate, for settlement generally within two business days. The U.S. dollar value of the contracts is determined using current currency exchange rates supplied by a pricing service. The contract is marked-to-market daily for settlements beyond one day and any change in market value is recorded as an unrealized gain or loss. When the contract is closed, the Fund records a realized gain or loss equal to the difference between the value on the open and close date. Losses may arise from changes in the value of the foreign currency, or if the counterparties do not perform under the contract’s terms. The maximum potential loss from such contracts is the aggregate face value in U.S. dollars at the time the contract was opened.
Distributions to Shareholders: The Fund normally pays dividends, if any, and distributes capital gains, if any, on an annual basis. Income dividend distributions are derived from interest and other income the Fund receives from its investments, including short term capital gains. Long term capital gain distributions are derived from gains realized when the Fund sells a security it has owned for more than one year. The Fund may make additional distributions and dividends at other times if its portfolio manager or managers believe doing so may be necessary for the Fund to avoid or reduce taxes. Net investment income/(loss) and net realized gain/(loss) may differ for financial statement and tax purposes.
| 26 | www.riversidefunds.com |
| Riverside Frontier Markets Fund | Notes to Financial Statements |
| March 31, 2015 (Unaudited) |
3. DERIVATIVE INSTRUMENTS
The Fund’s investment objectives permit the Fund to enter into various types of derivatives contracts, including, but not limited to, forward exchange contracts and total return swaps. In doing so, the Fund will employ strategies in differing combinations to permit it to increase, decrease or change the level or types of exposure to market factors. Central to those strategies are features inherent in derivatives that make them more attractive for this purpose than equity or debt securities; they require little or no initial cash investment, they can focus exposure on only certain selected risk factors, and they may not require the ultimate receipt or delivery of the underlying security (or securities) to the contract. This may allow the Fund to pursue its objectives more quickly and efficiently than if it were to make direct purchases or sales of securities capable of affecting a similar response to market factors.
Risk of Investing in Derivatives: The Fund’s use of derivatives can result in losses due to unanticipated changes in the market risk factors and the overall market. In instances where the Fund is using derivatives to decrease, or hedge, exposures to market risk factors for securities held by the Fund, there are also risks that those derivatives may not perform as expected resulting in losses for the combined or hedged positions.
Derivatives may have little or no initial cash investment relative to their market value exposure and therefore can produce significant gains or losses in excess of their cost. This use of embedded leverage allows the Fund to increase its market value exposure relative to its net assets and can substantially increase the volatility of the Fund’s performance.
Additional associated risks from investing in derivatives also exist and potentially could have significant effects on the valuation of the derivative and the Fund. Typically, the associated risks are not the risks that the Fund is attempting to increase or decrease exposure to, per its investment objective, but are the additional risks from investing in derivatives.
Examples of these associated risks are liquidity risk, which is the risk that the Fund will not be able to sell or close out the derivative in a timely manner, and counterparty credit risk, which is the risk that the counterparty will not fulfill its obligation to the Fund. In addition, use of derivatives may increase or decrease exposure to the following risk factors:
Equity Risk: Equity risk relates to the change in value of equity securities as they relate to increases or decreases in the general market. Associated risks can be different for each type of derivative and are discussed by each derivative type in the notes that follow.
Foreign Currency Risk: Currency trading involves significant risks, including market risk, interest rate risk, country risk, counterparty credit risk and short sale risk. Market risk results from the price movement of foreign currency values in response to shifting market supply and demand.
Interest Rate Risk: Interest rate risk is the risk that fixed income securities will decline in value because of changes in interest rates. As nominal interest rates rise, the value of fixed income securities held by the Fund are likely to decrease. Securities with longer durations
| Semi-Annual Report | March 31, 2015 | 27 |
| Riverside Frontier Markets Fund | Notes to Financial Statements |
| March 31, 2015 (Unaudited) |
tend to be more sensitive to changes in interest rates, and are usually more volatile than equity securities.
Swap Contracts: The Fund may enter into swap transactions to seek to increase total return. Risks may arise as a result of the failure of the counterparty to the swap contract to comply with the terms of the swap contract. The loss incurred by the failure of a counterparty is generally limited to the net payment to be received by the Fund and/or the termination value at the end of the contract.
Therefore, the Fund considers the creditworthiness of each counterparty to a contract in evaluating potential credit risk. Additionally, risks may arise from unanticipated movements in interest rates or in the value of the underlying reference asset or index. Entering into these agreements involves, to varying degrees, market risk, liquidity risk and elements of credit, legal and documentation risk that are not directly reflected in the amounts recognized in the Statements of Assets and Liabilities.
The Fund may pay or receive cash as collateral on these contracts which may be recorded as an asset and/or liability. The Fund must set aside liquid assets, or engage in other appropriate measures, to cover its obligations under these contracts. Swaps are marked to market daily using either pricing vendor quotations, counterparty prices or model prices and the change in value, if any, is recorded as an unrealized gain or loss. Upfront payments made and/or received by the Fund are recorded as an asset and/or liability and realized gains or losses are recognized ratably over the contract’s term/event, with the exception of forward starting interest rate swaps, whose realized gains or losses are recognized ratably from the effective start date. Periodic payments received or made on swap contracts are recorded as realized gains or losses. Gains or losses are realized upon termination of a swap contract and are recorded on the Statements of Operations.
The Fund invests in total return swaps to obtain exposure to a security or market without owning such security or investing directly in that market. Total return swaps are agreements in which there is an exchange of cash flows whereby one party commits to make payments based on the total return (coupons plus capital gains/losses) of an underlying instrument in exchange for fixed or floating rate interest payments. To the extent the total return of the instrument or index underlying the transaction exceeds or falls short of the offsetting interest rate obligation, the Fund will receive a payment from or make a payment to the counterparty. Swap agreements held at March 31, 2015 are disclosed in the Portfolio of Investments.
The average notional shares of the Fund’s swap positions for the period ended March 31, 2015 was 27,730,644.
| 28 | www.riversidefunds.com |
| Riverside Frontier Markets Fund | Notes to Financial Statements |
| March 31, 2015 (Unaudited) |
Derivative Instruments: The following tables disclose the amounts related to the Fund’s use of derivative instruments.
The effect of derivative instruments on the Statement of Assets and Liabilities as of March 31, 2015:
| Asset Derivatives | Liability Derivatives | ||||||||
| Statement of Assets | Gross Unrealized | Gross Unrealized | |||||||
| Risk Exposure | and Liabilities Location | Appreciation | Depreciation | ||||||
| Equity Contracts (Total Return Swap Contracts) | Unrealized appreciation/ (depreciation) on total return swap contracts | $ | 223,258 | $ | (1,598,039 | ) | |||
| Total | $ | 223,258 | $ | (1,598,039 | ) | ||||
The effect of derivative instruments on the Statement of Operations for the period ended March 31, 2015:
| Net change in | |||||||||
| Realized | Unrealized | ||||||||
| Loss on | Depreciation on | ||||||||
| Derivatives | Derivatives | ||||||||
| Risk Exposure | Statement of Operations Location | Recognized | Recognized | ||||||
| Equity Contracts (Total Return Swap Contracts) | Net realized gain/(loss) on swap contracts/change in unrealized appreciation/(depreciation) on swap contracts | $ | (207,609 | ) | $ | (1,372,606 | ) | ||
| Total | $ | (207,609 | ) | $ | (1,372,606 | ) | |||
| 4. OFFSETTING AGREEMENTS |
Certain derivative contracts are executed under standardized netting agreements. A derivative netting arrangement creates an enforceable right of set‐off that becomes effective and affects the realization of settlement on individual assets, liabilities and collateral amounts, only following a specified event of default or early termination. Default events may include the failure to make payments or deliver securities timely, material adverse changes in financial condition or insolvency, the breach of minimum regulatory capital requirements or loss of license, charter or other legal authorization necessary to perform under the contract. The Fund may manage counterparty risk by entering into enforceable collateral arrangements with counterparties to securities lending agreements. These agreements mitigate counterparty credit risk by providing for a single net settlement with a counterparty of all financial transactions covered by the agreement in an event of default as defined under such agreement.
| Semi-Annual Report | March 31, 2015 | 29 |
| Riverside Frontier Markets Fund | Notes to Financial Statements |
| March 31, 2015 (Unaudited) |
The following table presents derivative financial instruments and securities lending arrangements that are subject to enforceable netting arrangements, collateral arrangements or other similar agreements as of March 31, 2015.
Gross Amounts Not Offset in the Statement of Assets and Liabilities | ||||||||||||||||||||||||
| Gross | ||||||||||||||||||||||||
| Amounts | ||||||||||||||||||||||||
| Offset in | ||||||||||||||||||||||||
| the | Net Amounts | |||||||||||||||||||||||
| Gross | Statement | Presented in | ||||||||||||||||||||||
| Amounts of | of Assets | the Statement | ||||||||||||||||||||||
| Recognized | and | of Assets and | Financial | Cash Collateral | Net Amount | |||||||||||||||||||
| Description | Assets | Liabilities | Liabilities | Instruments (a) | Received(a) | Receivable | ||||||||||||||||||
| Assets | ||||||||||||||||||||||||
| Total Return | ||||||||||||||||||||||||
| Swaps | $ | 223,258 | $ | – | $ | 223,258 | $ | – | $ | – | $ | 223,258 | ||||||||||||
| Total | $ | 223,258 | $ | – | $ | 223,258 | $ | – | $ | – | $ | 223,258 | ||||||||||||
Gross Amounts Not Offset in the Statement of Assets and Liabilities | ||||||||||||||||||||||||
| Gross | ||||||||||||||||||||||||
| Amounts | ||||||||||||||||||||||||
| Offset in | ||||||||||||||||||||||||
| the | Net Amounts | |||||||||||||||||||||||
| Gross | Statement | Presented in | ||||||||||||||||||||||
| Amounts of | of Assets | the Statement | ||||||||||||||||||||||
| Recognized | and | of Assets and | Financial | Cash Collateral | Net Amount | |||||||||||||||||||
| Description | Liabilities | Liabilities | Liabilities | Instruments (a) | Pledged(a) | Payable | ||||||||||||||||||
| Liabilities | ||||||||||||||||||||||||
| Total Return | ||||||||||||||||||||||||
| Swaps | $ | 1,598,039 | $ | – | $ | 1,598,039 | $ | (223,258 | ) | $ | (1,374,781 | ) | $ | – | ||||||||||
| Total | $ | 1,598,039 | $ | – | $ | 1,598,039 | $ | (223,258 | ) | $ | (1,374,781 | ) | $ | – | ||||||||||
(a) These amounts are limited to the derivative asset/liability balance and, accordingly, do not include excess collateral received/pledged.
| 30 | www.riversidefunds.com |
| Riverside Frontier Markets Fund | Notes to Financial Statements |
| March 31, 2015 (Unaudited) |
| 5. TAX BASIS INFORMATION |
Tax Basis of Distributions to Shareholders: The character of distributions made during the period from net investment income or net realized gains may differ from its ultimate characterization for federal income tax purposes. Also, due to the timing of dividend distributions, the fiscal year in which amounts are distributed may differ from the fiscal year in which the income or realized gain were recorded by the Fund. The amounts and characteristics of tax basis distributions and composition of distributable earnings/(accumulated losses) are finalized at fiscal year‐end. Accordingly, tax basis balances have not been determined as of the date of the semi‐annual.
Unrealized Appreciation and Depreciation on Investments: As of March 31, 2015, the aggregate cost of investments, gross unrealized appreciation/(depreciation) and net unrealized appreciation for Federal tax purposes were as follows:
| Gross unrealized appreciation (excess of value over tax cost) | $ | 180,772 | ||
| Gross unrealized depreciation (excess of tax cost over value) | (601,150 | ) | ||
| Net unrealized depreciation | $ | (420,378 | ) | |
| Cost of investments for income tax purposes | $ | 15,650,074 |
| 6. SECURITIES TRANSACTIONS |
Purchases and sales of securities, excluding short‐term securities, during the period ended March 31, 2015 were as follows:
| Proceeds from | ||||||||
| Purchases of Securities | Sales of Securities | |||||||
| $ | 7,750,037 | $ | 4,164,457 | |||||
| 7. BENEFICIAL SHARE TRANSACTIONS |
The capitalization of the Trust consists of an unlimited number of shares of beneficial interest with no par value per share. Holders of the shares of the Fund have one vote for each share held and a proportionate fraction of a vote for each fractional share. All shares issued and outstanding are fully paid and are non‐assessable, transferable and redeemable at the option of the shareholder. Shares have no pre‐emptive rights.
Shares redeemed within 90 days of purchase may incur a 2.00% short‐term redemption fee deducted from the redemption amount. For the period ended March 31, 2015, the redemption fees charged by the Fund are presented in the Statements of Changes in Net Assets.
| Semi-Annual Report | March 31, 2015 | 31 |
| Riverside Frontier Markets Fund | Notes to Financial Statements |
| March 31, 2015 (Unaudited) |
Transactions in common shares were as follows:
| For the Six | ||||||||
| Months Ended | For the Period | |||||||
| March 31, 2015 | Ended | |||||||
| (Unaudited) | September 30, 2014(a) | |||||||
| Investor | ||||||||
| Shares Sold | 9,871 | 35,410 | ||||||
| Shares Issued in Reinvestment of Dividends | 42 | – | ||||||
| Less Shares Redeemed | (6,733 | ) | (7,954 | ) | ||||
| Net Increase from share transactions | 3,180 | 27,456 | ||||||
| Institutional | ||||||||
| Shares Sold | 1,481,486 | 2,365,687 | ||||||
| Shares Issued in Reinvestment of Dividends | 3,970 | – | ||||||
| Less Shares Redeemed | (1,713,966 | ) | (2 | ) | ||||
| Net Increase/(Decrease) from share transactions | (228,510 | ) | 2,365,685 | |||||
(a) Commenced operations on March 1, 2014.
Control is defined by the 1940 Act as the beneficial ownership, either directly or through one or more controlled companies, of more than 25% of the voting securities of a company. The Fund has one unaffiliated shareholder representing approximately 32% of total Fund shares. Investment activities of these shareholders could have a material impact on the Fund.
| 8. MANAGEMENT AND RELATED‐PARTY TRANSACTIONS |
Investment Advisory: Riverside Advisors, LLC (“Riverside Advisors” or the “Adviser”), subject to the authority of the Board, is responsible for the overall management and administration of the Fund’s business affairs. The Adviser manages the investments of the Fund in accordance with the Fund’s investment objectives, policies and limitations and investment guidelines established jointly by the Adviser and the Board.
Pursuant to the Investment Advisory Agreement (the “Advisory Agreement”) with the Adviser, the Fund pays the Adviser an annual management fee of 1.45% based on the Fund’s average daily net assets. The management fee is paid on a monthly basis. The initial term of the Advisory Agreement is two years. The Board may extend the Advisory Agreement for additional one‐year terms. The Board, shareholders of the Fund or the Adviser may terminate the Advisory Agreement upon 60 days’ notice.
Pursuant to a fee waiver letter agreement (the “Fee Waiver Agreement”), the Adviser has contractually agreed to limit the amount of the Fund’s Total Annual Fund Operating Expenses, exclusive of Distribution and Service (12b‐1) fees, Acquired Fund Fees and Expenses, brokerage expenses, interest expenses, taxes and extraordinary expenses, to 1.95% of the Fund’s average daily net assets for the Investor Class and the Institutional Class. The Fee Waiver Agreement is in effect through January 31, 2016. The Adviser will be permitted to recover, on a class‐by‐class basis,
| 32 | www.riversidefunds.com |
| Riverside Frontier Markets Fund | Notes to Financial Statements |
| March 31, 2015 (Unaudited) |
expenses it has borne through the Fee Waiver Agreement to the extent that the Fund’s expenses in later periods fall below the annual rates set forth in the Fee Waiver Agreement. The Fund will not be obligated to pay any such deferred fees and expenses more than three years after the end of the fiscal year in which the fees and expenses were deferred. The Adviser may not discontinue the Fee Waiver Agreement without the approval by the Fund’s Board.
For the six‐month period ended March 31, 2015, the fee waivers and/or reimbursements were as follows:
| Fees | ||||
| Waived/Reimbursed | ||||
| by Adviser | ||||
| Investor Class | $ | (2,244 | ) | |
| Institutional Class | (170,021 | ) | ||
| TOTAL | $ | (172,265 | ) | |
As of March 31, 2015, the balances of recoupable expenses were as follows:
| Fund | Expires 2018 | Expires 2017 | ||||||
| Investor Class | $ | 2,244 | $ | 12,466 | ||||
| Institutional Class | 170,021 | 173,327 | ||||||
Administrator: ALPS Fund Services, Inc. (“ALPS”) (an affiliate of ALPS Distributors, Inc.) serves as administrator to the Fund. The Fund has agreed to pay expenses incurred in connection with its administrative activities. Pursuant to the Administration, Bookkeeping and Pricing Services Agreement, the Trust with ALPS will provide operational services to the Fund including, but not limited to, fund accounting and fund administration and generally assist in the Fund’s operations. The Fund’s administration fee is accrued on a daily basis and paid on a monthly basis following the end of the month. The officers of the Trust are employees of ALPS. Administration fees paid by the Fund for the six months ended March 31, 2015 are disclosed in the Statement of Operations.
ALPS is reimbursed by the Fund for certain out‐of‐pocket expenses.
Transfer Agent: ALPS serves as transfer agent for the Fund under a Transfer Agency and Services Agreement with the Trust. Under this agreement, ALPS is paid an annual fee for services performed on behalf of the Fund plus fees for open accounts and is reimbursed for certain out‐of‐pocket expenses.
Compliance Services: ALPS provides services as the Fund’s Chief Compliance Officer to monitor and test the policies and procedures of the Fund in conjunction with requirements under Rule 38a‐1 under the 1940 Act pursuant to a Chief Compliance Officer Services Agreement with the Trust. Under this agreement, ALPS is paid an annual fee for services performed on behalf of the Fund and is reimbursed for certain out‐of‐pocket expenses.
Distribution: ALPS Distributors, Inc. (the “Distributor”) (an affiliate of ALPS) acts as the principal underwriter of the Fund’s shares pursuant to a Distribution Agreement with the Trust. Shares of the Fund are offered on a continuous basis through the Distributor, as agent of the
| Semi-Annual Report | March 31, 2015 | 33 |
| Riverside Frontier Markets Fund | Notes to Financial Statements |
| March 31, 2015 (Unaudited) |
Fund. The Distributor is not obligated to sell any particular amount of shares and is not entitled to any compensation for its services as the Fund’s principal underwriter pursuant to the Distribution Agreement.
The Fund has adopted a separate plan of distribution for the Investor class shares pursuant to Rule 12b‐1 of the 1940 Act (the “Plan”). The Plan allows the Fund to use Investor class assets to pay fees in connection with the distribution and marketing of the Investor class shares and/or the provision of shareholder services to the Investor class shareholders. The Plan permits payment for services in connection with the administration of plans or programs that use the Investor class shares of the Fund as their funding medium and for related expenses. The Plan permits the Fund to make total payments at an annual rate of up to 0.25% of a Fund’s average daily net assets attributable to the Investor class shares. Because these fees are paid out of the Fund’s Investor class assets on an ongoing basis, over time they will increase the cost of an investment in the Investor clpass shares, and Plan fees may cost an investor more than other types of sales charges. Plan fees are shown as distribution and service fees on the Statement of Operations.
| 9. TRUSTEES |
As of March 31, 2015, there were four Trustees, three of whom are not “interested persons” (within the meaning of the 1940 Act) of the Trust (the “Independent Trustees”). The Independent Trustees receive a quarterly retainer of $4,000, plus $2,000 for each regular Board or Committee meeting attended, $2,000 for each special telephonic Board or Committee meeting attended and $2,000 for each special in‐person Board meeting attended. The Independent Trustees are also reimbursed for all reasonable out‐of‐pocket expenses relating to attendance at meetings and for meeting‐related expenses. Officers of the Trust and Trustees who are interested persons of the Trust receive no salary or fees from the Trust.
| 10. INDEMNIFICATIONS |
Under the Trust’s organizational documents, its officers and Trustees are indemnified against certain liabilities arising out of the performance of their duties to the Trust. Additionally, in the normal course of business, the Trust enters into contracts with service providers that may contain general indemnification clauses which may permit indemnification to the extent permissible under applicable law. The Trust’s maximum exposure under these arrangements is unknown, as this would involve future claims that may be made against the Trust that have not yet occurred.
| 34 | www.riversidefunds.com |
| Riverside Frontier Markets Fund | Additional Information |
| March 31, 2015 (Unaudited) |
| 1. PROXY VOTING POLICIES AND VOTING RECORD |
A description of the policies and procedures that the Fund uses to determine how to vote proxies relating to portfolio securities is available without charge, upon request, (i) by calling the Fund (toll‐free) at 1‐855‐384‐2813 or (ii) on the website of the Securities and Exchange Commission (the “SEC”) at http://www.sec.gov.
Information regarding how the Fund voted proxies relating to portfolio securities during the most recent 12‐month period ended June 30 will be available (i) without charge, upon request, by calling the Fund (toll‐free) at 1‐855‐384‐2813 or (ii) on the SEC’s website at http://www.sec.gov.
| 2. PORTFOLIO HOLDINGS |
The Fund files its complete schedule of portfolio holdings with the SEC for the first and third quarters of each fiscal year on Form N‐Qs. The Fund’s Forms N‐Q are available on the SEC’s website at http://www.sec.gov. The Fund’s Forms N‐Q may be reviewed and copied at the SEC’s Public Reference Room in Washington, D.C., and information on the operation of the Public Reference Room may be obtained by calling 1‐800‐SEC‐0330.
| Semi-Annual Report | March 31, 2015 | 35 |

Item 2. Code of Ethics.
Not applicable to this report.
Item 3. Audit Committee Financial Expert.
Not applicable to this report.
Item 4. Principal Accountant Fees and Services.
Not applicable to this report.
Item 5. Audit Committee of Listed Registrants.
Not applicable to the registrant.
Item 6. Investments.
| (a) | Schedule of Investments is included as part of the Reports to Stockholders filed under Item 1 of this Form N-CSR. |
| (b) | Not applicable. |
Item 7. Disclosure of Proxy Voting Policies and Procedures for Closed-End Management Investment Companies.
Not applicable to the registrant.
Item 8. Portfolio Managers of Closed-End Management Investment Companies.
Not applicable to the registrant.
Item 9. Purchases of Equity Securities by Closed-End Management Investment Company and Affiliated Purchasers.
Not applicable to the registrant.
Item 10. Submission of Matters to a Vote of Security Holders.
There have been no material changes to the procedures by which shareholders may recommend nominees to the registrant’s Board of Trustees, where those changes were implemented after the registrant last provided disclosure in response to the requirements of Item 407(c)(2)(iv) of Regulation S-K, or this Item.
Item 11. Controls and Procedures.
| (a) | The registrant’s principal executive officer and principal financial officer have evaluated the registrant’s disclosure controls and procedures (as defined in Rule 30a-3(c) under the Investment Company Act of 1940, as amended) within 90 days of this report and have concluded that the registrant’s disclosure controls and procedures were effective as of that date. |
| (b) | There was no change in the registrant’s internal control over financial reporting (as defined in Rule 30a-3(d) under the Investment Company Act of 1940, as amended) during the second fiscal quarter of the period covered by this report that has materially affected, or is reasonably likely to materially affect, the registrant’s internal control over financial reporting. |
Item 12. Exhibits.
| (a)(1) | Not applicable to this report. |
| (a)(2) | The certifications required by Rule 30a-2(a) of the Investment Company Act of 1940, as amended, and Section 302 of the Sarbanes-Oxley Act of 2002 are attached hereto as Exhibit 99.Cert. |
| (a)(3) | None. |
| (b) | The certifications by the registrant’s principal executive officer and principal financial officer, as required by Rule 30a-2(b) of the Investment Company Act of 1940, as amended, and Section 906 of the Sarbanes-Oxley Act of 2002 are attached hereto as Exhibit 99.906Cert. |
SIGNATURES
Pursuant to the requirements of the Securities Exchange Act of 1934 and the Investment Company Act of 1940, the registrant has duly caused this report to be signed on its behalf by the undersigned, thereunto duly authorized.
| ALPS SERIES TRUST | ||
| By: | /s/ Jeremy O. May | |
| Jeremy O. May | ||
| President (Principal Executive Officer) | ||
| Date: | June 3, 2015 | |
Pursuant to the requirements of the Securities Exchange Act of 1934 and the Investment Company Act of 1940, this report has been signed below by the following persons on behalf of the registrant and in the capacities and on the dates indicated.
| By: | /s/ Jeremy O. May | |
| Jeremy O. May | ||
| President (Principal Executive Officer) | ||
| Date: | June 3, 2015 | |
| By: | /s/ Kimberly R. Storms | |
| Kimberly R. Storms | ||
| Treasurer (Principal Financial Officer) | ||
| Date: | June 3, 2015 | |