UNITED STATES
SECURITIES AND EXCHANGE COMMISSION
Washington, D.C. 20549
FORM N-CSR
CERTIFIED SHAREHOLDER REPORT OF REGISTERED
MANAGEMENT INVESTMENT COMPANIES
Investment Company Act file number 811-22748
YCG Funds
(Exact name of registrant as specified in charter)
3207 Ranch Road 620 South, Suite 200
Austin, TX 78738
(Address of principal executive offices) (Zip code)
William Kruger
YCG Funds
3207 Ranch Road 620 South, Suite 200
Austin, TX 78738
(Name and address of agent for service)
(512) 505-2347
Registrant's telephone number, including area code
Date of fiscal year end: November 30
Date of reporting period: December 1, 2020 to November 30, 2021
Item 1. Reports to Stockholders.
| |
 | YCG ENHANCED FUND |
| a series of the YCG Funds |
|
|
|
|
|
|
|
|
| | Annual Report | | |
| | November 30, 2021 | Ticker Symbol: YCGEX | |
YCG Enhanced Fund
MESSAGE TO SHAREHOLDERS
(Unaudited)
Dear Fellow Shareholder:
For the fiscal year ended November 30, 2021, the YCG Enhanced Fund achieved a total net return of 29.90%. During the same time period, the S&P 500 Index had a total return of 27.92%, and the S&P Global Broad Market Index had a total return of 19.39%. The Fund’s top five equity winners and top five equity losers during this period were as follows:
| TOP FIVE EQUITY | TOP FIVE EQUITY |
| WINNERS | LOSERS |
| MSCI, Inc. | Mastercard, Inc. – Class A |
| Microsoft Corp. | CoStar Group, Inc. |
| Alphabet, Inc. – Class C | Unilever, PLC. |
| CBRE Group, Inc. – Class A | Colgate-Palmolive Co. |
| Moody’s Corp. | HDFC Bank, Ltd. – ADR |
The top 5 equity winners and equity losers are determined based on a ranking of the dollar gains and losses of all the equity securities owned in the portfolio over the period specified above. This calculation excludes the portfolio’s options positions, which may have experienced a gain or a loss during the period specified. Additionally, the Fund seeks to maximize long term capital appreciation with reasonable investment risk. We believe that one year is too short a period to accurately assess the soundness of our investment strategy, and, thus, we try not to draw too many conclusions from the chart above. Instead, we evaluate ourselves by the Fund’s performance over a full economic cycle, which we define as a period that includes both a recession and an economic expansion.
Currently, one of the most dominant concerns among investors is inflation: specifically, whether the recent rapid price increases that we’ve seen in commodities, wages, and asset prices (stocks, housing) are signs of a transitory inflation or a more persistent, pernicious variety. Investors view this question as important since stocks are trading where they are, in part, because most high-grade bonds offer very little yield. Since most portfolios are a mix of stock and bonds, investors have come up with the acronym TINA (“There is no alternative”) to describe this phenomenon of investors paying higher prices than they have historically for stocks since, unlike bonds, they appear to actually offer meaningfully positive long-term nominal and real returns. If a persistent, hard-to-control inflation forces the Fed to materially raise rates, then, suddenly, TINA isn’t true anymore, and some investors may prefer the lower-but-historically-less-volatile returns of bonds, which could create downward pressure on stocks prices. In the remainder of this letter, we’ll explain how we think about inflation and what changes we’re making to the portfolio as a result.
YCG Enhanced Fund
Inflation
Inflation occurs when the supply of money and credit increases relative to the supply of goods and services (“too much money chasing too few goods”). Deflation occurs when the supply of money and credit decreases relative to the supply of goods and services (not enough money and too many goods).
So, let’s start with a sampling of deflationary pressures, which can occur when the supply of money and credit decreases or when the supply of goods and services increases.
| | 1) | Personal, corporate, and government debt paydown and/or cash buildup – All else equal, when individuals, corporations, and governments, in aggregate, pay down debt or build up cash (in other words, when there are not enough new borrowers to match the savers), the supply of money and credit declines. This decline in money and credit might occur in response to a financial crisis that forces individuals, corporations, and governments to repair their balance sheets, and it also might occur in a benign economic environment if there are not enough attractive consumption and investment opportunities to induce net new borrowing. Since money and credit are the two sources of spending in an economy, when their supply declines, total spending declines. When total spending declines, but the supply of goods and services remains the same, the prices of goods and services must, in aggregate, adjust downward. Furthermore, since one person’s spending is another person’s income, this reduction in spending sometimes causes a deflationary spiral where reduced spending leads to reduced income which leads to further reduced spending and so on. (SUPPLY OF MONEY AND CREDIT DECREASES) |
| | | |
| | 2) | Globalization – Globalization generally leads to a more optimal division of labor, which brings down the cost to produce goods and services. In a competitive market, a reduction in the costs of goods sold leads at least some companies to be willing to sell their products at a lower price, resulting in lower overall prices for goods and services. However, this deflation does not occur equally across countries. For the countries that have high-cost labor, such as the United States currently, there is more downward pressure on prices of goods and services, especially the labor component. In contrast, if a country has lower-cost labor that also has the infrastructure (education, roads, etc.) to supply desired goods and services, it can actually experience a golden age with a boom in real growth and healthy inflation, as China has recently experienced and as the U.S. did after World War II. (SUPPLY OF GOODS AND SERVICES INCREASES) |
| | | |
| | 3) | Technological progress – Innovations such as automation, better communication and transportation networks, cheaper resource extraction techniques, and the invention or discovery of cheaper and/or better substitute |
YCG Enhanced Fund
| | | |
| | | products all decrease the price of goods and services. In other words, for the same amount of money, a society can produce and/or purchase more goods and services. (SUPPLY OF GOODS AND SERVICES INCREASES) |
| | 4) | Reduction in the power of firms and workers to collude and/or collectively bargain – If employees can’t form labor unions and corporations aren’t allowed to collude with competitors, then they all have to compete with each other to earn income and profits, driving down prices. In other words, this competition increases the supply of workers, goods, and services for a given amount of money. (SUPPLY OF GOODS AND SERVICES INCREASES) |
| | 5) | Changes in government policies and societal norms that increase the confidence that a given denomination of a country’s money can be exchanged for a certain level of world output now and in the future – Confidence tends to increase, for example, when a government improves its fiscal discipline and trustworthiness by reducing corruption in government-contract bidding, by cutting projects that have demonstrated little societal return, and by allocating more to projects that have demonstrated strong returns, such as infrastructure and research and development. In these cases, a country’s money is more valued by the international community and, therefore, it can purchase more global goods and services for the same amount of money and credit. (SUPPLY OF GOODS AND SERVICES INCREASES) |
Below is a sampling of inflationary forces, which are mostly the reverse of the above deflationary forces:
| | 1) | Personal, corporate, and government debt increases – All else equal, when individuals, corporations, and governments, in aggregate, choose to increase their debt (in other words, when there are more borrowers than savers), the supply of money and credit increases. Since money and credit are the two sources of spending in an economy, when their supply increases, total spending increases. When total spending increases but the supply of goods and services remains the same, the prices of goods and services must, in aggregate, adjust upward. Furthermore, as in the deflationary example, but in reverse, this increase in spending sometimes sets off a virtuous cycle where higher spending leads to higher income which leads to higher spending and so on. (SUPPLY OF MONEY AND CREDIT INCREASES) |
| | 2) | Deglobalization – When a country closes itself off from rest of the world, it removes workers, resources, factories, and some of its institutional knowledge from the global market, decreasing network effects and division-of-labor efficiencies. This reduces the supply of goods and services available to each country for a given amount of money. (SUPPLY OF GOODS AND SERVICES DECREASES) |
YCG Enhanced Fund
| | | |
| | 3) | Technological stasis or reversal as a result of written or unwritten rules that impede innovation such as government price controls, regulatory red tape, and cultural norms that discourage entrepreneurship. (SUPPLY OF GOODS AND SERVICES DECREASES) |
| | | |
| | 4) | Increases in the power of firms and workers to collude and/or collectively bargain, reducing the supply of workers or products for a given amount of money. (SUPPLY OF GOODS AND SERVICES DECREASES) |
| | | |
| | 5) | Changes in government policies and societal norms that decrease the confidence that a given denomination of a country’s money can be exchanged for a certain level of world output now and in the future. For example, all other things equal, when a government dilutes the value of a country’s money by printing more of it, threatens not to honor existing debt, or institutes rules that weaken the economy to the extent that investors begin to question the long-term capacity of the economy to support its debt, it is contributing to inflationary pressures. Similarly, societal norms moving towards more widespread cheating on taxes and/or refusal to pay debts also create inflationary pressure. In most of these cases, a country’s money is less valued by the international community and so it can purchase fewer global goods and services for the same amount of money and credit. In the case of money printing, the supply of money and credit increases. (SUPPLY OF GOODS AND SERVICES DECREASES AND/OR SUPPLY OF MONEY AND CREDIT INCREASES) |
| | | |
| | 6) | Natural disasters – Earthquakes, hurricanes, droughts, and pandemics all tend to decrease the supply of goods and services, either directly or indirectly. Direct impacts include droughts that wipe out crops, earthquakes that destroy factories, and pandemics that result in loss of life (which reduces the supply of labor). Indirect impacts include social distancing and other safety measures that reduce productivity and, therefore, decrease the supply of goods and services that can be produced with a given amount of money. (SUPPLY OF GOODS AND SERVICES DECREASES) |
The above list shows that many causal factors need to be measured in order to predict inflation. As you probably noticed, creating accurate measurements for some of these categories is a Herculean task in and of itself. However, two additional considerations show that measurement problems are just the tip of the iceberg. First, each of these factors interacts in complex ways with all the other factors. In other words, in the real world, all is not equal. Changes in technological progress are not independent of globalization which is not independent of society’s aggregate balance sheet choices. Changes in one factor cause changes in other factors which cause changes in other factors and so on. Second, there is a huge and unpredictable psychological component to many of these factors. For instance, changes in government policy such as more money printing or increased government deficits
YCG Enhanced Fund
and debt sometimes scare individuals and corporations into reducing their spending by enough that the deflationary pressure of their behaviors outweighs the inflationary pressure of the government’s behavior. Other times, individuals and businesses increase their spending as a result of increased government deficits, accelerating inflationary pressures.
A look at the current situation provides a real-world example. Most economists believe the inflation we’re currently experiencing has been caused by both a decrease in the supply of goods and services and an increase in the supply of money and credit:
SUPPLY OF GOODS AND SERVICES (NET DECREASE):
| | 1) | Business closures during lockdowns (DECREASE) |
| | | |
| | 2) | New business start-ups, many of them online (INCREASE) |
| | | |
| | 3) | Protocols to prevent the spread of COVID that limited the number of people who could be in the same room or that made it harder for each person to do their job, both of which impacted output, especially at factories that produce and warehouses that ship durable goods. These issues are ongoing with COVID still wreaking havoc in key countries such as Brazil, India, and Indonesia. (DECREASE) |
| | | |
| | 4) | COVID protocols limiting international travel, even for business reasons, which disrupted global supply chains, either preventing or delaying movement of goods through the supply chain. These issues are ongoing with COVID still wreaking havoc in key countries such as Brazil, India, and Indonesia. (DECREASE) |
| | | |
| | 5) | With enhanced unemployment benefits that replaced or enhanced incomes as well as the return of day trading combined with an ebullient stock market, many workers are reluctant to return to the workforce, causing labor shortages and rising wages. (DECREASE) |
SUPPLY OF MONEY AND CREDIT (NET INCREASE)
| | 1) | Enhanced unemployment benefits, stimulus checks, and a whole host of other unprecedented deficit-driven government spending initiatives have increased society’s aggregate debt and, when combined with ebullient housing and stock markets, have increased the current incomes and the perceived wealth of many people (INCREASE) |
| | | |
| | 2) | Loan and rent forbearance programs (INCREASE) |
| | | |
| | 3) | Virus fears reduced discretionary spending, increased cash buildup, and improved debt pay down, putting many individuals in the position to splurge as the economy opens back up. (DECREASE THEN POTENTIALLY NET INCREASE) |
YCG Enhanced Fund
| | | |
| | 4) | COVID forced people to confront their mortality, couped them up, and shut down many of their favorite activities. This combination has created a strong emotional desire in many to spend regardless of budget. The surging popularity of the acronym YOLO, which stands for “You only live once,” demonstrates the ubiquity of these feelings. (DECREASE THEN INCREASE) |
| | | |
| | 5) | COVID suddenly and unexpectedly drove a major mix shift in spending, away from experiences and towards durable goods, including housing. It takes time to build the capacity to meet this unexpected stairstep up in demand.1 (MIXED: DECREASE IN EXPERIENCES AND INCREASE IN DURABLE GOODS) |
In our view, the above rationale seems to explain the inflation we’re currently experiencing. However, it unfortunately doesn’t help us to answer the question that really matters: Is this a transitory inflation, or is it the start of a more secular, sustained inflation? In order to answer this question, we need to answer a whole host of questions, including but not limited to: Is the housing market strength (and the willingness of many millennials to take on new debt to fund housing investment and consumption) sustainable, and, if so, how long will it take for supply to catch up to this newfound demand? Did recent COVID experiences cause individuals and corporations to be more averse to debt in the future, or have government actions bolstered confidence to continue borrowing? If there is increased borrowing demand, will banks actually lend and thereby the money multiplier increase, or will there continue to be a decrease in the velocity of money? Is the government willing to continue huge government deficits, and, if so, will they be used to fund high-return projects such as investments in research and development and infrastructure, or will they be used to fund stimulus payments that are perhaps less likely to produce durable increases in productivity and growth? Will enhanced unemployment benefits expire, turning today’s labor shortage into a labor glut? Will COVID and the continuing China-U.S. tensions result in a long-term move away from globalization, in which supply chains are optimized not for speed and cost but for resilience, or will the global supply chain be repaired and relubricated in short order? Will productivity dramatically increase, due to the pandemic supercharging innovation and capital spending, thereby reinforcing the persistent and decades-long deflationary pressure on wages for many workers in the U.S? Unfortunately, there are too many unknowable factors interacting in ways that are too complex and unpredictable to model future inflation with any degree of accuracy.
So, if we can’t predict future inflation (or any other macroeconomic factors, for that matter), what can we do?
____________
| | |
1 | See https://www.vox.com/the-goods/22445613/behavioral-economics-budget-post-pandemic. |
YCG Enhanced Fund
Well, we can prepare. And, to us, that means owning a portfolio that can deal reasonably well with both inflation and deflation. In our view, the Fund’s portfolio full of a diverse collection of global champions with enduring pricing power, ownership-minded management teams, and conservative balance sheets is such a portfolio. If the economy experiences future inflation, we think these businesses have such strong pricing power that they will be able to raise prices at least as fast as any cost increases that they experience and probably even faster. When combined with these companies’ attractive volume growth opportunities, we believe these price increases will drive persistent, high-return-on-invested-capital earnings growth that will, over the long-term, mostly offset any valuation multiple contraction that they experience from higher interest rates. If the economy experiences deflation, we believe these companies’ pricing power will enable them to keep their prices from falling as fast as their costs and that their dominant market positions and conservative balance sheets will enable them to grow their market share through aggressive investments in customer acquisition and through the purchase of distressed competitors.
Furthermore, because we believe investors tend to overly penalize businesses that they fear will be negatively impacted by the dominant macroeconomic narratives of the moment, we’ve used the recent inflation fears and excitement over the post-pandemic recovery as an opportunity to rebalance the portfolio. Therefore, we added to or introduced new stocks in the Fund’s portfolio that sold off because they have more stable cash flows and thus benefit less from inflation and economic strength, including the Fund’s Big Tech, software, and information services holdings. Conversely, we trimmed some of the more cyclical positions the Fund owns such as its bank, commercial real estate brokerage, and luxury holdings, all of which benefit from the inflation and economic recovery narrative and thus have experienced strong recent stock price performance.
Concluding Thoughts
The level of future inflation is undoubtedly an important component of future returns for both individual stocks and the market as a whole. As a result, it’s understandable that investors spend a lot of time thinking about it. Unfortunately, there are many things about that future that are impossible to predict, and inflation is one of them. Therefore, as with all other macroeconomic factors, we try to prepare rather than predict. By concentrating the Fund’s portfolio dollars on a diverse collection of global champions that possess enduring pricing power, ownership-minded management teams, and conservative balance sheets, we believe the Fund is prepared to both survive and thrive through a wide range of future economic scenarios. By adding portfolio dollars to stocks that underperform as a result of inflation fears and by trimming the Fund’s exposure to stocks that outperform as a result of these fears, we believe the Fund can capitalize on investors’ chronic short-termism and enhance the long-term, risk-adjusted return of its portfolio.
YCG Enhanced Fund
In our view, the key to successful long-term investing is to adopt a sensible game plan and then to execute this game plan in a disciplined way. We can adopt a sensible game plan on our own but we can only execute it in a disciplined way if you, the Fund shareholder, fully understand our investment process. This is why we spend so much time on our thought process in these quarterly letters. And it also explains why we continue to be so grateful to you for the trust and grace you display by allowing us to steward your hard-earned savings through both good times and bad. Know that we take this responsibility incredibly seriously and that we are invested right alongside you.
Finally, we hope you have a great 2022, and please reach out to us with any questions or concerns you may have. We are here to help!
Sincerely,
The YCG Team
Past performance does not guarantee future results.
Mutual fund investing involves risk. Principal loss is possible. The Fund is non-diversified, meaning it may concentrate its assets in fewer individual holdings than a diversified fund. Therefore, the Fund is more exposed to individual stock volatility than a diversified fund. The Fund invests primarily in equity securities without regard to market capitalization, thus investments will be made in mid and smaller capitalization companies, which involve additional risks such as limited liquidity and greater volatility. The Fund may also write put options and covered call options on a substantial portion of the Fund’s long equity portfolio, which have the risks of early option contract assignment forcing the Fund to purchase the underlying stock at the exercise price which may be the cause of significant losses due to the failure of correctly predicting the direction of securities prices, interest rates and currency exchange rates. The investment in options is not suitable for all investors. Covered call writing may limit the upside of an underlying security. The Fund may also invest in foreign securities which involve political, economic and currency risks, greater volatility, and differences in accounting methods. Investments in debt securities typically decrease in value when interest rates rise. This risk is usually greater for longer-term debt securities. Investment in lower-rated, non-rated and distressed securities presents a greater risk of loss to principal and interest than higher-rated securities.
Diversification does not guarantee a profit or protect from loss in a declining market.
Fund holdings and sector allocations are subject to change at any time and should not be considered recommendations to buy or sell any security. Please see the Schedule of Investments in this report for a complete list of Fund holdings.
The S&P 500 or Standard & Poor’s 500 Index is a market-capitalization-weighted index of the 500 largest U.S. publicly traded companies. The index is widely regarded as the best gauge of large-cap U.S. equities.
The S&P Global Broad Market Index is a market capitalization-weighted index that provides a broad measure of the global equities markets and includes approximately 11,000 companies in more than 52 countries covering both developed and emerging markets.
YCG Enhanced Fund
Cash flow is a measure of changes in a company’s cash account during an accounting period, specifically its cash income minus the cash payments it makes. All else being equal, we greatly prefer companies that have high “free cash flows,” which we define as the cash flow from operations that is left over after spending on maintenance capital expenditures and acquisitions that are required to protect the business. In other words, it’s the cash flow from operations that is free and clear to be distributed to shareholders in the form of dividends and share repurchases, and/or to be allocated towards ways to grow the existing business through means such as “growth” acquisitions or new capital expenditures, or simply pay down debt. Typically, we calculate this by looking at a normalized view of net income plus depreciation and amortization minus the maintenance capital expenditures and acquisitions that are required to protect the business, adjusted for often overlooked items such as pensions, stock option expenses, and leases.
The forward risk-adjusted rate of return of a stock is our probability- and risk-weighted estimate of the compound annualized return we believe we are likely to achieve by owning the stock. Using our methodology, the forward risk-adjusted rate of return is calculated by taking the sum total of the free cash flow per share of the company divided by its price (its “Free Cash Flow Yield”) and the long-term rate at which we expect these free cash flows to grow (the “Growth Rate of Free Cash Flow”) and then adjusting this number up or down based on the risk inherent in the stock (i.e. how wide the potential distribution of expected returns are in the various possible future scenarios).
YCG Enhanced Fund
EXPENSE EXAMPLE
For the six months ended November 30, 2021 (Unaudited)
As a shareholder of the YCG Enhanced Fund (the “Fund”), you incur ongoing costs, including management fees and other Fund expenses. If you invest through a financial intermediary, you may also incur additional costs such as a transaction fee charged on the purchase or sale of the Fund or an asset-based management fee. This example is intended to help you understand your ongoing costs (in dollars) of investing in the Fund and to compare these costs with the ongoing costs of investing in other mutual funds.
The Example is based on an investment of $1,000 invested at the beginning of the period and held for the entire period from June 1, 2021 to November 30, 2021.
Actual Expenses
The first line of the table on the next page provides information about actual account values and actual expenses. You may use the information provided in this line, together with the amount you invested, to estimate the expenses that you paid over the period. Simply divide your account value by $1,000 (for example, an $8,600 ending account value divided by $1,000 = 8.6), then multiply the result by the number in the first line under the heading entitled “Expenses Paid During the Period” to estimate the expenses you paid on your account during the period.
Hypothetical Example for Comparison Purposes
The second line of the table on the next page provides information about hypothetical account values and hypothetical expenses based on the Fund’s actual expense ratio and an assumed rate of return of 5% per year before expenses, which is not the Fund’s actual return. The hypothetical account values and expenses may not be used to estimate the actual ending account balance or expenses you paid for the period. You may use this information to compare the ongoing costs of investing in the Fund and other funds. To do so, compare this 5% hypothetical example with the 5% hypothetical examples that appear in the shareholder reports of the other funds.
YCG Enhanced Fund
EXPENSE EXAMPLE (continued)
For the six months ended November 30, 2021 (Unaudited)
Please note that the expenses shown in the table are meant to highlight your ongoing costs only and do not reflect any costs that may be associated with investing in the Fund through a financial intermediary. Therefore, the second line of the table is useful in comparing the ongoing costs only, and will not help you determine the relative total costs of owning different funds. In addition, if any costs associated with investing through a financial intermediary were included, your costs would have been higher.
| | | | Expenses Paid |
| | Beginning | Ending | During Period(a) |
| | Account Value | Account Value | 6/1/21 – |
| | 6/1/21 | 11/30/21 | 11/30/21 |
| Actual | $1,000.00 | $1,100.50 | $6.27 |
| | | | |
| Hypothetical (5% return | | | |
| before expenses) | 1,000.00 | 1,019.10 | 6.02 |
(a) | Expenses are equal to the Fund’s annualized expense ratio of 1.19%, multiplied by the average account value over the period, multiplied by 183/365 to reflect the period. |
YCG Enhanced Fund
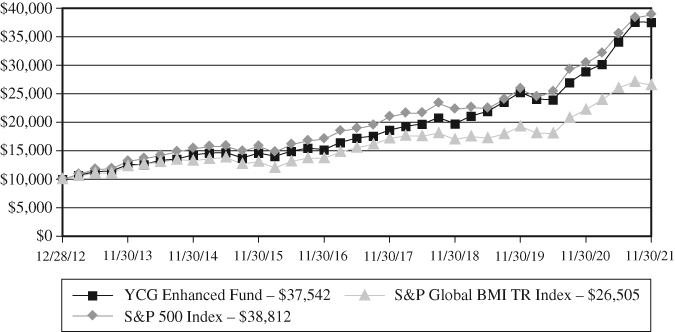
GROWTH OF $10,000 INVESTMENT
(Unaudited)
This chart assumes an initial gross investment of $10,000 made on December 28, 2012 (commencement of the Fund’s operations). Returns shown include the reinvestment of all dividends. Returns shown do not reflect the deductions of taxes that a shareholder would pay on Fund distributions or the redemption of Fund shares. In the absence of fee waivers and reimbursements, when they are necessary to keep expenses at the expense cap, total return would be reduced. Past performance is not predictive of future performance. Investment return and principal value will fluctuate so that your shares, when redeemed, may be worth more or less than original cost. Index returns do not reflect the effects of fees or expenses. It is not possible to invest directly in an index.
| | | | | Since Inception |
| | One Year | Three Year | Five Year | (12/28/2012) |
| Average Annual Returns | | | | |
| YCG Enhanced Fund | 29.90% | 23.85% | 19.82% | 15.98% |
| S&P 500 Index | 27.92% | 20.38% | 17.90% | 16.41% |
| S&P Global BMI | | | | |
| Total Return Index | 19.39% | 16.03% | 14.14% | 11.54% |
YCG Enhanced Fund
TOP TEN EQUITY HOLDINGS
November 30, 2021 (Unaudited)
| | | Percentage of |
| | | Net Assets |
| Microsoft Corp. | | | 5.56 | % |
| Moody’s Corp. | | | 5.36 | % |
| Amazon, Inc. | | | 5.24 | % |
| Alphabet, Inc. – Class C | | | 5.11 | % |
| MSCI, Inc. | | | 4.83 | % |
| MasterCard, Inc. – Class A | | | 4.50 | % |
| NIKE, Inc. – Class B | | | 3.77 | % |
| Aon PLC – Class A | | | 3.62 | % |
| Verisk Analytics, Inc. | | | 3.53 | % |
| Copart, Inc. | | | 3.21 | % |
| Total | | | 44.73 | % |
ALLOCATION OF PORTFOLIO HOLDINGS (as a % of net assets)
November 30, 2021 (Unaudited)
For Fund compliance purposes, the Fund’s industry classifications refer to any one or more of the industry sub-classifications used by one or more widely recognized market indexes or ratings group indexes, and/or they may be defined by Fund management. This definition does not apply for all purposes of this report, which may combine sub-classifications for reporting ease. Categories are shown as a percentage of net assets.
YCG Enhanced Fund
SCHEDULE OF INVESTMENTS
November 30, 2021
| | | Shares | | | Value | |
| COMMON STOCKS – 90.85% | | | | | | |
| | | | | | | |
| Automobiles – 1.09% | | | | | | |
| Ferrari NV (a) | | | 22,928 | | | $ | 5,971,827 | |
| | | | | | | | | |
| Banks – 2.76% | | | | | | | | |
| HDFC Bank Ltd. – ADR (a) | | | 143,521 | | | | 9,396,320 | |
| JPMorgan Chase & Co. | | | 35,532 | | | | 5,643,547 | |
| | | | | | | | 15,039,867 | |
| | | | | | | | | |
| Beverages – 1.67% | | | | | | | | |
| PepsiCo., Inc. | | | 56,870 | | | | 9,086,689 | |
| | | | | | | | | |
| Capital Markets – 12.84% | | | | | | | | |
| Moody’s Corp. | | | 74,847 | | | | 29,238,232 | |
| MSCI, Inc. | | | 41,877 | | | | 26,359,478 | |
| S&P Global, Inc. | | | 19,003 | | | | 8,660,237 | |
| The Charles Schwab Corp. | | | 75,044 | | | | 5,807,655 | |
| | | | | | | | 70,065,602 | |
| | | | | | | | | |
| Commercial Services & Supplies – 3.21% | | | | | | | | |
| Copart, Inc. (b) | | | 120,695 | | | | 17,520,086 | |
| | | | | | | | | |
| | | | | | | | | |
| Hotels, Restaurants & Leisure – 1.27% | | | | | | | | |
| Booking Holdings, Inc. (b) | | | 3,294 | | | | 6,923,494 | |
| | | | | | | | | |
| | | | | | | | | |
| Household Products – 2.98% | | | | | | | | |
| Colgate-Palmolive Co. | | | 99,311 | | | | 7,450,311 | |
| The Procter & Gamble Co. (c) | | | 60,754 | | | | 8,783,813 | |
| | | | | | | | 16,234,124 | |
| | | | | | | | | |
| Insurance – 9.52% | | | | | | | | |
| Aon PLC – Class A (a)(c) | | | 66,807 | | | | 19,759,506 | |
| Marsh & McLennan Cos, Inc. | | | 100,424 | | | | 16,471,545 | |
| The Progressive Corp. | | | 168,897 | | | | 15,697,287 | |
| | | | | | | | 51,928,338 | |
| | | | | | | | | |
| Interactive Media & Services – 9.11% | | | | | | | | |
| Alphabet, Inc. – Class C (b) | | | 9,776 | | | | 27,852,215 | |
| Meta Platforms, Inc. – Class A (b) | | | 50,331 | | | | 16,330,396 | |
| Tencent Holdings Ltd. – ADR (a) | | | 94,651 | | | | 5,532,351 | |
| | | | | | | | 49,714,962 | |
See notes to financial statements.
YCG Enhanced Fund
SCHEDULE OF INVESTMENTS (continued)
November 30, 2021
| | | Shares | | | Value | |
| COMMON STOCKS – 90.85% (continued) | | | | | | |
| | | | | | | |
| Internet & Direct Marketing Retail – 5.64% | | | | | | |
| Alibaba Group Holding Ltd. – ADR (a)(b) | | | 17,184 | | | $ | 2,191,476 | |
| Amazon.com, Inc. (b) | | | 8,144 | | | | 28,561,578 | |
| | | | | | | | 30,753,054 | |
| | | | | | | | | |
| IT Services – 5.51% | | | | | | | | |
| MasterCard, Inc. – Class A | | | 77,951 | | | | 24,548,329 | |
| PayPal Holdings, Inc. (b) | | | 9,876 | | | | 1,825,974 | |
| Visa, Inc. – Class A | | | 18,925 | | | | 3,667,097 | |
| | | | | | | | 30,041,400 | |
| | | | | | | | | |
| Personal Products – 6.48% | | | | | | | | |
| L’Oreal SA (a)(d) | | | 33,168 | | | | 14,952,232 | |
| The Estee Lauder Companies, Inc. – Class A | | | 39,548 | | | | 13,132,704 | |
| Unilever PLC – ADR (a) | | | 143,369 | | | | 7,290,314 | |
| | | | | | | | 35,375,250 | |
| | | | | | | | | |
| Professional Services – 5.81% | | | | | | | | |
| CoStar Group, Inc. (b) | | | 159,944 | | | | 12,437,246 | |
| Verisk Analytics, Inc. | | | 85,668 | | | | 19,264,163 | |
| | | | | | | | 31,701,409 | |
| | | | | | | | | |
| Real Estate Management & Development – 2.90% | | | | | | | | |
| CBRE Group, Inc. – Class A (b) | | | 165,570 | | | | 15,823,525 | |
| Software – 9.27% | | | | | | | | |
| Adobe, Inc. (b) | | | 12,828 | | | | 8,592,836 | |
| Intuit, Inc. | | | 17,911 | | | | 11,683,345 | |
| Microsoft Corp. | | | 91,685 | | | | 30,310,144 | |
| | | | | | | | 50,586,325 | |
| | | | | | | | | |
| Technology Hardware, Storage & Peripherals – 1.75% | | | | | | | | |
| Apple, Inc. | | | 57,807 | | | | 9,555,497 | |
| | | | | | | | | |
| Textiles, Apparel & Luxury Goods – 9.04% | | | | | | | | |
| Adidas AG (a) | | | 18,342 | | | | 5,315,843 | |
| Hermes International (a) | | | 7,311 | | | | 13,705,638 | |
| LVMH Moet Hennessy Louis Vuitton SE (a) | | | 12,432 | | | | 9,680,425 | |
| NIKE, Inc. – Class B | | | 121,659 | | | | 20,589,569 | |
| | | | | | | | 49,291,475 | |
| TOTAL COMMON STOCKS (Cost $268,301,432) | | | | | | | 495,612,924 | |
See notes to financial statements.
YCG Enhanced Fund
SCHEDULE OF INVESTMENTS (continued)
November 30, 2021
| | | Principal | | | | |
| | | Amount | | | Value | |
| SHORT-TERM INVESTMENTS – 7.11% | | | | | | |
| U.S. Treasury Bills – 7.11% | | | | | | |
| 0.000%, 12/02/2021 (e)(f) | | $ | 289,000 | | | $ | 289,000 | |
| 0.001%, 12/09/2021 (e) | | | 253,000 | | | | 252,999 | |
| 0.006%, 12/16/2021 (e) | | | 448,000 | | | | 447,995 | |
| 0.021%, 12/21/2021 (e) | | | 298,000 | | | | 297,992 | |
| 0.004%, 12/23/2021 (e) | | | 335,000 | | | | 334,994 | |
| 0.009%, 12/30/2021 (e) | | | 2,164,000 | | | | 2,163,949 | |
| 0.006%, 01/06/2022 (e) | | | 269,000 | | | | 268,992 | |
| 0.005%, 01/13/2022 (e) | | | 76,000 | | | | 75,998 | |
| 0.007%, 01/20/2022 (e) | | | 419,000 | | | | 418,985 | |
| 0.010%, 01/27/2022 (e) | | | 377,000 | | | | 376,982 | |
| 0.007%, 02/03/2022 (e) | | | 359,000 | | | | 358,974 | |
| 0.009%, 02/10/2022 (e) | | | 648,000 | | | | 647,944 | |
| 0.009%, 02/17/2022 (e) | | | 372,000 | | | | 371,962 | |
| 0.011%, 02/24/2022 (e) | | | 1,254,000 | | | | 1,253,877 | |
| 0.013%, 03/03/2022 (e) | | | 7,150,000 | | | | 7,149,129 | |
| 0.011%, 03/10/2022 (e) | | | 299,000 | | | | 298,961 | |
| 0.010%, 03/17/2022 (e) | | | 1,068,000 | | | | 1,067,846 | |
| 0.013%, 03/24/2022 (e) | | | 106,000 | | | | 105,983 | |
| 0.014%, 03/31/2022 (e) | | | 285,000 | | | | 284,948 | |
| 0.021%, 04/07/2022 (e) | | | 582,000 | | | | 581,882 | |
| 0.020%, 04/21/2022 (e) | | | 128,000 | | | | 127,966 | |
| 0.021%, 04/28/2022 (e) | | | 17,679,000 | | | | 17,673,549 | |
| 0.023%, 05/05/2022 (e) | | | 1,448,000 | | | | 1,447,486 | |
| 0.028%, 05/12/2022 (e) | | | 1,800,000 | | | | 1,799,332 | |
| 0.039%, 05/19/2022 (e) | | | 359,000 | | | | 358,852 | |
| 0.048%, 05/26/2022 (e) | | | 312,000 | | | | 311,863 | |
| TOTAL SHORT-TERM INVESTMENTS (Cost $38,773,795) | | | | | | | 38,768,440 | |
| Total Investments (Cost $307,075,227) – 97.96% | | | | | | | 534,381,364 | |
| Other Assets in Excess of Liabilities – 2.04% | | | | | | | 11,141,290 | |
| TOTAL NET ASSETS – 100.00% | | | | | | $ | 545,522,654 | |
See notes to financial statements.
YCG Enhanced Fund
SCHEDULE OF INVESTMENTS (continued)
November 30, 2021
Percentages are stated as a percent of net assets.
| ADR | American Depositary Receipt |
| PLC | Public Limited Company |
| (a) | Foreign issued security. |
| (b) | Non–income producing. |
| (c) | A portion of this security is pledged as collateral on options written. As of November 30, 2021, the value of collateral is $11,737,586. |
| (d) | A portion of this security is classified as illiquid due to a technicality on how it trades; however, it is valued the same as the regular shares. |
| (e) | Reflects the annualized yield on the date of purchase for discounted investments. |
| (f) | Less than 0.0005%. |
The Global Industry Classification Standard (GICS®) was developed by and/or is the exclusive property of MSCI, Inc. (“MSCI”) and Standard & Poor Financial Services LLC (“S&P”). GICS is a service mark of MSCI and S&P and has been licensed for use by U.S. Bank Global Fund Services.
See notes to financial statements.
YCG Enhanced Fund
SCHEDULE OF OPTIONS WRITTEN
November 30, 2021
| | | | | | Notional | | | | |
| | | Contracts | | | Amount | | | Value | |
PUT OPTIONS(a) | | | | | | | | | |
| Adobe, Inc. | | | | | | | | | |
| Expiration: December 2021; | | | | | | | | | |
| Exercise Price: $630.00 | | | 19 | | | $
| 1,197,000 | | | $
| 19,855 | |
| Expiration: December 2021; | | | | | | | | | | | | |
| Exercise Price: $660.00 | | | 110 | | | | 7,260,000 | | | | 198,110 | |
| Alibaba Group Holding Ltd. | | | | | | | | | | | | |
| Expiration: February 2022; | | | | | | | | | | | | |
| Exercise Price: $145.00 | | | 255 | | | | 3,697,500 | | | | 587,265 | |
| Amazon.com, Inc. | | | | | | | | | | | | |
| Expiration: February 2022; | | | | | | | | | | | | |
| Exercise Price: $3,740.00 | | | 11 | | | | 4,114,000 | | | | 382,608 | |
| Apple, Inc. | | | | | | | | | | | | |
| Expiration: January 2022; | | | | | | | | | | | | |
| Exercise Price: $145.00 | | | 365 | | | | 5,292,500 | | | | 49,640 | |
| CoStar Group, Inc. | | | | | | | | | | | | |
| Expiration: January 2022; | | | | | | | | | | | | |
| Exercise Price: $82.00 | | | 180 | | | | 1,476,000 | | | | 109,800 | |
| Expiration: January 2022; | | | | | | | | | | | | |
| Exercise Price: $83.00 | | | 250 | | | | 2,075,000 | | | | 168,750 | |
| Expiration: January 2022; | | | | | | | | | | | | |
| Exercise Price: $94.00 | | | 320 | | | | 3,008,000 | | | | 515,200 | |
| Intuit, Inc. | | | | | | | | | | | | |
| Expiration: January 2022; | | | | | | | | | | | | |
| Exercise Price: $560.00 | | | 45 | | | | 2,520,000 | | | | 38,700 | |
| Meta Platforms, Inc. | | | | | | | | | | | | |
| Expiration: December 2021; | | | | | | | | | | | | |
| Exercise Price: $325.00 | | | 20 | | | | 650,000 | | | | 21,400 | |
| Expiration: December 2021; | | | | | | | | | | | | |
| Exercise Price: $345.00 | | | 16 | | | | 552,000 | | | | 38,080 | |
| Expiration: January 2022; | | | | | | | | | | | | |
| Exercise Price: $325.00 | | | 143 | | | | 4,647,500 | | | | 250,965 | |
| Microsoft Corp. | | | | | | | | | | | | |
| Expiration: February 2022; | | | | | | | | | | | | |
| Exercise Price: $345.00 | | | 150 | | | | 5,175,000 | | | | 363,750 | |
See notes to financial statements.
YCG Enhanced Fund
SCHEDULE OF OPTIONS WRITTEN (continued)
November 30, 2021
| | | | | | Notional | | | | |
| | | Contracts | | | Amount | | | Value | |
PUT OPTIONS(a) (continued) | | | | | | | | | |
| PayPal Holdings, Inc. | | | | | | | | | |
| Expiration: December 2021; | | | | | | | | | |
| Exercise Price: $280.00 | | | 108 | | | | 3,024,000 | | | $ | 1,052,244 | |
| Expiration: February 2022; | | | | | | | | | | | | |
| Exercise Price: $200.00 | | | 18 | | | | 360,000 | | | | 42,336 | |
| Expiration: February 2022; | | | | | | | | | | | | |
| Exercise Price: $210.00 | | | 70 | | | | 1,470,000 | | | | 219,730 | |
| S&P Global, Inc. | | | | | | | | | | | | |
| Expiration: January 2022; | | | | | | | | | | | | |
| Exercise Price: $450.00 | | | 60 | | | | 2,700,000 | | | | 72,600 | |
| Verisk Analytics, Inc. | | | | | | | | | | | | |
| Expiration: December 2021; | | | | | | | | | | | | |
| Exercise Price: $220.00 | | | 20 | | | | 440,000 | | | | 6,000 | |
| Visa, Inc. | | | | | | | | | | | | |
| Expiration: December 2021; | | | | | | | | | | | | |
| Exercise Price: $225.00 | | | 127 | | | | 2,857,500 | | | | 395986 | |
| Expiration: January 2022; | | | | | | | | | | | | |
| Exercise Price: $230.00 | | | 35 | | | | 805,000 | | | | 127925 | |
| Expiration: February 2022; | | | | | | | | | | | | |
| Exercise Price: $205.00 | | | 7 | | | | 143,500 | | | | 12,761 | |
| Total Options Written | | | | | | | | | | | | |
| (Premiums received $3,175,464) | | | | | | | | | | $ | 4,673,705 | |
| | | | | | | | | | | | | |
See notes to financial statements.
YCG Enhanced Fund
STATEMENT OF ASSETS AND LIABILITIES
November 30, 2021
| ASSETS: | | | |
| Investments, at value (Cost $307,075,227) | | $ | 534,381,364 | |
| Foreign currency, at value (Cost $1,985,520) | | | 2,015,694 | |
| Cash | | | 633 | |
| Deposits with brokers for options written | | | 14,362,957 | |
| Receivable for Fund shares sold | | | 1,092,673 | |
| Dividends and interest receivable | | | 335,627 | |
| Prepaid expenses | | | 32,897 | |
| Total Assets | | | 552,221,845 | |
| | | | | |
| LIABILITIES: | | | | |
| Options written, at value (Premiums received $3,175,464) | | | 4,673,705 | |
| Payable for Fund shares redeemed | | | 41,640 | |
| Payable to investment advisor | | | 454,595 | |
| Payable for investments purchased | | | 1,400,000 | |
| Payable to custodian | | | 6,600 | |
| Other accrued expenses | | | 122,651 | |
| Total Liabilities | | | 6,699,191 | |
| NET ASSETS | | $ | 545,522,654 | |
| | | | | |
| NET ASSETS CONSIST OF: | | | | |
| Capital stock | | $ | 271,088,523 | |
| Total distributable earnings (accumulated deficit) | | | 274,434,131 | |
| Total Net Assets | | $ | 545,522,654 | |
| Shares outstanding (unlimited shares of no par value authorized) | | | 17,609,977 | |
| | | | | |
| NET ASSET VALUE, OFFERING AND | | | | |
REDEMPTION PRICE PER SHARE(a) | | $ | 30.98 | |
(a) | A redemption fee of 2.00% is assessed against shares redeemed within 30 days of purchase. See Note 2(i). |
See notes to financial statements.
YCG Enhanced Fund
STATEMENT OF OPERATIONS
For the year ended November 30, 2021
| INVESTMENT INCOME: | | | |
Dividend income(a) | | $ | 4,113,573 | |
| Interest income | | | 10,349 | |
| Total Investment Income | | | 4,123,922 | |
| EXPENSES: | | | | |
| Investment advisory fees | | | 4,841,499 | |
| Administration fees | | | 186,993 | |
| Shareholder service fees | | | 176,624 | |
| Transfer agent fees and expenses | | | 131,877 | |
| Accounting fees | | | 111,916 | |
| Legal fees | | | 72,839 | |
| Compliance fees | | | 59,999 | |
| Federal and state registration fees | | | 49,475 | |
| Custody fees | | | 37,678 | |
| Trustees fees and expenses | | | 23,999 | |
| Audit and tax fees | | | 16,997 | |
| Insurance fees | | | 11,739 | |
| Reports to Shareholders | | | 11,243 | |
| Miscellaneous expenses | | | 861 | |
| Total expenses before reimbursements/recoupments | | | 5,733,739 | |
| Net expense recoupment (reimbursement) | | | | |
| by investment advisor (see Note 4) | | | 27,645 | |
Net Expenses | | | 5,761,384 | |
| NET INVESTMENT INCOME (LOSS) | | | (1,637,462 | ) |
| REALIZED AND UNREALIZED GAIN (LOSS): | | | | |
| Net realized gain (loss) on | | | | |
| Investments | | | 41,189,079 | |
| Options written | | | 10,274,833 | |
| Foreign currency transactions | | | 34,654 | |
| Net change in unrealized appreciation (depreciation) on | | | | |
| Investments | | | 75,425,162 | |
| Options written | | | (2,776,940 | ) |
| Foreign currency transactions | | | (18,826 | ) |
| Net realized and unrealized gain (loss) on investments | | | 124,127,962 | |
| NET INCREASE (DECREASE) IN NET ASSETS | | | | |
| RESULTING FROM OPERATIONS | | $ | 122,490,500 | |
(a) | Net of $72,320 in foreign withholding taxes and fees. |
See notes to financial statements.
YCG Enhanced Fund
STATEMENTS OF CHANGES IN NET ASSETS
| | | Year Ended | | | Year Ended | |
| | | November 30, 2021 | | | November 30, 2020 | |
| OPERATIONS: | | | | | | |
| Net investment income (loss) | | $ | (1,637,462 | ) | | $ | (505,939 | ) |
| Net realized gain (loss) on | | | | | | | | |
| investments and options written | | | 51,498,566 | | | | (19,540 | ) |
| Net change in unrealized appreciation | | | | | | | | |
| (depreciation) on investments | | | | | | | | |
| and options written | | | 72,629,396 | | | | 57,390,754 | |
| Net increase (decrease) in net assets | | | | | | | | |
| resulting from operations | | | 122,490,500 | | | | 56,865,275 | |
| | | | | | | | | |
| CAPITAL SHARE TRANSACTIONS: | | | | | | | | |
| Proceeds from shares sold | | | 48,549,795 | | | | 146,143,174 | |
| Proceeds from reinvestment of distributions | | | — | | | | 1,689,631 | |
| Redemption fees | | | 3,132 | | | | 45,166 | |
| Payment for shares redeemed | | | (39,074,246 | ) | | | (106,820,398 | ) |
| Net increase (decrease) | | | 9,478,681 | | | | 41,057,573 | |
| | | | | | | | | |
| DISTRIBUTIONS TO SHAREHOLDERS: | | | | | | | | |
| Distributions to shareholders | | | — | | | | (1,852,171 | ) |
| | | | | | | | | |
| TOTAL INCREASE (DECREASE) | | | | | | | | |
| IN NET ASSETS | | | 131,969,181 | | | | 96,070,677 | |
| | | | | | | | | |
| NET ASSETS: | | | | | | | | |
| Beginning of period | | | 413,553,473 | | | | 317,482,796 | |
| End of period | | $
| 545,522,654 | | | $
| 413,553,473 | |
| | | | | | | | | |
| CHANGE IN SHARES OUTSTANDING: | | | | | | | | |
| Shares sold | | | 1,729,178 | | | | 7,576,427 | |
| Issued in reinvestment of distributions | | | — | | | | 79,625 | |
| Shares redeemed | | | (1,460,063 | ) | | | (5,471,065 | ) |
| Net increase (decrease) | | | 269,115 | | | | 2,184,987 | |
See notes to financial statements.
YCG Enhanced Fund
FINANCIAL HIGHLIGHTS
For a Fund share outstanding throughout the period
| | | Year Ended November 30, | |
| | | 2021 | | | 2020 | | | 2019 | | | 2018 | | | 2017 | |
| NET ASSET VALUE: | | | | | | | | | | | | | | | |
| Beginning of year | | $ | 23.85 | | | $ | 20.95 | | | $ | 16.99 | | | $ | 16.60 | | | $ | 14.00 | |
| | | | | | | | | | | | | | | | | | | | | |
| OPERATIONS: | | | | | | | | | | | | | | | | | | | | |
| Net investment income (loss) | | | (0.09 | )(a) | | | (0.03 | ) | | | 0.02 | | | | 0.06 | | | | 0.07 | |
| Net realized and unrealized | | | | | | | | | | | | | | | | | | | | |
| gain (loss) on investment securities | | | 7.22 | | | | 3.05 | | | | 4.48 | | | | 0.93 | | | | 3.00 | |
| Total from investment operations | | | 7.13 | | | | 3.02 | | | | 4.50 | | | | 0.99 | | | | 3.07 | |
| Redemption fee proceeds | | | — | (b) | | | — | (b) | | | — | (b) | | | — | (b) | | | — | |
| | | | | | | | | | | | | | | | | | | | | |
| Dividends from net | | | | | | | | | | | | | | | | | | | | |
| investment income | | | — | | | | (0.01 | ) | | | (0.06 | ) | | | (0.07 | ) | | | (0.08 | ) |
| Dividends from net realized gains | | | — | | | | (0.11 | ) | | | (0.48 | ) | | | (0.53 | ) | | | (0.39 | ) |
| Total distributions | | | — | | | | (0.12 | ) | | | (0.54 | ) | | | (0.60 | ) | | | (0.47 | ) |
| | | | | | | | | | | | | | | | | | | | | |
| NET ASSET VALUE: | | | | | | | | | | | | | | | | | | | | |
| End of period | | $ | 30.98 | | | $ | 23.85 | | | $ | 20.95 | | | $ | 16.99 | | | $ | 16.60 | |
| | | | | | | | | | | | | | | | | | | | | |
| TOTAL RETURN | | | 29.90 | % | | | 14.49 | % | | | 27.74 | % | | | 6.08 | % | | | 22.58 | % |
| | | | | | | | | | | | | | | | | | | | | |
| SUPPLEMENTAL DATA | | | | | | | | | | | | | | | | | | | | |
| AND RATIOS: | | | | | | | | | | | | | | | | | | | | |
| Net assets; end of period (000’s) | | $ | 545,523 | | | $ | 413,553 | | | $ | 317,483 | | | $ | 201,576 | | | $ | 142,099 | |
| Ratio of expenses to | | | | | | | | | | | | | | | | | | | | |
| average net assets: | | | | | | | | | | | | | | | | | | | | |
| Expenses including | | | | | | | | | | | | | | | | | | | | |
| reimbursement (recapture) | | | 1.19 | % | | | 1.19 | % | | | 1.19 | % | | | 1.19 | % | | | 1.19 | % |
| Expenses excluding | | | | | | | | | | | | | | | | | | | | |
| reimbursement (recapture) | | | 1.18 | % | | | 1.19 | % | | | 1.20 | % | | | 1.24 | % | | | 1.34 | % |
| Net investment income | | | | | | | | | | | | | | | | | | | | |
| (loss) including | | | | | | | | | | | | | | | | | | | | |
| reimbursement (recapture) | | | (0.34 | )% | | | (0.14 | )% | | | 0.09 | % | | | 0.37 | % | | | 0.47 | % |
| Net investment income | | | | | | | | | | | | | | | | | | | | |
| (loss) excluding | | | | | | | | | | | | | | | | | | | | |
| reimbursement (recapture) | | | (0.33 | )% | | | (0.14 | )% | | | 0.08 | % | | | 0.32 | % | | | 0.32 | % |
| Portfolio turnover rate | | | 18 | % | | | 44 | % | | | 6 | % | | | 21 | % | | | 16 | % |
(a) | Net investment income/(loss) per share has been calculated based on average shares outstanding during the period. |
(b) | Amount represents less than $0.01 per share. |
See notes to financial statements.
YCG Enhanced Fund
NOTES TO FINANCIAL STATEMENTS
November 30, 2021
YCG Funds (the “Trust”) is a Delaware statutory trust organized under an Agreement and Declarations of Trust dated September 4, 2012. The Trust is an open-end management investment company, as defined in the Investment Company Act of 1940 (the “1940 Act”), as amended. The Trust consists of one series, YCG Enhanced Fund (the “Fund”). The Fund is classified and operates as a non-diversified fund under the 1940 Act. The Fund commenced operations on December 28, 2012. The Fund’s investment adviser is YCG, LLC (the “Adviser”). There are an unlimited number of authorized shares. The investment objective of the Fund is to maximize long-term capital appreciation with reasonable investment risk.
| 2. | SUMMARY OF SIGNIFICANT ACCOUNTING POLICIES |
The following is a summary of significant accounting policies consistently followed by the Fund in the preparation of its financial statements. The financial statements have been prepared in conformity with accounting principles generally accepted in the United States of America (“GAAP”). The Fund is an investment company and accordingly follows the investment company accounting and reporting guidance of the Financial Accounting Standards Board (“FASB”) Accounting Standards Codification (“ASC”) Topic 946 Financial Services – Investment Companies.
a) Subsequent Events Evaluation – In preparing these financial statements, the Fund has evaluated events and transactions for potential recognition or disclosure resulting from subsequent events through the date the financial statements were issued. This evaluation did not result in any subsequent events that necessitated disclosures and/or adjustments other than noted below.
On December 15, 2021, the Trust declared and paid distributions from net realized capital gains to shareholders of record as of December 14, 2021, as follows:
| | Short-Term Capital Gain | Long-Term Capital Gain |
| Distribution Paid | $10,010,993 | $38,622,161 |
| Distribution Paid Per Share | $0.56814 | $2.19187 |
b) Foreign Currency – Investment securities and other assets and liabilities denominated in foreign currencies are translated into U.S. dollar amounts at the date of valuation. Purchases and sales of investment securities and income and expense items denominated in foreign currencies are translated into U.S. dollar amounts on the respective dates of such transactions. The Fund does not isolate that portion of the results of operations resulting from changes in foreign exchange rates on investments and currency gains or losses realized between the trade and settlement dates on securities transactions from the fluctuations arising from changes in market prices of securities held. Such fluctuations are included with the net realized and unrealized gain or loss from investments. Reported net realized foreign exchange
YCG Enhanced Fund
NOTES TO FINANCIAL STATEMENTS (continued)
November 30, 2021
gains or losses that arise from sales of foreign currencies, currency gains or losses realized between the trade and settlement dates on foreign currency transactions, and the difference between the amounts of dividends, interest, and foreign withholding taxes recorded on the Fund’s books and the U.S. dollar equivalent of the amounts actually received or paid. Net unrealized foreign exchange gains and losses arise from changes in the values of assets and liabilities, other than investments in securities at fiscal period end, resulting from changes in exchange rates.
c) Investment Valuation – The Fund’s investments are valued at fair value. Fair value as used for determining the Fund’s net asset value is in contrast to the use of the term “fair value” for making valuation measurements in connection with preparing the Fund’s financial statements, as discussed below under “Valuation Measurements.” FASB Accounting Standard Codification Topic 820: Fair Value Measurement uses the term “fair value” to refer generally to the value of an asset or liability, regardless of whether that value is based on readily available market quotations or on other inputs.
Securities which are traded on a national stock exchange are valued at the last sale price on the securities exchange on which such securities are primarily traded. Securities that are traded on The Nasdaq OMX Group, Inc., referred to as Nasdaq, are valued at the Nasdaq Official Closing Price. Exchange-traded securities for which there were no transactions are valued at the current bid prices. Securities traded on only over-the-counter markets are valued on the basis of closing over-the-counter bid prices. Short-term debt instruments maturing within 60 days are valued by the amortized cost method, which approximates fair value. Amortized cost is not used if its use would be inappropriate due to credit or other impairments of the issuer, in which case the security’s fair value would be determined, as described below. Debt securities (other than those valued using the amortized cost method) are valued at the market price furnished by a national pricing service, if available, and otherwise at the most recent bid quotation or evaluated price, subject to review by the Adviser and determination of the appropriate price whenever a furnished price is significantly different from the previous day’s furnished price. Options written or purchased by the Fund are valued at the last sales price. If there are no trades for an option on a given day, options are valued at the mean between the current bid and asked prices. If market quotations are not readily available for a security or if a security’s value has been materially affected by events occurring after the close of the exchange or market on which the security is principally traded, then that security may be valued by another method that the Board of Trustees believes accurately reflects fair value. A security’s valuation may differ depending on the method used for determining fair value. Fair value in this context is the value of securities for which no readily available market quotations exist, as determined in good faith by the Adviser pursuant to procedures established by and under the supervision of the Board.
YCG Enhanced Fund
NOTES TO FINANCIAL STATEMENTS (continued)
November 30, 2021
Valuation Measurements
The Fund has adopted authoritative fair valuation accounting standards which establish an authoritative definition of fair value and set out a hierarchy for measuring fair value. These standards require additional disclosures about the various inputs and valuation techniques used to develop the measurements of fair value and a discussion of changes in valuation techniques and related inputs, if any, during the period. In addition, these standards require expanded disclosure for each major category of assets. These inputs are summarized in the three broad levels listed below:
| Level 1 – | Quoted prices in active markets for identical securities. |
| | |
| Level 2 – | Other significant observable inputs (including quoted prices for similar securities, interest rates, prepayment speeds, credit risk, etc.) |
| | |
| Level 3 – | Significant unobservable inputs (including the Fund’s own assumptions in determining the fair value of investments). |
The inputs or methodology used for valuing securities are not an indication of the risk associated with investing in those securities. The following is a summary of the inputs used to value the Fund’s investments as of November 30, 2021:
| | | Level 1 | | | Level 2 | | | Level 3 | | | Total | |
Assets | | | | | | | | | | | | |
| Common Stocks* | | $ | 482,627,545 | | | $ | 12,985,379 | | | $ | — | | | $ | 495,612,924 | |
| Short-Term Investments | | | — | | | | 38,768,440 | | | | — | | | | 38,768,440 | |
| Total Investments | | | | | | | | | | | | | | | | |
| in Securities | | $ | 482,627,545 | | | $ | 51,753,819 | | | $ | — | | | $ | 534,381,364 | |
Liabilities | | | | | | | | | | | | | | | | |
| Other Financial | | | | | | | | | | | | | | | | |
| Instruments** | | | | | | | | | | | | | | | | |
| Options Written | | $ | 3,497,347 | | | $ | 1,176,358 | | | $ | — | | | $ | 4,673,705 | |
| * | | Please refer to the schedule of investments to view securities by industry type. |
| ** | | Other Financial Instruments are derivative instruments not reflected in the Schedule of Investments, such as options written, which are reflected at value. |
The Fund did not invest in any Level 3 investments during the year.
d) Option Writing – The Fund may write covered call options and put options on a substantial portion of the Fund’s long equity portfolio as a means to generate additional income and to tax-efficiently enter and exit positions. The Fund will not use this strategy as a means of generating implicit leverage. In other words, if all put options were to be exercised, the Fund will generally have enough cash on hand to purchase the assigned shares. When the Fund writes an option, an amount equal to the premium received by the Fund is recorded as a liability and is subsequently adjusted to the current fair value of the option written. Premiums received from writing options that expire unexercised are treated by the Fund on the expiration date
YCG Enhanced Fund
NOTES TO FINANCIAL STATEMENTS (continued)
November 30, 2021
as realized gains from options written. The difference between the premium and the amount paid on effecting a closing purchase transaction, including brokerage commissions, is also treated as a realized gain, or, if the premium is less than the amount paid for the closing purchase transaction, as a realized loss. If a call option is exercised, the premium is added to the proceeds from the sale of the underlying security in determining whether the Fund has realized a gain or loss. If a put option is exercised, the premium reduces the cost basis of the securities purchased by the Fund. The Fund, as a writer of an option, bears the market risk of an unfavorable change in the price of the security underlying the written option. Upon writing an option, the Fund is required to pledge an amount of cash or securities, as determined by the broker, as collateral. As of November 30, 2021, the Fund held securities with a value of $11,737,586 and cash of $14,362,957 as collateral for options written. During the period, the Fund used written covered call and put options in a manner consistent with the strategy described above.
The value of Derivative Instruments on the Statement of Assets and Liabilities as of November 30, 2021, are as follows:
| | Liability Derivatives | |
| Derivatives not | | | |
| accounted for as | | | |
| hedging instruments | Location | Value | |
| Equity Contracts – Options | Options written, at value | $4,673,705 | |
The effect of Derivative Instruments on the Statement of Operations for the period ended November 30, 2021, are as follows:
| Amount of Realized Gain on | Change in Unrealized Depreciation |
| Derivatives Recognized in Income | on Derivatives Recognized in Income |
Derivatives not | | Derivatives not | |
accounted for as | Options | accounted for as | Options |
hedging instruments | Written | hedging instruments | Written |
Equity Contracts | $10,274,833 | Equity Contracts | $2,776,940 |
The average monthly value of options written during the year ended November 30, 2021 was $2,255,675.
Derivative Risks
The risks of using the various types of derivatives in which the Fund may engage include the risk that movements in the value of the derivative may not fully offset or complement instruments currently held in the Fund in the manner intended by the Adviser, the risk that the counterparty to a derivative contract may fail to comply with its obligations to the Fund, the risk that there may not be a liquid secondary market for the derivative at a time when the Fund would look to disengage the
YCG Enhanced Fund
NOTES TO FINANCIAL STATEMENTS (continued)
November 30, 2021
position, the risk that additional capital from the Fund may be called upon to fulfill the conditions of the derivative contract, the risk that the use of derivatives may induce leverage in the Fund, and the risk that the cost of the derivative may reduce the overall returns experience by the Fund.
Offsetting Assets and Liabilities
The Fund is subject to various Master Netting Arrangements, which govern the terms of certain transactions with select counterparties. The Master Netting Arrangements allow the Fund to close out and net its total exposure to a counterparty in the event of a default with respect to all the transactions governed under a single agreement with a counterparty. The Master Netting Arrangements also specify collateral posting arrangements at pre-arranged exposure levels. Under the Master Netting Arrangements, collateral is routinely transferred if the total net exposure to certain transactions (net of existing collateral already in place) governed under the relevant Master Netting Arrangement with a counterparty in a given account exceeds a specified threshold depending on the counterparty and the type of Master Netting Arrangement.
The following is a summary of the Assets and Liabilities subject to offsetting in the Fund as of November 30, 2021:
| Liabilities | | | | Gross Amounts not | |
| | | | | offset in the Statement | |
| | | | | of Assets and Liabilities | |
| | | Gross | Net | | | |
| | | Amounts | Amounts | | | |
| | | Offset | Presented | | | |
| | Gross | in the | in the | | | |
| | Amounts | Statement | Statement | | | |
| | of | of Assets | of Assets | | | |
| Description / | Recognized | and | and | Financial | Collateral | Net |
| Counterparty | Liabilities | Liabilities | Liabilities | Instruments | Pledged | Amount |
| Options Written | | | | | | |
| Interactive Brokers | $4,673,705 | $ — | $4,673,705 | $ — | $4,673,705 | $ — |
In some instances, the collateral amounts disclosed in the tables were adjusted due to the requirement to limit the collateral amounts to avoid the effect of overcollateralization. Actual collateral received/pledged may be more than the amounts disclosed herein.
e) Federal Income Taxes – The Fund intends to qualify as a “regulated investment company” under Subchapter M of the Internal Revenue Code of 1986, as amended. If so qualified, the Fund will not be subject to federal income tax to the extent it distributes substantially all of its net investment income and capital gains to shareholders. Therefore, no federal income tax provision is required.
The Fund has adopted financial reporting rules regarding recognition and measurement of tax positions taken or expected to be taken on a tax return. The
YCG Enhanced Fund
NOTES TO FINANCIAL STATEMENTS (continued)
November 30, 2021
Fund recognizes interest and penalties, if any, related to unrecognized tax benefits as income tax expense in the Statement of Operations. During the year, the Fund did not incur any interest or penalties. As of and during the year ended November 30, 2021, the Fund did not have any liabilities for unrecognized tax benefits.
The Fund is not subject to examination by U.S. tax authorities for tax years prior to the period ended November 30, 2018.
f) Distributions to Shareholders – The Fund will declare and distribute any net investment income and any net realized long or short-term capital gains annually. Distributions to shareholders are recorded on the ex-dividend date. The character of distributions made during the year from net investment income or net realized gains may differ from the characterization for federal income tax purposes due to differences in the recognition of income, expense and gain items for financial statement and tax purposes. Where appropriate, reclassifications between capital accounts are made for such differences that are permanent in nature.
g) Use of Estimates – The preparation of the financial statements in conformity with GAAP requires management to make estimates and assumptions that affect the reported amounts of assets and liabilities and disclosure of contingent assets and liabilities at the date of the financial statements and the reported amounts of increases and decreases in net assets from operations during the reporting period. Actual results could differ from those estimates.
h) Guarantees and Indemnifications – Under the Fund’s organizational documents, its officers and trustees are indemnified by the Fund against certain liabilities arising out of the performance of their duties to the Fund. Additionally, in the normal course of business, the Fund enters into contracts with service providers that contain general indemnification clauses. The Fund’s maximum exposure under these arrangements is unknown as this would involve future claims against the Fund that have not yet occurred. Currently, the Fund expects the risk of loss to be remote.
i) Redemption Fee – Those who buy and sell the Fund within 30 calendar days will incur a 2% redemption fee, retained for the benefit of long-term shareholders, recorded as additional capital in the Statement of Changes in Net Assets.
j) Beneficial Ownership – The beneficial ownership, either directly or indirectly, of more than 25% of the voting securities of a fund creates a presumption of control of the Fund, under Section 2(a)(9) of the 1940 Act. At November 30, 2021, no shareholder held more than 25% of the outstanding shares of the YCG Enhanced Fund.
k) Other – Investment transactions and shareholder transactions are accounted for on the trade date. Net realized gains and losses on securities are computed on the basis of specific identification. Dividend income is recognized on the ex-dividend date and interest income is recognized on an accrual basis. Discounts and premiums on securities purchased are accreted and amortized over the lives of the respective securities.
YCG Enhanced Fund
NOTES TO FINANCIAL STATEMENTS (continued)
November 30, 2021
Withholding taxes on foreign dividends have been provided for in accordance with the Fund’s understanding of the applicable country’s tax rules and regulations.
| 3. | INVESTMENT TRANSACTIONS |
For the year ended November 30, 2021, the aggregate purchases and sales of securities, excluding short-term securities, were $90,611,061 and $78,928,724 respectively for the Fund. For the year ended November 30, 2021, there were no long-term purchases or sales of U.S. Government securities for the Fund.
| 4. | COMMITMENTS AND OTHER RELATED PARTY TRANSACTIONS |
The Adviser acts as the investment adviser to the Fund pursuant to an investment advisory agreement (the “Advisory Agreement”) which has been approved by the Board (including a majority of the Trustees who are not parties to the Advisory Agreement, or interested persons of any such party). Under the terms of the Advisory Agreement between the Fund and the Adviser, the Adviser conducts investment research and management for the Fund and is responsible for the purchase and sale of securities for the Fund’s investment portfolio. The Adviser provides the Fund with investment advice, supervises the management and investment programs and provides investment advisory facilities and executive and supervisory personnel for managing the investments and effectuating portfolio transactions. The Adviser also furnishes, at its own expense, all necessary administrative services, office space, equipment and clerical personnel for servicing the investments of the Fund. With the exception of the Chief Compliance Officer, who became an employee of the Advisor in March 2020, such officers receive no compensation from the Fund for serving in their respective roles. The Fund makes reimbursement payments to the Advisor for the salary and benefits associated with the office of the Chief Compliance Officer. The compliance fees expensed by the Fund during the year ended November 30, 2021, are included in the Statement of Operations. Under the Advisory Agreement, the monthly compensation paid to the Adviser is accrued daily at an annual rate of 1.00% on the average daily net assets of the Fund.
In the interest of limiting the expenses of the Fund, the Adviser has entered into a contractual expense limitation agreement with the Fund. Pursuant to the Expense Limitation Agreement, the Adviser (for the lifetime of the Fund) has agreed to waive or limit its fees and assume other expenses of the Fund (excluding interest, taxes, brokerage commissions and dividend expenses on securities sold short and extraordinary expenses not incurred in the ordinary course of business) so that the Fund’s ratio of total annual operating expenses is limited to 1.39%. In addition to the lifetime limit, the Adviser has agreed to reimburse the Fund to the extent necessary to ensure that total annual fund operating expenses to do not exceed 1.19% at least through April 1, 2023. The Adviser is entitled to the reimbursement of fees waived or reimbursed by the Adviser to the Fund subject to the limitations that (1) the
YCG Enhanced Fund
NOTES TO FINANCIAL STATEMENTS (continued)
November 30, 2021
reimbursement is made only for fees and expenses incurred not more than thirty-six months following the month in which the reimbursement occurred, and (2) the reimbursement may not be made if it would cause the Fund’s annual expense limitation to be exceeded. The reimbursement amount may not include any additional charges or fees, such as interest accruable on the reimbursement account. During the year ended November 30, 2021, the Fund reimbursed $36,712 of previously waived expenses, waived $9,067 and let $9,612 fees subject to recoupment expire. As of November 30, 2021, the following expenses are subject to recoupment by the Adviser:
| | Year Ending | Year Ending | Year Ending | |
| | November 30, 2022 | November 30, 2023 | November 30, 2024 | Total |
| YCG | $41,779 | $74,305 | $9,067 | $134,763 |
Certain officers, trustees and shareholders of the Fund are also owners or employees of the Adviser.
Vigilant Distributors, LLC, previously Herald Investment Marketing, LLC, acted as the Fund’s principal underwriter in a continuous public offering of the Fund’s shares during the period from January 4, 2021 through November 30, 2021. Prior to January 4, 2021, Quasar Distributors, LLC, (“Quasar”) acted as the Fund’s principal underwriter.
The Fund has entered into Service Agreements with U.S. Bancorp Fund Services, LLC doing business as U.S. Bank Global Fund Services (“Fund Services”), and a Custody Agreement with U.S. Bank, N.A. Under these agreements, Fund Services and U.S. Bank, N.A. provide certain transfer agency, administrative, accounting and custody services.
Non-Diversification Risk: The Fund is non-diversified. A non-diversified fund may invest more of its assets in fewer companies than if it were a diversified fund. The Fund may be more exposed to the risks of loss and volatility than a fund that invests more broadly.
COVID-19 Risk: The global outbreak of COVID-19 (commonly referred to as “coronavirus”) has disrupted economic markets and the prolonged economic impact is uncertain. The ultimate economic fallout from the pandemic, and the long-term impact on economies, markets, industries and individual issuers, are not known. The operational and financial performance of the issuers of securities in which the Fund invests depends on future developments, including the duration and spread of the outbreak, and such uncertainty may in turn adversely affect the value and liquidity of the Fund’s investments, impair the Fund’s ability to satisfy redemption requests, and negatively impact the Fund’s performance.
The above are only two of the principal risks of the Fund. The other principal risks are discussed in the Fund’s most recent Prospectus.
YCG Enhanced Fund
NOTES TO FINANCIAL STATEMENTS (continued)
November 30, 2021
| 6. | FEDERAL TAX INFORMATION |
A. Tax Basis of Distributions to Shareholders: The tax character of the distributions paid by the Fund were as follows:
| | For the Year Ended | | | For the Year Ended | |
| | | November 30, 2021 | | | November 30, 2020 | |
| Ordinary Income | | $ | — | | | $ | 978,705 | |
| Long-Term Capital Gains | | | — | | | | 873,466 | |
| Total | | $ | — | | | $ | 1,852,171 | |
Reclassifications: The tax components of distributable earnings are determined in accordance with income tax regulations which may differ from the compositions of net assets reported under GAAP. Accordingly, for the year ended November 31, 2021, certain differences were reclassified. The reclassifications were as follows:
Decrease Total Distributable Earnings
| | $ | (858,496 | ) |
Increase Capital Stock
| | $ | 858,496 | |
These differences are primarily due to the differing book and tax treatments of income related to deemed distributions for tax purposes.
B. Tax Basis of Investments
As of November 30, 2021, the components of the tax basis cost of investments and net unrealized appreciation were as follows:
| | | YCG Enhanced Fund | |
| | | | | | Written | | | Foreign | |
| | | Investments | | | Options | | | Currencies | |
| Tax cost of investments | | $ | 307,109,025 | | | $ | 4,673,705 | | | $ | 1,985,520 | |
| Gross unrealized appreciation | | | 234,816,918 | | | | (1,498,241 | ) | | | 30,174 | |
| Gross unrealized depreciation | | | (7,547,160 | ) | | | — | | | | — | |
| Net tax unrealized | | | | | | | | | | | | |
| appreciation (depreciation) | | | 227,269,758 | | | | (1,498,241 | ) | | | 30,174 | |
| Undistributed ordinary income | | | 10,010,829 | | | | — | | | | — | |
| Undistributed long-term capital gains | | | 38,622,036 | | | | — | | | | — | |
| Distributable earnings | | | 48,632,865 | | | | — | | | | — | |
| Other accumulated gains (losses) | | | (425 | ) | | | — | | | | — | |
| Total distributable earnings | | $ | 275,902,198 | | | $ | (1,498,241 | ) | | $ | 30,174 | |
The tax basis of investments for tax and financial reporting purposes differs, principally due to the deferral of losses on wash sales.
YCG Enhanced Fund
NOTES TO FINANCIAL STATEMENTS (continued)
November 30, 2021
At November 30, 2021 the Fund had the following capital loss carryforwards:
| | Short-Term | Long-Term | Expires | |
| YCG | $ — | $ — | Indefinite | |
Net capital losses incurred after October 31, and within the taxable year are deemed to arise on the first business day of the Fund’s next taxable year. Qualified late-year ordinary losses are the excess of the sum of the specified loss attributable to the portion of the taxable year after October 31, and the late-year losses attributable to the portion of the taxable year after December 31, over the sum of the specified gains attributable to the portion of the taxable year after October 31, and other ordinary income attributable to the portion of the taxable year after December 31. For the fiscal year ended November 30, 2021, there were no late year losses.
YCG Enhanced Fund
REPORT OF INDEPENDENT REGISTERED PUBLIC ACCOUNTING FIRM
To the Shareholders of YCG Enhanced Fund and
Board of Trustees of YCG Funds
Opinion on the Financial Statements
We have audited the accompanying statement of assets and liabilities, including the schedules of investments and options written, of YCG Enhanced Fund (the “Fund”), a series of YCG Funds, as of November 30, 2021, the related statement of operations for the year then ended, the statements of changes in net assets for each of the two years in the period then ended, the related notes, and the financial highlights for each of the five years in the period then ended (collectively referred to as the “financial statements”). In our opinion, the financial statements present fairly, in all material respects, the financial position of the Fund as of November 30, 2021, the results of its operations for the year then ended, the changes in net assets for each of the two years in the period then ended, and the financial highlights for each of the five years in the period then ended, in conformity with accounting principles generally accepted in the United States of America.
Basis for Opinion
These financial statements are the responsibility of the Fund’s management. Our responsibility is to express an opinion on the Fund’s financial statements based on our audits. We are a public accounting firm registered with the Public Company Accounting Oversight Board (United States) (“PCAOB”) and are required to be independent with respect to the Fund in accordance with the U.S. federal securities laws and the applicable rules and regulations of the Securities and Exchange Commission and the PCAOB.
We conducted our audits in accordance with the standards of the PCAOB. Those standards require that we plan and perform the audit to obtain reasonable assurance about whether the financial statements are free of material misstatement whether due to error or fraud.
Our audits included performing procedures to assess the risks of material misstatement of the financial statements, whether due to error or fraud, and performing procedures that respond to those risks. Such procedures included examining, on a test basis, evidence regarding the amounts and disclosures in the financial statements. Our procedures included confirmation of securities owned as of November 30, 2021, by correspondence with the custodian and brokers. Our audits also included evaluating the accounting principles used and significant estimates made by management, as well as evaluating the overall presentation of the financial statements. We believe that our audits provide a reasonable basis for our opinion.
We have served as the Fund’s auditor since 2012.
COHEN & COMPANY, LTD.
Chicago, Illinois
January 27, 2022
YCG Enhanced Fund
ADDITIONAL INFORMATION
(Unaudited)
| 1. | SHAREHOLDER NOTIFICATION OF FEDERAL TAX STATUS |
For the year ended November 30, 2021, 0% of the dividends paid from net investment income, including short-term capital gains, for the YCG Enhanced Fund qualify for the dividends received deduction available to corporate shareholders.
For the year ended November 30, 2021, 0% of the dividends paid from net investment income, including short-term capital gains, for the YCG Enhanced Fund are designated as qualified dividend income.
| 2. | COMPENSATION OF TRUSTEES |
Each Trustee who is not an “interested person” of the Trust (i.e. an “Independent Trustee”) receives an annual retainer of $4,000, paid quarterly, as well as $1,000 per meeting attended. In addition, Independent Trustees are eligible for reimbursement of out-of-pocket expenses incurred in connection with attendance at such meetings. The Fund’s Statement of Additional Information includes additional information about the Trustees and is available upon request by calling toll free 1-855-444-9243 or by accessing the Fund’s website at www.ycgfunds.com. (Note for clarification: The information on our website is not incorporated by reference into this report.)
| 3. | PROXY VOTING POLICIES AND PROCEDURES |
For a description of the policies and procedures that the Fund uses to determine how to vote proxies relating to portfolio securities, please call 1-855-444-9243 and request a Statement of Additional Information. One will be mailed to you free of charge. The Statement of Additional Information is also available on the Fund’s website at www.ycgfunds.com or on the web site of the Securities and Exchange Commission at http://www.sec.gov. Information on how the Fund voted proxies relating to portfolio securities during the most recent 12-month period ended June 30 is available without charge, upon request, by calling 1-855-444-9243 or by accessing the website of the Securities and Exchange Commission at http://www.sec.gov.
| 4. | DISCLOSURE OF PORTFOLIO HOLDINGS |
The Fund files a complete schedule of portfolio holdings with the Securities and Exchange Commission for the first and third quarters of each fiscal year as an exhibit to its reports on Form N-PORT. The Fund’s Form N-PORT reports are available on the website of the Securities and Exchange Commission at http://www.sec.gov or on request by calling 1-800-SEC-0330.
YCG Enhanced Fund
ADDITIONAL INFORMATION (continued)
(Unaudited)
| 5. | BOARD ANNUAL RENEWAL OF INVESTMENT ADVISORY AGREEMENT |
On October 28, 2021, the Board of Trustees of YCG Funds (the “Trust”) met to, among other things, approve the continuation of the investment advisory agreement for the YCG Enhanced Fund (the “Fund”). As part of the process for approving the continuation of the investment advisory agreement, the Trustees reviewed their fiduciary duties and the relevant factors for the Trustees to consider, and the Trustees who are not “interested persons” (as defined in the Investment Company Act of 1940) of the Fund (the “Independent Trustees”) met in executive session to discuss the approval of the continuation of the investment advisory agreement.
In advance of the meeting, YCG, LLC (the “Adviser”) sent detailed information to the Trustees to assist them in their evaluation of the investment advisory agreement. This information included, but was not limited to, a memorandum from counsel to the Fund and the Independent Trustees that summarized the legal standards applicable to the Trustees’ consideration of the advisory agreement; comparative information relating to the Fund’s management fees and other expenses of the Fund; information regarding fees paid and other payments; information on the Adviser’s profitability; information about brokerage commissions; comparative information relating to the Fund’s performance; information about sales and redemptions of the Fund; information about the Fund’s compliance program; and other information the Trustees believed was useful in evaluating the approval of advisory agreement. Counsel to the Fund and the Independent Trustees advised the Trustees on their fiduciary duties under the rules.
All of the factors discussed by the Trustees were considered as a whole, and were considered separately by the Independent Trustees, meeting in executive session. The factors were viewed in their totality by the Trustees, with no single factor being the principal or determinative factor in the Trustees’ determination of whether to approve the continuation of the investment advisory agreement. The Trustees recognized that the management and fee arrangements for the Fund are the result of years of review and discussion between the Independent Trustees and the Adviser, that certain aspects of such arrangements may receive greater scrutiny in some years than in others and that the Trustees’ conclusions may be based, in part, on their consideration of these same arrangements and information received during the course of the year and in prior years.
Prior to approving the continuation of the investment advisory agreement, the Trustees and the Independent Trustees in executive session considered, among other items:
| | • | The nature and quality of the investment advisory services provided by the Adviser. |
YCG Enhanced Fund
ADDITIONAL INFORMATION (continued)
(Unaudited)
| | • | A comparison of the fees and expenses of the Fund to other similar funds. |
| | | |
| | • | A comparison of the fee structures of other accounts managed by the Adviser. |
| | | |
| | • | Whether economies of scale are recognized by the Fund. |
| | | |
| | • | The costs and profitability of the Fund to the Adviser. |
| | | |
| | • | The performance of the Fund. |
| | | |
| | • | The other benefits to the Adviser from serving as investment adviser to the Fund (in addition to the advisory fee). |
The material considerations and determinations of the Board, including all of the Independent Trustees, are as follows:
Nature, Extent and Quality of Investment Advisory Services
The Trustees noted that the Adviser supervises the investment portfolio of the Fund, directing the day-to-day management of the Fund’s portfolio, including the purchase and sale of investment securities. They then discussed with management the nature of the investment process employed by the portfolio managers of the Fund, which is research intensive, and discussed staffing at the Adviser. Namely, in making its investment decisions, the Adviser uses a “bottom-up” approach focused on individual companies, which is dependent on independent, in-house, fundamental research to analyze each company considered for investment. The Trustees discussed the staff of the Adviser and the qualifications of the staff, and they concluded that the Adviser is well staffed to conduct the research needed to meet the investment objectives of the Fund.
In addition to the nature of the Adviser’s investment process, the Trustees considered the background and experience of the Adviser’s senior management and expertise of, and the amount of attention given to the Fund by investment personnel of the Adviser. In addition, the Trustees considered the quality of the material service providers to the Fund, who provide administrative and distribution services on behalf of the Fund and are overseen by the Adviser, and the overall reputation and capabilities of the Adviser. The Trustees noted that the Adviser actively oversees the service providers to the Fund to ensure that the Fund is well served. Based on this review, the Trustees believe that the Adviser provides high quality services to the Fund, as the Adviser’s personnel are focused on servicing the Fund.
In light of the Trustees’ discussions and considerations regarding the Adviser, the Trustees concluded that they were satisfied with the nature, extent and quality of the investment advisory services provided to the Fund by the Adviser, and that the nature and extent of the services provided by the Adviser are appropriate to assure that the Fund’s operations are conducted in compliance with applicable laws, rules and regulations.
YCG Enhanced Fund
ADDITIONAL INFORMATION (continued)
(Unaudited)
Comparative Fees and Expenses
The Trustees then discussed with management the variables, in addition to the management fees, such as administrative and transaction fees, which impact costs to the shareholders of the Fund. Management reviewed with the Trustees the comparison of the Fund’s expense ratios to other similar funds. As part of the discussion with management, the Trustees ensured that they understood and were comfortable with the criteria used by the Adviser to determine the mutual funds that make up the peer groups identified and discussed below.
In the materials provided to the Trustees, there was a report comparing the Fund to two peer groups. The first peer group was a comparison versus the Morningstar Large Cap Blend Category peers, and the second peer group was a comparison versus custom “stockpicking” and “option” peers. In discussing and evaluating the report, the Trustees noted the following:
| | • | While the Fund had higher than average advisory and net expenses compared to the Morningstar Large Cap Blend category peers, the Fund’s return over the last few years is in the top half of the funds in the category. The Trustees also noted that unlike most peers in the category, the Fund utilizes an option enhancement strategy. |
| | | |
| | • | The Fund’s expense ratio is very favorable compared to option peers, which is important because the Trustees believe that the Fund’s option enhancement strategy is a unique strategy that sets the Fund apart from its competitors. As noted above, other funds in the Morningstar Large Cap Blend Category generally do not utilize an option strategy. |
| | | |
| | • | The Fund outperformed peer group funds on a since inception, five-year, and three-year basis. |
| | | |
| | • | The Fund performed extremely well against many of the stockpicking and large cap blend category peer group funds. |
| | | |
| | • | The Fund is still relatively small in assets under management, and the Adviser is subsidizing the expenses of the Fund to remain competitive with other funds. |
After reviewing and discussing the comparison of the Fund’s expense ratios to other similar funds, as noted above, the Trustee’s concluded that the expense ratio of the Fund is within a reasonable range of comparable mutual funds, particularly funds that have an option strategy, and that the Fund’s fees are reasonable.
Comparison of Fee Structures of Other Accounts
The Trustees then inquired of management regarding the distinction between the services performed by the Adviser for separately managed accounts and those
YCG Enhanced Fund
ADDITIONAL INFORMATION (continued)
(Unaudited)
performed by the Adviser for the Fund. The Adviser noted that the management of the Fund involves comprehensive and substantive duties beyond those involved with separate accounts. Specifically, the Adviser noted the following:
| | • | The Adviser provides tailored investment advisory services to the Fund in order to accommodate the cash flow volatility presented by the purchases and redemptions of shareholders, as shareholders are able to redeem on a daily basis. |
| | | |
| | • | With regard to the Fund, the Adviser attempts to serve the needs of hundreds of accounts, ranging from direct accounts holding a few thousand dollars to the large omnibus accounts of intermediaries. |
| | | |
| | • | The Adviser maintains a robust shareholder communication effort for the Fund to reach shareholders through direct contact, through intermediaries, or via the financial press, and has contributed significant financial resources to marketing efforts for the Fund. |
| | | |
| | • | The Adviser focuses on marketing the Fund and has found that the most effective way is through one-on-one meetings with RIA’s, which require significant amounts of time and resources to attract investors. |
| | | |
| | • | The Adviser coordinates with the Fund’s Chief Compliance Officer and other service providers to ensure compliance with regulatory regimens imposed by Federal law and the Internal Revenue Code or the Fund (there are not similar requirements that are applicable to separate accounts). |
The Trustees concluded that the services performed by the Adviser for the Fund require a higher level of service and oversight than those performed for separate accounts. On the other hand, they noted that the Adviser has found that the client servicing of separately managed accounts can be very resource intensive. As the management of the Fund and the separately managed accounts is distinct, the Trustees concluded that the differential in advisory fees between the Fund and the separate accounts is reasonable and concluded that the fee rate charged to the Fund in comparison to those charged to the Adviser’s other clients is reasonable.
Performance
The Trustees reviewed the Adviser’s quality of investment management, management history and ability to successfully market the Fund. The Trustees noted that at each quarterly meeting, the Trustees review reports regarding the investment performance of the Fund. Based on the information provided at this meeting and the information and quarterly discussions regarding the Fund’s investment performance, the Trustees believe that the Adviser manages the Fund in a manner that is materially consistent with its stated investment objective and style.
YCG Enhanced Fund
ADDITIONAL INFORMATION (continued)
(Unaudited)
In assessing the performance of the Fund, which is positive, the Trustees noted the following:
| | • | The Fund’s return over the last three years is in the top half of the funds in the Morningstar Large Cap Blend category. |
| | | |
| | • | The Fund outperformed peer group funds on a since inception, five-year and three-year basis. |
| | | |
| | • | The Fund performed extremely well against many of the stockpicking and large cap blend category peer group funds. |
The Trustees concluded that the performance of the Fund, particularly adjusting for risk, has been satisfactory on a relative basis and more than satisfactory on an absolute basis. They continue to believe that the Adviser’s discipline should lead to more favorable results in the long-term and concluded that renewal of the existing advisory agreement was in the best interest of the Fund’s shareholders.
Costs and Profitability
The Trustees considered the cost of services provided and the profits realized by the Adviser. They also considered the Fund’s overall expense ratios compared to peer group funds. The Trustees concluded that given the size of the Fund and the niche strategy of the Fund, that the Fund’s fee structure is appropriate and reasonable.
The Trustees discussed in detail the profitability this year of the Adviser as it relates to the Fund, and they discussed the impact of the intermediary service fees on the profitability. The Trustees also considered the resources and revenues that the Adviser has put into managing and distributing the Fund and concluded that the level of profitability realized by the Adviser from its provision of services to the Fund is reasonable, and that the overall expense ratios and investment advisory fees were fair and within a reasonable range of industry averages.
Economies of Scale
The Trustees discussed with management whether economies of scale are recognized by the Fund. They noted that as Fund assets grow, certain fixed costs are spread over the larger asset base, which may lead to some economies of scale. On the other hand, the Trustees noted that many of the Fund’s expenses are subject to diseconomies of scale. For example, the intermediary service fees increase as the Fund’s assets grow.
Given the size of the Fund, the Trustees determined that the Fund has not realized economies of scale. They noted that the expenses for the Fund are currently capped and any excess is paid by the Adviser, which benefits shareholders. The Trustees concluded that the current fees were appropriate at foreseeable asset levels.
YCG Enhanced Fund
ADDITIONAL INFORMATION (continued)
(Unaudited)
Fall-Out Benefits
The Trustees then considered other benefits to the Adviser from serving as Adviser to the Fund (in addition to the advisory fee). The Trustees noted that the Adviser does not derive ancillary benefits from its association with the Fund in the form of proprietary and third-party research products and services, as the Adviser does not receive any research or other services from the broker-dealers that the Fund trades with. They also briefly discussed soft dollars and the fact that the Fund does not utilize them.
It was noted that managing the Fund has provided more visibility for the Adviser in the financial media and industry in general, as the Fund has been highlighted in publications, including national publications. However, the primary focus of these articles has been the Fund.
Based on the Trustees’ discussion and analysis, the Trustees concluded that the other benefits realized by the Adviser from its relationship with the Fund were reasonable.
Conclusion
After reviewing the materials provided at the meeting, management’s presentation, as well as other information regularly provided at the Board’s quarterly meetings throughout the year regarding the quality of services provided by the Adviser, the performance of the Fund, expense information, regulatory compliance issues, trading information and related matters and other factors deemed relevant by the Board, the Trustees, including all of the Independent Trustees, approved the continuation of the investment advisory agreement.
YCG Enhanced Fund
TRUSTEES AND OFFICERS
(Unaudited)
The business of the Fund is managed under the direction of the Board. The Board formulates the general policies of the Fund and meets periodically to review the Fund’s performance, monitor investment activities and practices, and discuss other matters affecting the Fund. The Trustees are fiduciaries for the Fund’s shareholders and are governed by the laws of the State of Delaware in this regard. The names and addresses of the Trustees and Officers of the Trust are listed below along with a description of their principal occupations over at least the last five years. Trustees who are “interested persons”, as defined by the 1940 Act, are indicated by asterisk. The Fund’s Statement of Additional Information includes additional information about the Trustees and is available, without charge, upon request by (1) calling toll free 1-855-444-9243; (2) on the Fund’s website located at http://www.ycgfunds.com; or (3) on the SEC’s website http://www.sec.gov.
| | | Term of | | | |
| | | Office | Number of | | |
| | | and | Portfolios | Principal | Other |
| | Position(s) | Length | in Fund | Occupation(s) | Directorships |
| Name, address | Held with | of Time | Complex | During Past | Held by |
| and age | the Fund | Served | Overseen | Five Years | Trustee |
Brian Yacktman* | Trustee | Indefinite, | 1 | Manager, Founding | None. |
3207 Ranch Road | | Trustee | | Partner and Chief | |
620 South, Suite 200 | | since 2012 | | Investment Officer, | |
Austin, TX 78738 | President | One year | | YCG, LLC, | |
Age: 42 | | term, | | investment adviser | |
| | | President | | to the Fund, | |
| | | since 2012 | | since 2007. | |
| | | | | | |
William D. Kruger* | Chairman | Indefinite, | 1 | Manager, Partner | None. |
3207 Ranch Road | and | Trustee | | and CEO, YCG, | |
620 South, Suite 200 | Trustee | since 2012 | | LLC, investment | |
Austin, TX 78738 | Vice | One year | | adviser to the Fund, | |
Age: 42 | President | term, Vice | | since 2008. | |
| | and | President | | | |
| | | since 2012 | | | |
| | Treasurer | One year | | | |
| | | term, | | | |
| | | Treasurer | | | |
| | | since 2012 | | | |
YCG Enhanced Fund
TRUSTEES AND OFFICERS (continued)
(Unaudited)
| | | Term of | | | |
| | | Office | Number of | | |
| | | and | Portfolios | Principal | Other |
| | Position(s) | Length | in Fund | Occupation(s) | Directorships |
| Name, address | Held with | of Time | Complex | During Past | Held by |
| and age | the Fund | Served | Overseen | Five Years | Trustee |
| Independent Trustees: | | | | | |
| | | | | | |
Travis E. Oliphant | Trustee | Indefinite, | 1 | Scientific and | None. |
3207 Ranch Road | | Trustee | | Technical Software | |
620 South, Suite 200 | | since 2012 | | Manager and | |
Austin, TX 78738 | | | | Executive. | |
Age: 50 | | | | Founder and CEO | |
| | | | | of Anaconda | |
| | | | | (Continuum Analytics), | |
| | | | | January 2012 – 2017. | |
| | | | | Founder and CEO | |
| | | | | of Quansight, | |
| | | | | 2018 – Present. | |
| | | | | | |
Rory M. McDonald | Trustee | Indefinite, | 1 | Associate Professor | None. |
3207 Ranch Road | | Trustee | | of Business | |
620 South, Suite 200 | | since 2012 | | Administration in | |
Austin, TX 78738 | | | | the Technology | |
Age: 42 | | | | and Operations | |
| | | | | Management Unit | |
| | | | | at Harvard Business | |
| | | | | School, 2013 – Present. | |
| | | | | | |
Cyril James Speirs | Trustee | Indefinite, | 1 | Retired, Previously, | None. |
3207 Ranch Road | | Trustee | | Global Vice President | |
620 South, Suite 200 | | since 2017 | | Procurement for Whole | |
Austin, TX 78738 | | | | Foods Market, Inc., | |
Age: 66 | | | | 2005 – 2016. | |
YCG Enhanced Fund
TRUSTEES AND OFFICERS (continued)
(Unaudited)
| | | Term of | | | |
| | | Office | Number of | | |
| | | and | Portfolios | Principal | Other |
| | Position(s) | Length | in Fund | Occupation(s) | Directorships |
| Name, address | Held with | of Time | Complex | During Past | Held by |
| and age | the Fund | Served | Overseen | Five Years | Trustee |
| Officers who are not Trustees: | | | | | |
| | | | | | |
Elliott Savage | Vice | One year | N/A | Manager, | None. |
3207 Ranch Road | President | term, Vice | | Partner and | |
620 South, Suite 200 | | President | | Portfolio manager, | |
Austin, TX 78738 | | since | | YCG, LLC, | |
Age: 41 | | December | | investment adviser | |
| | | 2012 | | to the Fund, | |
| | Secretary | One year | | since 2012. | |
| | | term, | | | |
| | | Secretary | | | |
| | | since | | | |
| | | February | | | |
| | | 2016 | | | |
| | Assistant | One year | | | |
| | Treasurer | term, | | | |
| | | Assistant | | | |
| | | Treasurer | | | |
| | | since | | | |
| | | December | | | |
| | | 2012 | | | |
| | | | | | |
Lelia Long | Chief | One year | N/A | Chief Compliance | None. |
3207 Ranch Road | Compliance | term, Chief | | Officer, YCG, LLC | |
620 South, Suite 200 | Officer | Compliance | | 2016 – Present, | |
Austin, TX 78738 | | Officer | | Investment | |
Age: 59 | | since | | Management & | |
| | | March 2016 | | Compliance | |
| | |
| | Consultant, Vigilant | |
| | |
| | Compliance LLC, | |
| | |
| | 2009 – 2020. | |
| | |
| | Treasurer, New | |
| | |
| | Ireland Fund, Inc., | |
| | |
| | 2002 – 2020. | |
| * | Brian Yacktman and William Kruger are considered to be “interested persons” of the Trust, a term that is defined in the 1940 Act. Mr. Yacktman and Mr. Kruger are interested persons because: (1) each is an officer of the Trust; and (2) each is the owner of the investment adviser to the Fund. |
Each trustee holds office for an indefinite term and until the earlier of: the Trust’s next meeting of shareholders and the election and qualification of his successor; or until the date a trustee dies, resigns or is removed in accordance with the Trust’s Declaration of Trust and By-laws. Each officer holds office at the pleasure of the Board and serves for a period of one year, or until his successor is duly elected and qualified.
Privacy Notice
| FACTS | WHAT DOES YCG FUNDS DO WITH YOUR PERSONAL INFORMATION? |
| | |
| WHY? | Financial companies choose how they share your personal information. Federal law gives consumers the right to limit some, but not all information sharing. Federal law also requires us to tell you how we collect, share, and protect your personal information. Please read this Notice carefully to understand what we do. |
| | |
| WHAT? | The types of information we collect and share depend on the product or service you have with us. This information can include: |
| | • Social Security Number |
| | • Assets |
| | • Retirement Assets |
| | • Transaction History |
| | • Checking Account History |
| | • Purchase History |
| | • Account Balances |
| | • Account Transactions |
| | • Wire Transfer Instructions |
| | When you are no longer our customer, we continue to share your information as described in this Notice. |
| | |
| HOW? | All financial companies need to share your personal information to run their everyday business. In the section below, we list the reasons financial companies can share their customers’ personal information; the reasons YCG Funds chooses to share; and whether you can limit this sharing. |
| | Does YCG Funds | Can you limit |
| Reasons we can share your personal information. | Trust share? | this sharing? |
| For our everyday business purposes— | | |
| Such as to process your transactions, maintain | | |
| your account(s), respond to court orders and | Yes | No |
| legal investigations, or report to credit bureaus. | | |
| For our marketing purposes— | | |
| to offer our products and services to you. | No | We don’t share |
| For joint marketing with other financial | | |
| companies | No | We don’t share |
| For our affiliates’ everyday business purposes— | | |
| information about your transactions and experiences. | Yes | No |
| For our affiliates’ everyday business purposes— | | |
| information about your creditworthiness | No | We don’t share |
| For non-affiliates to market to you | No | We don’t share |
| Questions? | Call 855-444-YCGF (9243) |
Privacy Notice (continued)
| Who we are | |
| Who is providing | YCG Funds |
| this Notice? | YCG, LLC (investment adviser to the Trust) |
| | US Bancorp Fund Services, LLC (administrator to the Trust) |
| | |
| What we do | |
| How does | To protect your personal information from unauthorized |
| YCG Funds | access and use, we use security measures that comply |
| protect | with federal law. These measures include computer safeguards |
| your personal | and secured files and buildings. |
| information? | |
| Our service providers are held accountable for adhering to strict
|
| | policies and procedures to prevent any misuse or your nonpublic |
| | personal information. |
| How does | We collect your personal information, for example, when you |
| YCG Funds | • Open an account |
| collect your | • Provide account information |
| personal | • Give us your contact information |
| information? | • Make deposits or withdrawals from your account |
| | • Make a wire transfer |
| | • Tell us where to send the money |
| | • Tell us who receives the money |
| | • Show your government-issued ID |
| | • Show your drivers’ license |
| | We also collect your personal information from other companies. |
| Why can’t I | Federal law gives you the right to limit only: |
| limit all sharing? | • Sharing for affiliates’ everyday business purposes—information about your creditworthiness. |
| | • Affiliates from using your information to market to you. |
| | • Sharing for non-affiliates to market to you. |
| | State laws and individual companies may give you additional rights to |
| | limit sharing. |
| Definitions | |
| Affiliates | Companies related by common ownership or control. They can be
|
| | financial and non-financial companies. |
| | |
| YCG, LLC, is an affiliate of YCG Funds |
| Non-affiliates | Companies not related by common ownership or control. They can be
|
| | financial and non-financial companies. |
| | |
| | • YCG Funds does not share with non-affiliates so they can market to
|
| | you. |
| Joint marketing | A formal agreement between non-affiliated financial companies that
|
| | together market financial products to you. |
| | |
| | • YCG Funds does not jointly market. |
For Fund information and shareholder services, call
1-855-444-9243
web site: www.ycgfunds.com
YCG Funds
c/o U.S. Bancorp Fund Services, LLC
P.O. Box 701
Milwaukee, WI 53201-0701
Investment Adviser
YCG, LLC
3207 Ranch Road 620 South, Suite 200
Austin, TX 78738
Legal Counsel
Foley & Lardner LLP
777 East Wisconsin Avenue
Milwaukee, WI 53202
Independent Registered Public Accounting Firm
Cohen & Company, Ltd.
151 North Franklin Street, Suite 575
Chicago, IL 60606
Transfer Agent, Fund Accountant, and Fund Administrator
U.S. Bancorp Fund Services, LLC
615 East Michigan Street
Milwaukee, WI 53202
Custodian
U.S. Bank, N.A.
1555 North RiverCenter Drive, Suite 302
Milwaukee, WI 53212
Distributor
Vigilant Distributors, LLC
Gateway Corporate Center, Suite 216
223 Wilmington West Chester Pike
Chadds Ford, PA 19317
This report is submitted for the general information of shareholders of the YCG Enhanced Fund. It is not authorized for distribution to prospective investors unless accompanied or preceded by an effective Prospectus for the Fund, which contains more information concerning the Fund’s investment policies, as well as fees and expenses and other pertinent information. Read the Prospectus carefully.
Item 2. Code of Ethics.
The registrant has adopted a code of ethics that applies to the registrant’s principal executive officer and principal financial officer. The registrant has not made any substantive amendments to its code of ethics during the period covered by this report. The registrant has not granted any waivers from any provisions of the code of ethics during the period covered by this report.
A copy of the registrant’s Code of Ethics is filed herewith.
Item 3. Audit Committee Financial Expert.
The registrant’s board of trustees has determined that there is at least one audit committee financial expert serving on its audit committee. Travis E. Oliphant is the “audit committee financial expert” and is considered to be “independent” as each term is defined in Item 3 of Form N CSR.
Item 4. Principal Accountant Fees and Services.
The registrant has engaged its principal accountant to perform audit services, audit-related services, tax services and other services during the past two fiscal years. “Audit services” refer to performing an audit of the registrant's annual financial statements or services that are normally provided by the accountant in connection with statutory and regulatory filings or engagements for those fiscal years. “Audit-related services” refer to the assurance and related services by the principal accountant that are reasonably related to the performance of the audit. “Tax services” refer to professional services rendered by the principal accountant for tax compliance, tax advice, and tax planning. There were no “Other services” provided by the principal accountant. The following table details the aggregate fees billed or expected to be billed for each of the last two fiscal years for audit fees, audit-related fees, tax fees and other fees by the principal accountant.
| | FYE 11/30/2021 | FYE 11/30/2020 |
Audit Fees | $14,000 | $13,500 |
Audit-Related Fees | $0 | $0 |
Tax Fees | $3,000 | $3,000 |
All Other Fees | $0 | $0 |
The audit committee has adopted pre-approval policies and procedures that require the audit committee to pre‑approve all audit and non‑audit services of the registrant, including services provided to any entity affiliated with the registrant.
The percentage of fees billed by Cohen & Company, Ltd. applicable to non-audit services pursuant to waiver of pre-approval requirement were as follows:
| | FYE 11/30/2021 | FYE 11/30/2020 |
Audit-Related Fees | 0% | 0% |
Tax Fees | 0% | 0% |
All Other Fees | 0% | 0% |
All of the principal accountant’s hours spent on auditing the registrant’s financial statements were attributed to work performed by full‑time permanent employees of the principal accountant. (If more than 50 percent of the accountant’s hours were spent to audit the registrant's financial statements for the most recent fiscal year, state how many hours were attributed to work performed by persons other than the principal accountant's full-time, permanent employees.)
The following table indicates the non-audit fees billed or expected to be billed by the registrant’s accountant for services to the registrant and to the registrant’s investment adviser (and any other controlling entity, etc.—not sub-adviser) for the last two years. The audit committee of the board of trustees/directors has considered whether the provision of non-audit services that were rendered to the registrant's investment adviser is compatible with maintaining the principal accountant's independence and has concluded that the provision of such non-audit services by the accountant has not compromised the accountant’s independence.
Non-Audit Related Fees | FYE 11/30/2020 | FYE 11/30/2019 |
Registrant | $0 | $0 |
Registrant’s Investment Adviser | $0 | $0 |
Item 5. Audit Committee of Listed Registrants.
Not applicable to registrants who are not listed issuers (as defined in Rule 10A-3 under the Securities Exchange Act of 1934).
Item 6. Investments.
Schedule of Investments is included as part of the report to shareholders filed under Item 1 of this Form.
Item 7. Disclosure of Proxy Voting Policies and Procedures for Closed-End Management Investment Companies.
Not applicable to open-end investment companies.
Item 8. Portfolio Managers of Closed-End Management Investment Companies.
Not applicable to open-end investment companies.
Item 9. Purchases of Equity Securities by Closed‑End Management Investment Company and Affiliated Purchasers.
Not applicable to open-end investment companies.
Item 10. Submission of Matters to a Vote of Security Holders.
Not Applicable.
Item 11. Controls and Procedures.
(a) | The Registrant’s President/Principal Executive Officer and Treasurer/Principal Financial Officer have reviewed the Registrant's disclosure controls and procedures (as defined in Rule 30a-3(c) under the Investment Company Act of 1940 (the “Act”)) as of a date within 90 days of the filing of this report, as required by Rule 30a-3(b) under the Act and Rules 13a-15(b) or 15d‑15(b) under the Securities Exchange Act of 1934. Based on their review, such officers have concluded that the disclosure controls and procedures are effective in ensuring that information required to be disclosed in this report is appropriately recorded, processed, summarized and reported and made known to them by others within the Registrant and by the Registrant’s service provider. |
(b) | There were no changes in the Registrant's internal control over financial reporting (as defined in Rule 30a-3(d) under the Act) that occurred during the second fiscal quarter of the period covered by this report that have materially affected, or are reasonably likely to materially affect, the Registrant's internal control over financial reporting. |
Item 12. Disclosure of Securities Lending Activities for Closed-End Management Investment Companies
Not applicable to open-end investment companies.
Item 13. Exhibits.
(3) Any written solicitation to purchase securities under Rule 23c‑1 under the Act sent or given during the period covered by the report by or on behalf of the registrant to 10 or more persons. Not applicable to open-end investment companies.
(4) Change in the registrant’s independent public accountant. There was no change in the registrant’s independent public accounting for the period covered by this report.
| (1) | Change in the registrant’s independent public accountant. There was no change in the registrant’s independent public accountant for the period covered by this report. |
SIGNATURES
Pursuant to the requirements of the Securities Exchange Act of 1934 and the Investment Company Act of 1940, the registrant has duly caused this report to be signed on its behalf by the undersigned, thereunto duly authorized.
(Registrant) YCG Funds
By (Signature and Title)* /s/ Brian A. Yacktman
Brian A. Yacktman, President (Principal Executive Officer)
Date January 27, 2022
Pursuant to the requirements of the Securities Exchange Act of 1934 and the Investment Company Act of 1940, this report has been signed below by the following persons on behalf of the registrant and in the capacities and on the dates indicated.
By (Signature and Title)* /s/ Brian A. Yacktman
Brian A. Yacktman, President (Principal Executive Officer)
Date January 27, 2022
By (Signature and Title)* /s/ William D. Kruger
William D. Kruger, Treasurer (Principal Financial Officer)
Date January 27, 2022
* Print the name and title of each signing officer under his or her signature.