4th Quarter 2015 Earnings Report February 18, 2016

This presentation should be reviewed in conjunction with CVR Refining, LP’s Fourth Quarter earnings conference call held on February 18, 2016. The following information contains forward-looking statements based on management’s current expectations and beliefs, as well as a number of assumptions concerning future events. These statements are subject to risks, uncertainties, assumptions and other important factors. You are cautioned not to put undue reliance on such forward-looking statements (including forecasts and projections regarding our future performance) because actual results may vary materially from those expressed or implied as a result of various factors, including, but not limited to those set forth under “Risk Factors” in CVR Refining, LP’s Annual Report on Form 10-K, Quarterly Reports on Form 10-Q and any other filings CVR Refining, LP makes with the Securities and Exchange Commission. CVR Refining, LP assumes no obligation to, and expressly disclaims any obligation to, update or revise any forward-looking statements, whether as a result of new information, future events or otherwise, except to the extent required by law. Forward Looking Statements 2
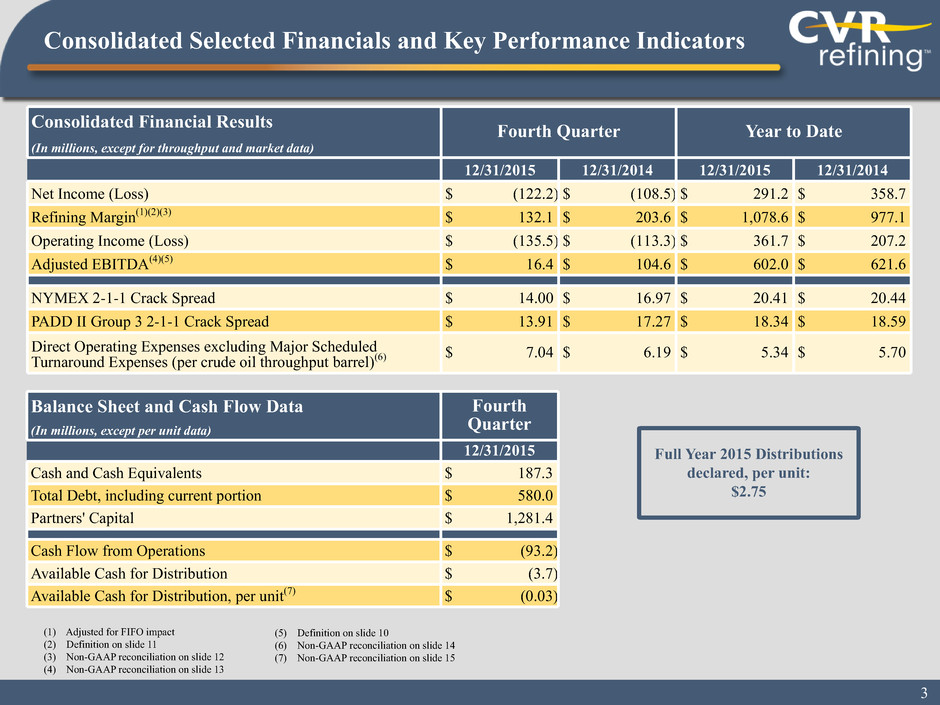
Consolidated Financial Results Fourth Quarter Year to Date (In millions, except for throughput and market data) 12/31/2015 12/31/2014 12/31/2015 12/31/2014 Net Income (Loss) $ (122.2) $ (108.5) $ 291.2 $ 358.7 Refining Margin(1)(2)(3) $ 132.1 $ 203.6 $ 1,078.6 $ 977.1 Operating Income (Loss) $ (135.5) $ (113.3) $ 361.7 $ 207.2 Adjusted EBITDA(4)(5) $ 16.4 $ 104.6 $ 602.0 $ 621.6 NYMEX 2-1-1 Crack Spread $ 14.00 $ 16.97 $ 20.41 $ 20.44 PADD II Group 3 2-1-1 Crack Spread $ 13.91 $ 17.27 $ 18.34 $ 18.59 Direct Operating Expenses excluding Major Scheduled Turnaround Expenses (per crude oil throughput barrel)(6) $ 7.04 $ 6.19 $ 5.34 $ 5.70 Consolidated Selected Financials and Key Performance Indicators Balance Sheet and Cash Flow Data Fourth Quarter(In millions, except per unit data) 12/31/2015 Cash and Cash Equivalents $ 187.3 Total Debt, including current portion $ 580.0 Partners' Capital $ 1,281.4 Cash Flow from Operations $ (93.2) Available Cash for Distribution $ (3.7) Available Cash for Distribution, per unit(7) $ (0.03) (1) Adjusted for FIFO impact (2) Definition on slide 11 (3) Non-GAAP reconciliation on slide 12 (4) Non-GAAP reconciliation on slide 13 3 (5) Definition on slide 10 (6) Non-GAAP reconciliation on slide 14 (7) Non-GAAP reconciliation on slide 15 Full Year 2015 Distributions declared, per unit: $2.75
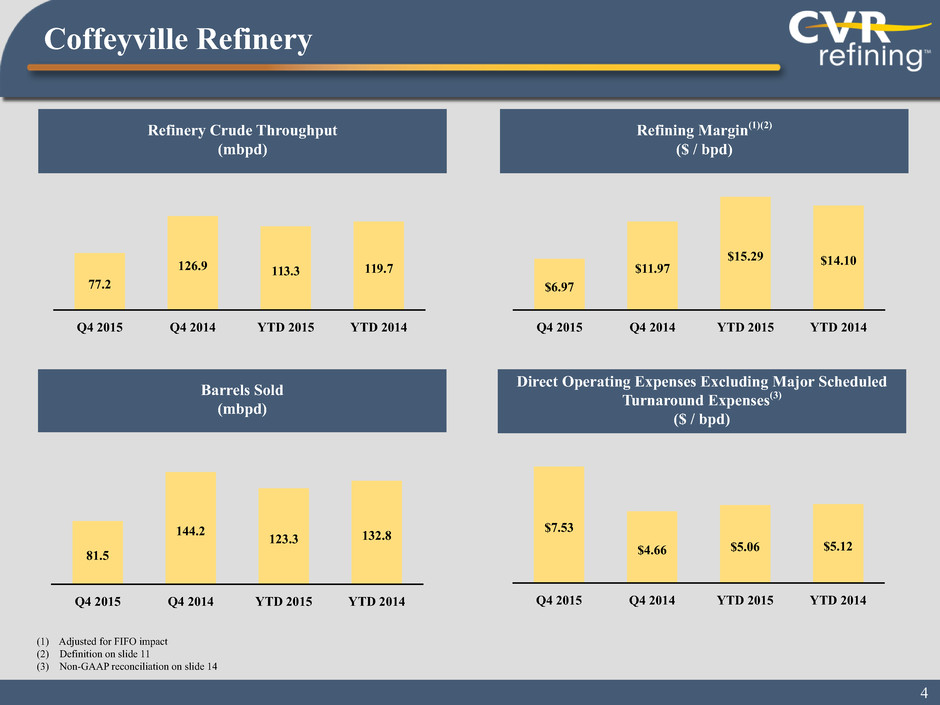
Q4 2015 Q4 2014 YTD 2015 YTD 2014 77.2 126.9 113.3 119.7 Q4 2015 Q4 2014 YTD 2015 YTD 2014 81.5 144.2 123.3 132.8 (1) Adjusted for FIFO impact (2) Definition on slide 11 (3) Non-GAAP reconciliation on slide 14 Q4 2015 Q4 2014 YTD 2015 YTD 2014 $6.97 $11.97 $15.29 $14.10 Q4 2015 Q4 2014 YTD 2015 YTD 2014 $7.53 $4.66 $5.06 $5.12 Coffeyville Refinery 4 Refinery Crude Throughput (mbpd) Direct Operating Expenses Excluding Major Scheduled Turnaround Expenses(3) ($ / bpd) Refining Margin(1)(2) ($ / bpd) Barrels Sold (mbpd)

Q4 2015 Q4 2014 YTD 2015 YTD 2014 82.9 69.3 79.8 76.8 Q4 2015 Q4 2014 YTD 2015 YTD 2014 84.7 69.1 81.4 76.9 Refinery Crude Throughput (mbpd) (1) Adjusted for FIFO impact (2) Definition on slide 11 (3) Non-GAAP reconciliation on slide 14 Q4 2015 Q4 2014 YTD 2015 YTD 2014 $10.74 $9.92 $15.21 $12.74 Refining Margin(1)(2) ($ / bpd) Q4 2015 Q4 2014 YTD 2015 YTD 2014 $6.44 $8.96 $5.71 $6.61 Wynnewood Refinery 5 Direct Operating Expenses Excluding Major Scheduled Turnaround Expenses(3) ($ / bpd) Barrels Sold (mbpd)

$700 $600 $500 $400 $300 $200 $100 2012 2013 2014 2015 $620.1 $302.9 $211.2 $392.7 Note: Refer to slide 16 for metrics used in calculations Debt Metrics 6 Financial Metrics 2012 2013 2014 2015 w Debt to Capital 44% 28% 29% 31% w Debt to Adj. EBITDA 0.7 0.8 0.9 1.0 Net Debt ($ in millions)
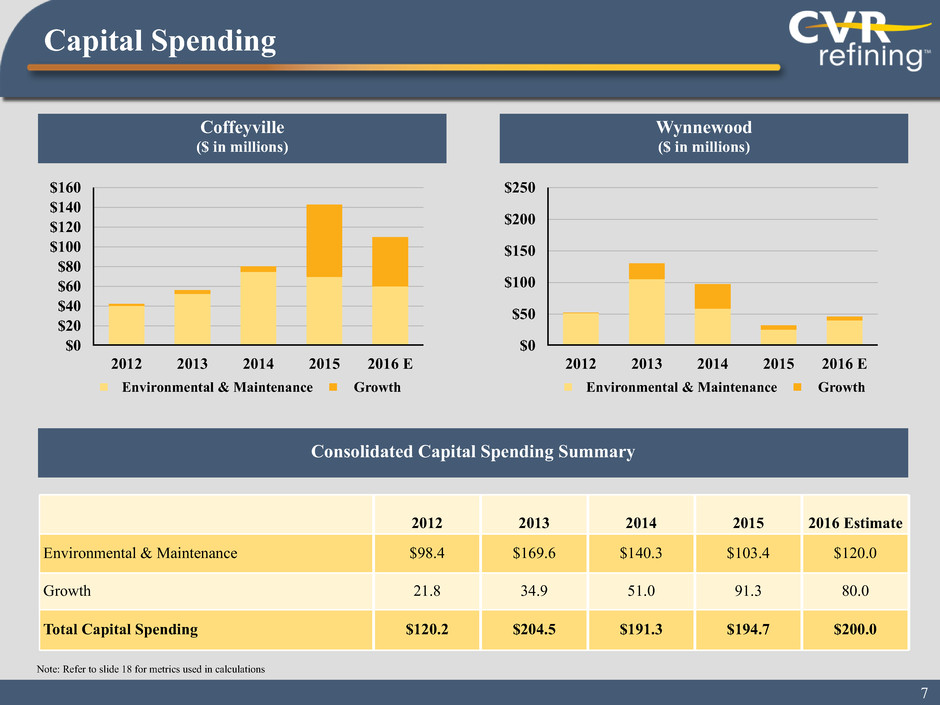
Coffeyville ($ in millions) Note: Refer to slide 18 for metrics used in calculations Wynnewood ($ in millions) Capital Spending 7 n Environmental & Maintenance n Growth $250 $200 $150 $100 $50 $0 2012 2013 2014 2015 2016 E $160 $140 $120 $100 $80 $60 $40 $20 $0 2012 2013 2014 2015 2016 E Consolidated Capital Spending Summary 2012 2013 2014 2015 2016 Estimate Environmental & Maintenance $98.4 $169.6 $140.3 $103.4 $120.0 Growth 21.8 34.9 51.0 91.3 80.0 Total Capital Spending $120.2 $204.5 $191.3 $194.7 $200.0 n Environmental & Maintenance n Growth

Distillate Note: Refer to slide 19 for metrics used in calculations (1) As of December 31, 2015 Hedging Position(1) 8 Hedged crack spread ($/bbl) Hedged bbls (millions) $40 $30 $20 $10 $0 Q1 '16 Q2 '16 Q3 '16 Q4 '16 0.6 0.6 0.6 0.6
Appendix
Non-GAAP Financial Measures 10 To supplement the actual results in accordance with GAAP for the applicable periods, the Partnership also uses non-GAAP financial measures as discussed below, which are reconciled to GAAP-based results. These non-GAAP financial measures should not be considered an alternative for GAAP results. The adjustments are provided to enhance an overall understanding of the Partnership’s financial performance for the applicable periods and are indicators management believes are relevant and useful for planning and forecasting future periods. EBITDA and Adjusted EBITDA. EBITDA represents net income (loss) before (i) interest expense and other financing costs, net of interest income, (ii) income tax expense and (iii) depreciation and amortization. Adjusted EBITDA represents EBITDA adjusted for FIFO impact (favorable) unfavorable; share-based compensation, non-cash; major scheduled turnaround expenses; loss on extinguishment of debt; (gain) loss on derivatives, net; current period settlements on derivative contracts; expenses associated with the acquisition of Gary-Williams and flood insurance recovery. We present Adjusted EBITDA because it is the starting point for our calculation of available cash for distribution. EBITDA and Adjusted EBITDA are not recognized terms under GAAP and should not be substituted for net income (loss) or cash flow from operations. Management believes that EBITDA and Adjusted EBITDA enable investors to better understand our ability to make distributions to our common unitholders, help investors evaluate our ongoing operating results and allow for greater transparency in reviewing our overall financial, operational and economic performance. EBITDA and Adjusted EBITDA presented by other companies may not be comparable to our presentation, since each company may define these terms differently. Available cash for distribution is not a recognized term under GAAP. Available cash should not be considered in isolation or as an alternative to net income (loss) or operating income (loss) as a measure of operating performance. In addition, available cash for distribution is not presented as, and should not be considered, an alternative to cash flows from operations or as a measure of liquidity. Available cash as reported by the Partnership may not be comparable to similarly titled measures of other entities, thereby limiting its usefulness as a comparative measure.
Non-GAAP Financial Measures (cont'd) 11 Refining margin per crude oil throughput barrel is a measurement calculated as the difference between net sales and cost of product sold (exclusive of depreciation and amortization). Refining margin is a non-GAAP measure that we believe is important to investors in evaluating our refineries' performance as a general indication of the amount above our cost of product sold at which we are able to sell refined products. Each of the components used in this calculation (net sales and cost of product sold exclusive of depreciation and amortization) can be taken directly from our Statements of Operations. Our calculation of refining margin may differ from similar calculations of other companies in our industry, thereby limiting its usefulness as a comparative measure. In order to derive the refining margin per crude oil throughput barrel, we utilize the total dollar figures for refining margin as derived above and divide by the applicable number of crude oil throughput barrels for the period. We believe that refining margin is important to enable investors to better understand and evaluate our ongoing operating results and allow for greater transparency in the review of our overall financial, operational and economic performance. Refining margin per crude oil throughput barrel adjusted for FIFO impact is a measurement calculated as the difference between net sales and cost of product sold (exclusive of depreciation and amortization) adjusted for FIFO impact. Refining margin adjusted for FIFO impact is a non-GAAP measure that we believe is important to investors in evaluating our refineries' performance as a general indication of the amount above our cost of product sold (taking into account the impact of our utilization of FIFO) at which we are able to sell refined products. Our calculation of refining margin adjusted for FIFO impact may differ from calculations of other companies in our industry, thereby limiting its usefulness as a comparative measure. Under our FIFO accounting method, changes in crude oil prices can cause fluctuations in the inventory valuation of our crude oil, work in process and finished goods, thereby resulting in a favorable FIFO impact when crude oil prices increase and an unfavorable FIFO impact when crude oil prices decrease.
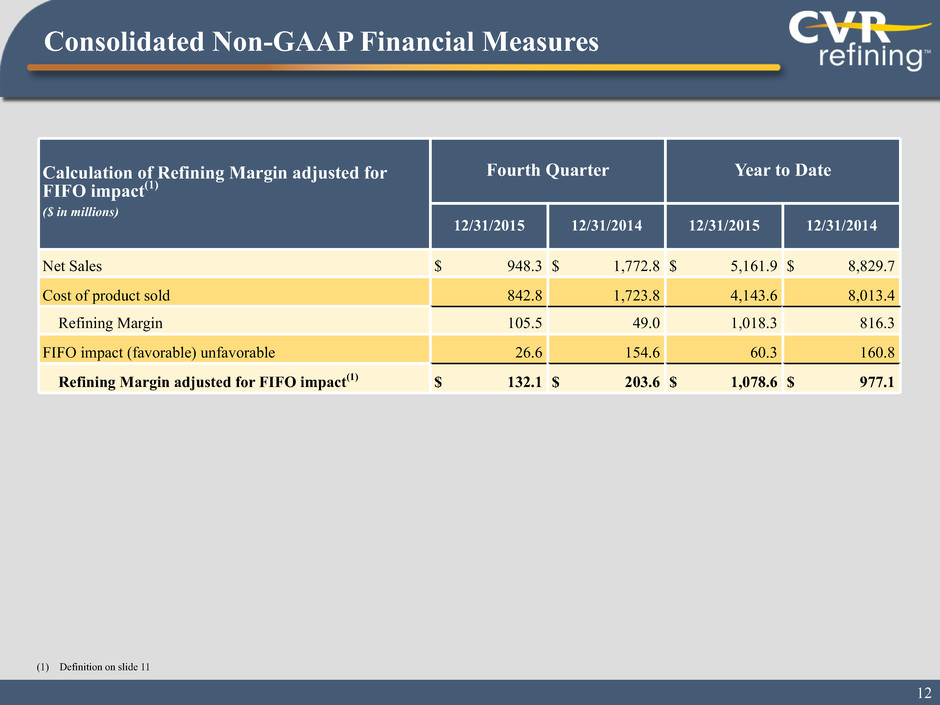
Calculation of Refining Margin adjusted for FIFO impact(1) Fourth Quarter Year to Date ($ in millions) 12/31/2015 12/31/2014 12/31/2015 12/31/2014 Net Sales $ 948.3 $ 1,772.8 $ 5,161.9 $ 8,829.7 Cost of product sold 842.8 1,723.8 4,143.6 8,013.4 Refining Margin 105.5 49.0 1,018.3 816.3 FIFO impact (favorable) unfavorable 26.6 154.6 60.3 160.8 Refining Margin adjusted for FIFO impact(1) $ 132.1 $ 203.6 $ 1,078.6 $ 977.1 Consolidated Non-GAAP Financial Measures (1) Definition on slide 11 12
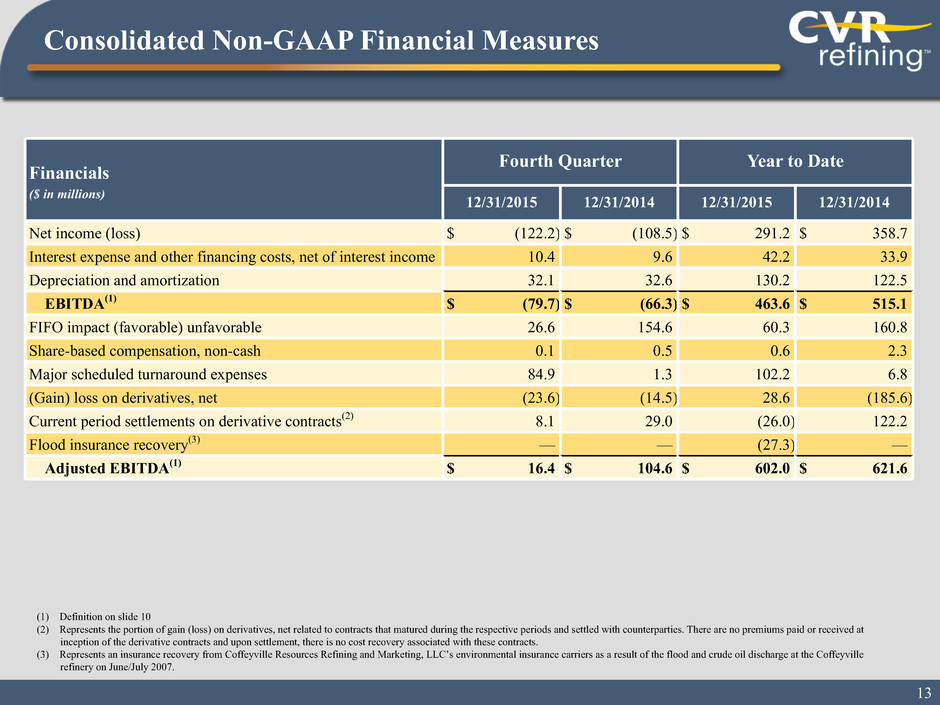
Financials Fourth Quarter Year to Date ($ in millions) 12/31/2015 12/31/2014 12/31/2015 12/31/2014 Net income (loss) $ (122.2) $ (108.5) $ 291.2 $ 358.7 Interest expense and other financing costs, net of interest income 10.4 9.6 42.2 33.9 Depreciation and amortization 32.1 32.6 130.2 122.5 EBITDA(1) $ (79.7) $ (66.3) $ 463.6 $ 515.1 FIFO impact (favorable) unfavorable 26.6 154.6 60.3 160.8 Share-based compensation, non-cash 0.1 0.5 0.6 2.3 Major scheduled turnaround expenses 84.9 1.3 102.2 6.8 (Gain) loss on derivatives, net (23.6) (14.5) 28.6 (185.6) Current period settlements on derivative contracts(2) 8.1 29.0 (26.0) 122.2 Flood insurance recovery(3) — — (27.3) — Adjusted EBITDA(1) $ 16.4 $ 104.6 $ 602.0 $ 621.6 (1) Definition on slide 10 (2) Represents the portion of gain (loss) on derivatives, net related to contracts that matured during the respective periods and settled with counterparties. There are no premiums paid or received at inception of the derivative contracts and upon settlement, there is no cost recovery associated with these contracts. (3) Represents an insurance recovery from Coffeyville Resources Refining and Marketing, LLC’s environmental insurance carriers as a result of the flood and crude oil discharge at the Coffeyville refinery on June/July 2007. 13 Consolidated Non-GAAP Financial Measures
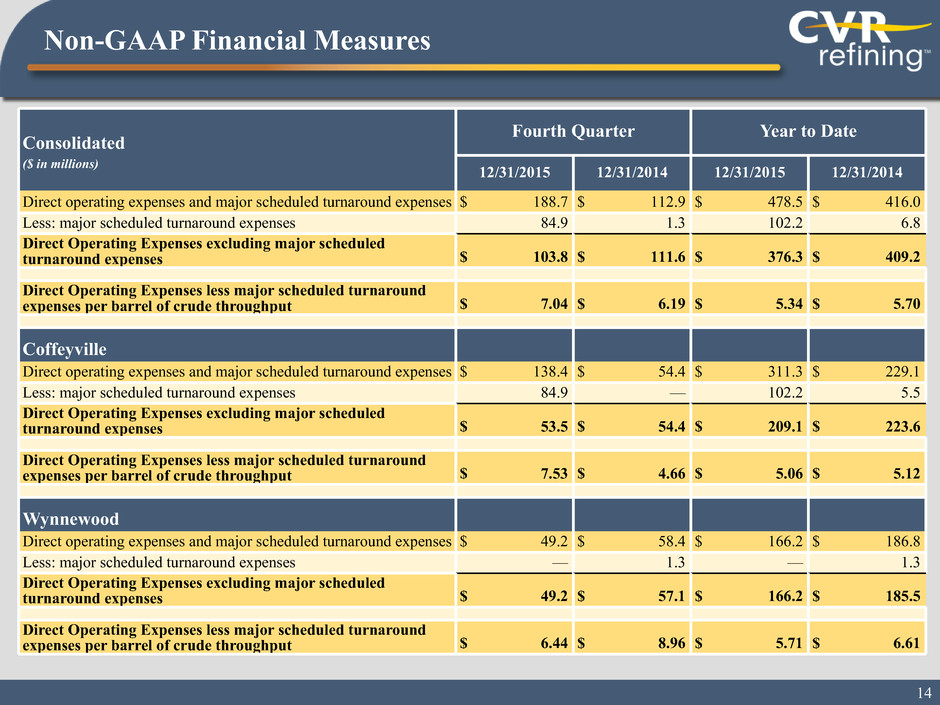
Consolidated Fourth Quarter Year to Date ($ in millions) 12/31/2015 12/31/2014 12/31/2015 12/31/2014 Direct operating expenses and major scheduled turnaround expenses $ 188.7 $ 112.9 $ 478.5 $ 416.0 Less: major scheduled turnaround expenses 84.9 1.3 102.2 6.8 Direct Operating Expenses excluding major scheduled turnaround expenses $ 103.8 $ 111.6 $ 376.3 $ 409.2 Direct Operating Expenses less major scheduled turnaround expenses per barrel of crude throughput $ 7.04 $ 6.19 $ 5.34 $ 5.70 Coffeyville Direct operating expenses and major scheduled turnaround expenses $ 138.4 $ 54.4 $ 311.3 $ 229.1 Less: major scheduled turnaround expenses 84.9 — 102.2 5.5 Direct Operating Expenses excluding major scheduled turnaround expenses $ 53.5 $ 54.4 $ 209.1 $ 223.6 Direct Operating Expenses less major scheduled turnaround expenses per barrel of crude throughput $ 7.53 $ 4.66 $ 5.06 $ 5.12 Wynnewood Direct operating expenses and major scheduled turnaround expenses $ 49.2 $ 58.4 $ 166.2 $ 186.8 Less: major scheduled turnaround expenses — 1.3 — 1.3 Direct Operating Expenses excluding major scheduled turnaround expenses $ 49.2 $ 57.1 $ 166.2 $ 185.5 Direct Operating Expenses less major scheduled turnaround expenses per barrel of crude throughput $ 6.44 $ 8.96 $ 5.71 $ 6.61 14 Non-GAAP Financial Measures
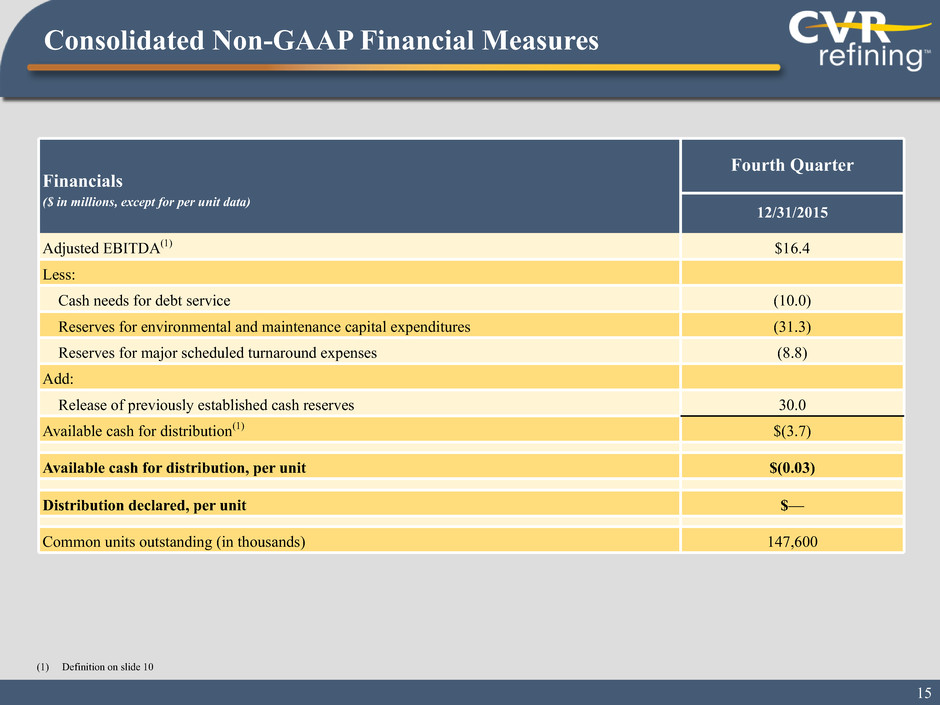
Financials Fourth Quarter ($ in millions, except for per unit data) 12/31/2015 Adjusted EBITDA(1) $16.4 Less: Cash needs for debt service (10.0) Reserves for environmental and maintenance capital expenditures (31.3) Reserves for major scheduled turnaround expenses (8.8) Add: Release of previously established cash reserves 30.0 Available cash for distribution(1) $(3.7) Available cash for distribution, per unit $(0.03) Distribution declared, per unit $— Common units outstanding (in thousands) 147,600 (1) Definition on slide 10 15 Consolidated Non-GAAP Financial Measures
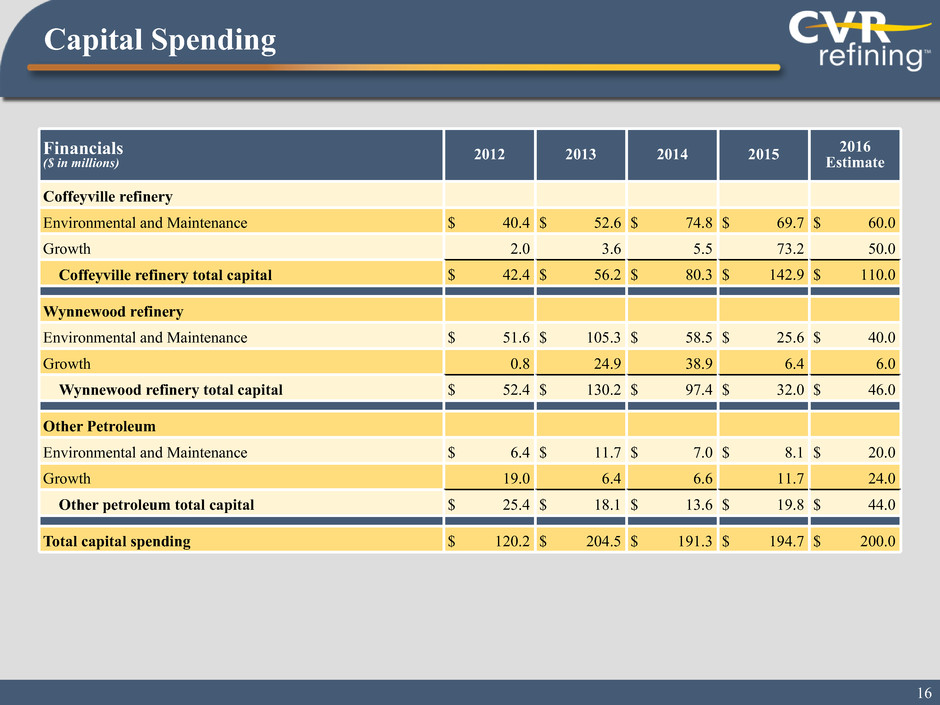
Financials ($ in millions) 2012 2013 2014 2015 2016 Estimate Coffeyville refinery Environmental and Maintenance $ 40.4 $ 52.6 $ 74.8 $ 69.7 $ 60.0 Growth 2.0 3.6 5.5 73.2 50.0 Coffeyville refinery total capital $ 42.4 $ 56.2 $ 80.3 $ 142.9 $ 110.0 Wynnewood refinery Environmental and Maintenance $ 51.6 $ 105.3 $ 58.5 $ 25.6 $ 40.0 Growth 0.8 24.9 38.9 6.4 6.0 Wynnewood refinery total capital $ 52.4 $ 130.2 $ 97.4 $ 32.0 $ 46.0 Other Petroleum Environmental and Maintenance $ 6.4 $ 11.7 $ 7.0 $ 8.1 $ 20.0 Growth 19.0 6.4 6.6 11.7 24.0 Other petroleum total capital $ 25.4 $ 18.1 $ 13.6 $ 19.8 $ 44.0 Total capital spending $ 120.2 $ 204.5 $ 191.3 $ 194.7 $ 200.0 16 Capital Spending
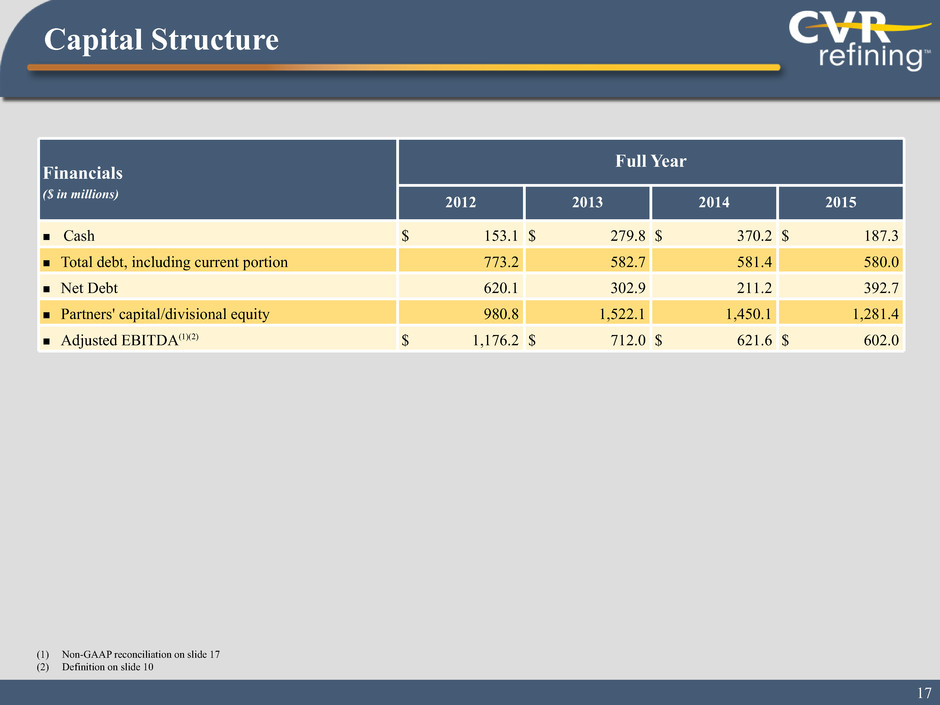
Financials Full Year ($ in millions) 2012 2013 2014 2015 n Cash $ 153.1 $ 279.8 $ 370.2 $ 187.3 n Total debt, including current portion 773.2 582.7 581.4 580.0 n Net Debt 620.1 302.9 211.2 392.7 n Partners' capital/divisional equity 980.8 1,522.1 1,450.1 1,281.4 n Adjusted EBITDA(1)(2) $ 1,176.2 $ 712.0 $ 621.6 $ 602.0 (1) Non-GAAP reconciliation on slide 17 (2) Definition on slide 10 17 Capital Structure
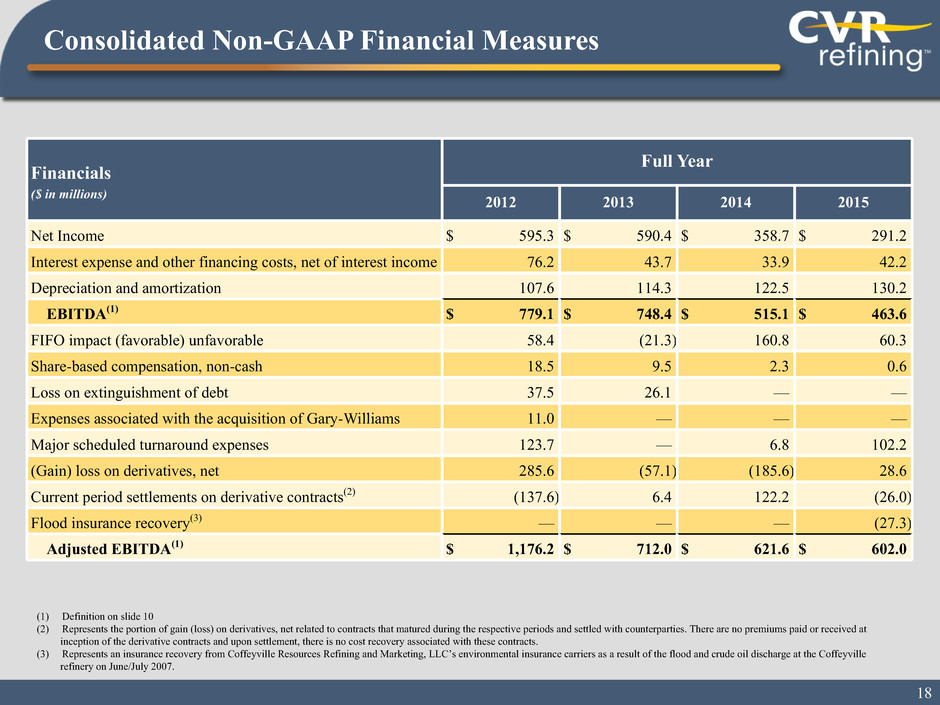
Financials Full Year ($ in millions) 2012 2013 2014 2015 Net Income $ 595.3 $ 590.4 $ 358.7 $ 291.2 Interest expense and other financing costs, net of interest income 76.2 43.7 33.9 42.2 Depreciation and amortization 107.6 114.3 122.5 130.2 EBITDA(1) $ 779.1 $ 748.4 $ 515.1 $ 463.6 FIFO impact (favorable) unfavorable 58.4 (21.3) 160.8 60.3 Share-based compensation, non-cash 18.5 9.5 2.3 0.6 Loss on extinguishment of debt 37.5 26.1 — — Expenses associated with the acquisition of Gary-Williams 11.0 — — — Major scheduled turnaround expenses 123.7 — 6.8 102.2 (Gain) loss on derivatives, net 285.6 (57.1) (185.6) 28.6 Current period settlements on derivative contracts(2) (137.6) 6.4 122.2 (26.0) Flood insurance recovery(3) — — — (27.3) Adjusted EBITDA(1) $ 1,176.2 $ 712.0 $ 621.6 $ 602.0 (1) Definition on slide 10 (2) Represents the portion of gain (loss) on derivatives, net related to contracts that matured during the respective periods and settled with counterparties. There are no premiums paid or received at inception of the derivative contracts and upon settlement, there is no cost recovery associated with these contracts. (3) Represents an insurance recovery from Coffeyville Resources Refining and Marketing, LLC’s environmental insurance carriers as a result of the flood and crude oil discharge at the Coffeyville refinery on June/July 2007. 18 Consolidated Non-GAAP Financial Measures
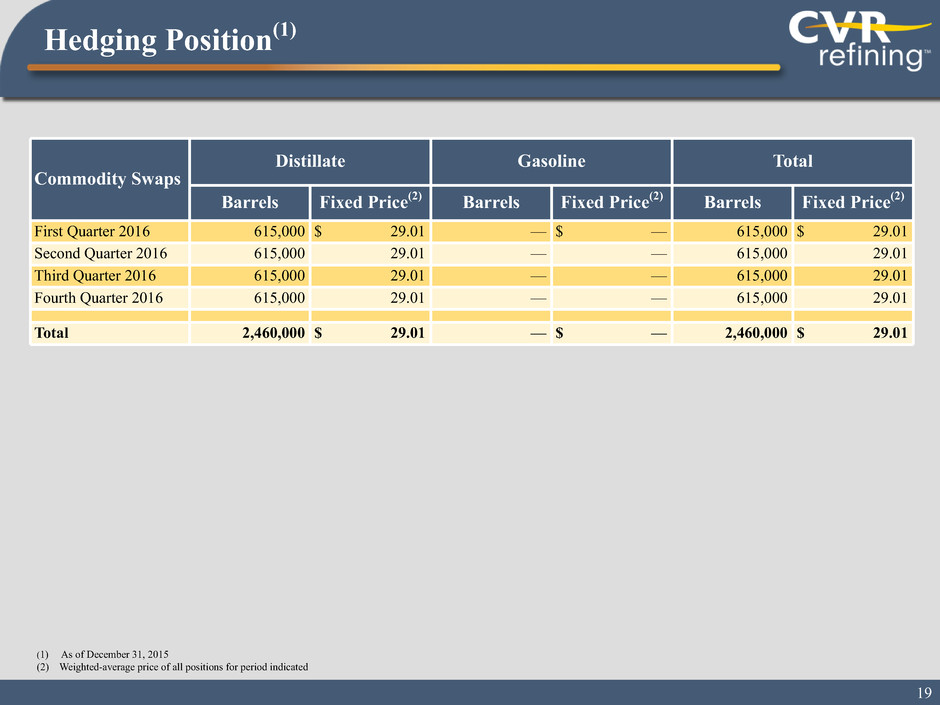
Commodity Swaps Distillate Gasoline Total Barrels Fixed Price(2) Barrels Fixed Price(2) Barrels Fixed Price(2) First Quarter 2016 615,000 $ 29.01 — $ — 615,000 $ 29.01 Second Quarter 2016 615,000 29.01 — — 615,000 29.01 Third Quarter 2016 615,000 29.01 — — 615,000 29.01 Fourth Quarter 2016 615,000 29.01 — — 615,000 29.01 Total 2,460,000 $ 29.01 — $ — 2,460,000 $ 29.01 (1) As of December 31, 2015 (2) Weighted-average price of all positions for period indicated 19 Hedging Position(1)


