0001559109virtus:BloombergUSAggregateBondIndex19218BroadBasedIndexMember2017-08-31
UNITED STATES
SECURITIES AND EXCHANGE COMMISSION
Washington, D.C. 20549
FORM N-CSR
CERTIFIED SHAREHOLDER REPORT OF REGISTERED MANAGEMENT INVESTMENT COMPANIES
Investment Company Act file number 811-22819
ETFis Series Trust I
(Exact name of registrant as specified in charter)
31 West 52nd Street, 16th Floor
New York, NY 10019
(Address of principal executive offices) (Zip code)
ETFis Series Trust I
c/o Corporation Service Company
2711 Centerville Road, Suite 400
Wilmington, DE 19808
(Name and address of agent for service)
Registrant’s telephone number, including area code: (212) 593-4383
Date of fiscal year end: October 31
Date of reporting period: October 31, 2024
Item 1. Reports to Stockholders.
| (a) | The Report to Shareholders is attached herewith. The registrant’s annual report transmitted to shareholders pursuant to Rule 30e-1 under the Investment Company Act of 1940 is as follows: |
InfraCap REIT Preferred ETF
Annual Shareholder Report | October 31, 2024
This annual shareholder report contains important information about the InfraCap REIT Preferred ETF ("Fund") for the period of November 1, 2023 to October 31, 2024.You can find additional information about the Fund at https://www.virtus.com/investor-resources/etf-documents.You can also request this information by contacting us at 1-888-383-0553.
What were the Fund costs for the period?
(Based on a hypothetical $10,000 investment)
| Fund | Costs of a $10,000 investment | Costs paid as a percentage of a $10,000 investment |
|---|
| InfraCap REIT Preferred ETF | $52 | 0.45% |
Portfolio Manager Commentary by Infrastructure Capital Advisors, LLC
For the fiscal year ended October 31, 2024, the Fund at NAV returned 29.17%. For the same period, the FT Wilshire 5000 Index, a broad-based securities market index, returned 37.86%, and the Indxx REIT Preferred Stock Index, which serves as the style-specific index, returned 29.98%.
What factors impacted Fund performance over the reporting period?
The Fund seeks exposure to preferred securities held by Real Estate Investment Trusts (REITs). During the period, exposure to sub-sectors, such as Mortgage REITs and Office REITs, were factors that contributed positively to the Fund's relative performance. Vornado, AGNC Investment Corp and Annaly Capital Management were three companies that were primary contributors to relative performance within these factors. During the period, exposure to the Self-Storage and Residential REITs sub-sectors were factors that detracted from relative performance because these sub-sectors underperformed versus other REIT sub-sectors. Overall, REIT preferreds benefited from the Federal Reserve’s commencement of an interest rate cut cycle and continued tightening of corporate credit spreads.
AGNC Investment Corp (AGNC) and Annaly Capital Management, Inc. (NLY) were two of the primary contributors for this factor’s positive performance.
Among office REITs, Vornado was the primary contributor for this factor’s positive performance.
While the sector performed positively, it was a relative underperformer versus other REIT sub-sectors.
While the sector performed positively, it was a relative underperformer versus other REIT sub-sectors.
InfraCap REIT Preferred ETF | 1
The preceding information is the opinion of the investment adviser and/or sub-adviser, as appropriate, through the end of the period stated. Any such opinions are subject to change at any time based upon market or other conditions and should not be relied upon as investment advice. Past performance is no guarantee of future results, and there is no guarantee that market forecasts will be realized.
How has the Fund historically performed?
The following graph and table compare the initial and subsequent account values over the life of the Fund. It assumes a $10,000 initial investment from inception in an appropriate broad-based securities market index and style-specific index for the same period.
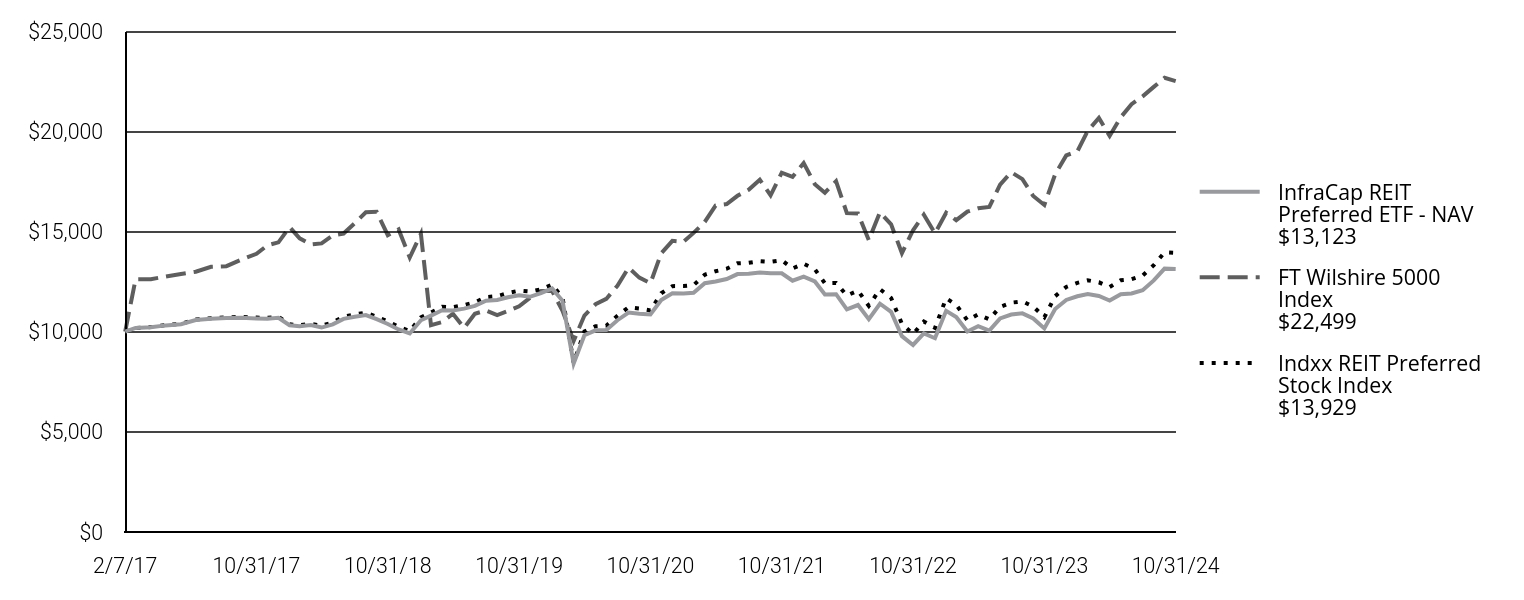
| InfraCap REIT Preferred ETF - NAV $13,123 | FT Wilshire 5000 Index $22,499 | Indxx REIT Preferred Stock Index $13,929 |
|---|
| 2/7/17 | $10,000 | $10,000 | $10,000 |
| 2/28/17 | $10,185 | $12,609 | $10,183 |
| 3/31/17 | $10,215 | $12,615 | $10,223 |
| 4/30/17 | $10,310 | $12,747 | $10,323 |
| 5/31/17 | $10,369 | $12,875 | $10,390 |
| 6/30/17 | $10,579 | $12,987 | $10,600 |
| 7/31/17 | $10,638 | $13,234 | $10,663 |
| 8/31/17 | $10,675 | $13,266 | $10,708 |
| 9/30/17 | $10,690 | $13,586 | $10,732 |
| 10/31/17 | $10,654 | $13,879 | $10,698 |
| 11/30/17 | $10,636 | $14,301 | $10,685 |
| 12/31/17 | $10,687 | $14,455 | $10,740 |
| 1/31/18 | $10,317 | $15,214 | $10,365 |
| 2/28/18 | $10,263 | $14,653 | $10,319 |
| 3/31/18 | $10,325 | $14,345 | $10,382 |
| 4/30/18 | $10,202 | $14,402 | $10,293 |
| 5/31/18 | $10,362 | $14,798 | $10,459 |
| 6/30/18 | $10,634 | $14,894 | $10,744 |
| 7/31/18 | $10,739 | $15,411 | $10,856 |
| 8/31/18 | $10,825 | $15,952 | $10,946 |
| 9/30/18 | $10,623 | $15,978 | $10,741 |
| 10/31/18 | $10,377 | $14,812 | $10,517 |
| 11/30/18 | $10,108 | $15,098 | $10,242 |
| 12/31/18 | $9,909 | $13,694 | $10,027 |
| 1/31/19 | $10,566 | $14,878 | $10,708 |
| 2/28/19 | $10,798 | $10,323 | $10,957 |
| 3/31/19 | $11,062 | $10,473 | $11,238 |
| 4/30/19 | $11,057 | $10,893 | $11,213 |
| 5/31/19 | $11,146 | $10,182 | $11,319 |
| 6/30/19 | $11,282 | $10,892 | $11,462 |
| 7/31/19 | $11,537 | $11,054 | $11,721 |
| 8/31/19 | $11,577 | $10,828 | $11,766 |
| 9/30/19 | $11,715 | $11,025 | $11,930 |
| 10/31/19 | $11,807 | $11,266 | $12,043 |
| 11/30/19 | $11,737 | $11,684 | $12,001 |
| 12/31/19 | $11,922 | $12,026 | $12,111 |
| 1/31/20 | $12,154 | $12,027 | $12,339 |
| 2/29/20 | $11,538 | $11,041 | $11,693 |
| 3/31/20 | $8,412 | $9,537 | $8,439 |
| 4/30/20 | $9,817 | $10,802 | $10,002 |
| 5/31/20 | $10,063 | $11,364 | $10,267 |
| 6/30/20 | $10,083 | $11,631 | $10,296 |
| 7/31/20 | $10,568 | $12,289 | $10,794 |
| 8/31/20 | $10,949 | $13,187 | $11,213 |
| 9/30/20 | $10,893 | $12,694 | $11,152 |
| 10/31/20 | $10,855 | $12,414 | $11,053 |
| 11/30/20 | $11,580 | $13,908 | $11,913 |
| 12/31/20 | $11,909 | $14,531 | $12,269 |
| 1/31/21 | $11,897 | $14,483 | $12,271 |
| 2/28/21 | $11,937 | $14,925 | $12,319 |
| 3/31/21 | $12,413 | $15,473 | $12,840 |
| 4/30/21 | $12,504 | $16,290 | $13,014 |
| 5/31/21 | $12,621 | $16,366 | $13,139 |
| 6/30/21 | $12,869 | $16,777 | $13,408 |
| 7/31/21 | $12,888 | $17,077 | $13,434 |
| 8/31/21 | $12,953 | $17,580 | $13,516 |
| 9/30/21 | $12,915 | $16,801 | $13,481 |
| 10/31/21 | $12,910 | $17,931 | $13,561 |
| 11/30/21 | $12,539 | $17,721 | $13,150 |
| 12/31/21 | $12,746 | $18,410 | $13,382 |
| 1/31/22 | $12,500 | $17,356 | $13,114 |
| 2/28/22 | $11,856 | $16,932 | $12,414 |
| 3/31/22 | $11,866 | $17,499 | $12,429 |
| 4/30/22 | $11,109 | $15,916 | $11,802 |
| 5/31/22 | $11,326 | $15,892 | $12,039 |
| 6/30/22 | $10,621 | $14,563 | $11,285 |
| 7/31/22 | $11,390 | $15,954 | $12,117 |
| 8/31/22 | $10,985 | $15,349 | $11,677 |
| 9/30/22 | $9,773 | $13,916 | $10,393 |
| 10/31/22 | $9,334 | $15,058 | $9,876 |
| 11/30/22 | $9,914 | $15,832 | $10,505 |
| 12/31/22 | $9,670 | $14,905 | $10,183 |
| 1/31/23 | $11,036 | $15,932 | $11,662 |
| 2/28/23 | $10,731 | $15,560 | $11,340 |
| 3/31/23 | $10,003 | $15,986 | $10,563 |
| 4/30/23 | $10,274 | $16,152 | $10,858 |
| 5/31/23 | $10,050 | $16,221 | $10,609 |
| 6/30/23 | $10,659 | $17,334 | $11,233 |
| 7/31/23 | $10,849 | $17,956 | $11,445 |
| 8/31/23 | $10,911 | $17,607 | $11,506 |
| 9/30/23 | $10,658 | $16,766 | $11,252 |
| 10/31/23 | $10,159 | $16,320 | $10,716 |
| 11/30/23 | $11,128 | $17,844 | $11,765 |
| 12/31/23 | $11,580 | $18,794 | $12,230 |
| 1/31/24 | $11,764 | $18,995 | $12,433 |
| 2/29/24 | $11,878 | $20,019 | $12,559 |
| 3/31/24 | $11,779 | $20,664 | $12,460 |
| 4/30/24 | $11,552 | $19,764 | $12,223 |
| 5/31/24 | $11,868 | $20,697 | $12,565 |
| 6/30/24 | $11,905 | $21,347 | $12,613 |
| 7/31/24 | $12,068 | $21,740 | $12,797 |
| 8/31/24 | $12,554 | $22,212 | $13,316 |
| 9/30/24 | $13,143 | $22,663 | $13,952 |
| 10/31/24 | $13,123 | $22,499 | $13,929 |
| ANNUAL AVERAGE TOTAL RETURNS | 1 Year | 5 Years | Since Inception 2/7/17 |
|---|
| InfraCap REIT Preferred ETF - NAV | 29.17 | 2.14 | 3.58 |
| FT Wilshire 5000 Index | 37.86 | 14.84 | 13.94 |
| Indxx REIT Preferred Stock Index | 29.98 | 2.95 | 4.38 |
Performance data quoted represents past performance. Past performance does not guarantee future results. Investment return and principal value will fluctuate so that shares, when redeemed, may be worth more or less than their original cost. The above table and graph do not reflect the deduction of taxes that a shareholder would pay on fund distributions or the redemption of shares. Current performance may be lower or higher than the performance data quoted. Please visit virtus.com for performance data current to the most recent month end. Average annual total return is the annual compound return for the indicated period and reflects the change in share price and the reinvestment of all dividends and capital gains.
InfraCap REIT Preferred ETF | 2
KEY FUND STATISTIC (as of October 31, 2024)
| Fund net assets | $114,644,915 |
| Total number of portfolio holdings | 110 |
| Total advisory fees paid | $362,420 |
| Portfolio turnover rate | 14% |
ASSET ALLOCATION Footnote Reference(1)
| Real Estate | 60.80% |
| Financials | 38.50% |
| Money Market fund | 0.70% |
| Footnote | Description |
Footnote(1) | Percentage of total investments as of October 31, 2024. |
Where can I find additional information about the Fund?
For more information about the Fund, including its prospectus, financial information, holdings, and proxy voting information, please contact us at 1-888-383-0553, or visit https://www.virtus.com/investor-resources/etf-documents.
Shareholders who have consented to receive a single annual or semi-annual shareholder report at a shared address may revoke this
consent or request additional copies by calling Virtus ETFs at 1-888-383-0553.
InfraCap REIT Preferred ETF | 3
Virtus InfraCap U.S. Preferred Stock ETF
Annual Shareholder Report | October 31, 2024
This annual shareholder report contains important information about the Virtus InfraCap U.S. Preferred Stock ETF ("Fund") for the period of November 1, 2023 to October 31, 2024.You can find additional information about the Fund at https://www.virtus.com/investor-resources/etf-documents.You can also request this information by contacting us at 1-888-383-0553.
What were the Fund costs for the period?
(Based on a hypothetical $10,000 investment)
| Fund | Costs of a $10,000 investment | Costs paid as a percentage of a $10,000 investment |
|---|
| Virtus InfraCap U.S. Preferred Stock ETF | $291 | 2.48% |
Portfolio Manager Commentary by Infrastructure Capital Advisors, LLC
For the fiscal year ended October 31, 2024, the Fund at NAV returned 34.95%. For the same period, the FT Wilshire 5000 Index, a broad-based securities market index, returned 37.86%, and the S&P U.S. Preferred Stock Index, which serves as the style-specific index, returned 24.20%.
What factors impacted Fund performance over the reporting period?
Sector allocation, interest rate sensitives, and credit qualities were factors that positively contributed to the Fund's relative outperformance to the S&P U.S. Preferred Stock Index (“Benchmark”) for the 12-month period. Overweight exposure to the Utilities and Real Estate sectors also positively contributed to the Fund's high income and total return. Underweight exposure to the Commercial Services and Media Sectors detracted from relative performance. In addition, overweight exposure to select small company issuers detracted from relative performance. Finally, factors such as interest rate sensitives, credit qualities, and market betas helped to increase income and total return as a result of the Fund's overweight exposure to non-investment grade securities and preferred securities with higher market betas, such as mandatory convertible preferred securities.
Overweight exposure to utilities and Real Estate sectors relative to the Benchmark contributed to relative outperformance.
Credits/ Interest Rates/ Market Beta
Overweight exposure to mandatory convertibles preferred securities and non-investment grade credits that provided enhanced income and contributed to relative outperformance.
Media/ Commercial Services
Underweight exposure to Media and Commercial Services sectors relative to the Benchmark detracted from relative performance.
Overweight exposure to select small company issuers which that underperformed during the period due to idiosyncratic credit considerations.
Virtus InfraCap U.S. Preferred Stock ETF | 1
The preceding information is the opinion of the investment adviser and/or sub-adviser, as appropriate, through the end of the period stated. Any such opinions are subject to change at any time based upon market or other conditions and should not be relied upon as investment advice. Past performance is no guarantee of future results, and there is no guarantee that market forecasts will be realized.
How has the Fund historically performed?
The following graph and table compare the initial and subsequent account values over the life of the Fund. It assumes a $10,000 initial investment from inception in an appropriate broad-based securities market index and style-specific index for the same period.
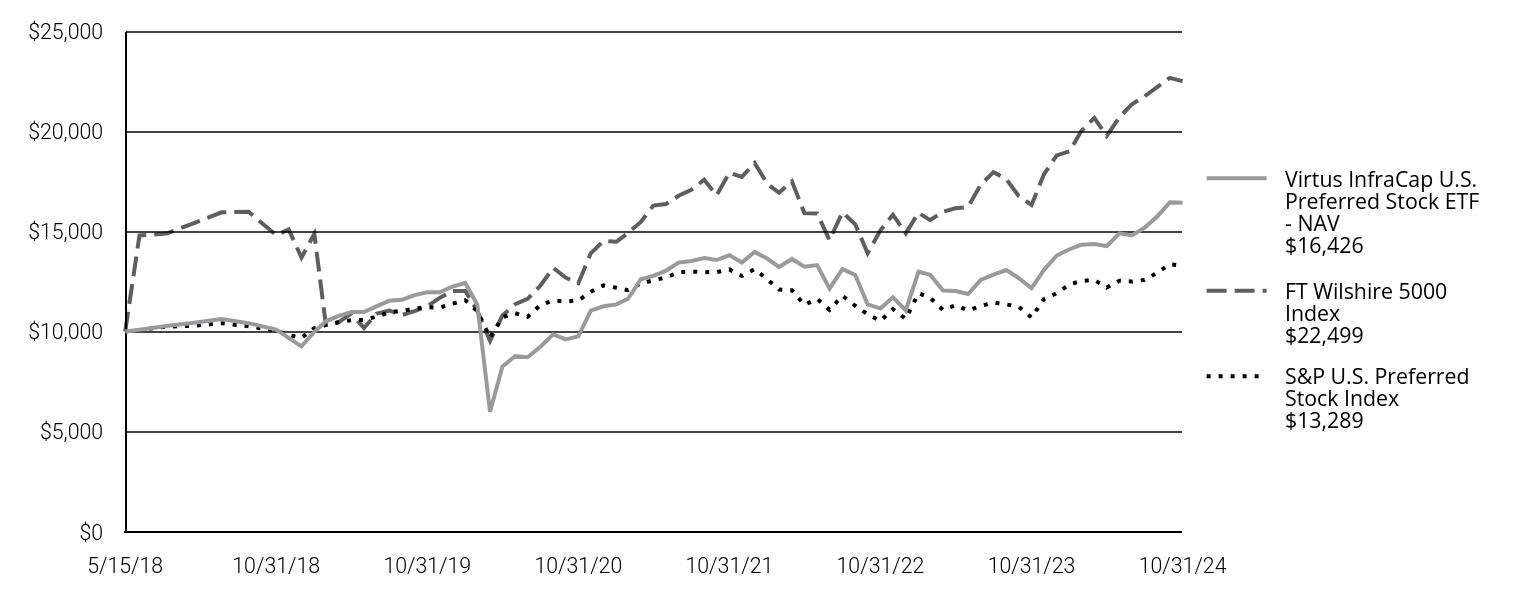
| Virtus InfraCap U.S. Preferred Stock ETF - NAV $16,426 | FT Wilshire 5000 Index $22,499 | S&P U.S. Preferred Stock Index $13,289 |
|---|
| 5/15/18 | $10,000 | $10,000 | $10,000 |
| 5/31/18 | $10,087 | $14,798 | $10,085 |
| 6/30/18 | $10,279 | $14,894 | $10,244 |
| 7/31/18 | $10,444 | $15,411 | $10,295 |
| 8/31/18 | $10,626 | $15,952 | $10,417 |
| 9/30/18 | $10,421 | $15,978 | $10,265 |
| 10/31/18 | $10,102 | $14,812 | $10,049 |
| 11/30/18 | $9,687 | $15,098 | $9,829 |
| 12/31/18 | $9,264 | $13,694 | $9,686 |
| 1/31/19 | $9,990 | $14,878 | $10,178 |
| 2/28/19 | $10,514 | $10,323 | $10,341 |
| 3/31/19 | $10,787 | $10,473 | $10,463 |
| 4/30/19 | $10,973 | $10,893 | $10,569 |
| 5/31/19 | $10,980 | $10,182 | $10,582 |
| 6/30/19 | $11,255 | $10,892 | $10,744 |
| 7/31/19 | $11,537 | $11,054 | $10,959 |
| 8/31/19 | $11,588 | $10,828 | $11,042 |
| 9/30/19 | $11,819 | $11,025 | $11,143 |
| 10/31/19 | $11,958 | $11,266 | $11,215 |
| 11/30/19 | $11,963 | $11,684 | $11,190 |
| 12/31/19 | $12,241 | $12,026 | $11,394 |
| 1/31/20 | $12,426 | $12,027 | $11,565 |
| 2/29/20 | $11,346 | $11,041 | $11,029 |
| 3/31/20 | $6,004 | $9,537 | $9,695 |
| 4/30/20 | $8,256 | $10,802 | $10,720 |
| 5/31/20 | $8,784 | $11,364 | $10,916 |
| 6/30/20 | $8,719 | $11,631 | $10,741 |
| 7/31/20 | $9,247 | $12,289 | $11,333 |
| 8/31/20 | $9,860 | $13,187 | $11,551 |
| 9/30/20 | $9,612 | $12,694 | $11,504 |
| 10/31/20 | $9,762 | $12,414 | $11,554 |
| 11/30/20 | $11,050 | $13,908 | $11,988 |
| 12/31/20 | $11,265 | $14,531 | $12,303 |
| 1/31/21 | $11,359 | $14,483 | $12,190 |
| 2/28/21 | $11,638 | $14,925 | $12,071 |
| 3/31/21 | $12,612 | $15,473 | $12,399 |
| 4/30/21 | $12,784 | $16,290 | $12,559 |
| 5/31/21 | $13,042 | $16,366 | $12,700 |
| 6/30/21 | $13,445 | $16,777 | $12,964 |
| 7/31/21 | $13,524 | $17,077 | $12,992 |
| 8/31/21 | $13,667 | $17,580 | $12,967 |
| 9/30/21 | $13,573 | $16,801 | $12,969 |
| 10/31/21 | $13,815 | $17,931 | $13,100 |
| 11/30/21 | $13,448 | $17,721 | $12,779 |
| 12/31/21 | $13,976 | $18,410 | $13,119 |
| 1/31/22 | $13,632 | $17,356 | $12,598 |
| 2/28/22 | $13,224 | $16,932 | $12,098 |
| 3/31/22 | $13,625 | $17,499 | $12,061 |
| 4/30/22 | $13,235 | $15,916 | $11,334 |
| 5/31/22 | $13,317 | $15,892 | $11,631 |
| 6/30/22 | $12,144 | $14,563 | $11,085 |
| 7/31/22 | $13,118 | $15,954 | $11,792 |
| 8/31/22 | $12,830 | $15,349 | $11,289 |
| 9/30/22 | $11,355 | $13,916 | $10,862 |
| 10/31/22 | $11,151 | $15,058 | $10,531 |
| 11/30/22 | $11,711 | $15,832 | $11,118 |
| 12/31/22 | $11,053 | $14,905 | $10,636 |
| 1/31/23 | $12,987 | $15,932 | $11,912 |
| 2/28/23 | $12,840 | $15,560 | $11,688 |
| 3/31/23 | $12,051 | $15,986 | $11,082 |
| 4/30/23 | $12,027 | $16,152 | $11,316 |
| 5/31/23 | $11,875 | $16,221 | $11,053 |
| 6/30/23 | $12,576 | $17,334 | $11,274 |
| 7/31/23 | $12,847 | $17,956 | $11,452 |
| 8/31/23 | $13,070 | $17,607 | $11,354 |
| 9/30/23 | $12,665 | $16,766 | $11,242 |
| 10/31/23 | $12,171 | $16,320 | $10,699 |
| 11/30/23 | $13,079 | $17,844 | $11,623 |
| 12/31/23 | $13,796 | $18,794 | $11,915 |
| 1/31/24 | $14,111 | $18,995 | $12,357 |
| 2/29/24 | $14,335 | $20,019 | $12,526 |
| 3/31/24 | $14,370 | $20,664 | $12,581 |
| 4/30/24 | $14,262 | $19,764 | $12,199 |
| 5/31/24 | $14,904 | $20,697 | $12,537 |
| 6/30/24 | $14,796 | $21,347 | $12,498 |
| 7/31/24 | $15,188 | $21,740 | $12,582 |
| 8/31/24 | $15,755 | $22,212 | $12,944 |
| 9/30/24 | $16,451 | $22,663 | $13,365 |
| 10/31/24 | $16,426 | $22,499 | $13,289 |
| ANNUAL AVERAGE TOTAL RETURNS | 1 Year | 5 Years | Since Inception 5/15/18 |
|---|
| Virtus InfraCap U.S. Preferred Stock ETF - NAV | 34.95 | 6.56 | 7.97 |
| FT Wilshire 5000 Index | 37.86 | 14.84 | 13.51 |
| S&P U.S. Preferred Stock Index | 24.20 | 3.45 | 4.49 |
Performance data quoted represents past performance. Past performance does not guarantee future results. Investment return and principal value will fluctuate so that shares, when redeemed, may be worth more or less than their original cost. The above table and graph do not reflect the deduction of taxes that a shareholder would pay on fund distributions or the redemption of shares. Current performance may be lower or higher than the performance data quoted. Please visit virtus.com for performance data current to the most recent month end. Average annual total return is the annual compound return for the indicated period and reflects the change in share price and the reinvestment of all dividends and capital gains.
Virtus InfraCap U.S. Preferred Stock ETF | 2
KEY FUND STATISTIC (as of October 31, 2024)
| Fund net assets | $1,380,264,248 |
| Total number of portfolio holdings | 216 |
| Total advisory fees paid | $7,653,469 |
| Portfolio turnover rate | 62% |
ASSET ALLOCATION Footnote Reference(1)
| Financials | 64.2%Footnote Reference+ |
| Real Estate | 25.4%Footnote Reference+ |
| Industrials | 11.5% |
| Utilities | 8.9% |
| Communication Services | 7.4% |
| Energy | 4.3% |
| Consumer Discretionary | 0.9% |
| Health Care | 0.1% |
| Information Technology | 0.0% |
| Corporate Bond | 0.0% |
| Money Market Funds | 0.4% |
| Liabilities in Excess of Other Assets | (23.1)% |
| Total | 100.0% |
|
| Footnote | Description |
Footnote+ | Amounts represent investments in particular sectors. No industry within these sectors represented more than 25% of the Fund’s total assets at the time of investment. |
Footnote(1) | Percentage of total investments as of October 31, 2024. |
Where can I find additional information about the Fund?
For more information about the Fund, including its prospectus, financial information, holdings, and proxy voting information, please contact us at 1-888-383-0553, or visit https://www.virtus.com/investor-resources/etf-documents.
Shareholders who have consented to receive a single annual or semi-annual shareholder report at a shared address may revoke this
consent or request additional copies by calling Virtus ETFs at 1-888-383-0553.
Virtus InfraCap U.S. Preferred Stock ETF | 3
Virtus LifeSci Biotech Clinical Trials ETF
Annual Shareholder Report | October 31, 2024
This annual shareholder report contains important information about the Virtus LifeSci Biotech Clinical Trials ETF ("Fund") for the period of November 1, 2023 to October 31, 2024.You can find additional information about the Fund at https://www.virtus.com/investor-resources/etf-documents.You can also request this information by contacting us at 1-888-383-0553.
What were the Fund costs for the period?
(Based on a hypothetical $10,000 investment)
| Fund | Costs of a $10,000 investment | Costs paid as a percentage of a $10,000 investment |
|---|
| Virtus LifeSci Biotech Clinical Trials ETF | $102 | 0.79% |
Portfolio Manager Commentary by Virtus ETF Advisers LLC
For the fiscal year ended October 31, 2024, the Fund at NAV returned 59.09%. For the same period, the FT Wilshire 5000 Index and the S&P 500 Index, each a broad-based securities market index, returned 37.86% and 38.02%, respectively, and the Lifesci Biotechnology Clinical Trials Index, which serves as the style-specific index, returned 61.46%.
What factors impacted Fund performance over the reporting period?
Momentum and volatility exposures contributed positively to Fund returns relative to the Fund’s broad-based securities market index, the FT Wilshire 5000 Index, for the 12-month period. Exposures in the biotechnology and pharmaceuticals sectors contributed the most to relative performance. Underweight exposures to the information technology and health care sectors detracted from relative performance. Sector allocations and specific stock index weightings contributed to overall Fund performance, as tracking error was minimal to the FT Wilshire 5000 Index. On a relative weighting measure, being equal weight while seeking to reduce concentration risk resulted in overweight positions in biotechnology stocks including Longboard Pharmaceutics and Summit Therapeutics. Contributors among pharmaceutical stocks included Viking Therapeutics, which experienced strong gains due to sales of its obesity pill, and from products in its pipeline for liver disease.
Biotechnology/ Pharmaceuticals
Issue selection, particularly in Longboard Pharmaceuticals and Summit Therapeutics, enhanced relative returns. In addition, Viking Therapeutics contributed to performance.
Overweight exposure to these factors enhanced relative returns.
Information Technology/ Healthcare
Index exposures to these sectors relative to the FT Wilshire 5000 Index detracted from performance.
Underweight exposure to these factors detracted from performance over the period, as they are more sensitive to economic changes including higher interest rates and tighter monetary policy.
Virtus LifeSci Biotech Clinical Trials ETF | 1
The preceding information is the opinion of the investment adviser and/or sub-adviser, as appropriate, through the end of the period stated. Any such opinions are subject to change at any time based upon market or other conditions and should not be relied upon as investment advice. Past performance is no guarantee of future results, and there is no guarantee that market forecasts will be realized.
How has the Fund historically performed?
The following graph and table compare the initial and subsequent account values over the life of the Fund. It assumes a $10,000 initial investment from inception in an appropriate broad-based securities market indexes and a style-specific index for the same period. The Fund has changed its broad-based index to the FT Wilshire 5000 Index, which includes large, mid, small and micro- capitalization companies.
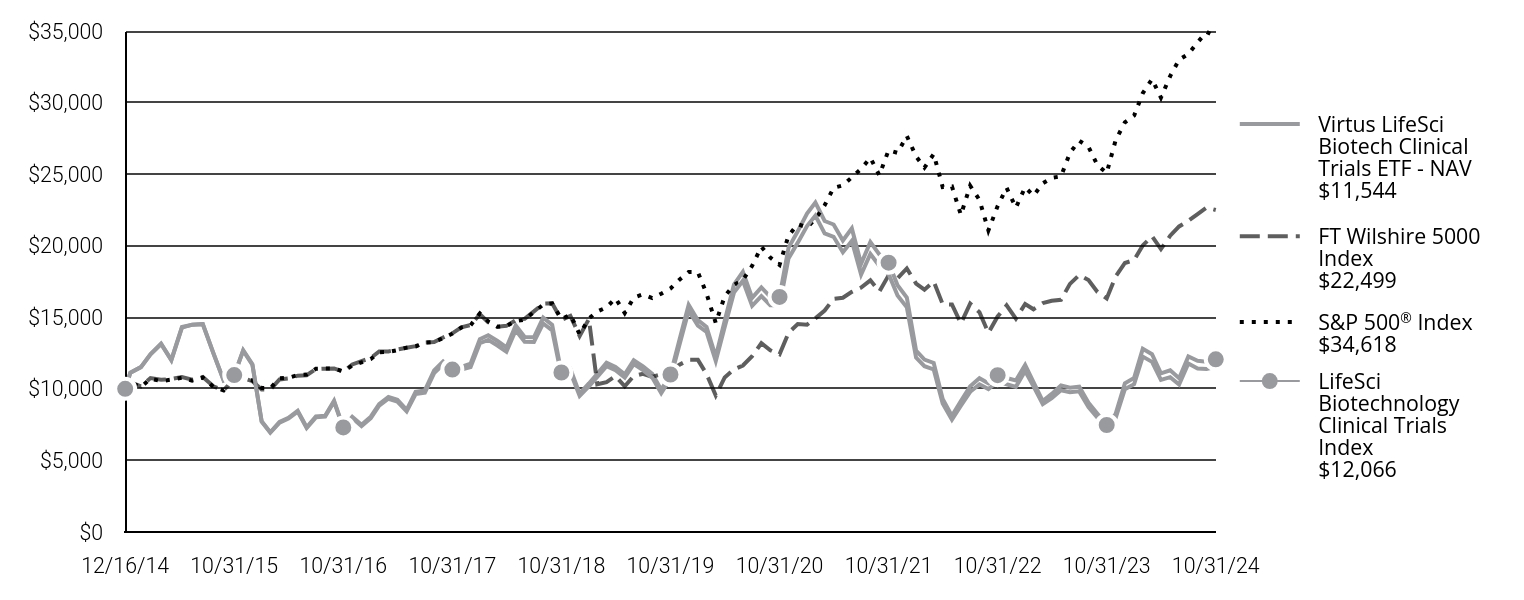
| Virtus LifeSci Biotech Clinical Trials ETF - NAV $11,544 | FT Wilshire 5000 Index $22,499 | S&P 500® Index $34,618 | LifeSci Biotechnology Clinical Trials Index $12,066 |
|---|
| 12/16/14 | $10,000 | $10,000 | $10,000 | $10,000 |
| 12/31/14 | $11,128 | $10,462 | $10,444 | $11,119 |
| 1/31/15 | $11,519 | $10,172 | $10,131 | $11,519 |
| 2/28/15 | $12,408 | $10,752 | $10,713 | $12,415 |
| 3/31/15 | $13,136 | $10,630 | $10,544 | $13,152 |
| 4/30/15 | $12,001 | $10,688 | $10,645 | $12,023 |
| 5/31/15 | $14,278 | $10,826 | $10,782 | $14,316 |
| 6/30/15 | $14,484 | $10,636 | $10,573 | $14,473 |
| 7/31/15 | $14,522 | $10,824 | $10,794 | $14,522 |
| 8/31/15 | $12,488 | $10,181 | $10,143 | $12,492 |
| 9/30/15 | $10,588 | $9,904 | $9,892 | $10,596 |
| 10/31/15 | $10,946 | $10,697 | $10,727 | $10,963 |
| 11/30/15 | $12,668 | $10,747 | $10,759 | $12,698 |
| 12/31/15 | $11,669 | $10,535 | $10,589 | $11,721 |
| 1/31/16 | $7,709 | $9,960 | $10,063 | $7,740 |
| 2/29/16 | $6,938 | $9,955 | $10,050 | $6,971 |
| 3/31/16 | $7,640 | $10,658 | $10,732 | $7,686 |
| 4/30/16 | $7,932 | $10,727 | $10,773 | $7,983 |
| 5/31/16 | $8,410 | $10,922 | $10,967 | $8,469 |
| 6/30/16 | $7,265 | $10,956 | $10,995 | $7,316 |
| 7/31/16 | $8,010 | $11,386 | $11,400 | $8,072 |
| 8/31/16 | $8,061 | $11,413 | $11,416 | $8,127 |
| 9/30/16 | $9,099 | $11,425 | $11,419 | $9,178 |
| 10/31/16 | $7,254 | $11,192 | $11,210 | $7,309 |
| 11/30/16 | $7,965 | $11,702 | $11,626 | $8,048 |
| 12/31/16 | $7,405 | $11,943 | $11,855 | $7,487 |
| 1/31/17 | $7,961 | $12,156 | $12,080 | $8,054 |
| 2/28/17 | $8,826 | $12,609 | $12,560 | $8,931 |
| 3/31/17 | $9,309 | $12,615 | $12,574 | $9,428 |
| 4/30/17 | $9,114 | $12,747 | $12,704 | $9,231 |
| 5/31/17 | $8,423 | $12,875 | $12,882 | $8,526 |
| 6/30/17 | $9,643 | $12,987 | $12,963 | $9,795 |
| 7/31/17 | $9,734 | $13,234 | $13,229 | $9,891 |
| 8/31/17 | $11,096 | $13,266 | $13,270 | $11,290 |
| 9/30/17 | $11,695 | $13,586 | $13,544 | $11,908 |
| 10/31/17 | $11,147 | $13,879 | $13,860 | $11,347 |
| 11/30/17 | $11,341 | $14,301 | $14,285 | $11,531 |
| 12/31/17 | $11,519 | $14,455 | $14,444 | $11,753 |
| 1/31/18 | $13,188 | $15,214 | $15,270 | $13,471 |
| 2/28/18 | $13,422 | $14,653 | $14,708 | $13,741 |
| 3/31/18 | $13,026 | $14,345 | $14,334 | $13,341 |
| 4/30/18 | $12,587 | $14,402 | $14,389 | $12,891 |
| 5/31/18 | $14,089 | $14,798 | $14,735 | $14,432 |
| 6/30/18 | $13,291 | $14,894 | $14,826 | $13,619 |
| 7/31/18 | $13,274 | $15,411 | $15,378 | $13,605 |
| 8/31/18 | $14,568 | $15,952 | $15,879 | $14,970 |
| 9/30/18 | $14,086 | $15,978 | $15,969 | $14,472 |
| 10/31/18 | $10,918 | $14,812 | $14,878 | $11,142 |
| 11/30/18 | $11,153 | $15,098 | $15,181 | $11,396 |
| 12/31/18 | $9,504 | $13,694 | $13,810 | $9,667 |
| 1/31/19 | $10,177 | $14,878 | $14,917 | $10,377 |
| 2/28/19 | $10,833 | $10,323 | $15,396 | $11,053 |
| 3/31/19 | $11,586 | $10,473 | $15,695 | $11,829 |
| 4/30/19 | $11,298 | $10,893 | $16,331 | $11,535 |
| 5/31/19 | $10,780 | $10,182 | $15,293 | $11,013 |
| 6/30/19 | $11,726 | $10,892 | $16,371 | $11,998 |
| 7/31/19 | $11,307 | $11,054 | $16,606 | $11,573 |
| 8/31/19 | $10,786 | $10,828 | $16,343 | $11,044 |
| 9/30/19 | $9,698 | $11,025 | $16,649 | $9,931 |
| 10/31/19 | $10,735 | $11,266 | $17,009 | $11,002 |
| 11/30/19 | $13,072 | $11,684 | $17,627 | $13,412 |
| 12/31/19 | $15,453 | $12,026 | $18,159 | $15,871 |
| 1/31/20 | $14,416 | $12,027 | $18,152 | $14,797 |
| 2/29/20 | $13,972 | $11,041 | $16,657 | $14,328 |
| 3/31/20 | $11,948 | $9,537 | $14,600 | $12,242 |
| 4/30/20 | $14,321 | $10,802 | $16,472 | $14,768 |
| 5/31/20 | $16,724 | $11,364 | $17,256 | $17,288 |
| 6/30/20 | $17,553 | $11,631 | $17,599 | $18,179 |
| 7/31/20 | $15,797 | $12,289 | $18,592 | $16,362 |
| 8/31/20 | $16,482 | $13,187 | $19,928 | $17,085 |
| 9/30/20 | $15,845 | $12,694 | $19,171 | $16,428 |
| 10/31/20 | $15,835 | $12,414 | $18,661 | $16,421 |
| 11/30/20 | $19,116 | $13,908 | $20,704 | $19,853 |
| 12/31/20 | $20,215 | $14,531 | $21,500 | $21,005 |
| 1/31/21 | $21,377 | $14,483 | $21,283 | $22,239 |
| 2/28/21 | $22,106 | $14,925 | $21,869 | $23,020 |
| 3/31/21 | $20,861 | $15,473 | $22,827 | $21,726 |
| 4/30/21 | $20,620 | $16,290 | $24,045 | $21,482 |
| 5/31/21 | $19,545 | $16,366 | $24,213 | $20,360 |
| 6/30/21 | $20,334 | $16,777 | $24,779 | $21,208 |
| 7/31/21 | $17,980 | $17,077 | $25,367 | $18,732 |
| 8/31/21 | $19,423 | $17,580 | $26,139 | $20,262 |
| 9/30/21 | $18,597 | $16,801 | $24,923 | $19,400 |
| 10/31/21 | $18,028 | $17,931 | $26,669 | $18,817 |
| 11/30/21 | $16,520 | $17,721 | $26,484 | $17,233 |
| 12/31/21 | $15,697 | $18,410 | $27,671 | $16,382 |
| 1/31/22 | $12,184 | $17,356 | $26,239 | $12,675 |
| 2/28/22 | $11,586 | $16,932 | $25,454 | $12,047 |
| 3/31/22 | $11,356 | $17,499 | $26,399 | $11,810 |
| 4/30/22 | $8,977 | $15,916 | $24,097 | $9,299 |
| 5/31/22 | $7,851 | $15,892 | $24,141 | $8,111 |
| 6/30/22 | $8,818 | $14,563 | $22,148 | $9,144 |
| 7/31/22 | $9,795 | $15,954 | $24,190 | $10,185 |
| 8/31/22 | $10,315 | $15,349 | $23,204 | $10,739 |
| 9/30/22 | $9,982 | $13,916 | $21,067 | $10,392 |
| 10/31/22 | $10,517 | $15,058 | $22,772 | $10,959 |
| 11/30/22 | $10,322 | $15,832 | $24,045 | $10,759 |
| 12/31/22 | $10,143 | $14,905 | $22,660 | $10,585 |
| 1/31/23 | $11,249 | $15,932 | $24,083 | $11,677 |
| 2/28/23 | $10,171 | $15,560 | $23,496 | $10,475 |
| 3/31/23 | $8,931 | $15,986 | $24,358 | $9,143 |
| 4/30/23 | $9,356 | $16,152 | $24,739 | $9,649 |
| 5/31/23 | $9,903 | $16,221 | $24,846 | $10,245 |
| 6/30/23 | $9,759 | $17,334 | $26,488 | $10,085 |
| 7/31/23 | $9,824 | $17,956 | $27,339 | $10,153 |
| 8/31/23 | $8,728 | $17,607 | $26,904 | $9,027 |
| 9/30/23 | $7,985 | $16,766 | $25,621 | $8,261 |
| 10/31/23 | $7,256 | $16,320 | $25,082 | $7,473 |
| 11/30/23 | $7,972 | $17,844 | $27,373 | $8,248 |
| 12/31/23 | $9,977 | $18,794 | $28,616 | $10,388 |
| 1/31/24 | $10,327 | $18,995 | $29,097 | $10,765 |
| 2/29/24 | $12,253 | $20,019 | $30,651 | $12,793 |
| 3/31/24 | $11,885 | $20,664 | $31,637 | $12,417 |
| 4/30/24 | $10,628 | $19,764 | $30,345 | $11,088 |
| 5/31/24 | $10,819 | $20,697 | $31,850 | $11,295 |
| 6/30/24 | $10,298 | $21,347 | $32,992 | $10,740 |
| 7/31/24 | $11,771 | $21,740 | $33,394 | $12,258 |
| 8/31/24 | $11,421 | $22,212 | $34,204 | $11,958 |
| 9/30/24 | $11,381 | $22,663 | $34,934 | $11,898 |
| 10/31/24 | $11,544 | $22,499 | $34,618 | $12,066 |
| ANNUAL AVERAGE TOTAL RETURNS | 1 Year | 5 Years | Since Inception 12/16/14 |
|---|
| Virtus LifeSci Biotech Clinical Trials ETF - NAV | 59.09 | 1.46 | 1.46 |
| FT Wilshire 5000 Index | 37.86 | 14.84 | 13.03 |
S&P 500® Index | 38.02 | 15.27 | 13.39 |
| LifeSci Biotechnology Clinical Trials Index | 61.46 | 1.86 | 1.92 |
Performance data quoted represents past performance. Past performance does not guarantee future results. Investment return and principal value will fluctuate so that shares, when redeemed, may be worth more or less than their original cost. The above table and graph do not reflect the deduction of taxes that a shareholder would pay on fund distributions or the redemption of shares. Current performance may be lower or higher than the performance data quoted. Please visit virtus.com for performance data current to the most recent month end. Average annual total return is the annual compound return for the indicated period and reflects the change in share price and the reinvestment of all dividends and capital gains.
Virtus LifeSci Biotech Clinical Trials ETF | 2
KEY FUND STATISTIC (as of October 31, 2024)
| Fund net assets | $11,320,824 |
| Total number of portfolio holdings | 121 |
| Total advisory fees paid | $84,796 |
| Portfolio turnover rate | 77% |
ASSET ALLOCATION Footnote Reference(1)
| Health Care | 93.60% |
| Money Market Fund | 6.40% |
| Footnote | Description |
Footnote(1) | Percentage of total investments as of October 31, 2024. |
Where can I find additional information about the Fund?
For more information about the Fund, including its prospectus, financial information, holdings, and proxy voting information, please contact us at 1-888-383-0553, or visit https://www.virtus.com/investor-resources/etf-documents.
Shareholders who have consented to receive a single annual or semi-annual shareholder report at a shared address may revoke this
consent or request additional copies by calling Virtus ETFs at 1-888-383-0553.
Virtus LifeSci Biotech Clinical Trials ETF | 3
Virtus LifeSci Biotech Products ETF
Annual Shareholder Report | October 31, 2024
This annual shareholder report contains important information about the Virtus LifeSci Biotech Products ETF ("Fund") for the period of November 1, 2023 to October 31, 2024.You can find additional information about the Fund at https://www.virtus.com/investor-resources/etf-documents.You can also request this information by contacting us at 1-888-383-0553.
What were the Fund costs for the period?
(Based on a hypothetical $10,000 investment)
| Fund | Costs of a $10,000 investment | Costs paid as a percentage of a $10,000 investment |
|---|
| Virtus LifeSci Biotech Products ETF | $93 | 0.79% |
Portfolio Manager Commentary by Virtus ETF Advisers LLC
For the fiscal year ended October 31, 2024, the Fund at NAV returned 35.53%. For the same period, the FT Wilshire 5000 Index and the S&P 500 Index, each a broad-based securities market index, returned 37.86% and 38.02%, respectively, and the Lifesci Biotechnology Products Index, which serves as the style-specific index, returned 37.44%.
What factors impacted Fund performance over the reporting period?
Excess growth and volatility exposures contributed a mild positive to the index returns relative to the Fund's broad-based securities market index, the FT Wilshire 5000 Index, for the 12-month period. Exposures in the smaller market capitalization companies enhanced the performance of the Fund relative to the FT Wilshire 5000 Index, which includes larger-capitalization companies and more diversified holdings. Underweight exposures to the medical equipment, device manufacturing, and software sectors detracted from relative performance. The Fund seeks to reduce concentration risk by maintaining equal exposure to all of its holdings. This strategy resulted in the Fund slightly underperforming the FT Wilshire 5000 Index for the fiscal year.
Issue selection, particularly in ADMA Biologics and TGTX Therapeutics, enhanced relative returns. In addition, Iovance Biotherapeutics and Tarsus Pharmaceuticals contributed to performance.
Owning a higher concentration of smaller-capitalization companies enhanced relative returns, as the FT Wilshire 5000 Index includes larger-capitalization companies and more diversified holdings.
Underweight exposures to the medical equipment, device manufacturing, and software sectors detracted from relative performance.
While holding a less diversified portfolio than the FT Wilshire 5000 Index, the Fund produced higher idiosyncratic returns over the 12-month period that may not be able to be reproduced going forward.
Virtus LifeSci Biotech Products ETF | 1
The preceding information is the opinion of the investment adviser and/or sub-adviser, as appropriate, through the end of the period stated. Any such opinions are subject to change at any time based upon market or other conditions and should not be relied upon as investment advice. Past performance is no guarantee of future results, and there is no guarantee that market forecasts will be realized.
How has the Fund historically performed?
The following graph and table compare the initial and subsequent account values over the life of the Fund. It assumes a $10,000 initial investment from inception in an appropriate broad-based securities market indexes and a style-specific index for the same period. The Fund has changed its broad-based index to the FT Wilshire 5000 Index, which includes large, mid, small and micro- capitalization companies.
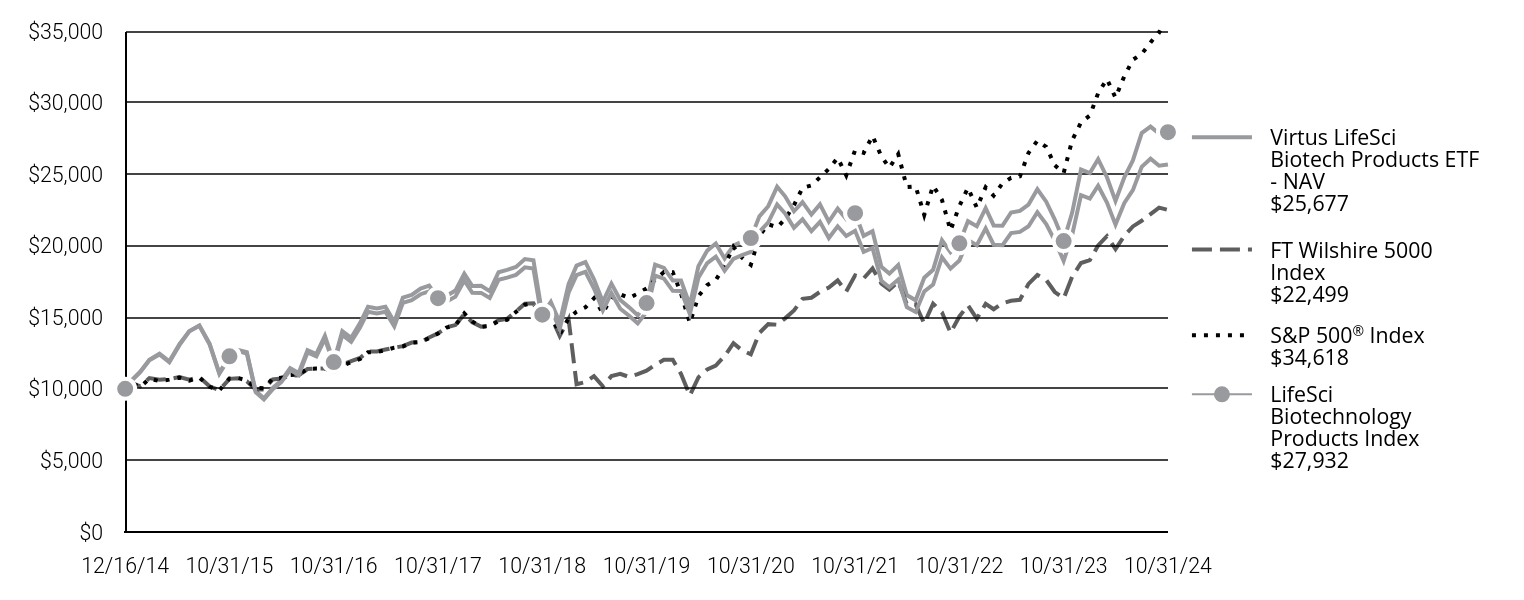
| Virtus LifeSci Biotech Products ETF - NAV $25,677 | FT Wilshire 5000 Index $22,499 | S&P 500® Index $34,618 | LifeSci Biotechnology Products Index $27,932 |
|---|
| 12/16/14 | $10,000 | $10,000 | $10,000 | $10,000 |
| 12/31/14 | $10,466 | $10,462 | $10,444 | $10,487 |
| 1/31/15 | $11,163 | $10,172 | $10,131 | $11,193 |
| 2/28/15 | $11,989 | $10,752 | $10,713 | $12,029 |
| 3/31/15 | $12,402 | $10,630 | $10,544 | $12,461 |
| 4/30/15 | $11,865 | $10,688 | $10,645 | $11,929 |
| 5/31/15 | $13,049 | $10,826 | $10,782 | $13,131 |
| 6/30/15 | $14,019 | $10,636 | $10,573 | $14,022 |
| 7/31/15 | $14,407 | $10,824 | $10,794 | $14,421 |
| 8/31/15 | $13,122 | $10,181 | $10,143 | $13,170 |
| 9/30/15 | $11,055 | $9,904 | $9,892 | $11,116 |
| 10/31/15 | $12,199 | $10,697 | $10,727 | $12,275 |
| 11/30/15 | $12,638 | $10,747 | $10,759 | $12,723 |
| 12/31/15 | $12,472 | $10,535 | $10,589 | $12,569 |
| 1/31/16 | $9,765 | $9,960 | $10,063 | $9,845 |
| 2/29/16 | $9,265 | $9,955 | $10,050 | $9,347 |
| 3/31/16 | $9,974 | $10,658 | $10,732 | $10,068 |
| 4/30/16 | $10,467 | $10,727 | $10,773 | $10,574 |
| 5/31/16 | $11,312 | $10,922 | $10,967 | $11,443 |
| 6/30/16 | $10,967 | $10,956 | $10,995 | $11,106 |
| 7/31/16 | $12,538 | $11,386 | $11,400 | $12,707 |
| 8/31/16 | $12,272 | $11,413 | $11,416 | $12,438 |
| 9/30/16 | $13,497 | $11,425 | $11,419 | $13,697 |
| 10/31/16 | $11,715 | $11,192 | $11,210 | $11,872 |
| 11/30/16 | $13,760 | $11,702 | $11,626 | $14,037 |
| 12/31/16 | $13,282 | $11,943 | $11,855 | $13,561 |
| 1/31/17 | $14,291 | $12,156 | $12,080 | $14,598 |
| 2/28/17 | $15,392 | $12,609 | $12,560 | $15,729 |
| 3/31/17 | $15,273 | $12,615 | $12,574 | $15,613 |
| 4/30/17 | $15,390 | $12,747 | $12,704 | $15,737 |
| 5/31/17 | $14,358 | $12,875 | $12,882 | $14,666 |
| 6/30/17 | $16,012 | $12,987 | $12,963 | $16,369 |
| 7/31/17 | $16,198 | $13,234 | $13,229 | $16,569 |
| 8/31/17 | $16,611 | $13,266 | $13,270 | $17,003 |
| 9/30/17 | $16,810 | $13,586 | $13,544 | $17,217 |
| 10/31/17 | $15,942 | $13,879 | $13,860 | $16,333 |
| 11/30/17 | $16,095 | $14,301 | $14,285 | $16,500 |
| 12/31/17 | $16,441 | $14,455 | $14,444 | $16,865 |
| 1/31/18 | $17,573 | $15,214 | $15,270 | $18,047 |
| 2/28/18 | $16,716 | $14,653 | $14,708 | $17,183 |
| 3/31/18 | $16,704 | $14,345 | $14,334 | $17,194 |
| 4/30/18 | $16,345 | $14,402 | $14,389 | $16,829 |
| 5/31/18 | $17,617 | $14,798 | $14,735 | $18,146 |
| 6/30/18 | $17,772 | $14,894 | $14,826 | $18,308 |
| 7/31/18 | $17,962 | $15,411 | $15,378 | $18,513 |
| 8/31/18 | $18,488 | $15,952 | $15,879 | $19,072 |
| 9/30/18 | $18,399 | $15,978 | $15,969 | $18,990 |
| 10/31/18 | $14,748 | $14,812 | $14,878 | $15,183 |
| 11/30/18 | $15,594 | $15,098 | $15,181 | $16,079 |
| 12/31/18 | $14,173 | $13,694 | $13,810 | $14,647 |
| 1/31/19 | $16,714 | $14,878 | $14,917 | $17,316 |
| 2/28/19 | $17,943 | $10,323 | $15,396 | $18,606 |
| 3/31/19 | $18,174 | $10,473 | $15,695 | $18,857 |
| 4/30/19 | $17,005 | $10,893 | $16,331 | $17,651 |
| 5/31/19 | $15,488 | $10,182 | $15,293 | $16,085 |
| 6/30/19 | $16,688 | $10,892 | $16,371 | $17,345 |
| 7/31/19 | $15,595 | $11,054 | $16,606 | $16,204 |
| 8/31/19 | $15,105 | $10,828 | $16,343 | $15,695 |
| 9/30/19 | $14,576 | $11,025 | $16,649 | $15,143 |
| 10/31/19 | $15,370 | $11,266 | $17,009 | $15,991 |
| 11/30/19 | $17,906 | $11,684 | $17,627 | $18,674 |
| 12/31/19 | $17,699 | $12,026 | $18,159 | $18,454 |
| 1/31/20 | $16,849 | $12,027 | $18,152 | $17,563 |
| 2/29/20 | $16,843 | $11,041 | $16,657 | $17,567 |
| 3/31/20 | $15,214 | $9,537 | $14,600 | $15,858 |
| 4/30/20 | $17,765 | $10,802 | $16,472 | $18,563 |
| 5/31/20 | $18,790 | $11,364 | $17,256 | $19,658 |
| 6/30/20 | $19,243 | $11,631 | $17,599 | $20,155 |
| 7/31/20 | $18,248 | $12,289 | $18,592 | $19,113 |
| 8/31/20 | $19,086 | $13,187 | $19,928 | $20,015 |
| 9/30/20 | $19,338 | $12,694 | $19,171 | $20,292 |
| 10/31/20 | $19,562 | $12,414 | $18,661 | $20,539 |
| 11/30/20 | $20,975 | $13,908 | $20,704 | $22,053 |
| 12/31/20 | $21,627 | $14,531 | $21,500 | $22,761 |
| 1/31/21 | $22,881 | $14,483 | $21,283 | $24,116 |
| 2/28/21 | $22,248 | $14,925 | $21,869 | $23,452 |
| 3/31/21 | $21,256 | $15,473 | $22,827 | $22,404 |
| 4/30/21 | $21,841 | $16,290 | $24,045 | $23,044 |
| 5/31/21 | $21,016 | $16,366 | $24,213 | $22,176 |
| 6/30/21 | $21,664 | $16,777 | $24,779 | $22,888 |
| 7/31/21 | $20,534 | $17,077 | $25,367 | $21,685 |
| 8/31/21 | $21,357 | $17,580 | $26,139 | $22,588 |
| 9/30/21 | $20,678 | $16,801 | $24,923 | $21,867 |
| 10/31/21 | $21,041 | $17,931 | $26,669 | $22,274 |
| 11/30/21 | $19,570 | $17,721 | $26,484 | $20,688 |
| 12/31/21 | $19,846 | $18,410 | $27,671 | $21,009 |
| 1/31/22 | $17,550 | $17,356 | $26,239 | $18,527 |
| 2/28/22 | $17,101 | $16,932 | $25,454 | $18,051 |
| 3/31/22 | $17,640 | $17,499 | $26,399 | $18,649 |
| 4/30/22 | $15,709 | $15,916 | $24,097 | $16,552 |
| 5/31/22 | $15,367 | $15,892 | $24,141 | $16,191 |
| 6/30/22 | $16,799 | $14,563 | $22,148 | $17,766 |
| 7/31/22 | $17,280 | $15,954 | $24,190 | $18,317 |
| 8/31/22 | $19,189 | $15,349 | $23,204 | $20,382 |
| 9/30/22 | $18,400 | $13,916 | $21,067 | $19,548 |
| 10/31/22 | $18,962 | $15,058 | $22,772 | $20,166 |
| 11/30/22 | $20,391 | $15,832 | $24,045 | $21,715 |
| 12/31/22 | $20,038 | $14,905 | $22,660 | $21,356 |
| 1/31/23 | $21,207 | $15,932 | $24,083 | $22,631 |
| 2/28/23 | $20,071 | $15,560 | $23,496 | $21,418 |
| 3/31/23 | $20,039 | $15,986 | $24,358 | $21,398 |
| 4/30/23 | $20,879 | $16,152 | $24,739 | $22,318 |
| 5/31/23 | $20,966 | $16,221 | $24,846 | $22,427 |
| 6/30/23 | $21,360 | $17,334 | $26,488 | $22,876 |
| 7/31/23 | $22,338 | $17,956 | $27,339 | $23,946 |
| 8/31/23 | $21,518 | $17,607 | $26,904 | $23,076 |
| 9/30/23 | $20,351 | $16,766 | $25,621 | $21,829 |
| 10/31/23 | $18,945 | $16,320 | $25,082 | $20,323 |
| 11/30/23 | $20,773 | $17,844 | $27,373 | $22,313 |
| 12/31/23 | $23,533 | $18,794 | $28,616 | $25,320 |
| 1/31/24 | $23,298 | $18,995 | $29,097 | $25,079 |
| 2/29/24 | $24,188 | $20,019 | $30,651 | $26,045 |
| 3/31/24 | $23,015 | $20,664 | $31,637 | $24,785 |
| 4/30/24 | $21,470 | $19,764 | $30,345 | $23,123 |
| 5/31/24 | $22,985 | $20,697 | $31,850 | $24,783 |
| 6/30/24 | $23,881 | $21,347 | $32,992 | $25,954 |
| 7/31/24 | $25,510 | $21,740 | $33,394 | $27,870 |
| 8/31/24 | $26,079 | $22,212 | $34,204 | $28,322 |
| 9/30/24 | $25,586 | $22,663 | $34,934 | $27,834 |
| 10/31/24 | $25,677 | $22,499 | $34,618 | $27,932 |
| ANNUAL AVERAGE TOTAL RETURNS | 1 Year | 5 Years | Since Inception 12/16/14 |
|---|
| Virtus LifeSci Biotech Products ETF - NAV | 35.53 | 10.81 | 10.01 |
| FT Wilshire 5000 Index | 37.86 | 14.84 | 13.03 |
S&P 500® Index | 38.02 | 15.27 | 13.39 |
| LifeSci Biotechnology Products Index | 37.44 | 11.80 | 10.95 |
Performance data quoted represents past performance. Past performance does not guarantee future results. Investment return and principal value will fluctuate so that shares, when redeemed, may be worth more or less than their original cost. The above table and graph do not reflect the deduction of taxes that a shareholder would pay on fund distributions or the redemption of shares. Current performance may be lower or higher than the performance data quoted. Please visit virtus.com for performance data current to the most recent month end. Average annual total return is the annual compound return for the indicated period and reflects the change in share price and the reinvestment of all dividends and capital gains.
Virtus LifeSci Biotech Products ETF | 2
KEY FUND STATISTIC (as of October 31, 2024)
| Fund net assets | $22,138,886 |
| Total number of portfolio holdings | 65 |
| Total advisory fees paid | $153,294 |
| Portfolio turnover rate | 46% |
ASSET ALLOCATION Footnote Reference(1)
| Health Care | 98.50% |
| Money Market Fund | 1.50% |
| Footnote | Description |
Footnote(1) | Percentage of total investments as of October 31, 2024. |
Where can I find additional information about the Fund?
For more information about the Fund, including its prospectus, financial information, holdings, and proxy voting information, please contact us at 1-888-383-0553, or visit https://www.virtus.com/investor-resources/etf-documents.
Shareholders who have consented to receive a single annual or semi-annual shareholder report at a shared address may revoke this
consent or request additional copies by calling Virtus ETFs at 1-888-383-0553.
Virtus LifeSci Biotech Products ETF | 3
Virtus Newfleet Multi-Sector Bond ETF
Annual Shareholder Report | October 31, 2024
This annual shareholder report contains important information about the Virtus Newfleet Multi-Sector Bond ETF ("Fund") for the period of November 1, 2023 to October 31, 2024.You can find additional information about the Fund at https://www.virtus.com/investor-resources/etf-documents.You can also request this information by contacting us at 1-888-383-0553.
What were the Fund costs for the period?
(Based on a hypothetical $10,000 investment)
| Fund | Costs of a $10,000 investment | Costs paid as a percentage of a $10,000 investment |
|---|
| Virtus Newfleet Multi-Sector Bond ETF | $52 | 0.49% |
Portfolio Manager Commentary by Newfleet Asset Management
For the fiscal year ended October 31, 2024, the Fund at NAV returned 13.51%. For the same period, the Bloomberg U.S. Aggregate Bond Index, a broad-based securities market index, returned 10.55%.
What factors impacted Fund performance over the reporting period?
Sector allocation and issue selection contributed positively to Fund returns relative to the Bloomberg U.S. Aggregate Bond Index for the period ended October 31, 2024. The Fund’s underweight to U.S. Treasuries was a key contributor to the positive performance. Allocation to and issue selection within high yield corporate bonds was additive to performance. The Fund’s underweight to agency mortgage-backed securities versus the benchmark detracted from performance. In addition, the Fund’s yield curve exposure versus the benchmark detracted from performance.
The Fund’s underweight to U.S. Treasuries had a positive impact, as spread sectors had positive excess returns during the period.
Allocation to and selection within high yield corporate bonds was additive to performance. Stable fundamentals, strong technicals, and attractive yields contributed to the positive performance.
Agency mortgage- backed securities (MBS)
The Fund’s underweight to MBS had a negative impact on performance as spreads tightened during the period. Fundamentals are strong as housing supply and demand provide a strong foundation. We prefer non-agency residential mortgage-backed securities (RMBS) for the additional carry they offer for ratings and duration.
Curve positioning relative to the Bloomberg U.S. Aggregate Bond Index was a detractor from performance during the period.
Virtus Newfleet Multi-Sector Bond ETF | 1
The preceding information is the opinion of the investment adviser and/or sub-adviser, as appropriate, through the end of the period stated. Any such opinions are subject to change at any time based upon market or other conditions and should not be relied upon as investment advice. Past performance is no guarantee of future results, and there is no guarantee that market forecasts will be realized.
How has the Fund historically performed?
The following graph and table compare the initial and subsequent account values over the life of the Fund. It assumes a $10,000 initial investment from inception in an appropriate broad-based securities market index for the same period.
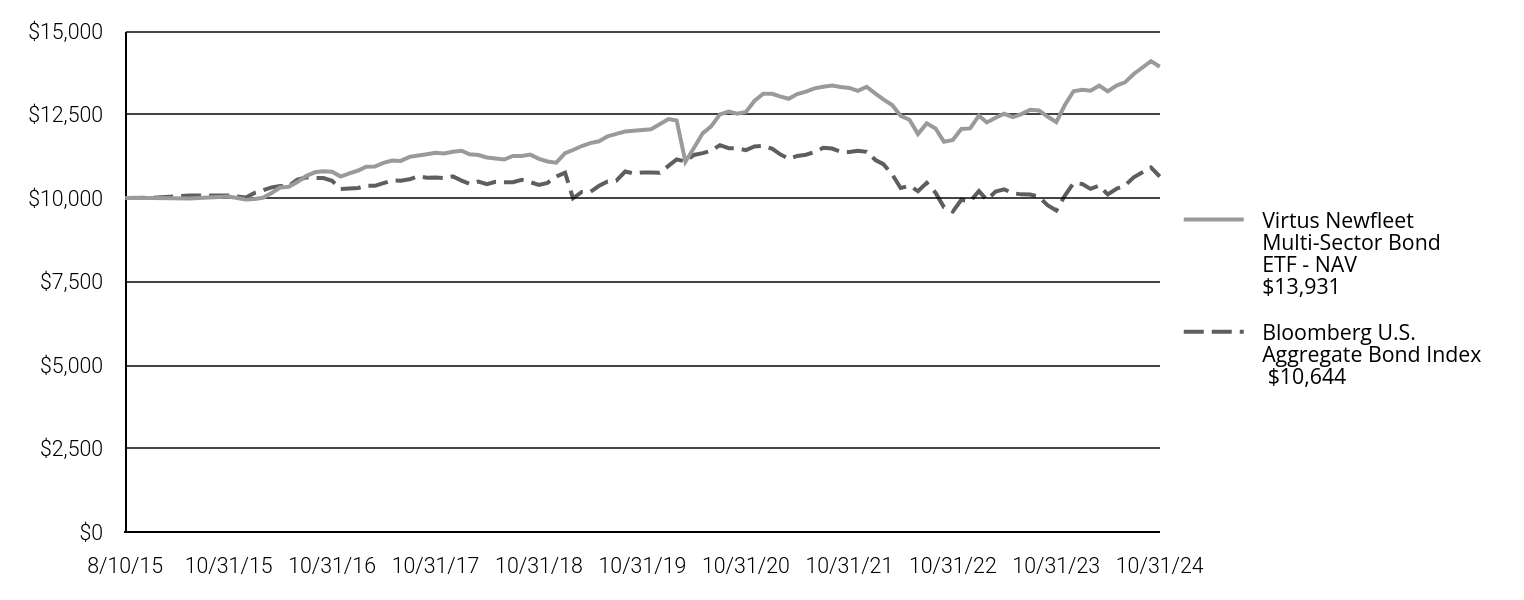
| Virtus Newfleet Multi-Sector Bond ETF - NAV $13,931 | Bloomberg U.S. Aggregate Bond Index $10,644 |
|---|
| 8/10/15 | $10,000 | $10,000 |
| 8/31/15 | $10,000 | $10,005 |
| 9/30/15 | $9,984 | $10,073 |
| 10/31/15 | $10,047 | $10,075 |
| 11/30/15 | $9,999 | $10,048 |
| 12/31/15 | $9,958 | $10,016 |
| 1/31/16 | $9,968 | $10,154 |
| 2/29/16 | $10,007 | $10,226 |
| 3/31/16 | $10,152 | $10,319 |
| 4/30/16 | $10,313 | $10,359 |
| 5/31/16 | $10,337 | $10,362 |
| 6/30/16 | $10,478 | $10,548 |
| 7/31/16 | $10,658 | $10,614 |
| 8/31/16 | $10,769 | $10,602 |
| 9/30/16 | $10,802 | $10,596 |
| 10/31/16 | $10,787 | $10,515 |
| 11/30/16 | $10,643 | $10,266 |
| 12/31/16 | $10,740 | $10,281 |
| 1/31/17 | $10,823 | $10,301 |
| 2/28/17 | $10,934 | $10,370 |
| 3/31/17 | $10,940 | $10,365 |
| 4/30/17 | $11,051 | $10,445 |
| 5/31/17 | $11,119 | $10,525 |
| 6/30/17 | $11,111 | $10,515 |
| 7/31/17 | $11,231 | $10,560 |
| 8/31/17 | $11,273 | $10,655 |
| 9/30/17 | $11,312 | $10,604 |
| 10/31/17 | $11,355 | $10,610 |
| 11/30/17 | $11,334 | $10,596 |
| 12/31/17 | $11,383 | $10,645 |
| 1/31/18 | $11,416 | $10,522 |
| 2/28/18 | $11,308 | $10,423 |
| 3/31/18 | $11,286 | $10,489 |
| 4/30/18 | $11,213 | $10,411 |
| 5/31/18 | $11,182 | $10,486 |
| 6/30/18 | $11,151 | $10,473 |
| 7/31/18 | $11,259 | $10,475 |
| 8/31/18 | $11,257 | $10,543 |
| 9/30/18 | $11,298 | $10,475 |
| 10/31/18 | $11,171 | $10,392 |
| 11/30/18 | $11,093 | $10,454 |
| 12/31/18 | $11,059 | $10,646 |
| 1/31/19 | $11,342 | $10,759 |
| 2/28/19 | $11,437 | $9,991 |
| 3/31/19 | $11,556 | $10,183 |
| 4/30/19 | $11,643 | $10,185 |
| 5/31/19 | $11,697 | $10,366 |
| 6/30/19 | $11,848 | $10,496 |
| 7/31/19 | $11,919 | $10,520 |
| 8/31/19 | $11,992 | $10,792 |
| 9/30/19 | $12,014 | $10,735 |
| 10/31/19 | $12,035 | $10,767 |
| 11/30/19 | $12,059 | $10,762 |
| 12/31/19 | $12,206 | $10,754 |
| 1/31/20 | $12,366 | $10,961 |
| 2/29/20 | $12,323 | $11,158 |
| 3/31/20 | $11,085 | $11,093 |
| 4/30/20 | $11,495 | $11,290 |
| 5/31/20 | $11,936 | $11,342 |
| 6/30/20 | $12,143 | $11,414 |
| 7/31/20 | $12,504 | $11,584 |
| 8/31/20 | $12,586 | $11,491 |
| 9/30/20 | $12,526 | $11,484 |
| 10/31/20 | $12,578 | $11,433 |
| 11/30/20 | $12,906 | $11,545 |
| 12/31/20 | $13,122 | $11,561 |
| 1/31/21 | $13,121 | $11,478 |
| 2/28/21 | $13,043 | $11,313 |
| 3/31/21 | $12,970 | $11,171 |
| 4/30/21 | $13,111 | $11,260 |
| 5/31/21 | $13,186 | $11,296 |
| 6/30/21 | $13,283 | $11,376 |
| 7/31/21 | $13,332 | $11,503 |
| 8/31/21 | $13,369 | $11,481 |
| 9/30/21 | $13,326 | $11,382 |
| 10/31/21 | $13,295 | $11,379 |
| 11/30/21 | $13,206 | $11,412 |
| 12/31/21 | $13,330 | $11,383 |
| 1/31/22 | $13,124 | $11,138 |
| 2/28/22 | $12,951 | $11,013 |
| 3/31/22 | $12,785 | $10,708 |
| 4/30/22 | $12,460 | $10,301 |
| 5/31/22 | $12,344 | $10,368 |
| 6/30/22 | $11,917 | $10,205 |
| 7/31/22 | $12,234 | $10,454 |
| 8/31/22 | $12,084 | $10,159 |
| 9/30/22 | $11,681 | $9,720 |
| 10/31/22 | $11,737 | $9,594 |
| 11/30/22 | $12,066 | $9,947 |
| 12/31/22 | $12,083 | $9,902 |
| 1/31/23 | $12,466 | $10,207 |
| 2/28/23 | $12,263 | $9,943 |
| 3/31/23 | $12,403 | $10,195 |
| 4/30/23 | $12,522 | $10,257 |
| 5/31/23 | $12,424 | $10,145 |
| 6/30/23 | $12,511 | $10,109 |
| 7/31/23 | $12,642 | $10,102 |
| 8/31/23 | $12,623 | $10,038 |
| 9/30/23 | $12,440 | $9,783 |
| 10/31/23 | $12,273 | $9,628 |
| 11/30/23 | $12,776 | $10,064 |
| 12/31/23 | $13,197 | $10,450 |
| 1/31/24 | $13,238 | $10,421 |
| 2/29/24 | $13,214 | $10,274 |
| 3/31/24 | $13,362 | $10,368 |
| 4/30/24 | $13,190 | $10,107 |
| 5/31/24 | $13,368 | $10,278 |
| 6/30/24 | $13,462 | $10,375 |
| 7/31/24 | $13,712 | $10,618 |
| 8/31/24 | $13,907 | $10,770 |
| 9/30/24 | $14,097 | $10,914 |
| 10/31/24 | $13,931 | $10,644 |
| ANNUAL AVERAGE TOTAL RETURNS | 1 Year | 5 Years | Since Inception 8/10/15 |
|---|
| Virtus Newfleet Multi-Sector Bond ETF - NAV | 13.51 | 2.97 | 3.66 |
| Bloomberg U.S. Aggregate Bond Index | 10.55 | -0.23 | 1.48 |
Performance data quoted represents past performance. Past performance does not guarantee future results. Investment return and principal value will fluctuate so that shares, when redeemed, may be worth more or less than their original cost. The above table and graph do not reflect the deduction of taxes that a shareholder would pay on fund distributions or the redemption of shares. Current performance may be lower or higher than the performance data quoted. Please visit virtus.com for performance data current to the most recent month end. Average annual total return is the annual compound return for the indicated period and reflects the change in share price and the reinvestment of all dividends and capital gains.
Virtus Newfleet Multi-Sector Bond ETF | 2
KEY FUND STATISTIC (as of October 31, 2024)
| Fund net assets | $191,287,377 |
| Total number of portfolio holdings | 803 |
| Total advisory fees paid | $218,118 |
| Portfolio turnover rate | 92% |
ASSET ALLOCATION Footnote Reference(1)
| Corporate Bond | 26.88% |
| Foreign Bond | 19.64% |
| Term Loan | 12.58% |
| Asset Backed Security | 11.04% |
| Residential Mortgage Backed Security | 9.46% |
| U.S. Government Securities | 5.77% |
| Mortgage Backed Security | 5.57% |
| Commercial Mortgage Backed Security | 4.13% |
| Money Market Fund | 2.95% |
| Exchange Traded Fund | 1.98% |
| Common Stock | 0.00% |
| Footnote | Description |
Footnote(1) | Percentage of total investments as of October 31, 2024. |
Where can I find additional information about the Fund?
For more information about the Fund, including its prospectus, financial information, holdings, and proxy voting information, please contact us at 1-888-383-0553, or visit https://www.virtus.com/investor-resources/etf-documents.
Shareholders who have consented to receive a single annual or semi-annual shareholder report at a shared address may revoke this
consent or request additional copies by calling Virtus ETFs at 1-888-383-0553.
Virtus Newfleet Multi-Sector Bond ETF | 3
Virtus Private Credit Strategy ETF
Annual Shareholder Report | October 31, 2024
This annual shareholder report contains important information about the Virtus Private Credit Strategy ETF ("Fund") for the period of November 1, 2023 to October 31, 2024.You can find additional information about the Fund at https://www.virtus.com/investor-resources/etf-documents.You can also request this information by contacting us at 1-888-383-0553.
What were the Fund costs for the period?
(Based on a hypothetical $10,000 investment)
| Fund | Costs of a $10,000 investment | Costs paid as a percentage of a $10,000 investment |
|---|
| Virtus Private Credit Strategy ETF | $82 | 0.75% |
Portfolio Manager Commentary by Virtus ETF Advisers LLC
For the fiscal year ended October 31, 2024, the Fund at NAV returned 19.85%. For the same period, the Bloomberg U.S. Aggregate Bond Index, a broad-based securities market index, returned 10.55%, and the Indxx Private Credit Index, which serves as the style-specific index, returned 20.83%.
What factors impacted Fund performance over the reporting period?
Sector exposure decisions contributed positively to Fund returns relative to the Bloomberg U.S. Aggregate Bond Index, for the 12-month period. Overweight exposure in the asset management industry contributed the most to relative performance, as it is also necessary to meet the Fund’s investment objectives. Underweight exposures to the semiconductors, software, technology hardware, internet media & services, and biopharmaceuticals industries detracted from relative performance. Shorter duration credit allocations and specific Fund weightings aided performance. On a relative weighting measure, the Fund’s components are weighted based on dividend yields while seeking to reduce concentration risk.
Asset management/ Collateralized loan obligations (CLOs)
Overweight exposures to these sectors benefited from performance in the short term, as they are more sensitive to the overall economy, including regulatory changes.
Overweight exposure to the U.S. detracted somewhat from Fund returns.
Shorter duration credit allocations and underweight exposures to Treasury, securitized, and government-related securities relative to the Bloomberg U.S. Aggregate Bond Index enhanced performance.
Underweight exposures to the semiconductors, software, technology hardware, internet media & services and biopharmaceuticals industries detracted from relative performance.
Virtus Private Credit Strategy ETF | 1
The preceding information is the opinion of the investment adviser and/or sub-adviser, as appropriate, through the end of the period stated. Any such opinions are subject to change at any time based upon market or other conditions and should not be relied upon as investment advice. Past performance is no guarantee of future results, and there is no guarantee that market forecasts will be realized.
How has the Fund historically performed?
The following graph and table compare the initial and subsequent account values over the life of the Fund. It assumes a $10,000 initial investment from inception in an appropriate broad-based securities market index and style-specific index for the same period.
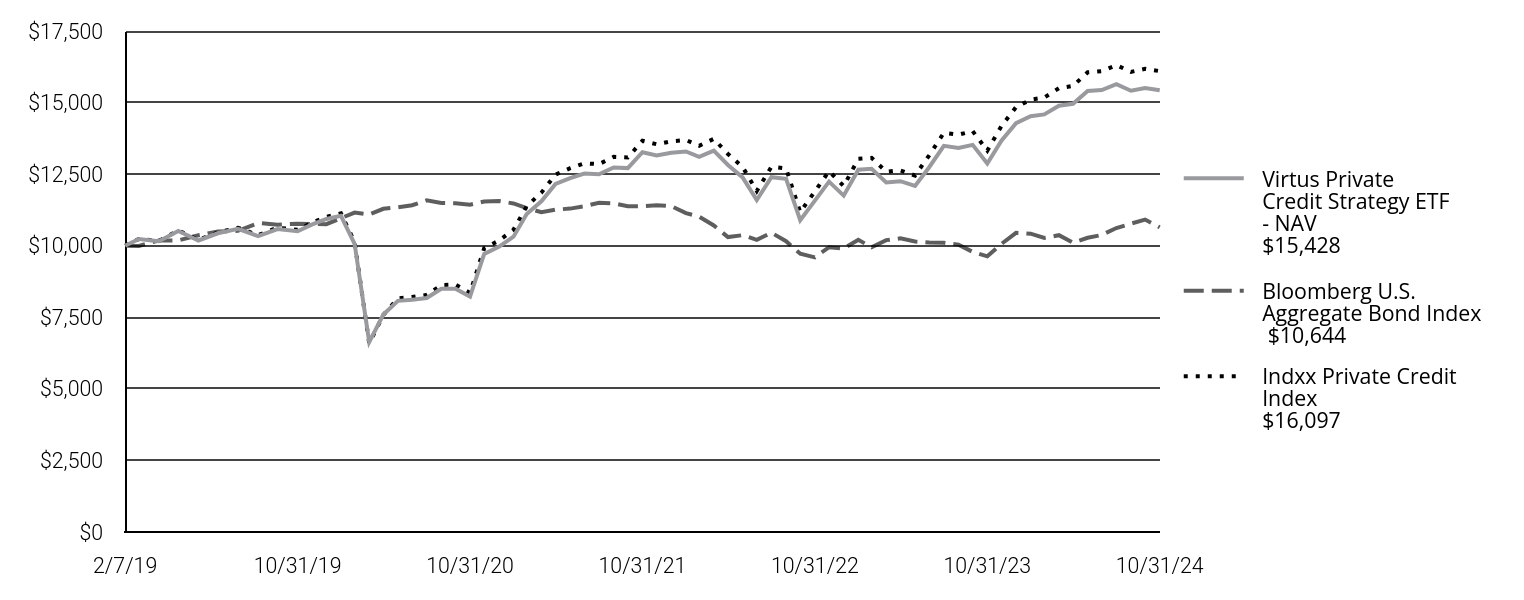
| Virtus Private Credit Strategy ETF - NAV $15,428 | Bloomberg U.S. Aggregate Bond Index $10,644 | Indxx Private Credit Index $16,097 |
|---|
| 2/7/19 | $10,000 | $10,000 | $10,000 |
| 2/28/19 | $10,232 | $9,991 | $10,237 |
| 3/31/19 | $10,156 | $10,183 | $10,163 |
| 4/30/19 | $10,514 | $10,185 | $10,534 |
| 5/31/19 | $10,183 | $10,366 | $10,203 |
| 6/30/19 | $10,434 | $10,496 | $10,464 |
| 7/31/19 | $10,588 | $10,520 | $10,628 |
| 8/31/19 | $10,334 | $10,792 | $10,367 |
| 9/30/19 | $10,583 | $10,735 | $10,629 |
| 10/31/19 | $10,503 | $10,767 | $10,554 |
| 11/30/19 | $10,737 | $10,762 | $10,800 |
| 12/31/19 | $10,935 | $10,754 | $11,011 |
| 1/31/20 | $11,046 | $10,961 | $11,129 |
| 2/29/20 | $10,067 | $11,158 | $10,124 |
| 3/31/20 | $6,634 | $11,093 | $6,588 |
| 4/30/20 | $7,596 | $11,290 | $7,583 |
| 5/31/20 | $8,074 | $11,342 | $8,161 |
| 6/30/20 | $8,116 | $11,414 | $8,210 |
| 7/31/20 | $8,173 | $11,584 | $8,281 |
| 8/31/20 | $8,497 | $11,491 | $8,627 |
| 9/30/20 | $8,499 | $11,484 | $8,642 |
| 10/31/20 | $8,223 | $11,433 | $8,353 |
| 11/30/20 | $9,715 | $11,545 | $9,916 |
| 12/31/20 | $9,959 | $11,561 | $10,178 |
| 1/31/21 | $10,316 | $11,478 | $10,555 |
| 2/28/21 | $11,107 | $11,313 | $11,382 |
| 3/31/21 | $11,551 | $11,171 | $11,853 |
| 4/30/21 | $12,155 | $11,260 | $12,485 |
| 5/31/21 | $12,363 | $11,296 | $12,707 |
| 6/30/21 | $12,522 | $11,376 | $12,878 |
| 7/31/21 | $12,494 | $11,503 | $12,849 |
| 8/31/21 | $12,734 | $11,481 | $13,103 |
| 9/30/21 | $12,711 | $11,382 | $13,081 |
| 10/31/21 | $13,265 | $11,379 | $13,665 |
| 11/30/21 | $13,151 | $11,412 | $13,545 |
| 12/31/21 | $13,249 | $11,383 | $13,647 |
| 1/31/22 | $13,293 | $11,138 | $13,693 |
| 2/28/22 | $13,102 | $11,013 | $13,493 |
| 3/31/22 | $13,322 | $10,708 | $13,732 |
| 4/30/22 | $12,822 | $10,301 | $13,205 |
| 5/31/22 | $12,386 | $10,368 | $12,751 |
| 6/30/22 | $11,595 | $10,205 | $11,911 |
| 7/31/22 | $12,392 | $10,454 | $12,758 |
| 8/31/22 | $12,336 | $10,159 | $12,700 |
| 9/30/22 | $10,890 | $9,720 | $11,171 |
| 10/31/22 | $11,574 | $9,594 | $11,900 |
| 11/30/22 | $12,237 | $9,947 | $12,604 |
| 12/31/22 | $11,749 | $9,902 | $12,082 |
| 1/31/23 | $12,656 | $10,207 | $13,035 |
| 2/28/23 | $12,686 | $9,943 | $13,069 |
| 3/31/23 | $12,210 | $10,195 | $12,584 |
| 4/30/23 | $12,253 | $10,257 | $12,631 |
| 5/31/23 | $12,089 | $10,145 | $12,452 |
| 6/30/23 | $12,742 | $10,109 | $13,157 |
| 7/31/23 | $13,487 | $10,102 | $13,943 |
| 8/31/23 | $13,414 | $10,038 | $13,878 |
| 9/30/23 | $13,523 | $9,783 | $14,002 |
| 10/31/23 | $12,873 | $9,628 | $13,323 |
| 11/30/23 | $13,669 | $10,064 | $14,178 |
| 12/31/23 | $14,281 | $10,450 | $14,842 |
| 1/31/24 | $14,521 | $10,421 | $15,101 |
| 2/29/24 | $14,586 | $10,274 | $15,175 |
| 3/31/24 | $14,889 | $10,368 | $15,501 |
| 4/30/24 | $14,959 | $10,107 | $15,580 |
| 5/31/24 | $15,406 | $10,278 | $16,059 |
| 6/30/24 | $15,439 | $10,375 | $16,096 |
| 7/31/24 | $15,640 | $10,618 | $16,309 |
| 8/31/24 | $15,413 | $10,770 | $16,073 |
| 9/30/24 | $15,506 | $10,914 | $16,179 |
| 10/31/24 | $15,428 | $10,644 | $16,097 |
| ANNUAL AVERAGE TOTAL RETURNS | 1 Year | 5 Years | Since Inception 2/7/19 |
|---|
| Virtus Private Credit Strategy ETF - NAV | 19.85 | 8.00 | 7.86 |
| Bloomberg U.S. Aggregate Bond Index | 10.55 | -0.23 | 1.09 |
| Indxx Private Credit Index | 20.83 | 8.81 | 8.66 |
Performance data quoted represents past performance. Past performance does not guarantee future results. Investment return and principal value will fluctuate so that shares, when redeemed, may be worth more or less than their original cost. The above table and graph do not reflect the deduction of taxes that a shareholder would pay on fund distributions or the redemption of shares. Current performance may be lower or higher than the performance data quoted. Please visit virtus.com for performance data current to the most recent month end. Average annual total return is the annual compound return for the indicated period and reflects the change in share price and the reinvestment of all dividends and capital gains.
Virtus Private Credit Strategy ETF | 2
KEY FUND STATISTIC (as of October 31, 2024)
| Fund net assets | $51,896,511 |
| Total number of portfolio holdings | 63 |
| Total advisory fees paid | $297,103 |
| Portfolio turnover rate | 29% |
ASSET ALLOCATION Footnote Reference(1)
| Financials | 58.00% |
| Closed-End Funds | 33.20% |
| Money Market Fund | 8.80% |
| Footnote | Description |
Footnote(1) | Percentage of total investments as of October 31, 2024. |
Where can I find additional information about the Fund?
For more information about the Fund, including its prospectus, financial information, holdings, and proxy voting information, please contact us at 1-888-383-0553, or visit https://www.virtus.com/investor-resources/etf-documents.
Shareholders who have consented to receive a single annual or semi-annual shareholder report at a shared address may revoke this
consent or request additional copies by calling Virtus ETFs at 1-888-383-0553.
Virtus Private Credit Strategy ETF | 3
Virtus Real Asset Income ETF
Annual Shareholder Report | October 31, 2024
This annual shareholder report contains important information about the Virtus Real Asset Income ETF ("Fund") for the period of November 1, 2023 to October 31, 2024.You can find additional information about the Fund at https://www.virtus.com/investor-resources/etf-documents.You can also request this information by contacting us at 1-888-383-0553.
What were the Fund costs for the period?
(Based on a hypothetical $10,000 investment)
| Fund | Costs of a $10,000 investment | Costs paid as a percentage of a $10,000 investment |
|---|
| Virtus Real Asset Income ETF | $60 | 0.55% |
Portfolio Manager Commentary by Virtus ETF Advisers LLC
For the fiscal year ended October 31, 2024, the Fund at NAV returned 16.89%. For the same period, the FT Wilshire 5000 Index, a broad-based securities market index, returned 37.86%, and the Indxx Real Asset Income Index, which serves as the style-specific index, returned 18.14%.
What factors impacted Fund performance over the reporting period?
Exposure to certain sectors such as Oil and Gas as well as REITS contributed negatively to Fund returns relative to the Fund’s broad-based securities index, the FT Wilshire 5000 Index, for the 12-month period. Factors such as Quality and Dividend Yields enhanced the Fund’s relative returns. The Fund does seek to reduce concentration risk by maintaining equal exposure to all of its holding. This limits exposure to momentum stocks which led to some relative underperformance. The Fund did maintain exposure to utilities, materials and communication companies which elevated the Fund’s relative returns.
Sectors: Oil & Gas and REITS
Positions in New Fortress Energy Inc. and APA Corp. as well as Barry Corp. and Vale S.A. detracted from relative returns.
Factors: Momentum and Value
Underweight exposure to these factors was a headwind for the Fund’s relative return.
Overweight exposures to utilities, materials, and communications relative to the FT Wilshire 5000 Index enhanced performance.
Factors: Quality and dividend yield
Overweight in companies that exhibited quality factors and high dividend yields relative to the FT Wilshire 500 Index made a favorable impact on the Fund’s performance.
Virtus Real Asset Income ETF | 1
The preceding information is the opinion of the investment adviser and/or sub-adviser, as appropriate, through the end of the period stated. Any such opinions are subject to change at any time based upon market or other conditions and should not be relied upon as investment advice. Past performance is no guarantee of future results, and there is no guarantee that market forecasts will be realized.
How has the Fund historically performed?
The following graph and table compare the initial and subsequent account values over the life of the Fund. It assumes a $10,000 initial investment from inception in an appropriate broad-based securities market index and style-specific index for the same period.
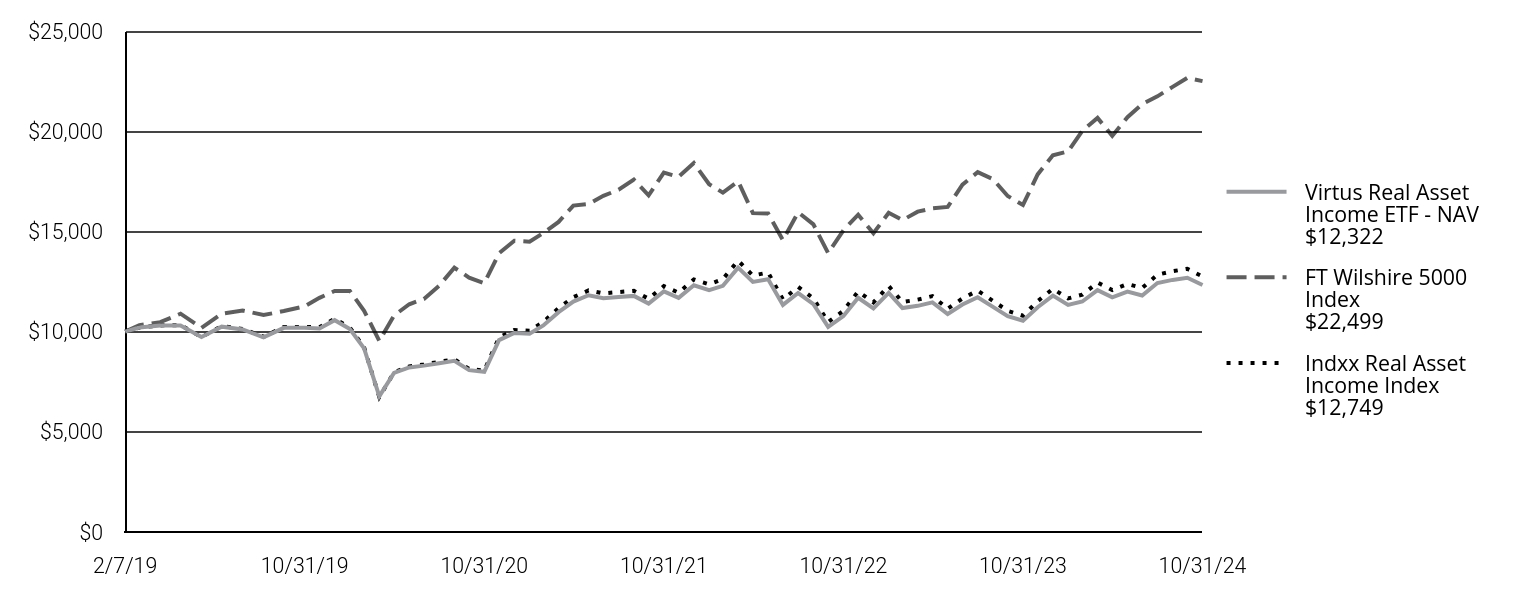
| Virtus Real Asset Income ETF - NAV $12,322 | FT Wilshire 5000 Index $22,499 | Indxx Real Asset Income Index $12,749 |
|---|
| 2/7/19 | $10,000 | $10,000 | $10,000 |
| 2/28/19 | $10,201 | $10,323 | $10,205 |
| 3/31/19 | $10,301 | $10,473 | $10,308 |
| 4/30/19 | $10,309 | $10,893 | $10,322 |
| 5/31/19 | $9,728 | $10,182 | $9,738 |
| 6/30/19 | $10,246 | $10,892 | $10,271 |
| 7/31/19 | $10,109 | $11,054 | $10,136 |
| 8/31/19 | $9,712 | $10,828 | $9,740 |
| 9/30/19 | $10,186 | $11,025 | $10,228 |
| 10/31/19 | $10,187 | $11,266 | $10,238 |
| 11/30/19 | $10,159 | $11,684 | $10,215 |
| 12/31/19 | $10,571 | $12,026 | $10,646 |
| 1/31/20 | $10,131 | $12,027 | $10,204 |
| 2/29/20 | $9,166 | $11,041 | $9,215 |
| 3/31/20 | $6,770 | $9,537 | $6,735 |
| 4/30/20 | $7,938 | $10,802 | $7,964 |
| 5/31/20 | $8,212 | $11,364 | $8,262 |
| 6/30/20 | $8,302 | $11,631 | $8,365 |
| 7/31/20 | $8,419 | $12,289 | $8,489 |
| 8/31/20 | $8,543 | $13,187 | $8,619 |
| 9/30/20 | $8,076 | $12,694 | $8,138 |
| 10/31/20 | $7,994 | $12,414 | $8,058 |
| 11/30/20 | $9,575 | $13,908 | $9,705 |
| 12/31/20 | $9,930 | $14,531 | $10,076 |
| 1/31/21 | $9,893 | $14,483 | $10,045 |
| 2/28/21 | $10,305 | $14,925 | $10,478 |
| 3/31/21 | $10,972 | $15,473 | $11,176 |
| 4/30/21 | $11,497 | $16,290 | $11,716 |
| 5/31/21 | $11,813 | $16,366 | $12,053 |
| 6/30/21 | $11,667 | $16,777 | $11,905 |
| 7/31/21 | $11,729 | $17,077 | $11,974 |
| 8/31/21 | $11,782 | $17,580 | $12,034 |
| 9/30/21 | $11,398 | $16,801 | $11,641 |
| 10/31/21 | $12,004 | $17,931 | $12,271 |
| 11/30/21 | $11,682 | $17,721 | $11,943 |
| 12/31/21 | $12,314 | $18,410 | $12,600 |
| 1/31/22 | $12,070 | $17,356 | $12,361 |
| 2/28/22 | $12,284 | $16,932 | $12,623 |
| 3/31/22 | $13,192 | $17,499 | $13,541 |
| 4/30/22 | $12,477 | $15,916 | $12,796 |
| 5/31/22 | $12,615 | $15,892 | $12,948 |
| 6/30/22 | $11,331 | $14,563 | $11,608 |
| 7/31/22 | $11,925 | $15,954 | $12,232 |
| 8/31/22 | $11,374 | $15,349 | $11,659 |
| 9/30/22 | $10,237 | $13,916 | $10,478 |
| 10/31/22 | $10,773 | $15,058 | $11,040 |
| 11/30/22 | $11,687 | $15,832 | $12,003 |
| 12/31/22 | $11,161 | $14,905 | $11,457 |
| 1/31/23 | $11,931 | $15,932 | $12,278 |
| 2/28/23 | $11,173 | $15,560 | $11,474 |
| 3/31/23 | $11,286 | $15,986 | $11,595 |
| 4/30/23 | $11,460 | $16,152 | $11,772 |
| 5/31/23 | $10,877 | $16,221 | $11,143 |
| 6/30/23 | $11,349 | $17,334 | $11,654 |
| 7/31/23 | $11,714 | $17,956 | $12,048 |
| 8/31/23 | $11,236 | $17,607 | $11,533 |
| 9/30/23 | $10,772 | $16,766 | $11,038 |
| 10/31/23 | $10,541 | $16,320 | $10,792 |
| 11/30/23 | $11,219 | $17,844 | $11,518 |
| 12/31/23 | $11,797 | $18,794 | $12,138 |
| 1/31/24 | $11,331 | $18,995 | $11,657 |
| 2/29/24 | $11,501 | $20,019 | $11,842 |
| 3/31/24 | $12,066 | $20,664 | $12,448 |
| 4/30/24 | $11,712 | $19,764 | $12,072 |
| 5/31/24 | $11,993 | $20,697 | $12,376 |
| 6/30/24 | $11,803 | $21,347 | $12,178 |
| 7/31/24 | $12,422 | $21,740 | $12,839 |
| 8/31/24 | $12,580 | $22,212 | $13,013 |
| 9/30/24 | $12,685 | $22,663 | $13,133 |
| 10/31/24 | $12,322 | $22,499 | $12,749 |
| ANNUAL AVERAGE TOTAL RETURNS | 1 Year | 5 Years | Since Inception 2/7/19 |
|---|
| Virtus Real Asset Income ETF - NAV | 16.89 | 3.88 | 3.71 |
| FT Wilshire 5000 Index | 37.86 | 14.84 | 15.19 |
| Indxx Real Asset Income Index | 18.14 | 4.48 | 4.33 |
Performance data quoted represents past performance. Past performance does not guarantee future results. Investment return and principal value will fluctuate so that shares, when redeemed, may be worth more or less than their original cost. The above table and graph do not reflect the deduction of taxes that a shareholder would pay on fund distributions or the redemption of shares. Current performance may be lower or higher than the performance data quoted. Please visit virtus.com for performance data current to the most recent month end. Average annual total return is the annual compound return for the indicated period and reflects the change in share price and the reinvestment of all dividends and capital gains.
Virtus Real Asset Income ETF | 2
KEY FUND STATISTIC (as of October 31, 2024)
| Fund net assets | $15,530,790 |
| Total number of portfolio holdings | 91 |
| Total advisory fees paid | $93,166 |
| Portfolio turnover rate | 67% |
ASSET ALLOCATION Footnote Reference(1)
| Energy | 33.50% |
| Real Estate | 32.40% |
| Utilities | 15.50% |
| Materials | 9.50% |
| Communication Services | 5.70% |
| Money Market Fund | 2.10% |
| Consumer Staples | 1.30% |
| Footnote | Description |
Footnote(1) | Percentage of total investments as of October 31, 2024. |
Where can I find additional information about the Fund?
For more information about the Fund, including its prospectus, financial information, holdings, and proxy voting information, please contact us at 1-888-383-0553, or visit https://www.virtus.com/investor-resources/etf-documents.
Shareholders who have consented to receive a single annual or semi-annual shareholder report at a shared address may revoke this
consent or request additional copies by calling Virtus ETFs at 1-888-383-0553.
Virtus Real Asset Income ETF | 3
Virtus WMC International Dividend ETF
VWID / Cboe BZX Exchange, Inc.
Annual Shareholder Report | October 31, 2024
This annual shareholder report contains important information about the Virtus WMC International Dividend ETF ("Fund") for the period of November 1, 2023 to October 31, 2024.You can find additional information about the Fund at https://www.virtus.com/investor-resources/etf-documents.You can also request this information by contacting us at 1-888-383-0553.
What were the Fund costs for the period?
(Based on a hypothetical $10,000 investment)
| Fund | Costs of a $10,000 investment | Costs paid as a percentage of a $10,000 investment |
|---|
| Virtus WMC International Dividend ETF | $54 | 0.49% |
Portfolio Manager Commentary by Wellington Management Company LLP
For the fiscal year ended October 31, 2024, the Fund at NAV returned 19.23%. For the same period, the MSCI ACWI ex USA Index, a broad-based securities market index, returned 24.33%, and the MSCI World ex USA Value Index and the MSCI World Ex USA High Dividend Yield Index, each a style-specific index, returned 23.93% and 21.80%, respectively.
What factors impacted Fund performance over the reporting period?
The Fund seeks income by investing in equity securities that will generate above market yield through a well-diversified portfolio. The Fund’s European exposures contributed most to absolute yield and was supplemented by yield from exposures in other regions, notably Canada. Sector allocation, a fallout of our risk-based construction process as we look to provide above market yield over time through a broadly diversified portfolio, was the primary driver of relative underperformance. Our underweight exposure to the information technology sector and our overweight exposure to the energy sector detracted from relative performance while our overweight exposure to the financials sector contributed to relative performance. Security selection also detracted, driven by not owning Taiwan Semiconductor (information technology) and our overweight positions in Aker BP (energy) and TotalEnergies (energy). Our overweight positions in Manulife (financials), Intesa Sanpaolo (financials) and SITC International (industrials) contributed to relative performance. From a regional perspective, our exposure in the Middle East detracted, while our exposure in Canada contributed to relative performance.
Our underweight exposure to information technology stocks detracted from relative performance. This positioning is a natural byproduct of the portfolio’s income focus as technology names tend to be lower yielding relative to other areas of the market.
Exposure to the Middle East names detracted from relative performance, driven by challenged security selection in the region.
An overweight exposure to financials contributed. Strong security selection, particularly in Manulife and Intesa Sanpaolo, also contributed to relative performance.
Our overweight exposure to dividend paying stocks contributed to relative performance as investors favored these names over other areas of the market.
Virtus WMC International Dividend ETF | 1
The preceding information is the opinion of the investment adviser and/or sub-adviser, as appropriate, through the end of the period stated. Any such opinions are subject to change at any time based upon market or other conditions and should not be relied upon as investment advice. Past performance is no guarantee of future results, and there is no guarantee that market forecasts will be realized.
How has the Fund historically performed?
The following graph and table compare the initial and subsequent account values over the life of the Fund. It assumes a $10,000 initial investment from inception in an appropriate broad-based securities market index and style-specific indexes for the same period. The Fund has changed its style-specific index from the MSCI World ex USA High Dividend Yield Index to the MSCI World ex USA Value Index, which employs an index methodology that more closely aligns with the investment process used in managing the Fund’s portfolio.
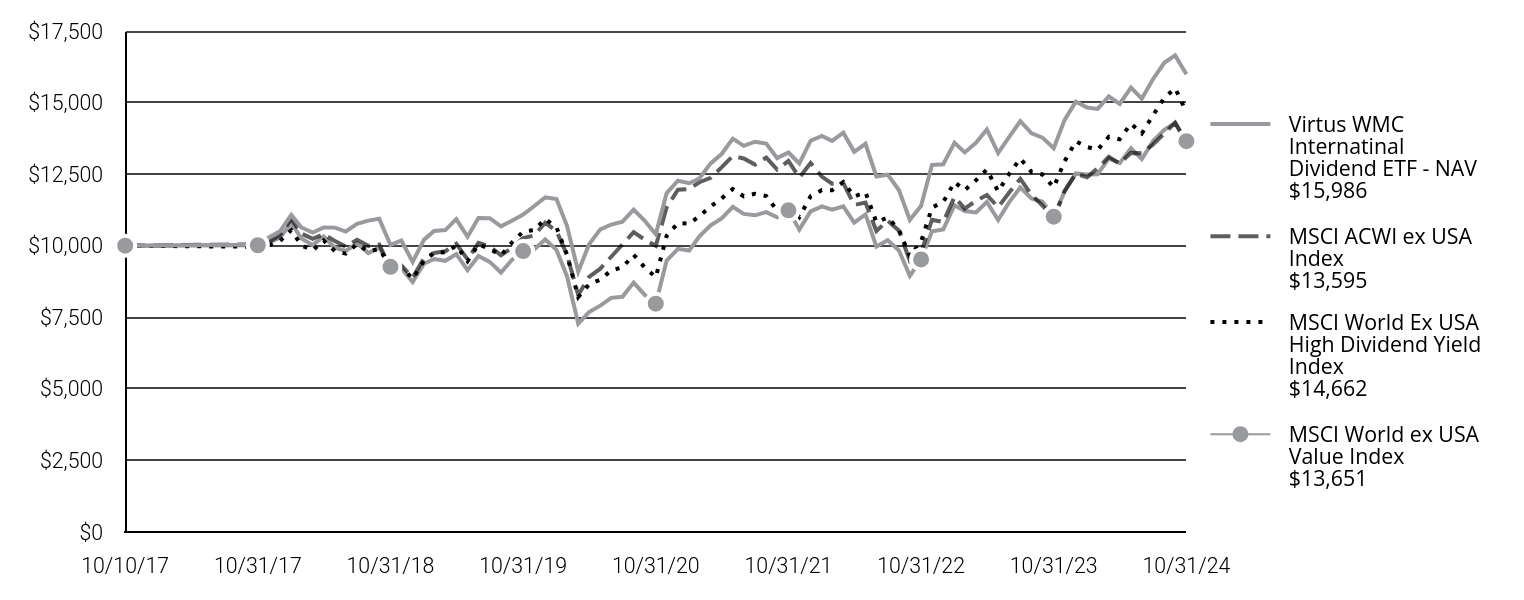
| Virtus WMC Internatinal Dividend ETF - NAV $15,986 | MSCI ACWI ex USA Index $13,595 | MSCI World Ex USA High Dividend Yield Index $14,662 | MSCI World ex USA Value Index $13,651 |
|---|
| 10/10/17 | $10,000 | $10,000 | $10,000 | $10,000 |
| 10/31/17 | $10,038 | $10,053 | $9,963 | $10,017 |
| 11/30/17 | $10,289 | $10,135 | $10,010 | $10,108 |
| 12/31/17 | $10,503 | $10,362 | $10,167 | $10,280 |
| 1/31/18 | $11,080 | $10,939 | $10,543 | $10,796 |
| 2/28/18 | $10,637 | $10,423 | $10,012 | $10,250 |
| 3/31/18 | $10,457 | $10,239 | $9,840 | $10,021 |
| 4/30/18 | $10,638 | $10,402 | $10,185 | $10,322 |
| 5/31/18 | $10,632 | $10,162 | $9,813 | $9,928 |
| 6/30/18 | $10,496 | $9,971 | $9,724 | $9,815 |
| 7/31/18 | $10,765 | $10,210 | $10,054 | $10,088 |
| 8/31/18 | $10,878 | $9,996 | $9,802 | $9,744 |
| 9/30/18 | $10,943 | $10,042 | $9,886 | $9,928 |
| 10/31/18 | $10,027 | $9,225 | $9,271 | $9,261 |
| 11/30/18 | $10,181 | $9,312 | $9,277 | $9,215 |
| 12/31/18 | $9,431 | $8,891 | $8,841 | $8,732 |
| 1/31/19 | $10,204 | $9,562 | $9,471 | $9,370 |
| 2/28/19 | $10,513 | $9,749 | $9,746 | $9,535 |
| 3/31/19 | $10,545 | $9,807 | $9,770 | $9,473 |
| 4/30/19 | $10,928 | $10,066 | $10,003 | $9,706 |
| 5/31/19 | $10,316 | $9,526 | $9,460 | $9,145 |
| 6/30/19 | $10,965 | $10,100 | $10,045 | $9,639 |
| 7/31/19 | $10,962 | $9,978 | $9,894 | $9,435 |
| 8/31/19 | $10,675 | $9,669 | $9,667 | $9,063 |
| 9/30/19 | $10,875 | $9,918 | $10,106 | $9,500 |
| 10/31/19 | $11,090 | $10,264 | $10,496 | $9,812 |
| 11/30/19 | $11,379 | $10,355 | $10,541 | $9,864 |
| 12/31/19 | $11,688 | $10,803 | $10,938 | $10,219 |
| 1/31/20 | $11,629 | $10,513 | $10,642 | $9,854 |
| 2/29/20 | $10,695 | $9,682 | $9,684 | $8,935 |
| 3/31/20 | $9,091 | $8,280 | $8,207 | $7,280 |
| 4/30/20 | $10,053 | $8,908 | $8,649 | $7,683 |
| 5/31/20 | $10,571 | $9,199 | $8,814 | $7,907 |
| 6/30/20 | $10,740 | $9,615 | $9,138 | $8,179 |
| 7/31/20 | $10,840 | $10,043 | $9,243 | $8,217 |
| 8/31/20 | $11,257 | $10,473 | $9,683 | $8,712 |
| 9/30/20 | $10,881 | $10,216 | $9,248 | $8,289 |
| 10/31/20 | $10,403 | $9,996 | $8,899 | $7,976 |
| 11/30/20 | $11,840 | $11,341 | $10,348 | $9,483 |
| 12/31/20 | $12,269 | $11,954 | $10,793 | $9,890 |
| 1/31/21 | $12,184 | $11,980 | $10,767 | $9,832 |
| 2/28/21 | $12,350 | $12,217 | $11,034 | $10,325 |
| 3/31/21 | $12,875 | $12,372 | $11,375 | $10,713 |
| 4/30/21 | $13,203 | $12,736 | $11,650 | $10,951 |
| 5/31/21 | $13,740 | $13,134 | $11,981 | $11,360 |
| 6/30/21 | $13,489 | $13,049 | $11,727 | $11,111 |
| 7/31/21 | $13,632 | $12,834 | $11,815 | $11,062 |
| 8/31/21 | $13,570 | $13,078 | $11,733 | $11,172 |
| 9/30/21 | $13,059 | $12,659 | $11,227 | $10,992 |
| 10/31/21 | $13,255 | $12,961 | $11,474 | $11,236 |
| 11/30/21 | $12,872 | $12,378 | $11,003 | $10,562 |
| 12/31/21 | $13,668 | $12,889 | $11,725 | $11,201 |
| 1/31/22 | $13,835 | $12,414 | $11,942 | $11,373 |
| 2/28/22 | $13,664 | $12,168 | $11,940 | $11,256 |
| 3/31/22 | $13,948 | $12,188 | $12,227 | $11,375 |
| 4/30/22 | $13,279 | $11,423 | $11,721 | $10,805 |
| 5/31/22 | $13,561 | $11,505 | $11,868 | $11,092 |
| 6/30/22 | $12,418 | $10,515 | $10,821 | $9,969 |
| 7/31/22 | $12,482 | $10,875 | $10,987 | $10,192 |
| 8/31/22 | $11,945 | $10,525 | $10,559 | $9,833 |
| 9/30/22 | $10,902 | $9,473 | $9,629 | $8,949 |
| 10/31/22 | $11,395 | $9,756 | $10,144 | $9,520 |
| 11/30/22 | $12,822 | $10,908 | $11,336 | $10,503 |
| 12/31/22 | $12,846 | $10,826 | $11,525 | $10,569 |
| 1/31/23 | $13,599 | $11,705 | $12,223 | $11,413 |
| 2/28/23 | $13,259 | $11,294 | $11,938 | $11,214 |
| 3/31/23 | $13,594 | $11,570 | $12,286 | $11,164 |
| 4/30/23 | $14,059 | $11,771 | $12,663 | $11,529 |
| 5/31/23 | $13,236 | $11,343 | $11,896 | $10,896 |
| 6/30/23 | $13,793 | $11,852 | $12,504 | $11,513 |
| 7/31/23 | $14,350 | $12,334 | $13,046 | $12,030 |
| 8/31/23 | $13,924 | $11,777 | $12,571 | $11,650 |
| 9/30/23 | $13,775 | $11,405 | $12,490 | $11,535 |
| 10/31/23 | $13,408 | $10,934 | $12,037 | $11,015 |
| 11/30/23 | $14,396 | $11,918 | $12,955 | $11,899 |
| 12/31/23 | $15,030 | $12,517 | $13,647 | $12,523 |
| 1/31/24 | $14,828 | $12,393 | $13,449 | $12,484 |
| 2/29/24 | $14,779 | $12,707 | $13,349 | $12,496 |
| 3/31/24 | $15,212 | $13,104 | $13,805 | $13,051 |
| 4/30/24 | $14,952 | $12,868 | $13,720 | $12,885 |
| 5/31/24 | $15,525 | $13,242 | $14,263 | $13,405 |
| 6/30/24 | $15,133 | $13,229 | $13,921 | $13,028 |
| 7/31/24 | $15,820 | $13,536 | $14,558 | $13,656 |
| 8/31/24 | $16,391 | $13,921 | $15,167 | $14,048 |
| 9/30/24 | $16,646 | $14,296 | $15,503 | $14,291 |
| 10/31/24 | $15,986 | $13,595 | $14,662 | $13,651 |
| ANNUAL AVERAGE TOTAL RETURNS | 1 Year | 5 Years | Since Inception 10/10/17 |
|---|
| Virtus WMC International Dividend ETF - NAV | 19.23 | 7.59 | 6.87 |
| MSCI World Ex USA High Dividend Yield Index | 21.80 | 6.91 | 5.57 |
| MSCI ACWI ex USA Index | 24.33 | 5.78 | 4.44 |
| MSCI World ex USA Value Index | 23.93 | 6.83 | 4.51 |
Performance data quoted represents past performance. Past performance does not guarantee future results. Investment return and principal value will fluctuate so that shares, when redeemed, may be worth more or less than their original cost. The above table and graph do not reflect the deduction of taxes that a shareholder would pay on fund distributions or the redemption of shares. Current performance may be lower or higher than the performance data quoted. Please visit virtus.com for performance data current to the most recent month end. Average annual total return is the annual compound return for the indicated period and reflects the change in share price and the reinvestment of all dividends and capital gains.
Virtus WMC International Dividend ETF | 2
KEY FUND STATISTIC (as of October 31, 2024)
| Fund net assets | $12,486,333 |
| Total number of portfolio holdings | 144 |
| Total advisory fees paid | $48,186 |
| Portfolio turnover rate | 41% |
ASSET ALLOCATION Footnote Reference(1)
| Financials | 27.80% |
| Industrials | 13.70% |
| Energy | 9.50% |
| Consumer Discretionary | 8.70% |
| Consumer Staples | 7.70% |
| Communication Services | 7.40% |
| Health Care | 7.40% |
| Utilities | 6.20% |
| Materials | 4.70% |
| Information Technology | 4.60% |
| Real Estate | 2.30% |
| Footnote | Description |
Footnote(1) | Percentage of total investments as of October 31, 2024. |
Where can I find additional information about the Fund?
For more information about the Fund, including its prospectus, financial information, holdings, and proxy voting information, please contact us at 1-888-383-0553, or visit https://www.virtus.com/investor-resources/etf-documents.
Shareholders who have consented to receive a single annual or semi-annual shareholder report at a shared address may revoke this
consent or request additional copies by calling Virtus ETFs at 1-888-383-0553.
Virtus WMC International Dividend ETF | 3
Annual Shareholder Report | October 31, 2024
This annual shareholder report contains important information about the InfraCap MLP ETF ("Fund") for the period of November 1, 2023 to October 31, 2024.You can find additional information about the Fund at https://www.virtus.com/investor-resources/etf-documents.You can also request this information by contacting us at 1-888-383-0553.
What were the Fund costs for the period?
(Based on a hypothetical $10,000 investment)
| Fund | Costs of a $10,000 investment | Costs paid as a percentage of a $10,000 investment |
|---|
| InfraCap MLP ETF | $308 | 2.75% |
Portfolio Manager Commentary by Infrastructure Capital Advisors, LLC
For the fiscal year ended October 31, 2024, the Fund at NAV returned 24.40%. For the same period, the FT Wilshire 5000 Index and the
S&P 500® Index, each a broad-based securities market index, returned 37.86% and 38.02%, respectively, and the Alerian MLP Infrastructure Index, which serves as the style-specific index, returned 22.45%.
What factors impacted Fund performance over the reporting period?
Natural Gas and C-Corp exposure were factors that positively contributed to the Fund's relative outperformance to the Alerian MLP Infrastructure Index (“Benchmark”) for the 12-month period. The Fund's overweight exposure to select companies with regulated natural gas pipelines positively contributed to relative performance. Further, AMZA’s overweight exposure to C-Corps enhanced returns relative to the Benchmark. The Fund's underweight exposure to smaller size companies held in the Benchmark detracted from relative performance during the period. In addition, overweight exposure to the MLP refining sector detracted from relative performance. Overall, MLPs performed well during the period and benefited from forecasted increases in energy demands from Artificial Intelligence and data centers.
Overweight exposure, in companies such as Williams Cos (WMB), TC Energy (TRP), and Kinder Morgan (KMI), enhanced income and contributed to relative outperformance.
C-Corp exposure, in companies such as Targa Resources (TRGP) and Oneok Inc (OKE), contributed to outperformance.
Overweight exposures to the MLP refining sector relative to Benchmark detracted from performance.
Underweight exposure to small company issuers that performed well during the period due to strong MLP sector performance.
The preceding information is the opinion of the investment adviser and/or sub-adviser, as appropriate, through the end of the period stated. Any such opinions are subject to change at any time based upon market or other conditions and should not be relied upon as investment advice. Past performance is no guarantee of future results, and there is no guarantee that market forecasts will be realized.
How has the Fund historically performed?
The following graph and table compare the initial and subsequent account values at the end of each of the most recently completed 10 fiscal years of the Fund. It assumes a $10,000 initial investment at the beginning of the first fiscal year in an appropriate broad-based securities market indexes and a style-specific index for the same period. The Fund has changed its broad-based index to the FT Wilshire 5000 Index, which includes large, mid, small and micro-capitalization companies.
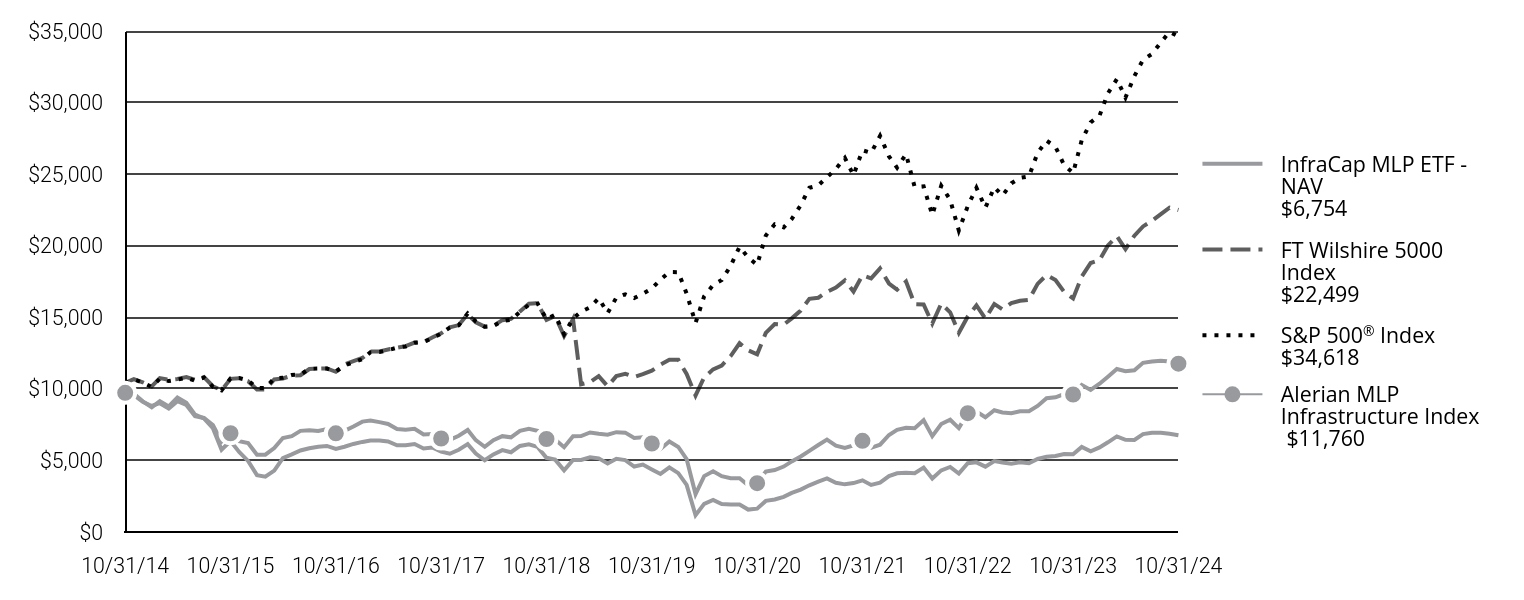
| InfraCap MLP ETF - NAV $6,754 | FT Wilshire 5000 Index $22,499 | S&P 500® Index $34,618 | Alerian MLP Infrastructure Index $11,760 |
|---|
| 10/31/14 | $9,683 | $10,415 | $10,381 | $9,724 |
| 11/30/14 | $9,668 | $10,676 | $10,660 | $9,553 |
| 12/31/14 | $9,125 | $10,462 | $10,444 | $9,099 |
| 1/31/15 | $8,716 | $10,172 | $10,131 | $8,806 |
| 2/28/15 | $9,148 | $10,752 | $10,713 | $8,998 |
| 3/31/15 | $8,773 | $10,630 | $10,544 | $8,631 |
| 4/30/15 | $9,392 | $10,688 | $10,645 | $9,141 |
| 5/31/15 | $9,031 | $10,826 | $10,782 | $8,878 |
| 6/30/15 | $8,203 | $10,636 | $10,573 | $8,097 |
| 7/31/15 | $7,938 | $10,824 | $10,794 | $7,966 |
| 8/31/15 | $7,247 | $10,181 | $10,143 | $7,472 |
| 9/30/15 | $5,745 | $9,904 | $9,892 | $6,315 |
| 10/31/15 | $6,357 | $10,697 | $10,727 | $6,899 |
| 11/30/15 | $5,589 | $10,747 | $10,759 | $6,350 |
| 12/31/15 | $4,965 | $10,535 | $10,589 | $6,211 |
| 1/31/16 | $3,972 | $9,960 | $10,063 | $5,398 |
| 2/29/16 | $3,866 | $9,955 | $10,050 | $5,399 |
| 3/31/16 | $4,290 | $10,658 | $10,732 | $5,860 |
| 4/30/16 | $5,158 | $10,727 | $10,773 | $6,566 |
| 5/31/16 | $5,422 | $10,922 | $10,967 | $6,698 |
| 6/30/16 | $5,696 | $10,956 | $10,995 | $7,065 |
| 7/31/16 | $5,848 | $11,386 | $11,400 | $7,103 |
| 8/31/16 | $5,958 | $11,413 | $11,416 | $7,058 |
| 9/30/16 | $6,012 | $11,425 | $11,419 | $7,196 |
| 10/31/16 | $5,811 | $11,192 | $11,210 | $6,892 |
| 11/30/16 | $5,959 | $11,702 | $11,626 | $7,073 |
| 12/31/16 | $6,152 | $11,943 | $11,855 | $7,375 |
| 1/31/17 | $6,293 | $12,156 | $12,080 | $7,711 |
| 2/28/17 | $6,398 | $12,609 | $12,560 | $7,786 |
| 3/31/17 | $6,386 | $12,615 | $12,574 | $7,678 |
| 4/30/17 | $6,325 | $12,747 | $12,704 | $7,549 |
| 5/31/17 | $6,052 | $12,875 | $12,882 | $7,191 |
| 6/30/17 | $6,058 | $12,987 | $12,963 | $7,148 |
| 7/31/17 | $6,144 | $13,234 | $13,229 | $7,213 |
| 8/31/17 | $5,835 | $13,266 | $13,270 | $6,808 |
| 9/30/17 | $5,900 | $13,586 | $13,544 | $6,846 |
| 10/31/17 | $5,611 | $13,879 | $13,860 | $6,530 |
| 11/30/17 | $5,468 | $14,301 | $14,285 | $6,436 |
| 12/31/17 | $5,748 | $14,455 | $14,444 | $6,725 |
| 1/31/18 | $6,138 | $15,214 | $15,270 | $7,125 |
| 2/28/18 | $5,484 | $14,653 | $14,708 | $6,415 |
| 3/31/18 | $5,014 | $14,345 | $14,334 | $5,951 |
| 4/30/18 | $5,418 | $14,402 | $14,389 | $6,419 |
| 5/31/18 | $5,720 | $14,798 | $14,735 | $6,696 |
| 6/30/18 | $5,572 | $14,894 | $14,826 | $6,613 |
| 7/31/18 | $6,009 | $15,411 | $15,378 | $7,062 |
| 8/31/18 | $6,127 | $15,952 | $15,879 | $7,216 |
| 9/30/18 | $5,942 | $15,978 | $15,969 | $7,075 |
| 10/31/18 | $5,182 | $14,812 | $14,878 | $6,495 |
| 11/30/18 | $5,058 | $15,098 | $15,181 | $6,461 |
| 12/31/18 | $4,305 | $13,694 | $13,810 | $5,922 |
| 1/31/19 | $5,028 | $14,878 | $14,917 | $6,690 |
| 2/28/19 | $5,031 | $10,323 | $15,396 | $6,700 |
| 3/31/19 | $5,221 | $10,473 | $15,695 | $6,951 |
| 4/30/19 | $5,146 | $10,893 | $16,331 | $6,865 |
| 5/31/19 | $4,791 | $10,182 | $15,293 | $6,798 |
| 6/30/19 | $5,114 | $10,892 | $16,371 | $6,973 |
| 7/31/19 | $5,022 | $11,054 | $16,606 | $6,942 |
| 8/31/19 | $4,575 | $10,828 | $16,343 | $6,570 |
| 9/30/19 | $4,712 | $11,025 | $16,649 | $6,620 |
| 10/31/19 | $4,372 | $11,266 | $17,009 | $6,182 |
| 11/30/19 | $4,055 | $11,684 | $17,627 | $5,800 |
| 12/31/19 | $4,518 | $12,026 | $18,159 | $6,318 |
| 1/31/20 | $4,114 | $12,027 | $18,152 | $5,944 |
| 2/29/20 | $3,294 | $11,041 | $16,657 | $5,099 |
| 3/31/20 | $1,175 | $9,537 | $14,600 | $2,648 |
| 4/30/20 | $1,970 | $10,802 | $16,472 | $3,907 |
| 5/31/20 | $2,238 | $11,364 | $17,256 | $4,245 |
| 6/30/20 | $1,950 | $11,631 | $17,599 | $3,898 |
| 7/31/20 | $1,914 | $12,289 | $18,592 | $3,756 |
| 8/31/20 | $1,919 | $13,187 | $19,928 | $3,760 |
| 9/30/20 | $1,566 | $12,694 | $19,171 | $3,259 |
| 10/31/20 | $1,632 | $12,414 | $18,661 | $3,410 |
| 11/30/20 | $2,173 | $13,908 | $20,704 | $4,223 |
| 12/31/20 | $2,269 | $14,531 | $21,500 | $4,330 |
| 1/31/21 | $2,457 | $14,483 | $21,283 | $4,571 |
| 2/28/21 | $2,732 | $14,925 | $21,869 | $4,930 |
| 3/31/21 | $2,961 | $15,473 | $22,827 | $5,276 |
| 4/30/21 | $3,264 | $16,290 | $24,045 | $5,670 |
| 5/31/21 | $3,521 | $16,366 | $24,213 | $6,076 |
| 6/30/21 | $3,748 | $16,777 | $24,779 | $6,455 |
| 7/31/21 | $3,442 | $17,077 | $25,367 | $6,029 |
| 8/31/21 | $3,329 | $17,580 | $26,139 | $5,872 |
| 9/30/21 | $3,416 | $16,801 | $24,923 | $6,050 |
| 10/31/21 | $3,612 | $17,931 | $26,669 | $6,372 |
| 11/30/21 | $3,286 | $17,721 | $26,484 | $5,884 |
| 12/31/21 | $3,453 | $18,410 | $27,671 | $6,102 |
| 1/31/22 | $3,909 | $17,356 | $26,239 | $6,780 |
| 2/28/22 | $4,100 | $16,932 | $25,454 | $7,139 |
| 3/31/22 | $4,137 | $17,499 | $26,399 | $7,277 |
| 4/30/22 | $4,112 | $15,916 | $24,097 | $7,250 |
| 5/31/22 | $4,499 | $15,892 | $24,141 | $7,811 |
| 6/30/22 | $3,738 | $14,563 | $22,148 | $6,698 |
| 7/31/22 | $4,304 | $15,954 | $24,190 | $7,542 |
| 8/31/22 | $4,541 | $15,349 | $23,204 | $7,845 |
| 9/30/22 | $4,087 | $13,916 | $21,067 | $7,258 |
| 10/31/22 | $4,808 | $15,058 | $22,772 | $8,303 |
| 11/30/22 | $4,864 | $15,832 | $24,045 | $8,410 |
| 12/31/22 | $4,566 | $14,905 | $22,660 | $8,017 |
| 1/31/23 | $4,953 | $15,932 | $24,083 | $8,504 |
| 2/28/23 | $4,859 | $15,560 | $23,496 | $8,350 |
| 3/31/23 | $4,776 | $15,986 | $24,358 | $8,291 |
| 4/30/23 | $4,864 | $16,152 | $24,739 | $8,431 |
| 5/31/23 | $4,805 | $16,221 | $24,846 | $8,431 |
| 6/30/23 | $5,101 | $17,334 | $26,488 | $8,807 |
| 7/31/23 | $5,258 | $17,956 | $27,339 | $9,342 |
| 8/31/23 | $5,309 | $17,607 | $26,904 | $9,411 |
| 9/30/23 | $5,446 | $16,766 | $25,621 | $9,634 |
| 10/31/23 | $5,429 | $16,320 | $25,082 | $9,604 |
| 11/30/23 | $5,939 | $17,844 | $27,373 | $10,275 |
| 12/31/23 | $5,638 | $18,794 | $28,616 | $9,922 |
| 1/31/24 | $5,908 | $18,995 | $29,097 | $10,356 |
| 2/29/24 | $6,266 | $20,019 | $30,651 | $10,853 |
| 3/31/24 | $6,678 | $20,664 | $31,637 | $11,385 |
| 4/30/24 | $6,444 | $19,764 | $30,345 | $11,234 |
| 5/31/24 | $6,433 | $20,697 | $31,850 | $11,296 |
| 6/30/24 | $6,838 | $21,347 | $32,992 | $11,822 |
| 7/31/24 | $6,934 | $21,740 | $33,394 | $11,909 |
| 8/31/24 | $6,932 | $22,212 | $34,204 | $11,963 |
| 9/30/24 | $6,868 | $22,663 | $34,934 | $11,909 |
| 10/31/24 | $6,754 | $22,499 | $34,618 | $11,760 |
| ANNUAL AVERAGE TOTAL RETURNS | 1 Year | 5 Years | 10 Years |
|---|
| InfraCap MLP ETF - NAV | 24.40 | 9.09 | -3.54 |
| FT Wilshire 5000 Index | 37.86 | 14.84 | 12.63 |
S&P 500® Index | 38.02 | 15.27 | 13.00 |
| Alerian MLP Infrastructure Index | 22.45 | 13.73 | 1.92 |
Performance data quoted represents past performance. Past performance does not guarantee future results. Investment return and principal value will fluctuate so that shares, when redeemed, may be worth more or less than their original cost. The above table and graph do not reflect the deduction of taxes that a shareholder would pay on fund distributions or the redemption of shares. Current performance may be lower or higher than the performance data quoted. Please visit virtus.com for performance data current to the most recent month end. Average annual total return is the annual compound return for the indicated period and reflects the change in share price and the reinvestment of all dividends and capital gains.
KEY FUND STATISTIC (as of October 31, 2024)
| Fund net assets | $377,544,101 |
| Total number of portfolio holdings | 31 |
| Total advisory fees paid | $3,561,116 |
| Portfolio turnover rate | 59% |
ASSET ALLOCATION Footnote Reference(1)
| Energy | 98.00% |
| Money Market fund | 1.80% |
| Utilities | 0.20% |
| Footnote | Description |
Footnote(1) | Percentage of total investments as of October 31, 2024. |
Where can I find additional information about the Fund?
For more information about the Fund, including its prospectus, financial information, holdings, and proxy voting information, please contact us at 1-888-383-0553, or visit https://www.virtus.com/investor-resources/etf-documents.
Shareholders who have consented to receive a single annual or semi-annual shareholder report at a shared address may revoke this
consent or request additional copies by calling Virtus ETFs at 1-888-383-0553.
Item 2. Code of Ethics.
| (a) | The registrant, as of the end of the period covered by this report, has adopted a code of ethics that applies to the registrant’s principal executive officer, principal financial officer, principal accounting officer or controller, or persons performing similar functions, regardless of whether these individuals are employed by the registrant or a third party (the “Code of Ethics”). |
| (c) | There have been no amendments, during the period covered by this report, to a provision of the Code of Ethics that applies to the registrant’s principal executive officer, principal financial officer, principal accounting officer or controller, or persons performing similar functions, regardless of whether these individuals are employed by the registrant or a third party, and that relates to any element of the code of ethics definition enumerated in Item 2(b) of Form N-CSR. |
| (d) | The registrant has not granted any waivers, including an implicit waiver, from a provision of the code of ethics that applies to the registrant’s principal executive officer, principal financial officer, principal accounting officer or controller, or persons performing similar functions, regardless of whether these individuals are employed by the registrant or a third party, that relates to one or more of the items set forth in Item 2(b) of Form N-CSR. |
| (f) | A copy of the Code of Ethics is filed as an Exhibit. |
Item 3. Audit Committee Financial Expert.
The registrant's board of trustees has determined that the registrant does not have an audit committee financial expert serving on its audit committee. At this time, the registrant's board of trustees believes that the collective experience provided by the members of the audit committee together offer the registrant adequate oversight for the registrant's level of financial complexity.
Item 4. Principal Accountant Fees and Services.
The aggregate fees billed for each of the last two fiscal years for professional services rendered by the principal accountant for the audit of the registrant's annual financial statements or for services that are normally provided by the accountant in connection with statutory and regulatory filings or engagements for those fiscal years were $227,321 for 2024 and $222,509 for 2023.
The aggregate fees billed in each of the last two fiscal years for assurance and related services rendered by the principal accountant to the registrant that are reasonably related to the performance of the audit of the registrant's financial statements and are not reported under paragraph (a) of this Item were $0 for 2024 and $0 for 2023.
The aggregate fees billed in each of the last two fiscal years for professional services rendered by the principal accountant to the registrant for tax compliance, tax advice, and tax planning were $208,817 for 2024 and $209,618 for 2023.
“Tax Fees” are those primarily associated with review of the Trust’s tax provision and qualification as a regulated investment company (RIC) in connection with audits of the Trust’s financial statement, review of year-end distributions by the Fund to avoid excise tax for the Trust, periodic discussion with management on tax issues affecting the Trust, and reviewing and signing the Fund’s federal income tax returns.
The aggregate fees billed in each of the last two fiscal years for products and services rendered by the principal accountant to the registrant, which include but are not limited to accounting consultations concerning financial accounting and reporting standards, other than the services reported in paragraphs (a) through (c) of this Item were $0 for 2024 and $0 for 2023.
| (e)(1) | The audit committee has not adopted pre-approval policies and procedures described in paragraph (c)(7) of Rule 2-01 of Regulation S-X. |
| (e)(2) | None of the services described in paragraph (b) through (d) of this Item were approved by the audit committee pursuant to paragraph (c)(7)(i)(C) of Rule 2-01 of Regulation S-X. |
| (f) | Less than 50% of hours expended on the principal accountant’s engagement to audit the registrant’s financial statements for the most recent fiscal year were attributed to work performed by persons other than the principal accountant’s full-time, permanent employees. |
| (g) | The aggregate non-audit fees billed by the registrant’s accountant for services rendered to the registrant, and rendered to the registrant’s investment adviser (not including any sub-adviser whose role is primarily portfolio management and is subcontracted with or overseen by another investment adviser), and any entity controlling, controlled by, or under common control with the adviser that provides ongoing services to the registrant for each of the last two fiscal years of the registrant were $252,136 for 2024 and $240,718 for 2023. |
Item 5. Audit Committee of Listed registrants.
| (a) | The registrant has a separately designated audit committee consisting of all the independent trustees of the registrant. The members of the audit committee are: James A. Simpson, Robert S. Tull, Jr., and Myles J. Edwards. |
Item 6. Investments.
| (a) | Please refer to Item 7. |
Item 7. Financial Statements and Financial Highlights for Open-End Management Investment Companies.
ANNUAL FINANCIALS
(FORM N-CSR Items 7-11)
ETFis Series Trust I
October 31, 2024
INFRACAP REIT PREFERRED ETF
VIRTUS INFRACAP U.S. PREFERRED STOCK ETF
VIRTUS LIFESCI BIOTECH CLINICAL TRIALS ETF
VIRTUS LIFESCI BIOTECH PRODUCTS ETF
VIRTUS NEWFLEET MULTI-SECTOR BOND ETF
VIRTUS PRIVATE CREDIT STRATEGY ETF
VIRTUS REAL ASSET INCOME ETF
VIRTUS WMC INTERNATIONAL DIVIDEND ETF
INFRACAP MLP ETF
Portfolio Composition (unaudited)
October 31, 2024
| | | |
Asset Allocation as of 10/31/2024 (based on net assets) |
| | | |
InfraCap REIT Preferred ETF | | | |
Real Estate | | 60.8 | % |
Financials | | 38.4 | % |
Money Market Fund | | 0.7 | % |
Other Assets in Excess of Liabilities | | 0.1 | % |
Total | | 100.0 | % |
| | | |
Virtus InfraCap U.S. Preferred Stock ETF |
Financials | | 64.2 | %* |
Real Estate | | 25.4 | %* |
Industrials | | 11.5 | % |
Utilities | | 8.9 | % |
Communication Services | | 7.4 | % |
Energy | | 4.3 | % |
Consumer Discretionary | | 0.9 | % |
Health Care | | 0.1 | % |
Money Market Fund | | 0.4 | % |
Liabilities in Excess of Other Assets | | (23.1 | )% |
Total | | 100.0 | % |
| | | |
Virtus LifeSci Biotech Clinical Trials ETF | | | |
Health Care | | 98.0 | % |
Money Market Fund | | 6.7 | % |
Liabilities in Excess of Other Assets | | (4.7 | )% |
Total | | 100.0 | % |
| | | |
Virtus LifeSci Biotech Products ETF | | | |
Health Care | | 99.2 | % |
Money Market Fund | | 1.5 | % |
Liabilities in Excess of Other Assets | | (0.7 | )% |
Total | | 100.0 | % |
*Amounts represent investments in particular sectors. No industry within these sectors represented more than 25% of the Fund’s total assets at the time of investment.
Portfolio Composition (unaudited) (continued)
October 31, 2024
| | | |
Virtus Newfleet Multi-Sector Bond ETF | | | |
Corporate Bonds | | 27.2 | % |
Foreign Bonds | | 19.9 | % |
Term Loans | | 12.7 | % |
Asset Backed Securities | | 11.2 | % |
Residential Mortgage Backed Securities | | 9.6 | % |
U.S. Government Securities | | 5.8 | % |
Mortgage Backed Securities | | 5.6 | % |
Commercial Mortgage Backed Securities | | 4.2 | % |
Money Market Fund | | 3.0 | % |
Exchange Traded Funds | | 2.0 | % |
Common Stocks | | 0.0 | %** |
Liabilities in Excess of Other Assets | | (1.2 | )% |
Total | | 100.0 | % |
| | | |
Virtus Private Credit Strategy ETF | | | |
Financials | | 57.8 | % |
Closed-End Funds | | 39.9 | % |
Money Market Fund | | 9.4 | % |
Liabilities in Excess of Other Assets | | (7.1 | )% |
Total | | 100.0 | % |
| | | |
Virtus Real Asset Income ETF | | | |
Energy | | 33.4 | % |
Real Estate | | 32.3 | % |
Utilities | | 15.5 | % |
Materials | | 9.5 | % |
Communication Services | | 5.6 | % |
Consumer Staples | | 1.2 | % |
Money Market Fund | | 2.1 | % |
Other Assets in Excess of Liabilities | | 0.4 | % |
Total | | 100.0 | % |
**Amount rounds to less than 0.05%.
Portfolio Composition (unaudited) (continued)
October 31, 2024
| | | |
Virtus WMC International Dividend ETF | | | |
Financials | | 27.4 | % |
Industrials | | 13.5 | % |
Energy | | 9.3 | % |
Consumer Discretionary | | 8.6 | % |
Consumer Staples | | 7.6 | % |
Health Care | | 7.3 | % |
Communication Services | | 7.3 | % |
Utilities | | 6.1 | % |
Information Technology | | 4.7 | % |
Materials | | 4.6 | % |
Real Estate | | 2.2 | % |
Other Assets in Excess of Liabilities | | 1.4 | % |
Total | | 100.0 | % |
| | | |
InfraCap MLP ETF | | | |
Energy | | 133.1 | % |
Utilities | | 0.2 | % |
Written Options | | 0.0 | %** |
Money Market Funds | | 2.4 | % |
Liabilities in Excess of Other Assets | | (35.7 | )% |
Total | | 100.0 | % |
**Amount rounds to less than 0.05%.
Schedule of Investments — InfraCap REIT Preferred ETF
October 31, 2024
The accompanying notes are an integral part of these financial statements.
4
| | | | | |
Security Description | | Shares | | Value | |
| | | | | |
PREFERRED STOCKS — 99.2% | | | | | |
| | | | | |
Financials — 38.4% | | | | | |
ACRES Commercial Realty Corp.,
Series C, 10.52% | | 18,532 | | $460,891
| |
AG Mortgage Investment Trust, Inc.,
Series B, 8.00% | | 26,743 | | 601,717 | |
AG Mortgage Investment Trust, Inc.,
Series C, 11.68% | | 10,662 | | 268,469 | |
AGNC Investment Corp., Series D, 9.25% | | 36,252 | | 909,563 | |
AGNC Investment Corp., Series E, 9.85% | | 61,564 | | 1,555,722 | |
AGNC Investment Corp., Series F, 6.13% | | 89,330 | | 2,210,917 | |
AGNC Investment Corp., Series G, 7.75% | | 10,600 | | 269,240 | |
Annaly Capital Management, Inc.,
Series F, 9.78% | | 62,650 | | 1,619,502 | |
Annaly Capital Management, Inc.,
Series G, 8.96% | | 66,835 | | 1,706,966 | |
Annaly Capital Management, Inc.,
Series I, 10.58% | | 67,183 | | 1,736,009 | |
Arbor Realty Trust, Inc., Series D, 6.38% | | 40,154 | | 794,648 | |
Arbor Realty Trust, Inc., Series E, 6.25% | | 21,431 | | 418,976 | |
Arbor Realty Trust, Inc., Series F, 6.25% | | 48,274 | | 998,789 | |
ARMOUR Residential REIT, Inc.,
Series C, 7.00% | | 26,175 | | 606,213 | |
Chimera Investment Corp., Series A, 8.00% | | 26,378 | | 632,808 | |
Chimera Investment Corp., Series B, 10.66% | | 23,222 | | 589,142 | |
Chimera Investment Corp., Series C, 7.75% | | 39,745 | | 908,571 | |
Chimera Investment Corp., Series D, 10.20% | | 31,199 | | 778,415 | |
DigitalBridge Group, Inc., Series H, 7.13% | | 78,059 | | 1,973,332 | |
DigitalBridge Group, Inc., Series I, 7.15% | | 124,534 | | 3,146,974 | |
DigitalBridge Group, Inc., Series J, 7.13% | | 111,002 | | 2,769,500 | |
Dynex Capital, Inc., Series C, 6.90% | | 16,616 | | 423,210 | |
Ellington Financial, Inc., 10.05% | | 9,079 | | 227,611 | |
Ellington Financial, Inc., Series C, 8.63% | | 573 | | 14,720 | |
Franklin BSP Realty Trust, Inc.,
Series E, 7.50% | | 39,867 | | 932,090 | |
Granite Point Mortgage Trust, Inc.,
Series A, 7.00% | | 30,485 | | 513,063 | |
Inpoint Commercial Real Estate Income, Inc., Series A, 6.75% | | 11,889 | | 259,775 | |
Invesco Mortgage Capital, Inc., Series B, 7.75% | | 17,614 | | 439,822 | |
Invesco Mortgage Capital, Inc., Series C, 7.50% | | 30,153 | | 731,210 | |
KKR Real Estate Finance Trust, Inc., Series A, 6.50% | | 51,483 | | 1,119,755 | |
MFA Financial, Inc., Series B, 7.50% | | 32,784 | | 744,197 | |
MFA Financial, Inc., Series C, 6.50% | | 42,963 | | 1,038,845 | |
| | | | | |
Security Description | | Shares | | Value | |
| | | | | |
PREFERRED STOCKS (continued) | | | | | |
| | | | | |
Financials (continued) | | | | | |
New York Mortgage Trust, Inc.,
Series D, 8.00% | | 24,377 | | $561,890
| |
New York Mortgage Trust, Inc.,
Series E, 7.88% | | 29,407 | | 733,117 | |
New York Mortgage Trust, Inc.,
Series F, 6.88% | | 21,872 | | 485,996 | |
PennyMac Mortgage Investment Trust,
Series A, 8.13% | | 17,748 | | 449,024 | |
PennyMac Mortgage Investment Trust,
Series B, 8.00% | | 30,109 | | 751,220 | |
PennyMac Mortgage Investment Trust,
Series C, 6.75% | | 39,422 | | 819,189 | |
Ready Capital Corp., 5.75% | | 2,952 | | 72,855 | |
Ready Capital Corp., Series E, 6.50% | | 17,748 | | 342,536 | |
Rithm Capital Corp., Series A, 11.18% | | 23,951 | | 609,553 | |
Rithm Capital Corp., Series B, 11.02% | | 45,019 | | 1,138,080 | |
Rithm Capital Corp., Series C, 6.38% | | 63,416 | | 1,541,009 | |
Rithm Capital Corp., Series D, 7.00% | | 72,546 | | 1,753,437 | |
TPG RE Finance Trust, Inc.,
Series C, 6.25% | | 31,843 | | 619,346 | |
Two Harbors Investment Corp.,
Series A, 8.13% | | 19,415 | | 480,910 | |
Two Harbors Investment Corp.,
Series B, 7.63% | | 43,606 | | 1,080,557 | |
Two Harbors Investment Corp.,
Series C, 7.25% | | 49,321 | | 1,213,790 | |
Total Financials | | | | 44,053,171 | |
Real Estate — 60.8% | | | | | |
Agree Realty Corp., Series A, 4.25% | | 64,713 | | 1,276,787 | |
American Homes 4 Rent, Series G, 5.88% | | 18,918 | | 468,410 | |
American Homes 4 Rent, Series H, 6.25% | | 42,401 | | 1,073,169 | |
Armada Hoffler Properties, Inc.,
Series A, 6.75% | | 43,438 | | 1,049,896 | |
Chatham Lodging Trust, Series A, 6.63% | | 16,616 | | 390,476 | |
City Office REIT, Inc., Series A, 6.63% | | 18,958 | | 331,765 | |
CTO Realty Growth, Inc., Series A, 6.38% | | 15,940 | | 389,892 | |
DiamondRock Hospitality Co., 8.25% | | 40,752 | | 1,057,514 | |
Digital Realty Trust, Inc., Series J, 5.25% | | 75,886 | | 1,800,016 | |
Digital Realty Trust, Inc., Series K, 5.85% | | 76,547 | | 1,919,799 | |
Digital Realty Trust, Inc., Series L, 5.20% | | 123,205 | | 2,892,853 | |
Diversified Healthcare Trust, 5.63% | | 155,638 | | 2,490,208 | |
Diversified Healthcare Trust, 6.25% | | 104,869 | | 1,793,260 | |
EPR Properties, Series G, 5.75% | | 56,930 | | 1,247,336 | |
Federal Realty Investment Trust,
Series C, 5.00% | | 56,784 | | 1,278,208 | |
| | | | | |
Schedule of Investments — InfraCap REIT Preferred ETF (continued)
October 31, 2024
The accompanying notes are an integral part of these financial statements.
5
| | | | | |
Security Description | | Shares | | Value | |
| | | | | |
PREFERRED STOCKS (continued) | | | | | |
| | | | | |
Real Estate (continued) | | | | | |
Gladstone Commercial Corp.,
Series E, 6.63% | | 25,063 | | $604,269
| |
Gladstone Commercial Corp.,
Series G, 6.00% | | 15,657 | | 346,020 | |
Gladstone Land Corp., Series B, 6.00% | | 46,569 | | 1,031,503 | |
Gladstone Land Corp., Series C, 6.00% | | 72,091 | | 1,549,956 | |
Global Medical REIT, Inc.,
Series A, 7.50% | | 9,816 | | 250,777 | |
Global Net Lease, Inc., Series A, 7.25% | | 72,971 | | 1,662,279 | |
Global Net Lease, Inc., Series B, 6.88% | | 43,173 | | 923,902 | |
Global Net Lease, Inc., Series D, 7.50% | | 78,436 | | 1,794,616 | |
Global Net Lease, Inc., Series E, 7.38% | | 36,587 | | 819,549 | |
Hudson Pacific Properties, Inc.,
Series C, 4.75% | | 176,315 | | 2,572,436 | |
Kimco Realty Corp., Series L, 5.13% | | 82,205 | | 1,876,740 | |
Kimco Realty Corp., Series M, 5.25% | | 96,757 | | 2,226,379 | |
National Storage Affiliates Trust,
Series A, 6.00% | | 78,736 | | 1,817,227 | |
Office Properties Income Trust, 6.38% | | 72,246 | | 857,560 | |
Pebblebrook Hotel Trust, Series E, 6.38% | | 7,732 | | 174,666 | |
Pebblebrook Hotel Trust, Series F, 6.30% | | 56,892 | | 1,326,721 | |
Pebblebrook Hotel Trust, Series G, 6.38% | | 84,560 | | 1,927,122 | |
Pebblebrook Hotel Trust, Series H, 5.70% | | 85,881 | | 1,777,737 | |
Public Storage, Series F, 5.15% | | 27,313 | | 665,071 | |
Public Storage, Series G, 5.05% | | 38,572 | | 930,357 | |
Public Storage, Series H, 5.60% | | 28,916 | | 723,478 | |
Public Storage, Series I, 4.88% | | 40,721 | | 928,439 | |
Public Storage, Series J, 4.70% | | 32,025 | | 704,550 | |
Public Storage, Series K, 4.75% | | 27,646 | | 611,806 | |
Public Storage, Series L, 4.63% | | 63,704 | | 1,366,451 | |
Public Storage, Series M, 4.13% | | 5,603 | | 110,267 | |
Public Storage, Series N, 3.88% | | 33,742 | | 616,804 | |
Public Storage, Series O, 3.90% | | 23,019 | | 421,248 | |
Public Storage, Series P, 4.00% | | 74,200 | | 1,387,540 | |
| | | | | |
Security Description | | Shares | | Value | |
| | | | | |
PREFERRED STOCKS (continued) | | | | | |
| | | | | |
Real Estate (continued) | | | | | |
Public Storage, Series Q, 3.95% | | 20,402 | | $380,293
| |
Public Storage, Series R, 4.00% | | 51,131 | | 964,331 | |
Public Storage, Series S, 4.10% | | 11,912 | | 234,071 | |
Regency Centers Corp., Series B, 5.88% | | 2,369 | | 57,875 | |
Saul Centers, Inc., Series E, 6.00% | | 28,628 | | 668,464 | |
SITE Centers Corp., Series A, 6.38% | | 66,309 | | 1,665,019 | |
SL Green Realty Corp., Series I, 6.50% | | 85,634 | | 2,044,084 | |
Summit Hotel Properties, Inc.,
Series E, 6.25% | | 30,939 | | 649,410 | |
Summit Hotel Properties, Inc.,
Series F, 5.88% | | 5,616 | | 118,217 | |
Sunstone Hotel Investors, Inc.,
Series H, 6.13% | | 18,753 | | 431,319 | |
Sunstone Hotel Investors, Inc.,
Series I, 5.70% | | 17,193 | | 373,432 | |
UMH Properties, Inc., Series D, 6.38% | | 97,074 | | 2,338,513 | |
Vornado Realty Trust, Series L, 5.40% | | 112,939 | | 2,116,477 | |
Vornado Realty Trust, Series M, 5.25% | | 120,418 | | 2,195,220 | |
Vornado Realty Trust, Series N, 5.25% | | 113,212 | | 2,080,837 | |
Vornado Realty Trust, Series O, 4.45% | | 112,069 | | 1,881,638 | |
Total Real Estate | | | | 69,664,259 | |
Total Preferred Stocks | | | | | |
(Cost $111,823,445) | | | | 113,717,430 | |
| | | | | |
MONEY MARKET FUNDS — 0.7% | | | | | |
Goldman Sachs Financial Square Government Fund, Institutional Shares, 4.78%(1) | | 400,880 | | 400,880 | |
RBC BlueBay U.S. Government Money Market Fund - Institutional Shares, 4.77%(1) | | 400,880 | | 400,880 | |
Total Money Market Funds | | | | | |
(Cost $801,760) | | | | 801,760 | |
| | | | | |
TOTAL INVESTMENTS — 99.9% | | | | | |
(Cost $112,625,205) | | | | 114,519,190 | |
Other Assets in Excess of
Liabilities — 0.1% | | | | 125,725 | |
Net Assets — 100.0% | | | | $114,644,915
| |
(1)The rate shown reflects the seven-day yield as of October 31, 2024.
The following table summarizes valuation of the Fund’s investments under the fair value hierarchy levels as of October 31, 2024.
| | | | | | | | |
| | Level 1 | | Level 2 | | Level 3 | | Total |
Asset Valuation Inputs | | | | | | | | |
Preferred Stocks | | $113,717,430
| | $ —
| | $—
| | $113,717,430
|
Money Market Funds | | 801,760 | | — | | — | | 801,760 |
Total | | $114,519,190
| | $—
| | $—
| | $114,519,190
|
Schedule of Investments — Virtus InfraCap U.S. Preferred Stock ETF
October 31, 2024
The accompanying notes are an integral part of these financial statements.
6
| | | | | |
Security Description | | Shares | | Value | |
| | | | | |
PREFERRED STOCKS — 121.2% | | | | | |
| | | | | |
Communication Services — 7.4% | | | | | |
AT&T, Inc., Series A, 5.00% | | 2,206 | | $47,870
| |
Liberty Broadband Corp., Series A, 7.00%(1) | | 88,524 | | 2,120,150 | |
Qwest Corp., 6.50%(1) | | 1,183,479 | | 18,971,168 | |
Qwest Corp., 6.75%(1) | | 905,796 | | 14,592,374 | |
Telephone and Data Systems, Inc., Series UU, 6.63%(1) | | 732,042 | | 15,065,424 | |
Telephone and Data Systems, Inc., Series VV, 6.00%(1) | | 1,561,136 | | 29,255,689 | |
United States Cellular Corp., 5.50%(1) | | 783,427 | | 17,634,636 | |
United States Cellular Corp., 6.25%(1) | | 170,817 | | 4,009,075 | |
Total Communication Services | | | | 101,696,386 | |
Consumer Discretionary — 0.9% | | | | | |
Ford Motor Co., 6.00%(1) | | | | | |
| | 508,564 | | 12,434,390 | |
| | | | | |
Energy — 4.3% | | | | | |
Brookfield Infrastructure Finance ULC,
5.00% (Canada)(1) | | 19,576 | | 379,579 | |
Energy Transfer LP, Series I, 9.25%(1) | | 3,290,311 | | 39,088,895 | |
GasLog Partners LP, Series A, 8.63%
(Greece)(1) | | 691,891 | | 17,899,151 | |
GasLog Partners LP, Series B, 10.69%
(Greece)(1) | | 68,671 | | 1,741,496 | |
Golar LNG Partners LP, Series A, 8.75%
(United Kingdom)(1) | | 47,750 | | 439,300 | |
Total Energy | | | | 59,548,421 | |
Financials — 64.2%† | | | | | |
Abacus Life, Inc., 9.88%(1) | | 148,558 | | 3,947,929 | |
ACRES Commercial Realty Corp., Series C, 10.52% | | 71,301 | | 1,773,256 | |
ACRES Commercial Realty Corp., Series D, 7.88% | | 40,918 | | 950,525 | |
Affiliated Managers Group, Inc., 4.20% | | 3,397 | | 59,447 | |
Affiliated Managers Group, Inc., 6.75%(1) | | 63,720 | | 1,636,967 | |
AG Mortgage Investment Trust, Inc., 9.50%(1) | | 265,138 | | 6,774,270 | |
AG Mortgage Investment Trust, Inc., Series A, 8.25% | | 400 | | 9,060 | |
AG Mortgage Investment Trust, Inc., Series B, 8.00%(1) | | 272,115 | | 6,122,587 | |
AG Mortgage Investment Trust, Inc., Series C, 11.68%(1) | | 420,199 | | 10,580,611 | |
AGNC Investment Corp., Series D, 9.25%(1) | | 11,013 | | 276,316 | |
AGNC Investment Corp., Series G, 7.75%(1) | | 44,935 | | 1,141,349 | |
American National Group, Inc., Series A, 5.95%(1) | | 99,249 | | 2,493,135 | |
American National Group, Inc., Series B, 6.63%(1) | | 12,175 | | 309,123 | |
Angel Oak Mortgage REIT, Inc., 9.50% | | 69,272 | | 1,732,493 | |
| | | | | |
Security Description | | Shares | | Value | |
| | | | | |
PREFERRED STOCKS (continued) | | | | | |
| | | | | |
Financials (continued) | | | | | |
Apollo Global Management, Inc., 6.75% | | 125,151 | | $ 9,557,782
| |
Arbor Realty Trust, Inc., Series D, 6.38% | | 45,766 | | 905,709 | |
Arbor Realty Trust, Inc., Series E, 6.25%(1) | | 46,719 | | 913,356 | |
Arbor Realty Trust, Inc., Series F, 6.25% | | 37,669 | | 779,372 | |
Ares Management Corp., Series B, 6.75%* | | 205,883 | | 11,097,094 | |
Argo Group International Holdings, Inc., 7.00%(1) | | 18,578 | | 464,264 | |
ARMOUR Residential REIT, Inc., Series C, 7.00%(1) | | 442,197 | | 10,241,282 | |
Aspen Insurance Holdings Ltd., 5.63% (Bermuda) | | 14,335 | | 300,032 | |
Associated Banc-Corp., 6.63% | | 5,074 | | 124,364 | |
Athene Holding Ltd., 7.25%(1) | | 659,615 | | 16,985,086 | |
Atlanticus Holdings Corp., 9.25%(1) | | 1,234,869 | | 30,550,659 | |
Atlanticus Holdings Corp., Series B, 7.63%(1) | | 40,518 | | 926,241 | |
B Riley Financial, Inc., 5.25%(1) | | 70,929 | | 812,137 | |
B Riley Financial, Inc., 6.00%(1) | | 123,520 | | 1,377,248 | |
Banc of California, Inc., Series F, 7.75%(1) | | 1,301,736 | | 31,502,011 | |
Bank of America Corp., Series 4, 6.07%(1) | | 8,495 | | 205,579 | |
Bank of America Corp., Series E, 5.73% | | 8,997 | | 221,416 | |
Bank of Hawaii Corp., 8.00%(1) | | 659,159 | | 17,639,095 | |
Bank OZK, Series A, 4.63%(1) | | 28,487 | | 537,265 | |
Brighthouse Financial, Inc., Series C, 5.38% | | 3,809 | | 77,170 | |
Brighthouse Financial, Inc., Series D, 4.63%(1) | | 118,240 | | 2,042,005 | |
Brookfield Finance, Inc., Series 50, 4.63% (Canada) | | 4,644 | | 85,775 | |
Brookfield Oaktree Holdings LLC, Series A, 6.63%(1) | | 9,898 | | 241,709 | |
Brookfield Oaktree Holdings LLC, Series B, 6.55%(1) | | 15,886 | | 374,115 | |
Chimera Investment Corp., 9.00%(1) | | 132,288 | | 3,405,093 | |
Chimera Investment Corp., 9.25%* | | 116,336 | | 2,994,489 | |
Chimera Investment Corp., Series A, 8.00%(1) | | 343,891 | | 8,249,945 | |
Chimera Investment Corp., Series B, 10.66%(1) | | 525,760 | | 13,338,531 | |
Chimera Investment Corp., Series C, 7.75%(1) | | 702,560 | | 16,060,522 | |
Chimera Investment Corp., Series D, 10.20%(1) | | 691,443 | | 17,251,503 | |
CION Investment Corp., 7.50%* | | 954,171 | | 24,474,486 | |
Citizens Financial Group, Inc., 7.38% | | 3,189 | | 86,422 | |
Compass Diversified Holdings, Series A, 7.25%(1) | | 472,211 | | 11,583,336 | |
Compass Diversified Holdings, Series B, 7.88%(1) | | 30,882 | | 755,683 | |
Compass Diversified Holdings, Series C, 7.88% | | 76,794 | | 1,886,061 | |
DigitalBridge Group, Inc., Series H, 7.13%(1) | | 767,334 | | 19,398,203 | |
DigitalBridge Group, Inc., Series I, 7.15%(1) | | 1,295,217 | | 32,730,134 | |
DigitalBridge Group, Inc., Series J, 7.13%(1) | | 586,605 | | 14,635,795 | |
Schedule of Investments — Virtus InfraCap U.S. Preferred Stock ETF (continued)
October 31, 2024
The accompanying notes are an integral part of these financial statements.
7
| | | | | |
Security Description | | Shares | | Value | |
| | | | | |
PREFERRED STOCKS (continued) | | | | | |
| | | | | |
Financials (continued) | | | | | |
Dime Community Bancshares, Inc., 5.50%(1) | | 11,017 | | $ 224,086
| |
Dime Community Bancshares, Inc., 9.00%(1) | | 313,546 | | 8,531,587 | |
Eagle Point Income Co., Inc., Series B, 7.75%(1) | | 16,063 | | 400,932 | |
Eagle Point Income Co., Inc., Series C, 8.00% | | 69,002 | | 1,727,120 | |
Eagle Point Institutional Income Fund, Series A, 8.13%* | | 110,681 | | 2,747,102 | |
Ellington Financial, Inc., 10.05%(1) | | 835,200 | | 20,938,464 | |
Enstar Group Ltd., Series D, 7.00% | | 46 | | 984 | |
Enterprise Financial Services Corp., Series A, 5.00%(1) | | 276,117 | | 5,649,354 | |
F&G Annuities & Life, Inc., 7.95% | | 4,555 | | 123,714 | |
Fifth Third Bancorp, Series A, 6.00% | | 2,361 | | 58,246 | |
Flagstar Financial, Inc., Series A, 6.38%(1) | | 1,799,286 | | 37,659,056 | |
Franklin BSP Realty Trust, Inc.,
Series E, 7.50% | | 44,575 | | 1,042,163 | |
Heartland Financial USA, Inc., Series E, 7.00%(1) | | 15,630 | | 390,437 | |
Huntington Bancshares, Inc., Series J, 6.88% | | 1 | | 26 | |
Invesco Mortgage Capital, Inc., Series B, 7.75%(1) | | 487,411 | | 12,170,653 | |
Invesco Mortgage Capital, Inc., Series C, 7.50%(1) | | 514,333 | | 12,472,575 | |
Kemper Corp., 5.88%(1) | | 327,939 | | 7,670,493 | |
KeyCorp, Series E, 6.13% | | 44,953 | | 1,144,054 | |
KeyCorp, Series F, 5.65% | | 79 | | 1,841 | |
M&T Bank Corp., Series J, 7.50% | | 178 | | 4,863 | |
Merchants Bancorp, Series B, 9.42%(1) | | 159,842 | | 4,031,215 | |
Merchants Bancorp, Series C, 6.00%(1) | | 182,585 | | 4,199,455 | |
MFA Financial, Inc., 8.88% | | 100 | | 2,560 | |
MFA Financial, Inc., 9.00% | | 53,204 | | 1,363,619 | |
MFA Financial, Inc., Series B, 7.50%(1) | | 436,148 | | 9,900,560 | |
MFA Financial, Inc., Series C, 6.50%(1) | | 959,041 | | 23,189,611 | |
MidCap Financial Investment Corp., 8.00% | | 3,739 | | 95,344 | |
Morgan Stanley, Series A, 5.62% | | 3,526 | | 83,425 | |
Morgan Stanley, Series Q, 6.63% | | 2,387 | | 63,017 | |
Navient Corp., 6.00%(1) | | 17,487 | | 349,740 | |
New York Community Capital Trust V, 6.00% | | 578,184 | | 22,896,086 | |
New York Mortgage Trust, Inc., Series D, 8.00%(1) | | 1,442,733 | | 33,254,996 | |
New York Mortgage Trust, Inc., Series E, 7.88%(1) | | 875,840 | | 21,834,691 | |
New York Mortgage Trust, Inc.,
Series F, 6.88% | | 9,005 | | 200,091 | |
NewtekOne, Inc., 8.50% | | 53,277 | | 1,341,515 | |
NewtekOne, Inc., 8.63%* | | 502,114 | | 12,703,484 | |
Oxford Lane Capital Corp., 8.75% | | 81,331 | | 2,117,859 | |
Oxford Lane Capital Corp., Series 2029, 6.00%(1) | | 71,996 | | 1,660,228 | |
| | | | | |
Security Description | | Shares | | Value | |
| | | | | |
PREFERRED STOCKS (continued) | | | | | |
| | | | | |
Financials (continued) | | | | | |
PennyMac Mortgage Investment Trust, Series A, 8.13%(1) | | 234,499 | | $ 5,932,825
| |
PennyMac Mortgage Investment Trust, Series B, 8.00%(1) | | 792,320 | | 19,768,384 | |
PennyMac Mortgage Investment Trust, Series C, 6.75%(1) | | 141,290 | | 2,936,006 | |
Prospect Capital Corp., Series A, 5.35%(1) | | 772,211 | | 15,058,114 | |
Ready Capital Corp., 6.20% | | 1,233 | | 30,184 | |
Ready Capital Corp., Series C, 6.25% | | 325 | | 6,094 | |
Ready Capital Corp., Series E, 6.50% | | 7,876 | | 152,007 | |
Redwood Trust, Inc., 9.00%(1) | | 343,460 | | 8,696,407 | |
Redwood Trust, Inc., 10.00%(1) | | 66,052 | | 1,718,673 | |
Regions Financial Corp., 6.95% | | 1,229,601 | | 31,772,890 | |
Regions Financial Corp., Series C, 5.70% | | 338 | | 8,497 | |
Rithm Capital Corp., Series A, 11.18%(1) | | 7,559 | | 192,377 | |
Rithm Capital Corp., Series B, 11.02% | | 23,189 | | 586,218 | |
Rithm Capital Corp., Series C, 6.38% | | 180,952 | | 4,397,134 | |
Rithm Capital Corp., Series D, 7.00%(1) | | 78,358 | | 1,893,913 | |
RiverNorth Opportunities Fund, Inc., Series A, 6.00%(1) | | 97,595 | | 2,328,617 | |
SLM Corp., Series B, 6.91%(1) | | 570,133 | | 42,235,453 | |
State Street Corp., Series G, 5.35% | | 18,211 | | 453,272 | |
Synchrony Financial, Series A, 5.63%(1) | | 696,374 | | 14,387,087 | |
Synchrony Financial, Series B, 8.25%(1) | | 397,349 | | 10,315,180 | |
Synovus Financial Corp., Series E, 8.40%(1) | | 76,383 | | 2,020,330 | |
Texas Capital Bancshares, Inc., Series B, 5.75%(1) | | 51,745 | | 1,078,883 | |
TPG RE Finance Trust, Inc., Series C, 6.25% | | 17,473 | | 339,850 | |
Trinity Capital, Inc., 7.88% | | 775,606 | | 19,623,873 | |
Two Harbors Investment Corp., Series A, 8.13%(1) | | 20,792 | | 515,018 | |
Two Harbors Investment Corp., Series B, 7.63%(1) | | 760,396 | | 18,842,613 | |
Two Harbors Investment Corp., Series C, 7.25%(1) | | 1,169,010 | | 28,769,336 | |
US Bancorp, Series B, 5.52% | | 19,306 | | 427,435 | |
Valley National Bancorp, Series A, 6.25%(1) | | 1,047,070 | | 25,517,096 | |
Valley National Bancorp, Series B, 8.43%(1) | | 209,550 | | 5,154,930 | |
Valley National Bancorp, Series C, 8.25% | | 935,592 | | 24,774,476 | |
Webster Financial Corp., Series F, 5.25% | | 3,589 | | 77,163 | |
WesBanco, Inc., Series A, 6.75% | | 42,442 | | 1,081,422 | |
Wintrust Financial Corp., Series E, 6.88%(1) | | 17,043 | | 428,631 | |
Total Financials | | | | 886,383,671 | |
Health Care — 0.1% | | | | | |
XOMA Royalty Corp., Series A, 8.63%(1) | | | | | |
| | 13,925 | | 358,569 | |
| | | | | |
Schedule of Investments — Virtus InfraCap U.S. Preferred Stock ETF (continued)
October 31, 2024
The accompanying notes are an integral part of these financial statements.
8
| | | | | |
Security Description | | Shares | | Value | |
| | | | | |
PREFERRED STOCKS (continued) | | | | | |
| | | | | |
Industrials — 11.5% | | | | | |
Alta Equipment Group, Inc., Series A, 10.00% | | 206 | | $ 5,260
| |
Atlas Corp., Series D, 7.95% (Canada) | | 6,135 | | 153,620 | |
Atlas Corp., Series H, 7.88% (Canada)(1) | | 55,630 | | 1,385,187 | |
Babcock & Wilcox Enterprises, Inc., 6.50%(1) | | 277,306 | | 6,045,271 | |
Babcock & Wilcox Enterprises, Inc., 8.13%(1) | | 847,946 | | 20,248,951 | |
Babcock & Wilcox Enterprises, Inc., Series A, 7.75%(1) | | 1,598,343 | | 21,897,299 | |
Boeing Co., 6.00%* | | 500 | | 26,865 | |
Chart Industries, Inc., Series B, 6.75% | | 301,349 | | 14,871,573 | |
FTAI Aviation Ltd., Series B, 8.00%(1) | | 1,306,696 | | 33,216,212 | |
FTAI Aviation Ltd., Series C, 8.25%(1) | | 51,512 | | 1,354,251 | |
FTAI Aviation Ltd., Series D, 9.50% | | 22,964 | | 610,842 | |
Pitney Bowes, Inc., 6.70%(1) | | 787,630 | | 16,461,467 | |
Triton International Ltd., 6.88% (Bermuda)(1) | | 425,878 | | 10,370,129 | |
Triton International Ltd., 7.38% (Bermuda)(1) | | 865,418 | | 21,246,012 | |
Triton International Ltd., Series E, 5.75% (Bermuda)(1) | | 495,137 | | 11,100,972 | |
Total Industrials | | | | 158,993,911 | |
Information Technology — 0.0%(2) | | | | | |
Hewlett Packard Enterprise Co., 7.63%* | | | | | |
| | 6,064 | | 350,802 | |
| | | | | |
Real Estate — 25.4%† | | | | | |
Armada Hoffler Properties, Inc., Series A, 6.75% | | 11,396 | | 275,441 | |
Braemar Hotels & Resorts, Inc., Series B, 5.50%(1) | | 368,541 | | 5,284,878 | |
Braemar Hotels & Resorts, Inc., Series D, 8.25%(1) | | 119,348 | | 2,476,471 | |
City Office REIT, Inc., Series A, 6.63%(1) | | 201,005 | | 3,517,587 | |
CTO Realty Growth, Inc., Series A, 6.38%(1) | | 254,527 | | 6,225,730 | |
DiamondRock Hospitality Co., 8.25%(1) | | 19,918 | | 516,872 | |
Digital Realty Trust, Inc., Series J, 5.25% | | 19,596 | | 464,817 | |
Digital Realty Trust, Inc., Series L, 5.20% | | 21,797 | | 511,794 | |
Diversified Healthcare Trust, 5.63%(1) | | 1,270,284 | | 20,324,544 | |
Diversified Healthcare Trust, 6.25%(1) | | 1,127,555 | | 19,281,190 | |
EPR Properties, Series C, 5.75%(1) | | 67,704 | | 1,439,387 | |
EPR Properties, Series E, 9.00%(1) | | 515,882 | | 15,450,666 | |
EPR Properties, Series G, 5.75%(1) | | 514,559 | | 11,273,988 | |
Gladstone Land Corp., Series B, 6.00% | | 12,839 | | 284,384 | |
Global Net Lease, Inc., Series A, 7.25%(1) | | 721,998 | | 16,447,114 | |
Global Net Lease, Inc., Series B, 6.88%(1) | | 663,705 | | 14,203,287 | |
Global Net Lease, Inc., Series D, 7.50%(1) | | 1,406,341 | | 32,177,082 | |
Global Net Lease, Inc., Series E, 7.38%(1) | | 416,713 | | 9,334,371 | |
| | | | | |
| | | | | |
Security Description | | Shares | | Value | |
| | | | | |
PREFERRED STOCKS (continued) | | | | | |
| | | | | |
Real Estate (continued) | | | | | |
Hudson Pacific Properties, Inc., Series C, 4.75%(1) | | 1,047,018 | | $ 15,275,993
| |
Kimco Realty Corp., Series N, 7.25% | | 312 | | 19,032 | |
LXP Industrial Trust, Series C, 6.50%(1) | | 34,541 | | 1,775,062 | |
National Healthcare Properties, Series B, 7.13%(1) | | 514,201 | | 8,093,524 | |
Office Properties Income Trust, 6.38%(1) | | 511,585 | | 6,072,514 | |
Pebblebrook Hotel Trust, Series E, 6.38%(1) | | 60,485 | | 1,366,356 | |
Pebblebrook Hotel Trust, Series F, 6.30%(1) | | 498,557 | | 11,626,349 | |
Pebblebrook Hotel Trust, Series G, 6.38%(1) | | 153,329 | | 3,494,368 | |
Pebblebrook Hotel Trust, Series H, 5.70%(1) | | 105,403 | | 2,181,842 | |
Regency Centers Corp., Series B, 5.88%(1) | | 230,386 | | 5,628,330 | |
RLJ Lodging Trust, Series A, 1.95%(1) | | 1,309,544 | | 33,864,808 | |
Saul Centers, Inc., Series E, 6.00%(1) | | 701,076 | | 16,370,125 | |
SITE Centers Corp., Series A, 6.38% | | 10,206 | | 256,273 | |
SL Green Realty Corp., Series I, 6.50%(1) | | 446,308 | | 10,653,372 | |
Summit Hotel Properties, Inc., Series E, 6.25%(1) | | 419,115 | | 8,797,224 | |
Summit Hotel Properties, Inc.,
Series F, 5.88%(1) | | 139,808 | | 2,942,958 | |
Sunstone Hotel Investors, Inc., Series H, 6.13%(1) | | 10,013 | | 230,299 | |
Sunstone Hotel Investors, Inc.,
Series I, 5.70%(1) | | 96,847 | | 2,103,517 | |
Vornado Realty Trust, Series L, 5.40%(1) | | 672,315 | | 12,599,183 | |
Vornado Realty Trust, Series M, 5.25%(1) | | 1,028,850 | | 18,755,936 | |
Vornado Realty Trust, Series N, 5.25%(1) | | 838,428 | | 15,410,307 | |
Vornado Realty Trust, Series O, 4.45%(1) | | 829,634 | | 13,929,555 | |
Total Real Estate | | | | 350,936,530 | |
Utilities — 7.4% | | | | | |
Brookfield BRP Holdings Canada, Inc., 4.63% (Canada) | | 159 | | 2,802 | |
Brookfield BRP Holdings Canada, Inc., 7.25% (Canada)(1) | | 441,666 | | 11,302,233 | |
Brookfield Infrastructure Finance ULC, 7.25% (Canada)(1) | | 124,497 | | 3,164,714 | |
Eagle Point Credit Co., Inc., Series F, 8.00%(1) | | 109,257 | | 2,718,314 | |
NextEra Energy, Inc., 6.93% | | 208,001 | | 9,308,045 | |
NextEra Energy, Inc., 7.30% | | 15,995 | | 846,295 | |
SCE Trust III, Series H, 7.77%(1) | | 950,646 | | 24,079,863 | |
SCE Trust IV, Series J, 5.38%(1) | | 1,610,527 | | 39,618,964 | |
SCE Trust VI, 5.00%(1) | | 511,706 | | 10,546,261 | |
Sempra, 5.75% | | 2,122 | | 52,668 | |
South Jersey Industries, Inc., 5.63%(1) | | 5,636 | | 107,450 | |
Spire, Inc., Series A, 5.90% | | 4,980 | | 123,902 | |
Total Utilities | | | | 101,871,511 | |
Total Preferred Stocks | | | | | |
(Cost $1,584,618,189) | | | | 1,672,574,191 | |
Schedule of Investments — Virtus InfraCap U.S. Preferred Stock ETF (continued)
October 31, 2024
The accompanying notes are an integral part of these financial statements.
9
| | | | | |
Security Description | | Shares | | Value | |
| | | | | |
COMMON STOCKS — 1.5% | | | | | |
Industrials — 0.0%(2) | | | | |
Chart Industries, Inc.* | | 8 | | $ 966
| |
| | | | |
Utilities — 1.5% | | | | |
Algonquin Power & Utilities Corp. (Canada)(1) | | 928,616 | | 4,494,501 | |
UGI Corp.(1) | | 671,611 | | 16,058,219 | |
Total Utilities | | | | 20,552,720 | |
| | | | | |
Total Common Stocks | | | | | |
(Cost $23,934,511) | | | | 20,553,686 | |
| | Principal | | | |
CORPORATE BOND — 0.0%(2) | | | |
Financials — 0.0%(2) | | | |
Hudson Pacific Properties LP, 4.65%, 04/01/29 | | $25,000
| | 20,025 | |
(Cost $20,785) | | | | | |
| | | | | |
Security Description | | Shares | | Value | |
| | | | | |
MONEY MARKET FUNDS — 0.4% | | | | | |
Goldman Sachs Financial Square Government Fund, Institutional Shares, 4.78%(3) | | 2,812,880 | | $ 2,812,880
| |
RBC BlueBay U.S. Government Money Market Fund - Institutional Shares, 4.77%(3) | | 2,812,880 | | 2,812,880 | |
Total Money Market Funds | | | | | |
(Cost $5,625,760) | | | | 5,625,760 | |
| | | | | |
TOTAL INVESTMENTS — 123.1% | | | | | |
(Cost $1,614,199,245) | | | | 1,698,773,662 | |
Liabilities in Excess of Other Assets — (23.1)% | | | | (318,509,414 | ) |
Net Assets — 100.0% | | | | $1,380,264,248
| |
*Non-income producing security.
†Amounts represent investments in particular sectors. No industry within these sectors represented more than 25% of the Fund’s total assets at the time of investment.
(1)Security, or a portion thereof, has been pledged as collateral for borrowings. The aggregate market value of the collateral at October 31, 2024 was $1,243,999,482.
(2)Amount rounds to less than 0.05%.
(3)The rate shown reflects the seven-day yield as of October 31, 2024.
The following table summarizes valuation of the Fund’s investments under the fair value hierarchy levels as of October 31, 2024.
| | | | | | | | |
| | Level 1 | | Level 2 | | Level 3 | | Total |
Asset Valuation Inputs | | | | | | | | |
Preferred Stocks | | $1,672,574,191
| | $—
| | $—
| | $1,672,574,191
|
Common Stocks | | 20,553,686 | | — | | — | | 20,553,686 |
Corporate Bond | | — | | 20,025 | | — | | 20,025 |
Money Market Funds | | 5,625,760 | | — | | — | | 5,625,760 |
Total | | $1,698,753,637
| | $20,025
| | $—
| | $1,698,773,662
|
Schedule of Investments - Virtus LifeSci Biotech Clinical Trials ETF
October 31, 2024
The accompanying notes are an integral part of these financial statements.
10
| | | | | |
Security Description | | Shares | | Value | |
| | | | | |
COMMON STOCKS — 98.0% | | | | | |
| | | | |
Health Care — 98.0% | | | | |
4D Molecular Therapeutics, Inc.* | | 3,773 | | $30,222
| |
89bio, Inc.* | | 9,923 | | 77,201 | |
AbCellera Biologics, Inc. (Canada)*(1) | | 27,678 | | 75,561 | |
ACELYRIN, Inc.* | | 21,138 | | 120,064 | |
Aerovate Therapeutics, Inc.* | | 3,749 | | 9,185 | |
Agenus, Inc.* | | 5,759 | | 24,188 | |
Akero Therapeutics, Inc.* | | 3,741 | | 115,335 | |
Alector, Inc.* | | 18,697 | | 91,989 | |
Allogene Therapeutics, Inc.* | | 36,285 | | 92,708 | |
ALX Oncology Holdings, Inc.* | | 10,920 | | 15,616 | |
AnaptysBio, Inc.* | | 3,797 | | 82,129 | |
Annexon, Inc.* | | 15,339 | | 112,282 | |
Apogee Therapeutics, Inc.*(1) | | 2,138 | | 111,262 | |
Applied Therapeutics, Inc.* | | 17,524 | | 154,912 | |
Arbutus Biopharma Corp.* | | 29,162 | | 112,128 | |
Arcellx, Inc.*(1) | | 1,651 | | 139,130 | |
Arcturus Therapeutics Holdings, Inc.* | | 2,919 | | 51,754 | |
Arcus Biosciences, Inc.* | | 5,424 | | 82,987 | |
Arcutis Biotherapeutics, Inc.* | | 9,867 | | 81,995 | |
Arrowhead Pharmaceuticals, Inc.* | | 3,478 | | 66,882 | |
Arvinas, Inc.* | | 3,486 | | 92,135 | |
Autolus Therapeutics PLC (United Kingdom)*(2) | | 20,348 | | 68,573 | |
Avidity Biosciences, Inc.* | | 2,305 | | 97,409 | |
Beam Therapeutics, Inc.*(1) | | 3,653 | | 80,037 | |
Belite Bio, Inc.*(1)(2) | | 1,843 | | 122,762 | |
Bicycle Therapeutics PLC (United Kingdom)*(2) | | 3,789 | | 88,833 | |
Biohaven Ltd.* | | 2,760 | | 137,338 | |
Cabaletta Bio, Inc.* | | 7,338 | | 26,050 | |
Cargo Therapeutics, Inc.* | | 5,368 | | 104,676 | |
Cassava Sciences, Inc.*(1) | | 4,634 | | 119,580 | |
Celcuity, Inc.* | | 6,006 | | 93,093 | |
Celldex Therapeutics, Inc.* | | 2,529 | | 65,906 | |
Centessa Pharmaceuticals PLC*(1)(2) | | 9,285 | | 139,646 | |
CG oncology, Inc.*(1) | | 2,648 | | 94,083 | |
Cogent Biosciences, Inc.* | | 10,266 | | 117,956 | |
Compass Pathways PLC (United Kingdom)*(1)(2) | | 13,281 | | 63,218 | |
Crinetics Pharmaceuticals, Inc.* | | 1,962 | | 109,794 | |
Cullinan Therapeutics, Inc.* | | 4,228 | | 65,745 | |
CureVac NV (Germany)*(1) | | 23,036 | | 63,119 | |
Cytokinetics, Inc.* | | 1,747 | | 89,097 | |
Denali Therapeutics, Inc.* | | 4,164 | | 108,097 | |
Dianthus Therapeutics, Inc.*(1) | | 3,422 | | 95,337 | |
Disc Medicine, Inc.* | | 2,353 | | 105,462 | |
Dyne Therapeutics, Inc.* | | 2,736 | | 78,961 | |
Edgewise Therapeutics, Inc.* | | 5,145 | | 172,718 | |
| | | | | |
Security Description | | Shares | | Value | |
| | | | | |
COMMON STOCKS (continued) | | | | | |
| | | | |
Health Care (continued) | | | | |
Editas Medicine, Inc.* | | 16,790 | | $ 48,691
| |
Enliven Therapeutics, Inc.* | | 4,188 | | 116,636 | |
Erasca, Inc.* | | 42,275 | | 109,492 | |
Exscientia PLC (United Kingdom)*(2) | | 19,359 | | 94,085 | |
Fulcrum Therapeutics, Inc.* | | 11,813 | | 37,329 | |
HilleVax, Inc.* | | 6,230 | | 11,276 | |
Ideaya Biosciences, Inc.* | | 2,369 | | 66,687 | |
IGM Biosciences, Inc.*(1) | | 11,606 | | 198,927 | |
Immatics NV (Germany)* | | 7,115 | | 64,747 | |
Immunome, Inc.*(1) | | 5,743 | | 65,872 | |
Immunovant, Inc.* | | 3,462 | | 101,298 | |
Intellia Therapeutics, Inc.* | | 3,550 | | 50,481 | |
iTeos Therapeutics, Inc.* | | 5,655 | | 47,785 | |
Janux Therapeutics, Inc.* | | 2,178 | | 117,590 | |
Keros Therapeutics, Inc.* | | 1,859 | | 107,896 | |
Kura Oncology, Inc.* | | 4,275 | | 71,478 | |
Kymera Therapeutics, Inc.*(1) | | 2,640 | | 121,889 | |
Kyverna Therapeutics, Inc.* | | 6,381 | | 30,501 | |
Larimar Therapeutics, Inc.* | | 9,508 | | 78,203 | |
Liquidia Corp.* | | 6,860 | | 74,431 | |
Longboard Pharmaceuticals, Inc.* | | 4,618 | | 275,787 | |
Lyell Immunopharma, Inc.* | | 35,583 | | 34,170 | |
MacroGenics, Inc.* | | 19,694 | | 72,080 | |
Merus NV (Netherlands)* | | 1,595 | | 79,638 | |
Mineralys Therapeutics, Inc.* | | 7,267 | | 97,233 | |
MoonLake Immunotherapeutics*(1) | | 2,162 | | 100,360 | |
Neumora Therapeutics, Inc.*(1) | | 9,261 | | 106,038 | |
Neurogene, Inc.*(1) | | 2,194 | | 96,558 | |
Newamsterdam Pharma Co. NV
(Netherlands)* | | 4,738 | | 80,641 | |
Nurix Therapeutics, Inc.* | | 5,512 | | 135,485 | |
Nuvalent, Inc. Class A*(1) | | 1,165 | | 103,091 | |
Nuvation Bio, Inc.* | | 30,821 | | 68,114 | |
Olema Pharmaceuticals, Inc.* | | 7,394 | | 85,253 | |
ORIC Pharmaceuticals, Inc.*(1) | | 11,997 | | 112,532 | |
Perspective Therapeutics, Inc.* | | 7,945 | | 93,830 | |
Pharvaris NV (Netherlands)* | | 5,089 | | 126,563 | |
Pliant Therapeutics, Inc.* | | 7,697 | | 108,297 | |
Praxis Precision Medicines, Inc.* | | 2,297 | | 160,767 | |
Precigen, Inc.* | | 54,216 | | 42,733 | |
Prime Medicine, Inc.*(1) | | 11,670 | | 45,280 | |
Protagonist Therapeutics, Inc.* | | 2,680 | | 122,851 | |
Prothena Corp. PLC (Ireland)* | | 4,315 | | 73,355 | |
Recursion Pharmaceuticals, Inc. Class A*(1) | | 9,763 | | 61,702 | |
Schedule of Investments - Virtus LifeSci Biotech Clinical Trials ETF (continued)
October 31, 2024
The accompanying notes are an integral part of these financial statements.
11
| | | | | |
Security Description | | Shares | | Value | |
| | | | | |
COMMON STOCKS (continued) | | | | | |
| | | | |
Health Care (continued) | | | | |
REGENXBIO, Inc.* | | 7,043 | | $ 60,499
| |
Relay Therapeutics, Inc.* | | 11,781 | | 66,386 | |
Replimune Group, Inc.* | | 9,739 | | 114,531 | |
REVOLUTION Medicines, Inc.* | | 2,321 | | 124,174 | |
Rocket Pharmaceuticals, Inc.* | | 4,028 | | 67,066 | |
Sana Biotechnology, Inc.* | | 12,890 | | 45,115 | |
Savara, Inc.* | | 22,701 | | 82,518 | |
Scholar Rock Holding Corp.* | | 9,771 | | 277,887 | |
Scilex Holding Co. (Singapore)*(1)(3)(4) | | 17,955 | | 15,519 | |
Silence Therapeutics PLC (United Kingdom)*(2) | | 4,674 | | 80,860 | |
Soleno Therapeutics, Inc.* | | 2,050 | | 112,873 | |
Spyre Therapeutics, Inc.*(1) | | 2,848 | | 92,645 | |
Stoke Therapeutics, Inc.* | | 5,256 | | 64,964 | |
Structure Therapeutics, Inc.*(1)(2) | | 1,787 | | 73,535 | |
Summit Therapeutics, Inc.*(1) | | 11,390 | | 211,740 | |
Syndax Pharmaceuticals, Inc.* | | 4,451 | | 83,946 | |
Tango Therapeutics, Inc.* | | 10,984 | | 59,698 | |
Taysha Gene Therapies, Inc.* | | 22,103 | | 37,354 | |
Terns Pharmaceuticals, Inc.* | | 11,550 | | 79,233 | |
Tyra Biosciences, Inc.* | | 4,642 | | 77,429 | |
uniQure NV (Netherlands)* | | 17,556 | | 100,420 | |
Vaxcyte, Inc.* | | 1,244 | | 132,299 | |
Vera Therapeutics, Inc.* | | 2,465 | | 99,537 | |
Verve Therapeutics, Inc.*(1) | | 16,455 | | 94,287 | |
Viking Therapeutics, Inc.*(1) | | 1,771 | | 128,468 | |
Vir Biotechnology, Inc.* | | 8,894 | | 66,616 | |
Viridian Therapeutics, Inc.* | | 7,011 | | 151,227 | |
| | | | | |
Security Description | | Shares | | Value | |
| | | | | |
COMMON STOCKS (continued) | | | | | |
| | | | |
Health Care (continued) | | | | |
WaVe Life Sciences Ltd.* | | 14,222 | | $ 194,984
| |
Xencor, Inc.* | | 4,323 | | 90,826 | |
Xenon Pharmaceuticals, Inc. (Canada)* | | 2,425 | | 99,692 | |
Zentalis Pharmaceuticals, Inc.* | | 9,683 | | 26,435 | |
Zymeworks, Inc.* | | 10,114 | | 138,562 | |
Total Health Care | | | | 11,096,132 | |
Total Common Stocks | | | | | |
(Cost $12,517,941) | | | | 11,096,132 | |
SECURITIES LENDING
COLLATERAL — 6.7% | | | | | |
Money Market Fund — 6.7% | | | | | |
Dreyfus Government Cash Management Fund, Institutional Shares, 4.76%(5)(6) | | | | | |
(Cost $754,964) | | 754,964 | | 754,964 | |
| | | | | |
TOTAL INVESTMENTS — 104.7% | | | | | |
(Cost $13,272,905) | | | | 11,851,096 | |
Liabilities in Excess of Other Assets — (4.7)% | | | | (530,272 | ) |
Net Assets — 100.0% | | | | $11,320,824
| |
*Non-income producing security.
(1)All or a portion of the security was on loan. The aggregate market value of securities on loan was $2,544,897; total market value of collateral held by the Fund was $2,663,904. Market value of the collateral held includes non-cash U.S. Treasury securities having a value of $1,908,940.
(2)American Depositary Receipts.
(3)Security valued at fair value as determined in good faith by or under the direction of the Trustees. This security is disclosed as a Level 3 security in the Fair Value Hierarchy table located after the Schedule of Investments.
(4)Restricted security. See Note 5.
(5)Represents securities purchased with cash collateral received for securities on loan.
(6)The rate shown reflects the seven-day yield as of October 31, 2024.
The following table summarizes valuation of the Fund’s investments under the fair value hierarchy levels as of October 31, 2024.
| | | | | | | | |
| | Level 1 | | Level 2 | | Level 3 | | Total |
Asset Valuation Inputs | | | | | | | | |
Common Stocks | | $11,080,613
| | $—
| | $15,519
| | $11,096,132
|
Money Market Fund | | 754,964 | | — | | — | | 754,964 |
Total | | $11,835,577
| | $—
| | $15,519
| | $11,851,096
|
Management has determined that the amount of Level 3 securities compared to total net assets is not material; therefore, the rollforward of Level 3 securities and assumptions are not shown for the year ended October 31, 2024.
Schedule of Investments - Virtus LifeSci Biotech Products ETF
October 31, 2024
The accompanying notes are an integral part of these financial statements.
12
| | | | | |
Security Description | | Shares | | Value | |
| | | | | |
COMMON STOCKS — 99.2% | | | | | |
| | | | |
Health Care — 99.2% | | | | |
ACADIA Pharmaceuticals, Inc.* | | 21,826 | | $318,441
| |
ADMA Biologics, Inc.* | | 30,552 | | 498,303 | |
Agios Pharmaceuticals, Inc.* | | 7,042 | | 312,876 | |
Alnylam Pharmaceuticals, Inc.* | | 2,058 | | 548,642 | |
Amgen, Inc. | | 1,103 | | 353,137 | |
Amicus Therapeutics, Inc.* | | 30,939 | | 353,323 | |
Apellis Pharmaceuticals, Inc.* | | 7,738 | | 210,938 | |
Ardelyx, Inc.* | | 50,747 | | 297,885 | |
Ascendis Pharma A/S (Denmark)*(1) | | 2,576 | | 316,384 | |
Aurinia Pharmaceuticals, Inc. (Canada)* | | 61,561 | | 443,855 | |
Axsome Therapeutics, Inc.*(2) | | 4,542 | | 404,374 | |
BeiGene Ltd. (China)*(1) | | 1,979 | | 401,025 | |
BioCryst Pharmaceuticals, Inc.* | | 52,865 | | 423,449 | |
Biogen, Inc.* | | 1,408 | | 244,992 | |
BioMarin Pharmaceutical, Inc.* | | 3,910 | | 257,630 | |
BioNTech SE (Germany)*(1) | | 3,431 | | 388,046 | |
Blueprint Medicines Corp.* | | 3,096 | | 270,931 | |
Bridgebio Pharma, Inc.* | | 11,357 | | 265,867 | |
CRISPR Therapeutics AG (Switzerland)* | | 5,047 | | 234,130 | |
Day One Biopharmaceuticals, Inc.* | | 25,491 | | 375,228 | |
Dynavax Technologies Corp.* | | 27,423 | | 324,963 | |
Esperion Therapeutics, Inc.* | | 113,178 | | 230,883 | |
Exelixis, Inc.* | | 14,998 | | 497,934 | |
Geron Corp.* | | 67,490 | | 277,384 | |
Gilead Sciences, Inc. | | 5,182 | | 460,265 | |
Halozyme Therapeutics, Inc.* | | 6,637 | | 335,633 | |
Harmony Biosciences Holdings, Inc.*(2) | | 11,067 | | 355,583 | |
ImmunityBio, Inc.*(2) | | 56,107 | | 292,317 | |
Immunocore Holdings PLC
(United Kingdom)*(1)(2) | | 8,298 | | 255,827 | |
Incyte Corp.* | | 5,254 | | 389,427 | |
Insmed, Inc.* | | 5,344 | | 359,544 | |
Intra-Cellular Therapies, Inc.* | | 4,814 | | 407,987 | |
Ionis Pharmaceuticals, Inc.* | | 8,009 | | 307,466 | |
Iovance Biotherapeutics, Inc.*(2) | | 39,069 | | 407,880 | |
Ironwood Pharmaceuticals, Inc.* | | 55,075 | | 217,546 | |
Kiniksa Pharmaceuticals International PLC* | | 17,556 | | 396,590 | |
Krystal Biotech, Inc.*(2) | | 1,802 | | 310,899 | |
Legend Biotech Corp.*(1) | | 7,542 | | 339,541 | |
Lexicon Pharmaceuticals, Inc.* | | 179,972 | | 350,945 | |
Ligand Pharmaceuticals, Inc.* | | 4,049 | | 427,979 | |
Madrigal Pharmaceuticals, Inc.*(2) | | 1,189 | | 308,355 | |
Mirum Pharmaceuticals, Inc.* | | 12,344 | | 474,750 | |
Moderna, Inc.* | | 2,268 | | 123,288 | |
Neurocrine Biosciences, Inc.* | | 2,417 | | 290,693 | |
Novavax, Inc.*(2) | | 21,884 | | 210,305 | |
Omniab, Inc. - $12.50 Earnout*(3) | | 1,295 | | 0 | |
Omniab, Inc. - $15.00 Earnout*(3) | | 1,295 | | 0 | |
Phathom Pharmaceuticals, Inc.*(2) | | 30,078 | | 515,838 | |
PTC Therapeutics, Inc.* | | 8,925 | | 356,286 | |
Regeneron Pharmaceuticals, Inc.* | | 321 | | 269,062 | |
| | | | | |
Security Description | | Shares | | Value | |
| | | | | |
COMMON STOCKS (continued) | | | | | |
| | | | |
Health Care (continued) | | | | |
Rhythm Pharmaceuticals, Inc.*(2) | | 7,423 | | $ 354,300
| |
Roivant Sciences Ltd.*(2) | | 30,467 | | 351,894 | |
Sage Therapeutics, Inc.* | | 28,639 | | 174,125 | |
Sarepta Therapeutics, Inc.* | | 2,635 | | 332,010 | |
SpringWorks Therapeutics, Inc.* | | 8,415 | | 253,544 | |
Tarsus Pharmaceuticals, Inc.* | | 9,938 | | 442,142 | |
TG Therapeutics, Inc.*(2) | | 19,651 | | 492,454 | |
Theravance Biopharma, Inc.* | | 38,386 | | 316,301 | |
Travere Therapeutics, Inc.*(2) | | 45,490 | | 796,075 | |
Ultragenyx Pharmaceutical, Inc.* | | 7,638 | | 389,462 | |
United Therapeutics Corp.* | | 1,145 | | 428,196 | |
Vertex Pharmaceuticals, Inc.* | | 688 | | 327,474 | |
Y-mAbs Therapeutics, Inc.*(2) | | 27,332 | | 396,587 | |
Zai Lab Ltd. (China)*(1)(2) | | 16,727 | | 505,490 | |
Total Health Care | | | | 21,974,680 | |
Total Common Stocks | | | | | |
(Cost $19,388,295) | | | | 21,974,680 | |
SECURITIES LENDING
COLLATERAL — 1.5% | | | | | |
Money Market Fund — 1.5% | | | | | |
Dreyfus Government Cash Management Fund, Institutional Shares, 4.76%(4)(5) | | | | | |
(Cost $325,415) | | 325,415 | | 325,415 | |
| | | | | |
TOTAL INVESTMENTS — 100.7% | | | | | |
(Cost $19,713,710) | | | | 22,300,095 | |
Liabilities in Excess of Other Assets — (0.7)% | | | | (161,209 | ) |
Net Assets - 100.0% | | | | $22,138,886
| |
*Non-income producing security.
(1)American Depositary Receipts.
(2)All or a portion of the security was on loan. The aggregate market value of securities on loan was $5,523,058; total market value of collateral held by the Fund was $5,733,744. Market value of the collateral held includes non-cash U.S. Treasury securities having a value of $5,408,329.
(3)Security valued at fair value as determined in good faith by or under the direction of the Trustees. This security is disclosed as a Level 2 security in the Fair Value Hierarchy table located after the Schedule of Investments.
(4)Represents securities purchased with cash collateral received for securities on loan.
(5)The rate shown reflects the seven-day yield as of October 31, 2024.
Schedule of Investments - Virtus LifeSci Biotech Products ETF (continued)
October 31, 2024
The accompanying notes are an integral part of these financial statements.
13
The following table summarizes valuation of the Fund’s investments under the fair value hierarchy levels as of October 31, 2024.
| | | | | | | | |
| | Level 1 | | Level 2 | | Level 3 | | Total |
Asset Valuation Inputs | | | | | | | | |
Common Stocks | | $21,623,735
| | $350,945
| | $—
| | $21,974,680
|
Money Market Fund | | 325,415 | | — | | — | | 325,415 |
Total | | $21,949,150
| | $$350,945
| | $—
| | $22,300,095
|
Schedule of Investments — Virtus Newfleet Multi-Sector Bond ETF
October 31, 2024
The accompanying notes are an integral part of these financial statements.
14
| | | | | |
Security Description | | Principal | | Value | |
| | | | | |
CORPORATE BONDS — 27.2% | | | | | |
| | | | | |
Communication Services — 1.5% | | | | | |
CCO Holdings LLC / CCO Holdings Capital Corp., 4.75%, 03/01/30(1) | | $365,000
| | $332,332
| |
Cmg Media Corp., 8.88%, 12/15/27(1) | | 410,000 | | 297,763 | |
CSC Holdings LLC, 11.75%, 01/31/29(1) | | 200,000 | | 195,233 | |
Directv Financing LLC, 8.88%, 02/01/30(1) | | 295,000 | | 291,420 | |
DISH DBS Corp., 5.88%, 11/15/24 | | 55,000 | | 54,633 | |
Gray Television, Inc., 7.00%, 05/15/27(1) | | 115,000 | | 112,000 | |
Gray Television, Inc., 5.38%, 11/15/31(1) | | 600,000 | | 362,493 | |
Hughes Satellite Systems Corp., 6.63%, 08/01/26 | | 280,000 | | 242,518 | |
Level 3 Financing, Inc., 3.63%, 01/15/29(1) | | 60,000 | | 45,290 | |
Millennium Escrow Corp., 6.63%, 08/01/26(1) | | 450,000 | | 289,969 | |
Rackspace Technology Global, Inc., 5.38%, 12/01/28(1) | | 65,000 | | 19,931 | |
Sprint Capital Corp., 8.75%, 03/15/32 | | 160,000 | | 193,694 | |
T-Mobile USA, Inc., 5.05%, 07/15/33 | | 96,000 | | 95,622 | |
Univision Communications, Inc., 6.63%, 06/01/27(1) | | 330,000 | | 327,739 | |
Total Communication Services | | | | 2,860,637 | |
| | | | | |
Consumer Discretionary — 1.7% | | | | | |
Aptiv PLC / Aptiv Global Financing Dac, 6.88%, (US 5 Year CMT T- Note + 3.39%), 12/15/54(2) | | 450,000 | | 439,028 | |
Ashton Woods USA LLC / Ashton Woods Finance Co., 4.63%, 04/01/30(1) | | 255,000 | | 235,064 | |
Churchill Downs, Inc., 6.75%, 05/01/31(1) | | 65,000 | | 66,256 | |
Ford Motor Co., 3.25%, 02/12/32 | | 105,000 | | 87,877 | |
Ford Motor Co., 4.75%, 01/15/43 | | 80,000 | | 64,910 | |
Ford Motor Credit Co. LLC, 6.05%, 11/05/31 | | 120,000 | | 120,000 | |
Light & Wonder International, Inc., 7.00%, 05/15/28(1) | | 175,000 | | 175,878 | |
Meritage Homes Corp., 3.88%, 04/15/29(1) | | 561,000 | | 524,234 | |
Newell Brands, Inc., 6.63%, 09/15/29 | | 261,000 | | 265,126 | |
Newell Brands, Inc., 6.63%, 05/15/32 | | 60,000 | | 60,323 | |
Nissan Motor Acceptance Co. LLC, 7.05%, 09/15/28(1) | | 130,000 | | 135,034 | |
Nmg Holding Co., Inc. / Neiman Marcus Group LLC, 8.50%, 10/01/28(1) | | 115,000 | | 117,025 | |
Ontario Gaming GTA LP/OTG Co.-Issuer LLC, 8.00%, 08/01/30 (Canada)(1) | | 95,000 | | 98,125 | |
PetSmart, Inc. / PetSmart Finance Corp., 7.75%, 02/15/29(1) | | 400,000 | | 388,669 | |
Prime Security Services Borrower LLC / Prime Finance, Inc., 6.25%, 01/15/28(1) | | 200,000 | | 199,987 | |
Wayfair LLC, 7.25%, 10/31/29(1) | | 5,000 | | 5,072 | |
Weekley Homes LLC / Weekley Finance Corp., 4.88%, 09/15/28(1) | | 230,000 | | 220,000 | |
Total Consumer Discretionary | | | | 3,202,608 | |
| | | | | |
Consumer Staples — 1.3% | | | | | |
Albertsons Cos., Inc. / Safeway, Inc. / New Albertsons LP / Albertsons LLC, 4.88%, 02/15/30(1) | | 185,000 | | 180,376 | |
Chobani Holdco II LLC, 8.75%, 10/01/29, (1)(3) | | 5,000 | | 5,171 | |
| | | | | |
Security Description | | Principal | | Value | |
| | | | | |
CORPORATE BONDS (continued) | | | | | |
| | | | | |
Consumer Staples (continued) | | | | | |
Coty, Inc./HFC Prestige Products, Inc./HFC Prestige International US LLC, 6.63%, 07/15/30(1) | | $50,000
| | $51,034
| |
Herbalife Nutrition Ltd. / HLF Financing, Inc., 7.88%, 09/01/25(1) | | 384,000 | | 382,977 | |
HLF Financing Sarl LLC / Herbalife International, Inc., 4.88%, 06/01/29(1) | | 80,000 | | 55,232 | |
Kronos Acquisition Holdings, Inc., 8.25%, 06/30/31(1) | | 185,000 | | 183,419 | |
Kronos Acquisition Holdings, Inc., 10.75%, 06/30/32 (Canada)(1) | | 220,000 | | 205,237 | |
Philip Morris International, Inc., 4.90%, 11/01/34 | | 480,000 | | 468,915 | |
Pilgrim’s Pride Corp., 6.25%, 07/01/33 | | 498,000 | | 517,578 | |
Post Holdings, Inc., 6.25%, 02/15/32(1) | | 55,000 | | 55,680 | |
Post Holdings, Inc., 6.38%, 03/01/33(1) | | 140,000 | | 138,857 | |
Triton Water Holdings, Inc., 6.25%, 04/01/29(1) | | 255,000 | | 252,157 | |
Total Consumer Staples | | | | 2,496,633 | |
| | | | | |
Energy – 4.0% | | | | | |
Aethon United Br LP / Aethon United Finance Corp., 7.50%, 10/01/29(1) | | 25,000 | | 25,190 | |
Alliance Resource Operating Partners LP / Alliance Resource Finance Corp., 8.63%, 06/15/29(1) | | 135,000 | | 142,624 | |
Antero Midstream Partners LP / Antero Midstream Finance Corp., 5.75%, 01/15/28(1) | | 180,000 | | 179,168 | |
Antero Resources Corp., 5.38%, 03/01/30(1) | | 200,000 | | 194,373 | |
Ascent Resources Utica Holdings LLC / ARU Finance Corp., 8.25%, 12/31/28(1) | | 175,000 | | 178,696 | |
CITGO Petroleum Corp., 7.00%, 06/15/25(1) | | 120,000 | | 120,229 | |
Civitas Resources, Inc., 8.75%, 07/01/31(1) | | 175,000 | | 183,507 | |
Columbia Pipelines Operating Co. LLC, 6.04%, 11/15/33(1) | | 135,000 | | 139,874 | |
Columbia Pipelines Operating Co. LLC, 6.54%, 11/15/53(1) | | 70,000 | | 75,311 | |
Columbia Pipelines Operating Co. LLC, 6.71%, 08/15/63(1) | | 25,000 | | 27,402 | |
CrownRock LP / CrownRock Finance, Inc., 5.00%, 05/01/29(1) | | 50,000 | | 50,597 | |
CVR Energy, Inc., 8.50%, 01/15/29(1) | | 315,000 | | 305,734 | |
DT Midstream, Inc., 4.13%, 06/15/29(1) | | 105,000 | | 98,679 | |
Encino Acquisition Partners Holdings LLC, 8.75%, 05/01/31(1) | | 115,000 | | 118,155 | |
Energy Transfer LP, Series H, 6.50%, (US 5 Year CMT T- Note + 5.69%), perpetual(2)(4) | | 225,000 | | 224,853 | |
EQM Midstream Partners LP, 6.38%, 04/01/29(1) | | 285,000 | | 289,668 | |
Flex Intermediate Holdco LLC, 3.36%, 06/30/31(1) | | 430,000 | | 372,348 | |
Genesis Energy LP / Genesis Energy Finance Corp., 8.88%, 04/15/30 | | 225,000 | | 231,934 | |
Gulfport Energy Operating Corp., 6.75%, 09/01/29(1) | | 120,000 | | 120,770 | |
Helix Energy Solutions Group, Inc., 9.75%, 03/01/29(1) | | 385,000 | | 410,936 | |
Hilcorp Energy I LP / Hilcorp Finance Co., 5.75%, 02/01/29(1) | | 125,000 | | 120,045 | |
Schedule of Investments — Virtus Newfleet Multi-Sector Bond ETF (continued)
October 31, 2024
The accompanying notes are an integral part of these financial statements.
15
| | | | | |
Security Description | | Principal | | Value | |
| | | | | |
CORPORATE BONDS (continued) | | | | | |
| | | | | |
Energy (continued) | | | | | |
Hilcorp Energy I LP / Hilcorp Finance Co., 7.25%, 02/15/35(1) | | $395,000
| | $387,772
| |
Kraken Oil & Gas Partners LLC, 7.63%, 08/15/29(1) | | 385,000 | | 380,710 | |
Mesquite Energy, Inc., Escrow, 7.25%, perpetual(1)(4) | | 12,000 | | 255 | |
Nabors Industries, Inc., 7.38%, 05/15/27(1) | | 455,000 | | 455,699 | |
Ngl Energy Operating LLC / Ngl Energy Finance Corp., 8.13%, 02/15/29(1) | | 20,000 | | 20,142 | |
Ngl Energy Operating LLC / Ngl Energy Finance Corp., 8.38%, 02/15/32(1) | | 415,000 | | 418,514 | |
Noble Finance II LLC, 8.00%, 04/15/30(1) | | 60,000 | | 60,858 | |
Occidental Petroleum Corp., 5.55%, 10/01/34 | | 115,000 | | 113,288 | |
Occidental Petroleum Corp., 6.20%, 03/15/40 | | 370,000 | | 369,584 | |
Plains All American Pipeline LP / Paa Finance Corp., 5.70%, 09/15/34 | | 325,000 | | 327,965 | |
Transocean, Inc., 8.25%, 05/15/29(1) | | 30,000 | | 30,163 | |
Transocean, Inc., 8.75%, 02/15/30(1) | | 63,750 | | 66,095 | |
Transocean, Inc., 8.50%, 05/15/31(1) | | 195,000 | | 196,629 | |
Venture Global Calcasieu Pass LLC, 4.13%, 08/15/31(1) | | 125,000 | | 114,010 | |
Venture Global Lng, Inc., 9.00%, (US 5 Year CMT T- Note + 5.44%), perpetual(1)(2)(4) | | 120,000 | | 120,068 | |
Venture Global LNG, Inc., 9.88%, 02/01/32(1) | | 135,000 | | 147,440 | |
Viper Energy, Inc., 7.38%, 11/01/31(1) | | 15,000 | | 15,598 | |
Western Midstream Operating LP, 5.25%, 02/01/50 | | 435,000 | | 379,877 | |
Williams Cos., Inc. (The), 5.15%, 03/15/34 | | 425,000 | | 418,660 | |
Total Energy | | | | 7,633,420 | |
| | | | | |
Financials — 7.3% | | | | | |
Acrisure LLC / Acrisure Finance, Inc., 8.25%, 02/01/29(1) | | 135,000 | | 137,320 | |
Acrisure LLC / Acrisure Finance, Inc., 6.00%, 08/01/29(1) | | 195,000 | | 184,716 | |
Allstate Corp. (The), Series B, 8.32%, (3-Month SOFR + 3.20%), 08/15/53(2) | | 245,000 | | 245,295 | |
American Express Co., 5.63%, (SOFR + 1.93%), 07/28/34(2) | | 420,000 | | 427,399 | |
AON North America, Inc., 5.45%, 03/01/34 | | 300,000 | | 304,723 | |
Apollo Debt Solutions BDC, 6.90%, 04/13/29(1) | | 340,000 | | 347,351 | |
Bank of America Corp., 3.42%, (3-Month SOFR + 1.30%), 12/20/28(2) | | 150,000 | | 143,866 | |
Bank of America Corp., 5.02%, (SOFR + 2.16%), 07/22/33(2) | | 180,000 | | 178,846 | |
Bank of America Corp., 5.29%, (SOFR + 1.91%), 04/25/34(2) | | 120,000 | | 120,586 | |
Bank of America Corp., 5.47%, (SOFR + 1.65%), 01/23/35(2) | | 95,000 | | 96,447 | |
Bank of America Corp., 5.43%, (SOFR + 1.91%), 08/15/35(2) | | 125,000 | | 123,183 | |
Bank of New York Mellon Corp. (The), Series G, 4.70%, (US 5 Year CMT T- Note + 4.36%), perpetual(2)(4) | | 395,000 | | 392,662 | |
| | | | | |
Security Description | | Principal | | Value | |
| | | | | |
CORPORATE BONDS (continued) | | | | | |
| | | | | |
Financials (continued) | | | | | |
Bank of New York Mellon Corp. (The), 5.83%, (SOFR + 2.07%), 10/25/33(2) | | $90,000
| | $94,783
| |
Blackstone Private Credit Fund, 2.63%, 12/15/26 | | 69,000 | | 65,009 | |
Blackstone Private Credit Fund, 7.30%, 11/27/28(1) | | 230,000 | | 241,622 | |
Block, Inc., 6.50%, 05/15/32(1) | | 95,000 | | 96,806 | |
Blue Owl Credit Income Corp., 4.70%, 02/08/27 | | 43,000 | | 41,941 | |
Blue Owl Credit Income Corp., 6.65%, 03/15/31 | | 110,000 | | 110,809 | |
Blue Owl Finance LLC, 3.13%, 06/10/31 | | 510,000 | | 438,242 | |
BroadStreet Partners, Inc., 5.88%, 04/15/29(1) | | 100,000 | | 95,718 | |
Capital One Financial Corp., 2.36%, (SOFR + 1.34%), 07/29/32(2) | | 175,000 | | 141,356 | |
Charles Schwab Corp. (The), Series H, 4.00%, (US 10 Year CMT T- Note + 3.08%), perpetual(2)(4) | | 420,000 | | 366,437 | |
Charles Schwab Corp. (The), 6.14%, (SOFR + 2.01%), 08/24/34(2) | | 180,000 | | 191,083 | |
Citigroup, Inc., Series X, 3.88%, (US 5 Year CMT T- Note + 3.42%), perpetual(2)(4) | | 390,000 | | 377,894 | |
Citigroup, Inc., 3.98%, (3-Month SOFR + 1.60%), 03/20/30(2) | | 145,000 | | 139,015 | |
Citigroup, Inc., 6.27%, (SOFR + 2.34%), 11/17/33(2) | | 130,000 | | 138,491 | |
Citigroup, Inc., 6.17%, (SOFR + 2.66%), 05/25/34(2) | | 172,000 | | 178,308 | |
Citizens Financial Group, Inc., 5.72%, (SOFR + 1.91%), 07/23/32(2) | | 320,000 | | 323,178 | |
Corebridge Financial, Inc., 6.38%, (US 5 Year CMT T- Note + 2.65%), 09/15/54(2) | | 329,000 | | 328,396 | |
F&g Annuities & Life, Inc., 6.50%, 06/04/29 | | 315,000 | | 319,393 | |
Fifth Third Bancorp, 4.34%, (SOFR + 1.66%), 04/25/33(2) | | 220,000 | | 205,954 | |
Global Atlantic Finance Co., 7.95%, 06/15/33(1) | | 180,000 | | 201,075 | |
Global Atlantic Finance Co., 7.95%, (US 5 Year CMT T- Note + 3.61%), 10/15/54(1)(2) | | 65,000 | | 67,606 | |
Goldman Sachs Group, Inc. (The), 1.99%, (SOFR + 1.09%), 01/27/32(2) | | 115,000 | | 95,967 | |
Goldman Sachs Group, Inc. (The), 3.10%, (SOFR + 1.41%), 02/24/33(2) | | 205,000 | | 179,073 | |
Goldman Sachs Group, Inc. (The), 6.45%, 05/01/36 | | 130,000 | | 140,525 | |
HA Sustainable Infrastructure Capital, Inc., 6.38%, 07/01/34(1) | | 233,000 | | 232,057 | |
Hub International Ltd., 7.38%, 01/31/32(1) | | 15,000 | | 15,311 | |
Huntington Bancshares, Inc./Oh, 5.71%, (SOFR + 1.87%), 02/02/35(2) | | 120,000 | | 121,429 | |
Huntington National Bank (The), 5.70%, (SOFR + 1.22%), 11/18/25(2) | | 250,000 | | 249,997 | |
JPMorgan Chase & Co., Series HH, 4.60%, (3-Month SOFR + 3.13%), perpetual(2)(4) | | 144,000 | | 143,669 | |
JPMorgan Chase & Co., 1.95%, (SOFR + 1.07%), 02/04/32(2) | | 165,000 | | 138,074 | |
JPMorgan Chase & Co., 5.72%, (SOFR + 2.58%), 09/14/33(2) | | 230,000 | | 236,903 | |
JPMorgan Chase & Co., 6.25%, (SOFR + 1.81%), 10/23/34(2) | | 110,000 | | 118,245 | |
KeyCorp, 4.79%, (SOFR + 2.06%), 06/01/33(2) | | 100,000 | | 95,417 | |
Schedule of Investments — Virtus Newfleet Multi-Sector Bond ETF (continued)
October 31, 2024
The accompanying notes are an integral part of these financial statements.
16
| | | | | |
Security Description | | Principal | | Value | |
| | | | | |
CORPORATE BONDS (continued) | | | | | |
| | | | | |
Financials (continued) | | | | | |
KeyCorp, 6.40%, (SOFR + 2.42%), 03/06/35(2) | | $200,000
| | $211,140
| |
Ladder Capital Finance Holdings LLLP / Ladder Capital Finance Corp., 4.25%, 02/01/27(1) | | 75,000 | | 72,668 | |
Liberty Mutual Group, Inc., 4.13%, (US 5 Year CMT T- Note + 3.32%), 12/15/51(1)(2) | | 210,000 | | 198,221 | |
MetLife, Inc., Series D, 5.88%, (3-Month SOFR + 3.22%), perpetual(2)(4) | | 62,000 | | 62,671 | |
MetLife, Inc., Series G, 3.85%, (US 5 Year CMT T- Note + 3.58%), perpetual(2)(4) | | 185,000 | | 181,497 | |
Midcap Financial Issuer Trust, 6.50%, 05/01/28(1) | | 440,000 | | 416,323 | |
Morgan Stanley, 6.34%, (SOFR + 2.56%), 10/18/33(2) | | 130,000 | | 139,956 | |
Morgan Stanley, 5.25%, (SOFR + 1.87%), 04/21/34(2) | | 190,000 | | 190,347 | |
Morgan Stanley, 5.95%, (US 5 Year CMT T- Note + 2.43%), 01/19/38(2) | | 97,000 | | 98,832 | |
MSCI, Inc., 3.63%, 09/01/30(1) | | 459,000 | | 420,958 | |
National Rural Utilities Cooperative Finance Corp., 7.76%, (3-Month SOFR + 3.17%), 04/30/43(2) | | 105,000 | | 105,015 | |
Nationstar Mortgage Holdings, Inc., 5.75%, 11/15/31(1) | | 185,000 | | 177,124 | |
NCR Atleos Corp., 9.50%, 04/01/29(1) | | 77,000 | | 84,812 | |
Nuveen LLC, 5.85%, 04/15/34(1) | | 180,000 | | 184,827 | |
OneMain Finance Corp., 7.13%, 11/15/31 | | 325,000 | | 328,962 | |
Panther Escrow Issuer LLC, 7.13%, 06/01/31(1) | | 15,000 | | 15,371 | |
Prudential Financial, Inc., 5.13%, (US 5 Year CMT T- Note + 3.16%), 03/01/52(2) | | 99,000 | | 95,864 | |
Prudential Financial, Inc., 6.50%, (US 5 Year CMT T- Note + 2.40%), 03/15/54(2) | | 195,000 | | 203,891 | |
State Street Corp., Series I, 6.70%, (US 5 Year CMT T- Note + 2.61%), perpetual(2)(4) | | 100,000 | | 103,201 | |
State Street Corp., 4.82%, (SOFR + 1.57%), 01/26/34(2) | | 167,000 | | 164,674 | |
State Street Corp., 6.12%, (SOFR + 1.96%), 11/21/34(2) | | 405,000 | | 427,439 | |
Synchrony Financial, 4.88%, 06/13/25 | | 95,000 | | 94,733 | |
Synchrony Financial, 4.50%, 07/23/25 | | 85,000 | | 84,578 | |
Synchrony Financial, 3.70%, 08/04/26 | | 50,000 | | 48,804 | |
Texas Capital Bancshares, Inc., 4.00%, (US 5 Year CMT T- Note + 3.15%), 05/06/31(2) | | 70,000 | | 66,505 | |
Truist Financial Corp., Series Q, 5.10%, (US 10 Year CMT T- Note + 4.35%), perpetual(2)(4) | | 255,000 | | 248,788 | |
Truist Financial Corp., 5.71%, (SOFR + 1.92%), 01/24/35(2) | | 215,000 | | 218,993 | |
Wells Fargo & Co., 6.85%, (US 5 Year CMT T- Note + 2.77%), perpetual(2)(4) | | 125,000 | | 129,189 | |
Wells Fargo & Co., Series U, 5.88%, perpetual(2)(4)(5) | | 60,000 | | 60,010 | |
Wells Fargo & Co., Series BB, 3.90%, (US 5 Year CMT T- Note + 3.45%), perpetual(2)(4) | | 115,000 | | 111,447 | |
Wells Fargo & Co., 5.39%, (SOFR + 2.02%), 04/24/34(2) | | 215,000 | | 216,535 | |
Wells Fargo & Co., 6.49%, (SOFR + 2.06%), 10/23/34(2) | | 140,000 | | 151,326 | |
Total Financials | | | | 13,946,878 | |
| | | | | |
Security Description | | Principal | | Value | |
| | | | | |
CORPORATE BONDS (continued) | | | | | |
| | | | | |
Health Care — 2.3% | | | | | |
Amgen, Inc., 5.25%, 03/02/33 | | $390,000
| | $394,168
| |
Catalent Pharma Solutions, Inc., 3.50%, 04/01/30(1) | | 140,000 | | 135,591 | |
CHS/Community Health Systems, Inc., 5.25%, 05/15/30(1) | | 45,000 | | 39,307 | |
CHS/Community Health Systems, Inc., 4.75%, 02/15/31(1) | | 250,000 | | 208,721 | |
CVS Health Corp., 5.88%, 06/01/53 | | 305,000 | | 293,700 | |
Dentsply Sirona, Inc., 3.25%, 06/01/30 | | 455,000 | | 407,294 | |
Endo Finance Holdings, Inc., 8.50%, 04/15/31(1) | | 215,000 | | 230,152 | |
HCA, Inc., 5.50%, 06/01/33 | | 170,000 | | 170,825 | |
HCA, Inc., 5.60%, 04/01/34 | | 365,000 | | 367,111 | |
Illumina, Inc., 2.55%, 03/23/31 | | 312,000 | | 267,275 | |
Iqvia, Inc., 5.70%, 05/15/28 | | 200,000 | | 204,423 | |
LifePoint Health, Inc., 9.88%, 08/15/30(1) | | 175,000 | | 191,648 | |
LifePoint Health, Inc., 10.00%, 06/01/32(1) | | 75,000 | | 80,116 | |
Medline Borrower LP, 5.25%, 10/01/29(1) | | 150,000 | | 145,420 | |
Medline Borrower LP/Medline Co.-Issuer, Inc., 6.25%, 04/01/29(1) | | 40,000 | | 40,748 | |
Par Pharmaceutical, Inc., 0.00%, 04/01/27(1)(7)(8) | | 35,000 | | 0 | |
Prime Healthcare Services, Inc., 9.38%, 09/01/29(1) | | 265,000 | | 269,517 | |
Royalty Pharma PLC, 5.40%, 09/02/34 | | 310,000 | | 307,948 | |
Universal Health Services, Inc., 2.65%, 01/15/32 | | 231,000 | | 192,544 | |
Universal Health Services, Inc., 5.05%, 10/15/34 | | 455,000 | | 431,867 | |
Total Health Care | | | | 4,378,375 | |
| | | | | |
Industrials — 3.0% | | | | | |
Alaska Airlines Pass-Through Trust, Class A, Series 2020-1, 4.80%, 08/15/27(1) | | 189,459 | | 187,963 | |
Amentum Escrow Corp., 7.25%, 08/01/32(1) | | 35,000 | | 36,283 | |
Aviation Capital Group LLC, 3.50%, 11/01/27(1) | | 146,000 | | 139,144 | |
Aviation Capital Group LLC, 6.75%, 10/25/28(1) | | 80,000 | | 84,199 | |
Bnsf Funding Trust I, 6.61%, (3-Month USD LIBOR + 2.35%), 12/15/55(2) | | 185,000 | | 188,110 | |
Boeing Co. (The), 5.81%, 05/01/50 | | 95,000 | | 89,670 | |
Boeing Co. (The), 5.93%, 05/01/60 | | 143,000 | | 133,401 | |
Builders FirstSource, Inc., 6.38%, 03/01/34(1) | | 230,000 | | 232,141 | |
Chart Industries, Inc., 9.50%, 01/01/31(1) | | 80,000 | | 86,084 | |
CoStar Group, Inc., 2.80%, 07/15/30(1) | | 403,000 | | 352,049 | |
CRH America Finance, Inc., 5.40%, 05/21/34 | | 450,000 | | 456,064 | |
Delta Air Lines Through Trust, Series 2015-1, 3.63%, 07/30/27 | | 75,954 | | 73,488 | |
Fortress Transportation and Infrastructure Investors LLC, 7.00%, 05/01/31(1) | | 110,000 | | 113,227 | |
Fortress Transportation And Infrastructure Investors LLC, 7.00%, 06/15/32(1) | | 25,000 | | 25,668 | |
Global Infrastructure Solutions, Inc., 7.50%, 04/15/32(1) | | 320,000 | | 325,654 | |
Hertz Corp. (The), 4.63%, 12/01/26(1) | | 650,000 | | 491,674 | |
Icahn Enterprises LP / Icahn Enterprises Finance Corp., 5.25%, 05/15/27 | | 90,000 | | 83,934 | |
L3harris Technologies, Inc., 5.35%, 06/01/34 | | 295,000 | | 298,600 | |
LBM Acquisition LLC, 6.25%, 01/15/29(1) | | 350,000 | | 323,181 | |
Schedule of Investments — Virtus Newfleet Multi-Sector Bond ETF (continued)
October 31, 2024
The accompanying notes are an integral part of these financial statements.
17
| | | | | |
Security Description | | Principal | | Value | |
| | | | | |
CORPORATE BONDS (continued) | | | | | |
| | | | | |
Industrials (continued) | | | | | |
Regal Rexnord Corp., 6.40%, 04/15/33 | | $485,000
| | $506,987
| |
Science Applications International Corp., 4.88%, 04/01/28(1) | | 80,000 | | 78,544 | |
Sempra Global, 3.25%, 01/15/32(1) | | 233,000 | | 194,141 | |
TransDigm, Inc., 6.63%, 03/01/32(1) | | 230,000 | | 234,181 | |
TransDigm, Inc., 6.00%, 01/15/33(1) | | 265,000 | | 262,868 | |
United Airlines Pass-Through Trust, Class A, Series 2023-1, 5.80%, 01/15/36 | | 158,380 | | 163,397 | |
United Airlines Pass-Through Trust, Series AA, 5.45%, 02/15/37 | | 40,000 | | 40,735 | |
United Rentals North America, Inc., 3.75%, 01/15/32 | | 265,000 | | 235,208 | |
Veralto Corp., 5.45%, 09/18/33 | | 310,000 | | 314,832 | |
WESCO Distribution, Inc., 6.63%, 03/15/32(1) | | 60,000 | | 61,560 | |
Total Industrials | | | | 5,812,987 | |
| | | | | |
Information Technology — 1.8% | | | | | |
Boost Newco Borrower LLC, 7.50%, 01/15/31(1) | | 95,000 | | 100,242 | |
Booz Allen Hamilton, Inc., 3.88%, 09/01/28(1) | | 130,000 | | 124,735 | |
Booz Allen Hamilton, Inc., 4.00%, 07/01/29(1) | | 110,000 | | 105,140 | |
Broadcom, Inc., 4.80%, 10/15/34 | | 515,000 | | 498,222 | |
Commscope Technologies LLC, 6.00%, 06/15/25(1) | | 325,000 | | 318,906 | |
Consensus Cloud Solutions, Inc., 6.50%, 10/15/28(1) | | 100,000 | | 99,150 | |
Foundry Jv Holdco LLC, 6.25%, 01/25/35(1) | | 290,000 | | 296,909 | |
Gartner, Inc., 3.75%, 10/01/30(1) | | 440,000 | | 405,039 | |
Helios Software Holdings, Inc. / Ion Corporate Solutions Finance Sarl, 8.75%, 05/01/29(1) | | 75,000 | | 76,220 | |
Insight Enterprises, Inc., 6.63%, 05/15/32(1) | | 15,000 | | 15,347 | |
Leidos, Inc., 2.30%, 02/15/31 | | 155,000 | | 132,187 | |
Oracle Corp., 6.25%, 11/09/32 | | 170,000 | | 182,455 | |
Oracle Corp., 5.55%, 02/06/53 | | 250,000 | | 244,403 | |
Rocket Software, Inc., 9.00%, 11/28/28(1) | | 405,000 | | 422,606 | |
Viasat, Inc., 5.63%, 09/15/25(1) | | 180,000 | | 177,828 | |
Vontier Corp., 2.95%, 04/01/31 | | 285,000 | | 245,146 | |
Total Information Technology | | | | 3,444,535 | |
| | | | | |
Materials – 1.9% | | | | | |
Asp Unifrax Holdings, Inc., 5.25%, 09/30/28(1) | | 305,000 | | 164,282 | |
Bayport Polymers LLC, 5.14%, 04/14/32(1) | | 455,000 | | 434,661 | |
Berry Global, Inc., 5.65%, 01/15/34(1) | | 510,000 | | 509,548 | |
Graham Packaging Co., Inc., 7.13%, 08/15/28(1) | | 345,000 | | 335,944 | |
Illuminate Buyer LLC / Illuminate Holdings IV, Inc., 9.00%, 07/01/28(1) | | 465,000 | | 471,455 | |
LSB Industries, Inc., 6.25%, 10/15/28(1) | | 465,000 | | 450,330 | |
Mauser Packaging Solutions Holding Co., 9.25%, 04/15/27(1) | | 330,000 | | 337,765 | |
New Enterprise Stone & Lime Co., Inc., 9.75%, 07/15/28(1) | | 85,000 | | 86,366 | |
Sealed Air Corp., 6.50%, 07/15/32(1) | | 65,000 | | 66,038 | |
Sonoco Products Co., 5.00%, 09/01/34 | | 285,000 | | 273,204 | |
| | | | | |
Security Description | | Principal | | Value | |
| | | | | |
CORPORATE BONDS (continued) | | | | | |
| | | | | |
Materials (continued) | | | | | |
Windsor Holdings III LLC, 8.50%, 06/15/30(1) | | $165,000
| | $173,854
| |
WR Grace Holdings LLC, 5.63%, 08/15/29(1) | | 250,000 | | 231,161 | |
Total Materials | | | | 3,534,608 | |
| | | | | |
Real Estate – 0.6% | | | | | |
EPR Properties, 3.60%, 11/15/31 | | 410,000 | | 361,605 | |
GLP Capital LP / GLP Financing II, Inc., 6.75%, 12/01/33 | | 155,000 | | 165,718 | |
Office Properties Income Trust, 9.00%, 09/30/29(1) | | 131,000 | | 110,807 | |
Safehold GL Holdings LLC, 6.10%, 04/01/34 | | 290,000 | | 299,310 | |
VICI Properties LP, 5.13%, 05/15/32 | | 135,000 | | 132,322 | |
VICI Properties LP, 5.75%, 04/01/34 | | 25,000 | | 25,415 | |
VICI Properties LP / VICI Note Co., Inc., 4.63%, 06/15/25(1) | | 15,000 | | 14,932 | |
VICI Properties LP / VICI Note Co., Inc., 4.13%, 08/15/30(1) | | 115,000 | | 106,655 | |
Total Real Estate | | | | 1,216,764 | |
| | | | | |
Utilities — 1.8% | | | | | |
AES Corp. (The), 7.60%, (US 5 Year CMT T- Note + 3.20%), 01/15/55(2) | | 285,000 | | 295,534 | |
Black Hills Corp., 6.15%, 05/15/34 | | 405,000 | | 425,079 | |
CMS Energy Corp., 4.75%, (US 5 Year CMT T- Note + 4.12%), 06/01/50(2) | | 370,000 | | 356,153 | |
Dominion Energy, Inc., Series B, 7.00%, (US 5 Year CMT T- Note + 2.51%), 06/01/54(2) | | 395,000 | | 421,268 | |
Entergy Corp., 7.13%, (US 5 Year CMT T- Note + 2.67%), 12/01/54(2) | | 250,000 | | 256,220 | |
Ferrellgas LP / Ferrellgas Finance Corp., 5.38%, 04/01/26(1) | | 55,000 | | 54,659 | |
Ferrellgas LP / Ferrellgas Finance Corp., 5.88%, 04/01/29(1) | | 210,000 | | 196,217 | |
KeySpan Gas East Corp., 5.99%, 03/06/33(1) | | 426,000 | | 438,696 | |
Lightning Power LLC, 7.25%, 08/15/32(1) | | 10,000 | | 10,412 | |
NRG Energy, Inc., 7.00%, 03/15/33(1) | | 226,000 | | 245,392 | |
Pacificorp, 5.80%, 01/15/55 | | 125,000 | | 125,158 | |
Puget Energy, Inc., 4.22%, 03/15/32 | | 275,000 | | 252,841 | |
Southern Co. (The), Series 21-A, 3.75%, (US 5 Year CMT T- Note + 2.92%), 09/15/51(2) | | 248,000 | | 238,826 | |
Vistra Corp., 8.00%, (US 5 Year CMT T- Note + 6.93%), perpetual(1)(2)(4) | | 51,000 | | 52,425 | |
Vistra Operations Co. LLC, 6.88%, 04/15/32(1) | | 120,000 | | 124,176 | |
Total Utilities | | | | 3,493,056 | |
| | | | | |
Total Corporate Bonds | | | | | |
(Cost $51,426,811) | | | | 52,020,501 | |
Schedule of Investments — Virtus Newfleet Multi-Sector Bond ETF (continued)
October 31, 2024
The accompanying notes are an integral part of these financial statements.
18
| | | | | |
Security Description | | Principal | | Value | |
| | | | | |
FOREIGN BONDS — 19.9% | | | | | |
| | | | | |
Communication Services — 0.3% | | | | | |
Altice Financing SA, 5.00%, 01/15/28 (Luxembourg)(1) | | $465,000
| | $393,709
| |
Altice France SA/France, 5.13%, 07/15/29 (France)(1) | | 200,000 | | 149,817 | |
Telesat Canada / Telesat LLC, 6.50%, 10/15/27 (Canada)(1) | | 35,000 | | 10,997 | |
Total Communication Services | | | | 554,523 | |
| | | | | |
Consumer Discretionary — 1.0% | | | | | |
1011778 BC ULC / New Red Finance, Inc., 6.13%, 06/15/29 (Canada)(1) | | 50,000 | | 50,909 | |
Ashtead Capital, Inc., 5.50%, 08/11/32 (United Kingdom)(1) | | 235,000 | | 234,417 | |
Ashtead Capital, Inc., 5.80%, 04/15/34 (United Kingdom)(1) | | 200,000 | | 202,756 | |
Aston Martin Capital Holdings Ltd., 10.00%, 03/31/29 (Jersey Island)(1) | | 365,000 | | 354,925 | |
Great Canadian Gaming Corp., 8.75%, 11/15/29 (Canada)(1) | | 90,000 | | 90,000 | |
Melco Resorts Finance Ltd., 5.38%, 12/04/29 (Hong Kong)(1) | | 441,000 | | 406,547 | |
Merlin Entertainments Group US Holdings, Inc., 7.38%, 02/15/31 (United Kingdom)(1) | | 200,000 | | 196,284 | |
Raptor Acquisition Corp. / Raptor Co.-Issuer LLC, 4.88%, 11/01/26 (Canada)(1) | | 360,000 | | 357,271 | |
Total Consumer Discretionary | | | | 1,893,109 | |
| | | | | |
Consumer Staples — 0.3% | | | | | |
Bat Capital Corp., 7.75%, 10/19/32 (United Kingdom) | | 245,000 | | 281,558 | |
Bat Capital Corp., 4.39%, 08/15/37 (United Kingdom) | | 100,000 | | 87,212 | |
Minerva Luxembourg SA, 8.88%, 09/13/33 (Brazil)(1) | | 158,000 | | 165,702 | |
Sigma Holdco BV, 7.88%, 05/15/26 (Netherlands)(1) | | 8,000 | | 7,933 | |
Total Consumer Staples | | | | 542,405 | |
| | | | | |
Energy — 2.9% | | | | | |
Adnoc Murban Rsc Ltd., 4.50%, 09/11/34 (United Arab Emirates)(1) | | 455,000 | | 434,245 | |
AKER BP ASA, 5.13%, 10/01/34 (Norway)(1) | | 230,000 | | 220,231 | |
AKER BP ASA, 5.80%, 10/01/54 (Norway)(1) | | 155,000 | | 145,300 | |
BP Capital Markets PLC, 4.88%, (US 5 Year CMT T- Note + 4.40%), perpetual(2)(4) | | 495,000 | | 483,042 | |
Coronado Finance Pty Ltd., 9.25%, 10/01/29 (Australia)(1) | | 480,000 | | 491,398 | |
Ecopetrol SA, 4.63%, 11/02/31 (Colombia) | | 128,000 | | 105,952 | |
Enbridge, Inc., 8.50%, (US 5 Year CMT T- Note + 4.43%), 01/15/84 (Canada)(2) | | 30,000 | | 33,406 | |
Greensaif Pipelines Bidco Sarl, 6.13%, 02/23/38 (Saudi Arabia)(1) | | 70,000 | | 71,837 | |
KazMunayGas National Co. JSC, 6.38%, 10/24/48 (Kazakhstan)(1) | | 101,000 | | 96,108 | |
| | | | | |
Security Description | | Principal | | Value | |
| | | | | |
FOREIGN BONDS (continued) | | | | | |
| | | | | |
Energy (continued) | | | | | |
Pertamina Persero PT, 2.30%, 02/09/31 (Indonesia)(1) | | $535,000
| | $456,590
| |
Petroleos Mexicanos, 6.50%, 03/13/27 (Mexico) | | 245,000 | | 240,595 | |
Petroleos Mexicanos, 6.70%, 02/16/32 (Mexico) | | 628,000 | | 558,725 | |
Petroleos Mexicanos, 7.69%, 01/23/50 (Mexico) | | 187,000 | | 145,748 | |
Petronas Capital Ltd., 3.50%, 04/21/30 (Malaysia)(1) | | 300,000 | | 280,265 | |
Qatarenergy, 2.25%, 07/12/31 (Qatar)(1) | | 405,000 | | 348,806 | |
Saudi Arabian Oil Co., 5.25%, 07/17/34
(Saudi Arabia)(1) | | 427,000 | | 428,200 | |
South Bow Canadian Infrastructure Holdings Ltd., 7.50%, (US 5 Year CMT T- Note + 3.67%), 03/01/55 (Canada)(1)(2) | | 380,000 | | 394,901 | |
South Bow USA Infrastructure Holdings LLC, 5.58%, 10/01/34 (Canada)(1) | | 140,000 | | 138,396 | |
Teine Energy Ltd., 6.88%, 04/15/29 (Canada)(1) | | 110,000 | | 108,719 | |
Transcanada Trust, 5.60%, (US 5 Year CMT T- Note + 3.99%), 03/07/82 (Canada)(2) | | 280,000 | | 267,627 | |
Total Energy | | | | 5,450,091 | |
| | | | | |
Financials — 3.0% | | | | | |
AerCap Ireland Capital DAC / AerCap Global Aviation Trust, 2.45%, 10/29/26 (Ireland) | | 175,000 | | 167,088 | |
AerCap Ireland Capital DAC / AerCap Global Aviation Trust, 3.30%, 01/30/32 (Ireland) | | 120,000 | | 105,555 | |
AerCap Ireland Capital DAC / AerCap Global Aviation Trust, 4.95%, 09/10/34 (Ireland) | | 150,000 | | 144,514 | |
AerCap Ireland Capital DAC / AerCap Global Aviation Trust, 6.95%, (US 5 Year CMT T- Note + 2.72%), 03/10/55 (Ireland)(2) | | 150,000 | | 154,690 | |
Allianz SE, 6.35%, (US 5 Year CMT T- Note + 3.23%), 09/06/53 (Germany)(1)(2) | | 205,000 | | 218,419 | |
Allianz SE, 5.60%, (US 5 Year CMT T- Note + 2.77%), 09/03/54 (Germany)(1)(2) | | 180,000 | | 181,701 | |
Ascot Group Ltd., 4.25%, 12/15/30 (Bermuda)(1) | | 195,000 | | 169,259 | |
Banco de Credito del Peru S.A., 3.13%, (US 5 Year CMT T- Note + 3.00%), 07/01/30 (Peru)(1)(2) | | 325,000 | | 317,427 | |
Banco de Credito del Peru S.A., 3.13%, (US 5 Year CMT T- Note + 3.00%), 07/01/30 (Peru)(2) | | 36,000 | | 35,168 | |
Banco de Credito E Inversiones SA, 8.75%, (US 5 Year CMT T- Note + 4.94%), perpetual (Chile)(1)(2)(4) | | 213,000 | | 225,514 | |
Banco Mercantil del Norte SA, 6.63%, (US 10 Year CMT T- Note + 5.03%), perpetual (Mexico)(1)(2)(4) | | 285,000 | | 260,330 | |
Barclays, 7.44%, (US 1 Year CMT T- Note + 3.50%), 11/02/33 (United Kingdom)(2) | | 200,000 | | 224,512 | |
BBVA Bancomer SA, 5.13%, (US 5 Year CMT T- Note + 2.65%), 01/18/33 (Mexico)(1)(2) | | 248,000 | | 232,965 | |
Bpce SA, 7.00%, (SOFR + 2.59%), 10/19/34 (France)(1)(2) | | 315,000 | | 343,945 | |
Brookfield Finance, Inc., 6.35%, 01/05/34 (Canada) | | 185,000 | | 198,147 | |
Deutsche Bank AG/New York NY, 5.40%, (SOFR + 2.05%), 09/11/35 (Germany)(2) | | 375,000 | | 364,207 | |
Export-Import Bank of Korea, 5.13%, 01/11/33 (South Korea) | | 240,000 | | 244,681 | |
Schedule of Investments — Virtus Newfleet Multi-Sector Bond ETF (continued)
October 31, 2024
The accompanying notes are an integral part of these financial statements.
19
| | | | | |
Security Description | | Principal | | Value | |
| | | | | |
FOREIGN BONDS (continued) | | | | | |
| | | | | |
Financials (continued) | | | | | |
Gaci First Investment Co., 4.88%, 02/14/35 (Saudi Arabia) | | $400,000
| | $385,875
| |
GGAM Finance Ltd., 6.88%, 04/15/29 (Cayman Islands)(1) | | 120,000 | | 122,588 | |
Natwest Group PLC, 6.48%, (US 5 Year CMT T- Note + 2.20%), 06/01/34 (United Kingdom)(2) | | 435,000 | | 450,171 | |
Nippon Life Insurance Co., 6.25%, (US 5 Year CMT T- Note + 2.95%), 09/13/53 (Japan)(1)(2) | | 200,000 | | 211,745 | |
Societe Generale SA, 6.07%, (US 1 Year CMT T- Note + 2.10%), 01/19/35 (France)(1)(2) | | 380,000 | | 384,673 | |
Toronto-Dominion Bank (The), 8.13%, (US 5 Year CMT T- Note + 4.08%), 10/31/82 (Canada)(2) | | 335,000 | | 353,812 | |
UBS Group AG, 9.25%, (US 5 Year CMT T- Note + 4.76%), perpetual (Switzerland)(1)(2)(4) | | 60,000 | | 69,617 | |
UBS Group AG, 4.99%, (US 1 Year CMT T- Note + 2.40%), 08/05/33 (Switzerland)(1)(2) | | 230,000 | | 227,145 | |
Total Financials | | | | 5,793,748 | |
| | | | | |
Government — 8.9% | | | | | |
Abu Dhabi Government International Bond, 5.00%, 04/30/34 (United Arab Emirates)(1) | | 115,000 | | 117,372 | |
Abu Dhabi Government International Bond, 3.88%, 04/16/50 (United Arab Emirates)(1) | | 336,000 | | 269,640 | |
Angolan Government International Bond, 8.75%, 04/14/32 (Angola)(1) | | 246,000 | | 223,388 | |
Argentine Republic Government International Bond, 0.75%, 07/09/30 (Argentina)(6) | | 1,031,040 | | 696,294 | |
Bahrain Government International Bond, 5.63%, 05/18/34 (Bahrain)(1) | | 273,000 | | 253,975 | |
Benin Government International Bond, 7.96%, 02/13/38 (Benin)(1) | | 15,000 | | 14,737 | |
Brazilian Government International Bond, 6.25%, 03/18/31 (Brazil) | | 85,000 | | 86,718 | |
Brazilian Government International Bond, 6.00%, 10/20/33 (Brazil) | | 308,000 | | 305,998 | |
Brazilian Government International Bond, 7.13%, 05/13/54 (Brazil) | | 336,000 | | 336,428 | |
Chile Government International Bond, 5.33%, 01/05/54 (Chile) | | 380,000 | | 367,175 | |
Colombia Government International Bond, 8.00%, 11/14/35 (Colombia) | | 575,000 | | 582,944 | |
Costa Rica Government International Bond, 6.55%, 04/03/34 (Costa Rica)(1) | | 96,000 | | 99,990 | |
Costa Rica Government International Bond, 7.30%, 11/13/54 (Costa Rica)(1) | | 45,000 | | 47,745 | |
Dominican Republic International Bond, 4.88%, 09/23/32 (Dominican Republic)(1) | | 541,000 | | 495,015 | |
Ecuador Government International Bond, 6.90%, 07/31/30 (Ecuador)(1)(6) | | 388,000 | | 268,302 | |
Ecuador Government International Bond, 6.90%, 07/31/30 (Ecuador)(6) | | 218,000 | | 150,747 | |
Egypt Government International Bond, 5.88%, 02/16/31 (Egypt)(1) | | 255,000 | | 212,289 | |
Egypt Government International Bond, 8.50%, 01/31/47 (Egypt)(1) | | 297,000 | | 236,136 | |
| | | | | |
Security Description | | Principal | | Value | |
| | | | | |
FOREIGN BONDS (continued) | | | | | |
| | | | | |
Government (continued) | | | | | |
El Salvador Government International Bond, 7.65%, 06/15/35 (El Salvador)(1) | | $52,000
| | $45,500
| |
Ethiopia International Bond, 6.63%, 12/11/24 (Ethiopia)(1)(8) | | 195,000 | | 152,770 | |
Finance Department Government of Sharjah, 4.00%, 07/28/50 (United Arab Emirates)(1) | | 470,000 | | 319,894 | |
Gabon Government International Bond, 6.95%, 06/16/25 (Gabon)(1) | | 40,000 | | 39,062 | |
Ghana Government International Bond, 5.28%, 07/03/26 (Ghana)(9) | | 6,400 | | 5,961 | |
Ghana Government International Bond, 5.00%, 07/03/29 (Ghana)(6) | | 48,400 | | 41,685 | |
Ghana Government International Bond, 5.12%, 01/03/30 (Ghana)(9) | | 11,078 | | 8,433 | |
Ghana Government International Bond, 5.00%, 07/03/35 (Ghana)(1)(6) | | 168,000 | | 117,180 | |
Ghana Government International Bond, 5.00%, 07/03/35 (Ghana)(6) | | 69,600 | | 48,546 | |
Guatemala Government Bond, 6.60%, 06/13/36 (Guatemala)(1) | | 309,000 | | 314,601 | |
Hungary Government International Bond, 6.25%, 09/22/32 (Hungary)(1) | | 369,000 | | 384,221 | |
Indonesia Government International Bond, 2.85%, 02/14/30 (Indonesia) | | 430,000 | | 391,423 | |
Indonesia Government International Bond, 4.75%, 09/10/34 (Indonesia) | | 685,000 | | 671,940 | |
Iraq Government International Bond, 5.80%, 01/15/28 (Iraq) | | 241,063 | | 232,851 | |
Ivory Coast Government International Bond, 6.13%, 06/15/33 (Ivory Coast)(1) | | 200,000 | | 181,748 | |
Ivory Coast Government International Bond, 8.25%, 01/30/37 (Ivory Coast)(1) | | 138,000 | | 137,656 | |
Jordan Government International Bond, 7.50%, 01/13/29 (Jordan)(1) | | 50,000 | | 50,812 | |
Jordan Government International Bond, 5.85%, 07/07/30 (Jordan)(1) | | 35,000 | | 33,195 | |
Lebanon Government International Bond, 7.00%, 03/23/32 (Lebanon)(8) | | 259,000 | | 22,015 | |
Mexico Government International Bond, 3.50%, 02/12/34 (Mexico) | | 320,000 | | 261,100 | |
Mexico Government International Bond, 6.35%, 02/09/35 (Mexico) | | 273,000 | | 274,502 | |
Mexico Government International Bond, 6.00%, 05/07/36 (Mexico) | | 285,000 | | 277,210 | |
Mexico Government International Bond, 6.34%, 05/04/53 (Mexico) | | 436,000 | | 406,843 | |
Morocco Government International Bond, 3.00%, 12/15/32 (Morocco)(1) | | 123,000 | | 101,898 | |
Nigeria Government International Bond, 7.38%, 09/28/33 (Nigeria)(1) | | 301,000 | | 255,189 | |
Oman Government International Bond, 6.75%, 01/17/48 (Oman)(1) | | 317,000 | | 328,095 | |
Pakistan Government International Bond, 7.38%, 04/08/31 (Pakistan)(1) | | 128,000 | | 108,640 | |
Schedule of Investments — Virtus Newfleet Multi-Sector Bond ETF (continued)
October 31, 2024
The accompanying notes are an integral part of these financial statements.
20
| | | | | |
Security Description | | Principal | | Value | |
| | | | | |
FOREIGN BONDS (continued) | | | | | |
| | | | | |
Government (continued) | | | | | |
Panama Government International Bond, 3.88%, 03/17/28 (Panama) | | $70,000
| | $65,870
| |
Panama Government International Bond, 7.50%, 03/01/31 (Panama) | | 135,000 | | 142,153 | |
Panama Government International Bond, 8.00%, 03/01/38 (Panama) | | 473,000 | | 499,606 | |
Paraguay Government International Bond, 6.00%, 02/09/36 (Paraguay)(1) | | 121,000 | | 124,061 | |
Peruvian Government International Bond, 5.88%, 08/08/54 (Peru) | | 120,000 | | 118,925 | |
Philippine Government International Bond, 4.75%, 03/05/35 (Philippines) | | 309,000 | | 301,854 | |
Philippine Government International Bond, 3.70%, 03/01/41 (Philippines) | | 325,000 | | 268,631 | |
Qatar Government International Bond, 3.75%, 04/16/30 (Qatar)(1) | | 235,000 | | 227,289 | |
Republic of Armenia International Bond, 3.60%, 02/02/31 (Armenia)(1) | | 100,000 | | 84,125 | |
Republic of Kenya Government International Bond, 8.00%, 05/22/32 (Kenya)(1) | | 104,000 | | 95,940 | |
Republic of Poland Government International Bond, 4.88%, 10/04/33 (Poland) | | 509,000 | | 501,670 | |
Republic of South Africa Government International Bond, 5.88%, 06/22/30 (South Africa) | | 297,000 | | 290,318 | |
Republic of South Africa Government International Bond, 5.65%, 09/27/47 (South Africa) | | 210,000 | | 164,850 | |
Republic of Uzbekistan International Bond, 6.90%, 02/28/32 (Uzbekistan)(1) | | 169,000 | | 166,729 | |
Romanian Government International Bond, 7.13%, 01/17/33 (Romania)(1) | | 443,000 | | 469,718 | |
Saudi Government International Bond, 4.88%, 07/18/33 (Saudi Arabia)(1) | | 394,000 | | 390,922 | |
Saudi Government International Bond, 4.50%, 10/26/46 (Saudi Arabia)(1) | | 890,000 | | 752,050 | |
Senegal Government International Bond, 6.25%, 05/23/33 (Senegal)(1) | | 60,000 | | 49,708 | |
Serbia International Bond, 6.50%, 09/26/33 (Serbia)(1) | | 226,000 | | 236,594 | |
Sri Lanka Government International Bond, 6.20%, 05/11/27 (Sri Lanka)(1)(8) | | 211,000 | | 132,139 | |
Trinidad & Tobago Government International Bond, 6.40%, 06/26/34 (Trinidad and Tobago)(1) | | 45,000 | | 45,197 | |
Turkey Government International Bond, 9.38%, 03/14/29 (Turkey) | | 150,000 | | 167,438 | |
Turkey Government International Bond, 7.63%, 04/26/29 (Turkey) | | 150,000 | | 157,219 | |
Turkey Government International Bond, 9.13%, 07/13/30 (Turkey) | | 575,000 | | 642,922 | |
Turkiye Government International Bond, 7.63%, 05/15/34 (Turkey) | | 430,000 | | 443,932 | |
Turkiye Government International Bond, 6.63%, 02/17/45 (Turkey) | | 214,000 | | 186,983 | |
Ukraine Government International Bond, 1.75%, 02/01/29 (Ukraine)(6) | | 14,422 | | 8,695 | |
Ukraine Government International Bond, 1.75%, 02/01/29 (Ukraine)(1)(6) | | 14,422 | | 8,686 | |
| | | | | |
Security Description | | Principal | | Value | |
| | | | | |
FOREIGN BONDS (continued) | | | | | |
| | | | | |
Government (continued) | | | | | |
Ukraine Government International Bond, 16.34%, 02/01/30 (Ukraine)(1)(6)(9) | | $2,626
| | $1,266
| |
Ukraine Government International Bond, 16.34%, 02/01/30 (Ukraine)(6)(9) | | 2,626 | | 1,266 | |
Ukraine Government International Bond, 12.84%, 02/01/34 (Ukraine)(6)(9) | | 9,813 | | 3,633 | |
Ukraine Government International Bond, 12.84%, 02/01/34 (Ukraine)(1)(6)(9) | | 9,813 | | 3,633 | |
Ukraine Government International Bond, 1.75%, 02/01/34 (Ukraine)(6) | | 14,422 | | 6,811 | |
Ukraine Government International Bond, 1.75%, 02/01/34 (Ukraine)(1)(6) | | 14,422 | | 6,811 | |
Ukraine Government International Bond, 8.84%, 02/01/35 (Ukraine)(6)(9) | | 8,292 | | 4,053 | |
Ukraine Government International Bond, 8.84%, 02/01/35 (Ukraine)(1)(6)(9) | | 8,292 | | 4,063 | |
Ukraine Government International Bond, 1.75%, 02/01/35 (Ukraine)(1)(6) | | 119,825 | | 55,269 | |
Ukraine Government International Bond, 1.75%, 02/01/35 (Ukraine)(6) | | 16,825 | | 7,761 | |
Ukraine Government International Bond, 8.21%, 02/01/36 (Ukraine)(1)(6)(9) | | 6,910 | | 3,360 | |
Ukraine Government International Bond, 8.21%, 02/01/36 (Ukraine)(6)(9) | | 6,910 | | 3,360 | |
Ukraine Government International Bond, 1.75%, 02/01/36 (Ukraine)(1)(6) | | 2,403 | | 1,090 | |
Ukraine Government International Bond, 1.75%, 02/01/36 (Ukraine)(6) | | 2,403 | | 1,090 | |
Venezuela Government International Bond, 9.38%, 01/13/34 (Venezuela)(8) | | 702,000 | | 116,181 | |
Zambia Government International Bond, 5.75%, 06/30/33 (Zambia)(1)(6) | | 25,376 | | 22,346 | |
Zambia Government International Bond, 0.50%, 12/31/53 (Zambia)(1) | | 24,000 | | 12,990 | |
Total Government | | | | 16,977,070 | |
| | | | | |
Health Care — 0.7% | | | | | |
Cheplapharm Arzneimittel GMBH, 5.50%, 01/15/28 (Germany)(1) | | 190,000 | | 183,455 | |
Grifols SA, 4.75%, 10/15/28 (Spain)(1) | | 115,000 | | 106,091 | |
ICON Investments Six Designated Activity Company, 6.00%, 05/08/34 (Ireland) | | 545,000 | | 558,534 | |
Smith & Nephew PLC, 5.40%, 03/20/34 (United Kingdom) | | 405,000 | | 407,116 | |
Teva Pharmaceutical Finance Netherlands III BV, 3.15%, 10/01/26 (Netherlands) | | 80,000 | | 76,325 | |
Total Health Care | | | | 1,331,521 | |
| | | | | |
Industrials — 1.0% | | | | | |
Adani Ports & Special Economic Zone Ltd., 4.38%, 07/03/29 (India)(1) | | 460,000 | | 427,800 | |
Avolon Holdings Funding Ltd., 4.38%, 05/01/26 (Ireland)(1) | | 282,000 | | 277,772 | |
Schedule of Investments — Virtus Newfleet Multi-Sector Bond ETF (continued)
October 31, 2024
The accompanying notes are an integral part of these financial statements.
21
| | | | | |
Security Description | | Principal | | Value | |
| | | | | |
FOREIGN BONDS (continued) | | | | | |
| | | | | |
Industrials (continued) | | | | | |
British Airways Pass-Through Trust, Class A, Series 2021-1, 2.90%, 03/15/35
(United Kingdom)(1) | | $298,786
| | $265,052
| |
Cimpress PLC, 7.38%, 09/15/32 (Ireland)(1) | | 380,000 | | 374,583 | |
DP World PLC, 6.85%, 07/02/37 (United
Arab Emirates)(1) | | 30,000 | | 33,187 | |
VistaJet Malta Finance PLC / Vista Management Holding, Inc., 9.50%, 06/01/28 (Switzerland)(1) | | 490,000 | | 481,891 | |
Wrangler Holdco Corp., 6.63%, 04/01/32
(Canada)(1) | | 105,000 | | 107,326 | |
Total Industrials | | | | 1,967,611 | |
| | | | | |
Information Technology — 0.3% | | | | | |
Garda World Security Corp., 8.38%, 11/15/32 (Canada)(1) | | 245,000 | | 245,286 | |
Ion Trading Technologies Sarl, 9.50%, 05/30/29 (Luxembourg)(1) | | 375,000 | | 381,450 | |
Total Information Technology | | | | 626,736 | |
| | | | | |
Materials — 1.0% | | | | | |
Corp. Nacional del Cobre de Chile, 5.95%, 01/08/34 (Chile)(1) | | 249,000 | | 252,813 | |
FMG Resources August 2006 Pty Ltd., 5.88%, 04/15/30 (Australia)(1) | | 100,000 | | 99,609 | |
Glencore Funding LLC, 5.63%, 04/04/34 (Australia)(1) | | 265,000 | | 269,311 | |
INEOS Quattro Finance 2 PLC, 3.38%, 01/15/26 (United Kingdom)(1) | | 81,000 | | 79,121 | |
INEOS Quattro Finance 2 PLC, 9.63%, 03/15/29 (United Kingdom)(1) | | 250,000 | | 265,143 | |
NOVA Chemicals Corp., 5.00%, 05/01/25 (Canada)(1) | | 48,000 | | 47,836 | |
Smurfit Kappa Treasury Ulc, 5.44%, 04/03/34 (Ireland)(1) | | 425,000 | | 428,048 | |
Taseko Mines Ltd., 8.25%, 05/01/30 (Canada)(1) | | 150,000 | | 155,189 | |
Trivium Packaging Finance BV, 8.50%, 08/15/27 (Netherlands)(1) | | 308,000 | | 307,419 | |
Total Materials | | | | 1,904,489 | |
| | | | | |
Utilities — 0.5% | | | | | |
Electricite de France SA, 6.25%, 05/23/33
(France)(1) | | 200,000 | | 211,888 | |
Electricite de France SA, 6.90%, 05/23/53
(France)(1) | | 235,000 | | 261,391 | |
ENEL Finance International NV, 7.50%, 10/14/32 (Italy)(1) | | 200,000 | | 227,724 | |
ENEL Finance International NV, 5.50%, 06/26/34 (Italy)(1) | | 110,000 | | 111,044 | |
Perusahaan Listrik Negara PT, 4.13%, 05/15/27 (Indonesia)(1) | | 150,000 | | 147,844 | |
Total Utilities | | | | 959,891 | |
| | | | | |
Total Foreign Bonds | | | | | |
(Cost $37,594,747) | | | | 38,001,194 | |
| | | | | |
Security Description | | Principal | | Value | |
| | | | | |
TERM LOANS — 12.7% | | | | | |
| | | | | |
Aerospace — 0.3% | | | | | |
Brown Group Holding, LLC, 7.34%, (1-Month SOFR + 2.75%), 07/01/31(2) | | $49,998
| | $50,025
| |
Brown Group Holding, LLC, 7.44%, (1-Month SOFR + 2.75%), 07/01/31(2) | | 31,277 | | 31,294 | |
Brown Group Holding, LLC, 7.81%, (3-Month SOFR + 2.75%), 07/01/31(2) | | 23,725 | | 23,738 | |
Dynasty Acquisition Co, Inc., 0.00%, (SOFR + 0.00%), 08/24/28(10) | | 26,357 | | 26,390 | |
Dynasty Acquisition Co, Inc., 0.00%, (SOFR + 0.00%), 08/24/28(10) | | 10,163 | | 10,176 | |
Dynasty Acquisition Co, Inc., 8.35%, (1-Month SOFR + 3.50%), 08/24/28(2) | | 62,416 | | 62,494 | |
Dynasty Acquisition Co, Inc., 8.35%, (1-Month SOFR + 3.50%), 08/24/28(2) | | 22,892 | | 22,920 | |
Peraton Corp., 8.54%, (1-Month SOFR + 3.85%), 02/01/28(2) | | 216,667 | | 210,292 | |
TransDigm, Inc., 7.32%, (3-Month SOFR + 2.50%), 01/19/32(2) | | 180,000 | | 180,281 | |
Total Aerospace | | | | 617,610 | |
| | | | | |
Chemicals — 0.2% | | | | | |
INEOS US Finance LLC, 7.94%, (1-Month SOFR + 3.25%), 02/18/30(2) | | 115,000 | | 115,252 | |
Innophos Holdings, Inc., 8.55%, (1-Month SOFR + 3.86%), 02/05/27(2) | | 168,817 | | 169,406 | |
LSF11 A5 Holdco LLC, 8.30%, (1-Month SOFR + 3.61%), 10/15/28(2) | | 59,246 | | 59,548 | |
Lummus Technology Holdings V LLC, 0.00%, (SOFR + 0.00%), 12/31/29(10) | | 35,000 | | 35,085 | |
Lummus Technology Holdings V LLC, 8.30%, (1-Month SOFR + 3.61%), 12/31/29(2) | | 44,775 | | 44,883 | |
Nouryon Finance BV, 8.63%, (3-Month SOFR + 3.50%), 04/03/28(2) | | 54,588 | | 54,963 | |
Total Chemicals | | | | 479,137 | |
| | | | | |
Consumer Durables — 0.3% | | | | | |
Madison Safety & Flow, 0.00%, (SOFR + 0.00%), 09/26/31(10) | | 90,000 | | 90,469 | |
Madison Safety & Flow, 7.97%, (1-Month SOFR + 3.25%), 09/26/31(2) | | 55,000 | | 55,286 | |
Plastipak Holdings, 7.94%, (1-Month SOFR + 3.25%), 10/19/29(2) | | 135,000 | | 134,879 | |
Protective Industrial Products, Inc., 0.00%, (SOFR + 0.00%), 12/29/27(10) | | 100,000 | | 99,750 | |
Protective Industrial Products, Inc., 8.80%, (1-Month SOFR + 4.11%), 12/29/27(2) | | 119,202 | | 118,904 | |
Total Consumer Durables | | | | 499,288 | |
| | | | | |
Consumer Non—Durables — 0.4% | | | | | |
Aggreko (Albion), 9.10%, (3-Month SOFR + 4.51%), 08/16/29(2) | | 74,813 | | 75,156 | |
CULLIGAN HOLDINGS (AI AQUA/OSMOSIS), 0.00%, (SOFR + 0.00%), 07/31/28(10) | | 260,000 | | 260,758 | |
Schedule of Investments — Virtus Newfleet Multi-Sector Bond ETF (continued)
October 31, 2024
The accompanying notes are an integral part of these financial statements.
22
| | | | | |
Security Description | | Principal | | Value | |
| | | | | |
TERM LOANS (continued) | | | | | |
| | | | | |
Consumer Non-Durables (continued) | | | | | |
DS Parent, Inc., 0.00%, (SOFR + 0.00%), 01/31/31(10) | | $100,000
| | $95,562
| |
DS Parent, Inc., 10.10%, (3-Month SOFR + 5.50%), 12/13/30(2) | | 159,850 | | 152,757 | |
Kronos Acquisition Holdings, Inc. / KIK Custom Products, Inc., 8.58%, (3-Month SOFR + 4.00%), 07/08/31(2) | | 118,466 | | 111,654 | |
Varsity Brands LLC, 8.82%, (3-Month SOFR + 3.75%), 08/26/31(2) | | 115,000 | | 114,689 | |
Total Consumer Non-Durables | | | | 810,576 | |
| | | | | |
Energy — 0.4% | | | | | |
EPIC Crude Services LP, 7.66%, (3-Month SOFR + 3.00%), 10/10/31(2) | | 170,000 | | 170,152 | |
Freeport LNG Investments, 0.00%, (SOFR + 0.00%), 12/21/28 (10) | | 99,742 | | 99,328 | |
Freeport LNG Investments, 8.38%, (3-Month SOFR + 3.50%), 12/21/28(2) | | 168,006 | | 167,309 | |
Hamilton Projects Acquiror LLC, 8.44%, (1-Month SOFR + 3.75%), 05/22/31(2) | | 34,913 | | 35,109 | |
NGP XI Midstream Holdings LLC, 8.60%, (3-Month SOFR + 4.00%), 07/25/31(2) | | 75,000 | | 75,141 | |
Oryx Midstream Services Permian Basin LLC, 7.92%, (1-Month SOFR + 3.11%), 10/05/28(2) | | 58,077 | | 58,178 | |
Traverse Midstream, 8.09%, (3-Month SOFR + 3.50%), 02/16/28(2) | | 99,845 | | 100,344 | |
Total Energy | | | | 705,561 | |
| | | | | |
Financials — 0.4% | | | | | |
Acrisure LLC, 7.76%, (1-Month SOFR + 3.00%), 02/16/27(2) | | 38,098 | | 38,092 | |
Acrisure LLC, 8.01%, (1-Month SOFR + 3.25%), 11/06/30(2) | | 294,175 | | 294,084 | |
AssuredPartners, Inc., 8.19%, (1-Month SOFR + 3.50%), 02/14/31(2) | | 70,000 | | 70,180 | |
Asurion LLC, 8.05%, (1-Month SOFR + 3.36%), 07/31/27(2) | | 24,039 | | 23,885 | |
BroadStreet Partners, Inc, 7.94%, (1-Month SOFR + 3.25%), 06/13/31(2) | | 265,000 | | 265,102 | |
Innomotics (Dynamo), 0.00%, (SOFR + 0.00%), 09/25/31(10) | | 70,000 | | 70,219 | |
Lannett Co., Inc., 2.00%, (3-Month SOFR + 2.00%), 06/16/30(2)(7) | | 1,706 | | 562 | |
Total Financials | | | | 762,124 | |
| | | | | |
Food and Drug — 0.0%(11) | | | | | |
Chobani LLC, 8.44%, (1-Month SOFR + 3.75%), 10/25/27(2) | | 29,775 | | 29,958 | |
| | | | | |
Food/Tobacco — 0.3% | | | | | |
Asprie Bakeries, 0.00%, (SOFR + 0.00%), 12/23/30(10) | | 100,000 | | 100,125 | |
Del Monte Foods, Inc, 9.35%, (3-Month SOFR + 4.40%), 08/02/28(2) | | 31,596 | | 18,026 | |
| | | | | |
Security Description | | Principal | | Value | |
| | | | | |
TERM LOANS (continued) | | | | | |
| | | | | |
Food/Tobacco (continued) | | | | | |
Del Monte Foods, Inc, 9.85%, (3-Month SOFR + 4.90%), 08/02/28(2) | | $71,921
| | $13,485
| |
Del Monte Foods, Inc, 13.17%, (3-Month SOFR + 8.15%), 08/02/28(2) | | 36,315 | | 35,038 | |
Ion Trading Finance Limited, 9.32%, (SOFR + 4.41%), 01/03/28(2) | | 254,444 | | 254,483 | |
Pegasus Bidco BV, 7.85%, (1-Month SOFR + 3.25%), 07/12/29(2) | | 83,667 | | 84,015 | |
Tropicana (Naked Juice LLC), 7.95%, (3-Month SOFR + 3.35%), 01/24/29(2) | | 123,111 | | 92,987 | |
Total Food/Tobacco | | | | 598,159 | |
| | | | | |
Forest Prod/Containers — 0.5% | | | | | |
Clydesdale Acquisition Holdings Inc, 0.00%, (SOFR + 0.00%), 04/13/29(10) | | 285,000 | | 284,627 | |
Kloeckner Pentaplast of America, Inc., 0.00%, (SOFR + 0.00%), 02/12/26(10) | | 100,000 | | 93,861 | |
Kloeckner Pentaplast of America, Inc., 9.72%, (6-Month SOFR + 4.98%), 02/12/26(2) | | 191,269 | | 179,527 | |
Mauser Packaging Solutions Holding Co., 8.17%, (1-Month SOFR + 3.50%), 04/15/27(2) | | 54,374 | | 54,612 | |
TricorBraun Holdings, Inc., 0.00%, (SOFR + 0.00%), 03/03/28(10) | | 100,000 | | 99,266 | |
TricorBraun Holdings, Inc., 8.05%, (1-Month SOFR + 3.36%), 03/03/28(2) | | 227,096 | | 225,429 | |
Total Forest Prod/Containers | | | | 937,322 | |
| | | | | |
Gaming/Leisure — 0.7% | | | | | |
ECL Entertainment LLC, 8.69%, (1-Month SOFR + 4.00%), 08/31/30(2) | | 79,501 | | 79,774 | |
Entain, 8.01%, (6-Month SOFR + 2.75%), 10/31/29(2) | | 94,763 | | 94,761 | |
Fertitta Entertainment LLC, 0.00%, (SOFR + 0.00%), 01/27/29(10) | | 500,000 | | 500,783 | |
Great Canadian Gaming, 0.00%, (SOFR + 0.00%), 11/01/29(10) | | 100,000 | | 99,000 | |
J&J Ventures Gaming, LLC, 8.80%, (1-Month SOFR + 4.00%), 04/26/28(2) | | 19,351 | | 19,391 | |
Merlin Buyer, Inc, 8.10%, (3-Month SOFR + 3.50%), 11/12/29(2) | | 154,425 | | 147,862 | |
One Toronto Gaming, 8.89%, (3-Month SOFR + 4.25%), 08/01/30(2) | | 114,138 | | 114,300 | |
Scientific Games Holdings LP, 7.59%, (3-Month SOFR + 3.00%), 04/04/29(2) | | 344,044 | | 343,038 | |
Total Gaming/Leisure | | | | 1,398,909 | |
| | | | | |
Health Care — 1.5% | | | | | |
Agiliti Health, 7.59%, (3-Month SOFR + 3.00%), 05/01/30(2) | | 154,221 | | 152,293 | |
Bausch & Lomb Corporation, 8.69%, (1-Month SOFR + 4.00%), 09/29/28(2) | | 44,550 | | 44,717 | |
CHG Healthcare Services, Inc., 8.30%, (1-Month SOFR + 3.61%), 09/29/28(2) | | 57,791 | | 57,978 | |
Schedule of Investments — Virtus Newfleet Multi-Sector Bond ETF (continued)
October 31, 2024
The accompanying notes are an integral part of these financial statements.
23
| | | | | |
Security Description | | Principal | | Value | |
| | | | | |
TERM LOANS (continued) | | | | | |
| | | | | |
Health Care (continued) | | | | | |
Cotiviti (Verscend), 7.92%, (1-Month SOFR + 3.25%), 05/01/31(2) | | $54,725
| | $54,811
| |
Endo Finance Holdings, Inc., 9.24%, (1-Month SOFR + 4.50%), 04/09/31(2) | | 30,000 | | 30,062 | |
Ensemble RCM LLC, 7.59%, (3-Month SOFR + 3.00%), 08/01/29(2) | | 99,749 | | 100,012 | |
Global Medical Response, Inc, 0.00%, (SOFR + 0.00%), 10/31/28(10) | | 154,970 | | 154,596 | |
Grifols SA, 6.74%, (3-Month SOFR + 2.15%), 11/15/27(2) | | 255,000 | | 248,147 | |
Hunter US Bidco, Inc., 8.95%, (3-Month SOFR + 4.35%), 08/19/28(2) | | 55,797 | | 54,681 | |
LifePoint Health, Inc, 8.41%, (3-Month SOFR + 3.75%), 05/16/31(2) | | 239,784 | | 240,249 | |
LifePoint Health, Inc, 8.63%, (3-Month SOFR + 4.00%), 05/19/31(2) | | 24,938 | | 25,008 | |
Medline Borrower LP, 6.94%, (1-Month SOFR + 2.25%), 10/23/28(2) | | 25,000 | | 25,025 | |
Medline Borrower LP, 7.44%, (1-Month SOFR + 2.75%), 10/23/28(2) | | 120,510 | | 120,757 | |
Milano Acquisition Corp., 0.00%, (SOFR + 0.00%), 10/01/27 (10) | | 100,000 | | 96,350 | |
Milano Acquisition Corp., 8.70%, (3-Month SOFR + 4.10%), 10/01/27(2) | | 168,404 | | 162,257 | |
ModivCare, Inc, 9.34%, (3-Month SOFR + 4.75%), 07/01/31(2) | | 59,850 | | 57,830 | |
One Call Corp., 10.39%, (3-Month SOFR + 5.76%), 04/22/27(2) | | 229,407 | | 224,590 | |
PCI Pharma (Packaging Coordinators), 7.84%, (3-Month SOFR + 3.25%), 11/30/27(2) | | 133,493 | | 133,818 | |
PointClickCare Technologies, Inc, 0.00%, 10/10/31 | | 70,000 | | 70,219 | |
Radiology Partners, Inc., 8.88%, (3-Month SOFR + 3.76%), 01/31/29(2) | | 104,614 | | 103,306 | |
Southern Veterinary Partners LLC, 8.00%, (6-Month SOFR + 3.75%), 10/05/27(2) | | 79,479 | | 79,549 | |
Star Parent, Inc., 0.00%, (SOFR + 0.00%), 09/27/30 (10) | | 100,000 | | 98,088 | |
Star Parent, Inc., 8.35%, (3-Month SOFR + 3.75%), 09/27/30(2) | | 79,600 | | 78,078 | |
Upstream Newco, Inc., 9.10%, (3-Month SOFR + 4.51%), 11/20/26(2) | | 21,769 | | 19,095 | |
Zelis Payments Buyer, Inc, 0.00%, (SOFR + 0.00%), 10/24/31(10) | | 395,000 | | 393,766 | |
Total Health Care | | | | 2,825,282 | |
| | | | | |
Housing — 0.3% | | | | | |
Chariot Buyer LLC, 8.04%, (1-Month SOFR + 3.35%), 11/03/28(2) | | 134,883 | | 134,833 | |
Cornerstone Building Brands, Inc, 8.15%, (1-Month SOFR + 3.25%), 04/12/28(2) | | 104,459 | | 102,847 | |
Cornerstone Building Brands, Inc, 9.30%, (1-Month SOFR + 4.50%), 05/15/31(2) | | 80,000 | | 79,664 | |
Hunter Douglas Holding BV, 8.57%, (3-Month SOFR + 3.50%), 02/26/29(2) | | 94,138 | | 93,986 | |
| | | | | |
Security Description | | Principal | | Value | |
| | | | | |
TERM LOANS (continued) | | | | | |
| | | | | |
Housing (continued) | | | | | |
LBM Acquisition LLC, 8.67%, (1-Month SOFR + 3.85%), 05/30/31(2) | | $179,550
| | $177,216
| |
Total Housing | | | | 588,546 | |
| | | | | |
Information Technology — 1.7% | | | | | |
Applied Systems, 7.60%, (3-Month SOFR + 3.00%), 02/24/31(2) | | 178,203 | | 178,816 | |
Applied Systems, 9.85%, (3-Month SOFR + 5.25%), 02/23/32(2) | | 10,000 | | 10,304 | |
Boost Newco Borrower LLC, 7.10%, (3-Month SOFR + 2.50%), 01/31/31(2) | | 35,000 | | 35,142 | |
Boxer Parent Co., Inc., 8.34%, (3-Month SOFR + 3.75%), 07/30/31(2) | | 274,900 | | 274,497 | |
Central Parent, Inc, 7.85%, (3-Month SOFR + 3.25%), 07/06/29(2) | | 353,404 | | 351,255 | |
ConnectWise LLC, 8.37%, (3-Month SOFR + 3.76%), 09/29/28(2) | | 133,656 | | 133,799 | |
Delivery Hero Finco LLC, 10.10%, (3-Month SOFR + 5.00%), 12/12/29(2) | | 179,100 | | 180,802 | |
Ellucian (Sophia), 8.29%, (1-Month SOFR + 3.60%), 10/09/29(2) | | 27,008 | | 27,153 | |
Icon Parent, Inc, 0.00%, (SOFR + 0.00%), 09/11/31(10) | | 160,000 | | 159,075 | |
Icon Parent, Inc, 0.00%, (SOFR + 0.00%), 09/10/32(10) | | 70,000 | | 71,138 | |
Indicor LLC, 7.85%, (3-Month SOFR + 3.25%), 11/22/29(2) | | 88,657 | | 88,774 | |
Infinite Bidco LLC, 8.60%, (3-Month SOFR + 4.01%), 03/02/28(2) | | 188,837 | | 186,321 | |
Ion Trading Finance Limited, 9.02%, (3-Month SOFR + 4.00%), 04/01/28(2) | | 174,537 | | 174,406 | |
Jaggaer LLC, 0.00%, (SOFR + 0.00%), 10/07/30(10) | | 235,000 | | 234,817 | |
McAfee, 7.91%, (1-Month SOFR + 3.25%), 03/01/29(2) | | 280,000 | | 280,020 | |
Ncr Atleos, LLC, 8.40%, (3-Month SOFR + 3.75%), 03/27/29(2) | | 32,633 | | 32,715 | |
Project Ruby Ultimate Parent Corp., 8.05%, (1-Month SOFR + 3.36%), 03/10/28(2) | | 108,333 | | 108,681 | |
Project Ruby Ultimate Parent Corp., 8.30%, (1-Month SOFR + 3.61%), 03/10/28(2) | | 14,925 | | 14,993 | |
Proofpoint, Inc, 7.69%, (1-Month SOFR + 3.00%), 08/31/28(2) | | 53,990 | | 54,087 | |
RealPage, Inc., 7.80%, (1-Month SOFR + 3.11%), 04/24/28(2) | | 198,030 | | 195,456 | |
Rocket Software, Inc., 9.44%, (1-Month SOFR + 4.75%), 11/28/28(2) | | 144,271 | | 144,693 | |
SOFTWARE AG/MOSEL, 9.10%, (3-Month SOFR + 4.50%), 09/16/30(2) | | 37,000 | | 37,324 | |
Thunder Generation Funding LLC, 7.61%, (3-Month SOFR + 3.00%), 09/27/31(2) | | 185,000 | | 185,439 | |
Ultimate Software Group, 7.62%, (3-Month SOFR + 3.00%), 02/10/31(2) | | 138,908 | | 139,223 | |
Total Information Technology | | | | 3,298,930 | |
Schedule of Investments — Virtus Newfleet Multi-Sector Bond ETF (continued)
October 31, 2024
The accompanying notes are an integral part of these financial statements.
24
| | | | | |
Security Description | | Principal | | Value | |
| | | | | |
TERM LOANS (continued) | | | | | |
| | | | | |
Manufacturing — 0.8% | | | | | |
Arcline FM Holdings LLC, 9.57%, (6-Month SOFR + 4.50%), 06/23/28(2) | | $247,407
| | $248,576
| |
Circor (Cube), 8.13%, (3-Month SOFR + 3.50%), 10/09/31(2) | | 170,000 | | 170,425 | |
Construction Partners, 0.00%, (SOFR + 0.00%), 10/29/31(10) | | 20,000 | | 20,050 | |
CPM Holdings, Inc, 9.17%, (1-Month SOFR + 4.50%), 09/21/28(2) | | 238,307 | | 233,966 | |
Filtration Group Corp., 8.30%, (1-Month SOFR + 3.61%), 10/21/28(2) | | 106,011 | | 106,323 | |
LSF12 Crown US Commercial Bidco, LLC, 0.00%, (SOFR + 0.00%), 10/14/31(10) | | 445,000 | | 445,556 | |
Star US Bidco, LLC, 8.44%, (1-Month SOFR + 3.75%), 03/17/27(2) | | 46,628 | | 46,959 | |
Treasure Holdco, Inc, 0.00%, (SOFR + 0.00%), 10/10/31(10) | | 275,000 | | 272,852 | |
Total Manufacturing | | | | 1,544,707 | |
| | | | | |
Media/Telecom — 0.4% | | | | | |
Cogeco Communications USA II LP, 7.94%, (1-Month SOFR + 3.25%), 09/18/30(2) | | 343,775 | | 340,195 | |
Creative Artists Agency LLC, 7.44%, (1-Month SOFR + 2.75%), 09/12/31(2) | | 90,000 | | 90,134 | |
Virgin Media Bristol LLC, 0.00%, (SOFR + 0.00%), 01/31/28(10) | | 105,000 | | 102,132 | |
Virgin Media Bristol LLC, 7.42%, (1-Month SOFR + 2.61%), 01/31/28(2) | | 245,000 | | 238,309 | |
Total Media/Telecom | | | | 770,770 | |
| | | | | |
Media/Telecom — Broadcasting — 0.4% | | | | | |
Gray Television, Inc., 7.79%, (1-Month SOFR + 3.00%), 12/01/28(2) | | 218,776 | | 206,439 | |
Terrier Media Buyer, Inc., 8.20%, (3-Month SOFR + 3.60%), 12/17/26(2) | | 233,574 | | 214,290 | |
Univision Communications, Inc, 0.00%, (SOFR + 0.00%), 01/23/29(10) | | 100,000 | | 99,000 | |
Univision Communications, Inc, 8.30%, (1-Month SOFR + 3.61%), 01/31/29(2) | | 189,525 | | 187,630 | |
Total Media/Telecom - Broadcasting | | | | 707,359 | |
| | | | | |
Media/Telecom — Cable/Wireless Video — 0.5% | | | |
CSC Holdings LLC, 0.00%, (SOFR + 0.00%), 01/18/28(10) | | 145,000 | | 141,867 | |
CSC Holdings LLC, 9.30%, (1-Month SOFR + 4.50%), 01/18/28(2) | | 178,636 | | 174,777 | |
Directv Financing LLC, 0.00%, (SOFR + 0.00%), 08/02/29 (10) | | 100,000 | | 97,469 | |
Directv Financing LLC, 10.10%, (3-Month SOFR + 5.51%), 08/02/29(2) | | 229,606 | | 223,793 | |
Eagle Broadband Investments LLC, 7.87%, (3-Month SOFR + 3.26%), 11/12/27(2) | | 303,357 | | 303,086 | |
Total Media/Telecom - Cable/Wireless Video | | | | 940,992 | |
| | | | | |
Security Description | | Principal | | Value | |
| | | | | |
TERM LOANS (continued) | | | | | |
| | | | | |
Media/Telecom — Diversified Media — 0.4% | | | | | |
Century DE Buyer LLC, 0.00%, (SOFR + 0.00%), 10/30/30(10) | | $180,000
| | $180,656
| |
Century DE Buyer LLC, 8.59%, (3-Month SOFR + 4.00%), 10/30/30(2) | | 41,790 | | 41,943 | |
McGraw-Hill Education, Inc, 8.60%, (3-Month SOFR + 4.00%), 08/01/31(2) | | 52,140 | | 52,440 | |
MH Sub I LLC, 8.94%, (1-Month SOFR + 4.25%), 05/03/28(2) | | 249,472 | | 248,201 | |
Neilson Holdings, 9.76%, (3-Month SOFR + 5.10%), 04/11/29(2) | | 252,570 | | 234,048 | |
Total Media/Telecom - Diversified Media | | | | 757,288 | |
| | | | | |
Media/Telecom — Telecommunications — 0.3% | | | | | |
Altice France SA/France, 8.37%, (6-Month SOFR + 3.69%), 01/31/26(2) | | 48,419 | | 41,640 | |
Cincinnati Bell, Inc., 8.04%, (1-Month SOFR + 3.35%), 11/22/28(2) | | 283,352 | | 283,671 | |
Numericable U.S. LLC, 7.43%, (6-Month SOFR + 2.75%), 07/31/25(2) | | 243,549 | | 226,523 | |
Total Media/Telecom - Telecommunications | | | | 551,834 | |
| |
Media/Telecom — Wireless Communications — 0.1% | |
Viasat, Inc., 9.19%, (1-Month SOFR + 4.50%), 03/02/29(2) | | 218,933 | | 199,503 | |
| | | | | |
Metals/Minerals — 0.0%(11) | | | | | |
Covia Holdings LLC, 8.85%, (3-Month SOFR + 4.26%), 07/31/26(2) | | 95,000 | | 94,661 | |
| | | | | |
Retail — 0.5% | | | | | |
CNT Holdings Corp, 8.09%, (3-Month SOFR + 3.50%), 11/08/27(2) | | 74,438 | | 74,698 | |
EG America LLC, 10.44%, (SOFR + 5.61%), 02/07/28(2) | | 54,586 | | 54,730 | |
Harbor Freight Tools USA, Inc, 0.00%, (SOFR + 0.00%), 06/11/31 (10) | | 190,000 | | 185,631 | |
Harbor Freight Tools USA, Inc, 7.19%, (1-Month SOFR + 2.50%), 06/11/31(2) | | 239,400 | | 233,895 | |
Peer Holding III BV, 7.60%, (3-Month SOFR + 3.00%), 06/20/31(2) | | 335,000 | | 335,943 | |
Petco Health & Wellness Co., Inc., 8.12%, (3-Month SOFR + 3.51%), 03/03/28(2) | | 140,000 | | 133,420 | |
Total Retail | | | | 1,018,317 | |
| | | | | |
Service — 1.6% | | | | | |
Acuren (ASP/AAL), 8.19%, (1-Month SOFR + 3.50%), 07/30/31(2) | | 30,000 | | 30,206 | |
Allied Universal Holdco LLC, 0.00%, (SOFR + 0.00%), 05/12/28(10) | | 190,000 | | 189,839 | |
Ascend Learning LLC, 8.29%, (1-Month SOFR + 3.60%), 12/11/28(2) | | 183,863 | | 183,993 | |
BIFM US Finance LLC, 8.94%, (1-Month SOFR + 4.25%), 05/31/28(2) | | 39,800 | | 39,974 | |
Schedule of Investments — Virtus Newfleet Multi-Sector Bond ETF (continued)
October 31, 2024
The accompanying notes are an integral part of these financial statements.
25
| | | | | |
Security Description | | Principal | | Value | |
| | | | | |
TERM LOANS (continued) | | | | | |
| | | | | |
Service (continued) | | | | | |
Brightview Landscapes LLC, 7.09%, (3-Month SOFR + 2.50%), 04/20/29(2) | | $73,877
| | $74,000
| |
Cognita (Lernen), 0.00%, (SOFR + 0.00%), 10/01/31(10) | | 95,000 | | 95,594 | |
Cognita (Lernen), 8.83%, (SOFR + 4.00%), 09/30/31(2) | | 60,000 | | 60,375 | |
Crisis Prevention Inst, Inc., 9.35%, (3-Month SOFR + 4.75%), 04/09/31(2) | | 50,000 | | 50,271 | |
CSC Holdings LLC, 9.26%, (3-Month SOFR + 4.26%), 03/04/28(2) | | 328,377 | | 286,829 | |
DG Investment Intermediate Holdings, 0.00%, (SOFR + 0.00%), 03/31/28(10) | | 275,000 | | 275,567 | |
DXP Enterprises, Inc, 8.44%, (1-Month SOFR + 3.75%), 10/11/30(2) | | 119,600 | | 120,258 | |
Garda World Security Corp, 8.29%, (1-Month SOFR + 3.50%), 02/01/29(2) | | 79,395 | | 79,395 | |
Grant Thornton Advisors LLC, 7.94%, (1-Month SOFR + 3.25%), 06/02/31(2) | | 75,000 | | 75,114 | |
Hertz Corp. (The), 8.49%, (1-Month SOFR + 3.75%), 06/30/28(2) | | 168,862 | | 150,850 | |
Kindercare (Kuehg Corp.), 7.84%, (3-Month SOFR + 3.25%), 06/12/30(2) | | 83,629 | | 83,932 | |
NAB Holdings LLC, 0.00%, (SOFR + 0.00%), 11/23/28(10) | | 180,000 | | 180,161 | |
NAB Holdings LLC, 7.35%, (3-Month SOFR + 2.75%), 11/23/28(2) | | 138,945 | | 139,069 | |
OMNIA Partners LLC, 7.87%, (3-Month SOFR + 3.25%), 07/25/30(2) | | 80,000 | | 80,262 | |
Planet US Buyer LLC, 8.60%, (3-Month SOFR + 3.50%), 02/07/31(2) | | 29,925 | | 30,048 | |
Titan Acquisition (Husky), 10.33%, (3-Month SOFR + 5.00%), 02/15/29(2) | | 155,158 | | 155,527 | |
TMF Sapphire, 8.09%, (3-Month SOFR + 3.50%), 05/03/28(2) | | 34,738 | | 34,897 | |
Trugreen Limited Partnership, 8.80%, (1-Month SOFR + 4.10%), 11/02/27(2) | | 114,111 | | 110,769 | |
University Support Services LLC, 7.44%, (1-Month SOFR + 2.75%), 02/10/29(2) | | 301,440 | | 301,158 | |
Win Waste Innovations Holdings, Inc., 7.55%, (1-Month SOFR + 2.86%), 03/24/28(2) | | 238,704 | | 227,962 | |
Total Service | | | | 3,056,050 | |
| | | | | |
Transportation — 0.2% | | | | | |
Belron, 0.00%, (SOFR + 0.00%), 10/01/31(10) | | 190,000 | | 190,950 | |
Belron, 7.54%, (1-Month SOFR + 2.75%), 10/01/31(2) | | 145,000 | | 145,725 | |
Total Transportation | | | | 336,675 | |
| | | | | |
Transportation — Automotive — 0.2% | | | | | |
First Brands Group LLC, 9.85%, (3-Month SOFR + 5.00%), 03/30/27(2) | | 204,005 | | 198,752 | |
PAI Holdco, Inc., 8.60%, (3-Month SOFR + 4.01%), 10/28/27(2) | | 138,132 | | 127,772 | |
Total Transportation - Automotive | | | | 326,524 | |
| | | | | |
Security Description | | Principal | | Value | |
| | | | | |
TERM LOANS (continued) | | | | | |
| | | | | |
Utilities — 0.3% | | | | | |
Cornerstone Generation LLC, 0.00%, (SOFR + 0.00%), 10/28/31 | | $100,000
| | $100,125
| |
Hunterstown Generation (Kestrel), 0.00%, (SOFR + 0.00%), 01/01/40(10) | | 50,000 | | 50,000 | |
Lightstone Holdco LLC, 10.34%, (3-Month SOFR + 5.75%), 01/29/27(2) | | 207,603 | | 210,514 | |
Lightstone Holdco LLC, 10.34%, (3-Month SOFR + 5.75%), 01/29/27(2) | | 11,743 | | 11,908 | |
Waterbridge NDB Operating LLC (f/k/a Waterbridge Midstream Operating LLC), 9.60%, (3-Month SOFR + 4.50%), 05/07/29(2) | | 115,000 | | 115,086 | |
Total Utilities | | | | 487,633 | |
| | | | | |
Total Term Loans | | | | | |
(Cost $24,417,079) | | | | 24,343,715 | |
| | | | | |
ASSET BACKED SECURITIES — 11.2% | | | | | |
ACHV ABS Trust, Class A, Series 2024-1PL, 5.90%, 04/25/31(1) | | 111,615 | | 112,209 | |
Acm Auto Trust, Class A, Series 2024-2A, 6.06%, 02/20/29(1) | | 520,000 | | 520,541 | |
Affirm Asset Securitization Trust, Class A, Series 2023-B, 6.82%, 09/15/28(1) | | 125,000 | | 126,879 | |
Affirm Asset Securitization Trust, Class A, Series 2024-B, 4.62%, 09/15/29(1) | | 255,000 | | 253,245 | |
American Credit Acceptance Receivables Trust, Class C, Series 2024-1, 5.63%, 01/14/30(1) | | 135,000 | | 135,872 | |
American Credit Acceptance Receivables Trust, Class D, Series 2022-1, 2.46%, 03/13/28(1) | | 93,948 | | 93,111 | |
American Credit Acceptance Receivables Trust 2024-4, Class C, Series 2024-4, 4.91%, 08/12/31(1) | | 535,000 | | 532,410 | |
Applebee’s Funding LLC / Ihop Funding LLC, Class A2, Series 2023-1A, 7.82%, 03/05/53(1) | | 209,000 | | 216,103 | |
Aqua Finance Trust, Class B, Series 2024-A, 5.06%, 04/18/50(1) | | 520,000 | | 511,734 | |
Arivo Acceptance Auto Loan Receivables Trust, Class B, Series 2024-1A, 6.87%, 06/17/30(1) | | 228,000 | | 231,588 | |
Auxilior Term Funding, Class B, Series 2024-1A, 5.69%, 07/15/31(1) | | 360,000 | | 365,240 | |
Auxilior Term Funding, Class D, Series 2023-1A, 7.27%, 12/16/30(1) | | 90,000 | | 91,377 | |
Avis Budget Rental Car Funding Aesop LLC, Class C, Series 2024-5A, 6.24%, 04/20/27(1) | | 160,000 | | 160,651 | |
Bhg Securitization Trust, Class A, Series 2024-1CON, 5.81%, 04/17/35(1) | | 149,893 | | 151,905 | |
Bojangles Issuer LLC, Class A2, Series 2024-1A, 6.58%, 11/20/54(1) | | 460,000 | | 457,216 | |
Business Jet Securities LLC, Class A, Series 2024-2A, 5.36%, 09/15/39(1) | | 374,722 | | 368,936 | |
Carvana Auto Receivables Trust, Class B, Series 2024-N1, 5.63%, 05/10/30(1) | | 200,000 | | 202,394 | |
CLI Funding VI LLC, Class A, Series 2020-1A, 2.08%, 09/18/45(1) | | 209,574 | | 191,555 | |
Credit Acceptance Auto Loan Trust, Class A, Series 2024-1A, 5.68%, 03/15/34(1) | | 162,000 | | 163,797 | |
Schedule of Investments — Virtus Newfleet Multi-Sector Bond ETF (continued)
October 31, 2024
The accompanying notes are an integral part of these financial statements.
26
| | | | | |
Security Description | | Principal | | Value | |
| | | | | |
ASSET BACKED SECURITIES (continued) | | | | | |
| | | | | |
Dext ABS LLC, Class A2, Series 2023-1, 5.99%, 03/15/32(1) | | $78,230
| | $78,873
| |
Drive Auto Receivables Trust, Class C, Series 2024-1, 5.43%, 11/17/31 | | 300,000 | | 301,800 | |
DT Auto Owner Trust, Class D, Series 2023-1A, 6.44%, 11/15/28(1) | | 155,000 | | 157,405 | |
Encina Equipment Finance LLC, Class B, Series 2022-1A, 5.15%, 01/16/29(1) | | 100,000 | | 99,549 | |
Enterprise Fleet Financing, Class A3, Series 2024-4, 4.56%, 11/20/28(1) | | 550,000 | | 547,933 | |
Exeter Automobile Receivables Trust, Class B, Series 2023-1A, 5.72%, 04/15/27 | | 59,949 | | 59,980 | |
Exeter Automobile Receivables Trust, Class B, Series 2024-5A, 4.48%, 04/16/29 | | 385,000 | | 382,515 | |
Exeter Automobile Receivables Trust, Class C, Series 2024-2A, 5.74%, 05/15/29 | | 263,000 | | 266,547 | |
FAT Brands Royalty LLC, Class A2, Series 2021-1A, 5.75%, 04/25/51(1) | | 48,750 | | 40,877 | |
FHF Trust, Class A2, Series 2023-1A, 6.57%, 06/15/28(1) | | 66,519 | | 67,324 | |
First Help Financial LLC, Class A2, Series 2024-3A, 4.94%, 11/15/30(1) | | 570,000 | | 569,606 | |
First Help Financial LLC, Class C, Series 2024-3A, 5.43%, 03/17/31(1) | | 570,000 | | 569,674 | |
Flagship Credit Auto Trust, Class D, Series 2023-1, 6.46%, 05/15/29(1) | | 510,000 | | 517,519 | |
Foundation Finance Trust, Class A, Series 2024-2A, 4.60%, 03/15/50(1) | | 370,217 | | 367,242 | |
GLS Auto Receivables Issuer Trust, Class C, Series 2024-2A, 6.03%, 02/15/30(1) | | 245,000 | | 249,365 | |
GLS Auto Receivables Issuer Trust, Class D, Series 2022-2A, 6.15%, 04/17/28(1) | | 65,000 | | 65,592 | |
GLS Auto Select Receivables Trust, Class C, Series 2024-3A, 5.92%, 08/15/30(1) | | 425,000 | | 431,838 | |
Hardee’s Funding LLC, Class A2, Series 2024-1A, 7.25%, 03/20/54(1) | | 228,850 | | 234,178 | |
Hertz Vehicle Financing III LLC, Class C, Series 2022-1A, 2.63%, 06/25/26(1) | | 285,000 | | 280,459 | |
Hilton Grand Vacations Trust, Class A, Series 2024-2A, 5.50%, 03/25/38(1) | | 318,273 | | 321,154 | |
Hinnt, Class A, Series 2024-A, 5.49%, 03/15/43(1) | | 174,812 | | 176,994 | |
Hotwire Funding LLC, Class C, Series 2021-1, 4.46%, 11/20/51(1) | | 65,000 | | 61,443 | |
Jack in the Box Funding LLC, Class A2I, Series 2022-1A, 3.45%, 02/26/52(1) | | 318,250 | | 302,045 | |
LAD Auto Receivables Trust, Class C, Series 2024-3A, 4.93%, 03/15/30(1) | | 565,000 | | 560,433 | |
LAD Auto Receivables Trust, Class D, Series 2021-1A, 3.99%, 11/15/29(1) | | 55,000 | | 54,319 | |
LAD Auto Receivables Trust, Class D, Series 2023-2A, 6.30%, 02/15/31(1) | | 135,000 | | 136,534 | |
Lendbuzz Securitization Trust, Class A2, Series 2023-2A, 7.09%, 10/16/28(1) | | 83,259 | | 84,787 | |
Lendbuzz Securitization Trust, Class A2, Series 2024-2A, 5.99%, 05/15/29(1) | | 285,000 | | 287,633 | |
Lendbuzz Securitization Trust, Class B, Series 2024-3A, 5.03%, 11/15/30(1) | | 437,000 | | 432,237 | |
| | | | | |
Security Description | | Principal | | Value | |
| | | | | |
ASSET BACKED SECURITIES (continued) | | | | | |
| | | | | |
Libra Solutions LLC, Class A, Series 2024-1A, 5.88%, 09/30/38(1) | | $360,000
| | $354,459
| |
Lobel Automobile Receivables Trust, Class B, Series 2023-1, 7.05%, 09/15/28(1) | | 160,000 | | 161,483 | |
MAPS Trust, Class A, Series 2021-1A, 2.52%, 06/15/46(1) | | 12,465 | | 11,392 | |
Mercury Financial Credit Card Master Trust, Class A, Series 2024-2A, 6.56%, 07/20/29(1) | | 275,000 | | 277,764 | |
Metronet Infrastructure Issuer LLC, Class A2, Series 2024-1A, 6.23%, 04/20/54(1) | | 455,000 | | 465,727 | |
Mission Lane Credit Card Master Trust, Class A, Series 2023-A, 7.23%, 07/17/28(1) | | 133,000 | | 134,060 | |
Momnt Technologies Trust, Class A, Series 2023-1A, 6.92%, 03/20/45(1) | | 69,519 | | 69,937 | |
Mvw LLC, Class B, Series 2021-1WA, 1.44%, 01/22/41(1) | | 422,968 | | 400,221 | |
MVW Owner Trust, Class A, Series 2019-1A, 2.89%, 11/20/36(1) | | 12,533 | | 12,384 | |
MVW Owner Trust, Class A, Series 2024-1A, 5.32%, 02/20/43(1) | | 191,161 | | 192,310 | |
OneMain Direct Auto Receivables Trust, Class C, Series 2022-1A, 5.31%, 06/14/29(1) | | 355,000 | | 354,234 | |
OneMain Financial Issuance Trust, Class A, Series 2022-3A, 5.94%, 05/15/34(1) | | 360,000 | | 363,568 | |
Oportun Issuance Trust, Class B, Series 2024-2, 5.83%, 02/09/32(1) | | 380,000 | | 380,683 | |
Peac Solutions Receivables, Class B, Series 2024-1A, 5.79%, 11/20/30(1) | | 270,000 | | 273,944 | |
Planet Fitness Master Issuer LLC, Class A2I, Series 2024-1A, 5.77%, 06/05/54(1) | | 320,000 | | 321,418 | |
Powerpay Issuance Trust, Class A, Series 2024-1A, 6.53%, 02/18/39(1) | | 145,167 | | 147,165 | |
Purchasing Power Funding, Class B, Series 2024-A, 6.43%, 08/15/28(1) | | 180,000 | | 182,068 | |
RCKT Mortgage Trust, Class A1A, Series 2023-CES3, 7.11%, 11/25/43(1)(2)(5) | | 836,084 | | 848,512 | |
Reach ABS Trust, Class B, Series 2024-1A, 6.29%, 02/18/31(1) | | 160,000 | | 161,996 | |
Reach ABS Trust, Class B, Series 2024-2A, 5.84%, 07/15/31(1) | | 310,000 | | 312,296 | |
Retained Vantage Data Centers Issuer LLC, Class A2, Series 2024-1A, 4.99%, 09/15/49(1) | | 510,000 | | 494,182 | |
Santander Drive Auto Receivables Trust, Class B, Series 2023-1, 4.98%, 02/15/28 | | 249,000 | | 249,083 | |
Santander Drive Auto Receivables Trust, Class C, Series 2022-5, 4.74%, 10/16/28 | | 100,000 | | 99,970 | |
Switch ABS Issuer LLC, Class A2, Series 2024-2A, 5.44%, 06/25/54(1) | | 275,000 | | 274,421 | |
Taco Bell Funding LLC, Class A23, Series 2016-1A, 4.97%, 05/25/46(1) | | 405,000 | | 403,509 | |
Trafigura Securitisation Finance PLC, Class A2, Series 2024-1A (Ireland), 5.98%, 11/15/27(1) | | 245,000 | | 244,966 | |
Tsc Spv Funding LLC, Class A2, Series 2024-1A, 6.29%, 08/20/54(1) | | 320,000 | | 318,503 | |
United Auto Credit Securitization Trust, Class C, Series 2023-1, 6.28%, 07/10/28(1) | | 203,000 | | 203,672 | |
Schedule of Investments — Virtus Newfleet Multi-Sector Bond ETF (continued)
October 31, 2024
The accompanying notes are an integral part of these financial statements.
27
| | | | | |
Security Description | | Principal | | Value | |
| | | | | |
ASSET BACKED SECURITIES (continued) | | | | | |
| | | | | |
Usq Rail III LLC, Class A, Series 2024-1A, 4.99%, 09/28/54(1) | | $385,000
| | $376,323
| |
Veros Auto Receivables Trust, Class C, Series 2024-1, 7.57%, 12/15/28(1) | | 250,000 | | 254,925 | |
Westlake Automobile Receivables Trust, Class B, Series 2024-1A, 5.55%, 11/15/27(1) | | 218,000 | | 220,149 | |
ZAXBY’S Funding LLC, Class A2, Series 2021-1A, 3.24%, 07/30/51(1) | | 228,330 | | 207,713 | |
| | | | | |
Total Asset Backed Securities | | | | | |
(Cost $21,310,766) | | | | 21,365,655 | |
| |
RESIDENTIAL MORTGAGE BACKED SECURITIES - 9.6% | |
| | | | | |
A&d Mortgage Trust, Class A1, Series 2023-NQM3, 6.73%, 07/25/68(1)(6) | | 172,398 | | 173,833 | |
Ajax Mortgage Loan Trust, Class A1, Series 2019-D, 2.96%, 09/25/65(1)(6) | | 43,636 | | 41,156 | |
AMSR Trust, Class D, Series 2021-SFR3, 2.18%, 10/17/38(1) | | 100,000 | | 94,325 | |
Angel Oak Mortgage Trust, Class A1, Series 2023-1, 4.75%, 09/26/67(1)(6) | | 925,104 | | 913,508 | |
Angel Oak Mortgage Trust 2021-6, Class A1, Series 2021-6, 1.46%, 09/25/66(1)(2)(5) | | 680,334 | | 564,587 | |
Arroyo Mortgage Trust, Class A1, Series 2019-1, 3.81%, 01/25/49(1)(2)(5) | | 90,892 | | 87,851 | |
Arroyo Mortgage Trust, Class A1, Series 2019-2, 3.35%, 04/25/49(1)(2)(5) | | 711,382 | | 683,200 | |
Arroyo Mortgage Trust, Class A3, Series 2020-1, 3.33%, 03/25/55(1) | | 200,000 | | 177,707 | |
Chase Home Lending Mortgage Trust, Class A1, Series 2023-RPL1, 3.50%, 06/25/62(1)(2)(5) | | 521,374 | | 478,473 | |
Chase Home Lending Mortgage Trust, Class A1A, Series 2024-RPL4, 3.38%, 12/25/64(1)(2)(5) | | 397,788 | | 356,952 | |
CIM Trust, Class A1, Series 2022-R2, 3.75%, 12/25/61(1)(2)(5) | | 221,491 | | 205,774 | |
Colt Mortgage Loan Trust, Class A1, Series 2022-4, 4.30%, 03/25/67(1)(2)(5) | | 282,138 | | 274,846 | |
Colt Mortgage Loan Trust, Class A1, Series 2022-5, 4.55%, 04/25/67(1)(2)(5) | | 274,110 | | 268,908 | |
Colt Mortgage Loan Trust, Class A1, Series 2024-5, 5.12%, 08/25/69(1)(6) | | 523,775 | | 520,404 | |
CSMC Trust, Class A1, Series 2020-RPL4, 2.00%, 01/25/60(1)(2)(5) | | 306,512 | | 271,652 | |
Deephaven Residential Mortgage Trust, Class A1, Series 2022-1, 2.21%, 01/25/67(1)(2)(5) | | 70,320 | | 63,315 | |
Ellington Financial Mortgage Trust, Class A1, Series 2022-1, 2.21%, 01/25/67(1)(2)(5) | | 115,893 | | 100,212 | |
Federal Home Loan Mortgage Corporation, 5.50%, 07/01/53 | | 1,226,482 | | 1,217,339 | |
GCAT Trust, Class A1, Series 2020-NQM1, 3.25%, 01/25/60(1)(6) | | 264,392 | | 256,823 | |
LHOME Mortgage Trust, Class A1, Series 2022-RTL3, 8.15%, 11/25/27(1)(6) | | 360,000 | | 362,705 | |
LHOME Mortgage Trust, Class A1, Series 2024-RTL1, 7.02%, 01/25/29(1)(6) | | 260,000 | | 262,350 | |
| | | | | |
Security Description | | Principal | | Value | |
| | | | | |
RESIDENTIAL MORTGAGE BACKED SECURITIES (continued) | |
| | | | | |
MetLife Securitization Trust, Class A1A, Series 2019-1A, 3.75%, 04/25/58(1)(2)(5) | | $158,905
| | $155,544
| |
Mfa Trust, Class A1, Series 2024-NQM2, 5.27%, 08/25/69(1)(6) | | 295,261 | | 293,465 | |
Mfra Trust, Class A1, Series 2022-INV2, 4.95%, 07/25/57(1)(6) | | 490,768 | | 487,660 | |
Mill City Mortgage Loan Trust, Class B1, Series 2017-3, 3.25%, 01/25/61(1)(2)(5) | | 97,189 | | 85,265 | |
New Residential Mortgage Loan Trust, Class A1, Series 2016-1A, 3.75%, 03/25/56(1)(2)(5) | | 32,668 | | 30,743 | |
New Residential Mortgage Loan Trust, Class B1, Series 2016-3A, 4.00%, 09/25/56(1)(2)(5) | | 323,370 | | 310,589 | |
New Residential Mortgage Loan Trust, Class A3, Series 2017-2A, 4.00%, 03/25/57(1)(2)(5) | | 399,330 | | 380,478 | |
New Residential Mortgage Loan Trust, Class M2, Series 2019-RPL2, 3.75%, 02/25/59(1)(2)(5) | | 100,000 | | 87,212 | |
New York Mortgage Trust, Class A1, Series 2024-CP1, 3.75%, 02/25/68(1)(2)(5) | | 279,230 | | 259,956 | |
Onslow Bay Financial LLC, Class A1A, Series 2023-NQM5, 6.57%, 06/25/63(1)(6) | | 403,155 | | 407,800 | |
Onslow Bay Financial LLC, Class A1, Series 2023-NQM9, 7.16%, 10/25/63(1)(6) | | 159,427 | | 162,671 | |
Onslow Bay Financial LLC, Class A1, Series 2024-NQM3, 6.13%, 12/25/63(1)(6) | | 142,036 | | 143,062 | |
Onslow Bay Financial LLC, Class A1, Series 2024-NQM9, 6.03%, 01/25/64(1)(6) | | 243,254 | | 244,937 | |
Pretium Mortgage Credit Partners, Class A1, Series 2024-RPL1, 3.90%, 10/25/63(1)(2)(5) | | 1,053,375 | | 999,083 | |
Prkcm Trust, Class A1A, Series 2022-AFC1, 4.10%, 04/25/57(1)(2)(5) | | 386,307 | | 376,066 | |
PRPM LLC, Class A1, Series 2021-RPL1, 1.32%, 07/25/51(1)(6) | | 727,819 | | 660,335 | |
PRPM LLC, Class A1, Series 2021-RPL2, 1.46%, 10/25/51(1)(2)(5) | | 638,599 | | 579,663 | |
RCKT Mortgage Trust, Class A1A, Series 2023-CES1, 6.52%, 06/25/43(1)(2)(5) | | 228,595 | | 230,075 | |
RCKT Mortgage Trust, Class A1A, Series 2024-CES1, 6.03%, 02/25/44(1)(2)(5) | | 178,578 | | 179,156 | |
Sequoia Mortgage Trust, Class B1, Series 2013-8, 3.48%, 06/25/43(2)(5) | | 47,036 | | 45,117 | |
SG Residential Mortgage Trust, Class A1, Series 2021-1, 1.16%, 07/25/61(1)(2)(5) | | 1,027,848 | | 830,324 | |
Starwood Mortgage Residential Trust, Class A1, Series 2020-1, 2.28%, 02/25/50(1)(2)(5) | | 39,130 | | 37,278 | |
Towd Point Mortgage Trust, Class A2, Series 2017-1, 3.50%, 10/25/56(1)(2)(5) | | 71,756 | | 70,887 | |
Towd Point Mortgage Trust, Class A2, Series 2017-4, 3.00%, 06/25/57(1)(2)(5) | | 225,000 | | 208,409 | |
Towd Point Mortgage Trust, Class A2, Series 2018-6, 3.75%, 03/25/58(1)(2)(5) | | 100,000 | | 90,635 | |
Towd Point Mortgage Trust, Class A2, Series 2019-2, 3.75%, 12/25/58(1)(2)(5) | | 940,000 | | 842,905 | |
Towd Point Mortgage Trust, Class A2, Series 2021-1, 2.75%, 11/25/61(1)(2)(5) | | 100,000 | | 82,033 | |
Verus Securitization Trust, Class A1, Series 2022-5, 3.80%, 04/25/67(1)(6) | | 87,211 | | 82,289 | |
Schedule of Investments — Virtus Newfleet Multi-Sector Bond ETF (continued)
October 31, 2024
The accompanying notes are an integral part of these financial statements.
28
| | | | | |
Security Description | | Principal | | Value | |
| | | | | |
RESIDENTIAL MORTGAGE BACKED SECURITIES (continued) | |
| | | | | |
Verus Securitization Trust, Class A1, Series 2022-4, 4.47%, 04/25/67(1)(6) | | $72,068
| | $71,501
| |
Verus Securitization Trust, Class A1, Series 2022-6, 4.91%, 06/25/67(1)(6) | | 1,115,453 | | 1,105,566 | |
Verus Securitization Trust, Class A3, Series 2022-6, 4.91%, 06/25/67(1)(6) | | 237,984 | | 234,676 | |
Verus Securitization Trust, Class A1, Series 2022-7, 5.15%, 07/25/67(1)(6) | | 513,796 | | 511,198 | |
Verus Securitization Trust, Class A1, Series 2023-8, 6.26%, 12/25/68(1)(6) | | 431,862 | | 435,620 | |
Visio Trust, Class A1, Series 2019-2, 2.72%, 11/25/54(1)(2)(5) | | 145,187 | | 141,085 | |
Visio Trust, Class A2, Series 2022-1, 5.85%, 08/25/57(1)(6) | | 76,574 | | 76,232 | |
| | | | | |
Total Residential Mortgage Backed Securities | | | | | |
(Cost $18,376,962) | | | | 18,315,435 | |
| | | | | |
U.S. GOVERNMENT SECURITIES — 5.8% | | | | | |
U.S. Treasury Bond | | | | | |
4.63%, 05/15/54 | | 3,345,000 | | 3,423,921 | |
U.S. Treasury Note | | | | | |
1.00%, 12/15/24 | | 1,040,000 | | 1,035,416 | |
4.38%, 08/15/26 | | 690,000 | | 692,305 | |
4.00%, 02/15/34 | | 6,135,000 | | 6,004,152 | |
| | | | | |
Total U.S. Government Securities | | | | | |
(Cost $11,333,675) | | | | 11,155,794 | |
| | | | | |
MORTGAGE BACKED SECURITIES — 5.6% | | | | | |
| | | | | |
Federal Home Loan Mortgage Corporation, 6.00%, 10/01/38 | | 150,116 | | 153,030 | |
Federal Home Loan Mortgage Corporation, 5.50%, 01/01/53 | | 218,072 | | 216,292 | |
Federal Home Loan Mortgage Corporation, 6.00%, 03/01/53 | | 578,009 | | 582,000 | |
Federal Home Loan Mortgage Corporation, 6.00%, 07/01/53 | | 1,027,280 | | 1,034,373 | |
Federal Home Loan Mortgage Corporation, 6.00%, 08/01/53 | | 1,147,407 | | 1,156,035 | |
Federal Home Loan Mortgage Corporation, 4.50%, 08/01/53 | | 873,271 | | 830,580 | |
Federal Home Loan Mortgage Corporation, 5.00%, 12/01/53 | | 2,876,633 | | 2,797,414 | |
Federal National Mortgage Association, 3.50%, 05/01/49 | | 22,954 | | 20,723 | |
Federal National Mortgage Association, 5.00%, 11/01/52 | | 393,661 | | 383,267 | |
Federal National Mortgage Association, 4.50%, 11/01/52 | | 386,072 | | 367,078 | |
Federal National Mortgage Association, 4.00%, 03/01/53 | | 1,225,133 | | 1,132,781 | |
Federal National Mortgage Association, 6.00%, 04/01/53 | | 577,147 | | 581,132 | |
Federal National Mortgage Association, 5.50%, 07/01/53 | | 260,823 | | 258,574 | |
| | | | | |
Security Description | | Principal | | Value | |
| | | | | |
MORTGAGE BACKED SECURITIES (continued) | |
| | | | | |
Federal National Mortgage Association, 4.50%, 08/01/53 | | $1,329,641
| | $1,264,044
| |
| | | | | |
Total Mortgage Backed Securities | | | | | |
(Cost $10,945,560) | | | | 10,777,323 | |
| |
COMMERCIAL MORTGAGE BACKED SECURITIES — 4.2% | |
| | | | | |
BBCMS Mortgage Trust, Class A, Series 2018-TALL, 5.72%, (1-Month SOFR + 0.92%), 03/15/37(1)(2) | | 955,000 | | 899,443 | |
BPR Trust, Class A, Series 2022-OANA, 6.70%, (1-Month SOFR + 1.90%), 04/15/37(1)(2) | | 800,000 | | 804,842 | |
Bx Commercial Mortgage Trust, Class A, Series 2024-XL5, 6.20%, (1-Month SOFR + 1.39%), 03/15/41(1)(2) | | 480,775 | | 481,863 | |
Bx Trust, Class A, Series 2022-CLS, 5.76%, 10/13/27(1) | | 410,000 | | 408,064 | |
Bx Trust, Class B, Series 2019-OC11, 3.61%, 12/09/41(1) | | 200,000 | | 182,702 | |
BX Trust, Class D, Series 2019-OC11, 3.94%, 12/09/41(1)(2)(5) | | 685,000 | | 622,020 | |
CF Hippolyta LLC, Class A1, Series 2020-1, 1.69%, 07/15/60(1) | | 89,945 | | 87,154 | |
COMM Mortgage Trust, Class A1, Series 2013-300P, 4.35%, 08/10/30(1) | | 365,000 | | 354,786 | |
COMM Mortgage Trust, Class B, Series 2020-CBM, 3.10%, 02/10/37(1) | | 45,000 | | 44,382 | |
Fashion Show Mall LLC, Class A, Series 2024-SHOW, 5.27%, 10/10/41(1)(2)(5) | | 685,000 | | 673,891 | |
GCT Commercial Mortgage Trust, Class A, Series 2021-GCT, 5.72%, (1-Month SOFR + 0.91%), 02/15/38(1)(2) | | 280,000 | | 249,996 | |
J.P. Morgan Chase Commercial Mortgage Securities Trust, Class A, Series 2024-OMNI, 5.80%, 10/05/39(1)(2)(5) | | 440,000 | | 445,379 | |
Legends Outlets Kansas City Ks Mortgage Secured Pass-Through Trust, Class A, Series 2024-LGND, 6.25%, 11/15/27(1) | | 431,000 | | 429,922 | |
MIRA Trust, Class A, Series 2023-MILE, 6.75%, 06/10/38(1) | | 270,000 | | 280,723 | |
Morgan Stanley Bank of America Merrill Lynch Trust, Class AS, Series 2015-C22, 3.56%, 04/15/48 | | 520,000 | | 505,676 | |
Mssg Trust, Class A, Series 2017-237P, 3.40%, 09/13/39(1) | | 456,000 | | 421,750 | |
Rock Trust, Class C, Series 2024-CNTR, 6.47%, 11/13/41(1) | | 420,000 | | 424,705 | |
Thpt Mortgage Trust, Class A, Series 2023-THL, 6.99%, 12/10/34(1)(2)(5) | | 300,000 | | 305,097 | |
WFRBS Commercial Mortgage Trust, Class AS, Series 2014-C24, 3.93%, 11/15/47 | | 370,000 | | 360,742 | |
| | | | | |
Total Commercial Mortgage Backed Securities | | | | | |
(Cost $7,943,237) | | | | 7,983,137 | |
Schedule of Investments — Virtus Newfleet Multi-Sector Bond ETF (continued)
October 31, 2024
The accompanying notes are an integral part of these financial statements.
29
| | | | | |
Security Description | | Shares | | Value | |
| | | | | |
EXCHANGE TRADED FUNDS — 2.0% | | | | | |
| | | | | |
Debt Funds — 2.0% | | | | | |
iShares iBoxx $ High Yield Corporate Bond ETF | | 24,465 | | $1,936,160
| |
SPDR Bloomberg Barclays High Yield Bond ETF | | 19,660 | | 1,893,258 | |
Total Debt Funds | | | | 3,829,418 | |
| | | | | |
Total Exchange Traded Funds | | | | | |
(Cost $3,807,313) | | | | 3,829,418 | |
| | | | | |
COMMON STOCKS — 0.0%(11) | | | | | |
Consumer Discretionary — 0.0%(11) | | | | | |
West Marine (Rising Tide)*(7) | | 38 | | 109 | |
| | | | | |
Health Care — 0.0%(11) | | | | | |
Endo Finance Holdings, Inc.* | | 339 | | 8,648 | |
Lannett Co., Inc.*(7) | | 277 | | — | |
Total Health Care | | | | 8,648 | |
| | | | | |
Total Common Stocks | | | | | |
(Cost $7,550) | | | | 8,757 | |
| | | | | |
MONEY MARKET FUND — 3.0% | | | | | |
JP Morgan U.S. Government Money Market Institutional Shares, 4.71%(12)
(Cost $5,704,455) | | 5,704,455 | | 5,704,455 | |
| | | | | |
TOTAL INVESTMENTS — 101.2% | | | | | |
(Cost $192,868,155) | | | | 193,505,384 | |
Liabilities in Excess of Other Assets - (1.2)% | | | | (2,218,007 | ) |
Net Assets — 100.0% | | | | $191,287,377
| |
*Non-income producing security.
(1)Security was purchased pursuant to Rule 144A under the Securities Act of 1933 and may not be resold subject to that rule except to qualified institutional buyers. Unless otherwise noted, 144A securities are deemed to be liquid. At October 31, 2024, the aggregate value of these securities was $92,862,835, or 48.5% of net assets.
(2)Variable rate instrument. The interest rate shown reflects the rate in effect at October 31, 2024.
(3)Payment in-kind security.
(4)Perpetual security with no stated maturity date.
(5)Adjustable rate security with an interest rate that is not based on a published reference index and spread. The rate is based on the structure of the agreement and current market conditions.
(6)Represents step coupon bond. Rate shown reflects the rate in effect as of October 31, 2024.
(7)Security valued at fair value as determined in good faith by or under the direction of the Trustees. This security is disclosed as a Level 3 security in the Fair Value Hierarchy table located after the Schedule of Investments.
(8)Security in default, no interest payments are being received during the bankruptcy proceedings.
(9)Represents a zero coupon bond. Rate shown reflects the effective yield.
(10)This loan will settle after October 31, 2024, at which time the interest rate, calculated on the base lending rate and the agreed upon spread on trade date, will be reflected.
(11)Amount rounds to less than 0.05%.
(12)The rate shown reflects the seven-day yield as of October 31, 2024.
Abbreviations:
CMT — Constant Maturity Treasury Index
ETF — Exchange Traded Fund
LIBOR — London InterBank Offered Rate
SOFR — Secured Overnight Financing Rate
Currency Abbreviations
USD United States Dollar
The following table summarizes valuation of the Fund’s investments under the fair value hierarchy levels as of October 31, 2024.
| | | | | | | | |
| | Level 1 | | Level 2 | | Level 3 | | Total |
Asset Valuation Inputs | | | | | | | | |
Corporate Bonds | | $—
| | $52,020,501
| | $—
| | $52,020,501
|
Foreign Bonds | | — | | 38,001,194 | | — | | 38,001,194 |
Term Loans | | — | | 24,343,153 | | 562 | | 24,343,715 |
Asset Backed Securities | | — | | 21,365,655 | | — | | 21,365,655 |
Residential Mortgage Backed Securities | | — | | 18,315,435 | | — | | 18,315,435 |
U.S. Government Securities | | — | | 11,155,794 | | — | | 11,155,794 |
Mortgage Backed Securities | | — | | 10,777,323 | | — | | 10,777,323 |
Commercial Mortgage Backed Securities | | — | | 7,983,137 | | — | | 7,983,137 |
Exchange Traded Funds | | 3,829,418 | | — | | — | | 3,829,418 |
Common Stocks | | 8,648 | | — | | 109 | | 8,757 |
Money Market Fund | | 5,704,455 | | — | | — | | 5,704,455 |
Total | | $9,542,521
| | $183,962,192
| | $671
| | $193,505,384
|
Management has determined that the amount of Level 3 securities compared to total net assets is not material; therefore, the rollforward of Level 3 securities and assumptions are not shown for the year ended October 31, 2024.
Schedule of Investments — Virtus Private Credit Strategy ETF
October 31, 2024
The accompanying notes are an integral part of these financial statements.
30
| | | | | |
Security Description | | Shares | | Value | |
| | | | | |
COMMON STOCKS — 57.8% | | | | | |
| | | | | |
Financials — 57.8% | | | | | |
Ares Capital Corp.(1) | | 35,357 | | $747,447
| |
Bain Capital Specialty Finance, Inc. | | 47,112 | | 784,415 | |
Barings BDC, Inc. | | 81,368 | | 786,829 | |
BlackRock TCP Capital Corp. | | 128,137 | | 1,027,659 | |
Blackstone Secured Lending Fund | | 22,708 | | 706,900 | |
Capital Southwest Corp. | | 30,287 | | 732,340 | |
Carlyle Secured Lending, Inc. | | 44,745 | | 760,665 | |
CION Investment Corp. | | 65,356 | | 765,319 | |
Crescent Capital BDC, Inc. | | 44,104 | | 802,252 | |
Fidus Investment Corp. | | 42,918 | | 836,901 | |
FS KKR Capital Corp. | | 54,253 | | 1,098,081 | |
Gladstone Capital Corp.(1) | | 29,398 | | 712,607 | |
Gladstone Investment Corp.(1) | | 65,141 | | 888,523 | |
Goldman Sachs BDC, Inc. | | 75,172 | | 1,002,794 | |
Golub Capital BDC, Inc. | | 52,779 | | 799,074 | |
Hercules Capital, Inc.(1) | | 47,427 | | 937,158 | |
Horizon Technology Finance Corp.(1) | | 86,135 | | 831,203 | |
Main Street Capital Corp.(1) | | 10,946 | | 561,968 | |
MidCap Financial Investment Corp. | | 62,347 | | 833,579 | |
Monroe Capital Corp.(1) | | 65,569 | | 517,995 | |
Morgan Stanley Direct Lending Fund | | 10,756 | | 213,829 | |
New Mountain Finance Corp. | | 72,436 | | 827,943 | |
Nuveen Churchill Direct Lending Corp. | | 8,890 | | 149,530 | |
Oaktree Specialty Lending Corp. | | 62,694 | | 1,016,897 | |
OFS Capital Corp. | | 63,853 | | 517,209 | |
Oxford Square Capital Corp. | | 173,227 | | 505,823 | |
PennantPark Floating Rate Capital Ltd. | | 78,771 | | 884,598 | |
PennantPark Investment Corp.(1) | | 129,539 | | 897,705 | |
Portman Ridge Finance Corp. | | 27,378 | | 511,969 | |
Prospect Capital Corp.(1) | | 232,308 | | 1,205,679 | |
Runway Growth Finance Corp. | | 106,663 | | 1,080,496 | |
Saratoga Investment Corp.(1) | | 39,669 | | 929,841 | |
Sixth Street Specialty Lending, Inc. | | 37,804 | | 771,202 | |
SLR Investment Corp. | | 57,955 | | 890,768 | |
Stellus Capital Investment Corp.(1) | | 64,187 | | 903,111 | |
TriplePoint Venture Growth BDC Corp. | | 227,917 | | 1,517,927 | |
WhiteHorse Finance, Inc.(1) | | 88,352 | | 1,038,136 | |
Total Financials | | | | 29,996,372 | |
Total Common Stocks | | | | | |
(Cost $32,435,648) | | | | 29,996,372 | |
| | | | | |
CLOSED-END FUNDS(2) — 39.9% | | | | | |
Ares Dynamic Credit Allocation Fund, Inc. | | 46,305 | | 698,742 | |
Barings Participation Investors | | 29,624 | | 508,052 | |
BlackRock Debt Strategies Fund, Inc.(1) | | 68,582 | | 740,686 | |
| | | | | |
| | | | | |
Security Description | | Shares | | Value | |
CLOSED-END FUNDS(2) (continued) | | | | | |
| | | | | |
BlackRock Floating Rate Income Strategies
Fund, Inc.(1) | | 56,785 | | $781,362
| |
BlackRock Floating Rate Income Trust | | 56,691 | | 739,818 | |
BlackRock Income Trust, Inc. | | 59,461 | | 703,424 | |
BlackRock Innovation and Growth Term Trust | | 139,201 | | 1,048,184 | |
BlackRock Limited Duration Income Trust | | 49,681 | | 709,941 | |
Blackstone Long-Short Credit Income Fund | | 55,778 | | 704,476 | |
Blackstone Senior Floating Rate Term Fund | | 46,104 | | 653,755 | |
BNY Mellon Alcentra Global Credit Income 2024 Target Term Fund, Inc.(1) | | 53,908 | | 495,414 | |
Carlyle Credit Income Fund | | 113,893 | | 932,784 | |
Eagle Point Credit Co., Inc.(1) | | 146,340 | | 1,400,474 | |
Eaton Vance Floating-Rate Income Trust | | 57,492 | | 753,720 | |
Eaton Vance Senior Floating-Rate Trust(1) | | 60,734 | | 775,573 | |
Eaton Vance Senior Income Trust(1) | | 122,675 | | 763,038 | |
First Trust Senior Floating Rate Income Fund II | | 80,799 | | 837,886 | |
Invesco Dynamic Credit Opportunity Fund | | 454 | | 4,996 | |
Invesco Senior Income Trust(1) | | 215,217 | | 839,346 | |
KKR Income Opportunities Fund(1) | | 55,231 | | 770,472 | |
Nuveen Credit Strategies Income Fund | | 142,995 | | 816,501 | |
Nuveen Floating Rate Income Fund | | 93,882 | | 829,917 | |
OFS Credit Co., Inc.(1) | | 320,164 | | 2,263,559 | |
Pioneer Floating Rate Fund, Inc. | | 80,730 | | 792,284 | |
XAI Octagon Floating Rate Alternative
Income Trust | | 165,353 | | 1,144,243 | |
Total Closed-End Funds | | | | | |
(Cost $20,959,683) | | | | 20,708,647 | |
| | | | | |
SECURITIES LENDING COLLATERAL — 9.4% | |
Money Market Fund — 9.4% | | | | | |
Dreyfus Government Cash Management Fund, Institutional Shares, 4.76%(3)(4) | | | | | |
(Cost $4,882,798) | | 4,882,798 | | 4,882,798 | |
| | | | | |
TOTAL INVESTMENTS — 107.1% | | | | | |
(Cost $58,278,129) | | | | 55,587,817 | |
Liabilities in Excess of Other Assets — (7.1)% | | | | (3,691,306 | ) |
Net Assets — 100.0% | | | | $51,896,511
| |
(1)All or a portion of the security was on loan. The aggregate market value of securities on loan was $5,960,346; total market value of collateral held by the Fund was $6,192,192. Market value of the collateral held includes non-cash U.S. Treasury securities having a value of $1,309,394.
(2)Shares of each fund are publicly offered, and each prospectus and annual report are publicly available.
(3)Represents securities purchased with cash collateral received for securities on loan.
(4)The rate shown reflects the seven-day yield as of October 31, 2024.
Schedule of Investments — Virtus Private Credit Strategy ETF (continued)
October 31, 2024
The accompanying notes are an integral part of these financial statements.
31
The following table summarizes valuation of the Fund’s investments under the fair value hierarchy levels as of October 31, 2024.
| | | | | | | | |
| | Level 1 | | Level 2 | | Level 3 | | Total |
Asset Valuation Inputs | | | | | | | | |
Common Stocks | | $29,996,372
| | $—
| | $—
| | $29,996,372
|
Closed-End Funds | | 20,708,647 | | — | | — | | 20,708,647 |
Money Market Fund | | 4,882,798 | | — | | — | | 4,882,798 |
Total | | $55,587,817
| | $—
| | $—
| | $55,587,817
|
Schedule of Investments — Virtus Real Asset Income ETF
October 31, 2024
The accompanying notes are an integral part of these financial statements.
32
| | | | |
Security Description | | Shares | | Value |
| | | | |
COMMON STOCKS — 97.5% | | | | |
| | | | |
Communication Services — 5.6% | | | | |
Cogent Communications Holdings, Inc. | | 2,446 | | $196,340
|
KT Corp. (South Korea)(1) | | 11,462 | | 180,297 |
Mobile TeleSystems PJSC (Russia)(2) | | 387,202 | | 4 |
Spok Holdings, Inc. | | 11,643 | | 181,282 |
TELUS Corp. (Canada) | | 10,565 | | 167,033 |
TIM SA (Brazil)(1) | | 10,434 | | 149,206 |
Total Communication Services | | | | 874,162 |
| | | | |
Consumer Staples — 1.2% | | | | |
Fresh Del Monte Produce, Inc. | | 6,061 | | 194,619 |
| | | | |
Energy — 33.4% | | | | |
Alliance Resource Partners LP(3) | | 7,278 | | 190,465 |
APA Corp. | | 7,054 | | 166,474 |
Berry Corp. | | 32,690 | | 164,104 |
Black Stone Minerals LP | | 11,838 | | 174,729 |
Canadian Natural Resources Ltd. (Canada) | | 5,295 | | 180,136 |
ConocoPhillips | | 1,610 | | 176,359 |
Coterra Energy, Inc. | | 7,475 | | 178,802 |
Devon Energy Corp. | | 4,336 | | 167,716 |
Diamondback Energy, Inc. | | 977 | | 172,704 |
Dorchester Minerals LP(3) | | 5,729 | | 183,041 |
Ecopetrol SA (Colombia)(1) | | 19,371 | | 149,157 |
EOG Resources, Inc. | | 1,403 | | 171,110 |
Equinor ASA (Norway)(1) | | 7,114 | | 167,037 |
Geopark Ltd. (Colombia) | | 23,393 | | 183,401 |
Hess Midstream LP Class A | | 4,972 | | 172,280 |
Imperial Oil Ltd. (Canada) | | 2,576 | | 191,860 |
Kimbell Royalty Partners LP | | 11,053 | | 177,401 |
Natural Resource Partners LP | | 1,830 | | 173,466 |
New Fortress Energy, Inc.(3) | | 18,636 | | 156,729 |
Ovintiv, Inc. | | 4,365 | | 171,108 |
Patterson-UTI Energy, Inc. | | 21,130 | | 162,067 |
Petroleo Brasileiro SA (Brazil)(1) | | 12,282 | | 165,193 |
Plains All American Pipeline LP | | 9,964 | | 162,114 |
Plains GP Holdings LP Class A | | 9,347 | | 160,768 |
Sabine Royalty Trust | | 2,923 | | 178,391 |
Sitio Royalties Corp. Class A | | 8,124 | | 181,084 |
Tenaris SA(1) | | 5,993 | | 197,050 |
Veren, Inc. (Canada) | | 27,462 | | 141,704 |
Viper Energy, Inc. | | 3,873 | | 201,009 |
Western Midstream Partners LP | | 4,564 | | 172,200 |
Total Energy | | | | 5,189,659 |
| | | | |
Materials — 9.5% | | | | |
B2Gold Corp. (Canada) | | 52,324 | | 173,716 |
Cia Siderurgica Nacional SA (Brazil)(1) | | 85,026 | | 173,453 |
Gerdau SA (Brazil)(1) | | 54,250 | | 169,260 |
Gold Fields Ltd. (South Africa)(1) | | 11,674 | | 192,388 |
ICL Group Ltd. (Israel)(3) | | 46,541 | | 191,749 |
| | | | |
Security Description | | Shares | | Value |
| | | | |
COMMON STOCKS (continued) | | | | |
| | | | |
Materials (continued) | | | | |
Sibanye Stillwater Ltd. (South Africa)*(1) | | 42,718 | | $199,493
|
Southern Copper Corp. (Mexico) | | 1,707 | | 187,002 |
Vale SA (Brazil)(1) | | 17,005 | | 181,953 |
Total Materials | | | | 1,469,014 |
| | | | |
Real Estate — 32.3% | | | | |
Agree Realty Corp. | | 2,375 | | 176,344 |
American Assets Trust, Inc. | | 6,565 | | 176,927 |
American Tower Corp. | | 752 | | 160,582 |
Apple Hospitality REIT, Inc. | | 11,521 | | 170,165 |
Brixmor Property Group, Inc. | | 6,375 | | 171,806 |
Broadstone Net Lease, Inc. | | 9,442 | | 166,085 |
Camden Property Trust | | 1,412 | | 163,496 |
Crown Castle, Inc. | | 1,533 | | 164,782 |
CubeSmart | | 3,279 | | 156,867 |
Curbline Properties Corp.* | | 6,005 | | 135,893 |
EastGroup Properties, Inc. | | 947 | | 162,202 |
EPR Properties | | 3,631 | | 164,738 |
Essential Properties Realty Trust, Inc. | | 5,186 | | 164,344 |
Extra Space Storage, Inc. | | 980 | | 160,034 |
First Industrial Realty Trust, Inc. | | 3,186 | | 167,233 |
Host Hotels & Resorts, Inc. | | 9,442 | | 162,780 |
Innovative Industrial Properties, Inc. | | 1,297 | | 167,559 |
InvenTrust Properties Corp. | | 6,011 | | 177,024 |
Invitation Homes, Inc. | | 4,907 | | 154,129 |
Kimco Realty Corp. | | 7,610 | | 180,509 |
Mid-America Apartment Communities, Inc. | | 1,089 | | 164,809 |
National Storage Affiliates Trust | | 3,641 | | 153,468 |
Outfront Media, Inc. | | 9,691 | | 172,112 |
Public Storage | | 489 | | 160,910 |
Regency Centers Corp. | | 2,470 | | 176,457 |
Retail Opportunity Investments Corp. | | 11,250 | | 174,375 |
Rexford Industrial Realty, Inc.(3) | | 3,459 | | 148,357 |
Ryman Hospitality Properties, Inc. | | 1,611 | | 172,458 |
SITE Centers Corp. | | 3,003 | | 47,898 |
Tanger, Inc. | | 5,542 | | 184,161 |
Terreno Realty Corp. | | 2,586 | | 155,031 |
Total Real Estate | | | | 5,013,535 |
| | | | |
Utilities — 15.5% | | | | |
Alliant Energy Corp. | | 2,961 | | 177,660 |
American Electric Power Co., Inc. | | 1,731 | | 170,936 |
Avista Corp. | | 4,616 | | 173,008 |
Cia Energetica de Minas Gerais (Brazil)(1) | | 87,120 | | 168,142 |
Clearway Energy, Inc. Class C | | 5,975 | | 169,570 |
CMS Energy Corp. | | 2,532 | | 176,253 |
Enel Chile SA (Chile)(1) | | 66,737 | | 182,859 |
Eversource Energy | | 2,634 | | 173,449 |
New Jersey Resources Corp. | | 3,712 | | 170,344 |
NextEra Energy Partners LP(3) | | 6,543 | | 126,607 |
Schedule of Investments — Virtus Real Asset Income ETF (continued)
October 31, 2024
The accompanying notes are an integral part of these financial statements.
33
| | | | |
Security Description | | Shares | | Value |
| | | | |
COMMON STOCKS (continued) | | | | |
| | | | |
Utilities (continued) | | | | |
NiSource, Inc. | | 5,189 | | $182,445
|
ONE Gas, Inc.(3) | | 2,405 | | 171,404 |
TXNM Energy, Inc. | | 4,114 | | 179,124 |
WEC Energy Group, Inc. | | 1,867 | | 178,354 |
Total Utilities | | | | 2,400,155 |
Total Common Stocks | | | | |
(Cost $17,485,775) | | | | 15,141,144 |
| | | | |
SECURITIES LENDING COLLATERAL — 2.1% |
Money Market Fund — 2.1% | | | | |
Dreyfus Government Cash Management Fund, Institutional Shares, 4.76%(4)(5) | | | | |
(Cost $332,328) | | 332,328 | | 332,328 |
| | | | |
Security Description | | | | Value |
| | | | |
TOTAL INVESTMENTS — 99.6% | | | | |
(Cost $17,818,103) | | | | $15,473,472
|
Other Assets in Excess of Liabilities — 0.4% | | | | 57,318 |
Net Assets — 100.0% | | | | $15,530,790
|
*Non-income producing security.
(1)American Depositary Receipts.
(2)Security valued at fair value as determined in good faith by or under the direction of the Trustees. This security is disclosed as a Level 3 security in the Fair Value Hierarchy table located after the Schedule of Investments.
(3)All or a portion of the security was on loan. The aggregate market value of securities on loan was $766,581; total market value of collateral held by the Fund was $795,190. Market value of the collateral held includes non-cash U.S. Treasury securities having a value of $462,862.
(4)Represents securities purchased with cash collateral received for securities on loan.
(5)The rate shown reflects the seven-day yield as of October 31, 2024.
The following table summarizes valuation of the Fund’s investments under the fair value hierarchy levels as of October 31, 2024.
| | | | | | | | |
| | Level 1 | | Level 2 | | Level 3 | | Total |
Asset Valuation Inputs | | | | | | | | |
Common Stocks | | $15,141,140
| | $—
| | $4
| | $15,141,144
|
Money Market Fund | | 332,328 | | — | | — | | 332,328 |
Total | | $15,473,468
| | $—
| | $4
| | $15,473,472
|
The value of level 3 security represents valuations of Russian Common Stock for which Management has determined include significant unobservable inputs as of October 31, 2024.
Management has determined that the amount of Level 3 securities compared to total net assets is not material; therefore, the rollforward of Level 3 securities and assumptions are not shown for the year ended October 31, 2024.
Schedule of Investments — Virtus WMC International Dividend ETF
October 31, 2024
The accompanying notes are an integral part of these financial statements.
34
| | | | |
Security Description | | Shares | | Value |
| | | | |
COMMON STOCKS — 96.5% | | | | |
| | | | |
Australia — 6.0% | | | | |
Ampol Ltd. | | 1,060 | | $19,463
|
APA Group | | 23,196 | | 106,399 |
BHP Group Ltd. | | 6,069 | | 170,304 |
Computershare Ltd. | | 3,107 | | 53,939 |
Dexus | | 3,580 | | 16,892 |
GPT Group (The) | | 4,326 | | 13,494 |
Rio Tinto PLC | | 3,840 | | 248,368 |
Stockland | | 24,281 | | 82,773 |
Transurban Group | | 1,456 | | 12,179 |
Woodside Energy Group Ltd. | | 2,031 | | 31,784 |
Total Australia | | | | 755,595 |
| | | | |
Austria — 1.0% | | | | |
OMV AG | | 3,088 | | 127,977 |
| | | | |
Belgium — 0.1% | | | | |
Ageas SA/NV | | 332 | | 17,291 |
| | | | |
Canada — 12.6% | | | | |
Bank of Montreal | | 774 | | 70,532 |
Bank of Nova Scotia (The) | | 3,475 | | 178,923 |
BCE, Inc. | | 3,780 | | 121,869 |
Canadian Imperial Bank of Commerce | | 3,091 | | 193,383 |
Emera, Inc. | | 3,251 | | 122,816 |
Enbridge, Inc. | | 4,267 | | 172,353 |
IGM Financial, Inc. | | 474 | | 14,240 |
Keyera Corp. | | 1,840 | | 56,508 |
Manulife Financial Corp. | | 6,775 | | 197,895 |
Royal Bank of Canada | | 154 | | 18,625 |
TC Energy Corp. | | 4,114 | | 191,347 |
TELUS Corp. | | 8,356 | | 132,090 |
Toronto-Dominion Bank (The) | | 1,856 | | 102,601 |
Total Canada | | | | 1,573,182 |
| | | | |
China — 1.6% | | | | |
BOC Hong Kong Holdings Ltd. | | 37,770 | | 123,405 |
SITC International Holdings Co., Ltd. | | 25,414 | | 71,919 |
Total China | | | | 195,324 |
| | | | |
Finland — 2.0% | | | | |
Elisa OYJ | | 1,182 | | 56,263 |
Kesko OYJ Class B | | 6,527 | | 139,616 |
Kone OYJ Class B | | 695 | | 37,996 |
UPM-Kymmene OYJ | | 388 | | 11,366 |
Total Finland | | | | 245,241 |
| | | | |
France — 8.1% | | | | |
AXA SA | | 4,507 | | 169,234 |
Bouygues SA | | 3,700 | | 118,446 |
Engie SA | | 5,016 | | 84,106 |
| | | | |
Security Description | | Shares | | Value |
| | | | |
COMMON STOCKS (continued) | | | | |
| | | | |
France (continued) | | | | |
Gecina SA | | 322 | | $34,342
|
Orange SA | | 12,684 | | 139,281 |
Renault SA | | 912 | | 41,566 |
Rexel SA | | 450 | | 12,325 |
Teleperformance SE | | 208 | | 21,924 |
TotalEnergies SE | | 4,278 | | 267,105 |
Vinci SA | | 1,053 | | 117,633 |
Total France | | | | 1,005,962 |
| | | | |
Germany — 5.4% | | | | |
Allianz SE | | 905 | | 284,889 |
BASF SE | | 2,261 | | 109,800 |
Daimler Truck Holding AG | | 382 | | 15,794 |
Deutsche Post AG | | 1,971 | | 79,176 |
Evonik Industries AG | | 720 | | 15,844 |
Mercedes-Benz Group AG | | 2,530 | | 153,286 |
Siemens AG | | 88 | | 17,077 |
Total Germany | | | | 675,866 |
| | | | |
Hong Kong — 0.8% | | | | |
Hang Seng Bank Ltd. | | 3,139 | | 38,399 |
Link REIT | | 5,024 | | 23,427 |
MTR Corp. Ltd. | | 7,256 | | 26,414 |
Sino Land Co., Ltd. | | 12,491 | | 12,500 |
Total Hong Kong | | | | 100,740 |
| | | | |
Italy — 5.5% | | | | |
Banco BPM SpA | | 2,270 | | 15,299 |
Enel SpA | | 18,451 | | 139,888 |
Eni SpA | | 3,260 | | 49,687 |
Generali | | 5,795 | | 161,055 |
Intesa Sanpaolo SpA | | 42,103 | | 180,305 |
Snam SpA | | 28,044 | | 134,770 |
Total Italy | | | | 681,004 |
| | | | |
Japan — 18.8% | | | | |
Astellas Pharma, Inc. | | 4,400 | | 51,996 |
Brother Industries Ltd. | | 2,078 | | 41,180 |
Canon, Inc. | | 4,886 | | 160,916 |
Daifuku Co. Ltd. | | 689 | | 13,291 |
Daito Trust Construction Co., Ltd. | | 529 | | 58,770 |
Daiwa House Industry Co., Ltd. | | 401 | | 12,064 |
Disco Corp. | | 171 | | 50,049 |
Fuji Electric Co. Ltd. | | 322 | | 16,848 |
Honda Motor Co., Ltd. | | 15,468 | | 158,559 |
Isuzu Motors Ltd. | | 8,142 | | 106,986 |
ITOCHU Corp. | | 525 | | 26,444 |
Japan Tobacco, Inc. | | 5,678 | | 159,981 |
Komatsu Ltd. | | 3,548 | | 93,662 |
Kyocera Corp. | | 5,971 | | 61,816 |
Schedule of Investments — Virtus WMC International Dividend ETF (continued)
October 31, 2024
The accompanying notes are an integral part of these financial statements.
35
| | | | |
Security Description | | Shares | | Value |
| | | | |
COMMON STOCKS (continued) | | | | |
| | | | |
Japan (continued) | | | | |
Lasertec Corp. | | 150 | | $23,175
|
Marubeni Corp. | | 3,327 | | 50,866 |
Mazda Motor Corp. | | 2,094 | | 15,263 |
Mitsubishi Corp. | | 807 | | 15,060 |
Mitsubishi Electric Corp. | | 1,212 | | 19,045 |
Mitsubishi Heavy Industries Ltd. | | 1,348 | | 19,456 |
Mitsubishi UFJ Financial Group, Inc. | | 3,409 | | 36,538 |
Mitsui & Co., Ltd. | | 3,080 | | 64,097 |
Mizuho Financial Group, Inc. | | 2,830 | | 59,826 |
MS&AD Insurance Group Holdings, Inc. | | 1,914 | | 43,321 |
Murata Manufacturing Co. Ltd. | | 916 | | 16,320 |
Nissan Motor Co. Ltd. | | 4,599 | | 12,446 |
Otsuka Corp. | | 525 | | 11,872 |
SBI Holdings, Inc. | | 2,077 | | 46,464 |
SCREEN Holdings Co., Ltd. | | 277 | | 18,286 |
SCSK Corp. | | 6,140 | | 115,857 |
Seiko Epson Corp. | | 753 | | 13,919 |
Sekisui House Ltd. | | 5,421 | | 132,582 |
SoftBank Corp. | | 23,340 | | 29,617 |
Subaru Corp. | | 910 | | 16,659 |
Sumitomo Corp. | | 3,104 | | 66,293 |
Sumitomo Mitsui Financial Group, Inc. | | 4,293 | | 92,477 |
Takeda Pharmaceutical Co., Ltd. | | 4,237 | | 118,906 |
Tokio Marine Holdings, Inc. | | 1,901 | | 69,664 |
Tokyo Electron Ltd. | | 389 | | 59,909 |
Toyota Motor Corp. | | 6,116 | | 107,978 |
Toyota Tsusho Corp. | | 3,456 | | 60,117 |
Total Japan | | | | 2,348,575 |
| | | | |
Netherlands — 0.2% | | | | |
ASR Nederland NV | | 264 | | 12,512 |
Koninklijke Ahold Delhaize NV | | 527 | | 17,375 |
Total Netherlands | | | | 29,887 |
| | | | |
New Zealand — 0.7% | | | | |
Spark New Zealand Ltd. | | 50,997 | | 88,699 |
| | | | |
Norway — 3.0% | | | | |
Aker BP ASA | | 6,203 | | 132,291 |
Equinor ASA | | 3,257 | | 78,181 |
Norsk Hydro ASA | | 3,759 | | 23,134 |
Salmar ASA | | 515 | | 26,124 |
Telenor ASA | | 9,268 | | 113,826 |
Total Norway | | | | 373,556 |
| | | | |
Singapore — 4.1% | | | | |
CapitaLand Ascendas REIT | | 6,107 | | 12,440 |
CapitaLand Integrated Commercial Trust | | 8,695 | | 13,301 |
DBS Group Holdings Ltd. | | 4,277 | | 125,217 |
Oversea-Chinese Banking Corp. Ltd. | | 15,154 | | 174,320 |
| | | | |
Security Description | | Shares | | Value |
| | | | |
COMMON STOCKS (continued) | | | | |
| | | | |
Singapore (continued) | | | | |
Singapore Technologies Engineering Ltd. | | 35,718 | | $122,802
|
United Overseas Bank Ltd. | | 2,596 | | 63,224 |
Total Singapore | | | | 511,304 |
| | | | |
Spain — 4.0% | | | | |
ACS Actividades de Construccion y Servicios SA | | 2,984 | | 142,817 |
Aena SME SA(1) | | 214 | | 47,254 |
Banco Bilbao Vizcaya Argentaria SA | | 9,064 | | 90,213 |
CaixaBank SA | | 24,953 | | 151,727 |
Iberdrola SA | | 1,037 | | 15,392 |
Telefonica SA | | 9,855 | | 46,245 |
Total Spain | | | | 493,648 |
| | | | |
Sweden — 2.3% | | | | |
Tele2 AB Class B | | 11,724 | | 122,857 |
Volvo AB Class B | | 6,379 | | 165,663 |
Total Sweden | | | | 288,520 |
| | | | |
Switzerland — 5.4% | | | | |
Adecco Group AG | | 3,021 | | 94,665 |
Novartis AG | | 3,400 | | 369,313 |
SGS SA | | 735 | | 77,879 |
Zurich Insurance Group AG | | 228 | | 134,865 |
Total Switzerland | | | | 676,722 |
| | | | |
Taiwan — 0.1% | | | | |
ASML Holding NV | | 16 | | 10,811 |
| | | | |
United Kingdom — 9.8% | | | | |
British American Tobacco PLC | | 6,008 | | 208,783 |
Hargreaves Lansdown PLC | | 1,739 | | 24,397 |
HSBC Holdings PLC | | 10,758 | | 98,727 |
Imperial Brands PLC | | 5,470 | | 164,836 |
Legal & General Group PLC | | 48,582 | | 136,001 |
M&G PLC | | 12,598 | | 31,506 |
National Grid PLC | | 12,562 | | 158,127 |
Phoenix Group Holdings PLC | | 18,319 | | 116,029 |
Reckitt Benckiser Group PLC | | 1,316 | | 79,484 |
Unilever PLC | | 2,475 | | 150,954 |
Vodafone Group PLC | | 63,194 | | 58,686 |
Total United Kingdom | | | | 1,227,530 |
| | | | |
United States — 5.0% | | | | |
Roche Holding AG | | 520 | | 161,320 |
Sanofi SA | | 1,993 | | 210,523 |
Shell PLC | | 925 | | 30,755 |
Stellantis NV | | 4,902 | | 67,164 |
Swiss Re AG | | 1,164 | | 149,148 |
Total United States | | | | 618,910 |
Total Common Stocks | | | | |
(Cost $11,132,692) | | | | 12,046,344 |
Schedule of Investments — Virtus WMC International Dividend ETF (continued)
October 31, 2024
The accompanying notes are an integral part of these financial statements.
36
| | | | |
Security Description | | Shares | | Value |
| | | | |
PREFERRED STOCKS — 2.1% | | | | |
Germany — 2.1% | | | | |
Bayerische Motoren Werke AG, 8.93% | | 1,620 | | $119,033
|
Volkswagen AG, 10.30% | | 1,499 | | 145,020 |
Total Germany | | | | 264,053 |
Total Preferred Stocks | | | | |
(Cost $317,390) | | | | 264,053 |
| | | | |
Security Description | | | | Value |
| | | | |
TOTAL INVESTMENTS — 98.6% | | | | |
(Cost $11,450,082) | | | | $12,310,397
|
Other Assets in Excess of Liabilities — 1.4% | | | | 175,936 |
Net Assets — 100.0% | | | | $12,486,333
|
(1)Security was purchased pursuant to Rule 144A under the Securities Act of 1933 and may not be resold subject to that rule except to qualified institutional buyers. Unless otherwise noted, 144A securities are deemed to be liquid. At October 31, 2024, the aggregate value of these securities was $47,254, or 0.4% of net assets.
The following table summarizes valuation of the Fund’s investments under the fair value hierarchy levels as of October 31, 2024.
| | | | | | | | |
| | Level 1 | | Level 2 | | Level 3 | | Total |
Asset Valuation Inputs | | | | | | | | |
Common Stocks | | $12,046,344
| | $—
| | $—
| | $12,046,344
|
Preferred Stocks | | 264,053 | | — | | — | | 264,053 |
Total | | $12,310,397
| | $—
| | $—
| | $12,310,397
|
Statements of Assets and Liabilities
October 31, 2024
The accompanying notes are an integral part of these financial statements.
37
| | | | | | | | | |
| | InfraCap REIT Preferred ETF | | Virtus InfraCap U.S. Preferred Stock ETF | | Virtus LifeSci Biotech Clinical Trials ETF | | Virtus LifeSci Biotech Products ETF | |
Assets: | | | | | | | | | |
Investments, at cost | | $112,625,205
| | $1,614,199,245
| | $13,272,905
| | $19,713,710
| |
Investments, at value (including securities on loan)(a) | | 114,519,190 | | 1,698,773,662 | | 11,851,096 | | 22,300,095 | |
Cash | | — | | 37,552 | | 218,053 | | 176,258 | |
Due from broker | | 790 | | 2,642 | | — | | — | |
Receivables: | | | | | | | | | |
Dividends and interest | | 167,363 | | 53,877 | | 300 | | 258 | |
Capital shares sold | | — | | 1,123,995 | | — | | — | |
Securities lending | | — | | — | | 10,080 | | 1,814 | |
Tax reclaim | | — | | 113,362 | | 3,637 | | 284 | |
Investment securities sold | | — | | 3,306,266 | | — | | — | |
Prepaid expenses | | 287 | | 287 | | 287 | | 287 | |
Total Assets | | 114,687,630 | | 1,703,411,643 | | 12,083,453 | | 22,478,996 | |
Liabilities: | | | | | | | | | |
Bank borrowings | | — | | 310,772,012 | | — | | — | |
Payables: | | | | | | | | | |
Investment securities purchased | | — | | 11,451,269 | | — | | — | |
Collateral for securities on loan | | — | | — | | 754,964 | | 325,415 | |
Advisory fees | | 42,715 | | 924,114 | | 7,665 | | 14,695 | |
Total Liabilities | | 42,715 | | 323,147,395 | | 762,629 | | 340,110 | |
Net Assets | | $114,644,915
| | $1,380,264,248
| | $11,320,824
| | $22,138,886
| |
Net Assets Consist of: | | | | | | | | | |
Paid-in capital | | $125,141,521
| | $1,316,806,734
| | $72,132,056
| | $36,038,166
| |
Total distributable earnings (accumulated deficit) | | (10,496,606 | ) | 63,457,514 | | (60,811,232 | ) | (13,899,280 | ) |
Net Assets | | $114,644,915
| | $1,380,264,248
| | $11,320,824
| | $22,138,886
| |
Shares outstanding (unlimited number of
shares of beneficial interest authorized,
no par value) | | 5,850,004 | | 61,400,004 | | 400,004 | | 350,004 | |
Net asset value per share | | $19.60
| | $22.48
| | $28.30
| | $63.25
| |
(a)Market value of securities on loan | | $—
| | $—
| | $2,544,897
| | $5,523,058
| |
Statements of Assets and Liabilities (continued)
October 31, 2024
The accompanying notes are an integral part of these financial statements.
38
| | | | | | | | | |
| | Virtus Newfleet Multi-Sector Bond ETF | | Virtus Private Credit Strategy ETF | | Virtus Real Asset
Income ETF | | Virtus WMC International Dividend ETF | |
Assets: | | | | | | | | | |
Investments, at cost | | $192,868,155
| | $58,278,129
| | $17,818,103
| | $11,450,082
| |
Investments, at value (including securities on loan)(a) | | 193,505,384 | | 55,587,817 | | 15,473,472 | | 12,310,397 | |
Cash | | 184,247 | | 1,099,032 | | 348,447 | | 70,846 | |
Foreign currency(b) | | — | | — | | — | | 21,025 | |
Receivables: | | | | | | | | | |
Investment securities sold | | 3,527,896 | | — | | 8,869 | | 46 | |
Dividends and interest | | 1,748,714 | | 101,350 | | 35,440 | | 37,539 | |
Securities lending | | — | | 22,707 | | 980 | | — | |
Tax reclaim | | — | | — | | 3,060 | | 51,442 | |
Prepaid expenses | | 1,486 | | 230 | | 230 | | 287 | |
Total Assets | | 198,967,727 | | 56,811,136 | | 15,870,498 | | 12,491,582 | |
Liabilities: | | | | | | | | | |
Payables: | | | | | | | | | |
Investment securities purchased | | 7,509,172 | | — | | — | | 2 | |
Collateral for securities on loan | | — | | 4,882,798 | | 332,328 | | — | |
Advisory fees | | 6,449 | | 31,827 | | 7,380 | | 5,247 | |
Transfer agent fees | | 36,264 | | — | | — | | — | |
Accounting and administration fees | | 47,316 | | — | | — | | — | |
Custody fees | | 5,269 | | — | | — | | — | |
Professional fees | | 43,552 | | — | | — | | — | |
Pricing fees | | 18,743 | | — | | — | | — | |
Trustee fees | | 12,616 | | — | | — | | — | |
Exchange listing fees | | 280 | | — | | — | | — | |
Other accrued expenses | | 689 | | — | | — | | — | |
Total Liabilities | | 7,680,350 | | 4,914,625 | | 339,708 | | 5,249 | |
Net Assets | | $191,287,377
| | $51,896,511
| | $15,530,790
| | $12,486,333
| |
Net Assets Consist of: | | | | | | | | | |
Paid-in capital | | $195,335,754
| | $64,659,582
| | $62,348,374
| | $11,833,412
| |
Total distributable earnings (accumulated deficit) | | (4,048,377 | ) | (12,763,071 | ) | (46,817,584 | ) | 652,921 | |
Net Assets | | $191,287,377
| | $51,896,511
| | $15,530,790
| | $12,486,333
| |
Shares outstanding (unlimited number of
shares of beneficial interest authorized,
no par value) | | 8,450,004 | | 2,350,004 | | 650,004 | | 450,004 | |
Net asset value per share | | $22.64
| | $22.08
| | $23.89
| | $27.75
| |
(a)Market value of securities on loan | | $—
| | $5,960,346
| | $766,581
| | $—
| |
(b)Foreign currency, at cost | | $—
| | $—
| | $—
| | $20,983
| |
Statements of Operations
For the Year Ended October 31, 2024
The accompanying notes are an integral part of these financial statements.
39
| | | | | | | | | |
| | InfraCap REIT Preferred ETF | | Virtus InfraCap U.S. Preferred Stock ETF | | Virtus LifeSci Biotech Clinical Trials ETF | | Virtus LifeSci Biotech Products ETF | |
Investment Income: | | | | | | | | | |
Dividend income (net of foreign withholding taxes) | | $4,292,929
| | $75,687,811
| | $—
| | $25,628
| |
Interest income | | 7,301 | | 54,642 | | 4,966 | | 3,608 | |
Securities lending, net of fees | | — | | — | | 74,123 | | 32,360 | |
Total Investment Income | | 4,300,230 | | 75,742,453 | | 79,089 | | 61,596 | |
| | | | | | | | | |
Expenses: | | | | | | | | | |
Advisory fees | | 362,420 | | 7,653,469 | | 84,796 | | 153,294 | |
Interest expenses | | — | | 16,039,775 | | — | | — | |
Total Expenses | | 362,420 | | 23,693,244 | | 84,796 | | 153,294 | |
Net Investment Income (Loss) | | 3,937,810 | | 52,049,209 | | (5,707 | ) | (91,698 | ) |
| | | | | | | | | |
Net Realized Gain (Loss) on: | | | | | | | | | |
Investments | | 138,053 | | 19,100,338 | | (1,771,406 | ) | (109,599 | ) |
In-kind redemptions | | 382,892 | | 1,133,726 | | 310,125 | | — | |
Securities sold short | | — | | (2,419 | ) | — | | — | |
Total Net Realized Gain (Loss) | | 520,945 | | 20,231,645 | | (1,461,281 | ) | (109,599 | ) |
| | | | | | | | | |
Change in Net Unrealized Appreciation (Depreciation) on: | | | | | | | | | |
Investments | | 14,154,080 | | 189,977,170 | | 6,019,638 | | 5,326,277 | |
Total Change in Net Unrealized Appreciation | | 14,154,080 | | 189,977,170 | | 6,019,638 | | 5,326,277 | |
Net Realized and Change in Unrealized Gain | | 14,675,025 | | 210,208,815 | | 4,558,357 | | 5,216,678 | |
Net Increase in Net Assets Resulting from Operations | | $18,612,835
| | $262,258,024
| | $4,552,650
| | $5,124,980
| |
Foreign withholding taxes | | $—
| | $333,892
| | $—
| | $—
| |
The accompanying notes are an integral part of these financial statements.
40
Statements of Operations (continued)
For the Year Ended October 31, 2024
| | | | | | | | | |
| | Virtus Newfleet Multi-Sector
Bond ETF | | Virtus Private Credit Strategy ETF | | Virtus Real Asset Income ETF | | Virtus WMC International Dividend ETF | |
Investment Income: | | | | | | | | | |
Dividend income (net of foreign withholding taxes) | | $224,779
| | $4,556,927
| | $884,018
| | $493,387
| |
Interest income | | 6,244,588 | | 17,347 | | 9,089 | | 1,605 | |
Securities lending, net of fees | | — | | 183,747 | | 12,860 | | — | |
Total Investment Income | | 6,469,367 | | 4,758,021 | | 905,967 | | 494,992 | |
Expenses: | | | | | | | | | |
Advisory fees | | 443,836 | | 297,103 | | 93,166 | | 48,186 | |
Pricing fees | | 67,512 | | — | | — | | — | |
Accounting and administration fees | | 67,324 | | — | | — | | — | |
Professional fees | | 54,546 | | — | | — | | — | |
Transfer agent fees | | 36,820 | | — | | — | | — | |
Report to shareholders fees | | 10,929 | | — | | — | | — | |
Trustee fees | | 9,564 | | — | | — | | — | |
Exchange listing fees | | 8,701 | | — | | — | | — | |
Custody fees | | 7,761 | | — | | — | | — | |
Insurance fees | | 813 | | — | | — | | — | |
Tax expense | | 3 | | — | | — | | — | |
Other expenses | | 1,196 | | — | | — | | — | |
Total Expenses | | 709,005 | | 297,103 | | 93,166 | | 48,186 | |
Less expense waivers/reimbursements | | (225,718 | ) | — | | — | | — | |
Net Expenses | | 483,287 | | 297,103 | | 93,166 | | 48,186 | |
Net Investment Income | | 5,986,080 | | 4,460,918 | | 812,801 | | 446,806 | |
Net Realized Gain (Loss) on: | | | | | | | | | |
Investments | | 318,993 | | (822,191 | ) | (1,402,928 | ) | 153,623 | |
In-kind redemptions | | — | | 670,017 | | 314,705 | | — | |
Foreign currency transactions | | (1,834 | ) | — | | (8 | ) | 1,167 | |
Total Net Realized Gain (Loss) | | 317,159 | | (152,174 | ) | (1,088,231 | ) | 154,790 | |
Change in Net Unrealized Appreciation (Depreciation) on: | | | | | | | | | |
Investments | | 3,071,811 | | 1,518,420 | | 3,027,093 | | 947,783 | |
Foreign currency translations | | — | | — | | (2 | ) | 320 | |
Total Change in Net Unrealized Appreciation | | 3,071,811 | | 1,518,420 | | 3,027,091 | | 948,103 | |
Net Realized and Change in Unrealized Gain | | 3,388,970 | | 1,366,246 | | 1,938,860 | | 1,102,893 | |
Net Increase in Net Assets Resulting from Operations | | $9,375,050
| | $5,827,164
| | $2,751,661
| | $1,549,699
| |
Foreign withholding taxes | | $—
| | $—
| | $22,123
| | $72,706
| |
Statements of Changes in Net Assets
The accompanying notes are an integral part of these financial statements.
41
| | | | | | | | | |
| | InfraCap REIT Preferred ETF | | Virtus InfraCap
U.S. Preferred Stock ETF | |
| | For the
Year Ended
October 31, 2024 | | For the
Year Ended
October 31, 2023 | | For the
Year Ended
October 31, 2024 | | For the
Year Ended
October 31, 2023 | |
Increase (Decrease) in Net Assets Resulting from Operations: | | | | | | | | |
Net investment income | | $3,937,810
| | $3,929,411
| | $52,049,209
| | $42,228,880
| |
Net realized gain (loss) | | 520,945 | | (1,999,819 | ) | 20,231,645 | | (20,326,346 | ) |
Net change in unrealized appreciation | | 14,154,080 | | 2,474,881 | | 189,977,170 | | 17,688,788 | |
Net increase in net assets resulting from operations | | 18,612,835 | | 4,404,473 | | 262,258,024 | | 39,591,322 | |
Distributions to Shareholders | | (4,553,044 | ) | (3,748,137 | ) | (86,513,987 | ) | (46,177,337 | ) |
Distributions to Shareholders from return of capital | | (1,776,962 | ) | (1,285,869 | ) | (5,386,521 | ) | (10,423,671 | ) |
Total distributions | | (6,330,006 | ) | (5,034,006 | ) | (91,900,508 | ) | (56,601,008 | ) |
| | | | | | | | | |
Shareholder Transactions: | | | | | | | | | |
Proceeds from shares sold | | 51,203,831 | | 8,236,173 | | 604,985,491 | | 190,529,617 | |
Cost of shares redeemed | | (5,405,900 | ) | (5,106,974 | ) | (4,357,175 | ) | (20,377,242 | ) |
Net increase in net assets resulting from shareholder transactions | | 45,797,931 | | 3,129,199 | | 600,628,316 | | 170,152,375 | |
Increase in net assets | | 58,080,760 | | 2,499,666 | | 770,985,832 | | 153,142,689 | |
| | | | | | | | | |
Net Assets: | | | | | | | | | |
Beginning of year | | 56,564,155 | | 54,064,489 | | 609,278,416 | | 456,135,727 | |
End of year | | $114,644,915
| | $56,564,155
| | $1,380,264,248
| | $609,278,416
| |
| | | | | | | | | |
Changes in Shares Outstanding: | | | | | | | | | |
Shares outstanding, beginning of year | | 3,450,004 | | 3,300,004 | | 33,250,004 | | 24,500,004 | |
Shares sold | | 2,700,000 | | 450,000 | | 28,350,000 | | 9,750,000 | |
Shares redeemed | | (300,000 | ) | (300,000 | ) | (200,000 | ) | (1,000,000 | ) |
Shares outstanding, end of year | | 5,850,004 | | 3,450,004 | | 61,400,004 | | 33,250,004 | |
Statements of Changes in Net Assets (continued)
The accompanying notes are an integral part of these financial statements.
42
| | | | | | | | | |
| | Virtus LifeSci Biotech
Clinical Trials ETF | | Virtus LifeSci Biotech Products ETF | |
| | For the
Year Ended
October 31, 2024 | | For the
Year Ended
October 31, 2023 | | For the
Year Ended
October 31, 2024 | | For the
Year Ended
October 31, 2023 | |
Increase (Decrease) in Net Assets Resulting from Operations: | | | | | | | | |
Net investment income (loss) | | $(5,707
| ) | $29,011
| | $(91,698
| ) | $(110,020
| ) |
Net realized gain (loss) | | (1,461,281 | ) | (4,026,783 | ) | (109,599 | ) | 1,686,918 | |
Net change in unrealized appreciation (depreciation) | | 6,019,638 | | (63,857 | ) | 5,326,277 | | (1,260,331 | ) |
Net increase (decrease) in net assets resulting from operations | | 4,552,650 | | (4,061,629 | ) | 5,124,980 | | 316,567 | |
Distributions to Shareholders | | (37,035 | ) | — | | — | | — | |
| | | | | | | | | |
Shareholder Transactions: | | | | | | | | | |
Proceeds from shares sold | | — | | — | | 3,012,729 | | — | |
Cost of shares redeemed | | (1,229,884 | ) | (6,019,212 | ) | — | | (2,664,613 | ) |
Net increase (decrease) in net assets resulting from shareholder transactions | | (1,229,884 | ) | (6,019,212 | ) | 3,012,729 | | (2,664,613 | ) |
Increase (decrease) in net assets | | 3,285,731 | | (10,080,841 | ) | 8,137,709 | | (2,348,046 | ) |
| | | | | | | | | |
Net Assets: | | | | | | | | | |
Beginning of year | | 8,035,093 | | 18,115,934 | | 14,001,177 | | 16,349,223 | |
End of year | | $11,320,824
| | $8,035,093
| | $22,138,886
| | $14,001,177
| |
| | | | | | | | | |
Changes in Shares Outstanding: | | | | | | | | | |
Shares outstanding, beginning of year | | 450,004 | | 700,004 | | 300,004 | | 350,004 | |
Shares sold | | — | | — | | 50,000 | | — | |
Shares redeemed | | (50,000 | ) | (250,000 | ) | — | | (50,000 | ) |
Shares outstanding, end of year | | 400,004 | | 450,004 | | 350,004 | | 300,004 | |
Statements of Changes in Net Assets (continued)
The accompanying notes are an integral part of these financial statements.
43
| | | | | | | | | |
| | Virtus Newfleet
Multi-Sector Bond ETF | | Virtus Private Credit Strategy ETF | |
| | For the
Year Ended
October 31, 2024 | | For the
Year Ended
October 31, 2023 | | For the
Year Ended
October 31, 2024 | | For the
Year Ended
October 31, 2023 | |
Increase (Decrease) in Net Assets Resulting from Operations: | | | | | | | | |
Net investment income | | $5,986,080
| | $3,237,630
| | $4,460,918
| | $2,925,000
| |
Net realized gain (loss) | | 317,159 | | (1,528,857 | ) | (152,174 | ) | (4,123,409 | ) |
Net change in unrealized appreciation | | 3,071,811 | | 569,218 | | 1,518,420 | | 1,195,696 | |
Net increase (decrease) in net assets resulting from operations | | 9,375,050 | | 2,277,991 | | 5,827,164 | | (2,713 | ) |
Distributions to Shareholders | | (5,718,315 | ) | (3,089,988 | ) | (3,995,609 | ) | (2,724,501 | ) |
| | | | | | | | | |
Shareholder Transactions: | | | | | | | | | |
Proceeds from shares sold | | 143,291,682 | | 40,472,226 | | 36,986,561 | | 36,194,903 | |
Cost of shares redeemed | | (3,279,674 | ) | (33,834,144 | ) | (13,515,596 | ) | (28,608,764 | ) |
Net increase in net assets resulting from shareholder transactions | | 140,012,008 | | 6,638,082 | | 23,470,965 | | 7,586,139 | |
Increase in net assets | | 143,668,743 | | 5,826,085 | | 25,302,520 | | 4,858,925 | |
| | | | | | | | | |
Net Assets: | | | | | | | | | |
Beginning of year | | 47,618,634 | | 41,792,549 | | 26,593,991 | | 21,735,066 | |
End of year | | $191,287,377
| | $47,618,634
| | $51,896,511
| | $26,593,991
| |
| | | | | | | | | |
Changes in Shares Outstanding: | | | | | | | | | |
Shares outstanding, beginning of year | | 2,250,004 | | 1,950,004 | | 1,300,004 | | 1,050,004 | |
Shares sold | | 6,350,000 | | 1,850,000 | | 1,650,000 | | 1,650,000 | |
Shares redeemed | | (150,000 | ) | (1,550,000 | ) | (600,000 | ) | (1,400,000 | ) |
Shares outstanding, end of year | | 8,450,004 | | 2,250,004 | | 2,350,004 | | 1,300,004 | |
Statements of Changes in Net Assets (continued)
The accompanying notes are an integral part of these financial statements.
44
| | | | | | | | | |
| | Virtus Real Asset Income ETF | | Virtus WMC International
Dividend ETF | |
| | For the
Year Ended
October 31, 2024 | | For the
Year Ended
October 31, 2023 | | For the
Year Ended
October 31, 2024 | | For the
Year Ended
October 31, 2023 | |
Increase (Decrease) in Net Assets Resulting from Operations: | | | | | | | | |
Net investment income | | $812,801
| | $863,063
| | $446,806
| | $385,030
| |
Net realized gain (loss) | | (1,088,231 | ) | (7,046,668 | ) | 154,790 | | (241,998 | ) |
Net change in unrealized appreciation | | 3,027,091 | | 7,181,666 | | 948,103 | | 1,002,822 | |
Net increase in net assets resulting from operations | | 2,751,661 | | 998,061 | | 1,549,699 | | 1,145,854 | |
Distributions to Shareholders | | (993,505 | ) | (1,496,841 | ) | (467,150 | ) | (380,432 | ) |
| | | | | | | | | |
Shareholder Transactions: | | | | | | | | | |
Proceeds from shares sold | | 1,182,735 | | — | | 2,860,707 | | 1,270,370 | |
Cost of shares redeemed | | (4,730,049 | ) | (27,601,677 | ) | — | | — | |
Net increase (decrease) in net assets resulting from shareholder transactions | | (3,547,314 | ) | (27,601,677 | ) | 2,860,707 | | 1,270,370 | |
Increase (decrease) in net assets | | (1,789,158 | ) | (28,100,457 | ) | 3,943,256 | | 2,035,792 | |
| | | | | | | | | |
Net Assets: | | | | | | | | | |
Beginning of year | | 17,319,948 | | 45,420,405 | | 8,543,077 | | 6,507,285 | |
End of year | | $15,530,790
| | $17,319,948
| | $12,486,333
| | $8,543,077
| |
| | | | | | | | | |
Changes in Shares Outstanding: | | | | | | | | | |
Shares outstanding, beginning of year | | 800,004 | | 1,950,004 | | 350,004 | | 300,004 | |
Shares sold | | 50,000 | | — | | 100,000 | | 50,000 | |
Shares redeemed | | (200,000 | ) | (1,150,000 | ) | — | | — | |
Shares outstanding, end of year | | 650,004 | | 800,004 | | 450,004 | | 350,004 | |
Statement of Cash Flows
For the Year Ended October 31, 2024
The accompanying notes are an integral part of these financial statements.
45
| | | |
| | Virtus InfraCap U.S. Preferred Stock ETF | |
Cash Flows From Operating Activities: | | | |
Net increase (decrease) in net assets from operations | | $262,258,024
| |
| | | |
Adjustments to reconcile net increase (decrease) in net assets from operations to net cash provided by (used in) operating activities: | | | |
Purchases of investment securities | | (965,048,743 | ) |
Proceeds from sales of investments | | 987,980,374 | |
Proceeds from securities sold short | | 512,037 | |
Payments made to cover securities sold short | | (514,456 | ) |
Net realized (gain) loss on investments | | (19,100,338 | ) |
Net realized (gain) loss on securities sold short | | 2,419 | |
Net realized (gain) loss on in-kind redemptions | | (1,133,726 | ) |
Net amortization of premium/(discount accretion) | | (47 | ) |
Net change in unrealized (appreciation) depreciation on investments | | (189,977,170 | ) |
(Increase) decrease in due from broker | | (2,642 | ) |
(Increase) decrease in dividends and interest receivable | | 719,824 | |
(Increase) decrease in prepaid expenses | | (58 | ) |
(Increase) decrease in tax reclaim receivable | | (27,474 | ) |
Increase (decrease) in advisory fees payable | | 512,219 | |
Increase (decrease) in interest expense | | (920,234 | ) |
Net cash provided by (used in) operating activities | | 75,260,009 | |
| | | |
Cash Flows provided by (used in) Financing Activities: | | | |
Proceeds from borrowings | | 151,814,585 | |
Payments for fund shares sold in excess of in-kind creations (issues and redemptions) | | (137,405,112 | ) |
Distributions paid | | (91,900,508 | ) |
Net cash provided by (used in) financing activities | | (77,491,035 | ) |
| | | |
Net increase (decrease) in cash | | (2,231,026 | ) |
Cash, beginning of year | | 2,268,578 | |
Cash, end of year | | $37,552
| |
| | | |
Supplemental information: | | | |
Interest paid on borrowings | | $16,960,009
| |
| | | |
Non-cash financing activities: | | | |
In-kind creations — Issued | | 745,931,235 | |
In-kind creations — Redeemed | | 5,374,585 | |
The accompanying notes are an integral part of these financial statements.
46
| | | | | | | | | | | |
| | InfraCap REIT Preferred ETF | |
| | For the
Year Ended
October 31, 2024 | | For the
Year Ended
October 31, 2023 | | For the
Year Ended
October 31, 2022 | | For the
Year Ended
October 31, 2021 | | For the
Year Ended
October 31, 2020 | |
| |
Per Share Data for a Share Outstanding throughout each year presented: | | | | | | | | | | | |
Net asset value, beginning of year | | $16.40
| | $16.38
| | $24.32
| | $21.71
| | $25.26
| |
Investment operations: | | | | | | | | | | | |
Net investment income1 | | 0.91 | | 1.13 | | 0.68 | | 0.63 | | 1.05 | |
Net realized and unrealized gain (loss) | | 3.73 | | 0.33 | | (7.18 | ) | 3.42 | | (3.14 | ) |
Total from investment operations | | 4.64 | | 1.46 | | (6.50 | ) | 4.05 | | (2.09 | ) |
| | | | | | | | | | | |
Less Distributions from: | | | | | | | | | | | |
Net investment income | | (1.04 | ) | (1.07 | ) | (0.96 | ) | (1.44 | ) | (1.22 | ) |
Return of capital | | (0.40 | ) | (0.37 | ) | (0.48 | ) | — | | (0.24 | ) |
Total distributions | | (1.44 | ) | (1.44 | ) | (1.44 | ) | (1.44 | ) | (1.46 | ) |
Net Asset Value, End of year | | $19.60
| | $16.40
| | $16.38
| | $24.32
| | $21.71
| |
Net Asset Value Total Return2 | | 29.17 | % | 8.84 | % | (27.70 | )% | 18.93 | % | (8.06 | )% |
Net assets, end of year (000’s omitted) | | $114,645
| | $56,564
| | $54,064
| | $87,539
| | $52,104
| |
| | | | | | | | | | | |
RATIOS/SUPPLEMENTAL DATA: | | | | | | | | | | | |
Ratios to Average Net Assets: | | | | | | | | | | | |
Expenses | | 0.45 | % | 0.45 | % | 0.45 | % | 0.45 | % | 0.45 | % |
Net investment income | | 4.89 | % | 6.51 | % | 3.25 | % | 2.61 | % | 4.75 | % |
Portfolio turnover rate3 | | 14 | % | 14 | % | 79 | % | 144 | % | 38 | % |
1Based on average shares outstanding.
2Net Asset Value Total Return is calculated assuming an initial investment made at the net asset value on the first day of the year, reinvestment of dividends and distributions at net asset value during the year, and redemptions at net asset value on the last day of the year.
3Portfolio turnover excludes the value of portfolio securities received or delivered as a result of in-kind creations or redemptions of the Fund’s capital shares.
Financial Highlights (continued)
The accompanying notes are an integral part of these financial statements.
47
| | | | | | | | | | | |
| | Virtus InfraCap U.S. Preferred Stock ETF | |
| | For the
Year Ended
October 31, 2024 | | For the
Year Ended
October 31, 2023 | | For the
Year Ended
October 31, 2022 | | For the
Year Ended
October 31, 2021 | | For the
Year Ended
October 31, 2020 | |
Per Share Data for a Share Outstanding throughout each year presented: | | | | | | | | | | | |
Net asset value, beginning of year | | $18.32
| | $18.62
| | $25.16
| | $19.26
| | $26.43
| |
Investment operations: | | | | | | | | | | | |
Net investment income1 | | 1.15 | | 1.48 | | 1.50 | | 1.18 | | 1.40 | |
Net realized and unrealized gain (loss) | | 5.02 | | 0.20 | 2 | (6.09 | ) | 6.62 | | (6.25 | ) |
Total from investment operations | | 6.17 | | 1.68 | | (4.59 | ) | 7.80 | | (4.85 | ) |
| | | | | | | | | | | |
Less Distributions from: | | | | | | | | | | | |
Net investment income | | (1.58 | ) | (1.62 | ) | (1.95 | ) | (1.59 | ) | (1.81 | ) |
Net realized gains | | (0.31 | ) | — | | — | | (0.26 | ) | (0.43 | ) |
Return of capital | | (0.12 | ) | (0.36 | ) | — | | (0.05 | ) | (0.08 | ) |
Total distributions | | (2.01 | ) | (1.98 | ) | (1.95 | ) | (1.90 | ) | (2.32 | ) |
Net Asset Value, End of year | | $22.48
| | $18.32
| | $18.62
| | $25.16
| | $19.26
| |
Net Asset Value Total Return3 | | 34.95 | % | 9.15 | % | (19.28 | )% | 41.52 | % | (18.37 | )% |
Net assets, end of year (000’s omitted) | | $1,380,264
| | $609,278
| | $456,136
| | $527,121
| | $146,397
| |
| | | | | | | | | | | |
RATIOS/SUPPLEMENTAL DATA: | | | | | | | | | | | |
Ratios to Average Net Assets: | | | | | | | | | | | |
Expenses | | 2.48 | %4 | 2.52 | %5 | 1.40 | %6 | 1.21 | %7 | 1.47 | %8 |
Net investment income | | 5.44 | % | 7.71 | % | 6.64 | % | 4.93 | % | 6.93 | % |
Portfolio turnover rate9 | | 62 | % | 26 | % | 22 | % | 35 | % | 96 | % |
1Based on average shares outstanding.
2The per share amount of realized and unrealized gain (loss) on investments does not accord with the amounts reported in the Statements of Changes in Net Assets due to the timing of creation of Fund shares in relation to fluctuating market values.
3Net Asset Value Total Return is calculated assuming an initial investment made at the net asset value on the first day of the year, reinvestment of dividends and distributions at net asset value during the year, and redemptions at net asset value on the last day of the year.
4The ratios of expenses to average net assets include interest expense fees of 1.68%.
5The ratios of expenses to average net assets include interest expense fees of 1.72%.
6The ratios of expenses to average net assets include interest expense fees of 0.60%.
7The ratios of expenses to average net assets include interest expense fees of 0.41%.
8The ratios of expenses to average net assets include interest expense of 0.63% and dividend expense on securities sold short fees of 0.04%.
9Portfolio turnover excludes the value of portfolio securities received or delivered as a result of in-kind creations or redemptions of the Fund’s capital shares.
Financial Highlights (continued)
The accompanying notes are an integral part of these financial statements.
48
| | | | | | | | | | | |
| | Virtus LifeSci Biotech Clinical Trials ETF | |
| | For the
Year Ended
October 31, 2024 | | For the
Year Ended
October 31, 2023 | | For the
Year Ended
October 31, 2022 | | For the
Year Ended
October 31, 2021 | | For the
Year Ended
October 31, 2020 | |
Per Share Data for a Share Outstanding throughout each year presented: | | | | | | | | | | | |
Net asset value, beginning of year | | $17.86
| | $25.88
| | $44.36
| | $38.97
| | $26.42
| |
Investment operations: | | | | | | | | | | | |
Net investment income (loss)1 | | (0.01 | ) | 0.05 | | (0.16 | ) | (0.26 | ) | (0.15 | ) |
Net realized and unrealized gain (loss) | | 10.53 | | (8.07 | ) | (18.32 | ) | 5.65 | | 12.70 | |
Total from investment operations | | 10.52 | | (8.02 | ) | (18.48 | ) | 5.39 | | 12.55 | |
| | | | | | | | | | | |
Less Distributions from: | | | | | | | | | | | |
Net investment income | | (0.08 | ) | — | | — | | — | | — | |
Total distributions | | (0.08 | ) | — | | — | | — | | — | |
Net Asset Value, End of year | | $28.30
| | $17.86
| | $25.88
| | $44.36
| | $38.97
| |
Net Asset Value Total Return2 | | 59.09 | % | (31.01 | )% | (41.66 | )% | 13.85 | % | 47.50 | % |
Net assets, end of year (000’s omitted) | | $11,321
| | $8,035
| | $18,116
| | $35,490
| | $37,018
| |
| | | | | | | | | | | |
RATIOS/SUPPLEMENTAL DATA: | | | | | | | | | | | |
Ratios to Average Net Assets: | | | | | | | | | | | |
Expenses | | 0.79 | % | 0.79 | % | 0.79 | % | 0.79 | % | 0.79 | % |
Net investment income (loss) | | (0.05 | )% | 0.22 | % | (0.56 | )% | (0.53 | )% | (0.41 | )% |
Portfolio turnover rate3 | | 77 | % | 66 | % | 61 | % | 76 | % | 81 | % |
1Based on average shares outstanding.
2Net Asset Value Total Return is calculated assuming an initial investment made at the net asset value on the first day of the year, reinvestment of dividends and distributions at net asset value during the year, and redemptions at net asset value on the last day of the year.
3Portfolio turnover excludes the value of portfolio securities received or delivered as a result of in-kind creations or redemptions of the Fund’s capital shares.
Financial Highlights (continued)
The accompanying notes are an integral part of these financial statements.
49
| | | | | | | | | | | |
| | Virtus LifeSci Biotech Products ETF | |
| | For the
Year Ended
October 31, 2024 | | For the
Year Ended
October 31, 2023 | | For the
Year Ended
October 31, 2022 | | For the
Year Ended
October 31, 2021 | | For the
Year Ended
October 31, 2020 | |
Per Share Data for a Share Outstanding throughout each year presented: | | | | | | | | | | | |
Net asset value, beginning of year | | $46.67
| | $46.71
| | $51.83
| | $48.19
| | $37.86
| |
Investment operations: | | | | | | | | | | | |
Net investment loss1 | | (0.27 | ) | (0.32 | ) | (0.26 | ) | (0.30 | ) | (0.19 | ) |
Net realized and unrealized gain (loss) | | 16.85 | | 0.28 | | (4.86 | ) | 3.94 | | 10.52 | |
Total from investment operations | | 16.58 | | (0.04 | ) | (5.12 | ) | 3.64 | | 10.33 | |
Net Asset Value, End of year | | $63.25
| | $46.67
| | $46.71
| | $51.83
| | $48.19
| |
Net Asset Value Total Return2 | | 35.53 | % | (0.09 | )% | (9.88 | )% | 7.56 | % | 27.27 | % |
Net assets, end of year (000’s omitted) | | $22,139
| | $14,001
| | $16,349
| | $23,325
| | $26,505
| |
| | | | | | | | | | | |
RATIOS/SUPPLEMENTAL DATA: | | | | | | | | | | | |
Ratios to Average Net Assets: | | | | | | | | | | | |
Expenses | | 0.79 | % | 0.79 | % | 0.79 | % | 0.79 | % | 0.79 | % |
Net investment loss | | (0.47 | )% | (0.63 | )% | (0.59 | )% | (0.57 | )% | (0.43 | )% |
Portfolio turnover rate3 | | 46 | % | 49 | % | 48 | % | 44 | % | 46 | % |
1Based on average shares outstanding.
2Net Asset Value Total Return is calculated assuming an initial investment made at the net asset value on the first day of the year, reinvestment of dividends and distributions at net asset value during the year, and redemptions at net asset value on the last day of the year.
3Portfolio turnover excludes the value of portfolio securities received or delivered as a result of in-kind creations or redemptions of the Fund’s capital shares.
Financial Highlights (continued)
The accompanying notes are an integral part of these financial statements.
50
| | | | | | | | | | | |
| | Virtus Newfleet Multi-Sector Bond ETF | |
| | For the
Year Ended
October 31, 2024 | | For the
Year Ended
October 31, 2023 | | For the
Year Ended
October 31, 2022 | | For the
Year Ended
October 31, 2021 | | For the
Year Ended
October 31, 2020 | |
Per Share Data for a Share Outstanding throughout each year presented: | | | | | | | | | | | |
Net asset value, beginning of year | | $21.16
| | $21.43
| | $25.21
| | $24.66
| | $24.54
| |
Investment operations: | | | | | | | | | | | |
Net investment income1 | | 1.36 | | 1.31 | | 0.90 | | 0.89 | | 0.96 | |
Net realized and unrealized gain (loss) | | 1.45 | | (0.33 | ) | (3.80 | ) | 0.50 | | 0.10 | |
Total from investment operations | | 2.81 | | 0.98 | | (2.90 | ) | 1.39 | | 1.06 | |
| | | | | | | | | | | |
Less Distributions from: | | | | | | | | | | | |
Net investment income | | (1.33 | ) | (1.25 | ) | (0.88 | ) | (0.84 | ) | (0.91 | ) |
Return of capital | | — | | — | | — | | — | | (0.03 | ) |
Total distributions | | (1.33 | ) | (1.25 | ) | (0.88 | ) | (0.84 | ) | (0.94 | ) |
Net Asset Value, End of year | | $22.64
| | $21.16
| | $21.43
| | $25.21
| | $24.66
| |
Net Asset Value Total Return2 | | 13.51 | % | 4.56 | % | (11.72 | )% | 5.71 | % | 4.51 | % |
Net assets, end of year (000’s omitted) | | $191,287
| | $47,619
| | $41,793
| | $20,171
| | $18,494
| |
| | | | | | | | | | | |
RATIOS/SUPPLEMENTAL DATA: | | | | | | | | | | | |
Ratios to Average Net Assets: | | | | | | | | | | | |
Expenses, net of expense waivers | | 0.49 | % | 0.49 | % | 0.49 | % | 0.49 | %3 | 0.55 | %3 |
Expenses, prior to expense waivers | | 0.72 | % | 0.80 | % | 1.02 | % | 1.21 | %3 | 1.15 | %3 |
Net investment income | | 6.07 | % | 5.95 | % | 3.92 | % | 3.52 | % | 3.95 | % |
Portfolio turnover rate4 | | 92 | % | 138 | % | 84 | % | 107 | % | 103 | % |
1Based on average shares outstanding.
2Net Asset Value Total Return is calculated assuming an initial investment made at the net asset value on the first day of the year, reinvestment of dividends and distributions at net asset value during the year, and redemptions at net asset value on the last day of the year.
3The ratios of expenses to average net assets includes tax expense fees of less than 0.01%.
4Portfolio turnover excludes the value of portfolio securities received or delivered as a result of in-kind creations or redemptions of the Fund’s capital shares.
Financial Highlights (continued)
The accompanying notes are an integral part of these financial statements.
51
| | | | | | | | | | | |
| | Virtus Private Credit Strategy ETF | |
| | For the
Year Ended
October 31, 2024 | | For the
Year Ended
October 31, 2023 | | For the
Year Ended
October 31, 2022 | | For the
Year Ended
October 31, 2021 | | For the
Year Ended
October 31, 2020 | |
| |
Per Share Data for a Share Outstanding throughout each year presented: | | | | | | | | | | | |
Net asset value, beginning of year | | $20.46
| | $20.70
| | $25.99
| | $17.37
| | $24.72
| |
Investment operations: | | | | | | | | | | | |
Net investment income1 | | 2.52 | | 2.51 | | 2.13 | | 1.71 | | 1.89 | |
Net realized and unrealized gain (loss) | | 1.43 | | (0.30 | ) | (5.33 | ) | 8.62 | | (7.20 | ) |
Total from investment operations | | 3.95 | | 2.21 | | (3.20 | ) | 10.33 | | (5.31 | ) |
| | | | | | | | | | | |
Less Distributions from: | | | | | | | | | | | |
Net investment income | | (2.33 | ) | (2.45 | ) | (2.09 | ) | (1.71 | ) | (2.04 | ) |
Total distributions | | (2.33 | ) | (2.45 | ) | (2.09 | ) | (1.71 | ) | (2.04 | ) |
Net Asset Value, End of year | | $22.08
| | $20.46
| | $20.70
| | $25.99
| | $17.37
| |
Net Asset Value Total Return2 | | 19.85 | % | 11.22 | % | (12.75 | )% | 61.32 | % | (21.70 | )% |
Net assets, end of year (000’s omitted) | | $51,897
| | $26,594
| | $21,735
| | $31,189
| | $19,109
| |
| | | | | | | | | | | |
RATIOS/SUPPLEMENTAL DATA: | | | | | | | | | | | |
Ratios to Average Net Assets: | | | | | | | | | | | |
Expenses | | 0.75 | %3 | 0.75 | %3 | 0.75 | % | 0.75 | % | 0.75 | %4 |
Net investment income | | 11.26 | %3 | 11.85 | %3 | 8.97 | % | 7.27 | % | 8.59 | % |
Portfolio turnover rate5 | | 29 | % | 40 | % | 27 | % | 34 | % | 24 | % |
1Based on average shares outstanding.
2Net Asset Value Total Return is calculated assuming an initial investment made at the net asset value on the first day of the year, reinvestment of dividends and distributions at net asset value during the year, and redemptions at net asset value on the last day of the year.
3The fund indirectly bears its proportionate shares of expenses and net investment income of any underlying funds in which the Fund invests. Such expenses and income are not included in the calculation of this ratio.
4The ratios of expenses to average net assets includes tax expense fees of less than 0.01%.
5Portfolio turnover excludes the value of portfolio securities received or delivered as a result of in-kind creations or redemptions of the Fund’s capital shares.
Financial Highlights (continued)
The accompanying notes are an integral part of these financial statements.
52
| | | | | | | | | | | |
| | Virtus Real Asset Income ETF | |
| | For the
Year Ended
October 31, 2024 | | For the
Year Ended
October 31, 2023 | | For the
Year Ended
October 31, 2022 | | For the
Year Ended
October 31, 2021 | | For the
Year Ended
October 31, 2020 | |
| |
Per Share Data for a Share Outstanding throughout each year presented: | | | | | | | | | | | |
Net asset value, beginning of year | | $21.65
| | $23.29
| | $26.84
| | $18.67
| | $24.72
| |
Investment operations: | | | | | | | | | | | |
Net investment income1 | | 1.13 | | 0.73 | | 0.93 | | 0.57 | | 0.64 | |
Net realized and unrealized gain (loss) | | 2.47 | | (1.17 | )2 | (3.61 | ) | 8.66 | | (5.95 | ) |
Total from investment operations | | 3.60 | | (0.44 | ) | (2.68 | ) | 9.23 | | (5.31 | ) |
| | | | | | | | | | | |
Less Distributions from: | | | | | | | | | | | |
Net investment income | | (1.36 | ) | (1.20 | ) | (0.87 | ) | (1.06 | ) | (0.74 | ) |
Total distributions | | (1.36 | ) | (1.20 | ) | (0.87 | ) | (1.06 | ) | (0.74 | ) |
Net Asset Value, End of year | | $23.89
| | $21.65
| | $23.29
| | $26.84
| | $18.67
| |
Net Asset Value Total Return3 | | 16.89 | % | (2.15 | )% | (10.25 | )% | 50.16 | % | (21.53 | )% |
Net assets, end of year (000’s omitted) | | $15,531
| | $17,320
| | $45,420
| | $139,583
| | $100,810
| |
| | | | | | | | | | | |
RATIOS/SUPPLEMENTAL DATA: | | | | | | | | | | | |
Ratios to Average Net Assets: | | | | | | | | | | | |
Expenses | | 0.55 | % | 0.55 | % | 0.55 | % | 0.55 | % | 0.55 | %4 |
Net investment income | | 4.80 | % | 3.06 | % | 3.52 | % | 2.30 | % | 2.93 | % |
Portfolio turnover rate5 | | 67 | % | 88 | % | 70 | % | 66 | % | 91 | % |
1Based on average shares outstanding.
2The per share amount of realized and unrealized gain (loss) on investments does not accord with the amounts reported in the Statements of Changes in Net Assets due to the timing of creation of Fund shares in relation to fluctuating market values.
3Net Asset Value Total Return is calculated assuming an initial investment made at the net asset value on the first day of the year, reinvestment of dividends and distributions at net asset value during the year, and redemptions at net asset value on the last day of the year.
4The ratios of expenses to average net assets includes tax expense fees of less than 0.01%.
5Portfolio turnover excludes the value of portfolio securities received or delivered as a result of in-kind creations or redemptions of the Fund’s capital shares.
Financial Highlights (continued)
The accompanying notes are an integral part of these financial statements.
53
| | | | | | | | | | | |
| | Virtus WMC International Dividend ETF | |
| | For the
Year Ended
October 31, 2024 | | For the
Year Ended
October 31, 2023 | | For the
Year Ended
October 31, 2022 | | For the
Year Ended
October 31, 2021 | | For the
Year Ended
October 31, 2020 | |
| |
Per Share Data for a Share Outstanding throughout each year presented: | | | | | | | | | | | |
Net asset value, beginning of year | | $24.41
| | $21.69
| | $28.57
| | $23.94
| | $26.41
| |
Investment operations: | | | | | | | | | | | |
Net investment income1 | | 1.23 | | 1.20 | | 1.50 | | 1.29 | | 0.52 | |
Net realized and unrealized gain (loss) | | 3.40 | | 2.65 | | (5.13 | ) | 5.18 | | (2.08 | ) |
Total from investment operations | | 4.63 | | 3.85 | | (3.63 | ) | 6.47 | | (1.56 | ) |
| | | | | | | | | | | |
Less Distributions from: | | | | | | | | | | | |
Net investment income | | (1.29 | ) | (1.13 | ) | (1.69 | ) | (1.15 | ) | (0.91 | ) |
Net realized gains | | — | | — | | (1.56 | ) | (0.69 | ) | — | |
Total distributions | | (1.29 | ) | (1.13 | ) | (3.25 | ) | (1.84 | ) | (0.91 | ) |
Net Asset Value, End of year | | $27.75
| | $24.41
| | $21.69
| | $28.57
| | $23.94
| |
Net Asset Value Total Return2 | | 19.23 | % | 17.67 | % | (14.03 | )% | 27.41 | % | (6.20 | )% |
Net assets, end of year (000’s omitted) | | $12,486
| | $8,543
| | $6,507
| | $7,142
| | $4,788
| |
| | | | | | | | | | | |
RATIOS/SUPPLEMENTAL DATA: | | | | | | | | | | | |
Ratios to Average Net Assets: | | | | | | | | | | | |
Expenses | | 0.49 | % | 0.49 | % | 0.49 | % | 0.49 | % | 0.49 | % |
Net investment income | | 4.54 | % | 4.77 | % | 5.87 | % | 4.47 | % | 2.04 | % |
Portfolio turnover rate3 | | 41 | % | 61 | % | 50 | % | 68 | % | 211 | % |
1Based on average shares outstanding.
2Net Asset Value Total Return is calculated assuming an initial investment made at the net asset value on the first day of the year, reinvestment of dividends and distributions at net asset value during the year, and redemptions at net asset value on the last day of the year.
3Portfolio turnover excludes the value of portfolio securities received or delivered as a result of in-kind creations or redemptions of the Fund’s capital shares.
Notes to Financial Statements
October 31, 2024
1. ORGANIZATION
The ETFis Series Trust I (the “Trust”) was organized as a Delaware statutory trust on September 20, 2012 and is registered with the U.S. Securities and Exchange Commission (the “SEC”) as an open-end management investment company under the Investment Company Act of 1940 (the “1940 Act”).
As of October 31, 2024, ten funds of the Trust are offered for sale. The InfraCap REIT Preferred ETF, Virtus InfraCap U.S. Preferred Stock ETF, Virtus LifeSci Biotech Clinical Trials ETF, Virtus LifeSci Biotech Products ETF, Virtus Newfleet Multi-Sector Bond ETF, Virtus Private Credit Strategy ETF, Virtus Real Asset Income ETF and Virtus WMC International Dividend ETF (each a “Fund” and collectively, the “Funds”) are presented in this annual report. The offering of each Fund’s shares is registered under the Securities Act of 1933 (the “Securities Act”).
| | |
Funds | | Investment objective(s) |
InfraCap REIT Preferred ETF | | Seeks investment results that correspond, before fees and expenses, to the price and yield performance of the Indxx REIT Preferred Stock Index. |
Virtus InfraCap U.S. Preferred Stock ETF | | Seeks current income and, secondarily, capital appreciation. |
Virtus LifeSci Biotech Clinical Trials ETF | | Seeks investment results that correspond, before fees and expenses, to the price and yield performance of the LifeSci Biotechnology Clinical Trials Index. |
Virtus LifeSci Biotech Products ETF | | Seeks investment results that correspond, before fees and expenses, to the price and yield performance of the LifeSci Biotechnology Products Index. |
Virtus Newfleet Multi-Sector Bond ETF | | Seeks to provide a high level of current income and, secondarily, capital appreciation. |
Virtus Private Credit Strategy ETF | | Seeks investment results that correspond, before fees and expenses, to the price and yield performance of the Indxx Private Credit Index. |
Virtus Real Asset Income ETF | | Seeks investment results that correspond, before fees and expenses, to the price and yield performance of the Indxx Real Asset Income Index. |
Virtus WMC International Dividend ETF | | Seeks income. |
There is no guarantee that a Fund will achieve its objective(s).
InfraCap REIT Preferred ETF and Virtus InfraCap U.S. Preferred Stock ETF are “non-diversified” Funds, as defined under the 1940 Act, as of the year ended October 31, 2024. Virtus Private Credit Strategy ETF is a “fund of funds,” meaning it will generally invest its assets in other registered investment companies.
2. SIGNIFICANT ACCOUNTING POLICIES
Each Fund is an investment company and accordingly follows the investment company accounting and reporting guidance of the Financial Accounting Standards Board (“FASB”) Accounting Standard Codification Topic 946 Financial Services — Investment Companies. Each Fund prepares its financial statements in accordance with generally accepted accounting principles (“GAAP”) in the United States of America and follows the significant accounting policies described below.
(a) Use of Estimates
Management makes certain estimates and assumptions that affect the reported amounts of assets and liabilities and disclosure of contingent assets and liabilities at the date of the financial statements and reported amounts of increases and decreases in the net assets from operations during the reporting period. Actual results could differ from those estimates.
(b) Indemnification
In the normal course of business, the Funds may enter into contracts that contain a variety of representations which provide general indemnifications for certain liabilities. The Funds’ maximum exposure under these arrangements is unknown. However, the Funds have not had prior claims or losses pursuant to these contracts and expect the risk of loss to be remote.
(c) Security Valuation
A description of the valuation techniques applied to the Funds’ major categories of assets and liabilities measured at fair value on a recurring basis is as follows:
Equity securities and exchange-traded funds are valued at the official closing price (typically last sale) on the exchange on which the securities are primarily traded. Securities regularly traded in an over the counter market are valued at the latest quoted sale price in such market or in the case of the New York Stock Exchange (“NYSE”), at the NYSE Official Closing Price. Such valuations are typically categorized as Level 1 in the fair value hierarchy. The Board of Trustees of the Trust (the “Board”) has designated Virtus ETF Advisers LLC (the “Adviser”) to serve as its valuation designee, pursuant to Rule 2a-5 under the 1940 Act, to perform the fair value
Notes to Financial Statements (continued)
October 31, 2024
determinations relating to any or all Fund investments. Accordingly, if market quotations are not readily available, or if it is determined that a quotation of a security does not represent fair value, then the security is valued by the Adviser at fair value as determined in good faith using procedures approved by the Board. Such valuations are typically categorized as Level 2 or Level 3 in the fair value hierarchy.
Debt securities, including restricted securities, are valued based on evaluated quotations received from independent pricing services or from dealers who make markets in such securities. For most bond types, the pricing service utilizes matrix pricing that considers one or more of the following factors: yield or price of bonds of comparable quality, coupon, maturity, current cash flows, type, and current day trade information, as well as dealer-supplied prices. Pricing services generally value fixed income securities assuming orderly transactions of an institutional round lot size, but a Fund may hold or transact in such securities in smaller, odd lot sizes. Odd lots may trade at lower prices than institutional round lots. Such valuations are typically categorized as Level 2 in the fair value hierarchy. Debt securities that are not widely traded, are illiquid, or are internally fair valued by the Adviser are generally categorized as Level 3 in the hierarchy.
Listed derivatives, such as options, that are actively traded are valued based on quoted prices from the exchange and are categorized as Level 1 in the hierarchy. Over-the-counter derivative contracts, which include options, do not require material subjectivity as pricing inputs are observed from actively quoted markets and are categorized as Level 2 in the hierarchy.
Investments in other open-end investment companies are valued based on their net asset value (“NAV”) each business day. Investments in closed-end funds are valued as of the close of regular trading on the NYSE each business day. Each is categorized as Level 1 in the fair value hierarchy.
(d) Fair Value Measurement
Accounting Standards Codification, Fair Value Measurements and Disclosures (“ASC 820”) defines fair value, establishes a framework for measuring fair value in accordance with GAAP, and requires disclosure about fair value measurements. It also provides guidance on determining when there has been a significant decrease in the volume and level of activity for an asset or liability, when a transaction is not orderly, and how that information must be incorporated into fair value measurement. Under ASC 820, various inputs are used in determining the value of the Funds’ investments. The Adviser, on behalf of each Fund, utilizes a fair value hierarchy which prioritizes the inputs to valuation techniques used to measure fair value into three broad levels. These inputs are summarized in the following hierarchy:
•Level 1 — Unadjusted quoted prices in active markets for identical assets or liabilities that the Funds have the ability to access.
•Level 2 — Observable inputs other than quoted prices included in Level 1 that are observable for the asset or liability, either directly or indirectly. These inputs may include quoted prices for the identical instrument on an inactive market, prices for similar securities, interest rates, prepayment speeds, credit risk, yield curves, default rates and similar data.
•Level 3 — Unobservable inputs for the asset or liability, to the extent relevant observable inputs are not available; representing the Funds’ own assumptions about the assumptions a market participant would use in valuing the asset or liability, and would be based on the best information available.
The inputs or methodology used for valuing securities are not necessarily an indication of the risk associated with investing in those securities. The hierarchy classification of inputs used to value each Fund’s investments at October 31, 2024, is disclosed at the end of each Fund’s Schedule of Investments.
(e) Security Transactions and Investment Income
Security transactions are accounted for on the trade date. Realized gains and losses on sales of investment securities are calculated using specific identification. Dividend income is recognized on the ex-dividend date. Expenses and interest income are recognized on the accrual basis. Amortization of premium and accretion of discount on debt securities are included in interest income. Each Fund amortizes premiums and accretes discounts using the effective interest method. Premiums on callable debt instruments are amortized to interest income to the earliest call date using the effective interest method.
Dividend income from REIT investments is recorded using management’s estimate of the income included in distributions received from the REIT investments. Distributions received in excess of this estimated amount are recorded as a reduction of the cost of investments or reclassified to capital gains. The actual amounts of income, return of capital, and capital gains are only determined by each domestic REIT after its fiscal year-end, and may differ from the estimated amounts.
(f) Foreign Taxes
Certain Funds may be subject to foreign taxes (a portion of which may be reclaimable) on income, stock dividends, capital gains on investments, or certain foreign currency transactions. All foreign taxes are recorded in accordance with the applicable foreign tax regulations and rates that exist in the foreign jurisdictions in which each Fund invests. These foreign taxes, if any, are paid by each Fund
Notes to Financial Statements (continued)
October 31, 2024
and are reflected in its Statements of Operations as follows: foreign taxes withheld at source are presented as a reduction of income, foreign taxes on stock dividends are presented as “Other foreign taxes”, and foreign taxes on capital gains from sales of investments and foreign taxes on foreign currency transactions are included in their respective net realized gain (loss) categories. Foreign taxes payable or deferred as of October 31, 2024, if any, are disclosed in the Statements of Assets and Liabilities.
The Funds file withholding tax reclaims in certain jurisdictions to recover a portion of amounts previously withheld. The Funds may record a reclaim receivable based on collectability, which includes factors such as the jurisdiction’s applicable laws, payment history and market convention. The Statements of Operations includes tax reclaims recorded as well as professional and other fees, if any, associated with recovery of foreign withholding taxes.
(g) Expenses
Each Fund pays all of its expenses not assumed by its Sub-Adviser, if any, as defined in Note 3, or the Adviser. General Trust expenses that are allocated among and charged to the assets of the Funds and other series of the Trust are done so on a basis that the Board deems fair and equitable, which may be on a basis of relative net assets of each Fund and other series of the Trust or the nature of the services performed and relative applicability to each Fund and other series of the Trust.
(h) Short Sales
The Virtus InfraCap U.S. Preferred Stock ETF may sell securities short. A short sale is a transaction in which the Fund sells a security it does not own in anticipation of a decline in market price. To sell a security short, the Fund must borrow the security. The Fund’s obligation to replace the security borrowed and sold short will be fully collateralized at all times by the proceeds from the short sale retained by the broker and by cash and securities deposited in a segregated account with the Fund’s custodian. If the price of the security sold short increases between the time of the short sale and the time the Fund replaces the borrowed security, the Fund will realize a loss, and if the price declines during the period, the Fund will realize a gain. Any realized gain will be decreased, and any realized loss increased, by the amount of transaction costs. On the ex-dividend date, dividends on short sales are recorded as an expense to the Fund.
In accordance with the terms of its prime brokerage agreement, the Fund may receive rebate income or be charged a fee on borrowed securities which is reported as “Interest Expense” on the Statement of Operations. Such income or fee is calculated on a daily basis based upon the market value of each borrowed security and a variable rate that is dependent upon the availability of such security.
(i) Distributions to Shareholders
Distributions are recorded by the Funds on the ex-dividend date. Income and capital gain distributions are determined in accordance with income tax regulations that may differ from GAAP in the United States of America.
(j) Foreign Currency Translation
Non-U.S. Investment securities and other assets and liabilities denominated in foreign currencies are translated into U.S. dollar amounts at the foreign currency exchange rate effective at the end of the reporting period. Cost of investments is translated at the currency exchange rate effective at the trade date. The gain or loss resulting from a change in currency exchange rates between the trade and settlement date of a portfolio transaction is treated as a gain or loss on foreign currency. Likewise, the gain or loss resulting from a change in currency exchange rates between the date the income is accrued and the date it is paid is treated as a gain or loss on foreign currency. The Funds do not isolate that portion of the results of operations arising from changes in foreign exchange rates on investments from the fluctuations arising from changes in the market prices of securities held. Such fluctuations are included with the net realized and unrealized gain or loss on investments.
(k) Cash and Cash Equivalents
Cash is comprised of demand deposits. Cash equivalents are highly liquid investments with original maturities of 90 days or less. The carrying amount of cash equivalents, primarily representing money market funds is a reasonable estimate of fair value. These assets are considered to be Level 1 securities, per Accounting Standards Codification (“ASC”) Topic 820, Fair Value Measurements and Disclosures.
(l) Loan Agreements
The Virtus Newfleet Multi-Sector Bond ETF may invest in direct debt instruments which are interests in amounts owed by a corporate, governmental, or other borrower to lenders or lending syndicates. Loan agreements are generally non-investment grade and often involve borrowers that are highly leveraged. The Fund may invest in obligations of borrowers who are in bankruptcy proceedings. Loan agreements are typically senior in the corporate capital structure of the borrower. A loan is often administered by a bank or other financial institution (the “lender”) that acts as agent for all holders. The lender administers the terms of the loan, as specified in the loan agreement. The Fund’s investments in loans may be in the form of participations in loans or assignments of all or a portion of loans from
Notes to Financial Statements (continued)
October 31, 2024
third parties. When investing in loan participations, the Fund has the right to receive payments of principal, interest and any fees to which it is entitled only from the lender selling the loan participation and only upon receipt by the lender of payments from the borrower. The Fund generally has no right to enforce compliance with the terms of the loan agreement with the borrower. As a result, the Fund may be subject to the credit risk of both the borrower and the lender that is selling the loan agreement. When the Fund purchases assignments from lenders, it acquires direct rights against the borrower on the loan.
The Fund may invest in multiple series or tranches of a loan, which may have varying terms and carry different associated risks. Loan agreements may involve foreign borrowers, and investments may be denominated in foreign currencies. Direct indebtedness of emerging countries involves a risk that the government entities responsible for the repayment of the debt may be unable, or unwilling, to pay the principal and interest when due.
The loan agreements have floating rate loan interests which generally pay interest at rates that are periodically determined by reference to a base lending rate plus a premium. The base lending rates are generally the London Interbank Offered Rate (“LIBOR”), Secured Overnight Financing Rate (“SOFR”), the prime rate offered by one or more U.S. banks or the certificate of deposit rate. When a loan agreement is purchased, the Fund may pay an assignment fee. On an ongoing basis, the Fund may receive a commitment fee based on the undrawn portion of the underlying line of credit portion of a loan agreement. Prepayment penalty fees are received upon the prepayment of a loan agreement by a borrower. Prepayment penalty, facility, commitment, consent and amendment fees are recorded to income as earned or paid.
(m) Securities Lending
Certain Funds may loan securities to qualified brokers through an agreement with The Bank of New York Mellon (“BNY Mellon”), as a third party lending agent. Under the terms of the agreement, a Fund doing so is required to maintain collateral with a market value not less than 102% of the market value of loaned securities. Collateral is adjusted daily in connection with changes in the market value of securities on loan. Collateral may consist of cash and securities issued by the U.S. Government or its agencies. Cash collateral is invested in a short-term money market fund. Dividends earned on the collateral and premiums paid by the broker are recorded as income by a Fund net of fees and rebates charged by BNY Mellon for its services as securities lending agent and in connection with this securities lending program. Lending portfolio securities involves a risk of delay in the recovery of the loaned securities or in the declining value of the collateral.
At October 31, 2024, the following Funds had securities on loan:
| | | | | | | | | | | | | |
Funds | | Market Value | | Cash
Collateral | | Non Cash
Collateral(a) | | Net
Amount(b) | |
Virtus LifeSci Biotech Clinical Trials ETF | | $ | 2,544,897 | | $ | 754,964 | | $ | 1,908,940 | | $ | 0 |
|
Virtus LifeSci Biotech Products ETF | |
| 5,523,058 | |
| 325,415 | |
| 5,408,329 | |
| 0 |
|
Virtus Private Credit Strategy ETF | |
| 5,960,346 | |
| 4,882,798 | |
| 1,309,394 | |
| 0 |
|
Virtus Real Asset Income ETF | |
| 766,581 | |
| 332,328 | |
| 462,862 | |
| 0 |
|
(a)Collateral received in excess of the market value of securities on loan is not presented in this table. The total cash collateral received by each Fund is disclosed in the Fund’s statement of assets and liabilities.
(b)Net amount represents the net amount receivable due from the counterparty in the event of default.
Funds not listed in table above did not have any securities on loan at October 31, 2024.
The following table presents the contract value of securities lending transactions and the type of collateral provided to counterparties.
Remaining Contractual Maturity of the Agreements, as of October 31, 2024
| | | | | | | | | | |
| | Overnight and
Continuous | | Between | | Total |
<30 Days | | 30 & 90 days | | >90 days |
Virtus LifeSci Biotech Clinical Trials ETF | | | | | | | | | | |
Securities Lending Transactions | | | | | | | | | | |
Common Stocks | | $2,663,904
| | $—
| | $—
| | $—
| | $2,663,904
|
Gross amount of recognized liabilities for securities lending transactions: | | | | | | $2,663,904
|
| | | | | | | | | | |
Virtus LifeSci Biotech Products ETF | | | | | | | | | | |
Securities Lending Transactions | | | | | | | | | | |
Common Stocks | | $5,733,744
| | $—
| | $—
| | $—
| | $5,733,744
|
Gross amount of recognized liabilities for securities lending transactions: | | | | | | $5,733,744
|
Notes to Financial Statements (continued)
October 31, 2024
| | | | | | | | | | |
| | Overnight and
Continuous | | Between | | Total |
<30 Days | | 30 & 90 days | | >90 days |
| | | | | | | | | | |
Virtus Private Credit Strategy ETF | | | | | | | | | | |
Securities Lending Transactions | | | | | | | | | | |
Common Stocks | | $6,192,192
| | $—
| | $—
| | $—
| | $6,192,192
|
Gross amount of recognized liabilities for securities lending transactions: | | | | | | $6,192,192
|
| | | | | | | | | | |
Virtus Real Asset Income ETF | | | | | | | | | | |
Securities Lending Transactions | | | | | | | | | | |
Common Stocks | | $795,190
| | $—
| | $—
| | $—
| | $795,190
|
Gross amount of recognized liabilities for securities lending transactions: | | | | | | $795,190
|
3. INVESTMENT MANAGEMENT RELATED PARTIES AND OTHER AGREEMENTS
Investment Advisory Agreements
The Trust, on behalf of each Fund, has entered into Investment Advisory Agreements (collectively, the “Advisory Agreement”) with the Adviser, an indirect wholly-owned subsidiary of Virtus Investment Partners, Inc. (Ticker: VRTS) (together with its affiliates, “Virtus”). Pursuant to the Advisory Agreement, the Adviser has overall supervisory responsibility for the general management and investment of the Funds’ securities portfolios. The Adviser has agreed to pay all of the ordinary operating expenses of the Virtus LifeSci Biotech Clinical Trials ETF, Virtus LifeSci Biotech Products ETF, Virtus Private Credit Strategy ETF, Virtus Real Asset Income ETF, and Virtus WMC International Dividend ETF, except for each Fund’s management fee; payments under any 12b-1 plan; taxes and other governmental fees; brokerage fees, commissions and other transaction expenses; interest and other costs of borrowing; litigation or arbitration expenses; acquired fund fees and expenses; and extraordinary or other non-routine expenses of the Funds. The Adviser is entitled to receive a fee from each Fund (unless otherwise noted below) based on each Fund’s average daily net assets, computed and accrued daily and payable monthly, at an annual rate as follows:
| | |
Funds | | Rate |
InfraCap REIT Preferred ETF | | 0.45%, subject to a minimum annual fee of $25,000 per year |
Virtus InfraCap U.S. Preferred Stock ETF | | 0.80% |
Virtus LifeSci Biotech Clinical Trials ETF | | 0.79% |
Virtus LifeSci Biotech Products ETF | | 0.79% |
Virtus Newfleet Multi-Sector Bond ETF | | 0.45% |
Virtus Private Credit Strategy ETF | | 0.75% |
Virtus Real Asset Income ETF | | 0.55% |
Virtus WMC International Dividend ETF | | 0.49% |
The Advisory Agreement may be terminated by the Trust on behalf of a Fund with the approval of a Fund’s Board or by a vote of the majority of a Fund’s shareholders. The Advisory Agreement may also be terminated by the Adviser by not more than 60 days’ nor less than 30 days’ written notice.
Expense Limitation Agreement
The Adviser has contractually agreed to reduce its fees and reimburse expenses in order to limit Virtus Newfleet Multi-Sector Bond ETF’s total operating expenses (excluding interest, taxes, brokerage fees and commissions, other expenditures that are capitalized in accordance with generally accepted accounting principles, acquired fund fees and expenses, other extraordinary expenses not incurred in the ordinary course of the Funds’ business, and amounts, if any, payable pursuant to a plan adopted in accordance with Rule 12b-1 under the 1940 Act) from exceeding 0.49% of the Fund’s average daily net assets through at least February 28, 2025. The expense limitation agreement with respect to Virtus Newfleet Multi-Sector Bond ETF will be terminated upon termination of the Advisory Agreement between the Adviser and the Fund. In addition, while the Adviser or the Fund may discontinue the expense limitation agreement after the contractual period, it may only be terminated during its term with the approval of the Fund’s Board.
Under certain conditions, the Adviser may recapture operating expenses waived or reimbursed under the expense limitation agreement for a period of three years following the date on which such waiver or reimbursement occurred; provided that such recapture may not cause the Fund’s total operating expenses to exceed 0.49% of the average daily net assets of the Fund (or any lower expense limitation
Notes to Financial Statements (continued)
October 31, 2024
or limitations to which the Fund and the Adviser may otherwise agree). All or a portion of the following expenses reimbursed by the Adviser may be recaptured during the fiscal years indicated:
| | | | | | |
Fund | | 2025 | | 2026 | | 2027 |
Virtus Newfleet Multi-Sector Bond ETF | | $137,763 | | $168,746 | | $225,718 |
Sub-Advisory Agreement
Each Sub-Adviser provides investment advice and management services to its respective Fund. Pursuant to an investment sub-advisory agreement among the Trust, the respective Sub-Adviser and the Adviser, the Adviser pays each Fund’s Sub-Adviser a sub-advisory fee calculated as shown below. The Adviser has delegated to the InfraCap REIT Preferred ETF and Virtus InfraCap U.S. Preferred Stock ETF’s sub-adviser the obligation to pay all of the ordinary operating expenses of each of those Funds, except for the management fee paid to the Adviser; payments under any 12b-1 plan adopted by the Fund; taxes and other governmental fees; brokerage fees, commissions and other transaction expenses; interest and other costs of borrowing; litigation or arbitration expenses; acquired fund fees and expenses; and extraordinary or other non-routine expenses of the Fund. The Sub-Advisers and sub-advisory fees for each Fund are listed below.
| | | | |
Funds | | Sub-Advisers | | Sub-Advisory Fees |
InfraCap REIT Preferred ETF | | Infrastructure Capital Advisors, LLC | | 0.375%* |
Virtus InfraCap U.S. Preferred Stock ETF | | Infrastructure Capital Advisors, LLC | | 0.66%* |
Virtus Newfleet Multi-Sector Bond ETF | | Virtus Fixed Income Advisers, LLC, operating through its division Newfleet Asset Management(1) | | 50% of the net advisory fee*+ |
Virtus WMC International Dividend ETF | | Wellington Management Company LLP | | 0.21%* |
(1)An indirect wholly-owned subsidiary of Virtus.
*InfraCap REIT Preferred ETF, Virtus InfraCap U.S. Preferred Stock ETF, Virtus Newfleet Multi-Sector Bond ETF and Virtus WMC International Dividend ETF’s sub-advisory fees are paid for by the Adviser, not the Funds.
+Net advisory fee: In the event the Adviser waives its entire fee and also assumes expenses of the Trust pursuant to an applicable expense limitation agreement, the Sub-Adviser will similarly waive its entire fee and will share in the expense assumption by promptly paying to the Adviser (or its designee) 50% of the assumed amount. If during the term of the Sub-Advisory Agreement the Adviser later recaptures some or all of fees waived or expenses reimbursed by the Adviser and the Sub-Adviser together, then the Adviser will pay to the Sub-Adviser 50% of the amount recaptured.
Principal Underwriter
Pursuant to the terms of a Distribution Agreement with the Trust, VP Distributors, LLC (the “Distributor”) serves as the Funds’ principal underwriter. The Distributor receives compensation from the Adviser for the statutory underwriting services it provides to the Funds. The Distributor will not distribute shares in less than Creation Units (as hereinafter defined), and does not maintain a secondary market in shares. The shares are traded in the secondary market. The Distributor is an indirect wholly-owned subsidiary of Virtus.
Distribution and Service (12b-1 Plan)
The Board of Trustees has adopted a distribution and service plan, under which InfraCap REIT Preferred ETF, Virtus InfraCap U.S. Preferred Stock ETF, Virtus LifeSci Biotech Clinical Trials ETF, Virtus LifeSci Biotech Products ETF, Virtus Private Credit Strategy ETF, Virtus Real Asset Income ETF, and Virtus WMC International Dividend ETF (collectively, the “12b-1 Funds”) are authorized to pay an amount up to 0.25% of their average daily net assets each year to finance activities primarily intended to result in the sale of Creation Units of the 12b-1 Funds or the provision of investor services. No 12b-1 fees are currently paid by the 12b-1 Funds and there are no current plans to impose these fees.
Operational Administrator
Virtus ETF Solutions LLC (the “Administrator”) serves as the Funds’ operational administrator. The Administrator supervises the overall administration of the Trust and the Funds including, among other responsibilities, the coordination and day-to-day oversight of the Funds’ operations, the service providers’ communications with the Funds and each other and assistance with Trust, Board and contractual matters related to the Funds and other series of the Trust. The Administrator also provides persons satisfactory to the Board to serve as officers of the Trust. The Administrator is an indirect wholly-owned subsidiary of Virtus.
Accounting Services Administrator, Custodian and Transfer Agent
The Bank of New York Mellon (“BNY Mellon”) provides administrative, accounting, tax and financial reporting for the maintenance and operations of the Trust as the Funds’ accounting services administrator. BNY Mellon also serves as the custodian for the Funds’ assets, and serves as transfer agent and dividend paying agent for the Funds.
Notes to Financial Statements (continued)
October 31, 2024
Affiliated Shareholders
At October 31, 2024, Virtus Partners, Inc. held shares of the below Fund which may be sold at any time that aggregated to the following:
| | | | |
| | Shares | | % of share
outstanding |
Virtus WMC International Dividend ETF | | 184,507 | | 41.0% |
At October 31, 2024, the sub-adviser of the below Funds held shares of such Fund which may be redeemed at any time that aggregated to the following:
| | | | |
| | Shares | | % of share outstanding |
InfraCap REIT Preferred ETF | | 2,595 | | 0.0% |
Virtus InfraCap U.S. Preferred Stock ETF | | 399,214 | | 0.7% |
4. CREATION AND REDEMPTION TRANSACTIONS
The Funds issue and redeem shares on a continuous basis at NAV in aggregate blocks of shares or multiples thereof called “Creation Units.” The Funds’ Creation Units may be issued and redeemed generally for cash or an in-kind deposit of securities held by the Funds. In each instance of cash creations or redemptions, the Trust may impose transaction fees based on transaction expenses related to the particular exchange that will be higher than the transaction fees associated with in-kind purchases or redemptions.
Only “Authorized Participants” who have entered into contractual arrangements with the Distributor may purchase or redeem shares directly from the Funds. An Authorized Participant is either (i) a broker-dealer or other participant in the clearing process through the Continuous Net Settlement System of the National Securities Clearing Corporation or (ii) a DTC participant and, in each case, must have executed a Participant Agreement with the Distributor. Most retail investors will not qualify as Authorized Participants or have the resources to buy and sell whole Creation Units. Therefore, they will be unable to purchase or redeem the shares directly from the Funds. Rather, most retail investors will purchase shares in the secondary market with the assistance of a broker and will be subject to customary brokerage commissions or fees.
Authorized participants pay a fixed transaction fee to the shareholder servicing agent when purchasing and redeeming Creation Units of a Fund. The transaction fee is used to defray the costs associated with the issuance and redemption of Creation Units.
The following table discloses each Fund’s transaction fee:
| | |
Funds | | Creation/Redemption
Transaction Fee |
InfraCap REIT Preferred ETF | | $500
|
Virtus InfraCap U.S. Preferred Stock ETF | | 600 |
Virtus LifeSci Biotech Clinical Trials ETF | | 500 |
Virtus LifeSci Biotech Products ETF | | 500 |
Virtus Newfleet Multi-Sector Bond ETF | | 500 |
Virtus Private Credit Strategy ETF | | 500 |
Virtus Real Asset Income ETF | | 500 |
Virtus WMC International Dividend ETF | | 1,200 |
5. RESTRICTED SECURITIES
Restricted securities are not registered under the Securities Act. Generally, 144A securities are excluded from this category. Each Fund will bear any costs, including those involved in registration under the Securities Act, in connection with the disposition of such securities. The following Fund held a security that was considered to be restricted at October 31, 2024:
| | | | | | | | | | |
Fund | | Investment | | Date of
Acquisition | | Cost | | Value | | Percentage of
Net Assets |
Virtus LifeSci Biotech Clinical Trials ETF | | Scilex Holding Co | | 1/11/2023 | | $89,457 | | $15,519 | | 0.1% |
Notes to Financial Statements (continued)
October 31, 2024
6. FEDERAL INCOME TAX
Each Fund intends to qualify as a “regulated investment company” under Sub-chapter M of the Internal Revenue Code of 1986 (the “Code”), as amended. Each Fund intends to distribute substantially all of its net investment income and net capital gains to shareholders. Therefore, no federal income or excise tax provision is required. Accounting for Uncertainty in Income Taxes as issued by the FASB provides guidance for how uncertain tax positions should be recognized, measured, presented and disclosed in the financial statements, and requires the evaluation of tax positions taken or expected to be taken in the course of preparing a Fund’s tax returns to determine whether the tax positions are “more-likely-than-not” of being sustained by the applicable tax authority. Tax positions not deemed to meet the more-likely-than-not threshold would be recorded as a tax benefit or expense in the current year. Interest and penalties related to income taxes would be recorded as income tax expense. Management of the Funds is required to analyze all open tax years (2021, 2022 and 2023), as defined by IRS statute of limitations, for all major jurisdictions, including federal tax authorities and certain state tax authorities. As of October 31, 2024, the Funds did not have a liability for any unrecognized tax benefits or uncertain tax positions that would require recognition in the financial statements. The Funds have no examination in progress and are not aware of any tax positions for which it is reasonably possible that the amounts of unrecognized tax benefits will significantly change in the next twelve months.
The Funds recognize interest accrued related to unrecognized tax benefits and penalties as income tax expense. For the year ended October 31, 2024, the Funds had no accrued penalties or interest.
At October 31, 2024, the adjusted cost basis of investments and gross unrealized appreciation and depreciation of investments for federal income tax purposes were as follows:
| | | | | | | | | |
| | Federal Tax Cost
Of Investments | | Gross Unrealized
Appreciation | | Gross Unrealized
Depreciation | | Net Unrealized
Appreciation
(Depreciation) | |
InfraCap REIT Preferred ETF | | $112,732,396
| | $5,835,148
| | $(4,048,354
| ) | $1,786,794
| |
Virtus InfraCap U.S. Preferred Stock ETF | | 1,635,316,148 | | 115,426,541 | | (51,969,027 | ) | 63,457,514 | |
Virtus LifeSci Biotech Clinical Trials ETF | | 13,702,435 | | 2,987,215 | | (4,838,554 | ) | (1,851,339 | ) |
Virtus LifeSci Biotech Products ETF | | 20,110,833 | | 5,568,487 | | (3,379,225 | ) | 2,189,262 | |
Virtus Newfleet Multi-Sector Bond ETF | | 192,929,269 | | 2,534,666 | | (1,958,551 | ) | 576,115 | |
Virtus Private Credit Strategy ETF | | 58,990,550 | | 904,971 | | (4,307,704 | ) | (3,402,733 | ) |
Virtus Real Asset Income ETF | | 17,958,400 | | 1,320,311 | | (3,805,240 | ) | (2,484,929 | ) |
Virtus WMC International Dividend ETF | | 11,490,815 | | 1,401,523 | | (581,941 | ) | 819,582 | |
At October 31, 2024, the components of accumulated earnings/loss on a tax-basis were as follows:
| | | | | | | | | |
| | Undistributed
Ordinary Income | | Accumulated
Capital and
Other Gain
(Loss) | | Net Unrealized
Appreciation
(Depreciation) | | Total
Accumulated
Earnings (Loss) | |
InfraCap REIT Preferred ETF | | $—
| | $(12,283,400
| ) | $1,786,794
| | (10,496,606 | ) |
Virtus InfraCap U.S. Preferred Stock ETF | | — | | — | | 63,457,514 | | 63,457,514 | |
Virtus LifeSci Biotech Clinical Trials ETF | | 75,007 | | (59,034,900 | ) | (1,851,339 | ) | (60,811,232 | ) |
Virtus LifeSci Biotech Products ETF | | — | | (16,088,542 | ) | 2,189,262 | | (13,899,280 | ) |
Virtus Newfleet Multi-Sector Bond ETF | | 416,520 | | (5,041,012 | ) | 576,115 | | (4,048,377 | ) |
Virtus Private Credit Strategy ETF | | 850,742 | | (10,211,080 | ) | (3,402,733 | ) | (12,763,071 | ) |
Virtus Real Asset Income ETF | | 412,513 | | (44,745,141 | ) | (2,484,956 | ) | (46,817,584 | ) |
Virtus WMC International Dividend ETF | | 66,123 | | (232,056 | ) | 818,854 | | 652,921 | |
Ordinary losses incurred after December 31 (“Late Year Ordinary Losses”) within the taxable year are deemed to arise on the first business day of the Funds’ next taxable year. During the fiscal year ended October 31, 2024, the following Fund incurred and elected to defer Late Year Ordinary Losses as follows:
| | |
Virtus LifeSci Biotech Products ETF | | $78,158
|
Notes to Financial Statements (continued)
October 31, 2024
The tax character of dividends and distributions paid during the fiscal years ended October 31, 2024 and October 31, 2023 were as follows:
| | | | | | | | | | | | |
| | 2024 | | 2023 |
| | Distributions
Paid From
Ordinary
Income | | Return of
Capital | | Distributions
Paid From
Long-Term
Capital Gains | | Distributions
Paid From
Ordinary
Income | | Return of
Capital | | Distributions
Paid From
Long-Term
Capital Gains |
InfraCap REIT Preferred ETF | | $4,553,044
| | $1,776,962
| | $—
| | $3,748,137
| | $1,285,869
| | $—
|
Virtus InfraCap U.S. Preferred Stock ETF | | 72,248,861 | | 5,386,521 | | 14,265,126 | | 46,177,337 | | 10,423,671 | | — |
Virtus LifeSci Biotech Clinical Trials ETF | | 37,035 | | — | | — | | — | | — | | — |
Virtus LifeSci Biotech Products ETF | | — | | — | | — | | — | | — | | — |
Virtus Newfleet Multi-Sector Bond ETF | | 5,718,315 | | — | | — | | 3,089,988 | | — | | — |
Virtus Private Credit Strategy ETF | | 3,995,609 | | — | | — | | 2,724,501 | | — | | — |
Virtus Real Asset Income ETF | | 993,505 | | — | | — | | 1,496,841 | | — | | — |
Virtus WMC International Dividend ETF | | 467,150 | | — | | — | | 380,432 | | — | | — |
Short-term gain distributions if any, are reported as ordinary income for federal tax purposes.
At October 31, 2024, for federal income tax purposes, the following Funds have capital loss carryforwards available to offset future capital gains for an unlimited period. To the extent that these loss carryforwards are utilized, capital gains so offset will not be distributed to shareholders:
| | | | | | |
| | Short-Term
No Expiration | | Long-Term
No Expiration | | Total |
InfraCap REIT Preferred ETF | | $11,889,448
| | $393,952
| | $12,283,400
|
Virtus InfraCap U.S. Preferred Stock ETF | | — | | — | | — |
Virtus LifeSci Biotech Clinical Trials ETF | | 24,935,425 | | 34,099,475 | | 59,034,900 |
Virtus LifeSci Biotech Products ETF | | 2,439,086 | | 13,571,298 | | 16,010,384 |
Virtus Newfleet Multi-Sector Bond ETF | | 1,276,514 | | 3,764,498 | | 5,041,012 |
Virtus Private Credit Strategy ETF | | 3,294,215 | | 6,916,865 | | 10,211,080 |
Virtus Real Asset Income ETF | | 26,325,320 | | 18,419,821 | | 44,745,141 |
Virtus WMC International Dividend ETF | | 74,390 | | 157,666 | | 232,056 |
For financial reporting purposes, capital accounts are adjusted to reflect the tax character of permanent book/tax differences. Results of operations and net assets were not affected by these reclassifications. Reclassifications are primarily due to tax treatment of redemptions in kind. At October 31, 2024, the effect of permanent book/tax reclassifications resulted in increases (decreases) to the components of net assets as follows:
| | | | | |
| | Distributable Earnings (Accumulated Deficit) | | Paid-In-Capital | |
InfraCap REIT Preferred ETF | | $242,506
| | $(242,506
| ) |
Virtus InfraCap U.S. Preferred Stock ETF | | 8,755,858 | | (8,755,858 | ) |
Virtus LifeSci Biotech Clinical Trials ETF | | (304,121 | ) | 304,121 | |
Virtus LifeSci Biotech Products ETF | | 89,904 | | (89,904 | ) |
Virtus Newfleet Multi-Sector Bond ETF | | (740 | ) | 740 | |
Virtus Private Credit Strategy ETF | | (540,001 | ) | 540,001 | |
Virtus Real Asset Income ETF | | 954,720 | | (954,720 | ) |
Virtus WMC International Dividend ETF | | — | | — | |
Notes to Financial Statements (continued)
October 31, 2024
7. INVESTMENT TRANSACTIONS
Purchases and sales of investments (excluding short-term investments), subscriptions in-kind and redemptions in-kind for the year ended October 31, 2024 were as follows:
| | | | | | | | |
| | Purchases | | Sales | | Subscriptions
In-Kind | | Redemptions
In-Kind |
InfraCap REIT Preferred ETF | | $10,736,822
| | $10,974,953
| | $50,627,244
| | $5,346,771
|
Virtus InfraCap U.S. Preferred Stock ETF | | 744,321,237 | | 748,814,456 | | 745,931,235 | | 5,374,585 |
Virtus LifeSci Biotech Clinical Trials ETF | | 8,044,263 | | 8,014,962 | | — | | 1,229,648 |
Virtus LifeSci Biotech Products ETF | | 8,849,566 | | 8,994,134 | | 3,013,780 | | — |
Virtus Newfleet Multi-Sector Bond ETF | | 200,937,107 | | 70,631,351 | | — | | — |
Virtus Private Credit Strategy ETF | | 11,349,850 | | 11,212,506 | | 36,989,978 | | 13,494,515 |
Virtus Real Asset Income ETF | | 11,326,784 | | 11,114,975 | | 1,182,947 | | 4,726,484 |
Virtus WMC International Dividend ETF | | 4,101,668 | | 3,993,700 | | 2,644,460 | | — |
Purchases and sales of long-term U.S. Government Securities for the year ended October 31, 2024 were as follows:
| | | | |
| | Purchases | | Sales |
Virtus Newfleet Multi-Sector Bond ETF | | $25,945,687
| | $18,870,671
|
8. BORROWINGS
The Virtus InfraCap U.S. Preferred Stock ETF entered into Lending Agreements (the “Agreements”) with commercial banks (the “Banks”) that allows the Fund to borrow cash from the Banks. Borrowings under the Agreements are collateralized by investments of the Fund. If the Fund defaults with respect to any of its obligations under the Agreements, the Banks may foreclose on assets of the Fund and/ or the Fund may be required to repay immediately, in part or in full, the loan balance outstanding under the Agreements, necessitating the sale of securities at potentially inopportune times. Interest is charged at the Overnight Bank Funding Rate (“OBFR”) plus an additional percentage rate on the amount borrowed. The Agreements have an on-demand commitment term. For the year ended October 31, 2024, the average daily borrowings under the Agreements and the weighted average interest rate were $247,680,400 and 6.35%, respectively.
9. INVESTMENT RISKS
As with any investment, an investment in the Funds could result in a loss or the performance of the Funds could be inferior to that of other investments. An investor should consider each Fund’s investment objectives, risks, and charges and expenses carefully before investing. Each Fund’s prospectus and statement of additional information contain this and other important information.
Credit Risk
Junk Bonds or High Yield Securities: High yield securities are generally subject to greater levels of credit quality risk than investment grade securities. The retail secondary market for these “junk bonds” may be less liquid than that of higher-rated fixed income securities, and adverse conditions could make it difficult at times to sell these securities or could result in lower prices than higher-rated fixed income securities. These risks can reduce the value of the Fund’s shares and the income it earns.
Cash Concentration Risk
At various times, the Funds may have cash and cash collateral balances that exceed federally insured limits.
Market Risk
Local, regional or global events such as war, acts of terrorism, the spread of infectious illness or other public health issue, recessions, or other events could have a significant impact on each Fund and its investments, including hampering the ability of the Fund’s portfolio manager(s) to invest the Fund’s assets as intended.
10. LIBOR REPLACEMENT RISK
In July 2017, the head of the United Kingdom Financial Conduct Authority (“FCA”) announced the intention to phase out the use of LIBOR by the end of 2021. However, after subsequent announcements by the FCA, the LIBOR administrator and other regulators, certain of the most widely used LIBORs continued until approximately June 30, 2023. The ICE Benchmark Administration Limited, which is regulated and authorized by FCA, and the administrator of LIBOR, ceased publishing certain LIBOR settings on December 31, 2021. On April 3, 2023, the FCA announced its decision to require LIBOR’s administrator to continue to publish the 1-month, 3-month, and 6-month U.S. dollar settings under an unrepresentative synthetic methodology until September 30, 2024. On March 15, 2022, the
Notes to Financial Statements (continued)
October 31, 2024
Adjustable Interest Act (LIBOR) Act (the “LIBOR Act”) was enacted into law which directs the Federal Reserve Board, as a fallback mechanism, to identify benchmark rates based on SOFR that will replace LIBOR in certain financial contracts after June 30, 2023. On December 16, 2022, the Federal Reserve adopted regulations implementing the LIBOR Act. The Funds may be exposed to financial instruments tied to LIBOR to determine payment obligations, financing terms, hedging strategies or investment value. The expected discontinuation of LIBOR could have a significant impact on the financial markets and may present a material risk for certain market participants, including the Funds. Abandonment of or modifications to LIBOR could lead to significant short- and long-term uncertainty and market instability. The risks associated with this discontinuation and transition may be exacerbated if the work necessary to effect an orderly transition to an alternative reference rate is not completed in a timely manner. It remains uncertain the effects such changes will have on the Funds, issuers of instruments in which the Funds invest, and the financial markets generally.
11. 10% SHAREHOLDERS
As of October 31, 2024, certain Funds had individual shareholder account(s) and/or omnibus shareholder account(s) (comprised of a group of individual shareholders), which individually amounted to more than 10% of the total shares outstanding of the Fund as detailed below:
| | | | |
Funds | | % of Shares
Outstanding | | Number of
Accounts |
InfraCap REIT Preferred ETF | | 68% | | 3 |
Virtus InfraCap U.S. Preferred Stock ETF | | 59% | | 2 |
Virtus LifeSci Biotech Clinical Trials ETF | | 63% | | 3 |
Virtus LifeSci Biotech Products ETF | | 44% | | 2 |
Virtus Newfleet Multi-Sector Bond ETF | | 68% | | 2 |
Virtus Private Credit Strategy ETF | | 66% | | 2 |
Virtus Real Asset Income ETF | | 81% | | 2 |
Virtus WMC International Dividend ETF | | 72% | | 2* |
* Includes affiliated shareholder account.
12. RECENT ACCOUNTING PRONOUNCEMENTS
In March 2020, the FASB issued Accounting Standards Update (“ASU”) No. 2020-04 (“ASU 2020-04”), Reference Rate Reform (Topic 848) – Facilitation of the Effects of Reference Rate Reform on Financial Reporting. The amendments in ASU 2020-04 provide optional temporary financial reporting relief from the effect of certain types of contract modifications due to the planned discontinuation of the LIBOR and other interbank-offered reference rates as of the end of 2021. In March 2021, the administrator for LIBOR announced the extension of the publication of a majority of the USD LIBOR settings to June 30, 2023. On December 21, 2022, the FASB issued ASU 2022-06 to defer the sunset date of ASC 848 until December 31, 2024. ASU 2020-04 is effective for certain reference rate-related contract modifications that occur during the period March 12, 2020 through December 31, 2024. Management is currently evaluating the impact, if any, of ASU 2020-04 and ASU 2020-06, but does not believe there will be a material impact.
In November 2023, the FASB issued Accounting Standards Update (ASU), ASU 2023-07, Segment Reporting (Topic 280) – Improvements to Reportable Segment Disclosures, which improves reportable segment disclosure requirements, primarily through enhanced disclosures about segment expenses. In addition, the ASU clarifies that a public entity with a single reportable segment provide all disclosures required by the ASU and all existing segment disclosures in Topic 280. The amendments under this ASU are effective on a retrospective basis for annual periods beginning after December 15, 2023 and for interim periods within fiscal years beginning after December 15, 2024, and early adoption is permitted. Management is currently evaluating the impact of adopting ASU 2023-07 on the Funds’ financial statements.
13. SUBSEQUENT EVENTS
Management has evaluated subsequent events through the issuance of these financial statements and has determined that there are no material events that would require disclosure.
Schedule of Investments — InfraCap MLP ETF
October 31, 2024
The accompanying notes are an integral part of these financial statements.
65
| | | | | |
Security Description | | Shares | | Value | |
| | | | | |
COMMON STOCKS — 132.6% | | | | | |
| | | | |
Energy — 132.4% | | | | |
Cheniere Energy Partners LP(1) | | 427,203 | | $21,595,112
| |
Cheniere Energy, Inc.(1)(2) | | 65,501 | | 12,535,581 | |
Delek Logistics Partners LP | | 347,756 | | 13,412,949 | |
DT Midstream, Inc. | | 33,149 | | 2,988,382 | |
Enbridge, Inc. (Canada)(1) | | 80,206 | | 3,240,322 | |
Energy Transfer LP(1)(2) | | 3,352,620 | | 55,251,178 | |
EnLink Midstream LLC(1) | | 761,678 | | 11,303,302 | |
Enterprise Products Partners LP(1) | | 1,816,859 | | 52,071,179 | |
Genesis Energy LP(1) | | 630,212 | | 7,127,698 | |
Global Partners LP | | 141,147 | | 6,608,503 | |
Hess Midstream LP Class A | | 610,146 | | 21,141,559 | |
HF Sinclair Corp. | | 823 | | 31,776 | |
Kinder Morgan, Inc.(1)(2) | | 348,139 | | 8,532,887 | |
Marathon Petroleum Corp.(1)(2) | | 28,907 | | 4,205,101 | |
MPLX LP(1) | | 1,386,023 | | 61,567,142 | |
ONEOK, Inc.(1) | | 52,026 | | 5,040,279 | |
Phillips 66(2) | | 17,490 | | 2,130,632 | |
Plains All American Pipeline LP(1) | | 3,647,312 | | 59,341,766 | |
South Bow Corp. (Canada)*(1) | | 21,959 | | 548,097 | |
Sunoco LP(1) | | 1,174,788 | | 59,679,230 | |
Targa Resources Corp.(1) | | 50,365 | | 8,408,940 | |
TC Energy Corp. (Canada)(1) | | 119,797 | | 5,571,758 | |
USA Compression Partners LP | | 251,080 | | 5,476,055 | |
Valero Energy Corp.(2) | | 49,963 | | 6,483,199 | |
Western Midstream Partners LP(1) | | 1,412,125 | | 53,279,476 | |
Williams Cos., Inc. (The)(1) | | 231,101 | | 12,102,759 | |
Total Energy | | | | 499,674,862 | |
Utilities — 0.2% | | | | |
Suburban Propane Partners LP | | 47,750 | | 896,267 | |
Total Common Stocks | | | | | |
(Cost $311,838,390) | | | | 500,571,129 | |
| | | | | |
PREFERRED STOCKS — 0.7% | | | | | |
Energy — 0.7% | | | | | |
Brookfield Infrastructure Finance ULC, 5.00% (Canada) | | 973 | | 18,867 | |
Energy Transfer LP, Series I, 9.25% | | 229,782 | | 2,729,810 | |
Total Energy | | | | 2,748,677 | |
Total Preferred Stocks | | | | | |
(Cost $2,191,364) | | | | 2,748,677 | |
| | | | | |
MONEY MARKET FUNDS — 2.4% | | | | | |
Goldman Sachs Financial Square Government Fund, Institutional Shares, 4.78%(3) | | 4,572,397 | | 4,572,397 | |
RBC BlueBay U.S. Government Money Market Fund - Institutional Shares, 4.77%(3) | | 4,572,398 | | 4,572,398 | |
Total Money Market Funds | | | | | |
(Cost $9,144,795) | | | | 9,144,795 | |
| | | | | |
| | | | | |
Security Description | | Shares | | Value | |
| | | | | |
TOTAL INVESTMENTS — 135.7% | | | | | |
(Cost $323,174,549) | | | | $512,464,601
| |
Liabilities in Excess of Other Assets — (35.7)% | | | | (134,920,500 | ) |
Net Assets — 100.0% | | | | $377,544,101
| |
| | | | | | | |
Security Description | | Notional
Amount | | Number of
contracts | | Value | |
| | | | | |
WRITTEN OPTIONS — (0.0)%(4) | | | | | |
| |
Written Call Options | |
Cheniere Energy, Inc., Expires 11/08/24,
Strike Price $190.00 | | (10,000 | ) | (100 | ) | $(36,200
| ) |
Energy Transfer LP, Expires 11/01/24,
Strike Price $16.50 | | (100,000 | ) | (1,000 | ) | (5,000 | ) |
Energy Transfer LP, Expires 11/08/24,
Strike Price $16.50 | | (100,000 | ) | (1,000 | ) | (23,000 | ) |
Kinder Morgan, Inc., Expires 11/08/24,
Strike Price $25.00 | | (100,000 | ) | (1,000 | ) | (19,000 | ) |
Marathon Petroleum Corp., Expires 11/01/24,
Strike Price $185.00 | | (10,000 | ) | (100 | ) | 0 | |
Marathon Petroleum Corp., Expires 11/08/24,
Strike Price $190.00 | | (10,000 | ) | (100 | ) | (200 | ) |
Marathon Petroleum Corp., Expires 11/15/24,
Strike Price $180.00 | | (15,000 | ) | (150 | ) | (6,300 | ) |
Marathon Petroleum Corp., Expires 11/15/24,
Strike Price $185.00 | | (20,000 | ) | (200 | ) | (8,000 | ) |
Phillips 66, Expires 11/01/24,
Strike Price $131.00 | | (10,000 | ) | (100 | ) | (500 | ) |
Phillips 66, Expires 11/01/24,
Strike Price $145.00 | | (10,000 | ) | (100 | ) | 0 | |
Phillips 66, Expires 11/08/24,
Strike Price $135.00 | | (10,000 | ) | (100 | ) | (1,000 | ) |
Phillips 66, Expires 11/15/24,
Strike Price $144.00 | | (15,000 | ) | (150 | ) | (600 | ) |
Valero Energy Corp., Expires 11/01/24,
Strike Price $134.00 | | (20,000 | ) | (200 | ) | (3,200 | ) |
Valero Energy Corp., Expires 11/01/24,
Strike Price $160.00 | | (10,000 | ) | (100 | ) | 0 | |
Valero Energy Corp., Expires 11/08/24,
Strike Price $141.00 | | (10,000 | ) | (100 | ) | (2,100 | ) |
Valero Energy Corp., Expires 11/08/24,
Strike Price $147.00 | | (10,000 | ) | (100 | ) | (1,300 | ) |
Valero Energy Corp., Expires 11/08/24,
Strike Price $165.00 | | (10,000 | ) | (100 | ) | 0 | |
Schedule of Investments — InfraCap MLP ETF (continued)
October 31, 2024
The accompanying notes are an integral part of these financial statements.
66
| | | | | | | |
Security Description | | Notional
Amount | | Number of
contracts | | Value | |
| | | | | |
WRITTEN OPTIONS (continued) | | | | | |
| | | | | | | |
Written Call Options (continued) | | | | | | | |
Valero Energy Corp., Expires 11/15/24,
Strike Price $150.00 | | (5,000 | ) | (50 | ) | $ (1,250
| ) |
Valero Energy Corp., Expires 11/15/24,
Strike Price $152.50 | | (20,000 | ) | (200 | ) | (1,800 | ) |
Cheniere Energy, Inc., Expires 11/01/24,
Strike Price $180.00 | | (30,000 | ) | (300 | ) | (1,800 | ) |
Plains All American Pipeline LP, Expires 11/15/24,
Strike Price $16.00 | | (100,000 | ) | (1,000 | ) | (20,000 | ) |
Targa Resources Corp., Expires 11/15/24,
Strike Price $140.00 | | (3,500 | ) | (35 | ) | (630 | ) |
| | | | | | | |
Security Description | | Notional
Amount | | Number of
contracts | | Value | |
| | | | | |
WRITTEN OPTIONS (continued) | | | | | |
| | | | | | | |
Written Call Options (continued) | | | | | | | |
Targa Resources Corp., Expires 11/15/24,
Strike Price $145.00 | | (2,500 | ) | (25 | ) | $(813
| ) |
Targa Resources Corp., Expires 11/15/24,
Strike Price $150.00 | | (10,000 | ) | (100 | ) | (5,700 | ) |
Targa Resources Corp., Expires 11/15/24,
Strike Price $155.00 | | (20,000 | ) | (200 | ) | (22,000 | ) |
Targa Resources Corp., Expires 12/20/24,
Strike Price $150.00 | | (10,000 | ) | (100 | ) | (17,200 | ) |
Williams Cos., Inc. (The), Expires 11/01/24,
Strike Price $52.00 | | (50,000 | ) | (500 | ) | (5,000 | ) |
Total Written Options — (0.0)%(4) | | | | | |
(Premiums Received $268,336) | | | | | | $(182,593
| ) |
*Non-income producing security.
(1)Security, or a portion thereof, has been pledged as collateral for borrowings. The aggregate market value of the collateral at October 31, 2024 was $377,221,928.
(2)Subject to written call options.
(3)The rate shown reflects the seven-day yield as of October 31, 2024.
(4)Amount rounds to less than 0.05%.
The following table summarizes valuation of the Fund’s investments under the fair value hierarchy levels as of October 31, 2024.
| | | | | | | | |
| | Level 1 | | Level 2 | | Level 3 | | Total |
Asset Valuation Inputs | | | | | | | | |
Common Stocks | | $500,571,129
| | $—
| | $—
| | $500,571,129
|
Preferred Stocks | | 2,748,677 | | — | | — | | 2,748,677 |
Money Market Funds | | 9,144,795 | | — | | — | | 9,144,795 |
Total | | $512,464,601
| | $—
| | $—
| | $512,464,601
|
Liability Valuation Inputs | | | | | | | | |
Written Options | | $179,863
| | $2,730
| | $—
| | $182,593
|
Total | | $179,863
| | $2,730
| | $—
| | $182,593
|
Statement of Assets and Liabilities
October 31, 2024
The accompanying notes are an integral part of these financial statements.
67
| | | |
| | InfraCap MLP
ETF | |
Assets: | | | |
Investments, at cost | | $323,174,549
| |
Investments, at value | | 512,464,601 | |
Due from broker | | 1,453,898 | |
Receivables: | | | |
Investment securities sold | | 4,119,321 | |
Dividends and interest | | 147,579 | |
Tax reclaim | | 7,507 | |
Prepaid taxes | | 2,860 | |
Prepaid expenses | | 232,066 | |
Total Assets | | 518,427,832 | |
Liabilities: | | | |
Bank borrowings | | 110,044,406 | |
Due to custodian | | 8,000,000 | |
Payables: | | | |
Investment securities purchased | | 2,854,557 | |
Interest expense | | 585,932 | |
Sub-Advisory fees | | 313,050 | |
Written options, at value(a) | | 182,593 | |
Current Income Tax Liability | | 1,417,193 | |
Deferred Income Tax Liability | | 17,486,000 | |
Total Liabilities | | 140,883,731 | |
Net Assets | | $377,544,101
| |
Net Assets Consist of: | | | |
Paid-in capital | | $483,196,365
| |
Total distributable earnings (accumulated deficit), net of income taxes | | (105,652,264 | ) |
Net Assets | | $377,544,101
| |
Shares outstanding (unlimited number of shares of beneficial interest authorized, no par value) | | 9,540,000 | |
Net asset value per share | | $39.57
| |
(a)Premiums received from written options | | $268,336
| |
Statement of Operations
For the Year Ended October 31, 2024
The accompanying notes are an integral part of these financial statements.
68
| | | |
| | InfraCap MLP
ETF | |
Investment Income: | | | |
Distributions from master limited partnerships | | $29,035,635
| |
Dividend income (net of foreign withholding taxes) | | 3,682,980 | |
Interest income | | 30,286 | |
Less: Return of capital distributions | | (30,747,277 | ) |
Total Investment Income | | 2,001,624 | |
| | | |
Expenses: | | | |
Interest expenses | | 7,713,899 | |
Sub-Advisory fees | | 3,561,116 | |
Total Expenses | | 11,275,015 | |
Net Investment (Loss) Before Income Taxes | | (9,273,391 | ) |
Current and Deferred Income Tax Benefit / (Expense) | | 981,591 | |
Net Investment (Loss), Net of Income Taxes | | (8,291,800 | ) |
| | | |
Net Realized Gain (Loss) on: | | | |
Investments | | 27,362,648 | |
Written options | | 3,023,071 | |
Foreign currency transactions | | (1,918 | ) |
Current and Deferred Income Tax Benefit (Expense) | | (3,216,133 | ) |
Total Net Realized Gain, Net of Income Taxes | | 27,167,668 | |
| | | |
Change in Net Unrealized Appreciation (Depreciation) on: | | | |
Investments | | 67,317,764 | |
Written options | | 12,167 | |
Foreign currency translations | | (29 | ) |
Current and Deferred Income Tax Benefit (Expense) | | (7,126,886 | ) |
Total Change in Net Unrealized Appreciation | | 60,203,016 | |
Net Realized and Change in Unrealized Gain, Net of Income Taxes | | 87,370,684 | |
Net Increase in Net Assets Resulting from Operations | | $79,078,884
| |
Foreign withholding taxes | | $34,166
| |
| | | |
Statement of Changes in Net Assets
The accompanying notes are an integral part of these financial statements.
69
| | | | | |
| | InfraCap MLP ETF | |
| | For the
Year Ended
October 31, 2024 | | For the
Year Ended
October 31, 2023 | |
Increase (Decrease) in Net Assets Resulting from Operations: | | | | | |
Net investment loss, net of income taxes | | $(8,291,800
| ) | $(6,220,973
| ) |
Net realized gain, net of income taxes | | 27,167,668 | | 37,633,482 | |
Net change in unrealized appreciation, net of income taxes | | 60,203,016 | | 5,854,071 | |
Net increase in net assets resulting from operations | | 79,078,884 | | 37,266,580 | |
Distributions to Shareholders | | (29,650,201 | ) | (26,762,601 | ) |
| | | | | |
Shareholder Transactions: | | | | | |
Proceeds from shares sold | | 22,770,177 | | 23,202,124 | |
Cost of shares redeemed | | (21,266,939 | ) | (40,630,273 | ) |
Net increase (decrease) in net assets resulting from shareholder transactions | | 1,503,238 | | (17,428,149 | ) |
Increase (decrease) in net assets | | 50,931,921 | | (6,924,170 | ) |
| | | | | |
Net Assets: | | | | | |
Beginning of year | | 326,612,180 | | 333,536,350 | |
End of year | | $377,544,101
| | $326,612,180
| |
| | | | | |
Changes in Shares Outstanding: | | | | | |
Shares outstanding, beginning of year | | 9,490,000 | | 10,040,000 | |
Shares sold | | 600,000 | | 700,000 | |
Shares redeemed | | (550,000 | ) | (1,250,000 | ) |
Shares outstanding, end of year | | 9,540,000 | | 9,490,000 | |
Statement of Cash Flows
For the Year Ended October 31, 2024
The accompanying notes are an integral part of these financial statements.
70
| | | |
| | InfraCap MLP
ETF | |
Cash Flows From Operating Activities: | | | |
Net increase (decrease) in net assets from operations | | $79,078,884
| |
| | | |
Adjustments to reconcile net increase (decrease) in net assets from operations to net cash provided by (used in) operating activities: | | | |
Purchases of investment securities | | (291,659,515 | ) |
Proceeds from sales of investments | | 345,760,234 | |
Net proceeds from purchased and written options | | 3,950,821 | |
Net realized (gain) loss on investments | | (27,362,648 | ) |
Net realized (gain) loss on written options | | (3,023,071 | ) |
Net proceeds (purchases) of short-term investment securities | | (9,144,795 | ) |
Net change in unrealized (appreciation) depreciation on investments | | (67,317,764 | ) |
Net change in unrealized (appreciation) depreciation on written options | | (12,167 | ) |
(Increase) decrease in due from brokers | | (1,411,935 | ) |
(Increase) decrease in dividends and interest receivable | | 487,977 | |
(Increase) decrease in tax reclaim receivable | | (7,507 | ) |
Increase (decrease) in current tax payable | | (3,066,913 | ) |
(Increase) decrease in prepaid expenses | | (227,500 | ) |
(Increase) decrease in prepaid taxes | | 2,525,400 | |
Increase (decrease) in sub-advisory fees payable | | 49,023 | |
Increase (decrease) in deferred income tax liability | | 6,841,841 | |
Increase (decrease) in interest expense | | 585,932 | |
Net cash provided by (used in) operating activities | | 36,046,297 | |
| | | |
Cash Flows provided by (used in) Financing Activities: | | | |
Due to custodian | | 8,000,000 | |
Proceeds from borrowings | | 12,728,686 | |
Payments for fund shares sold in excess of in-kind creations (issues and redemptions) | | (29,035,549 | ) |
Distributions paid | | (29,650,201 | ) |
Net cash provided by (used in) financing activities | | (37,957,064 | ) |
| | | |
Net increase (decrease) in cash | | (1,910,767 | ) |
Cash, beginning of year | | 1,910,767 | |
Cash, end of year | | $—
| |
| | | |
Supplemental information: | | | |
Interest paid on borrowings | | $7,127,967
| |
Income taxes paid | | 3,285,395 | |
| | | |
Non-cash financing activities: | | | |
In-kind creations — Issued | | $30,538,787
| |
In-kind creations — Redeemed | | — | |
Financial Highlights
October 31, 2024
The accompanying notes are an integral part of these financial statements.
71
| | | | | | | | | | | | | | | | | | | | |
| | InfraCap MLP ETF |
| | For the
Year Ended
October 31, 2024 | | For the
Year Ended
October 31, 2023 | | For the
Year Ended
October 31, 2022 | | For the
Year Ended
October 31, 2021 | | For the
Year Ended
October 31, 20201 |
Per Share Data for a Share Outstanding throughout each year presented: | | | | | | | | | | | | | | | | | | | | |
Net asset value, beginning of year | | | $34.42
| | | | $33.22
| | | | $27.31
| | | | $13.78
| | | | $44.80
| |
Investment operations: | | | | | | | | | | | | | | | | | | | | |
Net investment loss2 | | | (0.86 | ) | | | (0.65 | ) | | | (0.31 | ) | | | (0.33 | ) | | | (0.09 | ) |
Net realized and unrealized gain (loss) | | | 9.09 | | | | 4.69 | | | | 8.86 | | | | 16.50 | | | | (28.94 | ) |
Total from investment operations | | | 8.23 | | | | 4.04 | | | | 8.55 | | | | 16.17 | | | | (29.03 | ) |
| | | | | | | | | | | | | | | | | | | | |
Less Distributions from: | | | | | | | | | | | | | | | | | | | | |
Net investment income | | | (3.08 | ) | | | (2.84 | ) | | | — | | | | — | | | | — | |
Net realized gains | | | — | | | | — | | | | (2.64 | ) | | | — | | | | — | |
Return of capital | | | — | | | | — | | | | — | | | | (2.64 | ) | | | (1.99 | ) |
Total distributions | | | (3.08 | | | | (2.84 | ) | | | (2.64 | ) | | | (2.64 | ) | | | (1.99 | ) |
Net Asset Value, End of year | | | $39.57
| | | | $34.42
| | | | $33.22
| | | | $27.31
| | | | $13.78
| |
Net Asset Value Total Return3 | | | 24.40 | % | | | 12.91 | % | | | 33.13 | % | | | 121.30 | % | | | (62.67 | )% |
Net assets, end of year (000’s omitted) | | | $377,544
| | | | $326,612
| | | | $333,536
| | | | $294,628
| | | | $99,107
| |
| | | | | | | | | | | | | | | | | | | | |
RATIOS/SUPPLEMENTAL DATA: | | | | | | | | | | | | | | | | | | | | |
Ratios to Average Net Assets: | | | | | | | | | | | | | | | | | | | | |
Expenses, including current and deferred income tax expense/benefit | | | 2.75 | %4 | | | 2.18 | %6 | | | 1.64 | %8 | | | 1.40 | %9 | | | 2.01 | %10 |
Expenses, excluding current and deferred income tax expense/benefit | | | 3.01 | %5 | | | 2.99 | %7 | | | 1.64 | %8 | | | 1.40 | %9 | | | 1.89 | %10 |
Net investment loss, net of income taxes | | | (2.21 | )% | | | (1.98 | )% | | | (1.06 | )% | | | (1.31 | )% | | | (1.71 | )% |
Portfolio turnover rate11 | | | 59 | % | | | 69 | % | | | 62 | % | | | 99 | % | | | 96 | % |
1Effective March 31, 2020, the Fund had a 1 for 10 reverse stock split. The share amounts for the year ended December 31, 2020 was adjusted as a result of the 1 for 10 reverse stock split (See Note 1).
2Based on average shares outstanding.
3Net Asset Value Total Return is calculated assuming an initial investment made at the net asset value on the first day of the year, reinvestment of dividends and distributions at net asset value during the year, and redemptions at net asset value on the last day of the year.
4The ratios of expenses to average net assets include interest expense of 2.06% and current and deferred income tax benefit / expense of 0.26%.
5The ratios of expenses to average net assets include interest expense fees of 2.06%.
6The ratios of expenses to average net assets include interest expense of 2.04% and current and deferred income tax benefit / expense of 0.81%.
7The ratios of expenses to average net assets include interest expense fees of 2.04%.
8The ratios of expenses to average net assets include interest expense fees of 0.69%.
9The ratios of expenses to average net assets include interest expense fees of 0.45%.
10The ratios of expenses to average net assets include interest expense of 0.93% and tax expense of 0.01%.
11Portfolio turnover excludes the value of portfolio securities received or delivered as a result of in-kind creations or redemptions of the Fund’s capital shares.
Notes to Financial Statements
October 31, 2024
1. ORGANIZATION
The ETFis Series Trust I (the “Trust”) was organized as a Delaware statutory trust on September 20, 2012 and is registered with the U.S. Securities and Exchange Commission (the “SEC”) as an open-end management investment company under the Investment Company Act of 1940 (the “1940 Act”).
As of October 31, 2024, ten funds of the Trust are offered for sale. The InfraCap MLP ETF (the “Fund”) is presented in this annual report. The offering of the Fund’s shares is registered under the Securities Act of 1933 (the “Securities Act”).
| | |
Fund | | Investment objective |
InfraCap MLP ETF | | Seeks total return primarily through investments in equity securities of publicly traded master limited partnerships and limited liability companies taxed as partnerships (“MLPs”). |
There is no guarantee that the Fund will achieve its objective(s).
The Fund is “non-diversified,” as defined under the 1940 Act, as of the year ended October 31, 2024.
Reverse Split
After the close of the markets on March 30, 2020 (the Record Date), the Fund effected a reverse split of its issued and outstanding shares, with a 1 for 10 ratio. Shares of the Fund began trading on the NYSE Arca on a split-adjusted basis on March 31, 2020.
The effect of the reverse split was reducing the number of shares outstanding and resulted in a proportionate increase in the net asset value (“NAV”) per share of the Fund. Therefore, the reverse split did not change the aggregate value of a shareholder’s investment or the total market value of the shares outstanding.
The reverse split was applied retroactively for all periods presented in the financial statements.
2. SIGNIFICANT ACCOUNTING POLICIES
The Fund is an investment company and accordingly follows the investment company accounting and reporting guidance of the Financial Accounting Standards Board (“FASB”) Accounting Standard Codification Topic 946 Financial Services — Investment Companies. The Fund prepares its financial statements in accordance with generally accepted accounting principles (“GAAP”) in the United States of America and follows the significant accounting policies described below.
(a) Use of Estimates
Management makes certain estimates and assumptions that affect the reported amounts of assets and liabilities and disclosure of contingent assets and liabilities at the date of the financial statements and reported amounts of increases and decreases in the net assets from operations during the reporting period. Actual results could differ from those estimates.
(b) Indemnification
In the normal course of business, the Fund may enter into contracts that contain a variety of representations which provide general indemnifications for certain liabilities. The Fund’s maximum exposure under these arrangements is unknown. However, the Fund has not had prior claims or losses pursuant to these contracts and expects the risk of loss to be remote.
(c) Security Valuation
A description of the valuation techniques applied to the Fund’s major categories of assets and liabilities measured at fair value on a recurring basis is as follows:
Equity securities and exchange-traded funds are valued at the official closing price (typically last sale) on the exchange on which the securities are primarily traded. Securities regularly traded in an over the counter market are valued at the latest quoted sale price in such market or in the case of the New York Stock Exchange (“NYSE”), at the NYSE Official Closing Price. Such valuations are typically categorized as Level 1 in the fair value hierarchy. The Board of Trustees of the Trust (the “Board”) has designated Virtus ETF Advisers LLC (the “Adviser”) to serve as its valuation designee, pursuant to Rule 2a-5 under the 1940 Act, to perform the fair value determinations relating to any or all Fund investments. Accordingly, if market quotations are not readily available, or if it is determined that a quotation of a security does not represent fair value, then the security is valued by the Adviser at fair value as determined in good faith using procedures approved by the Board. Such valuations are typically categorized as Level 2 or Level 3 in the fair value hierarchy.
Listed derivatives, such as options, that are actively traded are valued based on quoted prices from the exchange and are categorized as Level 1 in the hierarchy. Over-the-counter derivative contracts, which include options, do not require material subjectivity as pricing inputs are observed from actively quoted markets and are categorized as Level 2 in the hierarchy.
Notes to Financial Statements (continued)
October 31, 2024
(d) Fair Value Measurement
Accounting Standards Codification, Fair Value Measurements and Disclosures (“ASC 820”) defines fair value, establishes a framework for measuring fair value in accordance with GAAP, and requires disclosure about fair value measurements. It also provides guidance on determining when there has been a significant decrease in the volume and level of activity for an asset or liability, when a transaction is not orderly, and how that information must be incorporated into fair value measurement. Under ASC 820, various inputs are used in determining the value of the Fund’s investments. The Adviser, on behalf of the Fund, utilizes a fair value hierarchy which prioritizes the inputs to valuation techniques used to measure fair value into three broad levels. These inputs are summarized in the following hierarchy:
•Level 1 — Unadjusted quoted prices in active markets for identical assets or liabilities that the Fund has the ability to access.
•Level 2 — Observable inputs other than quoted prices included in Level 1 that are observable for the asset or liability, either directly or indirectly. These inputs may include quoted prices for the identical instrument on an inactive market, prices for similar securities, interest rates, prepayment speeds, credit risk, yield curves, default rates and similar data.
•Level 3 — Unobservable inputs for the asset or liability, to the extent relevant observable inputs are not available; representing the Fund’s own assumptions about the assumptions a market participant would use in valuing the asset or liability, and would be based on the best information available.
The inputs or methodology used for valuing securities are not necessarily an indication of the risk associated with investing in those securities. The hierarchy classification of inputs used to value the Fund’s investments at October 31, 2024, is disclosed at the end of the Fund’s Schedule of Investments.
(e) Security Transactions, Investment Income and Return of Capital Estimates
Security transactions are accounted for on the trade date. Realized gains and losses on sales of investment securities are calculated using specific identification. Dividend income is recognized on the ex-dividend date. Expenses are recognized on the accrual basis. The Fund amortizes premiums and accretes discounts using the effective interest method.
The Fund invests in master limited partnerships (“MLPs”) which make distributions that are primarily attributable to return of capital. The Fund records investment income and return of capital in the Statement of Operations using management’s estimate of the percentage of income included in the distributions received from each MLP based on historical information from the MLPs and other industry sources. These estimates may be adjusted based on information received from the MLPs after the tax and fiscal year ends.
The return of capital portion of the MLP distributions is a reduction to investment income and a reduction in the cost basis of each investment which increases net realized gain (loss) and net change in unrealized appreciation (depreciation). If the return of capital distributions exceed its cost basis, the distributions are treated as realized gains. The actual amounts of income and return of capital are only determined by each MLP after its fiscal year-end and may differ from the estimated amounts.
(f) Foreign Taxes
The Fund may be subject to foreign taxes (a portion of which may be reclaimable) on income, stock dividends, capital gains on investments, or certain foreign currency transactions. All foreign taxes are recorded in accordance with the applicable foreign tax regulations and rates that exist in the foreign jurisdictions in which the Fund invests. These foreign taxes, if any, are paid by the Fund and are reflected in the Statement of Operations as follows: foreign taxes withheld at source are presented as a reduction of income, foreign taxes on stock dividends are presented as “Other foreign taxes”, and foreign taxes on capital gains from sales of investments and foreign taxes on foreign currency transactions are included in their respective net realized gain (loss) categories. Foreign taxes payable or deferred as of October 31, 2024, if any, are disclosed in the Statements of Assets and Liabilities.
The Fund files withholding tax reclaims in certain jurisdictions to recover a portion of amounts previously withheld. The Fund may record a reclaim receivable based on collectability, which includes factors such as the jurisdiction’s applicable laws, payment history and market convention. The Statement of Operations includes tax reclaims recorded as well as professional and other fees, if any, associated with recovery of foreign withholding taxes.
(g) Expenses
The Fund pays all of its expenses not assumed by Infrastructure Capital Advisors, LLC (the “Sub-Adviser”) or the Adviser. General Trust expenses that are allocated among and charged to the assets of the Fund and other series of the Trust are done so on a basis that the Board deems fair and equitable, which may be on a basis of relative net assets of the Fund and other series of the Trust or the nature of the services performed and relative applicability to the Fund and other series of the Trust.
Notes to Financial Statements (continued)
October 31, 2024
(h) Short Sales
The Fund may sell securities short. A short sale is a transaction in which the Fund sells a security it does not own in anticipation of a decline in market price. To sell a security short, the Fund must borrow the security. The Fund’s obligation to replace the security borrowed and sold short will be fully collateralized at all times by the proceeds from the short sale retained by the broker and by cash and securities deposited in a segregated account with the Fund’s custodian. If the price of the security sold short increases between the time of the short sale and the time the Fund replaces the borrowed security, the Fund will realize a loss, and if the price declines during the period, the Fund will realize a gain. Any realized gain will be decreased, and any realized loss increased, by the amount of transaction costs. On the ex-dividend date, dividends on short sales are recorded as an expense to the Fund.
In accordance with the terms of its prime brokerage agreement, the Fund may receive rebate income or be charged a fee on borrowed securities which is reported as “Interest Expense” on the Statement of Operations. Such income or fee is calculated on a daily basis based upon the market value of each borrowed security and a variable rate that is dependent upon the availability of such security.
(i) Distributions to Shareholders
Distributions to shareholders are declared and paid on a monthly basis and are recorded on the ex-dividend date. The Fund uses a cash flow-based distribution approach based on the Fund’s net cash flow received from portfolio investments.
The estimated character of the distributions paid will either be a dividend (ordinary income eligible to be treated as qualified dividend income) or a return of capital. Distributions made from current or accumulated earnings and profits of the Fund will be taxable to shareholders as dividend income. Distributions that are in an amount greater than the Fund’s current and accumulated earnings and profits will represent a return of capital to the extent of a shareholder’s basis in their common shares, and such distributions will correspondingly increase the realized gain upon the sale of their common shares. Additionally, distributions not paid from current or accumulated earnings and profits that exceed a shareholder’s tax basis in their common shares will generally be taxed as a capital gain. This estimate is based on the Fund’s operating results during the period.
(j) Cash and Cash Equivalents
Cash is comprised of demand deposits. Cash equivalents are highly liquid investments with original maturities of 90 days or less. The carrying amount of cash equivalents, primarily representing money market funds is a reasonable estimate of fair value. These assets are considered to be Level 1 securities, per Accounting Standards Codification (“ASC”) Topic 820, Fair Value Measurements and Disclosures.
3. INVESTMENT MANAGEMENT RELATED PARTIES AND OTHER AGREEMENTS
Investment Advisory Agreement
The Trust, on behalf of the Fund, has entered into an Investment Advisory Agreement (the “Advisory Agreement”) with the Adviser, an indirect wholly-owned subsidiary of Virtus Investment Partners, Inc. (Ticker: VRTS) (together with its affiliates, “Virtus”). Pursuant to the Advisory Agreement, the Adviser has overall supervisory responsibility for the general management and investment of the Fund’s securities portfolio. For its services to the Fund, the Adviser is entitled to receive a fee, payable monthly, at an annual rate of 0.075% of the Fund’s average daily net assets, subject to a minimum annual fee of $25,000. The Sub-Adviser pays the Adviser’s fee out of the Sub-Adviser’s fee, pursuant to the Sub-Adviser’s unified fee arrangement with the Fund, as described below.
The Advisory Agreement may be terminated by the Trust on behalf of a Fund with the approval of a Fund’s Board or by a vote of the majority of a Fund’s shareholders. The Advisory Agreement may also be terminated by the Adviser by not more than 60 days’ nor less than 30 days’ written notice.
Sub-Advisory Agreement
Infrastructure Capital Advisors, LLC (the “Sub-Adviser”) provides investment advice and management services to the Fund. Pursuant to an investment sub-advisory agreement among the Trust, the Sub-Adviser and the Adviser, the Fund pays the Sub-Adviser a fee, payable monthly, at an annual rate of 0.95% of the Fund’s average daily net assets. The Sub-Adviser has agreed to pay all expenses of the Fund, except the Sub-Adviser’s fee, brokerage expenses, taxes, interest, litigation expenses, payments under any 12b-1 plan adopted by the Fund, and other non-routine or extraordinary expenses of the Fund.
Principal Underwriter
Pursuant to the terms of a Distribution Agreement with the Trust, VP Distributors, LLC (the “Distributor”) serves as the Fund’s principal underwriter. The Distributor receives compensation from the Adviser for the statutory underwriting services it provides to the Fund. The Distributor will not distribute shares in less than Creation Units (as hereinafter defined), and does not maintain a secondary market in shares. The shares are traded in the secondary market. The Distributor is an indirect wholly-owned subsidiary of Virtus.
Notes to Financial Statements (continued)
October 31, 2024
Operational Administrator
Virtus ETF Solutions LLC (the “Administrator”) serves as the Fund’s operational administrator. The Administrator supervises the overall administration of the Trust and the Fund including, among other responsibilities, the coordination and day-to-day oversight of the Fund’s operations, the service providers’ communications with the Fund and each other and assistance with Trust, Board and contractual matters related to the Fund. The Administrator also provides persons satisfactory to the Board to serve as officers of the Trust. The Administrator is an indirect wholly-owned subsidiary of Virtus.
Accounting Services Administrator, Custodian and Transfer Agent
The Bank of New York Mellon (“BNY Mellon”) provides administrative, accounting, tax and financial reporting for the maintenance and operations of the Trust as the Fund’s accounting services administrator. BNY Mellon also serves as the custodian for the Fund’s assets, and serves as transfer agent and dividend paying agent for the Fund.
Affiliated Shareholders
At October 31, 2024, the Sub-Adviser held shares of the Fund which may be redeemed at any time that aggregated to the following:
| | | | |
Fund | | Shares | | % of shares
outstanding |
InfraCap MLP ETF | | 38,845 | | 0.4% |
4. CREATION AND REDEMPTION TRANSACTIONS
The Fund issues and redeems shares on a continuous basis at NAV in aggregate blocks of shares or multiples thereof called “Creation Units.” The Fund’s Creation Units may be issued and redeemed generally for cash or an in-kind deposit of securities held by the Fund. In each instance of cash creations or redemptions, the Trust may impose transaction fees based on transaction expenses related to the particular exchange that will be higher than the transaction fees associated with in-kind purchases or redemptions.
Only “Authorized Participants” who have entered into contractual arrangements with the Distributor may purchase or redeem shares directly from the Fund. An Authorized Participant is either (i) a broker-dealer or other participant in the clearing process through the Continuous Net Settlement System of the National Securities Clearing Corporation or (ii) a DTC participant and, in each case, must have executed a Participant Agreement with the Distributor. Most retail investors will not qualify as Authorized Participants or have the resources to buy and sell whole Creation Units. Therefore, they will be unable to purchase or redeem the shares directly from the Fund. Rather, most retail investors will purchase shares in the secondary market with the assistance of a broker and will be subject to customary brokerage commissions or fees.
Authorized participants pay a fixed transaction fee of $500 to the shareholder servicing agent when purchasing and redeeming Creation Units of the Fund. The transaction fee is used to defray the costs associated with the issuance and redemption of Creation Units.
5. FEDERAL INCOME TAX
The Fund is taxed as a regular C-corporation for federal income tax purposes and as such is obligated to pay federal and applicable state and foreign corporate taxes on its taxable income. Currently, the federal income tax rate for a corporation is 21 percent. This treatment differs from most investment companies, which elect to be treated as “regulated investment companies” under the Code in order to avoid paying entity level income taxes. Under current law, the Fund is not eligible to elect treatment as a regulated investment company due to its investments primarily in MLPs invested in energy assets. The Fund expects that substantially all of the distributions it receives from MLPs may be treated as a tax-deferred return of capital, thus reducing the Fund’s current tax liability. However, the amount of taxes paid by the Fund will vary depending on the amount of income and gains derived from investments and/or sales of MLP interests and such taxes will reduce your return from an investment in the Fund.
Cash distributions from MLPs to the Fund that exceed the Fund’s allocable share of such MLP’s net taxable income are considered a tax deferred return of capital that will reduce the Fund’s adjusted tax basis in the equity securities of the MLP. These reductions in the Fund’s adjusted tax basis in the MLP equity securities will increase the amount of any taxable gain (or decrease the amount of any tax loss) recognized by the Fund on a subsequent sale of the securities. The Fund will accrue deferred income taxes for any future tax liability associated with (i) that portion of MLP distributions considered to be a tax-deferred return of capital as well as (ii) capital appreciation of its investments. Upon the sale of an MLP security, the Fund may be liable for previously deferred taxes. The Fund will rely to some extent on information provided by the MLPs, which is not necessarily timely, to estimate the deferred tax liability for purposes of financial statement reporting and determining the Fund’s NAV. From time to time, the Adviser will modify the estimates or assumptions related to the Fund’s deferred tax liability as new information becomes available. The Fund will generally compute deferred income taxes based on the federal income tax rate applicable to corporations and an assumed rate attributable to state taxes.
Notes to Financial Statements (continued)
October 31, 2024
The Fund’s income tax expense/(benefit) consists of the following:
| | | | | | | |
As of October 31, 2024 | | Current | | Deferred | | Total | |
Federal | | $2,368,455
| | $19,254,030
| | $21,622,485
| |
State | | 151,132 | | 790,435 | | 941,567 | |
Valuation Allowance | | — | | (13,202,624 | ) | (13,202,624 | ) |
Total Tax Expense/(Benefit) | | $2,519,587
| | $6,841,841
| | $9,361,428
| |
Components of the Fund’s deferred tax assets and liabilities are as follows:
| | | |
| | As of
October 31, 2024 | |
Deferred Tax Assets: | | | |
Capital Loss Carryforward | | $37,420,619
| |
Other | | 354,281 | |
Total Deferred Tax Assets | | 37,774,900 | |
Less Valuation Allowance | | (16,719,816 | ) |
Net Deferred Tax Assets | | $21,055,084
| |
Deferred Tax Liabilities: | | | |
Net Unrealized Gain on Investment | | $20,992,645
| |
Book vs tax deferred income from MLP Investments | | 17,548,438 | |
Total Deferred Tax Liabilities | | 38,541,083 | |
Total Net Deferred Tax Asset/(Liability) | | $(17,485,999
| ) |
The Fund reviews the recoverability of its deferred tax assets based upon the weight of available evidence. When assessing the recoverability of its deferred tax assets, significant weight was given to the effects of potential future realized and unrealized gains on investments and the period over which these deferred tax assets can be realized. Currently, any capital losses that may be generated by the Fund in the future are eligible to be carried back up to three years and can be carried forward for five years to offset capital gains recognized by the Fund in those years. As of the period ended October 31, 2024, the Fund has a capital loss carryforward of $169,856,695 of which $153,290,897 expires in 2025, and $16,565,798 expires in 2026.
Based upon the Fund’s assessment, it has determined that it is “more-likely-than-not” that a portion of its deferred tax assets will not be realized through future taxable income of the appropriate character. Accordingly, a valuation allowance has been established for the Fund’s deferred tax assets. The Fund will continue to assess the need for a valuation allowance in the future. Significant changes in the fair value of its portfolio of investments may change the Fund’s assessment of the recoverability of these assets and may result in an adjustment of the valuation allowance against all or a portion of the Fund’s gross deferred tax assets.
Total income tax (benefit)/expense (current and deferred) differs from the amount computed by applying the federal statutory income tax rate of 21% to net investment and realized and unrealized gain/(losses) on investment before taxes as follows for the Fund:
| | | | | |
| | Amount | | Rate | |
Income Tax (Benefit) at Statutory Rate | | $18,572,466
| | 21.00 | % |
State Income Taxes (Net of Federal Benefit) | | 911,554 | | 1.03 | |
Permanent Differences, Net | | (161,163 | ) | (0.18 | ) |
Effect of State Tax Rate Change | | (158,280 | ) | (0.18 | ) |
Capital Loss Carryforward Expiration | | 2,741,239 | | 3.10 | |
Provision to Return Adjustment and Other | | 658,236 | | 0.75 | |
Valuation Allowance | | (13,202,624 | ) | (14.93 | ) |
Net Income Tax Expense/(Benefit) | | $9,361,428
| | 10.59 | % |
The Fund recognizes interest accrued related to unrecognized tax benefits and penalties as income tax expense. For the period from inception to October 31, 2024, the Fund does not have any accrued penalties or interest.
The Fund recognizes the tax benefits of uncertain tax positions only where the position is “more-likely-than-not” to be sustained assuming examination by tax authorities. Management has analyzed the Fund’s tax positions, and has concluded that no liability for unrecognized tax benefits should be recorded related to uncertain tax positions taken on U.S. tax returns and state tax returns filed
Notes to Financial Statements (continued)
October 31, 2024
since inception of the Fund. The Fund’s tax years, October 31, 2021 through October 31, 2023, remain subject to examination by tax authorities in the United States. Due to the nature of the Fund’s investments, the Fund may be required to file income tax returns in several states. As of the year ended October 31, 2024, the Fund is not aware of any tax positions for which it is reasonably possible that the total amounts of unrecognized tax benefits will change materially over the next fiscal year.
At October 31, 2024, the adjusted cost basis of investments and gross unrealized appreciation and depreciation of investments, excluding written options, for federal income tax purposes were as follows:
| | | | | | | | |
Fund | | Federal Tax
Cost Of
Investments | | Gross
Unrealized
Appreciation | | Gross
Unrealized
Depreciation | | Net Unrealized
Appreciation
(Depreciation) |
InfraCap MLP ETF | | $338,688,656
| | $177,518,193
| | $(3,742,248
| ) | $173,775,945
|
The tax character of dividends and distributions paid during the fiscal years ended October 31, 2024 and October 31, 2023 were as follows:
| | | | |
Fund | | 2024 | | 2023 |
| Distributions Paid From Ordinary Income | | Distributions Paid From Ordinary Income |
InfraCap MLP ETF | | $29,650,201
| | $26,762,601
|
6. INVESTMENT TRANSACTIONS
Purchases and sales of investments (excluding short-term investments), subscriptions in-kind and redemptions in-kind for the year ended October 31, 2024 were as follows:
| | | | | | | | |
Fund | | Purchases | | Sales | | Subscriptions
In-Kind | | Redemptions
In-Kind |
InfraCap MLP ETF | | $291,819,021
| | $315,864,254
| | $30,538,787
| | $—
|
7. DERIVATIVE FINANCIAL INSTRUMENTS
Options
The Fund may write covered call and put options on portfolio securities and other financial instruments. Premiums received are recorded as liabilities. The liabilities are subsequently adjusted to reflect the current value of the options written. Premiums received from writing options that expire are treated as realized gains. Premiums received from writing options that are exercised or are closed are added to or offset against the proceeds or amount paid on the transactions to determine the net realized gain or loss. By writing a covered call option, the Fund, in exchange for the premium, foregoes the opportunity for capital appreciation above the exercise price should the market price of the underlying security increase. By writing a put option, the Fund, in exchange for the premium, accepts the risk of having to purchase a security at an exercise price that is above the current price. Changes in value of written options are reported as change in unrealized gain (loss) on written options in the Statement of Operations. When the written option expires, is terminated or is sold, the Fund will record a gain or loss, which is reported as realized gain (loss) on written options in the Statement of Operations. Written covered call options limit the upside potential of a security above the strike price. Written put options subject the Fund to risk of loss if the value of the security declines below the exercise price minus the put premium.
The Fund may purchase call and put options on the portfolio securities or other financial instruments. The Fund may purchase call options to protect against an increase in the price of the security or financial instrument it anticipates purchasing. The Fund may purchase put options on securities which it holds or other financial instruments to protect against a decline in the value of the security or financial instrument or to close out covered written positions. Changes in value of purchased options are reported as part of change in unrealized gain (loss) on investments in the Statement of Operations. When the purchased option expires, is terminated or is sold, the Fund will record a gain or loss, which is reported as part of realized gain (loss) on investments in the Statement of Operations. Risks may arise from an imperfect correlation between the change in market value of the securities held by the Fund and the prices of options relating to the securities purchased or sold by the Fund and from the possible lack of liquid secondary market for an option. The maximum exposure to loss for any purchased option is limited to the premium initially paid for the option.
Transactions in derivative instruments reflected on the Statement of Assets and Liabilities at October 31, 2024 are as follows:
| | | |
Liabilities | | Equity Risk | |
Written options, at value | | $ 182,593
| |
Notes to Financial Statements (continued)
October 31, 2024
Transactions in derivative instruments reflected on the Statement of Operations during the year ended October 31, 2024 were as follows:
| | | |
Net Realized Gain (Loss) on: | | Equity Risk | |
Written options | | $3,023,071
| |
| | | |
Change in Net Unrealized Appreciation (Depreciation) on: | | Equity Risk | |
Written options | | $12,167
| |
For the year ended October 31, 2024, the monthly average market value of written options contracts held by the Fund was $510,785.
8. BORROWINGS
The Fund entered into Lending Agreements (the “Agreements”) with commercial banks (the “Banks”) that allows the Fund to borrow cash from the Banks. Borrowings under the Agreements are collateralized by investments of the Fund. If the Fund defaults with respect to any of its obligations under the Agreements, the Banks may foreclose on assets of the Fund and/or the Fund may be required to repay immediately, in part or in full, the loan balance outstanding under the Agreements, necessitating the sale of securities at potentially inopportune times. Interest is charged at the Overnight Bank Funding Rate (“OBFR”) plus an additional percentage rate on the amount borrowed. The Agreements have an on-demand commitment term. For the year ended October 31, 2024, the average daily borrowings under the Agreements and the weighted average interest rate were $112,687,104 and 6.35%, respectively.
9. INVESTMENT RISKS
As with any investment, an investment in the Fund could result in a loss or the performance of the Fund could be inferior to that of other investments. An investor should consider the Fund’s investment objectives, risks, and charges and expenses carefully before investing. The Fund’s prospectus and statement of additional information contain this and other important information.
MLP Risk
Investments in securities of MLPs involve risks that differ from investments in common stock including risks related to limited control and limited rights to vote on matters affecting the MLP, risks related to potential conflicts of interest between the MLP and the MLP’s general partner and cash flow risks. MLP common units and other equity securities can be affected by macro-economic and other factors affecting the stock market in general, expectations of interest rates, investor sentiment towards MLPs or the energy sector, changes in a particular issuer’s financial condition or unfavorable or unanticipated poor performance of a particular issuer (in the case of MLPs, generally measured in terms of distributable cash flow). Prices of common units of individual MLPs and other equity securities also can be affected by fundamentals unique to the partnership or company, including earnings power and coverage ratios.
Market Risk
Local, regional or global events such as war, acts of terrorism, the spread of infectious illness or other public health issue, recessions, or other events could have a significant impact on the Fund and its investments, including hampering the ability of the Fund’s portfolio manager(s) to invest the Fund’s assets as intended.
10. 10% SHAREHOLDERS
As of October 31, 2024, the Fund had individual shareholder account(s) and/or omnibus shareholder account(s) (comprised of a group of individual shareholders), which individually amounted to more than 10% of the total shares outstanding of the Fund as detailed below:
| | | | |
Fund | | % of Shares
Outstanding | | Number of
Accounts |
InfraCap MLP ETF | | 62% | | 2 |
11. RECENT ACCOUNTING PRONOUNCEMENTS
In November 2023, the FASB issued Accounting Standards Update (ASU), ASU 2023-07, Segment Reporting (Topic 280) –Improvements to Reportable Segment Disclosures, which improves reportable segment disclosure requirements, primarily through enhanced disclosures about segment expenses. In addition, the ASU clarifies that a public entity with a single reportable segment provide all disclosures required by the ASU and all existing segment disclosures in Topic 280. The amendments under this ASU are effective on a retrospective basis for annual periods beginning after December 15, 2023 and for interim periods within fiscal years beginning after December 15, 2024, and early adoption is permitted. Management is currently evaluating the impact of adopting ASU 2023-07 on the Fund’s financial statements.
Notes to Financial Statements (continued)
October 31, 2024
12. SUBSEQUENT EVENTS
Management has evaluated subsequent events through the issuance of these financial statements and has determined that there are no material events that would require disclosure.
Report of Independent Registered Public Accounting Firm
To the Board of Trustees of ETFis Series Trust I and Shareholders of InfraCap REIT Preferred ETF, Virtus InfraCap U.S. Preferred Stock ETF, Virtus LifeSci Biotech Clinical Trials ETF, Virtus LifeSci Biotech Products ETF, Virtus Newfleet Multi-Sector Bond ETF, Virtus Private Credit Strategy ETF, Virtus Real Asset Income ETF, and Virtus WMC International Dividend ETF
Opinions on the Financial Statements
We have audited the accompanying statements of assets and liabilities, including the schedules of investments, of InfraCap REIT Preferred ETF, Virtus InfraCap U.S. Preferred Stock ETF, Virtus LifeSci Biotech Clinical Trials ETF, Virtus LifeSci Biotech Products ETF, Virtus Newfleet Multi-Sector Bond ETF, Virtus Private Credit Strategy ETF, Virtus Real Asset Income ETF and Virtus WMC International Dividend ETF (eight of the funds constituting ETFis Series Trust I, hereafter collectively referred to as the “Funds”) as of October 31, 2024, the related statements of operations for the year ended October 31, 2024, the statement of cash flows for Virtus InfraCap U.S. Preferred Stock ETF for the year ended October 31, 2024, the statements of changes in net assets for each of the two years in the period ended October 31, 2024, including the related notes, and the financial highlights for each of the five years in the period ended October 31, 2024 (collectively referred to as the “financial statements”). In our opinion, the financial statements present fairly, in all material respects, the financial position of each of the Funds as of October 31, 2024, the results of each of their operations and the cash flows for Virtus InfraCap U.S. Preferred Stock ETF for the year then ended, the changes in each of their net assets for each of the two years in the period ended October 31, 2024 and each of the financial highlights for each of the five years in the period ended October 31, 2024, in conformity with accounting principles generally accepted in the United States of America.
Basis for Opinions
These financial statements are the responsibility of the Funds’ management. Our responsibility is to express an opinion on the Funds’ financial statements based on our audits. We are a public accounting firm registered with the Public Company Accounting Oversight Board (United States) (“PCAOB”) and are required to be independent with respect to the Funds in accordance with the U.S. federal securities laws and the applicable rules and regulations of the Securities and Exchange Commission and the PCAOB.
We conducted our audits of these financial statements in accordance with the standards of the PCAOB. Those standards require that we plan and perform the audit to obtain reasonable assurance about whether the financial statements are free of material misstatement, whether due to error or fraud.
Our audits included performing procedures to assess the risks of material misstatement of the financial statements, whether due to error or fraud, and performing procedures that respond to those risks. Such procedures included examining, on a test basis, evidence regarding the amounts and disclosures in the financial statements. Our audits also included evaluating the accounting principles used and significant estimates made by management, as well as evaluating the overall presentation of the financial statements. Our procedures included confirmation of securities owned as of October 31, 2024, by correspondence with the custodian, transfer agent, and brokers; when replies were not received from brokers, we performed other auditing procedures. We believe that our audits provide a reasonable basis for our opinions.
/s/ PricewaterhouseCoopers LLP
Philadelphia, Pennsylvania
December 20, 2024
We have served as the auditor of one or more investment companies in Virtus ETF Solutions LLC since 2017.
Report of Independent Registered Public Accounting Firm (continued)
To the Board of Trustees of ETFis Series Trust I and Shareholders of InfraCap MLP ETF
Opinion on the Financial Statements
We have audited the accompanying statement of assets and liabilities, including the schedule of investments, of InfraCap MLP ETF (one of the funds constituting ETFis Series Trust I, hereafter referred to as the “Fund”) as of October 31, 2024, the related statements of operations and cash flows for the year ended October 31, 2024, the statement of changes in net assets for each of the two years in the period ended October 31, 2024, including the related notes, and the financial highlights for each of the five years in the period ended October 31, 2024 (collectively referred to as the “financial statements”). In our opinion, the financial statements present fairly, in all material respects, the financial position of the Fund as of October 31, 2024, the results of its operations and its cash flows for the year then ended, the changes in its net assets for each of the two years in the period ended October 31, 2024 and the financial highlights for each of the five years in the period ended October 31, 2024 in conformity with accounting principles generally accepted in the United States of America.
Basis for Opinion
These financial statements are the responsibility of the Fund’s management. Our responsibility is to express an opinion on the Fund’s financial statements based on our audits. We are a public accounting firm registered with the Public Company Accounting Oversight Board (United States) (“PCAOB”) and are required to be independent with respect to the Fund in accordance with the U.S. federal securities laws and the applicable rules and regulations of the Securities and Exchange Commission and the PCAOB.
We conducted our audits of these financial statements in accordance with the standards of the PCAOB. Those standards require that we plan and perform the audit to obtain reasonable assurance about whether the financial statements are free of material misstatement, whether due to error or fraud.
Our audits included performing procedures to assess the risks of material misstatement of the financial statements, whether due to error or fraud, and performing procedures that respond to those risks. Such procedures included examining, on a test basis, evidence regarding the amounts and disclosures in the financial statements. Our audits also included evaluating the accounting principles used and significant estimates made by management, as well as evaluating the overall presentation of the financial statements. Our procedures included confirmation of securities owned as of October 31, 2024, by correspondence with the custodian, transfer agent, and brokers; when replies were not received from brokers, we performed other auditing procedures. We believe that our audits provide a reasonable basis for our opinion.
/s/ PricewaterhouseCoopers LLP
Philadelphia, Pennsylvania
December 20, 2024
We have served as the auditor of one or more investment companies in Virtus ETF Solutions LLC since 2017.
Supplemental Information (unaudited)
Discount & Premium Information
The Funds’ premium/discount information for the most recently completed calendar year, and the most recently completed calendar quarters since that year is available by visiting www.virtusetfs.com or by calling (888) 383-4184.
TAX INFORMATION
For the fiscal year ended October 31, 2024, the Funds make the following disclosures for federal income tax purposes. Below is listed the percentages, or the maximum amount allowable, of its ordinary income dividends (“QDI”) to qualify for the lower tax rates applicable to individual shareholders, and the percentage of ordinary income dividends earned by each Fund which qualifies for the dividends received deduction (“DRD”) for corporate shareholders. The actual percentage of QDI and DRD for the calendar year will be designated in year-end tax statements.
| | | | |
Funds | | QDI | | DRD |
InfraCap REIT Preferred ETF | | 0.00% | | 0.00% |
Virtus InfraCap U.S. Preferred Stock ETF | | 58.79% | | 50.70% |
Virtus LifeSci Biotech Clinical Trials ETF | | 0.00% | | 0.00% |
Virtus LifeSci Biotech Products ETF | | 0.00% | | 0.00% |
Virtus Newfleet Multi-Sector Bond ETF | | 0.00% | | 0.00% |
Virtus Private Credit Strategy ETF | | 2.13% | | 0.23% |
Virtus Real Asset Income ETF | | 58.66% | | 18.70% |
Virtus WMC International Dividend ETF | | 91.60% | | 0.00% |
c/o VP Distributors, LLC
One Financial Plaza
Hartford, Connecticut 06103
Item 8. Changes in and Disagreements with Accountants for Open-End Management Investment Companies.
None.
Item 9. Proxy Disclosures for Open-End Management Investment Companies.
None.
Item 10. Remuneration Paid to Directors, Officers, and Others of Open-End Management Investment Companies.
Please refer to Item 7.
Item 11. Statement Regarding Basis for Approval of Investment Advisory Contract.
Not applicable
Item 12. Disclosure of Proxy Voting Policies and Procedures for Closed-End Management Investment Companies.
Disclosure not required for open-end management investment companies.
Item 13. Portfolio Managers of Closed-End Management Investment Companies.
Disclosure not required for open-end management investment companies.
Item 14. Purchases of Equity Securities by Closed-End Management Investment Company and Affiliated Purchasers.
Disclosure not required for open-end management investment companies.
Item 15. Submission of Matters to a Vote of Security Holders.
There have been no material changes to the procedures by which shareholders may recommend nominees to the registrant’s board of trustees, where those changes were implemented after the registrant last provided disclosure in response to the requirements of Item 407(c)(2)(iv) of Regulation S-K (17 CFR 229.407) (as required by Item 22(b)(15) of Schedule 14A (17 CFR 240.14a-101)), or this Item.
Item 16. Controls and Procedures.
| (a) | The registrant’s principal executive officer and principal financial officer have concluded, based on their evaluation of the effectiveness of the design and operation of the registrant’s disclosure controls and procedures (as defined in Rule 30a-3(c) under the Investment Company Act of 1940 (17 CFR 270.30a-3(c))) as of a date within 90 days of the filing date of this report, that the design and operation of such procedures are effective to provide reasonable assurance that information required to be disclosed by the registrant on Form N-CSR is recorded, processed, summarized and reported within the time periods specified in the Securities and Exchange Commission’s rules and forms, and that information required to be disclosed by the registrant in the reports that it files or submits on Form N-CSR is accumulated and communicated to the registrant’s management, including its principal executive and principal financial officers, as appropriate to allow timely decisions regarding required disclosure. |
| (b) | There were no changes in the registrant’s internal control over financial reporting (as defined in Rule 30a-3(d) under the 1940 Act (17 CFR 270.30a-3(d))) that occurred during the period covered by this report that have materially affected, or are reasonably likely to materially affect, the registrant’s internal control over financial reporting. |
Item 17. Disclosure of Securities Lending Activities for Closed-End Management Investment Companies.
Disclosure not required for open-end management investment companies.
Item 18. Recovery of Erroneously Awarded Compensation.
Not applicable.
Item 19. Exhibits.
| (a)(3)(1) | There were no written solicitations to purchase securities under Rule 23c-1 under the Act sent or given during the period covered by the report by or on behalf of the Registrant to 10 or more persons. |
| (a)(3)(2) | There was no change in the Registrant’s independent public accountant during the period covered by the report. |
SIGNATURES
Pursuant to the requirements of the Securities Exchange Act of 1934 and the Investment Company Act of 1940, the registrant has duly caused this report to be signed on its behalf by the undersigned, thereunto duly authorized.
| (Registrant) | ETFis Series Trust I | |
| | | |
| By (Signature and Title)* | /s/ William J. Smalley | |
| | William J. Smalley, President and Principal Executive Officer
(Principal Executive Officer) | |
| | | |
| Date | January 3, 2025 | |
Pursuant to the requirements of the Securities Exchange Act of 1934 and the Investment Company Act of 1940, this report has been signed below by the following persons on behalf of the registrant and in the capacities and on the dates indicated.
| By (Signature and Title)* | /s/ William J. Smalley | |
| | William J. Smalley, President and Principal Executive Officer
(Principal Executive Officer) | |
| | | |
| Date | January 3, 2025 | |
| By (Signature and Title)* | /s/ Brinton W. Frith | |
| | Brinton W. Frith, Treasurer and Principal Financial Officer/Principal Accounting Officer
(Principal Financial Officer/Principal Accounting Officer) | |
| | | |
| Date | January 3, 2025 | |
* Print the name and title of each signing officer under his or her signature.