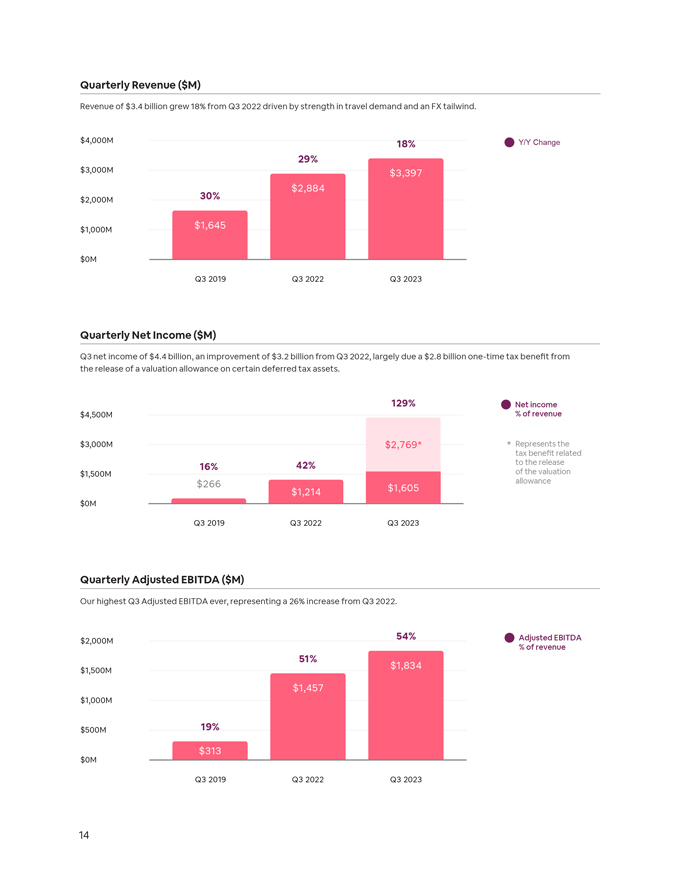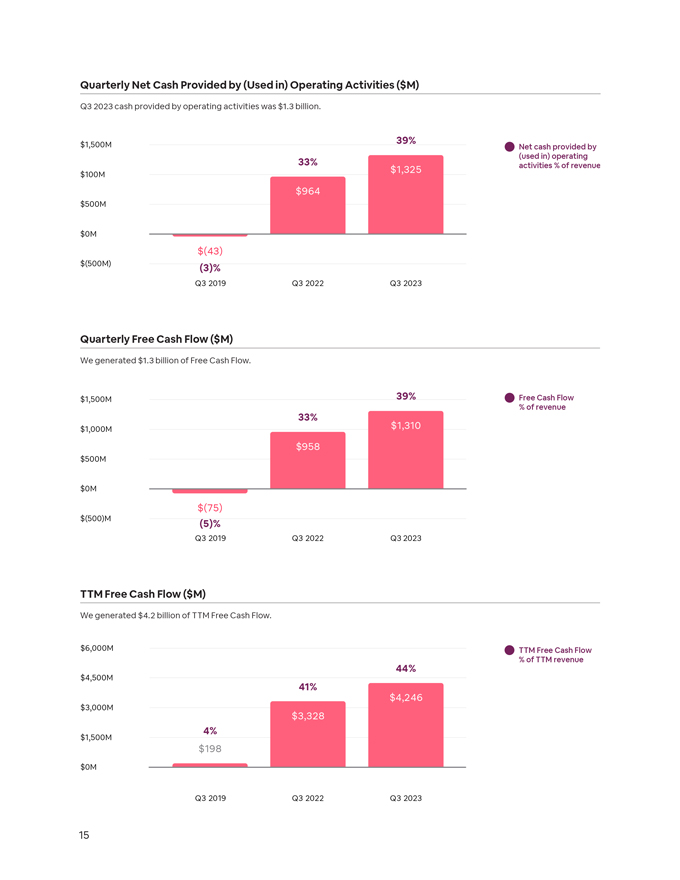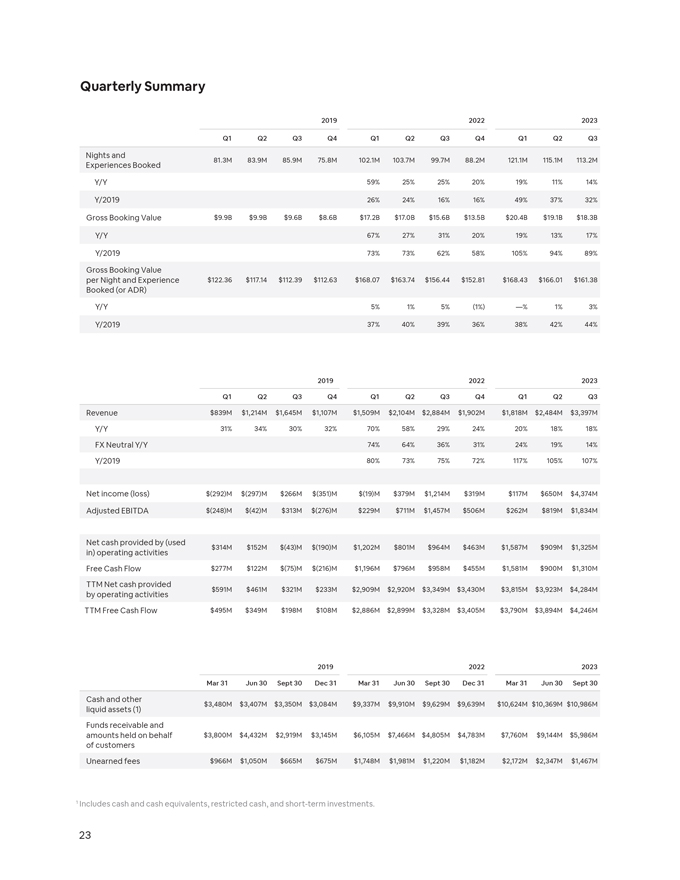
Quarterly Summary 2019 2022 2023 Q1 Q2 Q3 Q4 Q1 Q2 Q3 Q4 Q1 Q2 Q3 Nights and 81.3M 83.9M 85.9M 75.8M 102.1M 103.7M 99.7M 88.2M 121.1M 115.1M 113.2M Experiences Booked Y/Y 59% 25% 25% 20% 19% 11% 14% Y/2019 26% 24% 16% 16% 49% 37% 32% Gross Booking Value $9.9B $9.9B $9.6B $8.6B $17.2B $17.0B $15.6B $13.5B $20.4B $19.1B $18.3B Y/Y 67% 27% 31% 20% 19% 13% 17% Y/2019 73% 73% 62% 58% 105% 94% 89% Gross Booking Value per Night and Experience $122.36 $117.14 $112.39 $112.63 $168.07 $163.74 $156.44 $152.81 $168.43 $166.01 $161.38 Booked (or ADR) Y/Y 5% 1% 5% (1%) —% 1% 3% Y/2019 37% 40% 39% 36% 38% 42% 44% 2019 2022 2023 Q1 Q2 Q3 Q4 Q1 Q2 Q3 Q4 Q1 Q2 Q3 Revenue $839M $1,214M $1,645M $1,107M $1,509M $2,104M $2,884M $1,902M $1,818M $2,484M $3,397M Y/Y 31% 34% 30% 32% 70% 58% 29% 24% 20% 18% 18% FX Neutral Y/Y 74% 64% 36% 31% 24% 19% 14% Y/2019 80% 73% 75% 72% 117% 105% 107% Net income (loss) $(292)M $(297)M $266M $(351)M $(19)M $379M $1,214M $319M $117M $650M $4,374M Adjusted EBITDA $(248)M $(42)M $313M $(276)M $229M $711M $1,457M $506M $262M $819M $1,834M Net cash provided by (used $314M $152M $(43)M $(190)M $1,202M $801M $964M $463M $1,587M $909M $1,325M in) operating activities Free Cash Flow $277M $122M $(75)M $(216)M $1,196M $796M $958M $455M $1,581M $900M $1,310M TTM Net cash provided $591M $461M $321M $233M $2,909M $2,920M $3,349M $3,430M $3,815M $3,923M $4,284M by operating activities TTM Free Cash Flow $495M $349M $198M $108M $2,886M $2,899M $3,328M $3,405M $3,790M $3,894M $4,246M 2019 2022 2023 Mar 31 Jun 30 Sept 30 Dec 31 Mar 31 Jun 30 Sept 30 Dec 31 Mar 31 Jun 30 Sept 30 Cash and other $3,480M $3,407M $3,350M $3,084M $9,337M $9,910M $9,629M $9,639M $10,624M $10,369M $10,986M liquid assets (1) Funds receivable and amounts held on behalf $3,800M $4,432M $2,919M $3,145M $6,105M $7,466M $4,805M $4,783M $7,760M $9,144M $5,986M of customers Unearned fees $966M $1,050M $665M $675M $1,748M $1,981M $1,220M $1,182M $2,172M $2,347M $1,467M 1 Includes cash and cash equivalents, restricted cash, and short-term investments. 23