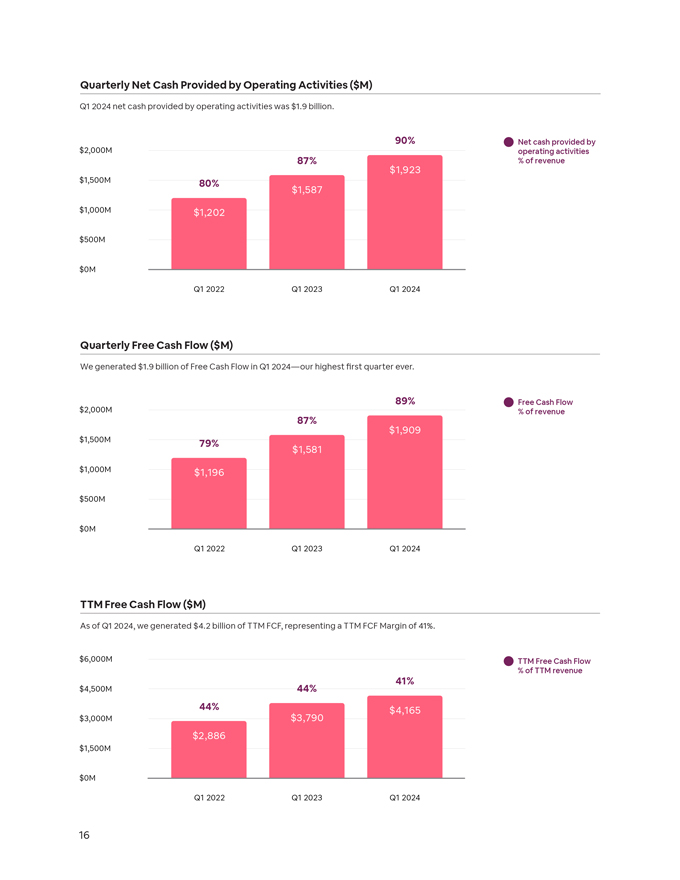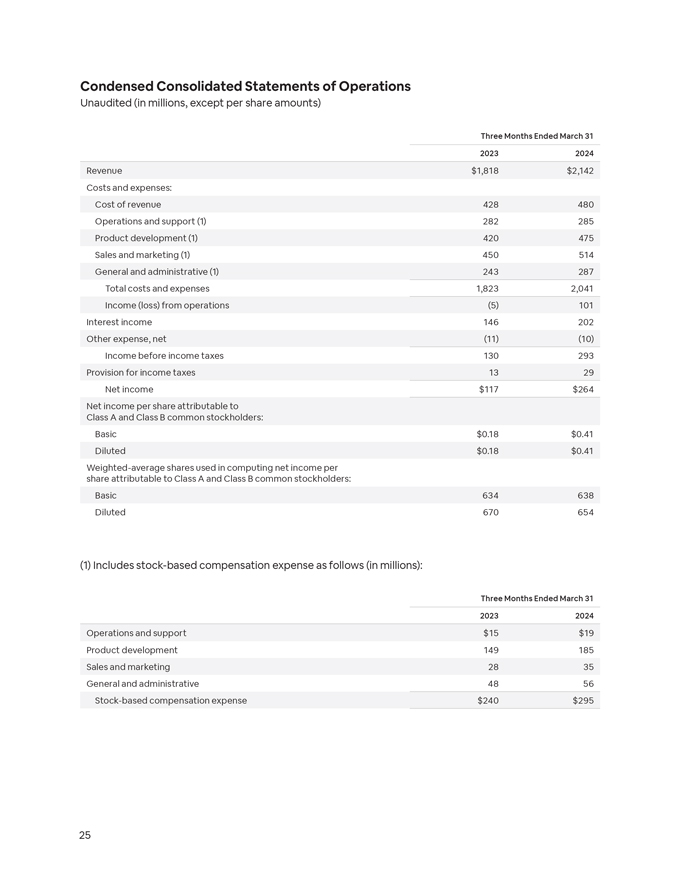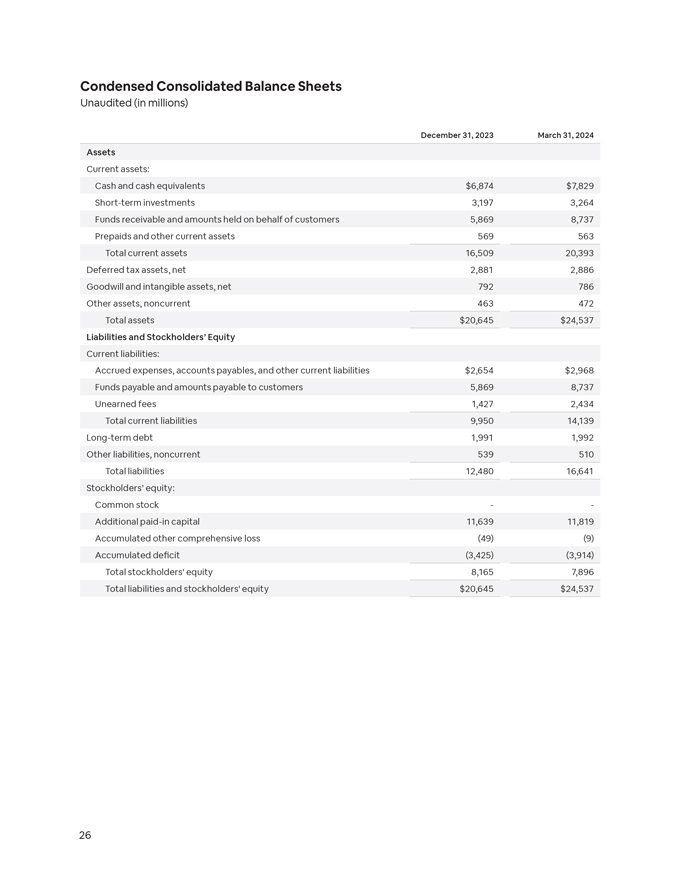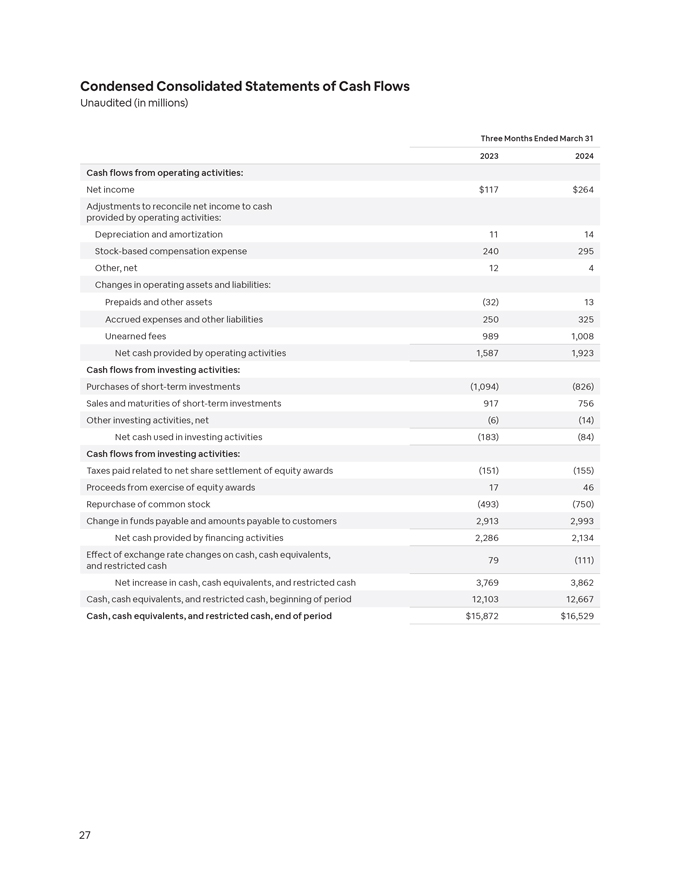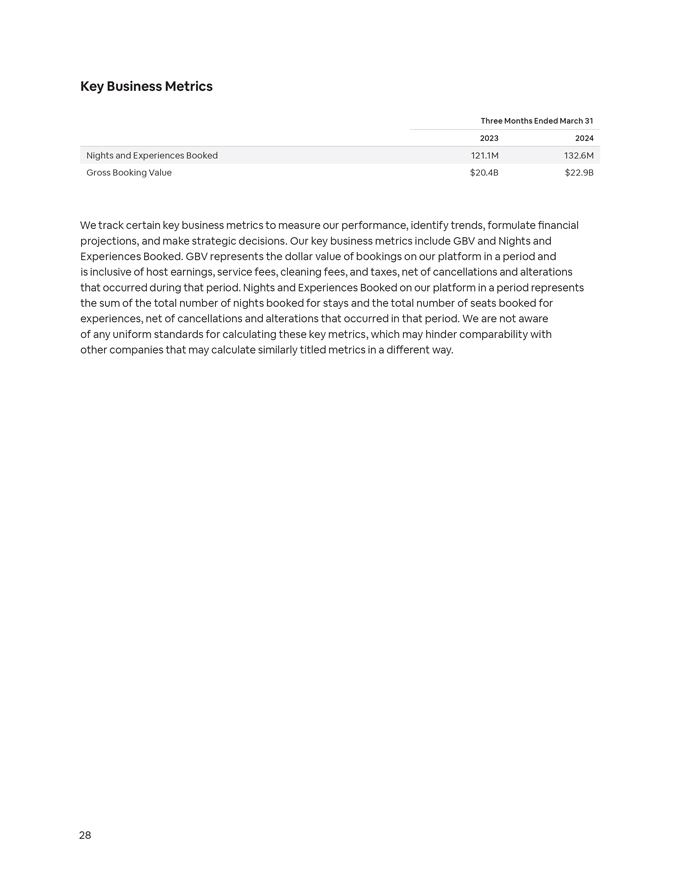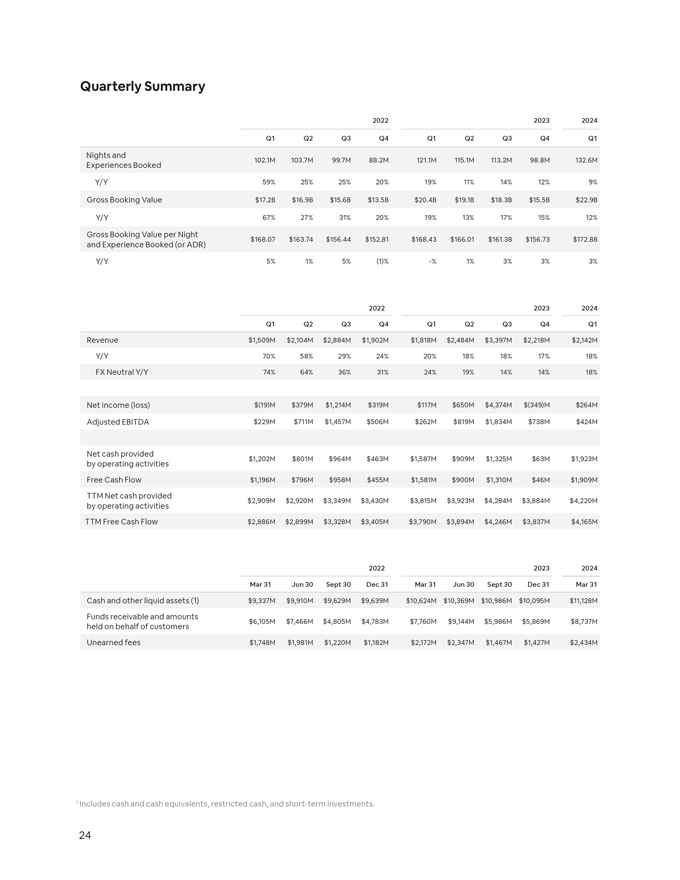
Quarterly Summary 2022 2023 2024 Q1 Q2 Q3 Q4 Q1 Q2 Q3 Q4 Q1 Nights and Experiences Booked 102.1M 103.7M 99.7M 88.2M 121.1M 115.1M 113.2M 98.8M 132.6M Y/Y 59% 25% 25% 20% 19% 11% 14% 12% 9% Gross Booking Value $17.2B $16.9B $15.6B $13.5B $20.4B $19.1B $18.3B $15.5B $22.9B Y/Y 67% 27% 31% 20% 19% 13% 17% 15% 12% Gross Booking Value per Night and Experience Booked (or ADR) $168.07 $163.74 $156.44 $152.81 $168.43 $166.01 $161.38 $156.73 $172.88 Y/Y 5% 1% 5% (1)% -% 1% 3% 3% 3% 2022 2023 2024 Q1 Q2 Q3 Q4 Q1 Q2 Q3 Q4 Q1 Revenue $1,509M $2,104M $2,884M $1,902M $1,818M $2,484M $3,397M $2,218M $2,142M Y/Y 70% 58% 29% 24% 20% 18% 18% 17% 18% FX Neutral Y/Y 74% 64% 36% 31% 24% 19% 14% 14% 18% Net income (loss) $(19)M $379M $1,214M $319M $117M $650M $4,374M $(349)M $264M Adjusted EBITDA $229M $711M $1,457M $506M $262M $819M $1,834M $738M $424M Net cash provided by operating activities $1,202M $801M $964M $463M $1,587M $909M $1,325M $63M $1,923M Free Cash Flow $1,196M $796M $958M $455M $1,581M $900M $1,310M $46M $1,909M TTM Net cash provided by operating activities $2,909M $2,920M $3,349M $3,430M $3,815M $3,923M $4,284M $3,884M $4,220M TTM Free Cash Flow $2,886M $2,899M $3,328M $3,405M $3,790M $3,894M $4,246M $3,837M $4,165M 2022 2023 2024 Mar 31 Jun 30 Sept 30 Dec 31 Mar 31 Jun 30 Sept 30 Dec 31 Mar 31 Cash and other liquid assets (1) $9,337M $9,910M $9,629M $9,639M $10,624M $10,369M $10,986M $10,095M $11,128M Funds receivable and amounts held on behalf of customers $6,105M $7,466M $4,805M $4,783M $7,760M $9,144M $5,986M $5,869M $8,737M Unearned fees $1,748M $1,981M $1,220M $1,182M $2,172M $2,347M $1,467M $1,427M $2,434M 1 Includes cash and cash equivalents, restricted cash, and short-term investments.