UNITED STATES
SECURITIES AND EXCHANGE COMMISSION
Washington, D.C. 20549
FORM N-CSR
CERTIFIED SHAREHOLDER REPORT OF REGISTERED
MANAGEMENT INVESTMENT COMPANIES
811-22761
Investment Company Act file number
Stone Ridge Trust
(Exact name of registrant as specified in charter)
405 Lexington Avenue, 55th Floor
New York, New York 10174
(Address of principal executive offices) (Zip code)
Jane Korach
Stone Ridge Trust
405 Lexington Avenue, 55th Floor
New York, New York 10174
(Name and address of agent for service)
(212) 257-4778
Registrant’s telephone number, including area code
Date of fiscal year end: October 31, 2013
Date of reporting period: October 31, 2013
Item 1. Reports to Stockholders.
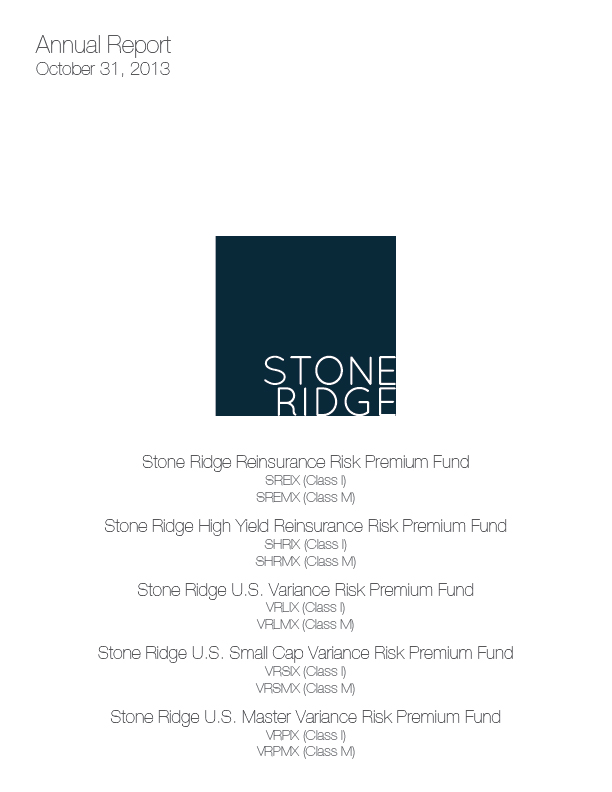
Table of Contents
Shareholder letter
December 2013
Dear Fellow Shareholder,
In 2013, Stone Ridge launched its first funds. Our growth – from a start-up working out of my apartment – to a global firm with 80 incredible clients and six funds – has been greater than we ever could have anticipated. How did this happen?
First, we are a kind firm. We are kind to each other. We are kind to our clients. We are kind to every vendor and counterpart we work with. Our portfolio managers are compensated, as detailed publicly in our SAI, based on the consistency of their kindness.
Second, we are a humble firm. Being humble is how we learn. Without this as a core principle, no single employee could keep up with the pace of innovation at Stone Ridge, nor in the markets. If anyone at Stone Ridge thinks that they already know everything, how can they possibly learn anything new? How can they be open to new ideas? If we are arrogant and the data changes, how are we going to let go of our beliefs if they are wrong? Instead, at Stone Ridge even the black belts come to work in their white belts and start every day with a beginner’s mind.
Third, we are focused. Very, very, very focused. This year we only did two things: Reinsurance and Variance Risk Premium. Imagine an entire firm focused every single day on just two things. That’s powerful. A real danger is that success leads to a dramatically increased opportunity set, which can be distracting. So, as an organization, we are world class at saying no.
Fourth, we got lucky. In our portfolio, there were no hurricanes. There were no earthquakes. There were no equity market crashes. That collective calmness drove the unusually strong risk-adjusted performance of our Reinsurance and Variance Risk Premium funds since launch. In future years, there will be tragic, terrible natural disasters and financial market shocks. The risk premiums we access will not deliver positive returns every year.
Stone Ridge, at its most basic, is about delivering access to valuable risks. That’s it. Risk taking is the most reliable way we know to build wealth in the long run. There are no shortcuts or free lunches. At Stone Ridge, we specialize in taking remote risks which, in any asset class, tend to have a higher ratio of risk premium to expected loss. And while we believe these risks will pay off on average and over the long term, the payoff periods are unpredictable. So are the drawdowns. If you want to realize the potential benefits of the risk taking, you have to stay in the trade.
I’m most proud of the 50/50 partnership Stone Ridge has with you, our clients. Both sides are equally important. You contribute the capital necessary to sustain and propel groundbreaking product development. We contribute our collective careers’ worth of experience in sourcing, structuring, execution, and risk management. Together, it works. In that spirit, I offer my deepest gratitude to you for sharing responsibility for your wealth with us this year. We look forward to serving you again in 2014.
Sincerely,
Ross L. Stevens
Founder, CEO
The opinions expressed are those of Stone Ridge Asset Management through the end of the period of this report, are subject to change, and are not intended to be a forecast of future events, a guarantee of future results, nor investment advice.
Past performance is no guarantee of future results.
| | | | | | | | | | | | | | | | |
| 2 | | Stone Ridge Funds | | | | | | Annual Report | | | | | | October 2013 | | |
| | | | | | | | | | |
Shareholder Letter
The Funds are generally available only to registered investment advisors (“RIAs”) meeting certain qualifications and that have completed a training program provided by the Advisor. Before allocating shares of the Funds to a client’s account, RIAs should carefully consider the Fund’s risks and investment objectives, as an investing in the Funds may not be appropriate for all clients and is not designed to be a complete investment program. An investment in the Fund involves a high degree of risk. The event-linked securities in which the Fund invests are considered “high yield” or “junk bonds”. It is possible that investing in the Fund may result in a loss of some or all of the amount invested. Before making an investment/allocation decision, an RIA should (i) consider the suitability of this investment with respect to a client’s investment objectives and individual situation and (ii) consider factors such as a client’s net worth, income, age, and risk tolerance. Allocation to client accounts should be avoided where a client has a short-term investing horizon and/or cannot bear the loss of some or all of their investment.
Mutual fund investing involves risk; Principal loss is possible. Event-linked, catastrophe bonds and reinsurance related securities carry large uncertainties and major risk exposures to adverse conditions. If a trigger event, as defined within the terms of the bond (such as a major natural disaster), involves losses or other metrics exceeding a specific magnitude in the geographic region and time period specified therein, the Fund may lose a portion or all of its investment in such security, including accrued interest and/or principal invested in such security. The Funds may invest in illiquid or restricted securities which may be difficult or impossible to sell at a time that the Funds would like or at the price that the Fund believes the security is worth. For additional risks, please refer to the prospectus.
The US Master Variance Risk Premium Fund, US Variance Risk Premium Fund, and US Small Cap Variance Risk Premium funds’ use of derivatives can lead to losses because of adverse movements in the price or value of the asset, index, rate or instrument underlying a derivative, due to failure of counterparty or due to tax or regulatory constraints. Derivatives may create economic leverage in the Fund, which magnifies the Fund’s exposure to the underlying investment. When derivatives are used to gain or limit exposure to a particular market or market segment, their performance may not correlate as expected to the performance of such market thereby causing the Fund to fail to achieve its original purpose for using such derivatives. The use of derivatives involves the exercise of specialized skill and judgment, and a transaction may be unsuccessful in whole or in part because of market behavior or unexpected events. Derivative instruments may be difficult to value, may be illiquid, and may be subject to wide swings in valuation caused by changes in the value of the underlying instrument. Investing in an ETF exposes the Fund to all of the risks of that ETF’s investments. As a result, the cost of investing in ETF shares may exceed the costs of investing directly in its underlying investments. ETF shares trade on an exchange at a market price which may vary from the ETF’s net asset value. The Fund is subject to leveraging risk. Leverage magnifies the Fund’s exposure to declines in the value of one or more underlying investments or creates investment risk with respect to a larger pool of assets than the Fund would otherwise have. The stocks of smaller, less seasoned companies are generally subject to greater price fluctuations, limited liquidity, higher transaction costs and higher investment risk. If, in any year, the Fund fails to qualify as a RIC under the Code for any reason, such a failure would have a material adverse effect on the Fund and its shareholders.
This information is intended for the shareholders of the Funds and is not for distribution to prospective investors unless preceded or accompanied by a current prospectus.
The Stone Ridge Funds are distributed by Quasar Distributors, LLC.
| | | | | | | | | | | | | | | | |
| | Stone Ridge Funds | | | | | | Annual Report | | | | | | October 2013 | | 3 |
| | | | | | | | | | |
| | |
| STONE RIDGE REINSURANCE RISK PREMIUM FUND | | |
|
| PERFORMANCE DATA (Unaudited) |
This chart assumes an initial gross investment of $10,000 made on February 1, 2013 (commencement of operations). Returns shown include the reinvestment of all dividends. Returns shown do not reflect the deduction of taxes that a shareholder would pay on fund distributions or the redemption of fund shares. In the absence of fee waivers and reimbursements, total return would be reduced. Past performance is not predictive of future performance. Investment return and principal value will fluctuate, so that your shares, when redeemed, may be worth more or less than the original cost.
The Bank of America (BofA) Merrill Lynch 3-Month U.S. Treasury Bill Index is an index of short-term U.S. Government securities with a remaining term to final maturity of less than three months. Index figures do not reflect any deduction for fees, taxes or expenses, and are not available for investment.
| | | | |
AVERAGE ANNUAL TOTAL RETURNS (FOR PERIOD ENDED OCTOBER 31, 2013) (Unaudited) | | | |
| | | Since
Inception
(02/01/13) | |
| Stone Ridge Reinsurance Risk Premium Fund — Class I | | | 4.53% | |
| Stone Ridge Reinsurance Risk Premium Fund — Class M | | | 4.48% | |
BofA Merrill Lynch 3-Month U.S. Treasury Bill Index | | | 0.05% | |
| | | | | | | | | | | | | | | | |
| 4 | | Stone Ridge Funds | | | | | | Annual Report | | | | | | October 2013 | | |
| | | | | | | | | | |
| | |
| STONE RIDGE HIGH YIELD REINSURANCE RISK PREMIUM FUND | | |
|
| PERFORMANCE DATA (Unaudited) |
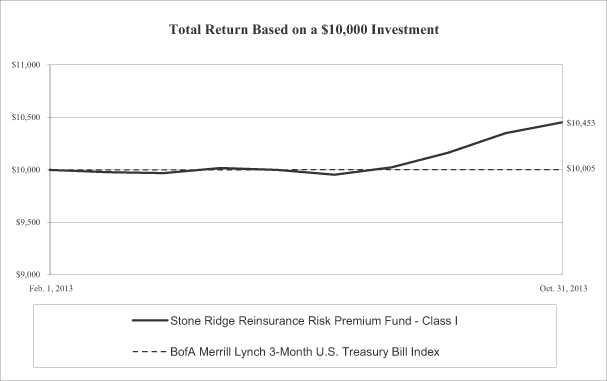
This chart assumes an initial gross investment of $10,000 made on February 1, 2013 (commencement of operations). Returns shown include the reinvestment of all dividends. Returns shown do not reflect the deduction of taxes that a shareholder would pay on fund distributions or the redemption of fund shares. In the absence of fee waivers and reimbursements, total return would be reduced. Past performance is not predictive of future performance. Investment return and principal value will fluctuate, so that your shares, when redeemed, may be worth more or less than the original cost.
The Bank of America (BofA) Merrill Lynch 3-Month U.S. Treasury Bill Index is an index of short-term U.S. Government securities with a remaining term to final maturity of less than three months. Index figures do not reflect any deduction for fees, taxes or expenses, and are not available for investment.
| | | | |
AVERAGE ANNUAL TOTAL RETURNS (FOR PERIOD ENDED OCTOBER 31, 2013) (Unaudited) | | | |
| | | Since
Inception
(02/01/13) | |
| Stone Ridge High Yield Reinsurance Risk Premium Fund — Class I | | | 5.58% | |
| Stone Ridge High Yield Reinsurance Risk Premium Fund — Class M | | | 5.43% | |
BofA Merrill Lynch 3-Month U.S. Treasury Bill Index | | | 0.05% | |
| | | | | | | | | | | | | | | | |
| | Stone Ridge Funds | | | | | | Annual Report | | | | | | October 2013 | | 5 |
| | | | | | | | | | |
| | |
| STONE RIDGE U.S. VARIANCE RISK PREMIUM FUND | | |
|
| PERFORMANCE DATA (Unaudited) |
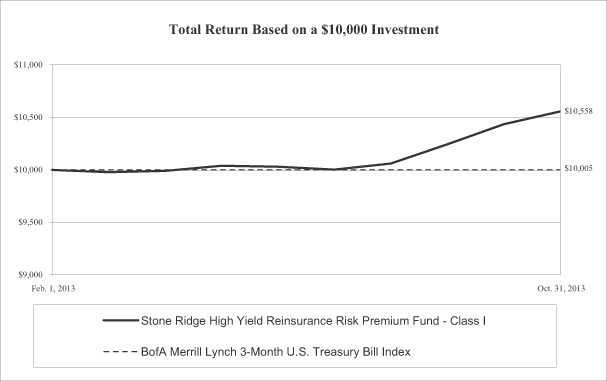
This chart assumes an initial gross investment of $10,000 made on May 1, 2013 (commencement of operations). Returns shown include the reinvestment of all dividends. Returns shown do not reflect the deduction of taxes that a shareholder would pay on fund distributions or the redemption of fund shares. In the absence of fee waivers and reimbursements, total return would be reduced. Past performance is not predictive of future performance. Investment return and principal value will fluctuate, so that your shares, when redeemed, may be worth more or less than the original cost.
The Bank of America (BofA) Merrill Lynch 3-Month U.S. Treasury Bill Index is an index of short-term U.S. Government securities with a remaining term to final maturity of less than three months. Index figures do not reflect any deduction for fees, taxes or expenses, and are not available for investment.
| | | | |
AVERAGE ANNUAL TOTAL RETURNS (FOR PERIOD ENDED OCTOBER 31, 2013) (Unaudited) | | | |
| | | Since
Inception
(05/01/13) | |
| Stone Ridge U.S. Variance Risk Premium Fund — Class I | | | 7.35% | |
| Stone Ridge U.S. Variance Risk Premium Fund — Class M | | | 7.25% | |
BofA Merrill Lynch 3-Month U.S. Treasury Bill Index | | | 0.03% | |
| | | | | | | | | | | | | | | | |
| 6 | | Stone Ridge Funds | | | | | | Annual Report | | | | | | October 2013 | | |
| | | | | | | | | | |
| | |
| STONE RIDGE U.S. SMALL CAP VARIANCE RISK PREMIUM FUND | | |
|
| PERFORMANCE DATA (Unaudited) |
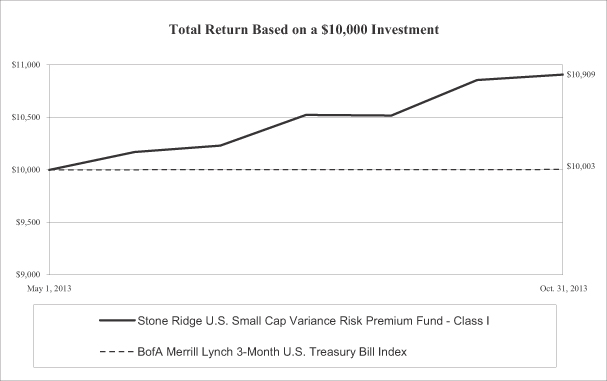
This chart assumes an initial gross investment of $10,000 made on May 1, 2013 (commencement of operations). Returns shown include the reinvestment of all dividends. Returns shown do not reflect the deduction of taxes that a shareholder would pay on fund distributions or the redemption of fund shares. In the absence of fee waivers and reimbursements, total return would be reduced. Past performance is not predictive of future performance. Investment return and principal value will fluctuate, so that your shares, when redeemed, may be worth more or less than the original cost.
The Bank of America (BofA) Merrill Lynch 3-Month U.S. Treasury Bill Index is an index of short-term U.S. Government securities with a remaining term to final maturity of less than three months. Index figures do not reflect any deduction for fees, taxes or expenses, and are not available for investment.
| | | | |
AVERAGE ANNUAL TOTAL RETURNS (FOR PERIOD ENDED OCTOBER 31, 2013) (Unaudited) | | | |
| | | Since
Inception
(05/01/13) | |
| Stone Ridge U.S. Small Cap Variance Risk Premium Fund — Class I | | | 9.09% | |
| Stone Ridge U.S. Small Cap Variance Risk Premium Fund — Class M | | | 8.99% | |
BofA Merrill Lynch 3-Month U.S. Treasury Bill Index | | | 0.03% | |
| | | | | | | | | | | | | | | | |
| | Stone Ridge Funds | | | | | | Annual Report | | | | | | October 2013 | | 7 |
| | | | | | | | | | |
| | |
| STONE RIDGE U.S. MASTER VARIANCE RISK PREMIUM FUND | | |
|
| PERFORMANCE DATA (Unaudited) |
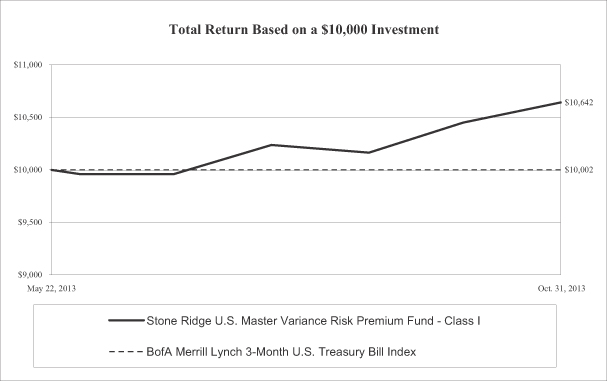
This chart assumes an initial gross investment of $10,000 made on May 22, 2013 (commencement of operations). Returns shown include the reinvestment of all dividends. Returns shown do not reflect the deduction of taxes that a shareholder would pay on fund distributions or the redemption of fund shares. In the absence of fee waivers and reimbursements, total return would be reduced. Past performance is not predictive of future performance. Investment return and principal value will fluctuate, so that your shares, when redeemed, may be worth more or less than the original cost.
The Bank of America (BofA) Merrill Lynch 3-Month U.S. Treasury Bill Index is an index of short-term U.S. Government securities with a remaining term to final maturity of less than three months. Index figures do not reflect any deduction for fees, taxes or expenses, and are not available for investment.
| | | | |
AVERAGE ANNUAL TOTAL RETURNS (FOR PERIOD ENDED OCTOBER 31, 2013) (Unaudited) | | | |
| | | Since
Inception
(05/22/13) | |
| Stone Ridge U.S. Master Variance Risk Premium Fund — Class I | | | 6.42% | |
| Stone Ridge U.S. Master Variance Risk Premium Fund — Class M | | | 6.36% | |
BofA Merrill Lynch 3-Month U.S. Treasury Bill Index | | | 0.02% | |
| | | | | | | | | | | | | | | | |
| 8 | | Stone Ridge Funds | | | | | | Annual Report | | | | | | October 2013 | | |
| | | | | | | | | | |
| | |
| ALLOCATION OF PORTFOLIO HOLDINGS AT OCTOBER 31, 2013 (Unaudited) |
| | | | | | | | |
| STONE RIDGE REINSURANCE RISK PREMIUM FUND PORTFOLIO ALLOCATION BY YEAR OF SCHEDULED MATURITY | |
| | |
| 2014 | | | $60,587,720 | | | | 11.9% | |
| | |
| 2015 | | | 71,206,664 | | | | 13.9% | |
| | |
| 2016 | | | 141,110,688 | | | | 27.6% | |
| | |
| 2017 | | | 130,840,269 | | | | 25.6% | |
| | |
| 2018 | | | 55,072,028 | | | | 10.8% | |
| | |
| 2019 | | | 40,420,751 | | | | 7.9% | |
| | |
| Not Applicable | | | 2,494,350 | | | | 0.5% | |
| | |
| Cash(1) | | | 9,118,222 | | | | 1.8% | |
| | | $510,850,692 | | | | | |
| | | | | | | | |
| STONE RIDGE U.S. VARIANCE RISK PREMIUM FUND PORTFOLIO ALLOCATION BY SECTOR | |
| | |
| Consumer Discretionary | | | $13,931,413 | | | | 3.8% | |
| | |
| Information Technology | | | 13,089,230 | | | | 3.6% | |
| | |
| Health Care | | | 7,951,631 | | | | 2.2% | |
| | |
| Industrials | | | 6,802,319 | | | | 1.9% | |
| | |
| Energy | | | 6,754,548 | | | | 1.9% | |
| | |
| Financials | | | 6,462,269 | | | | 1.8% | |
| | |
| Materials | | | 5,342,801 | | | | 1.5% | |
| | |
| Consumer Staples | | | 4,854,360 | | | | 1.3% | |
| | |
| Telecommunication Services | | | 744,202 | | | | 0.2% | |
| | |
| Utilities | | | 632,232 | | | | 0.2% | |
| | |
| Cash(1) | | | 295,699,442 | | | | 81.6% | |
| | | $362,264,447 | | | | | |
| | | | | | | | |
| STONE RIDGE U.S. MASTER VARIANCE RISK PREMIUM FUND PORTFOLIO ALLOCATION BY HOLDINGS | |
| | |
| Stone Ridge U.S. Variance Risk Premium Fund - Class I | | | $150,827,835 | | | | 66.6% | |
| | |
| Stone Ridge U.S. Small Cap Variance Risk Premium Fund - Class I | | | 74,977,437 | | | | 33.1% | |
| | |
| Cash(1) | | | 508,406 | | | | 0.3% | |
| | | $226,313,678 | | | | | |
| | | | | | | | |
| STONE RIDGE HIGH YIELD REINSURANCE RISK PREMIUM FUND PORTFOLIO ALLOCATION BY YEAR OF SCHEDULED MATURITY | |
| | |
| 2014 | | | $21,591,992 | | | | 10.4% | |
| | |
| 2015 | | | 30,411,909 | | | | 14.7% | |
| | |
| 2016 | | | 52,248,695 | | | | 25.2% | |
| | |
| 2017 | | | 62,884,078 | | | | 30.3% | |
| | |
| 2018 | | | 20,479,236 | | | | 9.9% | |
| | |
| 2019 | | | 15,610,875 | | | | 7.5% | |
| | |
| Not Applicable | | | 831,450 | | | | 0.4% | |
| | |
| Cash(1) | | | 3,170,485 | | | | 1.6% | |
| | | $207,228,720 | | | | | |
| | | | | | | | |
| STONE RIDGE U.S. SMALL CAP VARIANCE RISK PREMIUM FUND PORTFOLIO ALLOCATION BY SECTOR | |
| | |
| Health Care | | | $1,179,464 | | | | 1.0% | |
| | |
| Information Technology | | | 1,132,956 | | | | 1.0% | |
| | |
| Consumer Discretionary | | | 749,825 | | | | 0.7% | |
| | |
| Materials | | | 363,470 | | | | 0.3% | |
| | |
| Energy | | | 294,884 | | | | 0.3% | |
| | |
| Industrials | | | 225,803 | | | | 0.2% | |
| | |
| Telecommunication Services | | | 143,021 | | | | 0.1% | |
| | |
| Consumer Staples | | | 133,010 | | | | 0.1% | |
| | |
| Financials | | | 49,704 | | | | 0.0% | |
| | |
| Cash(1) | | | 109,552,682 | | | | 96.3% | |
| | | $113,824,819 | | | | | |
(1) Cash, cash equivalents and assets in excess of liabilities.
The Global Industry Classification Standard (GICS®) was developed by and/or is the exclusive property of MSCI, Inc. and Standard and Poor Financial Services LLC (“S&P”). GICS is a service mark of MSCI and S&P and has been licensed for use by U.S. Bancorp Fund Services, LLC.
| | | | | | | | | | | | | | | | |
| | Stone Ridge Funds | | | | | | Annual Report | | | | | | October 2013 | | 9 |
| | | | | | | | | | |
| | | | |
| Schedule of Investments | | | October 31, 2013 | |
| | |
| STONE RIDGE REINSURANCE RISK PREMIUM FUND | | |
| | | | | | | | |
| EVENT LINKED BONDS - 82.2% | | PRINCIPAL
AMOUNT | | | FAIR VALUE | |
| FINANCIAL SERVICES - 82.2% | | | | | | | | |
| | |
| Europe - 8.3% | | | | | | | | |
Atlas Re VII B
3.650%, 01/07/2016 (a)(b)(c) | | € | 2,250,000 | | | $ | 3,077,673 | |
Atlas VI 2011-2 A
8.000%, 04/09/2015 (a)(b)(c) | | € | 1,875,000 | | | | 2,582,852 | |
Calypso 2010-1 A
3.735%, 01/10/2014 (a)(b)(c) | | € | 9,500,000 | | | | 12,843,579 | |
Calypso 2011-1 A
4.100%, 01/09/2015 (a)(b)(c) | | € | 5,000,000 | | | | 6,846,699 | |
Calypso Capital II Class B
1.500%, 01/08/2018 (a)(b)(c) | | € | 2,750,000 | | | | 3,732,596 | |
Pylon II A
5.624%, 05/05/2016 (a)(b)(c) | | € | 1,000,000 | | | | 1,428,616 | |
Queen Street III
4.796%, 07/28/2014 (a)(b)(c) | | $ | 12,000,000 | | | | 12,035,540 | |
| | | | | | | | |
| | | | | | | 42,547,555 | |
| | | | | | | | |
| Global - 8.8% | | | | | | | | |
Blue Danube 2012-1 B
10.796%, 04/10/2015 (a)(b)(c) | | | 2,298,000 | | | | 2,471,907 | |
Blue Danube II 2013-1 A
4.368%, 05/23/2016 (a)(b)(c) | | | 10,042,000 | | | | 10,182,273 | |
EOS B
6.546%, 05/26/2014 (a)(b)(c) | | | 1,772,000 | | | | 1,800,436 | |
Galileo Re 2013-1
7.400%, 01/09/2017 (a)(b)(c) | | | 5,500,000 | | | | 5,497,593 | |
Montana Re 2010-1 E
9.758%, 01/08/2014 (a)(b)(c) | | | 904,000 | | | | 912,906 | |
Mythen Re 2012-2 A
8.613%, 01/05/2017 (a)(b)(c) | | | 578,000 | | | | 602,796 | |
Queen Street II
7.546%, 04/09/2014 (a)(b)(c) | | | 1,181,000 | | | | 1,198,071 | |
Queen Street IV
7.546%, 04/09/2015 (a)(b)(c) | | | 1,181,000 | | | | 1,218,711 | |
Queen Street V
8.546%, 04/09/2015 (a)(b)(c) | | | 1,181,000 | | | | 1,232,381 | |
Queen Street VI
10.396%, 04/09/2015 (a)(b)(c) | | | 2,515,000 | | | | 2,626,612 | |
Queen Street VIII
6.546%, 06/08/2016 (a)(b)(c) | | | 3,250,000 | | | | 3,271,215 | |
Successor X 2012-1 V-AA3
16.546%, 01/27/2015 (a)(b)(c) | | | 1,293,000 | | | | 1,348,211 | |
Tradewynd Re 2013-1 1
8.296%, 07/09/2018 (a)(b)(c) | | | 10,357,000 | | | | 10,766,757 | |
Tramline Re II 2013-1 A
3.296%, 07/07/2017 (a)(b)(c) | | | 1,750,000 | | | | 1,747,993 | |
| | | | | | | | |
| | | | | | | 44,877,862 | |
| | | | | | | | |
| Japan - 1.3% | | | | | | | | |
Nakama Re 2013-1
2.796%, 09/29/2016 (a)(b)(c) | | | 6,500,000 | | | | 6,531,123 | |
| | | | | | | | |
| | |
| Mexico - 1.8% | | | | | | | | |
MultiCat Mexico 2012-1 A
8.046%, 12/04/2015 (a)(b)(c) | | | 6,199,000 | | | | 6,401,707 | |
MultiCat Mexico 2012-1 B
7.796%, 12/04/2015 (a)(b)(c) | | | 1,875,000 | | | | 1,993,688 | |
| | | | | | | | |
| | | PRINCIPAL
AMOUNT | | | FAIR VALUE | |
| Mexico - 1.8% (continued) | | | | | | | | |
MultiCat Mexico 2012-1 C
7.546%, 12/04/2015 (a)(b)(c) | | $ | 541,000 | | | $ | 568,158 | |
| | | | | | | | |
| | | | | | | 8,963,553 | |
| | | | | | | | |
| Turkey - 3.5% | | | | | | | | |
Bosphorus 1 Re 2013-1 A
2.546%, 05/03/2016 (a)(b)(c) | | | 18,000,000 | | | | 17,956,812 | |
| | | | | | | | |
| | |
| United States - 58.2% | | | | | | | | |
Armor Re 2013-1 A
4.250%, 05/14/2014 (a)(b)(c) | | | 9,453,000 | | | | 9,579,076 | |
Atlas Re VII A
8.118%, 01/07/2016 (a)(b)(c) | | | 1,772,000 | | | | 1,828,922 | |
Caelus Re 2013-1 A
5.296%, 03/07/2016 (a)(b)(c) | | | 6,021,000 | | | | 6,093,746 | |
Caelus Re 2013-2 A
6.896%, 04/07/2017 (a)(b)(c) | | | 20,494,000 | | | | 21,050,994 | |
Combine Re C
17.796%, 01/07/2015 (a)(b)(c) | | | 1,255,000 | | | | 1,382,634 | |
Compass Re 2011-1 2
10.296%, 01/08/2015 (a)(b)(c) | | | 4,140,000 | | | | 4,353,960 | |
Compass Re 2011-1 3
11.296%, 01/08/2015 (a)(b)(c) | | | 4,730,000 | | | | 4,996,000 | |
East Lane IV 2011-1 A
5.796%, 03/14/2014 (a)(b)(c) | | | 1,750,000 | | | | 1,773,215 | |
East Lane IV 2011-1 B
6.696%, 03/13/2015 (a)(b)(c) | | | 4,238,000 | | | | 4,434,920 | |
Embarcadero Re 2011-1 A
6.680%, 08/04/2014 (a)(b)(c) | | | 3,125,000 | | | | 3,179,528 | |
Embarcadero Re 2012-1 A
7.394%, 02/13/2015 (a)(b)(c) | | | 1,647,000 | | | | 1,704,981 | |
Embarcadero Re 2012-2 A
5.046%, 08/07/2015 (a)(b)(c) | | | 6,750,000 | | | | 6,996,667 | |
Everglades Re 2012-1 A
17.796%, 04/30/2014 (a)(b)(c) | | | 5,731,000 | | | | 6,173,951 | |
Everglades Re 2013-1 A
10.046%, 03/28/2016 (a)(b)(c) | | | 12,600,000 | | | | 13,360,399 | |
Foundation Re III 2010-1 A
5.796%, 02/03/2014 (a)(b)(c) | | | 1,093,000 | | | | 1,102,953 | |
Golden State Re 2011-1
3.796%, 01/08/2015 (a)(b)(c) | | | 2,750,000 | | | | 2,792,954 | |
Green Fields II 2013-1 A
2.750%, 01/09/2017 (a)(b)(c) | | € | 2,250,000 | | | | 3,067,474 | |
Ibis Re II 2013-1 A
4.046%, 06/28/2016 (a)(b)(c) | | $ | 3,250,000 | | | | 3,318,782 | |
Ibis Re II 2013-1 B
4.546%, 06/28/2016 (a)(b)(c) | | | 4,500,000 | | | | 4,579,492 | |
Ibis Re II 2013-1 C
8.046%, 06/28/2016 (a)(b)(c) | | | 3,250,000 | | | | 3,362,092 | |
Johnston Re 2011-1 B
6.946%, 05/08/2014 (a)(b)(c) | | | 2,500,000 | | | | 2,564,311 | |
Lakeside Re III
8.046%, 01/08/2016 (a)(b)(c) | | | 10,975,000 | | | | 11,635,571 | |
Lodestone Re 2010-2 A-1
6.046%, 01/08/2014 (a)(b)(c) | | | 585,000 | | | | 588,306 | |
Lodestone Re 2010-2 A-2
7.296%, 01/08/2014 (a)(b)(c) | | | 3,544,000 | | | | 3,568,894 | |
| | | | |
| | The accompanying footnotes are an integral part of these Schedules of Investments. | | (Continued) |
| | | | | | | | | | | | | | | | |
| 10 | | Stone Ridge Funds | | | | | | Annual Report | | | | | | October 2013 | | |
| | | | | | | | | | |
| | | | |
| Schedule of Investments | | | October 31, 2013 | |
| | |
| STONE RIDGE REINSURANCE RISK PREMIUM FUND | | |
| | | | | | | | |
| | | PRINCIPAL
AMOUNT | | | FAIR VALUE | |
| United States - 58.2% (continued) | | | | | | | | |
Long Point Re III 2013-1 A
4.046%, 05/18/2016 (a)(b)(c) | | $ | 13,639,000 | | | $ | 13,899,253 | |
Merna Re IV
2.546%, 04/08/2016 (a)(b)(c) | | | 6,250,000 | | | | 6,302,515 | |
Metrocat Re 2013-1 A
4.546%, 08/05/2016 (a)(b)(c) | | | 3,750,000 | | | | 3,854,381 | |
Mona Lisa Re 2013-2 A
7.346%, 07/07/2017 (a)(b)(c) | | | 16,164,000 | | | | 16,834,137 | |
Montana Re 2010-1 C
12.158%, 01/08/2014 (a)(b)(c) | | | 586,000 | | | | 595,127 | |
Mystic Re III 2012-1 B
12.046%, 03/12/2015 (a)(b)(c) | | | 2,024,000 | | | | 2,176,335 | |
Mythen Re 2013-1 B
8.046%, 07/09/2015 (a)(b)(c) | | | 9,700,000 | | | | 10,100,610 | |
Northshore Re 2013-1 A
7.296%, 07/05/2016 (a)(b)(c) | | | 14,621,000 | | | | 15,029,318 | |
Pelican Re 2013-1 A
6.046%, 05/15/2017 (a)(b)(c) | | | 10,862,000 | | | | 11,115,377 | |
Residential Re 2011-1 1
9.046%, 06/06/2015 (a)(b)(c) | | | 1,186,000 | | | | 1,255,739 | |
Residential Re 2011-1 5
8.796%, 06/06/2015 (a)(b)(c) | | | 577,000 | | | | 619,335 | |
Residential Re 2011-2 1
8.946%, 12/06/2015 (a)(b)(c) | | | 2,358,000 | | | | 2,481,230 | |
Residential Re 2012-1 3
10.046%, 06/06/2016 (a)(b)(c) | | | 2,332,000 | | | | 2,592,563 | |
Residential Re 2012-2 2
5.796%, 12/06/2016 (a)(b)(c) | | | 1,149,000 | | | | 1,205,431 | |
Residential Re 2012-2 4
19.046%, 12/06/2016 (a)(b)(c) | | | 2,570,000 | | | | 2,820,261 | |
Residential Re 2013-1 11
8.046%, 06/06/2017 (a)(b)(c) | | | 24,900,000 | | | | 25,857,152 | |
Residential Re 2013-1 3
9.296%, 06/06/2017 (a)(b)(c) | | | 14,400,000 | | | | 14,881,768 | |
Sanders Re 2013-1 A
3.546%, 05/05/2017 (a)(b)(c) | | | 22,000,000 | | | | 22,047,046 | |
Sanders Re 2013-1 B
4.046%, 05/05/2017 (a)(b)(c) | | | 8,110,000 | | | | 8,137,939 | |
Successor X 2011-2 IV-AL3
13.046%, 02/25/2014 (a)(b)(c) | | | 2,593,000 | | | | 2,671,827 | |
Successor X 2012-1 V-D3
11.046%, 01/27/2015 (a)(b)(c) | | | 591,000 | | | | 620,373 | |
Tar Heel 2013-1 A
8.546%, 05/09/2016 (a)(b)(c) | | | 8,289,000 | | | | 8,780,250 | |
| | | | | | | | |
| | | | | | | 297,367,789 | |
| | | | | | | | |
| Unites States - 0.3% | | | | | | | | |
Atlas IX 2013-1 Class B
3.676%, 01/17/2019 (a)(b)(c) | | | 1,250,000 | | | | 1,256,626 | |
| | | | | | | | |
TOTAL EVENT LINKED BONDS
(Cost $410,637,816) | | | | | | | 419,501,320 | |
| | | | | | | | |
| PARTICIPATION NOTES (QUOTA SHARES) - 15.6% | |
|
| FINANCIAL SERVICES - 15.6% | |
|
| Global - 7.9% | |
Sector Re V LTD Series 3 Class A
03/01/2018 (b)(d)(e)(f) | | | 35,750,000 | | | | 40,572,675 | |
| | | | | | | | |
| | | | | | | | |
| | | PRINCIPAL
AMOUNT | | | FAIR VALUE | |
| United States - 7.7% | | | | | | | | |
Sector Re V LTD Series 3 Class F
03/01/2019 (b)(d)(e)(g) | | $ | 35,750,000 | | | $ | 39,164,125 | |
| | | | | | | | |
TOTAL PARTICIPATION NOTES
(QUOTA SHARES)
(Cost $71,500,000) | | | | | | | 79,736,800 | |
| | | | | | | | |
| | |
| PREFERENCE SHARES (QUOTA SHARES) - 0.5% | | | SHARES | | | | | |
| FINANCIAL SERVICES - 0.5% | | | | | | | | |
| | |
| Global - 0.5% | | | | | | | | |
| Lorenz Re Class B (b)(d)(e)(h) | | | 22,500 | | | | 2,494,350 | |
| | | | | | | | |
TOTAL PREFERENCE SHARES (QUOTA SHARES)
(Cost $2,250,000) | | | | | | | 2,494,350 | |
| | | | | | | | |
| |
| SHORT-TERM INVESTMENTS - 0.0% | | | | | |
| | |
| Money Market Funds - 0.0% | | | | | | | | |
| Fidelity Institutional Money Market Funds - Money Market Portfolio - 0.04% (i) | | | 38,676 | | | | 38,676 | |
| First American Government Obligations Fund - Class Z - 0.01% (i) | | | 38,676 | | | | 38,676 | |
| First American Prime Obligations Fund - Class Z - 0.02% (i) | | | 38,675 | | | | 38,675 | |
| Short Term Investments Trust - Liquid Assets Portfolio - Institutional Class - 0.02% (i) | | | 38,676 | | | | 38,676 | |
| Short Term Investments Trust - Treasury Portfolio - Institutional Class - 0.07% (i) | | | 38,676 | | | | 38,676 | |
| | | | | | | | |
TOTAL SHORT-TERM INVESTMENTS
(Cost $193,379) | | | | | | | 193,379 | |
| | | | | | | | |
TOTAL INVESTMENTS
(Cost $484,581,195) - 98.3% | | | | | | | 501,925,849 | |
| | | | | | | | |
| OTHER ASSETS IN EXCESS OF LIABILITIES - 1.7% | | | | | | | 8,924,843 | |
| | | | | | | | |
TOTAL NET ASSETS - 100.0% | | | | | | $ | 510,850,692 | |
| | | | | | | | |
Principal amounts stated in U.S. dollars unless otherwise noted.
Country shown is geographic area of peril risk.
Percentages are stated as a percent of net assets.
| (a) | Security is restricted to resale to institutional investors. The Fund’s Adviser has deemed this security to be liquid based upon procedures approved by the Board of Trustees. The aggregate value of these securities at October 31, 2013 was $419,501,320 which represents 82.2% of net assets. |
| (b) | Foreign issued security. Total foreign securities by country of domicile are $501,732,470. Foreign concentration is as follows: Bermuda 57.1%, Cayman Islands 30.2%, Ireland 10.9%. |
| (c) | Variable rate security. The rate shown is as of 10/31/2013. |
| (d) | Non-income producing security. |
| (e) | Security is considered illiquid and may be difficult to sell. The aggregate value of illiquid securities at October 31, 2013 was $82,231,150 which represented 16.1% of net assets. |
| (f) | Security is restricted to resale. Cost: $35,750,000. Acquisition date: March 19, 2013. |
| (g) | Security is restricted to resale. Cost: $35,750,000. Acquisition date: March 12, 2013. |
| (h) | Security is restricted to resale. Cost: $2,250,000. Acquisition date: March 25, 2013. |
| (i) | Rate shown is 7-day effective yield. |
| | | | |
| | The accompanying footnotes are an integral part of these Schedules of Investments. | | |
| | | | | | | | | | | | | | | | |
| | Stone Ridge Funds | | | | | | Annual Report | | | | | | October 2013 | | 11 |
| | | | | | | | | | |
| | | | |
| Schedule of Investments | | | October 31, 2013 | |
| | |
| STONE RIDGE HIGH YIELD REINSURANCE RISK PREMIUM FUND | | |
| | | | | | | | |
| EVENT LINKED BONDS - 82.7% | | PRINCIPAL
AMOUNT | | | FAIR VALUE | |
| FINANCIAL SERVICES - 82.7% | | | | | | | | |
| | |
| Europe - 0.7% | | | | | | | | |
Atlas VI 2011-2 A
8.000%, 04/09/2015 (a)(b)(c) | | € | 1,125,000 | | | $ | 1,549,711 | |
| | | | | | | | |
| | |
| Global - 12.1% | | | | | | | | |
Blue Danube 2012-1 B
10.796%, 04/10/2015 (a)(b)(c) | | $ | 1,702,000 | | | | 1,830,804 | |
Blue Danube II 2013-1 A
4.368%, 05/23/2016 (a)(b)(c) | | | 6,958,000 | | | | 7,055,194 | |
EOS B
6.546%, 05/26/2014 (a)(b)(c) | | | 1,228,000 | | | | 1,247,706 | |
Galileo Re 2013-1
7.400%, 01/09/2017 (a)(b)(c) | | | 4,000,000 | | | | 3,998,249 | |
Montana Re 2010-1 E
9.758%, 01/08/2014 (a)(b)(c) | | | 596,000 | | | | 601,872 | |
Mythen Re 2012-2 A
8.613%, 01/05/2017 (a)(b)(c) | | | 422,000 | | | | 440,104 | |
Queen Street II
7.546%, 04/09/2014 (a)(b)(c) | | | 819,000 | | | | 830,838 | |
Queen Street IV
7.546%, 04/09/2015 (a)(b)(c) | | | 819,000 | | | | 845,152 | |
Queen Street V
8.546%, 04/09/2015 (a)(b)(c) | | | 819,000 | | | | 854,632 | |
Queen Street VI
10.396%, 04/09/2015 (a)(b)(c) | | | 1,735,000 | | | | 1,811,996 | |
Queen Street VIII
6.546%, 06/08/2016 (a)(b)(c) | | | 250,000 | | | | 251,632 | |
Successor X 2012-1 V-AA3
16.546%, 01/27/2015 (a)(b)(c) | | | 957,000 | | | | 997,864 | |
Tradewynd Re 2013-1 1
8.296%, 07/09/2018 (a)(b)(c) | | | 4,143,000 | | | | 4,306,911 | |
| | | | | | | | |
| | | | | | | 25,072,954 | |
| | | | | | | | |
| Mexico - 3.2% | | | | | | | | |
MultiCat Mexico 2012-1 A
8.046%, 12/04/2015 (a)(b)(c) | | | 4,801,000 | | | | 4,957,993 | |
MultiCat Mexico 2012-1 B
7.796%, 12/04/2015 (a)(b)(c) | | | 1,125,000 | | | | 1,196,212 | |
MultiCat Mexico 2012-1 C
7.546%, 12/04/2015 (a)(b)(c) | | | 459,000 | | | | 482,042 | |
| | | | | | | | |
| | | | | | | 6,636,247 | |
| | | | | | | | |
| United States - 66.7% | | | | | | | | |
Armor Re 2013-1 A
4.250%, 05/14/2014 (a)(b)(c) | | | 6,547,000 | | | | 6,634,318 | |
Atlas Re VII A
8.118%, 01/07/2016 (a)(b)(c) | | | 1,228,000 | | | | 1,267,447 | |
Caelus Re 2013-1 A
5.296%, 03/07/2016 (a)(b)(c) | | | 4,229,000 | | | | 4,280,095 | |
Caelus Re 2013-2 A
6.896%, 04/07/2017 (a)(b)(c) | | | 14,506,000 | | | | 14,900,250 | |
Combine Re C
17.796%, 01/07/2015 (a)(b)(c) | | | 945,000 | | | | 1,041,106 | |
Compass Re 2011-1 2
10.296%, 01/08/2015 (a)(b)(c) | | | 2,860,000 | | | | 3,007,808 | |
Compass Re 2011-1 3
11.296%, 01/08/2015 (a)(b)(c) | | | 3,270,000 | | | | 3,453,894 | |
East Lane IV 2011-1 B
6.696%, 03/13/2015 (a)(b)(c) | | | 1,637,000 | | | | 1,713,064 | |
Embarcadero Re 2011-1 A
6.680%, 08/04/2014 (a)(b)(c) | | | 1,875,000 | | | | 1,907,717 | |
| | | | | | | | |
| | | PRINCIPAL
AMOUNT | | | FAIR VALUE | |
| United States - 66.7% (continued) | | | | | |
Embarcadero Re 2012-1 A
7.394%, 02/13/2015 (a)(b)(c) | | $ | 1,253,000 | | | $ | 1,297,111 | |
Everglades Re 2012-1 A
17.796%, 04/30/2014 (a)(b)(c) | | | 4,019,000 | | | | 4,329,630 | |
Everglades Re 2013-1 A
10.046%, 03/28/2016 (a)(b)(c) | | | 8,400,000 | | | | 8,906,933 | |
Foundation Re III 2010-1 A
5.796%, 02/03/2014 (a)(b)(c) | | | 757,000 | | | | 763,893 | |
Ibis Re II 2013-1 C
8.046%, 06/28/2016 (a)(b)(c) | | | 2,000,000 | | | | 2,068,979 | |
Lakeside Re III
8.046%, 01/08/2016 (a)(b)(c) | | | 8,700,000 | | | | 9,223,642 | |
Lodestone Re 2010-2 A-1
6.046%, 01/08/2014 (a)(b)(c) | | | 415,000 | | | | 417,345 | |
Lodestone Re 2010-2 A-2
7.296%, 01/08/2014 (a)(b)(c) | | | 2,456,000 | | | | 2,473,252 | |
Long Point Re III 2013-1 A
4.046%, 05/18/2016 (a)(b)(c) | | | 2,861,000 | | | | 2,915,592 | |
Mona Lisa Re 2013-2 A
7.346%, 07/07/2017 (a)(b)(c) | | | 1,836,000 | | | | 1,912,118 | |
Montana Re 2010-1 C
12.158%, 01/08/2014 (a)(b)(c) | | | 414,000 | | | | 420,448 | |
Mystic Re III 2012-1 B
12.046%, 03/12/2015 (a)(b)(c) | | | 1,476,000 | | | | 1,587,090 | |
Mythen Re 2013-1 B
8.046%, 07/09/2015 (a)(b)(c) | | | 300,000 | | | | 312,390 | |
Northshore Re 2013-1 A
7.296%, 07/05/2016 (a)(b)(c) | | | 5,379,000 | | | | 5,529,218 | |
Pelican Re 2013-1 A
6.046%, 05/15/2017 (a)(b)(c) | | | 7,388,000 | | | | 7,560,340 | |
Residential Re 2011-1 1
9.046%, 06/06/2015 (a)(b)(c) | | | 814,000 | | | | 861,865 | |
Residential Re 2011-1 5
8.796%, 06/06/2015 (a)(b)(c) | | | 423,000 | | | | 454,036 | |
Residential Re 2011-2 1
8.946%, 12/06/2015 (a)(b)(c) | | | 1,642,000 | | | | 1,727,812 | |
Residential Re 2012-1 3
10.046%, 06/06/2016 (a)(b)(c) | | | 1,668,000 | | | | 1,854,372 | |
Residential Re 2012-2 2
5.796%, 12/06/2016 (a)(b)(c) | | | 851,000 | | | | 892,795 | |
Residential Re 2012-2 4
19.046%, 12/06/2016 (a)(b)(c) | | | 1,780,000 | | | | 1,953,332 | |
Residential Re 2013-1 11
8.046%, 06/06/2017 (a)(b)(c) | | | 16,600,000 | | | | 17,238,102 | |
Residential Re 2013-1 3
9.296%, 06/06/2017 (a)(b)(c) | | | 9,600,000 | | | | 9,921,179 | |
Sanders Re 2013-1 B
4.046%, 05/05/2017 (a)(b)(c) | | | 6,890,000 | | | | 6,913,736 | |
Successor X 2011-2 IV-AL3
13.046%, 02/25/2014 (a)(b)(c) | | | 1,907,000 | | | | 1,964,973 | |
Successor X 2012-1 V-D3
11.046%, 01/27/2015 (a)(b)(c) | | | 409,000 | | | | 429,327 | |
Tar Heel 2013-1 A
8.546%, 05/09/2016 (a)(b)(c) | | | 5,711,000 | | | | 6,049,464 | |
| | | | | | | | |
| | | | | | | 138,184,673 | |
| | | | | | | | |
TOTAL EVENT LINKED BONDS
(Cost $167,322,395) | | | | | | | 171,443,585 | |
| | | | | | | | |
| | | | |
| | The accompanying footnotes are an integral part of these Schedules of Investments. | | (Continued) |
| | | | | | | | | | | | | | | | |
| 12 | | Stone Ridge Funds | | | | | | Annual Report | | | | | | October 2013 | | |
| | | | | | | | | | |
| | | | |
| Schedule of Investments | | | October 31, 2013 | |
| | |
| STONE RIDGE HIGH YIELD REINSURANCE RISK PREMIUM FUND | | |
| | | | | | | | |
| | | PRINCIPAL
AMOUNT | | | FAIR VALUE | |
PARTICIPATION NOTES
(QUOTA SHARES) - 15.4% | |
| FINANCIAL SERVICES - 15.4% | |
|
| Global - 7.8% | |
Sector Re V LTD Series 3 Class A
03/01/2018 (b)(d)(e)(f) | | $ | 14,250,000 | | | $ | 16,172,325 | |
| | | | | | | | |
| | |
| United States - 7.6% | | | | | | | | |
Sector Re V LTD Series 3 Class F
03/01/2019 (b)(d)(e)(g) | | | 14,250,000 | | | | 15,610,875 | |
| | | | | | | | |
TOTAL PARTICIPATION NOTES (QUOTA SHARES)
(Cost $28,500,000) | | | | | | | 31,783,200 | |
| | | | | | | | |
| PREFERENCE SHARES (QUOTA SHARES) - 0.4% | | | SHARES | | | | | |
| FINANCIAL SERVICES - 0.4% | | | | | | | | |
| | |
| Global - 0.4% | | | | | | | | |
| Lorenz Re Class B (b)(d)(e)(h) | | | 7,500 | | | | 831,450 | |
| | | | | | | | |
TOTAL PREFERENCE SHARES (QUOTA SHARES)
(Cost $750,000) | | | | | | | 831,450 | |
| | | | | | | | |
| SHORT-TERM INVESTMENTS - 0.2% | | | | | |
| | |
| Money Market Funds - 0.2% | | | | | | | | |
| Fidelity Institutional Money Market Funds -Money Market Portfolio -0.04% (i) | | | 87,793 | | | | 87,793 | |
| First American Government Obligations Fund - Class Z - 0.01% (i) | | | 87,793 | | | | 87,793 | |
| First American Prime Obligations Fund - Class Z - 0.02% (i) | | | 87,793 | | | | 87,793 | |
| Short Term Investments Trust - Liquid Assets Portfolio -Institutional Class - 0.02% (i) | | | 87,792 | | | | 87,792 | |
| Short Term Investments Trust - Treasury Portfolio - Institutional Class - 0.07% (i) | | | 87,793 | | | | 87,793 | |
| | | | | | | | |
TOTAL SHORT-TERM INVESTMENTS
(Cost $438,964) | | | | | | | 438,964 | |
| | | | | | | | |
TOTAL INVESTMENTS
(Cost $197,011,359) - 98.7% | | | | | | | 204,497,199 | |
| | | | | | | | |
| OTHER ASSETS IN EXCESS OF LIABILITIES - 1.3% | | | | 2,731,521 | |
| | | | | | | | |
TOTAL NET ASSETS - 100.0% | | | | | | $ | 207,228,720 | |
| | | | | | | | |
Principal amounts stated in U.S. dollars unless otherwise noted.
Country shown is geographic area of peril risk.
Percentages are stated as a percent of net assets.
| (a) | Security is restricted to resale to institutional investors. The Fund’s Adviser has deemed this security to be liquid based upon procedures approved by the Board of Trustees. The aggregate value of these securities at October 31, 2013 was $171,443,585 which represents 82.7% of net assets. |
| (b) | Foreign issued security. Total foreign securities by country of domicile are $204,058,235. Foreign concentration is as follows: Bermuda 54.5%, Cayman Islands 40.3%, Ireland 3.6%. |
| (c) | Variable rate security. The rate shown is as of 10/31/2013. |
| (d) | Non-income producing security. |
| (e) | Security is considered illiquid and may be difficult to sell. The aggregate value of illiquid securities at October 31, 2013 was $32,614,650 which represented 15.74% of net assets. |
| (f) | Security is restricted to resale. Cost: $14,250,000. Acquisition date: March 19, 2013. |
| (g) | Security is restricted to resale. Cost: $14,250,000. Acquisition date: March 12, 2013. |
| (h) | Security is restricted to resale. Cost: $750,000. Acquisition date: March 25, 2013. |
| (i) | Rate shown is the 7-day effective yield. |
| | | | |
| | The accompanying footnotes are an integral part of these Schedules of Investments. | | |
| | | | | | | | | | | | | | | | |
| | Stone Ridge Funds | | | | | | Annual Report | | | | | | October 2013 | | 13 |
| | | | | | | | | | |
| | | | |
| Schedule of Investments | | | October 31, 2013 | |
| | |
| STONE RIDGE U.S. VARIANCE RISK PREMIUM FUND | | |
| | | | | | | | |
| | | SHARES | | | FAIR
VALUE | |
| COMMON STOCKS - 18.1% | | | | | | | | |
| | |
| Automobiles & Components - 0.3% | | | | | | | | |
| Delphi Automotive PLC (a)(b) | | | 300 | | | $ | 17,160 | |
| Ford Motor Co. (b) | | | 13,600 | | | | 232,696 | |
| General Motors Co. (b)(c) | | | 5,700 | | | | 210,615 | |
| Goodyear Tire & Rubber Co. (b)(c) | | | 9,100 | | | | 190,918 | |
| Harley-Davidson, Inc. (b) | | | 400 | | | | 25,616 | |
| Tesla Motors, Inc. (b)(c) | | | 2,700 | | | | 431,838 | |
| | | | | | | | |
| | | | | | | 1,108,843 | |
| | | | | | | | |
| Banks - 0.4% | | | | | | | | |
| BB&T Corp. (b) | | | 6,200 | | | | 210,614 | |
| CIT Group, Inc. (b)(c) | | | 4,200 | | | | 202,272 | |
| Comerica, Inc. (b) | | | 700 | | | | 30,310 | |
| Huntington Bancshares, Inc. (b) | | | 2,000 | | | | 17,600 | |
| Nationstar Mortgage Holdings, Inc. (b)(c) | | | 3,600 | | | | 184,752 | |
| Ocwen Financial Corp. (b)(c) | | | 3,644 | | | | 204,902 | |
| Popular, Inc. (a)(b)(c) | | | 8,100 | | | | 204,525 | |
| The PNC Financial Services Group, Inc. (b) | | | 2,700 | | | | 198,531 | |
| Wells Fargo & Co. (b) | | | 5,600 | | | | 239,064 | |
| | | | | | | | |
| | | | | | | 1,492,570 | |
| | | | | | | | |
| Capital Goods - 1.3% | | | | | | | | |
| 3M Co. (b) | | | 1,800 | | | | 226,530 | |
| Actuant Corp. (b) | | | 100 | | | | 3,756 | |
| Alliant Techsystems, Inc. (b) | | | 500 | | | | 54,435 | |
| Boeing Co. (b) | | | 1,800 | | | | 234,900 | |
| Caterpillar, Inc. (b) | | | 2,400 | | | | 200,064 | |
| Chicago Bridge & Iron Co. NV (a)(b) | | | 59 | | | | 4,371 | |
| Colfax Corp. (b)(c) | | | 500 | | | | 27,980 | |
| Cummins, Inc. (b) | | | 1,700 | | | | 215,934 | |
| Deere & Co. (b) | | | 2,800 | | | | 229,152 | |
| Fluor Corp. (b) | | | 2,900 | | | | 215,238 | |
| General Dynamics Corp. (b) | | | 2,600 | | | | 225,238 | |
| General Electric Co. (b) | | | 8,500 | | | | 222,190 | |
| Honeywell International, Inc. (b) | | | 400 | | | | 34,692 | |
| Joy Global, Inc. (b) | | | 700 | | | | 39,725 | |
| Lennox International, Inc. (b) | | | 200 | | | | 15,612 | |
| Lockheed Martin Corp. (b) | | | 600 | | | | 80,004 | |
| Masco Corp. (b) | | | 9,400 | | | | 198,622 | |
| Navistar International Corp. (b)(c) | | | 4,800 | | | | 173,568 | |
| Nordson Corp. (b) | | | 1,200 | | | | 86,508 | |
| Pall Corp. (b) | | | 2,500 | | | | 201,300 | |
| Rockwell Collins, Inc. (b) | | | 400 | | | | 27,932 | |
| SolarCity Corp. (b)(c) | | | 3,000 | | | | 159,840 | |
| Terex Corp. (b)(c) | | | 6,000 | | | | 209,700 | |
| Textron, Inc. (b) | | | 6,000 | | | | 172,740 | |
| TransDigm Group, Inc. (b) | | | 1,600 | | | | 232,656 | |
| Trinity Industries, Inc. (b) | | | 3,600 | | | | 182,268 | |
| United Rentals, Inc. (b)(c) | | | 2,700 | | | | 174,393 | |
| United Technologies Corp. (b) | | | 1,900 | | | | 201,875 | |
| Valmont Industries, Inc. (b) | | | 1,300 | | | | 182,650 | |
| Watsco, Inc. (b) | | | 900 | | | | 85,761 | |
| WW Grainger, Inc. (b) | | | 700 | | | | 188,279 | |
| | | | | | | | |
| | | | | | | 4,507,913 | |
| | | | | | | | |
| | | | | | | | |
| | | SHARES | | | FAIR
VALUE | |
| Commercial & Professional Services - 0.1% | | | | | |
| Pitney Bowes, Inc. (b) | | | 8,700 | | | $ | 185,658 | |
| The ADT Corp. (b) | | | 4,423 | | | | 191,826 | |
| | | | | | | | |
| | | | | | | 377,484 | |
| | | | | | | | |
| Consumer Durables & Apparel - 0.8% | | | | | | | | |
| D.R. Horton, Inc. (b) | | | 13,900 | | | | 263,405 | |
| Fossil Group, Inc. (b)(c) | | | 1,800 | | | | 228,492 | |
| Garmin Ltd. (a)(b) | | | 600 | | | | 28,050 | |
| Lennar Corp. (b) | | | 8,600 | | | | 305,730 | |
| Michael Kors Holdings Ltd. (a)(b)(c) | | | 2,800 | | | | 215,460 | |
| Mohawk Industries, Inc. (b)(c) | | | 1,600 | | | | 211,872 | |
| NIKE, Inc. (b) | | | 2,900 | | | | 219,704 | |
| PulteGroup, Inc. (b) | | | 12,800 | | | | 225,920 | |
| PVH Corp. (b) | | | 1,400 | | | | 174,398 | |
| Ralph Lauren Corp. (b) | | | 1,300 | | | | 215,332 | |
| Standard Pacific Corp. (b)(c) | | | 19,000 | | | | 150,670 | |
| Toll Brothers, Inc. (b)(c) | | | 2,900 | | | | 95,352 | |
| Under Armour, Inc. (b)(c) | | | 2,800 | | | | 227,220 | |
| VF Corp. (b) | | | 800 | | | | 172,000 | |
| Whirlpool Corp. (b) | | | 1,400 | | | | 204,414 | |
| Wolverine World Wide, Inc. (b) | | | 500 | | | | 28,870 | |
| | | | | | | | |
| | | | | | | 2,966,889 | |
| | | | | | | | |
| Consumer Services - 0.4% | | | | | | | | |
| Burger King Worldwide, Inc. (b) | | | 1,000 | | | | 21,180 | |
| Caesars Entertainment Corp. (b)(c) | | | 1,000 | | | | 17,420 | |
| Chipotle Mexican Grill, Inc. (b)(c) | | | 400 | | | | 210,788 | |
| Darden Restaurants, Inc. (b) | | | 600 | | | | 30,918 | |
| International Game Technology (b) | | | 8,000 | | | | 150,400 | |
| Las Vegas Sands Corp. (b) | | | 2,400 | | | | 168,528 | |
| McDonald’s Corp. (b) | | | 2,100 | | | | 202,692 | |
| MGM Resorts International (b)(c) | | | 8,700 | | | | 165,648 | |
| Panera Bread Co. (b)(c) | | | 400 | | | | 63,168 | |
| Sotheby’s (b) | | | 600 | | | | 31,140 | |
| Starbucks Corp. (b) | | | 2,700 | | | | 218,835 | |
| Starwood Hotels & Resorts Worldwide, Inc. (b) | | | 1,600 | | | | 117,792 | |
| Wynn Resorts Ltd. (b) | | | 700 | | | | 116,375 | |
| Yum! Brands, Inc. (b) | | | 2,100 | | | | 142,002 | |
| | | | | | | | |
| | | | | | | 1,656,886 | |
| | | | | | | | |
| Diversified Financials - 0.6% | | | | | | | | |
| American Express Co. (b) | | | 2,100 | | | | 171,780 | |
| Bank of America Corp. (b) | | | 10,000 | | | | 139,600 | |
| BlackRock, Inc. (b) | | | 600 | | | | 180,486 | |
| Capital One Financial Corp. (b) | | | 2,500 | | | | 171,675 | |
| Citigroup, Inc. (b) | | | 5,600 | | | | 273,168 | |
| Discover Financial Services (b) | | | 1,500 | | | | 77,820 | |
| Goldman Sachs Group, Inc. (b) | | | 1,500 | | | | 241,290 | |
| JPMorgan Chase & Co. (b) | | | 4,400 | | | | 226,776 | |
| Morgan Stanley (b) | | | 1,300 | | | | 37,349 | |
| Northern Trust Corp. (b) | | | 100 | | | | 5,642 | |
| State Street Corp. (b) | | | 3,100 | | | | 217,217 | |
| The Bank of New York Mellon Corp. (b) | | | 7,200 | | | | 228,960 | |
| | | | | | | | |
| | | | | | | 1,971,763 | |
| | | | | | | | |
| Energy - 1.9% | | | | | | | | |
| Anadarko Petroleum Corp. (b) | | | 2,300 | | | | 219,167 | |
| Apache Corp. (b) | | | 2,900 | | | | 257,520 | |
| | | | |
| | The accompanying footnotes are an integral part of these Schedules of Investments. | | (Continued) |
| | | | | | | | | | | | | | | | |
| 14 | | Stone Ridge Funds | | | | | | Annual Report | | | | | | October 2013 | | |
| | | | | | | | | | |
| | | | |
| Schedule of Investments | | | October 31, 2013 | |
| | |
| STONE RIDGE U.S. VARIANCE RISK PREMIUM FUND | | |
| | | | | | | | |
| | | SHARES | | | FAIR
VALUE | |
| Energy - 1.9% (continued) | | | | | | | | |
| Baker Hughes, Inc. (b) | | | 1,000 | | | $ | 58,090 | |
| Cheniere Energy, Inc. (b)(c) | | | 8,800 | | | | 350,240 | |
| Chesapeake Energy Corp. (b) | | | 6,000 | | | | 167,760 | |
| Chevron Corp. (b) | | | 1,700 | | | | 203,932 | |
| Cobalt International Energy, Inc. (b)(c) | | | 7,300 | | | | 169,433 | |
| ConocoPhillips (b) | | | 3,300 | | | | 241,890 | |
| CONSOL Energy, Inc. (b) | | | 4,200 | | | | 153,300 | |
| CVR Energy, Inc. (b) | | | 5,200 | | | | 206,544 | |
| Devon Energy Corp. (b) | | | 3,006 | | | | 190,039 | |
| Dresser-Rand Group, Inc. (b)(c) | | | 2,000 | | | | 121,540 | |
| Energen Corp. (b) | | | 300 | | | | 23,496 | |
| EOG Resources, Inc. (b) | | | 1,600 | | | | 285,440 | |
| Exxon Mobil Corp. (b) | | | 2,400 | | | | 215,088 | |
| FMC Technologies, Inc. (b)(c) | | | 600 | | | | 30,330 | |
| Gulfport Energy Corp. (b)(c) | | | 3,300 | | | | 193,677 | |
| Halliburton Co. (b) | | | 4,200 | | | | 222,726 | |
| Hess Corp. (b) | | | 2,600 | | | | 211,120 | |
| HollyFrontier Corp. (b) | | | 7,100 | | | | 327,026 | |
| Kinder Morgan, Inc./DE (b) | | | 5,300 | | | | 187,143 | |
| Marathon Oil Corp. (b) | | | 4,300 | | | | 151,618 | |
| Marathon Petroleum Corp. (b) | | | 1,100 | | | | 78,826 | |
| Nabors Industries Ltd. (a)(b) | | | 9,600 | | | | 167,808 | |
| National Oilwell Varco, Inc. (b) | | | 400 | | | | 32,472 | |
| Newfield Exploration Co. (b)(c) | | | 6,100 | | | | 185,745 | |
| Occidental Petroleum Corp. (b) | | | 2,200 | | | | 211,376 | |
| Oil States International, Inc. (b)(c) | | | 2,000 | | | | 217,260 | |
| Peabody Energy Corp. (b) | | | 16,400 | | | | 319,472 | |
| Phillips 66 (b) | | | 3,500 | | | | 225,505 | |
| Schlumberger Ltd. (a)(b) | | | 2,700 | | | | 253,044 | |
| Seadrill Ltd. (a)(b) | | | 3,800 | | | | 177,156 | |
| Southwestern Energy Co. (b)(c) | | | 5,500 | | | | 204,710 | |
| Tesoro Corp. (b) | | | 3,500 | | | | 171,115 | |
| The Williams Cos., Inc. (b) | | | 5,700 | | | | 203,547 | |
| Valero Energy Corp. (b) | | | 2,900 | | | | 119,393 | |
| | | | | | | | |
| | | | | | | 6,754,548 | |
| | | | | | | | |
| Food & Staples Retailing - 0.3% | | | | | | | | |
| Casey’s General Stores, Inc. (b) | | | 400 | | | | 29,152 | |
| Costco Wholesale Corp. (b) | | | 1,800 | | | | 212,400 | |
| CVS Caremark Corp. (b) | | | 3,500 | | | | 217,910 | |
| Kroger Co. (b) | | | 1,400 | | | | 59,976 | |
| Rite Aid Corp. (b)(c) | | | 20,000 | | | | 106,600 | |
| Safeway, Inc. (b) | | | 200 | | | | 6,980 | |
| Walgreen Co. (b) | | | 3,000 | | | | 177,720 | |
| Wal-Mart Stores, Inc. (b) | | | 2,700 | | | | 207,225 | |
| Whole Foods Market, Inc. (b) | | | 2,714 | | | | 171,335 | |
| | | | | | | | |
| | | | | | | 1,189,298 | |
| | | | | | | | |
| Food, Beverage & Tobacco - 0.7% | | | | | | | | |
| Archer-Daniels-Midland Co. (b) | | | 5,100 | | | | 208,590 | |
| Beam, Inc. (b) | | | 3,200 | | | | 215,360 | |
| Bunge Ltd. (a)(b) | | | 2,600 | | | | 213,538 | |
| Constellation Brands, Inc. (b)(c) | | | 3,700 | | | | 241,610 | |
| General Mills, Inc. (b) | | | 4,200 | | | | 211,764 | |
| Green Mountain Coffee Roasters, Inc. (b)(c) | | | 4,700 | | | | 295,207 | |
| Kraft Foods Group, Inc. (b) | | | 900 | | | | 48,942 | |
| Lorillard, Inc. (b) | | | 4,500 | | | | 229,545 | |
| | | | | | | | |
| | | SHARES | | | FAIR
VALUE | |
| Food, Beverage & Tobacco - 0.7% (continued) | | | | | |
| Mead Johnson Nutrition Co. (b) | | | 2,700 | | | $ | 220,482 | |
| Mondelez International, Inc. (b) | | | 5,300 | | | | 178,292 | |
| PepsiCo, Inc. (b) | | | 2,100 | | | | 176,589 | |
| Philip Morris International, Inc. (b) | | | 2,000 | | | | 178,240 | |
| The Coca-Cola Co. (b) | | | 5,000 | | | | 197,850 | |
| The Hershey Co. (b) | | | 300 | | | | 29,772 | |
| Tyson Foods, Inc. (b) | | | 100 | | | | 2,767 | |
| | | | | | | | |
| | | | | | | 2,648,548 | |
| | | | | | | | |
| Health Care Equipment & Services - 0.9% | | | | | |
| Abbott Laboratories (b) | | | 6,800 | | | | 248,540 | |
| Aetna, Inc. (b) | | | 3,501 | | | | 219,512 | |
| Baxter International, Inc. (b) | | | 3,300 | | | | 217,371 | |
| Becton Dickinson & Co. (b) | | | 300 | | | | 31,539 | |
| Boston Scientific Corp. (b)(c) | | | 13,200 | | | | 154,308 | |
| Catamaran Corp. (a)(b)(c) | | | 600 | | | | 28,176 | |
| Cerner Corp. (b)(c) | | | 3,400 | | | | 190,502 | |
| Cigna Corp. (b) | | | 2,600 | | | | 200,148 | |
| Community Health Systems, Inc. (b) | | | 3,660 | | | | 159,686 | |
| Cooper Cos, Inc. (b) | | | 1,400 | | | | 180,894 | |
| Express Scripts Holding Co. (b)(c) | | | 3,300 | | | | 206,316 | |
| HCA Holdings, Inc. (b) | | | 7 | | | | 330 | |
| Health Management Associates, Inc. (b)(c) | | | 11,300 | | | | 144,866 | |
| Hologic, Inc. (b)(c) | | | 4,600 | | | | 102,994 | |
| Intuitive Surgical, Inc. (b)(c) | | | 600 | | | | 222,900 | |
| Laboratory Corp of America (b) Holdings (b)(c) | | | 1,800 | | | | 181,620 | |
| Medtronic, Inc. (b) | | | 2,000 | | | | 114,800 | |
| Quest Diagnostics, Inc. (b) | | | 1,500 | | | | 89,865 | |
| St. Jude Medical, Inc. (b) | | | 500 | | | | 28,695 | |
| UnitedHealth Group, Inc. (b) | | | 800 | | | | 54,608 | |
| WellPoint, Inc. (b) | | | 2,500 | | | | 212,000 | |
| | | | | | | | |
| | | | | | | 2,989,670 | |
| | | | | | | | |
| Household & Personal Products - 0.3% | | | | | | | | |
| Colgate-Palmolive Co. (b) | | | 500 | | | | 32,365 | |
| Herbalife Ltd. (a)(b) | | | 5,700 | | | | 369,474 | |
| Nu Skin Enterprises, Inc. (b) | | | 2,200 | | | | 257,246 | |
| The Clorox Co. (b) | | | 900 | | | | 81,171 | |
| The Estee Lauder Cos., Inc. (b) | | | 2,300 | | | | 163,208 | |
| The Procter & Gamble Co. (b) | | | 1,400 | | | | 113,050 | |
| | | | | | | | |
| | | | | | | 1,016,514 | |
| | | | | | | | |
| Insurance - 0.4% | | | | | | | | |
| Aflac, Inc. (b) | | | 3,600 | | | | 233,928 | |
| American International Group, Inc. (b) | | | 4,500 | | | | 232,425 | |
| Amtrust Financial Services, Inc. (b) | | | 1,500 | | | | 57,540 | |
| Assured Guaranty Ltd. (a)(b) | | | 3,300 | | | | 67,650 | |
| Berkshire Hathaway, Inc. (b)(c) | | | 1,400 | | | | 161,112 | |
| Chubb Corp. (b) | | | 300 | | | | 27,624 | |
| Hartford Financial Services Group, Inc. (b) | | | 3,917 | | | | 132,003 | |
| Lincoln National Corp. (b) | | | 600 | | | | 27,246 | |
| MBIA, Inc. (b)(c) | | | 17,600 | | | | 200,112 | |
| MetLife, Inc. (b) | | | 3,300 | | | | 156,123 | |
| Prudential Financial, Inc. (b) | | | 2,900 | | | | 236,031 | |
| The Allstate Corp. (b) | | | 3,300 | | | | 175,098 | |
| | | | | | | | |
| | | | | | | 1,706,892 | |
| | | | | | | | |
| | | | |
| | The accompanying footnotes are an integral part of these Schedules of Investments. | | (Continued) |
| | | | | | | | | | | | | | | | |
| | Stone Ridge Funds | | | | | | Annual Report | | | | | | October 2013 | | 15 |
| | | | | | | | | | |
| | | | |
| Schedule of Investments | | | October 31, 2013 | |
| | |
| STONE RIDGE U.S. VARIANCE RISK PREMIUM FUND | | |
| | | | | | | | |
| | | SHARES | | | FAIR
VALUE | |
| Materials - 1.5% | | | | | | | | |
| Air Products & Chemicals, Inc. (b) | | | 1,600 | | | $ | 174,416 | |
| Alcoa, Inc. (b) | | | 22,300 | | | | 206,721 | |
| Allegheny Technologies, Inc. (b) | | | 2,000 | | | | 66,200 | |
| Ashland, Inc. (b) | | | 300 | | | | 27,765 | |
| Avery Dennison Corp. (b) | | | 4,100 | | | | 193,192 | |
| Celanese Corp. (b) | | | 3,341 | | | | 187,129 | |
| CF Industries Holdings, Inc. (b) | | | 1,800 | | | | 388,080 | |
| Cliffs Natural Resources, Inc. (b) | | | 13,100 | | | | 336,408 | |
| Crown Holdings, Inc. (b)(c) | | | 4,300 | | | | 187,480 | |
| Cytec Industries, Inc. (b) | | | 2,111 | | | | 175,403 | |
| Eagle Materials, Inc. (b) | | | 2,900 | | | | 217,529 | |
| Eastman Chemical Co. (b) | | | 2,900 | | | | 228,491 | |
| El Du Pont de Nemours & Co. (b) | | | 3,600 | | | | 220,320 | |
| FMC Corp. (b) | | | 100 | | | | 7,276 | |
| Freeport-McMoRan Copper & Gold, Inc. (b) | | | 6,400 | | | | 235,264 | |
| Huntsman Corp. (b) | | | 9,800 | | | | 227,556 | |
| International Paper Co. (b) | | | 4,500 | | | | 200,745 | |
| LyondellBasell Industries NV (a)(b) | | | 500 | | | | 37,300 | |
| Monsanto Co. (b) | | | 2,200 | | | | 230,736 | |
| Newmont Mining Corp. (b) | | | 10,900 | | | | 297,134 | |
| Nucor Corp. (b) | | | 4,300 | | | | 222,611 | |
| Southern Copper Corp. (b) | | | 6,700 | | | | 187,265 | |
| The Dow Chemical Co. (b) | | | 5,700 | | | | 224,979 | |
| The Mosaic Co. (b) | | | 8,700 | | | | 398,895 | |
| United States Steel Corp. (b) | | | 9,800 | | | | 243,922 | |
| WR Grace & Co. (b)(c) | | | 2,400 | | | | 219,984 | |
| | | | | | | | |
| | | | | | | 5,342,801 | |
| | | | | | | | |
| Media - 0.5% | | | | | | | | |
| Charter Communications, Inc. (b)(c) | | | 600 | | | | 80,544 | |
| Comcast Corp. (b) | | | 3,400 | | | | 161,772 | |
| DirectTV (b)(c) | | | 3,600 | | | | 224,964 | |
| Discovery Communications, Inc. (b)(c) | | | 2,500 | | | | 222,300 | |
| DISH Network Corp. (b) | | | 4,800 | | | | 231,360 | |
| Interpublic Group of Cos., Inc. (b) | | | 6,000 | | | | 100,800 | |
| Omnicom Group, Inc. (b) | | | 2,727 | | | | 185,736 | |
| The Walt Disney Co. (b) | | | 3,100 | | | | 212,629 | |
| Time Warner, Inc. (b) | | | 2,600 | | | | 178,724 | |
| Viacom, Inc. (b) | | | 2,500 | | | | 208,225 | |
| | | | | | | | |
| | | | | | | 1,807,054 | |
| | | | | | | | |
| Pharmaceuticals, Biotechnology & Life Sciences - 1.3% | |
| Actavis Plc (a)(b)(c) | | | 1,500 | | | | 231,870 | |
| Aegerion Pharmaceuticals, Inc. (b)(c) | | | 2,500 | | | | 207,050 | |
| Agilent Technologies, Inc. (b) | | | 4,100 | | | | 208,116 | |
| Alexion Pharmaceuticals, Inc. (b)(c) | | | 1,800 | | | | 221,310 | |
| Allergan, Inc./United States (b) | | | 2,200 | | | | 199,342 | |
| Alnylam Pharmaceuticals, Inc. (b)(c) | | | 1,500 | | | | 86,415 | |
| Amgen, Inc. (b) | | | 3,100 | | | | 359,600 | |
| Biogen Idec, Inc. (b)(c) | | | 900 | | | | 219,771 | |
| Biomarin Pharmaceutical, Inc. (b)(c) | | | 3,000 | | | | 188,460 | |
| Bristol-Myers Squibb Co. (b) | | | 4,400 | | | | 231,088 | |
| Celgene Corp. (b)(c) | | | 1,300 | | | | 193,037 | |
| Cubist Pharmaceuticals, Inc. (b)(c) | | | 2,000 | | | | 124,000 | |
| Eli Lilly & Co. (b) | | | 3,900 | | | | 194,298 | |
| Forest Laboratories, Inc. (b)(c) | | | 100 | | | | 4,703 | |
| Gilead Sciences, Inc. (b)(c) | | | 2,600 | | | | 184,574 | |
| | | | | | | | |
| | | SHARES | | | FAIR
VALUE | |
| Pharmaceuticals, Biotechnology & Life Sciences - 1.3% (continued) | |
| Illumina, Inc. (b)(c) | | | 2,600 | | | $ | 243,126 | |
| Incyte Corp. Ltd. (b)(c) | | | 700 | | | | 27,300 | |
| Jazz Pharmaceuticals Plc. (a)(b)(c) | | | 800 | | | | 72,592 | |
| Johnson & Johnson (b) | | | 500 | | | | 46,305 | |
| Medivation, Inc. (b)(c) | | | 3,600 | | | | 215,496 | |
| Merck & Company, Inc. (b) | | | 4,300 | | | | 193,887 | |
| Pharmacyclics, Inc. (b)(c) | | | 1,700 | | | | 201,688 | |
| Questcor Pharmaceuticals, Inc. (b) | | | 3,900 | | | | 239,343 | |
| Regeneron Pharmaceuticals, Inc. (b)(c) | | | 700 | | | | 201,320 | |
| Theravance, Inc. (b)(c) | | | 4,900 | | | | 179,536 | |
| Thermo Fisher Scientific, Inc. (b) | | | 800 | | | | 78,224 | |
| Vertex Pharmaceuticals, Inc. (b)(c) | | | 2,900 | | | | 206,886 | |
| Zoetis, Inc. (b) | | | 6,400 | | | | 202,624 | |
| | | | | | | | |
| | | | | | | 4,961,961 | |
| | | | | | | | |
| Real Estate - 0.1% | | | | | | | | |
| Howard Hughes Corp. (b)(c) | | | 1,800 | | | | 210,690 | |
| | | | | | | | |
| | |
| Retailing - 1.8% | | | | | | | | |
| Abercrombie & Fitch Co. (b) | | | 5,900 | | | | 221,132 | |
| Amazon.com, Inc. (b)(c) | | | 700 | | | | 254,821 | |
| American Eagle Outfitters, Inc. (b) | | | 8,900 | | | | 137,861 | |
| AutoZone, Inc. (b)(c) | | | 500 | | | | 217,345 | |
| Bed Bath & Beyond, Inc. (b)(c) | | | 2,800 | | | | 216,496 | |
| Best Buy Co., Inc. (b) | | | 4,700 | | | | 201,160 | |
| CarMax, Inc. (b)(c) | | | 600 | | | | 28,194 | |
| Dillard’s, Inc. (b) | | | 400 | | | | 32,792 | |
| Dollar General Corp. (b)(c) | | | 2,900 | | | | 167,562 | |
| Dollar Tree, Inc. (b)(c) | | | 2,900 | | | | 169,360 | |
| DSW, Inc. (b) | | | 2,100 | | | | 184,107 | |
| Expedia, Inc. (b) | | | 5,000 | | | | 294,400 | |
| Family Dollar Stores, Inc. (b) | | | 2,500 | | | | 172,200 | |
| GameStop Corp. (b) | | | 4,625 | | | | 253,542 | |
| Genuine Parts Co. (b) | | | 600 | | | | 47,298 | |
| GNC Holdings, Inc. (b) | | | 3,800 | | | | 223,516 | |
| Groupon, Inc. (b)(c) | | | 15,100 | | | | 137,863 | |
| J.C. Penney Co., Inc. (b)(c) | | | 30,200 | | | | 226,500 | |
| LKQ Corp. (b)(c) | | | 800 | | | | 26,424 | |
| Lowe’s Cos., Inc. (b) | | | 4,900 | | | | 243,922 | |
| Lumber Liquidators Holdings, Inc. (b)(c) | | | 800 | | | | 91,352 | |
| Macy’s, Inc. (b) | | | 5,500 | | | | 253,605 | |
| Netflix, Inc. (b)(c) | | | 1,400 | | | | 451,472 | |
| Nordstrom, Inc. (b) | | | 100 | | | | 6,047 | |
| priceline.com, Inc. (b)(c) | | | 200 | | | | 210,766 | |
| Ross Stores, Inc. (b) | | | 2,300 | | | | 177,905 | |
| Sears Holdings Corp. (b)(c) | | | 3,400 | | | | 197,472 | |
| Signet Jewelers Ltd. (a)(b) | | | 400 | | | | 29,864 | |
| Staples, Inc. (b) | | | 11,600 | | | | 186,992 | |
| Target Corp. (b) | | | 2,900 | | | | 187,891 | |
| The Gap, Inc. (b) | | | 5,000 | | | | 184,950 | |
| The Home Depot, Inc. (b) | | | 2,800 | | | | 218,092 | |
| Tiffany & Co. (b) | | | 2,900 | | | | 229,593 | |
| TripAdvisor, Inc. (b)(c) | | | 3,900 | | | | 322,569 | |
| Urban Outfitters, Inc. (b)(c) | | | 4,700 | | | | 178,036 | |
| | | | | | | | |
| | | | | | | 6,383,101 | |
| | | | | | | | |
| | | | |
| | The accompanying footnotes are an integral part of these Schedules of Investments. | | (Continued) |
| | | | | | | | | | | | | | | | |
| 16 | | Stone Ridge Funds | | | | | | Annual Report | | | | | | October 2013 | | |
| | | | | | | | | | |
| | | | |
| Schedule of Investments | | | October 31, 2013 | |
| | |
| STONE RIDGE U.S. VARIANCE RISK PREMIUM FUND | | |
| | | | | | | | |
| | | SHARES | | | FAIR
VALUE | |
| Semiconductors & Semiconductor Equipment - 0.7% | |
| Advanced Micro Devices, Inc. (b)(c) | | | 10,000 | | | $ | 33,400 | |
| Analog Devices, Inc. (b) | | | 3,600 | | | | 177,480 | |
| Applied Materials, Inc. (b) | | | 7,000 | | | | 124,950 | |
| Avago Technologies Ltd. (b) | | | 3,600 | | | | 163,548 | |
| Broadcom Corp. (b) | | | 9,000 | | | | 240,480 | |
| First Solar, Inc. (b)(c) | | | 6,600 | | | | 331,782 | |
| Intel Corp. (b) | | | 7,800 | | | | 190,554 | |
| Linear Technology Corp. (b) | | | 4,400 | | | | 181,016 | |
| Marvell Technology Group Ltd. (a)(b) | | | 15,700 | | | | 188,400 | |
| Micron Technology, Inc. (b)(c) | | | 11,700 | | | | 206,856 | |
| NVIDIA Corp. (b) | | | 1,000 | | | | 15,180 | |
| Skyworks Solutions, Inc. (b)(c) | | | 6,300 | | | | 162,414 | |
| Texas Instruments, Inc. (b) | | | 5,500 | | | | 231,440 | |
| Xilinx, Inc. (b) | | | 3,000 | | | | 136,260 | |
| | | | | | | | |
| | | | | | | 2,383,760 | |
| | | | | | | | |
| Software & Services - 2.0% | | | | | | | | |
| Accenture PLC (a)(b) | | | 2,800 | | | | 205,800 | |
| Activision Blizzard, Inc. (b) | | | 10,800 | | | | 179,712 | |
| Adobe Systems, Inc. (b)(c) | | | 3,300 | | | | 178,860 | |
| Akamai Technologies, Inc. (b)(c) | | | 1,000 | | | | 44,740 | |
| Alliance Data Systems Corp. (b)(c) | | | 700 | | | | 165,942 | |
| Ansys, Inc. (b)(c) | | | 900 | | | | 78,705 | |
| Autodesk, Inc. (b)(c) | | | 5,000 | | | | 199,550 | |
| Automatic Data Processing, Inc. (b) | | | 200 | | | | 14,994 | |
| CommVault Systems, Inc. (b)(c) | | | 800 | | | | 62,464 | |
| Computer Sciences Corp. (b) | | | 3,400 | | | | 167,484 | |
| Concur Technologies, Inc. (b)(c) | | | 1,900 | | | | 198,740 | |
| eBay, Inc. (b)(c) | | | 3,300 | | | | 173,943 | |
| Electronic Arts, Inc. (b)(c) | | | 4,100 | | | | 107,625 | |
| Facebook, Inc. (b)(c) | | | 8,200 | | | | 412,132 | |
| Factset Research Systems, Inc. (b) | | | 300 | | | | 32,682 | |
| Fidelity National Information Systems, Inc. (b) | | | 600 | | | | 29,250 | |
| Fiserv, Inc. (b)(c) | | | 200 | | | | 20,946 | |
| Fleetcor Technologies, Inc. (b)(c) | | | 100 | | | | 11,535 | |
| Google, Inc. (b)(c) | | | 300 | | | | 309,174 | |
| Guidewire Software, Inc. (b)(c) | | | 3,591 | | | | 182,136 | |
| Informatica Corp. (b)(c) | | | 1,400 | | | | 54,040 | |
| International Business Machines Corp. (b) | | | 1,100 | | | | 197,131 | |
| Jack Henry & Associates, Inc. (b) | | | 500 | | | | 27,305 | |
| LinkedIn Corp. (b)(c) | | | 1,700 | | | | 380,239 | |
| MasterCard, Inc. (b) | | | 300 | | | | 215,130 | |
| Microsoft Corp. (b) | | | 4,600 | | | | 162,610 | |
| Oracle Corp. (b) | | | 4,000 | | | | 134,000 | |
| Pandora Media, Inc. (b)(c) | | | 9,500 | | | | 238,735 | |
| Rackspace Hosting, Inc. (b)(c) | | | 4,100 | | | | 210,043 | |
| Salesforce.com, Inc. (b)(c) | | | 3,500 | | | | 186,760 | |
| ServiceNow, Inc. (b)(c) | | | 3,500 | | | | 191,135 | |
| Splunk, Inc. (b)(c) | | | 2,769 | | | | 173,644 | |
| Symantec Corp. (b) | | | 9,300 | | | | 211,482 | |
| Tableau Software, Inc. (b)(c) | | | 2,700 | | | | 165,942 | |
| Teradata Corp. (b)(c) | | | 3,400 | | | | 149,838 | |
| TIBCO Software, Inc. (b)(c) | | | 4,700 | | | | 115,432 | |
| VeriSign, Inc. (b)(c) | | | 600 | | | | 32,568 | |
| Visa, Inc. (b) | | | 1,800 | | | | 354,006 | |
| VMware, Inc. (b)(c) | | | 4,300 | | | | 349,504 | |
| Workday, Inc. (b)(c) | | | 2,205 | | | | 165,088 | |
| | | | | | | | |
| | | SHARES | | | FAIR
VALUE | |
| Software & Services - 2.0% (continued) | | | | | |
| Yahoo, Inc. (b)(c) | | | 10,700 | | | $ | 352,351 | |
| Yelp, Inc. (b)(c) | | | 3,300 | | | | 223,575 | |
| Zillow, Inc. (b)(c) | | | 2,479 | | | | 197,403 | |
| Zynga, Inc. (b)(c) | | | 5,000 | | | | 17,950 | |
| | | | | | | | |
| | | | | | | 7,282,325 | |
| | | | | | | | |
| Technology Hardware & Equipment - 0.9% | | | | | |
| 3D Systems Corp. (b)(c) | | | 4,000 | | | | 248,960 | |
| Amphenol Corp. New (b) | | | 1,900 | | | | 152,551 | |
| Apple, Inc. (b) | | | 600 | | | | 313,410 | |
| Brocade Communications Systems, Inc. (b)(c) | | | 4,200 | | | | 33,684 | |
| Ciena Corp. (b)(c) | | | 6,511 | | | | 151,511 | |
| Cisco Systems, Inc. (b) | | | 6,000 | | | | 135,000 | |
| Corning, Inc. (b) | | | 11,000 | | | | 187,990 | |
| EMC Corp. (b) | | | 8,200 | | | | 197,374 | |
| F5 Networks, Inc. (b)(c) | | | 2,400 | | | | 195,624 | |
| Hewlett-Packard Co. (b) | | | 5,000 | | | | 121,850 | |
| JDS Uniphase Corp. (b)(c) | | | 2,000 | | | | 26,180 | |
| Juniper Networks, Inc. (b)(c) | | | 1,000 | | | | 18,640 | |
| Motorola Solutions, Inc. (b) | | | 3,400 | | | | 212,568 | |
| NetApp, Inc. (b) | | | 6,000 | | | | 232,860 | |
| Palo Alto Networks, Inc. (b)(c) | | | 4,000 | | | | 168,640 | |
| Qualcomm, Inc. (b) | | | 3,200 | | | | 222,304 | |
| SanDisk Corp. (b) | | | 3,000 | | | | 208,500 | |
| Stratasys Ltd. (a)(b)(c) | | | 2,000 | | | | 226,460 | |
| Western Digital Corp. (b) | | | 5,300 | | | | 369,039 | |
| | | | | | | | |
| | | | | | | 3,423,145 | |
| | | | | | | | |
| Telecommunication Services - 0.2% | | | | | | | | |
| AT&T, Inc. (b) | | | 2,900 | | | | 104,980 | |
| Crown Castle International Corp. (b)(c) | | | 2,300 | | | | 174,846 | |
| Sprint Corp. (b)(c) | | | 7,224 | | | | 48,618 | |
| T-Mobile US, Inc. (b)(c) | | | 8,800 | | | | 244,024 | |
| Verizon Communications, Inc. (b) | | | 3,400 | | | | 171,734 | |
| | | | | | | | |
| | | | | | | 744,202 | |
| | | | | | | | |
| Transportation - 0.5% | | | | | | | | |
| Alaska Air Group, Inc. (b) | | | 3,200 | | | | 226,112 | |
| Avis Budget Group Inc. (b)(c) | | | 5,200 | | | | 162,916 | |
| Copa Holdings SA (a) | | | 100 | | | | 14,954 | |
| CSX Corp. (b) | | | 1,600 | | | | 41,696 | |
| Delta Air Lines, Inc. (b) | | | 7,000 | | | | 184,660 | |
| FedEx Corp. (b) | | | 400 | | | | 52,400 | |
| Hertz Global Holdings, Inc. (b)(c) | | | 2,000 | | | | 45,920 | |
| Kansas City Southern (b) | | | 1,800 | | | | 218,736 | |
| Norfolk Southern Corp. (b) | | | 800 | | | | 68,816 | |
| Union Pacific Corp. (b) | | | 1,800 | | | | 272,520 | |
| United Continental Holdings, Inc. (b)(c) | | | 6,500 | | | | 220,675 | |
| United Parcel Service, Inc. (b) | | | 1,800 | | | | 176,832 | |
| US Airways Group, Inc. (b)(c) | | | 10,500 | | | | 230,685 | |
| | | | | | | | |
| | | | | | | 1,916,922 | |
| | | | | | | | |
| Utilities - 0.2% | | | | | | | | |
| CenterPoint Energy, Inc. (b) | | | 2,000 | | | | 49,200 | |
| Duke Energy Corp. (b) | | | 400 | | | | 28,692 | |
| ONEOK, Inc. (b) | | | 7,300 | | | | 412,450 | |
| | | | |
| | The accompanying footnotes are an integral part of these Schedules of Investments. | | (Continued) |
| | | | | | | | | | | | | | | | |
| | Stone Ridge Funds | | | | | | Annual Report | | | | | | October 2013 | | 17 |
| | | | | | | | | | |
| | | | |
| Schedule of Investments | | | October 31, 2013 | |
| | |
| STONE RIDGE U.S. VARIANCE RISK PREMIUM FUND | | |
| | | | | | | | |
| | | SHARES | | | FAIR
VALUE | |
| Utilities - 0.2% (continued) | | | | | | | | |
| Sempra Energy (b) | | | 300 | | | $ | 27,342 | |
| The Southern Co. (b) | | | 2,800 | | | | 114,548 | |
| | | | | | | | |
| | | | | | | 632,232 | |
| | | | | | | | |
TOTAL COMMON STOCKS
(Cost $62,118,256) | | | | | | | 65,476,011 | |
| | | | | | | | |
| REAL ESTATE INVESTMENT TRUSTS - 0.3% | | | | | |
| | |
| Real Estate - 0.3% | | | | | | | | |
| American Capital Agency Corp. | | | 8,000 | | | | 173,760 | |
| American Tower Corp. | | | 2,400 | | | | 190,440 | |
| Annaly Capital Management, Inc. | | | 12,600 | | | | 148,554 | |
| Boston Properties, Inc. | | | 100 | | | | 10,350 | |
| CommonWealth REIT | | | 7,000 | | | | 170,590 | |
| Digital Realty Trust, Inc. | | | 2,700 | | | | 128,682 | |
| Simon Property Group, Inc. (b) | | | 1,400 | | | | 216,370 | |
| Weyerhaeuser Co. | | | 1,000 | | | | 30,400 | |
| | | | | | | | |
| | | | | | | 1,069,146 | |
| | | | | | | | |
TOTAL REAL ESTATE INVESTMENT TRUSTS
(Cost $1,112,888) | | | | 1,069,146 | |
| | | | | | | | |
| INVESTMENT COMPANY - 0.0% | |
|
| Closed-End Mutual Fund - 0.0% | |
| American Capital Ltd. (c) | | | 800 | | | | 11,208 | |
| | | | | | | | |
TOTAL INVESTMENT COMPANY
(Cost $10,745) | | | | | | | 11,208 | |
| | | | | | | | |
| | |
| RIGHTS - 0.0% | | | | | | | | |
| | |
| Consumer Services - 0.0% | | | | | | | | |
Caesars Entertainment Corp. (Acquired 8/12/13) (c)(d) | | | 1,000 | | | | 8,640 | |
| | | | | | | | |
TOTAL RIGHTS
(Cost $0) | | | | | | | 8,640 | |
| | | | | | | | |
| SHORT-TERM INVESTMENTS - 81.2% | | | | | |
| | |
| Money Market Funds - 0.3% | | | | | | | | |
Fidelity Institutional Money Market Funds - Money Market
Portfolio - 0.04% (g) | | | 182,563 | | | | 182,563 | |
| First American Government Obligations Fund - Class Z - 0.01% (g) | | | 182,563 | | | | 182,563 | |
| | | | | | | | |
| | | SHARES | | | FAIR
VALUE | |
| Money Market Funds - 0.3% (continued) | | | | | |
| First American Prime Obligations Fund - Class Z - 0.02% (g) | | | 182,563 | | | $ | 182,563 | |
Short Term Investments Trust - Liquid Assets Portfolio - Institutional
Class - 0.02% (g) | | | 182,564 | | | | 182,564 | |
Short Term Investments Trust - Treasury Portfolio - Institutional
Class - 0.07% (g) | | | 182,564 | | | | 182,564 | |
| | | | | | | | |
| | | | | | | 912,817 | |
| | | | | | | | |
| | | PRINCIPAL
AMOUNT | | | | |
| U.S. Treasury Bills - 80.9% | | | | | | | | |
| 0.032%, 12/05/2013 (e)(f) | | $ | 40,000,000 | | | | 39,998,772 | |
| 0.032%, 12/12/2013 (e)(f) | | | 40,000,000 | | | | 39,998,519 | |
| 0.035%, 12/19/2013 (e)(f) | | | 40,000,000 | | | | 39,998,133 | |
| 0.025%, 01/09/2014 (e)(f) | | | 53,400,000 | | | | 53,397,331 | |
| 0.020%, 01/16/2014 (e)(f) | | | 40,000,000 | | | | 39,997,880 | |
| 0.025%, 01/23/2014 (e)(f) | | | 40,000,000 | | | | 39,996,760 | |
| 0.035%, 01/30/2014 (e)(f) | | | 40,000,000 | | | | 39,996,480 | |
| | | | | | | | |
| | | | | | | 293,383,875 | |
| | | | | | | | |
TOTAL SHORT-TERM INVESTMENTS
(Cost $294,298,188) | | | | | | | 294,296,692 | |
| | | | | | | | |
TOTAL INVESTMENTS
(Cost $357,540,077) - 99.6% | | | | | | | 360,861,697 | |
| | | | | | | | |
| OTHER ASSETS IN EXCESS OF LIABILITIES - 0.4% (h) | | | | | | | 1,402,750 | |
| | | | | | | | |
TOTAL NET ASSETS - 100.0% | | | | | | $ | 362,264,447 | |
| | | | | | | | |
Percentages are stated as a percent of net assets.
| (a) | Foreign issued security. Total foreign securities are $2,753,652 which represents 0.8% of net assets. |
| (b) | All or a portion of this security may be subject to call options written. |
| (c) | Non-income producing security. |
| (d) | Security is illiquid, restricted to resale and fair valued at October 31, 2013 using procedures approved by the Board of Trustees. The total value of positions fair valued was $8,640 or 0.0% of total net assets. |
| (e) | Rate shown is the effective yield based on purchased price. The calculation assumes the security is held to maturity. |
| (f) | All or a portion of this security is held as collateral for put options written. |
| (g) | Rate shown is the 7-day effective yield. |
| (h) | $1,230,000 is posted as initial margin on futures contracts. |
| | | | |
| | The accompanying footnotes are an integral part of these Schedules of Investments. | | (Continued) |
| | | | | | | | | | | | | | | | |
| 18 | | Stone Ridge Funds | | | | | | Annual Report | | | | | | October 2013 | | |
| | | | | | | | | | |
| | | | |
| Schedule of Investments | | | October 31, 2013 | |
| | |
| STONE RIDGE U.S. VARIANCE RISK PREMIUM FUND | | |
Written Options
| | | | | | | | |
DESCRIPTION | | CONTRACTS | | | FAIR
VALUE | |
| | |
| CALL OPTIONS | | | | | | | | |
| 3D Systems Corp., Expires 11/08/2013, Strike Price $67.00 | | | 9 | | | $ | 315 | |
| 3D Systems Corp., Expires 11/08/2013, Strike Price $70.00 | | | 20 | | | | 100 | |
| 3M Co., Expires 11/01/2013, Strike Price $128.00 | | | 6 | | | | 9 | |
| 3M Co., Expires 11/08/2013, Strike Price $129.00 | | | 5 | | | | 55 | |
| 3M Co., Expires 11/16/2013, Strike Price $130.00 | | | 3 | | | | 53 | |
| Abercrombie & Fitch Co., Expires 11/01/2013, Strike Price $37.00 | | | 1 | | | | 57 | |
| Abercrombie & Fitch Co., Expires 11/01/2013, Strike Price $39.00 | | | 2 | | | | 4 | |
| Abercrombie & Fitch Co., Expires 11/08/2013, Strike Price $37.00 | | | 8 | | | | 1,476 | |
| Abercrombie & Fitch Co., Expires 11/08/2013, Strike Price $38.00 | | | 8 | | | | 1,052 | |
| Abercrombie & Fitch Co., Expires 11/08/2013, Strike Price $39.00 | | | 8 | | | | 724 | |
| Abercrombie & Fitch Co., Expires 11/08/2013, Strike Price $40.00 | | | 18 | | | | 1,080 | |
| Abercrombie & Fitch Co., Expires 11/08/2013, Strike Price $41.00 | | | 3 | | | | 111 | |
| Accenture PLC, Expires 11/01/2013, Strike Price $79.00 | | | 28 | | | | 70 | |
| Actavis Plc, Expires 11/16/2013, Strike Price $170.00 | | | 11 | | | | 55 | |
| Activision Blizzard, Inc., Expires 11/01/2013, Strike Price $19.00 | | | 11 | | | | 22 | |
| Adobe Systems, Inc., Expires 11/16/2013, Strike Price $60.00 | | | 33 | | | | 99 | |
| Advanced Micro Devices, Inc., Expires 11/16/2013, Strike Price $4.00 | | | 10 | | | | 15 | |
| Air Products & Chemicals, Inc., Expires 11/16/2013, Strike Price $115.00 | | | 6 | | | | 60 | |
| Akamai Technologies, Inc., Expires 11/16/2013, Strike Price $52.50 | | | 2 | | | | 13 | |
| Akamai Technologies, Inc., Expires 11/16/2013, Strike Price $55.00 | | | 2 | | | | 7 | |
| Alaska Air Group, Inc., Expires 11/16/2013, Strike Price $75.00 | | | 4 | | | | 100 | |
| Alaska Air Group, Inc., Expires 11/16/2013, Strike Price $80.00 | | | 4 | | | | 20 | |
| Alcoa, Inc., Expires 11/01/2013, Strike Price $10.00 | | | 30 | | | | 30 | |
| Alcoa, Inc., Expires 11/16/2013, Strike Price $10.00 | | | 60 | | | | 330 | |
| Alcoa, Inc., Expires 11/16/2013, Strike Price $11.00 | | | 50 | | | | 75 | |
| Alexion Pharmaceuticals, Inc., Expires 11/01/2013, Strike Price $130.00 | | | 6 | | | | 75 | |
| Alexion Pharmaceuticals, Inc., Expires 11/16/2013, Strike Price $140.00 | | | 7 | | | | 193 | |
| Alexion Pharmaceuticals, Inc., Expires 11/22/2013, Strike Price $145.00 | | | 1 | | | | 23 | |
| Allegheny Technologies, Inc., Expires 11/16/2013, Strike Price $37.50 | | | 12 | | | | 60 | |
| Allergan, Inc./United States, Expires 11/16/2013, Strike Price $95.00 | | | 19 | | | | 285 | |
| Alliance Data Systems Corp., Expires 11/16/2013, Strike Price $250.00 | | | 7 | | | | 158 | |
| Amazon.com, Inc., Expires 11/16/2013, Strike Price $405.00 | | | 1 | | | | 32 | |
| Amazon.com, Inc., Expires 11/16/2013, Strike Price $410.00 | | | 1 | | | | 22 | |
| Amazon.com, Inc., Expires 11/16/2013, Strike Price $415.00 | | | 1 | | | | 16 | |
| Amazon.com, Inc., Expires 11/16/2013, Strike Price $425.00 | | | 2 | | | | 20 | |
| American Eagle Outfitters, Inc., Expires 11/16/2013, Strike Price $16.00 | | | 50 | | | | 3,125 | |
| American Eagle Outfitters, Inc., Expires 11/16/2013, Strike Price $17.00 | | | 29 | | | | 1,015 | �� |
| American Eagle Outfitters, Inc., Expires 11/16/2013, Strike Price $87.50 | | | 17 | | | | 51 | |
| Amgen, Inc., Expires 11/01/2013, Strike Price $124.00 | | | 3 | | | | 5 | |
| Amgen, Inc., Expires 11/08/2013, Strike Price $124.00 | | | 5 | | | | 30 | |
| Amgen, Inc., Expires 11/08/2013, Strike Price $125.00 | | | 3 | | | | 17 | |
| Amgen, Inc., Expires 11/16/2013, Strike Price $130.00 | | | 4 | | | | 6 | |
| Amphenol Corp., Expires 11/16/2013, Strike Price $85.00 | | | 15 | | | | 150 | |
| Anadarko Petroleum Corp., Expires 11/01/2013, Strike Price $100.00 | | | 10 | | | | 25 | |
| Anadarko Petroleum Corp., Expires 11/01/2013, Strike Price $101.00 | | | 9 | | | | 23 | |
| Analog Devices, Inc., Expires 11/16/2013, Strike Price $49.00 | | | 24 | | | | 2,040 | |
| Analog Devices, Inc., Expires 11/16/2013, Strike Price $50.00 | | | 12 | | | | 420 | |
| Apache Corp., Expires 11/01/2013, Strike Price $93.00 | | | 17 | | | | 43 | |
| Apache Corp., Expires 11/01/2013, Strike Price $94.00 | | | 3 | | | | 5 | |
| Apple, Inc., Expires 11/01/2013, Strike Price $550.00 | | | 1 | | | | 3 | |
| Apple, Inc., Expires 11/01/2013, Strike Price $560.00 | | | 1 | | | | 3 | |
| Apple, Inc., Expires 11/08/2013, Strike Price $560.00 | | | 1 | | | | 38 | |
| Apple, Inc., Expires 11/08/2013, Strike Price $580.00 | | | 1 | | | | 16 | |
| Apple, Inc., Expires 11/16/2013, Strike Price $560.00 | | | 1 | | | | 106 | |
| Apple, Inc., Expires 11/16/2013, Strike Price $565.00 | | | 1 | | | | 80 | |
| | | | |
| | The accompanying footnotes are an integral part of these Schedules of Investments. | | (Continued) |
| | | | | | | | | | | | | | | | |
| | Stone Ridge Funds | | | | | | Annual Report | | | | | | October 2013 | | 19 |
| | | | | | | | | | |
| | | | |
| Schedule of Investments | | | October 31, 2013 | |
| | |
| STONE RIDGE U.S. VARIANCE RISK PREMIUM FUND | | |
| | | | | | | | |
DESCRIPTION | | CONTRACTS | | | FAIR
VALUE | |
| Archer-Daniels-Midland Co., Expires 11/16/2013, Strike Price $43.00 | | | 7 | | | $ | 126 | |
| Archer-Daniels-Midland Co., Expires 11/16/2013, Strike Price $44.00 | | | 28 | | | | 224 | |
| Archer-Daniels-Midland Co., Expires 11/16/2013, Strike Price $45.00 | | | 7 | | | | 28 | |
| AT&T, Inc., Expires 11/16/2013, Strike Price $38.00 | | | 5 | | | | 25 | |
| AT&T, Inc., Expires 11/22/2013, Strike Price $39.00 | | | 16 | | | | 48 | |
| AutoZone, Inc., Expires 11/16/2013, Strike Price $460.00 | | | 3 | | | | 60 | |
| AutoZone, Inc., Expires 11/16/2013, Strike Price $470.00 | | | 1 | | | | 8 | |
| Avago Technologies Ltd., Expires 11/16/2013, Strike Price $50.00 | | | 36 | | | | 270 | |
| Baker Hughes, Inc., Expires 11/16/2013, Strike Price $62.50 | | | 10 | | | | 60 | |
| Bank of America Corp., Expires 11/08/2013, Strike Price $15.50 | | | 10 | | | | 5 | |
| Bank of America Corp., Expires 11/16/2013, Strike Price $15.00 | | | 10 | | | | 25 | |
| Bank of America Corp., Expires 11/22/2013, Strike Price $34.50 | | | 9 | | | | 22 | |
| Baxter International, Inc., Expires 11/16/2013, Strike Price $75.00 | | | 5 | | | | 8 | |
| Bed Bath & Beyond, Inc., Expires 11/16/2013, Strike Price $82.50 | | | 7 | | | | 74 | |
| Bed Bath & Beyond, Inc., Expires 11/16/2013, Strike Price $85.00 | | | 7 | | | | 18 | |
| Bed Bath & Beyond, Inc., Expires 11/16/2013, Strike Price $87.50 | | | 9 | | | | 23 | |
| Best Buy Co., Inc., Expires 11/16/2013, Strike Price $48.00 | | | 7 | | | | 60 | |
| Best Buy Co., Inc., Expires 11/16/2013, Strike Price $49.00 | | | 26 | | | | 104 | |
| Best Buy Co., Inc., Expires 11/16/2013, Strike Price $50.00 | | | 7 | | | | 21 | |
| Biogen Idec, Inc., Expires 11/16/2013, Strike Price $270.00 | | | 1 | | | | 39 | |
| Biogen Idec, Inc., Expires 11/22/2013, Strike Price $280.00 | | | 3 | | | | 645 | |
| Biogen Idec, Inc., Expires 11/22/2013, Strike Price $295.00 | | | 1 | | | | 95 | |
| Biogen Idec, Inc., Expires 11/22/2013, Strike Price $300.00 | | | 2 | | | | 125 | |
| Biomarin Pharmaceutical, Inc., Expires 11/16/2013, Strike Price $70.00 | | | 6 | | | | 420 | |
| Biomarin Pharmaceutical, Inc., Expires 11/16/2013, Strike Price $75.00 | | | 18 | | | | 540 | |
| BlackRock, Inc., Expires 11/16/2013, Strike Price $330.00 | | | 3 | | | | 37 | |
| BlackRock, Inc., Expires 11/16/2013, Strike Price $340.00 | | | 2 | | | | 40 | |
| BlackRock, Inc., Expires 11/16/2013, Strike Price $350.00 | | | 1 | | | | 20 | |
| Boeing Co., Expires 11/01/2013, Strike Price $135.00 | | | 3 | | | | 6 | |
| Boeing Co., Expires 11/16/2013, Strike Price $140.00 | | | 1 | | | | 9 | |
| Boeing Co., Expires 11/16/2013, Strike Price $145.00 | | | 9 | | | | 23 | |
| Boston Scientific Corp., Expires 11/16/2013, Strike Price $13.00 | | | 10 | | | | 10 | |
| Bristol-Myers Squibb Co., Expires 11/01/2013, Strike Price $51.00 | | | 12 | | | | 1,836 | |
| Bristol-Myers Squibb Co., Expires 11/08/2013, Strike Price $52.00 | | | 11 | | | | 1,050 | |
| Bristol-Myers Squibb Co., Expires 11/08/2013, Strike Price $55.00 | | | 1 | | | | 7 | |
| Bristol-Myers Squibb Co., Expires 11/16/2013, Strike Price $52.50 | | | 6 | | | | 537 | |
| Bristol-Myers Squibb Co., Expires 11/16/2013, Strike Price $55.00 | | | 6 | | | | 105 | |
| Broadcom Corp., Expires 11/01/2013, Strike Price $27.50 | | | 30 | | | | 45 | |
| Broadcom Corp., Expires 11/16/2013, Strike Price $29.00 | | | 37 | | | | 259 | |
| Brocade Communications Systems, Inc., Expires 11/16/2013, Strike Price $9.00 | | | 42 | | | | 126 | |
| Caesars Entertainment Corp., Expires 11/16/2013, Strike Price $20.00 | | | 5 | | | | 100 | |
| Capital One Financial Corp., Expires 11/16/2013, Strike Price $75.00 | | | 2 | | | | 4 | |
| Capital One Financial Corp., Expires 11/16/2013, Strike Price $77.50 | | | 19 | | | | 28 | |
| Casey’s General Stores, Inc., Expires 11/16/2013, Strike Price $77.50 | | | 2 | | | | 70 | |
| Caterpillar, Inc., Expires 11/01/2013, Strike Price $88.00 | | | 4 | | | | 2 | |
| Caterpillar, Inc., Expires 11/08/2013, Strike Price $90.00 | | | 12 | | | | 6 | |
| Caterpillar, Inc., Expires 11/08/2013, Strike Price $91.00 | | | 4 | | | | 4 | |
| CBOE S&P 500, Expires 11/01/2013, Strike Price $1775.00 | | | 150 | | | | 3,750 | |
| CBOE S&P 500, Expires 11/01/2013, Strike Price $1780.00 | | | 10 | | | | 100 | |
| CBOE S&P 500, Expires 11/01/2013, Strike Price $1785.00 | | | 5 | | | | 38 | |
| Celanese Corp., Expires 11/16/2013, Strike Price $62.50 | | | 28 | | | | 140 | |
| Celgene Corp., Expires 11/08/2013, Strike Price $180.00 | | | 2 | | | | 11 | |
| Celgene Corp., Expires 11/16/2013, Strike Price $170.00 | | | 2 | | | | 43 | |
| Celgene Corp., Expires 11/16/2013, Strike Price $175.00 | | | 2 | | | | 18 | |
| Celgene Corp., Expires 11/16/2013, Strike Price $180.00 | | | 2 | | | | 14 | |
| Celgene Corp., Expires 11/16/2013, Strike Price $185.00 | | | 4 | | | | 16 | |
| CF Industries Holdings, Inc., Expires 11/01/2013, Strike Price $220.00 | | | 8 | | | | 84 | |
| Chesapeake Energy Corp., Expires 11/01/2013, Strike Price $28.00 | | | 2 | | | | 30 | |
| | | | |
| | The accompanying footnotes are an integral part of these Schedules of Investments. | | (Continued) |
| | | | | | | | | | | | | | | | |
| 20 | | Stone Ridge Funds | | | | | | Annual Report | | | | | | October 2013 | | |
| | | | | | | | | | |
| | | | |
| Schedule of Investments | | | October 31, 2013 | |
| | |
| STONE RIDGE U.S. VARIANCE RISK PREMIUM FUND | | |
| | | | | | | | |
DESCRIPTION | | CONTRACTS | | | FAIR
VALUE | |
| Chesapeake Energy Corp., Expires 11/01/2013, Strike Price $30.00 | | | 48 | | | $ | 48 | |
| Chipotle Mexican Grill, Inc., Expires 11/01/2013, Strike Price $570.00 | | | 4 | | | | 20 | |
| Ciena Corp., Expires 11/16/2013, Strike Price $31.00 | | | 40 | | | | 80 | |
| Ciena Corp., Expires 11/16/2013, Strike Price $32.00 | | | 25 | | | | 50 | |
| Cisco Systems, Inc., Expires 11/01/2013, Strike Price $23.00 | | | 30 | | | | 15 | |
| Cisco Systems, Inc., Expires 11/08/2013, Strike Price $23.50 | | | 8 | | | | 24 | |
| Cisco Systems, Inc., Expires 11/08/2013, Strike Price $24.00 | | | 2 | | | | 3 | |
| Cisco Systems, Inc., Expires 11/08/2013, Strike Price $25.00 | | | 10 | | | | 10 | |
| CIT Group, Inc., Expires 11/16/2013, Strike Price $52.50 | | | 36 | | | | 162 | |
| Citigroup, Inc., Expires 11/01/2013, Strike Price $53.50 | | | 12 | | | | 6 | |
| Citigroup, Inc., Expires 11/01/2013, Strike Price $54.00 | | | 6 | | | | 3 | |
| Citigroup, Inc., Expires 11/08/2013, Strike Price $54.00 | | | 18 | | | | 18 | |
| Citigroup, Inc., Expires 11/08/2013, Strike Price $55.00 | | | 6 | | | | 6 | |
| Cliffs Natural Resources, Inc., Expires 11/16/2013, Strike Price $28.00 | | | 10 | | | | 195 | |
| Cliffs Natural Resources, Inc., Expires 11/22/2013, Strike Price $29.00 | | | 61 | | | | 1,037 | |
| Cobalt International Energy, Inc., Expires 11/16/2013, Strike Price $27.50 | | | 2 | | | | 20 | |
| Coca-Cola Co., Expires 11/01/2013, Strike Price $40.00 | | | 28 | | | | 56 | |
| Coca-Cola Co., Expires 11/08/2013, Strike Price $40.00 | | | 7 | | | | 105 | |
| Coca-Cola Co., Expires 11/08/2013, Strike Price $40.50 | | | 7 | | | | 35 | |
| Coca-Cola Co., Expires 11/16/2013, Strike Price $41.00 | | | 3 | | | | 18 | |
| Colfax Corp., Expires 11/16/2013, Strike Price $60.00 | | | 3 | | | | 37 | |
| Colgate-Palmolive Co., Expires 11/16/2013, Strike Price $67.50 | | | 2 | | | | 15 | |
| Comerica, Inc., Expires 11/16/2013, Strike Price $46.00 | | | 7 | | | | 38 | |
| CommVault Systems, Inc., Expires 11/16/2013, Strike Price $87.50 | | | 4 | | | | 60 | |
| CONSOL Energy, Inc., Expires 11/16/2013, Strike Price $40.00 | | | 26 | | | | 156 | |
| CONSOL Energy, Inc., Expires 11/16/2013, Strike Price $42.00 | | | 8 | | | | 8 | |
| Constellation Brands, Inc., Expires 11/16/2013, Strike Price $70.00 | | | 27 | | | | 270 | |
| Cooper Cos, Inc., Expires 11/16/2013, Strike Price $135.00 | | | 3 | | | | 135 | |
| Cooper Cos, Inc., Expires 11/16/2013, Strike Price $140.00 | | | 10 | | | | 150 | |
| Costco Wholesale Corp., Expires 11/01/2013, Strike Price $122.00 | | | 1 | | | | 5 | |
| Costco Wholesale Corp., Expires 11/01/2013, Strike Price $123.00 | | | 7 | | | | 7 | |
| Costco Wholesale Corp., Expires 11/08/2013, Strike Price $120.00 | | | 6 | | | | 183 | |
| Costco Wholesale Corp., Expires 11/08/2013, Strike Price $125.00 | | | 1 | | | | 4 | |
| Crown Holdings, Inc., Expires 11/16/2013, Strike Price $42.00 | | | 17 | | | | 3,060 | |
| Crown Holdings, Inc., Expires 11/16/2013, Strike Price $43.00 | | | 21 | | | | 2,152 | |
| Crown Holdings, Inc., Expires 11/16/2013, Strike Price $44.00 | | | 5 | | | | 262 | |
| Crown Holdings, Inc., Expires 11/16/2013, Strike Price $80.00 | | | 23 | | | | 287 | |
| CSX Corp., Expires 11/16/2013, Strike Price $27.50 | | | 16 | | | | 56 | |
| Cubist Pharmaceuticals, Inc., Expires 11/16/2013, Strike Price $70.00 | | | 10 | | | | 250 | |
| Cubist Pharmaceuticals, Inc., Expires 11/16/2013, Strike Price $75.00 | | | 5 | | | | 25 | |
| Cummins, Inc., Expires 11/08/2013, Strike Price $134.00 | | | 3 | | | | 15 | |
| Cummins, Inc., Expires 11/22/2013, Strike Price $140.00 | | | 6 | | | | 30 | |
| Cummins, Inc., Expires 11/22/2013, Strike Price $141.00 | | | 6 | | | | 30 | |
| Cytec Industries, Inc., Expires 11/16/2013, Strike Price $90.00 | | | 21 | | | | 158 | |
| Darden Restaurants, Inc., Expires 11/16/2013, Strike Price $60.00 | | | 6 | | | | 15 | |
| Deere & Co., Expires 11/01/2013, Strike Price $84.00 | | | 1 | | | | 3 | |
| Deere & Co., Expires 11/01/2013, Strike Price $85.00 | | | 4 | | | | 8 | |
| Deere & Co., Expires 11/01/2013, Strike Price $86.00 | | | 4 | | | | 6 | |
| Deere & Co., Expires 11/16/2013, Strike Price $87.50 | | | 5 | | | | 27 | |
| Deere & Co., Expires 11/16/2013, Strike Price $90.00 | | | 3 | | | | 4 | |
| Deere & Co., Expires 11/16/2013, Strike Price $92.50 | | | 4 | | | | 4 | |
| Delta Air Lines, Inc., Expires 11/08/2013, Strike Price $28.00 | | | 20 | | | | 80 | |
| Delta Air Lines, Inc., Expires 11/08/2013, Strike Price $28.50 | | | 10 | | | | 10 | |
| Delta Air Lines, Inc., Expires 11/08/2013, Strike Price $29.00 | | | 10 | | | | 5 | |
| Delta Air Lines, Inc., Expires 11/16/2013, Strike Price $29.00 | | | 10 | | | | 40 | |
| Delta Air Lines, Inc., Expires 11/16/2013, Strike Price $30.00 | | | 10 | | | | 10 | |
| Devon Energy Corp., Expires 11/01/2013, Strike Price $67.50 | | | 15 | | | | 22 | |
| Devon Energy Corp., Expires 11/01/2013, Strike Price $68.00 | | | 10 | | | | 15 | |
| | | | |
| | The accompanying footnotes are an integral part of these Schedules of Investments. | | (Continued) |
| | | | | | | | | | | | | | | | |
| | Stone Ridge Funds | | | | | | Annual Report | | | | | | October 2013 | | 21 |
| | | | | | | | | | |
| | | | |
| Schedule of Investments | | | October 31, 2013 | |
| | |
| STONE RIDGE U.S. VARIANCE RISK PREMIUM FUND | | |
| | | | | | | | |
DESCRIPTION | | CONTRACTS | | | FAIR
VALUE | |
| DISH Network Corp., Expires 11/01/2013, Strike Price $50.50 | | | 1 | | | $ | 2 | |
| DISH Network Corp., Expires 11/01/2013, Strike Price $52.00 | | | 6 | | | | 15 | |
| DISH Network Corp., Expires 11/01/2013, Strike Price $52.50 | | | 10 | | | | 25 | |
| DISH Network Corp., Expires 11/01/2013, Strike Price $53.00 | | | 7 | | | | 17 | |
| DISH Network Corp., Expires 11/01/2013, Strike Price $56.00 | | | 12 | | | | 30 | |
| Dollar General Corp., Expires 11/16/2013, Strike Price $65.00 | | | 29 | | | | 72 | |
| Dollar Tree, Inc., Expires 11/16/2013, Strike Price $67.50 | | | 29 | | | | 145 | |
| Dow Chemical Co., Expires 11/01/2013, Strike Price $41.00 | | | 7 | | | | 3 | |
| Dow Chemical Co., Expires 11/16/2013, Strike Price $43.00 | | | 14 | | | | 49 | |
| DSW, Inc., Expires 11/16/2013, Strike Price $85.00 | | | 21 | | | | 6,615 | |
| Eastman Chemical Co., Expires 11/16/2013, Strike Price $82.50 | | | 6 | | | | 270 | |
| Eastman Chemical Co., Expires 11/16/2013, Strike Price $85.00 | | | 7 | | | | 122 | |
| Eastman Chemical Co., Expires 11/16/2013, Strike Price $87.50 | | | 9 | | | | 45 | |
| eBay, Inc., Expires 11/16/2013, Strike Price $57.50 | | | 28 | | | | 126 | |
| EI Du Pont De Nemours & Co., Expires 11/01/2013, Strike Price $63.50 | | | 5 | | | | 5 | |
| EI Du Pont De Nemours & Co., Expires 11/01/2013, Strike Price $64.00 | | | 8 | | | | 8 | |
| EI Du Pont De Nemours & Co., Expires 11/08/2013, Strike Price $64.50 | | | 10 | | | | 15 | |
| EI Du Pont De Nemours & Co., Expires 11/16/2013, Strike Price $65.00 | | | 5 | | | | 8 | |
| Electronic Arts, Inc., Expires 11/16/2013, Strike Price $30.00 | | | 30 | | | | 90 | |
| EMC Corp., Expires 11/16/2013, Strike Price $26.00 | | | 30 | | | | 75 | |
| EOG Resources, Inc., Expires 11/01/2013, Strike Price $195.00 | | | 12 | | | | 24 | |
| EOG Resources, Inc., Expires 11/01/2013, Strike Price $200.00 | | | 2 | | | | 13 | |
| Express Scripts Holding Co., Expires 11/16/2013, Strike Price $67.50 | | | 5 | | | | 27 | |
| Express Scripts Holding Co., Expires 11/16/2013, Strike Price $70.00 | | | 13 | | | | 26 | |
| Express Scripts Holding Co., Expires 11/16/2013, Strike Price $72.50 | | | 10 | | | | 10 | |
| F5 Networks, Inc., Expires 11/01/2013, Strike Price $93.00 | | | 4 | | | | 8 | |
| F5 Networks, Inc., Expires 11/01/2013, Strike Price $94.00 | | | 4 | | | | 8 | |
| F5 Networks, Inc., Expires 11/01/2013, Strike Price $95.00 | | | 4 | | | | 6 | |
| F5 Networks, Inc., Expires 11/01/2013, Strike Price $97.00 | | | 8 | | | | 8 | |
| Factset Research Systems, Inc., Expires 11/16/2013, Strike Price $115.00 | | | 1 | | | | 15 | |
| Factset Research Systems, Inc., Expires 11/16/2013, Strike Price $120.00 | | | 1 | | | | 2 | |
| Family Dollar Stores, Inc., Expires 11/16/2013, Strike Price $75.00 | | | 1 | | | | 22 | |
| Family Dollar Stores, Inc., Expires 11/16/2013, Strike Price $80.00 | | | 16 | | | | 160 | |
| Family Dollar Stores, Inc., Expires 11/16/2013, Strike Price $82.50 | | | 8 | | | | 60 | |
| FedEx Corp., Expires 11/16/2013, Strike Price $145.00 | | | 4 | | | | 32 | |
| Ford Motor Co., Expires 11/08/2013, Strike Price $18.50 | | | 11 | | | | 5 | |
| Freeport-McMoRan Copper & Gold, Inc., Expires 11/16/2013, Strike Price $40.00 | | | 39 | | | | 136 | |
| Freeport-McMoRan Copper & Gold, Inc., Expires 11/01/2013, Strike Price $39.00 | | | 8 | | | | 4 | |
| GameStop Corp., Expires 11/01/2013, Strike Price $58.50 | | | 15 | | | | 15 | |
| GameStop Corp., Expires 11/01/2013, Strike Price $59.00 | | | 15 | | | | 15 | |
| GameStop Corp., Expires 11/01/2013, Strike Price $60.00 | | | 2 | | | | 2 | |
| Gap, Inc., Expires 11/16/2013, Strike Price $40.00 | | | 8 | | | | 88 | |
| Gap, Inc., Expires 11/16/2013, Strike Price $41.00 | | | 38 | | | | 190 | |
| Gap, Inc., Expires 11/16/2013, Strike Price $42.00 | | | 1 | | | | 2 | |
| General Dynamics Corp., Expires 11/16/2013, Strike Price $28.00 | | | 10 | | | | 25 | |
| General Dynamics Corp., Expires 11/16/2013, Strike Price $52.50 | | | 13 | | | | 46 | |
| General Dynamics Corp., Expires 11/22/2013, Strike Price $28.00 | | | 57 | | | | 200 | |
| Genuine Parts Co., Expires 11/16/2013, Strike Price $85.00 | | | 6 | | | | 30 | |
| Gilead Sciences, Inc., Expires 11/08/2013, Strike Price $77.00 | | | 18 | | | | 54 | |
| Gilead Sciences, Inc., Expires 11/16/2013, Strike Price $80.00 | | | 4 | | | | 12 | |
| GNC Holdings, Inc., Expires 11/16/2013, Strike Price $62.50 | | | 1 | | | | 15 | |
| GNC Holdings, Inc. Expires 11/16/2013, Strike Price $65.00 | | | 29 | | | | 72 | |
| Goldman Sachs Group, Inc., Expires 11/01/2013, Strike Price $170.00 | | | 2 | | | | 4 | |
| Goldman Sachs Group, Inc., Expires 11/01/2013, Strike Price $175.00 | | | 10 | | | | 15 | |
| Google, Inc., Expires 11/01/2013, Strike Price $1140.00 | | | 1 | | | | 2 | |
| Green Mountain Coffee Roasters, Inc., Expires 11/01/2013, Strike Price $71.50 | | | 5 | | | | 10 | |
| Green Mountain Coffee Roasters, Inc., Expires 11/01/2013, Strike Price $77.00 | | | 4 | | | | 8 | |
| Green Mountain Coffee Roasters, Inc., Expires 11/01/2013, Strike Price $78.00 | | | 1 | | | | 2 | |
| | | | |
| | The accompanying footnotes are an integral part of these Schedules of Investments. | | (Continued) |
| | | | | | | | | | | | | | | | |
| 22 | | Stone Ridge Funds | | | | | | Annual Report | | | | | | October 2013 | | |
| | | | | | | | | | |
| | | | |
| Schedule of Investments | | | October 31, 2013 | |
| | |
| STONE RIDGE U.S. VARIANCE RISK PREMIUM FUND | | |
| | | | | | | | |
DESCRIPTION | | CONTRACTS | | | FAIR
VALUE | |
| Green Mountain Coffee Roasters, Inc., Expires 11/01/2013, Strike Price $81.00 | | | 1 | | | $ | 2 | |
| Green Mountain Coffee Roasters, Inc., Expires 11/01/2013, Strike Price $88.00 | | | 1 | | | | 2 | |
| Green Mountain Coffee Roasters, Inc., Expires 11/08/2013, Strike Price $70.00 | | | 5 | | | | 98 | |
| Green Mountain Coffee Roasters, Inc., Expires 11/08/2013, Strike Price $71.50 | | | 5 | | | | 63 | |
| Green Mountain Coffee Roasters, Inc., Expires 11/08/2013, Strike Price $73.00 | | | 1 | | | | 8 | |
| Green Mountain Coffee Roasters, Inc., Expires 11/08/2013, Strike Price $80.00 | | | 1 | | | | 3 | |
| Green Mountain Coffee Roasters, Inc., Expires 11/08/2013, Strike Price $81.00 | | | 1 | | | | 2 | |
| Green Mountain Coffee Roasters, Inc., Expires 11/16/2013, Strike Price $72.50 | | | 5 | | | | 162 | |
| Guidewire Software, Inc., Expires 11/16/2013, Strike Price $55.00 | | | 35 | | | | 437 | |
| Halliburton Co., Expires 11/01/2013, Strike Price $55.00 | | | 2 | | | | 2 | |
| Halliburton Co., Expires 11/16/2013, Strike Price $55.00 | | | 32 | | | | 1,088 | |
| Harley-Davidson, Inc., Expires 11/16/2013, Strike Price $70.00 | | | 2 | | | | 11 | |
| Hartford Financial Services Group, Inc., Expires 11/16/2013, Strike Price $36.00 | | | 8 | | | | 32 | |
| Herbalife Ltd., Expires 11/01/2013, Strike Price $70.50 | | | 7 | | | | 28 | |
| Herbalife Ltd., Expires 11/01/2013, Strike Price $71.00 | | | 2 | | | | 7 | |
| Herbalife Ltd., Expires 11/01/2013, Strike Price $74.00 | | | 4 | | | | 18 | |
| Herbalife Ltd., Expires 11/01/2013, Strike Price $76.00 | | | 4 | | | | 2 | |
| Herbalife Ltd., Expires 11/08/2013, Strike Price $73.50 | | | 4 | | | | 26 | |
| Herbalife Ltd., Expires 11/08/2013, Strike Price $74.00 | | | 7 | | | | 38 | |
| Herbalife Ltd., Expires 11/08/2013, Strike Price $74.50 | | | 3 | | | | 16 | |
| Herbalife Ltd., Expires 11/22/2013, Strike Price $77.00 | | | 1 | | | | 33 | |
| Hershey Co., Expires 11/16/2013, Strike Price $105.00 | | | 2 | | | | 12 | |
| Hewlett-Packard Co., Expires 11/16/2013, Strike Price $27.00 | | | 14 | | | | 28 | |
| Home Depot, Inc., Expires 11/01/2013, Strike Price $78.00 | | | 4 | | | | 98 | |
| Home Depot, Inc., Expires 11/01/2013, Strike Price $79.00 | | | 8 | | | | 24 | |
| Home Depot, Inc., Expires 11/01/2013, Strike Price $80.00 | | | 4 | | | | 4 | |
| Home Depot, Inc., Expires 11/08/2013, Strike Price $79.00 | | | 4 | | | | 136 | |
| Home Depot, Inc., Expires 11/08/2013, Strike Price $80.00 | | | 3 | | | | 43 | |
| Honeywell International, Inc., Expires 11/16/2013, Strike Price $92.50 | | | 4 | | | | 10 | |
| Illumina, Inc., Expires 11/16/2013, Strike Price $105.00 | | | 19 | | | | 142 | |
| Informatica Corp., Expires 11/16/2013, Strike Price $42.50 | | | 6 | | | | 90 | |
| Informatica Corp., Expires 11/16/2013, Strike Price $45.00 | | | 1 | | | | 5 | |
| International Business Machines Corp., Expires 11/01/2013, Strike Price $190.00 | | | 2 | | | | 2 | |
| International Business Machines Corp., Expires 11/01/2013, Strike Price $195.00 | | | 2 | | | | 3 | |
| International Business Machines Corp., Expires 11/08/2013, Strike Price $190.00 | | | 4 | | | | 20 | |
| International Business Machines Corp., Expires 11/08/2013, Strike Price $195.00 | | | 1 | | | | 3 | |
| International Business Machines Corp., Expires 11/16/2013, Strike Price $48.00 | | | 4 | | | | 16 | |
| Interpublic Group of Cos., Inc., Expires 11/16/2013, Strike Price $17.00 | | | 60 | | | | 1,200 | |
| Intuitive Surgical, Inc., Expires 11/01/2013, Strike Price $410.00 | | | 5 | | | | 138 | |
| JC Penney Company, Inc., Expires 11/01/2013, Strike Price $8.00 | | | 239 | | | | 358 | |
| JC Penney Company, Inc., Expires 11/01/2013, Strike Price $8.50 | | | 26 | | | | 13 | |
| JC Penney Company, Inc., Expires 11/01/2013, Strike Price $9.00 | | | 14 | | | | 7 | |
| Johnson & Johnson, Expires 11/08/2013, Strike Price $95.00 | | | 1 | | | | 5 | |
| Johnson & Johnson, Expires 11/16/2013, Strike Price $97.50 | | | 3 | | | | 9 | |
| Joy Global, Inc., Expires 11/16/2013, Strike Price $60.00 | | | 7 | | | | 214 | |
| JPMorgan Chase & Co., Expires 11/01/2013, Strike Price $56.50 | | | 5 | | | | 3 | |
| JPMorgan Chase & Co., Expires 11/08/2013, Strike Price $56.50 | | | 5 | | | | 3 | |
| JPMorgan Chase & Co., Expires 11/08/2013, Strike Price $57.50 | | | 24 | | | | 12 | |
| Juniper Networks, Inc., Expires 11/16/2013, Strike Price $21.00 | | | 5 | | | | 13 | |
| Kansas City Southern, Expires 11/16/2013, Strike Price $130.00 | | | 14 | | | | 105 | |
| Kinder Morgan, Inc./DE, Expires 11/16/2013, Strike Price $37.50 | | | 45 | | | | 293 | |
| Kroger Co., Expires 11/16/2013, Strike Price $46.00 | | | 14 | | | | 35 | |
| Laboratory Corp of America Holdings, Expires 11/16/2013, Strike Price $105.00 | | | 18 | | | | 315 | |
| Las Vegas Sands Corp., Expires 11/01/2013, Strike Price $76.00 | | | 4 | | | | 2 | |
| Las Vegas Sands Corp., Expires 11/16/2013, Strike Price $77.50 | | | 12 | | | | 66 | |
| Las Vegas Sands Corp., Expires 11/16/2013, Strike Price $82.50 | | | 4 | | | | 4 | |
| Lennar Corp., Expires 11/16/2013, Strike Price $39.00 | | | 21 | | | | 252 | |
| Lennar Corp., Expires 11/16/2013, Strike Price $40.00 | | | 8 | | | | 56 | |
| | | | |
| | The accompanying footnotes are an integral part of these Schedules of Investments. | | (Continued) |
| | | | | | | | | | | | | | | | |
| | Stone Ridge Funds | | | | | | Annual Report | | | | | | October 2013 | | 23 |
| | | | | | | | | | |
| | | | |
| Schedule of Investments | | | October 31, 2013 | |
| | |
| STONE RIDGE U.S. VARIANCE RISK PREMIUM FUND | | |
| | | | | | | | |
DESCRIPTION | | CONTRACTS | | | FAIR
VALUE | |
| Lennar Corp., Expires 11/16/2013, Strike Price $41.00 | | | 21 | | | $ | 116 | |
| Lennox International, Inc., Expires 11/16/2013, Strike Price $85.00 | | | 2 | | | | 40 | |
| Linear Technology Corp., Expires 11/16/2013, Strike Price $40.00 | | | 1 | | | | 133 | |
| Linear Technology Corp., Expires 11/16/2013, Strike Price $41.00 | | | 43 | | | | 2,580 | |
| LinkedIn Corp., Expires 11/01/2013, Strike Price $240.00 | | | 2 | | | | 14 | |
| LinkedIn Corp., Expires 11/08/2013, Strike Price $265.00 | | | 2 | | | | 22 | |
| LinkedIn Corp., Expires 11/16/2013, Strike Price $255.00 | | | 2 | | | | 138 | |
| LinkedIn Corp., Expires 11/16/2013, Strike Price $260.00 | | | 2 | | | | 96 | |
| Lockheed Martin Corp., Expires 11/16/2013, Strike Price $145.00 | | | 4 | | | | 10 | |
| Lorillard, Inc., Expires 11/16/2013, Strike Price $52.50 | | | 18 | | | | 585 | |
| Lorillard, Inc., Expires 11/16/2013, Strike Price $55.00 | | | 17 | | | | 111 | |
| Lowe’s Cos, Inc., Expires 11/01/2013, Strike Price $51.50 | | | 6 | | | | 3 | |
| Lowe’s Cos, Inc., Expires 11/01/2013, Strike Price $52.50 | | | 18 | | | | 9 | |
| Lowe’s Cos, Inc., Expires 11/16/2013, Strike Price $55.00 | | | 6 | | | | 9 | |
| Lumber Liquidators Holdings, Inc., Expires 11/16/2013, Strike Price $130.00 | | | 5 | | | | 88 | |
| LyondellBasell Industries NV, Expires 11/16/2013, Strike Price $80.00 | | | 1 | | | | 10 | |
| Macy’s, Inc., Expires 11/01/2013, Strike Price $47.00 | | | 38 | | | | 114 | |
| Macy’s, Inc., Expires 11/01/2013, Strike Price $47.50 | | | 1 | | | | 1 | |
| Marvell Technology Group Ltd., Expires 11/01/2013, Strike Price $12.50 | | | 10 | | | | 10 | |
| Marvell Technology Group Ltd., Expires 11/01/2013, Strike Price $13.00 | | | 10 | | | | 5 | |
| Marvell Technology Group Ltd., Expires 11/08/2013, Strike Price $13.00 | | | 60 | | | | 120 | |
| Marvell Technology Group Ltd., Expires 11/08/2013, Strike Price $13.50 | | | 20 | | | | 20 | |
| Marvell Technology Group Ltd., Expires 11/16/2013, Strike Price $13.00 | | | 30 | | | | 165 | |
| MBIA, Inc., Expires 11/01/2013, Strike Price $12.00 | | | 116 | | | | 174 | |
| MBIA, Inc., Expires 11/01/2013, Strike Price $12.50 | | | 20 | | | | 20 | |
| MBIA, Inc., Expires 11/08/2013, Strike Price $12.50 | | | 30 | | | | 120 | |
| McDonald’s Corp., Expires 11/01/2013, Strike Price $97.00 | | | 3 | | | | 11 | |
| McDonald’s Corp., Expires 11/08/2013, Strike Price $98.00 | | | 3 | | | | 68 | |
| McDonald’s Corp., Expires 11/08/2013, Strike Price $99.00 | | | 13 | | | | 117 | |
| Mead Johnson Nutrition Co., Expires 11/16/2013, Strike Price $90.00 | | | 21 | | | | 462 | |
| Medtronic, Inc., Expires 11/16/2013, Strike Price $60.00 | | | 20 | | | | 140 | |
| Merck & Company, Inc., Expires 11/08/2013, Strike Price $46.50 | | | 6 | | | | 24 | |
| Merck & Company, Inc., Expires 11/16/2013, Strike Price $47.00 | | | 2 | | | | 13 | |
| Merck & Company, Inc., Expires 11/16/2013, Strike Price $48.00 | | | 3 | | | | 7 | |
| Merck & Company, Inc., Expires 11/22/2013, Strike Price $47.50 | | | 18 | | | | 72 | |
| Merck & Company, Inc., Expires 11/22/2013, Strike Price $48.00 | | | 8 | | | | 24 | |
| Michael Kors Holdings Ltd., Expires 11/01/2013, Strike Price $82.00 | | | 4 | | | | 10 | |
| Michael Kors Holdings Ltd., Expires 11/01/2013, Strike Price $82.50 | | | 20 | | | | 100 | |
| Micron Technology, Inc., Expires 11/01/2013, Strike Price $17.50 | | | 3 | | | | 72 | |
| Micron Technology, Inc., Expires 11/01/2013, Strike Price $18.50 | | | 13 | | | | 13 | |
| Micron Technology, Inc., Expires 11/01/2013, Strike Price $19.00 | | | 29 | | | | 14 | |
| Micron Technology, Inc., Expires 11/01/2013, Strike Price $19.50 | | | 20 | | | | 10 | |
| Micron Technology, Inc., Expires 11/01/2013, Strike Price $20.50 | | | 10 | | | | 5 | |
| Micron Technology, Inc., Expires 11/01/2013, Strike Price $21.00 | | | 10 | | | | 5 | |
| Micron Technology, Inc., Expires 11/08/2013, Strike Price $18.00 | | | 10 | | | | 270 | |
| Micron Technology, Inc., Expires 11/08/2013, Strike Price $20.50 | | | 1 | | | | 1 | |
| Micron Technology, Inc., Expires 11/16/2013, Strike Price $19.00 | | | 1 | | | | 17 | |
| Micron Technology, Inc., Expires 11/22/2013, Strike Price $19.00 | | | 10 | | | | 260 | |
| Mondelez International, Inc., Expires 11/01/2013, Strike Price $35.00 | | | 5 | | | | 5 | |
| Monsanto Co., Expires 11/01/2013, Strike Price $111.00 | | | 1 | | | | 3 | |
| Monsanto Co., Expires 11/01/2013, Strike Price $112.00 | | | 6 | | | | 15 | |
| Monsanto Co., Expires 11/16/2013, Strike Price $115.00 | | | 9 | | | | 72 | |
| Morgan Stanley, Expires 11/16/2013, Strike Price $32.00 | | | 9 | | | | 13 | |
| Mosaic Co., Expires 11/01/2013, Strike Price $47.50 | | | 8 | | | | 8 | |
| Mosaic Co., Expires 11/01/2013, Strike Price $49.50 | | | 24 | | | | 48 | |
| Mosaic Co., Expires 11/01/2013, Strike Price $50.00 | | | 6 | | | | 6 | |
| Motorola Solutions, Inc., Expires 11/16/2013, Strike Price $67.50 | | | 17 | | | | 127 | |
| Motorola Solutions, Inc., Expires 11/16/2013, Strike Price $70.00 | | | 12 | | | | 42 | |
| | | | |
| | The accompanying footnotes are an integral part of these Schedules of Investments. | | (Continued) |
| | | | | | | | | | | | | | | | |
| 24 | | Stone Ridge Funds | | | | | | Annual Report | | | | | | October 2013 | | |
| | | | | | | | | | |
| | | | |
| Schedule of Investments | | | October 31, 2013 | |
| | |
| STONE RIDGE U.S. VARIANCE RISK PREMIUM FUND | | |
| | | | | | | | |
DESCRIPTION | | CONTRACTS | | | FAIR
VALUE | |
| Nabors Industries Ltd., Expires 11/16/2013, Strike Price $19.00 | | | 15 | | | $ | 75 | |
| National Oilwell Varco, Inc., Expires 11/16/2013, Strike Price $87.50 | | | 2 | | | | 17 | |
| Navistar International Corp., Expires 11/08/2013, Strike Price $42.00 | | | 32 | | | | 320 | |
| Navistar International Corp., Expires 11/16/2013, Strike Price $42.00 | | | 8 | | | | 20 | |
| NetApp, Inc., Expires 11/01/2013, Strike Price $40.50 | | | 1 | | | | 3 | |
| NetApp, Inc., Expires 11/01/2013, Strike Price $41.00 | | | 28 | | | | 84 | |
| NetApp, Inc., Expires 11/01/2013, Strike Price $42.00 | | | 16 | | | | 40 | |
| Netflix, Inc., Expires 11/01/2013, Strike Price $375.00 | | | 3 | | | | 1 | |
| Netflix, Inc., Expires 11/01/2013, Strike Price $380.00 | | | 3 | | | | 4 | |
| NIKE, Inc., Expires 11/01/2013, Strike Price $80.00 | | | 21 | | | | 84 | |
| NIKE, Inc., Expires 11/16/2013, Strike Price $82.50 | | | 2 | | | | 3 | |
| Nordson Corp., Expires 11/16/2013, Strike Price $80.00 | | | 12 | | | | 240 | |
| Northern Trust Corp., Expires 11/16/2013, Strike Price $60.00 | | | 1 | | | | 2 | |
| Nu Skin Enterprises, Inc., Expires 11/16/2013, Strike Price $130.00 | | | 15 | | | | 450 | |
| Nucor Corp., Expires 11/16/2013, Strike Price $55.00 | | | 33 | | | | 148 | |
| NVIDIA Corp., Expires 11/01/2013, Strike Price $16.50 | | | 10 | | | | 5 | |
| Occidental Petroleum Corp., Expires 11/08/2013, Strike Price $101.00 | | | 6 | | | | 90 | |
| Occidental Petroleum Corp., Expires 11/22/2013, Strike Price $103.00 | | | 6 | | | | 162 | |
| Occidental Petroleum Corp., Expires 11/22/2013, Strike Price $104.00 | | | 6 | | | | 114 | |
| Omnicom Group, Inc., Expires 11/16/2013, Strike Price $70.00 | | | 27 | | | | 1,350 | |
| Oracle Corp., Expires 11/08/2013, Strike Price $34.50 | | | 8 | | | | 28 | |
| Oracle Corp., Expires 11/16/2013, Strike Price $35.00 | | | 24 | | | | 84 | |
| Pall Corp., Expires 11/16/2013, Strike Price $85.00 | | | 25 | | | | 500 | |
| Palo Alto Networks, Inc., Expires 11/16/2013, Strike Price $50.00 | | | 40 | | | | 600 | |
| Pandora Media, Inc., Expires 11/01/2013, Strike Price $30.50 | | | 10 | | | | 25 | |
| Pandora Media, Inc., Expires 11/08/2013, Strike Price $29.50 | | | 3 | | | | 15 | |
| Pandora Media, Inc., Expires 11/08/2013, Strike Price $31.00 | | | 20 | | | | 50 | |
| Pandora Media, Inc., Expires 11/08/2013, Strike Price $32.00 | | | 30 | | | | 75 | |
| Pandora Media, Inc., Expires 11/16/2013, Strike Price $32.00 | | | 5 | | | | 25 | |
| Pandora Media, Inc., Expires 11/22/2013, Strike Price $31.00 | | | 1 | | | | 43 | |
| Panera Bread Co., Expires 11/16/2013, Strike Price $170.00 | | | 2 | | | | 40 | |
| Peabody Energy Corp., Expires 11/01/2013, Strike Price $20.00 | | | 44 | | | | 110 | |
| Peabody Energy Corp., Expires 11/01/2013, Strike Price $20.50 | | | 10 | | | | 15 | |
| Peabody Energy Corp., Expires 11/01/2013, Strike Price $21.00 | | | 10 | | | | 5 | |
| Peabody Energy Corp., Expires 11/08/2013, Strike Price $20.50 | | | 34 | | | | 289 | |
| Peabody Energy Corp., Expires 11/08/2013, Strike Price $21.00 | | | 10 | | | | 35 | |
| Peabody Energy Corp., Expires 11/08/2013, Strike Price $21.50 | | | 20 | | | | 30 | |
| PepsiCo, Inc., Expires 11/16/2013, Strike Price $87.50 | | | 21 | | | | 210 | |
| PNC Financial Services Group, Inc., Expires 11/16/2013, Strike Price $80.00 | | | 23 | | | | 46 | |
| Popular, Inc., Expires 11/16/2013, Strike Price $28.00 | | | 70 | | | | 420 | |
| priceline.com, Inc., Expires 11/01/2013, Strike Price $1150.00 | | | 1 | | | | 10 | |
| Procter & Gamble Co., Expires 11/22/2013, Strike Price $87.00 | | | 10 | | | | 20 | |
| PulteGroup, Inc., Expires 11/01/2013, Strike Price $19.00 | | | 10 | | | | 5 | |
| PulteGroup, Inc., Expires 11/08/2013, Strike Price $20.00 | | | 10 | | | | 10 | |
| PulteGroup, Inc., Expires 11/16/2013, Strike Price $20.00 | | | 10 | | | | 35 | |
| PulteGroup, Inc., Expires 11/22/2013, Strike Price $20.50 | | | 60 | | | | 240 | |
| PVH Corp., Expires 11/16/2013, Strike Price $140.00 | | | 14 | | | | 105 | |
| Qualcomm, Inc., Expires 11/01/2013, Strike Price $70.00 | | | 4 | | | | 30 | |
| Qualcomm, Inc., Expires 11/01/2013, Strike Price $70.50 | | | 22 | | | | 44 | |
| Quest Diagnostics, Inc., Expires 11/16/2013, Strike Price $65.00 | | | 15 | | | | 112 | |
| Questcor Pharmaceuticals, Inc., Expires 11/01/2013, Strike Price $66.50 | | | 15 | | | | 150 | |
| Questcor Pharmaceuticals, Inc., Expires 11/08/2013, Strike Price $71.00 | | | 14 | | | | 350 | |
| Regeneron Pharmaceuticals, Inc., Expires 11/01/2013, Strike Price $330.00 | | | 6 | | | | 105 | |
| Ross Stores, Inc., Expires 11/16/2013, Strike Price $80.00 | | | 21 | | | | 420 | |
| Ross Stores, Inc., Expires 11/16/2013, Strike Price $82.50 | | | 2 | | | | 10 | |
| Safeway, Inc., Expires 11/16/2013, Strike Price $41.00 | | | 1 | | | | 10 | |
| Salesforce.com, Inc., Expires 11/01/2013, Strike Price $57.50 | | | 5 | | | | 2 | |
| Salesforce.com, Inc., Expires 11/01/2013, Strike Price $59.00 | | | 8 | | | | 4 | |
| | | | |
| | The accompanying footnotes are an integral part of these Schedules of Investments. | | (Continued) |
| | | | | | | | | | | | | | | | |
| | Stone Ridge Funds | | | | | | Annual Report | | | | | | October 2013 | | 25 |
| | | | | | | | | | |
| | | | |
| Schedule of Investments | | | October 31, 2013 | |
| | |
| STONE RIDGE U.S. VARIANCE RISK PREMIUM FUND | | |
| | | | | | | | |
DESCRIPTION | | CONTRACTS | | | FAIR
VALUE | |
| Salesforce.com, Inc., Expires 11/08/2013, Strike Price $60.00 | | | 10 | | | $ | 50 | |
| Salesforce.com, Inc., Expires 11/16/2013, Strike Price $60.00 | | | 4 | | | | 40 | |
| Salesforce.com, Inc., Expires 11/16/2013, Strike Price $62.50 | | | 3 | | | | 12 | |
| SanDisk Corp., Expires 11/01/2013, Strike Price $71.50 | | | 5 | | | | 12 | |
| SanDisk Corp., Expires 11/01/2013, Strike Price $72.50 | | | 5 | | | | 5 | |
| SanDisk Corp., Expires 11/01/2013, Strike Price $73.00 | | | 7 | | | | 7 | |
| SanDisk Corp., Expires 11/01/2013, Strike Price $74.00 | | | 4 | | | | 4 | |
| SanDisk Corp., Expires 11/16/2013, Strike Price $77.50 | | | 7 | | | | 42 | |
| Schlumberger Ltd., Expires 11/01/2013, Strike Price $97.00 | | | 10 | | | | 15 | |
| Schlumberger Ltd., Expires 11/16/2013, Strike Price $100.00 | | | 6 | | | | 57 | |
| Schlumberger Ltd., Expires 11/16/2013, Strike Price $105.00 | | | 3 | | | | 7 | |
| Seadrill Ltd., Expires 11/16/2013, Strike Price $50.00 | | | 38 | | | | 190 | |
| Signet Jewelers Ltd., Expires 11/16/2013, Strike Price $85.00 | | | 4 | | | | 960 | |
| Simon Property Group, Inc., Expires 11/16/2013, Strike Price $165.00 | | | 11 | | | | 77 | |
| SolarCity Corp., Expires 11/01/2013, Strike Price $70.50 | | | 10 | | | | 50 | |
| SolarCity Corp., Expires 11/01/2013, Strike Price $71.00 | | | 10 | | | | 50 | |
| SolarCity Corp., Expires 11/01/2013, Strike Price $72.00 | | | 5 | | | | 25 | |
| Splunk, Inc., Expires 11/16/2013, Strike Price $75.00 | | | 27 | | | | 270 | |
| St. Jude Medical, Inc., Expires 11/16/2013, Strike Price $60.00 | | | 5 | | | | 75 | |
| Staples, Inc., Expires 11/16/2013, Strike Price $18.00 | | | 116 | | | | 290 | |
| Starwood Hotels & Resorts Worldwide, Inc., Expires 11/16/2013, Strike Price $80.00 | | | 12 | | | | 42 | |
| State Street Corp., Expires 11/16/2013, Strike Price $75.00 | | | 12 | | | | 54 | |
| Symantec Corp., Expires 11/16/2013, Strike Price $25.00 | | | 30 | | | | 90 | |
| Tableau Software, Inc., Expires 11/16/2013, Strike Price $75.00 | | | 22 | | | | 385 | |
| Target Corp., Expires 11/01/2013, Strike Price $68.00 | | | 5 | | | | 5 | |
| Target Corp., Expires 11/01/2013, Strike Price $68.50 | | | 3 | | | | 3 | |
| Target Corp., Expires 11/08/2013, Strike Price $67.00 | | | 3 | | | | 13 | |
| Target Corp., Expires 11/08/2013, Strike Price $67.50 | | | 1 | | | | 2 | �� |
| Target Corp., Expires 11/08/2013, Strike Price $69.00 | | | 6 | | | | 6 | |
| Target Corp., Expires 11/08/2013, Strike Price $69.50 | | | 6 | | | | 6 | |
| Target Corp., Expires 11/16/2013, Strike Price $70.00 | | | 1 | | | | 1 | |
| Terex Corp., Expires 11/16/2013, Strike Price $39.00 | | | 35 | | | | 262 | |
| Terex Corp., Expires 11/16/2013, Strike Price $40.00 | | | 8 | | | | 20 | |
| Terex Corp., Expires 11/16/2013, Strike Price $41.00 | | | 8 | | | | 20 | |
| Tesla Motors, Inc., Expires 11/01/2013, Strike Price $170.00 | | | 1 | | | | 3 | |
| Tesla Motors, Inc., Expires 11/01/2013, Strike Price $190.00 | | | 1 | | | | 1 | |
| Tesla Motors, Inc., Expires 11/01/2013, Strike Price $195.00 | | | 1 | | | | 1 | |
| Tesla Motors, Inc., Expires 11/01/2013, Strike Price $200.00 | | | 5 | | | | 5 | |
| Tesla Motors, Inc., Expires 11/01/2013, Strike Price $205.00 | | | 1 | | | | 1 | |
| Tesla Motors, Inc., Expires 11/01/2013, Strike Price $215.00 | | | 2 | | | | 2 | |
| Tesoro Corp., Expires 11/01/2013, Strike Price $50.50 | | | 18 | | | | 90 | |
| Tesoro Corp., Expires 11/01/2013, Strike Price $51.00 | | | 11 | | | | 27 | |
| Texas Instruments, Inc., Expires 11/01/2013, Strike Price $41.00 | | | 8 | | | | 880 | |
| Texas Instruments, Inc., Expires 11/01/2013, Strike Price $41.50 | | | 7 | | | | 437 | |
| Texas Instruments, Inc., Expires 11/16/2013, Strike Price $43.00 | | | 28 | | | | 756 | |
| Textron, Inc., Expires 11/16/2013, Strike Price $31.00 | | | 60 | | | | 360 | |
| The ADT Corp., Expires 11/16/2013, Strike Price $45.00 | | | 8 | | | | 200 | |
| The ADT Corp., Expires 11/16/2013, Strike Price $46.00 | | | 14 | | | | 210 | |
| The ADT Corp., Expires 11/16/2013, Strike Price $47.00 | | | 21 | | | | 210 | |
| Theravance, Inc., Expires 11/16/2013, Strike Price $44.00 | | | 35 | | | | 175 | |
| Theravance, Inc., Expires 11/16/2013, Strike Price $45.00 | | | 7 | | | | 35 | |
| Thermo Fisher Scientific, Inc., Expires 11/16/2013, Strike Price $105.00 | | | 5 | | | | 25 | |
| TIBCO Software, Inc., Expires 11/16/2013, Strike Price $29.00 | | | 47 | | | | 235 | |
| Tiffany & Co., Expires 11/01/2013, Strike Price $82.00 | | | 12 | | | | 24 | |
| Tiffany & Co., Expires 11/01/2013, Strike Price $83.00 | | | 6 | | | | 24 | |
| Tiffany & Co., Expires 11/16/2013, Strike Price $87.50 | | | 4 | | | | 14 | |
| Toll Brothers, Inc., Expires 11/16/2013, Strike Price $36.00 | | | 2 | | | | 15 | |
| Toll Brothers, Inc., Expires 11/16/2013, Strike Price $37.00 | | | 19 | | | | 47 | |
| | | | |
| | The accompanying footnotes are an integral part of these Schedules of Investments. | | (Continued) |
| | | | | | | | | | | | | | | | |
| 26 | | Stone Ridge Funds | | | | | | Annual Report | | | | | | October 2013 | | |
| | | | | | | | | | |
| | | | |
| Schedule of Investments | | | October 31, 2013 | |
| | |
| STONE RIDGE U.S. VARIANCE RISK PREMIUM FUND | | |
| | | | | | | | |
DESCRIPTION | | CONTRACTS | | | FAIR
VALUE | |
| TripAdvisor, Inc., Expires 11/16/2013, Strike Price $85.00 | | | 19 | | | $ | 3,372 | |
| TripAdvisor, Inc., Expires 11/16/2013, Strike Price $87.50 | | | 4 | | | | 420 | |
| Tyson Foods, Inc., Expires 11/16/2013, Strike Price $31.00 | | | 1 | | | | 2 | |
| Under Armour, Inc., Expires 11/01/2013, Strike Price $85.00 | | | 4 | | | | 10 | |
| Under Armour, Inc., Expires 11/08/2013, Strike Price $90.00 | | | 8 | | | | 20 | |
| Under Armour, Inc., Expires 11/16/2013, Strike Price $92.50 | | | 4 | | | | 10 | |
| Under Armour, Inc., Expires 11/22/2013, Strike Price $91.00 | | | 4 | | | | 50 | |
| Under Armour, Inc., Expires 11/22/2013, Strike Price $92.00 | | | 4 | | | | 30 | |
| Under Armour, Inc., Expires 11/22/2013, Strike Price $93.00 | | | 4 | | | | 20 | |
| Union Pacific Corp., Expires 11/01/2013, Strike Price $160.00 | | | 8 | | | | 12 | |
| Union Pacific Corp., Expires 11/08/2013, Strike Price $165.00 | | | 2 | | | | 5 | |
| Union Pacific Corp., Expires 11/16/2013, Strike Price $165.00 | | | 2 | | | | 6 | |
| United Continental Holdings, Inc., Expires 11/16/2013, Strike Price $36.00 | | | 47 | | | | 1,598 | |
| United Continental Holdings, Inc., Expires 11/16/2013, Strike Price $37.00 | | | 9 | | | | 171 | |
| United Parcel Service, Inc., Expires 11/01/2013, Strike Price $100.00 | | | 9 | | | | 45 | |
| United Parcel Service, Inc., Expires 11/08/2013, Strike Price $102.00 | | | 6 | | | | 18 | |
| United Rentals, Inc., Expires 11/16/2013, Strike Price $75.00 | | | 27 | | | | 67 | |
| United States Steel Corp., Expires 11/08/2013, Strike Price $27.00 | | | 51 | | | | 408 | |
| United States Steel Corp., Expires 11/16/2013, Strike Price $28.00 | | | 20 | | | | 120 | |
| United Technologies Corp., Expires 11/01/2013, Strike Price $112.00 | | | 10 | | | | 25 | |
| United Technologies Corp., Expires 11/08/2013, Strike Price $115.00 | | | 3 | | | | 9 | |
| United Technologies Corp., Expires 11/08/2013, Strike Price $116.00 | | | 3 | | | | 7 | |
| UnitedHealth Group, Inc., Expires 11/08/2013, Strike Price $76.00 | | | 4 | | | | 2 | |
| UnitedHealth Group, Inc., Expires 11/16/2013, Strike Price $75.00 | | | 4 | | | | 4 | |
| Urban Outfitters, Inc., Expires 11/16/2013, Strike Price $39.00 | | | 23 | | | | 690 | |
| Urban Outfitters, Inc., Expires 11/16/2013, Strike Price $40.00 | | | 24 | | | | 240 | |
| US Airways Group, Inc., Expires 11/01/2013, Strike Price $24.50 | | | 34 | | | | 153 | |
| US Airways Group, Inc., Expires 11/01/2013, Strike Price $25.00 | | | 10 | | | | 10 | |
| US Airways Group, Inc., Expires 11/08/2013, Strike Price $25.00 | | | 12 | | | | 48 | |
| US Airways Group, Inc., Expires 11/16/2013, Strike Price $26.00 | | | 25 | | | | 200 | |
| Valero Energy Corp., Expires 11/01/2013, Strike Price $42.50 | | | 1 | | | | 3 | |
| Valero Energy Corp., Expires 11/08/2013, Strike Price $44.00 | | | 14 | | | | 112 | |
| Valero Energy Corp., Expires 11/16/2013, Strike Price $46.00 | | | 7 | | | | 21 | |
| Valmont Industries, Inc., Expires 11/16/2013, Strike Price $145.00 | | | 9 | | | | 630 | |
| Valmont Industries, Inc., Expires 11/16/2013, Strike Price $150.00 | | | 2 | | | | 85 | |
| Valmont Industries, Inc., Expires 11/16/2013, Strike Price $155.00 | | | 2 | | | | 145 | |
| Verizon Communications, Inc., Expires 11/16/2013, Strike Price $55.00 | | | 34 | | | | 51 | |
| Vertex Pharmaceuticals, Inc., Expires 11/08/2013, Strike Price $77.00 | | | 7 | | | | 175 | |
| Vertex Pharmaceuticals, Inc., Expires 11/16/2013, Strike Price $80.00 | | | 1 | | | | 25 | |
| Vertex Pharmaceuticals, Inc., Expires 11/16/2013, Strike Price $82.50 | | | 1 | | | | 10 | |
| Vertex Pharmaceuticals, Inc., Expires 11/22/2013, Strike Price $80.00 | | | 4 | | | | 140 | |
| Vertex Pharmaceuticals, Inc., Expires 11/22/2013, Strike Price $81.00 | | | 4 | | | | 100 | |
| Vertex Pharmaceuticals, Inc., Expires 11/22/2013, Strike Price $82.00 | | | 4 | | | | 80 | |
| Vertex Pharmaceuticals, Inc., Expires 11/22/2013, Strike Price $83.00 | | | 4 | | | | 60 | |
| Vertex Pharmaceuticals, Inc., Expires 11/22/2013, Strike Price $84.00 | | | 4 | | | | 40 | |
| VF Corp., Expires 11/16/2013, Strike Price $230.00 | | | 8 | | | | 80 | |
| VMware, Inc., Expires 11/16/2013, Strike Price $90.00 | | | 1 | | | | 17 | |
| VMware, Inc., Expires 11/16/2013, Strike Price $92.50 | | | 20 | | | | 250 | |
| Walgreen Co., Expires 11/01/2013, Strike Price $62.00 | | | 5 | | | | 8 | |
| Walgreen Co., Expires 11/08/2013, Strike Price $63.00 | | | 5 | | | | 25 | |
| Walgreen Co., Expires 11/08/2013, Strike Price $63.50 | | | 5 | | | | 15 | |
| Walgreen Co., Expires 11/08/2013, Strike Price $64.00 | | | 5 | | | | 10 | |
| Walgreen Co., Expires 11/08/2013, Strike Price $65.00 | | | 5 | | | | 8 | |
| Walgreen Co., Expires 11/16/2013, Strike Price $65.00 | | | 5 | | | | 15 | |
| Walt Disney Co., Expires 11/01/2013, Strike Price $70.00 | | | 21 | | | | 31 | |
| Walt Disney Co., Expires 11/01/2013, Strike Price $72.50 | | | 4 | | | | 4 | |
| Watsco, Inc., Expires 11/16/2013, Strike Price $105.00 | | | 9 | | | | 135 | |
| WellPoint, Inc., Expires 11/16/2013, Strike Price $92.50 | | | 16 | | | | 40 | |
| | | | |
| | The accompanying footnotes are an integral part of these Schedules of Investments. | | (Continued) |
| | | | | | | | | | | | | | | | |
| | Stone Ridge Funds | | | | | | Annual Report | | | | | | October 2013 | | 27 |
| | | | | | | | | | |
| | | | |
| Schedule of Investments | | | October 31, 2013 | |
| | |
| STONE RIDGE U.S. VARIANCE RISK PREMIUM FUND | | |
| | | | | | | | |
DESCRIPTION | | CONTRACTS | | | FAIR
VALUE | |
| Wells Fargo & Co., Expires 11/01/2013, Strike Price $44.00 | | | 19 | | | $ | 10 | |
| Wells Fargo & Co., Expires 11/08/2013, Strike Price $44.00 | | | 7 | | | | 11 | |
| Wells Fargo & Co., Expires 11/08/2013, Strike Price $44.50 | | | 7 | | | | 7 | |
| Western Digital Corp., Expires 11/16/2013, Strike Price $80.00 | | | 21 | | | | 368 | |
| Western Digital Corp., Expires 11/16/2013, Strike Price $85.00 | | | 5 | | | | 48 | |
| Whirlpool Corp., Expires 11/16/2013, Strike Price $170.00 | | | 12 | | | | 36 | |
| Whole Food Markets, Inc., Expires 11/01/2013, Strike Price $67.50 | | | 17 | | | | 9 | |
| Whole Foods Market, Inc., Expires 11/01/2013, Strike Price $67.00 | | | 5 | | | | 3 | |
| Wolverine World Wide, Inc., Expires 11/16/2013, Strike Price $65.00 | | | 5 | | | | 38 | |
| Workday, Inc., Expires 11/16/2013, Strike Price $92.50 | | | 1 | | | | 8 | |
| Workday, Inc., Expires 11/16/2013, Strike Price $95.00 | | | 21 | | | | 263 | |
| WR Grace & Co., Expires 11/16/2013, Strike Price $97.50 | | | 10 | | | | 150 | |
| WR Grace & Co., Expires 11/16/2013, Strike Price $100.00 | | | 9 | | | | 45 | |
| WW Grainger, Inc., Expires 11/16/2013, Strike Price $280.00 | | | 7 | | | | 455 | |
| Wynn Resorts Ltd., Expires 11/01/2013, Strike Price $175.00 | | | 2 | | | | 5 | |
| Wynn Resorts Ltd., Expires 11/01/2013, Strike Price $190.00 | | | 1 | | | | 2 | |
| Wynn Resorts Ltd., Expires 11/08/2013, Strike Price $185.00 | | | 1 | | | | 6 | |
| Wynn Resorts Ltd., Expires 11/08/2013, Strike Price $190.00 | | | 1 | | | | 5 | |
| Xilinx, Inc., Expires 11/16/2013, Strike Price $48.00 | | | 24 | | | | 96 | |
| Xilinx, Inc., Expires 11/16/2013, Strike Price $50.00 | | | 6 | | | | 9 | |
| Yahoo, Inc., Expires 11/01/2013, Strike Price $35.00 | | | 17 | | | | 9 | |
| Yahoo, Inc., Expires 11/16/2013, Strike Price $35.00 | | | 2 | | | | 41 | |
| Yahoo, Inc., Expires 11/16/2013, Strike Price $36.00 | | | 26 | | | | 247 | |
| Yahoo, Inc., Expires 11/16/2013, Strike Price $37.00 | | | 9 | | | | 36 | |
| Yelp, Inc., Expires 11/01/2013, Strike Price $71.50 | | | 1 | | | | 10 | |
| Yelp, Inc., Expires 11/08/2013, Strike Price $76.00 | | | 4 | | | | 124 | |
| Yelp, Inc., Expires 11/08/2013, Strike Price $78.00 | | | 4 | | | | 80 | |
| Yelp, Inc., Expires 11/08/2013, Strike Price $79.00 | | | 17 | | | | 170 | |
| Yelp, Inc., Expires 11/16/2013, Strike Price $80.00 | | | 1 | | | | 45 | |
| Yum! Brands, Inc., Expires 11/16/2013, Strike Price $72.50 | | | 12 | | | | 84 | |
| Zillow, Inc., Expires 11/01/2013, Strike Price $91.00 | | | 3 | | | | 8 | |
| Zillow, Inc., Expires 11/01/2013, Strike Price $93.00 | | | 12 | | | | 30 | |
| Zillow, Inc., Expires 11/01/2013, Strike Price $94.00 | | | 4 | | | | 10 | |
| Zillow, Inc., Expires 11/01/2013, Strike Price $97.00 | | | 1 | | | | 3 | |
| Zoetis, Inc., Expires 11/01/2013, Strike Price $35.00 | | | 6 | | | | 15 | |
| Zynga, Inc., Expires 11/01/2013, Strike Price $4.00 | | | 40 | | | | 20 | |
| | | | | | | | |
TOTAL CALL OPTIONS
(Premiums Received $109,613) | | | | | | | 83,941 | |
| | | | | | | | |
| PUT OPTIONS | | | | | | | | |
| CBOE S&P 500, Expires 11/01/2013, Strike Price $1750.00 | | | 219 | | | | 29,565 | |
| CBOE S&P 500, Expires 11/01/2013, Strike Price $1755.00 | | | 1,211 | | | | 278,530 | |
| CBOE S&P 500, Expires 11/01/2013, Strike Price $1760.00 | | | 111 | | | | 45,510 | |
| CBOE S&P 500, Expires 11/01/2013, Strike Price $1765.00 | | | 50 | | | | 42,750 | |
| | | | | | | | |
TOTAL PUT OPTIONS
(Premiums Received $1,149,873) | | | | | | | 396,355 | |
| | | | | | | | |
TOTAL WRITTEN OPTIONS
(Premiums Received $1,259,486) | | | | | | $ | 480,296 | |
| | | | | | | | |
Schedule of Open Futures Contracts
| | | | | | | | | | | | |
| DESCRIPTION | | NUMBER OF
CONTRACTS
SOLD | | | NOTIONAL
VALUE | | | UNREALIZED
DEPRECIATION | |
| S&P 500 Emini, December 2013 Settlement | | | 300 | | | | $26,265,000 | | | | $(11,423) | |
| | | | | | | | | | | | |
Total Futures Contracts Sold | | | | | | | $26,265,000 | | | | $(11,423) | |
| | | | | | | | | | | | |
| | | | |
| | The accompanying footnotes are an integral part of these Schedules of Investments. | | |
| | | | | | | | | | | | | | | | |
| 28 | | Stone Ridge Funds | | | | | | Annual Report | | | | | | October 2013 | | |
| | | | | | | | | | |
| | | | |
| Schedule of Investments | | | October 31, 2013 | |
| | |
| STONE RIDGE U.S. SMALL CAP VARIANCE RISK PREMIUM FUND | | |
| | | | | | | | |
| | | SHARES | | | FAIR
VALUE | |
| COMMON STOCKS - 3.7% | | | | | | | | |
| | |
| Automobiles & Components - 0.1% | | | | | | | | |
| Federal-Mogul Corp. (a)(b) | | | 2,600 | | | $ | 53,274 | |
| Tower International, Inc. (a)(b) | | | 2,100 | | | | 44,562 | |
| | | | | | | | |
| | | | | | | 97,836 | |
| | | | | | | | |
| Banks - 0.0% | | | | | | | | |
| CapitalSource, Inc. (a) | | | 3,800 | | | | 49,704 | |
| | | | | | | | |
| | |
| Capital Goods - 0.0% | | | | | | | | |
| Capstone Turbine Corp. (a)(b) | | | 20,000 | | | | 25,400 | |
| Wabash National Corp. (a)(b) | | | 4,200 | | | | 48,972 | |
| | | | | | | | |
| | | | | | | 74,372 | |
| | | | | | | | |
| Commercial & Professional Services - 0.1% | | | | | |
| WageWorks, Inc. (a)(b) | | | 1,100 | | | | 56,331 | |
| | | | | | | | |
| | |
| Consumer Durables & Apparel - 0.1% | | | | | | | | |
| Crocs, Inc. (a)(b) | | | 3,300 | | | | 40,194 | |
| JAKKS Pacific, Inc. (a) | | | 8,600 | | | | 55,384 | |
| Nautilus, Inc. (a)(b) | | | 6,800 | | | | 54,128 | |
| | | | | | | | |
| | | | | | | 149,706 | |
| | | | | | | | |
| Consumer Services - 0.2% | | | | | | | | |
| Boyd Gaming Corp. (a)(b) | | | 3,700 | | | | 39,072 | |
| Bridgepoint Education, Inc. (a)(b) | | | 2,700 | | | | 52,920 | |
| Caesars Entertainment Corp. (a)(b) | | | 2,500 | | | | 43,550 | |
| SHFL Entertainment, Inc. (a)(b) | | | 2,000 | | | | 46,360 | |
| Weight Watchers International, Inc. (a) | | | 1,200 | | | | 38,532 | |
| | | | | | | | |
| | | | | | | 220,434 | |
| | | | | | | | |
| Energy - 0.3% | | | | | | | | |
| Alpha Natural Resources, Inc. (a)(b) | | | 7,700 | | | | 53,900 | |
| Arch Coal, Inc. (a) | | | 10,000 | | | | 42,400 | |
| CARBO Ceramics, Inc. (a) | | | 500 | | | | 62,670 | |
| Goodrich Petroleum Corp. (a)(b) | | | 2,300 | | | | 53,797 | |
| McDermott International, Inc. (a)(b)(c) | | | 6,300 | | | | 44,541 | |
| Nuverra Environmental Solutions, Inc. (a)(b) | | | 15,400 | | | | 37,576 | |
| | | | | | | | |
| | | | | | | 294,884 | |
| | | | | | | | |
| Food & Staples Retailing - 0.0% | | | | | | | | |
| SUPERVALU, Inc. (a)(b) | | | 5,700 | | | | 40,071 | |
| | | | | | | | |
| | |
| Food, Beverage & Tobacco - 0.0% | | | | | | | | |
| Boulder Brands, Inc. (a)(b) | | | 2,800 | | | | 45,892 | |
| | | | | | | | |
| |
| Health Care Equipment & Services - 0.5% | | | | | |
| Abaxis, Inc. (a) | | | 1,100 | | | | 39,303 | |
| Air Methods Corp. (a) | | | 1,100 | | | | 48,092 | |
| Amedisys, Inc. (a)(b) | | | 2,500 | | | | 40,700 | |
| Anika Therapeutics, Inc. (a)(b) | | | 2,000 | | | | 59,740 | |
| DexCom, Inc. (a)(b) | | | 1,700 | | | | 48,841 | |
| MAKO Surgical Corp. (a)(b) | | | 3,000 | | | | 89,430 | |
| Medidata Solutions, Inc. (a)(b) | | | 500 | | | | 55,155 | |
| Orthofix International NV (a)(b) | | | 1,900 | | | | 38,931 | |
| Rockwell Medical, Inc. (a)(b) | | | 9,200 | | | | 105,984 | |
| | | | | | | | |
| | | | | | | 526,176 | |
| | | | | | | | |
| Household & Personal Products - 0.1% | | | | | | | | |
| Elizabeth Arden, Inc. (a)(b) | | | 1,300 | | | | 47,047 | |
| | | | | | | | |
| | | | | | | | |
| | | SHARES | | | FAIR
VALUE | |
| Materials - 0.3% | | | | | | | | |
| Allied Nevada Gold Corp. (a)(b) | | | 12,100 | | | $ | 49,368 | |
| Century Aluminum Co. (a)(b) | | | 5,200 | | | | 45,136 | |
| Coeur Mining Inc. (a)(b) | | | 3,300 | | | | 40,293 | |
| Compass Minerals International, Inc. (a) | | | 600 | | | | 44,682 | |
| Hecla Mining Co. (a) | | | 13,600 | | | | 42,432 | |
| Intrepid Potash, Inc. (a) | | | 3,500 | | | | 51,975 | |
| Molycorp, Inc. (a)(b) | | | 6,700 | | | | 33,969 | |
| Walter Energy, Inc. (a) | | | 3,500 | | | | 55,615 | |
| | | | | | | | |
| | | | | | | 363,470 | |
| | | | | | | | |
| Media - 0.1% | | | | | | | | |
| Digital Generation, Inc. (a)(b) | | | 3,800 | | | | 48,070 | |
| Entravision Communications Corp. (a) | | | 7,700 | | | | 51,898 | |
| | | | | | | | |
| | | | | | | 99,968 | |
| | | | | | | | |
| Pharmaceuticals, Biotechnology & Life Sciences - 0.6% | |
| Celldex Therapeutics, Inc. (a)(b) | | | 2,400 | | | | 54,984 | |
| Dendreon Corp. (a)(b) | | | 13,300 | | | | 34,181 | |
| Halozyme Therapeutics, Inc. (a)(b) | | | 6,700 | | | | 78,055 | |
| Immunomedics, Inc. (a)(b) | | | 8,900 | | | | 33,731 | |
| Infinity Pharmaceuticals, Inc. (a)(b) | | | 2,400 | | | | 32,520 | |
| Insmed, Inc. (a)(b) | | | 4,300 | | | | 61,232 | |
| InterMune, Inc. (a)(b) | | | 3,000 | | | | 42,270 | |
| NPS Pharmaceuticals, Inc. (a)(b) | | | 2,000 | | | | 57,560 | |
| Osiris Therapeutics, Inc. (a)(b) | | | 2,300 | | | | 30,613 | |
| Puma Biotechnology, Inc. (a)(b) | | | 900 | | | | 34,479 | |
| Sarepta Therapeutics, Inc. (a)(b) | | | 1,300 | | | | 50,622 | |
| Sequenom, Inc. (a)(b)(b) | | | 14,300 | | | | 27,456 | |
| Stemline Therapeutics, Inc. (a)(b) | | | 1,300 | | | | 36,179 | |
| TESARO, Inc. (a)(b) | | | 1,300 | | | | 50,050 | |
| Vanda Pharmaceuticals, Inc. (a)(b) | | | 4,100 | | | | 29,356 | |
| | | | | | | | |
| | | | | | | 653,288 | |
| | | | | | | | |
| Retailing - 0.1% | | | | | | | | |
| Big 5 Sporting Goods Corp. (a) | | | 2,300 | | | | 43,493 | |
| Body Central Corp. (a)(b) | | | 6,400 | | | | 35,840 | |
| Overstock.com, Inc. (a)(b) | | | 1,500 | | | | 35,145 | |
| RadioShack Corp. (a)(b) | | | 16,300 | | | | 45,803 | |
| | | | | | | | |
| | | | | | | 160,281 | |
| | | | | | | | |
| Semiconductors & Semiconductor Equipment - 0.2% | |
| Advanced Micro Devices, Inc. (a)(b) | | | 12,300 | | | | 41,082 | |
| Applied Micro Circuits Corp. (a)(b) | | | 3,900 | | | | 45,474 | |
| SunEdison, Inc. (a)(b) | | | 6,100 | | | | 56,730 | |
| SunPower Corp. (a)(b) | | | 2,000 | | | | 60,380 | |
| | | | | | | | |
| | | | | | | 203,666 | |
| | | | | | | | |
| Software & Services - 0.6% | | | | | | | | |
| Active Network, Inc. (a)(b) | | | 4,600 | | | | 66,424 | |
| Advent Software, Inc. (a) | | | 1,600 | | | | 53,680 | |
| Bankrate, Inc. (a)(b) | | | 2,600 | | | | 43,784 | |
| Ellie Mae, Inc. (a)(b) | | | 1,500 | | | | 43,350 | |
| Imperva, Inc. (a)(b) | | | 1,000 | | | | 38,340 | |
| Jive Software, Inc. (a)(b) | | | 3,400 | | | | 37,026 | |
| NIC, Inc. (a) | | | 2,000 | | | | 49,240 | |
| ServiceSource International, Inc. (a)(b) | | | 3,900 | | | | 42,198 | |
| Synchronoss Technologies, Inc. (a)(b) | | | 1,300 | | | | 45,006 | |
| Trulia, Inc. (a)(b) | | | 1,000 | | | | 39,970 | |
| | | | |
| | The accompanying footnotes are an integral part of these Schedules of Investments. | | (Continued) |
| | | | | | | | | | | | | | | | |
| | Stone Ridge Funds | | | | | | Annual Report | | | | | | October 2013 | | 29 |
| | | | | | | | | | |
| | | | |
| Schedule of Investments | | | October 31, 2013 | |
| | |
| STONE RIDGE U.S. SMALL CAP VARIANCE RISK PREMIUM FUND | | |
| | | | | | | | |
| | | SHARES | | | FAIR
VALUE | |
| Software & Services - 0.6% (continued) | | | | | | | | |
| ValueClick, Inc. (a)(b) | | | 2,100 | | | $ | 40,341 | |
| Vringo, Inc. (a)(b) | | | 13,300 | | | | 37,506 | |
| WebMD Health Corp. (a)(b) | | | 1,300 | | | | 45,786 | |
| Zynga, Inc. (a)(b) | | | 15,000 | | | | 53,850 | |
| | | | | | | | |
| | | | | | | 636,501 | |
| | | | | | | | |
| Technology Hardware & Equipment - 0.2% | | | | | |
| Alliance Fiber Optics Products, Inc. (a) | | | 1,400 | | | | 25,998 | |
| Cray, Inc. (a)(b) | | | 1,600 | | | | 35,776 | |
| Fusion-io, Inc. (a)(b) | | | 4,000 | | | | 43,000 | |
| Ixia (a)(b) | | | 2,800 | | | | 39,704 | |
| Silicon Graphics International Corp. (a)(b) | | | 3,000 | | | | 38,310 | |
| Ubiquiti Networks, Inc. (a) | | | 1,700 | | | | 65,586 | |
| Uni-Pixel, Inc. (a)(b) | | | 2,700 | | | | 44,415 | |
| | | | | | | | |
| | | | | | | 292,789 | |
| | | | | | | | |
| Telecommunication Services - 0.1% | | | | | | | | |
| Inteliquent, Inc. (a) | | | 5,900 | | | | 75,815 | |
| Leap Wireless International, Inc. (a)(b) | | | 2,700 | | | | 43,470 | |
| NII Holdings, Inc. (a)(b) | | | 6,900 | | | | 23,736 | |
| | | | | | | | |
| | | | | | | 143,021 | |
| | | | | | | | |
| Transportation - 0.1% | | | | | | | | |
| Arkansas Best Corp. (a) | | | 2,000 | | | | 54,740 | |
| XPO Logistics, Inc. (a)(b) | | | 2,000 | | | | 40,360 | |
| | | | | | | | |
| | | | | | | 95,100 | |
| | | | | | | | |
TOTAL COMMON STOCKS
(Cost $4,074,987) | | | | | | | 4,250,537 | |
| | | | | | | | |
| CONTINGENT VALUE RIGHTS - 0.0% | | | | | | | | |
|
| Pharmaceuticals, Biotechnology & Life Sciences - 0.0% | |
| Trius Therapeutics, Inc. Contingent Value Right (Acquired 8/12/13) (b)(d) | | | 3,300 | | | | — | |
| | | | | | | | |
TOTAL CONTINGENT VALUE RIGHTS
(Cost $0) | | | | | | | — | |
| | | | | | | | |
| RIGHTS - 0.0% | | | | | | | | |
| | |
| Consumer Services - 0.0% | | | | | | | | |
| Caesars Entertainment Corp. (Acquired 8/12/13) (b)(d) | | | 2,500 | | | | 21,600 | |
| | | | | | | | |
TOTAL RIGHTS
(Cost $0) | | | | | | | 21,600 | |
| | | | | | | | |
| | | | | | | | |
| | | SHARES | | | FAIR
VALUE | |
| SHORT-TERM INVESTMENTS - 96.2% | | | | | |
| | |
| Money Market Funds - 0.1% | | | | | | | | |
Fidelity Institutional Money Market Funds - Money Market
Portfolio - 0.01% (g) | | | 32,020 | | | $ | 32,020 | |
| First American Government Obligations Fund - Class Z - 0.01% (g) | | | 32,020 | | | | 32,020 | |
| First American Prime Obligations Fund - Class Z - 0.02% (g) | | | 32,019 | | | | 32,019 | |
Short Term Investments Trust - Liquid Assets Portfolio - Institutional
Class - 0.02% (g) | | | 32,019 | | | | 32,019 | |
| Short Term Investments Trust - Treasury Portfolio - Institutional Class - 0.07% (g) | | | 32,020 | | | | 32,020 | |
| | | | | | | | |
| | | | | | | 160,098 | |
| | | | | | | | |
| | | PRINCIPAL
AMOUNT | | | | |
| U.S. Treasury Bills - 96.1% | | | | | | | | |
| 0.032%, 12/05/2013 (e)(f) | | $ | 15,000,000 | | | | 14,999,540 | |
| 0.032%, 12/12/2013 (e)(f) | | | 15,000,000 | | | | 14,999,445 | |
| 0.035%, 12/19/2013 (e)(f) | | | 15,000,000 | | | | 14,999,300 | |
| 0.025%, 01/09/2014 (e)(f) | | | 19,300,000 | | | | 19,299,035 | |
| 0.020%, 01/16/2014 (e)(f) | | | 15,000,000 | | | | 14,999,205 | |
| 0.025%, 01/23/2014 (e)(f) | | | 15,000,000 | | | | 14,998,785 | |
| 0.035%, 01/30/2014 (e)(f) | | | 15,000,000 | | | | 14,998,680 | |
| | | | | | | | |
| | | | | | | 109,293,990 | |
| | | | | | | | |
TOTAL SHORT-TERM INVESTMENTS
(Cost $109,454,648) | | | | | | | 109,454,088 | |
| | | | | | | | |
TOTAL INVESTMENTS
(Cost $113,529,635) - 99.9% | | | | | | | 113,726,225 | |
| | | | | | | | |
| OTHER ASSETS IN EXCESS OF LIABILITIES - 0.1% | | | | | | | 98,594 | |
| | | | | | | | |
TOTAL NET ASSETS - 100.0% | | | | | | $ | 113,824,819 | |
| | | | | | | | |
Percentages are stated as a percent of net assets.
| (a) | All or portion of this security may be subject to call options written. |
| (b) | Non-income producing security. |
| (c) | Foreign issued security. Total foreign securities are $44,541 which represent 0.0% of net assets. |
| (d) | Security is illiquid, restricted to resale fair valued at October 31, 2013 using procedures approved by the Board of Trustees. The total value of positions fair valued was $21,600 or 0.0% of total net assets. |
| (e) | Rate shown is the effective yield based on purchased price. The calculation assumes the security is held to maturity. |
| (f) | All or a portion of security is held as collateral for put options written. |
| (g) | Rate shown is the 7-day effective yield. |
| | | | |
| | The accompanying footnotes are an integral part of these Schedules of Investments. | | (Continued) |
| | | | | | | | | | | | | | | | |
| 30 | | Stone Ridge Funds | | | | | | Annual Report | | | | | | October 2013 | | |
| | | | | | | | | | |
| | | | |
| Schedules of Investments | | | October 31, 2013 | |
| | |
| STONE RIDGE U.S. SMALL CAP VARIANCE RISK PREMIUM FUND | | |
Written Options
| | | | | | | | |
| DESCRIPTION | | CONTRACTS | | | VALUE | |
CALL OPTIONS | | | | | | | | |
| CBOE Russell 2000, Expires 11/01/2013, Strike Price $1,130. | | | 42 | | | $ | 105 | |
| | | | | | | | |
TOTAL CALL OPTIONS
(Premiums Received $13,458) | | | | | | | 105 | |
| | | | | | | | |
PUT OPTIONS | | | | | | | | |
| CBOE Russell 2000, Expires 11/01/2013, Strike Price $1,100. | | | 792 | | | | 146,520 | |
| CBOE Russell 2000, Expires 11/01/2013, Strike Price $1,110. | | | 152 | | | | 136,040 | |
| | | | | | | | |
TOTAL PUT OPTIONS
(Premiums Received $351,773) | | | | | | | 282,560 | |
| | | | | | | | |
TOTAL WRITTEN OPTIONS
(Premiums Received $365,231) | | | | | | $ | 282,665 | |
| | | | | | | | |
| | | | |
| | The accompanying footnotes are an integral part of these Schedules of Investments. | | |
| | | | | | | | | | | | | | | | |
| | Stone Ridge Funds | | | | | | Annual Report | | | | | | October 2013 | | 31 |
| | | | | | | | | | |
| | | | |
| Schedule of Investments | | | October 31, 2013 | |
| | |
| STONE RIDGE U.S. MASTER VARIANCE RISK PREMIUM FUND | | |
| | | | | | | | |
| INVESTMENT COMPANIES - 99.8% | | SHARES | | | FAIR VALUE | |
| | |
| Open-End Mutual Funds - 99.8% | | | | | | | | |
| Stone Ridge U.S. Small Cap Variance Risk Premium Fund - Class I (a) | | | 7,040,135 | | | $ | 74,977,437 | |
| Stone Ridge U.S. Variance Risk Premium Fund - Class I (a) | | | 14,391,969 | | | | 150,827,835 | |
| | | | | | | | |
TOTAL INVESTMENT COMPANIES
(Cost $217,889,852) | | | | | | | 225,805,272 | |
| | | | | | | | |
| |
| SHORT-TERM INVESTMENTS - 0.5% | | | | | |
| | |
| Money Market Funds - 0.5% | | | | | | | | |
| Fidelity Institutional Money Market Funds - Money Market Portfolio - 0.01% (b) | | | 235,485 | | | | 235,485 | |
| First American Government Obligations Fund - Class Z - 0.01% (b) | | | 235,485 | | | | 235,485 | |
| First American Prime Obligations Fund - Class Z - 0.02% (b) | | | 235,485 | | | | 235,485 | |
| Short Term Investments Trust - Liquid Assets Portfolio - Institutional Class - 0.02% (b) | | | 235,485 | | | | 235,485 | |
| Short Term Investments Trust - Treasury Portfolio - Institutional Class - 0.07% (b) | | | 235,485 | | | | 235,486 | |
| | | | | | | | |
TOTAL SHORT-TERM INVESTMENTS
(Cost $1,177,426) | | | | | | | 1,177,426 | |
| | | | | | | | |
TOTAL INVESTMENTS
(Cost $219,067,278) - 100.3% | | | | | | | 226,982,698 | |
| | | | | | | | |
| LIABILITIES IN EXCESS OF OTHER ASSETS - (0.3)% | | | | | | | (669,020) | |
| | | | | | | | |
TOTAL NET ASSETS - 100.0% | | | | | | $ | 226,313,678 | |
| | | | | | | | |
Percentages are stated as a percent of net assets.
| (a) | Affiliated company. See Footnote 10. |
| (b) | Rate shown is the 7-day effective yield. |
| | | | |
| | The accompanying footnotes are an integral part of these Schedules of Investments. | | |
| | | | | | | | | | | | | | | | |
| 32 | | Stone Ridge Funds | | | | | | Annual Report | | | | | | October 2013 | | |
| | | | | | | | | | |
| | | | |
| Statement of Assets and Liabilities | | | October 31, 2013 | |
| | | | | | | | | | | | | | | | | | | | |
| | | STONE RIDGE
REINSURANCE
RISK PREMIUM
FUND | | | STONE RIDGE
HIGH YIELD
REINSURANCE
RISK PREMIUM
FUND | | | STONE RIDGE
U.S. VARIANCE
RISK PREMIUM
FUND | | | STONE RIDGE
U.S. SMALL CAP
VARIANCE
RISK PREMIUM
FUND | | | STONE RIDGE
U.S. MASTER
VARIANCE
RISK PREMIUM
FUND | |
| ASSETS: | | | | | | | | | | | | | | | | | | | | |
| Investments, at fair value(1) | | | | | | | | | | | | | | | | | | | | |
Unaffiliated issuers | | $ | 501,925,849 | | | $ | 204,497,199 | | | $ | 360,861,697 | | | $ | 113,726,225 | | | $ | 1,177,426 | |
Affiliated issuers (See Note 10) | | | — | | | | — | | | | — | | | | — | | | | 225,805,272 | |
| Interest receivable | | | 2,978,831 | | | | 1,512,759 | | | | 17 | | | | 6 | | | | 10 | |
| Dividend receivable | | | — | | | | — | | | | 46,007 | | | | 150 | | | | — | |
| Receivable for fund shares sold | | | 32,450 | | | | 13,351 | | | | 556,220 | | | | 286,433 | | | | 140,790 | |
| Receivable for investments sold | | | 5,827,022 | | | | 1,288,568 | | | | 32,732 | | | | 721,685 | | | | — | |
| Foreign currencies, at value(2) | | | 625,425 | | | | 92,327 | | | | — | | | | — | | | | — | |
| Cash | | | 312,257 | | | | 213,693 | | | | 196,016 | | | | 252,309 | | | | — | |
| Due from broker | | | — | | | | — | | | | 1,519,540 | | | | — | | | | — | |
| Deferred offering expenses (See Note 6) | | | 53,738 | | | | 28,198 | | | | 94,762 | | | | 30,395 | | | | 114,519 | |
| Other assets | | | 31,621 | | | | 15,564 | | | | 14,756 | | | | 7,487 | | | | 12,679 | |
| Total assets | | | 511,787,193 | | | | 207,661,659 | | | | 363,321,747 | | | | 115,024,690 | | | | 227,250,696 | |
| LIABILITIES: | | | | | | | | | | | | | | | | | | | | |
| Payable for fund shares redeemed | | | 22,711 | | | | 9,251 | | | | 22,915 | | | | 26,758 | | | | 31,776 | |
| Options written, at fair value(3) | | | — | | | | — | | | | 480,296 | | | | 282,665 | | | | — | |
| Payable for investment securities purchased | | | — | | | | — | | | | 14,537 | | | | 644,575 | | | | 795,000 | |
| Payable to Investment Adviser | | | 560,755 | | | | 209,155 | | | | 291,552 | | | | 110,050 | | | | — | |
| Payable to Chief Compliance Officer | | | 17,628 | | | | 17,504 | | | | 18,414 | | | | 17,506 | | | | — | |
| Payable to Trustees | | | 18,074 | | | | 7,402 | | | | 12,235 | | | | 3,832 | | | | — | |
| Accrued distribution fees | | | 42,554 | | | | 17,351 | | | | 23,245 | | | | 1,470 | | | | 19,595 | |
| Other accrued expenses | | | 274,779 | | | | 172,276 | | | | 194,106 | | | | 113,015 | | | | 90,647 | |
| Total liabilities | | | 936,501 | | | | 432,939 | | | | 1,057,300 | | | | 1,199,871 | | | | 937,018 | |
| Total net assets | | $ | 510,850,692 | | | $ | 207,228,720 | | | $ | 362,264,447 | | | $ | 113,824,819 | | | $ | 226,313,678 | |
| | | | | | | | | | | | | | | | | | | | | |
| NET ASSETS CONSIST OF: | | | | | | | | | | | | | | | | | | | | |
| Capital stock | | $ | 492,122,435 | | | $ | 198,907,529 | | | $ | 349,855,484 | | | $ | 109,386,305 | | | $ | 218,391,358 | |
| Accumulated net investment income (loss) | | | 1,618,128 | | | | 907,424 | | | | — | | | | — | | | | — | |
| Accumulated undistributed net realized gain (loss) on investments | | | (236,047) | | | | (75,103) | | | | 8,319,575 | | | | 4,159,358 | | | | 6,900 | |
| Unrealized appreciation (depreciation) on: | | | | | | | | | | | | | | | | | | | | |
Investments and foreign currency translation | | | 17,346,176 | | | | 7,488,870 | | | | 3,321,620 | | | | 196,590 | | | | 7,915,420 | |
Futures contracts | | | — | | | | — | | | | (11,423) | | | | — | | | | — | |
Options written | | | — | | | | — | | | | 779,191 | | | | 82,566 | | | | — | |
| Total net assets | | $ | 510,850,692 | | | $ | 207,228,720 | | | $ | 362,264,447 | | | $ | 113,824,819 | | | $ | 226,313,678 | |
| | | | | | | | | | | | | | | | | | | | | |
| Class I | | | | | | | | | | | | | | | | | | | | |
| Net Assets | | $ | 360,434,428 | | | $ | 145,994,897 | | | $ | 264,883,202 | | | $ | 100,579,196 | | | $ | 146,295,918 | |
| Shares outstanding | | | 34,783,027 | | | | 14,029,257 | | | | 25,275,656 | | | | 9,442,913 | | | | 14,070,697 | |
| Class I Net asset value, offering and redemption price per share | | $ | 10.36 | | | $ | 10.41 | | | $ | 10.48 | | | $ | 10.65 | | | $ | 10.40 | |
| Class M | | | | | | | | | | | | | | | | | | | | |
| Net Assets | | $ | 150,416,264 | | | $ | 61,233,823 | | | $ | 97,381,245 | | | $ | 13,245,623 | | | $ | 80,017,760 | |
| Shares outstanding | | | 14,509,605 | | | | 5,882,281 | | | | 9,301,482 | | | | 1,244,693 | | | | 7,697,435 | |
| Class M Net asset value, offering and redemption price per share | | $ | 10.37 | | | $ | 10.41 | | | $ | 10.47 | | | $ | 10.64 | | | $ | 10.40 | |
| | | | | | | | | | | | | | | | | | | | | |
| (1) Cost of Investments | | | | | | | | | | | | | | | | | | | | |
Unaffiliated issuers | | $ | 484,581,195 | | | $ | 197,011,359 | | | $ | 357,540,077 | | | $ | 113,529,635 | | | $ | 1,177,426 | |
Affiliated issuers (See Note 10) | | | — | | | | — | | | | — | | | | — | | | | 217,889,852 | |
| (2) Cost of foreign currencies | | | 623,401 | | | | 89,249 | | | | — | | | | — | | | | — | |
| (3) Premiums received | | | — | | | | — | | | | 1,259,486 | | | | 365,231 | | | | — | |
| | | | |
| | The accompanying notes are an integral part of these financial statements. | | |
| | | | | | | | | | | | | | | | |
| | Stone Ridge Funds | | | | | | Annual Report | | | | | | October 2013 | | 33 |
| | | | | | | | | | |
| | | | |
| Statement of Operations | | | For the period ended October 31, 2013 | |
| | | | | | | | | | | | | | | | | | | | |
| | | STONE RIDGE
REINSURANCE
RISK PREMIUM
FUND(1) | | | STONE RIDGE
HIGH YIELD
REINSURANCE
RISK PREMIUM
FUND(1) | | | STONE RIDGE
U.S. VARIANCE
RISK PREMIUM
FUND(2) | | | STONE RIDGE
U.S. SMALL CAP
VARIANCE
RISK PREMIUM
FUND(2) | | | STONE RIDGE
U.S. MASTER
VARIANCE
RISK PREMIUM
FUND(3) | |
| INVESTMENT INCOME: | | | | | | | | | | | | | | | | | | | | |
| Dividend income | | | | | | | | | | | | | | | | | | | | |
Affiliated issuers (See Note 10) | | $ | — | | | $ | — | | | $ | — | | | $ | — | | | $ | 4,959,211 | |
Unaffiliated issuers | | | — | | | | — | | | | 294,630 | | | | 2,114 | | | | — | |
| Interest income | | | 11,967,152 | | | | 6,171,780 | | | | 40,650 | | | | 11,711 | | | | 79 | |
| Other income | | | — | | | | — | | | | — | | | | 3,601 | | | | — | |
| Total investment income | | | 11,967,152 | | | | 6,171,780 | | | | 335,280 | | | | 17,426 | | | | 4,959,290 | |
| Advisory fees (See Note 4) | | | 4,978,393 | | | | 2,007,066 | | | | 1,782,965 | | | | 530,851 | | | | — | |
| Fund accounting and administration fees | | | 310,115 | | | | 125,207 | | | | 120,823 | | | | 37,052 | | | | 210 | |
| Legal fees | | | 237,928 | | | | 95,544 | | | | 67,196 | | | | 22,548 | | | | 61,448 | |
| Offering costs | | | 177,992 | | | | 92,548 | | | | 62,332 | | | | 29,900 | | | | 39,444 | |
| Distribution (12b-1) fees — Class M Only | | | 156,295 | | | | 63,224 | | | | 70,613 | | | | 6,001 | | | | 42,898 | |
| Transfer agency fees and expenses | | | 108,068 | | | | 82,996 | | | | 27,776 | | | | 17,484 | | | | 39,706 | |
| Audit and tax related fees | | | 95,132 | | | | 90,872 | | | | 62,008 | | | | 62,008 | | | | 35,498 | |
| Federal and state registration fees | | | 78,564 | | | | 34,774 | | | | 50,072 | | | | 16,288 | | | | 29,476 | |
| Trustees fees and expenses | | | 33,000 | | | | 13,408 | | | | 20,196 | | | | 6,154 | | | | — | |
| Custody fees | | | 19,027 | | | | 7,303 | | | | 114,336 | | | | 3,971 | | | | 240 | |
| Chief Compliance Officer fees | | | 17,628 | | | | 17,504 | | | | 18,414 | | | | 17,506 | | | | — | |
| Other expenses | | | 105,852 | | | | 47,416 | | | | 30,616 | | | | 19,209 | | | | 15,624 | |
| Total expenses before Adviser waiver | | | 6,317,994 | | | | 2,677,862 | | | | 2,427,347 | | | | 768,972 | | | | 264,544 | |
| Expenses waived by Adviser (See Note 4) | | | (93,761) | | | | (67,746) | | | | (91,746) | | | | (33,880) | | | | — | |
| Net expenses before Adviser recoupment | | | 6,224,233 | | | | 2,610,116 | | | | 2,335,601 | | | | 735,092 | | | | 264,544 | |
| Expenses recouped by Adviser (See Note 4) | | | 130,299 | | | | 62,162 | | | | 9,427 | | | | 14,125 | | | | — | |
| Total net expenses | | | 6,354,532 | | | | 2,672,278 | | | | 2,345,028 | | | | 749,217 | | | | 264,544 | |
| Net investment income (loss) | | | 5,612,620 | | | | 3,499,502 | | | | (2,009,748) | | | | (731,791) | | | | 4,694,746 | |
| NET REALIZED AND UNREALIZED GAIN (LOSS) ON INVESTMENTS : | | | | | | | | | | | | | | | | | | | | |
| Net realized gain (loss) on: | | | | | | | | | | | | | | | | | | | | |
Investments | | | | | | | | | | | | | | | | | | | | |
Affiliated issuers (See Note 10) | | | — | | | | — | | | | — | | | | — | | | | 842 | |
Unaffiliated issuers | | | 92,837 | | | | 54,785 | | | | 1,225,836 | | | | (135,953) | | | | — | |
Options written | | | — | | | | — | | | | 18,389,959 | | | | 7,810,409 | | | | — | |
Futures contracts | | | — | | | | — | | | | (1,482,483) | | | | (394,417) | | | | — | |
Foreign currency translation | | | (120,386) | | | | 15,142 | | | | — | | | | — | | | | — | |
| Net change in unrealized appreciation (depreciation) on: | | | | | | | | | | | | | | | | | | | | |
Investments | | | 16,080,802 | | | | 7,479,897 | | | | 3,321,620 | | | | 196,590 | | | | 7,915,420 | |
Options written | | | — | | | | — | | | | 779,191 | | | | 82,566 | | | | — | |
Futures contracts | | | — | | | | — | | | | (11,423) | | | | — | | | | — | |
Foreign currency translation | | | 1,265,374 | | | | 8,973 | | | | — | | | | — | | | | — | |
| Net realized and unrealized gain | | | 17,318,627 | | | | 7,558,797 | | | | 22,222,700 | | | | 7,559,195 | | | | 7,916,262 | |
| Net increase in net assets resulting from operations | | $ | 22,931,247 | | | $ | 11,058,299 | | | $ | 20,212,952 | | | $ | 6,827,404 | | | $ | 12,611,008 | |
| | | | | | | | | | | | | | | | | | | | | |
| | (1) | Commenced operations on February 1, 2013 |
| | (2) | Commenced operations on May 1, 2013 |
| | (3) | Commenced operations on May 22, 2013 |
| | | | |
| | The accompanying notes are an integral part of these financial statements. | | |
| | | | | | | | | | | | | | | | |
| 34 | | Stone Ridge Funds | | | | | | Annual Report | | | | | | October 2013 | | |
| | | | | | | | | | |
| | | | |
| Statement of Changes in Net Assets | | | For the period ended October 31, 2013 | |
| | | | | | | | | | | | | | | | | | | | |
| | | STONE RIDGE
REINSURANCE
RISK PREMIUM
FUND (1) | | | STONE RIDGE
HIGH YIELD
REINSURANCE
RISK PREMIUM
FUND(1) | | | STONE RIDGE
U.S. VARIANCE
RISK PREMIUM
FUND(2) | | | STONE RIDGE
U.S. SMALL CAP
VARIANCE
RISK PREMIUM
FUND(2) | | | STONE RIDGE
U.S. MASTER
VARIANCE
RISK PREMIUM
FUND(3) | |
| OPERATIONS: | | | | | | | | | | | | | | | | | | | | |
| Net investment gain (loss) | | $ | 5,612,620 | | | $ | 3,499,502 | | | $ | (2,009,748) | | | $ | (731,791) | | | $ | 4,694,746 | |
| Net realized (gain) loss on: | | | | | | | | | | | | | | | | | | | | |
Investments | | | | | | | | | | | | | | | | | | | | |
Affiliated issuers (See Note 10) | | | — | | | | — | | | | — | | | | — | | | | 842 | |
Unaffiliated issuers | | | 92,837 | | | | 54,785 | | | | 1,225,836 | | | | (135,953) | | | | — | |
Options written | | | — | | | | — | | | | 18,389,959 | | | | 7,810,409 | | | | — | |
Futures contracts | | | — | | | | — | | | | (1,482,483) | | | | (394,417) | | | | — | |
Foreign currency translation | | | (120,386) | | | | 15,142 | | | | — | | | | — | | | | — | |
| Net change in unrealized appreciation (depreciation) on: | | | | | | | | | | | | | | | | | | | | |
Investments | | | 16,080,802 | | | | 7,479,897 | | | | 3,321,620 | | | | 196,590 | | | | 7,915,420 | |
Options written | | | — | | | | — | | | | 779,191 | | | | 82,566 | | | | — | |
Futures contracts | | | — | | | | — | | | | (11,423) | | | | — | | | | — | |
Foreign currency translation | | | 1,265,374 | | | | 8,973 | | | | — | | | | — | | | | — | |
Net increase in assets resulting from operations | | | 22,931,247 | | | | 11,058,299 | | | | 20,212,952 | | | | 6,827,404 | | | | 12,611,008 | |
| | | | | |
| DISTRIBUTIONS TO SHAREHOLDERS: | | | | | | | | | | | | | | | | | | | | |
| From net investment income — Class I | | | (3,146,149) | | | | (1,992,074) | | | | — | | | | — | | | | (3,160,745) | |
| From net investment income — Class M | | | (1,129,457) | | | | (782,166) | | | | — | | | | — | | | | (1,541,683) | |
| From net realized gain — Class I | | | — | | | | — | | | | (5,324,124) | | | | (2,162,691) | | | | — | |
| From net realized gain — Class M | | | — | | | | — | | | | (2,489,693) | | | | (235,481) | | | | — | |
Total Distributions | | | (4,275,606) | | | | (2,774,240) | | | | (7,813,817) | | | | (2,398,172) | | | | (4,702,428) | |
| | | | | |
| CAPITAL SHARE TRANSACTIONS: | | | | | | | | | | | | | | | | | | | | |
| Proceeds from shares sold — Class I | | | 357,387,240 | | | | 143,676,261 | | | | 258,551,729 | | | | 97,713,681 | | | | 141,147,951 | |
| Proceeds from shares sold — Class M | | | 165,014,285 | | | | 66,493,476 | | | | 115,936,713 | | | | 12,815,755 | | | | 79,901,736 | |
| Proceeds from shares issued to holders in reinvestment of dividends — Class I | | | 2,636,031 | | | | 1,703,079 | | | | 1,486,082 | | | | 498,246 | | | | 1,606,078 | |
| Proceeds from shares issued to holders in reinvestment of dividends — Class M | | | 900,009 | | | | 613,698 | | | | 2,380,290 | | | | 220,368 | | | | 1,286,382 | |
| Cost of shares redeemed — Class I | | | (12,627,802) | | | | (5,188,094) | | | | (3,525,574) | | | | (1,675,306) | | | | (1,787,633) | |
| Cost of shares redeemed — Class M | | | (21,214,712) | | | | (8,453,759) | | | | (24,963,928) | | | | (177,157) | | | | (3,749,416) | |
Net increase in net assets from capital share transactions | | | 492,095,051 | | | | 198,844,661 | | | | 349,865,312 | | | | 109,395,587 | | | | 218,405,098 | |
| Total increase in net assets | | | 510,750,692 | | | | 207,128,720 | | | | 362,264,447 | | | | 113,824,819 | | | | 226,313,678 | |
| | | | | |
| NET ASSETS: | | | | | | | | | | | | | | | | | | | | |
| Beginning of period | | | 100,000 | | | | 100,000 | | | | — | | | | — | | | | — | |
| End of period | | $ | 510,850,692 | | | $ | 207,228,720 | | | $ | 362,264,447 | | | $ | 113,824,819 | | | $ | 226,313,678 | |
| | | | | | | | | | | | | | | | | | | | | |
| Accumulated net investment income | | $ | 1,618,128 | | | $ | 907,424 | | | $ | — | | | $ | — | | | $ | — | |
| | (1) | Commenced operations on February 1, 2013 |
| | (2) | Commenced operations on May 1, 2013 |
| | (3) | Commenced operations on May 22, 2013 |
| | | | |
| | The accompanying notes are an integral part of these financial statements. | | |
| | | | | | | | | | | | | | | | |
| | Stone Ridge Funds | | | | | | Annual Report | | | | | | October 2013 | | 35 |
| | | | | | | | | | |
| | | | |
| Statement of Cash Flows | | | For the Period Ended October 31, 2013(1) | |
| | | | | | | | |
| | | STONE RIDGE
REINSURANCE
RISK PREMIUM
FUND | | | STONE RIDGE
HIGH YIELD
REINSURANCE
RISK PREMIUM
FUND | |
| CASH FLOWS FROM OPERATING ACTIVITIES | | | | | | | | |
| Net increase in net assets resulting from operations | | $ | 22,931,247 | | | $ | 11,058,299 | |
| Adjustments to reconcile net increase in net assets resulting from operations to net cash used in operating activities: | | | | | | | | |
Net realized and unrealized gain on investments: | | | (17,499,743) | | | | (7,540,625) | |
Amortization and accretion of premium and discount | | | 1,873,614 | | | | 829,393 | |
| Changes in assets and liabilities: | | | | | | | | |
Foreign currency | | | (625,425) | | | | (92,327) | |
Receivable for investments sold | | | (5,827,022) | | | | (1,288,568) | |
Receivable from Advisor | | | 124,511 | | | | 48,267 | |
Interest receivable | | | (2,978,831) | | | | (1,512,759) | |
Deferred offering expenses | | | 178,470 | | | | 93,019 | |
Other assets | | | (31,621) | | | | (15,564) | |
Payable to Chief Compliance Officer | | | 17,628 | | | | 17,504 | |
Payable to Investment Adviser | | | 560,755 | | | | 209,155 | |
Payable to Trustees | | | 18,074 | | | | 7,402 | |
Accrued distribution fees | | | 42,554 | | | | 17,351 | |
Other accrued expenses and other liabilities | | | (81,940) | | | | 2,791 | |
| Purchases of investments | | | (549,073,845) | | | | (221,320,787) | |
| Proceeds from sale of investments | | | 62,967,504 | | | | 23,973,785 | |
| Net purchases and sales of short-term investments | | | (193,379) | | | | (438,964) | |
| Net cash used by operating activities | | | (487,597,448) | | | | (195,952,628) | |
| | |
| CASH FLOWS FROM FINANCING ACTIVITIES: | | | | | | | | |
Proceeds from shares issued | | | 522,369,075 | | | | 210,156,386 | |
Payment on shares redeemed | | | (33,819,803) | | | | (13,632,602) | |
Cash distributions paid to shareholders | | | (739,566) | | | | (457,463) | |
Net cash provided by financing activities | | | 487,809,706 | | | | 196,066,321 | |
| Net increase in cash | | | 212,257 | | | | 113,693 | |
Cash, beginning of period | | | 100,000 | | | | 100,000 | |
Cash, end of period | | $ | 312,257 | | | $ | 213,693 | |
(1)Funds commenced operations on February 1, 2013 | | | | | | | | |
| | |
| SUPPLEMENTAL DISCLOSURES | | | | | | | | |
Non-cash financing activities-distributions reinvested | | $ | 3,536,040 | | | $ | 2,316,777 | |
| | | | |
| | The accompanying notes are an integral part of these financial statements. | | |
| | | | | | | | | | | | | | | | |
| 36 | | Stone Ridge Funds | | | | | | Annual Report | | | | | | October 2013 | | |
| | | | | | | | | | |
[Intentionally Left Blank]
| | | | |
| Financial Highlights | | | October 31, 2013 | |
| | | | | | | | | | | | | | | | |
| | | PER SHARE DATA: | |
| | | Income (Loss) from Investment Operations | |
| | | Net Asset
Value,
Beginning
of Period | | | Net
Investment
Income
(Loss)(4) | | | Net Realized
and
Unrealized Gains
on Investments | | | Total from
Investment
Operations | |
| STONE RIDGE REINSURANCE RISK PREMIUM FUND—CLASS I | | | | | | | | | | | | | | | | |
| Period Ended October 31, 2013(1) | | | $10.00 | | | | 0.13 | | | | 0.32 | | | | 0.45 | |
| STONE RIDGE REINSURANCE RISK PREMIUM FUND—CLASS M | | | | | | | | | | | | | | | | |
| Period Ended October 31, 2013(1) | | | $10.00 | | | | 0.12 | | | | 0.33 | | | | 0.45 | |
| STONE RIDGE HIGH YIELD REINSURANCE RISK PREMIUM FUND—CLASS I | | | | | | | | | | | | | | | | |
| Period Ended October 31, 2013(1) | | | $10.00 | | | | 0.20 | | | | 0.35 | | | | 0.55 | |
| STONE RIDGE HIGH YIELD REINSURANCE RISK PREMIUM FUND—CLASS M | | | | | | | | | | | | | | | | |
| Period Ended October 31, 2013(1) | | | $10.00 | | | | 0.18 | | | | 0.36 | | | | 0.54 | |
| STONE RIDGE U.S. VARIANCE RISK PREMIUM FUND—CLASS I | | | | | | | | | | | | | | | | |
| Period Ended October 31, 2013(2) | | | $10.00 | | | | (0.07) | | | | 0.80 | | | | 0.73 | |
| STONE RIDGE U.S. VARIANCE RISK PREMIUM FUND—CLASS M | | | | | | | | | | | | | | | | |
| Period Ended October 31, 2013(2) | | | $10.00 | | | | (0.07) | | | | 0.79 | | | | 0.72 | |
| STONE RIDGE U.S. SMALL CAP VARIANCE RISK PREMIUM FUND—CLASS I | | | | | | | | | | | | | | | | |
| Period Ended October 31, 2013(2) | | | $10.00 | | | | (0.09) | | | | 0.99 | | | | 0.90 | |
| STONE RIDGE U.S. SMALL CAP VARIANCE RISK PREMIUM FUND—CLASS M | | | | | | | | | | | | | | | | |
| Period Ended October 31, 2013(2) | | | $10.00 | | | | (0.10) | | | | 0.99 | | | | 0.89 | |
| STONE RIDGE U.S. MASTER VARIANCE RISK PREMIUM FUND—CLASS I | | | | | | | | | | | | | | | | |
| Period Ended October 31, 2013(3) | | | $10.00 | | | | 0.24 | (7) | | | 0.39 | (7) | | | 0.63 | (7) |
| STONE RIDGE U.S. MASTER VARIANCE RISK PREMIUM FUND—CLASS M | | | | | | | | | | | | | | | | |
| Period Ended October 31, 2013(3) | | | $10.00 | | | | 0.24 | (7) | | | 0.39 | (7) | | | 0.63 | (7) |
| | (1) | The Fund commenced operations on February 1, 2013. |
| | (2) | The Fund commenced operations on May 1, 2013. |
| | (3) | The Fund commenced operations on May 22, 2013. |
| | (4) | Net investment income (loss) per share has been calculated based on average shares outstanding during the period. |
| | (7) | Per share amounts only include income and expenses of the U.S. Master Variance Risk Premium Fund which are shown on the Fund’s Statement of Operations. Amounts do not include the Fund’s proportionate share of the income and expenses of the underlying investor funds. |
| | | | |
| | The accompanying notes are an integral part of these financial statements. | | |
| | | | | | | | | | | | | | | | |
| 38 | | Stone Ridge Funds | | | | | | Annual Report | | | | | | October 2013 | | |
| | | | | | | | | | |
| | | | |
| Financial Highlights | | | October 31, 2013 | |
| | | | | | | | | | | | | | | | | | | | | | | | | | | | | | | | | | | | | | | | | | | | |
| | | SUPPLEMENT DATA AND RATIOS: |
| Distributions to Shareholders | | | | | | | | | | | | | | | | | | | | | | | | | | | |
Net
Investment
Income | | | Net
Realized
Gains | | | Total
Distributions | | | Net Asset
Value, End of Period | | | Total
Return | | | Net Assets, End
of Period (000’s) | | | Ratio of Expenses to
Average
Net Assets
(Before Expense
Reimbursement/
Recoupment) | | | Ratio of
Expenses to
Average
Net Assets
(After Expense
Reimbursement/
Recoupment) | | | Ratio of Net
Investment Income
(Loss) to Average
Net Assets
(Before Expense
Reimbursement/
Recoupment) | | | Ratio of Net
Investment
Income
(Loss) to Average
Net Assets
(After Expense
Reimbursement/
Recoupment) | | | Portfolio
Turnover Rate | | | |
| | | | | | | | | | | | | | | | | | | | | | | | | | | | | | | | | | | | | | | | | | | | |
| | (0.09 | ) | | | — | | | | (0.09 | ) | | $ | 10.36 | | | | 4.53% | (5) | | $ | 360,434 | | | | 1.86% | (6) | | | 1.87% | (6) | | | 1.76% | (6) | | | 1.75% | (6) | | | 11.38% | (5) | | |
| | | | | | | | | | | | | | | | | | | | | | | | | | | | | | | | | | | | | | | | | | | | |
| | (0.08 | ) | | | — | | | | (0.08 | ) | | $ | 10.37 | | | | 4.48% | (5) | | $ | 150,416 | | | | 2.01% | (6) | | | 2.02% | (6) | | | 1.56% | (6) | | | 1.55% | (6) | | | 11.38% | (5) | | |
| | | | | | | | | | | | | | | | | | | | | | | | | | | | | | | | | | | | | | | | | | | | |
| | (0.14 | ) | | | — | | | | (0.14 | ) | | $ | 10.41 | | | | 5.58% | (5) | | $ | 145,995 | | | | 1.95% | (6) | | | 1.94% | (6) | | | 2.66% | (6) | | | 2.67% | (6) | | | 12.82% | (5) | | |
| | | | | | | | | | | | | | | | | | | | | | | | | | | | | | | | | | | | | | | | | | | | |
| | (0.13 | ) | | | — | | | | (0.13 | ) | | $ | 10.41 | | | | 5.43% | (5) | | $ | 61,234 | | | | 2.11% | (6) | | | 2.10% | (6) | | | 2.47% | (6) | | | 2.48% | (6) | | | 12.82% | (5) | | |
| | | | | | | | | | | | | | | | | | | | | | | | | | | | | | | | | | | | | | | | | | | | |
| | — | | | | (0.25 | ) | | | (0.25 | ) | | $ | 10.48 | | | | 7.35% | (5) | | $ | 264,883 | | | | 1.65% | (6) | | | 1.59% | (6) | | | (1.42% | )(6) | | | (1.36% | )(6) | | | 56.76% | (5) | | |
| | | | | | | | | | | | | | | | | | | | | | | | | | | | | | | | | | | | | | | | | | | | |
| | — | | | | (0.25 | ) | | | (0.25 | ) | | $ | 10.47 | | | | 7.25% | (5) | | $ | 97,381 | | | | 1.80% | (6) | | | 1.74% | (6) | | | (1.57% | )(6) | | | (1.51% | )(6) | | | 56.76% | (5) | | |
| | | | | | | | | | | | | | | | | | | | | | | | | | | | | | | | | | | | | | | | | | | | |
| | — | | | | (0.25 | ) | | | (0.25 | ) | | $ | 10.65 | | | | 9.09% | (5) | | $ | 100,579 | | | | 1.80% | (6) | | | 1.75% | (6) | | | (1.76% | )(6) | | | (1.71% | )(6) | | | 33.66% | (5) | | |
| | | | | | | | | | | | | | | | | | | | | | | | | | | | | | | | | | | | | | | | | | | | |
| | — | | | | (0.25 | ) | | | (0.25 | ) | | $ | 10.64 | | | | 8.99% | (5) | | $ | 13,246 | | | | 1.95% | (6) | | | 1.90% | (6) | | | (1.91% | )(6) | | | (1.86% | )(6) | | | 33.66% | (5) | | |
| | | | | | | | | | | | | | | | | | | | | | | | | | | | | | | | | | | | | | | | | | | | |
| | (0.23 | ) | | | — | | | | (0.23 | ) | | $ | 10.40 | | | | 6.42% | (5) | | $ | 146,296 | | | | 0.26% | (6) | | | N/A | | | | 5.29% | (6) | | | N/A | | | | 0.62% | (5) | | |
| | | | | | | | | | | | | | | | | | | | | | | | | | | | | | | | | | | | | | | | | | | | |
| | (0.23 | ) | | | — | | | | (0.23 | ) | | $ | 10.40 | | | | 6.36% | (5) | | $ | 80,018 | | | | 0.41% | (6) | | | N/A | | | | 5.37% | (6) | | | N/A | | | | 0.62% | (5) | | |
| | | | |
| | The accompanying notes are an integral part of these financial statements. | | |
| | | | | | | | | | | | | | | | |
| | Stone Ridge Funds | | | | | | Annual Report | | | | | | October 2013 | | 39 |
| | | | | | | | | | |
| | | | |
| Notes to Financial Statements | | | October 31, 2013 | |
1. Organization
Stone Ridge Trust (the “Trust”) was organized as a Delaware statutory trust on September 28, 2012, and is registered under the Investment Company Act of 1940 (the “1940 Act”), as amended, as an open-end management investment company issuing shares in multiple series, each series representing a distinct portfolio with its own investment objectives and policies. As of October 31, 2013, the Trust consisted of five series (the “Funds”): the Stone Ridge Reinsurance Risk Premium Fund (the “Reinsurance Risk Premium Fund”), the Stone Ridge High Yield Reinsurance Risk Premium Fund (the “High Yield Reinsurance Risk Premium Fund”, together with the Reinsurance Risk Premium Fund the “Reinsurance Funds”), the Stone Ridge U.S. Variance Risk Premium Fund (the “U.S. VRP Fund”), the Stone Ridge U.S. Small Cap Variance Risk Premium Fund (the “U.S. Small Cap VRP Fund”, together with the U.S. VRP Fund, the “U.S. VRP Funds”), and the Stone Ridge U.S. Master Variance Risk Premium Fund (the “U.S. Master VRP Fund”, together with the U.S. VRP Funds, the “U.S. VRP Portfolio of Funds”). The Reinsurance Funds commenced operations on February 1, 2013. The U.S. VRP Funds commenced operations on May 1, 2013. The U.S. Master VRP Fund commenced operations on May 22, 2013. The Funds each offer two classes of shares to investors (each a “Class”); Class I shares, with no front-end or back-end sales charges, no 12b-1 fees and no redemption fee; and the Class M Shares with no front-end or back-end sales charges, a 0.15% 12b-1 fee and no redemption fee. There are an unlimited number of authorized shares.
The investment objective of Reinsurance Funds is to seek a high level of total return consisting of income and capital appreciation. The Reinsurance Funds seek to achieve this objective by investing in event-linked bonds, Quota Shares and, to a lesser extent may invest in, event-linked swaps, equity securities and derivatives of equity securities of companies in the reinsurance industry. The investment objective of the U.S. VRP Portfolio of Funds is long-term capital appreciation. The U.S. VRP Fund seeks to achieve this investment objective by creating exposure to the U.S. securities through writing put and call option on those equities. The U.S. Small Cap VRP Fund seeks to achieve this investment objective by creating exposure to U.S. small-cap securities by writing put and call options on U.S. small cap securities. The U.S. Master VRP Fund seeks its investment objective by investing in the U.S. VRP Funds.
2. Summary of Significant Accounting Policies
The following is a summary of significant accounting policies consistently followed by the Funds in the preparation of their financial statements. The financial statements have been prepared in conformity with accounting principles generally accepted in the United States of America (“GAAP”).
(a) Investment Valuation and Fair Value Measurement In determining the net asset value (“NAV”) of the Funds’ shares, securities which are traded on a domestic national stock exchange are valued at the last sale price each day on the securities exchange on which the securities are primarily traded. Securities traded principally on the Nasdaq Stock Market are normally valued at the Nasdaq Official Closing Price (“NOCP”) provided by Nasdaq each business day. Exchange-traded securities for which there were no transactions are valued at the mean between the closing bid and asked prices. Non-exchange traded equity securities are valued at the mean price in the over-the-counter market. If a non-exchange traded equity does not trade on a particular day, the mean between the closing bid and asked prices is used.
Investments in open-end mutual funds, including money market funds, are generally priced at the ending net asset value (NAV) provided by the service agent of the Trust. Investments in closed-end mutual funds are valued at the last sale price on the exchange on which the shares are primarily traded.
Futures contracts are valued at the settlement price on the exchange on which they are primarily traded.
Debt securities with a remaining maturity in excess of 60 days, including corporate debt securities and municipal debt securities, event-linked bonds, collateralized mortgage obligation, loans, and other asset backed securities are valued daily using the mean between the closing bid and asked prices provided by either a pricing service or two independent brokers. Debt securities with a remaining maturity of less than 60 days are valued at amortized cost, which approximates fair value.
In the event that the Trust’s pricing vendor is unable to provide two independent broker quotes for event-linked bonds (catastrophe bonds), the Advisor will engage an independent data delivery vendor to obtain firm bids from two independent brokers or from a market maker in the security on a weekly basis and on the last business day of each month. The Advisor monitors event-linked bonds daily for significant events that could affect the value of these instruments.
| | | | | | | | | | | | | | | | |
| 40 | | Stone Ridge Funds | | | | | | Annual Report | | | | | | October 2013 | | |
| | | | | | | | | | |
| | | | |
| Notes to Financial Statements | | | October 31, 2013 | |
Exchange-traded options are valued at the mean of their highest bid and lowest ask, taken across all exchanges where the options are traded. Over the counter options not traded on an exchange are valued at the mean of the bid and asked quotations.
Participation Notes and Preference Shares (Quota Shares) are valued on a weekly basis and on the last business day of each month. These instruments are valued based upon indicative bids provided by third-party brokers. An independent third-party valuation model is used to verify the reasonability of such indicative bids. Quota Shares are monitored daily for significant events that could affect the value of the instruments.
For the purpose of determining the fair value, the Committee may use a variety of valuation methodologies, including: i) mathematical techniques that refer to the prices of similar or related securities; ii) a percentage increase or decrease across all securities of a region, country or industry affected by a significant event; iii) a multiple of earnings; iv) a discount from the market value of a similar freely-traded security; v) the yield to maturity of debt securities; vi) broker indications or single broker bids (provided that such indications or bids may not be the sole basis for valuation determination); vii) mathematical models developed by independent third parties; or viii) any combination of the aforementioned.
The Funds have adopted authoritative fair valuation accounting standards which establish an authoritative definition of fair value and set out a hierarchy for measuring fair value. These standards require additional disclosures about the various inputs and valuation techniques used to develop the measurements of fair value and a discussion of changes in valuation techniques and related inputs during the period. The hierarchy gives the highest priority to unadjusted quoted prices in active markets for identical assets or liabilities (Level 1 measurement) and the lowest priority to unobservable inputs (Level 3 measurements). The three levels of the fair value hierarchy are as follows:
Level 1: Inputs that reflect unadjusted quoted prices in active markets for identical assets or liabilities that the Fund has the ability to access at the measurement date;
Level 2: Significant inputs other than quoted prices that are observable for the asset or liability either directly or indirectly, including inputs in markets that are not considered to be active and firm bids from brokers or market makers which are not publically available;
Level 3: Significant inputs that are unobservable.
Inputs are used in applying the various valuation techniques and broadly refer to the assumptions that market participants use to make valuation decisions, including assumptions about risk. A financial instrument’s level within the fair value hierarchy is based on the lowest level of any input that is significant to the fair value measurement. However, the determination of what constitutes “observable” requires significant judgment by the Adviser. The Adviser considers observable data to be that market data which is readily available, regularly distributed or updated, reliable and verifiable, not proprietary, and provided by independent sources that are actively involved in the relevant market. The categorization of a financial instrument within the hierarchy is based upon the pricing transparency of the instrument and does not necessarily correspond to the Adviser’s perceived risk of that instrument.
There were no transfers between Levels during the reporting period. Transfers between levels are recognized at the end of the reporting period. The following tables summarize the inputs used to value the Funds’ investments as of October 31, 2013.
| | | | | | | | | | | | | | | | |
| DESCRIPTION | | LEVEL 1 | | | LEVEL 2 | | | LEVEL 3 | | | TOTAL | |
Stone Ridge Reinsurance Risk Premium Fund | | | | | | | | | | | | | | | | |
| Assets | | | | | | | | | | | | | | | | |
| Event-Linked Bonds (1) | | $ | — | | | $ | 419,501,320 | | | $ | — | | | $ | 419,501,320 | |
| Participation Notes (Quota Shares) (1) | | | — | | | | — | | | | 79,736,800 | | | | 79,736,800 | |
| Preference Shares (Quota Shares) (1) | | | — | | | | — | | | | 2,494,350 | | | | 2,494,350 | |
| Money Market Funds | | | 193,379 | | | | — | | | | — | | | | 193,379 | |
| | | | |
Total Assets | | $ | 193,379 | | | $ | 419,501,320 | | | $ | 82,231,150 | | | $ | 501,925,849 | |
| | | | | | | | | | | | | | | | |
| | Stone Ridge Funds | | | | | | Annual Report | | | | | | October 2013 | | 41 |
| | | | | | | | | | |
| | | | |
| Notes to Financial Statements | | | October 31, 2013 | |
| | | | | | | | | | | | | | | | |
| DESCRIPTION | | LEVEL 1 | | | LEVEL 2 | | | LEVEL 3 | | | TOTAL | |
Stone Ridge High Yield Reinsurance Risk Premium Fund | | | | | | | | | | | | | | | | |
| Assets | | | | | | | | | | | | | | | | |
| Event-Linked Bonds (1) | | $ | — | | | $ | 171,443,585 | | | $ | — | | | $ | 171,443,585 | |
| Participation Notes (Quota Shares) (1) | | | — | | | | — | | | | 31,783,200 | | | | 31,783,200 | |
| Preference Shares (Quota Shares) (1) | | | — | | | | — | | | | 831,450 | | | | 831,450 | |
| Money Market Funds | | | 438,964 | | | | — | | | | — | | | | 438,964 | |
| | | | |
Total Assets | | $ | 438,964 | | | $ | 171,443,585 | | | $ | 32,614,650 | | | $ | 204,497,199 | |
| | | | |
Stone Ridge U.S. Variance Risk Premium Fund | | | | | | | | | | | | | | | | |
| Assets | | | | | | | | | | | | | | | | |
| Common Stocks (1) | | $ | 65,476,011 | | | $ | — | | | $ | — | | | $ | 65,476,011 | |
| Real Estate Investment Trusts (1) | | | 1,069,146 | | | | — | | | | — | | | | 1,069,146 | |
| Investment Companies—Closed End (1) | | | 11,208 | | | | — | | | | — | | | | 11,208 | |
| Rights (1) | | | — | | | | — | | | | 8,640 | | | | 8,640 | |
| U.S. Treasury Bills | | | — | | | | 293,383,875 | | | | — | | | | 293,383,875 | |
| Money Market Funds | | | 912,817 | | | | — | | | | — | | | | 912,817 | |
| | | | |
Total Assets | | $ | 67,469,182 | | | $ | 293,383,875 | | | $ | 8,640 | | | $ | 360,861,697 | |
| Liabilities | | | | | | | | | | | | | | | | |
| Written Options | | $ | — | | | $ | (480,296 | ) | | $ | — | | | $ | (480,296 | ) |
| | | | |
Total Liabilities | | $ | — | | | $ | (480,296 | ) | | $ | — | | | $ | (480,296 | ) |
| | | | |
Futures Contracts (2) | | $ | (11,423 | ) | | $ | — | | | $ | — | | | $ | (11,423 | ) |
| | | | |
Stone Ridge U.S. Small Cap Variance Risk Premium Fund | | | | | | | | | | | | | | | | |
| Assets | | | | | | | | | | | | | | | | |
| Common Stocks (1) | | $ | 4,250,537 | | | $ | — | | | $ | — | | | $ | 4,250,537 | |
| Contingent Value Rights (1) | | | — | | | | — | | | | — | | | | — | |
| Rights (1) | | | — | | | | — | | | | 21,600 | | | | 21,600 | |
| U.S. Treasury Bills | | | — | | | | 109,293,990 | | | | — | | | | 109,293,990 | |
| Money Market Funds | | | 160,098 | | | | — | | | | — | | | | 160,098 | |
| | | | |
Total Assets | | $ | 4,410,635 | | | $ | 109,293,990 | | | $ | 21,600 | | | $ | 113,726,225 | |
| Liabilities | | | | | | | | | | | | | | | | |
| Written Options | | $ | — | | | $ | (282,665 | ) | | $ | — | | | $ | (282,665 | ) |
| | | | |
Total Liabilities | | $ | — | | | $ | (282,665 | ) | | $ | — | | | $ | (282,665 | ) |
Stone Ridge U.S. Master Variance Risk Premium Fund (3) | | | | | | | | | | | | | | | | |
| Assets | | | | | | | | | | | | | | | | |
| Investment Companies—Open End | | $ | 225,805,272 | | | $ | — | | | $ | — | | | $ | 225,805,272 | |
| Money Market Funds | | | 1,177,426 | | | $ | — | | | $ | — | | | | 1,177,426 | |
| | | | |
Total Assets | | $ | 226,982,698 | | | $ | — | | | $ | — | | | $ | 226,982,698 | |
| (1) | For further security characteristics and industry breakdown, see the Funds’ Schedules of Investments. |
| (2) | Futures contracts are reflected in a separate schedule on the Schedule of Investments, which are reflected at the net unrealized appreciation (depreciation) on the instrument. |
| (3) | The Fund measures Level 3 activity as of the beginning and end of each financial reporting period. For the period ended October 31, 2013, the Fund did not have unobservable inputs (Level 3 securities) used in determining fair value. Therefore, a reconciliation of assets and liabilities in which significant inputs (Level 3 securities) were used in determining fair value is not applicable. |
| | | | | | | | | | | | | | | | |
| 42 | | Stone Ridge Funds | | | | | | Annual Report | | | | | | October 2013 | | |
| | | | | | | | | | |
| | | | |
| Notes to Financial Statements | | | October 31, 2013 | |
Below is a reconciliation that details the activity of securities in Level 3 during the current fiscal period:
| | | | | | | | | | | | | | | | |
| | | STONE RIDGE REINSURANCE RISK
PREMIUM FUND | | | STONE RIDGE HIGH YIELD
REINSURANCE RISK
PREMIUM FUND | |
| Security Type | | PARTICIPATION
NOTES (QUOTA
SHARES) | | | PREFERENCE
SHARES (QUOTA
SHARES) | | | PARTICIPATION
NOTES (QUOTA
SHARES) | | | PREFERENCE
SHARES (QUOTA
SHARES) | |
Beginning Balance (1) | | $ | — | | | $ | — | | | $ | — | | | $ | — | |
Purchases | | | 71,500,000 | | | | 2,250,000 | | | | 28,500,000 | | | | 750,000 | |
Sales | | | — | | | | — | | | | — | | | | — | |
Realized gains | | | — | | | | — | | | | — | | | | — | |
Realized losses | | | — | | | | — | | | | — | | | | — | |
Change in unrealized appreciation (depreciation) | | | 8,236,800 | | | | 244,350 | | | | 3,283,200 | | | | 81,450 | |
| Transfers in/(out) of Level 3 | | | — | | | | — | | | | — | | | | — | |
| Ending Balance—October 31, 2013 | | $ | 79,736,800 | | | $ | 2,494,350 | | | $ | 31,783,200 | | | $ | 831,450 | |
| | | | | | | | | | | | | | |
| | | STONE RIDGE
U.S. VARIANCE
RISK PREMIUM
FUND | | | STONE RIDGE U.S. SMALL CAP
VARIANCE RISK PREMIUM FUND | | | |
| Security Type | | RIGHTS | | | RIGHTS | | | CONTINGENT
VALUE RIGHTS | | | |
Beginning Balance (1) | | $ | — | | | $ | — | | | $ | — | | | |
Purchases | | | — | (2) | | | — | (2) | | | — | (2) | | |
Sales | | | — | | | | — | | | | — | | | |
Realized gains | | | — | | | | — | | | | — | | | |
Realized losses | | | — | | | | — | | | | — | | | |
Change in unrealized appreciation (depreciation) | | | 8,640 | | | | 21,600 | | | | — | | | |
| Transfers in/(out) of Level 3 | | | — | | | | — | | | | — | | | |
| Ending Balance—October 31, 2013 | | $ | 8,640 | | | $ | 21,600 | | | $ | — | | | |
| (1) | Inception date was February 1, 2013 for the Reinsurance Risk Premium Fund and the High Yield Reinsurance Risk Premium Fund and was May 1, 2013 for the U.S. Variance Risk Premium Fund and the U.S. Small Cap Variance Risk Premium Fund. |
| (2) | Level 3 securities were acquired in a rights issuance to holders of the companies’ common stock. |
The following table summarizes the quantitative inputs used for investments categorized as Level 3 of the fair value hierarchy as of October 31, 2013.
Reinsurance Risk Premium Fund
| | | | | | | | | | | | | | |
| TYPE OF SECURITY | | INDUSTRY | |
| FAIR VALUE
AT 10/31/13 |
| |
| VALUATION
TECHNIQUES |
| | UNOBSERVABLE
INPUTS | | RANGE |
Participation Notes (Quota Shares) | | Financial Services | | | $79,736,800 | | | | Indicative bids | | | Non-public broker quotations | | 109.55 - 113.49 |
| | | | | |
Preference Shares (Quota Shares) | | Financial Services | | | 2,494,350 | | | | Indicative bids | | | Non-public broker quotation | | 110.86 |
| | | | | |
| | | | | | | | | | | | | | |
| | | | | | | | | | | | | | | | |
| | Stone Ridge Funds | | | | | | Annual Report | | | | | | October 2013 | | 43 |
| | | | | | | | | | |
| | | | |
| Notes to Financial Statements | | | October 31, 2013 | |
High Yield Reinsurance Risk Premium Fund
| | | | | | | | | | | | | | | | |
| TYPE OF SECURITY | | INDUSTRY | |
| FAIR VALUE
AT 10/31/13 |
| |
| VALUATION
TECHNIQUES |
| | UNOBSERVABLE
INPUTS | | | RANGE | |
Participation Notes (Quota Shares) | | Financial Services | | | $31,783,200 | | |
| Indicative bids
|
| | Non-public broker quotation | | | 109.55 - 113.49 | |
| | | | | |
Preference Shares (Quota Shares) | | Financial Services | | | 831,450 | | |
| Indicative bids
|
| | Non-public broker quotation | |
| 110.86
|
|
| | | | | |
| | | | | | | | | | | | | | | | |
The Level 3 investments as of October 31, 2013 in the U.S. Variance Risk Premium Fund and the U.S. Small Cap Variance Risk Premium Fund represented 0.00% of net assets and did not warrant disclosure of significant unobservable valuation inputs.
Quota Shares are valued based upon indicative bids provided by third-party brokers. An independent valuation model is used to verify the reasonability of such indicative bids. The independent valuation models take into account such things as losses from severe weather events, changes in market risk spreads and anticipated losses.
Derivative Transactions — The U.S. Variance Risk Premium Fund and the U.S. Small Cap Variance Risk Premium Fund engaged in derivatives and hedging activities during the period ended October 31, 2013. The use of derivatives included options and futures contracts. The Funds may hold purchased and written options and futures for speculative purposes. Further information regarding derivative activity for each Fund can be found in the Schedule of Investments.
Futures Contracts — The U.S. VRP Funds may purchase and sell futures contracts. The U.S. VRP Funds held futures contracts during the period ended October 31, 2013. The U.S. VRP Funds use futures contracts to maintain appropriate equity market exposure. With futures, there is minimal counterparty credit risk to the a Fund since futures are exchange traded and the exchange’s clearinghouse, as counterparty to all exchange traded futures, guarantees the futures against default. Upon entering into a contract, a Fund deposits and maintains as collateral, an initial margin as required by the exchange on which the transaction is effected. Pursuant to the contract, a Fund agrees to receive from or pay to the broker, an amount of cash equal to the daily fluctuation in value of the contract. Such receipts or payments are known as variation margin and are recorded by a Fund as unrealized gains and losses. When the contract is closed, a Fund records a realized gain or loss equal to the difference between the value of the contract at the time it was opened and the value at the time it was closed. As collateral for futures contracts, a Fund is required under the 1940 Act to maintain assets consisting of cash, cash equivalents or liquid securities. This collateral is required to be adjusted daily to reflect the market value of the purchase obligation for long futures contracts or the market value of the instrument underlying the contract, but not less than the market price at which the futures contract was established, for short futures contracts.
The average notional amount of futures contracts during the period ended October 31, 2013, were as follows:
| | | | | | | | |
| | | U.S. VRP
Fund | | | U.S. Small Cap
VRP Fund | |
Long futures contracts | | | | | | | | |
| Equity index contracts | | $ | 190,479 | | | $ | 197,287 | |
Total long futures contracts | | $ | 190,479 | | | $ | 197,287 | |
Short futures contracts | | | | | | | | |
| Equity index contracts | | $ | 5,107,083 | | | $ | — | |
Total short futures contracts | | $ | 5,107,083 | | | $ | — | |
| | | | | | | | | | | | | | | | |
| 44 | | Stone Ridge Funds | | | | | | Annual Report | | | | | | October 2013 | | |
| | | | | | | | | | |
| | | | |
| Notes to Financial Statements | | | October 31, 2013 | |
The effect of equity index futures contracts on the statement of operations during the period ended October 31, 2013 for the U.S. VRP Fund and the U.S. Small Cap VRP Fund include $1,482,483 and $394,417 in realized losses, respectively.
The change in unrealized depreciation on equity index futures contracts for the period ended October 31, 2013 for U.S. VRP Fund and the U.S. Small Cap VRP Fund was $(11,423) and $—, respectively.
Options — The Funds may purchase and write call or put options on securities and indices and enter into related closing transactions. The U.S. VRP Funds wrote call or put options during the period ended October 31, 2013. The Funds write put and call options to earn premium income. With options, there is minimal counterparty credit risk to the Funds since options are exchange traded and the exchange’s clearinghouse, as counterparty to all exchange traded options, guarantees the options against default. As the writer of a call option, the Funds have the obligation to sell the security at the exercise price during the exercise period. As a writer of a put option, the Funds have the obligation to buy the underlying security at the exercise price during the exercise period. The premium that the Funds pay when purchasing a call option or receives when writing a call option will reflect, among other things, the market price of the security, the relationship of the exercise price to the market price of the security, the relationship of the exercise price to the volatility of the security, the length of the option period and supply and demand factors. The premium is the market value of the option.
A purchaser (holder) of a put option pays a non-refundable premium to the seller (writer) of a put option to obtain the right to sell a specified amount of a security at a fixed price (the exercise price) during a specified period (exercise period). Conversely, the seller (writer) of a put option, upon payment by the holder of the premium, has the obligation to buy the security from the holder of the put option at the exercise price during the exercise period. When an option is exercised, the premium originally received decreases the cost basis of the underlying security (or increases the proceeds on the security sold short) and the Funds realize a gain or loss from the sale of the security (or closing of the short sale).
The U.S. VRP Funds engaged in options during the period ended October 31, 2013. The average market value of purchased and written options for the quarter ended October 31, 2013, were as follows:
| | | | | | | | |
| | | U.S. VRP
FUND | | | U.S. SMALL CAP VRP FUND | |
| Purchased options | | $ | 58 | | | $ | — | |
| Written options | | | 1,499,030 | | | | 596,5070 | |
Transactions in options written during the period ended October 31, 2013 were as follows:
| | | | | | | | | | | | | | | | |
| | | U.S. VRP FUND | | | U.S. SMALL CAP VRP FUND | |
| Call Options | | CONTRACTS | | | PREMIUMS | | | CONTRACTS | | | PREMIUMS | |
Outstanding, Beginning of period | | | — | | | $ | — | | | | — | | | $ | — | |
Options written | | | 57,745 | | | | 1,359,428 | | | | 688 | | | | 212,123 | |
Options terminated in closing transactions | | | (3,190 | ) | | | (303,540 | ) | | | (231 | ) | | | (73,228 | ) |
Options exercised | | | (4,651 | ) | | | (191,074 | ) | | | (137 | ) | | | (46,855 | ) |
Options expired | | | (43,103 | ) | | | (755,201 | ) | | | (278 | ) | | | (78,582 | ) |
| | | | | | | | |
Outstanding, end of period | | | 6,801 | | | $ | 109,613 | | | | 42 | | | $ | 13,458 | |
| | | | | | | | | | | | | | | | |
| | | U.S. VRP FUND | | | U.S. SMALL CAP VRP FUND | |
| Put Options | | CONTRACTS | | | PREMIUMS | | | CONTRACTS | | | PREMIUMS | |
Outstanding, Beginning of period | | | — | | | $ | — | | | | — | | | $ | — | |
Options written | | | 104,658 | | | | 87,931,380 | | | | 48,190 | | | | 33,776,364 | |
Options terminated in closing transactions | | | (85,097 | ) | | | (75,599,939 | ) | | | (37,786 | ) | | | (28,246,801 | ) |
Options exercised | | | (4,266 | ) | | | (2,805,630 | ) | | | (2,876 | ) | | | (1,462,523 | ) |
Options expired | | | (13,704 | ) | | | (8,375,938 | ) | | | (6,584 | ) | | | (3,715,267 | ) |
| | | | | | | | |
Outstanding, end of period | | | 1,591 | | | $ | 1,149,873 | | | | 944 | | | $ | 351,773 | |
| | | | | | | | | | | | | | | | |
| | Stone Ridge Funds | | | | | | Annual Report | | | | | | October 2013 | | 45 |
| | | | | | | | | | |
| | | | |
| Notes to Financial Statements | | | October 31, 2013 | |
Transactions in purchased options during the period ended October 31, 2013 were as follows:
| | | | | | | | | | | | | | | | |
| | | U.S. VRP FUND | | | U.S. SMALL CAP VRP FUND | |
| | | NOTIONAL AMOUNT | | | CONTRACTS | | | NOTIONAL AMOUNT | | | CONTRACTS | |
Outstanding, Beginning of period | | $ | — | | | | — | | | $ | — | | | | — | |
Options purchased | | | 106,600 | | | | 27 | | | | 1,352,000 | | | | 13 | |
Options terminated in closing transactions | | | — | | | | — | | | | (1,352,000 | ) | | | (13 | ) |
Options exercised | | | — | | | | — | | | | — | | | | — | |
Options expired | | | (106,600 | ) | | | (27 | ) | | | — | | | | — | |
| | | | | | | | |
Outstanding, end of period | | $ | — | | | | — | | | $ | — | | | | — | |
Balance Sheet—Values of Derivatives at October 31, 2013
U.S. VRP Fund
| | | | | | | | | | | | | | |
| | | ASSET DERIVATIVES | | | LIABILITY DERIVATIVES | |
| | | BALANCE SHEET
LOCATION | | | FAIR VALUE | | | BALANCE SHEET
LOCATION | | FAIR VALUE | |
Written Options | | | N/A | | | | N/A | | | Options written, at Fair Value | | $ | 480,296 | |
Futures Contracts | | | N/A | | | | N/A | | | Net Assets—Unrealized depreciation on futures contracts | | | 11,423 | |
| | | | | | | | | | | | | | |
Total | | | | | | $ | — | | | | | $ | 491,719 | |
U.S. Small Cap VRP Fund
| | | | | | | | | | | | | | |
| | | ASSET DERIVATIVES | | | LIABILITY DERIVATIVES | |
| | | BALANCE SHEET
LOCATION | | | FAIR VALUE | | | BALANCE SHEET
LOCATION | | FAIR VALUE | |
Written Options | | | N/A | | | | N/A | | | Options written, at Fair Value | | | $282,665 | |
| | | | | | | | | | | | | | |
Total | | | | | | | $— | | | | | | $282,665 | |
The effect of purchased options on the statement of operations during the period ended October 31, 2013 for the U.S. VRP Fund and the U.S. Small Cap VRP Fund include $497 and $131 in realized losses, respectively, and is included with realized gain (loss) on investments.
The effect of written options on the statement of operations during the period ended October 31, 2013 for the U.S. VRP Fund and the U.S. Small Cap VRP Fund include $18,389,959 and $7,810,409 in realized gains, respectively.
The change in unrealized appreciation or (depreciation) on purchased options for the period ended October 31, 2013 for the U.S. VRP Fund and the U.S. Small Cap VRP Fund was $0 and $0, respectively.
The change in unrealized appreciation or (depreciation) on written options for the period ended October 31, 2013 for the U.S. VRP Fund and the U.S. Small Cap VRP Fund was $779,191 and $82,566, respectively.
(b) Use of Estimates The preparation of the financial statements in conformity with GAAP requires management to make estimates and assumptions that affect the reported amounts of assets and liabilities and disclosure of contingent assets and liabilities at the date of the financial statements and the reported amounts of increases and decreases in net assets from operations during the reporting period. Actual results could differ from those estimates.
(c) Indemnifications In the normal course of business the Funds enter into contracts that contain a variety of representations which provide general indemnifications. The Funds’ maximum exposure under these arrangements cannot be known; however, the Funds expect any risk of loss to be remote.
| | | | | | | | | | | | | | | | |
| 46 | | Stone Ridge Funds | | | | | | Annual Report | | | | | | October 2013 | | |
| | | | | | | | | | |
| | | | |
| Notes to Financial Statements | | | October 31, 2013 | |
(d) Federal Income Taxes The Funds intend to qualify as “regulated investment companies” under Subchapter M of the Internal Revenue Code of 1986, as amended. If so qualified, the Funds will not be subject to federal income tax to the extent they distribute substantially all of their net investment income and capital gains to shareholders. Therefore, no federal income tax provision is required.
(e) Event-Linked Bonds Event-linked bonds are variable rate debt securities for which the return of principal and payment of interest are contingent on the non-occurrence of a specified trigger event(s) that leads to economic and/or human loss, such as an earthquake of a particular magnitude or a hurricane of a specific category. The most common type of event-linked bonds is known as “catastrophe” or “CAT” bonds. In most cases, the trigger event(s) will not be deemed to have occurred unless the event(s) happened in a particular geographic area and was of a certain magnitude (based on independent scientific readings) or caused a certain amount of actual or modeled loss. If the trigger event(s) occurs prior to a bond’s maturity, the Funds may lose all or a portion of its principal and forgo additional interest payments. In this regard, event-linked bonds typically have a special condition that states that if the issuer (i.e., an insurance or reinsurance company) suffers a loss from a particular pre-defined catastrophe, then the issuer’s obligation to pay interest and/or repay the principal is either deferred or completely forgiven. For example, if a Fund holds a bond which covers an insurer’s losses due to a hurricane with a “trigger” at $1 billion and a hurricane hits causing $1 billion or more in losses to such insurer, then the Fund will lose all or a portion of its principal invested in the bond and forgo any future interest payments. If the trigger event(s) does not occur, the Fund will recover its principal plus interest. Interest typically accrues and is paid on a quarterly basis. Although principal typically is repaid only on the maturity date, it may be repaid in installments, depending on the terms of the bond. The Funds may invest in event-linked bonds directly or indirectly through certain derivative instruments. Event-linked swaps are derivative instruments that are typically contingent, or formulaically related to defined trigger events. Trigger events include hurricanes, earthquakes and weather-related phenomena.
(f) Quota Shares Quota shares are a form of proportional reinsurance in which an investor participates in the premiums and losses of a reinsurer’s portfolio according to a pre-defined percentage. For example, under a 20% quota-share agreement, a special purpose vehicle (“SPV”) would obtain 20% of all premiums of the subject portfolio while being responsible for 20% of all claims, and the Fund, as holder of a Quota Share Note issued by the SPV, would be entitled to its pro rata share of the premiums received by the SPV and would be responsible for its pro rata share of the claims up to the total amount invested.
(g) Distributions to Shareholders The Funds intend to distribute to their shareholders any net investment income and any net realized long or short-term capital gains, if any, at least annually. Distributions are recorded on ex-dividend date. The Funds each may periodically make reclassifications among certain of their capital accounts as a result of the characterization of certain income and realized gains determined annually in accordance with federal tax regulations that may differ from generally accepted accounting principles.
(h) Foreign Securities and Currency Transactions The Funds’ books and records are maintained in U.S. dollars. Foreign currency denominated transactions (i.e. market value of investment securities, assets and liabilities, purchases and sales of investment securities, and income and expenses) are translated into U.S. dollars at the current rate of exchange. The Funds isolate that portion of results of operations resulting from changes in foreign exchange rates on investments from the fluctuations arising from changes in market prices of securities held and it is reported as realized gains on currency translation and change in unrealized appreciation on foreign currency related items on the Funds’ statement of operations.
The Reinsurance Funds may invest in event-linked securities issued by foreign sovereigns and foreign entities that are corporations, partnerships, trusts or other types of business entities. Because the majority of event-linked security issuers are domiciled outside the United States, the Reinsurance Funds will normally invest significant amounts of their assets in non-U.S. entities. Certain SPVs in which the Funds invest may be sponsored by non-U.S. ceding insurers that are not subject to the same regulation as that to which U.S. ceding insurers are subject. Such SPVs may pose a greater risk of loss, for example due to less stringent underwriting and/or risk-retention requirements. The Reinsurance Funds’ investments consist primarily of event-linked bonds which provide the Reinsurance Funds with contractual rights under the terms of the bond issuance. While the contractual rights of event-linked bonds issued are similar whether they are issued by a U.S. issuer or a non-U.S. issuer, there may be certain additional risks associated with non-U.S. issuers. For example, foreign issuers could be affected by factors not present in the U.S., including expropriation, confiscatory
| | | | | | | | | | | | | | | | |
| | Stone Ridge Funds | | | | | | Annual Report | | | | | | October 2013 | | 47 |
| | | | | | | | | | |
| | | | |
| Notes to Financial Statements | | | October 31, 2013 | |
taxation, lack of uniform accounting and auditing standards, less publicly available financial and other information, potential difficulties in enforcing contractual obligations, and increased costs to enforce applicable contractual obligations outside the U.S. Settlements of securities transactions in foreign countries are subject to risk of loss, may be delayed and are generally less frequent than in the U.S., which could affect the liquidity of the Reinsurance Fund’s assets.
(i) Allocation of Income, Expenses, Gains/Losses Income, expenses (other than those deemed attributable to a specific share class), and gains and losses of each Fund are allocated daily to each share class based upon the ratio of net assets represented by each class as a percentage of the net assets of each Fund. Expenses deemed directly attributable to a class of shares are recorded by the specific class. Most expenses are allocated based on average net assets, with the exception of 12b-1 fees, which are expensed at 0.15% of average daily net assets of the Class M shares.
(j) Other Investment transactions are recorded on the trade date. Dividend income, less any foreign tax withheld, is recognized on the ex-dividend date and interest income is recognized on an accrual basis, including amortization/accretion of premiums or discounts. Discounts and premiums on securities purchased are amortized over the lives of the respective securities using the constant yield method.
(k) Restricted Securities The Funds may invest a substantial portion of their assets in securities that are restricted, but eligible for purchase and sale by certain qualified buyers pursuant to Rule 144A under the Securities Act of 1933, as amended, as well as other restricted securities. Restricted securities may be resold in transactions that are exempt from registration under Federal securities laws or if the securities are publically registered. Restricted securities may be deemed illiquid.
3. Federal Tax Matters
Provisions for federal income taxes or excise taxes have not been made since the Funds have elected to be taxed as Regulated Investment Companies and intend to distribute substantially all taxable income to shareholders and otherwise comply with the provisions of the Internal Revenue Code applicable to Regulated Investment Companies. Distributions from net realized gains for book purposes may include short-term capital gains which are included as ordinary income to shareholders for tax purposes. Additionally, U.S. generally accepted accounting principles require that certain components of net assets relating to permanent differences be reclassified between financial and tax reporting. These reclassifications have no effect on net assets or net asset value per share.
For the period ended October 31, 2013, the effect of permanent “book/tax” reclassifications resulted in increases and decreases to components of the Funds’ net assets as follows:
| | | | | | | | | | | | |
| | | UNDISTRIBUTED
NET INVESTMENT
INCOME/(LOSS) | | | ACCUMULATED
NET REALIZED
GAIN/(LOSS) | | | PAID IN
CAPITAL | |
Reinsurance Risk Premium Fund | | $ | 281,114 | | | $ | (208,498 | ) | | $ | (72,616 | ) |
High Yield Reinsurance Risk Premium Fund | | | 182,162 | | | | (145,030 | ) | | | (37,132 | ) |
U.S. VRP Fund | | | 2,009,748 | | | | (1,999,920 | ) | | | (9,828 | ) |
U.S. Small Cap VRP Fund | | | 731,791 | | | | (722,509 | ) | | | (9,282 | ) |
U.S. Master VRP Fund | | | 7,682 | | | | 6,058 | | | | (13,740 | ) |
| | | | | | | | | | | | | | | | |
| 48 | | Stone Ridge Funds | | | | | | Annual Report | | | | | | October 2013 | | |
| | | | | | | | | | |
| | | | |
| Notes to Financial Statements | | | October 31, 2013 | |
These permanent differences primarily relate to foreign currency gains/losses and investments in passive foreign investment companies (PFICs) and non-deductible expenses in the Reinsurance Funds and net operating losses in the Variance Funds.
As of October 31, 2013, the components of accumulated earnings (losses) for income tax purposes were as follows:
| | | | | | | | | | | | | | | | | | | | |
| | | REINSURANCE
RISK PREMIUM
FUND | | | HIGH YIELD
REINSURANCE RISK
PREMIUM FUND | | | U.S. VRP
FUND | | | U.S. SMALL
CAP VRP
FUND | | | U.S. MASTER
VRP FUND | |
Tax cost of investments | | $ | 494,504,311 | | | $ | 201,475,649 | | | $ | 357,686,938 | | | $ | 113,529,635 | | | $ | 219,073,707 | |
Unrealized appreciation | | | 7,669,668 | | | | 3,050,671 | | | | 5,494,765 | | | | 440,476 | | | | 7,926,011 | |
| Unrealized depreciation | | | (248,130 | ) | | | (29,121 | ) | | | (2,320,006 | ) | | | (243,886 | ) | | | (17,020 | ) |
Net unrealized appreciation | | | 7,421,538 | | | | 3,021,550 | | | | 3,174,759 | | | | 196,590 | | | | 7,908,991 | |
| | | | | |
Undistributed ordinary income | | | 11,661,051 | | | | 5,415,848 | | | | — | | | | — | | | | 13,329 | |
| Undistributed long-term gains | | | — | | | | — | | | | 9,246,869 | | | | 4,241,924 | | | | — | |
Total undistributed earnings | | | 11,661,051 | | | | 5,415,848 | | | | 9,246,869 | | | | 4,241,924 | | | | 13,329 | |
Unrealized appreciation/depreciation | | | 7,421,538 | | | | 3,021,550 | | | | 3,174,759 | | | | 196,590 | | | | 7,908,991 | |
Accumulated realized capital and other losses | | | (354,332 | ) | | | (116,207 | ) | | | (12,665 | ) | | | — | | | | — | |
Total accumulated earnings/(loses) | | $ | 18,728,257 | | | $ | 8,321,191 | | | $ | 12,408,963 | | | $ | 4,438,514 | | | $ | 7,922,320 | |
The difference between book-basis and tax-basis unrealized appreciation is attributable primarily to mark-to-market adjustments on PFICs and wash sales.
The tax character of distributions paid during the period ended October 31, 2013 was as follows:
| | | | | | | | | | | | |
| | | ORDINARY
INCOME | | | LONG TERM
CAPITAL GAIN | | | TOTAL | |
Reinsurance Risk | | | | | | | | | | | | |
Premium Fund | | $ | 4,275,606 | | | $ | — | | | $ | 4,275,606 | |
High Yield Reinsurance | | | | | | | | | | | | |
Risk Premium Fund | | | 2,774,240 | | | | — | | | | 2,774,240 | |
U.S. VRP Fund | | | 6,784,867 | | | | 1,028,950 | | | | 7,813,817 | |
U.S. Small Cap VRP Fund | | | 2,141,039 | | | | 257,133 | | | | 2,398,172 | |
U.S. Master VRP Fund | | | 4,118,227 | | | | 584,201 | | | | 4,702,428 | |
At October 31, 2013 certain Funds had tax basis capital losses which may be carried forward indefinitely to offset future capital gains as shown below:
| | | | | | |
| | | | | | |
Reinsurance Risk Premium Fund | | $ | (236,047 | ) | | |
High Yield Reinsurance Risk Premium Fund | | | (75,103 | ) | | |
U.S. VRP Fund | | | — | | | |
U.S. Small Cap VRP Fund | | | — | | | |
U.S. Master VRP Fund | | | — | | | |
To the extent that Funds listed above may realize future net capital gains, those gains will be offset by any of their unused respective capital loss carryforwards.
There is no tax liability resulting from unrecognized tax benefits relating to uncertain income tax positions taken or expected to be taken on the tax return for the fiscal period-end October 31, 2013, the Funds’ only open tax period. The Funds recognize interest and penalties, if any, related to unrecognized tax benefits as income tax expense in the Statement of Operations. During the period, the Funds did not incur any interest or penalties.
| | | | | | | | | | | | | | | | |
| | Stone Ridge Funds | | | | | | Annual Report | | | | | | October 2013 | | 49 |
| | | | | | | | | | |
| | | | |
| Notes to Financial Statements | | | October 31, 2013 | |
4. Agreements
(a) Investment Advisory Agreement Stone Ridge Asset Management LLC (“Stone Ridge” or the “Adviser”) is the investment adviser of the Funds. The Adviser was organized as a Delaware limited liability company in 2012. The Adviser’s primary business is to provide a variety of investment management services, including an investment program for the Funds. The Adviser is responsible for all business activities and oversight of the investment decisions made for the Funds.
In return for providing management services to the Funds, each of the Reinsurance Funds pays the Adviser an annual fee of 1.50% of that Fund’s average daily net assets and each of the VRP Funds pays the Adviser an annual fee of 1.25% of that Fund’s average daily net assets. The U.S. Master VRP Fund does not directly pay an advisory fee to the Adviser because those assets are included in the assets of the U.S. VRP Funds.
Through February 1, 2014, the Adviser has agreed to waive its management fee and/or pay or otherwise bear operating and other expenses of certain Funds or Class thereof (excluding taxes, brokerage and transactional expenses, borrowing and other investment-related costs and fees including interest and commitment fees, short dividend expense, acquired fund fees, taxes, litigation and indemnification expenses, judgments and extraordinary expenses not incurred in the ordinary course of the Funds’ business) solely to the extent necessary to limit the Funds’ total annual fund operating expenses to 2.00% for Class I shares and 2.15% for Class M shares of each of the Reinsurance Funds and 1.75% for the Class I and 1.90% for the Class M shares of each of the U.S. VRP Funds. The Adviser shall be permitted to recover expenses attributable to a Fund or a Class thereof that the Adviser has borne in later periods to the extent that the expenses for a Class of shares fall below the annual rate in effect at the time of the actual waiver/reimbursement. Under the expense limitation agreement, the Funds are not obligated to reimburse such expenses beyond three years from the end of the fiscal year in which the Adviser waived a fee or reimbursed an expense. Any such recovery by the Adviser will not cause a class to exceed the annual limitation rate in effect at the time of the actual waiver/reimbursement. As of October 31, 2013, the Advisor has waived and recouped fees as follows:
| | | | | | | | | | | | | | | | |
| Fund | | ORGANIZATIONAL
EXPENSES PAID | | | ADVISORY FEES WAIVED | | | AMOUNT
RECOUPED | | | REMAINING AMOUNT
ELIGIBLE TO BE
RECOUPED (EXPIRING
OCTOBER 31, 2016) | |
Reinsurance Risk Premium Fund | | $ | (124,511 | ) | | $ | (93,761 | ) | | $ | 130,299 | | | $ | (87,973 | ) |
High Yield Reinsurance Fund | | | (48,267 | ) | | $ | (67,746 | ) | | $ | 62,162 | | | $ | (53,850 | ) |
U.S. Variance Risk Premium Fund | | | — | | | $ | (91,746 | ) | | $ | 9,427 | | | $ | (82,319 | ) |
U.S. Small Cap Variance Risk Premium Fund | | | — | | | $ | (33,880 | ) | | $ | 14,125 | | | $ | (19,755 | ) |
(b) Administrator, Custodian, and Transfer Agent The custodian to the Trust is U.S. Bank, N.A. The administrator and transfer agent to the Trust is U.S. Bancorp Fund Services, LLC, an affiliate of U.S. Bank, N.A.
(c) Distributor Quasar Distributors, LLC (the “Distributor”), an affiliate of U.S. Bank, N.A., serves as the Funds’ distributor.
5. Distribution Plan
The Funds pay fees to the Distributor, on an ongoing basis as compensation for the services the Distributor renders and the expenses it bears in connection with the sale and distribution of Class M shares (“distribution fees”) and/or in connection with personal services rendered to Class M shareholders and the maintenance of shareholder accounts (“servicing fees”). These payments are made pursuant to a Distribution and Servicing Plan (“12b-1 Plan”) adopted by each Fund pursuant to Rule 12b-1 under the 1940 Act. The maximum annual rate at which the distribution and/or servicing fees may be paid under the 12b-1 Plan is 0.15% of each Fund’s average daily net assets attributable to the Class M Shares. Because 12b-1 fees are paid out of a Fund’s assets on an ongoing basis, over time these fees will increase the cost of your investment and may cost you more than other types of sales charges.
| | | | | | | | | | | | | | | | |
| 50 | | Stone Ridge Funds | | | | | | Annual Report | | | | | | October 2013 | | |
| | | | | | | | | | |
| | | | |
| Notes to Financial Statements | | | October 31, 2013 | |
6. Organization and Offering Costs
Organization costs consist of costs incurred to establish the Funds and enable them to legally do business. The Funds expense organization costs as incurred. Offering costs include state registration fees and legal fees regarding the preparation of the initial registration statement. Offering costs are accounted for as deferred costs until operations begin. Offering costs are then amortized to expense over twelve months on a straight-line basis. These organization and offering expenses were advanced by the Adviser, subject to potential recovery (see Note 5). The total amount of the organization costs and offering costs incurred by the Reinsurance Risk Premium Fund is $124,511 and $232,208, respectively. The total amount of the organization costs and offering costs incurred by the High Yield Reinsurance Risk Premium Fund $48,267 and $121,217, respectively. The offering expenses incurred by the U.S. VRP Fund, the U.S. Small Cap VRP Fund and the U.S. Master VRP Fund are $157,094, $60,295, and $153,963, respectively.
7. Related Parties
Certain officers of the Trust are also employees of the Adviser. The Officers, with the exception of a portion of the Chief Compliance Officer’s salary, are not compensated by the Trust.
8. Investment Transactions
The aggregate purchase and sales of securities (excluding short-term securities) by the Funds for the period ended October 31, 2013 were as follows:
| | | | | | | | | | | | | | | | | | | | |
| | | REINSURANCE
RISK PREMIUM
FUND | | | HIGH YIELD
REINSURANCE
RISK PREMIUM
FUND | | | U.S. VRP
FUND | | | U.S. SMALL
CAP VRP
FUND | | | U.S. MASTER
VRP FUND | |
| Purchases | | $ | 549,073,845 | | | $ | 221,320,787 | | | $ | 85,643,171 | | | $ | 4,960,454 | | | $ | 219,122,000 | |
| Sales | | | 62,967,504 | | | | 23,973,785 | | | | 23,389,232 | | | | 749,762 | | | | 1,232,990 | |
U.S. Government Security Purchases | | | — | | | | — | | | | — | | | | — | | | | — | |
U.S. Government Security Purchases | | | — | | | | — | | | | — | | | | — | | | | — | |
9. Capital Share Transactions
| | | | | | | | |
| | | STONE RIDGE
REINSURANCE
RISK PREMIUM
FUND - CLASS I | | | STONE RIDGE
REINSURANCE
RISK PREMIUM
FUND - CLASS M | |
| | | PERIOD ENDED
OCTOBER 31, 2013 | | | PERIOD ENDED
OCTOBER 31, 2013 | |
Shares sold | | | 35,772,624 | | | | 16,523,843 | |
Shares issued to holders in reinvestment of dividends | | | 258,479 | | | | 88,108 | |
| Shares redeemed | | | (1,253,076 | ) | | | (2,107,346 | ) |
Net increase in shares | | | 34,778,027 | | | | 14,504,605 | |
Shares outstanding: | | | | | | | | |
| Beginning of period | | | 5,000 | | | | 5,000 | |
| End of period | | | 34,783,027 | | | | 14,509,605 | |
| | | | | | | | |
| | | | | | | | | | | | | | | | |
| | Stone Ridge Funds | | | | | | Annual Report | | | | | | October 2013 | | 51 |
| | | | | | | | | | |
| | | | |
| Notes to Financial Statements | | | October 31, 2013 | |
| | | | | | | | |
| | | STONE RIDGE
HIGH YIELD
REINSURANCE
RISK PREMIUM
FUND -CLASS I | | | STONE RIDGE
HIGH YIELD
REINSURANCE
RISK PREMIUM
FUND - CLASS M | |
| | | PERIOD ENDED
OCTOBER 31, 2013 | | | PERIOD ENDED
OCTOBER 31, 2013 | |
Shares sold | | | 14,370,230 | | | | 6,654,684 | |
Shares issued to holders in reinvestment of dividends | | | 167,119 | | | | 60,174 | |
| Shares redeemed | | | (513,092 | ) | | | (837,577 | ) |
Net increase in shares | | | 14,024,257 | | | | 5,877,281 | |
Shares outstanding: | | | | | | | | |
| Beginning of period | | | 5,000 | | | | 5,000 | |
| End of period | | | 14,029,257 | | | | 5,882,281 | |
| | | | | | | | |
| | | STONE RIDGE U.S.
VARIANCE RISK
PREMIUM FUND -
CLASS I | | | STONE RIDGE U.S.
VARIANCE RISK
PREMIUM FUND -
CLASS M | |
| | | PERIOD ENDED
OCTOBER 31, 2013 | | | PERIOD ENDED
OCTOBER 31, 2013 | |
Shares sold | | | 25,475,332 | | | | 11,487,918 | |
Shares issued to holders in reinvestment of dividends | | | 144,938 | | | | 232,877 | |
| Shares redeemed | | | (344,614 | ) | | | (2,419,313 | ) |
Net increase in shares | | | 25,275,656 | | | | 9,301,482 | |
Shares outstanding: | | | | | | | | |
| Beginning of period | | | — | | | | — | |
| End of period | | | 25,275,656 | | | | 9,301,482 | |
| | | | | | | | |
| | | STONE RIDGE U.S.
SMALL CAP
VARIANCE RISK
PREMIUM FUND -
CLASS I | | | STONE RIDGE U.S.
SMALL CAP
VARIANCE RISK
PREMIUM FUND -
CLASS M | |
| | | PERIOD ENDED
OCTOBER 31, 2013 | | | PERIOD ENDED
OCTOBER 31, 2013 | |
Shares sold | | | 9,554,813 | | | | 1,240,502 | |
Shares issued to holders in reinvestment of dividends | | | 47,360 | | | | 20,956 | |
| Shares redeemed | | | (159,260 | ) | | | (16,765 | ) |
Net increase in shares | | | 9,442,913 | | | | 1,244,693 | |
Shares outstanding: | | | | | | | | |
| Beginning of period | | | — | | | | — | |
| End of period | | | 9,442,913 | | | | 1,244,693 | |
| | | | | | | | |
| | | | | | | | | | | | | | | | |
| 52 | | Stone Ridge Funds | | | | | | Annual Report | | | | | | October 2013 | | |
| | | | | | | | | | |
| | | | |
| Notes to Financial Statements | | | October 31, 2013 | |
| | | | | | | | |
| | | STONE RIDGE U.S.
MASTER
VARIANCE RISK
PREMIUM FUND -
CLASS I | | | STONE RIDGE U.S.
MASTER
VARIANCE RISK
PREMIUM FUND -
CLASS M | |
| | | PERIOD ENDED
OCTOBER 31, 2013 | | | PERIOD ENDED
OCTOBER 31, 2013 | |
Shares sold | | | 14,088,631 | | | | 7,937,674 | |
Shares issued to holders in reinvestment of dividends | | | 157,775 | | | | 126,487 | |
| Shares redeemed | | | (175,709 | ) | | | (366,726 | ) |
Net increase in shares | | | 14,070,697 | | | | 7,697,435 | |
Shares outstanding: | | | | | | | | |
| Beginning of period | | | — | | | | — | |
| End of period | | | 14,070,697 | | | | 7,697,435 | |
10. Transactions with Affiliates
The following issuers are affiliated with the Funds; that is, the Adviser had control of 5% or more of the outstanding voting securities during the period ended October 31, 2013. As defined in Section (2)(a)(3) of the Investment Company Act of 1940; such issuers are:
U.S. Master Variance Risk Premium Fund
| | | | | | | | | | | | | | | | | | | | | | | | | | | | | | | | | | | | | | | | | | | | |
| ISSUER NAME | |
| MAY 22,
2013
SHARE
BALANCE | *
| | | COST | | | | ADDITIONS | | | | REDUCTIONS | | |
| SHARE
BALANCE AT
OCTOBER 31,
2013 |
| |
| DIVIDEND
INCOME |
| |
| REALIZED
GAIN/
(LOSS) |
| |
| VALUE AT
OCTOBER 31,
2013 |
| |
| COST AT
OCTOBER 31,
2013 |
|
| | | | | SHARES | | | | COST | | | | SHARES | | | | COST | | | | | | |
Stone Ridge U.S. Variance Risk Premium Fund—Class I | | | — | | | $ | — | | | | 14,437,744 | | | $ | 146,425,000 | | | | (45,775) | | | $ | (472,831) | | | | 14,391,969 | | | $ | 3,295,800 | | | $ | (4,638) | | | $ | 150,827,835 | | | $ | 145,952,169 | |
| Stone Ridge U.S. Small Cap Variance Risk Premium Fund—Class I | | | — | | | | — | | | | 7,112,754 | | | | 72,697,000 | | | | (72,619) | | | | (759,317) | | | | 7,040,135 | | | | 1,663,411 | | | | 5,480 | | | | 74,977,437 | | | | 71,937,683 | |
| | | | | | | $ | — | | | | | | | | | | | | | | | | | | | | | | | | $4,959,211 | | | $ | 842 | | | $ | 225,805,272 | | | $ | 217,889,852 | |
| | * | Commencement of operations. |
11. Beneficial Ownership
The beneficial ownership, either directly or indirectly, of more than 25% of the voting securities of a fund creates a presumption of control of the fund, under Section 2(a)(9) of the 1940 Act. At October 31, 2013, Stone Ridge U.S. Master Variance Risk Premium Fund held, for the benefit of its shareholders, 56.9% of the Stone Ridge U.S. Variance Risk Premium Fund — Class I shares (41.6% of total Fund shares) and 74.6% of the Stone Risk U.S. Small Cap Variance Risk Premium Fund — Class I shares (65.9% of total Fund shares).
12. Subsequent Events Evaluation
On November 6, 2013, the Trust filed an update to its registration statement to add three additional series to the Trust, the Stone Ridge International Developed Markets Variance Risk Premium Fund, the Stone Ridge Emerging Markets Variance Risk Premium Fund and the Stone International Master Variance Risk Premium Fund are scheduled to begin operations in early 2014.
| | | | | | | | | | | | | | | | |
| | Stone Ridge Funds | | | | | | Annual Report | | | | | | October 2013 | | 53 |
| | | | | | | | | | |
| | |
| Report of Independent Registered Public Accounting Firm |
The Board of Trustees and Shareholders of Stone Ridge Trust
We have audited the accompanying statements of assets and liabilities, including the schedule of investments, of Stone Ridge Reinsurance Risk Premium Fund, Stone Ridge High Yield Reinsurance Risk Premium Fund, Stone Ridge U.S. Variance Risk Premium Fund, Stone Ridge U.S. Small Cap Variance Risk Premium Fund and Stone Ridge U.S. Master Variance Risk Premium Fund (five of the portfolios constituting Stone Ridge Trust (collectively the Funds)) as of October 31, 2013, and the related statements of operations, statements of cash flows for the Stone Ridge Reinsurance Risk Premium Fund and the Stone Ridge High Yield Reinsurance Risk Premium Fund, statements of changes in net assets, and the financial highlights for each of the periods indicated therein. These financial statements and financial highlights are the responsibility of the Funds’ management. Our responsibility is to express an opinion on these financial statements and financial highlights based on our audits.
We conducted our audits in accordance with the standards of the Public Company Accounting Oversight Board (United States). Those standards require that we plan and perform the audit to obtain reasonable assurance about whether the financial statements and financial highlights are free of material misstatement. We were not engaged to perform an audit of the Funds’ internal control over financial reporting. Our audits included consideration of internal control over financial reporting as a basis for designing audit procedures that are appropriate in the circumstances, but not for the purpose of expressing an opinion on the effectiveness of the Funds’ internal control over financial reporting. Accordingly, we express no such opinion. An audit also includes examining, on a test basis, evidence supporting the amounts and disclosures in the financial statements and financial highlights, assessing the accounting principles used and significant estimates made by management, and evaluating the overall financial statement presentation. Our procedures included confirmation of securities owned as of October 31, 2013, by correspondence with the custodian and brokers or by other appropriate auditing procedures where replies from brokers were not received. We believe that our audits provide a reasonable basis for our opinion.
In our opinion, the financial statements and financial highlights referred to above present fairly, in all material respects, the financial position of each of the respective Funds constituting the Stone Ridge Trust at October 31, 2013, the results of their operations, cash flows, changes in their net assets, and the financial highlights for each of the periods indicated therein, in conformity with U.S. generally accepted accounting principles.

New York, NY
December 26, 2013
| | | | | | | | | | | | | | | | |
| 54 | | Stone Ridge Funds | | | | | | Annual Report | | | | | | October 2013 | | |
| | | | | | | | | | |
|
| Expense Example (Unaudited) |
As a shareholder of the Stone Ridge Funds ( each a “Fund”, together the “Funds”), you incur two types of ongoing costs, including investment advisory fees, distribution and/or shareholder servicing fees, and other Fund expenses, which are indirectly paid by shareholders. This example is intended to help you understand your ongoing costs (in dollars) of investing in a Fund and to compare these costs with the ongoing costs of investing in other mutual funds.
The example is based on an investment of $1,000 invested at the beginning of the period and held the entire six month period, with the exception of the Stone Ridge U.S. Master Variance Risk Premium Fund’s example which begins on May 22 2013, the Fund’s commencement of operations.
Actual Expenses
The first line of each of the tables below provides information about actual account values and actual expenses. However, the table does not include shareholder specific fees, such as the $15.00 fee charged for wire redemptions by the Funds’ transfer agent. The table also does not include portfolio trading commissions and related trading costs. You may use the information in this line, together with the amount you invested, to estimate the expenses that you paid over the period. Simply divide your account value by $1,000 (for example, an $8,600 account value divided by $1,000 = 8.6), then multiply the result by the number in the first line under the heading entitled “Expenses Paid During Period” to estimate the expenses you paid on your account during the period.
Hypothetical Example For Comparison Purposes
The second line on each table below provides information about hypothetical account values and hypothetical expenses based on the actual expense ratios for each share class of the Funds and an assumed rate of return of 5% per year before expenses, which is not the Funds’ actual returns. The hypothetical account values and expenses may not be used to estimate the actual ending account balance or expenses you paid for the period. You may use this information to compare the ongoing costs of investing in the Funds and other funds. To do so, compare this 5% hypothetical example with the 5% hypothetical examples that appear in the shareholder reports of the other fund. Please note that the expenses shown in the table are meant to highlight your ongoing costs only and do not reflect any transactional costs, such as sales charges (loads), redemptions fees, or exchange fees. Therefore, the second line of the table is useful in comparing ongoing costs only, and will not help you determine the relevant total cost of owning different funds.
Stone Ridge Reinsurance Risk Premium Fund — Class I
| | | | | | | | | | | | |
| | | BEGINNING
ACCOUNT
VALUE
MAY 1, 2013 | | | ENDING
ACCOUNT
VALUE
OCTOBER 31, 2013 | | | EXPENSES
PAID DURING
PERIOD*
MAY 1 -
OCTOBER 31, 2013 | |
Actual | | | $1,000.00 | | | | $1,043.20 | | | | $9.42 | |
Hypothetical (5% annual return before expenses) | | | $1,000.00 | | | | $1,015.98 | | | | $9.30 | |
| * | Expenses are equal to the Fund’s annualized expense ratio of 1.83%, multiplied by the average account value over the period, multiplied by 184/365 to reflect the partial year period. |
Stone Ridge Reinsurance Risk Premium Fund — Class M
| | | | | | | | | | | | |
| | | BEGINNING
ACCOUNT
VALUE
MAY 1, 2013 | | | ENDING
ACCOUNT
VALUE
OCTOBER 31, 2013 | | | EXPENSES
PAID DURING
PERIOD*
MAY 1 -
OCTOBER 31, 2013 | |
Actual | | | $1,000.00 | | | | $1,043.80 | | | | $10.15 | |
Hypothetical (5% annual return before expenses) | | | $1,000.00 | | | | $1,015.27 | | | | $10.01 | |
| * | Expenses are equal to the Fund’s annualized expense ratio of 1.97%, multiplied by the average account value over the period, multiplied by 184/365 to reflect the partial year period. |
| | | | | | | | | | | | | | | | |
| | Stone Ridge Funds | | | | | | Annual Report | | | | | | October 2013 | | 55 |
| | | | | | | | | | |
Stone Ridge High Yield Reinsurance Risk Premium Fund — Class I
| | | | | | | | | | | | |
| | | BEGINNING
ACCOUNT
VALUE
MAY 1, 2013 | | | ENDING
ACCOUNT
VALUE
OCTOBER 31, 2013 | | | EXPENSES
PAID DURING
PERIOD*
MAY 1 -
OCTOBER 31, 2013 | |
Actual | | | $1,000.00 | | | | $1,051.60 | | | | $9.98 | |
Hypothetical (5% annual return before expenses) | | | $1,000.00 | | | | $1,015.48 | | | | $9.80 | |
| * | Expenses are equal to the Fund’s annualized expense ratio of 1.93%, multiplied by the average account value over the period, multiplied by 184/365 to reflect the partial year period. |
Stone Ridge High Yield Reinsurance Risk Premium Fund — Class M
| | | | | | | | | | | | |
| | | BEGINNING
ACCOUNT
VALUE
MAY 1, 2013 | | | ENDING
ACCOUNT
VALUE
OCTOBER 31, 2013 | | | EXPENSES
PAID DURING
PERIOD*
MAY 1 -
OCTOBER 31, 2013 | |
Actual | | | $1,000.00 | | | | $1,050.10 | | | | $10.75 | |
Hypothetical (5% annual return before expenses) | | | $1,000.00 | | | | $1,014.72 | | | | $10.56 | |
| * | Expenses are equal to the Fund’s annualized expense ratio of 2.08%, multiplied by the average account value over the period, multiplied by 184/365 to reflect the partial year period. |
Stone Ridge U.S. Variance Risk Premium Fund — Class I
| | | | | | | | | | | | |
| | | BEGINNING
ACCOUNT
VALUE
MAY 1, 2013 | | | ENDING
ACCOUNT
VALUE
OCTOBER 31, 2013 | | | EXPENSES
PAID DURING
PERIOD*
MAY 1 -
OCTOBER 31, 2013 | |
Actual | | | $1,000.00 | | | | $1,073.50 | | | | $8.36 | |
Hypothetical (5% annual return before expenses) | | | $1,000.00 | | | | $1,017.14 | | | | $8.13 | |
| * | Expenses are equal to the Fund’s annualized expense ratio of 1.60%, multiplied by the average account value over the period, multiplied by 184/365 to reflect the partial year period. |
Stone Ridge U.S. Variance Risk Premium Fund — Class M
| | | | | | | | | | | | |
| | | BEGINNING
ACCOUNT
VALUE
MAY 1, 2013 | | | ENDING
ACCOUNT
VALUE
OCTOBER 31, 2013 | | | EXPENSES
PAID DURING
PERIOD*
MAY 1 -
OCTOBER 31, 2013 | |
Actual | | | $1,000.00 | | | | $1,072.50 | | | | $9.09 | |
Hypothetical (5% annual return before expenses) | | | $1,000.00 | | | | $1,016.43 | | | | $8.84 | |
| * | Expenses are equal to the Fund’s annualized expense ratio of 1.74%, multiplied by the average account value over the period, multiplied by 184/365 to reflect the partial year period. |
| | | | | | | | | | | | | | | | |
| 56 | | Stone Ridge Funds | | | | | | Annual Report | | | | | | October 2013 | | |
| | | | | | | | | | |
Stone Ridge U.S. Small Cap Variance Risk Premium Fund — Class I
| | | | | | | | | | | | |
| | | BEGINNING
ACCOUNT
VALUE
MAY 1, 2013 | | | ENDING
ACCOUNT
VALUE
OCTOBER 31, 2013 | | | EXPENSES
PAID DURING
PERIOD*
MAY 1 -
OCTOBER 31, 2013 | |
Actual | | | $1,000.00 | | | | $1,090.90 | | | | $9.22 | |
Hypothetical (5% annual return before expenses) | | | $1,000.00 | | | | $1,016.38 | | | | $8.89 | |
| * | Expenses are equal to the Fund’s annualized expense ratio of 1.75%, multiplied by the average account value over the period, multiplied by 184/365 to reflect the partial year period. |
Stone Ridge U.S. Small Cap Variance Risk Premium Fund — Class M
| | | | | | | | | | | | |
| | | BEGINNING
ACCOUNT
VALUE
MAY 1, 2013 | | | ENDING
ACCOUNT
VALUE
OCTOBER 31, 2013 | | | EXPENSES
PAID DURING
PERIOD*
MAY 1 -
OCTOBER 31, 2013 | |
Actual | | | $1,000.00 | | | | $1,089.90 | | | | $10.06 | |
Hypothetical (5% annual return before expenses) | | | $1,000.00 | | | | $1,015.58 | | | | $9.70 | |
| * | Expenses are equal to the Fund’s annualized expense ratio of 1.91%, multiplied by the average account value over the period, multiplied by 184/365 to reflect the partial year period. |
Stone Ridge U.S. Master Variance Risk Premium Fund — Class I
| | | | | | | | | | | | |
| | | BEGINNING
ACCOUNT
VALUE
MAY 22, 2013** | | | ENDING
ACCOUNT
VALUE
OCTOBER 31, 2013 | | | EXPENSES
PAID DURING
PERIOD*
MAY 22 -
OCTOBER 31, 2013 | |
Actual | | | $1,000.00 | | | | $1,064.20 | | | | $1.15 | |
Hypothetical (5% annual return before expenses) | | | $1,000.00 | | | | $1,021.08 | | | | $1.12 | |
| * | Expenses are equal to the Fund’s annualized expense ratio of 0.25%, multiplied by the average account value over the period, multiplied by 162/365 to reflect the partial year period. |
Stone Ridge U.S. Master Variance Risk Premium Fund — Class M
| | | | | | | | | | | | |
| | | BEGINNING
ACCOUNT
VALUE
MAY 22, 2013** | | | ENDING
ACCOUNT
VALUE
OCTOBER 31, 2013 | | | EXPENSES
PAID DURING
PERIOD*
MAY 22 -
OCTOBER 31, 2013 | |
Actual | | | $1,000.00 | | | | $1,063.60 | | | | $1.88 | |
Hypothetical (5% annual return before expenses) | | | $1,000.00 | | | | $1,020.37 | | | | $1.84 | |
| * | Expenses are equal to the Fund’s annualized expense ratio of 0.41%, multiplied by the average account value over the period, multiplied by 162/365 to reflect the partial year period. |
| ** | Commencement of operations. |
| | | | | | | | | | | | | | | | |
| | Stone Ridge Funds | | | | | | Annual Report | | | | | | October 2013 | | 57 |
| | | | | | | | | | |
| | |
| Additional Information (Unaudited) | | |
1. Investment Advisory Agreement Disclosure
On April 4, 2013, the Board of Trustees (the “Board”) of the Stone Ridge Trust (the “Trust”) approved the investment advisory agreements between Stone Ridge Asset Management, LLC (the “Adviser”) and the Trust on behalf of each of the Stone Ridge U.S. Variance Risk Premium Fund, the Stone Ridge U.S. Small Cap Variance Risk Premium Fund, and the Stone Ridge U.S. Master Variance Risk Premium Fund (each a “Fund” and together the “Funds”).
In connection with their consideration and approval of each Investment Advisory Agreement, the Trustees analyzed: (1) the nature, extent, and quality of the services to be provided by the Adviser; (2) the investment strategies of the Adviser; (3) the cost of the services to be provided and projected profits to be realized by the Adviser from its relationship with the relevant Fund; and (4) the proposed expense ratio of the Fund. Because the Funds had not yet commenced operations, the Board was not able to consider whether economies of scale exist in managing the Funds.
In considering the nature, extent, and quality of the services provided by the Adviser, the Board considered the qualifications the Adviser’s personnel and the Adviser’s ability to attract investors for the Fund, including the Adviser’s track record of raising assets in the existing Funds in the Trust.
The Board concluded that the approval of each of the investment advisory agreement was in the best interest of the Fund’s shareholders. The Board considered the presentation from the Adviser on the investment strategies for each Fund and the proposed cost of services to be provided by the Advisor and concluded they were appropriate, noting that the Adviser would not be charging an investment advisory fee to the Stone Ridge U.S. Master Variance Risk Premium Fund, because the Fund would be investing all or nearly all its assets in the U.S. Variance Risk Premium Fund and the U.S. Small Cap Variance Risk Premium Fund. The Board concluded that the proposed fees schedules were appropriate. The Board compared each Fund’s proposed expense ratio to those of other comparable mutual funds and considered the Adviser’s willingness to contractually cap the operating expenses of the Stone Ridge U.S. Variance Risk Premium Fund and the Stone Ridge U.S. Small Cap Variance Risk Premium Fund. After review, the Board concluded that the proposed expense ratios for each of the Funds were appropriate.
Based on the foregoing, and such other matters as were deemed relevant, but with no single factor being determinative to their decision, the Trustees concluded that the proposed Investment Advisory Agreements and advisory fees were fair and reasonable in relation to the services and expenses and such other matters as the Board has considered to be relevant in the exercise of their reasonable business judgment. As a result, the Trustees concluded that the approval of the Investment Advisory Agreements was in the best interest of the Funds.
2. Disclosure Regarding Fund Trustees and Officers
| | | | | | | | | | |
| Trustees |
NAME
(DATE OF BIRTH) | | POSITION(S)
HELD WITH
THE TRUST | | TERM OF
OFFICE(2) AND
LENGTH OF
TIME SERVED | | PRINCIPAL OCCUPATION(S)
DURING THE PAST 5 YEARS | | NUMBER OF PORTFOLIOS
IN THE FUND COMPLEX
OVERSEEN BY TRUSTEE | | OTHER
DIRECTORSHIPS /
TRUSTEESHIPS
HELD BY TRUSTEE
DURING THE
PAST 5 YEARS |
Jeffery Ekberg (4/29/1965) | | Trustee(1) | | since 2012 | | Principal, TPG Capital, L.P. (a global private investment firm), since May 2002; Chief Financial Officer, Newbridge Capital, LLC (an investment management company), until June 2011. | | 5 | | TPG Capital, LLC and
affiliates (sponsored
investment funds),
since May 2002. |
| | | | | |
Daniel Charney (10/12/1970) | | Trustee(1) | | since 2012 | | Cowen Group (a diversified financial services firm that provides alternative investment management and broker-dealer services), since January 2012; Jefferies & Co. (a global securities and investment banking firm), until November 2011. | | 5 | | None. |
| | | | | | | | | | | | | | | | |
| 58 | | Stone Ridge Funds | | | | | | Annual Report | | | | | | October 2013 | | |
| | | | | | | | | | |
| | |
| Additional Information (Unaudited) | | |
| | | | | | | | | | |
NAME
(DATE OF BIRTH) | | POSITION(S)
HELD WITH
THE TRUST | | TERM OF
OFFICE(2) AND
LENGTH OF
TIME SERVED | | PRINCIPAL OCCUPATION(S)
DURING THE PAST 5 YEARS | | NUMBER OF PORTFOLIOS
IN THE FUND COMPLEX
OVERSEEN BY TRUSTEE | | OTHER
DIRECTORSHIPS /
TRUSTEESHIPS
HELD BY TRUSTEE
DURING THE
PAST 5 YEARS |
| | | | | |
Ross Stevens(3) (12/13/69) | | Trustee, Chairman | | since 2012 | | Founder of Stone Ridge Asset Management LLC (“Adviser”), Chief Executive Officer and President of the Adviser, since 2012, Magnetar Capital (a multi-strategy alternative investment manager) (Investment Committee and Co-Head of Portfolio Managers Committee), until 2012. | | 5 | | None. |
| (1) | Trustees who are not “interested persons” of the Trust as defined in the 1940 Act. |
| (2) | Each Trustee serves until resignation or removal from the Board. |
| (3) | Mr. Stevens is an “interested person” of the Trust, as defined in Section 2(a)(19) of the 1940 Act, due to his position with Stone Ridge Asset Management LLC. |
The Statement of Additional Information includes additional information about the Fund’s Trustees and is available free of charge upon request by call the Funds toll free at 1.855.609.3680
| | | | | | |
Officers |
NAME (DATE OF
BIRTH) AND ADDRESS (1) | | POSITION(S)
HELD
WITH THE TRUST | | TERM OF
OFFICE AND
LENGTH OF
TIME SERVED(2) | | PRINCIPAL OCCUPATION(S) DURING PAST 5 YEARS |
Ross Stevens (12/13/69) | | President and Chief Executive Officer | | since 2012 | | Founder of Stone Ridge Asset Management LLC (“Adviser”), Chief Executive Officer and President of the Adviser (since 2012), prior to that Magnetar Capital (a multi-strategy alternative investment manager) (Investment Committee and Co-Head of Portfolio Managers Committee). |
| | | | | | | |
Jane Korach (3/13/74) | | Chief Compliance Officer and Secretary | | since 2012 | | General Counsel of the Adviser, since 2012; prior to that General Counsel and CCO at Owl Creek Asset Management (an employee owned hedge fund sponsor). |
Patrick Kelly (12/30/78) | | Treasurer and Principal Financial Officer | | since 2012 | | Chief Operating Officer of the Adviser, since 2012; prior to that Magnetar Capital (a multi-strategy alternative investment manager), as the Chief Operating Officer of Quantitative Strategies |
| (1) | Each Officer’s mailing address is c/o Stone Ridge Asset Management LLC, 405 Lexington Avenue, 55th Floor, New York, NY 10174. |
| (2) | The term of office of each officer is indefinite. |
| | | | | | | | | | | | | | | | |
| | Stone Ridge Funds | | | | | | Annual Report | | | | | | October 2013 | | 59 |
| | | | | | | | | | |
| | |
| Additional Information (Unaudited) | | |
3. Shareholder Notification of Federal Tax Status
For the fiscal period ended October 31, 2013, certain dividends paid by the Funds may be subject to a maximum tax rate of 15%, as provided for by the Jobs and Growth Tax Relief Reconciliation Act of 2003. The percentage of dividends declared from ordinary income designated as qualified dividend income was as follows:
| | | | |
| | | PERCENTAGES | |
Reinsurance Risk Premium Fund | | | 9.19% | |
High Yield Reinsurance Risk Premium Fund | | | 3.69% | |
U.S. VRP Fund | | | 4.09% | |
U.S. Small Cap VRP Fund | | | 0.08% | |
U.S. Master VRP Fund | | | 3.24% | |
For corporate shareholders, the percent of ordinary income distributions qualifying for the corporate dividends received deduction for the fiscal period ended October 31, 2013 was as follows:
| | | | |
| | | PERCENTAGES | |
Reinsurance Risk Premium Fund | | | 0.00% | |
High Yield Reinsurance Risk Premium Fund | | | 0.00% | |
U.S. VRP Fund | | | 4.09% | |
U.S. Small Cap VRP Fund | | | 0.08% | |
U.S. Master VRP Fund | | | 3.24% | |
For the period ended October 31, 2013, the funds designate the following percent of ordinary distributions paid as interest-related dividends under the Internal Revenue Code Section 871(k)(1)(c):
| | | | |
| | | PERCENTAGES | |
Reinsurance Risk Premium Fund | | | 0.17% | |
High Yield Reinsurance Risk Premium Fund | | | 0.14% | |
U.S. VRP Fund | | | 0.45% | |
U.S. Small Cap VRP Fund | | | 0.41% | |
U.S. Master VRP Fund | | | 0.00% | |
The percentage of taxable ordinary income distributions that are designated as short-term capital gain distributions under Internal Revenue Section 871(k)(2)(C) for each Fund were as follows:
| | | | |
| | | PERCENTAGES | |
Reinsurance Risk Premium Fund | | | 0.00% | |
High Yield Reinsurance Risk Premium Fund | | | 0.00% | |
U.S. VRP Fund | | | 100.00% | |
U.S. Small Cap VRP Fund | | | 100.00% | |
U.S. Master VRP Fund | | | 0.18% | |
Shareholders should not use the above information to prepare their tax returns. Since each Fund’s fiscal year is not the calendar year, another notification will be made available with respect to calendar year 2013. Such notification, which will reflect the amount to be used by calendar year taxpayers on their Federal income tax returns, will be made in conjunction with Form 1099-DIV and will be made available in February on the Funds’ website, www.stoneridgefunds.com. Shareholders are advised to consult their own tax advisors with respect to the tax consequences of their investment in each of the Funds.
4. Availability of Quarterly Portfolio Holdings Schedules
The Funds are required to file their complete schedule of portfolio holdings with the SEC for the first and third quarters of each fiscal year on Form N-Q. The Funds’ Form N-Q is available without charge on the SEC’s website (http://www.sec.gov) and may be available by calling 1.855.609.3680. You may also obtain copies at the SEC’s Public Reference Room in Washington, D.C. Information on the operation of the Public Reference Room may be obtained by calling 1.800.SEC.0330.
| | | | | | | | | | | | | | | | |
| 60 | | Stone Ridge Funds | | | | | | Annual Report | | | | | | October 2013 | | |
| | | | | | | | | | |
| | |
| Additional Information (Unaudited) | | |
5. Proxy Voting Policies and Procedures and Proxy Voting Record
A description of the policies and procedures that the Funds use to determine how to vote proxies relating to portfolio securities is available without charge by calling 1.855.609.3680 and on the SEC’s website (http://www.sec.gov). The Funds are required to file how they voted proxies related to portfolio securities during the most recent 12-month period ended June 30. The information is available without charge, upon request by calling 1.855.609.3680 and on the SEC’s website (http://www.sec.gov).
| | | | | | | | | | | | | | | | |
| | Stone Ridge Funds | | | | | | Annual Report | | | | | | October 2013 | | 61 |
| | | | | | | | | | |
Investment Adviser
Stone Ridge Asset Management, LLC
405 Lexington Avenue, 55th Floor
New York, NY 10174
Independent Registered Public Accounting Firm
Ernst & Young LLP
5 Times Square
New York, NY 10036
Legal Counsel
K&L Gates LLP
State Street Financial Center
One Lincoln Street
Boston, MA 02111
Custodian
U.S. Bank, N.A.
1555 North RiverCenter Drive, Suite 302
Milwaukee, WI 53212
Distributor
Quasar Distributors, LLC
615 East Michigan Street
Milwaukee, WI 53202
Administrator, Transfer Agent and Dividend Disbursing Agent
U.S. Bancorp Fund Services, LLC
615 East Michigan Street
Milwaukee, WI 53202
 SQANNU
Item 2. Code of Ethics.
The registrant has adopted a code of ethics that applies to the registrant’s principal executive officer and principal financial officer. The registrant has not made any amendments to its code of ethics during the period covered by this report. The registrant has not granted any waivers from any provisions of the code of ethics during the period covered by this report.
A copy of the registrant’s Code of Ethics is filed herewith.
Item 3. Audit Committee Financial Expert.
The registrant’s board of trustees has determined that there is at least one audit committee financial expert serving on its audit committee. Jeffery Ekberg is the “audit committee financial expert” and is considered to be “independent” as each term is defined in Item 3 of Form N-CSR.
Item 4. Principal Accountant Fees and Services.
The registrant has engaged its principal accountant to perform audit services, audit-related services, tax services and other services during the past fiscal year. “Audit services” refer to performing an audit of the registrant’s annual financial statements or services that are normally provided by the accountant in connection with statutory and regulatory filings or engagements for those fiscal years. “Audit-related services” refer to the assurance and related services by the principal accountant that are reasonably related to the performance of the audit. “Tax services” refer to professional services rendered by the principal accountant for tax compliance, tax advice, and tax planning. The following table details the aggregate fees billed or expected to be billed for the last fiscal year for audit fees, audit-related fees, tax fees and other fees by the principal accountant. The Trust began operations during the fiscal ended October 31, 2013. As such, there is no information listed for the prior fiscal year.
| | | | |
| | | FYE 10/31/2013 | | FYE 10/31/2012 |
Audit Fees | | $248,000 | | N/A |
Audit-Related Fees | | $0 | | N/A |
Tax Fees | | $95,500 | | N/A |
All Other Fees | | $0 | | N/A |
The audit committee has adopted pre-approval policies and procedures that require the audit committee to pre-approve all audit and non-audit services of the registrant, including services provided to any entity affiliated with the registrant.
The percentage of fees billed by Ernst & Young LLP applicable to non-audit services pursuant to waiver of pre-approval requirement were as follows:
| | | | |
| | | FYE 10/31/2013 | | FYE 10/31/2012 |
Audit-Related Fees | | 0% | | N/A |
Tax Fees | | 0% | | N/A |
All Other Fees | | 0% | | N/A |
1
All of the principal accountant’s hours spent on auditing the registrant’s financial statements were attributed to work performed by full-time permanent employees of the principal accountant.
The following table indicates the non-audit fees billed or expected to be billed by the registrant’s accountant for services to the registrant and to the registrant’s investment adviser (and any other controlling entity, etc.—not sub-adviser) for the last year. The audit committee of the board of trustees has considered whether the provision of non-audit services that were rendered to the registrant’s investment adviser is compatible with maintaining the principal accountant’s independence and has concluded that the provision of such non-audit services by the accountant has not compromised the accountant’s independence.
| | | | |
Non-Audit Related Fees | | FYE 10/31/2013 | | FYE 10/31/2012 |
Registrant | | $95,500 | | N/A |
Registrant’s Investment Adviser | | $0 | | N/A |
Item 5. Audit Committee of Listed Registrants.
Not applicable to registrants who are not listed issuers (as defined in Rule 10A-3 under the Securities Exchange Act of 1934).
Item 6. Investments.
| (a) | Schedule of Investments is included as part of the report to shareholders filed under Item 1 of this Form. |
Item 7. Disclosure of Proxy Voting Policies and Procedures for Closed-End Management Investment Companies.
Not applicable to open-end investment companies.
Item 8. Portfolio Managers of Closed-End Management Investment Companies.
Not applicable to open-end investment companies.
Item 9. Purchases of Equity Securities by Closed-End Management Investment Company and Affiliated Purchasers.
Not applicable to open-end investment companies.
Item 10. Submission of Matters to a Vote of Security Holders.
Not Applicable.
Item 11. Controls and Procedures.
| (a) | The Registrant’s President/Chief Executive Officer and Treasurer/Chief Financial Officer have reviewed the Registrant’s disclosure controls and procedures (as defined in Rule 30a-3(c) under the Investment Company Act of 1940 (the “Act”)) as of a date within 90 days of the filing of this report, as required by Rule 30a-3(b) under the Act and Rules 13a-15(b) or |
2
| | 15d-15(b) under the Securities Exchange Act of 1934. Based on their review, such officers have concluded that the disclosure controls and procedures are effective in ensuring that information required to be disclosed in this report is appropriately recorded, processed, summarized and reported and made known to them by others within the Registrant and by the Registrant’s service provider. |
| (b) | There were no changes in the Registrant’s internal control over financial reporting (as defined in Rule 30a-3(d) under the Act) that occurred during the second fiscal quarter of the period covered by this report that has materially affected, or is reasonably likely to materially affect, the Registrant’s internal control over financial reporting. |
Item 12. Exhibits.
| (a) | (1) Any code of ethics or amendment thereto, that is the subject of the disclosure required by Item 2, to the extent that the registrant intends to satisfy Item 2 requirements through filing an exhibit. Filed herewith. |
(2) A separate certification for each principal executive and principal financial officer pursuant to Section 302 of the Sarbanes-Oxley Act of 2002. Filed herewith.
(3) Any written solicitation to purchase securities under Rule 23c-1 under the Act sent or given during the period covered by the report by or on behalf of the registrant to 10 or more persons. Not applicable to open-end investment companies.
| (b) | Certifications pursuant to Section 906 of the Sarbanes-Oxley Act of 2002. Furnished herewith. |
3
SIGNATURES
Pursuant to the requirements of the Securities Exchange Act of 1934 and the Investment Company Act of 1940, the registrant has duly caused this report to be signed on its behalf by the undersigned, thereunto duly authorized.
(Registrant) Stone Ridge Trust
| | | | |
| By (Signature and Title)* | | /s/ Ross Stevens | | |
| | Ross Stevens, President | | |
Date 1/7/2014
Pursuant to the requirements of the Securities Exchange Act of 1934 and the Investment Company Act of 1940, this report has been signed below by the following persons on behalf of the registrant and in the capacities and on the dates indicated.
| | | | |
| By (Signature and Title)* | | /s/ Ross Stevens | | |
| | Ross Stevens, President | | |
Date 1/7/2014
| | | | |
| By (Signature and Title)* | | /s/ Patrick Kelly | | |
| | Patrick Kelly, Treasurer | | |
Date 1/7/2014
| * | Print the name and title of each signing officer under his or her signature. |
4