Exhibit 17(c)
Annual Report
October 31, 2015

Stone Ridge Reinsurance Risk Premium Fund
Stone Ridge High Yield Reinsurance Risk Premium Fund
Stone Ridge U.S. Large Cap Variance Risk Premium Fund
Stone Ridge U.S. Small Cap Variance Risk Premium Fund
Stone Ridge U.S. Variance Risk Premium Master Fund
Stone Ridge International Developed Markets Variance Risk Premium Fund
Stone Ridge Emerging Markets Variance Risk Premium Fund
Stone Ridge International Variance Risk Premium Master Fund
Stone Ridge Global Equity Variance Risk Premium Master Fund
Table of Contents
Shareholder Letter
December 2015
Dear Fellow Shareholder:
Like all firms, Stone Ridge was once a startup – no products, no clients. Now, with over 150 institutional clients, 11 funds, and $790 million of trading profits since inception, I hope we’re always a startup. As the brilliant Peter Thiel wrote in Zero to One:
The best startups might be considered slightly less extreme kinds of cults. The biggest difference is that cults tend to be fanatically wrong about something important. People at successful startups are fanatically right about something those outside it have missed.
What are we fanatically right about?
Stone Ridge is an ecosystem of optimism and possibilities. Our power comes from knowing that kindness has no downside. It works. Not every time, but always. Can you build a financial services firm based on “Focus. Be Humble. Be Kind.”? Our experiment is ongoing, but so far the results are encouraging.
Our Firm Principles are aspirational – we’re far from perfect – though our approach to moving though the world, applied consistently, has resulted in a culture we cherish. At Stone Ridge, our people – powered by an almost childlike sense of wonder – are everything. So how do new people join?
The recruiting process requires candidates – no matter how senior, no matter how junior – to meet with each member of our Management Committee twice. That part alone is 18 meetings. The entire process, which takes months and ultimately includes completion and presentation of a challenging project, is “off market.” This is on purpose. The higher up you go in most organizations, the more detached the senior executives get from the hiring process. I believe the opposite should be true. The objective is to create a hiring culture that resists compromise. Our most treasured achievement since inception is not the $790 million of trading profits. It’s that zero employees have chosen to leave.
While our firm’s growth has felt natural to us at every step along the way, some outsiders are surprised. The part they miss is the part they don’t see: the commitment of everyone at Stone Ridge to ongoing personal improvement. When you’re committed to getting better at something, progress is not always visible or tangible in the moment, but micro improvements accumulate. Breakthroughs eventually happen, though patience is required. We have chosen the path of personal improvement for its own sake, but also so that we can be our best selves to support our shared journey. Together we want to find out what’s possible in asset management.
In 2015, we introduced the concept of Antifragile at Stone Ridge. Coined by the brave Nassim Taleb, something Antifragile goes beyond surviving shocks, which is resiliency. For something Antifragile, shocks actually make it stronger. Firms are fragile. Could Stone Ridge become Antifragile? For example, after a disaster could our internal relationships actually strengthen amidst the chaos? In the aftermath, could our investors make more money, not less? Let me share two concrete examples of how we began our Antifragile journey this year.
First, about 6 months ago, I assigned a question to everyone at the firm:
Who are you committed to being, and how are you committed to responding, when the firm experiences its first disaster?
It’s a heavy question and I wasn’t looking for conceptual answers. I wanted bullet points and concrete action items. “Be specific. Show me your list.” Individual answers were presented to managers, who synthesized the views of their teams, and presented the overall results to our Management Committee. The details of our answers are private to us, but I can share that the process of answering this question changed us as a firm.
| | | | | | | | | | | | | | | | |
| | Stone Ridge Funds | | | | | | Annual Report | | | | | | October 31, 2015 | | |
| | | | | | | | | | |
3
Shareholder Letter
Of course, we don’t wish for a disaster, but the firm will be stronger afterwards. The power in that confidence, in that knowing, is palpable inside Stone Ridge. It has caused a real shift in the firm. You can feel it in the office. I invite you to visit us in 2016 and feel it for yourself.
The second Antifragile step we took in 2015 was the filing of the prospectus for the Stone Ridge Post-Event Reinsurance Fund (SRPEX). SRPEX will activate and collect client assets only after industry-changing disasters, the same kind of “CNN events” that will cause our Reinsurance Funds to have material drawdowns. Historically, such industry-changing events (e.g., devastating hurricanes Denis, Emily, Katrina, Rita, and Wilma occurred during four consecutive months in 2005) have caused post-event reinsurance yields to increase considerably the following renewal season. Upon triggering, SRPEX will become the sole channel to access the Stone Ridge Reinsurance Funds. SRPEX is available only to existing clients at the time of its activation and it does not charge any additional management fees or fund expenses.
How can a fund that charges no fees and has no assets help a firm, its clients, and its reinsurance partners become Antifragile? For clients, SRPEX means access to valuable post-event capacity with the largest global reinsurers, so long-term wealth creation becomes Antifragile. For our reinsurance partners, SRPEX means balance sheet security and the ability to play post-event offense, so their capital structure becomes Antifragile. And for Stone Ridge, SRPEX means post-event assets under management (AUM) goes up instead of down, so our firm becomes Antifragile.
The journey towards Antifragile is a long one, but we’ve taken the first steps.
2015 was far from a smooth ride and, given the diversity of our risk exposures, it never will be. Our reinsurance portfolios took many hits this year, including the Tianjin explosion in China, the Pemex explosion in the Gulf, Hurricane Patricia hitting the Jalisco coast, Cyclone Marcia smashing the Queensland coast, and brutal hailstorms in Sydney. We also suffered from the August volatility spikes in financial risk markets. Yet across all products, Stone Ridge delivered $404 million of trading profits through November. Even in August, trading profits were positive, as gains from our reinsurance portfolios more than offset losses from our Variance Risk Premium (VRP) franchise.
The Sharpe Ratio of 2015’s $404 million trading profits was an unsustainable 4.2, following last year’s $281 million trading profits and similarly unsustainable 5.5 Sharpe Ratio. Our performance since inception materially understates the true risk of our strategies. In particular, historical volatility is an often misleading and always incomplete measure of risk for any strategy, but especially for those involving insurance-related investments. Do not get lulled into a false sense of security when you look at the consistency of our past results. In future years, there will be tragic earthquakes and hurricanes. There will be market crashes.
We don’t court sharp losses, but they are part of the business and part of life. Reinsurers and option sellers – kindred spirits – must accept disasters, or else they would have no clients and our funds would make no money. Simply put, if you never pay claims, no one buys insurance. The real determinative of long-term wealth creation is how those providing risk transfer services to the markets – our clients via Stone Ridge funds – behave after losses.
When crashes happen, we will be standing shoulder to shoulder with you, arms locked together, drawing on centuries of wisdom about insurance markets, and reminding you that the best reinsurers sell more reinsurance after the storm.
Stone Ridge is most proud of the 50/50 partnership we have with you, our clients. We are on the path together. You contribute the capital necessary to sustain and propel groundbreaking product development. We contribute our collective careers’ worth of experience in sourcing, structuring, execution, and risk management. Together it works. In that spirit, I offer my deepest gratitude to you for sharing responsibility for your wealth with us this year. We look forward to serving you again in 2016.
Sincerely,
Ross L. Stevens
Founder, CEO
| | | | | | | | | | | | | | | | |
| | Stone Ridge Funds | | | | | | Annual Report | | | | | | October 31, 2015 | | |
| | | | | | | | | | |
4
Shareholder Letter
Standardized returns as September 30, 2015 for: U.S. Large Cap Variance Risk Premium Fund (“VRLIX”) 1Yr=1.67%, since inception (5/1/13)=7.13%; U.S. Small Cap Variance Risk Premium Fund (“VRSIX”) 1Yr=2.32%, since inception (5/1/13)=5.65%; U.S. Variance Risk Premium Master Fund (“VRPIX”) 1Yr=1.77%, since inception (5/21/13)=6.01%; International Developed Markets Variance Risk Premium Fund (“VRFIX”) 1Yr=-3.18%, since inception (2/11/14)=-0.44%; Emerging Markets Variance Risk Premium Fund (“VRMIX”) 1Yr=-13.05%, since inception (2/11/14)=-6.66%; International Variance Risk Premium Master Fund (“VRIIX”) 1Yr=-6.82%, since inception (2/11/14)=-2.90%; Global Equity Variance Risk Premium Master Fund (“VRGIX”) since inception (11/14/14)=-2.85%; All Asset Variance Risk Premium Fund (“AVRPX”) since inception (4/13/2015)=2.40%; Reinsurance Risk Premium Fund (“SREIX”) 1Yr=4.73%, since inception (2/1/13)=6.22%; High Yield Reinsurance Risk Premium Fund (“SHRIX”) 1Yr=5.69%, since inception (2/1/13)=7.30%; Reinsurance Risk Premium Interval Fund (“SRRIX”) 1YR=7.22%, since inception (12/9/2013)=8.38%. Returns over one year are annualized. Performance data quoted represents past performance; past performance does not guarantee future results. The investment return and principal value of an investment will fluctuate so that an investor’s shares, when redeemed, may be worth more or less than their original cost. Results for funds are net of fees and reflect the reinvestment of dividends and earnings. Current performance of the fund may be lower or higher than the performance quoted. Performance data current to the most recent quarter end may be obtained by calling 855-609-3680.
The gross expense ratio for the funds: VRLIX 1.62%; VRSIX 1.60%; VRFIX 2.24%; VRMIX 2.41%; SREIX 1.71%; SHRIX 1.78%; SRRIX 2.38%; VRPIX 1.76%; VRIIX 2.62%; VRGIX 2.02%; AVRPX 2.28%
The Funds are generally available only to registered investment advisors (“RIAs”) meeting certain qualifications and that have completed a training program provided by the Advisor. Before allocating shares of the Funds to a client’s account, RIAs should carefully consider the Fund’s investment objectives, risks, and charges and expenses before investing, as investing in the Funds may not be appropriate for all clients and is not designed to be a complete investment program. Each Fund’s prospectus contains this and other information about the Fund. A prospectus and other information about the Funds may be obtained by calling 855-609-3680 or visiting www.stoneridgefunds.com. Please read the prospectus carefully before investing. The information in this letter to shareholders regarding the Stone Ridge Post-Event Reinsurance Fund and in the Post-Event Reinsurance Fund prospectus (or Statement of Additional Information) is not complete and may be changed. The Advisor may not sell the Post-Event Reinsurance Fund until the registration statement filed with the Securities and Exchange Commission is effective. The Post-Event Reinsurance Fund’s prospectus (or Statement of Additional Information) is not an offer to sell the fund and is not soliciting an offer to buy the fund in any state where the offer or sale is not permitted.
An investment in the Funds involves a high degree of risk. Before making an investment/allocation decision, an RIA should (i) consider the suitability of this investment with respect to a client’s investment objectives and individual situation and (ii) consider factors such as a client’s net worth, income, age, and risk tolerance. Allocation to client accounts should be avoided where a client has a short-term investing horizon and/or cannot bear the loss of some or all of their investment.
Mutual fund investing involves risk; Principal loss is possible.
The event-linked securities in which the Reinsurance Risk Premium Fund, High Yield Reinsurance Risk Premium Fund, and Reinsurance Risk Premium Interval Fund invest are considered “high yield” or “junk bonds”. It is possible that investing in the Funds may result in a loss of some or all of the amount invested. Event-linked, catastrophe bonds and reinsurance related securities carry large uncertainties and major risk exposures to adverse conditions. If a trigger event, as defined within the terms of the bond (such as a major natural disaster), involves losses or other metrics exceeding a specific magnitude in the geographic region and time period specified therein, the Funds may lose a portion or all of their investments in such security, including accrued interest and/or principal invested in such security. The Funds may invest in illiquid or restricted securities which may be difficult or impossible to sell at a time that the Funds would like or at the price that the Funds believe the security is worth. For additional risks, please refer to the prospectus.
| | | | | | | | | | | | | | | | |
| | Stone Ridge Funds | | | | | | Annual Report | | | | | | October 31, 2015 | | |
| | | | | | | | | | |
5
Shareholder Letter
The US Variance Risk Premium Master Fund’s, US Large Cap Variance Risk Premium Fund’s, US Small Cap Variance Risk Premium Fund’s, and All Asset Variance Risk Premium Fund’s use of derivatives can lead to losses because of adverse movements in the price or value of the asset, index, rate or instrument underlying a derivative, due to failure of a counterparty or due to tax or regulatory constraints. Derivatives may create economic leverage in the Funds, which magnifies the Funds’ exposure to the underlying investment. When derivatives are used to gain or limit exposure to a particular market or market segment, their performance may not correlate as expected to the performance of such market thereby causing the Funds to fail to achieve its original purpose for using such derivatives. The use of derivatives involves the exercise of specialized skill and judgment, and a transaction may be unsuccessful in whole or in part because of market behavior or unexpected events. Derivative instruments may be difficult to value, may be illiquid, and may be subject to wide swings in valuation caused by changes in the value of the underlying instrument. Investing in an ETF exposes the Fund to all of the risks of that ETF’s investments. As a result, the cost of investing in ETF shares may exceed the costs of investing directly in its underlying investments. ETF shares trade on an exchange at a market price which may vary from the ETF’s net asset value. The Funds are subject to leveraging risk. Leverage magnifies the Funds’ exposure to declines in the value of one or more underlying investments or creates investment risk with respect to a larger pool of assets than the Funds would otherwise have. The stocks of smaller, less seasoned companies are generally subject to greater price fluctuations, limited liquidity, higher transaction costs and higher investment risk. If, in any year, the Funds fail to qualify as a RIC under the Code for any reason, such a failure would have a material adverse effect on the Funds and their shareholders.
The opinions expressed are those of Stone Ridge Asset Management through the end of the period of this report, are subject to change, and are not intended to be a forecast of future events, a guarantee of future results, nor investment advice.
Past performance is no guarantee of future results.
This information is intended for the shareholders of the Funds and is not for distribution to prospective investors unless preceded or accompanied by a current prospectus.
Sharpe Ratio is a measure that indicates the average return minus the risk-free return divided by the standard deviation of return on an investment.
The Stone Ridge Funds are distributed by Quasar Distributors, LLC.
| | | | | | | | | | | | | | | | |
| | Stone Ridge Funds | | | | | | Annual Report | | | | | | October 31, 2015 | | |
| | | | | | | | | | |
6
| | | | |
| STONE RIDGE REINSURANCE RISK PREMIUM FUND | | | | |
|
| PERFORMANCE DATA (Unaudited) |
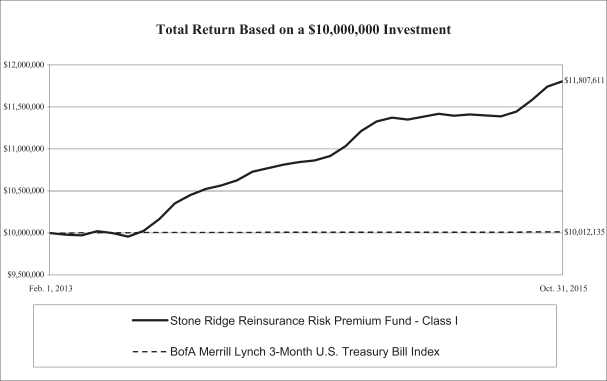
This chart assumes an initial gross investment of $10,000,000 made on February 1, 2013 (commencement of operations). Returns shown include the reinvestment of all dividends. Returns shown do not reflect the deduction of taxes that a shareholder would pay on fund distributions or the redemption of fund shares. In the absence of fee waivers and reimbursements, total return would be reduced. Past performance is not predictive of future performance. Investment return and principal value will fluctuate, so that your shares, when redeemed, may be worth more or less than the original cost.
The Bank of America (BofA) Merrill Lynch 3-Month U.S. Treasury Bill Index is an index of short-term U.S. Government securities with a remaining term to final maturity of less than three months. Index figures do not reflect any deduction of fees, taxes or expenses, and are not available for investment.
| | | | | | | | |
| AVERAGE ANNUAL TOTAL RETURNS (FOR PERIODS ENDED OCTOBER 31, 2015) | | | |
| | | 1-year
period
ended
10/31/2015 | | | Since
Inception
(02/01/13) | |
Stone Ridge Reinsurance Risk Premium Fund — Class I | | | 4.22% | | | | 6.24% | |
Stone Ridge Reinsurance Risk Premium Fund — Class M | | | 4.06% | | | | 6.09% | |
BofA Merrill Lynch 3-Month U.S. Treasury Bill Index | | | 0.02% | | | | 0.04% | |
| | | | | | | | | | | | | | | | |
| | Stone Ridge Funds | | | | | | Annual Report | | | | | | October 31, 2015 | | |
| | | | | | | | | | |
7
| | | | |
| STONE RIDGE HIGH YIELD REINSURANCE RISK PREMIUM FUND | | | | |
|
| PERFORMANCE DATA (Unaudited) |
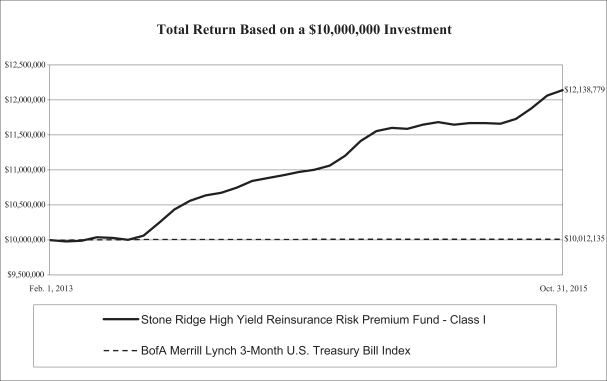
This chart assumes an initial gross investment of $10,000,000 made on February 1, 2013 (commencement of operations). Returns shown include the reinvestment of all dividends. Returns shown do not reflect the deduction of taxes that a shareholder would pay on fund distributions or the redemption of fund shares. In the absence of fee waivers and reimbursements, total return would be reduced. Past performance is not predictive of future performance. Investment return and principal value will fluctuate, so that your shares, when redeemed, may be worth more or less than the original cost.
The Bank of America (BofA) Merrill Lynch 3-Month U.S. Treasury Bill Index is an index of short-term U.S. Government securities with a remaining term to final maturity of less than three months. Index figures do not reflect any deduction of fees, taxes or expenses, and are not available for investment.
| | | | | | | | |
| AVERAGE ANNUAL TOTAL RETURNS (FOR PERIODS ENDED OCTOBER 31, 2015) | |
| | | 1-year
period
ended
10/31/2015 | | | Since
Inception
(02/01/13) | |
Stone Ridge High Yield Reinsurance Risk Premium Fund — Class I | | | 5.06% | | | | 7.32% | |
Stone Ridge High Yield Reinsurance Risk Premium Fund — Class M | | | 4.90% | | | | 7.16% | |
BofA Merrill Lynch 3-Month U.S. Treasury Bill Index | | | 0.02% | | | | 0.04% | |
| | | | | | | | | | | | | | | | |
| | Stone Ridge Funds | | | | | | Annual Report | | | | | | October 31, 2015 | | |
| | | | | | | | | | |
8
| | | | |
| STONE RIDGE U.S. LARGE CAP VARIANCE RISK PREMIUM FUND | | | | |
|
| PERFORMANCE DATA (Unaudited) |
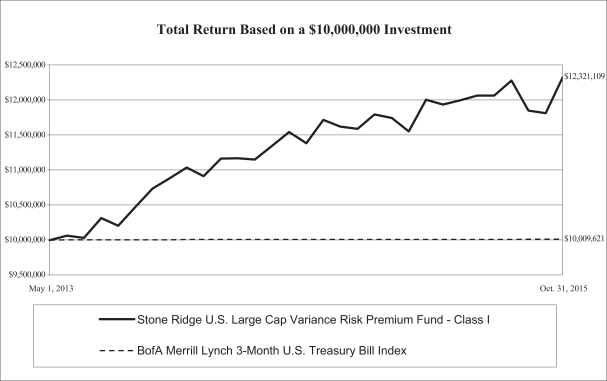
This chart assumes an initial gross investment of $10,000,000 made on May 1, 2013 (commencement of operations). Returns shown include the reinvestment of all dividends. Returns shown do not reflect the deduction of taxes that a shareholder would pay on fund distributions or the redemption of fund shares. In the absence of fee waivers and reimbursements, total return would be reduced. Past performance is not predictive of future performance. Investment return and principal value will fluctuate, so that your shares, when redeemed, may be worth more or less than the original cost.
The Bank of America (BofA) Merrill Lynch 3-Month U.S. Treasury Bill Index is an index of short-term U.S. Government securities with a remaining term to final maturity of less than three months. Index figures do not reflect any deduction of fees, taxes or expenses, and are not available for investment.
| | | | | | | | |
| AVERAGE ANNUAL TOTAL RETURNS (FOR PERIODS ENDED OCTOBER 31, 2015) | | | | | | |
| | | 1-year
period
ended
10/31/2015 | | | Since
Inception
(05/01/13) | |
Stone Ridge U.S. Large Cap Variance Risk Premium Fund — Class I | | | 6.33% | | | | 8.69% | |
Stone Ridge U.S. Large Cap Variance Risk Premium Fund — Class M | | | 6.15% | | | | 8.50% | |
BofA Merrill Lynch 3-Month U.S. Treasury Bill Index | | | 0.02% | | | | 0.04% | |
| | | | | | | | | | | | | | | | |
| | Stone Ridge Funds | | | | | | Annual Report | | | | | | October 31, 2015 | | |
| | | | | | | | | | |
9
| | | | |
| STONE RIDGE U.S. SMALL CAP VARIANCE RISK PREMIUM FUND | | | | |
|
| PERFORMANCE DATA (Unaudited) |
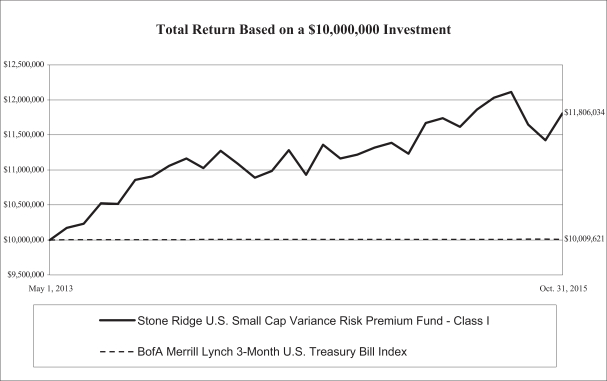
This chart assumes an initial gross investment of $10,000,000 made on May 1, 2013 (commencement of operations). Returns shown include the reinvestment of all dividends. Returns shown do not reflect the deduction of taxes that a shareholder would pay on fund distributions or the redemption of fund shares. In the absence of fee waivers and reimbursements, total return would be reduced. Past performance is not predictive of future performance. Investment return and principal value will fluctuate, so that your shares, when redeemed, may be worth more or less than the original cost.
The Bank of America (BofA) Merrill Lynch 3-Month U.S. Treasury Bill Index is an index of short-term U.S. Government securities with a remaining term to final maturity of less than three months. Index figures do not reflect any deduction of fees, taxes or expenses, and are not available for investment.
| | | | | | | | |
| AVERAGE ANNUAL TOTAL RETURNS (FOR PERIODS ENDED OCTOBER 31, 2015) | | | | | | |
| | | 1-year
period
ended
10/31/2015 | | | Since
Inception
(05/01/13) | |
Stone Ridge U.S. Small Cap Variance Risk Premium Fund — Class I | | | 5.23% | | | | 6.86% | |
Stone Ridge U.S. Small Cap Variance Risk Premium Fund — Class M | | | 5.15% | | | | 6.70% | |
BofA Merrill Lynch 3-Month U.S. Treasury Bill Index | | | 0.02% | | | | 0.04% | |
| | | | | | | | | | | | | | | | |
| | Stone Ridge Funds | | | | | | Annual Report | | | | | | October 31, 2015 | | |
| | | | | | | | | | |
10
| | | | |
| STONE RIDGE U.S. VARIANCE RISK PREMIUM MASTER FUND | | | | |
|
| PERFORMANCE DATA (Unaudited) |
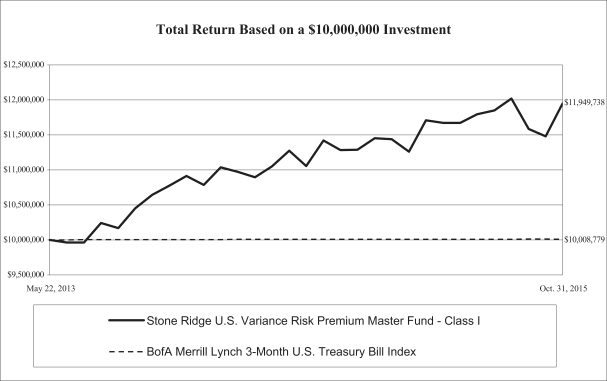
This chart assumes an initial gross investment of $10,000,000 made on May 22, 2013 (commencement of operations). Returns shown include the reinvestment of all dividends. Returns shown do not reflect the deduction of taxes that a shareholder would pay on fund distributions or the redemption of fund shares. In the absence of fee waivers and reimbursements, total return would be reduced. Past performance is not predictive of future performance. Investment return and principal value will fluctuate, so that your shares, when redeemed, may be worth more or less than the original cost.
The Bank of America (BofA) Merrill Lynch 3-Month U.S. Treasury Bill Index is an index of short-term U.S. Government securities with a remaining term to final maturity of less than three months. Index figures do not reflect any deduction of fees, taxes or expenses, and are not available for investment.
| | | | | | | | |
| AVERAGE ANNUAL TOTAL RETURNS (FOR PERIODS ENDED OCTOBER 31, 2015) | | | | | | |
| | | 1-year
period
ended
10/31/2015 | | | Since
Inception
(05/22/13) | |
Stone Ridge U.S. Variance Risk Premium Master Fund — Class I | | | 5.81% | | | | 7.52% | |
Stone Ridge U.S. Variance Risk Premium Master Fund — Class M | | | 5.57% | | | | 7.33% | |
BofA Merrill Lynch 3-Month U.S. Treasury Bill Index | | | 0.02% | | | | 0.04% | |
| | | | | | | | | | | | | | | | |
| | Stone Ridge Funds | | | | | | Annual Report | | | | | | October 31, 2015 | | |
| | | | | | | | | | |
11
| | | | |
| STONE RIDGE INTERNATIONAL DEVELOPED MARKETS VARIANCE RISK PREMIUM FUND | | | | |
|
| PERFORMANCE DATA (Unaudited) |
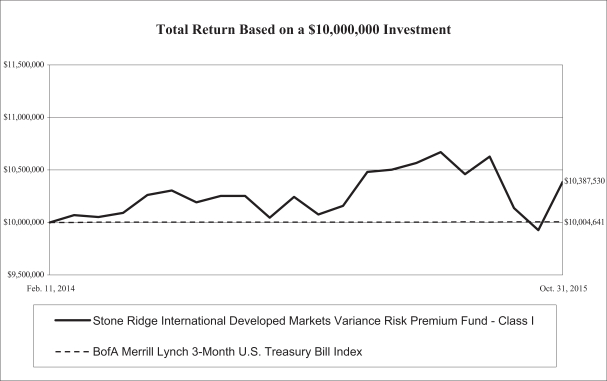
This chart assumes an initial gross investment of $10,000,000 made on February 11, 2014 (commencement of operations). Returns shown include the reinvestment of all dividends. Returns shown do not reflect the deduction of taxes that a shareholder would pay on fund distributions or the redemption of fund shares. In the absence of fee waivers and reimbursements, total return would be reduced. Past performance is not predictive of future performance. Investment return and principal value will fluctuate, so that your shares, when redeemed, may be worth more or less than the original cost.
The Bank of America (BofA) Merrill Lynch 3-Month U.S. Treasury Bill Index is an index of short-term U.S. Government securities with a remaining term to final maturity of less than three months. Index figures do not reflect any deduction of fees, taxes or expenses, and are not available for investment.
| | | | | | | | |
| AVERAGE ANNUAL TOTAL RETURNS (FOR PERIODS ENDED OCTOBER 31, 2015) | | | | | | |
| | | 1-year
period
ended
10/31/2015 | | | Since
Inception
(02/11/14) | |
Stone Ridge International Developed Markets Variance Risk Premium
Fund — Class I | | | 3.40% | | | | 2.24% | |
Stone Ridge International Developed Markets Variance Risk Premium
Fund — Class M | | | 3.30% | | | | 2.12% | |
BofA Merrill Lynch 3-Month U.S. Treasury Bill Index | | | 0.02% | | | | 0.03% | |
| | | | | | | | | | | | | | | | |
| | Stone Ridge Funds | | | | | | Annual Report | | | | | | October 31, 2015 | | |
| | | | | | | | | | |
12
| | | | |
| STONE RIDGE EMERGING MARKETS VARIANCE RISK PREMIUM FUND | | | | |
|
| PERFORMANCE DATA (Unaudited) |
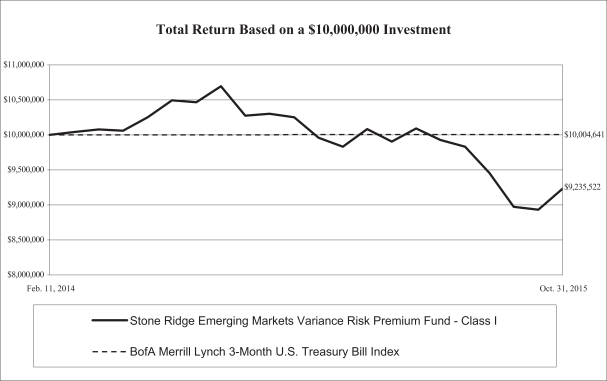
This chart assumes an initial gross investment of $10,000,000 made on February 11, 2014 (commencement of operations). Returns shown include the reinvestment of all dividends. Returns shown do not reflect the deduction of taxes that a shareholder would pay on fund distributions or the redemption of fund shares. In the absence of fee waivers and reimbursements, total return would be reduced. Past performance is not predictive of future performance. Investment return and principal value will fluctuate, so that your shares, when redeemed, may be worth more or less than the original cost.
The Bank of America (BofA) Merrill Lynch 3-Month U.S. Treasury Bill Index is an index of short-term U.S. Government securities with a remaining term to final maturity of less than three months. Index figures do not reflect any deduction of fees, taxes or expenses, and are not available for investment.
| | | | | | | | |
| AVERAGE ANNUAL TOTAL RETURNS (FOR PERIODS ENDED OCTOBER 31, 2015) | | | | | | |
| | | 1-year
period
ended
10/31/2015 | | | Since
Inception
(02/11/14) | |
Stone Ridge Emerging Markets Variance Risk Premium Fund — Class I | | | (10.37%) | | | | (4.52%) | |
Stone Ridge Emerging Markets Variance Risk Premium Fund — Class M | | | (10.48%) | | | | (4.64%) | |
BofA Merrill Lynch 3-Month U.S. Treasury Bill Index | | | 0.02% | | | | 0.03% | |
| | | | | | | | | | | | | | | | |
| | Stone Ridge Funds | | | | | | Annual Report | | | | | | October 31, 2015 | | |
| | | | | | | | | | |
13
| | | | |
| STONE RIDGE INTERNATIONAL VARIANCE RISK PREMIUM MASTER FUND | | | | |
|
| PERFORMANCE DATA (Unaudited) |
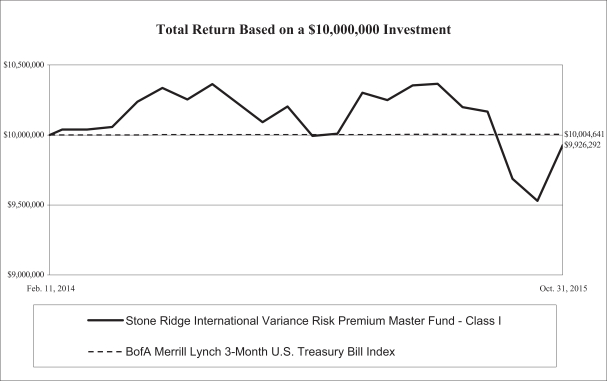
This chart assumes an initial gross investment of $10,000,000 made on February 11, 2014 (commencement of operations). Returns shown include the reinvestment of all dividends. Returns shown do not reflect the deduction of taxes that a shareholder would pay on fund distributions or the redemption of fund shares. In the absence of fee waivers and reimbursements, total return would be reduced. Past performance is not predictive of future performance. Investment return and principal value will fluctuate, so that your shares, when redeemed, may be worth more or less than the original cost.
The Bank of America (BofA) Merrill Lynch 3-Month U.S. Treasury Bill Index is an index of short-term U.S. Government securities with a remaining term to final maturity of less than three months. Index figures do not reflect any deduction of fees, taxes or expenses, and are not available for investment.
| | | | | | | | |
| AVERAGE ANNUAL TOTAL RETURNS (FOR PERIODS ENDED OCTOBER 31, 2015) | | | | | | |
| | | 1-year
period
ended
10/31/2015 | | | Since
Inception
(02/11/14) | |
Stone Ridge International Variance Risk Premium Master Fund — Class I | | | (1.63%) | | | | (0.42%) | |
Stone Ridge International Variance Risk Premium Master Fund — Class M | | | (1.77%) | | | | (0.56%) | |
BofA Merrill Lynch 3-Month U.S. Treasury Bill Index | | | 0.02% | | | | 0.03% | |
| | | | | | | | | | | | | | | | |
| | Stone Ridge Funds | | | | | | Annual Report | | | | | | October 31, 2015 | | |
| | | | | | | | | | |
14
| | | | |
| STONE RIDGE GLOBAL EQUITY VARIANCE RISK PREMIUM MASTER FUND | | | | |
|
| PERFORMANCE DATA (Unaudited) |
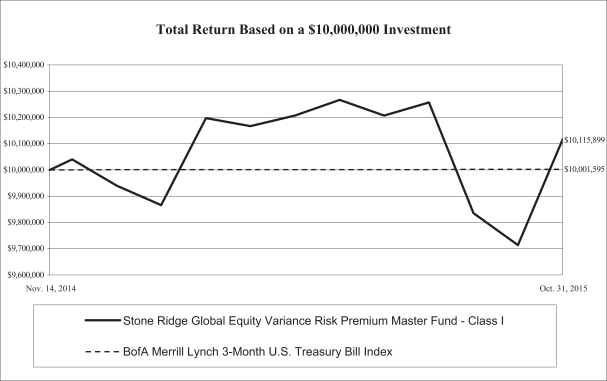
This chart assumes an initial gross investment of $10,000,000 made on November 14, 2014 (commencement of operations). Returns shown include the reinvestment of all dividends. Returns shown do not reflect the deduction of taxes that a shareholder would pay on fund distributions or the redemption of fund shares. In the absence of fee waivers and reimbursements, total return would be reduced. Past performance is not predictive of future performance. Investment return and principal value will fluctuate, so that your shares, when redeemed, may be worth more or less than the original cost.
The Bank of America (BofA) Merrill Lynch 3-Month U.S. Treasury Bill Index is an index of short-term U.S. Government securities with a remaining term to final maturity of less than three months. Index figures do not reflect any deduction of fees, taxes or expenses, and are not available for investment.
| | | | |
| TOTAL RETURNS (FOR PERIOD ENDED OCTOBER 31, 2015) | | | |
| | | Since
Inception
(11/14/14) | |
Stone Ridge Global Equity Variance Risk Premium Master Fund — Class I | | | 1.17% | |
Stone Ridge Global Equity Variance Risk Premium Master Fund — Class M | | | 1.05% | |
BofA Merrill Lynch 3-Month U.S. Treasury Bill Index | | | 0.02% | |
| | | | | | | | | | | | | | | | |
| | Stone Ridge Funds | | | | | | Annual Report | | | | | | October 31, 2015 | | |
| | | | | | | | | | |
15
| | |
| Management’s Discussion and Analysis | | |
Stone Ridge Reinsurance Risk Premium Fund is designed to capture the reinsurance risk premium through investing in a broadly diversified set of reinsurance-linked securities, primarily focused on catastrophe bonds. For the twelve months ending 10/31/2015, the Fund returned 4.22%. Given the diversification of the Fund’s risk exposures, there were a number of unexpected natural and man-made catastrophes around the world that negatively impacted certain of the Fund’s risk exposures, and therefore negatively impacted Fund performance, which we expect to be true every year.
Stone Ridge High Yield Reinsurance Risk Premium Fund is designed to capture the reinsurance risk premium through investing in a broadly diversified set of reinsurance-linked securities, primarily focused on higher yielding catastrophe bonds. For the twelve months ending 10/31/2015, the Fund returned 5.06%. Given the diversification of the Fund’s risk exposures, there were a number of unexpected natural and man-made catastrophes around the world that negatively impacted certain of the Fund’s risk exposures, and therefore negatively impacted Fund performance, which we expect to be true every year.
Stone Ridge U.S. Large Cap Variance Risk Premium Fund is designed to capture the returns of the variance risk premium in U.S. large company stocks. For the 12 months ended October 31, 2015, total returns were 6.33%. Given the diversification of the Fund’s risk exposures, there were a number of unexpected volatility spikes throughout the year that negatively impacted certain of the Fund’s risk exposures, and therefore negatively impacted Fund performance, which we expect to be true every year.
Stone Ridge U.S. Small Cap Variance Risk Premium Fund is designed to capture the returns of the variance risk premium in U.S. small company stocks. For the 12 months ended October 31, 2015, total returns were 5.23%. Given the diversification of the Fund’s risk exposures, there were a number of unexpected volatility spikes throughout the year that negatively impacted certain of the Fund’s risk exposures, and therefore negatively impacted Fund performance, which we expect to be true every year.
Stone Ridge U.S. Variance Risk Premium Master Fund is designed to capture the returns of the variance risk premium in U.S. stocks by purchasing shares of the Stone Ridge U.S. Small Cap Variance Risk Premium Fund and the Stone Ridge U.S. Large Cap Variance Risk Premium Fund. For the 12 months ended October 31, 2015, total returns were 5.81%. Given the diversification of the Fund’s risk exposures, there were a number of unexpected volatility spikes throughout the year that negatively impacted certain of the Fund’s risk exposures, and therefore negatively impacted Fund performance, which we expect to be true every year.
Stone Ridge International Developed Markets Variance Risk Premium Fund is designed to capture the returns of the variance risk premium in international developed market company stocks. For the 12 months ended October 31, 2015, total returns were 3.40%. Given the diversification of the Fund’s risk exposures, there were a number of unexpected volatility spikes throughout the year that negatively impacted certain of the Fund’s risk exposures, and therefore negatively impacted Fund performance, which we expect to be true every year.
Stone Ridge International Emerging Markets Variance Risk Premium Fund is designed to capture the returns of the variance risk premium in emerging market company stocks. For the 12 months ended October 31, 2015, total returns were -10.37%. Given the diversification of the Fund’s risk exposures, there were a number of unexpected volatility spikes throughout the year that negatively impacted certain of the Fund’s risk exposures, and therefore negatively impacted Fund performance, which we expect to be true every year.
Stone Ridge International Variance Risk Premium Master Fund is designed to capture the returns of the variance risk premium in international developed market and emerging market company stocks by purchasing shares of the Stone Ridge International Developed Markets Variance Risk Premium Fund and the Stone Ridge Emerging Markets Variance Risk Premium Fund. For the 12 months ended October 31, 2015, total returns were -1.63%. Given the diversification of the Fund’s risk exposures, there were a number of unexpected volatility spikes throughout the year that negatively impacted certain of the Fund’s risk exposures, and therefore negatively impacted Fund performance, which we expect to be true every year.
| | | | | | | | | | | | | | | | |
| | Stone Ridge Funds | | | | | | Annual Report | | | | | | October 31, 2015 | | |
| | | | | | | | | | |
16
| | |
| Management’s Discussion and Analysis | | |
Stone Ridge Global Equity Variance Risk Premium Master Fund is designed to capture the returns of the variance risk premium in U.S., international developed market and emerging market company stock by purchasing shares of the Stone Ridge U.S. Small Cap Variance Risk Premium Fund, the Stone Ridge U.S. Large Cap Variance Risk Premium Fund, the Stone Ridge International Developed Markets Variance Risk Premium Fund and the Stone Ridge Emerging Markets Variance Risk Premium Fund. For the period ended October 31, 2015, total returns were 1.17%. Given the diversification of the Fund’s risk exposures, there were a number of unexpected volatility spikes throughout the year that negatively impacted certain of the Fund’s risk exposures, and therefore negatively impacted Fund performance, which we expect to be true every year.
| | | | | | | | | | | | | | | | |
| | Stone Ridge Funds | | | | | | Annual Report | | | | | | October 31, 2015 | | |
| | | | | | | | | | |
17
| | | | |
| ALLOCATION OF PORTFOLIO HOLDINGS AT OCTOBER 31, 2015 (Unaudited) | | | | |
| | | | | | | | |
| STONE RIDGE REINSURANCE RISK PREMIUM FUND PORTFOLIO ALLOCATION BY YEAR OF SCHEDULED MATURITY | |
| | |
| 2015 | | | $18,727,305 | | | | 1.8% | |
| | |
| 2016 | | | 172,339,230 | | | | 16.8% | |
| | |
| 2017 | | | 311,112,218 | | | | 30.4% | |
| | |
| 2018 | | | 296,544,390 | | | | 28.9% | |
| | |
| 2019 | | | 70,042,360 | | | | 6.8% | |
| | |
| 2020 | | | 47,263,543 | | | | 4.6% | |
| | |
| 2023 | | | 7,623,589 | | | | 0.7% | |
| | |
| 2034 | | | 11,984,323 | | | | 1.2% | |
| | |
| Not Applicable | | | 82,072,719 | | | | 8.0% | |
| | |
| Other(1) | | | 6,832,737 | | | | 0.8% | |
| | | $1,024,542,414 | | | | | |
| | | | | | | | |
| STONE RIDGE U.S. LARGE CAP VARIANCE RISK PREMIUM FUND PORTFOLIO ALLOCATION BY SECTOR | |
| | |
| Consumer Discretionary | | | $11,994,869 | | | | 3.2% | |
| | |
| Information Technology | | | 10,112,271 | | | | 2.7% | |
| | |
| Health Care | | | 7,722,825 | | | | 2.0% | |
| | |
| Industrials | | | 4,659,428 | | | | 1.2% | |
| | |
| Financials | | | 3,646,815 | | | | 1.0% | |
| | |
| Consumer Staples | | | 3,325,720 | | | | 0.9% | |
| | |
| Energy | | | 3,197,990 | | | | 0.8% | |
| | |
| Materials | | | 3,188,651 | | | | 0.8% | |
| | |
| Utilities | | | 589,568 | | | | 0.2% | |
| | |
| Telecommunication Services | | | 455,976 | | | | 0.1% | |
| | |
| Other(1) | | | 329,855,956 | | | | 87.1% | |
| | | $378,750,069 | | | | | |
| | | | | | | | |
| STONE RIDGE U.S. VARIANCE RISK PREMIUM MASTER FUND PORTFOLIO ALLOCATION BY HOLDINGS | |
| | |
| Stone Ridge U.S. Large Cap Variance Risk Premium Fund - Class I | | | $132,115,117 | | | | 66.5% | |
| | |
| Stone Ridge U.S. Small Cap Variance Risk Premium Fund - Class I | | | 66,268,075 | | | | 33.4% | |
| | |
| Other(1) | | | 210,393 | | | | 0.1% | |
| | | $198,593,585 | | | | | |
| | | | | | | | |
| STONE RIDGE HIGH YIELD REINSURANCE RISK PREMIUM FUND PORTFOLIO ALLOCATION BY YEAR OF SCHEDULED MATURITY | |
| | |
| 2015 | | | $11,622,179 | | | | 2.3% | |
| | |
| 2016 | | | 73,537,470 | | | | 14.8% | |
| | |
| 2017 | | | 139,166,055 | | | | 28.1% | |
| | |
| 2018 | | | 156,017,592 | | | | 31.5% | |
| | |
| 2019 | | | 37,988,392 | | | | 7.7% | |
| | |
| 2020 | | | 11,655,760 | | | | 2.4% | |
| | |
| 2023 | | | 3,201,165 | | | | 0.6% | |
| | |
| 2034 | | | 10,828,753 | | | | 2.2% | |
| | |
| Not Applicable | | | 48,114,789 | | | | 9.7% | |
| | |
| Other(1) | | | 3,529,563 | | | | 0.7% | |
| | | $495,661,718 | | | | | |
| | | | | | | | |
| STONE RIDGE U.S. SMALL CAP VARIANCE RISK PREMIUM FUND PORTFOLIO ALLOCATION BY SECTOR | |
| | |
| Health Care | | | $1,341,227 | | | | 1.0% | |
| | |
| Information Technology | | | 680,365 | | | | 0.5% | |
| | |
| Consumer Discretionary | | | 619,603 | | | | 0.5% | |
| | |
| Industrials | | | 293,014 | | | | 0.2% | |
| | |
| Telecommunication Services | | | 129,052 | | | | 0.1% | |
| | |
| Materials | | | 109,230 | | | | 0.1% | |
| | |
| Energy | | | 41,411 | | | | 0.0% | |
| | |
| Financials | | | 48,553 | | | | 0.1% | |
| | |
| Consumer Staples | | | 24,808 | | | | 0.0% | |
| | |
| Other(1) | | | 127,005,824 | | | | 97.5% | |
| | | $130,293,087 | | | | | |
| | | | | | | | |
| STONE RIDGE INTERNATIONAL DEVELOPED MARKETS VARIANCE RISK PREMIUM FUND PORTFOLIO ALLOCATION BY SECTOR | |
| | |
| Health Care | | | $170,958 | | | | 0.2% | |
| | |
| Information Technology | | | 140,101 | | | | 0.1% | |
| | |
| Consumer Discretionary | | | 121,559 | | | | 0.1% | |
| | |
| Telecommunication Services | | | 116,115 | | | | 0.1% | |
| | |
| Financials | | | 113,644 | | | | 0.1% | |
| | |
| Consumer Staples | | | 82,256 | | | | 0.1% | |
| | |
| Energy | | | 42,840 | | | | 0.1% | |
| | |
| Utilities | | | 35,800 | | | | 0.0% | |
| | |
| Industrials | | | 31,668 | | | | 0.0% | |
| | |
| Materials | | | 31,616 | | | | 0.0% | |
| | |
| Other(1) | | | 110,644,461 | | | | 99.2% | |
| | | $111,531,018 | | | | | |
| | | | |
| | The accompanying footnotes are an integral part of these Schedules of Investments. | | (Continued) |
| | | | | | | | | | | | | | | | |
| | Stone Ridge Funds | | | | | | Annual Report | | | | | | October 31, 2015 | | |
| | | | | | | | | | |
18
| | | | |
| ALLOCATION OF PORTFOLIO HOLDINGS AT OCTOBER 31, 2015 (Unaudited) | | | | |
| | | | | | | | |
| STONE RIDGE EMERGING MARKETS VARIANCE RISK PREMIUM FUND PORTFOLIO ALLOCATION BY SECTOR | |
| | |
| Information Technology | | | $468,157 | | | | 0.9% | |
| | |
| Consumer Discretionary | | | 148,075 | | | | 0.3% | |
| | |
| Financials | | | 111,345 | | | | 0.2% | |
| | |
| Materials | | | 41,411 | | | | 0.1% | |
| | |
| Telecommunication Services | | | 16,029 | | | | 0.0% | |
| | |
| Energy | | | 15,616 | | | | 0.0% | |
| | |
| Other(1) | | | 49,615,878 | | | | 98.5% | |
| | | $50,416,511 | | | | | |
| | | | | | | | |
| STONE RIDGE GLOBAL EQUITY VARIANCE RISK PREMIUM MASTER FUND PORTFOLIO ALLOCATION BY HOLDINGS | |
| | |
| Stone Ridge U.S. Large Cap Variance Risk Premium Fund - Class I | | | $16,074,468 | | | | 33.2% | |
| | |
| Stone Ridge International Developed Markets Variance Risk Premium Fund - Class I | | | 16,001,599 | | | | 33.1% | |
| | |
| Stone Ridge U.S. Small Cap Variance Risk Premium Fund - Class I | | | 8,081,490 | | | | 16.7% | |
| | |
| Stone Ridge Emerging Markets Variance Risk Premium Fund - Class I | | | 7,896,466 | | | | 16.3% | |
| | |
| Other(1) | | | 308,941 | | | | 0.7% | |
| | | $48,362,964 | | | | | |
| | | | | | | | |
| STONE RIDGE INTERNATIONAL VARIANCE RISK PREMIUM MASTER FUND PORTFOLIO ALLOCATION BY HOLDINGS | |
| | |
| Stone Ridge International Developed Markets Variance Risk Premium Fund - Class I | | | $19,504,736 | | | | 66.3% | |
| | |
| Stone Ridge Emerging Markets Variance Risk Premium Fund - Class I | | | 9,663,390 | | | | 32.8% | |
| | |
| Other(1) | | | 262,008 | | | | 0.9% | |
| | | $29,430,134 | | | | | |
| (1) | Cash, cash equivalents, short term investments and other assets less liabilities. |
The Global Industry Classification Standard (GICS®) was developed by and/or is the exclusive property of MSCI, Inc. and Standard & Poor’s Financial Services LLC (“S&P”). GICS is a service mark of MSCI and S&P and has been licensed for use by U.S. Bancorp Fund Services, LLC.
| | | | |
| | The accompanying footnotes are an integral part of these Schedules of Investments. | | |
| | | | | | | | | | | | | | | | |
| | Stone Ridge Funds | | | | | | Annual Report | | | | | | October 31, 2015 | | |
| | | | | | | | | | |
19
| | |
| Schedule of Investments | | as of October 31, 2015 |
| | | | |
| STONE RIDGE REINSURANCE RISK PREMIUM FUND | | | | |
| | | | | | | | |
| | | PRINCIPAL
AMOUNT | | | FAIR
VALUE | |
| EVENT-LINKED BONDS - 81.3% | | | | | | |
| | | | | | | | |
| China - 0.1% | | | | | | |
| | | | | | | | |
| Earthquake - 0.1% | | | | | | |
Panda Re 2015-1
4.096%, 06/30/2018 (a)(b)(c) | | $ | 1,397,000 | | | $ | 1,393,654 | |
| | | | | | | | |
| | | | | | | | |
| Europe - 0.8% | | | | | | |
| | | | | | | | |
| Windstorm - 0.8% | | | | | | |
Atlas Re VII B
3.650%, 01/07/2016 (a)(b)(c) | | EUR | 2,250,000 | | | | 2,459,121 | |
Calypso Capital II Class B
3.710%, 01/08/2018 (a)(b)(c) | | EUR | 2,750,000 | | | | 3,067,433 | |
Green Fields II 2013-1 A
2.750%, 01/09/2017 (a)(b)(c) | | EUR | 2,250,000 | | | | 2,482,378 | |
| | | | | | | | |
| | | | | | | 8,008,932 | |
| | | | | | | | |
| Global - 23.5% | | | | | | |
| | | | | | | | |
| Earthquake - 1.1% | | | | | | |
Acorn Re 2015-1
3.663%, 07/17/2018 (a)(b)(c) | | $ | 6,595,000 | | | | 6,647,100 | |
Market Re 2014-4 Class A
4.000%, 10/01/2016 (a)(b)(c) | | | 2,121,000 | | | | 2,119,515 | |
Market Re 2014-4 Class B
4.000%, 12/01/2016 (a)(b)(c) | | | 771,000 | | | | 770,460 | |
Tramline Re II 2013-1 A
3.296%, 07/07/2017 (a)(b)(c) | | | 1,750,000 | | | | 1,730,838 | |
| | | | | | | | |
| | | | | | | 11,267,913 | |
| | | | | | | | |
| Mortality/Longevity - 2.5% | |
Benu Capital Class B
3.350%, 01/08/2020 (a)(b)(c) | | EUR | 12,000,000 | | | | 13,187,227 | |
Chesterfield Re 2014-1
4.500%, 12/15/2034 (c) | | $ | 11,945,054 | | | | 11,984,323 | |
Vitality Re VI Class B
2.146%, 01/08/2018 (a)(b)(c) | | | 1,000,000 | | | | 1,004,450 | |
| | | | | | | | |
| | | | | | | 26,176,000 | |
| | | | | | | | |
| Multiperil - 19.5% | |
Atlas IX 2015-1
7.161%, 01/07/2019 (a)(b)(c) | | | 4,910,000 | | | | 4,931,359 | |
Blue Danube II 2013-1 A
4.368%, 05/23/2016 (a)(b)(c) | | | 10,042,000 | | | | 10,039,992 | |
Galileo Re 2013-1
7.446%, 01/09/2017 (a)(b)(c) | | | 5,500,000 | | | | 5,570,950 | |
Galileo Re 2015-1 Class A
13.546%, 01/08/2018 (a)(b)(c) | | | 8,929,000 | | | | 9,153,564 | |
Kilimanjaro Re 2014-1 Class B
4.546%, 04/30/2018 (a)(b)(c) | | | 10,802,000 | | | | 10,743,669 | |
Kilimanjaro Re 2014-2 Class C
3.796%, 11/25/2019 (a)(b)(c) | | | 28,158,000 | | | | 27,887,683 | |
Loma Re 2013-1 A
8.316%, 01/08/2018 (a)(b)(c) | | | 2,271,000 | | | | 2,360,705 | |
Loma Re 2013-1 B
10.616%, 01/08/2018 (a)(b)(c) | | | 6,814,000 | | | | 7,117,223 | |
Loma Re 2013-1 C
16.546%, 01/08/2018 (a)(b)(c) | | | 11,781,000 | | | | 12,479,024 | |
Mythen Re 2012-2 A
8.646%, 01/05/2017 (a)(b)(c) | | | 578,000 | | | | 596,727 | |
| | | | | | | | |
| | | PRINCIPAL
AMOUNT | | | FAIR
VALUE | |
| Multiperil - 19.5% (continued) | |
RW003 (Horseshoe Segregated Account)
13.794%, 07/22/2016 (a)(b)(d)(e)(f) | | $ | 1,839,810 | | | $ | 1,705,603 | |
Tradewynd Re 2013-1 1
8.906%, 07/09/2018 (a)(b)(c) | | | 10,357,000 | | | | 11,398,914 | |
Tradewynd Re 2013-2 3-A
6.036%, 01/09/2017 (a)(b)(c) | | | 12,481,000 | | | | 12,650,742 | |
Tradewynd Re 2013-2 3-B
6.586%, 01/09/2017 (a)(b)(c) | | | 10,698,000 | | | | 10,847,772 | |
Tradewynd Re 2014-1 Class 3-A
5.000%, 01/08/2018 (a)(b)(c) | | | 10,554,000 | | | | 10,555,583 | |
Tradewynd Re 2014-1 Class 3-B
7.000%, 01/08/2018 (a)(b)(c) | | | 28,143,000 | | | | 28,399,101 | |
Tramline Re II 2014-1 Class A
9.796%, 01/04/2019 (a)(b)(c) | | | 18,115,000 | | | | 18,600,482 | |
VenTerra Re 2013-1 A
3.796%, 01/09/2017 (a)(b)(c) | | | 14,596,000 | | | | 14,600,379 | |
| | | | | | | | |
| | | | | | | 199,639,472 | |
| | | | | | | | |
| Windstorm - 0.4% | |
Queen Street VIII
6.546%, 06/08/2016 (a)(b)(c) | | | 3,250,000 | | | | 3,258,938 | |
Queen Street X Re
5.796%, 06/08/2018 (a)(b)(c) | | | 901,000 | | | | 890,413 | |
| | | | | | | | |
| | | | | | | 4,149,351 | |
| | | | | | | | |
| | | | | | | 241,232,736 | |
| | | | | | | | |
| Japan - 3.1% | | | | | | |
| | | | | | | | |
| Earthquake - 3.1% | | | | | | |
Kizuna Re II 2015-1
2.000%, 04/05/2019 (a)(b)(c) | | JPY | 500,000,000 | | | | 4,142,496 | |
Kizuna Re II Class A
2.296%, 04/06/2018 (a)(b)(c) | | $ | 6,750,000 | | | | 6,762,825 | |
Kizuna Re II Class B
2.556%, 04/06/2018 (a)(b)(c) | | | 4,500,000 | | | | 4,512,150 | |
Nakama Re
2.556%, 04/13/2018 (a)(b)(c) | | | 4,250,000 | | | | 4,264,875 | |
Nakama Re 2013-1
2.806%, 09/29/2016 (a)(b)(c) | | | 6,500,000 | | | | 6,518,200 | |
Nakama Re 2014-2 Class 2
2.931%, 01/16/2020 (a)(b)(c) | | | 5,250,000 | | | | 5,264,963 | |
| | | | | | | | |
| | | | | | | 31,465,509 | |
| | | | | | | | |
| Mexico - 0.8% | | | | | | |
| | | | | | | | |
| Earthquake - 0.6% | | | | | | |
MultiCat Mexico 2012-1 A
8.046%, 12/04/2015 (a)(b)(c) | | | 6,199,000 | | | | 6,208,918 | |
| | | | | | | | |
| | | | | | | | |
| Windstorm - 0.2% | | | | | | |
MultiCat Mexico 2012-1 B
7.796%, 12/04/2015 (a)(b)(c) | | | 1,875,000 | | | | 1,878,563 | |
MultiCat Mexico 2012-1 C
7.546%, 12/04/2015 (a)(b)(c) | | | 541,000 | | | | 21,640 | |
| | | | | | | | |
| | | | | | | 1,900,203 | |
| | | | | | | | |
| | | | | | | 8,109,121 | |
| | | | | | | | |
| | | | |
| | The accompanying footnotes are an integral part of these Schedules of Investments. | | (Continued) |
| | | | | | | | | | | | | | | | |
| | Stone Ridge Funds | | | | | | Annual Report | | | | | | October 31, 2015 | | |
| | | | | | | | | | |
20
| | |
| Schedule of Investments | | as of October 31, 2015 |
| | | | |
| STONE RIDGE REINSURANCE RISK PREMIUM FUND | | | | |
| | | | | | | | |
| | | PRINCIPAL
AMOUNT | | | FAIR
VALUE | |
| Turkey - 2.1% | | | | | | |
| | | | | | | | |
| Earthquake - 2.1% | | | | | | |
Bosphorus 1 Re 2013-1 A
2.556%, 05/03/2016 (a)(b)(c) | | $ | 18,000,000 | | | $ | 17,956,800 | |
Bosphorus Re 2015-1
3.579%, 08/17/2018 (a)(b)(c) | | | 3,250,000 | | | | 3,237,325 | |
| | | | | | | | |
| | | | | | | 21,194,125 | |
| | | | | | | | |
| United States - 50.9% | | | | | | |
| | | | | | | | |
| Earthquake - 6.5% | | | | | | |
Golden State Re II
2.246%, 01/08/2019 (a)(b)(c) | | | 4,200,000 | | | | 4,178,790 | |
Lakeside Re III
8.046%, 01/08/2016 (a)(b)(c) | | | 10,975,000 | | | | 11,034,265 | |
Merna Re 2015-1
2.046%, 04/09/2018 (a)(b)(c) | | | 1,478,000 | | | | 1,474,083 | |
Merna Re IV
2.556%, 04/08/2016 (a)(b)(c) | | | 6,250,000 | | | | 6,246,250 | |
Ursa Re 2014-1 Class A
3.500%, 12/07/2017 (a)(b)(c) | | | 5,631,000 | | | | 5,582,573 | |
Ursa Re 2014-1 Class B
5.000%, 12/07/2017 (a)(b)(c) | | | 20,237,000 | | | | 20,186,408 | |
Ursa Re 2015-1
5.000%, 09/21/2018 (a)(b)(c) | | | 17,550,000 | | | | 17,496,473 | |
| | | | | | | | |
| | | | | | | 66,198,842 | |
| | | | | | | | |
| Multiperil - 25.9% | | | | | | |
Atlas Re VII A
8.322%, 01/07/2016 (a)(b)(c) | | | 1,772,000 | | | | 1,785,999 | |
Caelus Re 2013-1 A
5.296%, 03/07/2016 (a)(b)(c) | | | 6,021,000 | | | | 6,069,469 | |
Caelus Re 2013-2 A
6.896%, 04/07/2017 (a)(b)(c) | | | 20,494,000 | | | | 21,187,722 | |
East Lane Re VI
2.796%, 03/14/2018 (a)(b)(c) | | | 14,467,000 | | | | 14,346,924 | |
East Lane VI 2015-1
3.806%, 03/13/2023 (a)(b)(c) | | | 7,597,000 | | | | 7,623,589 | |
Ibis Re II 2013-1 A
4.056%, 06/28/2016 (a)(b)(c) | | | 3,250,000 | | | | 3,282,500 | |
Ibis Re II 2013-1 B
4.546%, 06/28/2016 (a)(b)(c) | | | 4,500,000 | | | | 4,556,700 | |
Ibis Re II 2013-1 C
8.046%, 06/28/2016 (a)(b)(c) | | | 3,250,000 | | | | 3,359,850 | |
Long Point Re III 2015-1
3.750%, 05/23/2018 (a)(b)(c) | | | 10,569,000 | | | | 10,742,332 | |
Mona Lisa Re 2013-2 A
7.346%, 07/07/2017 (a)(b)(c) | | | 16,164,000 | | | | 16,976,241 | |
Northshore Re 2013-1 A
7.296%, 07/05/2016 (a)(b)(c) | | | 14,621,000 | | | | 14,971,904 | |
PennUnion Re 2015-1
4.556%, 12/07/2018 (a)(b)(c) | | | 1,825,000 | | | | 1,827,099 | |
Residential Re 2015-1 Class 10
11.046%, 06/06/2019 (a)(b)(c) | | | 4,070,000 | | | | 4,170,529 | |
Residential Re 2015-1 Class 11
6.046%, 06/06/2019 (a)(b)(c) | | | 4,428,000 | | | | 4,495,084 | |
Residential Re 2011-2 1
8.946%, 12/06/2015 (a)(b)(c) | | | 2,358,000 | | | | 2,365,663 | |
| | | | | | | | |
| | | PRINCIPAL
AMOUNT | | | FAIR
VALUE | |
| Multiperil - 25.9% (continued) | | | | | | |
Residential Re 2012-1 3
10.046%, 06/06/2016 (a)(b)(c) | | $ | 2,332,000 | | | $ | 2,429,711 | |
Residential Re 2012-2 2
5.796%, 12/06/2016 (a)(b)(c) | | | 1,149,000 | | | | 1,177,782 | |
Residential Re 2012-2 4
19.046%, 12/06/2016 (a)(b)(c) | | | 2,570,000 | | | | 2,788,835 | |
Residential Re 2013-1 11
8.056%, 06/06/2017 (a)(b)(c) | | | 23,100,000 | | | | 24,216,885 | |
Residential Re 2013-1 3
9.296%, 06/06/2017 (a)(b)(c) | | | 12,600,000 | | | | 13,352,850 | |
Residential Re 2013-2 1
20.046%, 12/06/2017 (a)(b)(c) | | | 4,580,000 | | | | 4,808,542 | |
Residential Re 2013-2 4
5.296%, 12/06/2017 (a)(b)(c) | | | 3,600,000 | | | | 3,604,140 | |
Residential Re 2014-1 10
15.046%, 06/06/2018 (a)(b)(c) | | | 9,197,000 | | | | 9,506,479 | |
Residential Re 2014-1 13
3.546%, 06/06/2018 (a)(b)(c) | | | 2,544,000 | | | | 2,574,274 | |
Residential Re 2014-2 Class 4
4.846%, 12/06/2018 (a)(b)(c) | | | 5,653,000 | | | | 5,574,423 | |
Riverfront Re 2014
4.056%, 01/06/2017 (a)(b)(c) | | | 4,512,000 | | | | 4,504,330 | |
Sanders Re 2013-1 A
3.546%, 05/05/2017 (a)(b)(c) | | | 22,000,000 | | | | 22,027,500 | |
Sanders Re 2013-1 B
4.046%, 05/05/2017 (a)(b)(c) | | | 8,110,000 | | | | 8,152,172 | |
Sanders Re 2014-1 B
3.056%, 05/25/2018 (a)(b)(c) | | | 18,750,000 | | | | 18,507,188 | |
Sanders Re 2014-1 C
3.286%, 05/25/2018 (a)(b)(c) | | | 19,000,000 | | | | 18,789,100 | |
Sanders Re 2014-2
3.896%, 06/07/2017 (a)(b)(c) | | | 4,247,000 | | | | 4,297,539 | |
Skyline Re 2014-1 A
14.046%, 01/23/2017 (a)(b)(c) | | | 1,426,000 | | | | 1,490,883 | |
| | | | | | | | |
| | | | | | | 265,564,238 | |
| | | | | | | | |
| Windstorm - 18.5% | | | | | | |
Alamo Re 2015-1 Class A
5.956%, 06/07/2018 (a)(b)(c) | | | 8,540,000 | | | | 8,881,600 | |
Alamo Re 2015-1 Class B
4.646%, 06/07/2018 (a)(b)(c) | | | 4,176,000 | | | | 4,312,346 | |
Alamo Re Ltd.
5.296%, 06/07/2017 (a)(b)(c) | | | 12,108,000 | | | | 12,484,559 | |
Armor Re Ltd.
4.126%, 12/15/2016 (a)(b)(c) | | | 5,450,000 | | | | 5,497,960 | |
Citrus Re 2014-1
4.506%, 04/18/2017 (a)(b)(c) | | | 6,353,000 | | | | 6,368,565 | |
Citrus Re 2014-2
4.336%, 04/24/2017 (a)(b)(c) | | | 1,410,000 | | | | 1,418,460 | |
Citrus Re 2015-1 Class A
4.946%, 04/09/2018 (a)(b)(c) | | | 5,985,000 | | | | 6,025,698 | |
Citrus Re 2015-1 Class B
6.366%, 04/09/2018 (a)(b)(c) | | | 8,977,000 | | | | 9,078,440 | |
Citrus Re 2015-1 Class C
9.526%, 04/09/2018 (a)(b)(c) | | | 2,768,000 | | | | 2,824,190 | |
Compass Re II 2015-1
9.762%, 12/08/2015 (a)(b)(c)(d) | | | 8,284,000 | | | | 8,252,521 | |
| | | | |
| | The accompanying footnotes are an integral part of these Schedules of Investments. | | (Continued) |
| | | | | | | | | | | | | | | | |
| | Stone Ridge Funds | | | | | | Annual Report | | | | | | October 31, 2015 | | |
| | | | | | | | | | |
21
| | |
| Schedule of Investments | | as of October 31, 2015 |
| | | | |
| STONE RIDGE REINSURANCE RISK PREMIUM FUND | | | | |
| | | | | | | | |
| | | PRINCIPAL
AMOUNT | | | FAIR
VALUE | |
| Windstorm - 18.5% (continued) | | | | | | |
Cranberry Re 2015-1
3.856%, 07/06/2018 (a)(b)(c) | | $ | 2,609,000 | | | $ | 2,667,181 | |
Everglades Re 2013-1 A
9.526%, 03/28/2016 (a)(b)(c) | | | 12,600,000 | | | | 12,945,240 | |
Everglades Re 2014
7.496%, 04/28/2017 (a)(b)(c) | | | 28,200,000 | | | | 29,359,020 | |
Everglades Re II 2015-1
5.196%, 05/03/2018 (a)(b)(c) | | | 6,897,000 | | | | 7,046,665 | |
Gator Re 2014
6.726%, 01/09/2017 (a)(b)(c) | | | 13,750,000 | | | | 12,955,250 | |
Kilimanjaro Re 2014-1 Class A
4.796%, 04/30/2018 (a)(b)(c) | | | 9,269,000 | | | | 9,276,878 | |
Long Point Re III 2013-1 A
4.246%, 05/18/2016 (a)(b)(c) | | | 13,639,000 | | | | 13,752,204 | |
Manatee Re 2015-1
5.056%, 12/22/2017 (a)(b)(c) | | | 2,424,000 | | | | 2,442,180 | |
Market Re 2015-2
6.950%, 06/07/2016 (a)(b)(c)(d) | | | 2,709,000 | | | | 2,846,888 | |
Metrocat Re 2013-1 A
4.546%, 08/05/2016 (a)(b)(c) | | | 3,750,000 | | | | 3,811,687 | |
Pelican Re 2013-1 A
6.056%, 05/15/2017 (a)(b)(c) | | | 8,862,000 | | | | 9,170,841 | |
Queen City
3.546%, 01/06/2017 (a)(b)(c) | | | 10,000,000 | | | | 9,971,500 | |
Tar Heel 2013-1 A
8.546%, 05/09/2016 (a)(b)(c) | | | 8,289,000 | | | | 8,534,769 | |
| | | | | | | | |
| | | | | | | 189,924,642 | |
| | | | | | | | |
| | | | | | 521,687,722 | |
| | | | | | | | |
TOTAL EVENT-LINKED BONDS
(Cost $824,195,937) | | | | | | | 833,091,799 | |
| | | | | | | | |
PARTICIPATION NOTES
(QUOTA SHARES) - 10.0% | | | | | | |
| | | | | | | | |
| Global - 7.4% | | | | | | |
| | | | | | | | |
| Multiperil - 7.4% | | | | | | |
Atlas Re X Class A
04/03/2017 (a)(c)(e) | | | 24,789,000 | | | | 28,074,272 | |
Eden Re 2015-1
04/19/2018 (a)(e)(f)(g) (Cost: $4,000,000; Acquisition Date: 12/29/2014) | | | 4,000,000 | | | | 4,427,534 | |
Eden Re II 2015-1
04/19/2018 (a)(e)(f)(g) (Cost: $13,624,875; Acquisition Date: 03/19/2015) | | | 13,500,000 | | | | 14,330,587 | |
Sector Re V LTD Series 4 Class A
03/30/2019 (a)(f) (Cost: $30,766; Acquisition Date: 04/24/2014) | | | 30,766 | | | | 723,490 | |
Sector Re V LTD Series 5 Class B
03/01/2020 (a)(f)(g) (Cost: $17,790,802; Acquisition Date: 04/30/2015) | | | 17,790,802 | | | | 19,317,253 | |
Sector Re V LTD Series 5 Class F
03/01/2020 (a)(f)(g) (Cost: $9,000,000; Acquisition Date: 04/27/2015) | | | 9,000,000 | | | | 9,494,100 | |
| | | | | | | | |
| | | | | | | 76,367,236 | |
| | | | | | | | |
| | | | | | | | |
| | | PRINCIPAL
AMOUNT | | | FAIR
VALUE | |
| United States - 2.6% | |
| | | | | | | | |
| Multiperil - 2.6% | | | | | | |
Sector Re V LTD Series 3 Class F
03/01/2019 (a)(f) (Cost: $178,750; Acquisition Date: 03/12/2013) | | $ | 178,750 | | | $ | 912,447 | |
Sector Re V LTD Series 5 Class G
06/26/2016 (a)(f)(g) (Cost: $24,083,000; Acquisition Date: 06/26/2015) | | | 24,083,000 | | | | 25,265,476 | |
| | | | | | | | |
| | | | | | 26,177,923 | |
| | | | | | | | |
TOTAL PARTICIPATION NOTES (QUOTA SHARES)
(Cost $93,497,193) | | | | | | | 102,545,159 | |
| | | | | | | | |
| | |
PREFERENCE SHARES
(QUOTA SHARES) - 8.0% | | SHARES | | | FAIR
VALUE | |
|
| Global - 8.0% | |
| | | | | | | | |
| Multiperil - 8.0% | | | | | | |
Biscayne (Kane Segregated Account Company) (a)(e)(f) (Cost: $17,415,491; Original Acquisition Date: 04/30/2014) | | | 17,296 | | | | 19,659,384 | |
Hatteras (Kane Segregated Account Company) (a)(e)(f)(g) (Cost: $6,300,000; Acquisition Date: 12/30/2014) | | | 6,300 | | | | 7,166,424 | |
Hilo (Kane Segregated Account Company) (a)(e)(f)(g) (Cost: $2,469,074; Acquisition Date: 06/09/2015) | | | 2,469 | | | | 2,658,186 | |
Hudson Charles 2 (Mt. Logan Re) (a)(f) (Cost: $8,062,500; Acquisition Date: 04/02/2014) | | | 8,063 | | | | 9,287,479 | |
Hudson Charles 3 (Mt. Logan Re) (a)(f) (Cost: $11,904,000; Acquisition Date: 06/19/2014) | | | 11,904 | | | | 13,577,169 | |
Hudson Paul 3 (Mt. Logan Re) (a)(f) (Cost: $8,062,500; Acquisition Date: 04/02/2014) | | | 8,063 | | | | 9,680,203 | |
Kona (Kane Segregated Account Company) (a)(e)(f)(g) (Cost: $2,412,000; Acquisition Date: 07/23/2015) | | | 2,412 | | | | 2,591,475 | |
Lorenz Re Class B (a)(e)(f)(g) (Cost: $49,349; Acquisition Date: 03/25/2013) | | | 493 | | | | 58,507 | |
LRe 2015 (a)(e)(f)(g) (Cost: $5,165,574; Acquisition Date: 03/31/2015) | | | 51,656 | | | | 5,847,694 | |
Minnewaska (Kane Segregated Account Company) (a)(e)(f)(g) (Cost: $3,744,456; Original Acquisition Date: 05/29/2015) | | | 3,216 | | | | 4,128,497 | |
| | | | |
| | The accompanying footnotes are an integral part of these Schedules of Investments. | | (Continued) |
| | | | | | | | | | | | | | | | |
| | Stone Ridge Funds | | | | | | Annual Report | | | | | | October 31, 2015 | | |
| | | | | | | | | | |
22
| | |
| Schedule of Investments | | as of October 31, 2015 |
| | | | |
| STONE RIDGE REINSURANCE RISK PREMIUM FUND | | | | |
| | | | | | | | |
| | | SHARES | | | FAIR
VALUE | |
| Multiperil - 8.0% (continued) | | | | | | |
Rondout (Kane Segregated Account Company) (a)(e)(f) (Cost: $6,891,227; Acquisition Date: 05/29/2015) | | | 6,083 | | | $ | 7,417,701 | |
| | | | | | | | |
TOTAL PREFERENCE SHARES (QUOTA SHARES)
(Cost $72,476,171) | | | | | | | 82,072,719 | |
| | | | | | | | |
TOTAL INVESTMENTS
(Cost $990,169,301) - 99.3% | | | | | | | 1,017,709,677 | |
| | | | | | | | |
OTHER ASSETS IN EXCESS OF
LIABILITIES - 0.7% | | | | | 6,832,737 | |
| | | | | | | | |
| TOTAL NET ASSETS - 100.0% | | | | | $1,024,542,414 | |
| | | | | | | | |
Principal amounts stated in U.S. dollars unless otherwise stated.
Country shown is geographic area of peril risk.
Percentages are stated as a percent of net assets.
| (a) | Foreign issued security. Total foreign securities by country of domicile are $1,005,725,354. Foreign concentration is as follows: Bermuda: 77.3%, Cayman Islands: 18.1%, Ireland: 2.8%. |
| (b) | Variable rate security. The rate shown is as of October 31, 2015. |
| (c) | Security is restricted to resale to institutional investors. The Fund’s Adviser has deemed this security to be liquid based upon procedures approved by the Board of Trustees. The aggregate value of these securities at October 31, 2015 was $859,460,468, which represents 83.9% of net assets. |
| (d) | Zero-coupon bond. The rate shown is the yield to maturity. |
| (e) | Security is fair valued by the Adviser pursuant to procedures approved by the Board of Trustees. The aggregate value of these securities is $98,065,864, which represents 9.6% of net assets. |
| (f) | Security is restricted to resale. The aggregate value of these securities at October 31, 2015 was $158,249,209, which represents 15.4% of net assets. |
| (g) | Non-income producing security. |
Open Futures Contracts
| | | | | | | | | | | | |
| DESCRIPTION | | NUMBER OF
CONTRACTS
SOLD | | | NOTIONAL
VALUE | | | UNREALIZED
APPRECIATION
(DEPRECIATION) | |
| | | |
| FUTURES CONTRACTS SOLD | | | | | | | | | |
Euro Fx, December 2015 Settlement | | | 164 | | | $ | 22,568,450 | | | $ | 257,027 | |
Japanese Yen, December 2015 Settlement | | | 40 | | | | 4,144,000 | | | | 30,507 | |
U.S. Treasury 5-Year Note, December 2015 Settlement | | | 77 | | | | 9,222,555 | | | | (12,799) | |
| | | | | | | | | | | | |
TOTAL FUTURES CONTRACTS SOLD | | | | | | $ | 35,935,005 | | | $ | 274,735 | |
| | | | | | | | | | | | |
| | | | |
| | The accompanying footnotes are an integral part of these Schedules of Investments. | | |
| | | | | | | | | | | | | | | | |
| | Stone Ridge Funds | | | | | | Annual Report | | | | | | October 31, 2015 | | |
| | | | | | | | | | |
23
| | |
| Schedule of Investments | | as of October 31, 2015 |
| | | | |
| STONE RIDGE HIGH YIELD REINSURANCE RISK PREMIUM FUND | | | | |
| | | | | | | | |
| | | PRINCIPAL
AMOUNT | | | FAIR
VALUE | |
| EVENT-LINKED BONDS - 80.6% | | | | |
| | | | | | | | |
| China - 0.1% | | | | |
| | | | | | | | |
| Earthquake - 0.1% | | | | | | |
Panda Re 2015-1
4.096%, 06/30/2018 (a)(b)(c) | | $ | 668,000 | | | $ | 666,400 | |
| | | | | | | | |
| | |
| Global - 20.6% | | | | | | |
| | | | | | | | |
| Earthquake - 0.9% | | | | | | |
Acorn Re 2015-1
3.663%, 07/17/2018 (a)(b)(c) | | | 3,155,000 | | | | 3,179,925 | |
Market Re 2014-4 Class A
4.000%, 10/01/2016 (a)(b)(c) | | | 944,000 | | | | 943,339 | |
Market Re 2014-4 Class B
4.000%, 12/01/2016 (a)(b)(c) | | | 343,000 | | | | 342,760 | |
| | | | | | | | |
| | | | | | | 4,466,024 | |
| | | | | | | | |
| Mortality/Longevity - 2.2% | | | | | | |
Chesterfield Re 2014-1
4.500%, 12/15/2034 (c) | | | 10,793,270 | | | | 10,828,753 | |
| | | | | | | | |
| | |
| Multiperil - 17.4% | | | | | | |
Atlas IX 2015-1
7.161%, 01/07/2019 (a)(b)(c) | | | 2,074,000 | | | | 2,083,022 | |
Blue Danube II 2013-1 A
4.368%, 05/23/2016 (a)(b)(c) | | | 6,958,000 | | | | 6,956,608 | |
Galileo Re 2013-1
7.446%, 01/09/2017 (a)(b)(c) | | | 4,000,000 | | | | 4,051,600 | |
Galileo Re 2015-1 Class A
13.546%, 01/08/2018 (a)(b)(c) | | | 3,793,000 | | | | 3,888,394 | |
Kilimanjaro Re 2014-1 Class B
4.546%, 04/30/2018 (a)(b)(c) | | | 5,944,000 | | | | 5,911,902 | |
Kilimanjaro Re 2014-2 Class C
3.796%, 11/25/2019 (a)(b)(c) | | | 11,842,000 | | | | 11,728,317 | |
Loma Re 2013-1 A
8.316%, 01/08/2018 (a)(b)(c) | | | 1,394,000 | | | | 1,449,063 | |
Loma Re 2013-1 B
10.616%, 01/08/2018 (a)(b)(c) | | | 3,181,000 | | | | 3,322,554 | |
Loma Re 2013-1 C
16.546%, 01/08/2018 (a)(b)(c) | | | 7,230,000 | | | | 7,658,378 | |
Mythen Re 2012-2 A
8.646%, 01/05/2017 (a)(b)(c) | | | 422,000 | | | | 435,673 | |
RW003 (Horseshoe Segregated Account)
13.794%, 07/22/2016 (a)(b)(d)(e)(g) | | | 683,093 | | | | 633,264 | |
Tradewynd Re 2013-1 1
8.906%, 07/09/2018 (a)(b)(c) | | | 4,143,000 | | | | 4,559,786 | |
Tradewynd Re 2013-2 3-A
6.036%, 01/09/2017 (a)(b)(c) | | | 5,019,000 | | | | 5,087,258 | |
Tradewynd Re 2013-2 3-B
6.586%, 01/09/2017 (a)(b)(c) | | | 4,302,000 | | | | 4,362,228 | |
Tradewynd Re 2014-1 Class 3-A
5.000%, 01/08/2018 (a)(b)(c) | | | 4,446,000 | | | | 4,446,667 | |
Tradewynd Re 2014-1 Class 3-B
7.000%, 01/08/2018 (a)(b)(c) | | | 11,857,000 | | | | 11,964,899 | |
Tramline Re II 2014-1 Class A
9.796%, 01/04/2019 (a)(b)(c) | | | 7,635,000 | | | | 7,839,618 | |
| | | | | | | | |
| | | | | | | 86,379,231 | |
| | | | | | | | |
| | | | | | | | |
| | | PRINCIPAL
AMOUNT | | | FAIR
VALUE | |
| Windstorm - 0.1% | | | | | | |
Queen Street VIII
6.546%, 06/08/2016 (a)(b)(c) | | $ | 250,000 | | | $ | 250,687 | |
Queen Street X Re
5.796%, 06/08/2018 (a)(b)(c) | | | 378,000 | | | | 373,559 | |
| | | | | | | | |
| | | | | | | 624,246 | |
| | | | | | | | |
| | | | | | | 102,298,254 | |
| | | | | | | | |
| Mexico - 1.2% | | | | | | |
| | | | | | | | |
| Earthquake - 1.0% | | | | | | |
MultiCat Mexico 2012-1 A
8.046%, 12/04/2015 (a)(b)(c) | | | 4,801,000 | | | | 4,808,682 | |
| | | | | | | | |
| | |
| Windstorm - 0.2% | | | | | | |
MultiCat Mexico 2012-1 B
7.796%, 12/04/2015 (a)(b)(c) | | | 1,125,000 | | | | 1,127,137 | |
MultiCat Mexico 2012-1 C
7.546%, 12/04/2015 (a)(b)(c) | | | 459,000 | | | | 18,360 | |
| | | | | | | | |
| | | | | | | 1,145,497 | |
| | | | | | | | |
| | | | | | | 5,954,179 | |
| | | | | | | | |
| United States - 58.7% | | | | | | |
| | | | | | | | |
| Earthquake - 6.2% | | | | | | |
Golden State Re II
2.246%, 01/08/2019 (a)(b)(c) | | | 2,900,000 | | | | 2,885,355 | |
Lakeside Re III
8.046%, 01/08/2016 (a)(b)(c) | | | 8,700,000 | | | | 8,746,980 | |
Ursa Re 2014-1 Class A
3.500%, 12/07/2017 (a)(b)(c) | | | 2,369,000 | | | | 2,348,627 | |
Ursa Re 2014-1 Class B
5.000%, 12/07/2017 (a)(b)(c) | | | 8,513,000 | | | | 8,491,717 | |
Ursa Re 2015-1
5.000%, 09/21/2018 (a)(b)(c) | | | 8,450,000 | | | | 8,424,228 | |
| | | | | | | | |
| | | | | | | 30,896,907 | |
| | | | | | | | |
| Multiperil - 22.0% | | | | | | |
Atlas Re VII A
8.322%, 01/07/2016 (a)(b)(c) | | | 1,228,000 | | | | 1,237,701 | |
Caelus Re 2013-1 A
5.296%, 03/07/2016 (a)(b)(c) | | | 4,229,000 | | | | 4,263,043 | |
Caelus Re 2013-2 A
6.896%, 04/07/2017 (a)(b)(c) | | | 11,506,000 | | | | 11,895,478 | |
East Lane Re VI
2.796%, 03/14/2018 (a)(b)(c) | | | 6,340,000 | | | | 6,287,378 | |
East Lane VI 2015-1
3.806%, 03/13/2023 (a)(b)(c) | | | 3,190,000 | | | | 3,201,165 | |
Ibis Re II 2013-1 C
8.046%, 06/28/2016 (a)(b)(c) | | | 2,000,000 | | | | 2,067,600 | |
Long Point Re III 2015-1
3.750%, 05/23/2018 (a)(b)(c) | | | 4,431,000 | | | | 4,503,668 | |
Mona Lisa Re 2013-2 A
7.346%, 07/07/2017 (a)(b)(c) | | | 1,836,000 | | | | 1,928,259 | |
Northshore Re 2013-1 A
7.296%, 07/05/2016 (a)(b)(c) | | | 5,379,000 | | | | 5,508,096 | |
PennUnion Re 2015-1
4.556%, 12/07/2018 (a)(b)(c) | | | 1,004,000 | | | | 1,005,155 | |
Residential Re 2015-1 Class 10
11.046%, 06/06/2019 (a)(b)(c) | | | 1,983,000 | | | | 2,031,980 | |
| | | | |
| | The accompanying footnotes are an integral part of these Schedules of Investments. | | (Continued) |
| | | | | | | | | | | | | | | | |
| | Stone Ridge Funds | | | | | | Annual Report | | | | | | October 31, 2015 | | |
| | | | | | | | | | |
24
| | |
| Schedule of Investments | | as of October 31, 2015 |
| | | | |
| STONE RIDGE HIGH YIELD REINSURANCE RISK PREMIUM FUND | | | | |
| | | | | | | | |
| | | PRINCIPAL
AMOUNT | | | FAIR
VALUE | |
| Multiperil - 22.0% (continued) | | | | | | |
Residential Re 2015-1 Class 11
6.046%, 06/06/2019 (a)(b)(c) | | $ | 2,157,000 | | | $ | 2,189,679 | |
Residential Re 2011-2 1
8.946%, 12/06/2015 (a)(b)(c) | | | 1,642,000 | | | | 1,647,337 | |
Residential Re 2012-1 3
10.046%, 06/06/2016 (a)(b)(c) | | | 1,668,000 | | | | 1,737,889 | |
Residential Re 2012-2 2
5.796%, 12/06/2016 (a)(b)(c) | | | 851,000 | | | | 872,318 | |
Residential Re 2012-2 4
19.046%, 12/06/2016 (a)(b)(c) | | | 1,780,000 | | | | 1,931,567 | |
Residential Re 2013-1 11
8.056%, 06/06/2017 (a)(b)(c) | | | 15,400,000 | | | | 16,144,590 | |
Residential Re 2013-1 3
9.296%, 06/06/2017 (a)(b)(c) | | | 8,400,000 | | | | 8,901,900 | |
Residential Re 2013-2 1
20.046%, 12/06/2017 (a)(b)(c) | | | 2,420,000 | | | | 2,540,758 | |
Residential Re 2013-2 4
5.296%, 12/06/2017 (a)(b)(c) | | | 1,900,000 | | | | 1,902,185 | |
Residential Re 2014-1 10
15.046%, 06/06/2018 (a)(b)(c) | | | 3,965,000 | | | | 4,098,422 | |
Residential Re 2014-1 13
3.546%, 06/06/2018 (a)(b)(c) | | | 1,097,000 | | | | 1,110,054 | |
Residential Re 2014-2 Class 4
4.846%, 12/06/2018 (a)(b)(c) | | | 2,347,000 | | | | 2,314,377 | |
Riverfront Re 2014
4.056%, 01/06/2017 (a)(b)(c) | | | 1,966,000 | | | | 1,962,658 | |
Sanders Re 2013-1 B
4.046%, 05/05/2017 (a)(b)(c) | | | 6,890,000 | | | | 6,925,828 | |
Sanders Re 2014-1 D
3.916%, 05/28/2019 (a)(b)(c) | | | 8,705,000 | | | | 8,578,342 | |
Sanders Re 2014-2
3.896%, 06/07/2017 (a)(b)(c) | | | 1,826,000 | | | | 1,847,729 | |
Skyline Re 2014-1 A
14.046%, 01/23/2017 (a)(b)(c) | | | 408,000 | | | | 426,564 | |
| | | | | | | | |
| | | | | | | 109,061,720 | |
| | | | | | | | |
| Windstorm - 30.5% | | | | | | |
Alamo Re 2015-1 Class A
5.956%, 06/07/2018 (a)(b)(c) | | | 24,557,000 | | | | 25,539,280 | |
Alamo Re 2015-1 Class B
4.646%, 06/07/2018 (a)(b)(c) | | | 12,015,000 | | | | 12,407,290 | |
Armor Re Ltd.
4.126%, 12/15/2016 (a)(b)(c) | | | 15,700,000 | | | | 15,838,160 | |
Citrus Re 2014-1
4.506%, 04/18/2017 (a)(b)(c) | | | 2,703,000 | | | | 2,709,623 | |
Citrus Re 2014-2
4.336%, 04/24/2017 (a)(b)(c) | | | 607,000 | | | | 610,642 | |
Citrus Re 2015-1 Class A
4.946%, 04/09/2018 (a)(b)(c) | | | 2,514,000 | | | | 2,531,095 | |
Citrus Re 2015-1 Class B
6.366%, 04/09/2018 (a)(b)(c) | | | 3,770,000 | | | | 3,812,601 | |
Citrus Re 2015-1 Class C
9.526%, 04/09/2018 (a)(b)(c) | | | 1,163,000 | | | | 1,186,609 | |
Compass Re II 2015-1
9.762%, 12/08/2015 (a)(b)(c)(d) | | | 4,036,000 | | | | 4,020,663 | |
Cranberry Re 2015-1
3.856%, 07/06/2018 (a)(b)(c) | | | 1,097,000 | | | | 1,121,463 | |
Everglades Re 2013-1 A
9.526%, 03/28/2016 (a)(b)(c) | | | 8,400,000 | | | | 8,630,160 | |
| | | | | | | | |
| | | PRINCIPAL
AMOUNT | | | FAIR
VALUE | |
| Windstorm - 30.5% (continued) | | | | | | |
Everglades Re 2014
7.496%, 04/28/2017 (a)(b)(c) | | $ | 24,042,000 | | | $ | 25,030,126 | |
Everglades Re II 2015-1
5.196%, 05/03/2018 (a)(b)(c) | | | 19,103,000 | | | | 19,517,535 | |
Gator Re 2014
6.726%, 01/09/2017 (a)(b)(c) | | | 6,026,000 | | | | 5,677,697 | |
Kilimanjaro Re 2014-1 Class A
4.796%, 04/30/2018 (a)(b)(c) | | | 3,991,000 | | | | 3,994,392 | |
Long Point Re III 2013-1 A
4.246%, 05/18/2016 (a)(b)(c) | | | 2,861,000 | | | | 2,884,746 | |
Manatee Re 2015-1
5.056%, 12/22/2017 (a)(b)(c) | | | 1,005,000 | | | | 1,012,538 | |
Market Re 2015-2
6.950%, 06/07/2016 (a)(b)(c)(d) | | | 1,319,000 | | | | 1,386,137 | |
Pelican Re 2013-1 A
6.056%, 05/15/2017 (a)(b)(c) | | | 7,388,000 | | | | 7,645,472 | |
Tar Heel 2013-1 A
8.546%, 05/09/2016 (a)(b)(c) | | | 5,711,000 | | | | 5,880,331 | |
| | | | | | | | |
| | | | | | | 151,436,560 | |
| | | | | | | | |
| | | | | | | 291,395,187 | |
| | | | | | | | |
TOTAL EVENT-LINKED BONDS
(Cost $393,350,916) | | | | 400,314,020 | |
| | | | | | | | |
| | |
PARTICIPATION NOTES
(QUOTA SHARES) - 8.8% | | | | | | |
| | | | | | | | |
| Global - 7.8% | | | | | | |
| | | | | | | | |
| Multiperil - 7.8% | | | | | | |
Atlas Re X Class A
04/03/2017 (a)(c)(e) | | | 15,211,000 | | | | 17,226,905 | |
Eden Re 2015-1
04/19/2018 (a)(e)(f)(g) (Cost: $1,500,000; Acquisition Date: 12/29/2014) | | | 1,500,000 | | | | 1,660,325 | |
Eden Re II 2015-1 04/19/2018 (a)(e)(f)(g) (Cost: $7,317,063; Acquisition Date: 03/19/2015) | | | 7,250,000 | | | | 7,696,056 | |
Sector Re V LTD Series 4 Class A 03/30/2019 (a)(g) (Cost: $12,263; Acquisition Date: 04/24/2014) | | | 12,263 | | | | 288,376 | |
Sector Re V LTD Series 5 Class B 03/01/2020 (a)(f)(g) (Cost: $7,091,439; Acquisition Date: 04/30/2015) | | | 7,091,439 | | | | 7,699,885 | |
Sector Re V LTD Series 5 Class F 03/01/2020 (a)(f)(g) (Cost: $3,750,000; Acquisition Date: 04/27/2015) | | | 3,750,000 | | | | 3,955,875 | |
| | | | | | | | |
| | | | | | | 38,527,422 | |
| | | | | | | | |
| United States - 1.0% | | | | | | |
| | | | | | | | |
| Multiperil - 1.0% | | | | | | |
Sector Re V LTD Series 3 Class F 03/01/2019 (a)(g) (Cost: $71,250; Acquisition Date: 03/12/2013) | | | 71,250 | | | | 363,703 | |
| | | | |
| | The accompanying footnotes are an integral part of these Schedules of Investments. | | (Continued) |
| | | | | | | | | | | | | | | | |
| | Stone Ridge Funds | | | | | | Annual Report | | | | | | October 31, 2015 | | |
| | | | | | | | | | |
25
| | |
| Schedule of Investments | | as of October 31, 2015 |
| | | | |
| STONE RIDGE HIGH YIELD REINSURANCE RISK PREMIUM FUND | | | | |
| | | | | | | | |
| | | PRINCIPAL
AMOUNT | | | FAIR
VALUE | |
| Multiperil - 1.0% (continued) | | | | | | |
Sector Re V LTD Series 5 Class G 06/26/2016 (a)(f)(g) (Cost: $4,587,000; Acquisition Date: 06/26/2015) | | $ | 4,587,000 | | | $ | 4,812,221 | |
| | | | | | | | |
| | | | | | | 5,175,924 | |
| | | | | | | | |
TOTAL PARTICIPATION NOTES
(QUOTA SHARES)
(Cost $39,540,014) | | | | | | | 43,703,346 | |
| | | | | | | | |
| | |
PREFERENCE SHARES
(QUOTA SHARES) - 9.7% | | SHARES | | | FAIR
VALUE | |
| | |
| Global - 9.7% | | | | | | |
| | | | | | | | |
| Multiperil - 9.7% | | | | | | |
Arenal (Kane Segregated Account Company) (a)(e)(f)(g) (Cost: $12,589,776; Acquisition Date: 05/07/2015) | | | 12,590 | | | | 13,858,255 | |
Biscayne (Kane Segregated Account Company) (a)(e)(g) (Cost: $10,874,225; Original Acquisition Date: 04/30/2014) | | | 10,896 | | | | 12,385,523 | |
Hilo (Kane Segregated Account Company) (a)(e)(f)(g) (Cost: $1,181,950; Acquisition Date: 06/09/2015) | | | 1,182 | | | | 1,272,478 | |
Hudson Charles 2 (Mt. Logan Re) (a)(g) (Cost: $3,472,000; Acquisition Date: 04/02/2014) | | | 3,472 | | | | 3,999,520 | |
Hudson Charles 3 (Mt. Logan Re) (a)(g) (Cost: $3,446,000; Acquisition Date: 06/19/2014) | | | 3,446 | | | | 3,930,353 | |
Hudson Paul 3 (Mt. Logan Re) (a)(g) (Cost: $3,472,000; Acquisition Date: 04/02/2014) | | | 3,472 | | | | 4,168,640 | |
Kona (Kane Segregated Account Company) (a)(e)(f)(g) (Cost: $450,000; Acquisition Date: 07/23/2015) | | | 450 | | | | 483,484 | |
Lorenz Re Class B (a)(e)(f)(g) (Cost: $16,450; Acquisition Date: 03/25/2013) | | | 165 | | | | 19,503 | |
LRe 2015 (a)(e)(f)(g) (Cost: $2,179,191; Acquisition Date: 03/31/2015) | | | 21,792 | | | | 2,466,956 | |
Minnewaska (Kane Segregated Account Company) (a)(e)(f)(g) (Cost: $1,793,421; Original Acquisition Date: 05/29/2015) | | | 1,540 | | | | 1,977,359 | |
Rondout (Kane Segregated Account Company) (a)(e)(g) (Cost: $3,300,563; Acquisition Date: 05/29/2015) | | | 2,913 | | | | 3,552,718 | |
| | | | | | | | |
TOTAL PREFERENCE SHARES
(QUOTA SHARES)
(Cost $42,775,576) | | | | 48,114,789 | |
| | | | | | | | |
| | | | | | | | |
| | | SHARES | | | FAIR
VALUE | |
| SHORT-TERM INVESTMENTS - 0.1% | | | | | | |
| | | | | | | | |
| Money Market Fund - 0.1% | | | | | | |
Fidelity Institutional Money Market Fund - Money Market Portfolio - Institutional Class - 0.12% (h) | | | 125,315 | | | $ | 125,315 | |
First American Government Obligations Fund - Class Z - 0.01% (h) | | | 125,315 | | | | 125,315 | |
First American Prime Obligations Fund - Class Z - 0.06% (h) | | | 125,315 | | | | 125,315 | |
Short Term Investments Trust - Liquid Assets Portfolio - Institutional Class - 0.16% (h) | | | 125,315 | | | | 125,315 | |
Short Term Investments Trust - Treasury Portfolio - Institutional Class - 0.02% (h) | | | 125,315 | | | | 125,315 | |
| | | | | | | | |
TOTAL SHORT-TERM INVESTMENTS
(Cost $626,575) | | | | 626,575 | |
| �� | | | | | | | |
TOTAL INVESTMENTS
(Cost $476,293,081) - 99.4% | | | | 492,758,730 | |
| | | | | | | | |
OTHER ASSETS IN EXCESS OF
LIABILITIES - 0.6% | | | | | 2,902,988 | |
| | | | | | | | |
| TOTAL NET ASSETS - 100.0% | | | $495,661,718 | |
| | | | | | | | |
Principal amounts stated in U.S. dollars unless otherwise stated.
Country shown is the geographic area of peril risk.
Percentages are stated as a percent of net assets.
| (a) | Foreign issued security. Total foreign securities by country of domicile are $481,303,402. Foreign concentration is as follows: Bermuda: 76.9%, Cayman Islands: 19.5%, Ireland: 0.7%. |
| (b) | Variable rate security. The rate shown is as of October 31, 2015. |
| (c) | Security is restricted to resale to institutional investors. The Fund’s Adviser has deemed this security to be liquid based upon procedures approved by the Board of Trustees. The aggregate value of these securities at October 31, 2015 was $416,907,661, which represents 84.1% of net assets. |
| (d) | Zero-coupon bond. The rate shown is the yield to maturity. |
| (e) | Security is fair valued by the Adviser pursuant to procedures approved by the Board of Trustees. The aggregate value of these securities is $63,232,826, which represents 12.8% of net assets. |
| (f) | Non-income producing security. |
| (g) | Security is restricted to resale. The aggregate value of these securities at October 31, 2015 was $75,224,494, which represents 15.2% of net assets. |
| (h) | Rate shown is the 7-day effective yield. |
Open Futures Contracts
| | | | | | | | | | | | |
| DESCRIPTION | | NUMBER OF
CONTRACTS
SOLD | | | NOTIONAL
VALUE | | | UNREALIZED
DEPRECIATION | |
| | | |
| FUTURES CONTRACTS SOLD | | | | | | | | | |
U.S. Treasury 5-Year Note, December 2015 Settlement | | | 70 | | | $ | 8,384,141 | | | $ | (11,636) | |
| | | | | | | | | | | | |
TOTAL FUTURES CONTRACTS SOLD | | | | | | $ | 8,384,141 | | | $ | (11,636) | |
| | | | | | | | | | | | |
| | | | |
| | The accompanying footnotes are an integral part of these Schedules of Investments. | | |
| | | | | | | | | | | | | | | | |
| | Stone Ridge Funds | | | | | | Annual Report | | | | | | October 31, 2015 | | |
| | | | | | | | | | |
26
| | |
| Schedule of Investments | | as of October 31, 2015 |
| | | | |
| STONE RIDGE U.S. LARGE CAP VARIANCE RISK PREMIUM FUND | | | | |
| | | | | | | | |
| | | SHARES | | | FAIR
VALUE | |
| COMMON STOCKS - 12.6% | | | | | | |
| | | | | | | | |
| Automobiles & Components - 0.4% | |
Delphi Automotive PLC (a)(b) | | | 2,900 | | | $ | 241,251 | |
Ford Motor Co. (b) | | | 9,100 | | | | 134,771 | |
General Motors Co. (b) | | | 5,700 | | | | 198,987 | |
Goodyear Tire & Rubber Co. (b) | | | 7,200 | | | | 236,448 | |
Harley-Davidson, Inc. (b) | | | 200 | | | | 9,890 | |
Lear Corp. (b) | | | 2,000 | | | | 250,120 | |
Tesla Motors, Inc. (b)(c) | | | 1,900 | | | | 393,167 | |
| | | | | | | | |
| | | | | | | 1,464,634 | |
| | | | | | | | |
| Banks - 0.2% | |
Bank of America Corp. (b) | | | 10,000 | | | | 167,800 | |
Citigroup, Inc. (b) | | | 600 | | | | 31,902 | |
City National Corp. (b) | | | 100 | | | | 8,960 | |
Comerica, Inc. (b) | | | 200 | | | | 8,680 | |
JPMorgan Chase & Co. (b) | | | 500 | | | | 32,125 | |
M&T Bank Corp. (b) | | | 1,600 | | | | 191,760 | |
Popular, Inc. (a)(b) | | | 145 | | | | 4,288 | |
Wells Fargo & Co. (b) | | | 2,800 | | | | 151,592 | |
| | | | | | | | |
| | | | | | | 597,107 | |
| | | | | | | | |
| Capital Goods - 0.8% | |
3M Co. (b) | | | 1,700 | | | | 267,257 | |
Boeing Co. (b) | | | 1,800 | | | | 266,526 | |
Caterpillar, Inc. (b) | | | 1,200 | | | | 87,588 | |
Chicago Bridge & Iron Co. NV (a)(b) | | | 1,000 | | | | 44,870 | |
Colfax Corp. (b)(c) | | | 600 | | | | 16,176 | |
Cummins, Inc. (b) | | | 1,500 | | | | 155,265 | |
Deere & Co. (b) | | | 1,400 | | | | 109,200 | |
Eaton Corp. PLC (a)(b) | | | 200 | | | | 11,182 | |
Fluor Corp. (b) | | | 2,100 | | | | 100,401 | |
General Electric Co. (b) | | | 8,300 | | | | 240,036 | |
Honeywell International, Inc. (b) | | | 300 | | | | 30,984 | |
Joy Global, Inc. (b) | | | 2,000 | | | | 34,360 | |
Lennox International, Inc. (b) | | | 300 | | | | 39,843 | |
Lockheed Martin Corp. (b) | | | 700 | | | | 153,881 | |
Navistar International Corp. (b)(c) | | | 3,300 | | | | 40,590 | |
NOW, Inc. (b)(c) | | | 25 | | | | 413 | |
Orbital ATK, Inc. (b) | | | 100 | | | | 8,562 | |
Raytheon Co. (b) | | | 300 | | | | 35,220 | |
Rockwell Collins, Inc. (b) | | | 100 | | | | 8,672 | |
Roper Technologies, Inc. (b) | | | 651 | | | | 121,314 | |
SolarCity Corp. (b)(c) | | | 3,500 | | | | 103,775 | |
Spirit AeroSystems Holdings, Inc. (b)(c) | | | 4,700 | | | | 247,878 | |
Terex Corp. (b) | | | 1,200 | | | | 24,072 | |
Textron, Inc. (b) | | | 5,900 | | | | 248,803 | |
TransDigm Group, Inc. (b)(c) | | | 200 | | | | 43,970 | |
Trinity Industries, Inc. (b) | | | 5,300 | | | | 143,471 | |
United Rentals, Inc. (b)(c) | | | 2,600 | | | | 194,636 | |
United Technologies Corp. (b) | | | 2,400 | | | | 236,184 | |
Valmont Industries, Inc. (b) | | | 400 | | | | 43,376 | |
Veritiv Corp. (b)(c) | | | 8 | | | | 336 | |
| | | | | | | | |
| | | | | | | 3,058,841 | |
| | | | | | | | |
| Commercial & Professional Services - 0.0% | |
ADT Corp. (b) | | | 800 | | | | 26,432 | |
| | | | | | | | |
| | | | | | | | |
| | | SHARES | | | FAIR
VALUE | |
| Consumer Durables & Apparel - 0.6% | |
Coach, Inc. (b) | | | 2,000 | | | $ | 62,400 | |
DR Horton, Inc. (b) | | | 11,200 | | | | 329,728 | |
Fossil Group, Inc. (b)(c) | | | 2,400 | | | | 130,584 | |
Garmin Ltd. (a)(b) | | | 3,933 | | | | 139,504 | |
Hanesbrands, Inc. (b) | | | 8,800 | | | | 281,072 | |
Harman International Industries, Inc. (b) | | | 690 | | | | 75,872 | |
Michael Kors Holdings Ltd. (a)(b)(c) | | | 700 | | | | 27,048 | |
NIKE, Inc. (b) | | | 2,700 | | | | 353,781 | |
PulteGroup, Inc. (b) | | | 11,800 | | | | 216,294 | |
Toll Brothers, Inc. (b)(c) | | | 4,200 | | | | 151,074 | |
Under Armour, Inc. (b)(c) | | | 1,000 | | | | 95,080 | |
VF Corp. (b) | | | 3,200 | | | | 216,064 | |
Vista Outdoor, Inc. (b)(c) | | | 400 | | | | 17,888 | |
| | | | | | | | |
| | | | | | | 2,096,389 | |
| | | | | | | | |
| Consumer Services - 0.4% | |
Caesars Entertainment Corp. (b)(c) | | | 600 | | | | 4,830 | |
Chipotle Mexican Grill, Inc. (b)(c) | | | 300 | | | | 192,069 | |
H&R Block, Inc. (b) | | | 6,300 | | | | 234,738 | |
Hilton Worldwide Holdings, Inc. (b) | | | 3,100 | | | | 77,469 | |
Las Vegas Sands Corp. (b) | | | 300 | | | | 14,853 | |
Marriott International, Inc. (b) | | | 701 | | | | 53,823 | |
McDonald’s Corp. (b) | | | 900 | | | | 101,025 | |
MGM Resorts International (b)(c) | | | 5,000 | | | | 115,950 | |
Royal Caribbean Cruises Ltd. (a)(b) | | | 3,400 | | | | 334,390 | |
Starbucks Corp. (b) | | | 500 | | | | 31,285 | |
Starwood Hotels & Resorts Worldwide, Inc. (b) | | | 2,000 | | | | 159,740 | |
Wynn Resorts Ltd. (b) | | | 700 | | | | 48,965 | |
Yum! Brands, Inc. (b) | | | 870 | | | | 61,691 | |
| | | | | | | | |
| | | | | | | 1,430,828 | |
| | | | | | | | |
| Diversified Financials - 0.3% | |
American Express Co. (b) | | | 400 | | | | 29,304 | |
Ameriprise Financial, Inc. (b) | | | 1,609 | | | | 185,614 | |
Bank of New York Mellon Corp. (b) | | | 1,300 | | | | 54,145 | |
BlackRock, Inc. (b) | | | 200 | | | | 70,394 | |
Capital One Financial Corp. (b) | | | 100 | | | | 7,890 | |
CME Group, Inc. (b) | | | 1,100 | | | | 103,917 | |
Discover Financial Services (b) | | | 2,000 | | | | 112,440 | |
E*Trade Financial Corp. (b)(c) | | | 1,000 | | | | 28,510 | |
FactSet Research Systems, Inc. (b) | | | 610 | | | | 106,823 | |
Goldman Sachs Group, Inc. (b) | | | 1,300 | | | | 243,750 | |
McGraw Hill Financial, Inc. (b) | | | 300 | | | | 27,792 | |
Moody’s Corp. (b) | | | 300 | | | | 28,848 | |
Morgan Stanley (b) | | | 2,000 | | | | 65,940 | |
NASDAQ OMX Group, Inc. (b) | | | 100 | | | | 5,789 | |
Northern Trust Corp. (b) | | | 2,900 | | | | 204,131 | |
| | | | | | | | |
| | | | | | | 1,275,287 | |
| | | | | | | | |
| Energy - 0.9% | |
Anadarko Petroleum Corp. (b) | | | 1,600 | | | | 107,008 | |
Apache Corp. (b) | | | 2,500 | | | | 117,825 | |
Baker Hughes, Inc. (b) | | | 3,300 | | | | 173,844 | |
California Resources Corp. (b) | | | 880 | | | | 3,555 | |
Cameron International Corp. (b)(c) | | | 900 | | | | 61,209 | |
Cheniere Energy, Inc. (b)(c) | | | 6,600 | | | | 326,832 | |
Chesapeake Energy Corp. (b) | | | 2,000 | | | | 14,260 | |
| | | | |
| | The accompanying footnotes are an integral part of these Schedules of Investments. | | (Continued) |
| | | | | | | | | | | | | | | | |
| | Stone Ridge Funds | | | | | | Annual Report | | | | | | October 31, 2015 | | |
| | | | | | | | | | |
27
| | |
| Schedule of Investments | | as of October 31, 2015 |
| | | | |
| STONE RIDGE U.S. LARGE CAP VARIANCE RISK PREMIUM FUND | | | | |
| | | | | | | | |
| | | SHARES | | | FAIR
VALUE | |
| Energy - 0.9% (continued) | |
Chevron Corp. (b) | | | 1,200 | | | $ | 109,056 | |
Concho Resources, Inc. (b)(c) | | | 1,800 | | | | 208,638 | |
ConocoPhillips (b) | | | 500 | | | | 26,675 | |
CONSOL Energy, Inc. (b) | | | 600 | | | | 3,996 | |
Continental Resources, Inc. (b)(c) | | | 600 | | | | 20,346 | |
CVR Energy, Inc. (b) | | | 4,600 | | | | 204,516 | |
Devon Energy Corp. (b) | | | 400 | | | | 16,772 | |
Energen Corp. (b) | | | 2,400 | | | | 139,560 | |
EOG Resources, Inc. (b) | | | 1,200 | | | | 103,020 | |
EQT Corp. (b) | | | 2,000 | | | | 132,140 | |
Exxon Mobil Corp. (b) | | | 400 | | | | 33,096 | |
Halliburton Co. (b) | | | 3,000 | | | | 115,140 | |
Helmerich & Payne, Inc. (b) | | | 2,100 | | | | 118,167 | |
Hess Corp. (b) | | | 1,600 | | | | 89,936 | |
HollyFrontier Corp. (b) | | | 300 | | | | 14,691 | |
Kinder Morgan, Inc. (b) | | | 300 | | | | 8,205 | |
Marathon Oil Corp. (b) | | | 2,000 | | | | 36,760 | |
Marathon Petroleum Corp. (b) | | | 4,200 | | | | 217,560 | |
National Oilwell Varco, Inc. (b) | | | 600 | | | | 22,584 | |
Newfield Exploration Co. (b)(c) | | | 1,500 | | | | 60,285 | |
Occidental Petroleum Corp. (b) | | | 1,900 | | | | 141,626 | |
Peabody Energy Corp. (b) | | | 393 | | | | 5,026 | |
Phillips 66 (b) | | | 1,300 | | | | 115,765 | |
Pioneer Natural Resources Co. (b) | | | 600 | | | | 82,284 | |
Schlumberger Ltd. (a)(b) | | | 2,000 | | | | 156,320 | |
Seadrill Ltd. (a)(b) | | | 1,000 | | | | 6,470 | |
Seventy Seven Energy, Inc. (b)(c) | | | 379 | | | | 432 | |
Southwestern Energy Co. (b)(c) | | | 1,000 | | | | 11,040 | |
Tesoro Corp. (b) | | | 1,500 | | | | 160,395 | |
Valero Energy Corp. (b) | | | 200 | | | | 13,184 | |
Whiting Petroleum Corp. (b)(c) | | | 3 | | | | 52 | |
Williams Cos., Inc. (b) | | | 500 | | | | 19,720 | |
| | | | | | | | |
| | | | | | | 3,197,990 | |
| | | | | | | | |
| Food & Staples Retailing - 0.3% | |
Costco Wholesale Corp. (b) | | | 200 | | | | 31,624 | |
CVS Health Corp. (b) | | | 2,700 | | | | 266,706 | |
Kroger Co. (b) | | | 4,800 | | | | 181,440 | |
Rite Aid Corp. (b)(c) | | | 29,100 | | | | 229,308 | |
Walgreens Boots Alliance, Inc. (b) | | | 700 | | | | 59,276 | |
Wal-Mart Stores, Inc. (b) | | | 2,800 | | | | 160,272 | |
Whole Foods Market, Inc. (b) | | | 2,114 | | | | 63,335 | |
| | | | | | | | |
| | | | | | | 991,961 | |
| | | | | | | | |
| Food, Beverage & Tobacco - 0.4% | |
Altria Group, Inc. (b) | | | 2,600 | | | | 157,222 | |
Archer-Daniels-Midland Co. (b) | | | 2,200 | | | | 100,452 | |
Coca-Cola Co. (b) | | | 900 | | | | 38,115 | |
Coca-Cola Enterprises, Inc. (b) | | | 1,200 | | | | 61,608 | |
JM Smucker Co. (b) | | | 1,800 | | | | 211,302 | |
Keurig Green Mountain, Inc. (b) | | | 4,100 | | | | 208,075 | |
Mead Johnson Nutrition Co. (b) | | | 300 | | | | 24,600 | |
Mondelez International, Inc. (b) | | | 4,000 | | | | 184,640 | |
Monster Beverage Corp. (b)(c) | | | 1,100 | | | | 149,952 | |
PepsiCo., Inc. (b) | | | 300 | | | | 30,657 | |
Philip Morris International, Inc. (b) | | | 800 | | | | 70,720 | |
Reynolds American, Inc. (b) | | | 580 | | | | 28,026 | |
Tyson Foods, Inc. (b) | | | 5,001 | | | | 221,844 | |
| | | | | | | | |
| | | | | | | 1,487,213 | |
| | | | | | | | |
| | | | | | | | |
| | | SHARES | | | FAIR
VALUE | |
| Health Care Equipment & Services - 1.0% | |
Abbott Laboratories (b) | | | 5,400 | | | $ | 241,920 | |
Aetna, Inc. (b) | | | 1,101 | | | | 126,373 | |
AmerisourceBergen Corp. (b) | | | 1,000 | | | | 96,510 | |
Anthem, Inc. (b) | | | 600 | | | | 83,490 | |
Athenahealth, Inc. (b)(c) | | | 2,300 | | | | 350,635 | |
Baxter International, Inc. (b) | | | 800 | | | | 29,912 | |
Becton, Dickinson & Co. (b) | | | 1,500 | | | | 213,780 | |
C.R. Bard, Inc. (b) | | | 1,410 | | | | 262,754 | |
Cardinal Health, Inc. (b) | | | 100 | | | | 8,220 | |
Centene Corp. (b)(c) | | | 800 | | | | 47,584 | |
Cigna Corp. (b) | | | 1,400 | | | | 187,656 | |
Community Health Systems, Inc. (b)(c) | | | 1,429 | | | | 40,069 | |
Cooper Cos., Inc. (b) | | | 1,500 | | | | 228,540 | |
Express Scripts Holding Co. (b)(c) | | | 3,300 | | | | 285,054 | |
Halyard Health, Inc. (b)(c) | | | 212 | | | | 6,292 | |
Health Net, Inc. (b)(c) | | | 557 | | | | 35,793 | |
Hologic, Inc. (b)(c) | | | 3,200 | | | | 124,352 | |
Humana, Inc. (b) | | | 1,788 | | | | 319,390 | |
Intuitive Surgical, Inc. (b)(c) | | | 500 | | | | 248,300 | |
Laboratory Corp. of America Holdings (b)(c) | | | 100 | | | | 12,274 | |
McKesson Corp. (b) | | | 1,100 | | | | 196,680 | |
Medtronic PLC (a)(b) | | | 495 | | | | 36,590 | |
Quest Diagnostics, Inc. (b) | | | 400 | | | | 27,180 | |
Sirona Dental Systems, Inc. (b)(c) | | | 99 | | | | 10,804 | |
St. Jude Medical, Inc. (b) | | | 2,900 | | | | 185,049 | |
UnitedHealth Group, Inc. (b) | | | 3,200 | | | | 376,896 | |
Universal Health Services, Inc. (b) | | | 8 | | | | 977 | |
Zimmer Biomet Holdings, Inc. (b) | | | 300 | | | | 31,371 | |
| | | | | | | | |
| | | | | | | 3,814,445 | |
| | | | | | | | |
| Household & Personal Products - 0.2% | |
Colgate-Palmolive Co. (b) | | | 3,300 | | | | 218,955 | |
Edgewell Personal Care Co. (b) | | | 500 | | | | 42,355 | |
Energizer Holdings, Inc. (b) | | | 500 | | | | 21,415 | |
Estee Lauder Cos., Inc. (b) | | | 800 | | | | 64,368 | |
Herbalife Ltd. (a)(b)(c) | | | 1,600 | | | | 89,664 | |
Kimberly-Clark Corp. (b) | | | 1,700 | | | | 203,507 | |
Nu Skin Enterprises, Inc. (b) | | | 2,800 | | | | 106,988 | |
Procter & Gamble Co. (b) | | | 1,300 | | | | 99,294 | |
| | | | | | | | |
| | | | | | | 846,546 | |
| | | | | | | | |
| Insurance - 0.1% | |
American International Group, Inc. (b) | | | 3,200 | | | | 201,792 | |
AmTrust Financial Services, Inc. (b) | | | 500 | | | | 34,110 | |
Assured Guaranty Ltd. (a)(b) | | | 3,800 | | | | 104,272 | |
Hartford Financial Services Group, Inc. (b) | | | 100 | | | | 4,626 | |
Lincoln National Corp. (b) | | | 300 | | | | 16,053 | |
MBIA, Inc. (b)(c) | | | 17,600 | | | | 132,176 | |
MetLife, Inc. (b) | | | 600 | | | | 30,228 | |
| | | | | | | | |
| | | | | | | 523,257 | |
| | | | | | | | |
| Materials - 0.8% | |
Air Products & Chemicals, Inc. (b) | | | 100 | | | | 13,898 | |
Alcoa, Inc. (b) | | | 8,600 | | | | 76,798 | |
Allegheny Technologies, Inc. (b) | | | 3,200 | | | | 47,040 | |
Ashland, Inc. (b) | | | 2,000 | | | | 219,440 | |
Avery Dennison Corp. (b) | | | 4,100 | | | | 266,377 | |
| | | | |
| | The accompanying footnotes are an integral part of these Schedules of Investments. | | (Continued) |
| | | | | | | | | | | | | | | | |
| | Stone Ridge Funds | | | | | | Annual Report | | | | | | October 31, 2015 | | |
| | | | | | | | | | |
28
| | |
| Schedule of Investments | | as of October 31, 2015 |
| | | | |
| STONE RIDGE U.S. LARGE CAP VARIANCE RISK PREMIUM FUND | | | | |
| | | | | | | | |
| | | SHARES | | | FAIR
VALUE | |
| Materials - 0.8% (continued) | |
Celanese Corp. (b) | | | 3,541 | | | $ | 251,588 | |
CF Industries Holdings, Inc. (b) | | | 500 | | | | 25,385 | |
Chemours Co. (b) | | | 560 | | | | 3,881 | |
Cliffs Natural Resources, Inc. (b) | | | 9,000 | | | | 24,840 | |
Crown Holdings, Inc. (b)(c) | | | 4,000 | | | | 212,160 | |
Cytec Industries, Inc. (b) | | | 4,022 | | | | 299,317 | |
Dow Chemical Co. (b) | | | 3,000 | | | | 155,010 | |
Ecolab, Inc. (b) | | | 700 | | | | 84,245 | |
EI Du Pont de Nemours & Co. (b) | | | 2,800 | | | | 177,520 | |
Freeport-McMoRan, Inc. (b) | | | 5,100 | | | | 60,027 | |
Huntsman Corp. (b) | | | 8,800 | | | | 115,896 | |
International Paper Co. (b) | | | 700 | | | | 29,883 | |
LyondellBasell Industries NV (a)(b) | | | 694 | | | | 64,480 | |
Monsanto Co. (b) | | | 1,700 | | | | 158,474 | |
Mosaic Co. (b) | | | 3,500 | | | | 118,265 | |
NewMarket Corp. (b) | | | 100 | | | | 39,374 | |
Newmont Mining Corp. (b) | | | 8,600 | | | | 167,356 | |
Nucor Corp. (b) | | | 2,900 | | | | 122,670 | |
PPG Industries, Inc. (b) | | | 400 | | | | 41,704 | |
Royal Gold, Inc. (b) | | | 1 | | | | 48 | |
Sherwin-Williams Co. (b) | | | 300 | | | | 80,049 | |
Southern Copper Corp. (b) | | | 200 | | | | 5,552 | |
United States Steel Corp. (b) | | | 8,056 | | | | 94,094 | |
Vulcan Materials Co. (b) | | | 2,000 | | | | 193,160 | |
WR Grace & Co. (b)(c) | | | 400 | | | | 40,120 | |
| | | | | | | | |
| | | | | | | 3,188,651 | |
| | | | | | | | |
| Media - 0.5% | |
CBS Corp. (b) | | | 600 | | | | 27,912 | |
Charter Communications, Inc. (b)(c) | | | 1,200 | | | | 229,128 | |
Comcast Corp. (b) | | | 3,500 | | | | 219,170 | |
DISH Network Corp. (b)(c) | | | 3,400 | | | | 214,098 | |
Gannett Co., Inc. (b) | | | 150 | | | | 2,373 | |
Interpublic Group of Cos., Inc. (b) | | | 6,500 | | | | 149,045 | |
Liberty Broadband Corp. - Class A (b)(c) | | | 350 | | | | 19,096 | |
Liberty Broadband Corp. - Class C (b)(c) | | | 700 | | | | 37,639 | |
Madison Square Garden Co. (b)(c) | | | 1,073 | | | | 191,530 | |
MSG Networks, Inc. (b)(c) | | | 3,219 | | | | 66,054 | |
Omnicom Group, Inc. (b) | | | 2,727 | | | | 204,307 | |
TEGNA, Inc. (b) | | | 300 | | | | 8,112 | |
Time Warner Cable, Inc. (b) | | | 1,400 | | | | 265,160 | |
Time Warner, Inc. (b) | | | 400 | | | | 30,136 | |
Walt Disney Co. (b) | | | 2,500 | | | | 284,350 | |
| | | | | | | | |
| | | | | | | 1,948,110 | |
| | | | | | | | |
| Pharmaceuticals, Biotechnology & Life Sciences - 1.0% | |
AbbVie, Inc. (b) | | | 268 | | | | 15,959 | |
Agilent Technologies, Inc. (b) | | | 4,100 | | | | 154,816 | |
Alexion Pharmaceuticals, Inc. (b)(c) | | | 1,700 | | | | 299,200 | |
Alkermes PLC (a)(b)(c) | | | 500 | | | | 35,960 | |
Allergan PLC (a)(b)(c) | | | 1,237 | | | | 381,577 | |
Amgen, Inc. (b) | | | 3,100 | | | | 490,358 | |
Baxalta, Inc. (b) | | | 1,500 | | | | 51,690 | |
Biogen, Inc. (b)(c) | | | 100 | | | | 29,051 | |
Bristol-Myers Squibb Co. (b) | | | 4,100 | | | | 270,395 | |
Celgene Corp. (b)(c) | | | 2,600 | | | | 319,046 | |
Eli Lilly & Co. (b) | | | 100 | | | | 8,157 | |
Endo International PLC (a)(b)(c) | | | 300 | | | | 17,997 | |
| | | | | | | | |
| | | SHARES | | | FAIR
VALUE | |
Pharmaceuticals, Biotechnology & Life
Sciences - 1.0% (continued) | | | | | | |
Gilead Sciences, Inc. (b) | | | 2,600 | | | $ | 281,138 | |
Illumina, Inc. (b)(c) | | | 700 | | | | 100,296 | |
Incyte Corp. (b)(c) | | | 300 | | | | 35,259 | |
Jazz Pharmaceuticals PLC (a)(b)(c) | | | 660 | | | | 90,605 | |
Johnson & Johnson (b) | | | 300 | | | | 30,309 | |
Mallinckrodt PLC (a)(b)(c) | | | 4,129 | | | | 271,152 | |
MannKind Corp. (b)(c) | | | 21,300 | | | | 70,503 | |
Medivation, Inc. (b)(c) | | | 1,800 | | | | 75,708 | |
Merck & Co., Inc. (b) | | | 700 | | | | 38,262 | |
Mettler-Toledo International, Inc. (b)(c) | | | 100 | | | | 31,099 | |
Mylan NV (a)(b)(c) | | | 500 | | | | 22,045 | |
Pfizer, Inc. (b) | | | 6,400 | | | | 216,448 | |
Regeneron Pharmaceuticals, Inc. (b)(c) | | | 700 | | | | 390,173 | |
Thermo Fisher Scientific, Inc. (b) | | | 300 | | | | 39,234 | |
Zoetis, Inc. (b) | | | 3,300 | | | | 141,933 | |
| | | | | | | | |
| | | | | | | 3,908,370 | |
| | | | | | | | |
| Real Estate - 0.1% | |
Howard Hughes Corp. (b)(c) | | | 1,100 | | | | 135,938 | |
Jones Lang LaSalle, Inc. (b) | | | 400 | | | | 66,684 | |
Welltower, Inc. (b) | | | 100 | | | | 6,487 | |
| | | | | | | | |
| | | | | | | 209,109 | |
| | | | | | | | |
| Retailing - 1.3% | |
Abercrombie & Fitch Co. (b) | | | 4,700 | | | | 99,593 | |
Advance Auto Parts, Inc. (b) | | | 1,200 | | | | 238,116 | |
Amazon.com, Inc. (b)(c) | | | 100 | | | | 62,590 | |
Bed Bath & Beyond, Inc. (b)(c) | | | 2,400 | | | | 143,112 | |
Best Buy Co., Inc. (b) | | | 3,700 | | | | 129,611 | |
Dillard’s, Inc. (b) | | | 2,188 | | | | 195,782 | |
Dollar General Corp. (b) | | | 4,300 | | | | 291,411 | |
Dollar Tree, Inc. (b)(c) | | | 820 | | | | 53,702 | |
Expedia, Inc. (b) | | | 3,200 | | | | 436,160 | |
GameStop Corp. (b) | | | 3,200 | | | | 147,424 | |
Gap, Inc. (b) | | | 1,900 | | | | 51,718 | |
Genuine Parts Co. (b) | | | 1,100 | | | | 99,836 | |
Groupon, Inc. (b)(c) | | | 500 | | | | 1,855 | |
Home Depot, Inc. (b) | | | 2,200 | | | | 272,008 | |
J.C. Penney Co., Inc. (b)(c) | | | 32,500 | | | | 298,025 | |
Kohl’s Corp. (b) | | | 1,500 | | | | 69,180 | |
L Brands, Inc. (b) | | | 500 | | | | 47,990 | |
Liberty Interactive Corp. (b)(c) | | | 1,952 | | | | 53,419 | |
Macy’s, Inc. (b) | | | 500 | | | | 25,490 | |
Netflix, Inc. (b)(c) | | | 6,800 | | | | 736,984 | |
Nordstrom, Inc. (b) | | | 3,000 | | | | 195,630 | |
O’Reilly Automotive, Inc. (b)(c) | | | 1,034 | | | | 285,653 | |
Priceline Group, Inc. (b)(c) | | | 100 | | | | 145,424 | |
Sears Holdings Corp. (b)(c) | | | 200 | | | | 4,674 | |
Signet Jewelers Ltd. (a)(b) | | | 1,000 | | | | 150,940 | |
Target Corp. (b) | | | 1,200 | | | | 92,616 | |
Tiffany & Co. (b) | | | 2,900 | | | | 239,076 | |
TripAdvisor, Inc. (b)(c) | | | 3,500 | | | | 293,230 | |
Ulta Salon Cosmetics & Fragrance, Inc. (b)(c) | | | 100 | | | | 17,396 | |
Williams-Sonoma, Inc. (b) | | | 2,390 | | | | 176,262 | |
| | | | | | | | |
| | | | | | | 5,054,907 | |
| �� | | | | | | | |
| | | | |
| | The accompanying footnotes are an integral part of these Schedules of Investments. | | (Continued) |
| | | | | | | | | | | | | | | | |
| | Stone Ridge Funds | | | | | | Annual Report | | | | | | October 31, 2015 | | |
| | | | | | | | | | |
29
| | |
| Schedule of Investments | | as of October 31, 2015 |
| | | | |
| STONE RIDGE U.S. LARGE CAP VARIANCE RISK PREMIUM FUND | | | | |
| | | | | | | | |
| | | SHARES | | | FAIR
VALUE | |
| Semiconductors & Semiconductor Equipment - 0.5% | |
Advanced Micro Devices, Inc. (b)(c) | | | 46,969 | | | $ | 99,574 | |
Analog Devices, Inc. (b) | | | 500 | | | | 30,060 | |
Applied Materials, Inc. (b) | | | 7,700 | | | | 129,129 | |
Avago Technologies Ltd. (b) | | | 2,200 | | | | 270,886 | |
Broadcom Corp. (b) | | | 1,200 | | | | 61,680 | |
Cree, Inc. (b)(c) | | | 5,500 | | | | 138,545 | |
First Solar, Inc. (b)(c) | | | 4,200 | | | | 239,694 | |
Intel Corp. (b) | | | 1,800 | | | | 60,948 | |
Linear Technology Corp. (b) | | | 600 | | | | 26,652 | |
Marvell Technology Group Ltd. (a)(b) | | | 12,000 | | | | 98,520 | |
Micron Technology, Inc. (b)(c) | | | 6,600 | | | | 109,296 | |
NVIDIA Corp. (b) | | | 11,800 | | | | 334,766 | |
Skyworks Solutions, Inc. (b) | | | 1,600 | | | | 123,584 | |
Texas Instruments, Inc. (b) | | | 3,400 | | | | 192,848 | |
| | | | | | | | |
| | | | | | | 1,916,182 | |
| | | | | | | | |
| Software & Services - 1.5% | |
Accenture PLC (a)(b) | | | 300 | | | | 32,160 | |
Activision Blizzard, Inc. (b) | | | 8,600 | | | | 298,936 | |
Adobe Systems, Inc. (b)(c) | | | 3,300 | | | | 292,578 | |
Akamai Technologies, Inc. (b)(c) | | | 200 | | | | 12,164 | |
Alphabet, Inc. - Class A (b)(c) | | | 400 | | | | 294,956 | |
Alphabet, Inc. - Class C (b)(c) | | | 501 | | | | 356,116 | |
Autodesk, Inc. (b)(c) | | | 4,400 | | | | 242,836 | |
Automatic Data Processing, Inc. (b) | | | 100 | | | | 8,699 | |
Blackhawk Network Holdings, Inc. (b)(c) | | | 887 | | | | 37,768 | |
CDK Global, Inc. (b) | | | 33 | | | | 1,643 | |
Cognizant Technology Solutions Corp. (b)(c) | | | 400 | | | | 27,244 | |
Computer Sciences Corp. (b) | | | 500 | | | | 33,295 | |
eBay, Inc. (b)(c) | | | 3,104 | | | | 86,602 | |
Electronic Arts, Inc. (b)(c) | | | 3,600 | | | | 259,452 | |
Facebook, Inc. (b)(c) | | | 3,000 | | | | 305,910 | |
Fidelity National Information Services, Inc. (b) | | | 3,400 | | | | 247,928 | |
FireEye, Inc. (b)(c) | | | 1,300 | | | | 33,995 | |
Fiserv, Inc. (b)(c) | | | 1,000 | | | | 96,510 | |
FleetCor Technologies, Inc. (b)(c) | | | 1,600 | | | | 231,776 | |
International Business Machines Corp. (b) | | | 400 | | | | 56,032 | |
Intuit, Inc. (b) | | | 500 | | | | 48,715 | |
Jack Henry & Associates, Inc. (b) | | | 500 | | | | 38,670 | |
LinkedIn Corp. (b)(c) | | | 100 | | | | 24,087 | |
MasterCard, Inc. (b) | | | 2,500 | | | | 247,475 | |
Microsoft Corp. (b) | | | 700 | | | | 36,848 | |
NetSuite, Inc. (b)(c) | | | 100 | | | | 8,507 | |
Oracle Corp. (b) | | | 3,000 | | | | 116,520 | |
Pandora Media, Inc. (b)(c) | | | 7,200 | | | | 82,872 | |
PayPal Holdings, Inc. (b)(c) | | | 3,104 | | | | 111,775 | |
Rackspace Hosting, Inc. (b)(c) | | | 2,700 | | | | 69,795 | |
Red Hat, Inc. (b)(c) | | | 2,800 | | | | 221,508 | |
Salesforce.com, Inc. (b)(c) | | | 3,700 | | | | 287,527 | |
Splunk, Inc. (b)(c) | | | 4,400 | | | | 247,104 | |
Tableau Software, Inc. (b)(c) | | | 2,800 | | | | 235,088 | |
Twitter, Inc. (b)(c) | | | 5,912 | | | | 168,256 | |
Ultimate Software Group, Inc. (b)(c) | | | 1,401 | | | | 286,294 | |
Vantiv, Inc. (b)(c) | | | 900 | | | | 45,135 | |
VeriSign, Inc. (b)(c) | | | 300 | | | | 24,180 | |
Visa, Inc. (b) | | | 1,200 | | | | 93,096 | |
| | | | | | | | |
| | | SHARES | | | FAIR
VALUE | |
| Software & Services - 1.5% (continued) | |
VMware, Inc. (b)(c) | | | 1,200 | | | $ | 72,180 | |
Workday, Inc. (b)(c) | | | 505 | | | | 39,880 | |
Yahoo!, Inc. (b)(c) | | | 2,400 | | | | 85,488 | |
Yelp, Inc. (b)(c) | | | 2,000 | | | | 44,500 | |
Zillow Group, Inc. - Class A (b)(c) | | | 3,300 | | | | 101,673 | |
Zillow Group, Inc. - Class C (b)(c) | | | 4,400 | | | | 121,836 | |
Zynga, Inc. (b)(c) | | | 3,600 | | | | 8,532 | |
| | | | | | | | |
| | | | | | | 5,824,141 | |
| | | | | | | | |
| Technology Hardware & Equipment - 0.6% | |
3D Systems Corp. (b)(c) | | | 3,000 | | | | 30,180 | |
Amphenol Corp. (b) | | | 200 | | | | 10,844 | |
Apple, Inc. (b) | | | 1,300 | | | | 155,350 | |
Cisco Systems, Inc. (b) | | | 3,300 | | | | 95,205 | |
Corning, Inc. (b) | | | 9,600 | | | | 178,560 | |
EMC Corp. (b) | | | 6,100 | | | | 159,942 | |
F5 Networks, Inc. (b)(c) | | | 2,200 | | | | 242,440 | |
Hewlett-Packard Co. (b) | | | 3,158 | | | | 85,140 | |
IPG Photonics Corp. (b)(c) | | | 1,600 | | | | 132,192 | |
Juniper Networks, Inc. (b) | | | 7,100 | | | | 222,869 | |
Keysight Technologies, Inc. (b)(c) | | | 2,050 | | | | 67,814 | |
NetApp, Inc. (b) | | | 6,000 | | | | 204,000 | |
Palo Alto Networks, Inc. (b)(c) | | | 1,600 | | | | 257,600 | |
QUALCOMM, Inc. (b) | | | 2,500 | | | | 148,550 | |
SanDisk Corp. (b) | | | 3,000 | | | | 231,000 | |
Stratasys Ltd. (a)(b)(c) | | | 1,700 | | | | 43,350 | |
Western Digital Corp. (b) | | | 1,600 | | | | 106,912 | |
| | | | | | | | |
| | | | | | | 2,371,948 | |
| | | | | | | | |
| Telecommunication Services - 0.1% | |
AT&T, Inc. (b) | | | 4,502 | | | | 150,862 | |
Sprint Corp. (b)(c) | | | 17,000 | | | | 80,410 | |
T-Mobile US, Inc. (b)(c) | | | 1,600 | | | | 60,624 | |
Verizon Communications, Inc. (b) | | | 3,500 | | | | 164,080 | |
| | | | | | | | |
| | | | | | | 455,976 | |
| | | | | | | | |
| Transportation - 0.4% | |
Alaska Air Group, Inc. (b) | | | 1,400 | | | | 106,750 | |
American Airlines Group, Inc. (b) | | | 400 | | | | 18,488 | |
CSX Corp. (b) | | | 900 | | | | 24,291 | |
Delta Air Lines, Inc. (b) | | | 6,500 | | | | 330,460 | |
FedEx Corp. (b) | | | 400 | | | | 62,420 | |
Hertz Global Holdings, Inc. (b)(c) | | | 6,100 | | | | 118,950 | |
Kansas City Southern (b) | | | 300 | | | | 24,828 | |
Norfolk Southern Corp. (b) | | | 1,200 | | | | 96,036 | |
Southwest Airlines Co. (b) | | | 4,000 | | | | 185,160 | |
Spirit Airlines, Inc. (b)(c) | | | 3,298 | | | | 122,422 | |
Union Pacific Corp. (b) | | | 1,700 | | | | 151,895 | |
United Continental Holdings, Inc. (b)(c) | | | 5,000 | | | | 301,550 | |
United Parcel Service, Inc. (b) | | | 300 | | | | 30,906 | |
| | | | | | | | |
| | | | | | | 1,574,156 | |
| | | | | | | | |
| Utilities - 0.2% | |
CenterPoint Energy, Inc. (b) | | | 3,900 | | | | 72,345 | |
Dominion Resources, Inc. (b) | | | 2,600 | | | | 185,718 | |
Duke Energy Corp. (b) | | | 2,200 | | | | 157,234 | |
NextEra Energy, Inc. (b) | | | 300 | | | | 30,798 | |
Sempra Energy (b) | | | 300 | | | | 30,723 | |
| | | | |
| | The accompanying footnotes are an integral part of these Schedules of Investments. | | (Continued) |
| | | | | | | | | | | | | | | | |
| | Stone Ridge Funds | | | | | | Annual Report | | | | | | October 31, 2015 | | |
| | | | | | | | | | |
30
| | |
| Schedule of Investments | | as of October 31, 2015 |
| | | | |
| STONE RIDGE U.S. LARGE CAP VARIANCE RISK PREMIUM FUND | | | | |
| | | | | | | | |
| | | SHARES | | | FAIR
VALUE | |
| Utilities - 0.2% (continued) | |
Southern Co. (b) | | | 2,500 | | | $ | 112,750 | |
| | | | | | | | |
| | | | | | | 589,568 | |
| | | | | | | | |
TOTAL COMMON STOCKS
(Cost $39,610,112) | | | | | | | 47,852,048 | |
| | | | | | | | |
|
| CONTINGENT VALUE RIGHTS - 0.0% | |
| | | | | | | | |
| Food and Staples Retailing - 0.0% | |
Safeway Casa Ley (c)(d)(e) (Cost: $0; Original Acquisition Date: 05/14/2013) | | | 5,400 | | | | 5,480 | |
Safeway PDC (c)(d)(e) (Cost: $0; Original Acquisition Date: 05/14/2013) | | | 5,400 | | | | 264 | |
| | | | | | | | |
TOTAL CONTINGENT VALUE RIGHTS
(Cost $0) | | | | | | | 5,744 | |
| | | | | | | | |
|
| REAL ESTATE INVESTMENT TRUSTS - 0.3% | |
| | | | | | | | |
| Real Estate - 0.3% | |
American Capital Agency Corp. (b) | | | 1,000 | | | | 17,830 | |
American Tower Corp. (b) | | | 300 | | | | 30,669 | |
Annaly Capital Management, Inc. (b) | | | 12,600 | | | | 125,370 | |
AvalonBay Communities, Inc. (b) | | | 400 | | | | 69,932 | |
Boston Properties, Inc. (b) | | | 100 | | | | 12,585 | |
Crown Castle International Corp. (b) | | | 100 | | | | 8,546 | |
Digital Realty Trust, Inc. (b) | | | 400 | | | | 29,584 | |
Equinix, Inc. (b) | | | 1,200 | | | | 356,016 | |
Equity Residential (b) | | | 1,100 | | | | 85,052 | |
Iron Mountain, Inc. (b) | | | 1,700 | | | | 52,088 | |
Lamar Advertising Co. (b) | | | 100 | | | | 5,643 | |
LaSalle Hotel Properties (b) | | | 12 | | | | 353 | |
Prologis, Inc. (b) | | | 700 | | | | 29,911 | |
Public Storage (b) | | | 200 | | | | 45,892 | |
Seritage Growth Properties (b)(c) | | | 100 | | | | 4,213 | |
Simon Property Group, Inc. (b) | | | 100 | | | | 20,146 | |
Urban Edge Properties (b) | | | 300 | | | | 7,122 | |
Vornado Realty Trust (b) | | | 300 | | | | 30,165 | |
Weyerhaeuser Co. (b) | | | 3,000 | | | | 87,990 | |
WP GLIMCHER, Inc. (b) | | | 600 | | | | 6,972 | |
| | | | | | | | |
TOTAL REAL ESTATE INVESTMENT TRUSTS
(Cost $792,931) | | | | 1,026,079 | |
| | | | | | | | |
| | | | | | | | |
| INVESTMENT COMPANY - 0.0% | |
| | | | | | | | |
| Business Development Company - 0.0% | |
| | | | | | | | |
| Closed-End Mutual Funds - 0.0% | |
American Capital Ltd. (c) | | | 800 | | | | 10,232 | |
| | | | | | | | |
TOTAL INVESTMENT COMPANY
(Cost $10,745) | | | | | | | 10,232 | |
| | | | | | | | |
| | | | | | | | |
| RIGHTS - 0.0% | |
| | | | | | | | |
| Health Care Equipment & Services - 0.0% | |
Community Health Systems, Inc. (c) | | | 1,000 | | | | 10 | |
| | | | | | | | |
TOTAL RIGHTS
(Cost $0) | | | | | | | 10 | |
| | | | | | | | |
| | | | | | | | |
| | | SHARES | | | FAIR
VALUE | |
| SHORT-TERM INVESTMENTS - 87.6% | |
| | | | | | | | |
| Money Market Funds - 0.1% | |
Fidelity Institutional Money Market Fund - Money Market Portfolio - Institutional Class - 0.12% (f) | | | 71,132 | | | $ | 71,132 | |
First American Government Obligations Fund - Class Z - 0.01% (f) | | | 71,131 | | | | 71,131 | |
First American Prime Obligations Fund - Class Z - 0.06% (f) | | | 71,131 | | | | 71,131 | |
Short Term Investments Trust - Liquid Assets Portfolio - Institutional Class - 0.16% (f) | | | 71,132 | | | | 71,132 | |
Short Term Investments Trust - Treasury Portfolio - Institutional Class - 0.02% (f) | | | 71,132 | | | | 71,132 | |
| | | | | | | | |
| | | | | | | 355,658 | |
| | | | | | | | |
| | |
| | | PRINCIPAL
AMOUNT | | | FAIR
VALUE | |
| U.S. Treasury Bills - 87.5% | |
0.029%, 11/05/2015 (g)(h) | | $ | 21,050,000 | | | | 21,049,931 | |
0.076%, 11/12/2015 (g)(h) | | | 38,900,000 | | | | 38,899,098 | |
0.095%, 11/19/2015 (g)(h) | | | 29,100,000 | | | | 29,098,627 | |
0.050%, 12/03/2015 (g)(h) | | | 57,150,000 | | | | 57,147,453 | |
0.012%, 12/10/2015 (g)(h) | | | 24,150,000 | | | | 24,149,689 | |
0.040%, 12/17/2015 (g)(h) | | | 22,150,000 | | | | 22,148,871 | |
0.055%, 12/24/2015 (g)(h) | | | 33,900,000 | | | | 33,897,255 | |
0.066%, 01/07/2016 (g)(h) | | | 40,300,000 | | | | 40,295,204 | |
0.000%, 01/21/2016 (g)(h) | | | 23,650,000 | | | | 23,646,784 | |
(0.005%), 02/04/2016 (g)(h) | | | 27,450,000 | | | | 27,443,330 | |
0.000%, 02/11/2016 (g)(h) | | | 13,700,000 | | | | 13,697,219 | |
| | | | | | | | |
| | | | | | | 331,473,461 | |
| | | | | | | | |
TOTAL SHORT-TERM INVESTMENTS
(Cost $331,842,205) | | | | | | | 331,829,119 | |
| | | | | | | | |
TOTAL INVESTMENTS
(Cost $372,255,993) - 100.5% | | | | | | | 380,723,232 | |
| | | | | | | | |
LIABILITIES IN EXCESS OF OTHER
ASSETS - (0.5)% | | | | | (1,973,163) | |
| | | | | | | | |
| TOTAL NET ASSETS - 100.0% | | | | | $378,750,069 | |
| | | | | | | | |
Percentages are stated as a percent of net assets.
PLC – Public Limited Company
| (a) | Foreign issued security. Total foreign securities are $2,404,635, which represents 0.6% of net assets. |
| (b) | All or portion of this security may be subject to call options written. |
| (c) | Non-income producing security. |
| (d) | Security is restricted to resale. The aggregate value of these securities at October 31, 2015 was $5,744, which represents 0.0% of net assets. |
| (e) | Security is fair valued by the Adviser pursuant to procedures approved by the Board of Trustees. The aggregate value of these securities is $5,744, which represents 0.0% of net assets. |
| (f) | Rate shown is the 7-day effective yield. |
| (g) | Rate shown is the effective yield based on purchased price. The calculation assumes the security is held to maturity. |
| (h) | All or portion of this security is held as collateral for put options written. |
| | | | |
| | The accompanying footnotes are an integral part of these Schedules of Investments. | | (Continued) |
| | | | | | | | | | | | | | | | |
| | Stone Ridge Funds | | | | | | Annual Report | | | | | | October 31, 2015 | | |
| | | | | | | | | | |
31
| | |
| Schedule of Investments | | as of October 31, 2015 |
| | | | |
| STONE RIDGE U.S. LARGE CAP VARIANCE RISK PREMIUM FUND | | | | |
Written Options
| | | | | | | | |
| DESCRIPTION | | NUMBER OF
CONTRACTS | | | FAIR
VALUE | |
| | |
CALL OPTIONS | | | | | | | | |
Akamai Technologies, Inc., Expires 11/06/2015, Strike Price $66.50 | | | 1 | | | $ | 4 | |
Alphabet, Inc., Expires 11/06/2015, Strike Price $752.50 | | | 2 | | | | 50 | |
Alphabet, Inc., Expires 11/06/2015, Strike Price $775.00 | | | 1 | | | | 33 | |
Alphabet, Inc., Expires 11/06/2015, Strike Price $780.00 | | | 1 | | | | 20 | |
Alphabet, Inc., Expires 11/06/2015, Strike Price $785.00 | | | 1 | | | | 18 | |
American Airlines Group, Inc., Expires 11/06/2015, Strike Price $49.50 | | | 2 | | | | 8 | |
American Airlines Group, Inc., Expires 11/06/2015, Strike Price $50.00 | | | 2 | | | | 6 | |
American Express Co., Expires 11/06/2015, Strike Price $77.00 | | | 2 | | | | 5 | |
Anadarko Petroleum Corp., Expires 11/06/2015, Strike Price $71.50 | | | 12 | | | | 228 | |
Apple, Inc., Expires 11/06/2015, Strike Price $124.00 | | | 3 | | | | 57 | |
Apple, Inc., Expires 11/06/2015, Strike Price $125.00 | | | 1 | | | | 14 | |
Applied Materials, Inc., Expires 11/06/2015, Strike Price $17.00 | | | 10 | | | | 130 | |
Athenahealth, Inc., Expires 11/06/2015, Strike Price $170.00 | | | 8 | | | | 100 | |
Athenahealth, Inc., Expires 11/06/2015, Strike Price $175.00 | | | 2 | | | | 50 | |
Avago Technologies Ltd., Expires 11/06/2015, Strike Price $137.00 | | | 3 | | | | 67 | |
Avago Technologies Ltd., Expires 11/06/2015, Strike Price $143.00 | | | 2 | | | | 15 | |
Baxter International, Inc., Expires 11/06/2015, Strike Price $38.50 | | | 4 | | | | 84 | |
Best Buy Co., Inc., Expires 11/06/2015, Strike Price $36.50 | | | 13 | | | | 104 | |
Boeing Co., Expires 11/06/2015, Strike Price $155.00 | | | 12 | | | | 54 | |
Bristol-Myers Squibb Co., Expires 11/06/2015, Strike Price $70.50 | | | 10 | | | | 40 | |
Bristol-Myers Squibb Co., Expires 11/06/2015, Strike Price $71.00 | | | 10 | | | | 30 | |
Bristol-Myers Squibb Co., Expires 11/06/2015, Strike Price $72.00 | | | 10 | | | | 20 | |
Broadcom Corp., Expires 11/06/2015, Strike Price $52.50 | | | 6 | | | | 135 | |
Caterpillar, Inc., Expires 11/06/2015, Strike Price $74.50 | | | 4 | | | | 178 | |
Caterpillar, Inc., Expires 11/06/2015, Strike Price $75.50 | | | 4 | | | | 84 | |
Caterpillar, Inc., Expires 11/06/2015, Strike Price $76.00 | | | 4 | | | | 54 | |
CBOE S&P 500, Expires 11/06/2015, Strike Price $2120.00 | | | 100 | | | | 11,000 | |
CBOE S&P 500, Expires 11/06/2015, Strike Price $2125.00 | | | 100 | | | | 8,000 | |
Cisco Systems, Inc., Expires 11/06/2015, Strike Price $30.00 | | | 23 | | | | 57 | |
Coach, Inc., Expires 11/06/2015, Strike Price $32.50 | | | 11 | | | | 55 | |
Comcast Corp., Expires 11/06/2015, Strike Price $65.50 | | | 27 | | | | 81 | |
Cummins, Inc., Expires 11/06/2015, Strike Price $110.00 | | | 12 | | | | 60 | |
Dow Chemical Co., Expires 11/06/2015, Strike Price $53.00 | | | 24 | | | | 468 | |
DR Horton, Inc., Expires 11/06/2015, Strike Price $30.50 | | | 3 | | | | 46 | |
E*Trade Financial Corp., Expires 11/06/2015, Strike Price $29.50 | | | 5 | | | | 70 | |
EI Du Pont de Nemours & Co., Expires 11/06/2015, Strike Price $65.50 | | | 23 | | | | 253 | |
Express Scripts Holding Co., Expires 11/06/2015, Strike Price $90.00 | | | 19 | | | | 665 | |
Freeport-McMoRan, Inc., Expires 11/06/2015, Strike Price $13.00 | | | 30 | | | | 195 | |
Gap, Inc., Expires 11/06/2015, Strike Price $28.00 | | | 6 | | | | 78 | |
General Motors Co., Expires 11/06/2015, Strike Price $36.50 | | | 17 | | | | 93 | |
Juniper Networks, Inc., Expires 11/06/2015, Strike Price $33.00 | | | 33 | | | | 198 | |
Kinder Morgan, Inc., Expires 11/06/2015, Strike Price $29.00 | | | 2 | | �� | | 8 | |
Macy’s, Inc., Expires 11/06/2015, Strike Price $51.50 | | | 1 | | | | 87 | |
Mallinckrodt PLC, Expires 11/06/2015, Strike Price $79.50 | | | 4 | | | | 140 | |
Marvell Technology Group Ltd., Expires 11/06/2015, Strike Price $9.00 | | | 110 | | | | 440 | |
McDonald’s Corp., Expires 11/06/2015, Strike Price $116.00 | | | 6 | | | | 60 | |
Merck & Co., Inc., Expires 11/06/2015, Strike Price $57.50 | | | 2 | | | | 6 | |
Microsoft Corp., Expires 11/06/2015, Strike Price $56.50 | | | 2 | | | | 5 | |
Netflix, Inc., Expires 11/06/2015, Strike Price $110.00 | | | 2 | | | | 327 | |
Nucor Corp., Expires 11/06/2015, Strike Price $44.00 | | | 8 | | | | 76 | |
Nucor Corp., Expires 11/06/2015, Strike Price $44.50 | | | 7 | | | | 49 | |
Oracle Corp., Expires 11/06/2015, Strike Price $39.50 | | | 22 | | | | 286 | |
Palo Alto Networks, Inc., Expires 11/06/2015, Strike Price $165.00 | | | 2 | | | | 365 | |
Palo Alto Networks, Inc., Expires 11/06/2015, Strike Price $170.00 | | | 4 | | | | 270 | |
Palo Alto Networks, Inc., Expires 11/06/2015, Strike Price $175.00 | | | 2 | | | | 45 | |
| | | | |
| | The accompanying footnotes are an integral part of these Schedules of Investments. | | (Continued) |
| | | | | | | | | | | | | | | | |
| | Stone Ridge Funds | | | | | | Annual Report | | | | | | October 31, 2015 | | |
| | | | | | | | | | |
32
| | |
| Schedule of Investments | | as of October 31, 2015 |
| | | | |
| STONE RIDGE U.S. LARGE CAP VARIANCE RISK PREMIUM FUND | | | | |
| | | | | | | | |
| DESCRIPTION | | NUMBER OF
CONTRACTS | | | FAIR
VALUE | |
| | |
CALL OPTIONS (continued) | | | | | | | | |
Pfizer, Inc., Expires 11/06/2015, Strike Price $36.00 | | | 49 | | | $ | 196 | |
Philip Morris International, Inc., Expires 11/06/2015, Strike Price $90.50 | | | 2 | | | | 25 | |
Procter & Gamble Co., Expires 11/06/2015, Strike Price $80.00 | | | 9 | | | | 104 | |
Rite Aid Corp., Expires 11/06/2015, Strike Price $6.50 | | | 20 | | | | 2,800 | |
Rite Aid Corp., Expires 11/06/2015, Strike Price $7.00 | | | 10 | | | | 875 | |
Southwest Airlines Co., Expires 11/06/2015, Strike Price $47.50 | | | 24 | | | | 720 | |
Splunk, Inc., Expires 11/06/2015, Strike Price $58.00 | | | 2 | | | | 130 | |
Target Corp., Expires 11/06/2015, Strike Price $77.50 | | | 4 | | | | 282 | |
Texas Instruments, Inc., Expires 11/06/2015, Strike Price $60.00 | | | 10 | | | | 110 | |
T-Mobile US, Inc., Expires 11/06/2015, Strike Price $39.50 | | | 9 | | | | 225 | |
Trinity Industries, Inc., Expires 11/06/2015, Strike Price $28.50 | | | 20 | | | | 250 | |
Twitter, Inc., Expires 11/06/2015, Strike Price $31.50 | | | 49 | | | | 392 | |
Under Armour, Inc., Expires 11/06/2015, Strike Price $104.00 | | | 3 | | | | 38 | |
Union Pacific Corp., Expires 11/06/2015, Strike Price $95.00 | | | 6 | | | | 36 | |
Union Pacific Corp., Expires 11/06/2015, Strike Price $95.50 | | | 3 | | | | 14 | |
Union Pacific Corp., Expires 11/06/2015, Strike Price $96.00 | | | 6 | | | | 18 | |
United Continental Holdings, Inc., Expires 11/06/2015, Strike Price $65.00 | | | 15 | | | | 105 | |
United Continental Holdings, Inc., Expires 11/06/2015, Strike Price $65.50 | | | 10 | | | | 55 | |
United Continental Holdings, Inc., Expires 11/06/2015, Strike Price $66.50 | | | 10 | | | | 30 | |
United Parcel Service, Inc., Expires 11/06/2015, Strike Price $106.00 | | | 2 | | | | 18 | |
United Rentals, Inc., Expires 11/06/2015, Strike Price $78.00 | | | 4 | | | | 170 | |
United Rentals, Inc., Expires 11/06/2015, Strike Price $79.00 | | | 8 | | | | 200 | |
United Rentals, Inc., Expires 11/06/2015, Strike Price $80.00 | | | 8 | | | | 200 | |
United Technologies Corp., Expires 11/06/2015, Strike Price $102.00 | | | 9 | | | | 81 | |
United Technologies Corp., Expires 11/06/2015, Strike Price $103.00 | | | 2 | | | | 20 | |
UnitedHealth Group, Inc., Expires 11/06/2015, Strike Price $123.00 | | | 1 | | | | 32 | |
VMware, Inc., Expires 11/06/2015, Strike Price $70.00 | | | 7 | | | | 175 | |
Western Digital Corp., Expires 11/06/2015, Strike Price $73.00 | | | 4 | | | | 58 | |
Western Digital Corp., Expires 11/06/2015, Strike Price $74.00 | | | 4 | | | | 104 | |
Western Digital Corp., Expires 11/06/2015, Strike Price $74.50 | | | 4 | | | | 102 | |
Western Digital Corp., Expires 11/06/2015, Strike Price $75.00 | | | 4 | | | | 102 | |
Yahoo!, Inc., Expires 11/06/2015, Strike Price $36.50 | | | 16 | | | | 504 | |
| | | | | | | | |
TOTAL CALL OPTIONS
(Premiums Received $46,278) | | | | | | | 33,242 | |
| | | | | | | | |
| | | | | | | | |
PUT OPTIONS | | | | | | | | |
CBOE S&P 500, Expires 11/06/2015, Strike Price $2080.00 | | | 174 | | | | 270,744 | |
CBOE S&P 500, Expires 11/06/2015, Strike Price $2085.00 | | | 1,111 | | | | 1,944,250 | |
CBOE S&P 500, Expires 11/06/2015, Strike Price $2090.00 | | | 139 | | | | 269,660 | |
NASDAQ 100, Expires 11/06/2015, Strike Price $4660.00 | | | 40 | | | | 155,000 | |
| | | | | | | | |
TOTAL PUT OPTIONS
(Premiums Received $2,104,837) | | | | | | | 2,639,654 | |
| | | | | | | | |
TOTAL WRITTEN OPTIONS
(Premiums Received $2,151,115) | | | | | | $ | 2,672,896 | |
| | | | | | | | |
| | | | |
| | The accompanying footnotes are an integral part of these Schedules of Investments. | | |
| | | | | | | | | | | | | | | | |
| | Stone Ridge Funds | | | | | | Annual Report | | | | | | October 31, 2015 | | |
| | | | | | | | | | |
33
| | |
| Schedule of Investments | | as of October 31, 2015 |
| | | | |
| STONE RIDGE U.S. SMALL CAP VARIANCE RISK PREMIUM FUND | | | | |
| | | | | | | | |
| | | SHARES | | | FAIR VALUE | |
| COMMON STOCKS - 2.5% | | | | | | |
| | | | | | | | |
| Automobiles & Components - 0.1% | | | | | | |
Dana Holding Corp. (a) | | | 2,400 | | | $ | 40,320 | |
Federal-Mogul Holdings Corp. (a)(b) | | | 2,600 | | | | 20,150 | |
Tower International, Inc. (a)(b) | | | 2,100 | | | | 57,687 | |
| | | | | | | | |
| | | | | | | 118,157 | |
| | | | | | | | |
| Banks - 0.0% | | | | | | |
PacWest Bancorp (a) | | | 1,078 | | | | 48,553 | |
| | | | | | | | |
| | | | | | | | |
| Capital Goods - 0.1% | | | | | | |
Capstone Turbine Corp. (a)(b) | | | 20,000 | | | | 4,100 | |
PowerSecure International, Inc. (a)(b) | | | 6,300 | | | | 78,498 | |
Wabash National Corp. (a)(b) | | | 4,200 | | | | 50,274 | |
| | | | | | | | |
| | | | | | | 132,872 | |
| | | | | | | | |
| Commercial & Professional Services - 0.1% | | | | |
WageWorks, Inc. (a)(b) | | | 1,100 | | | | 52,822 | |
| | | | | | | | |
| | | | | | | | |
| Consumer Durables & Apparel - 0.2% | | | | | | |
Crocs, Inc. (a)(b) | | | 3,300 | | | | 35,640 | |
JAKKS Pacific, Inc. (a)(b) | | | 8,600 | | | | 68,112 | |
Nautilus, Inc. (a)(b) | | | 6,800 | | | | 115,872 | |
| | | | | | | | |
| | | | | | | 219,624 | |
| | | | | | | | |
| Consumer Services - 0.1% | | | | | | |
Boyd Gaming Corp. (a)(b) | | | 3,700 | | | | 73,963 | |
Bridgepoint Education, Inc. (a)(b) | | | 2,164 | | | | 16,771 | |
| | | | | | | | |
| | | | | | | 90,734 | |
| | | | | | | | |
| Energy - 0.0% | | | | | | |
CARBO Ceramics, Inc. (a) | | | 500 | | | | 8,760 | |
Goodrich Petroleum Corp. (a)(b) | | | 2,300 | | | | 1,380 | |
McDermott International, Inc. (a)(b)(c) | | | 6,300 | | | | 29,043 | |
Penn Virginia Corp. (a)(b) | | | 3,600 | | | | 2,228 | |
| | | | | | | | |
| | | | | | | 41,411 | |
| | | | | | | | |
| Food, Beverage & Tobacco - 0.0% | | | | | | |
Boulder Brands, Inc. (a)(b) | | | 2,800 | | | | 24,808 | |
| | | | | | | | |
| | | | | | | | |
| Health Care Equipment & Services - 0.4% | | | | |
Abaxis, Inc. (a) | | | 1,100 | | | | 55,231 | |
Air Methods Corp. (a)(b) | | | 1,100 | | | | 45,023 | |
Anika Therapeutics, Inc. (a)(b) | | | 2,000 | | | | 77,040 | |
DexCom, Inc. (a)(b) | | | 1,700 | | | | 141,644 | |
Medidata Solutions, Inc. (a)(b) | | | 1,000 | | | | 43,000 | |
Orthofix International NV (a)(b)(c) | | | 1,900 | | | | 64,695 | |
Rockwell Medical, Inc. (a)(b) | | | 9,200 | | | | 106,536 | |
| | | | | | | | |
| | | | | | | 533,169 | |
| | | | | | | | |
| Materials - 0.1% | | | | | | |
Century Aluminum Co. (a)(b) | | | 5,200 | | | | 18,824 | |
Compass Minerals International, Inc. (a) | | | 600 | | | | 48,744 | |
Hecla Mining Co. (a) | | | 13,600 | | | | 28,152 | |
Intrepid Potash, Inc. (a)(b) | | | 3,500 | | | | 13,510 | |
| | | | | | | | |
| | | | | | | 109,230 | |
| | | | | | | | |
| Media - 0.1% | | | | | | |
Entravision Communications Corp. (a) | | | 7,700 | | | | 67,452 | |
Sizmek, Inc. (a)(b) | | | 3,800 | | | | 22,534 | |
World Wrestling Entertainment, Inc. (a) | | | 4,500 | | | | 80,235 | |
| | | | | | | | |
| | | | | | 170,221 | |
| | | | | | | | |
| | | | | | | | |
| | | SHARES | | | FAIR VALUE | |
| Pharmaceuticals, Biotechnology & Life Sciences - 0.6% | |
ACADIA Pharmaceuticals, Inc. (a)(b) | | | 2,100 | | | $ | 73,122 | |
Agios Pharmaceuticals, Inc. (a)(b) | | | 1,500 | | | | 109,290 | |
Endocyte, Inc. (a)(b) | | | 7,800 | | | | 40,092 | |
Halozyme Therapeutics, Inc. (a)(b) | | | 6,700 | | | | 104,855 | |
Insmed, Inc. (a)(b) | | | 4,300 | | | | 85,312 | |
Keryx Biopharmaceuticals, Inc. (a)(b) | | | 3,700 | | | | 16,576 | |
Merrimack Pharmaceuticals, Inc. (a)(b) | | | 7,000 | | | | 65,380 | |
Pernix Therapeutics Holdings, Inc. (a)(b) | | | 8,000 | | | | 22,480 | |
Prothena Corp. PLC (a)(b)(c) | | | 2,400 | | | | 123,624 | |
Retrophin, Inc. (a)(b) | | | 3,800 | | | | 72,694 | |
Sarepta Therapeutics, Inc. (a)(b) | | | 1,900 | | | | 45,714 | |
Vanda Pharmaceuticals, Inc. (a)(b) | | | 4,100 | | | | 44,034 | |
| | | | | | | | |
| | | | | | 803,173 | |
| | | | | | | | |
| Retailing - 0.0% | | | | | | |
Conn’s, Inc. (a)(b) | | | 1,100 | | | | 20,867 | |
| | | | | | | | |
| | | | | | | | |
| Semiconductors & Semiconductor Equipment - 0.2% | |
Cirrus Logic, Inc. (a)(b) | | | 2,600 | | | | 80,158 | |
Integrated Device Technology, Inc. (a)(b) | | | 4,300 | | | | 109,650 | |
SunEdison, Inc. (a)(b) | | | 6,100 | | | | 44,530 | |
SunPower Corp. (a)(b) | | | 2,000 | | | | 53,680 | |
| | | | | | | | |
| | | | | | 288,018 | |
| | | | | | | | |
| Software & Services - 0.2% | | | | | | |
Alliance Data Systems Corp. (a)(b) | | | 147 | | | | 43,705 | |
Bankrate, Inc. (a)(b) | | | 2,600 | | | | 30,862 | |
Gogo, Inc. (a)(b) | | | 2,300 | | | | 32,499 | |
Infoblox, Inc. (a)(b) | | | 2,500 | | | | 40,775 | |
Take-Two Interactive Software, Inc. (a)(b) | | | 2,700 | | | | 89,640 | |
Vringo, Inc. (a)(b) | | | 13,300 | | | | 4,994 | |
WebMD Health Corp. (a)(b) | | | 1,300 | | | | 52,858 | |
| | | | | | | | |
| | | | | | 295,333 | |
| | | | | | | | |
| Technology Hardware & Equipment - 0.1% | | | | |
Cray, Inc. (a)(b) | | | 1,600 | | | | 47,408 | |
Ubiquiti Networks, Inc. (a) | | | 1,700 | | | | 49,606 | |
| | | | | | | | |
| | | | | | 97,014 | |
| | | | | | | | |
| Telecommunication Services - 0.1% | | | | | | |
Inteliquent, Inc. (a) | | | 5,900 | | | | 122,248 | |
| | | | | | | | |
| | | | | | | | |
| Transportation - 0.1% | | | | | | |
Arkansas Best Corp. (a) | | | 2,000 | | | | 51,800 | |
XPO Logistics, Inc. (a)(b) | | | 2,000 | | | | 55,520 | |
| | | | | | | | |
| | | | | | 107,320 | |
| | | | | | | | |
TOTAL COMMON STOCKS
(Cost $2,765,095) | | | | | | | 3,275,574 | |
| | | | | | | | |
| | | | | | | | |
| CONTINGENT VALUE RIGHTS - 0.0% | |
| | | | | | | | |
| Pharmaceuticals, Biotechnology & Life Sciences - 0.0% | |
Furiex Pharmaceuticals, Inc. (b)(d)(e) (Cost: $0; Acquisition Date: 05/23/2014) | | | 500 | | | | 4,885 | |
Trius Therapeutics, Inc. (b)(d)(e) (Cost: $0; Acquisition Date: 08/12/2013) | | | 3,300 | | | | — | |
| | | | | | | | |
| | | | | | | 4,885 | |
| | | | | | | | |
| | | | |
| | The accompanying footnotes are an integral part of these Schedules of Investments. | | (Continued) |
| | | | | | | | | | | | | | | | |
| | Stone Ridge Funds | | | | | | Annual Report | | | | | | October 31, 2015 | | |
| | | | | | | | | | |
34
| | |
| Schedule of Investments | | as of October 31, 2015 |
| | | | |
| STONE RIDGE U.S. SMALL CAP VARIANCE RISK PREMIUM FUND | | | | |
| | | | | | | | |
| | | SHARES | | | FAIR VALUE | |
| Telecommunication Services - 0.0% | | | | | | |
Leap Wireless International, Inc. (b)(d)(e) | | | 2,700 | | | $ | 6,804 | |
| | | | | | | | |
TOTAL CONTINGENT VALUE RIGHTS
(Cost $0) | | | | | | | 11,689 | |
| | | | | | | | |
| | |
| | | PRINCIPAL AMOUNT | | | FAIR VALUE | |
| SHORT TERM INVESTMENTS - 98.4% | |
| | | | | | | | |
| U.S. Treasury Bills - 98.4% | | | | | | |
0.029%, 11/05/2015 (f)(g) | | $ | 17,100,000 | | | | 17,099,945 | |
0.061%, 11/12/2015 (f)(g) | | | 18,850,000 | | | | 18,849,647 | |
0.074%, 11/19/2015 (f)(g) | | | 7,400,000 | | | | 7,399,727 | |
0.051%, 12/03/2015 (f)(g) | | | 17,180,000 | | | | 17,179,222 | |
0.013%, 12/10/2015 (f)(g) | | | 11,750,000 | | | | 11,749,841 | |
0.040%, 12/17/2015 (f)(g) | | | 9,650,000 | | | | 9,649,507 | |
0.055%, 12/24/2015 (f)(g) | | | 10,650,000 | | | | 10,649,140 | |
0.069%, 01/07/2016 (f)(g) | | | 10,150,000 | | | | 10,148,792 | |
0.000%, 01/21/2016 (f)(g) | | | 6,500,000 | | | | 6,499,116 | |
(0.005%), 02/04/2016 (f)(g) | | | 11,000,000 | | | | 10,997,327 | |
0.000%, 02/11/2016 (f)(g) | | | 7,900,000 | | | | 7,898,396 | |
| | | | | | | | |
TOTAL SHORT TERM INVESTMENTS
(Cost $128,125,877) | | | | | | | 128,120,660 | |
| | | | | | | | |
TOTAL INVESTMENTS
(Cost $130,890,972) - 100.9% | | | | | | | 131,407,923 | |
| | | | | | | | |
LIABILITIES IN EXCESS OF OTHER
ASSETS - (0.9)% | | | | | (1,114,836) | |
| | | | | | | | |
| TOTAL NET ASSETS - 100.0% | | | | | $130,293,087 | |
| | | | | | | | |
Percentages are stated as a percent of net assets.
| (a) | All or portion of this security may be subject to call options written. |
| (b) | Non-income producing security. |
| (c) | Foreign issued security. Total foreign securities are $217,362, which represents 0.2% of net assets. |
| (d) | Security is restricted to resale. The aggregate value of these securities at October 31, 2015 was $11,689, which represents 0.0% of net assets. |
| (e) | Security is fair valued by the Adviser pursuant to procedures approved by the Board of Trustees. The aggregate value of these securities is $11,689, which represents 0.0% of net assets. |
| (f) | Rate shown is the effective yield based on purchase price. The calculation assumes the security is held to maturity. |
| (g) | All or portion of this security is held as collateral for put options written. |
Written Options
| | | | | | | | |
| DESCRIPTION | | NUMBER OF
CONTRACTS | | | FAIR VALUE | |
| | |
| CALL OPTIONS | | | | | | |
CBOE Russell 2000 Index, Expires 11/06/2015, Strike Price $1190.00 | | | 30 | | | $ | 3,030 | |
| | | | | | | | |
TOTAL CALL OPTIONS
(Premiums Received $5,098) | | | | | | | 3,030 | |
| | | | | | | | |
| | | | | | | | |
| PUT OPTIONS | | | | | | |
CBOE Russell 2000 Index, Expires 11/06/2015, Strike Price $1160.00 | | | 350 | | | | 360,500 | |
CBOE Russell 2000 Index, Expires 11/06/2015, Strike Price $1165.00 | | | 698 | | | | 879,480 | |
| | | | | | | | |
TOTAL PUT OPTIONS
(Premiums Received $1,171,311) | | | | | | | 1,239,980 | |
| | | | | | | | |
TOTAL WRITTEN OPTIONS
(Premiums Received $1,176,409) | | | | | | $ | 1,243,010 | |
| | | | | | | | |
| | | | |
| | The accompanying footnotes are an integral part of these Schedules of Investments. | | |
| | | | | | | | | | | | | | | | |
| | Stone Ridge Funds | | | | | | Annual Report | | | | | | October 31, 2015 | | |
| | | | | | | | | | |
35
| | |
| Schedule of Investments | | as of October 31, 2015 |
| | | | |
| STONE RIDGE U.S. VARIANCE RISK PREMIUM MASTER FUND | | | | |
| | | | | | | | |
| | | SHARES | | | FAIR VALUE | |
| INVESTMENT COMPANIES - 99.9% | | | | | | |
| | | | | | | | |
| Open-End Mutual Funds - 99.9% | | | | | | |
Stone Ridge U.S. Large Cap Variance Risk Premium Fund - Class I (a) | | | 12,131,783 | | | $ | 132,115,117 | |
Stone Ridge U.S. Small Cap Variance Risk Premium Fund - Class I (a) | | | 6,335,380 | | | | 66,268,075 | |
| | | | | | | | |
TOTAL INVESTMENT COMPANIES
(Cost $187,717,268) | | | | | | | 198,383,192 | |
| | | | | | | | |
| | | | | | | | |
| SHORT-TERM INVESTMENTS - 0.1% | | | | | | |
| | | | | | | | |
| Money Market Funds - 0.1% | | | | | | |
Fidelity Institutional Money Market Fund - Money Market Portfolio - Institutional Class - 0.12% (b) | | | 49,987 | | | | 49,987 | |
First American Government Obligations Fund - Class Z - 0.01% (b) | | | 49,986 | | | | 49,986 | |
First American Prime Obligations Fund - Class Z - 0.06% (b) | | | 49,987 | | | | 49,987 | |
Short Term Investments Trust - Liquid Assets Portfolio - Institutional Class - 0.16% (b) | | | 49,987 | | | | 49,987 | |
Short Term Investments Trust - Treasury Portfolio - Institutional Class - 0.02% (b) | | | 49,986 | | | | 49,986 | |
| | | | | | | | |
TOTAL SHORT-TERM INVESTMENTS
(Cost $249,933) | | | | | | | 249,933 | |
| | | | | | | | |
TOTAL INVESTMENTS
(Cost $187,967,201) - 100.0% | | | | | | | 198,633,125 | |
| | | | | | | | |
LIABILITIES IN EXCESS OF OTHER
ASSETS - 0.0% | | | | | (39,540) | |
| | | | | | | | |
| TOTAL NET ASSETS - 100.0% | | | | | $198,593,585 | |
| | | | | | | | |
Percentages are stated as a percent of net assets.
| (a) | Affiliated company. See Footnote 10. |
| (b) | Rate shown is the 7-day effective yield. |
| | | | |
| | The accompanying footnotes are an integral part of these Schedules of Investments. | | |
| | | | | | | | | | | | | | | | |
| | Stone Ridge Funds | | | | | | Annual Report | | | | | | October 31, 2015 | | |
| | | | | | | | | | |
36
| | |
| Schedule of Investments | | as of October 31, 2015 |
| | | | |
| STONE RIDGE INTERNATIONAL DEVELOPED MARKETS VARIANCE RISK PREMIUM FUND | | | | |
| | | | | | | | |
| | | SHARES | | | FAIR VALUE | |
| COMMON STOCKS - 0.8% | | | | | | |
| | | | | | | | |
| Automobiles & Components - 0.0% | | | | | | |
Toyota Motor Corp. - ADR | | | 300 | | | $ | 36,786 | |
| | | | | | | | |
| | | | | | | | |
| Banks - 0.1% | | | | | | |
Banco Bilbao Vizcaya Argentaria SA - ADR | | | 403 | | | | 3,474 | |
Banco Santander SA - ADR | | | 800 | | | | 4,432 | |
Barclays PLC - ADR | | | 2,500 | | | | 35,575 | |
HSBC Holdings PLC - ADR | | | 900 | | | | 35,163 | |
| | | | | | | | |
| | | | | | 78,644 | |
| | | | | | | | |
| Capital Goods - 0.0% | | | | | | |
voxeljet AG - ADR (a) | | | 5,200 | | | | 31,668 | |
| | | | | | | | |
| | | | | | | | |
| Consumer Durables & Apparel - 0.1% | | | | | | |
Sony Corp. - ADR (a) | | | 1,600 | | | | 45,440 | |
| | | | | | | | |
| | | | | | | | |
| Consumer Services - 0.0% | | | | | | |
Melco Crown Entertainment Ltd. - ADR | | | 2,100 | | | | 39,333 | |
| | | | | | | | |
| | | | | | | | |
| Diversified Financials - 0.0% | | | | | | |
Credit Suisse Group AG - ADR | | | 1,400 | | | | 35,000 | |
| | | | | | | | |
| | | | | | | | |
| Energy - 0.1% | | | | | | |
BP PLC - ADR | | | 1,200 | | | | 42,840 | |
| | | | | | | | |
| | | | | | | | |
| Food, Beverage & Tobacco - 0.1% | | | | | | |
Anheuser-Busch InBev NV - ADR | | | 400 | | | | 47,732 | |
Diageo PLC - ADR | | | 300 | | | | 34,524 | |
| | | | | | | | |
| | | | | | 82,256 | |
| | | | | | | | |
| Materials - 0.0% | | | | | | |
ArcelorMittal - ADR | | | 3,400 | | | | 19,074 | |
BHP Billiton Ltd. (b) | | | 100 | | | | 1,641 | |
BHP Billiton Ltd. - ADR | | | 100 | | | | 3,289 | |
Rio Tinto PLC - ADR | | | 200 | | | | 7,302 | |
South32 Ltd. (a)(b) | | | 100 | | | | 104 | |
South32 Ltd. - ADR (a) | | | 40 | | | | 206 | |
| | | | | | | | |
| | | | | | 31,616 | |
| | | | | | | | |
| Pharmaceuticals, Biotechnology & Life Sciences - 0.2% | |
AstraZeneca PLC - ADR | | | 1,100 | | | | 35,079 | |
GlaxoSmithKline PLC - ADR | | | 900 | | | | 38,754 | |
GW Pharmaceuticals PLC - ADR (a) | | | 300 | | | | 23,727 | |
Novartis AG - ADR | | | 400 | | | | 36,172 | |
Novo Nordisk A/S - ADR | | | 700 | | | | 37,226 | |
| | | | | | | | |
| | | | | | 170,958 | |
| | | | | | | | |
| Semiconductors & Semiconductor Equipment - 0.0% | |
ASML Holding NV - ADR | | | 400 | | | | 37,116 | |
| | | | | | | | |
| | | | | | | | |
| Software & Services - 0.0% | | | | | | |
SAP SE - ADR | | | 500 | | | | 39,355 | |
| | | | | | | | |
| | | | | | | | |
| Technology Hardware & Equipment - 0.1% | | | | |
Nokia OYJ - ADR | | | 4,900 | | | | 36,358 | |
Telefonaktiebolaget LM Ericsson - ADR | | | 2,800 | | | | 27,272 | |
| | | | | | | | |
| | | | | | | 63,630 | |
| | | | | | | | |
| | | | | | | | |
| | | SHARES | | | FAIR VALUE | |
| Telecommunication Services - 0.1% | | | | | | |
China Mobile Ltd. - ADR | | | 600 | | | $ | 36,186 | |
Orange SA - ADR | | | 2,300 | | | | 40,365 | |
Vodafone Group PLC - ADR (c) | | | 1,200 | | | | 39,564 | |
| | | | | | | | |
| | | | | | 116,115 | |
| | | | | | | | |
| Utilities - 0.0% | | | | | | |
National Grid PLC - ADR | | | 500 | | | | 35,800 | |
| | | | | | | | |
TOTAL COMMON STOCKS
(Cost $979,495) | | | | | | | 886,557 | |
| | | | | | | | |
| | | | | | | | |
| SHORT-TERM INVESTMENTS - 99.1% | | | | | | |
| | | | | | | | |
| Money Market Funds - 64.1% | | | | | | |
Fidelity Institutional Money Market Fund - Money Market Portfolio - Institutional Class - 0.12% (d) | | | 13,880,559 | | | | 13,880,559 | |
First American Government Obligations Fund - Class Z - 0.01% (d) | | | 14,412,545 | | | | 14,412,545 | |
First American Prime Obligations Fund - Class Z - 0.06% (d) | | | 14,412,544 | | | | 14,412,544 | |
Short Term Investments Trust - Liquid Assets Portfolio - Institutional Class - 0.16% (d) | | | 14,412,544 | | | | 14,412,544 | |
Short Term Investments Trust - Treasury Portfolio - Institutional Class - 0.02% (d) | | | 14,412,544 | | | | 14,412,544 | |
| | | | | | | | |
| | | | | | | 71,530,736 | |
| | | | | | | | |
| | |
| | | PRINCIPAL
AMOUNT | | | FAIR VALUE | |
| U.S. Treasury Bills - 35.0% | | | | | | |
0.085%, 11/12/2015 (e)(f) | | $ | 4,100,000 | | | | 4,099,894 | |
0.035%, 11/19/2015 (e)(f) | | | 13,100,000 | | | | 13,099,774 | |
0.055%, 12/3/2015 (e)(f) | | | 2,100,000 | | | | 2,099,897 | |
0.015%, 12/10/2015 (e)(f) | | | 6,250,000 | | | | 6,249,898 | |
0.040%, 12/17/2015 (e)(f) | | | 7,250,000 | | | | 7,249,630 | |
0.055%, 12/24/2015 (e)(f) | | | 2,000,000 | | | | 1,999,838 | |
0.000%, 02/11/2016 (e)(f) | | | 4,200,000 | | | | 4,199,147 | |
| | | | | | | | |
| | | | | | | 38,998,078 | |
| | | | | | | | |
TOTAL SHORT-TERM INVESTMENTS
(Cost $110,529,667) | | | | | | | 110,528,814 | |
| | | | | | | | |
TOTAL INVESTMENTS
(Cost $111,509,162) - 99.9% | | | | | 111,415,371 | |
| | | | | | | | |
OTHER ASSETS IN EXCESS OF
LIABILITIES - 0.1% | | | | | 115,647 | |
| | | | | | | | |
| TOTAL NET ASSETS - 100.0% | | | | | $111,531,018 | |
| | | | | | | | |
Percentages are stated as a percent of net assets.
ADR – American Depository Receipt
| (a) | Non-income producing security. |
| (b) | Foreign issued security. Total foreign securities are $1,745 which represents 0.0% of net assets. |
| (c) | All or a portion of this security may be subject to call options written. |
| (d) | Rate shown is the 7-day effective yield. |
| (e) | All or portion of this security is held as collateral for put options written. |
| (f) | Rate shown is the effective yield based on purchase price. The calculation assumes the security is held to maturity. |
| | | | |
| | The accompanying footnotes are an integral part of these Schedules of Investments. | | (Continued) |
| | | | | | | | | | | | | | | | |
| | Stone Ridge Funds | | | | | | Annual Report | | | | | | October 31, 2015 | | |
| | | | | | | | | | |
37
| | |
| Schedule of Investments | | as of October 31, 2015 |
| | | | |
| STONE RIDGE INTERNATIONAL DEVELOPED MARKETS VARIANCE RISK PREMIUM FUND | | | | |
Written Options
| | | | | | | | |
| DESCRIPTION | | NUMBER OF
CONTRACTS | | | FAIR
VALUE | |
| | |
| CALL OPTIONS | | | | | | |
Vodafone Group PLC, Expires 11/06/2015, Strike Price $34.00 | | | 1 | | | $ | 6 | |
Vodafone Group PLC, Expires 11/06/2015, Strike Price $34.50 | | | 3 | | | | 26 | |
| | | | | | | | |
TOTAL CALL OPTIONS
(Premiums Received $28) | | | | | | | 32 | |
| | | | | | | | |
| | | | | | | | |
| PUT OPTIONS | | | | | | |
CAC 40 Index, Expires 11/20/2015, Strike Price EUR 4850.00 | | | 102 | | | | 76,698 | |
Eurex DAX, Expires 11/06/2015, Strike Price EUR 10750.00 | | | 89 | | | | 32,982 | |
Eurex DAX, Expires 11/06/2015, Strike Price EUR 10800.00 | | | 80 | | | | 47,661 | |
Eurex DAX, Expires 11/06/2015, Strike Price EUR 10850.00 | | | 20 | | | | 11,522 | |
Eurex Euro STOXX 50 Index, Expires 11/06/2015, Strike Price EUR 3400.00 | | | 590 | | | | 169,984 | |
FTSE 100 Index, Expires 11/20/2015, Strike Price GBP 6375.00 | | | 77 | | | | 128,793 | |
FTSE 100 Index, Expires 11/20/2015, Strike Price GBP 6400.00 | | | 145 | | | | 273,825 | |
Hang Seng Index, Expires 11/27/2015, Strike Price HKD 23000.00 | | | 18 | | | | 78,497 | |
Nikkei-225 Stock Index, Expires 11/13/2015, Strike Price JPY 18750.00 | | | 120 | | | | 222,088 | |
Nikkei-225 Stock Index, Expires 11/13/2015, Strike Price JPY 19000.00 | | | 50 | | | | 138,213 | |
S&P/ASX 200 Index, Expires 11/19/2015, Strike Price AUD 5200.00 | | | 75 | | | | 39,256 | |
S&P/ASX 200 Index, Expires 11/19/2015, Strike Price AUD 5350.00 | | | 135 | | | | 147,098 | |
Swiss Market Index, Expires 11/20/2015, Strike Price CHF 8850.00 | | | 119 | | | | 98,961 | |
| | | | | | | | |
TOTAL PUT OPTIONS
(Premiums Received $1,701,771) | | | | | | | 1,465,578 | |
| | | | | | | | |
TOTAL WRITTEN OPTIONS
(Premiums Received $1,701,799) | | | | | | $ | 1,465,610 | |
| | | | | | | | |
| | | | |
| | The accompanying footnotes are an integral part of these Schedules of Investments. | | |
| | | | | | | | | | | | | | | | |
| | Stone Ridge Funds | | | | | | Annual Report | | | | | | October 31, 2015 | | |
| | | | | | | | | | |
38
| | |
| Schedule of Investments | | as of October 31, 2015 |
| | | | |
| STONE RIDGE EMERGING MARKETS VARIANCE RISK PREMIUM FUND | | | | |
| | | | | | | | |
| | | SHARES | | | FAIR
VALUE | |
| COMMON STOCKS - 1.5% | |
| | | | | | | | |
| Automobiles & Components - 0.0% | |
Tata Motors Ltd. - ADR (a) | | | 700 | | | $ | 20,699 | |
| | | | | | | | |
|
| Banks - 0.1% | |
HDFC Bank Ltd. - ADR | | | 300 | | | | 18,342 | |
ICICI Bank Ltd. - ADR | | | 1,800 | | | | 15,516 | |
| | | | | | | | |
| | | | | | | 33,858 | |
| | | | | | | | |
| | | | | | | | |
Consumer Services - 0.1% | |
New Oriental Education & Technology Group, Inc. - ADR | | | 800 | | | | 22,008 | |
| | | | | | | | |
|
| Diversified Financials - 0.0% | |
Noah Holdings Ltd. - ADR (a) | | | 700 | | | | 19,614 | |
| | | | | | | | |
|
| Energy - 0.0% | |
Petroleo Brasileiro SA - ADR (a) | | | 3,200 | | | | 15,616 | |
| | | | | | | | |
|
| Insurance - 0.1% | |
China Life Insurance Co. Ltd. - ADR | | | 1,500 | | | | 27,090 | |
| | | | | | | | |
|
| Materials - 0.1% | |
AngloGold Ashanti Ltd. - ADR (a) | | | 100 | | | | 844 | |
Cemex SAB de CV - ADR (a) | | | 1,872 | | | | 11,813 | |
Sibanye Gold Ltd. - ADR | | | 2,200 | | | | 14,366 | |
Vale SA - ADR | | | 3,300 | | | | 14,388 | |
| | | | | | | | |
| | | | | | | 41,411 | |
| | | | | | | | |
| Media - 0.0% | |
Grupo Televisa SAB - ADR | | | 300 | | | | 8,742 | |
| | | | | | | | |
|
| Real Estate - 0.0% | |
E-House China Holdings Ltd. - ADR | | | 2,500 | | | | 15,500 | |
| | | | | | | | |
| | | | | | | | |
| Retailing - 0.2% | |
Ctrip.com International Ltd. - ADR (a) | | | 300 | | | | 27,891 | |
E-commerce China Dangdang Inc. - ADR (a) | | | 2,103 | | | | 14,237 | |
Qunar Cayman Islands Ltd. - ADR (a) | | | 700 | | | | 33,978 | |
Vipshop Holdings Ltd. - ADR (a)(b) | | | 1,000 | | | | 20,520 | |
| | | | | | | | |
| | | | | | | | |
| | | | | | | 96,626 | |
| | | | | | | | |
| Semiconductors & Semiconductor Equipment - 0.2% | |
Himax Technologies, Inc. - ADR (b) | | | 3,200 | | | | 18,944 | |
JA Solar Holdings Co. Ltd. - ADR (a) | | | 2,200 | | | | 18,744 | |
JinkoSolar Holding Co. Ltd. - ADR (a) | | | 1,100 | | | | 28,479 | |
Taiwan Semiconductor Manufacturing Co. Ltd. - ADR | | | 800 | | | | 17,568 | |
Trina Solar Ltd. - ADR (a) | | | 2,100 | | | | 21,399 | |
| | | | | | | | |
| | | | | | | 105,134 | |
| | | | | | | | |
| Software & Services - 0.7% | |
21Vianet Group, Inc. - ADR (a) | | | 900 | | | | 18,036 | |
58.com, Inc. - ADR (a) | | | 300 | | | | 15,747 | |
Baidu, Inc. - ADR (a) | | | 200 | | | | 37,494 | |
Bitauto Holdings Ltd. - ADR (a) | | | 400 | | | | 12,760 | |
Changyou.com Ltd. - ADR (a) | | | 900 | | | | 17,964 | |
ChinaCache International Holdings Ltd. - ADR (a) | | | 2,161 | | | | 16,229 | |
Infosys Ltd. - ADR | | | 1,200 | | | | 21,792 | |
| | | | | | | | |
| | | SHARES | | | FAIR
VALUE | |
| Software & Services - 0.7% (continued) | |
KongZhong Corp. - ADR (a) | | | 2,100 | | | $ | 14,532 | |
Leju Holdings Ltd. - ADR | | | 105 | | | | 756 | |
NetEase, Inc. - ADR (b) | | | 500 | | | | 72,265 | |
NQ Mobile, Inc. - ADR (a)(b) | | | 5,600 | | | | 21,616 | |
Qihoo 360 Technology Co. Ltd. - ADR (a)(b) | | | 500 | | | | 28,545 | |
Sky-mobi Ltd. - ADR (a) | | | 3,600 | | | | 9,972 | |
SouFun Holdings Ltd. - ADR | | | 3,300 | | | | 23,331 | |
Youku Tudou, Inc. - ADR (a)(b) | | | 1,200 | | | | 29,208 | |
YY, Inc. - ADR (a)(b) | | | 400 | | | | 22,776 | |
| | | | | | | | |
| | | | | | | 363,023 | |
| | | | | | | | |
| Telecommunication Services - 0.0% | | | | | | |
America Movil SAB de CV - ADR | | | 900 | | | | 16,029 | |
| | | | | | | | |
TOTAL COMMON STOCKS
(Cost $808,102) | | | | | | | 785,350 | |
| | | | | | | | |
| | | | | | | | |
| PREFERRED STOCKS - 0.0% | |
| |
| Banks - 0.0% | |
Banco Bradesco SA - ADR | | | 2,040 | | | | 11,098 | |
Itau Unibanco Holding SA - ADR | | | 611 | | | | 4,185 | |
| | | | | | | | |
TOTAL PREFERRED STOCKS
(Cost $28,442) | | | | | | | 15,283 | |
| | | | | | | | |
| | | | | | | | |
| | |
| | | PRINCIPAL
AMOUNT | | | FAIR
VALUE | |
| | | | | | | | |
| SHORT TERM INVESTMENTS - 99.8% | |
| | | | | | | | |
| U.S. Treasury Bills - 99.8% | |
0.028%, 11/05/2015 (c)(d) | | $ | 3,950,000 | | | | 3,949,198 | |
0.077%, 11/12/2015 (c)(d) | | | 6,900,000 | | | | 6,899,835 | |
0.073%, 11/19/2015 (c)(d) | | | 2,600,000 | | | | 2,599,905 | |
0.054%, 12/03/2015 (c)(d) | | | 6,950,000 | | | | 6,949,668 | |
0.011%, 12/10/2015 (c)(d) | | | 4,050,000 | | | | 4,049,951 | |
0.039%, 12/17/2015 (c)(d) | | | 1,700,000 | | | | 1,699,916 | |
0.055%, 12/24/2015 (c)(d) | | | 5,750,000 | | | | 5,749,534 | |
0.039%, 01/07/2016 (c)(d) | | | 7,400,000 | | | | 7,399,119 | |
0.000%, 01/21/2016 (c)(d) | | | 5,250,000 | | | | 5,249,286 | |
(0.005%), 02/04/2016 (c)(d) | | | 1,800,000 | | | | 1,799,563 | |
0.000%, 02/11/2016 (c)(d) | | | 3,950,000 | | | | 3,949,988 | |
| | | | | | | | |
TOTAL SHORT TERM INVESTMENTS
(Cost $50,298,293) | | | | | | | 50,295,963 | |
| | | | | | | | |
TOTAL INVESTMENTS
(Cost $51,134,837) - 101.3% | | | | | | | 51,096,596 | |
| | | | | | | | |
LIABILITIES IN EXCESS OF OTHER
ASSETS - (1.3)% | | | | | (680,085) | |
| | | | | | | | |
| TOTAL NET ASSETS - 100.0% | | | | | $50,416,511 | |
| | | | | | | | |
Percentages are stated as a percent of net assets.
ADR American Depository Receipt
| (a) | Non-income producing security. |
| (b) | All or a portion of this security may be subject to call options written. |
| (c) | All or a portion of this security is held as collateral for put options written. |
| (d) | Rate shown is the effective yield based on purchased price. The calculation assumes the security is held to maturity. |
| | | | |
| | The accompanying footnotes are an integral part of these Schedules of Investments. | | (Continued) |
| | | | | | | | | | | | | | | | |
| | Stone Ridge Funds | | | | | | Annual Report | | | | | | October 31, 2015 | | |
| | | | | | | | | | |
39
| | |
| Schedule of Investments | | as of October 31, 2015 |
| | | | |
| STONE RIDGE EMERGING MARKETS VARIANCE RISK PREMIUM FUND | | | | |
Written Options
| | | | | | | | |
| DESCRIPTION | | NUMBER OF
CONTRACTS | | | VALUE | |
| | |
| CALL OPTIONS | | | | | | |
Himax Technologies, Inc., Expires 11/06/2015, Strike Price $6.50 | | | 32 | | | $ | 240 | |
NetEase, Inc., Expires 11/06/2015, Strike Price $150.00 | | | 1 | | | | 75 | |
NetEase, Inc., Expires 11/06/2015, Strike Price $155.00 | | | 1 | | | | 17 | |
NetEase, Inc., Expires 11/06/2015, Strike Price $160.00 | | | 1 | | | | 10 | |
NQ Mobile, Inc., Expires 11/06/2015, Strike Price $4.50 | | | 1 | | | | 7 | |
Qihoo 360 Technology Co. Ltd., Expires 11/06/2015, Strike Price $59.50 | | | 1 | | | | 57 | |
Vipshop Holdings Ltd., Expires 11/06/2015, Strike Price $22.50 | | | 1 | | | | 7 | |
Vipshop Holdings Ltd., Expires 11/06/2015, Strike Price $23.00 | | | 1 | | | | 8 | |
Youku Tudou, Inc., Expires 11/06/2015, Strike Price $27.50 | | | 1 | | | | 8 | |
Youku Tudou, Inc., Expires 11/06/2015, Strike Price $28.00 | | | 1 | | | | 8 | |
YY, Inc., Expires 11/06/2015, Strike Price $61.50 | | | 1 | | | | 8 | |
| | | | | | | | �� |
TOTAL CALL OPTIONS
(Premiums Received $563) | | | | | | | 445 | |
| | | | | | | | |
| PUT OPTIONS | | | | | | |
iShares MSCI Brazil Capped ETF, Expires 11/06/2015, Strike Price $23.00 | | | 500 | | | | 28,750 | |
iShares MSCI Emerging Markets ETF, Expires 11/06/2015, Strike Price $34.50 | | | 4,588 | | | | 112,406 | |
iShares MSCI Emerging Markets ETF, Expires 11/06/2015, Strike Price $35.00 | | | 4,225 | | | | 190,125 | |
iShares MSCI Emerging Markets ETF, Expires 11/06/2015, Strike Price $36.00 | | | 690 | | | | 82,455 | |
iShares MSCI Emerging Markets ETF, Expires 11/13/2015, Strike Price $36.00 | | | 1,000 | | | | 128,500 | |
iShares MSCI Emerging Markets ETF, Expires 11/20/2015, Strike Price $35.50 | | | 1,637 | | | | 168,611 | |
iShares MSCI Mexico Capped ETF, Expires 11/06/2015, Strike Price $54.50 | | | 250 | | | | 11,000 | |
iShares MSCI South Korea Capped ETF, Expires 11/20/2015, Strike Price $54.00 | | | 150 | | | | 14,025 | |
iShares China Large-Cap ETF, Expires 11/06/2015, Strike Price $38.00 | | | 500 | | | | 20,750 | |
Market Vectors Russia ETF, Expires 11/06/2015, Strike Price $16.50 | | | 100 | | | | 1,800 | |
| | | | | | | | |
TOTAL PUT OPTIONS
(Premiums Received $672,540) | | | | | | | 758,422 | |
| | | | | | | | |
TOTAL WRITTEN OPTIONS
(Premiums Received $673,103) | | | | | | $ | 758,867 | |
| | | | | | | | |
| | | | |
| | The accompanying footnotes are an integral part of these Schedules of Investments. | | |
| | | | | | | | | | | | | | | | |
| | Stone Ridge Funds | | | | | | Annual Report | | | | | | October 31, 2015 | | |
| | | | | | | | | | |
40
| | |
| Schedule of Investments | | as of October 31, 2015 |
| | | | |
| STONE RIDGE INTERNATIONAL VARIANCE RISK PREMIUM MASTER FUND | | | | |
| | | | | | | | |
| | | SHARES | | | FAIR VALUE | |
| INVESTMENT COMPANIES - 99.1% | | | | |
| | | | | | | | |
| Open-End Mutual Funds - 99.1% | | | | | | |
Stone Ridge Emerging Markets Variance Risk Premium Fund - Class I (a) | | | 1,094,382 | | | $ | 9,663,390 | |
Stone Ridge International Developed Markets Variance Risk Premium Fund - Class I (a) | | | 1,964,223 | | | | 19,504,736 | |
| | | | | | | | |
TOTAL INVESTMENT COMPANIES
(Cost $30,208,632) | | | | | | | 29,168,126 | |
| | | | | | | | |
| | | | | | | | |
| SHORT-TERM INVESTMENTS - 1.0% | | | | | | |
| | | | | | | | |
| Money Market Funds - 1.0% | | | | | | |
Fidelity Institutional Money Market Fund - Money Market Portfolio - Institutional Class - 0.12% (b) | | | 59,189 | | | | 59,189 | |
First American Government Obligations Fund - Class Z - 0.01% (b) | | | 59,189 | | | | 59,189 | |
First American Prime Obligations Fund - Class Z - 0.06% (b) | | | 59,188 | | | | 59,188 | |
Short Term Investments Trust - Liquid Assets Portfolio - Institutional Class - 0.16% (b) | | | 59,188 | | | | 59,188 | |
Short Term Investments Trust - Treasury Portfolio - Institutional Class - 0.02% (b) | | | 59,188 | | | | 59,188 | |
| | | | | | | | |
TOTAL SHORT-TERM INVESTMENTS
(Cost $295,942) | | | | | | | 295,942 | |
| | | | | | | | |
TOTAL INVESTMENTS
(Cost $30,504,574) - 100.1% | | | | | | | 29,464,068 | |
| | | | | | | | |
LIABILITIES IN EXCESS OF OTHER
ASSETS - (0.1)% | | | | | (33,934) | |
| | | | | | | | |
| TOTAL NET ASSETS - 100.0% | | | | | $29,430,134 | |
| | | | | | | | |
Percentages are stated as a percent of net assets.
| (a) | Affiliated company. See Footnote 10. |
| (b) | Rate shown is the 7-day effective yield. |
| | | | |
| | The accompanying footnotes are an integral part of these Schedules of Investments. | | |
| | | | | | | | | | | | | | | | |
| | Stone Ridge Funds | | | | | | Annual Report | | | | | | October 31, 2015 | | |
| | | | | | | | | | |
41
| | |
| Schedule of Investments | | as of October 31, 2015 |
| | | | |
| STONE RIDGE GLOBAL EQUITY VARIANCE RISK PREMIUM MASTER FUND | | | | |
| | | | | | | | |
| | | SHARES | | | FAIR
VALUE | |
| INVESTMENT COMPANIES - 99.4% | | | | |
| | | | | | | | |
| Open-End Mutual Funds - 99.4% | | | | | | |
Stone Ridge Emerging Markets Variance Risk Premium Fund - Class I (a) | | | 894,277 | | | $ | 7,896,466 | |
Stone Ridge International Developed Markets Variance Risk Premium Fund - Class I (a) | | | 1,611,440 | | | | 16,001,599 | |
Stone Ridge U.S. Large Cap Variance Risk Premium Fund - Class I (a) | | | 1,476,076 | | | | 16,074,468 | |
Stone Ridge U.S. Small Cap Variance Risk Premium Fund - Class I (a) | | | 772,609 | | | | 8,081,490 | |
| | | | | | | | |
TOTAL INVESTMENT COMPANIES
(Cost $47,717,925) | | | | | | | 48,054,023 | |
| | | | | | | | |
| | | | | | | | |
| SHORT-TERM INVESTMENTS - 0.6% | | | | |
| | | | | | | | |
| Money Market Funds - 0.6% | | | | | | |
Fidelity Institutional Money Market Fund - Money Market Portfolio - Institutional Class - 0.12% (b) | | | 55,242 | | | | 55,242 | |
First American Government Obligations Fund - Class Z - 0.01% (b) | | | 55,242 | | | | 55,242 | |
First American Prime Obligations Fund - Class Z - 0.06% (b) | | | 55,242 | | | | 55,242 | |
Short Term Investments Trust - Liquid Assets Portfolio - Institutional Class - 0.16% (b) | | | 55,242 | | | | 55,242 | |
Short Term Investments Trust - Treasury Portfolio - Institutional Class - 0.02% (b) | | | 55,242 | | | | 55,242 | |
| | | | | | | | |
TOTAL SHORT-TERM INVESTMENTS
(Cost $276,210) | | | | 276,210 | |
| | | | | | | | |
TOTAL INVESTMENTS
(Cost $47,994,135) - 99.9% | | | | | | | 48,330,233 | |
| | | | | | | | |
OTHER ASSETS IN EXCESS OF
LIABILITIES - 0.1% | | | | | 32,731 | |
| | | | | | | | |
| TOTAL NET ASSETS - 100.0% | | | | | $48,362,964 | |
| | | | | | | | |
Percentages are stated as a percent of net assets.
| (a) | Affiliated company. See Footnote 10. |
| (b) | Rate shown is the 7-day effective yield. |
| | | | |
| | The accompanying footnotes are an integral part of these Schedules of Investments. | | |
| | | | | | | | | | | | | | | | |
| | Stone Ridge Funds | | | | | | Annual Report | | | | | | October 31, 2015 | | |
| | | | | | | | | | |
42
| | |
| Statement of Assets and Liabilities | | October 31, 2015 |
| | | | | | | | |
| | | STONE RIDGE
REINSURANCE
RISK PREMIUM
FUND | | | STONE RIDGE
HIGH YIELD
REINSURANCE
RISK PREMIUM
FUND | |
| ASSETS: | | | | | | | | |
Investments, at fair value(1) | | $ | 1,017,709,677 | | | $ | 492,758,730 | |
Interest receivable | | | 5,391,041 | | | | 3,054,337 | |
Dividends receivable | | | 336,355 | | | | 211,906 | |
Receivable for fund shares sold | | | 86,649 | | | | 493,816 | |
Receivable for investments sold | | | 2,007,733 | | | | — | |
Foreign currencies, at value(2) | | | 21,628 | | | | 2 | |
Collateral held at broker | | | 2,127,726 | | | | 198,691 | |
Other assets | | | 34,416 | | | | 32,565 | |
| Total assets | | | 1,027,715,225 | | | | 496,750,047 | |
| LIABILITIES: | | | | | | | | |
Payable for fund shares redeemed | | | 213,142 | | | | 246,556 | |
Payable to Adviser | | | 1,307,860 | | | | 631,830 | |
Payable for Chief Compliance Officer compensation | | | 5,004 | | | | 4,999 | |
Payable to Custodian | | | 1,336,371 | | | | 10,533 | |
Payable to Trustees | | | 12,975 | | | | 7,740 | |
Variation margin on futures contracts | | | — | | | | 18,594 | |
Accrued distribution fees | | | 55,797 | | | | 15,691 | |
Other accrued expenses | | | 241,662 | | | | 152,386 | |
| Total liabilities | | | 3,172,811 | | | | 1,088,329 | |
| Total net assets | | $ | 1,024,542,414 | | | $ | 495,661,718 | |
| | | | | | | | | |
| NET ASSETS CONSIST OF: | | | | | | | | |
Capital stock | | $ | 1,000,011,195 | | | $ | 482,102,645 | |
Accumulated net investment income (loss) | | | 8,577,784 | | | | 1,977,051 | |
Accumulated net realized loss | | | (11,860,435 | ) | | | (4,871,991 | ) |
| Unrealized appreciation (depreciation) on: | | | | | | | | |
Investments | | | 28,957,279 | | | | 16,465,649 | |
Foreign currency translation | | | (1,418,144 | ) | | | — | |
Futures contracts | | | 274,735 | | | | (11,636 | ) |
| Total net assets | | $ | 1,024,542,414 | | | $ | 495,661,718 | |
| | | | | | | | | |
| Class I | | | | | | | | |
Net assets | | $ | 813,988,670 | | | $ | 436,522,847 | |
Shares outstanding | | | 78,789,436 | | | | 42,037,555 | |
Class I net asset value, offering and redemption price per share | | $ | 10.33 | | | $ | 10.38 | |
| Class M | | | | | | | | |
Net assets | | $ | 210,553,744 | | | $ | 59,138,871 | |
Shares outstanding | | | 20,383,881 | | | | 5,695,629 | |
Class M net asset value, offering and redemption price per share | | $ | 10.33 | | | $ | 10.38 | |
| | | | | | | | | |
(1) Cost of investments | | $ | 990,169,301 | | | $ | 476,293,081 | |
(2) Cost of foreign currencies | | | 21,760 | | | | 2 | |
| | | | |
| | The accompanying notes are an integral part of these financial statements. | | (Continued) |
| | | | | | | | | | | | | | | | |
| | Stone Ridge Funds | | | | | | Annual Report | | | | | | October 31, 2015 | | |
| | | | | | | | | | |
43
| | |
| Statement of Assets and Liabilities | | October 31, 2015 |
| | | | | | | | | | | | |
| | | STONE RIDGE
U.S. LARGE CAP
VARIANCE
RISK PREMIUM
FUND | | | STONE RIDGE
U.S. SMALL CAP
VARIANCE
RISK PREMIUM
FUND | | | STONE RIDGE
U.S. VARIANCE
RISK PREMIUM
MASTER FUND | |
| ASSETS: | | | | | | | | |
| Investments, at fair value(1) | | | | | | | | |
Unaffiliated issuers | | $ | 380,723,232 | | | $ | 131,407,923 | | | $ | 249,933 | |
Affiliated issuers | | | — | | | | — | | | | 198,383,192 | |
Interest receivable | | | 11 | | | | 10 | | | | 12 | |
Dividends receivable | | | 39,159 | | | | 50 | | | | — | |
Receivable for investments sold | | | 3,097,847 | | | | 781,002 | | | | — | |
Cash | | | 490 | �� | | | — | | | | — | |
Other assets | | | 22,577 | | | | 19,872 | | | | 23,242 | |
| Total assets | | | 383,883,316 | | | | 132,208,857 | | | | 198,656,379 | |
| LIABILITIES: | | | | | | | | |
Due to broker | | | 372 | | | | — | | | | — | |
Payable for fund shares redeemed | | | 56,000 | | | | 150,020 | | | | — | |
Options written, at fair value(2) | | | 2,672,896 | | | | 1,243,010 | | | | — | |
Payable for investment securities purchased | | | 1,800,915 | | | | 109,232 | | | | — | |
Payable to Adviser | | | 395,125 | | | | 123,238 | | | | — | |
Payable for Chief Compliance Officer compensation | | | 5,016 | | | | 5,001 | | | | 1,251 | |
Payable to Custodian | | | 64,319 | | | | 213,301 | | | | 449 | |
Payable to Trustees | | | 4,051 | | | | 1,362 | | | | — | |
Accrued distribution fees | | | 24,025 | | | | 4,327 | | | | 14,932 | |
Other accrued expenses | | | 110,528 | | | | 66,279 | | | | 46,162 | |
| Total liabilities | | | 5,133,247 | | | | 1,915,770 | | | | 62,794 | |
| Total net assets | | $ | 378,750,069 | | | $ | 130,293,087 | | | $ | 198,593,585 | |
| | | | | | | | | | | | | |
| NET ASSETS CONSIST OF: | | | | | | | | |
Capital stock | | $ | 352,950,502 | | | $ | 126,434,827 | | | $ | 184,910,412 | |
Accumulated net investment income (loss) | | | (2,348,924 | ) | | | (1,594,558 | ) | | | 799,094 | |
Accumulated net realized gain | | | 20,203,034 | | | | 5,002,468 | | | | 2,218,155 | |
| Unrealized appreciation (depreciation) on: | | | | | | | | |
Investments | | | 8,467,238 | | | | 516,951 | | | | 10,665,924 | |
Options written | | | (521,781 | ) | | | (66,601 | ) | | | — | |
| Total net assets | | $ | 378,750,069 | | | $ | 130,293,087 | | | $ | 198,593,585 | |
| | | | | | | | | | | | | |
| Class I | | | | | | | | |
Net assets | | $ | 285,402,854 | | | $ | 113,268,655 | | | $ | 145,606,051 | |
Shares outstanding | | | 26,211,959 | | | | 10,823,869 | | | | 13,619,938 | |
Class I net asset value, offering and redemption price per share | | $ | 10.89 | | | $ | 10.46 | | | $ | 10.69 | |
| Class M | | | | | | | | |
Net assets | | $ | 93,347,215 | | | $ | 17,024,432 | | | $ | 52,987,534 | |
Shares outstanding | | | 8,608,805 | | | | 1,633,492 | | | | 4,964,046 | |
Class M net asset value, offering and redemption price per share | | $ | 10.84 | | | $ | 10.42 | | | $ | 10.67 | |
| | | | | | | | | | | | | |
| (1) Cost of investments | | | | | | | | |
Unaffiliated issuers | | $ | 372,255,993 | | | $ | 130,890,972 | | | $ | 249,933 | |
Affiliated issuers (See Note 10) | | | — | | | | — | | | | 187,717,268 | |
(2) Premiums received | | | 2,151,115 | | | | 1,176,409 | | | | — | |
| | | | |
| | The accompanying notes are an integral part of these financial statements. | | (Continued) |
| | | | | | | | | | | | | | | | |
| | Stone Ridge Funds | | | | | | Annual Report | | | | | | October 31, 2015 | | |
| | | | | | | | | | |
44
| | |
| Statement of Assets and Liabilities | | October 31, 2015 |
| | | | | | | | | | | | | | | | |
| | | STONE RIDGE INTL
DEVELOPED
MARKETS VARIANCE
RISK PREMIUM FUND | | | STONE RIDGE
EMERGING MARKETS
VARIANCE RISK
PREMIUM FUND | | | STONE RIDGE
INTERNATIONAL
VARIANCE RISK
PREMIUM MASTER
FUND | | | STONE RIDGE
GLOBAL EQUITY
VARIANCE RISK
PREMIUM MASTER
FUND | |
| ASSETS: | | | | | | | | | | | | | | | | |
| Investments, at fair value(1) | | | | | | | | | | | | | | | | |
Unaffiliated issuers | | $ | 111,415,371 | | | $ | 51,096,596 | | | $ | 295,942 | | | $ | 276,210 | |
Affiliated issuers | | | — | | | | — | | | | 29,168,126 | | | | 48,054,023 | |
Interest receivable | | | 4,434 | | | | 6 | | | | 19 | | | | 19 | |
Investment receivable | | | 62,821 | | | | — | | | | — | | | | — | |
Dividends receivable | | | 638 | | | | 798 | | | | — | | | | — | |
Receivable from Adviser | | | — | | | | — | | | | 4,055 | | | | 17,468 | |
Receivable for fund shares sold | | | 8,000 | | | | 5,000 | | | | — | | | | 35,000 | |
Receivable for investments sold | | | — | | | | 709,908 | | | | — | | | | — | |
Foreign currencies, at value(2) | | | 3,035,255 | | | | — | | | | — | | | | — | |
Deferred offering expenses (See Note 6) | | | — | | | | — | | | | — | | | | 3,667 | |
Other assets | | | 15,018 | | | | 13,526 | | | | 12,458 | | | | 24,049 | |
| Total assets | | | 114,541,537 | | | | 51,825,834 | | | | 29,480,600 | | | | 48,410,436 | |
| LIABILITIES: | | | | | | | | | | | | | | | | |
Due to broker | | | — | | | | 580 | | | | — | | | | — | |
Payable for fund shares redeemed | | | 60,359 | | | | 75,040 | | | | — | | | | — | |
Options written, at fair value(3) | | | 1,465,610 | | | | 758,867 | | | | — | | | | — | |
Payable for investment securities purchased | | | 3,304 | | | | 173,797 | | | | — | | | | — | |
Payable for investment interest | | | 16,000 | | | | — | | | | — | | | | — | |
Payable to Adviser | | | 131,054 | | | | 44,212 | | | | — | | | | — | |
Payable for Chief Compliance Officer compensation | | | 4,997 | | | | 4,997 | | | | 1,277 | | | | 1,250 | |
Payable to Custodian | | | 1,249,118 | | | | 284,338 | | | | — | | | | 110 | |
Payable to Trustees | | | 1,555 | | | | 608 | | | | — | | | | — | |
Accrued distribution fees | | | 5,794 | | | | 811 | | | | 6,140 | | | | 2,385 | |
Other accrued expenses | | | 72,728 | | | | 66,073 | | | | 43,049 | | | | 43,727 | |
| Total liabilities | | | 3,010,519 | | | | 1,409,323 | | | | 50,466 | | | | 47,472 | |
| Total net assets | | $ | 111,531,018 | | | $ | 50,416,511 | | | $ | 29,430,134 | | | $ | 48,362,964 | |
| | | | | | | | | | | | | | | | | |
| NET ASSETS CONSIST OF: | | | | | | | | | | | | | | | | |
Capital stock | | $ | 110,550,176 | | | $ | 55,693,992 | | | $ | 30,370,898 | | | $ | 47,423,836 | |
Accumulated net investment income (loss) | | | (664,737 | ) | | | (698,117 | ) | | | 288,703 | | | | 27,379 | |
Accumulated net realized gain (loss) | | | 1,495,753 | | | | (4,455,359 | ) | | | (188,961 | ) | | | 575,651 | |
| Unrealized appreciation (depreciation) on: | | | | | | | | | | | | | | | | |
Investments | | | (92,936 | ) | | | (38,241 | ) | | | (1,040,506 | ) | | | 336,098 | |
Foreign currency translation | | | 6,573 | | | | — | | | | — | | | | — | |
Options written | | | 236,189 | | | | (85,764 | ) | | | — | | | | — | |
| Total net assets | | $ | 111,531,018 | | | $ | 50,416,511 | | | $ | 29,430,134 | | | $ | 48,362,964 | |
| | | | | | | | | | | | | | | | | |
| Class I | | | | | | | | | | | | | | | | |
Net assets | | $ | 90,448,700 | | | $ | 47,337,972 | | | $ | 9,536,274 | | | $ | 38,898,899 | |
Shares outstanding | | | 9,107,360 | | | | 5,360,877 | | | | 1,002,521 | | | | 3,864,207 | |
Class I net asset value, offering and redemption price per share | | $ | 9.93 | | | $ | 8.83 | | | $ | 9.51 | | | $ | 10.07 | |
| Class M | | | | | | | | | | | | | | | | |
Net assets | | $ | 21,082,318 | | | $ | 3,078,539 | | | $ | 19,893,860 | | | $ | 9,464,065 | |
Shares outstanding | | | 2,127,375 | | | | 349,483 | | | | 2,093,659 | | | | 941,075 | |
Class M net asset value, offering and redemption price per share | | $ | 9.91 | | | $ | 8.81 | | | $ | 9.50 | | | $ | 10.06 | |
| | | | | | | | | | | | | | | | | |
| (1) Cost of investments | | | | | | | | | | | | | | | | |
Unaffiliated issuers | | $ | 111,509,162 | | | $ | 51,134,837 | | | $ | 295,942 | | | $ | 276,210 | |
Affiliated issuers (See Note 10) | | | — | | | | — | | | | 30,208,632 | | | | 47,717,925 | |
(2) Cost of foreign currencies | | | 3,027,826 | | | | — | | | | — | | | | — | |
(3) Premiums received | | | 1,701,799 | | | | 673,103 | | | | — | | | | — | |
| | | | |
| | The accompanying notes are an integral part of these financial statements. | | |
| | | | | | | | | | | | | | | | |
| | Stone Ridge Funds | | | | | | Annual Report | | | | | | October 31, 2015 | | |
| | | | | | | | | | |
45
| | |
| Statement of Operations | | For the Year Ended October 31, 2015 |
| | | | | | | | |
| | | STONE RIDGE
REINSURANCE
RISK PREMIUM
FUND | | | STONE RIDGE
HIGH YIELD
REINSURANCE
RISK PREMIUM
FUND | |
| INVESTMENT INCOME: | | | | | | | | |
Dividend income | | $ | 22,916,099 | | | $ | 9,913,020 | |
Interest income | | | 45,741,700 | | | | 22,595,998 | |
| Total investment income | | | 68,657,799 | | | | 32,509,018 | |
| EXPENSES | | | | | | | | |
Advisory fees (See Note 4) | | | 14,577,033 | | | | 6,564,522 | |
Fund accounting and administration fees | | | 552,321 | | | | 271,221 | |
Distribution (12b-1) fees — Class M Only | | | 333,234 | | | | 95,585 | |
Legal fees | | | 210,667 | | | | 102,126 | |
Transfer agency fees and expenses | | | 158,988 | | | | 130,272 | |
Federal and state registration fees | | | 109,271 | | | | 74,442 | |
Custody fees | | | 90,189 | | | | 44,413 | |
Audit and tax related fees | | | 70,995 | | | | 70,989 | |
Chief Compliance Officer fees | | | 60,000 | | | | 60,000 | |
Trustees fees and expenses | | | 57,510 | | | | 27,437 | |
Other expenses | | | 109,995 | | | | 51,002 | |
| Total expenses | | | 16,330,203 | | | | 7,492,009 | |
| Net investment income | | | 52,327,596 | | | | 25,017,009 | |
| NET REALIZED AND UNREALIZED GAIN (LOSS): | | | | | | | | |
| Net realized gain (loss) on: | | | | | | | | |
Investments | | | 272,487 | | | | 261,927 | |
Futures contracts | | | (776,382 | ) | | | (261,139 | ) |
Foreign currency translation | | | (1,430,984 | ) | | | (252,426 | ) |
| Net change in unrealized appreciation (depreciation) on: | | | | | | | | |
Investments | | | (9,414,399 | ) | | | (1,707,711 | ) |
Futures contracts | | | (23,596 | ) | | | (11,636 | ) |
Foreign currency translation | | | (386,481 | ) | | | 113,408 | |
| Net realized and unrealized loss | | | (11,759,355 | ) | | | (1,857,577 | ) |
| Net increase in net assets resulting from operations | | $ | 40,568,241 | | | $ | 23,159,432 | |
| | | | | | | | | |
| | | | |
| | The accompanying notes are an integral part of these financial statements. | | (Continued) |
| | | | | | | | | | | | | | | | |
| | Stone Ridge Funds | | | | | | Annual Report | | | | | | October 31, 2015 | | |
| | | | | | | | | | |
46
| | |
| Statement of Operations | | For the Year Ended October 31, 2015 |
| | | | | | | | | | | | |
| | | STONE RIDGE
U.S. LARGE CAP
VARIANCE
RISK PREMIUM
FUND | | | STONE RIDGE
U.S. SMALL CAP
VARIANCE
RISK PREMIUM
FUND | | | STONE RIDGE
U.S. VARIANCE
RISK PREMIUM
MASTER FUND | |
| INVESTMENT INCOME: | | | | | | | | | | | | |
| Dividend income | | | | | | | | | | | | |
Affiliated issuers | | $ | — | | | $ | — | | | $ | 2,330,171 | |
Unaffiliated issuers | | | 932,468 | | | | 12,303 | | | | — | |
Interest income | | | 47,808 | | | | 18,847 | | | | 88 | |
Exchange rebates | | | — | | | | 39,995 | | | | — | |
| Total investment income | | | 980,276 | | | | 71,145 | | | | 2,330,259 | |
| EXPENSES | | | | | | | | | | | | |
Advisory fees (See Note 4) | | | 4,687,253 | | | | 1,599,580 | | | | — | |
Custody fees | | | 376,623 | | | | 26,929 | | | | 1,810 | |
Fund accounting and administration fees | | | 239,805 | | | | 70,459 | | | | — | |
Distribution (12b-1) fees — Class M Only | | | 145,322 | | | | 22,903 | | | | 109,261 | |
Legal fees | | | 104,171 | | | | 39,662 | | | | 62,481 | |
Audit and tax related fees | | | 70,739 | | | | 70,739 | | | | 40,898 | |
Transfer agency fees and expenses | | | 60,004 | | | | 35,783 | | | | 62,070 | |
Chief Compliance Officer fees | | | 58,018 | | | | 60,000 | | | | 14,958 | |
Federal and state registration fees | | | 42,495 | | | | 47,139 | | | | 46,726 | |
Trustees fees and expenses | | | 21,026 | | | | 7,154 | | | | — | |
Other expenses | | | 118,593 | | | | 35,031 | | | | 15,216 | |
| Total expenses before Adviser waiver | | | 5,924,049 | | | | 2,015,379 | | | | 353,420 | |
Expenses waived by Adviser (See Note 4) | | | — | | | | (12,511 | ) | | | — | |
| Total net expenses | | | 5,924,049 | | | | 2,002,868 | | | | 353,420 | |
| Net investment income (loss) | | | (4,943,773 | ) | | | (1,931,723 | ) | | | 1,976,839 | |
| NET REALIZED AND UNREALIZED GAIN (LOSS): | | | | | | | | | | | | |
| Net realized gain (loss) on: | | | | | | | | | | | | |
Investments | | | | | | | | | | | | |
Affiliated issuers (See Note 10) | | | — | | | | — | | | | 508,702 | |
Unaffiliated issuers | | | 6,537,709 | | | | 139,673 | | | | — | |
Capital gain distributions from affiliated mutual funds | | | — | | | | — | | | | 2,060,696 | |
Options written | | | 26,051,616 | | | | 7,901,098 | | | | — | |
Futures contracts | | | (297,392 | ) | | | 823,500 | | | | — | |
| Net change in unrealized appreciation (depreciation) on: | | | | | | | | | | | | |
Investments | | | (3,680,835 | ) | | | (118,568 | ) | | | 6,994,086 | |
Options written | | | (769,690 | ) | | | (346,721 | ) | | | — | |
| Net realized and unrealized gain | | | 27,841,408 | | | | 8,398,982 | | | | 9,563,484 | |
| Net increase in net assets resulting from operations | | $ | 22,897,635 | | | $ | 6,467,259 | | | $ | 11,540,323 | |
| | | | | | | | | | | | | |
| | | | |
| | The accompanying notes are an integral part of these financial statements. | | (Continued) |
| | | | | | | | | | | | | | | | |
| | Stone Ridge Funds | | | | | | Annual Report | | | | | | October 31, 2015 | | |
| | | | | | | | | | |
47
| | |
| Statement of Operations | | For the Year Ended October 31, 2015 |
| | | | | | | | | | | | | | | | |
| | | STONE RIDGE
INTL DEVELOPED
MARKETS VARIANCE
RISK PREMIUM
FUND | | | STONE RIDGE
EMERGING
MARKETS VARIANCE
RISK PREMIUM
FUND | | | STONE RIDGE
INTERNATIONAL
VARIANCE RISK
PREMIUM MASTER
FUND | | | STONE RIDGE
GLOBAL EQUITY
VARIANCE RISK
PREMIUM MASTER
FUND(1) | |
| INVESTMENT INCOME: | | | | | | | | | | | | |
| Dividend income | | | | | | | | | | | | |
Affiliated issuers | | $ | — | | | $ | — | | | $ | 255,179 | | | $ | 339,444 | |
Unaffiliated issuers | | | 22,420 | | | | 6,061 | | | | — | | | | — | |
Interest income | | | 40,891 | | | | 8,028 | | | | 118 | | | | 131 | |
Exchange rebates | | | — | | | | 69,400 | | | | — | | | | — | |
| Total investment income | | | 63,311 | | | | 83,489 | | | | 255,297 | | | | 339,575 | |
| EXPENSES | | | | | | | | | | | | |
Advisory fees (See Note 4) | | | 1,298,317 | | | | 634,342 | | | | — | | | | — | |
Audit and tax related fees | | | 68,240 | | | | 68,240 | | | | 39,183 | | | | 47,993 | |
Chief Compliance Officer fees | | | 60,000 | | | | 60,000 | | | | 15,023 | | | | 15,000 | |
Fund accounting and administration fees | | | 56,770 | | | | 28,603 | | | | — | | | | — | |
Transfer agency fees and expenses | | | 31,206 | | | | 30,500 | | | | 32,837 | | | | 45,526 | |
Distribution (12b-1) fees — Class M Only | | | 30,337 | | | | 5,599 | | | | 29,388 | | | | 10,838 | |
Offering costs | | | 26,763 | | | | 13,778 | | | | 16,778 | | | | 95,739 | |
Federal and state registration fees | | | 26,524 | | | | 24,150 | | | | 21,141 | | | | 12,624 | |
Custody fees | | | 25,648 | | | | 176,743 | | | | — | | | | 267 | |
Legal fees | | | 25,410 | | | | 5,428 | | | | 1,840 | | | | 34,172 | |
Trustees fees and expenses | | | 6,237 | | | | 2,537 | | | | — | | | | — | |
Other expenses | | | 280,230 | | | | 16,187 | | | | 3,033 | | | | 9,187 | |
| Total expenses before Adviser waiver | | | 1,935,682 | | | | 1,066,107 | | | | 159,223 | | | | 271,346 | |
Expenses waived by Adviser
(See Note 4) | | | — | | | | (147,055 | ) | | | (61,235 | ) | | | (125,491 | ) |
| Net expenses before Adviser recoupment | | | 1,935,682 | | | | 919,052 | | | | 97,988 | | | | 145,855 | |
Expenses recouped by Adviser (See Note 4) | | | 132,063 | | | | — | | | | — | | | | — | |
| Total net expenses | | | 2,067,745 | | | | 919,052 | | | | 97,988 | | | | 145,855 | |
| Net investment income (loss) | | | (2,004,434 | ) | | | (835,563 | ) | | | 157,309 | | | | 193,720 | |
| NET REALIZED AND UNREALIZED GAIN (LOSS): | | | | | | | | | | | | |
| Net realized gain (loss) on: | | | | | | | | | | | | |
Investments | | | | | | | | | | | | |
Affiliated issuers (See Note 10) | | | — | | | | — | | | | (170,292 | ) | | | 367,925 | |
Unaffiliated issuers | | | (5,692 | ) | | | 50,317 | | | | — | | | | — | |
Capital gain distributions from affiliated mutual funds | | | — | | | | — | | | | — | | | | 331,313 | |
Options written | | | 6,324,254 | | | | (4,465,014 | ) | | | — | | | | — | |
Futures contracts | | | (1,112,291 | ) | | | (32,685 | ) | | | — | | | | — | |
Foreign currency translation | | | (116,275 | ) | | | — | | | | — | | | | — | |
Net change in unrealized appreciation
(depreciation) on: | | | | | | | | |
Investments | | | (88,471 | ) | | | (69,592 | ) | | | (422,795 | ) | | | 336,098 | |
Options written | | | 54,766 | | | | (107,558 | ) | | | — | | | | — | |
Foreign currency translation | | | 39,991 | | | | — | | | | — | | | | — | |
| Net realized and unrealized gain (loss) | | | 5,096,282 | | | | (4,624,532 | ) | | | (593,087 | ) | | | 1,035,336 | |
| Net increase (decrease) in net assets resulting from operations | | $ | 3,091,848 | | | $ | (5,460,095 | ) | | $ | (435,778 | ) | | $ | 1,229,056 | |
| | | | | | | | | | | | | | | | | |
| | (1) | | Commenced operations on November 14, 2014. |
| | | | |
| | The accompanying notes are an integral part of these financial statements. | | |
| | | | | | | | | | | | | | | | |
| | Stone Ridge Funds | | | | | | Annual Report | | | | | | October 31, 2015 | | |
| | | | | | | | | | |
48
| | |
| Statement of Changes in Net Assets | | |
| | | | | | | | | | | | | | | | |
| | | STONE RIDGE REINSURANCE
RISK PREMIUM FUND | | | STONE RIDGE HIGH YIELD
REINSURANCE RISK PREMIUM FUND | |
| | | YEAR ENDED
OCTOBER 31, 2015 | | | YEAR ENDED
OCTOBER 31, 2014 | | | YEAR ENDED
OCTOBER 31, 2015 | | | YEAR ENDED
OCTOBER 31, 2014 | |
| OPERATIONS: | | | | | | | | | | | | |
Net investment income | | $ | 52,327,596 | | | $ | 35,100,703 | | | $ | 25,017,009 | | | $ | 16,191,161 | |
| Net realized gain (loss) on: | | | | | | | | | | | | |
Investments | | | 272,487 | | | | 367,360 | | | | 261,927 | | | | 313,269 | |
Futures contracts | | | (776,382 | ) | | | 818,062 | | | | (261,139 | ) | | | – | |
Foreign currency translation | | | (1,430,984 | ) | | | 695,756 | | | | (252,426 | ) | | | (3,072 | ) |
| Net change in unrealized appreciation (depreciation) on: | | | | | | | | | | | | |
Investments | | | (9,414,399 | ) | | | 22,290,877 | | | | (1,707,711 | ) | | | 10,693,463 | |
Futures contracts | | | (23,596 | ) | | | 298,331 | | | | (11,636 | ) | | | – | |
Foreign currency translation | | | (386,481 | ) | | | (2,297,038 | ) | | | 113,408 | | | | (122,381 | ) |
Net increase in assets resulting from operations | | | 40,568,241 | | | | 57,274,051 | | | | 23,159,432 | | | | 27,072,440 | |
| | | |
| DISTRIBUTIONS TO SHAREHOLDERS: | | | | | | | | | | | | |
From net investment income — Class I | | | (43,173,165 | ) | | | (23,278,934 | ) | | | (23,349,688 | ) | | | (12,305,748 | ) |
From net investment income — Class M | | | (16,543,977 | ) | | | (9,043,254 | ) | | | (5,697,882 | ) | | | (3,640,672 | ) |
Total distributions | | | (59,717,142 | ) | | | (32,322,188 | ) | | | (29,047,570 | ) | | | (15,946,420 | ) |
| | | |
| CAPITAL SHARE TRANSACTIONS: | | | | | | | | | | | | |
Proceeds from shares sold — Class I | | | 382,402,376 | | | | 225,172,509 | | | | 212,475,030 | | | | 120,920,539 | |
Proceeds from shares sold — Class M | | | 109,107,258 | | | | 108,991,261 | | | | 19,658,217 | | | | 26,585,822 | |
Proceeds from shares issued to holders in reinvestment of dividends — Class I | | | 35,667,351 | | | | 19,489,059 | | | | 21,095,584 | | | | 10,878,689 | |
Proceeds from shares issued to holders in reinvestment of dividends — Class M | | | 14,810,720 | | | | 7,977,655 | | | | 5,129,879 | | | | 3,225,011 | |
Cost of shares redeemed — Class I | | | (150,168,432 | ) | | | (65,363,961 | ) | | | (53,386,719 | ) | | | (26,880,813 | ) |
Cost of shares redeemed — Class M | | | (137,386,976 | ) | | | (42,810,060 | ) | | | (35,931,782 | ) | | | (20,574,341 | ) |
Net increase in net assets from capital share transactions | | | 254,432,297 | | | | 253,456,463 | | | | 169,040,209 | | | | 114,154,907 | |
| Total increase in net assets | | | 235,283,396 | | | | 278,408,326 | | | | 163,152,071 | | | | 125,280,927 | |
| | | |
| NET ASSETS: | | | | | | | | | | | | |
Beginning of year | | | 789,259,018 | | | | 510,850,692 | | | | 332,509,647 | | | | 207,228,720 | |
| End of year | | $ | 1,024,542,414 | | | $ | 789,259,018 | | | $ | 495,661,718 | | | $ | 332,509,647 | |
| | | | | | | | | | | | | | | | | |
Accumulated net investment income (loss) | | $ | 8,577,784 | | | $ | 7,560,626 | | | $ | 1,977,051 | | | $ | 2,327,720 | |
| | | | |
| | The accompanying notes are an integral part of these financial statements. | | (Continued) |
| | | | | | | | | | | | | | | | |
| | Stone Ridge Funds | | | | | | Annual Report | | | | | | October 31, 2015 | | |
| | | | | | | | | | |
49
| | |
| Statement of Changes in Net Assets | | |
| | | | | | | | | | | | | | | | | | | | | | | | |
| | | STONE RIDGE U.S. LARGE CAP
VARIANCE RISK PREMIUM FUND | | | STONE RIDGE U.S. SMALL CAP
VARIANCE RISK PREMIUM FUND | | | STONE RIDGE U.S. VARIANCE
RISK PREMIUM MASTER FUND | |
| | | YEAR ENDED
OCTOBER 31, 2015 | | | YEAR ENDED
OCTOBER 31, 2014 | | | YEAR ENDED
OCTOBER 31, 2015 | | | YEAR ENDED
OCTOBER 31, 2014 | | | YEAR ENDED
OCTOBER 31, 2015 | | | YEAR ENDED
OCTOBER 31, 2014 | |
| OPERATIONS: | | | | | | | | | | | | | | | | | | | | |
Net investment income (loss) | | $ | (4,943,773 | ) | | $ | (5,423,163 | ) | | $ | (1,931,723 | ) | | $ | (1,987,774 | ) | | $ | 1,976,839 | | | $ | 12,523,733 | |
| Net realized gain (loss) on: | | | | | | | | | | | | | | | | | | | | |
Investments | | | | | | | | | | | | | | | | | | | | |
Affiliated issuers | | | — | | | | — | | | | — | | | | — | | | | 508,702 | | | | 6,291,882 | |
Unaffiliated issuers | | | 6,537,709 | | | | 4,303,089 | | | | 139,673 | | | | (354,388 | ) | | | — | | | | — | |
Capital gain distributions from affiliated mutual funds | | | — | | | | — | | | | — | | | | — | | | | 2,060,696 | | | | — | |
Options written | | | 26,051,616 | | | | 22,685,937 | | | | 7,901,098 | | | | 4,812,851 | | | | — | | | | — | |
Futures contracts | | | (297,392 | ) | | | 363,505 | | | | 823,500 | | | | (37,658 | ) | | | — | | | | — | |
| Net change in unrealized appreciation (depreciation) on: | | | | | | | | | | | | | | | | | | | | |
Investments | | | (3,680,835 | ) | | | 8,826,453 | | | | (118,568 | ) | | | 438,929 | | | | 6,994,086 | | | | (4,243,582 | ) |
Options written | | | (769,690 | ) | | | (531,282 | ) | | | (346,721 | ) | | | 197,554 | | | | — | | | | — | |
Futures contracts | | | — | | | | 11,423 | | | | — | | | | — | | | | — | | | | — | |
Net increase in assets resulting from operations | | | 22,897,635 | | | | 30,235,962 | | | | 6,467,259 | | | | 3,069,514 | | | | 11,540,323 | | | | 14,572,033 | |
| | | | | |
| DISTRIBUTIONS TO SHAREHOLDERS: | | | | | | | | | | | | | | | | | | | | |
From net investment income — Class I | | | — | | | | — | | | | — | | | | — | | | | (1,377,018 | ) | | | (7,772,921 | ) |
From net investment income — Class M | | | — | | | | — | | | | — | | | | — | | | | (885,252 | ) | | | (4,747,401 | ) |
From net realized gain — Class I | | | (7,144,616 | ) | | | (21,748,616 | ) | | | (1,157,147 | ) | | | (7,828,960 | ) | | | (2,887,634 | ) | | | (8,217 | ) |
From net realized gain — Class M | | | (2,794,610 | ) | | | (8,055,151 | ) | | | (137,010 | ) | | | (993,911 | ) | | | (2,667,930 | ) | | | (5,130 | ) |
Return of Capital — Class I | | | — | | | | — | | | | — | | | | (1,659,195 | ) | | | — | | | | — | |
Return of Capital — Class M | | | — | | | | — | | | | — | | | | (196,529 | ) | | | — | | | | — | |
Total distributions | | | (9,939,226 | ) | | | (29,803,767 | ) | | | (1,294,157 | ) | | | (10,678,595 | ) | | | (7,817,834 | ) | | | (12,533,669 | ) |
| | | | | |
| CAPITAL SHARE TRANSACTIONS: | | | | | | | | | | | | | | | | | | | | |
Proceeds from shares sold — Class I | | | 90,216,108 | | | | 72,520,471 | | | | 48,902,979 | | | | 39,550,232 | | | | 70,532,694 | | | | 19,468,561 | |
Proceeds from shares sold — Class M | | | 12,151,747 | | | | 29,927,897 | | | | 5,829,236 | | | | 2,882,452 | | | | 12,643,865 | | | | 47,399,473 | |
Proceeds from shares issued to holders in reinvestment of dividends — Class I | | | 2,374,142 | | | | 6,750,096 | | | | 323,769 | | | | 2,358,212 | | | | 2,008,274 | | | | 4,867,401 | |
Proceeds from shares issued to holders in reinvestment of dividends — Class M | | | 2,668,919 | | | | 7,662,137 | | | | 128,099 | | | | 1,080,921 | | | | 2,421,687 | | | | 3,594,133 | |
Cost of shares redeemed — Class I | | | (122,729,821 | ) | | | (39,109,608 | ) | | | (56,295,078 | ) | | | (20,024,586 | ) | | | (94,309,886 | ) | | | (7,462,187 | ) |
Cost of shares redeemed — Class M | | | (37,738,874 | ) | | | (21,598,196 | ) | | | (3,411,519 | ) | | | (2,420,470 | ) | | | (71,115,462 | ) | | | (23,529,499 | ) |
Net increase (decrease) in net assets from capital share transactions | | | (53,057,779 | ) | | | 56,152,797 | | | | (4,522,514 | ) | | | 23,426,761 | | | | (77,818,828 | ) | | | 44,337,882 | |
| Total increase (decrease) in net assets | | | (40,099,370 | ) | | | 56,584,992 | | | | 650,588 | | | | 15,817,680 | | | | (74,096,339 | ) | | | 46,376,246 | |
| | | | | |
| NET ASSETS: | | | | | | | | | | | | | | | | | | | | |
Beginning of year | | | 418,849,439 | | | | 362,264,447 | | | | 129,642,499 | | | | 113,824,819 | | | | 272,689,924 | | | | 226,313,678 | |
| End of year | | $ | 378,750,069 | | | $ | 418,849,439 | | | $ | 130,293,087 | | | $ | 129,642,499 | | | $ | 198,593,585 | | | $ | 272,689,924 | |
| | | | | | | | | | | | | | | | | | | | | | | | | |
Accumulated net investment income (loss) | | $ | (2,348,924 | ) | | $ | (4,551,921 | ) | | $ | (1,594,558 | ) | | $ | (1,665,187 | ) | | $ | 799,094 | | | $ | 1,194,193 | |
| | | | |
| | The accompanying notes are an integral part of these financial statements. | | (Continued) |
| | | | | | | | | | | | | | | | |
| | Stone Ridge Funds | | | | | | Annual Report | | | | | | October 31, 2015 | | |
| | | | | | | | | | |
50
| | |
| Statement of Changes in Net Assets | | |
| | | | | | | | | | | | | | | | |
| | | STONE RIDGE INTL DEVELOPED MARKETS
VARIANCE RISK PREMIUM FUND | | | STONE RIDGE EMERGING MARKETS
VARIANCE RISK PREMIUM FUND | |
| | | YEAR ENDED
OCTOBER 31, 2015 | | | PERIOD ENDED
OCTOBER 31, 2014(1) | | | YEAR ENDED
OCTOBER 31, 2015 | | | PERIOD ENDED
OCTOBER 31, 2014(1) | |
| OPERATIONS: | | | | | | | | |
Net investment loss | | $ | (2,004,434 | ) | | $ | (944,383 | ) | | $ | (835,563 | ) | | $ | (397,406 | ) |
| Net realized gain (loss) on: | | | | | | | | |
Investments | | | | | | | | |
Unaffiliated issuers | | | (5,692 | ) | | | (1,210 | ) | | | 50,317 | | | | 28,870 | |
Options written | | | 6,324,254 | | | | 868,652 | | | | (4,465,014 | ) | | | 1,325,599 | |
Futures contracts | | | (1,112,291 | ) | | | 300,480 | | | | (32,685 | ) | | | (23,462 | ) |
Foreign currency translation | | | (116,275 | ) | | | (153,037 | ) | | | — | | | | — | |
| Net change in unrealized appreciation (depreciation) on: | | | | | | | | |
Investments | | | (88,471 | ) | | | (5,110 | ) | | | (69,592 | ) | | | 31,351 | |
Options written | | | 54,766 | | | | 180,103 | | | | (107,558 | ) | | | 21,794 | |
Foreign currency translation | | | 39,991 | | | | (31,452 | ) | | | — | | | | — | |
Net increase (decrease) in assets resulting from operations | | | 3,091,848 | | | | 214,043 | | | | (5,460,095 | ) | | | 986,746 | |
| | |
| DISTRIBUTIONS TO SHAREHOLDERS: | | | | | | | | |
From net realized gain — Class I | | | (673,304 | ) | | | (1,120,031 | ) | | | — | | | | (1,210,686 | ) |
From net realized gain — Class M | | | (185,511 | ) | | | (362,331 | ) | | | — | | | | (125,341 | ) |
Return of Capital — Class I | | | — | | | | (932,228 | ) | | | (414,733 | ) | | | (34,134 | ) |
Return of Capital — Class M | | | — | | | | (302,194 | ) | | | (39,436 | ) | | | (3,534 | ) |
Total distributions | | | (858,815 | ) | | | (2,716,784 | ) | | | (454,169 | ) | | | (1,373,695 | ) |
| | |
| CAPITAL SHARE TRANSACTIONS: | | | | | | | | |
Proceeds from shares sold — Class I | | | 52,895,209 | | | | 64,941,341 | | | | 27,262,668 | | | | 37,914,417 | |
Proceeds from shares sold — Class M | | | 3,258,887 | | | | 19,994,231 | | | | 1,860,730 | | | | 3,740,227 | |
Proceeds from shares issued to holders in reinvestment of dividends — Class I | | | 558,904 | | | | 2,047,435 | | | | 355,515 | | | | 1,240,584 | |
Proceeds from shares issued to holders in reinvestment of dividends — Class M | | | 179,324 | | | | 639,185 | | | | 31,514 | | | | 96,881 | |
Cost of shares redeemed — Class I(2) | | | (24,360,434 | ) | | | (5,553,046 | ) | | | (10,942,375 | ) | | | (2,655,815 | ) |
Cost of shares redeemed — Class M(3) | | | (1,579,652 | ) | | | (1,220,658 | ) | | | (2,081,457 | ) | | | (105,165 | ) |
Net increase in net assets from capital share transactions | | | 30,952,238 | | | | 80,848,488 | | | | 16,486,595 | | | | 40,231,129 | |
| Total increase in net assets | | | 33,185,271 | | | | 78,345,747 | | | | 10,572,331 | | | | 39,844,180 | |
| | |
| NET ASSETS: | | | | | | | | |
Beginning of period | | | 78,345,747 | | | | — | | | | 39,844,180 | | | | — | |
| End of period | | $ | 111,531,018 | | | $ | 78,345,747 | | | $ | 50,416,511 | | | $ | 39,844,180 | |
| | | | | | | | | | | | | | | | | |
Accumulated net investment loss | | $ | (664,737 | ) | | $ | (1,081,292 | ) | | $ | (698,117 | ) | | $ | (382,610 | ) |
| | (1) | | Commenced operations on February 11, 2014. |
| | (2) | | Net of redemption fees of $—, $690, $—, and $465, respectively. |
| | (3) | | Net of redemption fees of $—, $512, $— and $—, respectively. |
| | | | |
| | The accompanying notes are an integral part of these financial statements. | | (Continued) |
| | | | | | | | | | | | | | | | |
| | Stone Ridge Funds | | | | | | Annual Report | | | | | | October 31, 2015 | | |
| | | | | | | | | | |
51
| | |
| Statement of Changes in Net Assets | | |
| | | | | | | | | | | | |
| | | STONE RIDGE INTERNATIONAL VARIANCE
RISK PREMIUM MASTER FUND | | | STONE RIDGE
GLOBAL EQUITY
VARIANCE RISK
PREMIUM
MASTER FUND | |
| | | YEAR ENDED
OCTOBER 31, 2015 | | | PERIOD ENDED
OCTOBER 31, 2014(1) | | | PERIOD ENDED
OCTOBER 31, 2015(2) | |
| OPERATIONS: | | | | |
Net investment income | | $ | 157,309 | | | $ | 827,260 | | | $ | 193,720 | |
| Net realized gain (loss) on: | | | | |
Investments | | | | |
Affiliated issuers | | | (170,292 | ) | | | 161 | | | | 367,925 | |
Capital gain distributions from affiliated mutual funds | | | — | | | | — | | | | 331,313 | |
| Net change in unrealized appreciation (depreciation) on: | | | | |
Investments | | | (422,795 | ) | | | (617,711 | ) | | | 336,098 | |
Net increase (decrease) in assets resulting from operations | | | (435,778 | ) | | | 209,710 | | | | 1,229,056 | |
| |
| DISTRIBUTIONS TO SHAREHOLDERS: | | | | |
From net investment income — Class I | | | (33,564 | ) | | | (136,822 | ) | | | (296,465 | ) |
From net investment income — Class M | | | (99,039 | ) | | | (454,460 | ) | | | (19,134 | ) |
Return of Capital — Class I | | | (26,597 | ) | | | (56,418 | ) | | | — | |
Return of Capital — Class M | | | (78,378 | ) | | | (185,845 | ) | | | — | |
Total distributions | | | (237,578 | ) | | | (833,545 | ) | | | (315,599 | ) |
| |
| CAPITAL SHARE TRANSACTIONS: | | | | |
Proceeds from shares sold — Class I | | | 6,065,395 | | | | 6,641,729 | | | | 72,770,132 | |
Proceeds from shares sold — Class M | | | 3,143,158 | | | | 24,937,050 | | | | 10,750,950 | |
Proceeds from shares issued to holders in reinvestment of dividends — Class I | | | 55,948 | | | | 179,400 | | | | 290,653 | |
Proceeds from shares issued to holders in reinvestment of dividends — Class M | | | 141,815 | | | | 564,960 | | | | 15,370 | |
Cost of shares redeemed — Class I(3) | | | (2,407,219 | ) | | | (696,525 | ) | | | (35,019,649 | ) |
Cost of shares redeemed — Class M(4) | | | (2,400,366 | ) | | | (5,498,020 | ) | | | (1,357,949 | ) |
Net increase in net assets from capital share transactions | | | 4,598,731 | | | | 26,128,594 | | | | 47,449,507 | |
| Total increase in net assets | | | 3,925,375 | | | | 25,504,759 | | | | 48,362,964 | |
| |
| NET ASSETS: | | | | |
Beginning of period | | | 25,504,759 | | | | — | | | | — | |
| End of period | | $ | 29,430,134 | | | $ | 25,504,759 | | | $ | 48,362,964 | |
| | | | | | | | | | | | | |
Accumulated net investment income (loss) | | $ | 288,703 | | | $ | 262,221 | | | $ | 27,379 | |
| | (1) | | Commenced operations on February 11, 2014. |
| | (2) | | Commenced operations on November 14, 2014. |
| | (3) | | Net of redemption fees of $—, $— and $11,206, respectively. |
| | (4) | | Net of redemption fees of $—, $1,074 and $—, respectively. |
| | | | |
| | The accompanying notes are an integral part of these financial statements. | | |
| | | | | | | | | | | | | | | | |
| | Stone Ridge Funds | | | | | | Annual Report | | | | | | October 31, 2015 | | |
| | | | | | | | | | |
52
| | | | | | | | |
| | | STONE RIDGE REINSURANCE
RISK PREMIUM FUND | | | STONE RIDGE HIGH YIELD
REINSURANCE RISK
PREMIUM FUND | |
| | | FOR THE YEAR ENDED
OCTOBER 31, 2015 | | | FOR THE YEAR ENDED
OCTOBER 31, 2015 | |
| CASH FLOWS FROM OPERATING ACTIVITIES | | | | | | | | |
Net increase in net assets resulting from operations | | $ | 40,568,241 | | | $ | 23,159,432 | |
| Adjustments to reconcile net increase in net assets resulting from operations to net cash used in operating activities: | | | | | | | | |
Net realized and unrealized loss | | | 10,800,333 | | | | 1,643,410 | |
Amortization and accretion of premium and discount | | | 675,231 | | | | 396,879 | |
| Changes in assets and liabilities: | | | | | | | | |
Foreign currency | | | 181,263 | | | | 28,820 | |
Variation margin on futures contracts | | | 132,000 | | | | 18,594 | |
Receivable for investments sold | | | (2,007,733 | ) | | | — | |
Collateral held at broker | | | (2,127,726 | ) | | | (198,691 | ) |
Dividends and interest receivable | | | (1,413,935 | ) | | | (1,048,457 | ) |
Other assets | | | (8,876 | ) | | | (17,749 | ) |
Payable to Adviser | | | 304,895 | | | | 210,147 | |
Payable to Trustees | | | 2,197 | | | | 3,340 | |
Payable to Custodian | | | 1,336,371 | | | | 10,533 | |
Accrued distribution fees | | | (56,169 | ) | | | (16,663 | ) |
Accrued expenses and other liabilities | | | (72,506 | ) | | | (33,444 | ) |
Purchases of investments | | | (384,944,331 | ) | | | (214,549,302 | ) |
Proceeds from sale of investments | | | 138,231,509 | | | | 48,863,851 | |
Net purchases and sales of short-term investments | | | 4,449,770 | | | | 2,169,029 | |
Net cash used in operating activities | | | (193,949,466 | ) | | | (139,360,271 | ) |
| CASH FLOWS FROM FINANCING ACTIVITIES: | | | | | | | | |
Proceeds from shares issued | | | 491,490,397 | | | | 231,707,011 | |
Payment on shares redeemed | | | (288,446,610 | ) | | | (89,524,633 | ) |
Cash distributions to shareholders | | | (9,239,071 | ) | | | (2,822,107 | ) |
Net cash provided by financing activities | | | 193,804,716 | | | | 139,360,271 | |
Net increase in cash | | | (144,750 | ) | | | — | |
Cash, beginning of year | | | 144,750 | | | | — | |
Cash, end of year | | $ | — | | | $ | — | |
| | | | | | | | | |
| NON-CASH FINANCING ACTIVITIES | | | | | | | | |
Reinvested distributions | | $ | 50,478,071 | | | $ | 26,225,463 | |
| | | | |
| | The accompanying notes are an integral part of these financial statements. | | |
| | | | | | | | | | | | | | | | |
| | Stone Ridge Funds | | | | | | Annual Report | | | | | | October 31, 2015 | | |
| | | | | | | | | | |
53
| | |
| Financial Highlights | | October 31, 2015 |
| | | | | | | | | | | | | | | | |
| | | PER SHARE DATA: | |
| | | Income (loss) from Investment Operations | |
| | |
Net Asset
Value,
Beginning
of Period | | | Net
Investment
Income(2) | | | Net Realized
and
Unrealized Gains
(Losses) | | | Total from
Investment
Operations | |
| STONE RIDGE REINSURANCE RISK PREMIUM FUND—CLASS I | | | | | | | | | | | | | | | | |
| Year Ended October 31, 2015 | | $ | 10.69 | | | | 0.55 | | | | (0.13 | ) | | | 0.42 | |
| Year Ended October 31, 2014 | | $ | 10.36 | | | | 0.53 | | | | 0.31 | | | | 0.84 | |
Period Ended October 31, 2013(1) | | $ | 10.00 | | | | 0.13 | | | | 0.32 | | | | 0.45 | |
| STONE RIDGE REINSURANCE RISK PREMIUM FUND—CLASS M | | | | | | | | | | | | | | | | |
| Year Ended October 31, 2015 | | $ | 10.69 | | | | 0.52 | | | | (0.11 | ) | | | 0.41 | |
| Year Ended October 31, 2014 | | $ | 10.37 | | | | 0.51 | | | | 0.31 | | | | 0.82 | |
Period Ended October 31, 2013(1) | | $ | 10.00 | | | | 0.12 | | | | 0.33 | | | | 0.45 | |
| STONE RIDGE HIGH YIELD REINSURANCE RISK PREMIUM FUND—CLASS I | | | | | | | | | | | | | | | | |
| Year Ended October 31, 2015 | | $ | 10.75 | | | | 0.59 | | | | (0.08 | ) | | | 0.51 | |
| Year Ended October 31, 2014 | | $ | 10.41 | | | | 0.58 | | | | 0.37 | | | | 0.95 | |
Period Ended October 31, 2013(1) | | $ | 10.00 | | | | 0.20 | | | | 0.35 | | | | 0.55 | |
| STONE RIDGE HIGH YIELD REINSURANCE RISK PREMIUM FUND—CLASS M | | | | | | | | | | | | | | | | |
| Year Ended October 31, 2015 | | $ | 10.75 | | | | 0.55 | | | | (0.06 | ) | | | 0.49 | |
| Year Ended October 31, 2014 | | $ | 10.41 | | | | 0.56 | | | | 0.37 | | | | 0.93 | |
Period Ended October 31, 2013(1) | | $ | 10.00 | | | | 0.18 | | | | 0.36 | | | | 0.54 | |
| | (1) | | The Fund commenced operations on February 1, 2013. |
| | (2) | | Net investment income per share has been calculated based on average shares outstanding during the period. |
| | (5) | | Total Return represents the rate that an investor would have earned (or lost) on an investment in the Fund (assuming the reinvestment of all dividends and distributions). |
| | | | |
| | The accompanying footnotes are an integral part of these financial statements. | | |
| | | | | | | | | | | | | | | | |
| | Stone Ridge Funds | | | | | | Annual Report | | | | | | October 31, 2015 | | |
| | | | | | | | | | |
54
| | |
| Financial Highlights | | October 31, 2015 |
| | | | | | | | | | | | | | | | | | | | | | | | | | | | | | | | | | | | | | | | | | | | | | |
| | | SUPPLEMENT DATA AND RATIOS: | |
| Distributions to Shareholders | | | | | | | | | | | | | | | | | | | | | | | | | | | | |
Net
Investment
Income | | | Net
Realized
Gains | | | Total
Distributions | | | Net
Asset
Value,
End of
Period | | | Total
Return(5) | | | Net
Assets,
End of
Period
(000’s) | | | Ratio of
Expenses to
Average
Net Assets
(Before Expense
Reimbursement/
Recoupment) | | | Ratio of
Expenses to
Average
Net Assets
(After Expense
Reimbursement/
Recoupment) | | | Ratio of Net
Investment Income
to Average
Net Assets
(Before Expense
Reimbursement/
Recoupment) | | | Ratio of Net
Investment Income
to Average
Net Assets
(After Expense
Reimbursement/
Recoupment) | | | Portfolio
Turnover Rate | | | | |
| | | | | | | | | | | | | | | | | | | | | | | | | | | | | | | | | | | | | | | | | | | | | | |
| | (0.78 | ) | | | — | | | | (0.78 | ) | | $ | 10.33 | | | | 4.22 | % | | $ | 813,989 | | | | 1.65 | % | | | N/A | | | | 5.46 | % | | | N/A | | | | 14.79 | % | | | | |
| | (0.51 | ) | | | — | | | | (0.51 | ) | | $ | 10.69 | | | | 8.39 | % | | $ | 557,255 | | | | 1.71 | % | | | 1.72 | % | | | 5.07 | % | | | 5.06 | % | | | 16.13 | % | | | | |
| | (0.09 | ) | | | — | | | | (0.09 | ) | | $ | 10.36 | | | | 4.53 | %(3) | | $ | 360,434 | | | | 1.86 | %(4) | | | 1.87 | %(4) | | | 1.76 | %(4) | | | 1.75 | %(4) | | | 11.38 | %(3) | | | | |
| | | | | | | | | | | | | | | | | | | | | | | | | | | | | | | | | | | | | | | | | | | | | | |
| | (0.77 | ) | | | — | | | | (0.77 | ) | | $ | 10.33 | | | | 4.06 | % | | $ | 210,554 | | | | 1.80 | % | | | N/A | | | | 5.13 | % | | | N/A | | | | 14.79 | % | | | | |
| | (0.50 | ) | | | — | | | | (0.50 | ) | | $ | 10.69 | | | | 8.18 | % | | $ | 232,004 | | | | 1.85 | % | | | 1.86 | % | | | 4.95 | % | | | 4.94 | % | | | 16.13 | % | | | | |
| | (0.08 | ) | | | — | | | | (0.08 | ) | | $ | 10.37 | | | | 4.48 | %(3) | | $ | 150,416 | | | | 2.01 | %(4) | | | 2.02 | %(4) | | | 1.56 | %(4) | | | 1.55 | %(4) | | | 11.38 | %(3) | | | | |
| | | | | | | | | | | | | | | | | | | | | | | | | | | | | | | | | | | | | | | | | | | | | | |
| | (0.88 | ) | | | — | | | | (0.88 | ) | | $ | 10.38 | | | | 5.06 | % | | $ | 436,523 | | | | 1.69 | % | | | N/A | | | | 5.76 | % | | | N/A | | | | 11.64 | % | | | | |
| | (0.61 | ) | | | — | | | | (0.61 | ) | | $ | 10.75 | | | | 9.44 | % | | $ | 259,515 | | | | 1.78 | % | | | 1.80 | % | | | 5.58 | % | | | 5.56 | % | | | 15.79 | % | | | | |
| | (0.14 | ) | | | — | | | | (0.14 | ) | | $ | 10.41 | | | | 5.58 | %(3) | | $ | 145,995 | | | | 1.95 | %(4) | | | 1.94 | %(4) | | | 2.66 | %(4) | | | 2.67 | %(4) | | | 12.82 | %(3) | | | | |
| | | | | | | | | | | | | | | | | | | | | | | | | | | | | | | | | | | | | | | | | | | | | | |
| | (0.86 | ) | | | — | | | | (0.86 | ) | | $ | 10.38 | | | | 4.90 | % | | $ | 59,139 | | | | 1.84 | % | | | N/A | | | | 5.46 | % | | | N/A | | | | 11.64 | % | | | | |
| | (0.59 | ) | | | — | | | | (0.59 | ) | | $ | 10.75 | | | | 9.33 | % | | $ | 72,995 | | | | 1.93 | % | | | 1.95 | % | | | 5.42 | % | | | 5.40 | % | | | 15.79 | % | | | | |
| | (0.13 | ) | | | — | | | | (0.13 | ) | | $ | 10.41 | | | | 5.43 | %(3) | | $ | 61,234 | | | | 2.11 | %(4) | | | 2.10 | %(4) | | | 2.47 | %(4) | | | 2.48 | %(4) | | | 12.82 | %(3) | | | | |
| | | | |
| | The accompanying footnotes are an integral part of these financial statements. | | (Continued) |
| | | | | | | | | | | | | | | | |
| | Stone Ridge Funds | | | | | | Annual Report | | | | | | October 31, 2015 | | |
| | | | | | | | | | |
55
| | |
| Financial Highlights | | October 31, 2015 |
| | | | | | | | | | | | | | | | |
| | | PER SHARE DATA: | |
| | | Income (loss) from Investment Operations | |
| | |
Net Asset
Value,
Beginning
of Period | | | Net
Investment
Income (Loss)(3) | | | Net Realized
and
Unrealized Gains | | | Total from
Investment
Operations | |
| STONE RIDGE U.S. LARGE CAP VARIANCE RISK PREMIUM FUND—CLASS I | | | | | | | | | | | | | | | | |
| Year Ended October 31, 2015 | | $ | 10.50 | | | | (0.14 | ) | | | 0.79 | | | | 0.65 | |
| Year Ended October 31, 2014 | | $ | 10.48 | | | | (0.14 | ) | | | 0.94 | | | | 0.80 | |
Period Ended October 31, 2013(1) | | $ | 10.00 | | | | (0.07 | ) | | | 0.80 | | | | 0.73 | |
| STONE RIDGE U.S. LARGE CAP VARIANCE RISK PREMIUM FUND—CLASS M | | | | | | | | | | | | | | | | |
| Year Ended October 31, 2015 | | $ | 10.47 | | | | (0.15 | ) | | | 0.78 | | | | 0.63 | |
| Year Ended October 31, 2014 | | $ | 10.47 | | | | (0.15 | ) | | | 0.93 | | | | 0.78 | |
Period Ended October 31, 2013(1) | | $ | 10.00 | | | | (0.07 | ) | | | 0.79 | | | | 0.72 | |
| STONE RIDGE U.S. SMALL CAP VARIANCE RISK PREMIUM FUND—CLASS I | | | | | | | | | | | | | | | | |
| Year Ended October 31, 2015 | | $ | 10.04 | | | | (0.15 | ) | | | 0.67 | | | | 0.52 | |
| Year Ended October 31, 2014 | | $ | 10.65 | | | | (0.16 | ) | | | 0.45 | | | | 0.29 | |
Period Ended October 31, 2013(1) | | $ | 10.00 | | | | (0.09 | ) | | | 0.99 | | | | 0.90 | |
| STONE RIDGE U.S. SMALL CAP VARIANCE RISK PREMIUM FUND—CLASS M | | | | | | | | | | | | | | | | |
| Year Ended October 31, 2015 | | $ | 10.01 | | | | (0.17 | ) | | | 0.68 | | | | 0.51 | |
| Year Ended October 31, 2014 | | $ | 10.64 | | | | (0.17 | ) | | | 0.44 | | | | 0.27 | |
Period Ended October 31, 2013(1) | | $ | 10.00 | | | | (0.10 | ) | | | 0.99 | | | | 0.89 | |
| STONE RIDGE U.S. VARIANCE RISK PREMIUM MASTER FUND—CLASS I | | | | | | | | | | | | | | | | |
| Year Ended October 31, 2015 | | $ | 10.50 | | | | 0.10 | (4) | | | 0.48 | (4) | | | 0.58 | (4) |
| Year Ended October 31, 2014 | | $ | 10.40 | | | | 0.51 | (4) | | | 0.10 | (4) | | | 0.61 | (4) |
Period Ended October 31, 2013(2) | | $ | 10.00 | | | | 0.24 | (4) | | | 0.39 | (4) | | | 0.63 | (4) |
| STONE RIDGE U.S. VARIANCE RISK PREMIUM MASTER FUND—CLASS M | | | | | | | | | | | | | | | | |
| Year Ended October 31, 2015 | | $ | 10.50 | | | | 0.10 | (4) | | | 0.46 | (4) | | | 0.56 | (4) |
| Year Ended October 31, 2014 | | $ | 10.40 | | | | 0.51 | (4) | | | 0.09 | (4) | | | 0.60 | (4) |
Period Ended October 31, 2013(2) | | $ | 10.00 | | | | 0.24 | (4) | | | 0.39 | (4) | | | 0.63 | (4) |
| | (1) | | The Fund commenced operations on May 1, 2013. |
| | (2) | | The Fund commenced operations on May 22, 2013. |
| | (3) | | Net investment income (loss) per share has been calculated based on average shares outstanding during the period. |
| | (4) | | Per share amounts only include income and expenses of the U.S. Variance Risk Premium Master Fund which are shown on the Fund’s Statement of Operations. Amounts do not include the Fund’s proportionate share of the income and expenses of the underlying investor funds. |
| | (7) | | Total Return represents the rate that an investor would have earned (or lost) on an investment in the Fund (assuming reinvestment of all dividends and distributions). |
| | | | |
| | The accompanying footnotes are an integral part of these financial statements. | | |
| | | | | | | | | | | | | | | | |
| | Stone Ridge��Funds | | | | | | Annual Report | | | | | | October 31, 2015 | | |
| | | | | | | | | | |
56
| | |
| Financial Highlights | | October 31, 2015 |
| | | | | | | | | | | | | | | | | | | | | | | | | | | | | | | | | | | | | | | | | | | | | | | | | | |
| | | SUPPLEMENT DATA AND RATIOS: | |
| Distributions to Shareholders | | | | | | | | | | | | | | | | | | | | | | | | | |
Net
Investment
Income | | | Net
Realized
Gains | | | Return
of Capital | | | Total
Distributions | | | Net
Asset
Value,
End of
Period | | | Total
Return(7) | | | Net
Assets,
End of
Period
(000’s) | | | Ratio of
Expenses to Average
Net Assets (Before Expense Reimbursement/
Recoupment) | | | Ratio of
Expenses to Average
Net Assets
(After Expense
Reimbursement/
Recoupment) | | | Ratio of Net
Investment Income
(Loss) to Average
Net Assets
(Before Expense
Reimbursement/
Recoupment) | | | Ratio of Net
Investment Income
(Loss) to Average
Net Assets
(After Expense
Reimbursement/
Recoupment) | | | Portfolio
Turnover Rate | | | | |
| | | | | | | | | | | | | | | | | | | | | | | | | | | | | | | | | | | | | | | | | | | | | | | | | | |
| | — | | | | (0.26 | ) | | | — | | | | (0.26 | ) | | $ | 10.89 | | | | 6.33 | % | | $ | 285,403 | | | | 1.54 | % | | | N/A | | | | (1.28 | %) | | | N/A | | | | 10.14 | % | | | | |
| | — | | | | (0.78 | ) | | | — | | | | (0.78 | ) | | $ | 10.50 | | | | 7.95 | % | | $ | 305,504 | | | | 1.62 | % | | | 1.64 | % | | | (1.27 | %) | | | (1.29 | %) | | | 97.63 | % | | | | |
| | — | | | | (0.25 | ) | | | — | | | | (0.25 | ) | | $ | 10.48 | | | | 7.35 | %(5) | | $ | 264,883 | | | | 1.65 | %(6) | | | 1.59 | %(6) | | | (1.42 | %)(6) | | | (1.36 | %)(6) | | | 56.76 | %(5) | | | | |
| | | | | | | | | | | | | | | | | | | | | | | | | | | | | | | | | | | | | | | | | | | | | | | | | | |
| | — | | | | (0.26 | ) | | | — | | | | (0.26 | ) | | $ | 10.84 | | | | 6.15 | % | | $ | 93,347 | | | | 1.69 | % | | | N/A | | | | (1.43 | %) | | | N/A | | | | 10.14 | % | | | | |
| | — | | | | (0.78 | ) | | | — | | | | (0.78 | ) | | $ | 10.47 | | | | 7.76 | % | | $ | 113,345 | | | | 1.77 | % | | | 1.79 | % | | | (1.42 | %) | | | (1.44 | %) | | | 97.63 | % | | | | |
| | — | | | | (0.25 | ) | | | — | | | | (0.25 | ) | | $ | 10.47 | | | | 7.25 | %(5) | | $ | 97,381 | | | | 1.80 | %(6) | | | 1.74 | %(6) | | | (1.57 | %)(6) | | | (1.51 | %)(6) | | | 56.76 | %(5) | | | | |
| | | | | | | | | | | | | | | | | | | | | | | | | | | | | | | | | | | | | | | | | | | | | | | | | | |
| | — | | | | (0.10 | ) | | | — | | | | (0.10 | ) | | $ | 10.46 | | | | 5.23 | % | | $ | 113,269 | | | | 1.56 | % | | | 1.55 | % | | | (1.50 | %) | | | (1.49 | %) | | | 0.00 | % | | | | |
| | — | | | | (0.75 | ) | | | (0.15 | ) | | | (0.90 | ) | | $ | 10.04 | | | | 2.85 | % | | $ | 115,717 | | | | 1.60 | % | | | 1.62 | % | | | (1.54 | %) | | | (1.56 | %) | | | 34.92 | % | | | | |
| | — | | | | (0.25 | ) | | | — | | | | (0.25 | ) | | $ | 10.65 | | | | 9.09 | %(5) | | $ | 100,579 | | | | 1.80 | %(6) | | | 1.75 | %(6) | | | (1.76 | %)(6) | | | (1.71 | %)(6) | | | 33.66 | %(5) | | | | |
| | | | | | | | | | | | | | | | | | | | | | | | | | | | | | | | | | | | | | | | | | | | | | | | | | |
| | — | | | | (0.10 | ) | | | — | | | | (0.10 | ) | | $ | 10.42 | | | | 5.15 | % | | $ | 17,024 | | | | 1.71 | % | | | 1.70 | % | | | (1.65 | %) | | | (1.64 | %) | | | 0.00 | % | | | | |
| | — | | | | (0.75 | ) | | | (0.15 | ) | | | (0.90 | ) | | $ | 10.01 | | | | 2.65 | % | | $ | 13,925 | | | | 1.75 | % | | | 1.77 | % | | | (1.69 | %) | | | (1.71 | %) | | | 34.92 | % | | | | |
| | — | | | | (0.25 | ) | | | — | | | | (0.25 | ) | | $ | 10.64 | | | | 8.99 | %(5) | | $ | 13,246 | | | | 1.95 | %(6) | | | 1.90 | %(6) | | | (1.91 | %)(6) | | | (1.86 | %)(6) | | | 33.66 | %(5) | | | | |
| | | | | | | | | | | | | | | | | | | | | | | | | | | | | | | | | | | | | | | | | | | | | | | | | | |
| | (0.10 | ) | | | (0.29 | ) | | | — | | | | (0.39 | ) | | $ | 10.69 | | | | 5.81 | % | | $ | 145,606 | | | | 0.13 | % | | | N/A | | | | 0.98 | % | | | N/A | | | | 16.83 | % | | | | |
| | (0.51 | ) | | | — | | | | — | | | | (0.51 | ) | | $ | 10.50 | | | | 6.02 | % | | $ | 164,687 | | | | 0.13 | % | | | N/A | | | | 4.91 | % | | | N/A | | | | 6.46 | % | | | | |
| | (0.23 | ) | | | — | | | | — | | | | (0.23 | ) | | $ | 10.40 | | | | 6.42 | %(5) | | $ | 146,296 | | | | 0.26 | %(6) | | | N/A | | | | 5.29 | %(6) | | | N/A | | | | 0.62 | %(5) | | | | |
| | | | | | | | | | | | | | | | | | | | | | | | | | | | | | | | | | | | | | | | | | | | | | | | | | |
| | (0.10 | ) | | | (0.29 | ) | | | — | | | | (0.39 | ) | | $ | 10.67 | | | | 5.57 | % | | $ | 52,988 | | | | 0.27 | % | | | N/A | | | | 1.02 | % | | | N/A | | | | 16.83 | % | | | | |
| | (0.50 | ) | | | — | | | | — | | | | (0.50 | ) | | $ | 10.50 | | | | 5.88 | % | | $ | 108,003 | | | | 0.28 | % | | | N/A | | | | 4.82 | % | | | N/A | | | | 6.46 | % | | | | |
| | (0.23 | ) | | | — | | | | — | | | | (0.23 | ) | | $ | 10.40 | | | | 6.36 | %(5) | | $ | 80,018 | | | | 0.41 | %(6) | | | N/A | | | | 5.37 | %(6) | | | N/A | | | | 0.62 | %(5) | | | | |
| | | | |
| | The accompanying footnotes are an integral part of these financial statements. | | (Continued) |
| | | | | | | | | | | | | | | | |
| | Stone Ridge Funds | | | | | | Annual Report | | | | | | October 31, 2015 | | |
| | | | | | | | | | |
57
| | |
| Financial Highlights | | October 31, 2015 |
| | | | | | | | | | | | | | | | |
| | | PER SHARE DATA: | |
| | | Income (Loss) from Investment Operations | |
| | | Net Asset
Value,
Beginning
of Period | | | Net
Investment
Income (Loss)(3) | | |
Net Realized
and
Unrealized Gains
(Losses) | | | Total from
Investment
Operations | |
| STONE RIDGE INTERNATIONAL DEVELOPED MARKETS VARIANCE RISK PREMIUM FUND—CLASS I | | | | | | | | | | | | | | | | |
| Year Ended October 31, 2015 | | $ | 9.70 | | | | (0.19 | ) | | | 0.52 | | | | 0.33 | |
Period Ended October 31, 2014(1) | | $ | 10.00 | | | | (0.12 | ) | | | 0.17 | | | | 0.05 | (6) |
| STONE RIDGE INTERNATIONAL DEVELOPED MARKETS VARIANCE RISK PREMIUM FUND—CLASS M | | | | | | | | | | | | | | | | |
| Year Ended October 31, 2015 | | $ | 9.69 | | | | (0.20 | ) | | | 0.52 | | | | 0.32 | |
Period Ended October 31, 2014(1) | | $ | 10.00 | | | | (0.13 | ) | | | 0.17 | | | | 0.04 | (6) |
| STONE RIDGE EMERGING MARKETS VARIANCE RISK PREMIUM FUND—CLASS I | | | | | | | | | | | | | | | | |
| Year Ended October 31, 2015 | | $ | 9.95 | | | | (0.15 | ) | | | (0.87 | ) | | | (1.02 | ) |
Period Ended October 31, 2014(1) | | $ | 10.00 | | | | (0.11 | ) | | | 0.40 | | | | 0.29 | (6) |
| STONE RIDGE EMERGING MARKETS VARIANCE RISK PREMIUM FUND—CLASS M | | | | | | | | | | | | | | | | |
| Year Ended October 31, 2015 | | $ | 9.94 | | | | (0.16 | ) | | | (0.87 | ) | | | (1.03 | ) |
Period Ended October 31, 2014(1) | | $ | 10.00 | | | | (0.12 | ) | | | 0.41 | | | | 0.29 | |
| STONE RIDGE INTERNATIONAL VARIANCE RISK PREMIUM MASTER FUND—CLASS I | | | | | | | | | | | | | | | | |
| Year Ended October 31, 2015 | | $ | 9.76 | | | | 0.05 | (4) | | | (0.21 | )(4) | | | (0.16 | )(4) |
Period Ended October 31, 2014(1) | | $ | 10.00 | | | | 0.34 | (4) | | | (0.24 | )(4) | | | 0.09 | (4) |
| STONE RIDGE INTERNATIONAL VARIANCE RISK PREMIUM MASTER FUND—CLASS M | | | | | | | | | | | | | | | | |
| Year Ended October 31, 2015 | | $ | 9.76 | | | | 0.06 | (4) | | | (0.23 | )(4) | | | (0.17 | )(4)(6) |
Period Ended October 31, 2014(1) | | $ | 10.00 | | | | 0.32 | (4) | | | (0.24 | )(4) | | | 0.07 | (4)(6) |
| STONE RIDGE GLOBAL EQUITY VARIANCE RISK PREMIUM MASTER FUND—CLASS I | | | | | | | | | | | | | | | | |
Period Ended October 31, 2015(2) | | $ | 10.00 | | | | 0.04 | (5) | | | 0.08 | (5) | | | 0.12 | (5)(6) |
| STONE RIDGE GLOBAL EQUITY VARIANCE RISK PREMIUM MASTER FUND—CLASS M | | | | | | | | | | | | | | | | |
Period Ended October 31, 2015(2) | | $ | 10.00 | | | | (0.01 | )(5) | | | 0.11 | (5) | | | 0.10 | (5) |
| | (1) | | The Fund commenced operations on February 11, 2014. |
| | (2) | | The Fund commenced operations on November 14, 2014. |
| | (3) | | Net investment income (loss) per share has been calculated based on average shares outstanding during the period. |
| | (4) | | Per share amounts only include income and expenses of the International Variance Risk Premium Master Fund which are shown on the Fund’s Statement of Operations. Amounts do not include the Fund’s proportionate share of the income and expenses of the underlying investor funds. |
| | (5) | | Per share amounts only include income and expenses of the Global Equity Variance Risk Premium Master Fund which are shown on the Fund’s Statement of Operations. Amounts do not include the Fund’s proportionate share of the income and expenses of the underlying investor funds. |
| | (6) | | Includes redemption fees of less than $0.01 per share. |
| | (9) | | Total Return represents the rate that an investor would have earned (or lost) on an investment in the Fund (assuming reinvestment of all dividends and distributions). |
| | | | |
| | The accompanying footnotes are an integral part of these financial statements. | | |
| | | | | | | | | | | | | | | | |
| | Stone Ridge Funds | | | | | | Annual Report | | | | | | October 31, 2015 | | |
| | | | | | | | | | |
58
| | |
| Financial Highlights | | October 31, 2015 |
| | | | | | | | | | | | | | | | | | | | | | | | | | | | | | | | | | | | | | | | | | | | | | | | | | |
| | | SUPPLEMENT DATA AND RATIOS: | |
| Distributions to Shareholders | | | | | | | | | | | | | | | | | | | | | | | | | | | | |
Net
Investment
Income | | | Net
Realized
Gains | | | Return
of Capital | | | Total
Distributions | | | Net
Asset
Value,
End of
Period | | | Total
Return(9) | | | Net
Assets,
End of
Period
(000’s) | | | Ratio of
Expenses to
Average
Net Assets
(Before Expense
Reimbursement/
Recoupment) | | | Ratio of
Expenses to
Average
Net Assets
(After Expense
Reimbursement/
Recoupment) | | | Ratio of Net
Investment Income
(Loss) to Average
Net Assets
(Before Expense
Reimbursement/
Recoupment) | | | Ratio of Net
Investment Income
(Loss) to Average
Net Assets
(After Expense
Reimbursement/
Recoupment) | | | Portfolio
Turnover Rate | | | | |
| | | | | | | | | | | | | | | | | | | | | | | | | | | | | | | | | | | | | | | | | | | | | | | | | | |
| | — | | | | (0.10 | ) | | | — | | | | (0.10 | ) | | $ | 9.93 | | | | 3.40 | % | | $ | 90,449 | | | | 1.83 | % | | | 1.96 | % | | | (1.77 | %) | | | (1.90 | %) | | | 107.43 | % | | | | |
| | — | | | | (0.19 | ) | | | (0.16 | ) | | | (0.35 | ) | | $ | 9.70 | | | | 0.47 | %(7) | | $ | 59,551 | | | | 2.16 | %(8) | | | 1.75 | %(8) | | | (2.12 | %)(8) | | | (1.71 | %)(8) | | | 70.35 | %(7) | | | | |
| | | | | | | | | | | | | | | | | | | | | | | | | | | | | | | | | | | | | | | | | | | | | | | | | | |
| | — | | | | (0.10 | ) | | | — | | | | (0.10 | ) | | $ | 9.91 | | | | 3.30 | % | | $ | 21,082 | | | | 1.98 | % | | | 2.11 | % | | | (1.92 | %) | | | (2.05 | %) | | | 107.43 | % | | | | |
| | — | | | | (0.19 | ) | | | (0.16 | ) | | | (0.35 | ) | | $ | 9.69 | | | | 0.36 | %(7) | | $ | 18,795 | | | | 2.35 | %(8) | | | 1.90 | %(8) | | | (2.31 | %)(8) | | | (1.86 | %)(8) | | | 70.35 | %(7) | | | | |
| | | | | | | | | | | | | | | | | | | | | | | | | | | | | | | | | | | | | | | | | | | | | | | | | | |
| | — | | | | — | | | | (0.10 | ) | | | (0.10 | ) | | $ | 8.83 | | | | (10.37 | %) | | $ | 47,338 | | | | 2.09 | % | | | 1.80 | % | | | (1.92 | %) | | | (1.63 | %) | | | 485.70 | % | | | | |
| | — | | | | (0.34 | ) | | | (0.01 | ) | | | (0.35 | ) | | $ | 9.95 | | | | 3.05 | %(7) | | $ | 36,142 | | | | 2.41 | %(8) | | | 1.80 | %(8) | | | (2.07 | %)(8) | | | (1.46 | %)(8) | | | 229.94 | %(7) | | | | |
| | | | | | | | | | | | | | | | | | | | | | | | | | | | | | | | | | | | | | | | | | | | | | | | | | |
| | — | | | | — | | | | (0.10 | ) | | | (0.10 | ) | | $ | 8.81 | | | | (10.48 | %) | | $ | 3,079 | | | | 2.22 | % | | | 1.95 | % | | | (2.07 | %) | | | (1.80 | %) | | | 485.70 | % | | | | |
| | — | | | | (0.34 | ) | | | (0.01 | ) | | | (0.35 | ) | | $ | 9.94 | | | | 2.95 | %(7) | | $ | 3,702 | | | | 2.84 | %(8) | | | 1.95 | %(8) | | | (2.50 | %)(8) | | | (1.61 | %)(8) | | | 229.94 | %(7) | | | | |
| | | | | | | | | | | | | | | | | | | | | | | | | | | | | | | | | | | | | | | | | | | | | | | | | | |
| | (0.05 | ) | | | — | | | | (0.04 | ) | | | (0.09 | ) | | $ | 9.51 | | | | (1.63 | %) | | $ | 9,536 | | | | 0.47 | % | | | 0.25 | % | | | 0.33 | % | | | 0.55 | % | | | 13.94 | % | | | | |
| | (0.24 | ) | | | — | | | | (0.10 | ) | | | (0.34 | ) | | $ | 9.76 | | | | 0.92 | %(7) | | $ | 5,971 | | | | 0.82 | %(8) | | | 0.25 | %(8) | | | 4.20 | %(8) | | | 4.77 | %(8) | | | 21.41 | %(7) | | | | |
| | | | | | | | | | | | | | | | | | | | | | | | | | | | | | | | | | | | | | | | | | | | | | | | | | |
| | (0.05 | ) | | | — | | | | (0.04 | ) | | | (0.09 | ) | | $ | 9.50 | | | | (1.77 | %) | | $ | 19,894 | | | | 0.62 | % | | | 0.40 | % | | | 0.36 | % | | | 0.58 | % | | | 13.94 | % | | | | |
| | (0.22 | ) | | | — | | | | (0.10 | ) | | | (0.32 | ) | | $ | 9.76 | | | | 0.82 | %(7) | | $ | 19,533 | | | | 0.98 | %(8) | | | 0.40 | %(8) | | | 3.93 | %(8) | | | 4.51 | %(8) | | | 21.41 | %(7) | | | | |
| | | | | | | | | | | | | | | | | | | | | | | | | | | | | | | | | | | | | | | | | | | | | | | | | | |
| | (0.05 | ) | | | — | | | | — | | | | (0.05 | ) | | $ | 10.07 | | | | 1.17 | %(7) | | $ | 38,899 | | | | 0.47 | %(8) | | | 0.25 | %(8) | | | 0.21 | %(8) | | | 0.43 | %(8) | | | 62.45 | %(7) | | | | |
| | | | | | | | | | | | | | | | | | | | | | | | | | | | | | | | | | | | | | | | | | | | | | | | | | |
| | (0.04 | ) | | | — | | | | — | | | | (0.04 | ) | | $ | 10.06 | | | | 1.05 | %(7) | | $ | 9,464 | | | | 0.72 | %(8) | | | 0.40 | %(8) | | | (0.42 | %)(8) | | | (0.10 | %)(8) | | | 62.45 | %(7) | | | | |
| | | | |
| | The accompanying footnotes are an integral part of these financial statements. | | (Continued) |
| | | | | | | | | | | | | | | | |
| | Stone Ridge Funds | | | | | | Annual Report | | | | | | October 31, 2015 | | |
| | | | | | | | | | |
59
| | |
| Notes to Financial Statements | | October 31, 2015 |
1. Organization
Stone Ridge Trust (the “Trust”) was organized as a Delaware statutory trust on September 28, 2012, and is registered under the Investment Company Act of 1940 (the “1940 Act”), as amended, as an open-end management investment company issuing shares in multiple series, each series representing a distinct portfolio with its own investment objectives and policies. As of October 31, 2015, the Trust consisted of nine non-diversified series (the “Funds”): the Stone Ridge Reinsurance Risk Premium Fund (the “Reinsurance Fund”), the Stone Ridge High Yield Reinsurance Risk Premium Fund (the “High Yield Fund”, together with the Reinsurance Fund the “Reinsurance Funds”), the Stone Ridge U.S. Large Cap Variance Risk Premium Fund (formerly, the Stone Ridge U.S. Variance Risk Premium Fund) (the “U.S. Large Cap VRP Fund”), the Stone Ridge U.S. Small Cap Variance Risk Premium Fund (the “U.S. Small Cap VRP Fund”, together with the U.S. Large Cap VRP Fund, the “U.S. VRP Funds”), the Stone Ridge U.S. Variance Risk Premium Master Fund (formerly the Stone Ridge U.S. Master Variance Risk Premium Fund) (the “U.S. VRP Master Fund”, together with the U.S. VRP Funds, the “U.S. VRP Portfolio of Funds”), the Stone Ridge International Developed Markets Variance Risk Premium Fund (the “International Developed Markets VRP Fund”), the Stone Ridge Emerging Markets Variance Risk Premium Fund (the “Emerging Markets VRP Fund”, together with the International Developed Markets VRP Fund, the “International VRP Funds”), the Stone Ridge International Variance Risk Premium Master Fund (formerly the Stone Ridge International Master Variance Risk Premium Fund) (the “International VRP Master Fund”) and the Stone Ridge Global Equity Variance Risk Premium Master Fund (the “Global Equity VRP Master Fund”, together with the International VRP Funds and the “International VRP Master Fund”, the “International VRP Portfolio of Funds”). The name changes and corresponding changes in investment policy were effective February 28, 2015. The Reinsurance Funds commenced operations on February 1, 2013. The U.S. VRP Funds commenced operations on May 1, 2013. The U.S. VRP Master Fund commenced operations on May 22, 2013. The International Developed Markets VRP Fund, Emerging Markets VRP Fund and the International VRP Master Fund commenced operations on February 11, 2014. The Global Equity VRP Master Fund commenced operations on November 14, 2014. The Funds each offer two classes of shares to investors: Class I shares, with no front-end or back-end sales charges, and no 12b-1 fees; and the Class M Shares, with no front-end or back-end sales charges, and a 0.15% 12b-1 fee. The Reinsurance Funds, the U.S. VRP Funds, and the VRP Master Fund do not charge redemption fees. The International VRP Portfolio of Funds did charge redemption fees, but the redemption fees were discontinued effective February 28, 2015. There are an unlimited number of authorized shares.
The investment objective of the Reinsurance Funds is to seek a high level of total return consisting of income and capital appreciation. The Reinsurance Funds seek to achieve this objective by investing in event-linked bonds, Quota Share Notes (as defined herein) and, to a lesser extent, event-linked swaps, equity securities and derivatives of equity securities of companies in the reinsurance industry. The investment objective of the U.S. VRP Portfolio of Funds is long-term capital appreciation. The U.S. Large Cap VRP Fund seeks to achieve this investment objective by creating exposure to U.S. large-cap securities through writing (selling) call and put options on U.S. large-cap securities. The U.S. Small Cap VRP Fund seeks to achieve this investment objective by creating exposure to U.S. small-cap securities by writing (selling) call and put options on U.S. small cap securities. The U.S. VRP Master Fund seeks to achieve its investment objective by investing in the U.S. VRP Funds. The investment objective of the International VRP Portfolio of Funds is long-term appreciation. The International Developed Markets VRP Fund seeks to achieve this objective by writing (selling) call and put options related to developed markets securities. The Emerging Markets VRP Fund seeks to achieve this objective by writing (selling) call and put options related to emerging markets securities. The International VRP Master Fund seeks to achieve its investment objective by investing in the International VRP Funds. The Global Equity VRP Master Fund seeks to achieve its investment objective by investing in the International VRP Funds and the U.S. VRP Funds.
2. Summary of Significant Accounting Policies
The following is a summary of significant accounting policies consistently followed by the Funds in the preparation of their financial statements. The financial statements have been prepared in conformity with accounting principles generally accepted in the United States of America (“GAAP”). The Funds are investment companies and apply specific accounting and financial reporting requirements under Financial Accounting Standards Board (“FASB”) Accounting Standards Topic 946, Financial Services – Investment Companies.
(a) Investment Valuation and Fair Value Measurement In determining the net asset value (“NAV”) of the Funds’ shares, securities which are traded on a domestic national stock exchange are valued at the last sale price each day on the securities exchange on which the securities are primarily traded. Securities traded principally on the NASDAQ Stock Market are normally valued at the NASDAQ Official Closing Price provided by NASDAQ each business day. Exchange-
| | | | | | | | | | | | | | | | |
| | Stone Ridge Funds | | | | | | Annual Report | | | | | | October 31, 2015 | | |
| | | | | | | | | | |
60
| | |
| Notes to Financial Statements | | October 31, 2015 |
traded securities for which there were no transactions are valued at the mean between the closing bid and asked prices. Non-exchange traded equity securities are valued at the last sale price in the over-the-counter market. If a non-exchange traded equity does not trade on a particular day, the mean between the closing bid and asked prices is used.
Investments in open-end mutual funds, including money market funds, are generally priced at the ending NAV provided by the service agent of the Trust. Investments in closed-end mutual funds are valued at the last sale price on the exchange on which the shares are primarily traded.
Futures contracts are valued at the settlement price on the exchange on which they are primarily traded.
Long-term debt securities issued with a maturity in excess of 60 days, including corporate debt securities and municipal debt securities, collateralized mortgage obligations, loans, and other asset-backed securities are valued daily using the mean between the closing bid and asked prices provided by either a pricing service or two independent brokers. Short-term debt securities issued with a maturity of less than 60 days, including U.S. Treasury securities, are valued at amortized cost, which approximates fair value.
Event-linked bonds (catastrophe bonds) are valued using average firm bids from at least two independent brokers or at least one firm bid from an independent market maker. In the event that the Trust’s pricing vendor is unable to provide two independent broker firm bids or a market maker firm bid for event-linked bonds the Adviser (as defined herein) will use an indicative price as the price of the security (or average, if multiple such prices) provided that the Adviser Valuation Committee (the “Committee”) (comprised of officers of the Adviser and established pursuant to the policies and procedures adopted by the Board of Trustees) determines that the indicative price or firm bid is reasonable. The Committee may use internal and/or independent external models to generate marks for the security. If the internal and/or independent external marks are within a predetermined range of the indicative price or firm bid, then the Committee may deem the indicative price or firm bid as reasonable. If the pricing sources above are not available, the Committee will fair value the security pursuant to procedures approved by the Board of Trustees. Event-linked bonds are valued on a weekly basis and on the last business day of each month. The Adviser monitors event-linked bonds daily for significant events that could affect the value of these investments.
Participation notes and preference shares (“Quota Shares”) and private fund units are valued using at least one firm bid from an independent market maker. In the event that the Trust’s pricing vendor is unable to provide a market maker firm bid for Quota Shares, the Adviser will use an indicative price or firm bid as the price of the security (or average, if multiple such prices) provided that the Committee determines that the indicative price or firm bid is reasonable. The committee will use internal and/or independent external models to generate marks for the security. If the internal and/or independent external marks are within a predetermined range of the indicative price or firm bid, then the Committee may deem the indicative price or firm bid as reasonable. If the pricing sources above are not available, the Committee will fair value the security pursuant to procedures approved by the Board of Trustees. Quota Shares and private fund units are valued on a weekly basis and on the last business day of each month. The Adviser monitors Quota Shares and private fund units daily for significant events that could affect the value of these investments.
If market values are not readily available (including in cases where available market quotations are deemed to be unreliable or infrequent), the Funds’ investments will be valued as determined in good faith pursuant to policies and procedures approved by the Board of Trustees (“fair value pricing”). In these circumstances, the Funds determine fair value in a manner that fairly reflects the market value of the security on the valuation date based on consideration of any information or factors it deems appropriate as further described below. The Committee has the responsibility for overseeing the implementation of the Funds’ valuation procedures and fair value determinations made on behalf of the Board of Trustees. For purposes of determining fair value of securities, the Committee may use (or make use of) a variety of valuation methodologies, including, without limitation: (i) mathematical techniques that refer to the prices of similar or related securities; (ii) a percentage increase or decrease across all securities of a region, country or industry affected by a significant event; (iii) a multiple of earnings; (iv) a discount from market of a similar freely traded security; (v) the yield to maturity of debt securities; (vi) the recommendation of a pricing service; (vii) a single broker’s (or insurance company’s) quote; (viii) recent primary and/or secondary market transactions that the Funds believe to be comparable; (ix) modeling or development of events; or (x) any combination of the above. Fair value pricing may require subjective determinations about the value of an asset or liability. Fair values used to determine the Funds’ NAVs may differ from quoted or
| | | | | | | | | | | | | | | | |
| | Stone Ridge Funds | | | | | | Annual Report | | | | | | October 31, 2015 | | |
| | | | | | | | | | |
61
| | |
| Notes to Financial Statements | | October 31, 2015 |
published prices, or from prices that are used by others, for the same investments. The use of fair value pricing may not always result in adjustments to the prices of securities or other assets or liabilities held by the Funds and it is possible that the fair value determined for a security may be materially different than the value that could be realized upon the sale of such security.
Domestic exchange-traded options are generally valued at the mean of their highest bid and lowest ask, taken across all exchanges where the options are traded. Over the counter domestic options not traded on an exchange are valued at the mean of the bid and asked quotations. Foreign options are valued at the settlement price on the exchange on which they are primarily traded.
Trading in securities on non-North American securities exchanges normally is completed before the calculation of the Funds’ NAV. Trading on these foreign exchanges may not take place on all days on which there is regular trading on the New York Stock Exchange (“NYSE”), or may take place on days on which there is no regular trading on the NYSE. Similarly, the Funds may hold securities traded in domestic markets where the market may close early on a given day prior to calculation of the Funds’ NAV. Events affecting the value of such securities held by the Funds that occur between the close of trading in the security and the close of trading on the NYSE normally will not be reflected in the Funds’ calculation of the NAV. Significant events will be closely monitored, and where it is determined that an adjustment should be made to the security’s value because significant interim events may materially affect the value of the security, the security will be priced at its fair value in accordance with the procedures approved by the Board of Trustees.
In determining whether a significant event has occurred with respect to securities traded principally in foreign markets, the Funds will monitor the index futures market associated with that foreign country. If the index futures, which are continuously traded, fluctuate by more than a predetermined range between the time of the closing of the equity or options exchange and the closing of the NYSE, the Funds may use fair valuation in accordance with the procedures approved by the Board of Trustees.
The Funds have adopted authoritative fair valuation accounting standards which establish an authoritative definition of fair value and set out a hierarchy for measuring fair value. These standards require additional disclosures about the various inputs and valuation techniques used to develop the measurements of fair value and a discussion of changes in valuation techniques and related inputs during the period. The hierarchy gives the highest priority to unadjusted quoted prices in active markets for identical assets or liabilities (Level 1 measurement) and the lowest priority to unobservable inputs (Level 3 measurements). The three levels of the fair value hierarchy are as follows:
Level 1: Inputs that reflect unadjusted quoted prices in active markets for identical assets or liabilities that the Fund has the ability to access at the measurement date;
Level 2: Significant inputs other than quoted prices that are observable for the asset or liability either directly or indirectly, including inputs in markets that are not considered to be active and firm bids from brokers or market makers which are not publically available;
Level 3: Significant inputs that are unobservable.
Inputs are used in applying the various valuation techniques and broadly refer to the assumptions that market participants use to make valuation decisions, including assumptions about risk. A financial instrument’s level within the fair value hierarchy is based on the lowest level of any input that is significant to the fair value measurement. However, the determination of what constitutes “observable” requires significant judgment by the Adviser. The Adviser considers observable data to be that market data which is readily available, regularly distributed or updated, reliable and verifiable, not proprietary, and provided by independent sources that are actively involved in the relevant market. The categorization of a financial instrument within the hierarchy is based upon the pricing transparency of the instrument and does not necessarily correspond to the Adviser’s perceived risk of that instrument.
| | | | | | | | | | | | | | | | |
| | Stone Ridge Funds | | | | | | Annual Report | | | | | | October 31, 2015 | | |
| | | | | | | | | | |
62
| | |
| Notes to Financial Statements | | October 31, 2015 |
Transfers between levels are recognized at the end of the reporting period. There were no transfers between levels during the reporting period. The following tables summarize the inputs used to value the Funds’ investments as of October 31, 2015.
| | | | | | | | | | | | | | | | |
| DESCRIPTION | | LEVEL 1 | | | LEVEL 2 | | | LEVEL 3 | | | TOTAL | |
| Reinsurance Fund | |
Assets | | | | | | | | | | | | | | | | |
| Event-Linked Bonds | | | | | | | | | | | | | | | | |
China | | $ | — | | | $ | — | | | $ | 1,393,654 | | | $ | 1,393,654 | |
Europe | | | — | | | | 8,008,932 | | | | — | | | | 8,008,932 | |
Global | | | — | | | | 224,652,835 | | | | 16,579,901 | | | | 241,232,736 | |
Japan | | | — | | | | 31,465,509 | | | | — | | | | 31,465,509 | |
Mexico | | | — | | | | 8,109,121 | | | | — | | | | 8,109,121 | |
Turkey | | | — | | | | 21,194,125 | | | | — | | | | 21,194,125 | |
United States | | | — | | | | 517,349,951 | | | | 4,337,771 | | | | 521,687,722 | |
Total Event-Linked Bonds | | | — | | | | 810,780,473 | | | | 22,311,326 | | | | 833,091,799 | |
Participation Notes (Quota Shares) (1) | | | — | | | | — | | | | 102,545,159 | | | | 102,545,159 | |
Preference Shares (Quota Shares) (1) | | | — | | | | — | | | | 82,072,719 | | | | 82,072,719 | |
| | | | |
Total Assets | | $ | — | | | $ | 810,780,473 | | | $ | 206,929,204 | | | $ | 1,017,709,677 | |
Other Financial Instruments* | | | | | | | | | | | | | | | | |
Unrealized appreciation on futures | | $ | 287,534 | | | $ | — | | | $ | — | | | $ | 287,534 | |
Unrealized depreciation on futures | | | (12,799 | ) | | | — | | | | — | | | | (12,799 | ) |
| | | | |
Total | | $ | 274,735 | | | $ | — | | | $ | — | | | $ | 274,735 | |
| | | | | | | | | | | | | | | | |
| High Yield Fund | |
| Assets | | | | | | | | | | | | | | | | |
| Event-Linked Bonds | | | | | | | | | | | | | | | | |
China | | $ | — | | | $ | — | | | $ | 666,400 | | | $ | 666,400 | |
Global | | | — | | | | 89,550,138 | | | | 12,748,116 | | | | 102,298,254 | |
Mexico | | | — | | | | 5,954,179 | | | | — | | | | 5,954,179 | |
United States | | | — | | | | 289,582,486 | | | | 1,812,701 | | | | 291,395,187 | |
Total Event-Linked Bonds | | | — | | | | 385,086,803 | | | | 15,227,217 | | | | 400,314,020 | |
Participation Notes (Quota Shares) (1) | | | — | | | | — | | | | 43,703,346 | | | | 43,703,346 | |
Preference Shares (Quota Shares) (1) | | | — | | | | — | | | | 48,114,789 | | | | 48,114,789 | |
Money Market Funds | | | 626,575 | | | | — | | | | — | | | | 626,575 | |
| | | | |
Total Assets | | $ | 626,575 | | | $ | 385,086,803 | | | $ | 107,045,352 | | | $ | 492,758,730 | |
Other Financial Instruments* | | | | | | | | | | | | | | | | |
Unrealized depreciation on futures | | $ | (11,636 | ) | | $ | — | | | $ | — | | | $ | (11,636 | ) |
| | | | |
Total | | $ | (11,636 | ) | | $ | — | | | $ | — | | | $ | (11,636 | ) |
| | | | | | | | | | | | | | | | |
| U.S. Large Cap VRP Fund | |
Assets | | | | | | | | | | | | | | | | |
Common Stocks (1) | | $ | 47,852,048 | | | $ | — | | | $ | — | | | $ | 47,852,048 | |
Contingent Value Rights (1) | | | — | | | | — | | | | 5,744 | | | | 5,744 | |
Real Estate Investment Trusts (1) | | | 1,026,079 | | | | — | | | | — | | | | 1,026,079 | |
Closed-End Mutual Funds (1) | | | 10,232 | | | | — | | | | — | | | | 10,232 | |
Rights (1) | | | 10 | | | | — | | | | — | | | | 10 | |
Money Market Funds | | | 355,658 | | | | — | | | | — | | | | 355,658 | |
U.S. Treasury Bills | | | — | | | | 331,473,461 | | | | — | | | | 331,473,461 | |
| | | | |
Total Assets | | $ | 49,244,027 | | | $ | 331,473,461 | | | $ | 5,744 | | | $ | 380,723,232 | |
Liabilities | | | | | | | | | | | | | | | | |
Written Options | | $ | 2,503,654 | | | $ | 169,242 | | | $ | — | | | $ | 2,672,896 | |
| | | | |
Total Liabilities | | $ | 2,503,654 | | | $ | 169,242 | | | $ | — | | | $ | 2,672,896 | |
| | | | | | | | | | | | | | | | |
| | Stone Ridge Funds | | | | | | Annual Report | | | | | | October 31, 2015 | | |
| | | | | | | | | | |
63
| | |
| Notes to Financial Statements | | October 31, 2015 |
| | | | | | | | | | | | | | | | |
| DESCRIPTION | | LEVEL 1 | | | LEVEL 2 | | | LEVEL 3 | | | TOTAL | |
| U.S. Small Cap VRP Fund | |
Assets | | | | | | | | | | | | | | | | |
Common Stocks (1) | | $ | 3,275,574 | | | $ | — | | | $ | — | | | $ | 3,275,574 | |
Contingent Value Rights (1) | | | — | | | | — | | | | 11,689 | | | | 11,689 | |
U.S. Treasury Bills | | | — | | | | 128,120,660 | | | | — | | | | 128,120,660 | |
| | | | |
Total Assets | | $ | 3,275,574 | | | $ | 128,120,660 | | | $ | 11,689 | | | $ | 131,407,923 | |
Liabilities | | | | | | | | | | | | | | | | |
Written Options | | $ | 3,030 | | | $ | 1,239,980 | | | $ | — | | | $ | 1,243,010 | |
| | | | |
Total Liabilities | | $ | 3,030 | | | $ | 1,239,980 | | | $ | — | | | $ | 1,243,010 | |
| | | | | | | | | | | | | | | | |
| U.S. VRP Master Fund (2) | | | | | | | | | | | | | |
Assets | | | | | | | | | | | | | | | | |
Investment Companies—Open End | | $ | 198,383,192 | | | $ | — | | | $ | — | | | $ | 198,383,192 | |
Money Market Funds | | | 249,933 | | | | | | | | | | | | 249,933 | |
| | | | |
Total Assets | | $ | 198,633,125 | | | $ | — | | | $ | — | | | $ | 198,633,125 | |
| | | | | | | | | | | | | | | | |
| International Developed Markets VRP Fund | |
Assets | | | | | | | | | | | | | | | | |
Common Stocks (1) | | $ | 886,557 | | | $ | — | | | $ | — | | | $ | 886,557 | |
Money Market Funds | | | 71,530,736 | | | | — | | | | | | | | 71,530,736 | |
U.S. Treasury Bills | | | — | | | | 38,998,078 | | | | — | | | | 38,998,078 | |
| | | | |
Total Assets | | $ | 72,417,293 | | | $ | 38,998,078 | | | $ | — | | | $ | 111,415,371 | |
Liabilities | | | | | | | | | | | | | | | | |
Written Options | | $ | 1,046,094 | | | $ | 419,516 | | | $ | — | | | $ | 1,465,610 | |
| | | | |
Total Liabilities | | $ | 1,046,094 | | | $ | 419,516 | | | $ | — | | | $ | 1,465,610 | |
| | | | | | | | | | | | | | | | |
| Emerging Markets VRP Fund (2) | |
Assets | | | | | | | | | | | | | | | | |
Common Stocks (1) | | $ | 785,350 | | | $ | — | | | $ | — | | | $ | 785,350 | |
Preferred Stocks (1) | | | 15,283 | | | | — | | | | — | | | | 15,283 | |
U.S. Treasury Bills | | | — | | | | 50,295,963 | | | | — | | | | 50,295,963 | |
| | | | |
Total Assets | | $ | 800,633 | | | $ | 50,295,963 | | | $ | — | | | $ | 51,096,596 | |
Liabilities | | | | | | | | | | | | | | | | |
Written Options | | $ | 1,800 | | | $ | 757,067 | | | $ | — | | | $ | 758,867 | |
| | | | |
Total Liabilities | | $ | 1,800 | | | $ | 757,067 | | | $ | — | | | $ | 758,867 | |
| | | | | | | | | | | | | | | | |
| International VRP Master Fund (2) | |
Assets | | | | | | | | | | | | | | | | |
Investment Companies—Open End | | $ | 29,168,126 | | | $ | — | | | $ | — | | | $ | 29,168,126 | |
Money Market Funds | | | 295,942 | | | | — | | | | | | | | 295,942 | |
| | | | |
Total Assets | | $ | 29,464,068 | | | $ | — | | | $ | — | | | $ | 29,464,068 | |
| | | | | | | | | | | | | | | | |
| Global Equity VRP Master Fund (2) | |
Assets | | | | | | | | | | | | | | | | |
Investment Companies—Open End | | $ | 48,054,023 | | | $ | — | | | $ | — | | | $ | 48,054,023 | |
Money Market Funds | | | 276,210 | | | | — | | | | | | | | 276,210 | |
| | | | |
Total Assets | | $ | 48,330,233 | | | $ | — | | | $ | — | | | $ | 48,330,233 | |
| * | Other financial instruments are derivative instruments, such as futures. These instruments are reflected at the unrealized appreciation (depreciation) on the instrument. |
| | | | | | | | | | | | | | | | |
| | Stone Ridge Funds | | | | | | Annual Report | | | | | | October 31, 2015 | | |
| | | | | | | | | | |
64
| | |
| Notes to Financial Statements | | October 31, 2015 |
| (1) | For further security characteristics, see the Funds’ Schedules of Investments. |
| (2) | The Fund measures Level 3 activity as of the beginning and end of each financial reporting period. For the period ended October 31, 2015, the Fund did not have unobservable inputs (Level 3 securities) used in determining fair value. Therefore, a reconciliation of assets and liabilities in which significant inputs (Level 3 securities) were used in determining fair value is not applicable. |
Below is a reconciliation that details the activity of securities in Level 3 during the current fiscal period:
| | | | | | | | | | | | | | | | | | | | | | | | |
| | | REINSURANCE FUND | | | HIGH YIELD FUND | |
| | | EVENT- LINKED
BONDS | | | PARTICIPATION
NOTES (QUOTA
SHARES) | | | PREFERENCE
SHARES (QUOTA
SHARES) | | | EVENT- LINKED
BONDS | | | PARTICIPATION
NOTES (QUOTA
SHARES) | | | PREFERENCE
SHARES (QUOTA
SHARES) | |
Beginning Balance—November 1, 2014 | | $ | 4,386,608 | | | $ | 97,064,639 | | | $ | 50,275,537 | | | $ | 1,716,468 | | | $ | 42,288,327 | | | $ | 24,526,978 | |
Acquisition/Cover | | | 18,471,709 | | | | 68,498,677 | | | | 32,582,749 | | | | 14,077,680 | | | | 24,245,502 | | | | 23,844,042 | |
Sell/Short | | | (748,946 | ) | | | (59,508,639 | ) | | | (4,616,574 | ) | | | (676,730 | ) | | | (21,228,968 | ) | | | (2,872,191 | ) |
Realized gains | | | — | | | | — | | | | 415,923 | | | | — | | | | — | | | | 138,641 | |
Realized losses | | | — | | | | (195,704 | ) | | | — | | | | — | | | | (78,008 | ) | | | — | |
Change in unrealized appreciation (depreciation) | | | 201,955 | | | | (3,313,814 | ) | | | 3,415,084 | | | | 109,799 | | | | (1,523,507 | ) | | | 2,477,319 | |
Transfers in/(out) of Level 3 | | | — | | | | — | | | | — | | | | — | | | | — | | | | — | |
Ending Balance—October 31, 2015 | | $ | 22,311,326 | | | $ | 102,545,159 | | | $ | 82,072,719 | | | $ | 15,227,217 | | | $ | 43,703,346 | | | $ | 48,114,789 | |
| | | | | | | | | | | | |
| | | U.S. LARGE
CAP VRP
FUND | | | U.S. SMALL
CAP VRP
FUND | | | INTERNATIONAL
DEVELOPED
MARKETS VRP
FUND | |
| | | CONTINGENT VALUE RIGHTS | | | CONTINGENT VALUE RIGHTS | | | WRITTEN
OPTIONS | |
Beginning Balance—November 1, 2014 | | $ | — | | | $ | 11,689 | | | $ | (110,752 | ) |
Acquisition/Cover | | | — | (1) | | | — | | | | 146,861 | |
Sell/Short | | | — | | | | — | | | | — | |
Realized gains | | | — | | | | — | | | | 140,029 | |
Realized losses | | | — | | | | — | | | | — | |
Change in unrealized appreciation (depreciation) | | | 5,744 | | | | — | | | | (176,138 | ) |
Transfers in/(out) of Level 3 | | | — | | | | — | | | | — | |
Ending Balance—October 31, 2015 | | $ | 5,744 | | | $ | 11,689 | | | $ | — | |
| (1) | Level 3 securities were acquired in a rights issuance to holders of the companies’ common stock. |
As of October 31, 2015, the change in unrealized appreciation (depreciation) on positions still held in the Reinsurance Fund, High Yield Fund, U.S. Large Cap VRP Fund, U.S. Small Cap VRP Fund and International Developed Markets VRP Fund were $2,801,012, $1,946,376, $5,744, $0, and $0 respectively.
Unobservable inputs included original transaction price, losses from severe weather events, and changes in market risk spread of comparable securities (including catastrophe bonds with similar risk profiles). Significant increases in the market risk spread of comparable instruments or severe weather losses in isolation would result in a significantly lower fair value measurement. A high amount of loss from severe weather may also increase market risk spreads. Quota Shares are monitored daily for significant events that could affect the value of the instruments.
| | | | | | | | | | | | | | | | |
| | Stone Ridge Funds | | | | | | Annual Report | | | | | | October 31, 2015 | | |
| | | | | | | | | | |
65
| | |
| Notes to Financial Statements | | October 31, 2015 |
The following table summarizes the quantitative inputs used for investments categorized as Level 3 of the fair value hierarchy as of October 31, 2015.
Reinsurance Fund
| | | | | | | | | | | | | | |
| TYPE OF SECURITY | | INDUSTRY | | FAIR VALUE AT 10/31/15 | | | VALUATION TECHNIQUES | | UNOBSERVABLE INPUTS | | RANGE | | WEIGHTED AVERAGE |
Event Linked Bonds | | Financial Services | | | $ 1,705,603 | | | Insurance
industry loss
model | | Estimated Losses:
Estimated Premium Earned: | | $0.1MM-$0.1MM
$0.2MM-$0.2MM | | $0.1MM
$0.2MM |
| | | | | | | | | | | | | | |
Participation Notes (Quota Shares) | | Financial Services | | | $46,832,393 | | | Insurance
industry loss
model | | Estimated Losses:
Estimated Premium Earned: | | $0.3MM-$3.8MM
$0.7MM-$7.3MM | | $2.5MM
$4.9MM |
| | | | | | | | | | | | | | |
Preference Shares (Quota Shares) | | Financial Services | | | $49,527,868 | | | Insurance
industry loss
model | | Estimated Losses: Estimated Premium Earned: | | $0.0MM-$3.9MM
$0.0MM-$5.5MM | | $1.2MM
$2.3MM |
High Yield Fund
| | | | | | | | | | | | | | |
| TYPE OF SECURITY | | INDUSTRY | | FAIR VALUE AT 10/31/15 | | | VALUATION TECHNIQUES | | UNOBSERVABLE INPUTS | | RANGE | | WEIGHTED AVERAGE |
Event Linked Bonds | | Financial Services | | | $ 633,264 | | | Insurance
industry loss
model | | Estimated Losses:
Estimated Premium Earned: | | $0.0MM-$0.0MM
$0.1MM-$0.1MM | | $0.0MM
$0.1MM |
| | | | | | | | | | | | | | |
Participation Notes (Quota Shares) | | Financial Services | | | $26,583,286 | | | Insurance
industry loss
model | | Estimated Losses:
Estimated Premium Earned: | | $0.1MM-$2.3MM
$0.3MM-$4.5MM | | $1.6MM
$3.1MM |
| | | | | | | | | | | | | | |
Preference Shares (Quota Shares) | | Financial Services | | | $36,016,276 | | | Insurance
industry loss
model | | Estimated Losses: Estimated Premium Earned: | | $0.0MM-$2.4MM
$0.0MM-$3.8MM | | $1.2MM
$2.1MM |
The level 3 securities held in the Reinsurance Fund and the High Yield Fund not listed above were priced using an indicative bid and amount to $108,863,340 for the Reinsurance Fund and $43,812,526 for the High Yield Fund.
Derivative Transactions — The Reinsurance Fund, High Yield Fund, U.S. Large Cap VRP Fund, U.S. Small Cap VRP Fund, International Developed Markets VRP Fund and the Emerging Markets VRP Fund engaged in derivatives and hedging activities during the period ended October 31, 2015. The use of derivatives included options and futures contracts. Further information regarding derivative activity for each Fund can be found in the Schedule of Investments.
Futures Contracts — The Reinsurance Fund, High Yield Fund, U.S. Large Cap VRP Fund, U.S. Small Cap VRP Fund, International Developed Markets VRP Fund and the Emerging Markets VRP Fund may purchase and sell futures contracts. The Reinsurance Fund, High Yield Fund, U.S. Large Cap VRP Fund, and the International Developed Markets VRP Fund held futures contracts during the period ended October 31, 2015. The U.S. Large Cap VRP Fund, U.S. Small Cap VRP Fund, International Developed Markets VRP Fund and Emerging Markets VRP Fund use futures contracts to maintain appropriate equity market exposure. The Reinsurance Fund and High Yield Fund use futures contracts to hedge the interest rate and foreign exchange rate exposure. With futures, there is minimal counterparty credit risk to the Fund since futures are exchange traded and the exchange’s clearinghouse, as counterparty to all exchange traded futures, guarantees the futures against default. Upon entering into a contract, a Fund deposits and maintains as collateral, an initial margin as required by the exchange on which the transaction is effected. Pursuant to the contract, a Fund agrees to receive from or pay to the broker, an amount of cash equal to the daily fluctuation in value of the contract. Such receipts or payments are known as variation margin and are recorded by a Fund as unrealized gains and losses. When the contract is closed, a Fund records a realized gain or loss equal to the difference between the value of the contract at the time it was opened and the value at the time it was closed. In connection with physically-settled futures contracts, a Fund is required under the 1940 Act to maintain assets consisting of cash, cash equivalents or liquid securities. The amount of the segregated assets is required to be adjusted daily to reflect the market value of the purchase obligation for long futures contracts or the market value of the instrument underlying the contract, but not less than the market price at which the futures contract was established, for short futures contracts.
| | | | | | | | | | | | | | | | |
| | Stone Ridge Funds | | | | | | Annual Report | | | | | | October 31, 2015 | | |
| | | | | | | | | | |
66
| | |
| Notes to Financial Statements | | October 31, 2015 |
The average notional amount of futures contracts during the period ended October 31, 2015, were as follows:
| | | | | | | | | | | | | | | | | | | | |
| | | REINSURANCE FUND | | | HIGH YIELD FUND | | | U.S. LARGE CAP VRP FUND | | | U.S. SMALL CAP VRP FUND | | | INTERNATIONAL
DEVELOPED
MARKETS VRP
FUND | |
Total long futures contracts | | $ | — | | | $ | — | | | $ | — | | | $ | — | | | $ | — | |
Total short futures contracts | | $ | 26,103,481 | | | $ | 8,358,010 | | | $ | 1,700,102 | | | $ | — | | | $ | 1,691,043 | |
Options — The Funds may purchase and write call or put options on securities and indices and enter into related closing transactions. The U.S. Large Cap VRP Fund, U.S. Small Cap VRP Fund, International Developed Markets VRP Fund and the Emerging Markets VRP Fund wrote call or put options during the period ended October 31, 2015. The Funds write put and call options to earn premium income. With options, there is minimal counterparty credit risk to the Funds since options are exchange traded and the exchange’s clearinghouse, as counterparty to all exchange traded options, guarantees the options against default. As the writer of a call option, the Funds have the obligation to sell the security at the exercise price during the exercise period. As a writer of a put option, the Funds have the obligation to buy the underlying security at the exercise price during the exercise period. The premium that the Funds pay when purchasing a call option or receive when writing a call option will reflect, among other things, the market price of the security, the relationship of the exercise price to the market price of the security, the relationship of the exercise price to the volatility of the security, the length of the option period and supply and demand factors. The premium is the market value of the option.
A purchaser (holder) of a put option pays a non-refundable premium to the seller (writer) of a put option to obtain the right to sell a specified amount of a security at a fixed price (the exercise price) during a specified period (exercise period). Conversely, the seller (writer) of a put option, upon payment by the holder of the premium, has the obligation to buy the security from the holder of the put option at the exercise price during the exercise period. When an option is exercised, the premium originally received decreases the cost basis of the underlying security (or increases the proceeds on the security sold short) and the Funds realize a gain or loss from the sale of the security (or closing of the short sale).
The U.S. Large Cap VRP Fund, U.S. Small Cap VRP Fund, International Developed Markets VRP Fund and the Emerging Markets VRP Fund engaged in options during the period ended October 31, 2015. The average market values of written options for the period ended October 31, 2015, were as follows:
| | | | | | | | | | | | | | | | |
| | | U.S. LARGE CAP VRP FUND | | | U.S. SMALL CAP
VRP FUND | | | INTERNATIONAL
DEVELOPED
MARKETS VRP
FUND | | | EMERGING
MARKETS
VRP FUND | |
Written Options | | $ | 1,454,643 | | | $ | 810,275 | | | $ | 1,680,760 | | | $ | 576,003 | |
Transactions in options written during the period ended October 31, 2015 were as follows:
| | | | | | | | | | | | | | | | |
| | | U.S. LARGE CAP VRP FUND | | | U.S. SMALL CAP VRP FUND | |
| Call Options | | CONTRACTS | | | PREMIUMS | | | CONTRACTS | | | PREMIUMS | |
Outstanding, beginning of period | | | 2,909 | | | $ | 80,422 | | | | 35 | | | $ | 4,023 | |
Options written | | | 118,041 | | | | 3,793,688 | | | | 1,827 | | | | 353,483 | |
Options terminated in closing transactions | | | (9,222 | ) | | | (526,369 | ) | | | (121 | ) | | | (78,110 | ) |
Options exercised | | | (5,425 | ) | | | (346,223 | ) | | | (115 | ) | | | (21,057 | ) |
Options expired | | | (105,232 | ) | | | (2,955,240 | ) | | | (1,596 | ) | | | (253,241 | ) |
| | | | | | | | |
Outstanding, end of period | | | 1,071 | | | $ | 46,278 | | | | 30 | | | $ | 5,098 | |
| | | | | | | | | | | | | | | | |
| | Stone Ridge Funds | | | | | | Annual Report | | | | | | October 31, 2015 | | |
| | | | | | | | | | |
67
| | |
| Notes to Financial Statements | | October 31, 2015 |
| | | | | | | | | | | | | | | | |
| | | INTERNATIONAL DEVELOPED
MARKETS VRP FUND | | | EMERGING MARKETS
VRP FUND | |
| Call Options | | CONTRACTS | | | PREMIUMS | | | CONTRACTS | | | PREMIUMS | |
Outstanding, beginning of period | | | 15 | | | $ | 259 | | | | 4 | | | $ | 40 | |
Options written | | | 2,247 | | | | 48,517 | | | | 4,311 | | | | 68,703 | |
Options terminated in closing transactions | | | (97 | ) | | | (29,243 | ) | | | (973 | ) | | | (39,887 | ) |
Options exercised | | | (201 | ) | | | (2,299 | ) | | | (390 | ) | | | (3,093 | ) |
Options expired | | | (1,960 | ) | | | (17,206 | ) | | | (2,910 | ) | | | (25,200 | ) |
| | | | | | | | |
Outstanding, end of period | | | 4 | | | $ | 28 | | | | 42 | | | $ | 563 | |
| | | | | | | | | | | | | | | | |
| | | U.S. LARGE CAP VRP FUND | | | U.S. SMALL CAP VRP FUND | |
| Put Options | | CONTRACTS | | | PREMIUMS | | | CONTRACTS | | | PREMIUMS | |
Outstanding, beginning of period | | | 1,589 | | | $ | 1,870,244 | | | | 1,040 | | | $ | 931,337 | |
Options written | | | 200,636 | | | | 244,579,007 | | | | 128,739 | | | | 107,354,530 | |
Options terminated in closing transactions | | | (167,088 | ) | | | (208,961,115 | ) | | | (107,348 | ) | | | (93,480,132 | ) |
Options exercised | | | (4,439 | ) | | | (5,188,330 | ) | | | (7,169 | ) | | | (5,984,573 | ) |
Options expired | | | (29,234 | ) | | | (30,194,969 | ) | | | (14,214 | ) | | | (7,649,851 | ) |
| | | | | | | | |
Outstanding, end of period | | | 1,464 | | | $ | 2,104,837 | | | | 1,048 | | | $ | 1,171,311 | |
| | | | | | | | | | | | | | | | |
| | | INTERNATIONAL DEVELOPED
MARKETS VRP FUND | | | EMERGING MARKETS
VRP FUND | |
| Put Options | | CONTRACTS | | | PREMIUMS | | | CONTRACTS | | | PREMIUMS | |
Outstanding, beginning of period | | | 1,077 | | | $ | 880,460 | | | | 9,023 | | | $ | 305,488 | |
Options written | | | 116,167 | | | | 75,422,017 | | | | 876,133 | | | | 36,053,144 | |
Options terminated in closing transactions | | | (83,282 | ) | | | (59,100,703 | ) | | | (702,235 | ) | | | (30,075,215 | ) |
Options exercised | | | (11,245 | ) | | | (7,016,573 | ) | | | (955 | ) | | | (29,030 | ) |
Options expired | | | (21,097 | ) | | | (8,483,430 | ) | | | (168,326 | ) | | | (5,581,847 | ) |
| | | | | | | | |
Outstanding, end of period | | | 1,620 | | | $ | 1,701,771 | | | | 13,640 | | | $ | 672,540 | |
Statement of Assets and Liabilities — Values of Derivatives at October 31, 2015
| | | | | | | | | | | | |
| | | ASSET DERIVATIVES | | | LIABILITY DERIVATIVES | |
| | | STATEMENT OF
ASSETS AND LIABILITIES
LOCATION | | FAIR VALUE | | | STATEMENT OF
ASSETS AND LIABILITIES
LOCATION | | FAIR VALUE | |
Reinsurance Fund | | | | | | | | | | |
| | Net assets—Unrealized appreciation on futures* | | $ | 287,534 | | | Net assets—Unrealized depreciation on futures* | | $ | 12,799 | |
| | | | | | | | | | | | |
Total | | | | $ | 287,534 | | | | | $ | 12,799 | |
High Yield Fund | | | | | | | | | | |
| | N/A | | $ | — | | | Net assets—Unrealized depreciation on futures* | | $ | 11,636 | |
| | | | | | | | | | | | |
Total | | | | $ | — | | | | | $ | 11,636 | |
U.S. Large Cap VRP Fund | | | | | | | | | | |
| | N/A | | $ | — | | | Options written, at Fair Value | | $ | 2,672,896 | |
| | | | | | | | | | | | |
Total | | | | $ | — | | | | | $ | 2,672,896 | |
U.S. Small Cap VRP Fund | | | | | | | | | | |
| | N/A | | $ | — | | | Options written, at Fair Value | | $ | 1,243,010 | |
| | | | | | | | | | | | |
Total | | | | $ | — | | | | | $ | 1,243,010 | |
| | | | | | | | | | | | | | | | |
| | Stone Ridge Funds | | | | | | Annual Report | | | | | | October 31, 2015 | | |
| | | | | | | | | | |
68
| | |
| Notes to Financial Statements | | October 31, 2015 |
| | | | | | | | | | | | |
| | | ASSET DERIVATIVES | | | LIABILITY DERIVATIVES | |
| | | STATEMENT OF
ASSETS AND LIABILITIES
LOCATION | | FAIR VALUE | | | STATEMENT OF
ASSETS AND LIABILITIES
LOCATION | | FAIR VALUE | |
International Developed Markets VRP Fund | | | | | | | | | | |
| | N/A | | $ | — | | | Options written, at Fair Value | | $ | 1,465,610 | |
| | | | | | | | | | | | |
Total | | | | $ | — | | | | | $ | 1,465,610 | |
Emerging Markets VRP Fund | | | | | | | | | | |
| | N/A | | $ | — | | | Options written, at Fair Value | | $ | 758,867 | |
| | | | | | | | | | | | |
Total | | | | $ | — | | | | | $ | 758,867 | |
| * | Reflects cumulative unrealized appreciation (depreciation) of futures contracts as reported in the Schedule of Investments. Only the current day’s variation margin is reflected in the Statement of Assets and Liabilities. |
The effect of derivative instruments on the Statement of Operations for the period ended October 31, 2015.
| | | | | | | | | | | | | | | | | | | | | | | | |
AMOUNT OF REALIZED GAIN OR (LOSS)
ON DERIVATIVES TRANSACTIONS | |
| | | FOREIGN EXCHANGE FUTURES CONTRACTS | | | EQUITY
INDEX
FUTURES
CONTRACTS | | | U.S.
TREASURY
FUTURES
CONTRACTS | | | PURCHASED
OPTIONS | | | WRITTEN
OPTIONS | | | TOTAL | |
Reinsurance Fund | | $ | (951,531 | ) | | $ | 408,923 | | | $ | (233,774 | ) | | $ | — | | | $ | — | | | $ | (776,382 | ) |
High Yield Fund | | | (21,631 | ) | | | | | | | (239,508 | ) | | | | | | | | | | | (261,139 | ) |
U.S. Large Cap VRP Fund | | | — | | | | (297,392 | ) | | | — | | | | — | | | | 26,051,616 | | | | 25,754,224 | |
U.S. Small Cap VRP Fund | | | — | | | | 823,500 | | | | — | | | | — | | | | 7,901,098 | | | | 8,724,598 | |
International Developed Markets VRP Fund | | | — | | | | (1,112,291 | ) | | | — | | | | — | | | | 6,324,254 | | | | 5,211,963 | |
Emerging Markets VRP Fund | | | — | | | | (32,685 | ) | | | — | | | | 56,767 | | | | (4,465,014 | ) | | | (4,440,932 | ) |
| | | | | | | | | | | | | | | | | | | | | | | | |
CHANGE IN UNREALIZED APPRECIATION OR (DEPRECIATION)
ON DERIVATIVES TRANSACTIONS | |
| | | FOREIGN EXCHANGE FUTURES CONTRACTS | | | EQUITY
INDEX FUTURES CONTRACTS | | | U.S.
TREASURY
FUTURES
CONTRACTS | | | PURC
HASED OPTIONS | | | WRITTEN OPTIONS | | | TOTAL | |
Reinsurance Fund | | $ | 287,534 | | | $ | (298,331 | ) | | $ | (12,799 | ) | | $ | — | | | $ | — | | | $ | (23,596 | ) |
High Yield Fund | | | — | | | | — | | | | (11,636 | ) | | | — | | | | — | | | | (11,636 | ) |
U.S. Large Cap VRP Fund | | | — | | | | — | | | | — | | | | — | | | | (769,690 | ) | | | (769,690 | ) |
U.S. Small Cap VRP Fund | | | — | | | | — | | | | — | | | | — | | | | (346,721 | ) | | | (346,721 | ) |
International Developed Markets VRP Fund | | | — | | | | — | | | | — | | | | — | | | | 54,766 | | | | 54,766 | |
Emerging Markets VRP Fund | | | — | | | | — | | | | — | | | | — | | | | (107,558 | ) | | | (107,558 | ) |
(b) Offsetting on the Statement of Assets and Liabilities Accounting Standards Update No. 2011-11 “Disclosures about Offsetting Assets and Liabilities” (“ASU 2011-11”) intended to help investors and other financial statement users better assess the effect or potential effect of offsetting arrangements on a fund’s financial position. ASU 2011-11 requires entities to disclosure both gross and net information about both instruments and transactions eligible for offset on the Statement of Assets and Liabilities, and disclose instruments and transactions subject to master netting or similar agreements. In addition, in January 2013, the FASB issued Accounting Standards Update No. 2013-1 “Clarifying the Scope of Offsetting Assets and Liabilities” (“ASU 2013-1”), specifying exactly which transactions are subject to offsetting disclosures. The scope of the disclosure requirement is limited to derivative instruments, repurchase agreements and
| | | | | | | | | | | | | | | | |
| | Stone Ridge Funds | | | | | | Annual Report | | | | | | October 31, 2015 | | |
| | | | | | | | | | |
69
| | |
| Notes to Financial Statements | | October 31, 2015 |
reverse repurchase agreements, and securities lending transactions. These agreements specify collateral posting arrangements. Under the agreements, collateral is routinely transferred if the total net exposure to certain transactions (net of existing collateral already in place) governed under an agreement with a counterparty in a given account exceeds a specified threshold.
The Funds are not subject to any Master Netting Arrangements, therefore, no additional disclosure is required.
(c) Use of Estimates The preparation of the financial statements in conformity with GAAP requires management to make estimates and assumptions that affect the reported amounts of assets and liabilities and disclosure of contingent assets and liabilities at the date of the financial statements and the reported amounts of increases and decreases in net assets from operations during the reporting period. Actual results could differ from those estimates.
(d) Indemnifications In the normal course of business, the Funds enter into contracts that contain a variety of representations which provide general indemnifications. The Funds’ maximum exposure under these arrangements cannot be known; however, the Funds expect any risk of loss to be remote.
(e) Federal Income Taxes The Funds intend to qualify as “regulated investment companies” under Subchapter M of the Internal Revenue Code of 1986, as amended. If so qualified, the Funds will not be subject to federal income tax to the extent they distribute substantially all of their net investment income and capital gains to shareholders. Therefore, no federal income tax provision is required.
(f) Event-Linked Bonds Event-linked bonds are variable rate debt securities for which the return of principal and payment of interest are contingent on the non-occurrence of a specified trigger event(s) that leads to economic and/or human loss, such as an earthquake of a particular magnitude or a hurricane of a specific category. The most common type of event-linked bonds is known as “catastrophe” or “CAT” bonds. In most cases, the trigger event(s) will not be deemed to have occurred unless the event(s) happened in a particular geographic area and was of a certain magnitude (based on independent scientific readings) or caused a certain amount of actual or modeled loss. If the trigger event(s) occurs prior to a bond’s maturity, the Funds may lose all or a portion of its principal and forgo additional interest payments. In this regard, event-linked bonds typically have a special condition that states that if the issuer (i.e., an insurance or reinsurance company) suffers a loss from a particular pre-defined catastrophe, then the issuer’s obligation to pay interest and/or repay the principal is either deferred or completely forgiven. For example, if a fund holds a bond which covers an insurer’s losses due to a hurricane with a “trigger” at $1 billion and a hurricane hits causing $1 billion or more in losses to such insurer, then the fund will lose all or a portion of its principal invested in the bond and forgo any future interest payments. If the trigger event(s) does not occur, the fund will recover its principal plus interest. Interest typically accrues and is paid on a quarterly basis. Although principal typically is repaid only on the maturity date, it may be repaid in installments, depending on the terms of the bond. The Funds may invest in event-linked bonds directly or indirectly through certain derivative instruments. Event-linked swaps are derivative instruments that are typically contingent, or formulaically related to defined trigger events. Trigger events include hurricanes, earthquakes, mortality/longevity, multiperil and other weather-related phenomena.
(g) Quota Shares Quota shares are a form of proportional reinsurance in which an investor participates in the premiums and losses of a reinsurer’s portfolio according to a pre-defined percentage. For example, under a 20% quota-share agreement, a special purpose vehicle (“SPV”) would obtain 20% of all premiums of the subject portfolio while being responsible for 20% of all claims, and the fund, as holder of a Quota Share Note issued by the SPV, would be entitled to its pro rata share of the premiums received by the SPV and would be responsible for its pro rata share of the claims up to the total amount invested.
(h) Distributions to Shareholders The Funds intend to distribute to their shareholders any net investment income and any net realized long- or short-term capital gains, if any, at least annually. Distributions are recorded on ex-dividend date. The Funds each may periodically make reclassifications among certain of their capital accounts as a result of the characterization of certain income and realized gains determined annually in accordance with federal tax regulations that may differ from GAAP.
(i) Foreign Securities and Currency Transactions The Funds’ books and records are maintained in U.S. dollars. Foreign currency denominated transactions (i.e. market value of investment securities, assets and liabilities, purchases
| | | | | | | | | | | | | | | | |
| | Stone Ridge Funds | | | | | | Annual Report | | | | | | October 31, 2015 | | |
| | | | | | | | | | |
70
| | |
| Notes to Financial Statements | | October 31, 2015 |
and sales of investment securities, and income and expenses) are translated into U.S. dollars at the current rate of exchange. The Funds isolate that portion of results of operations resulting from changes in foreign exchange rates on investments from the fluctuations arising from changes in market prices of securities held and it is reported as realized gains on currency translation and change in unrealized appreciation on foreign currency related items on the Funds’ statement of operations.
The Reinsurance Funds may invest in event-linked securities issued by foreign sovereigns and foreign entities that are corporations, partnerships, trusts or other types of business entities. Because the majority of event-linked security issuers are domiciled outside the United States, the Reinsurance Funds will normally invest significant amounts of their assets in non-U.S. entities. Certain SPVs in which the Funds invest may be sponsored by non-U.S. ceding insurers that are not subject to the same regulation as that to which U.S. ceding insurers are subject. Such SPVs may pose a greater risk of loss, for example due to less stringent underwriting and/or risk-retention requirements. The Reinsurance Funds’ investments consist primarily of event-linked bonds which provide the Reinsurance Funds with contractual rights under the terms of the bond issuance. While the contractual rights of event-linked bonds issued are similar whether they are issued by a U.S. issuer or a non-U.S. issuer, there may be certain additional risks associated with non-U.S. issuers. For example, foreign issuers could be affected by factors not present in the U.S., including expropriation, confiscatory taxation, lack of uniform accounting and auditing standards, less publicly available financial and other information, potential difficulties in enforcing contractual obligations, and increased costs to enforce applicable contractual obligations outside the U.S. Settlements of securities transactions in foreign countries are subject to risk of loss, may be delayed and are generally less frequent than in the U.S., which could affect the liquidity of the Reinsurance Funds’ assets.
The International VRP Funds invest primarily in foreign issued securities. Investments in foreign (non-U.S.) issuers involve risks not generally associated with investment in the securities of the U.S. companies, including risks relating to political, social and economic developments affecting issuers located in foreign countries and differences between U.S. and foreign regulatory requirements and market practices, including fluctuations in foreign currency exchange rates and regulations, or foreign withholding taxes. Investing in foreign securities may result in the Fund experiencing more rapid and extreme changes in value than a fund that invests exclusively in securities of the U.S. issuers.
If the Funds invest in foreign issuers by purchasing American Depositary Receipts (“ADRs”) (dollar-denominated depositary receipts issued generally by banks and representing the deposit with the bank of a security of a non-U.S. issuer; ADRs are publicly traded on exchanges or over-the counter in the United States), the Funds are exposed to credit risk with respect to the issuer of the ADR, in addition to the risks of the underlying foreign securities.
(j) Allocation of Income, Expenses, Gains/Losses Income, expenses (other than those deemed attributable to a specific share class), and gains and losses of each fund are allocated daily to each share class based upon the ratio of net assets represented by each class as a percentage of the net assets of each fund. Expenses deemed directly attributable to a class of shares are recorded by the specific class. Most expenses are allocated based on average net assets, with the exception of 12b-1 fees, which are expensed at 0.15% of average daily net assets of the Class M shares.
(k) Other Investment transactions are recorded on the trade date. Dividend income, less any foreign tax withheld, is recognized on the ex-dividend date and interest income is recognized on an accrual basis, including amortization/accretion of premiums or discounts. Discounts and premiums on securities purchased are amortized over the lives of the respective securities using the constant yield method.
Net investment income, other than class specific expenses, and realized and unrealized gains and losses are allocated daily to each class of shares based upon the relative NAV of outstanding shares of each class of shares at the beginning of the day.
(l) Restricted Securities The Funds may invest a substantial portion of their assets in securities that are restricted, but eligible for purchase and sale by certain qualified buyers pursuant to Rule 144A under the Securities Act of 1933, as amended, as well as other restricted securities. Restricted securities may be resold in transactions that are exempt from registration under Federal securities laws or if the securities are publically registered. Restricted securities may be deemed illiquid.
| | | | | | | | | | | | | | | | |
| | Stone Ridge Funds | | | | | | Annual Report | | | | | | October 31, 2015 | | |
| | | | | | | | | | |
71
| | |
| Notes to Financial Statements | | October 31, 2015 |
(m) REIT Distributions The character of distributions received from real estate investment trusts (“REITs”) held by the Funds is generally comprised of net investment income, capital gains, and return of capital. It is the policy of the Funds to estimate the character of distributions received from underlying REITs based on historical data provided by the REITs. After each calendar year end, REITs report the actual tax character of these distributions. Differences between the estimated and actual amounts reported by the REITs are reflected in the Funds’ records in the year in which they are reported by the REITs by adjusting related investment cost basis, capital gains and income, as necessary.
3. Federal Tax Matters
Provisions for federal income taxes or excise taxes have not been made since the Funds have elected to be taxed as Regulated Investment Companies and intend to distribute substantially all taxable income to shareholders and otherwise comply with the provisions of the Internal Revenue Code applicable to Regulated Investment Companies. Distributions from net realized gains for book purposes may include short-term capital gains which are included as ordinary income to shareholders for tax purposes. Additionally, U.S. generally accepted accounting principles require that certain components of net assets relating to permanent differences be reclassified between financial and tax reporting. The reclassifications have no effect on net assets or NAV per share.
For the period ended October 31, 2015, the effect of permanent “book/tax” reclassifications resulted in increases and decreases to components of the Funds’ net assets as follows:
| | | | | | | | | | | | |
| | | UNDISTRIBUTED
NET INVESTMENT
INCOME/(LOSS) | | | ACCUMULATED
NET REALIZED
GAIN/(LOSS) | | | PAID IN
CAPITAL | |
Reinsurance Fund | | $ | 8,406,704 | | | $ | (8,406,704 | ) | | $ | — | |
High Yield Fund | | | 3,679,892 | | | | (3,679,892 | ) | | | — | |
U.S. Large Cap VRP Fund | | | 7,146,770 | | | | (7,146,770 | ) | | | — | |
U.S. Small Cap VRP Fund | | | 2,002,353 | | | | (2,002,353 | ) | | | — | |
U.S. VRP Master Fund | | | (109,668 | ) | | | 109,668 | | | | — | |
International Developed Markets VRP Fund | | | 2,420,989 | | | | (2,420,989 | ) | | | — | |
Emerging Markets VRP Fund | | | 520,056 | | | | (2,957 | ) | | | (517,099 | ) |
International VRP Master Fund | | | 1,776 | | | | (1,776 | ) | | | — | |
Global Equity VRP Master Fund | | | 149,258 | | | | (123,587 | ) | | | (25,671 | ) |
These differences primarily relate to foreign currency gains/losses, investments in passive foreign investment companies (“PFICs”), 1256 options contracts, and REIT adjustments and net operating losses.
As of October 31, 2015, the components of accumulated earnings (losses) for income tax purposes were as follows:
| | | | | | | | | | | | | | | | | | | | | | | | | | | | | | | | | | | | |
| | | REINSURANCE
FUND | | | HIGH
YIELD
FUND | | | U.S. LARGE
CAP VRP
FUND | | | U.S. SMALL
CAP VRP
FUND | | | U.S. VRP
MASTER
FUND | | | INTER
NATIONAL
DEVELOPED
MARKETS
VRP
FUND | | | EMERGING
MARKETS
VRP FUND | | | INTER
NATIONAL
VRP
MASTER
FUND | | | GLOBAL
EQUITY
VRP
MASTER
FUND | |
Tax cost of Investments | | $ | 1,022,524,235 | | | $ | 494,586,210 | | | $ | 372,580,039 | | | $ | 130,891,033 | | | $ | 187,525,717 | | | $ | 111,532,807 | | | $ | 51,152,828 | | | $ | 30,365,581 | | | $ | 48,090,462 | |
Unrealized Appreciation | | | 31,845,049 | | | | 17,707,376 | | | | 12,308,627 | | | | 1,024,674 | | | | 11,481,798 | | | | 36,834 | | | | 87,727 | | | | 447,987 | | | | 1,088,009 | |
Unrealized Depreciation | | | (36,659,607 | ) | | | (19,534,856 | ) | | | (4,165,434 | ) | | | (507,785 | ) | | | (374,390 | ) | | | (154,270 | ) | | | (143,959 | ) | | | (1,349,500 | ) | | | (848,238 | ) |
Net unrealized appreciation (depreciation) | | | (4,814,558 | ) | | | (1,827,480 | ) | | | 8,143,193 | | | | 516,889 | | | | 11,107,408 | | | | (117,436 | ) | | | (56,232 | ) | | | (901,513 | ) | | | 239,771 | |
Undistributed ordinary income | | | 35,648,289 | | | | 17,251,265 | | | | — | | | | — | | | | — | | | | — | | | | — | | | | — | | | | 368,786 | |
Undistributed long-term gains | | | — | | | | — | | | | 20,542,299 | | | | 5,009,074 | | | | 2,575,765 | | | | 1,803,609 | | | | — | | | | — | | | | 330,571 | |
Total distributable earnings | | | 35,648,289 | | | | 17,251,265 | | | | 20,542,299 | | | | 5,009,074 | | | | 2,575,765 | | | | 1,803,609 | | | | — | | | | — | | | | 699,357 | |
Other accumulated loss | | | (6,302,512 | ) | | | (1,864,712 | ) | | | (2,885,925 | ) | | | (1,667,703 | ) | | | — | | | | (705,331 | ) | | | (5,221,249 | ) | | | (39,251 | ) | | | — | |
Total accumulated earnings | | $ | 24,531,219 | | | $ | 13,559,073 | | | $ | 25,799,567 | | | $ | 3,858,260 | | | $ | 13,683,173 | | | $ | 980,842 | | | $ | (5,277,481 | ) | | $ | (940,764 | ) | | $ | 939,128 | |
| | | | | | | | | | | | | | | | |
| | Stone Ridge Funds | | | | | | Annual Report | | | | | | October 31, 2015 | | |
| | | | | | | | | | |
72
| | |
| Notes to Financial Statements | | October 31, 2015 |
The difference between book-basis and tax-basis unrealized appreciation is attributable primarily to mark-to-market adjustments on PFICs, wash sales, and return of capital from underlying investments.
The tax character of distributions paid during the period ended October 31, 2015 was as follows:
| | | | | | | | | | | | | | | | |
| | | ORDINARY
INCOME | | | LONG TERM
CAPITAL GAIN | | | RETURN OF
CAPITAL | | | TOTAL | |
Reinsurance Fund | | $ | 59,717,142 | | | $ | — | | | $ | — | | | $ | 59,717,142 | |
High Yield Fund | | | 29,047,570 | | | | — | | | | — | | | | 29,047,570 | |
U.S. Large Cap VRP Fund | | | 4,016,372 | | | | 5,922,854 | | | | — | | | | 9,939,226 | |
U.S. Small Cap VRP Fund | | | 1,263,965 | | | | 30,192 | | | | — | | | | 1,294,157 | |
U.S. VRP Master Fund | | | 1,958,774 | | | | 5,859,060 | | | | — | | | | 7,817,834 | |
International Developed Markets VRP Fund | | | 858,815 | | | | — | | | | — | | | | 858,815 | |
Emerging Markets VRP Fund | | | — | | | | — | | | | 454,169 | | | | 454,169 | |
International VRP Master Fund | | | 129,251 | | | | 3,352 | | | | 104,975 | | | | 237,578 | |
Global Equity VRP Master Fund | | | 315,599 | | | | — | | | | — | | | | 315,599 | |
The tax character of distributions paid during the period ended October 31, 2014 was as follows:
| | | | | | | | | | | | | | | | |
| | | ORDINARY
INCOME | | | LONG TERM
CAPITAL GAIN | | | RETURN OF
CAPITAL | | | TOTAL | |
Reinsurance Fund | | $ | 32,322,188 | | | $ | — | | | $ | — | | | $ | 32,322,188 | |
High Yield Fund | | | 15,946,420 | | | | — | | | | — | | | | 15,946,420 | |
U.S. Large Cap VRP Fund | | | 11,465,960 | | | | 18,337,807 | | | | — | | | | 29,803,767 | |
U.S. Small Cap VRP Fund | | | 1,248,628 | | | | 7,574,243 | | | | 1,855,724 | | | | 10,678,595 | |
U.S. VRP Master Fund | | | 5,267,297 | | | | 7,266,372 | | | | — | | | | 12,533,669 | |
International Developed Markets VRP Fund | | | 1,366,795 | | | | 115,567 | | | | 1,234,422 | | | | 2,716,784 | |
Emerging Markets VRP Fund | | | 1,336,027 | | | | — | | | | 37,668 | | | | 1,373,695 | |
International VRP Master Fund | | | 566,265 | | | | 25,017 | | | | 242,263 | | | | 833,545 | |
At October 31, 2015 certain Funds have tax basis capital losses which may be carried forward indefinitely to offset future capital gains as shown below:
| | | | | | | | | | | | |
| | | SHORT-TERM | | | LONG-TERM | | | TOTAL | |
Reinsurance Fund | | $ | (1,276,403 | ) | | $ | (10,309,297 | ) | | $ | (11,585,700 | ) |
High Yield Fund | | | (385,785 | ) | | | (4,497,842 | ) | | | (4,883,627 | ) |
U.S. Large Cap VRP Fund | | | — | | | | — | | | | — | |
U.S. Small Cap VRP Fund | | | — | | | | — | | | | — | |
U.S. VRP Master Fund | | | — | | | | — | | | | — | |
International Developed Markets VRP Fund | | | — | | | | — | | | | — | |
Emerging Markets VRP Fund | | | (4,421,345 | ) | | | (16,023 | ) | | | (4,437,368 | ) |
International VRP Master Fund | | | — | | | | — | | | | — | |
Global Equity VRP Master Fund | | | — | | | | — | | | | — | |
To the extent that the Funds listed above may realize future net capital gains, those gains will be offset by any of their unused respective capital loss carryforwards.
| | | | | | | | | | | | | | | | |
| | Stone Ridge Funds | | | | | | Annual Report | | | | | | October 31, 2015 | | |
| | | | | | | | | | |
73
| | |
| Notes to Financial Statements | | October 31, 2015 |
At October 31, 2015 certain Funds deferred, on a tax basis, ordinary late-year losses. These losses are deemed to arise on November 1, 2015.
| | | | |
| | | | |
Reinsurance Fund | | $ | — | |
High Yield Fund | | | — | |
U.S. Large Cap VRP Fund | | | (2,348,924 | ) |
U.S. Small Cap VRP Fund | | | (1,594,557 | ) |
U.S. VRP Master Fund | | | — | |
International Developed Markets VRP Fund | | | (664,737 | ) |
Emerging Markets VRP Fund | | | (698,117 | ) |
International VRP Master Fund | | | (39,251 | ) |
Global Equity VRP Master Fund | | | — | |
There is no tax liability resulting from unrecognized tax benefits relating to uncertain income tax positions taken or expected to be taken on the tax return for the fiscal period-end October 31, 2015, or for any other tax years which are open for exam. As of October 31, 2015 open tax years include the periods ended October 31, 2014 and 2015. The Funds recognize interest and penalties, if any, related to unrecognized tax benefits as income tax expense in the Statement of Operations. During the period, the Funds did not incur any interest or penalties.
4. Agreements
(a) Investment Advisory Agreement Stone Ridge Asset Management LLC (“Stone Ridge” or the “Adviser”) is the investment adviser of the Funds. The Adviser was organized as a Delaware limited liability company in 2012. The Adviser’s primary business is to provide a variety of investment management services, including an investment program for the Funds. The Adviser is responsible for all business activities and oversight of the investment decisions made for the Funds.
In return for providing management services to the Funds, each of the Reinsurance Funds pays the Adviser an annual fee of 1.50% of that Fund’s average daily net assets and each of the U.S. VRP Funds and International VRP Funds pays the Adviser an annual fee of 1.25% of that Fund’s average daily net assets. The U.S. VRP Master Fund, International VRP Master Fund and the Global Equity VRP Master Fund do not pay an advisory fee to the Adviser.
Through February 28, 2016 for the Reinsurance Funds, U.S. VRP Funds, and the International VRP Portfolio of Funds, the Adviser has agreed to waive its management fee and/or pay or otherwise bear operating and other expenses of certain funds or classes thereof (excluding taxes, brokerage and transactional expenses, borrowing and other investment-related costs and fees including interest and commitment fees, short dividend expense, acquired fund fees, taxes, litigation and indemnification expenses, judgments and extraordinary expenses not incurred in the ordinary course of the Funds’ business) solely to the extent necessary to limit the Funds’ total annual fund operating expenses to 2.00% for Class I shares and 2.15% for Class M shares of each of the Reinsurance Funds, 1.75% for the Class I and 1.90% for the Class M shares of each of the U.S. VRP Funds and the International Developed Markets VRP Fund, 1.80% for the Class I and 1.95% for the Class M shares of the Emerging Markets VRP Fund, 0.25% for the Class I and 0.40% for the Class M shares of the International VRP Master Fund and 0.25% for the Class I shares and 0.40% for the Class M shares of the Global Equity VRP Master Fund. The Adviser shall be permitted to recover expenses attributable to a fund or a class thereof that the Adviser has borne in later periods to the extent that the expenses for a class of shares fall below the annual rate in effect at the time of the actual waiver/reimbursement. Under the expense limitation agreement, the Funds are not obligated to reimburse such expenses beyond three years from the end of the fiscal year in which the
| | | | | | | | | | | | | | | | |
| | Stone Ridge Funds | | | | | | Annual Report | | | | | | October 31, 2015 | | |
| | | | | | | | | | |
74
| | |
| Notes to Financial Statements | | October 31, 2015 |
Adviser waived a fee or reimbursed an expense. Any such recovery by the Adviser will not cause a class to exceed the annual limitation rate in effect at the time of the actual waiver/reimbursement. As of October 31, 2015, the Adviser has waived and recouped fees as follows:
| | | | | | | | |
| Fund | | REMAINING AMOUNT
TO BE RECOUPED
(EXPIRING
OCTOBER 31, 2017) | | | REMAINING AMOUNT
TO BE RECOUPED
(EXPIRING
OCTOBER 31, 2018) | |
Reinsurance Fund | | $ | — | | | $ | — | |
High Yield Fund | | | — | | | | — | |
U.S. Large Cap VRP Fund | | | — | | | | — | |
U.S. Small Cap VRP Fund | | | — | | | | (12,511 | ) |
International Developed Markets VRP Fund | | | (95,078 | ) | | | (126 | ) |
Emerging Markets VRP Fund | | | (171,182 | ) | | | (147,055 | ) |
International VRP Master Fund | | | (104,477 | ) | | | (61,235 | ) |
Global Equity VRP Master Fund | | | — | | | | (125,491 | ) |
(b) Distributor Quasar Distributors, LLC (the “Distributor”) serves as the Funds’ distributor.
(c) Administrator, Custodian, and Transfer Agent The custodian to the Trust is U.S. Bank, N.A. The administrator and transfer agent to the Trust is U.S. Bancorp Fund Services, LLC, an affiliate of U.S. Bank, N.A.
5. Distribution Plan
The Funds pay fees to the Distributor, on an ongoing basis as compensation for the services the Distributor renders and the expenses it bears in connection with the sale and distribution of Class M shares (“distribution fees”) and/or in connection with personal services rendered to Class M shareholders and the maintenance of shareholder accounts (“servicing fees”). These payments are made pursuant to a Distribution and Servicing Plan (“12b-1 Plan”) adopted by each Fund pursuant to Rule 12b-1 under the 1940 Act. The maximum annual rate at which the distribution and/or servicing fees may be paid under the 12b-1 Plan is 0.15% of each Fund’s average daily net assets attributable to the Class M Shares. Because 12b-1 fees are paid out of a Fund’s assets on an ongoing basis, over time these fees will increase the cost of your investment and may cost you more than other types of sales charges.
6. Offering Costs
Offering costs include state registration fees and legal fees regarding the preparation of the initial registration statement. Offering costs are accounted for as deferred costs until operations begin. Offering costs are then amortized to expense over twelve months on a straight-line basis. These offering expenses were advanced by the Adviser, subject to potential recovery (see Note 4). The offering expenses incurred by the International Developed Markets VRP Fund, the Emerging Markets VRP Fund, the International VRP Master Fund and the Global Equity VRP Master Fund are $82,819, $47,985, $50,683 and $99,406, respectively.
7. Related Parties
Certain officers of the Trust are also employees of the Adviser. The Officers, with the exception of a portion of the Chief Compliance Officer’s salary, are not compensated by the Trust.
| | | | | | | | | | | | | | | | |
| | Stone Ridge Funds | | | | | | Annual Report | | | | | | October 31, 2015 | | |
| | | | | | | | | | |
75
| | |
| Notes to Financial Statements | | October 31, 2015 |
8. Investment Transactions
The aggregate purchase and sales of securities (excluding short-term securities) by the Funds for the periods ended October 31, 2015 were as follows:
| | | | | | | | | | | | | | | | | | | | | | | | | | | | | | | | | | | | |
| | | REINSURANCE
FUND | | | HIGH YIELD
FUND | | | U.S. LARGE
CAP VRP
FUND | | | U.S. SMALL
CAP VRP
FUND | | | U.S. VRP
MASTER
FUND | | | INTERNATIONAL
DEVELOPED
MARKETS VRP
FUND | | | EMERGING
MARKETS
VRP FUND | | | INTERNATIONAL
VRP MASTER
FUND | | | GLOBAL
EQUITY VRP
MASTER
FUND | |
Purchases | | $ | 384,944,331 | | | $ | 214,549,302 | | | $ | 6,423,204 | | | $ | — | | | $ | 33,900,000 | | | $ | 1,066,894 | | | $ | 4,112,052 | | | $ | 8,055,179 | | | $ | 82,850,000 | |
Sales | | | 138,231,509 | | | | 48,863,851 | | | | 34,521,886 | | | | 221 | | | | 115,950,000 | | | | 920,685 | | | | 3,946,980 | | | | 3,800,000 | | | | 35,500,000 | |
U.S. Government Security Purchases | | | — | | | | — | | | | — | | | | — | | | | — | | | | — | | | | — | | | | — | | | | — | |
U.S. Government Security Sales | | | — | | | | — | | | | — | | | | — | | | | — | | | | — | | | | — | | | | — | | | | — | |
9. Capital Share Transactions
| | | | | | | | |
| REINSURANCE FUND - CLASS I | | YEAR ENDED
OCTOBER 31, 2015 | | | YEAR ENDED
OCTOBER 31, 2014 | |
Shares sold | | | 38,011,654 | | | | 21,744,252 | |
Shares issued to holders in reinvestment of dividends | | | 3,544,319 | | | | 1,887,253 | |
Shares redeemed | | | (14,877,808 | ) | | | (6,303,261 | ) |
Net increase in shares | | | 26,678,165 | | | | 17,328,244 | |
Shares outstanding: | | | | | | | | |
Beginning of year | | | 52,111,271 | | | | 34,783,027 | |
End of year | | | 78,789,436 | | | | 52,111,271 | |
| | | | | | | | |
| REINSURANCE FUND - CLASS M | | | | | | |
Shares sold | | | 10,849,404 | | | | 10,528,344 | |
Shares issued to holders in reinvestment of dividends | | | 1,473,234 | | | | 771,930 | |
Shares redeemed | | | (13,637,754 | ) | | | (4,110,882 | ) |
Net increase (decrease) in shares | | | (1,315,116 | ) | | | 7,189,392 | |
Shares outstanding: | | | | | | | | |
Beginning of year | | | 21,698,997 | | | | 14,509,605 | |
End of year | | | 20,383,881 | | | | 21,698,997 | |
| | | | | | | | |
| HIGH YIELD FUND - CLASS I | | | | | | |
Shares sold | | | 21,055,054 | | | | 11,644,614 | |
Shares issued to holders in reinvestment of dividends | | | 2,087,474 | | | | 1,051,284 | |
Shares redeemed | | | (5,247,057 | ) | | | (2,583,071 | ) |
Net increase in shares | | | 17,895,471 | | | | 10,112,827 | |
Shares outstanding: | | | | | | | | |
Beginning of year | | | 24,142,084 | | | | 14,029,257 | |
End of year | | | 42,037,555 | | | | 24,142,084 | |
| | | | | | | | |
| | | | | | | | | | | | | | | | |
| | Stone Ridge Funds | | | | | | Annual Report | | | | | | October 31, 2015 | | |
| | | | | | | | | | |
76
| | |
| Notes to Financial Statements | | October 31, 2015 |
| | | | | | | | |
| HIGH YIELD FUND - CLASS M | | YEAR ENDED
OCTOBER 31, 2015 | | | YEAR ENDED
OCTOBER 31, 2014 | |
Shares sold | | | 1,947,035 | | | | 2,565,412 | |
Shares issued to holders in reinvestment of dividends | | | 508,817 | | | | 311,953 | |
Shares redeemed | | | (3,551,850 | ) | | | (1,968,019 | ) |
Net increase (decrease) in shares | | | (1,095,998 | ) | | | 909,346 | |
Shares outstanding: | | | | | | | | |
Beginning of year | | | 6,791,627 | | | | 5,882,281 | |
End of year | | | 5,695,629 | | | | 6,791,627 | |
| | | | | | | | |
| U.S. LARGE CAP VRP FUND - CLASS I | | | | | | |
Shares sold | | | 8,498,041 | | | | 6,915,733 | |
Shares issued to holders in reinvestment of dividends | | | 230,243 | | | | 646,642 | |
Shares redeemed | | | (11,623,906 | ) | | | (3,730,450 | ) |
Net increase (decrease) in shares | | | (2,895,622 | ) | | | 3,831,925 | |
Shares outstanding: | | | | | | | | |
Beginning of year | | | 29,107,581 | | | | 25,275,656 | |
End of year | | | 26,211,959 | | | | 29,107,581 | |
| | | | | | | | |
| U.S. LARGE CAP VRP FUND - CLASS M | | | | | | |
Shares sold | | | 1,146,747 | | | | 2,849,250 | |
Shares issued to holders in reinvestment of dividends | | | 259,516 | | | | 735,260 | |
Shares redeemed | | | (3,625,240 | ) | | | (2,058,210 | ) |
Net increase (decrease) in shares | | | (2,218,977 | ) | | | 1,526,300 | |
Shares outstanding: | | | | | | | | |
Beginning of year | | | 10,827,782 | | | | 9,301,482 | |
End of year | | | 8,608,805 | | | | 10,827,782 | |
| | | | | | | | |
| U.S. SMALL CAP VRP FUND - CLASS I | | | | | | |
Shares sold | | | 4,798,685 | | | | 3,834,238 | |
Shares issued to holders in reinvestment of dividends | | | 32,482 | | | | 230,064 | |
Shares redeemed | | | (5,536,922 | ) | | | (1,977,591 | ) |
Net increase (decrease) in shares | | | (705,755 | ) | | | 2,086,711 | |
Shares outstanding: | | | | | | | | |
Beginning of year | | | 11,529,624 | | | | 9,442,913 | |
End of year | | | 10,823,869 | | | | 11,529,624 | |
| | | | | | | | |
| U.S. SMALL CAP VRP FUND - CLASS M | | | | | | |
Shares sold | | | 562,120 | | | | 282,224 | |
Shares issued to holders in reinvestment of dividends | | | 12,874 | | | | 105,624 | |
Shares redeemed | | | (332,477 | ) | | | (241,566 | ) |
Net increase in shares | | | 242,517 | | | | 146,282 | |
Shares outstanding: | | | | | | | | |
Beginning of year | | | 1,390,975 | | | | 1,244,693 | |
End of year | | | 1,633,492 | | | | 1,390,975 | |
| | | | | | | | |
| | | | | | | | | | | | | | | | |
| | Stone Ridge Funds | | | | | | Annual Report | | | | | | October 31, 2015 | | |
| | | | | | | | | | |
77
| | |
| Notes to Financial Statements | | October 31, 2015 |
| | | | | | | | |
| U.S. VRP MASTER FUND - CLASS I | | YEAR ENDED
OCTOBER 31, 2015 | | | YEAR ENDED
OCTOBER 31, 2014 | |
Shares sold | | | 6,710,245 | | | | 1,858,331 | |
Shares issued to holders in reinvestment of dividends | | | 196,515 | | | | 463,914 | |
Shares redeemed | | | (8,971,583 | ) | | | (708,181 | ) |
Net increase (decrease) in shares | | | (2,064,823 | ) | | | 1,614,064 | |
Shares outstanding: | | | | | | | | |
Beginning of year | | | 15,684,761 | | | | 14,070,697 | |
End of year | | | 13,619,938 | | �� | | 15,684,761 | |
| | | | | | | | |
| U.S. VRP MASTER FUND - CLASS M | | | | | | |
Shares sold | | | 1,202,672 | | | | 4,493,706 | |
Shares issued to holders in reinvestment of dividends | | | 238,071 | | | | 342,740 | |
Shares redeemed | | | (6,766,022 | ) | | | (2,244,556 | ) |
Net increase (decrease) in shares | | | (5,325,279 | ) | | | 2,591,890 | |
Shares outstanding: | | | | | | | | |
Beginning of year | | | 10,289,325 | | | | 7,697,435 | |
End of year | | | 4,964,046 | | | | 10,289,325 | |
| | | | | | | | |
| INTERNATIONAL DEVELOPED MARKETS VRP FUND - CLASS I(1) | | | | | PERIOD ENDED
OCTOBER 31, 2014 | |
Shares sold | | | 5,358,629 | | | | 6,492,042 | |
Shares issued to holders in reinvestment of dividends | | | 58,485 | | | | 204,689 | |
Shares redeemed | | | (2,448,123 | ) | | | (558,362 | ) |
Net increase in shares | | | 2,968,991 | | | | 6,138,369 | |
Shares outstanding: | | | | | | | | |
Beginning of period | | | 6,138,369 | | | | — | |
End of period | | | 9,107,360 | | | | 6,138,369 | |
| | | | | | | | |
| INTERNATIONAL DEVELOPED MARKETS VRP FUND - CLASS M(1) | | | | | | |
Shares sold | | | 330,924 | | | | 1,997,111 | |
Shares issued to holders in reinvestment of dividends | | | 18,787 | | | | 63,894 | |
Shares redeemed | | | (161,065 | ) | | | (122,276 | ) |
Net increase in shares | | | 188,646 | | | | 1,938,729 | |
Shares outstanding: | | | | | | | | |
Beginning of period | | | 1,938,729 | | | | — | |
End of period | | | 2,127,375 | | | | 1,938,729 | |
| | | | | | | | |
| EMERGING MARKETS VRP FUND - CLASS I(1) | | | | | | |
Shares sold | | | 2,884,018 | | | | 3,774,642 | |
Shares issued to holders in reinvestment of dividends | | | 36,793 | | | | 121,962 | |
Shares redeemed | | | (1,193,694 | ) | | | (262,844 | ) |
Net increase in shares | | | 1,727,117 | | | | 3,633,760 | |
Shares outstanding: | | | | | | | | |
Beginning of period | | | 3,633,760 | | | | — | |
End of period | | | 5,360,877 | | | | 3,633,760 | |
| | | | | | | | |
| | | | | | | | | | | | | | | | |
| | Stone Ridge Funds | | | | | | Annual Report | | | | | | October 31, 2015 | | |
| | | | | | | | | | |
78
| | |
| Notes to Financial Statements | | October 31, 2015 |
| | | | | | | | |
| EMERGING MARKETS VRP FUND - CLASS M(1) | | YEAR ENDED
OCTOBER 31, 2015 | | | PERIOD ENDED
OCTOBER 31, 2014 | |
Shares sold | | | 192,090 | | | | 373,527 | |
Shares issued to holders in reinvestment of dividends | | | 3,275 | | | | 9,527 | |
Shares redeemed | | | (218,445 | ) | | | (10,491 | ) |
Net increase (decrease) in shares | | | (23,080 | ) | | | 372,563 | |
Shares outstanding: | | | | | | | | |
Beginning of period | | | 372,563 | | | | — | |
End of period | | | 349,483 | | | | 372,563 | |
| | | | | | | | |
| INTERNATIONAL VRP MASTER FUND - CLASS I(1) | | | | | | |
Shares sold | | | 635,342 | | | | 663,588 | |
Shares issued to holders in reinvestment of dividends | | | 5,818 | | | | 17,910 | |
Shares redeemed | | | (250,171 | ) | | | (69,966 | ) |
Net increase in shares | | | 390,989 | | | | 611,532 | |
Shares outstanding: | | | | | | | | |
Beginning of period | | | 611,532 | | | | — | |
End of period | | | 1,002,521 | | | | 611,532 | |
| | | | | | | | |
| INTERNATIONAL VRP MASTER FUND - CLASS M(1) | | | | | | |
Shares sold | | | 326,637 | | | | 2,492,635 | |
Shares issued to holders in reinvestment of dividends | | | 14,737 | | | | 56,391 | |
Shares redeemed | | | (248,131 | ) | | | (548,610 | ) |
Net increase in shares | | | 93,243 | | | | 2,000,416 | |
Shares outstanding: | | | | | | | | |
Beginning of period | | | 2,000,416 | | | | — | |
End of period | | | 2,093,659 | | | | 2,000,416 | |
| | | | | | | | |
| GLOBAL EQUITY VRP MASTER FUND - CLASS I(2) | | PERIOD ENDED
OCTOBER 31, 2015 | | | | |
Shares sold | | | 7,268,519 | | | | | |
Shares issued to holders in reinvestment of dividends | | | 29,508 | | | | | |
Shares redeemed | | | (3,433,820 | ) | | | | |
Net increase in shares | | | 3,864,207 | | | | | |
Shares outstanding: | | | | | | | | |
Beginning of period | | | — | | | | | |
End of period | | | 3,864,207 | | | | | |
| | | | | | | | |
| GLOBAL EQUITY VRP MASTER FUND - CLASS M(2) | | | | | | |
Shares sold | | | 1,075,302 | | | | | |
Shares issued to holders in reinvestment of dividends | | | 1,560 | | | | | |
Shares redeemed | | | (135,787 | ) | | | | |
Net increase in shares | | | 941,075 | | | | | |
Shares outstanding: | | | | | | | | |
Beginning of period | | | — | | | | | |
End of period | | | 941,075 | | | | | |
| (1) | Commenced operations on February 11, 2014. |
| (2) | Commenced operations on November 14, 2014. |
| | | | | | | | | | | | | | | | |
| | Stone Ridge Funds | | | | | | Annual Report | | | | | | October 31, 2015 | | |
| | | | | | | | | | |
79
| | |
| Notes to Financial Statements | | October 31, 2015 |
10. Transactions with Affiliates
The following issuers are affiliated with the Funds; that is, the Adviser had control of 5% or more of the outstanding voting securities during the period ended October 31, 2015. As defined in Section (2)(a)(3) of the 1940 Act such issuers are:
| | | | | | | | | | | | | | | | | | | | | | | | | | | | |
| | | U.S. VRP Master Fund | | | | | | International VRP Master Fund | |
| | | U.S. Large
Cap VRP
Fund—Class I | | | U.S. Small
Cap VRP
Fund—Class I | | | Total | | | | | | International
Developed
Markets VRP
Fund—Class I | | | Stone Ridge
Emerging
Markets VRP
Fund—Class I | | | Total | |
| November 1, 2014 Balance | | | | | | | | | | | | | | | | | | | | | | | | | | | | |
Shares | | | 17,325,291 | | | | 9,065,224 | | | | | | | | | | | | 1,754,434 | | | | 853,068 | | | | | |
Cost | | $ | 176,787,239 | | | $ | 92,471,327 | | | $ | 269,258,566 | | | | | | | $ | 17,562,517 | | | $ | 8,561,229 | | | $ | 26,123,746 | |
| Additions | | | | | | | | | | | | | | | | | | | | | | | | | | | | |
Shares | | | 2,072,128 | | | | 1,144,300 | | | | | | | | | | | | 506,861 | | | | 336,061 | | | | | |
Cost | | $ | 22,000,000 | | | $ | 11,900,000 | | | | | | | | | | | $ | 4,970,041 | | | $ | 3,085,138 | | | | | |
| Reductions | | | | | | | | | | | | | | | | | | | | | | | | | | | | |
Shares | | | 7,265,636 | | | | 3,874,144 | | | | | | | | | | | | 297,072 | | | | 94,747 | | | | | |
Cost | | $ | 75,491,346 | | | $ | 39,949,952 | | | | | | | | | | | $ | 2,997,887 | | | $ | 972,406 | | | | | |
| October 31, 2015 Balance | | | | | | | | | | | | | | | | | | | | | | | | | | | | |
Shares | | | 12,131,783 | | | | 6,335,380 | | | | | | | | | | | | 1,964,223 | | | | 1,094,382 | | | | | |
Cost | | $ | 123,295,893 | | | $ | 64,421,375 | | | $ | 187,717,268 | | | | | | | $ | 19,534,671 | | | $ | 10,673,961 | | | $ | 30,208,632 | |
Value | | $ | 132,115,117 | | | $ | 66,268,075 | | | $ | 198,383,192 | | | | | | | $ | 19,504,736 | | | $ | 9,663,390 | | | $ | 29,168,126 | |
| Dividend Income | | $ | 1,554,832 | | | $ | 775,339 | | | $ | 2,330,171 | | | | | | | $ | 170,042 | | | $ | 85,137 | | | $ | 255,179 | |
| Realized Gain/(Loss) | | $ | 3,219,350 | (1) | | $ | (649,952 | ) | | $ | 2,569,398 | | | | | | | $ | (47,886 | ) | | $ | (122,406 | ) | | $ | (170,292 | ) |
| | | | | | | | | | | | | | | | | | | | |
| | | Global Equity VRP Master Fund | |
| | | U.S. Large
Cap VRP
Fund—Class I | | | U.S. Small
Cap VRP
Fund—Class I | | | International
Developed
Markets VRP
Fund—Class I | | | Stone Ridge
Emerging
Markets VRP
Fund—Class I | | | Total | |
| November 14, 2014 Balance(2) | | | | | | | | | | | | | | | | | | | | |
Shares | | | — | | | | — | | | | — | | | | — | | | | | |
Cost | | $ | — | | | $ | — | | | $ | — | | | $ | — | | | $ | — | |
| Additions | | | | | | | | | | | | | | | | | | | | |
Shares | | | 2,548,962 | | | | 1,340,645 | | | | 2,775,893 | | | | 1,538,002 | | | | | |
Cost | | $ | 26,950,000 | | | $ | 13,550,000 | | | $ | 27,150,000 | | | $ | 14,950,000 | | | | | |
| Reductions | | | | | | | | | | | | | | | | | | | | |
Shares | | | 1,072,886 | | | | 568,036 | | | | 1,164,453 | | | | 643,725 | | | | | |
Cost | | $ | 11,370,345 | | | $ | 5,750,858 | | | $ | 11,407,303 | | | $ | 6,353,569 | | | | | |
| October 31, 2015 Balance | | | | | | | | | | | | | | | | | | | | |
Shares | | | 1,476,076 | | | | 772,609 | | | | 1,611,440 | | | | 894,277 | | | | | |
Cost | | $ | 15,579,655 | | | $ | 7,799,142 | | | $ | 15,742,697 | | | $ | 8,596,431 | | | $ | 47,717,925 | |
Value | | $ | 16,074,468 | | | $ | 8,081,490 | | | $ | 16,001,599 | | | $ | 7,896,466 | | | $ | 48,054,023 | |
| Dividend Income | | $ | 112,537 | | | $ | 56,478 | | | $ | 112,692 | | | $ | 57,737 | | | $ | 339,444 | |
| Realized Gain/(Loss) | | $ | 360,968 | (3) | | $ | 199,141 | | | $ | 392,696 | | | $ | (253,567 | ) | | $ | 699,238 | |
| (1) | Includes $2,060,696 of long-term capital gain distributions. |
| (2) | Commencement of operations for the Global Equity VRP Master Fund. |
| (3) | Includes $331,313 of long-term capital gain distributions. |
11. Beneficial Ownership
The beneficial ownership, either directly or indirectly, of more than 25% of the voting securities of a fund creates a presumption of control of the fund, under Section 2(a)(9) of the 1940 Act. At October 31, 2015, U.S. VRP Master Fund held, for the benefit of its shareholders, 35% of the U.S. Large Cap VRP Fund and 51% of the U.S. Small Cap VRP Fund. The International VRP Master Fund held, for the benefit of its shareholders, 17% of the International Developed Markets VRP Fund and 19% of the Emerging Markets VRP Fund. The Global Equity VRP Master Fund held, for the benefit of its shareholders, 4% of the U.S. Large Cap VRP Fund, 6% of the U.S. Small Cap VRP Fund, 14% of the International Developed Markets VRP Fund and 16% of the Emerging Markets VRP Fund.
| | | | | | | | | | | | | | | | |
| | Stone Ridge Funds | | | | | | Annual Report | | | | | | October 31, 2015 | | |
| | | | | | | | | | |
80
| | |
| Notes to Financial Statements | | October 31, 2015 |
12. Subsequent Events Evaluation
In preparing these financial statements, the Fund has evaluated events and transactions for potential recognition or disclosure resulting from subsequent events through the date the financial statements were available to be issued. This evaluation did not result in any subsequent events that necessitated disclosures and/or adjustments.
| | | | | | | | | | | | | | | | |
| | Stone Ridge Funds | | | | | | Annual Report | | | | | | October 31, 2015 | | |
| | | | | | | | | | |
81
| | |
| Report of Independent Registered Public Accounting Firm |
The Board of Trustees and Shareholders of Stone Ridge Trust
We have audited the accompanying statements of assets and liabilities, including the schedules of investments, of Stone Ridge Reinsurance Risk Premium Fund, Stone Ridge High Yield Reinsurance Risk Premium Fund, Stone Ridge U.S. Large Cap Variance Risk Premium Fund, Stone Ridge U.S. Small Cap Variance Risk Premium Fund, Stone Ridge U.S. Variance Risk Premium Master Fund, Stone Ridge International Developed Markets Variance Risk Premium Fund, Stone Ridge Emerging Markets Variance Risk Premium Fund, Stone Ridge International Variance Risk Premium Master Fund, and Stone Ridge Global Equity Variance Risk Premium Master Fund (nine of the portfolios constituting Stone Ridge Trust) (collectively the Funds) as of October 31, 2015, and the related statements of operations for the Funds, statements of cash flows for the Stone Ridge Reinsurance Risk Premium Fund and the Stone Ridge High Yield Reinsurance Risk Premium Fund, statements of changes in net assets, and the financial highlights for the Funds for each of the periods indicated therein. These financial statements and financial highlights are the responsibility of the Funds’ management. Our responsibility is to express an opinion on these financial statements and financial highlights based on our audits.
We conducted our audits in accordance with the standards of the Public Company Accounting Oversight Board (United States). Those standards require that we plan and perform the audits to obtain reasonable assurance about whether the financial statements and financial highlights are free of material misstatement. We were not engaged to perform an audit of the Funds’ internal control over financial reporting. Our audits included consideration of internal control over financial reporting as a basis for designing audit procedures that are appropriate in the circumstances, but not for the purpose of expressing an opinion on the effectiveness of the Funds’ internal control over financial reporting. Accordingly, we express no such opinion. An audit also includes examining, on a test basis, evidence supporting the amounts and disclosures in the financial statements and financial highlights, assessing the accounting principles used and significant estimates made by management, and evaluating the overall financial statement presentation. Our procedures included confirmation of securities owned as of October 31, 2015, by correspondence with the custodian and brokers or by other appropriate auditing procedures where replies from brokers were not received. We believe that our audits provide a reasonable basis for our opinion.
In our opinion, the financial statements and financial highlights referred to above present fairly, in all material respects, the financial position of each of the respective Funds constituting Stone Ridge Trust at October 31, 2015, the results of their operations, cash flows, changes in their net assets, and the financial highlights for each of the periods indicated therein, in conformity with U.S. generally accepted accounting principles.

New York, NY
December 30, 2015
82
| | |
| Expense Examples (Unaudited) |
As a shareholder of the Stone Ridge Funds ( each a “Fund”, together the “Funds”), you incur ongoing costs, including investment advisory fees, distribution and/or shareholder servicing fees, and other Fund expenses, which are indirectly paid by shareholders. This example is intended to help you understand your ongoing costs (in dollars) of investing in a Fund and to compare these costs with the ongoing costs of investing in other mutual funds.
The example is based on an investment of $1,000 invested at the beginning of the period and held the entire period from May 1, 2015 through October 31, 2015.
Actual Expenses
The first line of each of the tables below provides information about actual account values and actual expenses. However, the table does not include shareholder specific fees, such as the $15.00 fee charged for wire redemptions by the Funds’ transfer agent. The table also does not include portfolio trading commissions and related trading costs. You may use the information in this line, together with the amount you invested, to estimate the expenses that you paid over the period. Simply divide your account value by $1,000 (for example, an $8,600 account value divided by $1,000 = 8.6), then multiply the result by the number in the first line under the heading entitled “Expenses Paid During Period” to estimate the expenses you paid on your account during the period.
Hypothetical Example For Comparison Purposes
The second line on each table below provides information about hypothetical account values and hypothetical expenses based on the actual expense ratios for each share class of the Funds and an assumed rate of return of 5% per year before expenses, which is not the Funds’ actual return. The hypothetical account values and expenses may not be used to estimate the actual ending account balance or expenses you paid for the period. You may use this information to compare the ongoing costs of investing in the Funds and other funds. To do so, compare this 5% hypothetical example with the 5% hypothetical examples that appear in the shareholder reports of the other fund. Please note that the expenses shown in the table are meant to highlight your ongoing costs only and do not reflect any transactional costs, such as sales charges (loads), redemption fees, or exchange fees. Therefore, the second line of the table is useful in comparing ongoing costs only, and will not help you determine the relevant total cost of owning different funds.
Stone Ridge Reinsurance Risk Premium Fund — Class I
| | | | | | | | | | | | |
| | | BEGINNING
ACCOUNT
VALUE
MAY 1, 2015 | | | ENDING
ACCOUNT
VALUE
OCTOBER 31, 2015 | | | EXPENSES
PAID DURING
PERIOD*
MAY 1, 2015 –
OCTOBER 31, 2015 | |
Actual | | $ | 1,000.00 | | | $ | 1,034.60 | | | $ | 8.46 | |
Hypothetical (5% annual return before expenses) | | $ | 1,000.00 | | | $ | 1,016.89 | | | $ | 8.39 | |
| * | Expenses are equal to the Fund’s annualized six-month expense ratio of 1.65%, multiplied by the average account value over the period, multiplied by 184/365 to reflect the partial year period. |
Stone Ridge Reinsurance Risk Premium Fund — Class M
| | | | | | | | | | | | |
| | | BEGINNING
ACCOUNT
VALUE
MAY 1, 2015 | | | ENDING ACCOUNT
VALUE
OCTOBER 31, 2015 | | | EXPENSES
PAID DURING
PERIOD*
MAY 1, 2015 –
OCTOBER 31, 2015 | |
Actual | | $ | 1,000.00 | | | $ | 1,033.80 | | | $ | 9.18 | |
Hypothetical (5% annual return before expenses) | | $ | 1,000.00 | | | $ | 1,016.18 | | | $ | 9.10 | |
| * | Expenses are equal to the Fund’s annualized six-month expense ratio of 1.79%, multiplied by the average account value over the period, multiplied by 184/365 to reflect the partial year period. |
| | | | | | | | | | | | | | | | |
| | Stone Ridge Funds | | | | | | Annual Report | | | | | | October 31, 2015 | | |
| | | | | | | | | | |
83
| | |
| Expense Examples (Unaudited) |
Stone Ridge High Yield Reinsurance Risk Premium Fund — Class I
| | | | | | | | | | | | |
| | | BEGINNING
ACCOUNT
VALUE
MAY 1, 2015 | | | ENDING ACCOUNT
VALUE
OCTOBER 31, 2015 | | | EXPENSES PAID
DURING PERIOD*
MAY 1, 2015 –
OCTOBER 31, 2015 | |
Actual | | $ | 1,000.00 | | | $ | 1,040.20 | | | $ | 8.64 | |
Hypothetical (5% annual return before expenses) | | $ | 1,000.00 | | | $ | 1,016.74 | | | $ | 8.54 | |
| * | Expenses are equal to the Fund’s annualized six-month expense ratio of 1.68%, multiplied by the average account value over the period, multiplied by 184/365 to reflect the partial year period. |
Stone Ridge High Yield Reinsurance Risk Premium Fund — Class M
| | | | | | | | | | | | |
| | | BEGINNING
ACCOUNT
VALUE
MAY 1, 2015 | | | ENDING ACCOUNT
VALUE
OCTOBER 31, 2015 | | | EXPENSES PAID
DURING PERIOD*
MAY 1, 2015 –
OCTOBER 31, 2015 | |
Actual | | $ | 1,000.00 | | | $ | 1,039.40 | | | $ | 9.41 | |
Hypothetical (5% annual return before expenses) | | $ | 1,000.00 | | | $ | 1,015.98 | | | $ | 9.30 | |
| * | Expenses are equal to the Fund’s annualized six-month expense ratio of 1.83%, multiplied by the average account value over the period, multiplied by 184/365 to reflect the partial year period. |
Stone Ridge U.S. Large Cap Variance Risk Premium Fund — Class I
| | | | | | | | | | | | |
| | | BEGINNING
ACCOUNT
VALUE
MAY 1, 2015 | | | ENDING ACCOUNT
VALUE
OCTOBER 31, 2015 | | | EXPENSES PAID DURING
PERIOD*
MAY 1, 2015 –
OCTOBER 31, 2015 | |
Actual | | $ | 1,000.00 | | | $ | 1,027.40 | | | $ | 7.82 | |
Hypothetical (5% annual return before expenses) | | $ | 1,000.00 | | | $ | 1,017.49 | | | $ | 7.78 | |
| * | Expenses are equal to the Fund’s annualized six-month expense ratio of 1.53%, multiplied by the average account value over the period, multiplied by 184/365 to reflect the partial year period. |
Stone Ridge U.S. Large Cap Variance Risk Premium Fund — Class M
| | | | | | | | | | | | |
| | | BEGINNING
ACCOUNT
VALUE
MAY 1, 2015 | | | ENDING ACCOUNT
VALUE
OCTOBER 31, 2015 | | | EXPENSES PAID DURING
PERIOD*
MAY 1, 2015 –
OCTOBER 31, 2015 | |
Actual | | $ | 1,000.00 | | | $ | 1,026.50 | | | $ | 8.58 | |
Hypothetical (5% annual return before expenses) | | $ | 1,000.00 | | | $ | 1,016.74 | | | $ | 8.54 | |
| * | Expenses are equal to the Fund’s annualized six-month expense ratio of 1.68%, multiplied by the average account value over the period, multiplied by 184/365 to reflect the partial year period. |
| | | | | | | | | | | | | | | | |
| | Stone Ridge Funds | | | | | | Annual Report | | | | | | October 31, 2015 | | |
| | | | | | | | | | |
84
| | |
| Expense Examples (Unaudited) |
Stone Ridge U.S. Small Cap Variance Risk Premium Fund — Class I
| | | | | | | | | | | | |
| | | BEGINNING
ACCOUNT
VALUE MAY 1, 2015 | | | ENDING ACCOUNT
VALUE
OCTOBER 31, 2015 | | | EXPENSES PAID DURING
PERIOD*
MAY 1, 2015 –
OCTOBER 31, 2015 | |
Actual | | $ | 1,000.00 | | | $ | 1,016.50 | | | $ | 7.88 | |
Hypothetical (5% annual return before expenses) | | $ | 1,000.00 | | | $ | 1,017.39 | | | $ | 7.88 | |
| * | Expenses are equal to the Fund’s annualized six-month expense ratio of 1.55%, multiplied by the average account value over the period, multiplied by 184/365 to reflect the partial year period. |
Stone Ridge U.S. Small Cap Variance Risk Premium Fund — Class M
| | | | | | | | | | | | |
| | | BEGINNING
ACCOUNT
VALUE
MAY 1, 2015 | | | ENDING ACCOUNT
VALUE
OCTOBER 31, 2015 | | | EXPENSES PAID DURING
PERIOD*
MAY 1, 2015 –
OCTOBER 31, 2015 | |
Actual | | $ | 1,000.00 | | | $ | 1,015.60 | | | $ | 8.69 | |
Hypothetical (5% annual return before expenses) | | $ | 1,000.00 | | | $ | 1,016.59 | | | $ | 8.69 | |
| * | Expenses are equal to the Fund’s annualized six-month expense ratio of 1.71%, multiplied by the average account value over the period, multiplied by 184/365 to reflect the partial year period. |
Stone Ridge U.S. Variance Risk Premium Master Fund — Class I
| | | | | | | | | | | | |
| | | BEGINNING
ACCOUNT
VALUE
MAY 1, 2015 | | | ENDING ACCOUNT
VALUE
OCTOBER 31, 2015 | | | EXPENSES PAID DURING
PERIOD*
MAY 1, 2015 –
OCTOBER 31, 2015 | |
Actual | | $ | 1,000.00 | | | $ | 1,023.90 | | | $ | 0.71 | |
Hypothetical (5% annual return before expenses) | | $ | 1,000.00 | | | $ | 1,024.50 | | | $ | 0.71 | |
| * | Expenses are equal to the Fund’s annualized six-month expense ratio of 0.14%, multiplied by the average account value over the period, multiplied by 184/365 to reflect the partial year period. |
Stone Ridge U.S. Variance Risk Premium Master Fund — Class M
| | | | | | | | | | | | |
| | | BEGINNING
ACCOUNT
VALUE
MAY 1, 2015 | | | ENDING ACCOUNT
VALUE
OCTOBER 31, 2015 | | | EXPENSES PAID DURING
PERIOD*
MAY 1, 2015 –
OCTOBER 31, 2015 | |
Actual | | $ | 1,000.00 | | | $ | 1,022.00 | | | $ | 1.43 | |
Hypothetical (5% annual return before expenses) | | $ | 1,000.00 | | | $ | 1,023.79 | | | $ | 1.43 | |
| * | Expenses are equal to the Fund’s annualized six-month expense ratio of 0.28%, multiplied by the average account value over the period, multiplied by 184/365 to reflect the partial year period. |
| | | | | | | | | | | | | | | | |
| | Stone Ridge Funds | | | | | | Annual Report | | | | | | October 31, 2015 | | |
| | | | | | | | | | |
85
| | |
| Expense Examples (Unaudited) |
Stone Ridge International Developed Markets Variance Risk Premium Fund — Class I
| | | | | | | | | | | | |
| | | BEGINNING
ACCOUNT
VALUE
MAY 1, 2015 | | | ENDING ACCOUNT
VALUE
OCTOBER 31, 2015 | | | EXPENSES PAID DURING
PERIOD*
MAY 1, 2015 –
OCTOBER 31, 2015 | |
Actual | | $ | 1,000.00 | | | $ | 983.20 | | | $ | 10.70 | |
Hypothetical (5% annual return before expenses) | | $ | 1,000.00 | | | $ | 1,014.42 | | | $ | 10.87 | |
| * | Expenses are equal to the Fund’s annualized six-month expense ratio of 2.14%, multiplied by the average account value over the period, multiplied by 184/365 to reflect the partial year period. |
Stone Ridge International Developed Markets Variance Risk Premium Fund — Class M
| | | | | | | | | | | | |
| | | BEGINNING
ACCOUNT
VALUE
MAY 1, 2015 | | | ENDING ACCOUNT
VALUE
OCTOBER 31, 2015 | | | EXPENSES PAID DURING
PERIOD*
MAY 1, 2015 –
OCTOBER 31, 2015 | |
Actual | | $ | 1,000.00 | | | $ | 983.10 | | | $ | 11.45 | |
Hypothetical (5% annual return before expenses) | | $ | 1,000.00 | | | $ | 1,013.66 | | | $ | 11.62 | |
| * | Expenses are equal to the Fund’s annualized six-month expense ratio of 2.29%, multiplied by the average account value over the period, multiplied by 184/365 to reflect the partial year period. |
Stone Ridge Emerging Markets Variance Risk Premium Fund — Class I
| | | | | | | | | | | | |
| | | BEGINNING
ACCOUNT
VALUE
MAY 1, 2015 | | | ENDING ACCOUNT
VALUE
OCTOBER 31, 2015 | | | EXPENSES PAID DURING
PERIOD*
MAY 1, 2015 –
OCTOBER 31, 2015 | |
Actual | | $ | 1,000.00 | | | $ | 915.00 | | | $ | 8.69 | |
Hypothetical (5% annual return before expenses) | | $ | 1,000.00 | | | $ | 1,016.13 | | | $ | 9.15 | |
| * | Expenses are equal to the Fund’s annualized six-month expense ratio of 1.80%, multiplied by the average account value over the period, multiplied by 184/365 to reflect the partial year period. |
Stone Ridge Emerging Markets Variance Risk Premium Fund — Class M
| | | | | | | | | | | | |
| | | BEGINNING
ACCOUNT
VALUE
MAY 1, 2015 | | | ENDING ACCOUNT
VALUE
OCTOBER 31, 2015 | | | EXPENSES PAID DURING
PERIOD*
MAY 1, 2015 –
OCTOBER 31, 2015 | |
Actual | | $ | 1,000.00 | | | $ | 913.90 | | | $ | 9.41 | |
Hypothetical (5% annual return before expenses) | | $ | 1,000.00 | | | $ | 1,015.38 | | | $ | 9.91 | |
| * | Expenses are equal to the Fund’s annualized six-month expense ratio of 1.95%, multiplied by the average account value over the period, multiplied by 184/365 to reflect the partial year period. |
| | | | | | | | | | | | | | | | |
| | Stone Ridge Funds | | | | | | Annual Report | | | | | | October 31, 2015 | | |
| | | | | | | | | | |
86
| | |
| Expense Examples (Unaudited) |
Stone Ridge International Variance Risk Premium Master Fund — Class I
| | | | | | | | | | | | |
| | | BEGINNING
ACCOUNT
VALUE
MAY 1, 2015 | | | ENDING ACCOUNT
VALUE
OCTOBER 31, 2015 | | | EXPENSES PAID DURING
PERIOD*
MAY 1, 2015 –
OCTOBER 31, 2015 | |
Actual | | $ | 1,000.00 | | | $ | 958.70 | | | $ | 1.23 | |
Hypothetical (5% annual return before expenses) | | $ | 1,000.00 | | | $ | 1,023.95 | | | $ | 1.28 | |
| * | Expenses are equal to the Fund’s annualized six-month expense ratio of 0.25%, multiplied by the average account value over the period, multiplied by 184/365 to reflect the partial year period. |
Stone Ridge International Variance Risk Premium Master Fund — Class M
| | | | | | | | | | | | |
| | | BEGINNING
ACCOUNT
VALUE
MAY 1, 2015 | | | ENDING ACCOUNT
VALUE
OCTOBER 31, 2015 | | | EXPENSES PAID DURING
PERIOD*
MAY 1, 2015 –
OCTOBER 31, 2015 | |
Actual | | $ | 1,000.00 | | | $ | 957.70 | | | $ | 1.97 | |
Hypothetical (5% annual return before expenses) | | $ | 1,000.00 | | | $ | 1,023.19 | | | $ | 2.04 | |
| * | Expenses are equal to the Fund’s annualized six-month expense ratio of 0.40%, multiplied by the average account value over the period, multiplied by 184/365 to reflect the partial year period. |
Stone Ridge Global Equity Variance Risk Premium Master Fund — Class I
| | | | | | | | | | | | |
| | | BEGINNING
ACCOUNT
VALUE
MAY 1, 2015 | | | ENDING ACCOUNT
VALUE
OCTOBER 31, 2015 | | | EXPENSES PAID
DURING PERIOD*
MAY 1, 2015 –
OCTOBER 31, 2015 | |
Actual | | $ | 1,000.00 | | | $ | 991.10 | | | $ | 1.25 | |
Hypothetical (5% annual return before expenses) | | $ | 1,000.00 | | | $ | 1,023.95 | | | $ | 1.28 | |
| * | Expenses are equal to the Fund’s annualized six-month expense ratio of 0.25%, multiplied by the average account value over the period, multiplied by 184/365 to reflect the partial year period. |
Stone Ridge Global Equity Variance Risk Premium Master Fund — Class M
| | | | | | | | | | | | |
| | | BEGINNING
ACCOUNT
VALUE
MAY 1, 2015 | | | ENDING ACCOUNT
VALUE
OCTOBER 31, 2015 | | | EXPENSES PAID
DURING PERIOD*
MAY 1, 2015 –
OCTOBER 31, 2015 | |
Actual | | $ | 1,000.00 | | | $ | 990.20 | | | $ | 2.01 | |
Hypothetical (5% annual return before expenses) | | $ | 1,000.00 | | | $ | 1,023.19 | | | $ | 2.04 | |
| * | Expenses are equal to the Fund’s annualized six-month expense ratio of 0.40%, multiplied by the average account value over the period, multiplied by 184/365 to reflect the partial year period. |
| | | | | | | | | | | | | | | | |
| | Stone Ridge Funds | | | | | | Annual Report | | | | | | October 31, 2015 | | |
| | | | | | | | | | |
87
| | |
| Additional Information (Unaudited) | | |
1. Board Approval of the Continuation of Certain Investment Management Agreements
Throughout the year, the Board of Trustees (the “Board”) of Stone Ridge Trust (the “Trust”), including the members of the Board who are not “interested persons” of the Trust (as that term is defined in the Investment Company Act of 1940, as amended) (the “Independent Trustees”), considers matters bearing on the investment management agreements between Stone Ridge Asset Management LLC (the “Adviser”) and the Trust, on behalf of each series of the Trust. On an annual basis, the Board, including the Independent Trustees, holds an in-person meeting to determine whether to approve the continuation, ordinarily for an additional one-year period, of any investment management agreements that are proposed to be renewed.
At an in-person meeting held on October 22, 2015, the Board, including a majority of the Independent Trustees, considered and approved the continuation for a one-year period of each of the investment management agreements (the “Existing Agreements”) between the Adviser and the Trust on behalf of Stone Ridge Reinsurance Risk Premium Fund (the “Reinsurance Risk Premium Fund”) and Stone Ridge High Yield Reinsurance Risk Premium Fund (the “High Yield Reinsurance Risk Premium Fund” and, together with the Reinsurance Risk Premium Fund the “Reinsurance Funds”), Stone Ridge U.S. Small Cap Variance Risk Premium Fund (the “U.S. Small Cap VRP Fund”), Stone Ridge U.S. Large Cap Variance Risk Premium Fund (the “U.S. Large Cap VRP Fund”), and Stone Ridge U.S. Variance Risk Premium Master Fund (the “U.S. VRP Master Fund” and, collectively with the U.S. Small Cap VRP Fund and the U.S. Large Cap VRP Fund, the “U.S. VRP Funds”), Stone Ridge International Developed Markets Variance Risk Premium Fund, Stone Ridge Emerging Markets Variance Risk Premium Fund, Stone Ridge International Variance Risk Premium Master Fund, and Stone Ridge Global Equity Variance Risk Premium Master Fund (together, the “International VRP Funds”). In evaluating each Existing Agreement, the Board considered information and materials furnished by the Adviser in advance of and at the meeting and was afforded the opportunity to request additional information and to ask questions of the Adviser to obtain information that it believed to be reasonably necessary to evaluate the terms of the Existing Agreements. In addition, as part of this process, the Independent Trustees had the opportunity to meet in executive session with legal counsel to the Trust without representatives of the Adviser present. The Board noted that the U.S. VRP Master Fund pursues its investment objective and principal investment strategies by investing in a combination of the U.S. Large Cap VRP Fund and the U.S. Small Cap VRP Fund (the “Underlying U.S. VRP Funds”), the International Variance Risk Premium Master Fund (the “International VRP Master Fund”) pursues its investment objective and principal investment strategies by investing in a combination of the Stone Ridge International Developed Markets Variance Risk Premium Fund and the Stone Ridge Emerging Markets Variance Risk Premium Fund (the “Underlying International VRP Funds”), and the Global Equity Variance Risk Premium Master Fund (the “Global Equity VRP Master Fund”) pursues its investment objective and principal investment strategies by investing in a combination of the Underlying U.S. VRP Funds and the Underlying International VRP Funds (the Underlying International VRP Funds together with the Underlying U.S. VRP Funds, the “Underlying Funds”). As a result, some of the information the Board took into consideration as part of its review of the Existing Agreements for the U.S. VRP Master Fund, the International VRP Master Fund and the Global Equity VRP Master Fund (collectively, the “VRP Master Funds”) related to the Underlying Funds.
The Board’s consideration of each Existing Agreement included but was not limited to: (1) the nature, extent, and quality of the services provided by the Adviser; (2) the investment performance of the Funds and the Adviser; (3) the cost of the services provided and the profits and other benefits realized by the Adviser from its relationship with each Fund; and (4) the extent to which economies of scale may be realized as the Funds grow and whether fee levels reflect such economies of scale for the benefit of shareholders of the Funds. In determining whether to approve the continuation of the Existing Agreements, the Board, including the Independent Trustees, did not identify any single factor as determinative; individual trustees may have evaluated the information presented differently from one another, giving different weights to various factors.
In considering the nature, extent, and quality of the services provided by the Adviser, the Board considered the investment management services provided by the Adviser, including the management of each Fund’s portfolio in accordance with its investment objective, investment policies, investment restrictions and applicable law; the unique nature of the Funds’ investment programs in the registered fund space; investment selection and monitoring; selection of trading counterparties and order management; the creation and implementation of ongoing analytical and risk management strategies; the Adviser’s investment in infrastructure, technology, and personnel needed to implement each Fund’s investment program; and the oversight and/or implementation of policies and procedures necessary to fulfill these responsibilities. For each of the U.S. VRP Master Fund, the International VRP Master Fund and the Global Equity VRP Master Fund, the Board considered the Adviser’s responsibilities in selecting and weighting such Funds’
| | | | | | | | | | | | | | | | |
| | Stone Ridge Funds | | | | | | Annual Report | | | | | | October 31, 2015 | | |
| | | | | | | | | | |
88
| | |
| Additional Information (Unaudited) | | |
investments in the appropriate Underlying Funds and the ongoing monitoring of such selection. The Board also considered other services provided by the Adviser, including proxy voting (to the extent applicable), monitoring potential conflicts of interest and maintaining regulatory compliance programs for the Funds. In addition, the Board considered the qualifications and professional backgrounds of the Adviser’s personnel who provide significant advisory or other services to each Fund under the applicable Existing Agreement and analyzed the Adviser’s ongoing ability to service the Funds through such personnel. Based on this and related information, the Board, including the Independent Trustees, concluded that the nature, extent and quality of services supported the continuation of the Existing Agreements.
In considering the investment performance of the Funds and the Adviser, the Board reviewed information provided by the Adviser relating to each Fund’s performance (net of fees) together with the performance of each Fund’s corresponding index or indexes (where applicable) and took into account the Adviser’s statements regarding differences between the Reinsurance Funds’ performance and the performance of the corresponding index or indexes. The Board also reviewed similar performance information for other comparable registered investment funds managed by the Adviser, where applicable, as well as performance information for funds within Morningstar categories that include multialternative and managed futures (for the U.S. VRP Funds), multialternative, long/short equity and market neutral funds (for the International VRP Funds) and non-traditional bond funds (for the Reinsurance Funds) determined to be most similar to the Funds by the Adviser (the “peer groups”). The Board considered the Adviser’s explanation that there are very few, if any, funds that follow investment strategies similar to those of the Funds due to the unique nature of the Funds’ investment strategies among registered funds, thus making it difficult to identify appropriate peer groups for the Funds and that the peer groups identified were based on an assessment of how the Adviser believed Morningstar would likely categorize the Funds. The Board, including the Independent Trustees, concluded that each Fund’s performance and/or other relevant factors supported the renewal of the Existing Agreement relating to that Fund.
In considering the cost of services provided and the benefits realized by the Adviser from its relationship with each Fund, the Board analyzed the fees paid under each Existing Agreement, the expense ratio for each Fund and any contractual expense limitation undertaken by the Adviser. The Board took into consideration that the VRP Master Funds are not charged an advisory fee under the applicable Existing Agreements. The Board noted that, because each of the VRP Master Funds invests in the applicable Underlying Funds, each of which pays the Adviser a management fee, the Adviser receives additional fees from the Underlying Funds as a result of each VRP Master Fund’s investments in the applicable Underlying Funds. In considering the appropriateness of the advisory fees, expense ratios and expense limitations applicable to the Funds, the Board also compared this data against the corresponding information for the funds in the peer group. The Board took into consideration information provided by the Adviser relating to the Adviser’s financial health, profitability and the benefits that the Adviser derives from the Existing Agreements. The Board also noted that the Adviser may receive reputational benefits from its relationships with the Funds. Based on the foregoing information and other factors deemed relevant, the Board, including the Independent Trustees, concluded that the advisory fee arrangements applicable to each of the Funds pursuant to the Existing Agreements were fair and reasonable and that the costs of the services the Adviser provided and the related benefits to the Adviser in respect of its relationships with the Funds supported the continuation of the Existing Agreements.
Finally, the Board considered the extent to which economies of scale in the provision of services by the Adviser would be realized as the Funds grow and whether the Funds’ fee levels reflect such economies of scale, such as through breakpoints in their investment advisory fees or through expense waiver or limitation arrangements. The Board noted the Adviser’s views regarding its ability to achieve economies of scale in respect of the different asset classes represented by the Funds’ investment programs. In addition, the Trustees noted that each of the Funds other than the U.S. VRP Master Fund was subject to a contractual expense limitation agreement. The Board noted that the Adviser generally sets the expense limitations for the Funds, if any, at levels that it believes reflect market levels for the services provided to, and expenses borne by, the Funds. After reviewing this and related information, the Board, including the Independent Trustees, concluded that the extent to which economies of scale currently are shared with the Funds supported the continuation of the Existing Agreements.
Based on a consideration and evaluation of all factors deemed to be relevant, including the foregoing matters and the Board’s determination that the continuation of each of the Existing Agreements was in the best interests of the shareholders, the Board, including the Independent Trustees, concluded that each of the Existing Agreements should be continued for a one-year period.
| | | | | | | | | | | | | | | | |
| | Stone Ridge Funds | | | | | | Annual Report | | | | | | October 31, 2015 | | |
| | | | | | | | | | |
89
| | |
| Additional Information (Unaudited) | | |
2. Disclosure Regarding Fund Trustees and Officers
| | | | | | | | | | |
| Independent Trustees(1) |
NAME
(YEAR OF BIRTH)
AND ADDRESS(5) | | POSITION(S)
HELD WITH
THE TRUST | | TERM OF
OFFICE(2) AND
LENGTH OF
TIME SERVED | | PRINCIPAL OCCUPATION(S)
DURING THE PAST 5 YEARS | | NUMBER OF
PORTFOLIOS
IN THE FUND
COMPLEX
OVERSEEN BY
TRUSTEE(3) | | OTHER
DIRECTORSHIPS /
TRUSTEESHIPS
HELD BY TRUSTEE
DURING THE
PAST 5 YEARS |
Jeffery Ekberg (1965) | | Trustee | | since 2012 | | Principal, TPG Capital, L.P., until 2011; Chief Financial Officer, Newbridge Capital, LLC , until 2011 | | 11 | | TPG Capital, LLC and
affiliates (sponsored
investment funds),
until 2011. |
| | | | | |
Daniel Charney (1970) | | Trustee | | since 2012 | | Cowen Group, since 2012; Jefferies & Co., until 2011 | | 11 | | None. |
| | | | | | | | | | |
| Interested Trustee |
NAME
(YEAR OF BIRTH)
AND ADDRESS(5) | | POSITION(S)
HELD WITH
THE TRUST | | TERM OF
OFFICE(2) AND
LENGTH OF
TIME SERVED | | PRINCIPAL OCCUPATION(S)
DURING THE PAST 5 YEARS | | NUMBER OF
PORTFOLIOS
IN THE FUND
COMPLEX
OVERSEEN BY
TRUSTEE(3) | | OTHER
DIRECTORSHIPS /
TRUSTEESHIPS
HELD BY TRUSTEE
DURING THE
PAST 5 YEARS |
| | | | | |
Ross Stevens(4) (1969) | | Trustee, Chairman | | since 2012 | | Founder of Stone Ridge Asset Management LLC (“Adviser”), Chief Executive Officer and President of the Adviser, since 2012, Magnetar Capital (Investment Committee and Co-Head of Portfolio Managers Committee), until 2012 | | 11 | | None. |
| (1) | Trustees who are not “interested persons” of the Trust as defined in the 1940 Act. |
| (2) | Each Trustee serves until resignation or removal from the Board of Trustees. |
| (3) | Fund complex includes Stone Ridge Trust II and Stone Ridge Trust III, other investment companies managed by the Adviser. |
| (4) | Mr. Stevens is an “interested person” of the Trust, as defined in Section 2(a)(19) of the 1940 Act, due to his position with Stone Ridge Asset Management LLC. |
| (5) | Each Trustee’s mailing address is c/o Stone Ridge Asset Management LLC, 510 Madison Avenue, 21st Floor, New York, NY 10022. |
The Statement of Additional Information includes additional information about the Fund’s Trustees and is available free of charge upon request by call the Funds toll free at 1.855.609.3680
| | | | | | | | | | | | | | | | |
| | Stone Ridge Funds | | | | | | Annual Report | | | | | | October 31, 2015 | | |
| | | | | | | | | | |
90
| | |
| Additional Information (Unaudited) | | |
| | | | | | |
| Officers |
NAME (YEAR OF
BIRTH) AND ADDRESS(1) | | POSITION(S)
HELD
WITH THE TRUST | | TERM OF
OFFICE AND
LENGTH OF
TIME SERVED(2) | | PRINCIPAL OCCUPATION(S) DURING PAST 5 YEARS |
Ross Stevens (1969) | | President and Chief Executive Officer | | since 2012 | | Founder of Stone Ridge Asset Management LLC (“Adviser”), Chief Executive Officer and President of the Adviser, since 2012; prior to that Magnetar Capital (Investment Committee and Co-Head of Portfolio Managers Committee). |
Jane Korach (1974) | | Chief Compliance Officer and Secretary | | since 2012 | | General Counsel of the Adviser, since 2012; prior to that General Counsel and CCO at Owl Creek Asset Management |
Patrick Kelly (1978) | | Treasurer and Principal Financial Officer | | since 2012 | | Chief Operating Officer of the Adviser, since 2012; prior to that Chief Operating Officer of Quantitative Strategies at Magnetar Capital. |
| (1) | Each Officer’s mailing address is c/o Stone Ridge Asset Management LLC, 510 Madison Avenue, 21st Floor, New York, NY 10022. |
| (2) | The term of office of each officer is indefinite. |
3. Shareholder Notification of Federal Tax Status
For the fiscal period ended October 31, 2015, certain dividends paid by the Funds may be subject to a maximum tax rate of 15%, as provided for by the Jobs and Growth Tax Relief Reconciliation Act of 2003. The percentage of dividends declared from ordinary income designated as qualified dividend income was as follows:
| | | | |
| | | PERCENTAGES | |
Reinsurance Fund | | | 0.00 | % |
High Yield Fund | | | 0.00 | % |
U.S. Large Cap VRP Fund | | | 21.75 | % |
U.S. Small Cap VRP Fund | | | 0.97 | % |
U.S. VRP Master Fund | | | 17.65 | % |
International Developed Markets VRP Fund | | | 2.86 | % |
Emerging Markets VRP Fund | | | 0.00 | % |
International VRP Master Fund | | | 3.76 | % |
Global Equity VRP Master Fund | | | 4.29 | % |
| | | | | | | | | | | | | | | | |
| | Stone Ridge Funds | | | | | | Annual Report | | | | | | October 31, 2015 | | |
| | | | | | | | | | |
91
| | |
| Additional Information (Unaudited) | | |
For corporate shareholders, the percent of ordinary income distributions qualifying for the corporate dividends received deduction for the fiscal period ended October 31, 2015 was as follows:
| | | | |
| | | PERCENTAGES | |
Reinsurance Fund | | | 0.00 | % |
High Yield Fund | | | 0.00 | % |
U.S. Large Cap VRP Fund | | | 21.21 | % |
U.S. Small Cap VRP Fund | | | 0.97 | % |
U.S. VRP Master Fund | | | 17.22 | % |
International Developed Markets VRP Fund | | | 0.00 | % |
Emerging Markets VRP Fund | | | 0.00 | % |
International VRP Master Fund | | | 0.00 | % |
Global Equity VRP Master Fund | | | 3.71 | % |
For the period ended October 31, 2015, the Funds designated the following percent of ordinary distributions paid as interest-related dividends under the Internal Revenue Code Section 871(k)(1)(c):
| | | | |
| | | PERCENTAGES | |
Reinsurance Fund | | | 0.00 | % |
High Yield Fund | | | 0.00 | % |
U.S. Large Cap VRP Fund | | | 0.51 | % |
U.S. Small Cap VRP Fund | | | 0.60 | % |
U.S. VRP Master Fund | | | 0.00 | % |
International Developed Markets VRP Fund | | | 1.39 | % |
Emerging Markets VRP Fund | | | 0.00 | % |
International VRP Master Fund | | | 0.05 | % |
Global Equity VRP Master Fund | | | 0.02 | % |
The percentage of taxable ordinary income distributions that are designated as short-term capital gain distributions under Internal Revenue Section 871(k)(2)(c) for each Fund were as follows:
| | | | |
| | | PERCENTAGES | |
Reinsurance Fund | | | 0.00 | % |
High Yield Fund | | | 0.00 | % |
U.S. Large Cap VRP Fund. | | | 100.00 | % |
U.S. Small Cap VRP Fund | | | 100.00 | % |
U.S. VRP Master Fund | | | 0.00 | % |
International Developed Markets VRP Fund | | | 100.00 | % |
Emerging Markets VRP Fund | | | 100.00 | % |
International VRP Master Fund | | | 13.79 | % |
Global Equity VRP Master Fund | | | 56.91 | % |
Shareholders should not use the above information to prepare their tax returns. Since each Fund’s fiscal year is not the calendar year, another notification will be made available with respect to calendar year 2015. Such notification, which will reflect the amount to be used by calendar year taxpayers on their Federal income tax returns, will be made in conjunction with Form 1099-DIV and will be made available in February on the Funds’ website, www.stoneridgefunds.com. Shareholders are advised to consult their own tax advisors with respect to the tax consequences of their investment in each of the Funds.
4. Availability of Quarterly Portfolio Holdings Schedules
The Funds are required to file their complete schedule of portfolio holdings with the SEC for the first and third quarters of each fiscal year on Form N-Q. The Funds’ Form N-Q is available without charge on the SEC’s website (http://www.sec.gov) and may be available by calling 1.855.609.3680. You may also obtain copies at the SEC’s Public Reference Room in Washington, D.C. Information on the operation of the Public Reference Room may be obtained by calling 1.800.SEC.0330.
| | | | | | | | | | | | | | | | |
| | Stone Ridge Funds | | | | | | Annual Report | | | | | | October 31, 2015 | | |
| | | | | | | | | | |
92
| | |
| Additional Information (Unaudited) | | |
5. Proxy Voting Policies and Procedures and Proxy Voting Record
A description of the policies and procedures that the Funds use to determine how to vote proxies relating to portfolio securities is available without charge by calling 1.855.609.3680 and on the SEC’s website (http://www.sec.gov). The Funds are required to file how they voted proxies related to portfolio securities during the most recent 12-month period ended June 30. The information is available without charge, upon request by calling 1.855.609.3680 and on the SEC’s website (http://www.sec.gov).
| | | | | | | | | | | | | | | | |
| | Stone Ridge Funds | | | | | | Annual Report | | | | | | October 31, 2015 | | |
| | | | | | | | | | |
93
Investment Adviser
Stone Ridge Asset Management LLC
510 Madison Avenue, 21st Floor
New York, NY 10022
Independent Registered Public Accounting Firm
Ernst & Young LLP
5 Times Square
New York, NY 10036
Legal Counsel
Ropes & Gray LLP
Prudential Tower
800 Boylston Street
Boston, MA 02199
Custodian
U.S. Bank, N.A.
1555 North RiverCenter Drive, Suite 302
Milwaukee, WI 53212
Distributor
Quasar Distributors, LLC
615 East Michigan Street
Milwaukee, WI 53202
Administrator, Transfer Agent and Dividend Disbursing Agent
U.S. Bancorp Fund Services, LLC
615 East Michigan Street
Milwaukee, WI 53202
 SQANNU