UNITED STATES
SECURITIES AND EXCHANGE COMMISSION
Washington, D.C. 20549
FORM N-CSR
CERTIFIED SHAREHOLDER REPORT OF REGISTERED
MANAGEMENT INVESTMENT COMPANIES
Investment Company Act file number 811-22768
Sound Point Floating Rate Income Fund
(Exact name of registrant as specified in charter)
375 Park Avenue, 25th Floor
New York, New York 10152
(Address of principal executive offices) (Zip code)
Stephen J. Ketchum
c/o Sound Point Capital Management, L.P.
375 Park Avenue, 25th Floor
New York, NY 10152
(Name and address of agent for service)
(212) 895-2260
Registrant's telephone number, including area code
Date of fiscal year end: August 31
Date of reporting period: August 31, 2013
Item 1. Reports to Stockholders.

Sound Point Floating Rate Income Fund
Annual Report
August 31, 2013
Sound Point Floating Rate Income Fund
TABLE OF CONTENTS
| Shareholder Letter | 3 |
| | |
| Allocation of Portfolio Holdings | 5 |
| | |
| Schedule of Investments | 6 |
| | |
| Statement of Assets & Liabilities | 11 |
| | |
| Statement of Operations | 12 |
| | |
| Statement of Changes in Net Assets | 13 |
| | |
| Statement of Cash Flows | 14 |
| | |
| Financial Highlights | 15 |
| | |
| Notes to the Financial Highlights | 16 |
| | |
| Report of Independent Registered Public Accounting Firm | 22 |
| | |
| Additional Information | 23 |
| | |
| Trustees and Officers | 24 |
| | |
| Privacy Notice | 25 |
Sound Point Floating Rate Income Fund
SHAREHOLDER LETTER
August 31, 2013
Dear Investors,
I am pleased to provide the Annual Report for the Sound Point Floating Rate Income Fund (the “Fund”) for the fiscal year ended August 31, 2013.
The Fund’s investment objective is to provide consistently strong risk-adjusted returns. The Fund seeks to achieve its objective by identifying fundamentally attractive floating rate loans or variable-rate investments, which pay interest at variable-rates and are determined periodically, on the basis of a floating base lending rate, such as the London Interbank Offered Rate, or LIBOR, with or without a floor plus a fixed spread and other investments including senior secured and unsecured bonds, and by creating a portfolio with an optimal blend of these assets.
Over the nine month period ended August 31, 2013 (since the Fund’s inception on December 1, 2012), the Fund generated a net return of 6.40% as compared to the Fund’s benchmark, the Credit Suisse Leveraged Loan Index, return of 4.71% over the same period of time. We have experienced one negative month (June 2013) in which the Fund returned -0.09% on a net basis as compared to the Credit Suisse Leveraged Loan Index return of -0.55% that same month. The Fund has experienced no individual loan defaults within the portfolio.
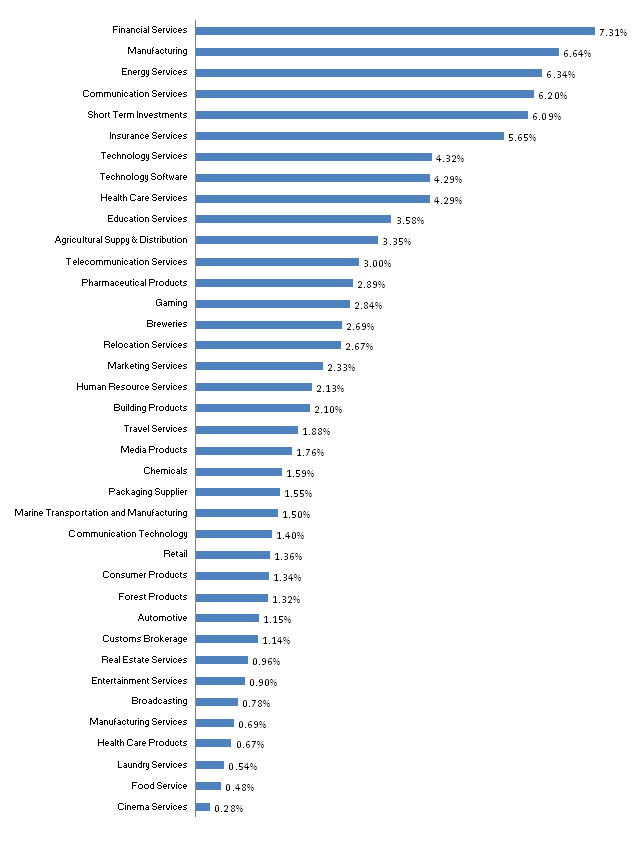
As of August 31, 2013, the Fund held 92.6% of its assets in first and second-lien secured bank loans and the balance in cash. The Fund was invested in 81 companies diversified across 37 industries as of August 31, 2013, with its top five positions represent 14.80% of Fund assets and the top five industry groups represent 32.50% of Fund assets. The top industry weighting was Financial Services where we have particular expertise and access through our parent company, Stone Point Capital.
Market Update - Over the nine month period ended August 31, 2013, the 10-Year Treasury rose from 1.63% to 2.78%. The move, which largely occurred in mid-May, was driven by changing expectations surrounding US monetary policy and signals by the Federal Reserve that they would begin tapering their quantitative easing program as early as the Fall. Though not a dramatic move, it nevertheless caught the capital markets off guard and impaired fixed income investors. Though not completely immune, floating rate loans outperformed, buoyed by continued inflows and healthy demand from institutional and retail investors (through loan mutual funds and ETFs). For the first six months of 2013, this demand was driven primarily by CLOs, representing 58% of new issue buyers, followed by retail investors at 26%, hedge funds at 8% and insurance companies at 8%.
Loan spreads ended the period at 509 basis points, still wide of the 453 basis points 20-year historical average. The trailing 12-month institutional leveraged loan default rate increased slightly to 2.71%.
Corporate fundamentals remain strong and market technicals have also begun to shift in favor of senior loans. An eventual tapering of quantitative easing should bode well for loans and we believe we are well positioned to take advantage.
We thank our investors for your support and welcome your questions and comments.
Sincerely,
Stephen Ketchum
Founder and Managing Partner of Sound Point Capital Management, LP,
Chairman of the Board of Trustees and President of Sound Point Floating Rate Income Fund
DISCLAIMER: The information contained herein is confidential and is intended solely for the person to whom it has been delivered. It is not to be reproduced, used, distributed or disclosed, in whole or in part, to third parties without the prior written consent of Sound Point Capital Management LP.
Performance results are presented on a net of fee basis, reflect the total returns for Sound Point Floating Rate Income Fund as a whole and do not represent the return of any individual investor. Results reflect the deduction of all fund expenses including management fees, brokerage commission, and administrative expenses. An investor’s return may vary from these returns based on the timing of investment. Net performance includes the reinvestment of all dividends, interest, and capital gains.
The return of the Credit Suisse Leverage Loan Index shown herein is intended to show relative market performance for the periods indicated and not as standards of comparison. Index returns include the reinvestment of dividends and are provided to show an example of alternate return potential during the relevant time periods; however, indices may possess different investment attributes that may make comparisons difficult such as volatility, liquidity, market capitalization, and security types. Indices are not subject to any of the fees or expenses to which Sound Point Floating Rate Income Fund is subject.
The views expressed are the opinions and projections of Sound Point Capital Management LP through the period ending August 31, 2013, and are subject to change based on market and other conditions. The opinions expressed may differ from those with different investment philosophies. Sound Point Capital Management LP does not represent that any opinion or projection will be realized. The information presented herein, including, but not limited to, Sound Point Capital Management LP’s investment experience/views, returns or performance, investment strategies, risk management, market opportunity, representative strategies, portfolio construction, expectations, targets, parameters, guidelines, and positions may involve Sound Point Capital Management LP’s views, estimates, assumptions, facts and information from other sources that are believed to be accurate and reliable as of the date this information is presented—any of which may change without notice. Sound Point Capital Management LP has no obligation (express or implied) to update any or all of the information contained herein or to advise you of any changes; nor does Sound Point Capital Management LP make any express or implied warranties or representations as to the completeness or accuracy or accept responsibility for errors. The information presented is for illustrative purposes only and does not constitute an exhaustive explanation of the investment process, investment strategies or risk management.
The analyses and conclusions of Sound Point Capital Management LP contained in this information include certain statements, assumptions, estimates and projections that reflect various assumptions by Sound Point Capital Management LP concerning anticipated results that are inherently subject to significant economic, competitive, and other uncertainties and contingencies and have been included solely for illustrative purposes.
As with any investment strategy, there is potential for profit as well as the possibility of loss. Sound Point Capital Management LP does not guarantee any minimum level of investment performance or the success of any portfolio or investment strategy. All investments involve risk and investment recommendations will not always be profitable. Past performance is no guarantee of future results. Investment returns and principal values of an investment will fluctuate so that an investor's investment may be worth more or less than its original value.
The information provided herein is for informational purposes only and does not constitute investment advice and should not be relied on as such. This information should not constitute an offer to sell or the solicitation of any offer to buy any interests in the any fund managed by Sound Point Capital Management LP or any of its affiliates. Such an offer to sell or solicitation of any offer to buy interests may only be made pursuant to definitive subscription documents between a fund and an investor.
| Sound Point Floating Rate Income Fund | | | | | |
| ALLOCATION OF PORTFOLIO HOLDINGS | | | | | |
| (Calculated as a percentage of Total Investments) | | | | | |
| August 31, 2013 | | | | | | |
| Sound Point Floating Rate Income Fund | | | | | | | | | | |
| SCHEDULE OF INVESTMENTS | | | | | | | | | | |
| August 31, 2013 | | | | | | | | | | |
| | | | | | | | | | | | |
| | | | Effective interest rate1 | | Due date | | Cost | | | Fair value | |
| | | | | | | | | | | | |
Bank Loans2 — United States — 97.59%3 | | | | | | | | | | |
| | Agricultural Suppy & Distribution — 3.52%3 | | | | | | | | | | |
| | Pinnacle Operating Corporation | | | 4.750 | % | 11/15/2018 | | $ | 171,570 | | | $ | 172,696 | |
| | Pinnacle Operating Corporation | | | 11.500 | | 5/13/2019 | | | 436,586 | | | | 453,200 | |
| | Total Agricultural Suppy & Distribution | | | | | | | | 608,156 | | | | 625,896 | |
| | | | | | | | | | | | | | | |
| | Automotive — 1.21%3 | | | | | | | | | | | | | |
| | August U.S. Holding Company, Inc. | | | 10.500 | | 4/29/2019 | | | 216,365 | | | | 215,568 | |
| | | | | | | | | | | | | | | |
| | Breweries — 2.83%3 | | | | | | | | | | | | | |
| | North American Breweries | | | 7.500 | | 12/11/2018 | | | 488,219 | | | | 502,475 | |
| | | | | | | | | | | | | | | |
| | Broadcasting — 0.83%3 | | | | | | | | | | | | | |
| | NEP Broadcasting, LLC | | | 9.500 | | 8/18/2020 | | | 141,464 | | | | 146,741 | |
| | | | | | | | | | | | | | | |
| | Building Products — 2.21%3 | | | | | | | | | | | | | |
| | C.H.I. Overhead Doors | | | 5.500 | | 3/18/2019 | | | 179,646 | | | | 180,848 | |
| | Continental Building Products LLC | | | 8.500 | | 2/15/2021 | | | 60,390 | | | | 61,152 | |
| | Quality Home Brands Holdings LLC | | | 6.750 | | 6/30/2014 | | | 150,913 | | | | 150,866 | |
| | Total Building Products | | | | | | | | 390,949 | | | | 392,866 | |
| | | | | | | | | | | | | | | |
| | Chemicals — 1.67%3 | | | | | | | | | | | | | |
| | Matrix Service Company | | | 7.750 | | 12/4/2020 | | | 138,600 | | | | 142,100 | |
| | OXEA | | | 8.250 | | 6/5/2020 | | | 67,668 | | | | 68,129 | |
| | Royal Adhesives & Sealants, LLC | | | 9.750 | | 1/25/2019 | | | 84,281 | | | | 86,860 | |
| | Total Chemicals | | | | | | | | 290,549 | | | | 297,089 | |
| | | | | | | | | | | | | | | |
| | Cinema Services — 0.30%3 | | | | | | | | | | | | | |
| | AUFINCO PTY Limited | | | 8.250 | | 11/30/2020 | | | 52,477 | | | | 53,166 | |
| | | | | | | | | | | | | | | |
| | Communication Services — 6.52%3 | | | | | | | | | | | | | |
| | Asurion | | | 3.500 | | 7/8/2020 | | | 40,542 | | | | 40,366 | |
| | ConvergeOne | | | 9.250 | | 5/9/2019 | | | 360,731 | | | | 363,712 | |
| | FairPoint Communications, Inc. | | | 7.500 | | 2/14/2019 | | | 493,957 | | | | 499,062 | |
| | Hemisphere Media Group, Inc. | | | 6.250 | | 7/30/2020 | | | 58,411 | | | | 59,295 | |
| | Puerto Rico Cable Acquistion Company Inc. | | | 5.250 | | 7/31/2018 | | | 196,015 | | | | 197,492 | |
| | Total Communication Services | | | | | | | | 1,149,656 | | | | 1,159,927 | |
| | | | | | | | | | | | | | | |
| | Communication Technology — 1.48%3 | | | | | | | | | | | | | |
| | Sorenson Communications | | | 9.500 | | 10/31/2014 | | | 268,046 | | | | 262,740 | |
| | | | | | | | | | | | | | | |
| | Consumer Products — 1.41%3 | | | | | | | | | | | | | |
| | Hunter Fan Company | | | 6.500 | | 12/20/2017 | | | 247,079 | | | | 250,102 | |
| Sound Point Floating Rate Income Fund | | | | | | | | | | |
| SCHEDULE OF INVESTMENTS | | | | | | | | | | |
| August 31, 2013 | | | | | | | | | |
| | | | Effective interest rate1 | | Due date | | Cost | | | Fair value | |
| | | | | | | | | | | | | | | |
| | Customs Brokerage — 1.20%3 | | | | | | | | | | | | | |
| | Livingston International | | | 9.000 | % | 4/17/2020 | | $ | 206,873 | | | $ | 212,759 | |
| | | | | | | | | | | | | | | |
| | Education Services — 3.76%3 | | | | | | | | | | | | | |
| | Ascend Learning | | | 7.000 | | 5/23/2017 | | | 190,284 | | | | 190,761 | |
| | McGraw-Hill Education | | | 9.000 | | 3/22/2019 | | | 168,150 | | | | 175,213 | |
| | Springer Science+Business Media | | | 5.000 | | 8/14/2020 | | | 294,341 | | | | 303,201 | |
| | Total Education Services | | | | | | | | 652,775 | | | | 669,175 | |
| | | | | | | | | | | | | | | |
| | Energy Services — 6.67%3 | | | | | | | | | | | | | |
| | Alinta Energy | | | 6.375 | | 8/7/2019 | | | 68,669 | | | | 69,396 | |
| | Bowie Resources, LLC | | | 6.750 | | 8/17/2020 | | | 153,268 | | | | 158,395 | |
| | Bowie Resources, LLC | | | 11.750 | | 2/9/2021 | | | 33,602 | | | | 33,775 | |
| | Fairmount Minerals | | | 5.000 | | 9/3/2019 | | | 71,640 | | | | 72,238 | |
| | NFR Energy | | | 8.750 | | 12/31/2018 | | | 495,229 | | | | 506,565 | |
| | Oxbow Carbon LLC | | | 8.000 | | 1/18/2020 | | | 57,420 | | | | 58,870 | |
| | Stallion Oilfield Services Ltd. | | | 8.000 | | 6/19/2018 | | | 207,930 | | | | 210,252 | |
| | US Infrastructure Holdings, LLC | | | 4.750 | | 7/30/2020 | | | 75,620 | | | | 76,304 | |
| | Total Energy Services | | | | | | | | 1,163,378 | | | | 1,185,795 | |
| | | | | | | | | | | | | | | |
| | Entertainment Services — 0.94%3 | | | | | | | | | | | | | |
| | AMF Bowling Worldwide, Inc. | | | 8.750 | | 6/28/2018 | | | 163,958 | | | | 167,732 | |
| | | | | | | | | | | | | | | |
| | Financial Services — 7.68%3 | | | | | | | | | | | | | |
| | AlixPartners | | | 9.000 | | 7/2/2021 | | | 48,515 | | | | 49,980 | |
| | BATS Global Markets, Inc. | | | 7.000 | | 12/19/2018 | | | 427,341 | | | | 447,633 | |
| | Guggenheim Partners, LLC | | | 3.250 | | 7/22/2020 | | | 60,849 | | | | 61,531 | |
| | Liquidnet Holdings, Inc. | | | 9.250 | | 5/3/2017 | | | 223,921 | | | | 226,974 | |
| | Orchard Acquisition Company, LLC | | | 9.000 | | 2/8/2019 | | | 241,619 | | | | 249,538 | |
| | Walter Investment Management Corp. | | | 5.750 | | 11/28/2017 | | | 326,010 | | | | 330,522 | |
| | Total Financial Services | | | | | | | | 1,328,255 | | | | 1,366,178 | |
| | | | | | | | | | | | | | | |
| | Food Service — 0.51%3 | | | | | | | | | | | | | |
| | CTI Foods Holding Co., LLC | | | 8.250 | | 6/14/2019 | | | 88,667 | | | | 89,775 | |
| | | | | | | | | | | | | | | |
| | Forest Products — 1.39%3 | | | | | | | | | | | | | |
| | Vestcom International, Inc. | | | 7.000 | | 12/26/2018 | | | 245,195 | | | | 247,506 | |
| Sound Point Floating Rate Income Fund | | | | | | | | | | |
| SCHEDULE OF INVESTMENTS | | | | | | | | | | |
| August 31, 2013 | | | | | | | | | |
| | | | Effective interest rate1 | | Due date | | Cost | | | Fair value | |
| | | | | | | | | | | | | | | |
| | Gaming — 2.99%3 | | | | | | | | | | | | | |
| | Bally Technologies, Inc. | | | 4.250 | % | 8/21/2020 | | $ | 89,550 | | | $ | 90,027 | |
| | CBAC Borrower, LLC | | | 8.250 | | 7/2/2020 | | | 45,552 | | | | 47,495 | |
| | Ceasar's Entertainment Operating Company Inc. | | | 9.500 | | 10/31/2016 | | | 41,205 | | | | 40,932 | |
| | Ceasar's Entertainment Operating Company Inc. | | | 5.250 | | 1/29/2018 | | | 200,646 | | | | 199,800 | |
| | Ceasar's Entertainment Operating Company Inc. | | | 5.440 | | 1/29/2018 | | | 104,025 | | | | 102,790 | |
| | Ceasar's Entertainment Operating Company Inc. | | | 9.500 | | 1/29/2018 | | | 50,730 | | | | 50,394 | |
| | Total Gaming | | | | | | | | 531,708 | | | | 531,438 | |
| | | | | | | | | | | | | | | |
| | Health Care Products — 0.70%3 | | | | | | | | | | | | | |
| | Water Pik, Inc. | | | 5.750 | | 7/8/2020 | | | 124,475 | | | | 125,095 | |
| | | | | | | | | | | | | | | |
| | Health Care Services — 4.51%3 | | | | | | | | | | | | | |
| | Carestream Health, Inc. | | | 9.500 | | 12/4/2019 | | | 134,260 | | | | 136,401 | |
| | DSI Renal, Inc. | | | 5.250 | | 8/15/2020 | | | 78,212 | | | | 78,803 | |
| | Genex Services, Inc. | | | 5.250 | | 7/26/2018 | | | 78,605 | | | | 79,593 | |
| | Therakos, Inc. | | | 7.500 | | 12/27/2017 | | | 241,929 | | | | 249,216 | |
| | Therakos, Inc. | | | 11.250 | | 7/18/2018 | | | 242,972 | | | | 257,500 | |
| | Total Health Care Services | | | | | | | | 775,978 | | | | 801,513 | |
| | | | | | | | | | | | | | | |
| | Human Resource Services — 2.24%3 | | | | | | | | | | | | | |
| | TriNet Group, Inc. | | | 5.000 | | 8/20/2020 | | | 126,723 | | | | 127,194 | |
| | TriNet Group, Inc. | | | 8.750 | | 2/12/2021 | | | 269,500 | | | | 270,875 | |
| | Total Human Resource Services | | | | | | | | 396,223 | | | | 398,069 | |
| | | | | | | | | | | | | | | |
| | Insurance Services — 5.94%3 | | | | | | | | | | | | | |
| | Applied Systems, Inc. | | | 8.250 | | 6/8/2017 | | | 42,893 | | | | 43,374 | |
| | Cooper Gay Swett & Crawford Ltd. | | | 8.250 | | 10/5/2020 | | | 91,639 | | | | 94,569 | |
| | Sedgwick Claims Management Services, Inc. | | | 8.000 | | 12/12/2018 | | | 463,732 | | | | 473,573 | |
| | StoneRiver, Inc. | | | 4.500 | | 11/29/2019 | | | 219,898 | | | | 221,133 | |
| | StoneRiver, Inc. | | | 8.500 | | 5/14/2020 | | | 219,895 | | | | 223,630 | |
| | Total Insurance Services | | | | | | | | 1,038,057 | | | | 1,056,279 | |
| | | | | | | | | | | | | | | |
| | Laundry Services — 0.57%3 | | | | | | | | | | | | | |
| | Spin Holdco, Inc. | | | 4.250 | | 11/14/2019 | | | 100,500 | | | | 101,411 | |
| | | | | | | | | | | | | | | |
| | Manufacturing — 5.81%3 | | | | | | | | | | | | | |
| | Grede Holdings LLC | | | 7.000 | | 5/2/2018 | | | 243,704 | | | | 245,782 | |
| | International Equipment Solutions, LLC | | | 6.750 | | 8/31/2020 | | | 63,044 | | | | 63,322 | |
| | Power Buyer, LLC | | | 8.250 | | 11/6/2020 | | | 77,220 | | | | 76,830 | |
| | Tomkins Air Distribution Technologies, Inc. | | | 9.250 | | 5/11/2020 | | | 138,550 | | | | 139,400 | |
| | WP CPP Holdings, LLC | | | 5.750 | | 12/27/2019 | | | 248,750 | | | | 248,750 | |
| | WP CPP Holdings, LLC | | | 10.500 | | 6/19/2020 | | | 245,113 | | | | 258,750 | |
| | Total Manufacturing | | | | | | | | 1,016,381 | | | | 1,032,834 | |
| Sound Point Floating Rate Income Fund | | | | | | | | | | |
| SCHEDULE OF INVESTMENTS | | | | | | | | | | |
| August 31, 2013 | | | | | | | | | |
| | | | Effective interest rate1 | | Due date | | Cost | | | Fair value | |
| | | | | | | | | | | | | | | |
| | Manufacturing Services — 0.73%3 | | | | | | | | | | | | | |
| | Distribution International, Inc. | | | 8.750 | % | 6/21/2019 | | $ | 128,700 | | | $ | 129,428 | |
| | | | | | | | | | | | | | | |
| | Marine Transportation and Manufacturing — 1.57%3 | | | | | | | | | | |
| | Commercial Barge Line Company | | | 7.500 | | 9/23/2019 | | | 102,723 | | | | 100,286 | |
| | Navios Maritime Partners L.P. | | | 5.250 | | 6/27/2018 | | | 172,487 | | | | 179,520 | |
| | Total Marine Transportation and Manufacturing | | | | | | | | 275,210 | | | | 279,806 | |
| | | | | | | | | | | | | | | |
| | Marketing Services — 2.45%3 | | | | | | | | | | | | | |
| | Advanstar Communications Inc. | | | 9.500 | | 6/6/2020 | | | 89,649 | | | | 91,227 | |
| | Merrill Corporation | | | 7.250 | | 3/8/2018 | | | 246,459 | | | | 251,548 | |
| | Van Wagner Communications, LLC | | | 6.500 | | 8/3/2018 | | | 91,000 | | | | 92,365 | |
| | Total Marketing Services | | | | | | | | 427,108 | | | | 435,140 | |
| | | | | | | | | | | | | | | |
| | Media Products — 1.85%3 | | | | | | | | | | | | | |
| | Playboy Enterprises, Inc. | | | 7.250 | | 3/6/2017 | | | 322,585 | | | | 329,634 | |
| | | | | | | | | | | | | | | |
| | Packaging Supplier — 1.63%3 | | | | | | | | | | | | | |
| | Berlin Packaging, LLC | | | 8.750 | | 3/31/2020 | | | 233,056 | | | | 233,740 | |
| | RanPak Corp. | | | 8.500 | | 3/27/2020 | | | 53,479 | | | | 55,485 | |
| | Total Packaging Supplier | | | | | | | | 286,535 | | | | 289,225 | |
| | | | | | | | | | | | | | | |
| | Pharmaceutical Products — 3.04%3 | | | | | | | | | | | | | |
| | Alvogen | | | 7.000 | | 5/23/2018 | | | 180,244 | | | | 181,166 | |
| | Covis Pharmaceuticals, Inc. | | | 6.000 | | 4/4/2019 | | | 357,105 | | | | 358,444 | |
| | Total Pharmaceutical Products | | | | | | | | 537,349 | | | | 539,610 | |
| | | | | | | | | | | | | | | |
| | Real Estate Services — 1.01%3 | | | | | | | | | | | | | |
| | RentPath, Inc. | | | 6.250 | | 5/29/2020 | | | 178,402 | | | | 179,488 | |
| | | | | | | | | | | | | | | |
| | Relocation Services — 2.81%3 | | | | | | | | | | | | | |
| | SIRVA, Inc. | | | 7.500 | | 3/22/2019 | | | 489,104 | | | | 499,997 | |
| | | | | | | | | | | | | | | |
| | Retail — 1.43%3 | | | | | | | | | | | | | |
| | Collective Brands, Inc. | | | 7.250 | | 10/9/2019 | | | 248,750 | | | | 253,516 | |
| | | | | | | | | | | | | | | |
| | Technology Services — 4.54%3 | | | | | | | | | | | | | |
| | Eastman Kodak Company | | | 7.250 | | 7/31/2019 | | | 219,520 | | | | 219,789 | |
| | Latisys | | | 6.500 | | 3/6/2019 | | | 455,869 | | | | 458,142 | |
| | LTS Buyer, LLC | | | 8.000 | | 4/1/2021 | | | 127,710 | | | | 129,806 | |
| | Total Technology Services | | | | | | | | 803,099 | | | | 807,737 | |
| Sound Point Floating Rate Income Fund | | | | | | | | | | |
| SCHEDULE OF INVESTMENTS | | | | | | | | | | |
| August 31, 2013 | | | | | | | | | |
| | | | | | | | | | | | | | | |
| | Technology Software — 4.51%3 | | | | | | | | | | | | | |
| | Aderant Holdings, Inc. | | | 6.250 | % | 12/20/2018 | | $ | 494,201 | | | $ | 496,880 | |
| | RP Crown Parent, LLC | | | 6.750 | | 12/21/2018 | | | 296,367 | | | | 305,666 | |
| | Total Technology Software | | | | | | | | 790,568 | | | | 802,546 | |
| | | | | | | | | | | | | | | |
| | Telecommunication Services — 3.15%3 | | | | | | | | | | | | | |
| | Global Tel*Link Corporation | | | 9.000 | | 11/20/2020 | | | 468,453 | | | | 466,248 | |
| | Securus Technologies, Inc. | | | 9.000 | | 4/17/2021 | | | 95,040 | | | | 94,560 | |
| | Total Telecommunication Services | | | | | | | | 563,493 | | | | 560,808 | |
| | | | | | | | | | | | | | | |
| | Travel Services — 1.98%3 | | | | | | | | | | | | | |
| | Apple Leisure Group | | | 7.000 | | 2/28/2019 | | | 247,003 | | | | 249,375 | |
| | Travelport | | | 6.250 | | 6/26/2019 | | | 99,511 | | | | 102,283 | |
| | Total Travel Services | | | | | | | | 346,514 | | | | 351,658 | |
| | | | | | | | | | | | | | | |
| | Total Bank Loans | | | | | | | | 17,082,800 | | | | 17,350,722 | |
| | | | | | | | | | | | | | | |
Bonds — United States — 1.17%3 | | | | | | | | | | | | | |
| | Manufacturing — 1.17%3 | | | | | | | | | | | | | |
| | Chassix | | | 9.250 | | 8/1/2018 | | | 203,434 | | | | 208,500 | |
| | | | | | | | | | | | | | | |
Short Term Investments — 6.41%3 | | | | | | | | | | | | | |
| | US Bank Money Market 5, 0.04%4 | | | | | | | | 1,138,429 | | | | 1,138,429 | |
| | | | | | | | | | | | | | | |
Total Investments — 105.17%3 | | | | | | | $ | 18,424,663 | | | $ | 18,697,651 | |
Other liabilities and assets — (5.17)%3 | | | | | | | | | | | | (918,504 | ) |
| | Net Assets — 100%3 | | | | | | | | | | | $ | 17,779,147 | |
| | | | | | | | | | | | | | | |
| | | | | | | | | | | | | | | |
| 1 | The effective interest rates are based on settled commitment amount. | | | | | | | | | | |
| 2 | Bank loans are exempt from registration under the Securities Act of 1933, as amended, but contain certain restrictions on resale and cannot be sold publicly. These loans pay interest at rates which adjust periodically. The interest rates show for the bank loans are the current interest rates as of August 31, 2013. Bank loans are also subject to mandatory and/or optional prepayment which cannot be predicted. As a result, the remaining maturity may be substantially less than the stated maturity shown. | |
| 3 | Calculated as a percentage of net assets. | | | | | | | | | | | | | |
| 4 | Rate reported is the current yield as of August 31, 2013. | | | | | | | | | | | | | |
Sound Point Floating Rate Income Fund | | | |
| STATEMENT OF ASSETS & LIABILITIES | | | |
| | | | |
| | | August 31, 2013 | |
| Assets | | | |
| Investments, at fair value (cost $18,424,663) | | $ | 18,697,651 | |
| Receivable for investments sold | | | 1,938,387 | |
| Interest receivable | | | 134,398 | |
| Receivable from Adviser, net | | | 1,511 | |
| Prepaid expenses and other assets | | | 146 | |
| Total assets | | | 20,772,093 | |
| | | | | |
| Liabilities | | | | |
| Payable for investments purchased | | | 2,838,503 | |
| Payable to Trustees | | | 11,250 | |
| Accrued expenses and other liabilities | | | 143,193 | |
| Total liabilities | | | 2,992,946 | |
| Total net assets | | $ | 17,779,147 | |
| | | | | |
| Net Assets: | | | | |
| Common stock, $0.01 par value; 1,681,275 shares issued and outstanding | | | | |
| (unlimited shares authorized) | | $ | 16,813 | |
| Additional paid-in capital | | | 16,994,916 | |
| Undistributed net investment income | | | 138,786 | |
| Accumulated net realized gain | | | 355,644 | |
| Net unrealized appreciation | | | 272,988 | |
| Total net assets | | $ | 17,779,147 | |
| | | | | |
| Net asset value per share | | $ | 10.58 | |
| | | | | |
| Sound Point Floating Rate Income Fund | | | |
| STATEMENT OF OPERATIONS | | | |
| | | | | |
| | | Period from December 1, 2012 (1) through August 31, 2013 |
| | |
| Investment Income | | | | |
Interest income | | $ | 482,879 | |
| | | | | |
| Operating Expenses | | | | |
| Advisory fees | | | 142,710 | |
| Professional fees | | | 90,000 | |
| Administrator fees | | | 61,254 | |
| Offering costs | | | 42,294 | |
| Directors' fees | | | 22,500 | |
| Transfer agent fees and expenses | | 14,123 | |
| Custodian fees and expenses | | | 8,267 | |
| Other operating expenses | | | 2,404 | |
| Total operating expenses | | 383,552 | |
| Less fees waived by Adviser | | | (144,221) | |
| Net Expenses | | | 239,331 | |
| | | | | |
| Net investment income | | | 243,548 | |
| | | | | |
| Realized and Unrealized Gains on Investments | | | |
| Net realized gain on investments | | 355,644 | |
| Net unrealized appreciation of investments | | 272,988 | |
| Net realized and unrealized gains on investments | | 628,632 | |
| Net increase in net assets resulting from operations | $ | 872,180 | |
(1) Commencement of operations.
| Sound Point Floating Rate Income Fund | | | |
| STATEMENT OF CHANGES IN NET ASSETS | | | |
| | | | | |
| | | Period from December 1, 2012 (1) through August 31, 2013 |
| | |
| | | |
| Operations | | | | |
| Net investment income | | $ | 243,548 | |
| Net realized gain on investments | | | 355,644 | |
| Net unrealized appreciation on investments | | 272,988 | |
| Net increase in net assets resulting from operations | | 872,180 | |
| Dividends to Common Stockholders | | | (104,762) | |
| Capital Stock Transactions | | | | |
| Proceeds from shares sold | | | 16,971,000 | |
Issuance of 3,905 common shares from reinvestment of distributions to | | | |
| shareholders | | | 40,729 | |
| Net increase in net assets capital stock transactions | | 17,011,729 | |
| Total increase in net assets | | | 17,779,147 | |
| Net Assets | | | | |
| Beginning of period | | | - | |
| End of period | | $ | 17,779,147 | |
| Undistributed net investment income, end of period | $ | 138,786 | |
| | | | | |
(1) Commencement of operations. | | | | |
| Sound Point Floating Rate Income Fund | |
| STATEMENT OF CASH FLOWS | |
| | | | |
| | | Period from December 1, 2012 (1) through August 31, 2013 | |
| Reconciliation of net increase in net assets applicable to | | | |
| common stockholders resulting from operations to | | | |
| net cash used in operating activities | | | |
| Net increase in net assets applicable to common stockholders | | | |
| resulting from operations | | $ | 872,180 | |
| Adjustments to reconcile net increase in net assets applicable to | | | | |
| common stockholders resulting from operations to net cash | | | | |
| used in operating activities: | | | | |
| Purchases of long-term investments | | | (45,734,534 | ) |
| Proceeds from sales of long-term investments | | | 28,807,728 | |
| Purchases of short-term investments, net | | | (1,138,429 | ) |
| Net unrealized depreciation | | | (272,988 | ) |
| Net realized gain | | | (355,644 | ) |
| Amortization and acretion | | | (3,784 | ) |
| Changes in operating assets and liabilities: | | | | |
| Increase in receivable for investments sold | | | (1,938,387 | ) |
| Increase in interest receivable | | | (134,398 | ) |
| Increase in receivable from Adviser, net | | | (1,511 | ) |
| Increase in prepaid expenses and other assets | | | (146 | ) |
| Increase in payable for investments purchased | | | 2,838,503 | |
| Increase in payable to Trustees | | | 11,250 | |
| Increase in accrued expenses and other liabilities | | | 143,193 | |
| Net cash used in operating activities | | | (16,906,967 | ) |
| | | | | |
| Cash Flows From Financing Activities | | | | |
| Issuance of common stock | | | 16,971,000 | |
| Distributions paid to common stockholders | | | (64,033 | ) |
| Net cash provided by financing activities | | | 16,906,967 | |
| | | | | |
| Net change in cash | | | - | |
| Cash--beginning of period | | | - | |
| Cash--end of period | | $ | - | |
| | | | | |
| Non-Cash Financing Activities | | | | |
| Reinvestment of distributions by common stockholders | | $ | 40,729 | |
| | | | | |
(1) Commencement of operations. | | | | |
| | Sound Point Floating Rate Income Fund | | | |
| | FINANCIAL HIGHLIGHTS | | | | |
| | | | | | |
| | | | | | |
| | | | | | |
| | | | Period From December 1, 2012 (1) through August 31, 2013 |
| | Per Common Share Data | | | | |
| | Net asset value, beginning of period | | $ | 10.00 | |
| | Income from investment operations: | | | | |
| | Net investment income | | | 0.14 | |
| | Net realized and unrealized gains on investments | | 0.50 | |
| | Total decrease from investment operations | | 0.64 | |
| | Less distributions to common stockholders: | | | | |
| | Net investment income | | | (0.06) | |
| | Total distributions to common stockholders | | (0.06) | |
| | Net asset value, end of period | | $ | 10.58 | |
| | Total investment return based on net asset value (2) | | 6.40 | % |
| | Supplemental Data and Ratios | | | | |
| | Net assets, end of period (000's) | | $ | 17,779 | |
| | Ratio of expenses to average net assets before waiver (3) | | 3.33 | % |
| | Ratio of expenses to average net assets after waiver (3) | | 2.08 | % |
| | Ratio of net investment income to average net assets before waiver (3) | | 0.86 | % |
| | Ratio of net investment income to average net assets after waiver (3) | | 2.11 | % |
| | Portfolio turnover rate (2) | | | 197.14 | % |
| | | | | | |
| (1) | Commencement of operations. | | | | |
| (2) | Not annualized. | | | | |
| (3) | Annualized for periods less than one full year. | | | | |
Sound Point Floating Rate Income Fund
NOTES TO THE FINANCIAL STATEMENTS
August 31, 2013
1. Organization
Sound Point Floating Rate Income Fund (the “Fund”) was organized as a business trust under the laws of the State of Delaware on October 24, 2012, and commenced operations on December 1, 2012. The Fund is registered under the Investment Company Act of 1940, as amended (the “1940 Act”), as a non-diversified, closed-end management investment company.
Sound Point Capital Management, LP (the “Adviser”) is a registered investment adviser under the Investment Advisers Act of 1940, as amended, and serves as investment adviser to the Fund. The Fund operates as an interval fund under Rule 23c-3 of the 1940 Act and, as such, offers to repurchase between 5% and 25% of its outstanding Shares at their net asset value as of or prior to the end of each fiscal quarter.
The Fund’s investment objective is to provide consistently strong risk-adjusted returns. The Fund seeks to achieve its objective by identifying fundamentally attractive floating rate loans or variable-rate investments, which pay interest at variable-rates and are determined periodically, on the basis of a floating base lending rate, such as the London Interbank Offered Rate (“LIBOR”) with or without a floor plus a fixed spread (“Floating Rate Loans”) and other investments, including senior secured and unsecured bonds, and by creating a portfolio with an optimal blend of these assets.
2. Significant Accounting Policies
The following is a summary of significant accounting policies followed consistently by the Fund in the preparation of its financial statements in conformity with accounting principles generally accepted in the United States of America (“U.S. GAAP”).
A. Valuation of Investments
The Fund’s investments in fixed income securities are generally valued using the prices provided directly by independent third party services or provided directly from one or more broker dealers or market makers, each in accordance with the valuation policies and procedures approved by the Fund’s Board of Trustees (the “Board”).
The pricing services may use valuation models or matrix pricing, which consider yield or prices with respect to comparable loan quotations from loan dealers or by reference to other securities that are considered comparable in such characteristics as credit rating, interest rates and maturity date, to determine the current value.
The Fund’s investments in bank loans are normally valued at the mid between the bid and ask obtained from dealers in loans by an independent pricing service in accordance with the Fund’s valuation policies and procedures approved by the Board.
In certain cases authorized pricing service vendors may not provide prices for a security held by the Fund, or the price provided by such pricing service vendor is deemed unreliable by the Adviser. In such cases, the Fund may use market maker quotations provided by an established market maker for that security (i.e., broker quotes) to value the security if the Adviser has experience obtaining quotations from the market maker and the Adviser determines that quotations obtained from the market maker in the past have generally been reliable (or, if the Adviser has no such experience with respect to a market maker, it determines based on other information available to it that quotations to be obtained by it from the market maker are reasonably likely to be reliable). In any such case, the Adviser will review any market quotations so obtained in light of other information in its possession for their general reliability.
Bank loans in which the Fund may invest have similar risks to lower-rated fixed income securities. Changes in the financial condition of the borrower or economic conditions or other circumstances may reduce the capacity of the borrower to make principal and interest payments on such instruments and may lead to defaults. Senior secured bank loans are supported by collateral; however, the value of the collateral may be insufficient to cover the amount owed to the Fund. By relying on a third party to administer a loan, the Fund is subject to the risk that the third party will fail to perform its obligations. The loans in which the Fund will invest are largely floating rate instruments; therefore, the interest rate risk generally is lower than for fixed-rate debt obligations. However, an increase in interest rates may adversely affect the borrower’s financial condition. Due to the unique and customized nature of loan agreements evidencing loans, loans are not as easily purchased or sold as publicly traded securities. Although the range of investors in loans has broadened in recent years, there can be no assurance that future levels of supply and demand in loan trading will provide the degree of liquidity which currently exists in the market. In addition, the terms of the loans may restrict their transferability without borrower consent. These factors may have an adverse effect on the market price and the Fund’s ability to dispose of particular portfolio investments. A less liquid secondary market also may make it more difficult for the Fund to obtain valuations of the loans in its portfolio.
Fair value is defined as the price that the Fund might reasonably expect to receive upon selling an investment in a timely transaction to an independent buyer upon its current sale in the normal course of business in an arm’s-length transaction. A three-tier hierarchy is utilized to maximize the use of observable market data and minimize the use of unobservable inputs and to establish classification of fair value measurements for disclosure purposes. Inputs refer broadly to the assumptions that market participants would use in pricing the asset or liability, including assumptions about risk. For example, market participants would consider the risk inherent in a particular valuation technique used to measure fair value, such as a pricing model, and/or the risk inherent in the inputs to the valuation technique. Inputs may be observable or unobservable. Observable inputs are inputs that reflect the assumptions market participants would use in pricing the asset or liability and are developed based on market data obtained from sources independent of the reporting entity. Unobservable inputs are inputs that reflect the reporting entity’s own assumptions about the assumptions market participants would use in pricing the asset or liability and are developed based on the best information available in the circumstances. The three-tier hierarchy of inputs is summarized in the three broad levels listed below.
Level 1 - Valuations based on unadjusted quoted prices in active markets for identical assets or liabilities that the Fund has the ability to access. Valuation adjustments are not applied to Level 1 investments. Since valuations are based on quoted prices that are readily and regularly available in an active market, valuation of these investments does not entail a significant degree of judgment.
Level 2 - Valuations based on quoted prices in markets that are not active or for which all significant inputs are observable, either directly or indirectly.
Level 3 - Valuations based on inputs that are unobservable and significant to the overall fair value measurement.
The availability of observable inputs can vary from security to security and is affected by a wide variety of factors, including, for example, the type of security, whether the security is new and not yet established in the marketplace, the liquidity of markets, and other characteristics particular to the security. To the extent that valuation is based on models or inputs that are less observable or unobservable in the market, the determination of fair value requires more judgment. Accordingly, the degree of judgment exercised is determining fair value is greatest for instruments categorized in level 3.
The inputs used to measure fair value may fall into different levels of the fair value hierarchy. In such cases, for disclosure purposes, the level in the fair value hierarchy within which the fair value measurement falls in its entirety is determined based on the lowest level input that is significant to the fair value measurement in its entirety.
Bank Loans - The fair value of bank loans is generally valued using recently executed transactions, market price quotations (where observable) and market observable credit default swap levels. Fair value is based on the average of one or more broker quotes received. When quotations are unobservable, proprietary valuation models and default recovery analysis methods are employed. Bank debt is generally categorized in Level 2 or 3 of the fair value hierarchy, depending on the use and availability of observable inputs.
Bonds - The fair value of corporate bonds is estimated using recently executed transactions, market price quotations (where observable), bond spreads, or credit default swap spreads. The spread data used is for the same maturity as the bond. If the spread data does not reference the issuer, then data that references a comparable issuer is used. When observable price quotations are not available, fair value is determined based on cash flow models using yield curves, bond or single name credit default swap spreads, and recovery rates based on collateral values as key inputs. Corporate bonds are generally categorized in Level 2 of the fair value hierarchy. In instances where significant inputs are unobservable, they are categorized in Level 3 of the fair value hierarchy.
The following is a summary of the inputs used as of August 31, 2013 in valuing the Fund’s investments:
| | | | | | | | | | | | | |
| Description | | Level 1 | | | Level 2 | | | Level 3 | | | Total Investments | |
Assets: Fixed Income: | | | | | | | | | | | | |
| Bank Loans (a) | | $ | - | | | $ | 17,350,722 | | | $ | - | | | $ | 17,350,722 | |
| Bonds (a) | | | - | | | | 208,500 | | | | - | | | | 208,500 | |
| Other: | | | | | | | | | | | | | | | | |
| Short-Term Investments (b) | | | 1,138,429 | | | | - | | | | - | | | | 1,138,429 | |
| Total Assets | | $ | 1,138,429 | | | $ | 17,559,222 | | | $ | - | | | $ | 18,697,651 | |
| | | | | | | | | | | | | | | | | |
| (a) | All other industry classifications are identified in the Schedule of Investments. |
| (b) | Short-term investment is a sweep investment for cash balances in the Fund at August 31, 2013. |
B. Investment Transactions, Related Investment Income and Expenses
Investment transactions are accounted for on a trade date basis. Interest income is recorded on the accrual basis, including the amortization of premiums and accretion of discounts on bank loans held using the yield-to-maturity method.
Realized gains and losses on investment transactions and unrealized appreciation and depreciation of investments are reported for financial statement and Federal income tax purposes on the identified cost method.
Expenses are recorded on the accrual basis as incurred.
C. Use of Estimates
The preparation of financial statements in conformity with U.S. GAAP requires management to make estimates and assumptions that affect the reported amounts of assets and liabilities and disclosure of contingent assets and liabilities at the date of the financial statements and the reported amounts of revenues and expenses during the reporting period. Actual results could differ from those estimates.
D. Federal Income Taxation
The Fund has elected to be taxed as a Regulated Investment Company (“RIC”) under the U.S. Internal Revenue Code of 1986, as amended, and intends to maintain this qualification and to distribute substantially all of its net taxable income to its shareholders.
E. Dividends and Distributions
Dividends to shareholders are recorded on the ex-dividend date. The character of dividends to shareholders made during the year may differ from their ultimate characterization for federal income tax purposes. The Fund will distribute substantially all of its net investment income and all of its capital gains to shareholders semi-annually. The character of distributions made during the year from net investment income or net realized gains might differ from the characterization for federal income tax purposes due to differences in the recognition of income and expense items for financial statement and tax purposes. When appropriate, reclassifications between net asset accounts are made for such differences that are permanent in nature. The reclassifications have no effect on net assets or net asset value per share.
F. Receivable/Payable for Investments Purchased/Sold
In the normal course of business, substantially all of the Fund’s investing transactions, money balances, and investment positions are transacted with the Fund’s agent: U.S. Bank. The Fund is subject to credit risk to the extent any agent with which it conducts business is unable to fulfill contractual obligations on its behalf. The Fund’s management monitors the financial condition of such agent and does not anticipate any losses from this counterparty.
Unsettled bank debt investments are subject to the risk of the debt issuer failing to fulfill their contractual obligations of providing the purchased investment to the Fund after the Fund has entered into the purchases and sales agreement and payment has been made.
G. Counterparty Risk
The Fund helps manage counterparty credit risk by entering into agreements only with counterparties the Adviser believes have the financial resources to honor their obligations. The Adviser monitors the financial stability of the Fund’s counterparties.
H. Recent Accounting Pronouncement
In January 2013, the Financial Accounting Standards Board issued Accounting Standards Update No. 2013-01 “Clarifying the Scope of Disclosures about Offsetting Assets and Liabilities” (“ASU 2013-01”) which amended Accounting Standards Codification Subtopic 210-20, Balance Sheet Offsetting. ASU 2013-01 clarified the scope of ASU No. 2011-11 “Disclosures about Offsetting Assets and Liabilities” (“ASU 2011-11”). ASU 2011-11 requires an entity to disclose both gross and net information related to offsetting and related arrangements enabling users of the financial statements to understand the effect of those arrangements on the entity’s financial position. The objective of this disclosure is to facilitate comparison between those entities that prepare their financial statements on the basic of U.S. GAAP and those entities that prepare their financial statements on the basis of International Financial Reporting Standards. ASU 2013-01 clarifies the scope of ASU 2011-11 as applying to derivatives accounted for in accordance with Topic 815, Derivatives and Hedging, including bifurcated embedded derivatives, repurchase agreements and reverse repurchase agreements, and securities borrowing and securities lending transactions that are offset either in accordance with other requirements of U.S. GAAP or subject to an enforceable master netting arrangement or similar agreement. The guidance in ASU 2013-01 and ASU 2011-11 is effective for interim and annual periods beginning on or after January 1, 2013. Adoption of ASU 2011-11 will have no effect on the Fund’s net assets. Management has determined ASU 2013-01 and ASU 2011-11 does not have an impact on the Fund’s financial statements.
3. Agreements
The Fund has entered into an Investment Advisory Agreement with Sound Point Capital Management, L.P. Under the terms of the agreement, the Fund pays the Adviser a fee equal to an annual rate of 1.25 percent of the Fund’s month-end net asset value, including assets attributable to the Adviser (or its affiliates) and before giving effect to any repurchases of Shares by the Fund. The fee is paid monthly in advance.
Pursuant to the Expense limitation agreement with respect to the Fund, until at least December 31, 2013, the Adviser has agreed to waive fees and/or pay Fund expenses to the extent necessary to prevent the operating expenses of the Fund (excluding interest expense, brokerage commissions, transfer agency fees and expenses, offering costs, litigation, indemnification, shareholder meeting costs, licensing fees and other trading expenses, taxes and extraordinary expenses) from exceeding 0.35 percent of average daily net assets per year (the “Expense Cap”). Expenses borne by the Adviser due to the Expense Cap are subject to reimbursement by the Fund up to three years from the date the fee or expense was incurred, but no reimbursement payment will be made by the Fund if it would result in the Fund exceeding the Expense Cap.
U.S. Bancorp Fund Services, LLC serves as the Fund’s administrator. The Fund pays the administrator a monthly fee computed at an annual rate of 0.09 percent of the first $100,000,000 of the Fund's average net assets, 0.07 percent on the next $200,000,000 of the Fund’s average net assets and 0.04 percent on the balance of the Fund's average net assets.
U.S. Bancorp Fund Services, LLC serves as the Fund's transfer agent, dividend paying agent, and agent for the automatic dividend reinvestment plan.
U.S. Bank, N.A. serves as the Fund's custodian. The Fund pays the custodian a monthly fee computed at an annual rate of 0.03 percent of the Fund’s average daily market value, plus portfolio transaction fees.
4. Income Taxes
The Fund intends to comply with the requirements under Subchapter M of the Internal Revenue Code (“Code”) in order to qualify as a regulated investment company (“RIC”). If so qualified, the Fund will not be subject to federal income tax to the extent it distributes all of its taxable income and net capital gains to its shareholders.
The tax character of dividends paid to shareholders during the period ended August 31, 2013, as noted below, was as follows:
Ordinary Income | | Net Long Term Capital Gains | | Total Distributions Paid |
| $104,762 | | $ - | | $104,762 |
The amount and character of income and capital gain distributions to be paid, if any, are determined in accordance with federal income tax regulations, which may differ from U.S. generally accepted accounting principles.
The following information is provided on a tax basis as of August 31, 2013:
| Tax cost of investments | | $ | 18,467,663 | |
| | | | | |
| Unrealized appreciation | | | 273,362 | |
| Unrealized depreciation | | | - | |
| Net unrealized appreciation (depreciation) | | | 273,362 | |
| | | | | |
| Undistributed ordinary income | | | 494,430 | |
| Undistributed long term gains | | | - | |
| Distributable earnings | | | 494,430 | |
| | | | | |
| Other accumulated gain/(loss) | | | - | |
| Total accumulated gain/(loss) | | $ | 767,792 | |
The Fund recognizes the tax benefits of uncertain tax positions only where the position is “more likely than not” to be sustained assuming examination by tax authorities. Management has analyzed the Fund’s tax positions, and has concluded that no liability for unrecognized tax benefits should be recorded related to uncertain tax positions taken on U.S. tax returns and state tax returns filed since inception of the Fund. No income tax returns are currently under examination. All tax years since commencement of operations remain subject to examination by the tax authorities in the United States. The Fund is not aware of any tax positions for which it is reasonably possible that the total amounts of unrecognized tax benefits will change materially in the next 12 months.
5. Investment Transactions
For the period from December 1, 2012 (commencement of operations) through August 31, 2013 the Fund purchased (at cost) and sold securities in the amount of $45,734,534 and $28,803,944 (excluding short term debt securities), respectively.
6. Common Stock
The Fund operates as an “interval fund” under Rule 23c-3 of the 1940 Act and, as such, provides a limited degree of liquidity to Shareholders. The Fund will offer to repurchase not less than 5% of its outstanding Shares on a quarterly basis. This is a fundamental policy that cannot be changed without Shareholder approval.
The Fund is permitted to issue an unlimited number of shares. Par value of all shares is $0.01. The Fund had 1,681,275 shares outstanding at August 31, 2013. During the period ended August 31, 2013, the Fund issued 1,677,395 shares through subscriptions, 3,880 shares through dividend reinvestment, and did not have any redemptions.
7. Subsequent Events
Management has evaluated the impact of all subsequent events on the Fund and has determined that there were no subsequent events that require disclosure in the financial statements with the exception of the receipt of additional capital subscriptions of $1,000,000.
REPORT OF INDEPENDENT REGISTERED PUBLIC ACCOUNTING FIRM
To the Board of Trustees and Shareholders of
Sound Point Floating Rate Income Fund:
We have audited the accompanying statement of assets and liabilities of Sound Point Floating Rate Income Fund (the “Fund”), including the schedule of investments, as of August 31, 2013, and the related statements of operations, changes in net assets, cash flows and financial highlights for the period December 1, 2012 (commencement of operations) through August 31, 2013. These financial statements and financial highlights are the responsibility of the Fund's management. Our responsibility is to express an opinion on these financial statements and financial highlights based on our audit.
We conducted our audit in accordance with the standards of the Public Company Accounting Oversight Board (United States). Those standards require that we plan and perform the audit to obtain reasonable assurance about whether the financial statements and financial highlights are free of material misstatement. The Fund is not required to have, nor were we engaged to perform, an audit of its internal control over financial reporting. Our audit included consideration of internal control over financial reporting as a basis for designing audit procedures that are appropriate in the circumstances, but not for the purpose of expressing an opinion on the effectiveness of the Fund’s internal control over financial reporting. Accordingly, we express no such opinion. An audit includes examining, on a test basis, evidence supporting the amounts and disclosures in the financial statements. Our procedures included confirmation of investments owned as of August 31, 2013 by correspondence with the custodian. An audit also includes assessing the accounting principles used and significant estimates made by management, as well as evaluating the overall financial statement presentation. We believe that our audit provides a reasonable basis for our opinion.
In our opinion, the financial statements and financial highlights referred to above present fairly, in all material respects, the financial position of Sound Point Floating Rate Income Fund as of August 31, 2013, and the results of its operations, its changes in net assets, its cash flows, and its financial highlights for the period December 1, 2012 (commencement of operations) through August 31, 2013, in conformity with accounting principles generally accepted in the United States of America.
/s/ Rothstein Kass
Roseland, New Jersey
October 28, 2013
Sound Point Floating Rate Income Fund
ADDITIONAL INFORMATION
August 31, 2013
(Unaudited)
Form N-Q
The Fund files its complete schedule of portfolio holdings for the first and third quarters of each fiscal year with the SEC on Form N-Q. The Fund’s Form N-Q is available without charge by visiting the SEC’s Web site at www.sec.gov and may be reviewed and copied at the SEC’s Public Reference Room in Washington D.C. You may obtain information on the operation of the Public Reference Room by calling (800) SEC-0330.
Proxy Voting
The Fund files its proxy voting records annually as of June 30 with the SEC on Form N-PX. The Fund’s Form N-PX is available without charge by visiting the SEC’s Web site at www.sec.gov and may be reviewed and copied at the SEC’s Public Reference Room in Washington D.C. You may obtain information on the operation of the Public Reference Room by calling (800) SEC-0330.
Board of Directors
The Prospectus includes additional information about the Fund’s Trustees and Officers and is available upon request without charge by calling the Company collect at (212) 895-2260 or by visiting the SEC’s Web site at www.sec.gov.
Forward-Looking Statements
This report contains "forward-looking statements,'' which are based on current management expectations. Actual future results, however, may prove to be different from expectations. You can identify forward-looking statements by words such as "may'', "will'', "believe'', "attempt'', "seem'', "think'', "ought'', "try'' and other similar terms. The Fund cannot promise future returns. Management’s opinions are a reflection of its best judgment at the time this report is compiled, and it disclaims any obligation to update or alter forward-looking statements as a result of new information, future events, or otherwise.
| Sound Point Floating Rate Income Fund |
| TRUSTEES & OFFICERS |
| August 31, 2013 |
| (Unaudited) |
| | | | | | |
| | | | | | |
| |
Name and Year of Birth | Position(s) Held with the Fund | Term of Office and Length of Time Served | Principal Occupations During Past Five Years | Number of Portfolios in Fund Complex Overseen by Trustee | Other Directorships Held by Trustee During the Past Five Years |
| Independent Trustees | | | | |
| Robert Lewis | Trustee and Audit Committee Chairman | Since inception | Chairman and Founder of Orbital Engineering Inc. | 1 | Drexel University, Pennsylvania State and PIAA (Pittsburgh International Airport Authority) |
| 1344 5th Avenue | |
| Pittsburgh, PA 15219 | |
| 1940 | |
| | | | |
| | | | | | |
| Jeffrey Arsenault | Trustee | Since inception | Principal of Old Greenwich Capital Partners | 1 | Stepping Stones Museum for Children |
| 800 Third Avenue | |
| 39th Floor | |
| New York NY 10022 | |
| 1962 | |
| | | | |
| Interested Trustee | | | | |
| Stephen Ketchum | Chairman, Trustee and President | Since inception | Founder and Managing Partner of Sound Point Capital Management, LP | 1 | East Side House Settlement, New York Police & Fire Widows’ & Children’s Benefit Fund, Museum of the City of New York |
| 375 Park Avenue | |
| 25th Floor | |
| New York, NY 10152 | |
| 1961 | |
| | |
| | |
| Officer | | | | | |
| Kevin Gerlitz | Chief Compliance Officer, Treasurer and Secretary | Since inception | Chief Compliance Officer and Chief Financial Officer of Sound Point Capital Management, LP; Chief Financial Officer of Raven Asset Management, LLC | n/a | n/a |
| 375 Park Avenue | |
| 25th Floor | |
| New York, NY 10152 | |
| 1958 | |
| | | | | |
| | | | | |
| | | | | |
| | | | | |
Sound Point Floating Rate Income Fund
PRIVACY NOTICE
The Fund collects and maintains nonpublic personal information about Shareholders as follows:
| · | Information we receive in subscription agreements, investor questionnaires and other forms which Shareholders complete and submit to us, such as names, addresses, phone numbers, social security numbers, and employment, asset, income and other household information; |
| · | Information we receive and maintain relating to the net asset value of a Shareholder’s shares, such as profit and loss allocations and capital withdrawals and additions; |
| · | Information about your investment in and other transactions with us and our affiliates, including information we receive and maintain relating to new issue and other securities transactions with and through the Fund and its affiliates; and |
| · | Information we receive about a Shareholder from the Shareholder’s purchaser representative, financial advisor, investment consultant or other financial institution with whom the Fund has a relationship and/or whom the Shareholder may have authorized to provide such information to the Fund. |
The Fund does not disclose any nonpublic personal information about its Shareholders or former Shareholders except as may be required or permitted by law. The Fund may disclose information about a Shareholder to its affiliates (including the Fund’s Board and/or Administrator or Investment Manager and the Fund’s employees or agents with a need to know such information to enable the Fund to provide statements, information and services to its Shareholders), and to the following types of third parties:
| · | Financial service providers such as the Fund’s prime broker who assists the Fund as part of the ordinary course of servicing your investments in the Fund; |
| · | Legal representatives of the Fund, such as our counsel, accountants and auditors; |
| · | Cergain non-affiliated parties who perform marketing services for the Fund or with whom we have entered into joint marketing agreements; and |
| · | Persons acting in a fiduciary or representative capacity on behalf of an individual Shareholder, such as an IRA custodian or Trustee of a grantor trust. |
On all occasions when it is necessary for us to share your personal information with nonaffiliated companies, we will require that such information only be used for the limited purpose for which it is shared and will advise these companies not to further share your information with others except to fulfill that limited purpose.
The Fund takes its responsibility to protect the privacy and confidentiality of Shareholder information very seriously. We maintain appropriate physical, electronic and procedural safeguards to guard Shareholder’s nonpublic personal information. We provide Shareholders with a Privacy Notice as part of their subscription materials and annually after that. If the Fund changes its privacy policies to permit it or its affiliates to share additional information the Fund has about you or to permit disclosures to additional types of parties, you will be notified in advance, and, if required by law, you will be given the opportunity to opt out of such additional disclosure and to direct us not to share your information with such parties.
Item 2. Code of Ethics.
The registrant has adopted a code of ethics that applies to the registrant’s principal executive officer and principal financial officer. The registrant has not made any amendments to its code of ethics during the period covered by this report. The registrant has not granted any waivers from any provisions of the code of ethics during the period covered by this report. The registrant intends to adopt a separate code of ethics under the Sarbanes-Oxley Act of 2002.
A copy of the registrant’s Code of Ethics is filed herewith.
Item 3. Audit Committee Financial Expert.
The registrant’s board of trustees has determined that there is at least one audit committee financial expert serving on its audit committee. Jeff Arsenault is the “audit committee financial expert” and is considered to be “independent” as each term is defined in Item 3 of Form N-CSR.
Item 4. Principal Accountant Fees and Services.
The registrant has engaged its principal accountant to perform audit services, audit-related services, tax services and other services during the past two fiscal years. “Audit services” refer to performing an audit of the registrant's annual financial statements or services that are normally provided by the accountant in connection with statutory and regulatory filings or engagements for those fiscal years. “Audit-related services” refer to the assurance and related services by the principal accountant that are reasonably related to the performance of the audit. “Tax services” refer to professional services rendered by the principal accountant for tax compliance, tax advice, and tax planning. The following table details the aggregate fees billed or expected to be billed for each of the last two fiscal years for audit fees, audit-related fees, tax fees and other fees by the principal accountant.
| | FYE 8/31/13 |
| Audit Fees | $35,000 |
| Audit-Related Fees | None |
| Tax Fees | 5,000 |
| All Other Fees | None |
The audit committee has adopted pre-approval policies and procedures that require the audit committee to pre-approve all audit and non-audit services of the registrant, including services provided to any entity affiliated with the registrant.
The percentage of fees billed by Rothstein Kass applicable to non-audit services pursuant to waiver of pre-approval requirement were as follows:
| | FYE 8/31/13 |
| Audit-Related Fees | 0% |
| Tax Fees | 0% |
| All Other Fees | 0% |
All of the principal accountant’s hours spent on auditing the registrant’s financial statements were attributed to work performed by full-time permanent employees of the principal accountant. (If more than 50 percent of the accountant’s hours were spent to audit the registrant's financial statements for the most recent fiscal year, state how many hours were attributed to work performed by persons other than the principal accountant's full-time, permanent employees.)
The following table indicates the non-audit fees billed or expected to be billed by the registrant’s accountant for services to the registrant and to the registrant’s investment adviser (and any other controlling entity, etc.—not sub-adviser) for the last two years. The audit committee of the board of trustees/directors has considered whether the provision of non-audit services that were rendered to the registrant's investment adviser is compatible with maintaining the principal accountant's independence and has concluded that the provision of such non-audit services by the accountant has not compromised the accountant’s independence.
| Non-Audit Related Fees | FYE 8/31/13 |
| Registrant | None |
| Registrant’s Investment Adviser | None |
Item 5. Audit Committee of Listed Registrants.
Not applicable to registrants who are not listed issuers (as defined in Rule 10A-3 under the Securities Exchange Act of 1934).
Item 6. Investments.
| (a) | Schedule of Investments is included as part of the report to shareholders filed under Item 1 of this Form. |
Item 7. Disclosure of Proxy Voting Policies and Procedures for Closed-End Management Investment Companies.
Not applicable since the fund invests exclusively in non-voting securities.
Item 8. Portfolio Managers of Closed-End Management Investment Companies.
Unless otherwise indicated, the following information is presented as of August 31, 2013.
The following individuals will have primary responsibility for managing the Fund since inception.
| Portfolio Manager | Recent Professional Experience |
| Stephen J. Ketchum | Mr. Ketchum is the managing partner/senior portfolio manager/member of board of managers of the Advisor. Mr. Ketchum is the founder and principal owner of the Advisor and the portfolio manager of the Sound Point Credit Opportunities Fund, the Sound Point Senior Floating Rate Fund, several separately managed accounts and Sound Point CLO I, Ltd., a Collateralized Loan Obligation vehicle. Previously, Mr. Ketchum was Global Head of Media Investment and Corporate Banking for Banc of America Securities (“BofA”), where he was a member of the Global Investment Banking Leadership Team. As Global Head of Media Banking, Mr. Ketchum was responsible, together with a risk partner, for a multi-billion dollar portfolio of corporate loans, which was used to support investment banking activities. Prior to joining BofA, he was a Managing Director at UBS in the TMT Investment Banking Group. From 1990 to 2000, he was employed in the Investment Banking Department of Donaldson, Lufkin & Jenrette, most recently as a Managing Director. Mr. Ketchum is a Vice President of the Board of Trustees of the East Side House Settlement, located in Mott Haven, the Bronx, the poorest congressional district in the United States., and also sits on the Board of Directors for the New York Police & Fire Widows’ & Children’s Benefit Fund. He earned his B.A. from New England College magna cum laude and an M.B.A. from the Harvard Business School. |
| Rick Richert, CFA | Mr. Richert is a co-portfolio manager of the Sound Point Senior Floating Rate Fund and Sound Point CLO I, Ltd. Prior to joining the Advisor, Mr. Richert was a Principal in the CLO group at American Capital (“ACAS”) where for 4 years he served as a senior member of a team managing $725MM in corporate loan assets. His primary role was managing the cash flow CLO and directly covered over 40 names in the Aerospace & Defense, Building Materials, Chemical, Electronics, Metals & Mining and Oil & Gas industries. This fund ranked in the top 7th percentile of all similar funds for the 3 years ended December 2009. Prior to ACAS, Mr. Richert was a Senior Credit Analyst at Sanno Point Capital Management, a credit-focused hedge fund, where he covered Home Builders, Metals & Mining, TMT, and Drug Store Retailers. Previously, he was a Director in the Bank Loan Unit at MetLife, where he worked for 10 years. At MetLife, Mr. Richert managed a $3+ billion portfolio of leveraged loans and directly covered over 40 names across many industries. Mr. Richert earned his M.B.A. in Finance from the University of Michigan and his B.B.A. in Accounting from Southern College. He is a Chartered Financial Analyst charterholder and is a Certified Public Accountant. |
The following table provides information about the other accounts managed on a day-to-day basis by each of the portfolio managers as of August 31, 2013:
| | Number of Accounts | Assets of Accounts | Number of Accounts Subject to a Performance Fee | Assets Subject to a Performance Fee |
| Stephen J. Ketchum | | | | |
| Registered Investment Companies | 3 | $173,373,000 | 0 | $0 |
Pooled Investment Vehicles Other Than Registered Companies | 2 | $293,239,000 | 1 | $147,824,000 |
| Other Accounts | 11 | $2,389,000,000 | 3 | $41,175,000 |
| Rick Richert, CFA | | | | |
| Registered Investment Companies | 1 | $17,779,000 | 0 | $0 |
Pooled Investment Vehicles Other Than Registered Companies | 1 | $145,414,000 | 0 | $0 |
| Other Accounts | 7 | $1,368,521,000 | 1 | $25,069,000 |
Potential Conflicts of Interest
The portfolio managers have interests which may conflict with the interests of the Fund. There is no guarantee that the policies and procedures adopted by the Advisor and the Fund will be able to identify or mitigate these conflicts of interest. Some examples of material conflicts of interest include:
Broad and Wide-Ranging Activities. The portfolio managers and the Advisor engage in a broad spectrum of activities. In the ordinary course of their business activities, the portfolio managers and the Advisor may engage in activities where the interests of certain divisions of the Advisor or the interests of their clients may conflict with the interests of the Shareholders of the Fund.
Allocation of Investment Opportunities. Certain inherent conflicts of interest arise from the fact that the portfolio managers and the Advisor provide investment management services both to the Fund and other clients, including, other funds, as well as, client accounts, proprietary accounts and any other investment vehicles that the Advisor and its affiliates may establish from time to time managed by the Advisor and its affiliates in which the Fund will not have an interest (such other clients, funds and accounts, collectively the "Other Accounts"). The respective investment programs of the Fund and the Other Accounts may or may not be substantially similar. The portfolio managers and the Advisor may give advice and recommend securities to Other Accounts which may differ from advice given to, or securities recommended or bought for, the Fund, even though their investment objectives may be the same or similar to those of the Fund.
While the Advisor will seek to manage potential conflicts of interest in good faith, the portfolio strategies employed by the portfolio managers and the Advisor in managing its respective Other Accounts could conflict with the transactions and strategies employed by the portfolio managers in managing the Fund and may affect the prices and availability of the securities and instruments in which the Fund invests. Conversely, participation in specific investment opportunities may be appropriate, at times, for both the Fund and Other Accounts. It is the policy of the Advisor to generally share appropriate investment opportunities (and sale opportunities) with the Other Accounts. In general and except as provided below, this means that such opportunities will be allocated pro rata among the Fund and the Other Accounts based on available capacity for such investment in each fund, taking into account available cash and the relative capital of the respective funds. Nevertheless, investment and/or opportunities may be allocated other than on a pro rata basis, if the Advisor deems in good faith that a different allocation among the Fund and the Other Accounts is appropriate, taking into account, among other considerations (a) risk-return profile of the proposed investment; (b) the Fund's or the Other Accounts' objectives, whether such objectives are considered solely in light of the specific investment under consideration or in the context of the portfolio's overall holdings; (c) the potential for the proposed investment to create an imbalance in the Fund's and the Other Accounts' portfolios; (d) liquidity requirements of the Fund and Other Accounts; (e) tax consequences; (f) regulatory restrictions; (g) the need to re-size risk in the Fund's or Other Accounts' portfolios; (h) redemption/withdrawal requests from Other Accounts and anticipated future contributions into the Fund and Other Accounts; and (i) proximity of an Other Account to the end of its specified term/commitment period. Orders may be combined for all such accounts, and if any order is not filled at the same price, they may be allocated on an average price basis.
Similarly, if an order on behalf of more than one account cannot be fully executed under prevailing market conditions, securities may be allocated among the different accounts on a basis which the Advisor or its affiliates consider equitable. From time to time, the Fund and the Other Accounts may make investments at different levels of an issuer's capital structure or otherwise in different classes of an issuer's securities. Such investments may inherently give rise to conflicts of interest or perceived conflicts of interest between or among the various classes of securities that may be held by such entities. While these conflicts cannot be eliminated, the Advisor, when practicable, will cause the Fund and the Other Accounts to hold investments in the same levels of an issuer's capital structure in the same proportion at each level; provided, however, that neither the Fund nor any Other Account will be required to hold an investment if holding such investment would result in a violation of the provisions of the organizational documents of the Fund or the Other Account, as applicable, or constitute a breach of, or default or debt repayment event with respect to, any credit facility or other debt instrument or obligation.
Allocation of Personnel. Although the professional staff of the Advisor will devote as much time to the management of the Fund as the Advisor deems appropriate to perform its duties in accordance with the investment advisory agreement and in accordance with reasonable commercial standards, the professional staff of the Advisor may have conflicts in allocating its time and services among the Fund and the Advisor's other investment vehicles and accounts. The Advisor and its affiliates are not restricted from forming additional investment funds, from entering into other investment advisory relationships or from engaging in other business activities, even though such activities may be in competition with the Fund and/or may involve substantial time and resources of the Advisor and its professional staff. These activities could be viewed as creating a conflict of interest in that the time and effort of the members of the Advisor and their officers and employees will not be devoted exclusively to the business of the Fund but will be allocated between the business of the Fund and the management of the monies of other clients of the Advisor.
Pursuit of Differing Strategies. At times, the portfolio managers may determine that an investment opportunity may be appropriate for only some of the accounts, clients, entities, funds and/or investment companies for which he or she exercises investment responsibility, or may decide that certain of the accounts, clients, entities, funds and/or investment companies should take differing positions with respect to a particular security. In these cases, the portfolio manager may place separate transactions for one or more accounts, clients, entities, funds and/or investment companies which may affect the market price of the security or the execution of the transaction, or both, to the detriment or benefit of one or more other accounts, clients, entities, funds and/or investment companies. For example, a portfolio manager may determine that it would be in the interest of another account to sell a security that the Fund holds long, potentially resulting in a decrease in the market value of the security held by the Fund.
Portfolio Manager Compensation
The Adviser's financial arrangements with its portfolio managers, its competitive compensation and its career path emphasis at all levels reflect the value senior management places on key resources. Compensation may include a variety of components and may vary from year to year based on a number of factors. The principal components of compensation include a base salary and a discretionary bonus.
Base Compensation. Generally, portfolio managers receive base compensation and employee benefits based on their individual seniority and/or their position with the firm.
Discretionary Compensation. In addition to base compensation, portfolio managers may receive discretionary compensation. Discretionary compensation is based on individual seniority, contributions to the Advisor and performance of the assets that the portfolio manager has primary responsibility for. These compensation guidelines are structured to closely align the interests of employees with those of the Advisor and its clients.
Securities Owned in the Fund by Portfolio Managers
The following table provides information about the dollar range of the Fund beneficially owned by each of the portfolio managers as of August 31, 2013:
| Portfolio Manager | Aggregate Dollar Range of Holdings in the Fund |
| Stephen J. Ketchum | $1 - $10,000 |
| Rick Richert, CFA | none |
Item 9. Purchases of Equity Securities by Closed-End Management Investment Company and Affiliated Purchasers.
Not applicable to open-end investment companies.
| Period | (a) Total Number of Shares (or Units) Purchased | (b) Average Price Paid per Share (or Unit) | (c) Total Number of Shares (or Units) Purchased as Part of Publicly Announced Plans or Programs | (d) Maximum Number (or Approximate Dollar Value) of Shares (or Units) that May Yet Be Purchased Under the Plans or Programs |
Month #1 3/01/13 – 3/31/13 | 0 | 0 | 0 | 0 |
Month #2 4/01/13 – 4/30/13 | 0 | 0 | 0 | 0 |
Month #3 5/01/13 – 5/31/13 | 0 | 0 | 0 | 0 |
Month #4 6/01/13 – 6/30/13 | 0 | 0 | 0 | 0 |
Month #5 7/01/13 - 7/31/13 | 0 | 0 | 0 | 0 |
Month #6 8/01/13 – 8/31/13 | 0 | 0 | 0 | 0 |
| Total | 0 | 0 | 0 | 0 |
Item 10. Submission of Matters to a Vote of Security Holders.
The registrant’s nominating committee charter does not contain any procedures by which shareholders may recommend nominees to the registrant’s board of trustees.
Item 11. Controls and Procedures.
| (a) | The Registrant’s President and Treasurer have reviewed the Registrant's disclosure controls and procedures (as defined in Rule 30a-3(c) under the Investment Company Act of 1940 (the “Act”)) as of a date within 90 days of the filing of this report, as required by Rule 30a-3(b) under the Act and Rules 13a-15(b) or 15d-15(b) under the Securities Exchange Act of 1934. Based on their review, such officers have concluded that the disclosure controls and procedures are effective in ensuring that information required to be disclosed in this report is appropriately recorded, processed, summarized and reported and made known to them by others within the Registrant and by the Registrant’s service provider. |
| (b) | There were no changes in the Registrant's internal control over financial reporting (as defined in Rule 30a-3(d) under the Act) that occurred during the second fiscal quarter of the period covered by this report that has materially affected, or is reasonably likely to materially affect, the Registrant's internal control over financial reporting. |
Item 12. Exhibits.
| (a) | (1) Any code of ethics or amendment thereto, that is the subject of the disclosure required by Item 2, to the extent that the registrant intends to satisfy Item 2 requirements through filing an exhibit. 1) Filed herewith. |
(2) A separate certification for each principal executive and principal financial officer pursuant to Section 302 of the Sarbanes-Oxley Act of 2002. Filed herewith.
(3) Any written solicitation to purchase securities under Rule 23c-1 under the Act sent or given during the period covered by the report by or on behalf of the registrant to 10 or more persons. Not applicable to open-end investment companies.
| (b) | Certifications pursuant to Section 906 of the Sarbanes-Oxley Act of 2002. Furnished herewith. |
SIGNATURES
Pursuant to the requirements of the Securities Exchange Act of 1934 and the Investment Company Act of 1940, the registrant has duly caused this report to be signed on its behalf by the undersigned, thereunto duly authorized.
(Registrant) Sound Point Floating Rate Income Fund
By (Signature and Title) /s/ Stephen J. Ketchum
Stephen J. Ketchum, President
Date November 1, 2013
Pursuant to the requirements of the Securities Exchange Act of 1934 and the Investment Company Act of 1940, this report has been signed below by the following persons on behalf of the registrant and in the capacities and on the dates indicated.
By (Signature and Title) /s/ Stephen J. Ketchum
Stephen J. Ketchum, President
Date November 1, 2013
By (Signature and Title) /s/ Kevin Gerlitz
Kevin Gerlitz, Treasurer
Date November 1, 2013