|
Exhibit 99.1 
|
Pattern
PATTERN ENERGY GROUP INC.
Investor Day
JUNE 24, 2015
SAFE HARBOR STATEMENT
The following information contains, or may be deemed to contain, “forward-looking statements” defined(as in the UPrivate. Securities Litigation Reform Act of 1995 and Canadian securities laws) The. words “may,” “plan,” “forecast,” “seek,” “target,” “goal,” “believe,” “expect,” “anticipate,” “intend,” “estimate” and other expressions that are predictions of or indicate future events and trends and that do not relate to historical matters identify forward-looking statementsYou. should not place undue reliance on these forward-looking statements about Pattern Energy Group Inc (the. “Company”) By. their nature, forward-looking statements are not statements of historical facts and involve risks and uncertainties because they relate to events and depend on circumstances that may or may not occur in the future, many of which are outside the Company’s controlSuch. risks and uncertainties could cause the actual results, performance or achievements of the Company to be materially different from its current expectations and include, but are not limited to: the Company’s ability to complete construction of its construction projects and transition them into financially successful operating projects; the Company’s ability to complete acquisition of power projects; fluctuations in supply, demand, prices and other conditions for electricity; the Company’s electricity generation, projections thereof and factors affecting production including wind and other conditions, other weather conditions, availability and curtailment; changes in law; and the Company’s ability to keep pace with and take advantage of new technologies.
In particular, this presentation contains the Company’s Adjusted EBITDA and cash available for distribution, which are not generally accepted accounting principles in the United States (“U . GAAP”) Adjusted. EBITDA and cash available for distribution have been disclosed because the Company believes that these measures may assist investors in evaluating its financial performance and its ability to pay dividendsNeither. Adjusted EBITDA nor cash available for distribution should be considered the sole measure of the Company’s performance and should not be considered in isolation from, or as a substitute for, the Company’s U GAAP. measures, including, but not limited to, the most directly comparable UGAAP. measures, net income and(loss) net cash provided by (used in) operating activities, respectivelySee. pages 85-87 for a reconciliation of net cash provided by operating activities to cash available for distribution and net income to adjusted EBITDAThe. forecasts included in this presentation should not be relied upon as fact or as an accurate representation of future results Assumptions. and estimates underlying the forecast are inherently uncertain and the Company’s future operating results are subject to a wide variety of risks and uncertainties, including significant business, economic, and competitive risks and uncertaintiesThere. can be no assurance that such assumptions will be realized or that the Company will generate cash available for distribution during the forecast periods at the levels forecasted, in which event the Company may not be able to pay cash dividends at the Company’s initial dividend level or at allForward. looking measures of CAFD, run-rate CAFD and CAFD per share growth are non-GAAP measures that cannot be reconciled to net cash provided by operating activities as the most directly comparable GAAP financial measure with unreasonable effort A. description of the adjustments to determine CAFD can be found on page 74 of Pattern Energy’s 2014 Annual Report on Form 10-K.
All forward-looking statements speak only as of the date made, and the Company expressly disclaims any intention or obligation to revise or publicly update any forward-looking statements, including Adjusted EBITDA and cash available for distribution, whether as a result of new information, future events, or otherwise except as may be required by applicable law For. additional information regarding known material risks that could cause the Company’s actual results to differ from its projected results please read “Risk Factors” in the Company’s annual report on Form 10-K for the year ended December 201431, and our quarterly report on Form 10-Q for the fiscal quarter ended March 201531, .
PATTERN ENERGY GROUP INC. 2
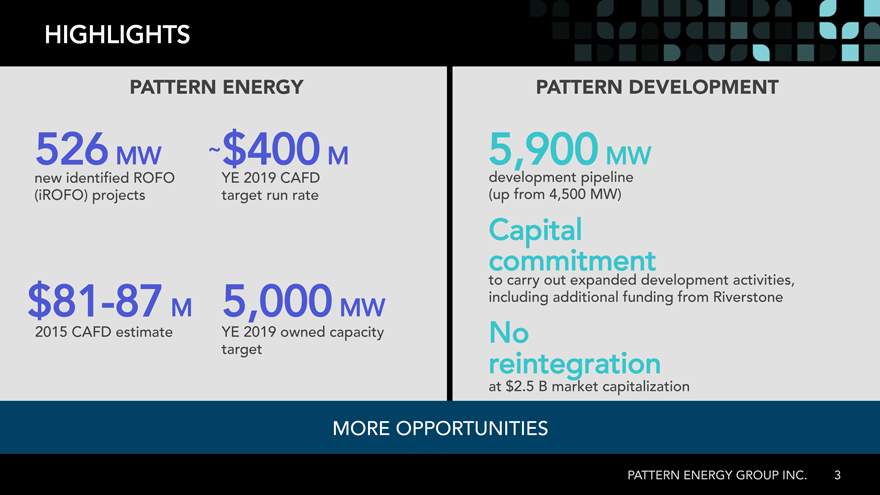
HIGHLIGHTS
PATTERN ENERGY_ PATTERN DEVELOPMENT_
526 MW ~ M 5,900 MW
new identified ROFO YE 2019 CAFD development pipeline projects(iROFO) target run rate from(up 4,500 MW)
Capital
commitment to carry out expanded development activities, -87 M 5,000 MW including additional funding from Riverstone 2015 CAFD estimate YE 2019 owned capacity No
target reintegration
at 5.2$ B market capitalization
MORE OPPORTUNITIES
PATTERN ENERGY GROUP INC. 3
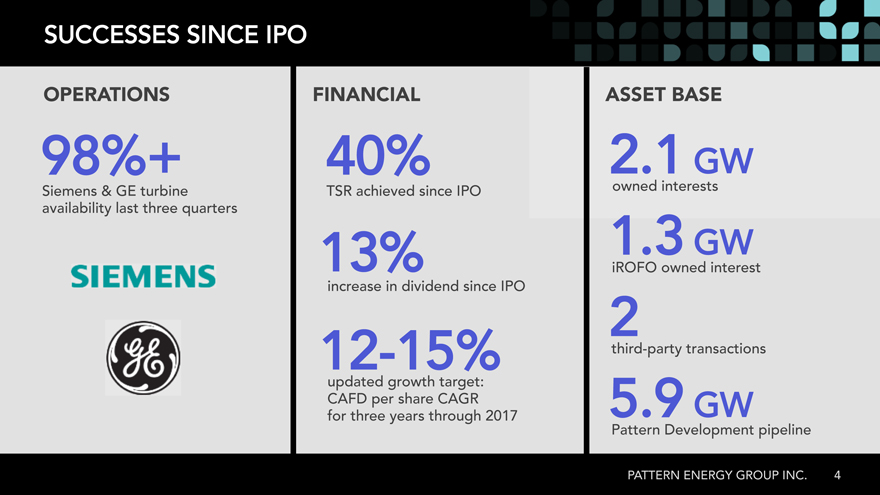
SUCCESSES SINCE IPO
OPERATIONS_ FINANCIAL_ ASSET BASE_
98%+ 40% 1.2 GW
Siemens GE& turbine TSR achieved since IPO owned interests availability last three quarters 3.1
13% GW
iROFO owned interest increase in dividend since IPO 2
12-15% third-party transactions updated growth target: CAFD per share CAGR 9.5 GW for three years through 2017 Pattern Development pipeline
PATTERN ENERGY GROUP INC. 4
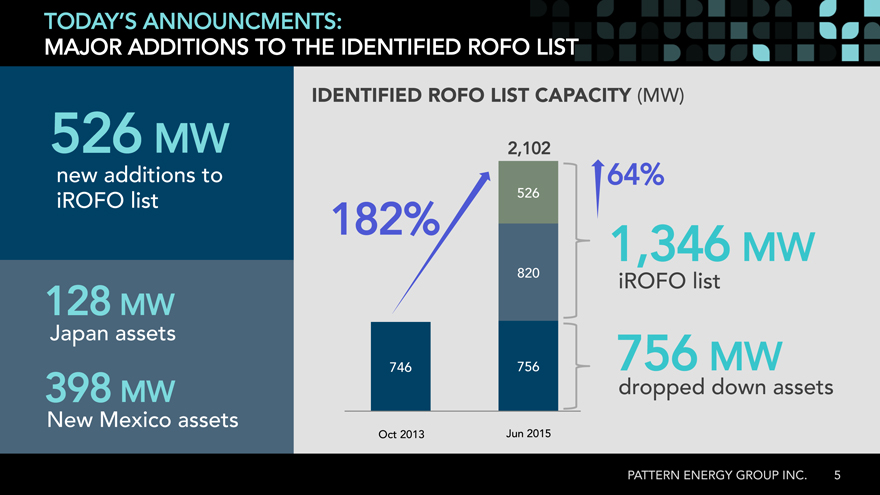
TODAY’S ANNOUNCMENTS:
MAJOR ADDITIONS TO THE IDENTIFIED ROFO LIST
IDENTIFIED ROFO LIST CAPACITY (MW)
526 MW 2,102
new additions to 64% iROFO list 182% 526
1,346 MW
820 iROFO list
128 MW
Japan assets
746 756 756 MW
398 MW dropped down assets New Mexico assets
Oct 2013 Jun 2015
Identified ROFO list capacity
(MW) PATTERN ENERGY GROUP INC. 5
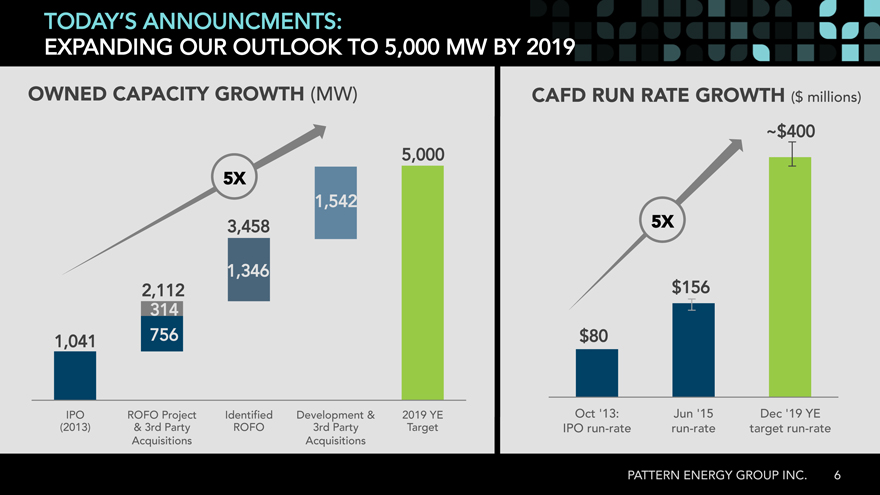
TODAY’S ANNOUNCMENTS:
EXPANDING OUR OUTLOOK TO 5,000 MW BY 2019
OWNED CAPACITY GROWTH (MW) CAFD RUN RATE GROWTH ($ millions)
~ 5,000
5X_
1,542
3,458 5X 1,346 2,112 156$ 314 1,041 756
IPO ROFO Project Identified Development 2019& YE Oct Jun’13: Dec’15 YE’19 (2013) 3rd& Party ROFO 3rd Party Target IPO run-rate run-rate target run-rate Acquisitions Acquisitions
PATTERN ENERGY GROUP INC 6.
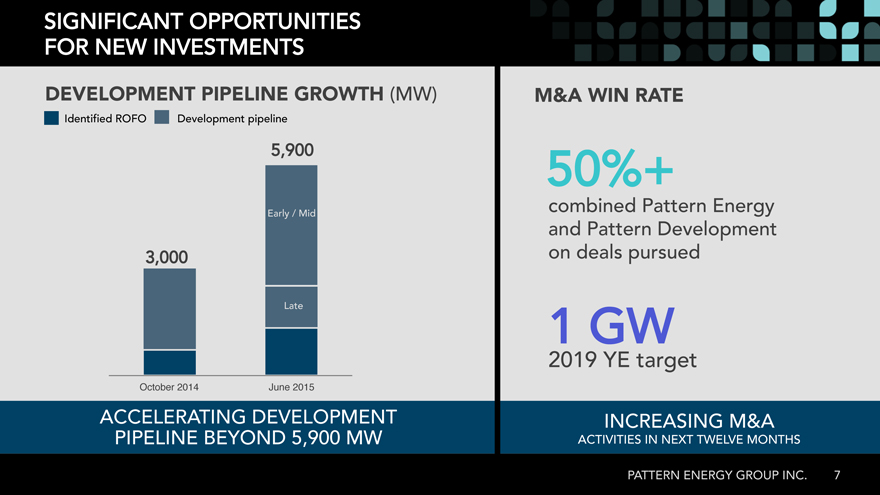
SIGNIFICANT OPPORTUNITIES FOR NEW INVESTMENTS
DEVELOPMENT PIPELINE GROWTH (MW) M&A WIN RATE
Identified ROFO Development pipeline
5,900 50%+
Early / Mid combined Pattern Energy and Pattern Development 3,000 on deals pursued
Late 1 GW
2019 YE target
October 2014 June_ 2015_
ACCELERATING DEVELOPMENT INCREASING M&A
PIPELINE BEYOND 5,900 MW ACTIVITIES IN NEXT TWELVE MONTHS PATTERN ENERGY GROUP INC. 7
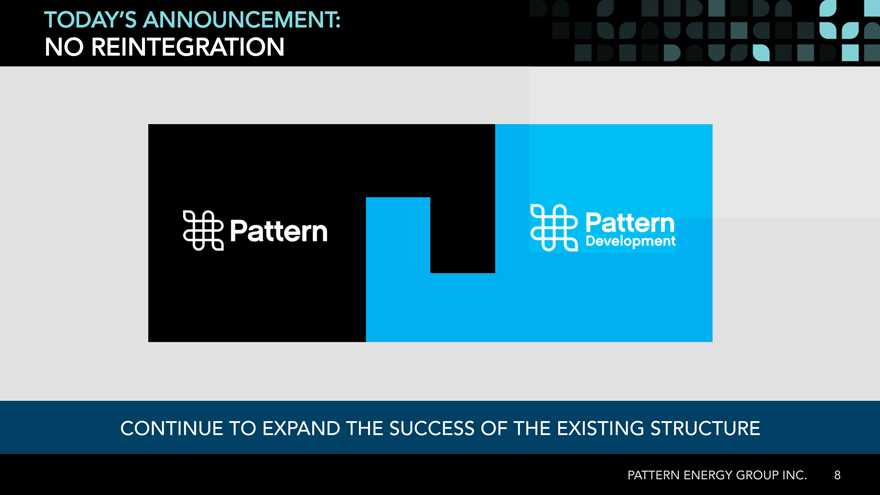
TODAY’S ANNOUNCEMENT:
NO REINTEGRATION
CONTINUE TO EXPAND THE SUCCESS OF THE EXISTING STRUCTURE
PATTERN ENERGY GROUP INC. 8
clean renewable
energy infrastructure
transforming the
production delivery&
of power
PATTERN ENERGY GROUP INC. 9
Hunter Armistead
PATTERN DEVELOPMENT OVERVIEW
Pattern
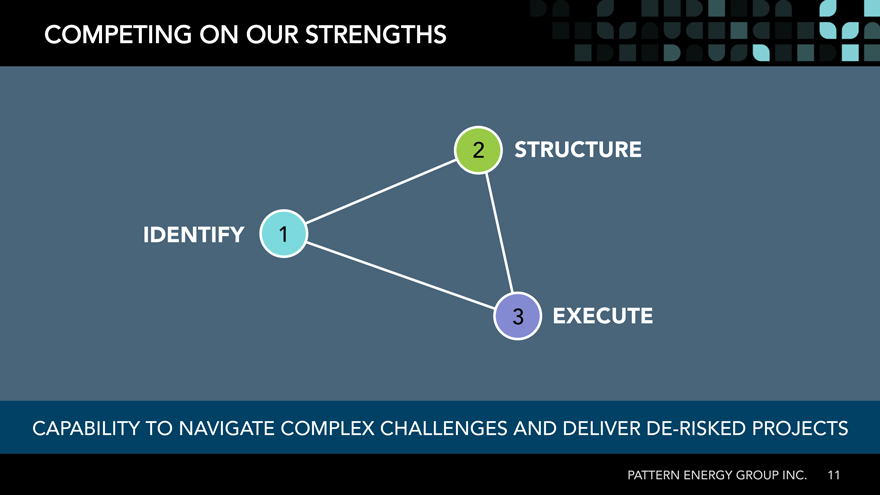
COMPETING ON OUR STRENGTHS
CAPABILITY TO NAVIGATE COMPLEX CHALLENGES AND DELIVER DE-RISKED PROJECTS
PATTERN ENERGY GROUP INC. 11
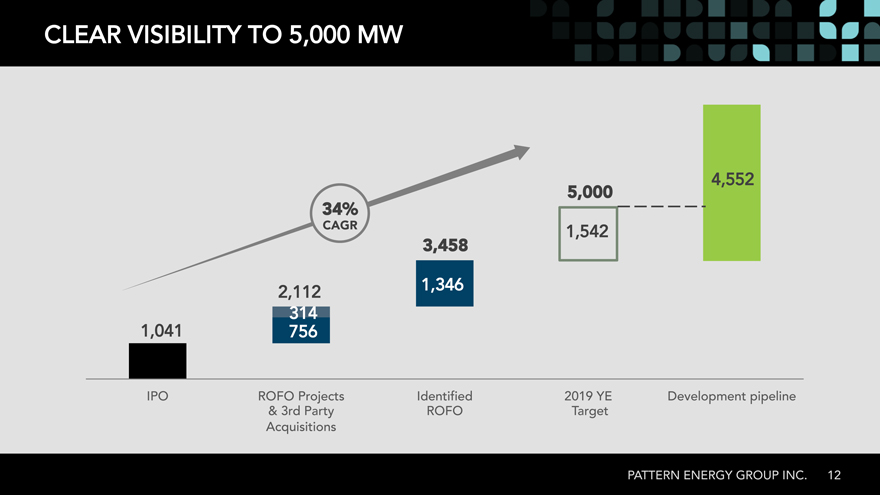
CLEAR VISIBILITY TO 5,000 MW
4,552
34%_ 5,000_
CAGR_ 1,542
3,458_
2,112 1,346 1,041 314 756
IPO ROFO Projects Identified 2019 YE Development pipeline
& 3rd Party ROFO Target Acquisitions
PATTERN ENERGY GROUP INC. 12
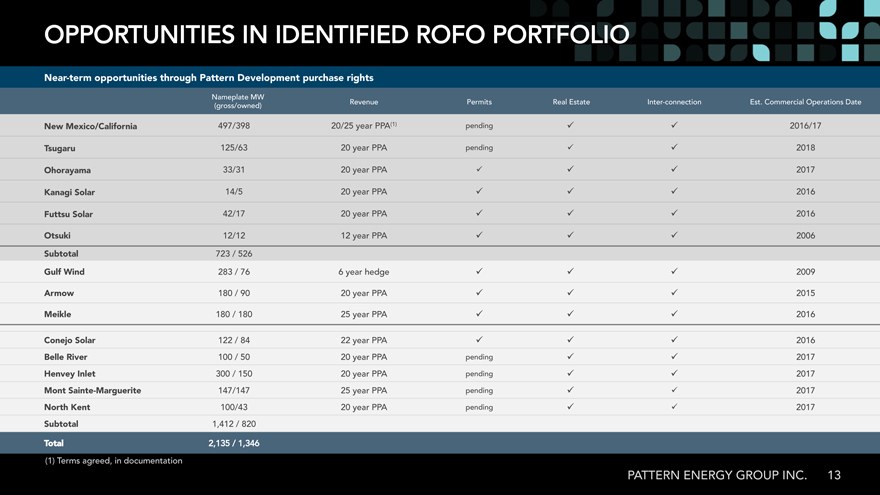
OPPORTUNITIES IN IDENTIFIED ROFO PORTFOLIO
Near-term opportunities through Pattern Development purchase rights_
Nameplate MW
Revenue Permits Real Estate Inter-connection EstCommercial. Operations Date (gross/owned)
New Mexico/California_ 20/25497/398 year PPA(1) pending 2016/17 Tsugaru _ 20125/63 year PPA pending 2018 Ohorayama_ 2033/31 year PPA 2017 Kanagi Solar_ 2014/5 year PPA 2016 Futtsu Solar _2042/17 year PPA 2016 Otsuki 1212/12 year PPA 2006 Subtotal 723_ / 526 Gulf Wind 283_ / 676 year hedge 2009 Armow 180_ / 2090 year PPA 2015 Meikle 180_ / 25180 year PPA 2016
Conejo Solar 122_ / 2284 year PPA 2016 Belle River 100_ / 2050 year PPA pending 2017 Henvey Inlet 300_ / 20150 year PPA pending 2017 Mont Sainte-Marguerite 25147/147 year PPA pending 2017 North Kent 20100/43 year PPA pending 2017 Subtotal 1,412_ / 820
Total 2,135_ / 1,346 Terms(1) agreed, in documentation
PATTERN ENERGY GROUP INC13.
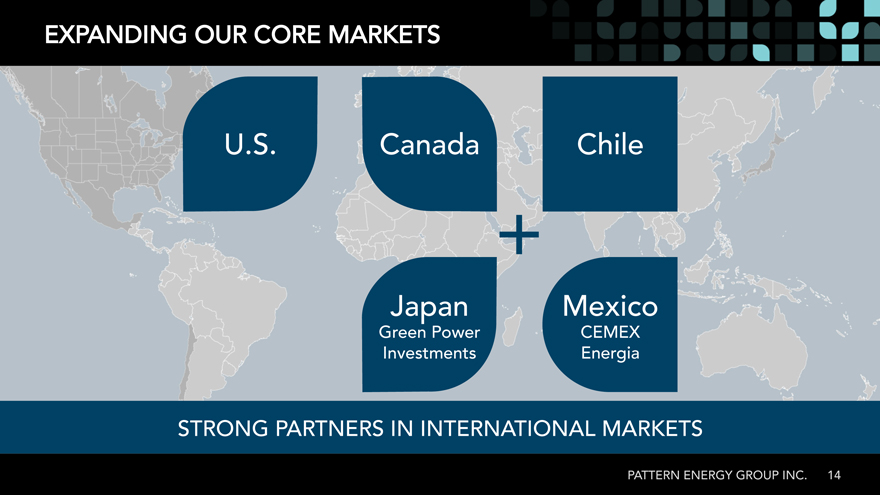
EXPANDING OUR CORE MARKETS
U Canada. Chile
+
Japan Mexico
Green Power CEMEX Investments Energia
STRONG PARTNERS IN INTERNATIONAL MARKETS
PATTERN ENERGY GROUP INC 14.
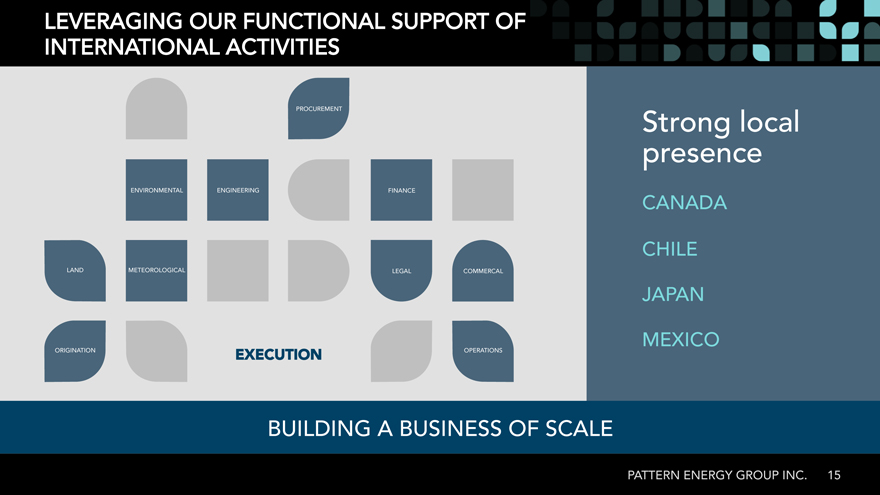
LEVERAGING OUR FUNCTIONAL SUPPORT OF INTERNATIONAL ACTIVITIES
PROCUREMENT Strong local presence
ENVIRONMENTAL ENGINEERING FINANCE
CANADA
CHILE
LAND METEOROLOGICAL LEGAL COMMERCAL
JAPAN
ORIGINATION OPERATIONS MEXICO
EXECUTION_
BUILDING A BUSINESS OF SCALE
PATTERN ENERGY GROUP INC 15.
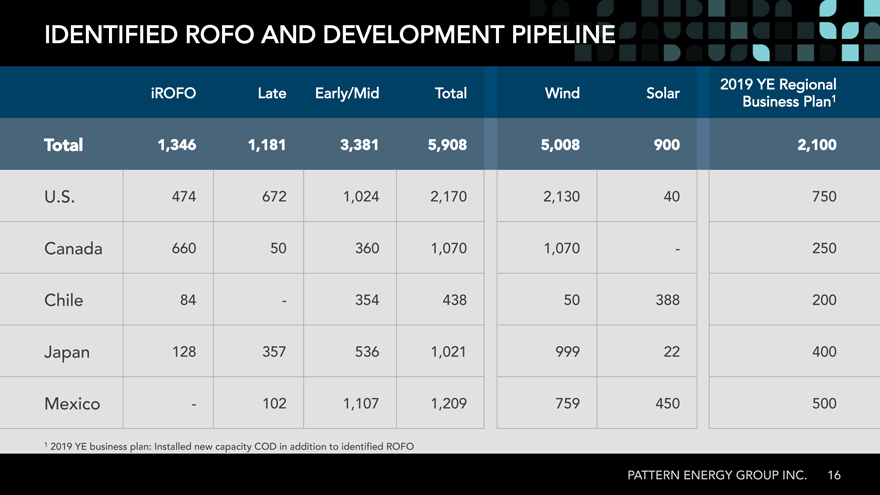
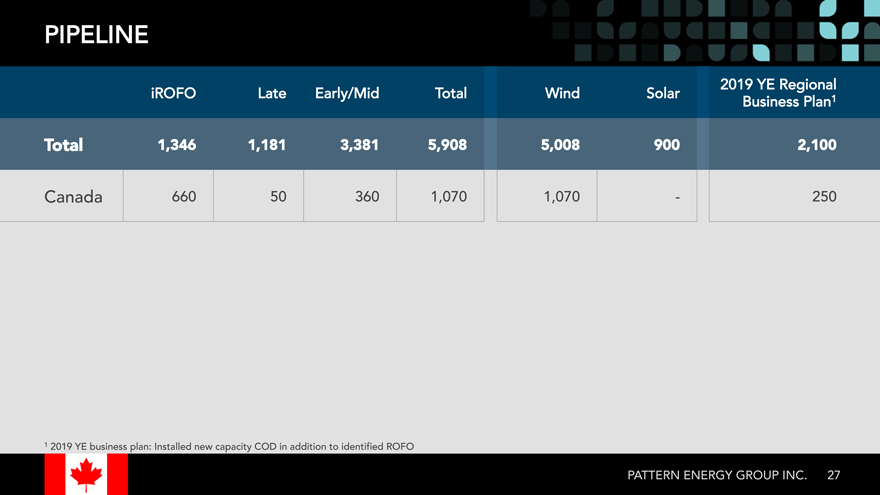
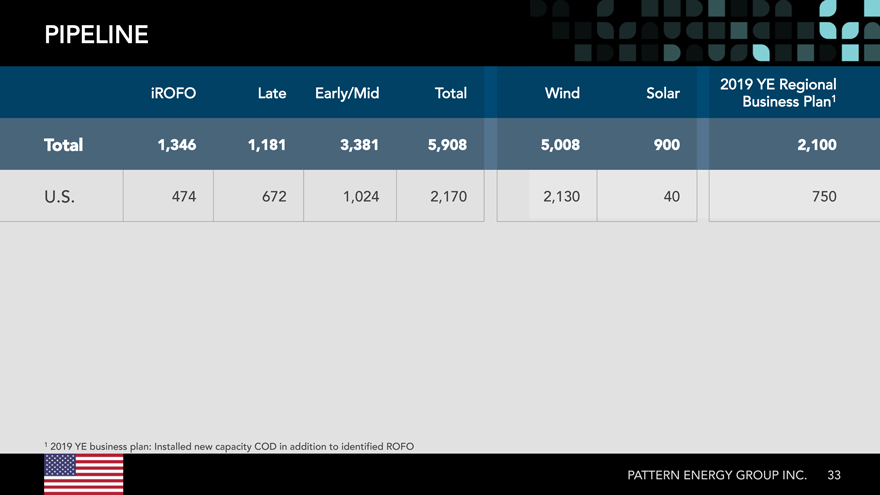
IDENTIFIED ROFO AND DEVELOPMENT PIPELINE
2019 YE Regional iROFO Late Early/Mid Total Wind Solar 1 Business Plan
Total_ 1,346 1,181 _ 3,381 5,908 5,008 900 _ 2,100_
U.S. 474 672 1,024 2,170 2,130 40 750 Canada 660 50 360 1,070 1,070 — 250 Chile 84 — 354 438 50 388 200 Japan 128 357 536 1,021 999 22 400
Mexico — 102 1,107 1,209 759 450 500
1 | | 2019 YE business plan: Installed new capacity COD in addition to identified ROFO |
PATTERN ENERGY GROUP INC. 16
Pattern Development’s
track record
generates more opportunities:
SUCCESS BREEDS SUCCESS
PATTERN ENERGY GROUP INC 17.
Pattern
Hunter Armistead
BUSINESS DEVELOPMENT
CHILE_
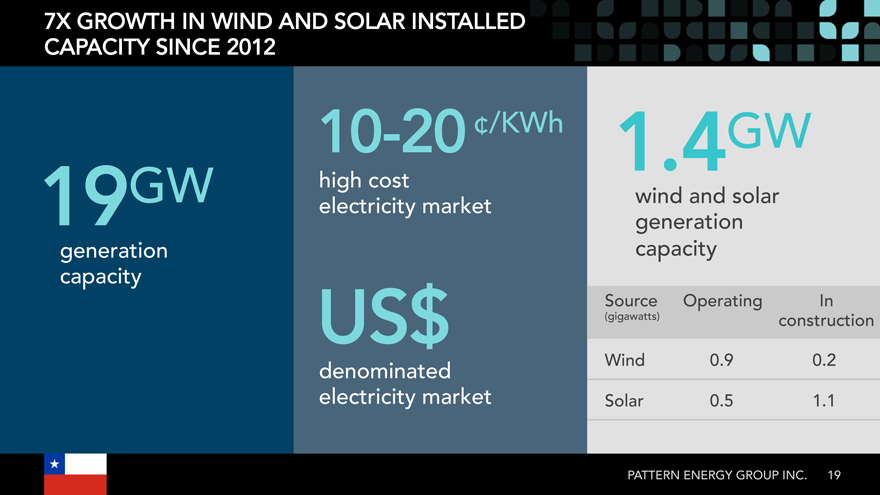
7X GROWTH IN WIND AND SOLAR INSTALLED
CAPACITY SINCE 2012
10-20 ¢/KWh 1.4GW
GW high cost
19 electricity market wind and solar generation generation capacity capacity
Source Operating In
US$ (gigawatts) construction
denominated Wind 0.9 0.2
electricity market Solar 0.5 1.1
PATTERN ENERGY GROUP INC. 19
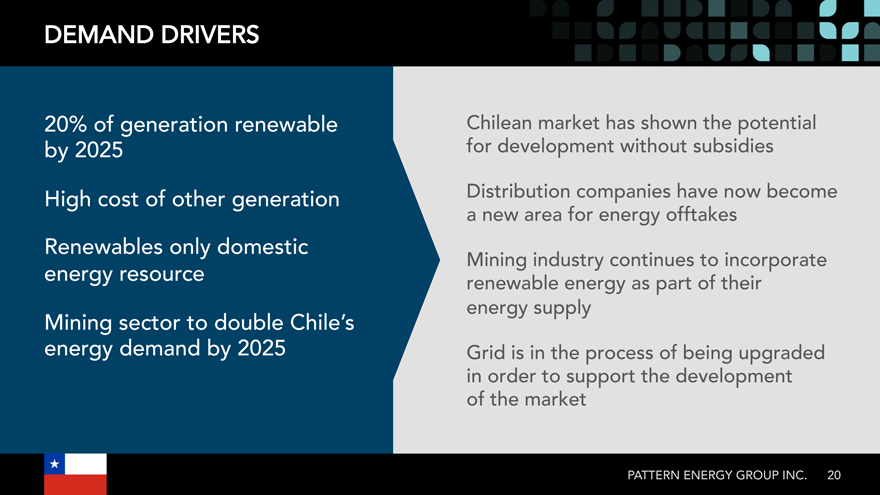
DEMAND DRIVERS
20% of generation renewable Chilean market has shown the potential by 2025 for development without subsidies High cost of other generation Distribution companies have now become a new area for energy offtakes
Renewables only domestic
Mining industry continues to incorporate energy resource renewable energy as part of their energy supply
Mining sector to double Chile’s
energy demand by 2025 Grid is in the process of being upgraded in order to support the development of the market
PATTERN ENERGY GROUP INC 20.
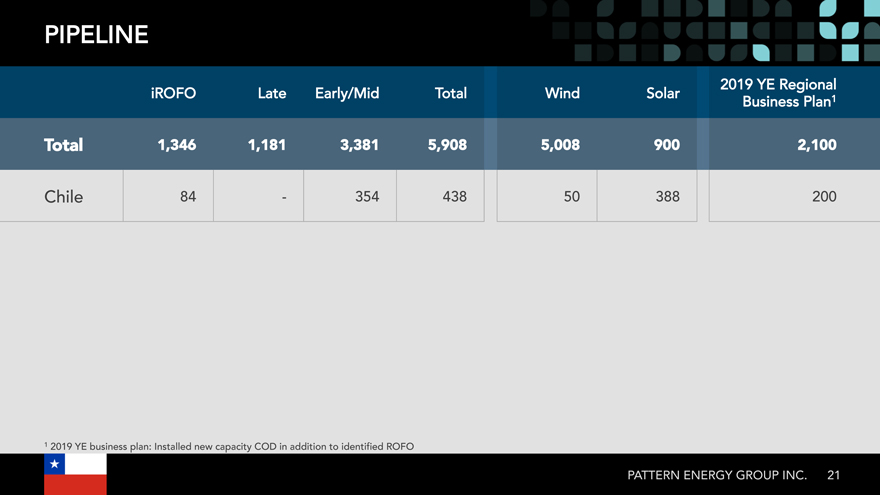
PIPELINE
2019 YE Regional iROFO Late Early/Mid Total Wind Solar 1 Business Plan
Total_ 1,346 1,181 _ 3,381 5,908 5,008 900 _ 2,100_
Chile 84 — 354 438 50 388 200
1 | | 2019 YE business plan: Installed new capacity COD in addition to identified ROFO |
PATTERN ENERGY GROUP INC. 21
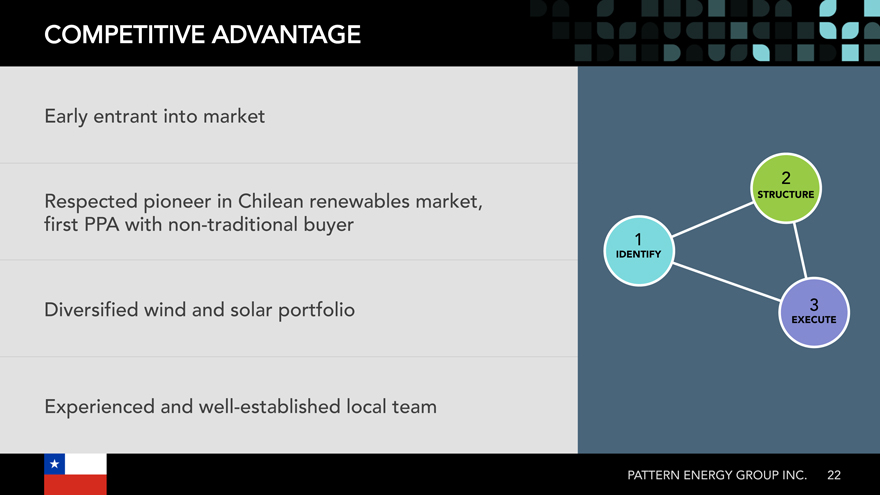
COMPETITIVE ADVANTAGE
Early entrant into market
Respected pioneer in Chilean renewables market, STRUCTURE first PPA with non-traditional buyer
IDENTIFY
Diversified wind and solar portfolio 3
EXECUTE_
Experienced and well-established local team
PATTERN ENERGY GROUP INC 22.
Pattern
Hunter Armistead
BUSINESS DEVELOPMENT
CANADA_
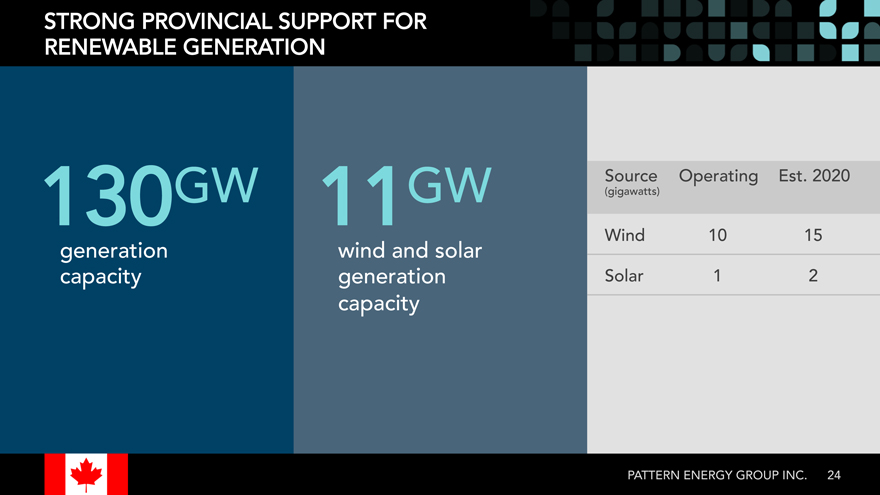
STRONG PROVINCIAL SUPPORT FOR RENEWABLE GENERATION
Source Operating Est2020.
11130 GW GW (gigawatts)
Wind 1510
generation wind and solar capacity generation Solar 21 capacity
PATTERN ENERGY GROUP INC 24.
DEMAND DRIVERS
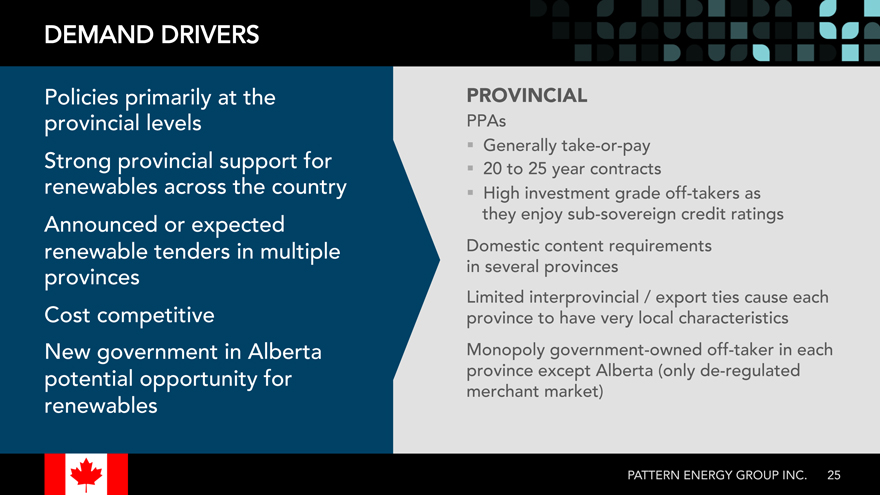
Policies primarily at the PROVINCIAL_ provincial levels PPAs
_? Generally take-or-pay
Strong provincial support for _? 20 to 25 year contracts
renewables across the country _? High investment grade off-takers as Announced or expected they enjoy sub-sovereign credit ratings
renewable tenders in multiple Domestic content requirements
provinces in several provinces
Limited interprovincial / export ties cause each Cost competitive province to have very local characteristics New government in Alberta Monopoly government-owned off-taker in each potential opportunity for province except Alberta de(only -regulated merchant market)
renewables
PATTERN ENERGY GROUP INC. 25
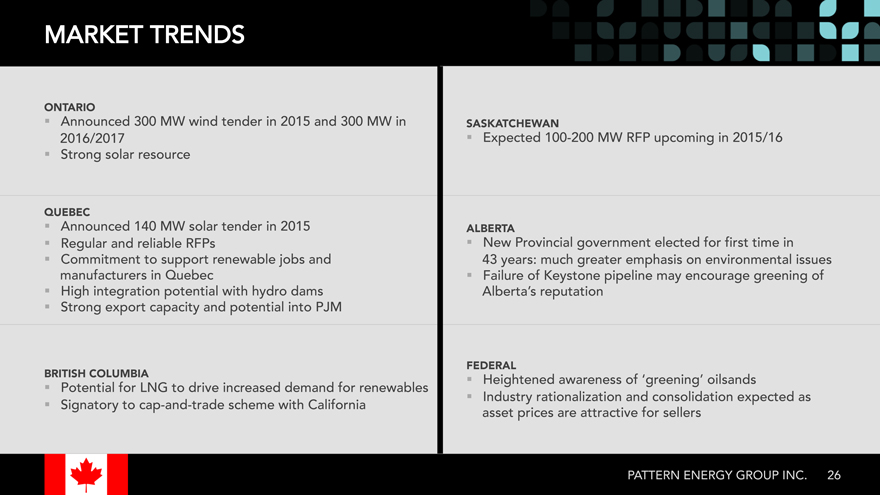
MARKET TRENDS
ONTARIO_
_? Announced 300 MW wind tender in 2015 and 300 MW in SASKATCHEWAN_
2016/2017 _? Expected 100-200 MW RFP upcoming in 2015/16 _? Strong solar resource
QUEBEC_
_? Announced 140 MW solar tender in 2015 ALBERTA_
_? Regular and reliable RFPs _? New Provincial government elected for first time in _? Commitment to support renewable jobs and 43 years: much greater emphasis on environmental issues manufacturers in Quebec _? Failure of Keystone pipeline may encourage greening of _? High integration potential with hydro dams Alberta’s reputation _? Strong export capacity and potential into PJM
FEDERAL_
BRITISH COLUMBIA_ ‘greening’ oilsands _? Heightened awareness of _? Potential for LNG to drive increased demand for renewables
_? Industry rationalization and consolidation expected as _? Signatory to cap-and-trade scheme with California asset prices are attractive for sellers
PATTERN ENERGY GROUP INC 26.
PIPELINE
2019 YE Regional iROFO Late Early/Mid Total Wind Solar 1 Business Plan
Total_ 1,346 1,181 _ 3,381 5,908 5,008 900 _ 2,100_
Canada 660 50 360 1,070 1,070 — 250
1 | | 2019 YE business plan: Installed new capacity COD in addition to identified ROFO |
PATTERN ENERGY GROUP INC. 27
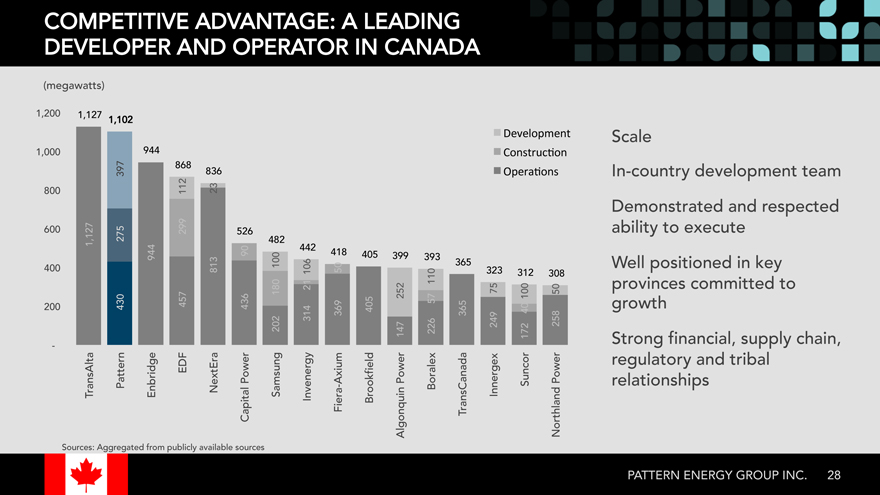
COMPETITIVE ADVANTAGE: A LEADING DEVELOPER AND OPERATOR IN CANADA
(megawatts)
1,200 1,127 1,102
Scale
1,000 944 __
__
868
397 836
In-country development team
23 800 112
Demonstrated and respected ability to execute
600 299 526 275 482 1,127
90 442 418
944 405 399 393
365 Well positioned in key
400 813100 106 50 323
312 308 110
21 provinces committed to
180 75 50 252 100 57
200 457 436 growth 430 405 40 369 365 314 249 258 202 226 147 172
— Strong financial, supply chain,
EDF Power Power Power regulatory and tribal TransAlta Pattern Enbridge NextEra Samsung Invenergy Fiera-Axium Brookfield Boralex TransCanada Innergex Suncor relationships Capital Algonquin Northland
Sources: Aggregated from publicly available sources
PATTERN ENERGY GROUP INC28.
Pattern
Hunter Armistead
BUSINESS DEVELOPMENT
UNITED STATES_
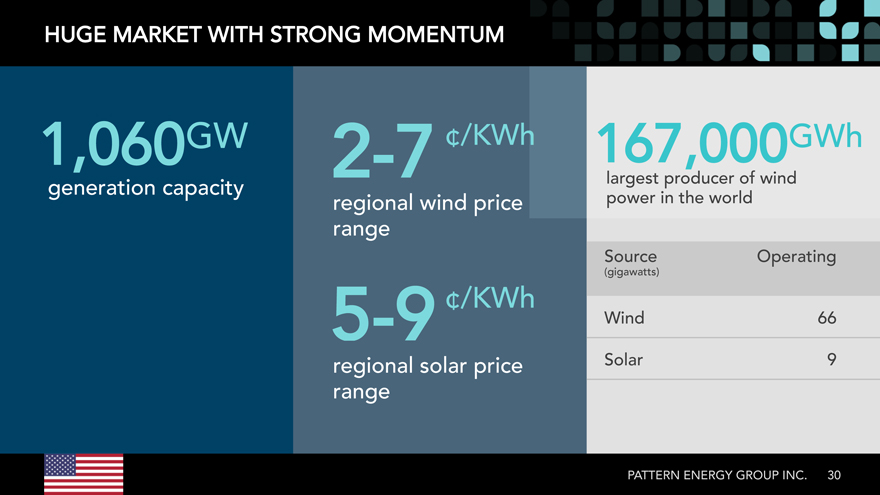
HUGE MARKET WITH STRONG MOMENTUM
1,060GW 2-7 ¢/KWh 167,000GWh
generation capacity largest producer of wind
regional wind price power in the world range
Source Operating
(gigawatts)
¢/KWh
5-9 Wind 66
regional solar price Solar 9 range
PATTERN ENERGY GROUP INC 30.
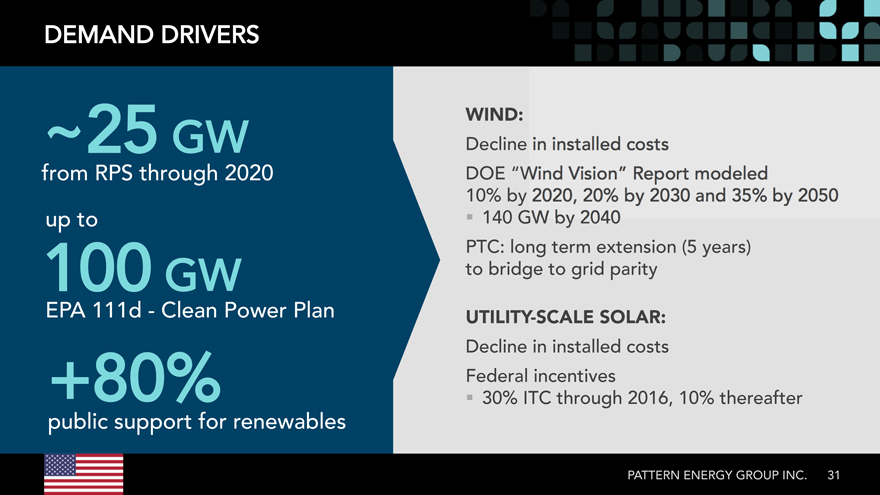
DEMAND DRIVERS
WIND:
~25 GW Decline
from RPS through 2020 DOE
10% by
up to _? 140 GW
PTC: long term extension (5 years) 100 GW to bridge to grid parity
EPA 111d—Clean Power Plan UTILITY-SCALE SOLAR:_
Decline in installed costs +80% Federal incentives
_? 30% ITC through 2016, 10% thereafter
public support for renewables
PATTERN ENERGY GROUP INC. 31
MARKET DRIVERS
ECONOMIC PURCHASES_ CORPORA
58%
decrease in wind pricing
Walmart Amazon Home Depot Microsoft
2009 2014
COMPETITIVE PRICING AND NEW ENTRANTS FUELING DEMAND
PATTERN ENERGY GROUP INC. 32
PIPELINE
2019 YE Regional iROFO Late Early/Mid Total Wind Solar 1 Business Plan
Total_ 1,346 1,181 _ 3,381 5,908 5,008 900 _ 2,100_
U.S. 474 672 1,024 2,170 2,130 40 750
1 | | 2019 YE business plan: Installed new capacity COD in addition to identified ROFO |
PATTERN ENERGY GROUP INC. 33
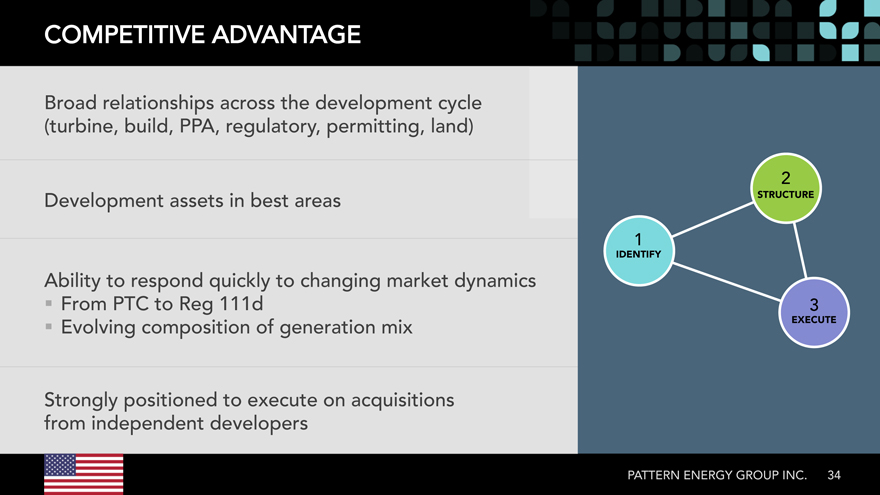
COMPETITIVE ADVANTAGE
Broad relationships across the development cycle (turbine, build, PPA, regulatory, permitting, land)
Development assets in best areas STRUCTURE
IDENTIFY
Ability to respond quickly to changing market dynamics
_? From PTC to Reg 111d 3
EXECUTE_
_? Evolving composition of generation mix
Strongly positioned to execute on acquisitions from independent developers
PATTERN ENERGY GROUP INC 34.
Pattern
Glen Hodges
BUSINESS DEVELOPMENT
MEXICO_
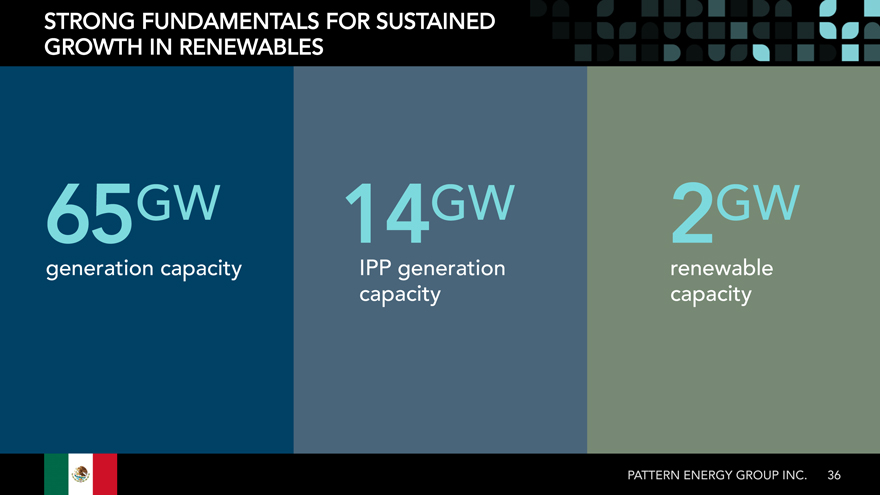
STRONG FUNDAMENTALS FOR SUSTAINED GROWTH IN RENEWABLES
GW 1465 GW 2GW
generation capacity IPP generation renewable capacity capacity
PATTERN ENERGY GROUP INC 36.
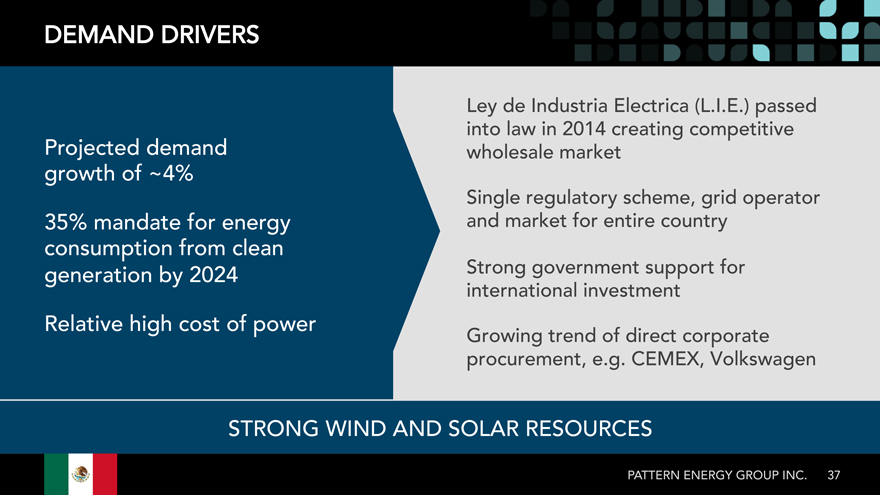
DEMAND DRIVERS
Ley de Industria Electrica (L . passed) into law in 2014 creating competitive
Projected demand wholesale market growth of ~4%
Single regulatory scheme, grid operator 35% mandate for energy and market for entire country
consumption from clean
generation by 2024 Strong government support for international investment
Relative high cost of power
Growing trend of direct corporate procurement, e . CEMEX, Volkswagen
STRONG WIND AND SOLAR RESOURCES
PATTERN ENERGY GROUP INC 37.
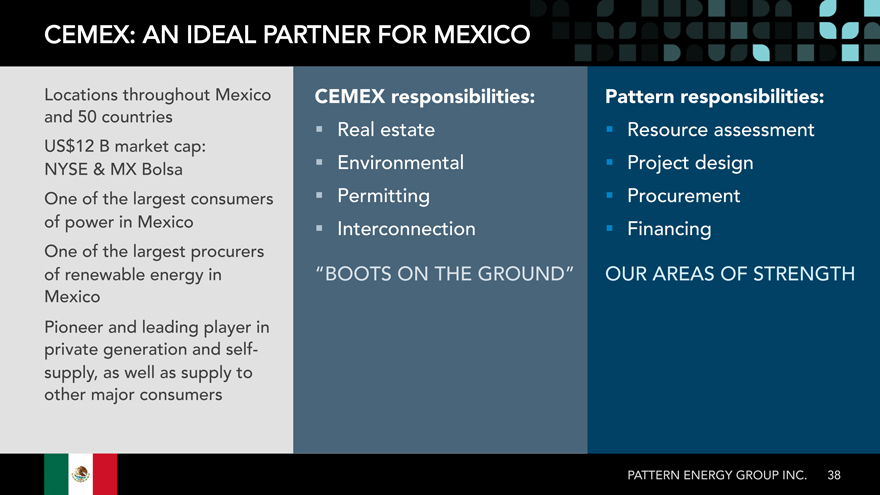
CEMEX: AN IDEAL PARTNER FOR MEXICO
Locations throughout Mexico CEMEX responsibilities:_ Pattern responsibilities:_
and 50 countries
_? Real estate _? Resource assessment
US B market cap:
NYSE MX& Bolsa _? Environmental _? Project design
One of the largest consumers _? Permitting _? Procurement of power in Mexico Financing
_? Interconnection _?
One of the largest procurers
of renewable energy in “BOOTS ON THE GROUND” OUR AREAS OF STRENGTH
Mexico
Pioneer and leading player in private generation and self-supply, as well as supply to other major consumers
PATTERN ENERGY GROUP INC 38.
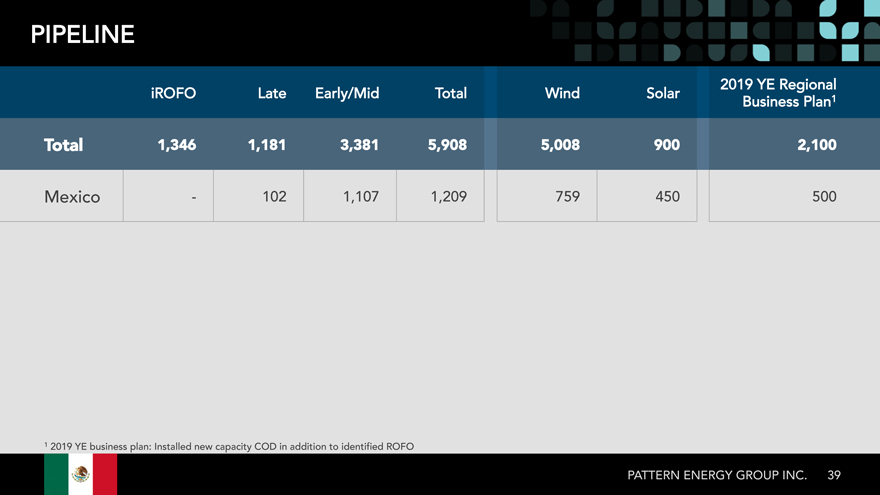
PIPELINE
2019 YE Regional iROFO Late Early/Mid Total Wind Solar 1 Business Plan
Total_ 1,346 1,181 _ 3,381 5,908 5,008 900 _ 2,100_
Mexico — 102 1,107 1,209 759 450 500
1 | | 2019 YE business plan: Installed new capacity COD in addition to identified ROFO |
PATTERN ENERGY GROUP INC. 39
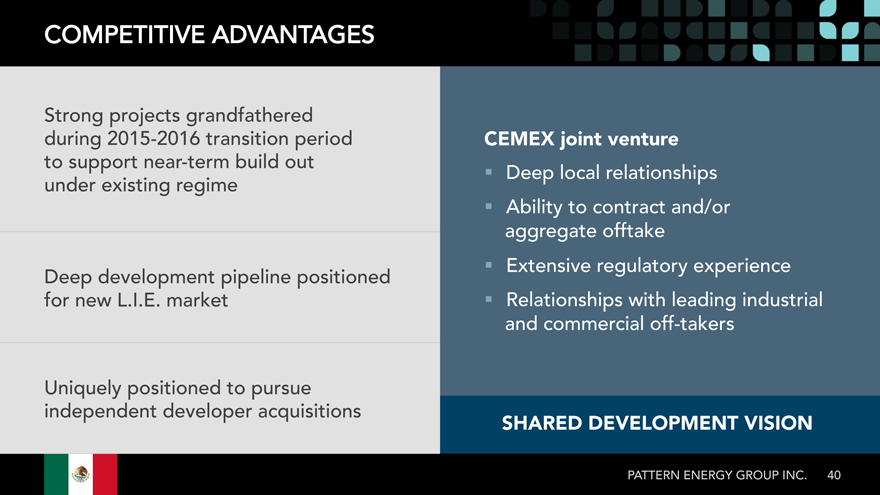
COMPETITIVE ADVANTAGES
Strong projects grandfathered during 2015-2016 transition period CEMEX joint venture_ to support near-term build out _? Deep local relationships under existing regime _? Ability to contract and/or aggregate offtake _? Extensive regulatory experience Deep development pipeline positioned for new Lmarket. _? Relationships with leading industrial and commercial off-takers
Uniquely positioned to pursue independent developer acquisitions
SHARED DEVELOPMENT VISION_
PATTERN ENERGY GROUP INC 40.
Pattern
Mark Anderson
BUSINESS DEVELOPMENT
JAPAN_
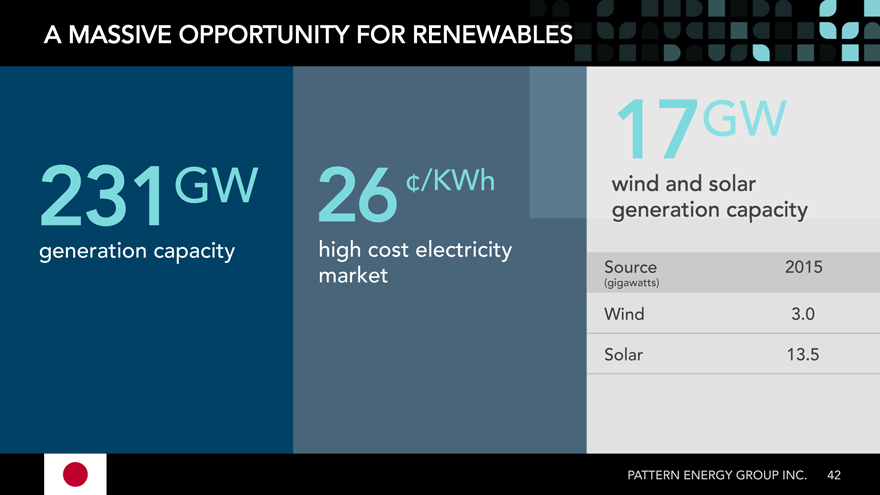
A MASSIVE OPPORTUNITY FOR RENEWAB
231GW 26 ¢/KWh
generation capacity high cost electricity
market Source 2015
(gigawatts)
Wind 0.3
Solar 5.13
PATTERN ENERGY GROUP INC 42.
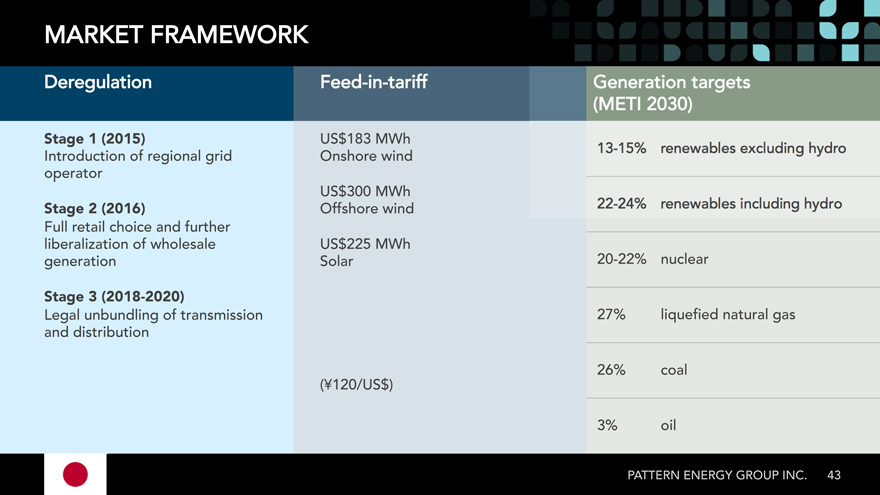
MARKET FRAMEWORK
Deregulation Feed-in-tariff
Stage 1 (2015)_ US$183 MWh Introduction of regional grid Onshore wind operator US$300 MWh
Stage 2 (2016)_ Offshore wind Full retail choice and further liberalization of wholesale US$225 MWh 20-22% nuclear generation Solar
Stage 3 (2018-2020)_
Legal unbundling of transmission 27% liquefied natural gas and distribution
26% coal
(¥120/US$)
3% oil
PATTERN ENERGY GROUP INC. 43
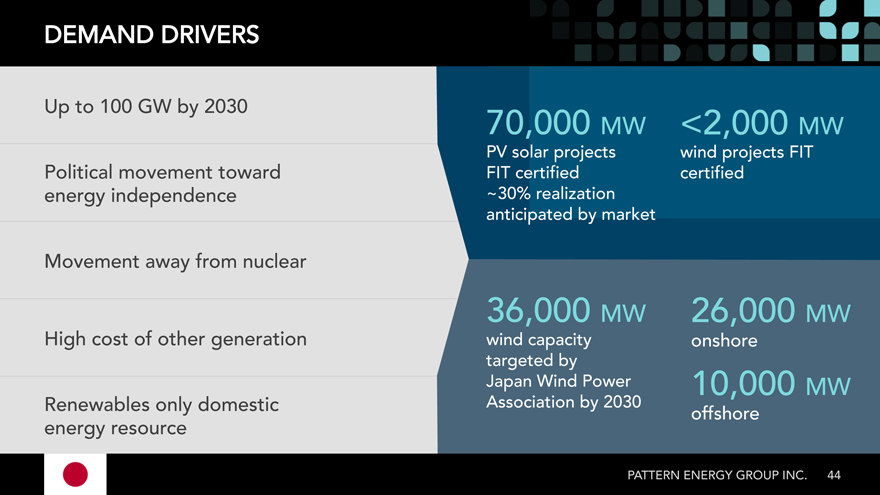
DEMAND DRIVERS
Up to 100 GW by 2030 70,000
MW <2,000 MW
PV solar projects wind projects FIT
Political movement toward FIT certified certified energy independence ~30% realization
anticipated by market
Movement away from nuclear
36,000 MW 26,000 MW
High cost of other generation wind capacity onshore
targeted by
Japan Wind Power 10,000 MW
Renewables only domestic Association by 2030 offshore energy resource
PATTERN ENERGY GROUP INC 44.
PIPELINE
2019 YE Regional iROFO Late Early/Mid Total Wind Solar 1 Business Plan
Total_ 1,346 1,181 _ 3,381 5,908 5,008 900 _ 2,100_
Japan 128 357 536 1,021 999 22 400
1 | | 2019 YE business plan: Installed new capacity COD in addition to identified ROFO |
PATTERN ENERGY GROUP INC. 45
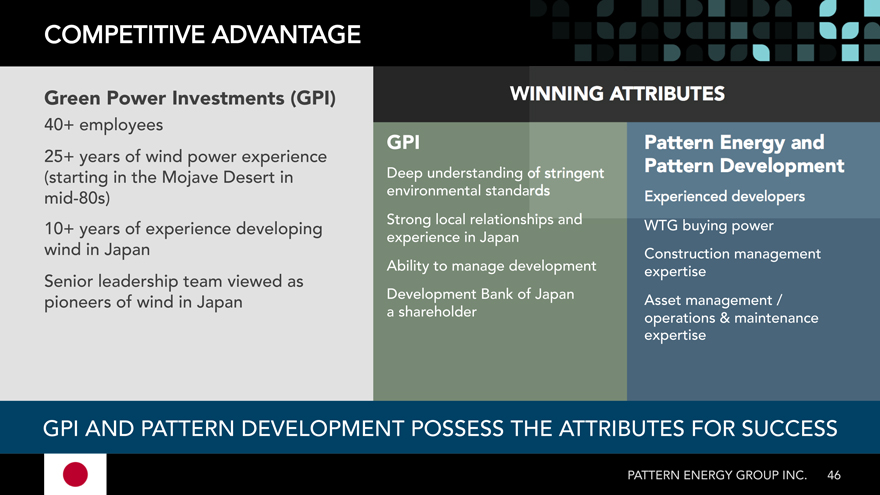
Green Power Investments (GPI)
40+ employees
25+ years of wind power experience
(starting in the Mojave Desert in
mid-80s)
10+ years of experience developing
wind in Japan
Senior leadership team viewed as
pioneers of wind in Japan
COMPETITIVE ADVANTAGE
WINNING ATTRIBUTES?
46
Pattern Energy and
Pattern Development?
Experienced developers
WTG buying power
Construction management
expertise
Asset management /
operations & maintenance
expertise
GPI?
Deep understanding of stringent
environmental standards
Strong local relationships and
experience in Japan
Ability to manage development
Development Bank of Japan
a shareholder
PATTERN ENERGY GROUP INC.
GPI AND PATTERN DEVELOPMENT POSSESS THE ATTRIBUTES FOR SUCCESS
Pattern
Esben Pedersen
INVESTMENT OVERVIEW & M&A OUTLOOK
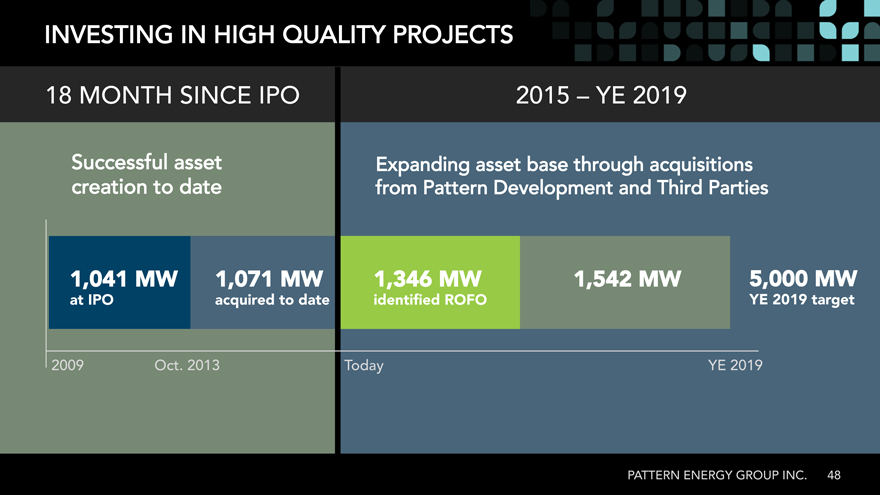
INVESTING IN HIGH QUALITY PROJECTS
18 MONTH SINCE IPO 2015 – YE 2019
Successful asset Expanding asset base through acquisitions creation to date from Pattern Development and Third Parties
1,041 MW 1,071 MW 1,346_ MW_ 1,542 MW_ 5,000 MW
at IPO acquired_ to date identi_ ?ed ROFO_ YE 2019 target_
2009 Oct 2013. Today YE 2019
PATTERN ENERGY GROUP INC 48.
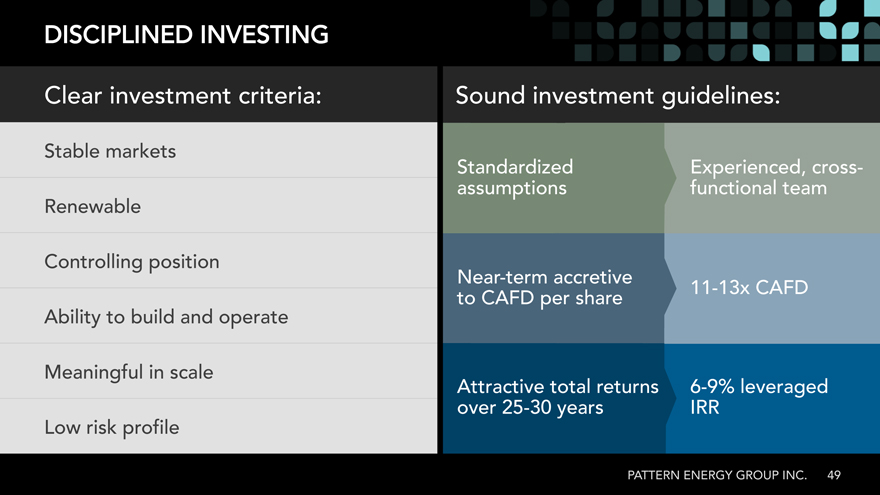
DISCIPLINED INVESTING
Clear investment criteria: Sound investment guidelines:
Stable markets
Standardized Experienced, cross-assumptions functional team Renewable
Controlling position
Near-term accretive
11-13x CAFD
Ability to build and operate to CAFD per share Meaningful in scale
Attractive total returns 6-9% leveraged Low risk profile over 25-30 years IRR
PATTERN ENERGY GROUP INC 49.
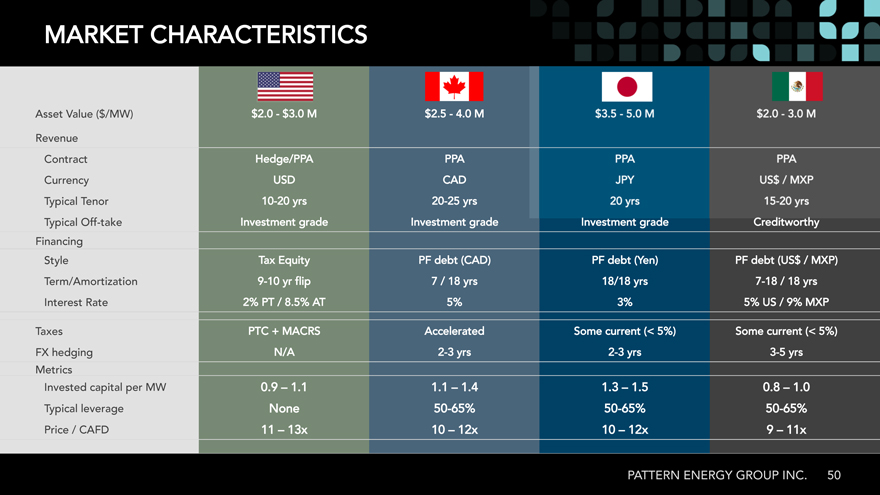
MARKET CHARACTERISTICS
Asset Value ($/MW) 0.2$—0.3$ M 5.2$—0.4 M Revenue Contract Hedge/PPA PPA
Currency USD CAD Typical Tenor 10-20 yrs 20-25 yrs
Typical Off-take Investment grade Investment grade Investment grade Creditworthy Financing Style Tax Equity PF debt (CAD) PF debt (Yen) PF debt (US$ / MXP) Term/Amortization 9-10 yr flip 7 / 18 yrs 18/18 yrs 7-18 / 18 yrs Interest Rate 2% PT / 8.5% AT 5% 3% 5% US / 9% MXP
Taxes PTC MACRS+ Accelerated Some current (< 5%) Some current (< 5%) FX hedging N/A 2-3 yrs 2-3 yrs 3-5 yrs Metrics Invested capital per MW 9.0 – 1.1 1.1 – 4.1 3.1 – 5.1 8.0 – 0.1
Typical leverage None 50-65% 50-65% 50-65% Price / CAFD 11 – 13x 10 – 12x 10 – 12x 9 – 11x
PATTERN ENERGY GROUP INC 50.
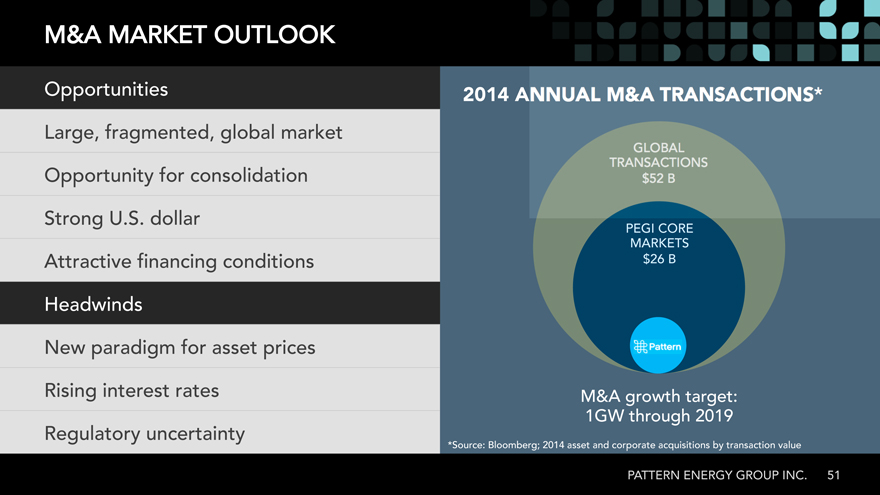
M&A MARKET OUTLOOK
Opportunities 2014 Large, fragmented, global market Opportunity for consolidation Strong U dollar.
PEGI CORE MARKETS
Attractive financing conditions B Headwinds New paradigm for asset prices Rising interest rates M&A growth target:
1GW through 2019
Regulatory uncertainty
*Source: Bloomberg; 2014 asset and corporate acquisitions by transaction value
PATTERN ENERGY GROUP INC 51.
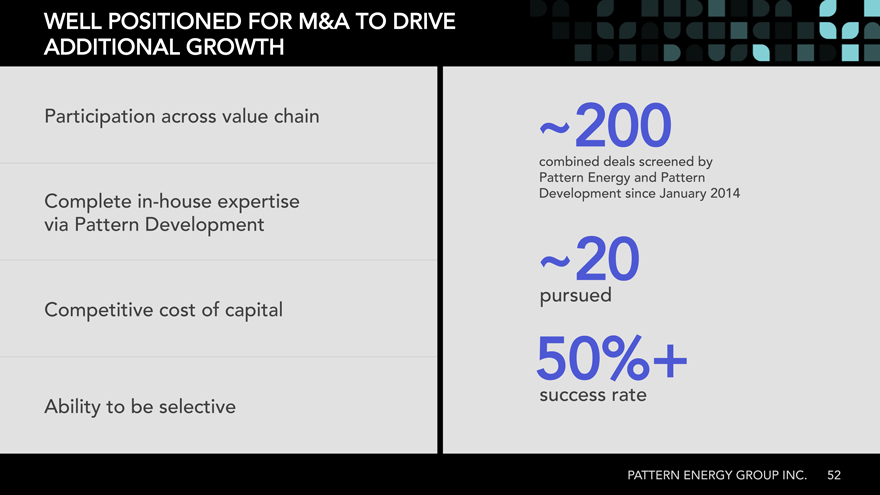
WELL POSITIONED FOR M&A TO DRIVE ADDITIONAL GROWTH
Participation across value chain ~200
combined deals screened by Pattern Energy and Pattern Complete in-house expertise Development since January 2014
via Pattern Development ~20 pursued Competitive cost of capital
50%+
success rate Ability to be selective
PATTERN ENERGY GROUP INC 52.
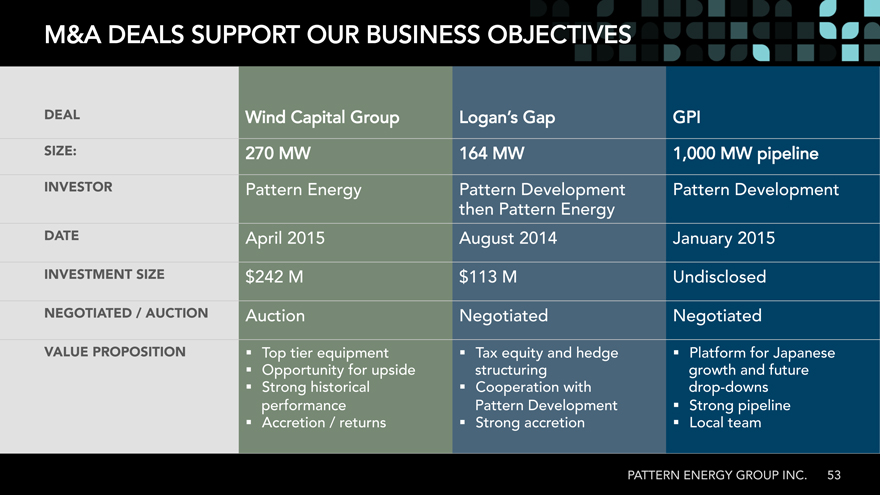
M&A DEALS SUPPORT OUR BUSINESS OBJECTIVES
DEAL_ Wind Capital Group Logan’s Gap GPI
SIZE:_ 270 MW 164 MW 1,000 MW pipeline INVESTOR_ Pattern Energy Pattern Development Pattern Development then Pattern Energy DATE_ April 2015 August 2014 January 2015
INVESTMENT SIZE_ M M Undisclosed
NEGOTIATED / AUCTION_ Auction Negotiated Negotiated
VALUE PROPOSITION ? Top tier equipment _? Tax equity and hedge _? Platform for Japanese _? Opportunity for upside structuring growth and future _? Strong historical _? Cooperation with drop-downs performance Pattern Development _? Strong pipeline _? Accretion / returns _? Strong accretion _? Local team
PATTERN ENERGY GROUP INC 53.
Pattern
Chris Shugart
OPERATIONS
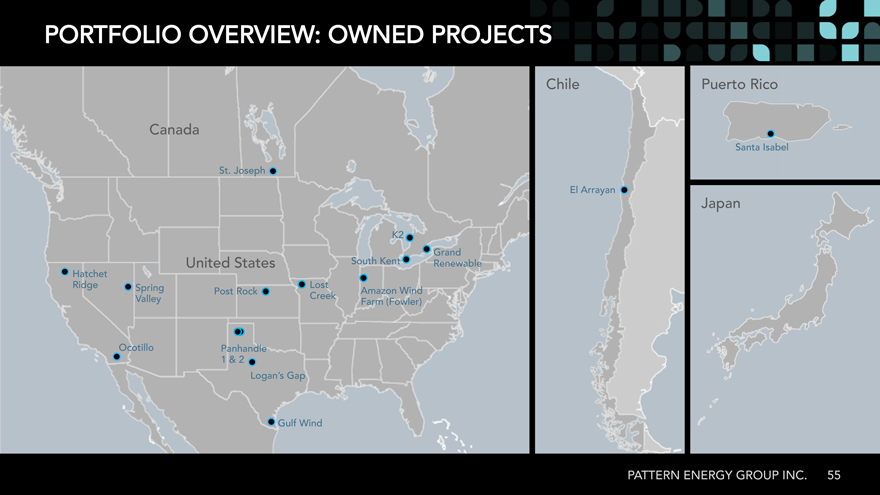
PORTFOLIO OVERVIEW: OWNED PROJECTS
Chile Puerto Rico
Canada
Santa Isabel
St. Joseph
El Arrayan Japan K2 Grand United States South Kent Renewable Hatchet Ridge Spring Lost Post Rock Amazon Wind Valley Creek Farm (Fowler)
Ocotillo Panhandle
Logan’s Gap
Gulf Wind
PATTERN ENERGY GROUP INC. 55
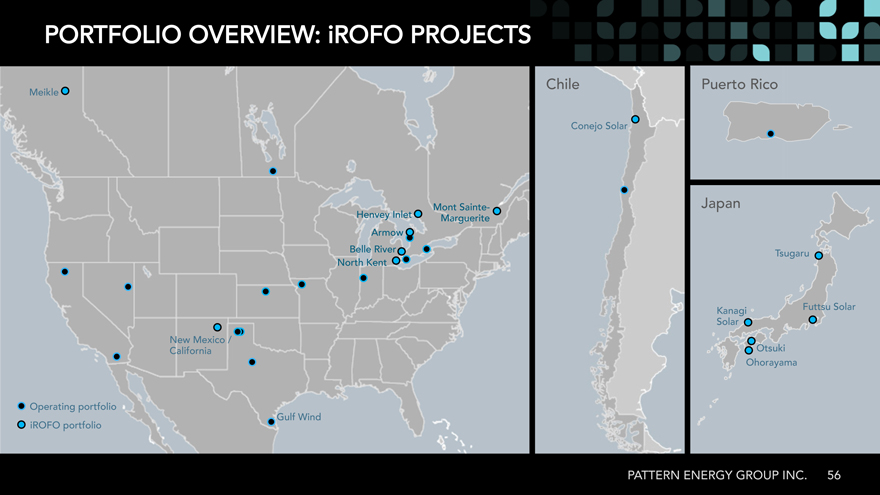
PORTFOLIO OVERVIEW: iROFO PROJECTS
Chile Puerto Rico
Meikle
Conejo Solar
Henvey Inlet Mont Sainte- Japan Marguerite Armow
Belle River Tsugaru North Kent
Kanagi Futtsu Solar Solar New Mexico / California Otsuki Ohorayama
Operating portfolio
Gulf Wind iROFO portfolio
PATTERN ENERGY GROUP INC. 56
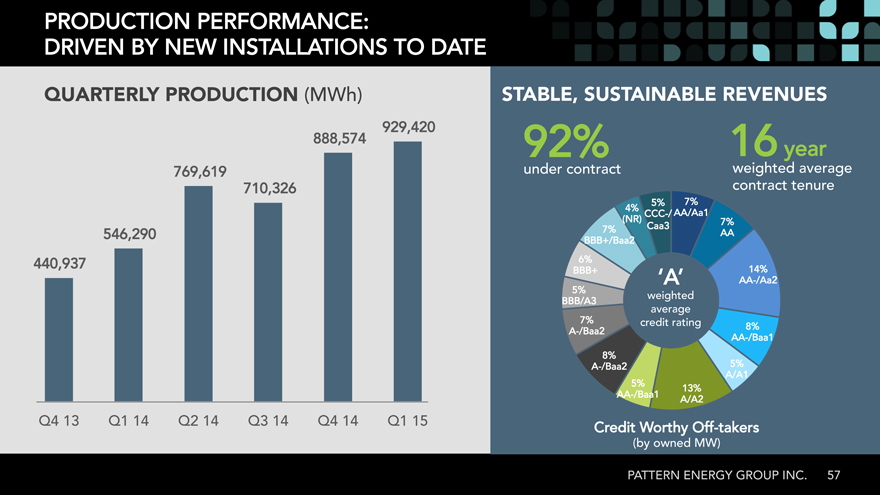
PRODUCTION PERFORMANCE:
DRIVEN BY NEW INSTALLATIONS TO DATE
QUARTERLY PRODUCTION (MWh) STABLE, SUSTAINABLE REVENUES
929,420
888,574 92% 16 year 769,619 under contract weighted average 710,326 contract tenure
5% 7%
4% AA/Aa1 CCC-/ (NR) 7%
7% Caa3
546,290 AA
BBB+/Baa2
440,937 6% 14%
BBB+ /Aa2
5% ‘A’ AA- weighted
BBB/A3 average 7% credit rating
A-/Baa2 8% AA-/Baa1 8% A-/Baa2 5% A/A1
5% 13% AA-/Baa1 A/A2
Q4 Q113 Q214 Q314 Q414 Q114 15 Credit Worthy Off-takers
owned(by MW)
PATTERN ENERGY GROUP INC 57.
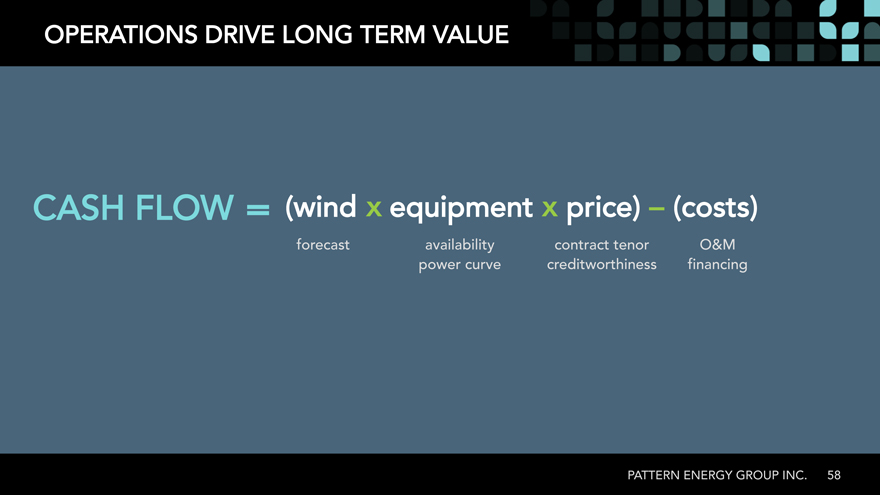
OPERATIONS DRIVE LONG TERM VALUE
CASH FLOW = (wind x equipment x price) – (costs)
forecast availability contract tenor O&M power curve creditworthiness financing
PATTERN ENERGY GROUP INC. 58
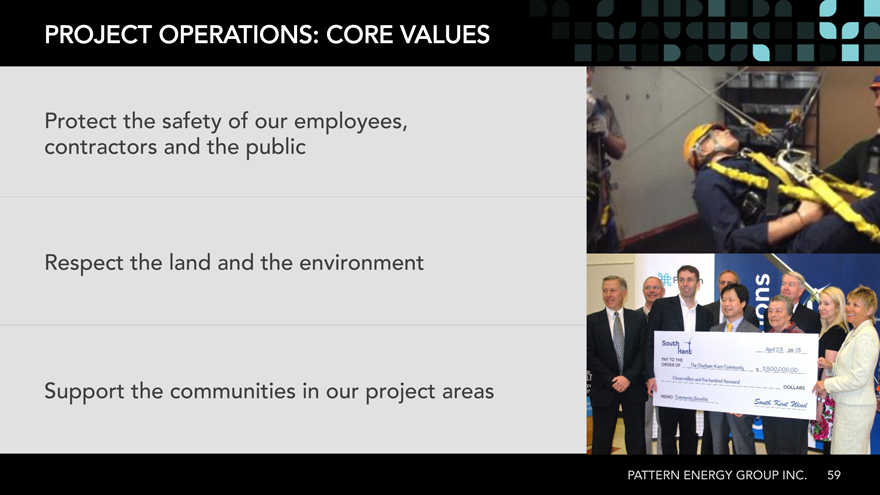
PROJECT OPERATIONS: CORE VALUES
Protect the safety of our employees, contractors and the public
Respect the land and the environment
Support the communities in our project areas
PATTERN ENERGY GROUP INC. 59
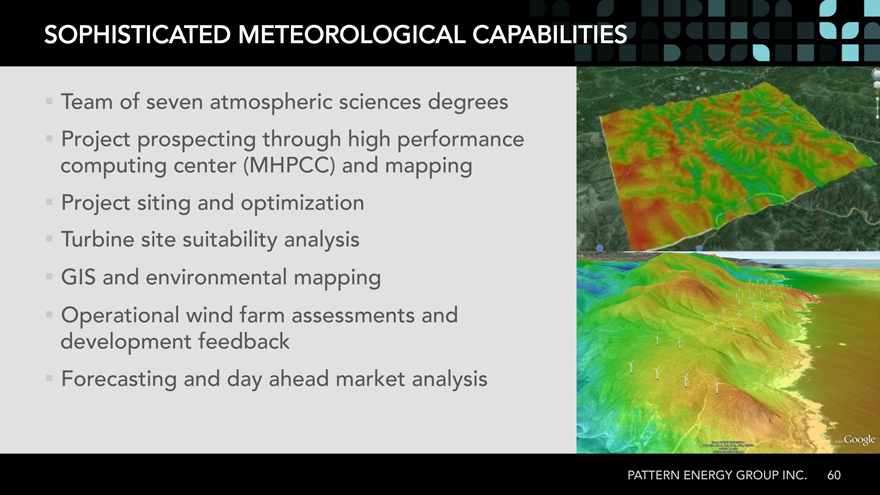
SOPHISTICATED METEOROLOGICAL CAPABILITIES
_? Team of seven atmospheric sciences degrees _? Project prospecting through high performance computing center and(MHPCC) mapping _? Project siting and optimization _? Turbine site suitability analysis _? GIS and environmental mapping _? Operational wind farm assessments and development feedback _? Forecasting and day ahead market analysis
PATTERN ENERGY GROUP INC60.
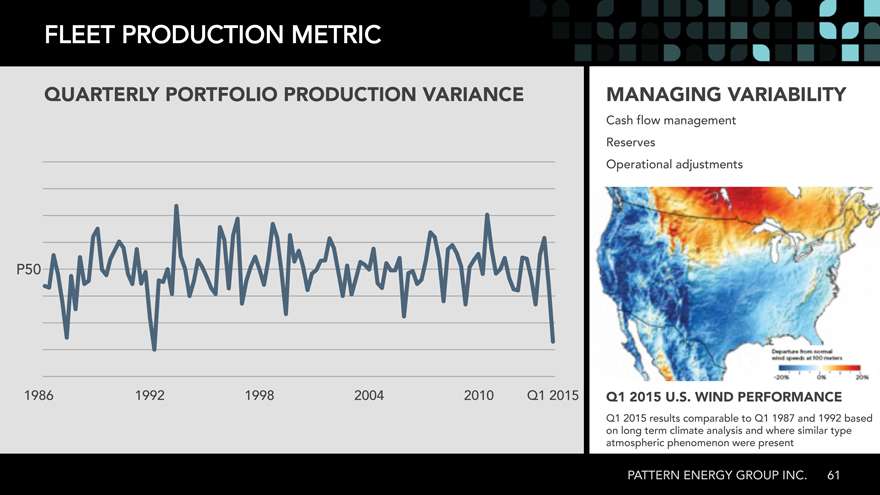
FLEET PRODUCTION METRIC
QUARTERLY PORTFOLIO PRODUCTION VARIANCE MANAGING VARIABILITY_
Cash flow management Reserves Operational adjustments
P50
1986 1992 1998 2004 2010 Q1 2015 Q1 2015 U.S. WIND PERFORMANCE_
Q1 2015 results comparable to Q1 1987 and 1992 based on long term climate analysis and where similar type atmospheric phenomenon were present
PATTERN ENERGY GROUP INC. 61
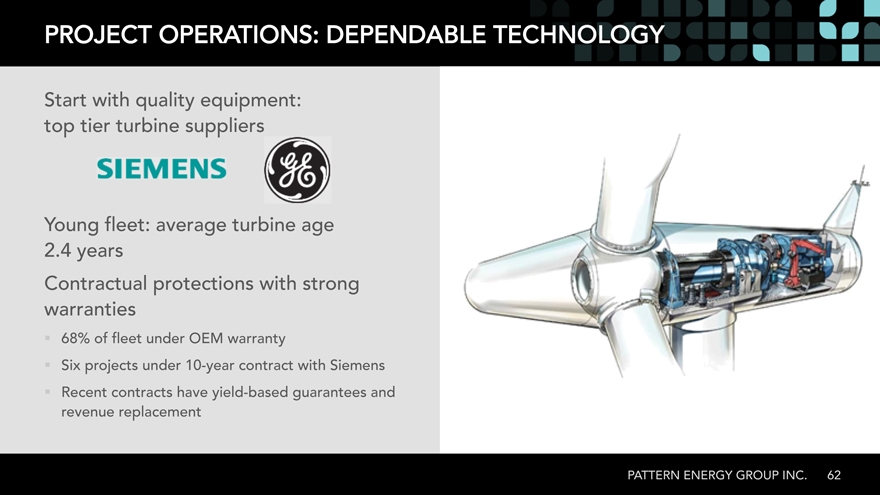
PROJECT OPERATIONS: DEPENDABLE TE
Start with quality equipment: top tier turbine suppliers
Young fleet: average turbine age 4.2 years Contractual protections with strong warranties
_? 68% of fleet under OEM warranty
_? Six projects under 10-year contract with Siemens _? Recent contracts have yield-based guarantees and revenue replacement
PATTERN ENERGY GROUP INC 62.
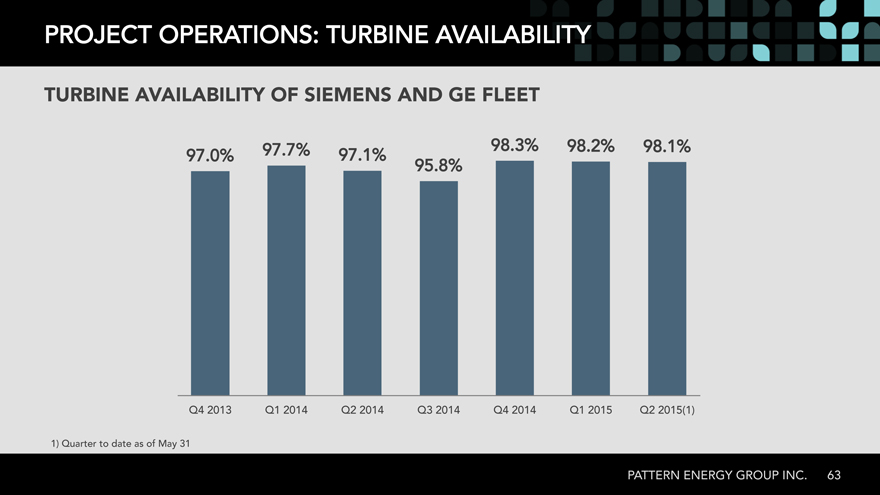
PROJECT OPERATIONS: TURBINE AVAILABILITY
TURBINE AVAILABILITY OF SIEMENS AND GE FLEET_
97.7% 98.3% 98.2% 98.1%
97.0% 97.1%
95.8%
Q4 2013 Q1 2014 Q2 2014 Q3 2014 Q4 2014 Q1 2015 Q2 2015(1)
1) Quarter to date as of May 31
PATTERN ENERGY GROUP INC. 63
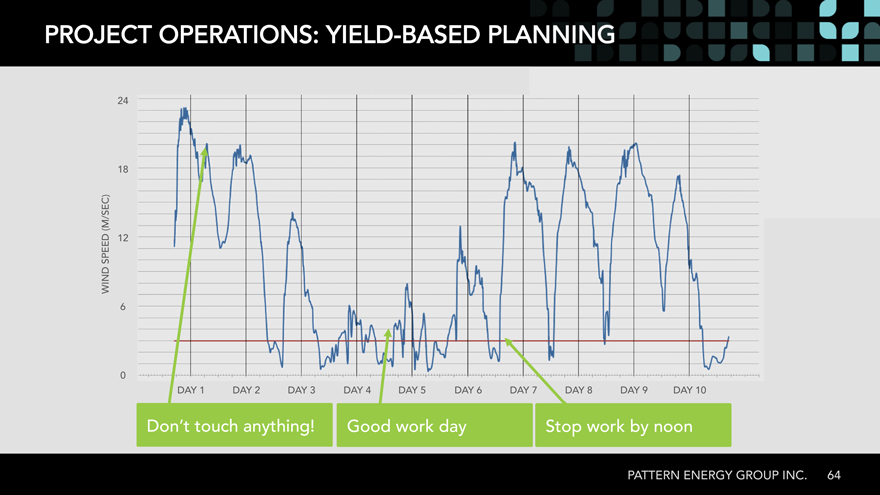
PROJECT OPERATIONS: YIELD-BASED PLA
24
18
(M/SEC) SPEED 12 WIND
0
DAY 1 DAY 2 DAY 3 DAY 4 DAY 5 DAY 6 DAY 7 DAY 8 DAY 9 DAY 10
Don’t touch anything! Good work day Stop work by noon
PATTERN ENERGY GROUP INC. 64
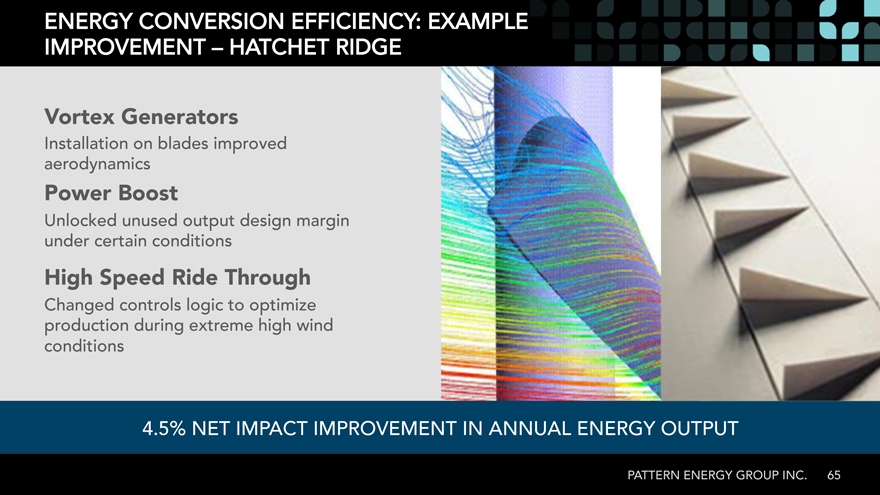
ENERGY CONVERSION EFFICIENCY: EXAMPLE IMPROVEMENT – HATCHET RIDGE
Vortex Generators_
Installation on blades improved aerodynamics
Power Boost_
Unlocked unused output design margin under certain conditions
High Speed Ride Through_
Changed controls logic to optimize production during extreme high wind conditions
4.5% NET IMPACT IMPROVEMENT IN ANNUAL ENERGY OUTPUT
PATTERN ENERGY GROUP INC 65.
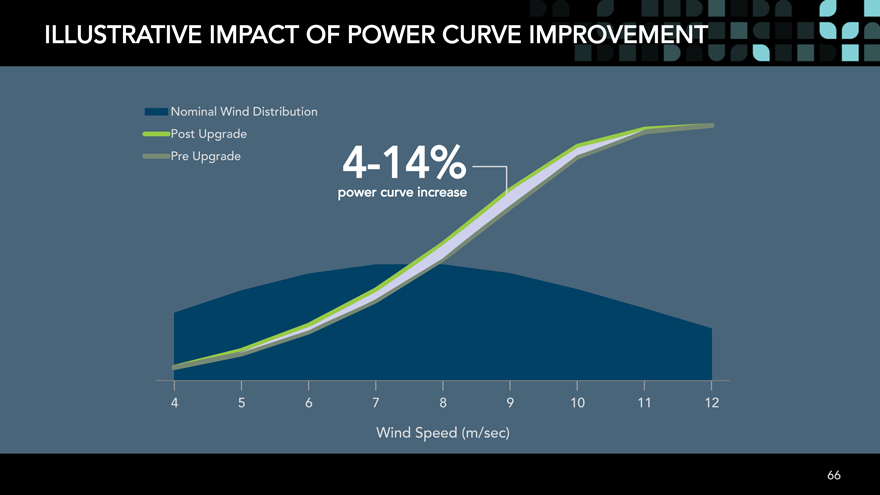
ILLUSTRATIVE IMPACT OF POWER CURVE IMPROVEMENT
Nominal Wind Distribution Post Upgrade
Pre Upgrade 4-14% power curve increase
Wind Speed (m/sec)
66
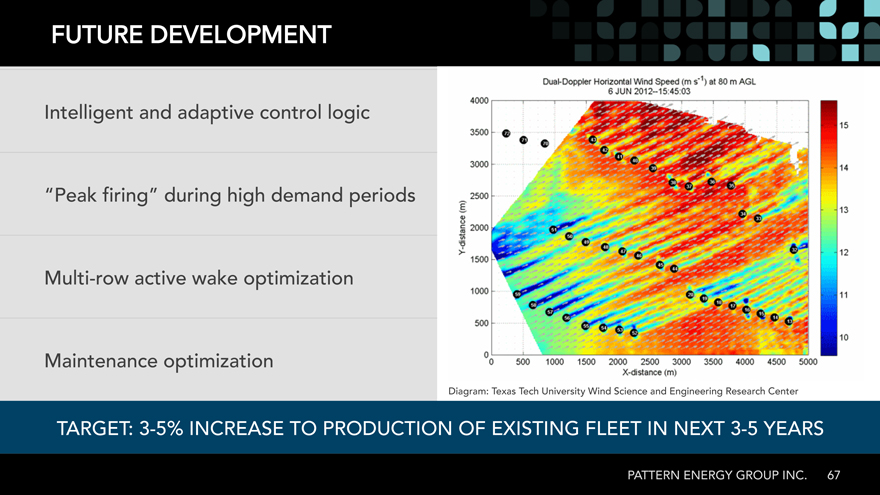
FUTURE DEVELOPMENT
Intelligent and adaptive control logic “Peak firing” during high demand periods Multi-row active wake optimization
Maintenance optimization
Diagram: Texas Tech University Wind Science and Engineering Research Center
TARGET: 3-5% INCREASE TO PRODUCTION OF EXISTING FLEET IN NEXT 3-5 YEARS
PATTERN ENERGY GROUP INC 67.
Pattern
Mike Lyon
FINANCIALS
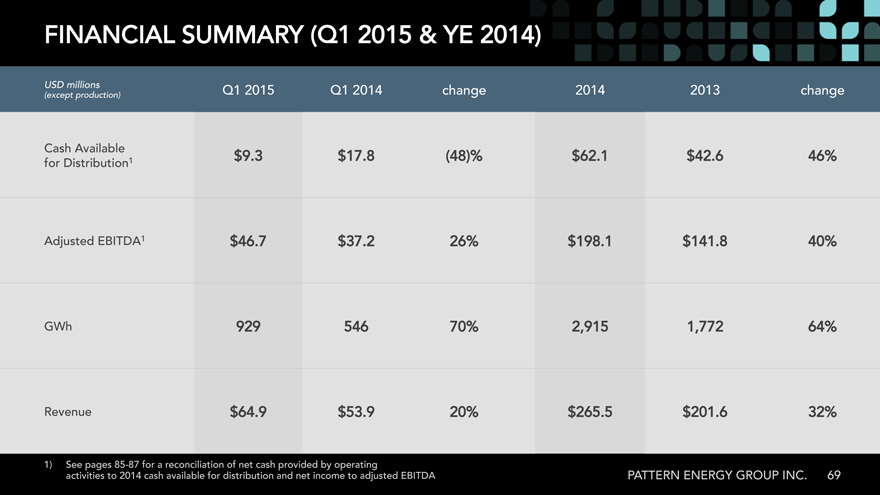
FINANCIAL SUMMARY 2015(Q1 YE& 2014)
USD millions Q1 Q12015 2014 change 2014 2013 change
(except production)
Cash Available 8.17$3.9$ (48)% 1.62$ 46%6.42$
for Distribution1
Adjusted EBITDA1 26%2.37$7.46$ 1.198$ 40%8.141$
GWh 70%546929 2,915 64%1,772
Revenue 20%9.53$9.64$ 5.265$ 32%6.201$
1)? See pages ##- for## a reconciliation of net cash provided by operating activities to
1)cash ? See available pages for distribution 85-87 for and a reconciliation net income to adjusted of net EBITDA cash provided by operating activities to 2014 cash available for distribution and net income to adjusted EBITDA PATTERN ENERGY GROUP INC 69.
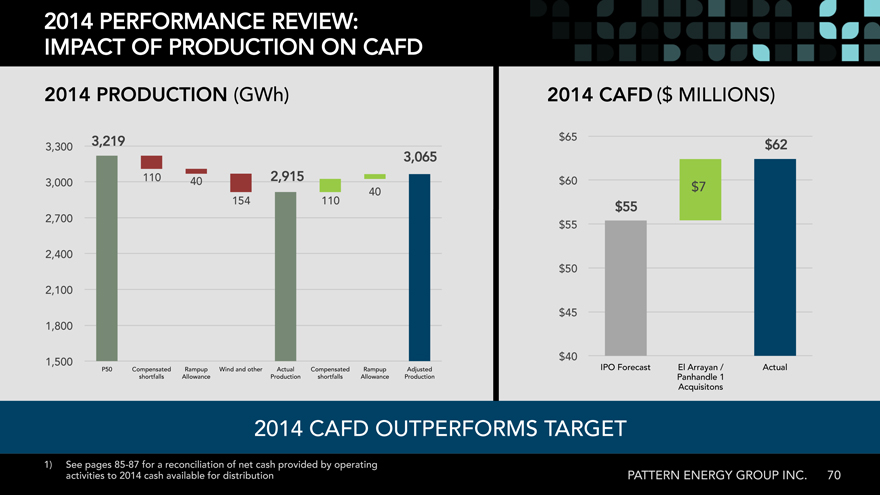
2014 PERFORMANCE REVIEW: IMPACT OF PRODUCTION ON CAFD
2014 PRODUCTION (GWh) 2014 CAFD ($ MILLIONS)
3,219
3,300
3,065
110 40 2,915
3,000 40 110154 55$ 2,700
2,400
2,100
1,800
1,500
P50 Compensated Rampup Wind and other Actual Compensated Rampup Adjusted IPO Forecast El Arrayan / Actual shortfalls Allowance Production shortfalls Allowance Production Panhandle 1
Acquisitons
2014 CAFD OUTPERFORMS TARGET
1)? See pages 85-87 for a reconciliation of net cash provided by operating activities to 2014 cash available for distribution PATTERN ENERGY GROUP INC. 70
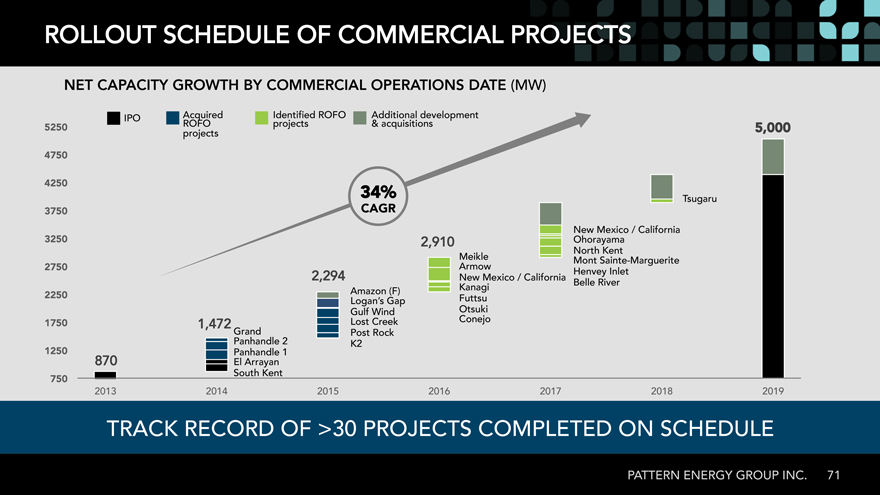
ROLLOUT SCHEDULE OF COMMERCIAL PROJECTS
NET CAPACITY GROWTH BY COMMERCIAL OPERATIONS DATE (MW)
IPO Acquired Identified ROFO Additional development
5250_ ROFO projects projects acquisitions& 5,000_
4750_
4250_ 34%_
Tsugaru
3750_ CAGR_
3250_ 2,910 Ohorayama New Mexico / California North Kent Meikle Armow Mont Sainte-Marguerite 2750_ Henvey Inlet 2,294 New Mexico / California Kanagi Belle River 2250_ Amazon (F) Logan’s Gap Futtsu Gulf Wind Conejo Otsuki 1750_ 1,472 Lost Creek Grand Post Rock 1250_ Panhandle 2 K2 El Panhandle Arrayan 1
870
South Kent
750_
2019201820172016201520142013
TRACK RECORD OF >30 PROJECTS COMPLETED ON SCHEDULE
PATTERN ENERGY GROUP INC 71.
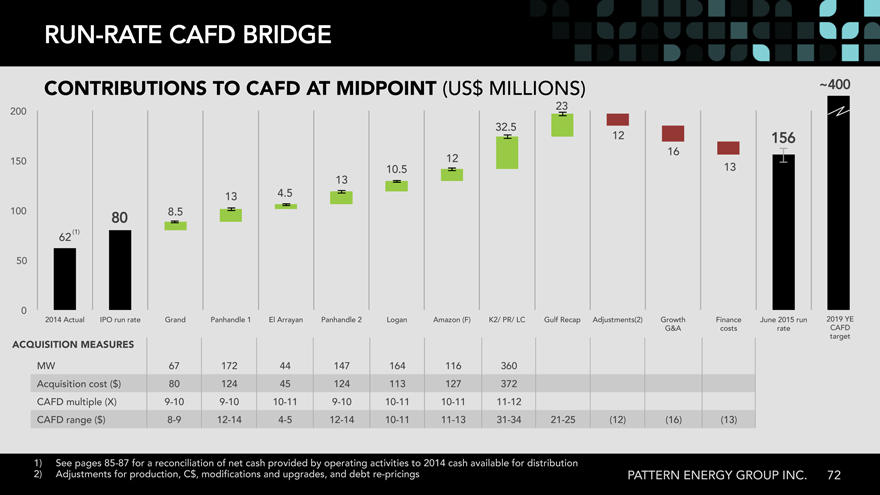
RUN-RATE CAFD BRIDGE
CONTRIBUTIONS TO CAFD AT MIDPOINT (US$ MILLIONS) ~400
200 23 5.32
12 156 16
150 12
5.10 13 13
13 5.4
100 80 5.8
62 (1)
50
0 2019 YE
2014 Actual IPO run rate Grand Panhandle 1 El Arrayan Panhandle 2 Logan Amazon (F) K2/ PR/ LC Gulf Recap Adjustments(2) Growth Finance June 2015 run CAFD G&A costs rate target
ACQUISITION MEASURES_
MW 3601161641474417267 Acquisition cost ($3721271131244512480) CAFD multiple 9(X) -910 -1010—911 —1010 —1011 -1111 -12
CAFD range ($ 8) —129 —414 —125 —1014 -1111—3113 -2134 -(12)25 (16) (13)
1)? See pages 85-87 for a reconciliation of net cash provided by operating activities to 2014 cash available for distribution
2)? Adjustments for production, C$ modifications, and upgrades, and debt re-pricings PATTERN ENERGY GROUP INC72.
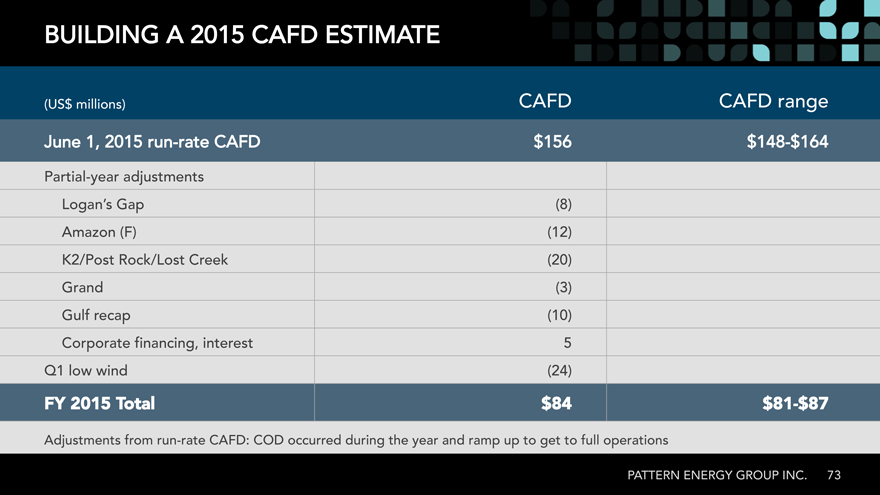
BUILDING A 2015 CAFD ESTIMATE
(US$ millions) CAFD CAFD range
June 20151, run-rate CAFD —
Partial-year adjustments
Logan’s Gap (8) Amazon (F) (12) K2/Post Rock/Lost Creek (20) Grand (3) Gulf recap (10) Corporate financing, interest 5 Q1 low wind (24)
FY 2015 Total_ 84$ _ 81$—87$ _
Adjustments from run-rate CAFD: COD occurred during the year and ramp up to get to full operations
PATTERN ENERGY GROUP INC 73.
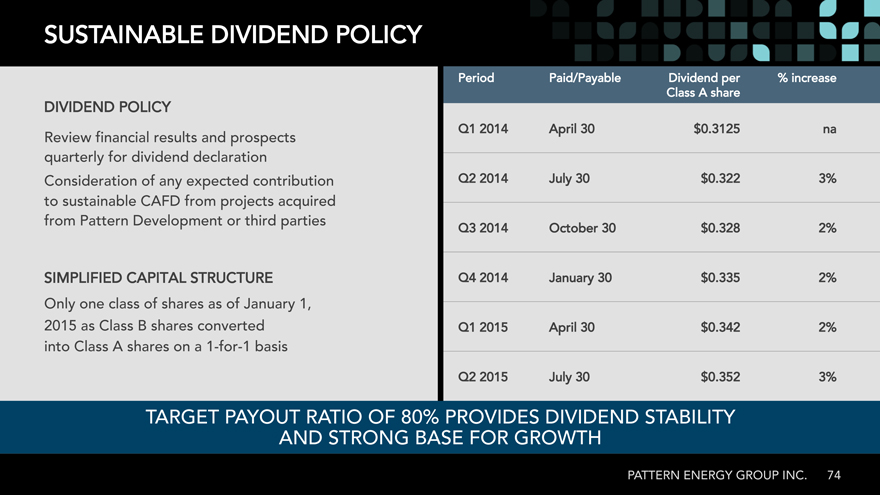
SUSTAINABLE DIVIDEND POLICY
Period Paid/Payable Dividend per increase% Class A share
DIVIDEND POLICY
Q1 2014 April 3125.0$30 na
Review financial results and prospects quarterly for dividend declaration
Consideration of any expected contribution Q2 2014 July 3%322.0$30 to sustainable CAFD from projects acquired from Pattern Development or third parties
Q3 2014 October 2%328.0$30
SIMPLIFIED CAPITAL STRUCTURE Q4 2014 January 30 2%335.0$ Only one class of shares as of January 1, 2015 as Class B shares converted Q1 2015 April 2%342.0$30 into Class A shares on a 1-for-1 basis
Q2 2015 July 3%352.0$30
TARGET PAYOUT RATIO OF 80% PROVIDES DIVIDEND STABILITY AND STRONG BASE FOR GROWTH
PATTERN ENERGY GROUP INC 74.
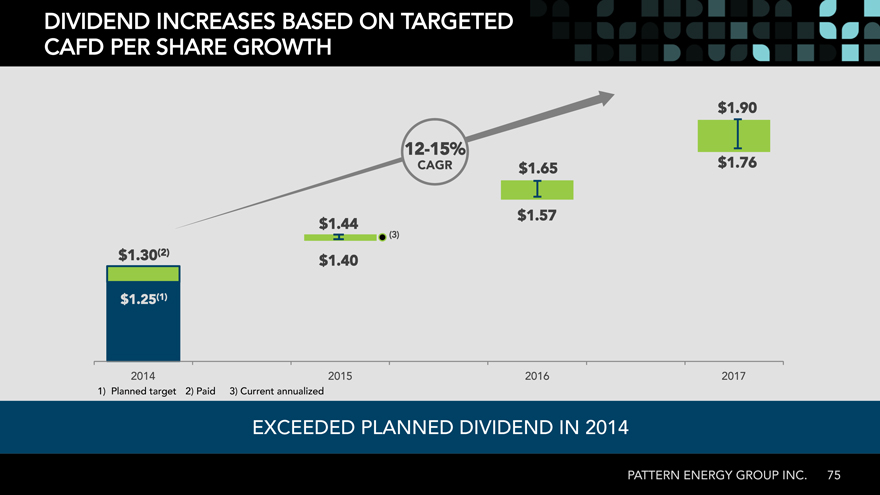
DIVIDEND INCREASES BASED ON TARGETED CAFD PER SHARE GROWTH
$1.90_
12-15%_
$1.76_ CAGR_ $1.65_
$1.57_
$1.44_
$1.30(2)_
$1.40_
$1.25(1)_
2014 2015 2016 2017
1)? Planned target 2) Paid 3) Current annualized
EXCEEDED PLANNED DIVIDEND IN 2014
PATTERN ENERGY GROUP INC. 75
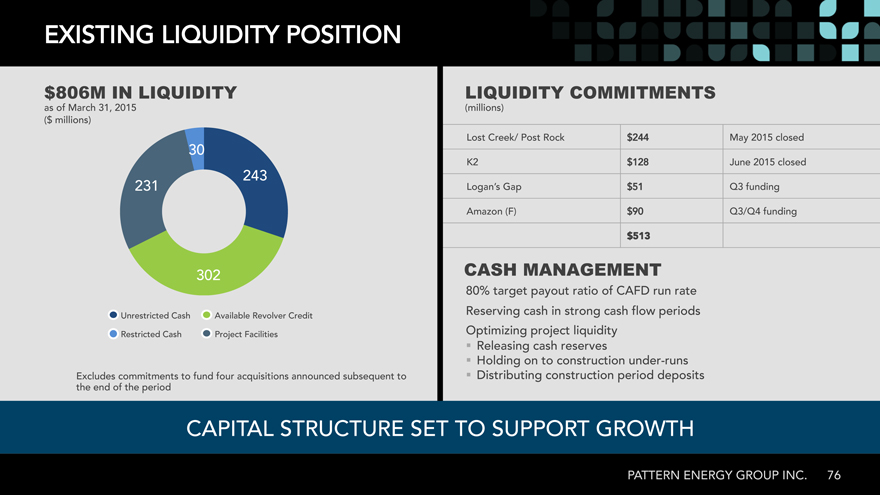
EXISTING LIQUIDITY POSITION
IN LIQUIDITY LIQUIDITY COMMITMENTS
as of March 201531, (millions) ($ millions)
30 Lost Creek/ Post Rock May 2015 closed 243 K2 June 2015 closed 231 Logan’s Gap Q3 funding Amazon (F) Q3/Q4 funding
513$ _
302 CASH MANAGEMENT
80% target payout ratio of CAFD run rate Unrestricted Cash Available Revolver Credit Reserving cash in strong cash flow periods
Restricted Cash Project Facilities Optimizing project liquidity
_? Releasing cash reserves
_? Holding on to construction under-runs
Excludes commitments to fund four acquisitions announced subsequent to _? Distributing construction period deposits the end of the period
CAPITAL STRUCTURE SET TO SUPPORT GROWTH
PATTERN ENERGY GROUP INC. 76
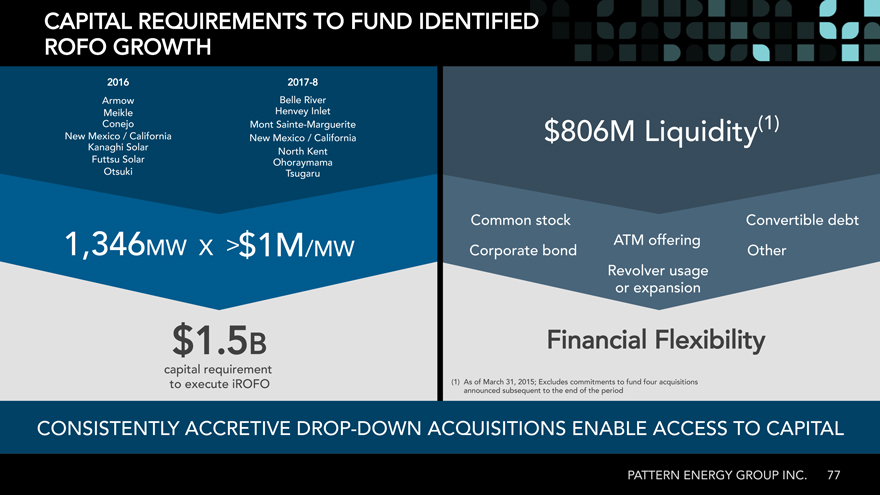
CAPITAL REQUIREMENTS TO FUND IDENTIFIED ROFO GROWTH
20172016 -8 Armow Belle River Meikle Henvey Inlet
Conejo Mont Sainte-Marguerite (1) New Mexico / California New Mexico / California Liquidity Kanaghi Solar North Kent Futtsu Solar Ohoraymama Otsuki Tsugaru
Common stock Convertible debt 1,346MW X > ATM offering /MW Corporate bond Other Revolver usage or expansion
5.1$ B Financial Flexibility
capital requirement
to execute iROFO As(1) of March 31, 2015; Excludes commitments to fund four acquisitions announced subsequent to the end of the period
CONSISTENTLY ACCRETIVE DROP-DOWN ACQUISITIONS ENABLE ACCESS TO CAPITAL
PATTERN ENERGY GROUP INC77.
Pattern
Mike Garland
PATTERN DEVELOPMENT RELATIONSHIP
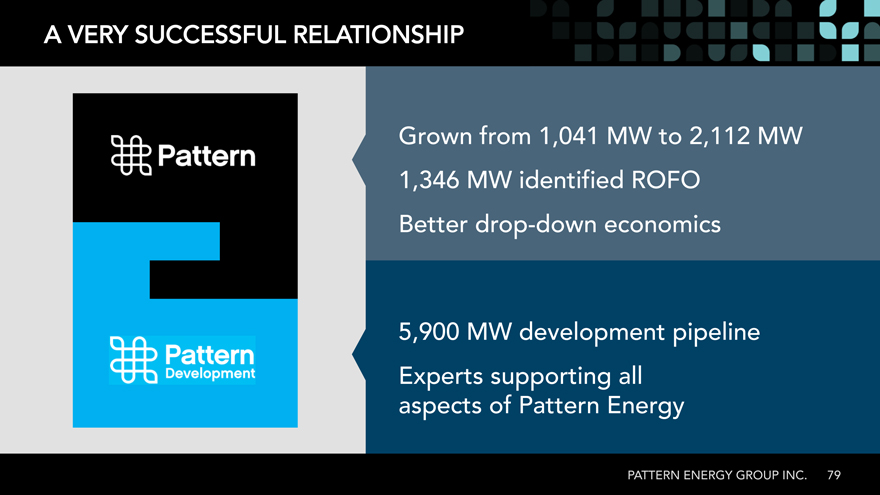
A VERY SUCCESSFUL RELATIONSHIP
Grown from 1,041 MW to 2,112 MW 1,346 MW identified ROFO
Better drop-down economics
5,900 MW development pipeline Experts supporting all aspects of Pattern Energy
PATTERN ENERGY GROUP INC 79.
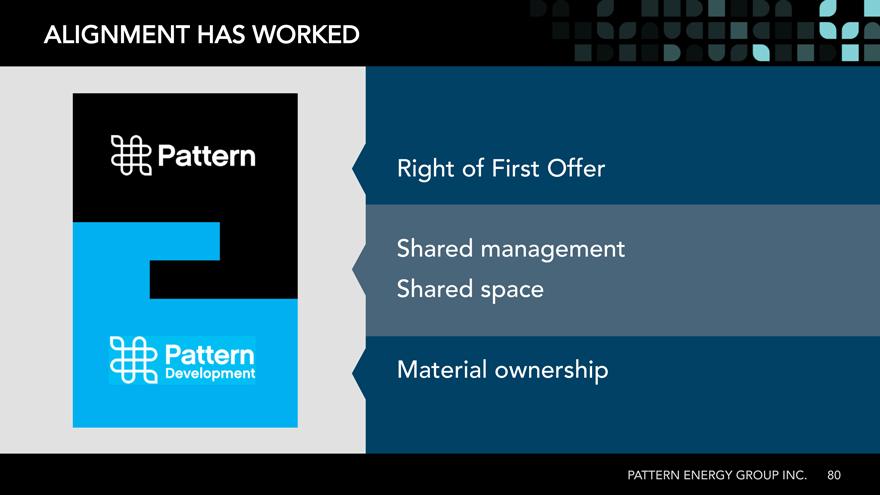
ALIGNMENT HAS WORKED
Right of First Offer
Shared management Shared space
Material ownership
PATTERN ENERGY GROUP INC. 80
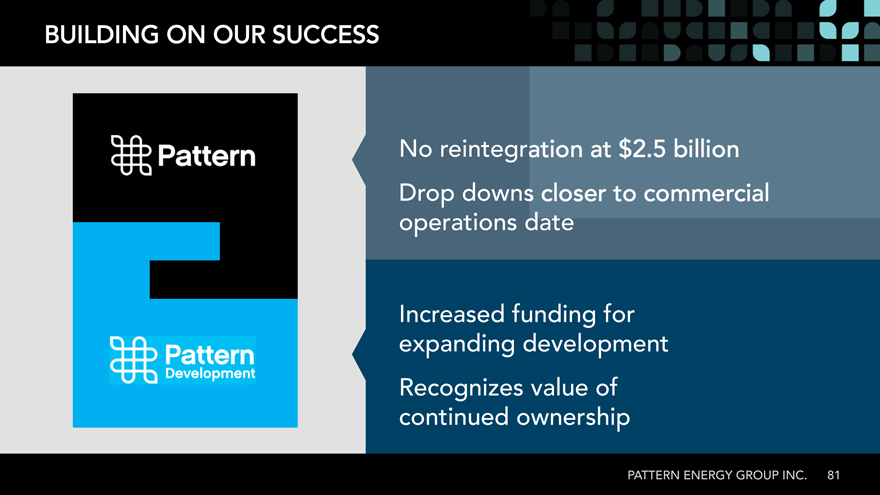
BUILDING ON OUR SUCCESS
No reintegration Drop downs operations date
Increased funding for expanding development Recognizes value of continued ownership
PATTERN ENERGY GROUP INC 81.
LEVERAGING THE RELATIONSHIP
82 Continuing to improve the relationship Selectively expanding markets Arranging construction bridge capital Joint acquisitions Participation in development Why Consider Development Ā?Development: 6-8X CAFD Ā?Acquisitions: 11-13X CAFD PATTERN ENERGY GROUP INC. Why Consider Development
_? Development: 6-8X CAFD _? Acquisitions: 11-13X CAFD
Pattern
QUESTION & ANSWER PANEL
Pattern
Mike Garland
WRAP UP
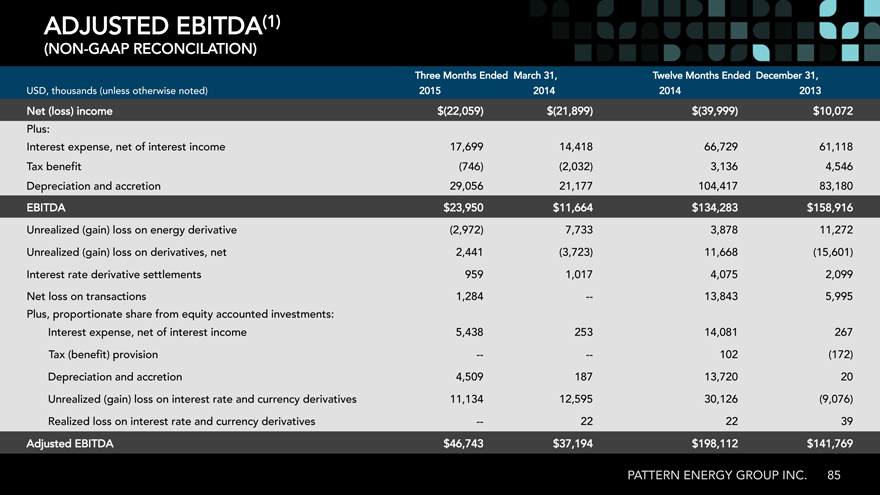
ADJUSTED EBITDA(1)
(NON-GAAP RECONCILATION)
Three Months Ended March 31, Twelve Months Ended December 31, USD, thousands otherwise(unless noted) 20142015 20132014
Net income(loss) $(22,059) $(21,899) $(39,999) Plus: Interest expense, net of interest income 17,699 14,418 66,729 61,118 Tax benefit (746) (2,032) 3,136 4,546 Depreciation and accretion 29,056 21,177 104,417 83,180 EBITDA 23,950$ Unrealized loss(gain) on energy derivative (2,972) 7,733 3,878 11,272 Unrealized loss(gain) on derivatives, net 2,441 (3,723) 11,668 (15,601) Interest rate derivative settlements 959 1,017 4,075 2,099 Net loss on transactions 1,284 — 13,843 5,995 Plus, proportionate share from equity accounted investments: Interest expense, net of interest income 5,438 253 14,081 267 Tax provision(benefit) — — 102 (172) Depreciation and accretion 4,509 187 13,720 20 Unrealized loss(gain) on interest rate and currency derivatives 11,134 12,595 30,126 (9,076) Realized loss on interest rate and currency derivatives — 22 22 39 Adjusted EBITDA 46,743$
PATTERN ENERGY GROUP INC. 85
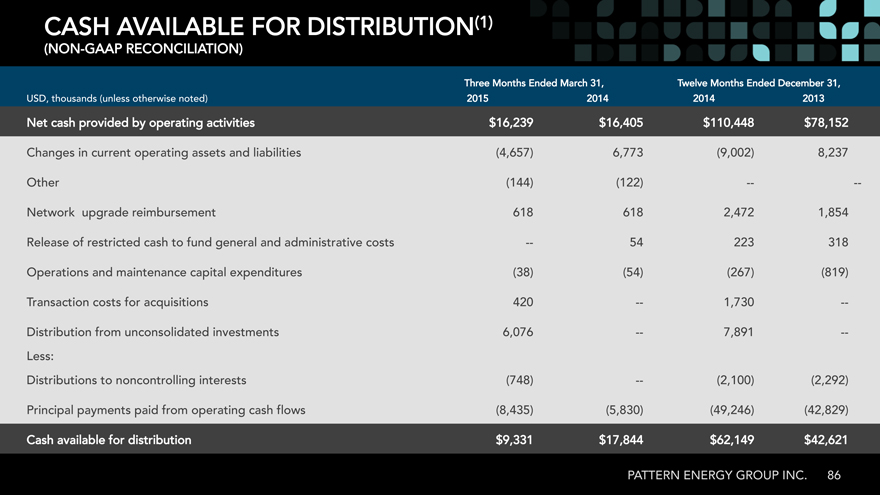
CASH AVAILABLE FOR DISTRIBUTION(1)
(NON-GAAP RECONCILIATION)
Three Months Ended March 31, Twelve Months Ended December 31, USD, thousands otherwise(unless noted) 2014 20132014
Net cash provided by operating activities 78,152$110,448$ Changes in current operating assets and liabilities (4,657) 6,773 8,237(9,002) Other (144) (122) — —Network upgrade reimbursement 618 1,8542,472618 Release of restricted cash to fund general and administrative costs — 31822354 Operations and maintenance capital expenditures (38) (54) (267) (819) Transaction costs for acquisitions 420 — 1,730 —
Distribution from unconsolidated investments 6,076 — 7,891 — Less: Distributions to noncontrolling interests (748) — (2,100) (2,292)
Principal payments paid from operating cash flows (8,435) (5,830) (49,246) (42,829) Cash available for distribution 42,621$62,149$ PATTERN ENERGY GROUP INC 86.
1 SUMMARY NON-GAAP FINANCIAL MEASURES
Adjusted EBITDA represents net income before(loss) net interest expense, income taxes and depreciation and accretion, including our proportionate share of net interest expense, income taxes and depreciation and accretion for joint venture investments that are accounted for under the equity method Adjusted. EBITDA also excludes the effect of certain mark-to-market adjustments and infrequent items not related to normal or ongoing operations, such as early payment of debt and realized derivative gain or loss from refinancing transactions, and gain or loss related to acquisitions or divestituresWe. disclose Adjusted EBITDA, which is a non-U GAAP. measure, because management believes this metric assists investors and analysts in comparing our operating performance across reporting periods on a consistent basis by excluding items that our management believes are not indicative of our core operating performance We. use Adjusted EBITDA to evaluate our operating performanceYou. should not consider Adjusted EBITDA as an alternative to net income determined(loss), in accordance with U . GAAP, or as an alternative to net cash provided by (used in) operating activities, determined in accordance with U . GAAP, as an indicator of our cash flows.
Adjusted EBITDA has limitations as an analytical tool Some. of these limitations are: Adjusted EBITDA:
?does not reflect our cash expenditures or future requirements for capital expenditures or contractual commitments; ?does not reflect changes in, or cash requirements for, our working capital needs;
?does not reflect the significant interest expense, or the cash requirements necessary to service interest or principal payments, on our debt; ?does not reflect our income tax expense or the cash requirement to pay our taxes; and ?does not reflect the effect of certain mark-to-market adjustments and non-recurring items;
?although depreciation and accretion are non-cash charges, the assets being depreciated and accreted will often have to be replaced in the future, and Adjusted EBITDA does not reflect any cash requirements for such replacements; and ?other companies in our industry may calculate Adjusted EBITDA differently than we do, limiting its usefulness as a comparative measure.
Because of these limitations, Adjusted EBITDA should not be considered in isolation or as a substitute for performance measures calculated in accordance with U GAAP. .
Cash available for distribution represents net cash provided by (used in) operating activities as adjusted to add(i) or subtract changes in operating assets and liabilities, subtract(ii) net deposits into restricted cash accounts, which are required pursuant to the cash reserve requirements of financing agreements, to the extent they are paid from operating cash flows during a period, subtract(iii) cash distributions paid to noncontrolling interests, subtract(iv) scheduled project-level debt repayments in accordance with the related loan amortization schedule, to the extent they are paid from operating cash flows during a period, subtract(v) non-expansionary capital expenditures, to the extent they are paid from operating cash flows during a period, and adding(vi) cash distributions received from unconsolidated investments, to the extent such distributions were derived from operating cash flows, and add(vii) or subtract other items as necessary to present the cash flows we deem representative of our core business operations.
We disclose cash available for distribution because management recognizes that it will be used as a supplemental measure by investors and analysts to evaluate our liquidity. However, cash available for distribution has limitations as an analytical tool because it excludes depreciation and accretion, does not capture the level of capital expenditures necessary to maintain the operating performance of our projects, is not reduced for principal payments on our project indebtedness except to the extent it is paid from operating cash flows during a period, and excludes the effect of certain other cash flow items, all of which could have a material effect on our financial condition and results from operations Cash. available for distribution is a non-UGAAP. measure and should not be considered an alternative to net income net(loss), cash provided by (used in) operating activities or any other liquidity measure determined in accordance with U . GAAP, nor is it indicative of funds available to fund our cash needsIn. addition, our calculation of cash available for distribution is not necessarily comparable to cash available for distribution as calculated by other companies Investors. should not rely on this measure as a substitute for any UGAAP. measure, including net income and(loss) net cash provided by (used in) operating activities._
PATTERN ENERGY GROUP INC 87.