Q2 2015 Earnings Call August 7, 2015

Safe Harbor Statements Forward-Looking Statements Statements contained in this presentation that state the Company’s or management’s expectations or predictions of the future are forward-looking statements and are intended to be covered by the safe harbor provisions of the Securities Act of 1933, as amended, and the Securities Exchange Act of 1934, as amended. The words “believe,” “expect,” “should,” “intends,” “estimates,” and other similar expressions identify forward-looking statements. It is important to note that actual results could differ materially from those projected in such forward-looking statements. For more information concerning factors that could cause actual results to differ from those expressed or forecasted, see CST filings with the Securities and Exchange Commission (“SEC”), including the Risk Factors in our most recently filed Annual Reports on Form 10-K and Quarterly Reports on Form 10-Q as filed with the SEC and available on CST Brand’s website at www.cstbrands.com and CrossAmerica’s website at www.crossamericapartners.com. If any of these risks or uncertainties materialize, or if our underlying assumptions prove to be incorrect, actual results may vary significantly from what we projected. Any forward-looking statement you see or hear during this presentation reflects our current views as of the date of this presentation with respect to future events. We assume no obligation to publicly update or revise these forward-looking statements for any reason, whether as a result of new information, future events, or otherwise. Non-GAAP Financial Measures To supplement our consolidated financial statements prepared in accordance with accounting principles generally accepted in the United States (“GAAP”) and to better reflect period-over-period comparisons, we use non-GAAP financial measures that either exclude or include amounts that are not normally excluded or included in the most directly comparable measure, calculated and presented in accordance with GAAP. Non-GAAP financial measures do not replace and are not superior to the presentation of GAAP financial results, but are provided to improve overall understanding of our current financial performance and our prospects for the future. We believe the non-GAAP financial results provide useful information to both management and investors regarding certain additional financial and business trends relating to financial condition and operating results. In addition, management uses these measures, along with GAAP information, for reviewing financial results and evaluating our historical operating performance. The non-GAAP adjustments for all periods presented are based upon information and assumptions available as of the date of this presentation. The non-GAAP information is not prepared in accordance with GAAP and may not be comparable to non-GAAP information used by other companies. Information regarding the non-GAAP financial measure referenced in this presentation, including the reconciliation to the nearest GAAP measure can be found in our financial results press releases, available on our web sites: www.cstbrands.com and www.crossamericapartners.com. 2

Overview & Store Initiatives Kim Lubel President, CEO and Chairman of the Board 3

2Q15 Results Summary (Amounts in millions except Earnings per Share, Distributable Cash Flow per LP Unit and Distribution Coverage) 4 Three Months Ended June 30, % Change Gross Profit $277 $280 (1%) EBITDA $80 $88 (9%) Earnings per Share $0.32 $0.43 (26%) Three Months Ended June 30, % Change Gross Profit $38 $27 41% Adjusted EBITDA $19 $17 12% Distributable Cash Flow per LP Unit $0.5692 $0.7195 (21%) Distribution Coverage 1.04x 1.40x (26%) CST Brands, Inc. 2015 2014 CrossAmerica Partners LP 2015 2014

Growing our Food Program • Implementing synergies from Nice N Easy to ensure great tasting food offerings across all day-parts – Program will be implemented in 5 NTI prototypes in the greater San Antonio area in 4Q15 – Modeled after Nice N Easy’s Made-to-Order and pizza programs (will continue to offer the Grab & Go and bakery program) 5

Food Offerings 6

Expanding Grocery Offerings • Enhances large store product mix • Provides a fill-in alternative to grocery and drug stores • Implementing in 50 stores across the Central Texas, San Antonio and Houston markets in 3Q15 7

CrossAmerica Partners Joe Topper, CEO Jeremy Bergeron, President 8

CrossAmerica Wholesale Segment Three Months Ended June 30, % Change Total Volume of Gallons Distributed (in thousands) 277,126 222,850 24% Margin – Total System1 $0.053 $0.067 (21%) Wholesale Rental Income2 (in thousands) $10,920 $9,990 9% Wholesale Segment Adjusted EBITDA $18,448 $16,304 13% 2015 2014 9 1 Cents per gallon, net of credit card fees 2 A small percentage of this amount is other income • CST Fuel Supply — 5 cents per gallon margin on approximately 1.9 billion gallons — CAPL equity ownership CAPL purchased 5% equity interest on Jan 1, 2015 $1.2 million income contribution in second quarter 2015 Ownership increased to 17.5% on July 1

CrossAmerica Retail Segment 10 Three Months Ended June 30, % Change Total Volume of Gallons Distributed (in thousands) 57,307 32,238 78% Fuel Margin – Total System* $0.095 $0.052 83% Retail Segment Adjusted EBITDA $4,595 $4,652 (1%) Site Count (Average sites - period ending 06/30/2015) 206 119 73% 2015 2014 * Cents per gallon, net of credit card fees

Continuous Growth 11 • One Stop Acquisition – 55 sites in West Virginia • 41 company operated retail sites • 4 commission agents • 9 wholesale dealer sites • 1 stand alone QSR – Rationale • Expand on existing presence in the West Virginia / Virginia market • Leverage existing relationship with Exxon, establish new fuel brand opportunity with Marathon • Significant amount of owned real estate • Positioned for further growth

Financial Overview Clay Killinger EVP and Chief Financial Officer 12

CST Key Metrics Gross Profit (mm) Three Months Ended June 30, % Change Motor Fuel $59 $65 (9%) Merchandise $112 $103 9% Other $15 $14 7% Key Metrics Three Months Ended June 30, % Change Core Stores (EOP) 993 1,044 (5%) Motor Fuel Gallons Sold (PSPD) 5,246 4,987 5% Motor Fuel CPG (net of CC) $0.1256 $0.1383 (9%) Merchandise Sales (PSPD) $3,917 $3,632 8% Merchandise Margin* (net of CC) 30.2% 29.8% 40 bps U.S. Retail (USD) * Merchandise margin excludes other revenue margin 13 2015 2014 2015 2014

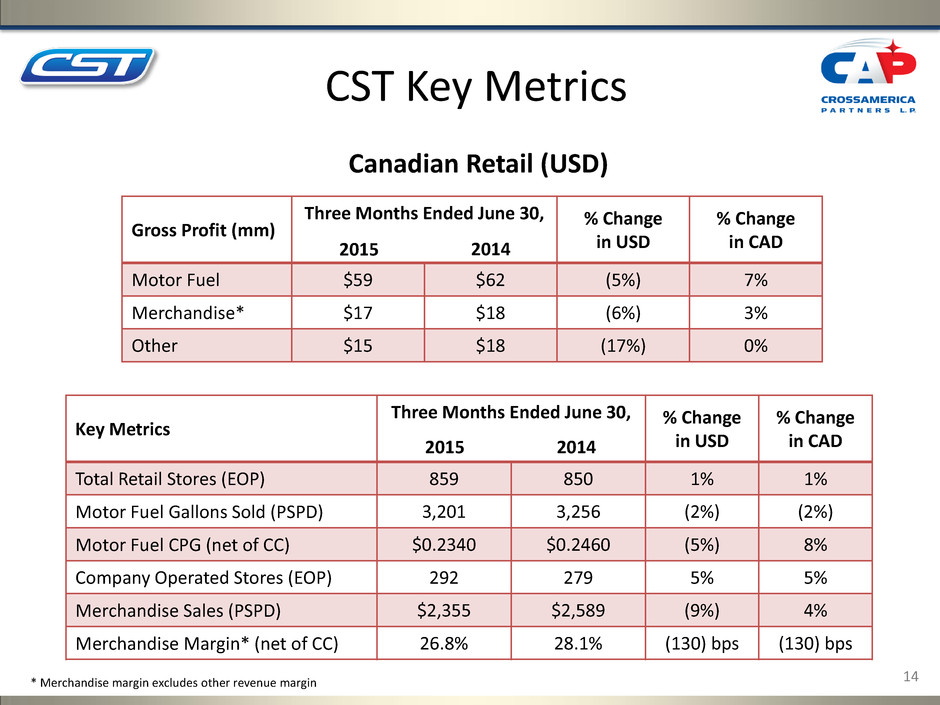
Key Metrics Three Months Ended June 30, % Change in USD % Change in CAD Total Retail Stores (EOP) 859 850 1% 1% Motor Fuel Gallons Sold (PSPD) 3,201 3,256 (2%) (2%) Motor Fuel CPG (net of CC) $0.2340 $0.2460 (5%) 8% Company Operated Stores (EOP) 292 279 5% 5% Merchandise Sales (PSPD) $2,355 $2,589 (9%) 4% Merchandise Margin* (net of CC) 26.8% 28.1% (130) bps (130) bps Gross Profit (mm) Three Months Ended June 30, % Change in USD % Change in CAD Motor Fuel $59 $62 (5%) 7% Merchandise* $17 $18 (6%) 3% Other $15 $18 (17%) 0% Canadian Retail (USD) * Merchandise margin excludes other revenue margin 14 2015 2014 2015 2014 CST Key Metrics

15 Solid Financial Position to Support Growth CST Brands, Inc. June 30, 2015 Cash $343 Debt $1,013 Net Revolver Capacity $276 Note: Amounts in millions

CST Guidance (in USD) Retail Segment Gallons (PSPD) 5,250 to 5,350 4,921 3,250 to 3,350 3,370 Merchandise Sales (PSPD) $4,100 to $4,200 $3,686 $2,350 to $2,450 $2,767 Merchandise Gross Margin (%) 30.0% to 31.0% 30.2% 27.0% to 28.0% 26.6% U.S. Canada Category Ranges (mm) Operating Expenses $179 to $183 General & Administrative Expenses $27 to $31 Depreciation & Amortization $32 to $34 16 3rd Quarter 2015 3Q15 Guidance 3Q14 Actual 3Q15 Guidance 3Q14 Actual

Historical Fuel Margins • Monthly data provided on the Investor Relations website • Enhances transparency of a key gross profit driver for CST • Updates for the first two months of each quarter will be posted approximately two weeks after month-end • Data for the last month of a quarter will post following filing of 10-Q or 10-K 17

CrossAmerica Key Metrics 18 CrossAmerica has guided to a target of 7-9% distribution per unit growth rate for 2015 and a long-term coverage target ≥ 1.1x Three months ended June 30, % Change 1Q15 Adjusted EBITDA $19.1 $17.1 12% $15.6 Distributable Cash Flow, $mm $14.3 $13.5 6% $10.1 Wholesale Gross Profit $21.5 $21.3 1% $21.1 Retail Gross Profit $16.8 $5.7 195% $14.1 Distributable Cash Flow per LP Unit $0.5692 $0.7195 (21%) $0.4106 Distribution Paid per LP Unit $0.5475 $0.5125 7% $0.5425 2014 2015

19 Solid Financial Position to Support Growth CrossAmerica Partners LP Net Revolver Capacity, As of 6/30/15 $140 *Net Revolver Capacity, As of 07/01/15 $99 Coverage Ratio, Qtr. Ended 06/30/15 1.04x Note: Amounts in millions *Adjusted for close of Asset Drops and One Stop Acquisition

Completed Dropdown Transactions Transaction #1 January 2015 5% interest in CST Fuel Supply $50.4 M in CrossAmerica units* $142.0 M in Cash + $119.5 M in CrossAmerica units* $261.5 M in Total Value Transaction #2 July 2015 12.5% interest in CST Fuel Supply Real Property of 29 NTI Stores & 20 *Unit value was based on the 20 day VWAP unit price before the public announcement of the transaction

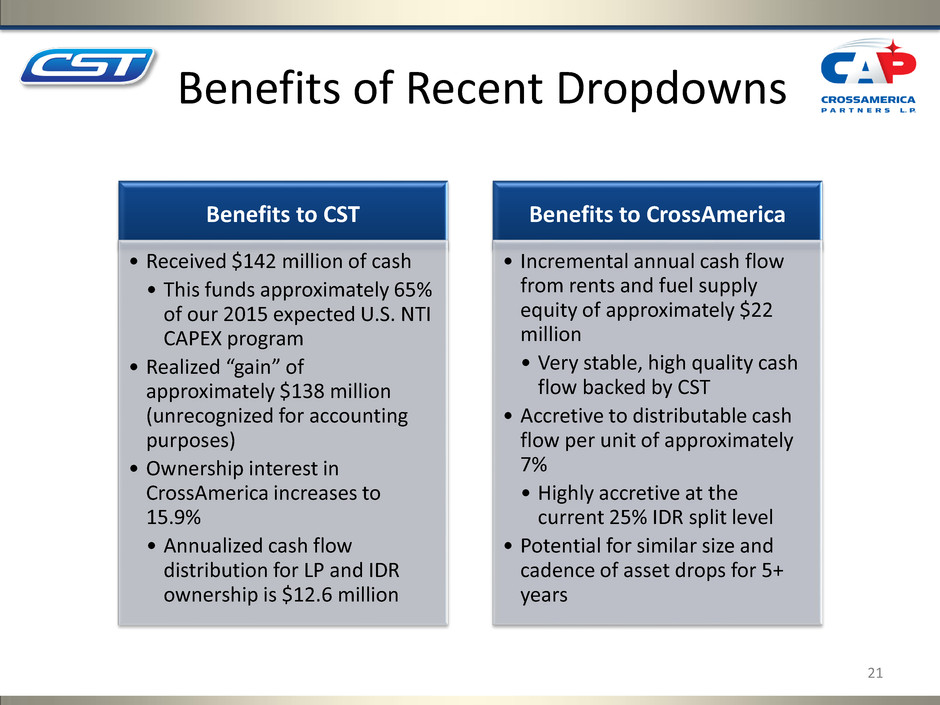
Benefits of Recent Dropdowns 21 Benefits to CST • Received $142 million of cash • This funds approximately 65% of our 2015 expected U.S. NTI CAPEX program • Realized “gain” of approximately $138 million (unrecognized for accounting purposes) • Ownership interest in CrossAmerica increases to 15.9% • Annualized cash flow distribution for LP and IDR ownership is $12.6 million Benefits to CrossAmerica • Incremental annual cash flow from rents and fuel supply equity of approximately $22 million • Very stable, high quality cash flow backed by CST • Accretive to distributable cash flow per unit of approximately 7% • Highly accretive at the current 25% IDR split level • Potential for similar size and cadence of asset drops for 5+ years

Q&A Session