
Year-End & 4Q15 Earnings Call February 19, 2016

Investor Update February 2016 Safe Harbor Statements Forward-Looking Statements Statements contained in this presentation that state the Company’s and Partnership’s or management’s expectations or predictions of the future are forward-looking statements and are intended to be covered by the safe harbor provisions of the Securities Act of 1933, as amended, and the Securities Exchange Act of 1934, as amended. The words “believe,” “expect,” “should,” “intends,” “estimates,” and other similar expressions identify forward-looking statements. It is important to note that actual results could differ materially from those projected in such forward-looking statements. For more information concerning factors that could cause actual results to differ from those expressed or forecasted, see CST and CrossAmerica filings with the Securities and Exchange Commission (“SEC”), including the Risk Factors in our most recently filed Annual Reports on Form 10-K and Quarterly Reports on Form 10-Q as filed with the SEC and available on CST Brand’s website at www.cstbrands.com and CrossAmerica’s website at www.crossamericapartners.com. If any of these risks or uncertainties materialize, or if our underlying assumptions prove to be incorrect, actual results may vary significantly from what we projected. Any forward-looking statement you see or hear during this presentation reflects our current views as of the date of this presentation with respect to future events. We assume no obligation to publicly update or revise these forward-looking statements for any reason, whether as a result of new information, future events, or otherwise. Non-GAAP Financial Measures To supplement our consolidated financial statements prepared in accordance with accounting principles generally accepted in the United States (“GAAP”) and to better reflect period-over-period comparisons, we use non-GAAP financial measures that either exclude or include amounts that are not normally excluded or included in the most directly comparable measure, calculated and presented in accordance with GAAP. Non-GAAP financial measures do not replace and are not superior to the presentation of GAAP financial results, but are provided to improve overall understanding of our current financial performance and our prospects for the future. We believe the non-GAAP financial results provide useful information to both management and investors regarding certain additional financial and business trends relating to financial condition and operating results. In addition, management uses these measures, along with GAAP information, for reviewing financial results and evaluating our historical operating performance. The non-GAAP adjustments for all periods presented are based upon information and assumptions available as of the date of this presentation. The non-GAAP information is not prepared in accordance with GAAP and may not be comparable to non-GAAP information used by other companies. Information regarding the non-GAAP financial measure referenced in this presentation, including the reconciliation to the nearest GAAP measure can be found in our financial results press releases, available on our web sites: www.cstbrands.com and www.crossamericapartners.com. 2
Investor Update February 2016 CST Business Overview Kim Lubel President, CEO and Chairman of the Board 3

Investor Update February 2016 4Q & Full Year Results Summary (Amounts in millions except Earnings per Share) Key Metrics Gross Profit EBITDA Adjusted EBITDA Earnings per Share CST Brands, Inc. *Adjusted for one-time items Three Months Ended Dec. 31, % Change $300 $372 (19%) $101 $195 (48%) $101 $195 (48%) $0.55* $1.02* (46%) 2015 2014 Year Ended Dec. 31, % Change $1,224 $1,237 (1%) $422 $479 (12%) $602 $479 26% $2.19* $2.50* (12%) 2015 2014 4 (1) See the CST Brands, Inc. earnings release for (i) a reconciliation of EBITDA, EBITDAR and Adjusted EBITDA to net income and (ii) the definitions of EBITDA, EBITDAR and Adjusted EBITDA.

Investor Update February 2016 Financial Overview Clay Killinger EVP and Chief Financial Officer 5

Investor Update February 2016 CST Key Metrics Gross Profit (mm) Three Months Ended Dec. 31, % Change Motor Fuel $88 $158 (44%) Merchandise & Services* $123 $116 6% Key Metrics Three Months Ended Dec. 31, % Change Core Stores (EOP) 1,049 989 6% Motor Fuel Gallons Sold (PSPD) 4,966 4,902 1% Motor Fuel CPG (net of CC) $0.194 $0.320 (39%) Merchandise & Services Sales* (PSPD) $3,929 $3,630 8% Merchandise & Services Margin* (net of CC) 32.9% 33.1% (20 bps) U.S. Retail (USD) *Includes other revenue/gross profit 2015 2014 2015 2014 6

Investor Update February 2016 Key Metrics Three Months Ended Dec. 31, % Change in USD % Change in CAD Total Retail Stores (EOP) 869 861 1% 1% Motor Fuel Gallons Sold (PSPD) 3,100 3,185 (3%) (3%) Motor Fuel CPG (net of CC) $0.224 $0.243 (8%) 8% Company Operated Stores (EOP) 303 293 3% 3% Merchandise & Services Sales* (PSPD) $2,275 $2,512 (9%) 6% Merchandise & Services Margin* (net of CC) 29.9% 29.8% 10 bps 10 bps Gross Profit (mm) Three Months Ended Dec. 31, % Change in USD % Change in CAD Motor Fuel $55 $61 (10%) 6% Merchandise & Services* $19 $20 (5%) 12% Other (Home Heat & Rent) $15 $17 (12%) 4% Canadian Retail (USD) 2015 2014 2015 2014 CST Key Metrics 7 *Includes other revenue/gross profit
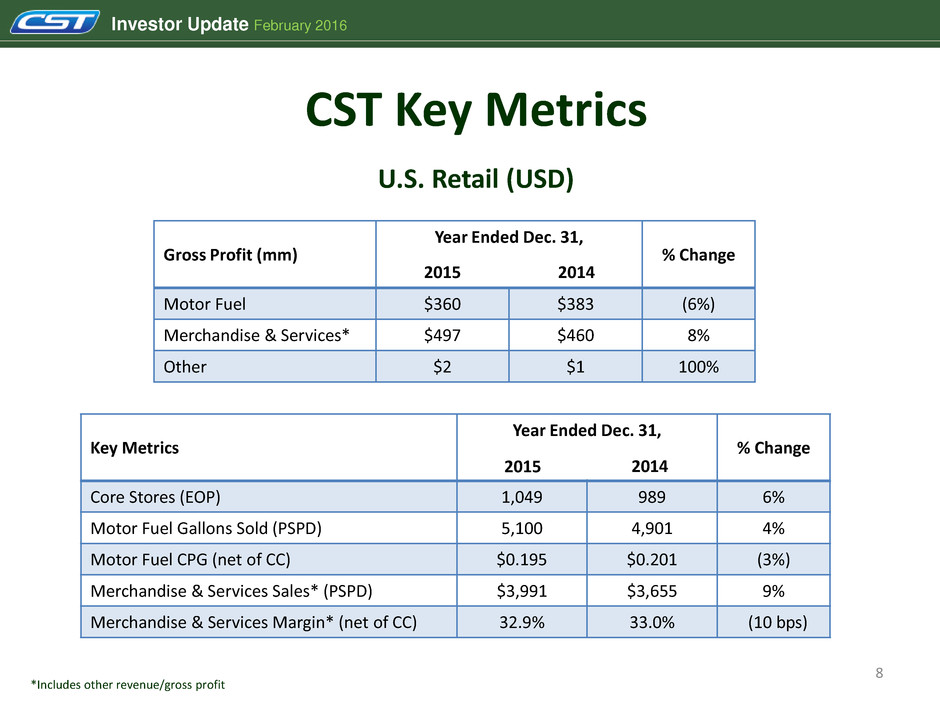
Investor Update February 2016 CST Key Metrics Gross Profit (mm) Year Ended Dec. 31, % Change Motor Fuel $360 $383 (6%) Merchandise & Services* $497 $460 8% Other $2 $1 100% Key Metrics Year Ended Dec. 31, % Change Core Stores (EOP) 1,049 989 6% Motor Fuel Gallons Sold (PSPD) 5,100 4,901 4% Motor Fuel CPG (net of CC) $0.195 $0.201 (3%) Merchandise & Services Sales* (PSPD) $3,991 $3,655 9% Merchandise & Services Margin* (net of CC) 32.9% 33.0% (10 bps) U.S. Retail (USD) 2015 2014 2015 2014 8 *Includes other revenue/gross profit

Investor Update February 2016 Key Metrics Year Ended Dec. 31, % Change in USD % Change in CAD Total Retail Stores (EOP) 869 861 1% 1% Motor Fuel Gallons Sold (PSPD) 3,166 3,230 (2%) (2%) Motor Fuel CPG (net of CC) $0.227 $0.240 (5%) 9% Company Operated Stores (EOP) 303 293 3% 3% Merchandise & Services Sales* (PSPD) $2,406 $2,659 (10%) 5% Merchandise & Services Margin* (net of CC) 30.9% 31.0% (10 bps) (10 bps) Gross Profit (mm) Year Ended Dec. 31, % Change in USD % Change in CAD Motor Fuel $225 $241 (7%) 8% Merchandise & Services* $80 $84 (5%) 10% Other (Home Heat & Rent) $60 $68 (12%) 2% Canadian Retail (USD) 2015 2014 2015 2014 CST Key Metrics 9 *Includes other revenue/gross profit

Investor Update February 2016 Solid Financial Position to Support Growth CST Brands, Inc. Dec. 31, 2015 (in millions) Cash $313 Total Debt $1,016 Note: Amounts in millions 10 Net Revolver Capacity as of February 18th, 2016: $144 million
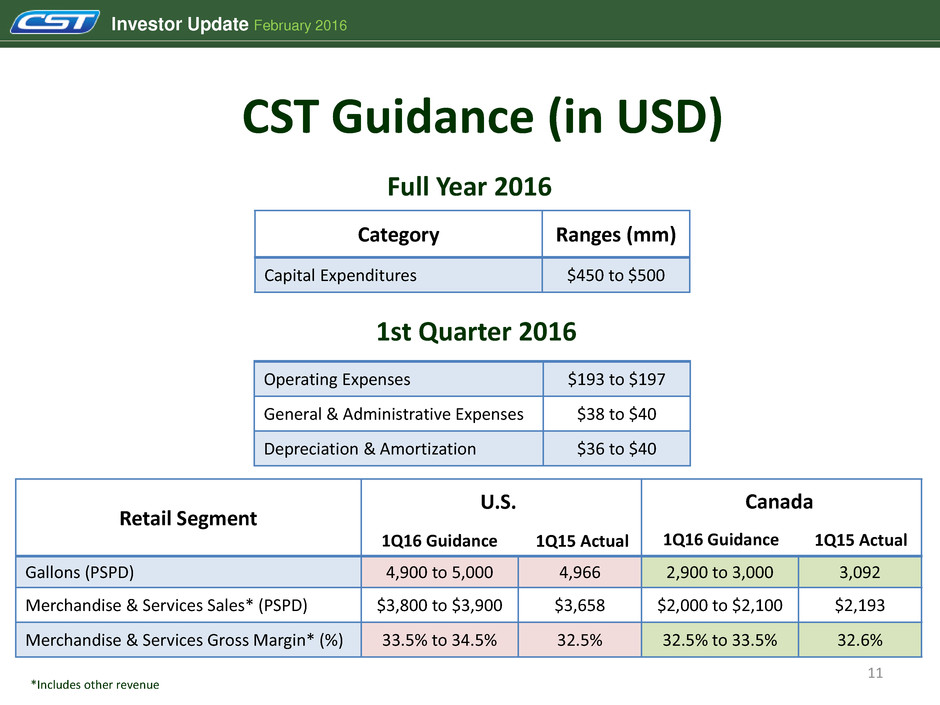
Investor Update February 2016 CST Guidance (in USD) Retail Segment Gallons (PSPD) 4,900 to 5,000 4,966 2,900 to 3,000 3,092 Merchandise & Services Sales* (PSPD) $3,800 to $3,900 $3,658 $2,000 to $2,100 $2,193 Merchandise & Services Gross Margin* (%) 33.5% to 34.5% 32.5% 32.5% to 33.5% 32.6% U.S. Canada Category Ranges (mm) Capital Expenditures $450 to $500 1Q16 Guidance 1Q15 Actual 1Q16 Guidance 1Q15 Actual 11 *Includes other revenue Category Ranges (mm) Operating Expenses $193 to $197 General & Administrative Expenses $38 to $40 Depreciation & Amortization $36 to $40 1st Quarter 2016 Full Year 2016
Investor Update February 2016 Initial Performance of Made to Order Food Program Hal Adams President Retail Operations 12
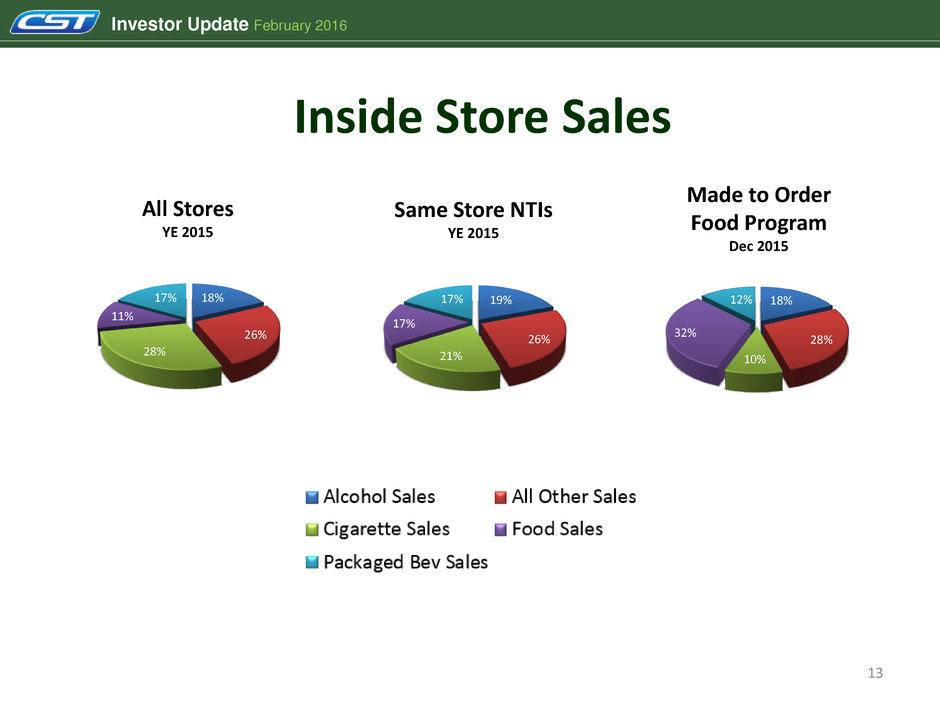
Investor Update February 2016 13 Inside Store Sales All Stores YE 2015 Same Store NTIs YE 2015 Made to Order Food Program Dec 2015 18% 26% 28% 11% 17% 19% 26% 21% 17% 17% 18% 28% 10% 32% 12%
4Q 2015 Earnings Call Jeremy Bergeron, President
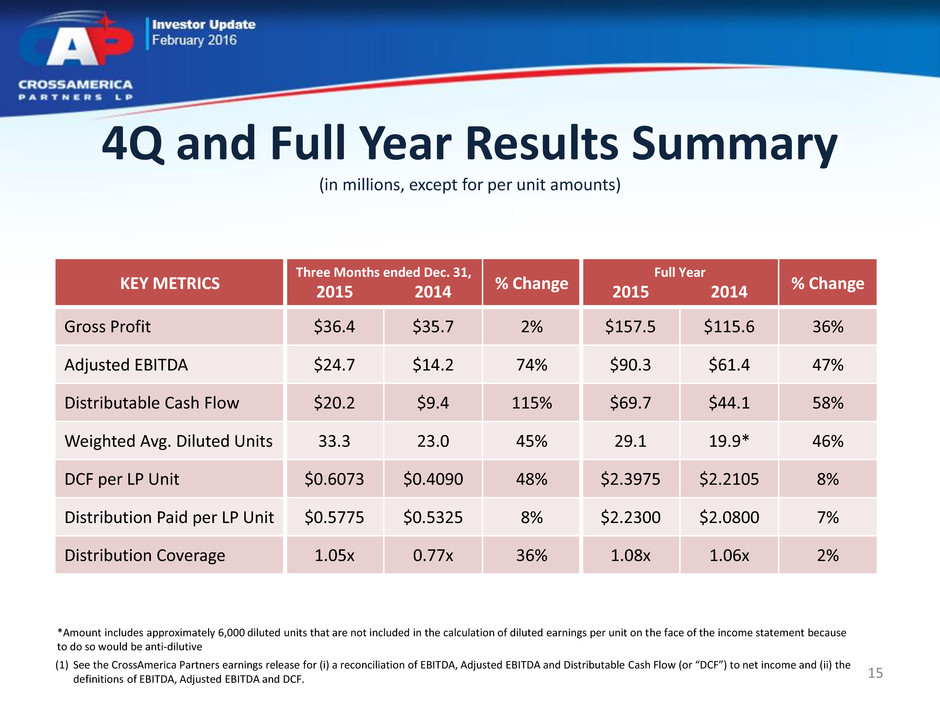
Investor Update February 2016 4Q and Full Year Results Summary (in millions, except for per unit amounts) KEY METRICS Three Months ended Dec. 31, 2015 2014 % Change Full Year 2015 2014 % Change Gross Profit $36.4 $35.7 2% $157.5 $115.6 36% Adjusted EBITDA $24.7 $14.2 74% $90.3 $61.4 47% Distributable Cash Flow $20.2 $9.4 115% $69.7 $44.1 58% Weighted Avg. Diluted Units 33.3 23.0 45% 29.1 19.9* 46% DCF per LP Unit $0.6073 $0.4090 48% $2.3975 $2.2105 8% Distribution Paid per LP Unit $0.5775 $0.5325 8% $2.2300 $2.0800 7% Distribution Coverage 1.05x 0.77x 36% 1.08x 1.06x 2% 15 *Amount includes approximately 6,000 diluted units that are not included in the calculation of diluted earnings per unit on the face of the income statement because to do so would be anti-dilutive (1) See the CrossAmerica Partners earnings release for (i) a reconciliation of EBITDA, Adjusted EBITDA and Distributable Cash Flow (or “DCF”) to net income and (ii) the definitions of EBITDA, Adjusted EBITDA and DCF.

Investor Update February 2016 4Q and Full Year Segment Results (in thousands, except for number of sites and per gallon amounts) WHOLESALE SEGMENT Three Months ended Dec. 31, 2015 2014 % Change Full Year 2015 2014 % Change Total Volume of Gallons Distributed 256,330 241,004 6% 1,051,357 887,677 18% Fuel Margin per Gallon $0.053 $0.071 (25%) $0.056 $0.068 (18%) Rental & Other Gross Profit $10,282 $7,160 44% $34,935 $25,471 37% Total Motor Fuel Sites (period avg.) 1,079 1,016 6% 1,072 923 16% Segment Adjusted EBITDA $26,803 $18,180 47% $92,826 $73,451 26% RETAIL SEGMENT Three Months ended Dec. 31, 2015 2014 % Change Full Year 2015 2014 % Change Total Volume of Gallons Distributed 45,988 42,408 8% 211,015 136,733 54% Fuel Margin per Gallon $0.065 $0.085 (24%) $0.100 $0.059 69% Site Count (period avg.) 185 160 16% 202 119 70% Segment Adjusted EBITDA $3,734 $4,660 (20%) $20,366 $8,729 133% 16 (1) See the CrossAmerica Partners earnings release for (i) a reconciliation of EBITDA, Adjusted EBITDA and Distributable Cash Flow (or “DCF”) to net income and (ii) the definitions of EBITDA, Adjusted EBITDA and DCF.

Investor Update February 2016 4Q14 vs 4Q15 Adjusted EBITDA Performance (in thousands) $24,708 $14,186 $14,226 ($1,768) $197 ($2,133) Acquisitions(1) Impact of Supplier Terms Discounts Q4 2014 Adjusted EBITDA Q4 2015 Adjusted EBITDA Net, Misc.(2) Net Opex/G&A Changes, Excluding Acquisitions (1) Acquisitions include third party acquisitions and CST asset drops conducted since Q2 2014 (2) Net, Misc. includes increased IDR distributions, DTW pricing and other miscellaneous items 17 (3) See the CrossAmerica Partners earnings release for (i) a reconciliation of EBITDA, Adjusted EBITDA and Distributable Cash Flow (or “DCF”) to net income and (ii) the definitions of EBITDA, Adjusted EBITDA and DCF.

Investor Update February 2016 3Q15 vs 4Q15 Adjusted EBITDA Performance (in thousands) $24,708 $30,963 ($2,763) ($428) ($843) ($2,221) Acquisitions(1) Impact of Supplier Terms Discounts Q3 2015 Adjusted EBITDA Q4 2015 Adjusted EBITDA Net, Misc.(2) Net Opex/G&A Changes, Excluding Acquisitions (1) Acquisitions include third party acquisitions and CST asset drops conducted since Q2 2014 (2) Net, Misc. includes increased IDR distributions, DTW pricing, seasonality in the base business and other miscellaneous items No new acquisitions between periods, decline is reflective of seasonality 18 (3) See the CrossAmerica Partners earnings release for (i) a reconciliation of EBITDA, Adjusted EBITDA and Distributable Cash Flow (or “DCF”) to net income and (ii) the definitions of EBITDA, Adjusted EBITDA and DCF.

Investor Update February 2016 2014 vs 2015 Adjusted EBITDA Performance (in thousands) $90,314 $61,424 $38,091 ($8,961) $155 ($395) Acquisitions(1) Impact of Supplier Terms Discounts 2014 Adjusted EBITDA 2015 Adjusted EBITDA Net, Misc.(2) Net Opex/G&A Changes, Excluding Acquisitions (1) Acquisitions include third party acquisitions and CST asset drops conducted since Q2 2014 (2) Net, Misc. includes increased IDR distributions, DTW pricing and other miscellaneous items 19 (3) See the CrossAmerica Partners earnings release for (i) a reconciliation of EBITDA, Adjusted EBITDA and Distributable Cash Flow (or “DCF”) to net income and (ii) the definitions of EBITDA, Adjusted EBITDA and DCF.
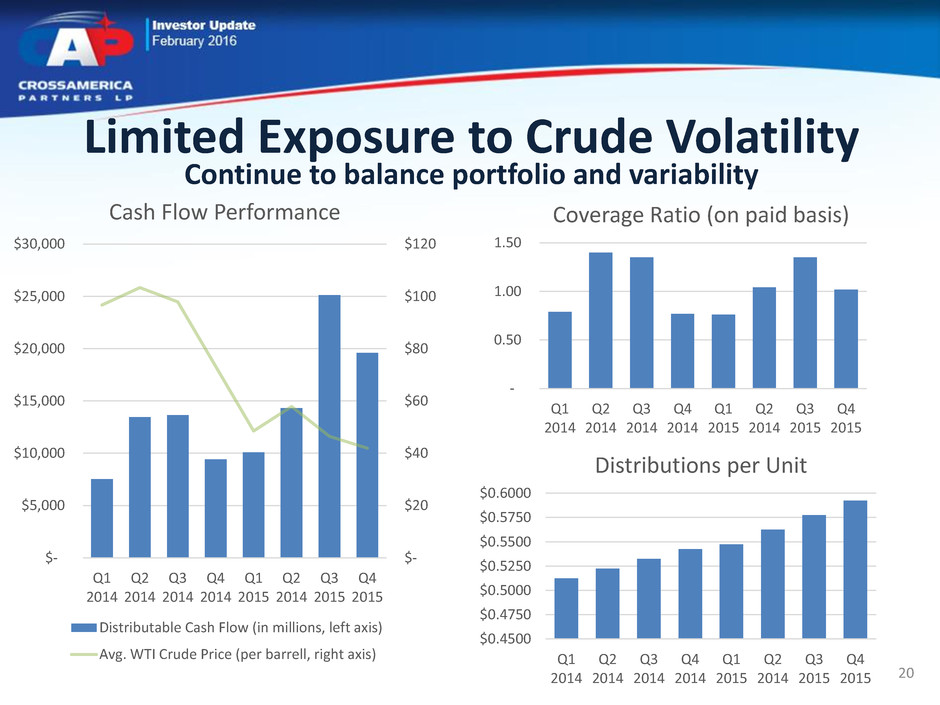
Investor Update February 2016 Limited Exposure to Crude Volatility Continue to balance portfolio and variability $- $20 $40 $60 $80 $100 $120 $- $5,000 $10,000 $15,000 $20,000 $25,000 $30,000 Q1 2014 Q2 2014 Q3 2014 Q4 2014 Q1 2015 Q2 2014 Q3 2015 Q4 2015 Cash Flow Performance Distributable Cash Flow (in millions, left axis) Avg. WTI Crude Price (per barrell, right axis) - 0.50 1.00 1.50 Q1 2014 Q2 2014 Q3 2014 Q4 2014 Q1 2015 Q2 2014 Q3 2015 Q4 2015 Coverage Ratio (on paid basis) $0.4500 $0.4750 $0.5000 $0.5250 $0.5500 $0.5750 $0.6000 Q1 2014 Q2 2014 Q3 2014 Q4 2014 Q1 2015 Q2 2014 Q3 2015 Q4 2015 Distributions per Unit 20

Investor Update February 2016 Continuing Accretive Growth • Over 85% owned locations • Located in proximity with FreedomValu stores • Large stores with good inside sales • Holiday franchise brings strong brand recognition 31 Company Operated $48.5 Million Purchase 26 Million Gallons Upper Midwest (MN, WI) Holiday Est. 1Q16 close date Asset Purchase Rationale 58 CrossAmerica company operated – FreedomValu or SuperAmerica 6 CrossAmerica dealer operated – FreedomValu 31 CrossAmerica company operated – Holiday (PENDING) (From SSG Corporation) 21

Investor Update February 2016 Executing with Measured Growth • Declared fourth quarter distribution of $0.5925 per unit – 1.5 cent per unit increase over third quarter • Grew distributions per unit 8.1% in 2015 over 2014 • Completes our commitment made in 1Q15 to increase distributions 7%-9% for the year – Expect to increase per unit distribution by 5%-7% for 2016 over 2015 • 2016 Distributable Cash Flow growth to come from three areas – Selective, accretive third party acquisitions – Accretive drop downs of CST Fuel Supply – Continued strong business performance, in addition to synergy recognition and expense reduction on recently completed transactions • Expect to achieve our long-term goal to maintain a 12-month coverage ratio of at least 1.1x • Expect to achieve these results without issuing any new equity in 2016 and remaining within our leverage coverage ratio covenants 22

Q&A Session
Appendix

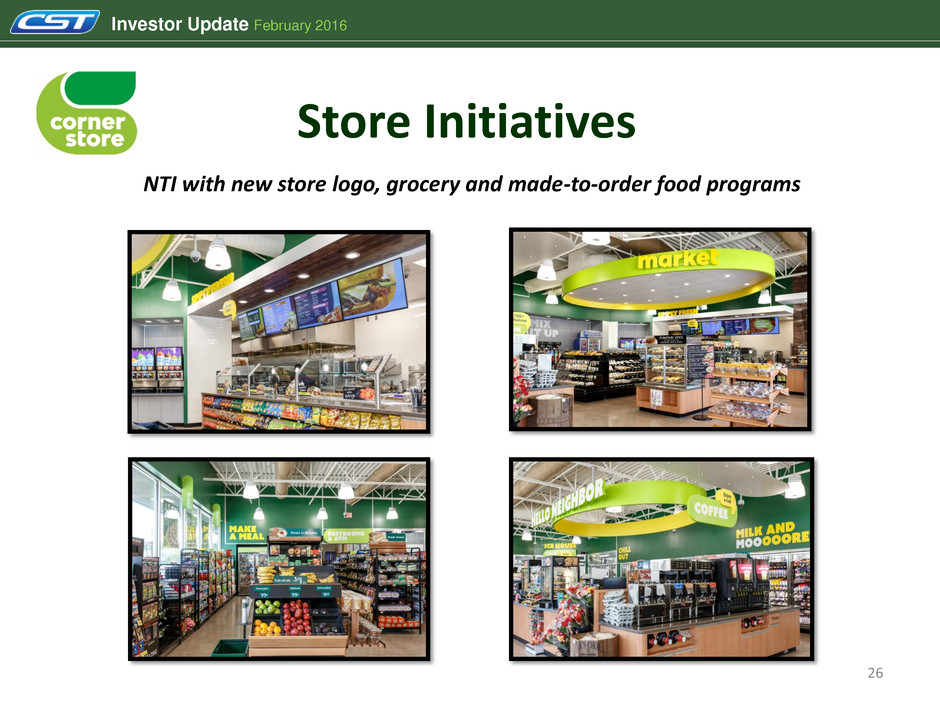
Investor Update February 2016 Store Initiatives NTI (New to Industry) with new store logo, grocery and made-to-order food programs 25
Investor Update February 2016 Store Initiatives NTI with new store logo, grocery and made-to-order food programs 26
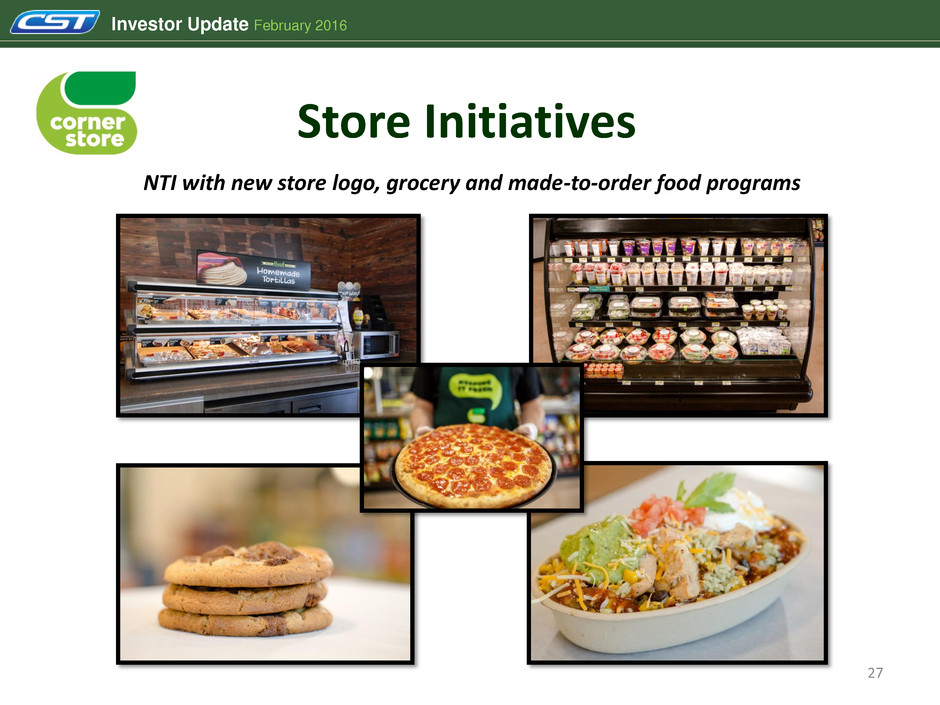
Investor Update February 2016 Store Initiatives 27 NTI with new store logo, grocery and made-to-order food programs

Investor Update February 2016 Rebranding Initiative Before After The rebranding of 11 stores in the South San Antonio market have been completed 28
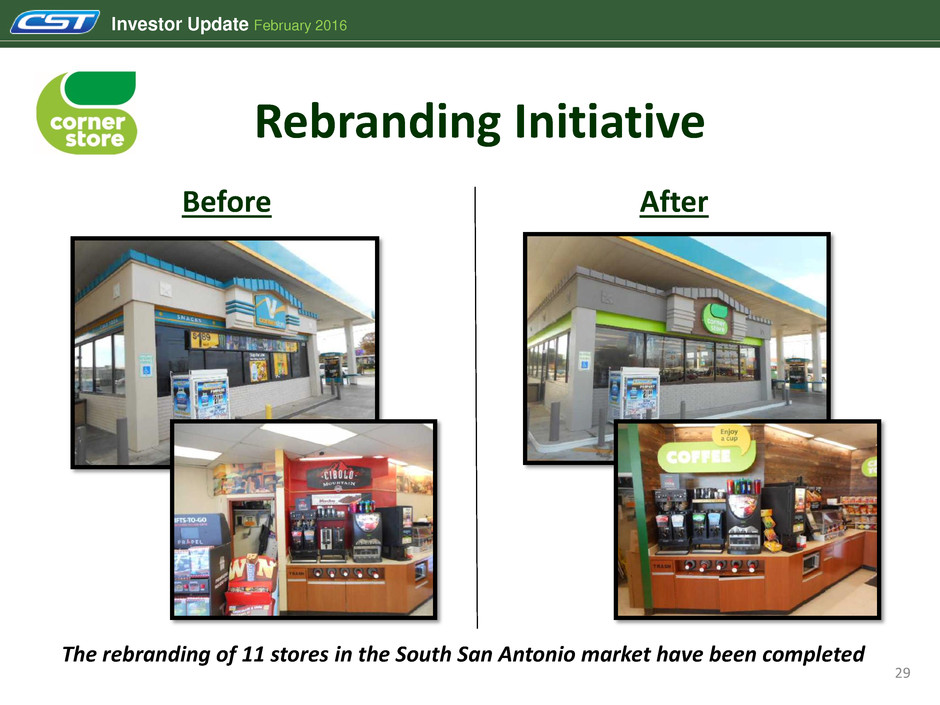
Investor Update February 2016 Rebranding Initiative After The rebranding of 11 stores in the South San Antonio market have been completed 29 Before

Investor Update February 2016 U.S. NTI Same Store Performance 2015 vs. 2014 (Dollars in Millions, Except Per Store Data) 30 Year Ended December 31, YOY Change 2015 2014 $ % Fuel Gross Profit 30.2$ 32.8$ (2.6)$ -8% Merchandise and Services Gross Profit 46.0 45.2 0.8 2% Store Level Cash Operating Expense (Including rent) (37.8) (35.5) (2.3) 6% EBITDA 38.5$ 42.5$ (4.0)$ -9% Rent Expense 1.6 0.6 1.0 160% EBITDAR 40.1$ 43.1$ (3.0)$ -7% NTI same store information Company-operated retail sites 50 50 Motor fuel sales (gallons per site per day) 8,998 9,326 (328) -4% Merchandise and services sales (per site per day) 7,334$ 7,047$ 287$ 4% Merchandise and service gross profit percentage, net of credit card fees 34.4% 35.2% 80 bps Merchandise and service gross profit dollars 46$ 45$ 1$ 2% Cash Flow R turn on Capital Employed EBITDAR 40.1$ 43.1$ Historical CAPEX - before asset drops (sale/leasback) 239.0$ 239.0$ Unlevered Cash Flow Return on Capital Employed 17% 18% EBITDA 38.5$ 42.5$ Adjusted CAPEX - after asset drops (sale/leasback) 212.2$ 239.0$ Levered Cash Flow Return on Capital Employed 18% 18%

Investor Update February 2016 CST Brands Operating Expenses 31 Item Increase Nice N Easy and Landmark Industries stores $4.1 million NTI stores $3.7 million 4Q 2014 vs. 4Q 2015 $172 million vs. $178 million Item Increase NTI Stores $3.6 million Flash Foods acquisition $14.4 million 4Q 2015 vs. 1Q 2016 Guidance $178 million vs. $193-$197 million Primary Drivers

Investor Update February 2016 • Total purchase price: $425 million • Estimated net effect of 1031 Like-Kind Exchange: $20-$25 million • $1.8 million of recurring synergies already realized on year 1 expected synergies of $10.2 million. Expect run rate to reach $11.7 million in year 3 • Expect the transaction to be accretive and an approximate 7-9x post- synergy multiple • Expected annual post-synergy EBITDA: $45-$55 million Flash Foods Case Study 32