shareholder
letter
Q4 / FY 2024
our mission is
to develop the
best education
in the world
and make it universally available.
 | |||||
DUOLINGO Q4 / FY 2024 2
Q4 and FY24 Highlights
| User Metrics | Q4 2023 | Q4 2024 | |||||||||
| Daily Active Users | 26.9M | 40.5M | |||||||||
| 51% YoY | |||||||||||
| Monthly Active Users | 88.4M | 116.7M | |||||||||
| 32% YoY | |||||||||||
| Paid Subscribers | 6.6M | 9.5M | |||||||||
| at period end | 43% YoY | ||||||||||
| Paid Subscriber Penetration | 8.3% | 8.8% | |||||||||
| as % of LTM MAU | |||||||||||
| Financial Metrics | Q4 2024 | FY 2024 | |||||||||
| Revenue | $209.6M | $748.0M | |||||||||
| 39% YoY | 41% YoY | ||||||||||
| Total Bookings | $271.6M | $870.6M | |||||||||
| 42% YoY | 40% YoY | ||||||||||
| Net Income | $13.9M | $88.6M | |||||||||
| Adjusted EBITDA | $52.3M | $191.9M | |||||||||
| 25.0% margin | 25.7% margin | ||||||||||
DUOLINGO Q4 / FY 2024 3
Dear shareholders,
We closed out 2024 with a record-breaking quarter. We surpassed 40 million DAUs; added our largest-ever number of net paid subscribers; achieved our highest-ever quarterly bookings, revenue and Adjusted EBITDA; and delivered 42% free cash flow margin. Duolingo Max, our highest subscription tier, helped drive this growth by exceeding our expectations. Our New Year’s Promotion was also strong during the last four days of December.
Fourth quarter highlights
•Total bookings were $271.6 million, an increase of 42% from the prior year quarter;
•Subscription bookings were $236.5 million, an increase of 50% from the prior year quarter;
•Paid subscribers totaled 9.5 million at quarter end, an increase of 43% from the prior year quarter;
•Daily active users (DAUs) were 40.5 million, an increase of 51% from the prior year quarter, and monthly active users (MAUs) were 116.7 million, an increase of 32% from the prior year quarter;
•Total revenues were $209.6 million, an increase of 39% from the prior year quarter;
•Net income was $13.9 million, compared to $12.1 million in the prior year quarter;
•Adjusted EBITDA was $52.3 million, compared to $35.2 million in the prior year quarter, a 25.0% versus 23.3% Adjusted EBITDA margin, respectively; and
•Net cash provided by operating activities was $83.3 million, compared to $49.2 million in the prior year quarter, and free cash flow was $87.8 million, compared to $47.7 million in the prior year quarter.
2024 highlights and 2025 priorities
Our growth starts with users. We create engaging experiences that teach our users and keep them coming back every day. This engagement translates into bookings as users pay for subscriptions. With scale and disciplined investment, we have turned our top-line momentum into sustained profitability. This reinforcing cycle—users, bookings, and profitability—has fueled our ability to reinvest and expand our mission to more people.
User growth
Powered by product improvements and creative marketing, our user growth has been remarkable over the past since 2021.
DUOLINGO Q4 / FY 2024 4
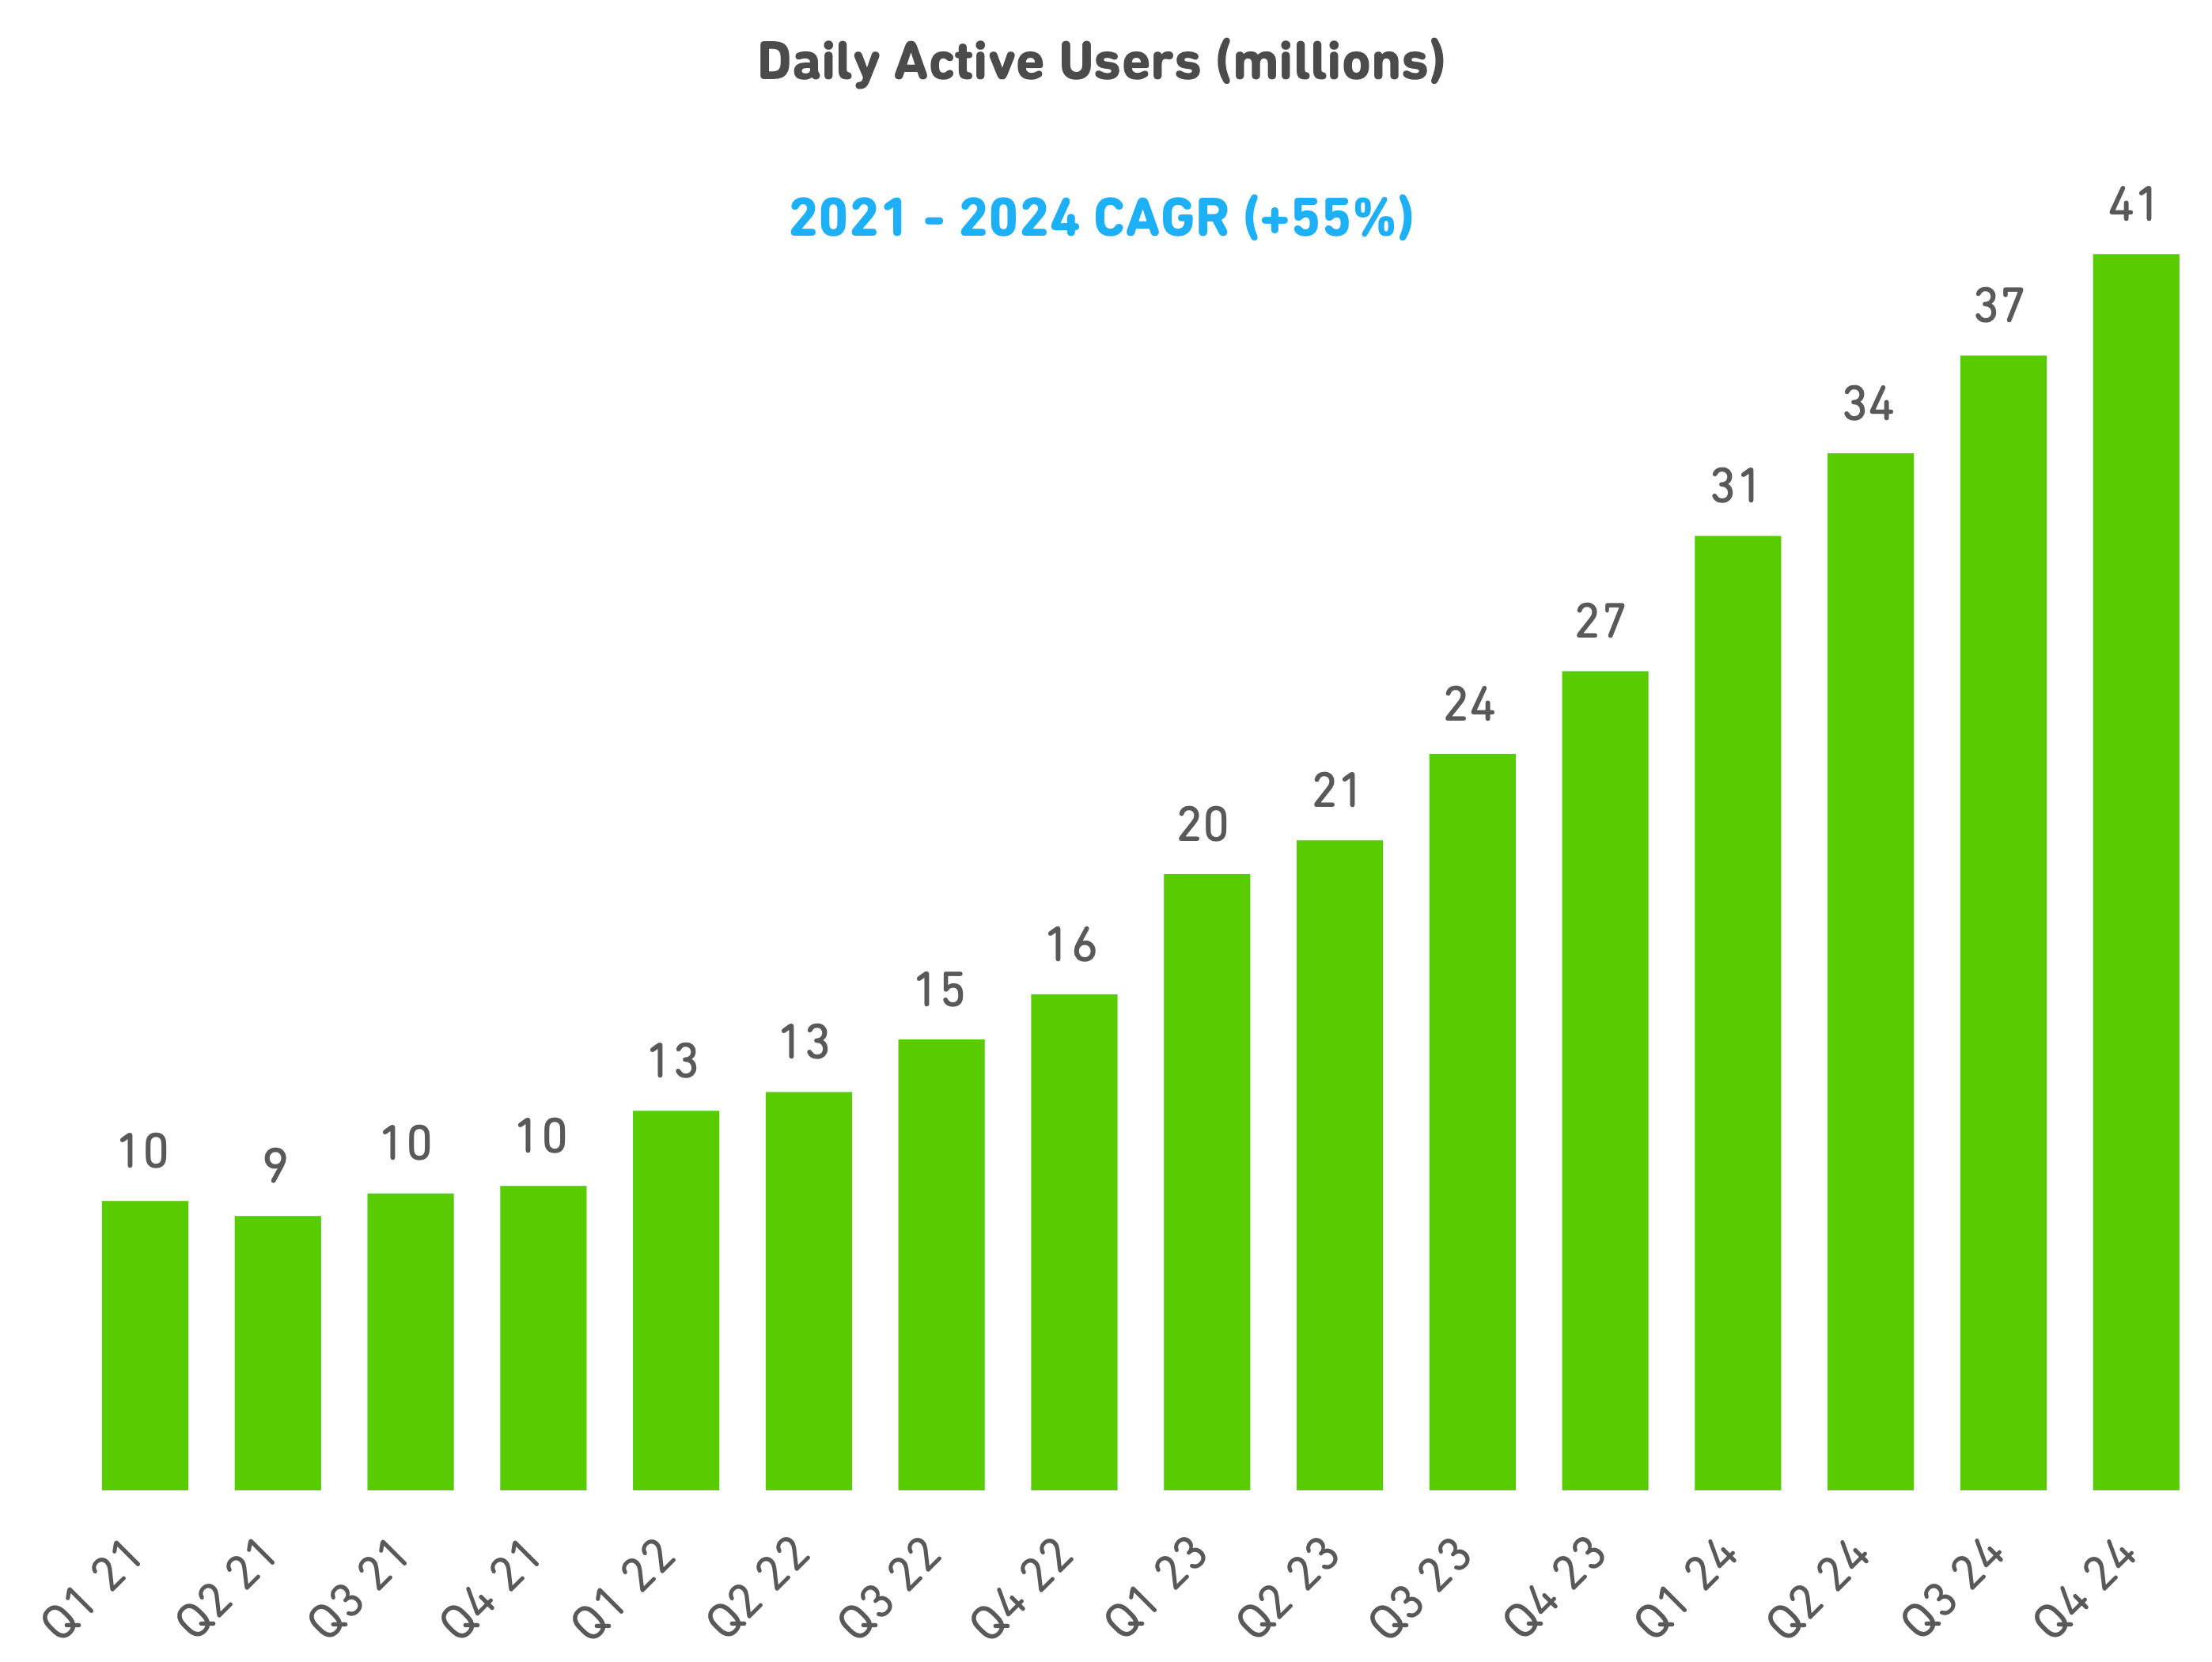
In 2024, we introduced many new product features, which boosted engagement and user retention. One measure of engagement is our DAU/MAU ratio, which rose more than 4 points year over year to 34.7% in Q4. Over 10 million of our users now maintain streaks of one year or longer, and one-third of our DAUs have a Friend Streak. We believe that our unhinged and viral marketing campaigns—like our 5-second Super Bowl ad, Duolingo on Ice, and “Owl Game” partnership with Netflix—contributed to our user growth and the growth of our iconic brand. Because of this work, AdAge named Duolingo “Marketer of the Year.” We’ve also successfully diversified our marketing channels. In 2024, our views on YouTube Shorts and Instagram Reels grew over 430% and 450% year over year, respectively.
In 2025, we’ll continue improving our product through A/B testing, increasing experiment velocity to make the experience more social and gamified. We’ll also expand our reach by launching new courses, such as Chinese for Korean speakers and German for Japanese speakers. We also plan to provide English learners with a more engaging experience by improving existing features like Video Call.
DUOLINGO Q4 / FY 2024 5
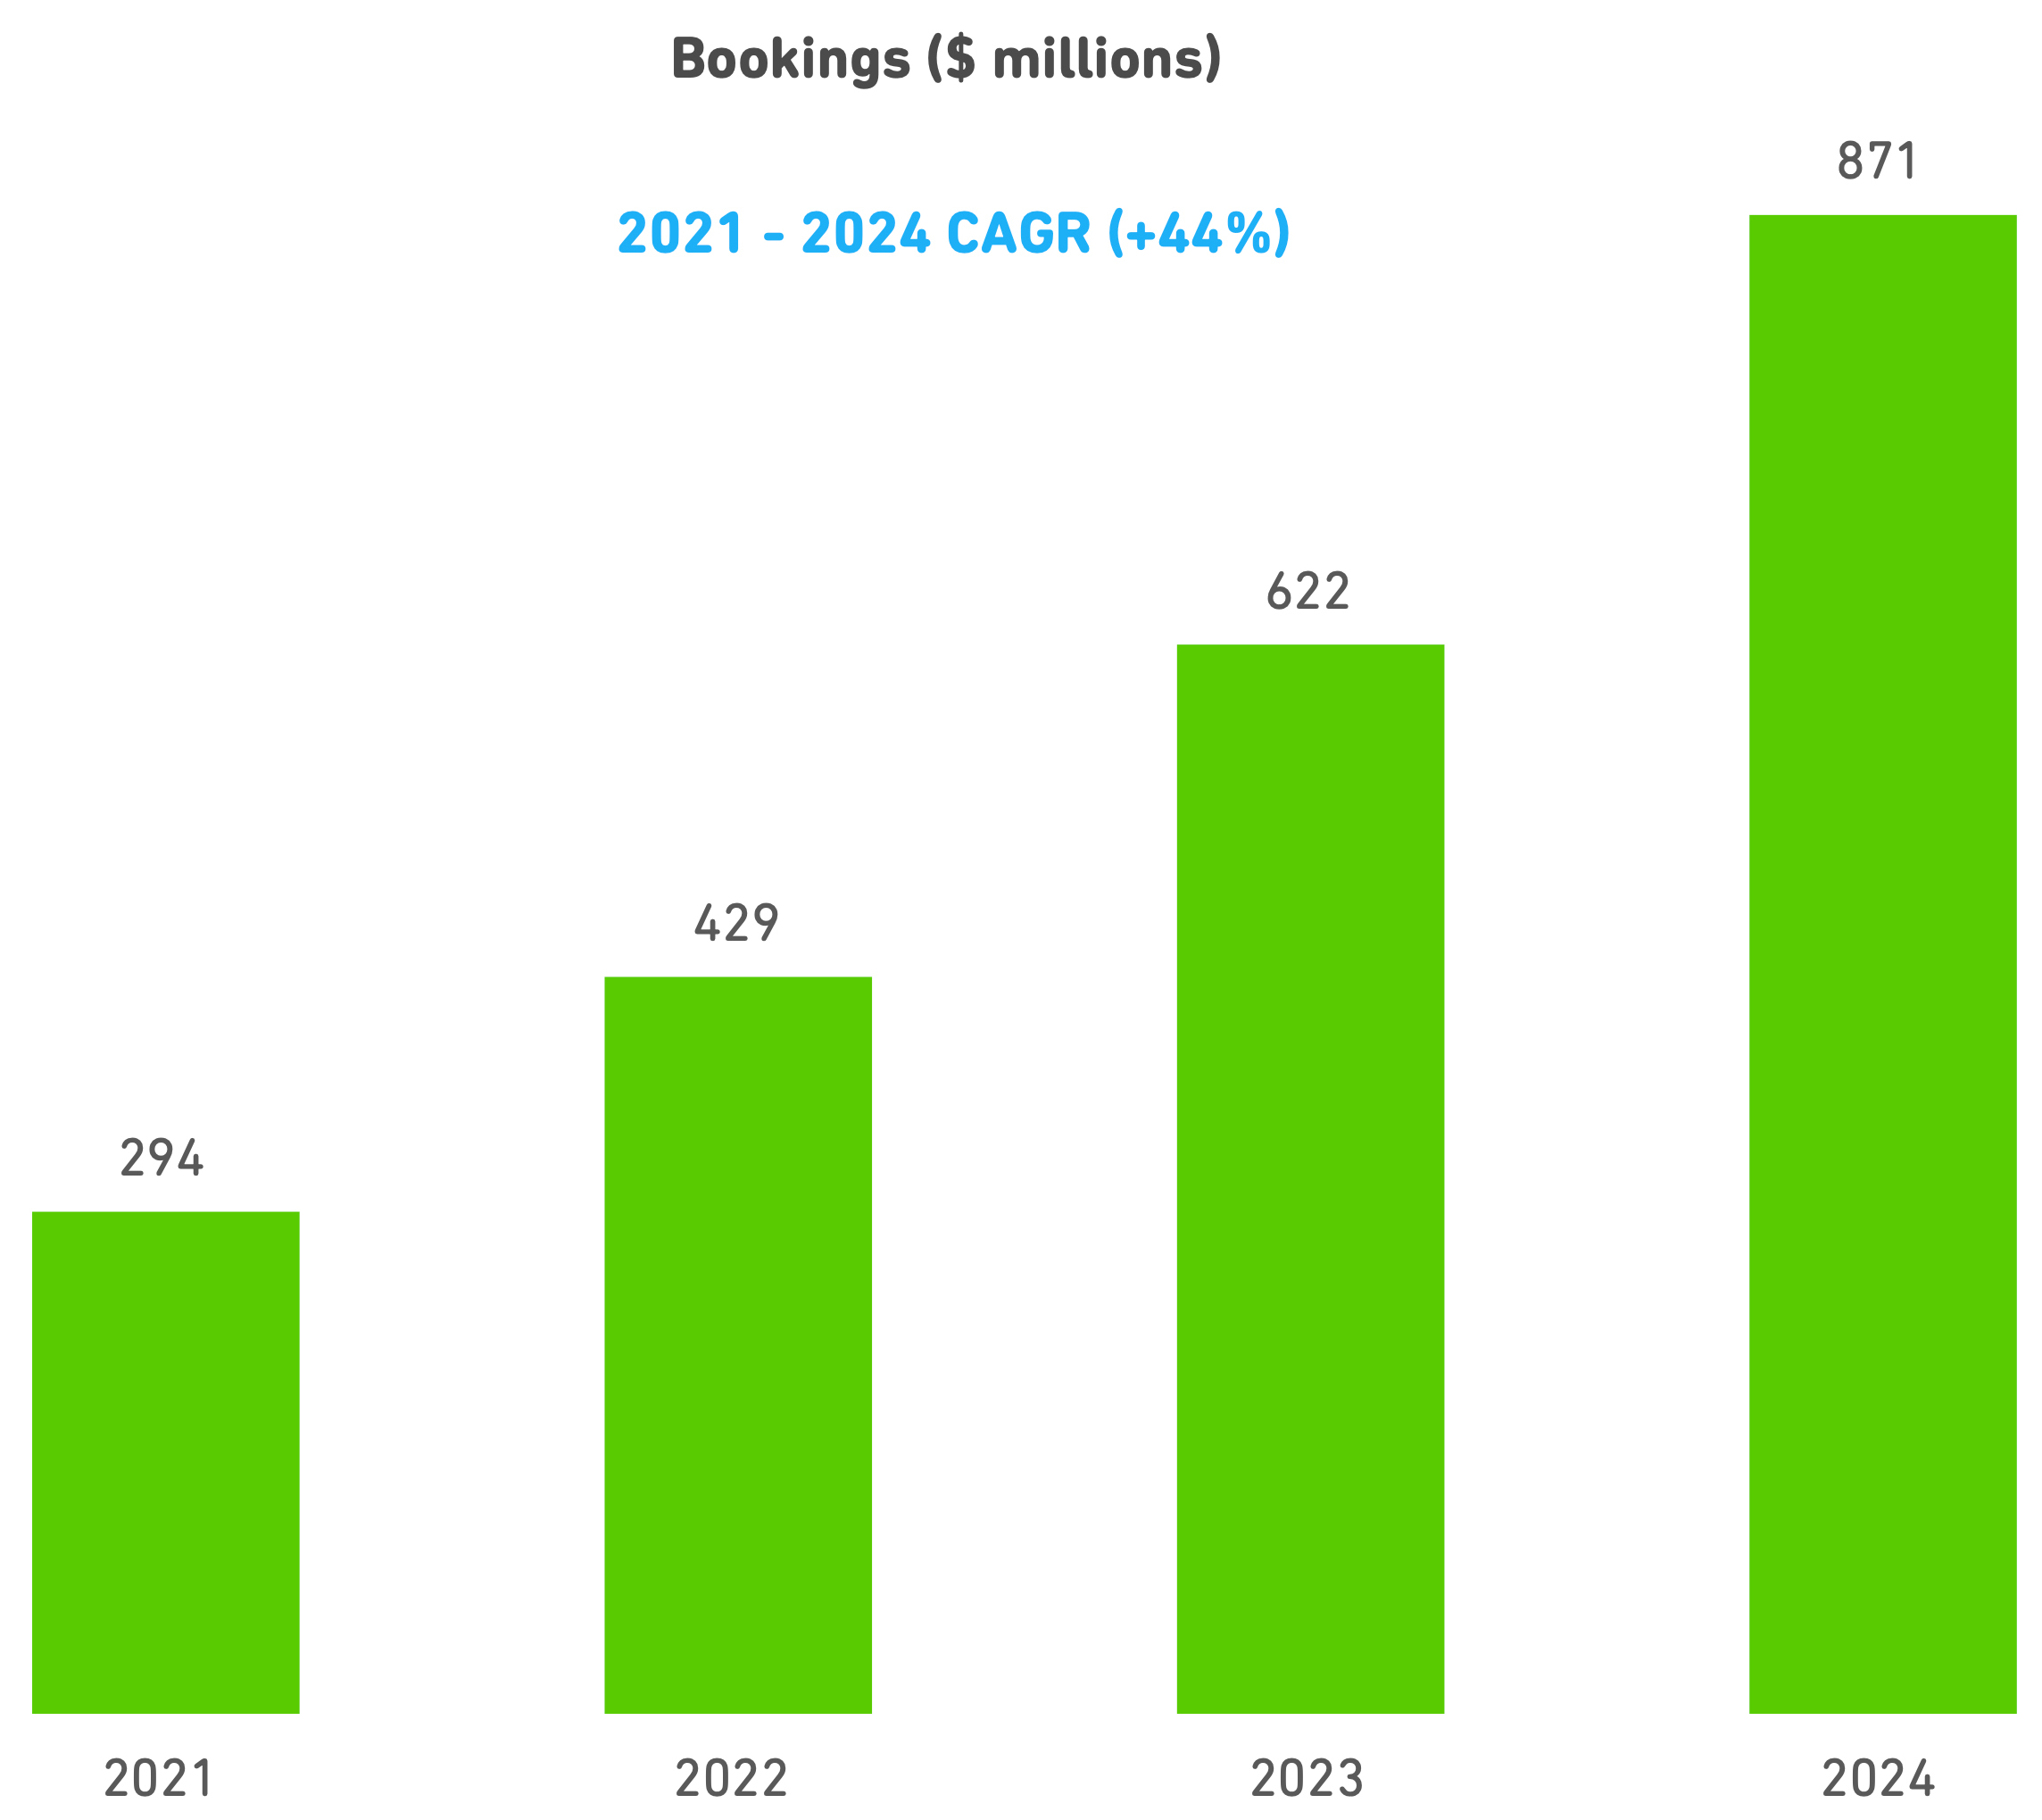
Monetization
Bookings grew 40% year-over-year in 2024. This was fueled by our packaging, promotion, and conversion experiments as well as the evolution of our subscription offerings, like Duolingo Max.
We also made significant progress launching Duolingo Max in more countries and courses, and it’s now available to a majority of our users. By year-end, this premium tier accounted for 5% of paid subscribers. Video Call, our real-time conversation feature introduced in Q3 2024, has been a key driver of this success by addressing a critical learning gap: practicing speaking skills. And because we see English learners engaging with this feature significantly more than learners of other languages, we believe this could help us monetize this audience over time.
In 2025, our priority is to elevate Video Call by making Lily, our AI-powered conversation partner, more dynamic and interactive in order to strengthen user engagement and further differentiate Duolingo Max as a premium offering.
DUOLINGO Q4 / FY 2024 6
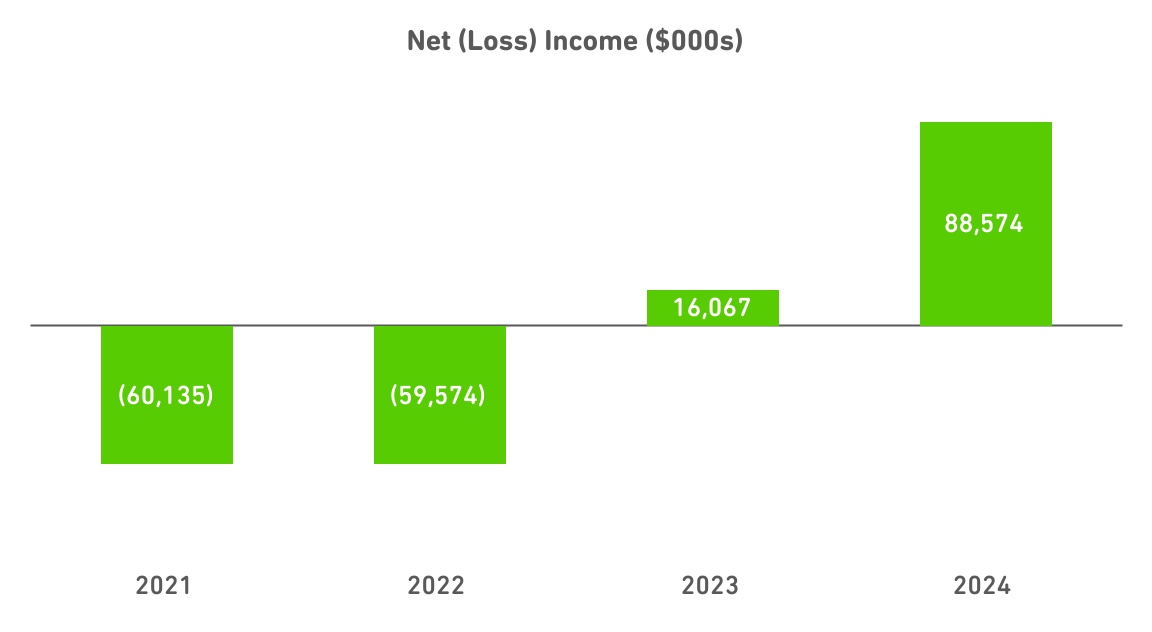
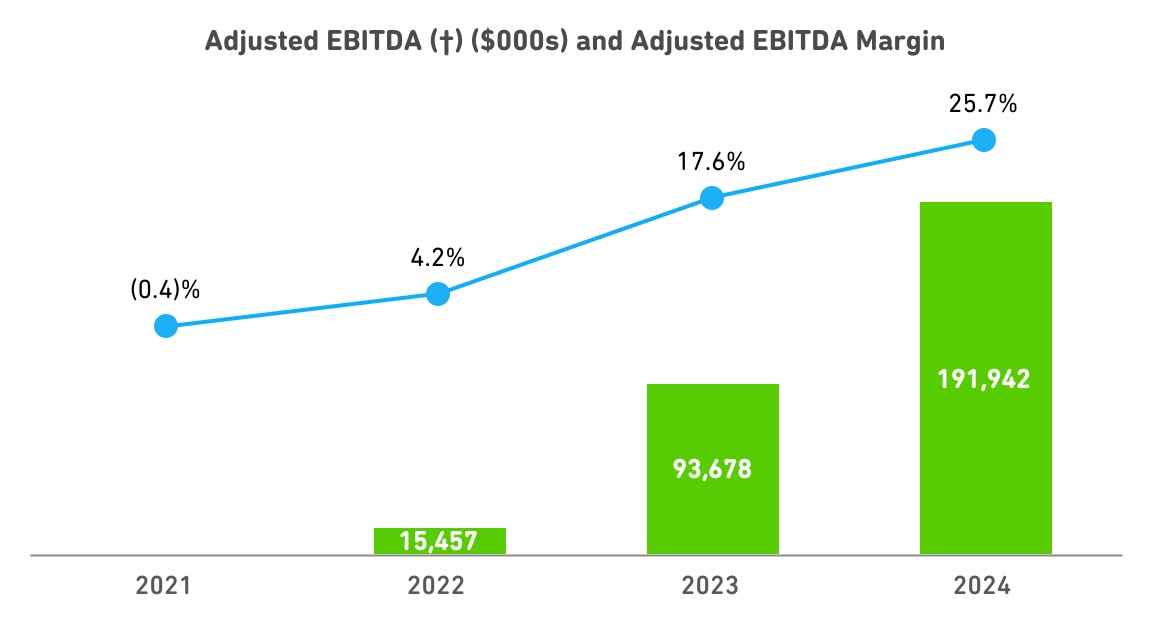
Profitability and operational efficiency
In 2024, we were able to grow users and bookings rapidly while also increasing net income and expanding Adjusted EBITDA by 8 percentage points to 25.7%.
(†)Please refer to the Appendix at the end of this letter for a reconciliation of these non-GAAP financial measures to the most directly comparable GAAP financial measure.
DUOLINGO Q4 / FY 2024 7
We gained operating leverage across Research and development (R&D), Sales and marketing (S&M), and General and administrative (G&A) expenses thanks to efficiency gains as we’ve scaled that helped us grow revenues faster than operating expenses. AI and automation tools in particular have helped us significantly scale our lesson content creation, helping to drive efficiency gains in R&D. Here’s a chart of our content growth as measured by course units published per year since 2021:
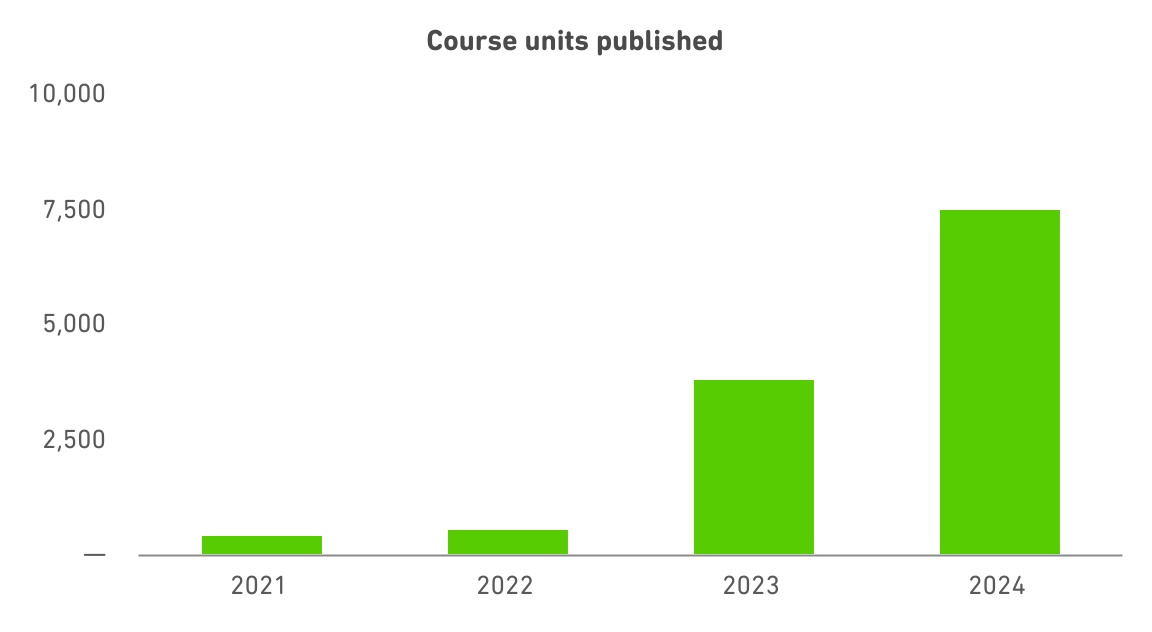
A unit is a collection of lessons that teach vocabulary and grammar topics
In 2025, we will continue investing in our core product, especially Duolingo Max and Video Call, and promote it globally. At the same time, we’ll lay the foundation for longer-term initiatives like Math and Music. Our fast-paced product development allows us to leverage advancements in generative AI to boost user engagement and monetization through features like Video Call, and we’ve already seen significant early success doing so.
Since our IPO, we’ve rapidly expanded profitability (shown in charts above). While we expect to continue growing margins this year, we will do so at a more measured pace due to the investments we are making into AI and the variable costs associated with Video Call. We see a tremendous growth opportunity ahead and believe that by investing strategically now, we can drive sustained, long-term success.
DUOLINGO Q4 / FY 2024 8
Closing remarks
2024 was an extraordinary year for Duolingo. People often ask me, “What’s the secret behind Duolingo’s success?” The truth is, there’s no secret—just our mission and a process. We call the process "The Green Machine." It’s our approach to experimentation, and it’s the engine behind everything we do, from product development to viral marketing. To see how we operate in more detail, I welcome you all to read the Duolingo Handbook, which we just published a few weeks ago.
I’m incredibly excited for what lies ahead. Each Monday, I share a message with the entire company. In my first note this January, I told the team that I believe 2025 will be our best year yet. Thank you for being a part of our journey to make learning accessible, effective, and delightful for everyone.
Until next time, we’ll continue to make it fun.

 | ||
| Luis von Ahn | ||
| CEO and Co-Founder | ||
DUOLINGO Q4 / FY 2024 9
financial performance and outlook
| Summary of Financial and Key Operating Metrics | ||||||||||||||||||||
| (in millions) | Q4 2023 | Q4 2024 | YoY | |||||||||||||||||
| User Metrics | ||||||||||||||||||||
| Monthly active users (MAUs) | 88.4 | 116.7 | 32% | |||||||||||||||||
| Daily active users (DAUs) | 26.9 | 40.5 | 51% | |||||||||||||||||
| Paid subscribers (period end) | 6.6 | 9.5 | 43% | |||||||||||||||||
| Q4 2023 | Q4 2024 | YoY | 2023 | 2024 | YoY | |||||||||||||||
| Operating Metrics | ||||||||||||||||||||
| Subscription bookings | $157.8 | $236.5 | 50% | $495.5 | $730.7 | 47% | ||||||||||||||
| Total bookings | $191.0 | $271.6 | 42% | $622.2 | $870.6 | 40% | ||||||||||||||
| GAAP Financial Measures | ||||||||||||||||||||
| Revenues | $151.0 | $209.6 | 39% | $531.1 | $748.0 | 41% | ||||||||||||||
| Gross profit | $110.4 | $150.6 | 36% | $389.0 | $544.4 | 40% | ||||||||||||||
| Gross margin (%) | 73.1% | 71.9% | ~(120) bps | 73.2% | 72.8% | ~(50) bps | ||||||||||||||
| Net income | $12.1 | $13.9 | 15% | $16.1 | $88.6 | >100% | ||||||||||||||
| Net cash from operating activities | $49.2 | $83.3 | 69% | $153.6 | $285.5 | 86% | ||||||||||||||
| Non-GAAP Financial Measures (†) | ||||||||||||||||||||
| Adjusted EBITDA | $35.2 | $52.3 | 49% | $93.7 | $191.9 | >100% | ||||||||||||||
| Adjusted EBITDA margin | 23.3% | 25.0% | ~170 bps | 17.6% | 25.7% | ~800 bps | ||||||||||||||
| Free cash flow | $47.7 | $87.8 | 84% | $144.3 | $274.9 | 91% | ||||||||||||||
| Free cash flow margin | 31.6% | 41.9% | ~1030 bps | 27.2% | 36.8% | ~960 bps | ||||||||||||||
(†) Please refer to the Appendix at the end of this letter for a reconciliation of these non-GAAP financial measures to the most directly comparable GAAP financial measure.
Amounts reported in millions are computed based on the amounts in thousands. As a result, the sum of the components reported in millions may not equal the total amount reported in millions due to rounding. In addition, percentages presented are calculated from the underlying numbers in thousands and may not add to their respective totals due to rounding.
DUOLINGO Q4 / FY 2024 11
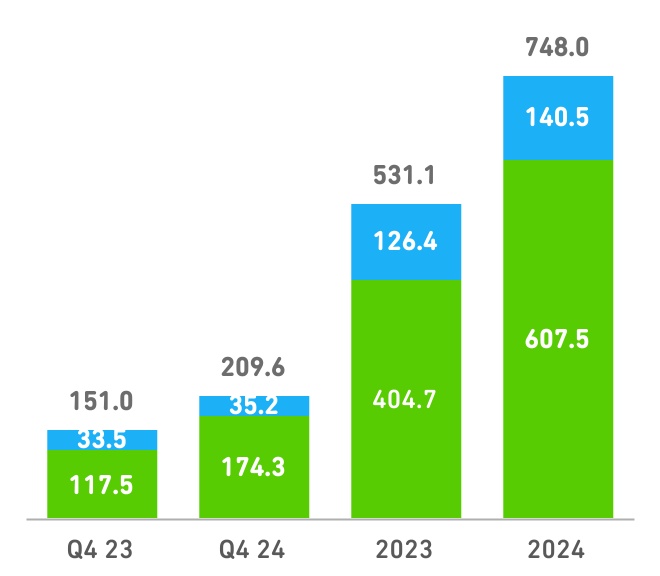
| Bookings ($M) | Revenue ($M) | ||||||||||
| YoY: | +42% | +40% | YoY: | +39% | +41% | ||||||||||||||||||
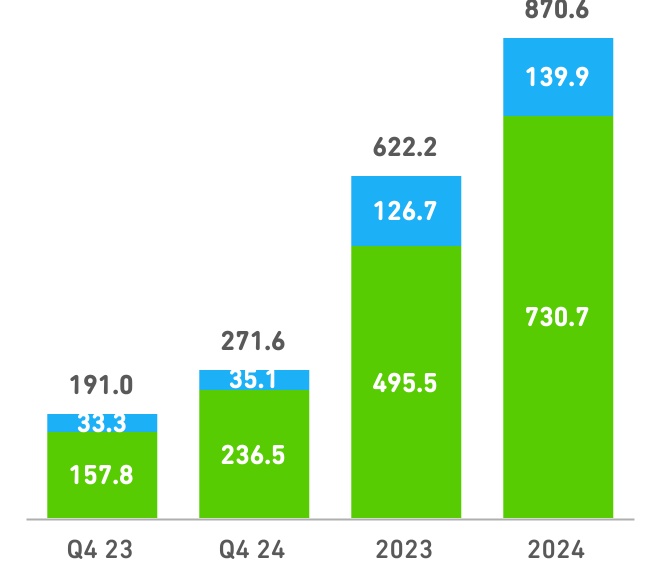
 | Subscription |  | Non-Subscription | ||||||||
In Q4, total bookings reached a record high of $271.6 million, growing 42% year over year on a reported basis (and 45% on a constant currency basis) driven primarily by a 50% increase in subscription bookings. In FY 2024, total bookings were $870.6 million, up 40% year over year on a reported basis (and 42% on a constant currency basis), driven primarily by a 47% increase in subscription bookings.
In Q4, revenues were $209.6 million, 39% higher year over year both on a reported and constant currency basis, driven primarily by an increase in subscription revenue, which grew 48% year over year, and comprised 83% of revenues. In FY 2024, revenues were $748.0 million, 41% higher year over year on both a reported and constant currency basis, driven primarily by growth in subscription revenue, which was up 50% year over year, and comprised 81% of revenues.
The increase in both subscription bookings and subscription revenue was primarily attributable to an increase in the average number of paid subscribers year over year. In Q4, subscription revenue per average subscriber increased 2% year over year, primarily due to a higher mix of both family plan and Duolingo Max subscribers.
DUOLINGO Q4 / FY 2024 12
The table below provides revenues by product type:
| (in millions) | Q4 2023 | Q4 2024 | Change | % Change | 2023 | 2024 | Change | % Change | ||||||||||||||||||
| Subscription | $117.5 | $174.3 | $56.9 | 48 | % | $404.7 | $607.5 | $202.8 | 50 | % | ||||||||||||||||
| Other (1) | $33.5 | $35.2 | $1.7 | 5 | % | $126.4 | $140.5 | $14.1 | 11 | % | ||||||||||||||||
| Total revenues | $151.0 | $209.6 | $58.6 | 39 | % | $531.1 | $748.0 | $216.9 | 41 | % | ||||||||||||||||
In Q4, gross margin decreased by approximately 120 basis points year over year to 71.9% due to lower subscription margins from increased generative AI costs due to the increased adoption of Duolingo Max, and lower advertising gross margin during the period from lower advertising revenue per DAU. This was offset by an increase in subscription revenue as a percentage of total revenue. In FY 2024, gross margin decreased by approximately 50 basis points year over year to 72.8%. This was mainly due to lower advertising gross margin, offset by an increase in subscription revenue as a percentage of total revenue.
| GAAP Operating Expenses (% of Revenue) | Non-GAAP Operating Expenses (% of Revenue) | ||||||||||
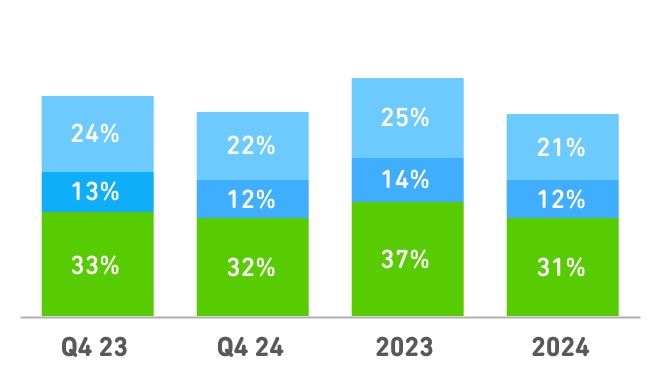
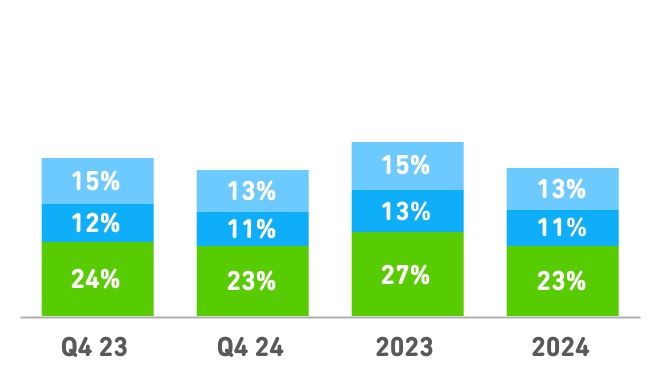
| R&D |  | S&M |  | G&A | ||||||||||||
We report three categories of operating expenses: Research and development (R&D), Sales and marketing (S&M), and General and administrative (G&A). Non-GAAP operating expenses† represent GAAP expenses adjusted for depreciation, amortization, stock-based compensation expenses related to equity awards, as well as other expenses. The most significant adjustment in Q4 and FY 2024 was for stock-based compensation (SBC) expenses related to equity awards of $36.6 million and $120.3 million, respectively. Roughly 15% of our SBC expense in Q4 was related to our pre-IPO founder equity awards, which are intended to serve as the sole equity award opportunity for our founders through 2031.
In Q4 and FY 2024, we achieved significant operating leverage across total operating expenses, both on a GAAP and non-GAAP basis.
(1) Other revenue is comprised mainly of Advertising, Duolingo English Test, and In-App Purchases.
DUOLINGO Q4 / FY 2024 13
In Q4, GAAP R&D expense decreased from 33% to 32% of revenue year over year, and in FY 2024, GAAP R&D expense decreased from 37% to 31% of revenue. On a non-GAAP basis†, R&D expense decreased year over year from 24% to 23% in Q4 and decreased from 27% to 23% in FY 2024. We continued to see leverage from our R&D investments, with top-line growth outpacing our spending in this area. Our team of engineers, designers, and product managers run countless experiments to make our products more engaging and effective at converting free users into subscribers. We believe his disciplined approach allows us to scale efficiently while delivering meaningful growth.
In Q4, GAAP S&M expense decreased from 13% to 12% of revenue year over year, and in FY 2024, GAAP S&M expense decreased from 14% to 12%. On a non-GAAP basis†, S&M expense decreased year over year from 12% to 11% in Q4, and decreased from 13% to 11% in FY 2024. Our social-first marketing strategy continues to deliver strong results, enabling us to attract new users efficiently. By focusing on creative, high-impact efforts, we’ve improved user acquisition effectiveness and sustained growth as we’ve scaled.
In Q4, GAAP G&A expense decreased from 24% to 22% of revenue year over year, and in FY 2024 GAAP G&A decreased from 25% to 21%. On a non-GAAP basis†, G&A expense decreased year over year from 15% to 13% of revenues in both Q4, and FY 2024. Year over year operating leverage in G&A primarily came from employee, office, and professional expenses.
| Adjusted EBITDA ($M) | Free Cash Flow ($M) | ||||||||||
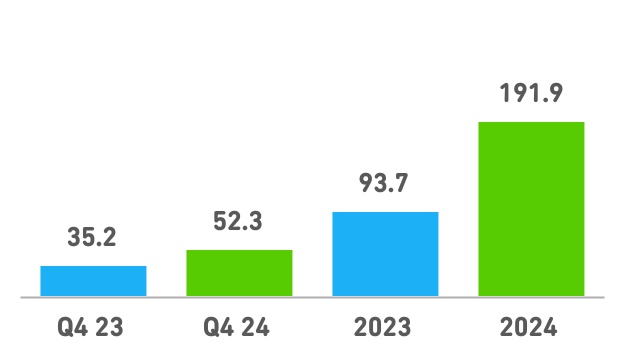
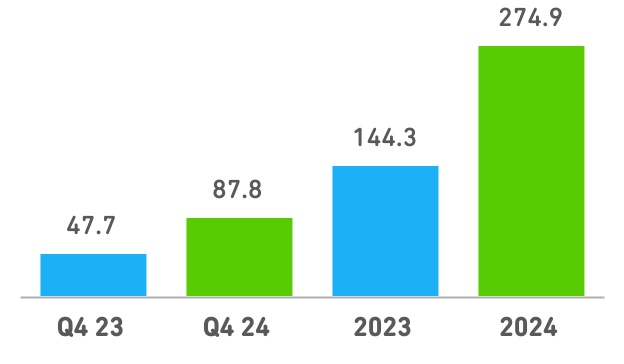
| 23.3% | 25.0% | 17.6% | 25.7% | Margin | 31.6% | 41.9% | 27.2% | 36.8% | ||||||||||||||||||
In Q4, we achieved our highest quarterly Adjusted EBITDA†, which increased by $17.1 million year over year to $52.3 million, or a 25.0% Adjusted EBITDA margin†. In FY 2024, Adjusted EBITDA increased by $98.3 million to $191.9 million, or a 25.7% Adjusted EBITDA margin. The increase was driven by growth in revenue and improved leverage across all categories of operating expenses during the period, as we continued to manage the business with cost and capital discipline.
During Q4 and FY 2024, we generated free cash flow (FCF)† of $87.8 million (a 41.9% FCF margin†) and $274.9 million (a 36.8% FCF margin†), respectively, driven primarily by an increase in cash from operations.
†Please refer to the Appendix at the end of this letter for a reconciliation of these non-GAAP financial measures to the most directly comparable GAAP financial measure.
DUOLINGO Q4 / FY 2024 14
Q1 and FY 2025 Guidance
Duolingo is providing the following guidance for the first quarter ending March 31, 2025, and the full year ending December 31, 2025.
| (in millions) | Q1 2025 | FY 2025 | ||||||
| Bookings | $252 - $255 | $1,082 - $1,098 | ||||||
| YoY Bookings Growth | 27.6% - 29.2% | 24.3% - 26.1% | ||||||
| Revenues | $220.5 - $223.5 | $962.5 - $978.5 | ||||||
| YoY Revenue Growth | 31.6% - 33.4% | 28.7% - 30.8% | ||||||
| Adjusted EBITDA | $54.0 - $57.0 | $259.9 - $274.0 | ||||||
| Adjusted EBITDA margin | 24.5% - 25.5% | 27.0% - 28.0% | ||||||
Our guidance in the table above assumes foreign exchange rates as of February 21, 2025.
On a constant currency basis, assuming the average foreign exchange rates for full-year 2024 remained constant for full-year 2025, we estimate that our full-year 2025 year-over-year growth for bookings and revenue at 26.2% to 28.1% and 30.1% to 32.2%, respectively.
On a constant currency basis, assuming the average foreign exchange rates for Q1 2024 remained constant for Q1 2025, we estimate that our Q1 2025 year-over-year growth for bookings and revenue at 30.8% to 32.4% and 33.6% to 35.4%, respectively.
With regards to the non-GAAP Adjusted EBITDA and Adjusted EBITDA margin outlook provided above, a reconciliation to GAAP net income, the most directly comparable financial measure presented in accordance with GAAP, has not been provided as the quantification of certain items included in the calculation of GAAP net income cannot be calculated or predicted at this time without unreasonable efforts. For example, the non-GAAP adjustment for stock-based compensation expenses related to equity awards requires additional inputs such as number of shares granted and market price that are not currently ascertainable, and the non-GAAP adjustment for certain legal, tax and regulatory reserves and expenses depends on the timing and magnitude of these expenses and cannot be accurately forecasted. For the same reasons, we are unable to address the probable significance of the unavailable information, which could have a potentially unpredictable, and potentially significant, impact on our future GAAP financial results.
DUOLINGO Q4 / FY 2024 15
Dilutive Securities
Duolingo has various dilutive securities outstanding. The table below details these securities:
| (Amounts in millions, except share price) | Price as of December 31, 2024 | Weighted-average exercise price | Shares | ||||||||||||||
| Share price | $324.23 | ||||||||||||||||
| Common stock outstanding as of December 31, 2024 | 44.9 | ||||||||||||||||
| Founder awards (1) | 1.4 | ||||||||||||||||
| Dilutive effect of stock options outstanding (2) | $18.73 | 1.4 | |||||||||||||||
| RSUs outstanding | 1.8 | ||||||||||||||||
| Total estimated diluted shares outstanding | 49.5 | ||||||||||||||||
Video Webcast
Duolingo will host a video webcast to discuss its fourth quarter and full year results today, February 27, 2025, at 5:30 p.m. ET. This live webcast and related materials will be publicly available and can be accessed at investors.duolingo.com. A replay will be available on the Investor Relations website two hours following completion of the webcast and will remain available for a period of one year.
About Duolingo
Duolingo is the leading mobile learning platform globally. Its flagship app has organically become the world's most popular way to learn languages and the top-grossing app in the Education category on both Google Play and the Apple App Store. With technology at the core of everything it does, Duolingo has consistently invested to provide learners a fun, engaging, and effective learning experience while remaining committed to its mission to develop the best education in the world and make it universally available.
(1)Includes 1.0 million underlying performance-based Restricted Stock Units ("RSUs") where performance criteria have not been satisfied.
(2)The Company has 1.5 million options outstanding as of December 31, 2024. The estimated dilutive effect is calculated as the number of shares expected to be issued upon vesting or exercise, adjusted for the strike price proceeds that are received by the Company and assumed to be used to repurchase shares of Duolingo common stock.
DUOLINGO Q4 / FY 2024 16
Definitions
Monthly Active Users (MAUs). MAUs are defined as unique users who engage with our Duolingo App or the learning section of our website each month. MAUs are reported for a measurement period by taking the average of the MAUs for each calendar month in that measurement period. The measurement period for MAUs is the three months ended December 31, 2024 and the same period in the prior year where applicable, and the analysis of results is based on those periods. MAUs are a measure of the size of our global active user community on Duolingo.
Daily Active Users (DAUs). DAUs are defined as unique users who engage with our Duolingo App or the learning section of our website each calendar day. DAUs are reported for a measurement period by taking the average of the DAUs for each day in that measurement period. The measurement period for DAUs is the three months ended December 31, 2024 and the same period in the prior year where applicable, and the analysis of results is based on those periods. DAUs are a measure of the consistent engagement of our global user community on Duolingo.
Paid Subscribers. Paid subscribers are defined as users who pay for access to any Duolingo subscription offering and had an active subscription as of the end of the measurement period. Each unique user account is treated as a single paid subscriber regardless of whether such user purchases multiple subscriptions, and the count of paid subscribers does not include users who are currently on a free trial or who are non-paying members of a family plan.
Subscription Bookings and Total Bookings. Subscription bookings represent the amounts we receive from a purchase of any Duolingo subscription offering. Total bookings include subscription bookings, income from advertising networks for advertisements served to our users, purchases of the Duolingo English Test, and in-app purchases of virtual goods. We believe bookings provide an indication of trends in our operating results, including cash flows, that are not necessarily reflected in our revenues because we recognize subscription revenues ratably over the lifetime of a subscription, which is generally from one to twelve months.
Limitation of Key Operating Metrics and Other Data
We manage our business by tracking several operating metrics, including MAUs, DAUs, paid subscribers, and subscription and total bookings. While these metrics are based on what we believe to be reasonable estimates of our user base for the applicable period of measurement, there are inherent challenges in measuring how our platform is used. These metrics are determined by using internal data gathered on an analytics platform that we developed and operate and have not been validated by an independent third party. This platform tracks user account and session activity. If we fail to maintain an effective analytics platform, our metrics calculations may be inaccurate. We believe that these metrics are reasonable estimates of our user base for the applicable period of measurement, and that the methodologies we employ and update from time-to-time to create these metrics are reasonable bases to identify trends in user behavior. Because we update the methodologies we employ to create metrics, our operating metrics may not be comparable to those in prior periods. Other companies, including companies in our industry, may calculate these metrics differently.
DUOLINGO Q4 / FY 2024 17
Non-GAAP Financial Measures
We use certain non-GAAP financial measures to supplement our Consolidated Financial Statements, which are presented in accordance with GAAP. Non-GAAP financial measures include Adjusted EBITDA, Adjusted EBITDA margin, constant currency measures, non-GAAP R&D expense, non-GAAP S&M expense and non-GAAP G&A expense (collectively, the “non-GAAP operating expenses”), free cash flow, and free cash flow margin. Please refer to the definitions and reconciliation at the end of this letter. We use these non-GAAP financial measures for financial and operational decision-making and as a means to evaluate period-to-period comparisons. By excluding certain items that may not be indicative of our recurring core operating results, we believe that these non-GAAP financial measures provide meaningful supplemental information regarding our performance. Accordingly, we believe these non-GAAP financial measures are useful to investors and others because they allow for additional information with respect to financial measures used by management in its financial and operational decision-making and they may be used by our institutional investors and the analyst community to help them analyze the health of our business. However, there are a number of limitations related to the use of non-GAAP financial measures, and these non-GAAP financial measures should be considered in addition to, not as a substitute for or in isolation from, our financial results prepared in accordance with GAAP. Other companies, including companies in our industry, may calculate these non-GAAP financial measures differently or not at all, which reduces their usefulness as comparative measures.
The effect of currency exchange rates on our business is an important factor in understanding period to period comparisons. We use non-GAAP percentage change in constant currency revenues and bookings, which exclude the impact of fluctuations in foreign currency exchange rates, for financial and operational decision-making and as a means to evaluate period-to-period comparisons. We believe this information is useful to investors to facilitate comparisons and better identify trends in our business. The impact of changes in foreign currency may vary significantly from period to period, and such changes generally are outside of the control of our management. We calculate constant currency revenues by using current period foreign currency revenues and translating them to constant currency using prior year comparable period exchange rates for the entire period of related bookings. We calculate constant currency bookings by using current period foreign currency bookings and translating them to constant currency using prior year comparable period exchange rates. The constant currency percentage change for revenues and bookings is calculated by dividing the difference between the constant currency amount and the prior year comparable period amount by the prior year comparable period amount.
DUOLINGO Q4 / FY 2024 18
Forward-Looking Statements
This Shareholder Letter contains forward-looking statements within the meaning of the Private Securities Litigation Reform Act of 1995. We intend such forward-looking statements to be covered by the safe harbor provisions for forward-looking statements contained in Section 27A of the Securities Act of 1933, as amended (the “Securities Act”) and Section 21E of the Securities Exchange Act of 1934, as amended (the “Exchange Act”). All statements other than statements of historical facts contained in this letter, including without limitation, statements regarding our business model and strategic priorities for growth, product enhancement, and monetization, including the expected benefits and efficacy of new products and product updates for user growth and retention, the availability of new products, the effectiveness of our marketing efforts, and our financial outlook, including our margin expansion, are forward-looking statements. Without limiting the generality of the foregoing, you can identify forward-looking statements because they contain words such as “may,” “will,” “shall,” “should,” “expects,” “plans,” “anticipates,” “could,” “intends,” “target,” “projects,” “contemplates,” “believes,” “estimates,” “predicts,” “potential,” “goal,” “objective,” “seeks,” or “continue” or the negative of these words or other similar terms or expressions that concern our expectations, strategy, plans, or intentions. Such forward-looking statements are neither promises nor guarantees, but involve a number of known and unknown risks, uncertainties and assumptions that may cause our actual results, performance or achievements to differ materially from those expressed or implied in the forward-looking statements due to various factors, including, but not limited to: our ability to retain and grow our users and sustain their engagement with our products; competition in the online language learning industry; our limited operating history; our ability to maintain profitability; our ability to manage our growth and operate at such scale; the success of our investments; our reliance on third-party platforms to store and distribute our products and collect revenue; our reliance on third-party hosting and cloud computing providers; our ability to compete for advertisements; acceptance by educational organizations of technology-based education; our ability to access, collect, use, and otherwise process Personal Data about our users and payers, and to comply with applicable data privacy laws; our ability to successfully develop, implement and use of artificial intelligence and machine learning technologies; our ability adequately obtain, protect and maintain our intellectual property rights; and the other important factors more fully detailed under the caption "Risk Factors" in our Annual Report on Form 10-K for the fiscal year ended December 31, 2024, as any such factors may be updated from time to time, in our other filings with the Securities and Exchange Commission (“SEC”), accessible on the SEC’s website at www.sec.gov and the Investor Relations section of the Company’s website at investors.duolingo.com. All forward-looking statements speak only as of the date of this letter. While we may elect to update such forward-looking statements at some point in the future, unless required by applicable law, we disclaim any obligation to do so, even if subsequent events cause our views to change.
Website Information
We routinely post important information for investors on the Investor Relations section of our website, investors.duolingo.com, and also from time to time may use social media channels, including our X account x.com/duolingo and our LinkedIn account linkedin.com/company/duolingo, as an additional means of disclosing public information to investors, the media, and others interested in us. It is possible that certain information we post on our website and on social media could be deemed to be material information, and we encourage investors, the media, and others interested in us to review the business and financial information we post on our website and on the social media channels identified above, in addition to following our press releases, SEC filings, public conference calls, presentations, and webcasts. The information contained on, or that may be accessed through, our website and our social media channels is not incorporated by reference into, and is not a part of, this document.
DUOLINGO Q4 / FY 2024 19
DUOLINGO, INC. AND SUBSIDIARIES CONDENSED CONSOLIDATED BALANCE SHEETS | |||||||||||
| (in thousands) | December 31, 2023 | December 31, 2024 | |||||||||
| ASSETS | |||||||||||
| Cash and cash equivalents | $747,610 | $785,791 | |||||||||
| Short-term investments | — | 91,854 | |||||||||
| Accounts receivable | 88,975 | 128,923 | |||||||||
| Deferred cost of revenues | 53,931 | 80,162 | |||||||||
| Prepaid expenses and other current assets | 7,282 | 14,858 | |||||||||
| Noncurrent assets | 56,159 | 200,140 | |||||||||
| Total assets | $953,957 | $1,301,728 | |||||||||
| LIABILITIES AND STOCKHOLDERS’ EQUITY | |||||||||||
| Deferred revenues | 249,192 | 372,884 | |||||||||
| Accounts payable | 2,447 | 6,381 | |||||||||
| Other current liabilities | 25,723 | 42,966 | |||||||||
| Long-term obligation under operating leases | 21,094 | 54,656 | |||||||||
| Deferred tax liabilities, net | — | 291 | |||||||||
| Total liabilities | 298,456 | 477,178 | |||||||||
| Total stockholders’ equity | 655,501 | 824,550 | |||||||||
| Total liabilities and stockholders' equity | $953,957 | $1,301,728 | |||||||||
DUOLINGO Q4 / FY 2024 20
DUOLINGO, INC. AND SUBSIDIARIES CONDENSED CONSOLIDATED STATEMENTS OF OPERATIONS AND COMPREHENSIVE INCOME | ||||||||||||||||||||
| Three Months Ended December 31, | Year Ended December 31, | |||||||||||||||||||
| (in thousands) | 2023 | 2024 | 2023 | 2024 | ||||||||||||||||
| Revenues | $150,985 | $209,550 | $531,109 | $748,024 | ||||||||||||||||
| Cost of revenues | 40,571 | 58,925 | 142,105 | 203,645 | ||||||||||||||||
| Gross profit | 110,414 | 150,625 | 389,004 | 544,379 | ||||||||||||||||
| Operating expenses: | ||||||||||||||||||||
| Research and development | 50,256 | 66,395 | 194,352 | 235,298 | ||||||||||||||||
| Sales and marketing | 19,118 | 24,815 | 75,788 | 90,494 | ||||||||||||||||
| General and administrative | 36,245 | 45,533 | 132,123 | 155,992 | ||||||||||||||||
| Total operating expenses | 105,619 | 136,743 | 402,263 | 481,784 | ||||||||||||||||
| Income (loss) from operations | 4,795 | 13,882 | (13,259) | 62,595 | ||||||||||||||||
| Other income (expense), net | 1,054 | (2,227) | (55) | (2,986) | ||||||||||||||||
| Income (loss) before interest income and income taxes | 5,849 | 11,655 | (13,314) | 59,609 | ||||||||||||||||
| Interest income | 9,284 | 10,697 | 31,091 | 42,697 | ||||||||||||||||
| Income before income taxes | 15,133 | 22,352 | 17,777 | 102,306 | ||||||||||||||||
| Provision for income taxes | 3,016 | 8,445 | 1,710 | 13,732 | ||||||||||||||||
| Net income and comprehensive income | $12,117 | $13,907 | $16,067 | $88,574 | ||||||||||||||||
DUOLINGO Q4 / FY 2024 21
| DUOLINGO, INC. AND SUBSIDIARIES | |||||||||||
| CONDENSED CONSOLIDATED STATEMENTS OF CASH FLOWS | |||||||||||
| Year Ended December 31, | |||||||||||
| (in thousands) | 2023 | 2024 | |||||||||
| Cash flows from operating activities: | |||||||||||
| Net income | $16,067 | $88,574 | |||||||||
| Adjustments to reconcile net income to net cash provided by operating activities: | |||||||||||
| Depreciation and amortization | 7,095 | 10,854 | |||||||||
| Stock-based compensation expense | 95,221 | 110,477 | |||||||||
| Accretion on marketable securities, net | — | (551) | |||||||||
| Gain on sale of capitalized software | (100) | — | |||||||||
| Loss on disposal of leasehold improvements | 433 | — | |||||||||
| Impairment of capitalized software | — | 238 | |||||||||
| Changes in assets and liabilities: | 34,898 | 75,921 | |||||||||
| Net cash provided by operating activities | 153,614 | 285,513 | |||||||||
| Net cash used for investing activities | (13,584) | (217,330) | |||||||||
| Net cash provided by (used for) financing activities | 2,135 | (30,002) | |||||||||
| Net increase in cash, cash equivalents and restricted cash | 142,165 | 38,181 | |||||||||
| Cash, cash equivalents and restricted cash - Beginning of period | 608,180 | 750,345 | |||||||||
| Cash, cash equivalents and restricted cash - End of period | $750,345 | $788,526 | |||||||||
DUOLINGO Q4 / FY 2024 22
appendix
e
Reconciliation: Adjusted EBITDA and Adjusted EBITDA Margin and GAAP Operating Expenses and Non-GAAP Operating Expenses
Adjusted EBITDA is defined as net income excluding interest income, income taxes, depreciation and amortization, stock-based compensation expenses related to equity awards, transaction costs related to acquisitions, acquisition earn-out costs, gain on sale of capitalized software, loss on disposal of leasehold improvements and impairment of capitalized software. Adjusted EBITDA margin is defined as Adjusted EBITDA as a percentage of revenues. GAAP operating expenses consist of research and development, sales and marketing, and general and administrative expenses. Non-GAAP operating expenses are defined as the respective GAAP operating expenses excluding depreciation and amortization, stock-based compensation expenses related to equity awards, and, as applicable, transaction costs related to acquisitions, acquisition earn-out costs, gain on sale of capitalized software, loss on disposal of leasehold improvements, and impairment of capitalized software. These non-GAAP financial measures are used by management to evaluate the financial performance of our business and we present these non-GAAP financial measures because we believe that they are helpful in highlighting trends in our operating results and that they are frequently used by analysts, investors and other interested parties to evaluate companies in our industry. The following tables present a reconciliation of our net income and GAAP operating expenses, the most directly comparable financial measures presented in accordance with GAAP, to Adjusted EBITDA and Adjusted EBITDA margin and non-GAAP operating expenses, respectively.
| (in thousands) | Q4 2023 | Q4 2024 | 2023 | 2024 | ||||||||||
| Net income | $12,117 | $13,907 | $16,067 | $88,574 | ||||||||||
| Add (deduct): | ||||||||||||||
| Interest income | (9,284) | (10,697) | (31,091) | (42,697) | ||||||||||
| Provision for income taxes | 3,016 | 8,445 | 1,710 | 13,732 | ||||||||||
| Depreciation and amortization | 2,042 | 3,661 | 7,095 | 10,854 | ||||||||||
| Stock-based compensation expenses related to equity awards (1) | 27,288 | 36,620 | 99,226 | 120,267 | ||||||||||
| Acquisition transaction costs (2) | — | 38 | — | 774 | ||||||||||
| Acquisition earn-out costs (3) | — | 100 | 338 | 200 | ||||||||||
| Gain on sale of capitalized software (4) | — | — | (100) | — | ||||||||||
| Loss on disposal of leasehold improvements | 16 | — | 433 | — | ||||||||||
| Impairment of capitalized software | — | 238 | — | 238 | ||||||||||
| Adjusted EBITDA | $35,195 | $52,312 | $93,678 | $191,942 | ||||||||||
| Revenues | $150,985 | $209,550 | $531,109 | $748,024 | ||||||||||
| Adjusted EBITDA margin | 23.3 | % | 25.0 | % | 17.6 | % | 25.7 | % | ||||||
DUOLINGO Q4 / FY 2024 24
| Reconciliation: GAAP to Non-GAAP Operating Expense | ||||||||||||||
| (in thousands) | Q4 2023 | Q4 2024 | 2023 | 2024 | ||||||||||
| Total GAAP Operating Expense | $105,619 | $136,743 | $402,263 | $481,784 | ||||||||||
| Less: Depreciation and amortization | (1,229) | (1,540) | (5,075) | (5,544) | ||||||||||
| Less: Stock-based compensation expenses related to equity awards (1) | (27,273) | (36,606) | (99,171) | (120,199) | ||||||||||
| Less: Other adjustments (2) (3) | — | (376) | (338) | (1,212) | ||||||||||
| Non-GAAP Operating Expense | $77,117 | $98,221 | $297,679 | $354,829 | ||||||||||
| Reconciliation: GAAP to Non-GAAP R&D Expense | ||||||||||||||
| (in thousands) | Q4 2023 | Q4 2024 | 2023 | 2024 | ||||||||||
| Total GAAP R&D Expense | $50,256 | $66,395 | $194,352 | $235,298 | ||||||||||
| Less: Depreciation and amortization | (419) | (770) | (1,650) | (2,358) | ||||||||||
| Less: Stock-based compensation expenses related to equity awards (1) | (13,297) | (17,574) | (46,812) | (62,394) | ||||||||||
| Less: Other adjustments (5) | — | (238) | — | (238) | ||||||||||
| Non-GAAP R&D Expense | $36,540 | $47,813 | $145,890 | $170,308 | ||||||||||
| Reconciliation: GAAP to Non-GAAP S&M Expense | ||||||||||||||
| (in thousands) | Q4 2023 | Q4 2024 | 2023 | 2024 | ||||||||||
| Total GAAP S&M Expense | $19,118 | $24,815 | $75,788 | $90,494 | ||||||||||
| Less: Depreciation and amortization | (231) | (214) | (1,165) | (860) | ||||||||||
| Less: Stock-based compensation expenses related to equity awards (1) | (1,042) | (1,401) | (4,001) | (5,042) | ||||||||||
| Non-GAAP S&M Expense | $17,845 | $23,200 | $70,622 | $84,592 | ||||||||||
| Reconciliation: GAAP to Non-GAAP G&A Expense | ||||||||||||||
| (in thousands) | Q4 2023 | Q4 2024 | 2023 | 2024 | ||||||||||
| Total GAAP G&A Expense | $36,245 | $45,533 | $132,123 | $155,992 | ||||||||||
| Less: Depreciation and amortization | (579) | (556) | (2,260) | (2,326) | ||||||||||
| Less: Stock-based compensation expenses related to equity awards (1) | (12,934) | (17,631) | (48,358) | (52,763) | ||||||||||
| Less: Other adjustments (2) (3) | — | (138) | (338) | (974) | ||||||||||
| Non-GAAP G&A Expense | $22,732 | $27,208 | $81,167 | $99,929 | ||||||||||
DUOLINGO Q4 / FY 2024 25
Reconciliation: Free Cash Flow and Free Cash Flow Margin
Free cash flow represents net cash provided by operating activities, reduced by capitalized software development costs and purchases of property and equipment and increased by taxes paid related to stock-based compensation equity awards, transaction costs related to acquisitions and acquisition earn-out payments as we believe such items are not indicative of future liquidity. Free cash flow margin is defined as Free cash flow as a percentage of revenues. We believe that Free cash flow is a measure of liquidity that provides useful information to our management, investors and others in understanding and evaluating the strength of our liquidity and future ability to generate cash that can be used for strategic opportunities or investing in our business. Free cash flow has certain limitations in that it does not represent our residual cash flow for discretionary expenditures and our non-discretionary commitments. The following table presents a reconciliation of net cash provided by operating activities, the most directly comparable financial measure calculated in accordance with GAAP, to free cash flow.
| (in thousands) | Q4 2023 | Q4 2024 | 2023 | 2024 | ||||||||||
| Net cash provided by operating activities | $49,193 | $83,344 | $153,614 | $285,513 | ||||||||||
| Less: Capitalized software development costs and purchases of intangible assets | (3,224) | (479) | (10,493) | (9,024) | ||||||||||
| Less: Purchases of property and equipment | (924) | (1,961) | (3,191) | (12,116) | ||||||||||
| Plus: Taxes paid related to stock-based compensation equity awards | 2,286 | 6,833 | 4,005 | 9,790 | ||||||||||
| Plus: Acquisition transaction costs (2) | — | 38 | — | 774 | ||||||||||
| Plus: Acquisition earn-out payment (3) | 338 | — | 338 | — | ||||||||||
| Free cash flow | $47,669 | $87,775 | $144,273 | $274,937 | ||||||||||
| Revenues | $150,985 | $209,550 | $531,109 | $748,024 | ||||||||||
| Free cash flow margin | 31.6 | % | 41.9 | % | 27.2 | % | 36.8 | % | ||||||
(1) In addition to stock-based compensation expense of $25.0 million and $29.8 million for the three months ended December 31, 2023 and 2024, respectively, and $95.2 million and $110.5 million for the years ended December 31, 2023 and 2024, respectively, this includes costs incurred related to taxes paid on equity transactions.
(2) Represents costs incurred related to acquisitions, including integration costs.
(3) Represents costs incurred related to the earn-out payments on acquisitions
(4) Represents proceeds from a sale of capitalized software.
(5) Represents impairment of capitalized software.
DUOLINGO Q4 / FY 2024 26
Contacts
Investor Relations:
Deborah Belevan, VP of Investor Relations
ir@duolingo.com
Press:
Sam Dalsimer, Global Head of Communications
press@duolingo.com
DUOLINGO Q4 / FY 2024 27