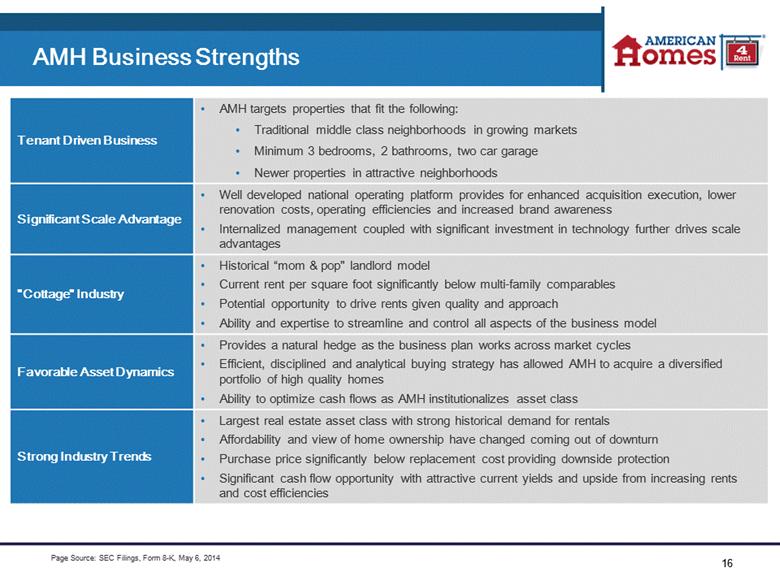
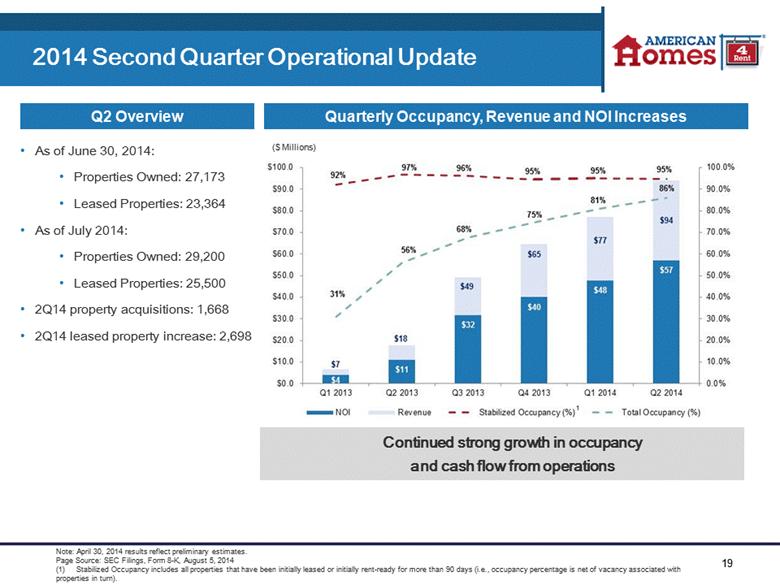
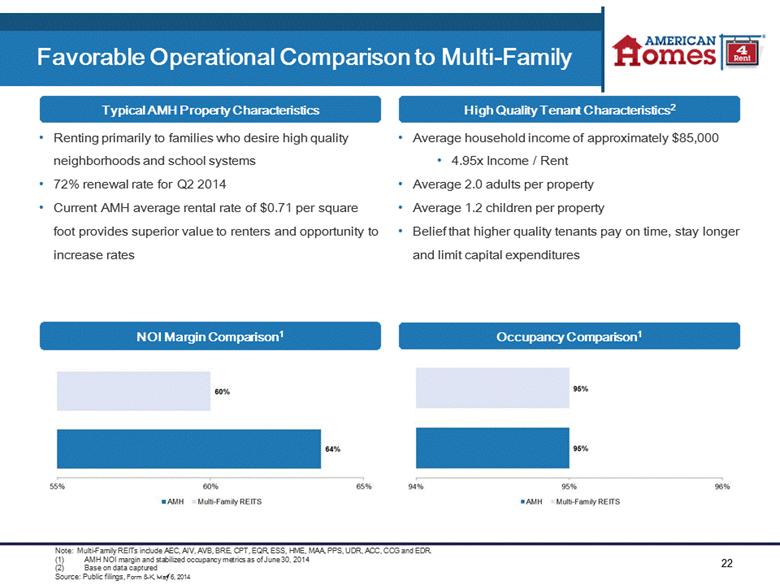
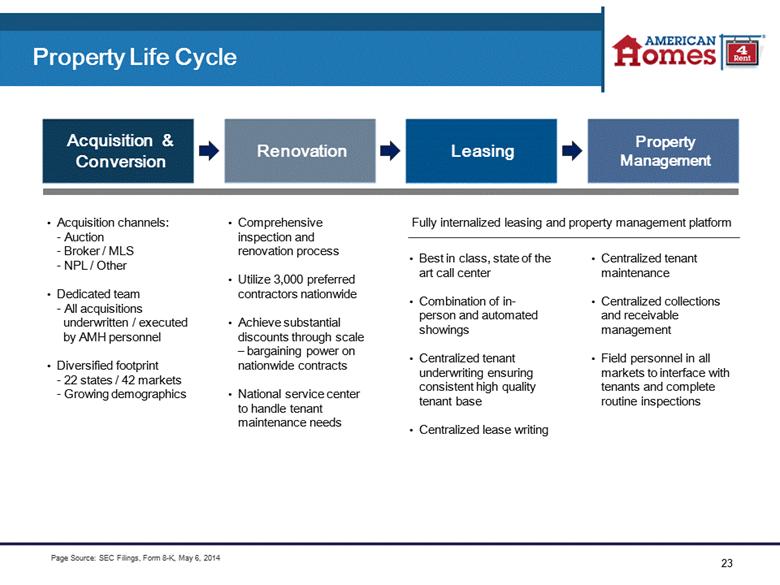
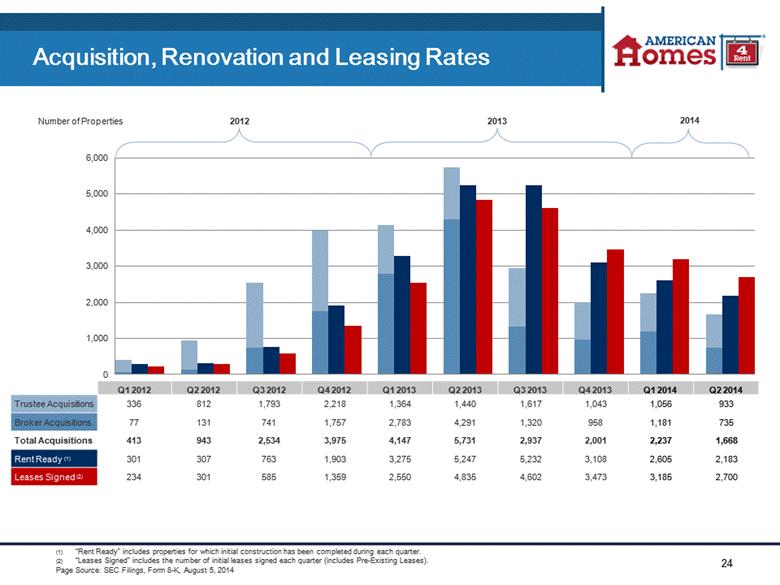
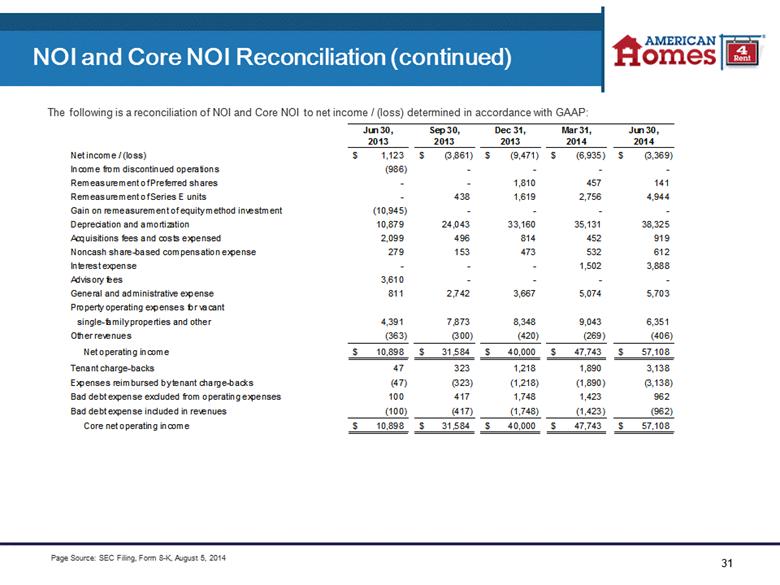
| 30 NOI and Core NOI Reconciliation NOI is a supplemental non-GAAP financial measure that we define as rents and fees from single-family properties and tenant charge-backs, less property operating expenses for leased single-family properties. Core NOI is also a supplemental non-GAAP financial measure that we define as rents and fees from single-family properties, net of bad debt expense, less property operating expenses for leased single-family properties, excluding expenses reimbursed by tenant charge-backs and bad debt expense. NOI and Core NOI also exclude income from discontinued operations, remeasurement of preferred shares, remeasurement of Series E units, gain on remeasurement of equity method investment, depreciation and amortization, acquisition fees and costs expensed, noncash share-based compensation expense, interest expense, advisory fees, general and administrative expense, property operating expenses for vacant single-family properties and other revenues Page Source: SEC Filing, Form 8-K, August 5, 2014 Jun 30, 2013 Sep 30, 2013 Dec 31, 2013 Mar 31, 2014 Jun 30, 2014 Net Operating Income Rents from single-family properties $ 17,020 $ 47,364 $ 61,843 $ 73,761 $ 88,871 Fees from single-family properties 690 1,476 1,409 1,358 1,889 Tenant charge-backs 47 323 1,218 1,890 3,138 Total revenues from single-family properties 17,757 49,163 64,470 77,009 93,898 Leased property operating expenses 6,859 17,579 24,470 29,266 36,790 Net operating income $ 10,898 $ 31,584 $ 40,000 $ 47,743 $ 57,108 Net operating income margin 61.4% 64.2% 62.0% 62.0% 60.8% Core Net Operating Income Rents from single-family properties $ 17,020 $ 47,364 $ 61,843 $ 73,761 $ 88,871 Fees from single-family properties 690 1,476 1,409 1,358 1,889 Bad debt expense (100) (417) (1,748) (1,423) (962) Core revenues from single-family properties 17,610 48,423 61,504 73,696 89,798 Leased property operating expenses 6,859 17,579 24,470 29,266 36,790 Expenses reimbursed by tenant charge-backs (47) (323) (1,218) (1,890) (3,138) Bad debt expense (100) (417) (1,748) (1,423) (962) Core property operating expenses 6,712 16,839 21,504 25,953 32,690 Core net operating income $ 10,898 $ 31,584 $ 40,000 $ 47,743 $ 57,108 Core net operating income margin 61.9% 65.2% 65.0% 64.8% 63.6% For the Three Months Ended |