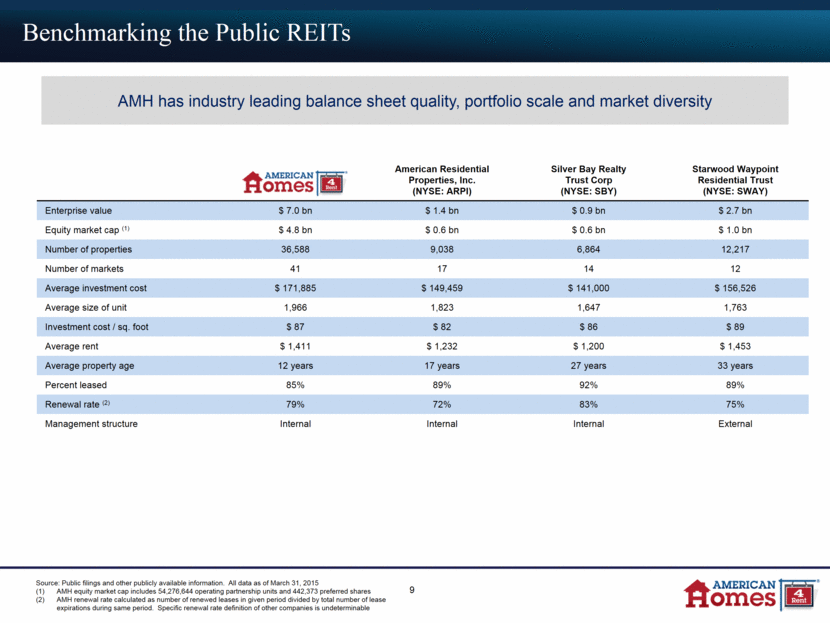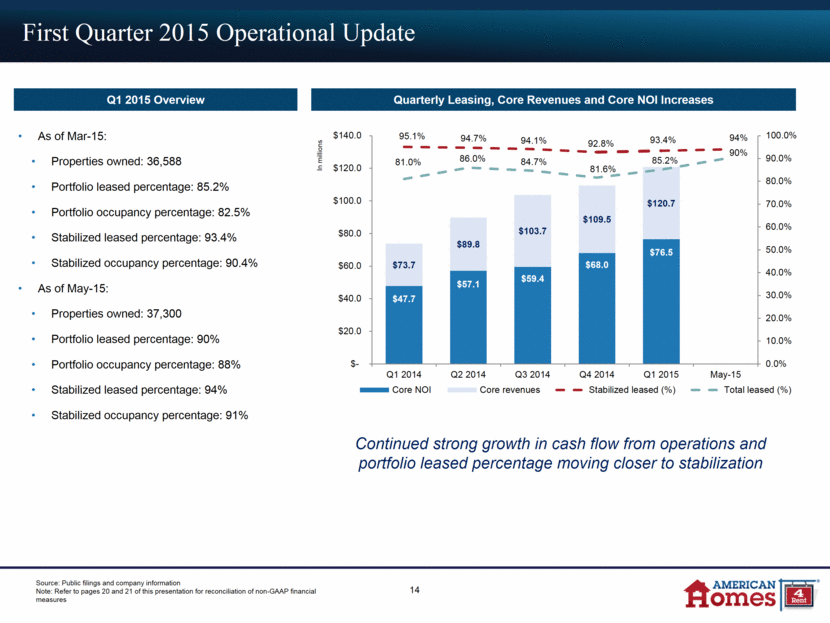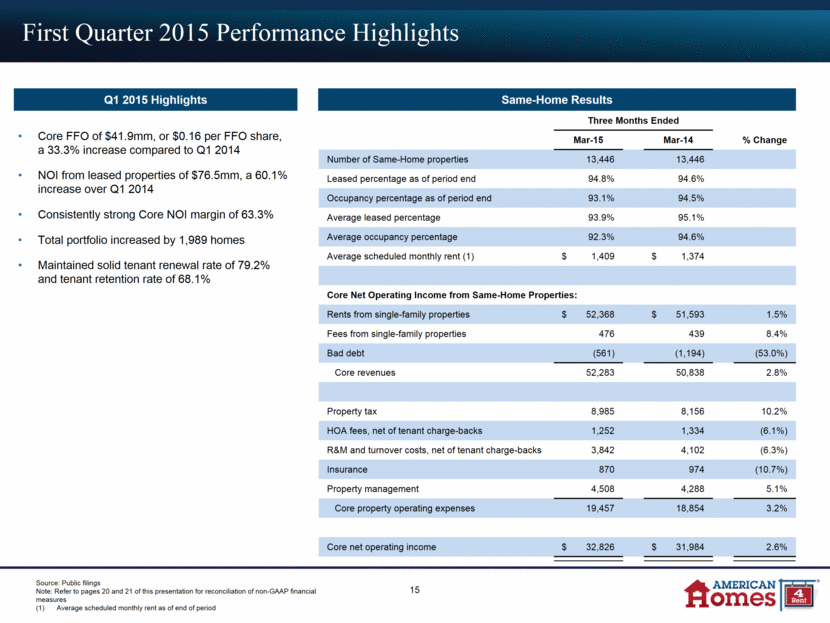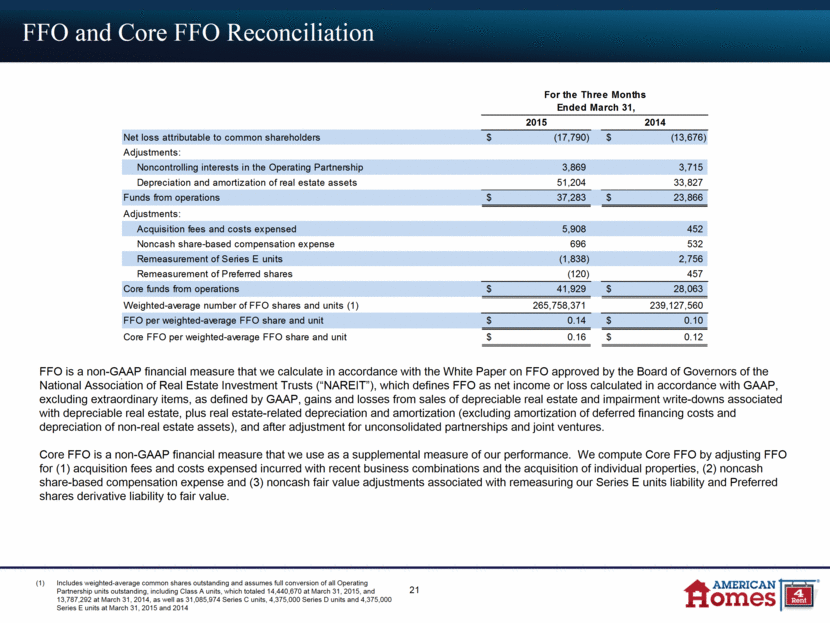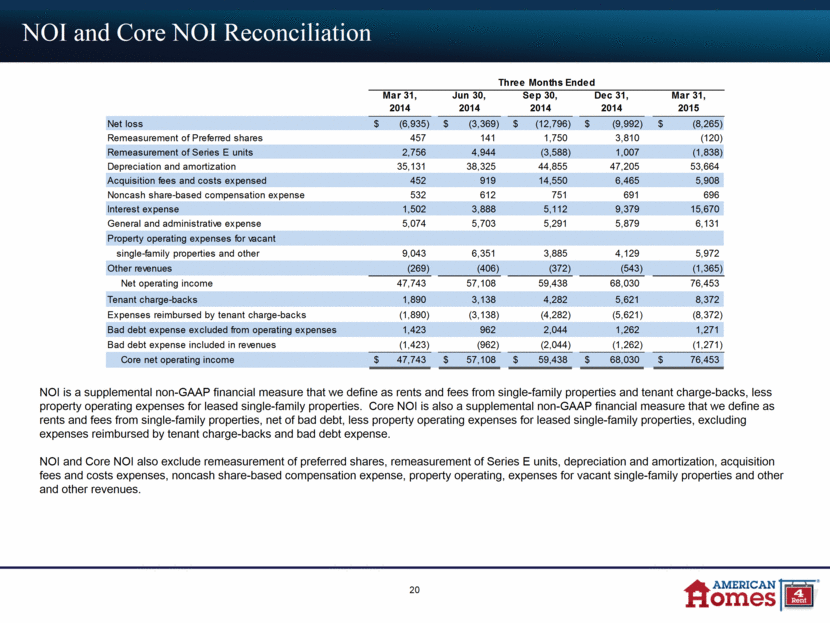
| NOI and Core NOI Reconciliation 20 NOI is a supplemental non-GAAP financial measure that we define as rents and fees from single-family properties and tenant charge-backs, less property operating expenses for leased single-family properties. Core NOI is also a supplemental non-GAAP financial measure that we define as rents and fees from single-family properties, net of bad debt, less property operating expenses for leased single-family properties, excluding expenses reimbursed by tenant charge-backs and bad debt expense. NOI and Core NOI also exclude remeasurement of preferred shares, remeasurement of Series E units, depreciation and amortization, acquisition fees and costs expenses, noncash share-based compensation expense, property operating, expenses for vacant single-family properties and other and other revenues. American Homes 4 Rent 2015 NOI and Core NOI Calculation Three Months Ended Three Months Ended Mar 31, 2014 Jun 30, 2014 Sep 30, 2014 Dec 31, 2014 Mar 31, 2015 Q1 v. Q4 Q1 v. PY Net Operating Income Rents from single-family properties $ 73,761 $ 88,871 $ 104,210 $ 109,543 $ 120,680 Fees from single-family properties 1,358 1,889 1,529 1,192 1,331 Tenant charge-backs 1,890 3,138 4,282 5,621 8,372 Total revenues from single-family properties 77,009 93,898 110,021 116,356 130,383 Leased property operating expenses 29,266 36,790 50,583 48,326 53,930 Net operating income $ 47,743 $ 57,108 $ 59,438 $ 68,030 $ 76,453 12.38% 60.13% Net operating income margin 62.0% 60.8% 54.0% 58.5% 58.6% Core Net Operating Income Rents from single-family properties $ 73,761 $ 88,871 $ 104,210 $ 109,543 $ 120,680 Fees from single-family properties 1,358 1,889 1,529 1,192 1,331 Bad debt expense (1,423) (962) (2,044) (1,262) (1,271) Core revenues from single-family properties 73,696 89,798 103,695 109,473 120,740 Leased property operating expenses 29,266 36,790 50,583 48,326 53,930 Expenses reimbursed by tenant charge-backs (1,890) (3,138) (4,282) (5,621) (8,372) Bad debt expense (1,423) (962) (2,044) (1,262) (1,271) Core property operating expenses 25,953 32,690 44,257 41,443 44,287 Core net operating income $ 47,743 $ 57,108 $ 59,438 $ 68,030 $ 76,453 Core net operating income margin 64.8% 63.6% 57.3% 62.1% 63.3% Three Months Ended Mar 31, 2014 Jun 30, 2014 Sep 30, 2014 Dec 31, 2014 Mar 31, 2015 Net loss $ (6,935) $ (3,369) $ (12,796) $ (9,992) $ (8,265) Remeasurement of Preferred shares 457 141 1,750 3,810 (120) Remeasurement of Series E units 2,756 4,944 (3,588) 1,007 (1,838) Depreciation and amortization 35,131 38,325 44,855 47,205 53,664 Acquisition fees and costs expensed 452 919 14,550 6,465 5,908 Noncash share-based compensation expense 532 612 751 691 696 Interest expense 1,502 3,888 5,112 9,379 15,670 General and administrative expense 5,074 5,703 5,291 5,879 6,131 Property operating expenses for vacant single-family properties and other 9,043 6,351 3,885 4,129 5,972 Other revenues (269) (406) (372) (543) (1,365) Net operating income 47,743 57,108 59,438 68,030 76,453 Tenant charge-backs 1,890 3,138 4,282 5,621 8,372 Expenses reimbursed by tenant charge-backs (1,890) (3,138) (4,282) (5,621) (8,372) Bad debt expense excluded from operating expenses 1,423 962 2,044 1,262 1,271 Bad debt expense included in revenues (1,423) (962) (2,044) (1,262) (1,271) Core net operating income $ 47,743 $ 57,108 $ 59,438 $ 68,030 $ 76,453 Average quarterly leased homes 18,997 18,997 24,763 25,807 29,717 Average quarterly homes in turn 640 700 700 700 700 |

