MS Margin 3.45 Text Margin 2.90 MS Margin 5.00 MS Margin 5.00 Footnote Margin 4.60 Colors FBR Sky 178 210 224 FBR Forest 0 72 70 FBR Cream 222 215 170 FBR Burgundy 110 0 50 FBR Silver 178 178 178 FBR Blue 5 5 80 FBR Sage 122 178 175 FBR Tan 184 155 104 FBR Brick 200 100 100 FBR Charcoal 51 51 51 FBR Steel 45 55 125 FBR Brown 87 61 17 Shading 234 234 234 3.65 3.10 2.70 2.90 2.20 3.00 3.85 May 2014

1 Disclaimer The information in this presentation has been prepared solely for informational purposes. “We,” “AMH,” “AH4R,” “the Company, ” “ the REIT,” “our” and “us” refer to American Homes 4 Rent, a Maryland real estate investment trust, and its subsidiaries taken as a whole. “AH L LC” refers to American Homes 4 Rent, LLC, a Delaware limited liability company formed by B. Wayne Hughes, our founder and chairman of our b oar d of trustees. AH LLC is our largest beneficial owner of our common shares (including units of our operating partnership, America n H omes 4 Rent, L.P., that are exchangeable for common shares) and performs our acquisition and renovation functions (including providing us wit h exclusive access to related personnel), which it will continue to perform until December 2014, at which time we have the option to hire AH LLC’s acquisition and renovation personnel. Various statements contained in this presentation, including those that express a belief, expectation or intention, as well a s t hose that are not statements of historical fact, are forward - looking statements. These forward - looking statements may include projections and esti mates concerning the timing and success of our strategies, plans or intentions. Forward - looking statements are generally accompanied by words suc h as “estimate,” “project,” “predict,” “believe,” “expect,” “intend,” “anticipate,” “potential,” “plan,” “goal” or other words that convey the un certainty of future events or outcomes. We have based these forward - looking statements on our current expectations and assumptions about future events. These assumptions include, among others, our projections and expectations regarding: market trends in the single - family home rental industry and i n the local markets where we operate, our ability to institutionalize a historically fragmented business model, our business strengths, our ideal te nant profile, the quality and location of our properties in attractive neighborhoods, the scale advantage of our national platform and the superiority of our operational infrastructure, the effectiveness of our investment philosophy and diversified acquisition strategy, our ability to create a cas h flow opportunity with attractive current yields and upside from increasing rents and cost efficiencies, our understanding of our competition and ge ner al economic, demographic and real estate conditions that may impact our business. While we consider these expectations and assumptions to be reasonable, they are inherently subject to significant business, economic, competitive, regulatory and other risks, contingencies and unc ert ainties, most of which are difficult to predict and many of which are beyond our control and could cause actual results to differ materially f rom any future results, performance or achievements expressed or implied by these forward - looking statements. Investors should not place undue reliance on these forward - looking statements, which speak only as of the date of this presentation. We undertake no obligation to update any forwa rd - looking statements to conform to actual results or changes in our expectations, unless required by applicable law. For a further desc rip tion of the risks and uncertainties that could cause actual results to differ from those expressed in these forward - looking statements, as well as ris ks relating to the business of the Company in general, see the “Risk Factors” disclosed in the Company’s Annual Report on Form 10 - K for the year en ded December 31, 2013 and the Company’s other filings with the Securities and Exchange Commission.

AMH Corporate Update 2

3 Large, Diversified Portfolio • 25 , 505 high quality homes as of March 31 , 2014 ( 26 , 018 as of April 30 , 2014 ) • 20 , 666 homes leased as of March 31 , 2014 ( 21 , 973 as of April 30 , 2014 ) • Properties in 22 states / 41 markets Strong Balance Sheet • Strong balance sheet with conservative approach to leverage • $4.2 billion total equity capitalization as of March 31, 2014 • $0.7 billion debt outstanding as of March 31, 2014 Differentiated Access to Capital • Largest publicly traded REIT in Single Family Rental space (NYSE: AMH) • IPO and concurrent private placement completed in August 2013, raising $887 million in capital • Completed over $400 million in preferred stock offerings in October 2013, December 2013 and May 2014 High Asset Quality • High - quality, well - located properties in attractive neighborhoods • Screen properties efficiently to ensure they meet AMH parameters Superior Operational Infrastructure • Well - developed national operating platform with local market expertise • Robust technology utilization – best in class call center and implementation of version “3.0” website Internal Corporate and Property Management • Aligned incentives and increased efficiency • Fully internalized asset and property management Experienced Management Team • Management team with a track record of successfully building and operating businesses in public markets Strong Alignment of Interest • Founder and senior management team hold approximately $1 billion of equity ownership American Homes 4 Rent Overview

AMH Business Strengths Tenant Driven Business • AMH targets properties that fit the following: • Traditional middle class neighborhoods in growing markets • Minimum 3 bedrooms, 2 bathrooms, two car garage • Newer properties in attractive neighborhoods Significant Scale Advantage • Well developed national operating platform provides for enhanced acquisition execution, lower renovation costs, operating efficiencies and increased brand awareness • Internalized management coupled with significant investment in technology further drives scale advantages "Cottage" Industry • Historical “mom & pop" landlord model • Current rent per square foot significantly below multi - family comparables • Potential opportunity to drive rents given quality and approach • Ability and expertise to streamline and control all aspects of the business model Favorable Asset Dynamics • Provides a natural hedge as the business plan works across market cycles • Efficient, disciplined and analytical buying strategy has allowed AMH to acquire a diversified portfolio of high quality homes • Ability to optimize cash flows as AMH institutionalizes asset class Strong Industry Trends • Largest real estate asset class with strong historical demand for rentals • Affordability and view of home ownership have changed coming out of downturn • Purchase price significantly below replacement cost providing downside protection • Significant cash flow opportunity with attractive current yields and upside from increasing rents and cost efficiencies 4

5 Investment Philosophy Focus on Tenant x Value created by finding the right tenant x Target tenants are families with children as this creates ties to the property given proximity to strong schools x S tronger schools are generally in newer neighborhoods x Long term price appreciation x Tenants likely to stay in property long - term Benefits Relative to Multi - family x Single family rentals have upside relative to multi - family rentals x Current AMH rents around $0.70 per square foot c ompares favorably to substantially higher multi - family rents in AMH markets x High potential to raise rents x Institutionalized a fragmented market x 14.7 million single family homes are currently rented by individuals 1 Downside Protection x Downside protection provided by acquisition basis relative to replacement cost and favorable market dynamics x Buying 20 - 30% below replacement cost provides downside protection x Replacement cost continues to increase maintaining acquisition discount American Homes 4 Rent has a unique approach to investing in single family properties that differentiates its portfolio from the competition (1) Source: Green Street Advisors, January 2014
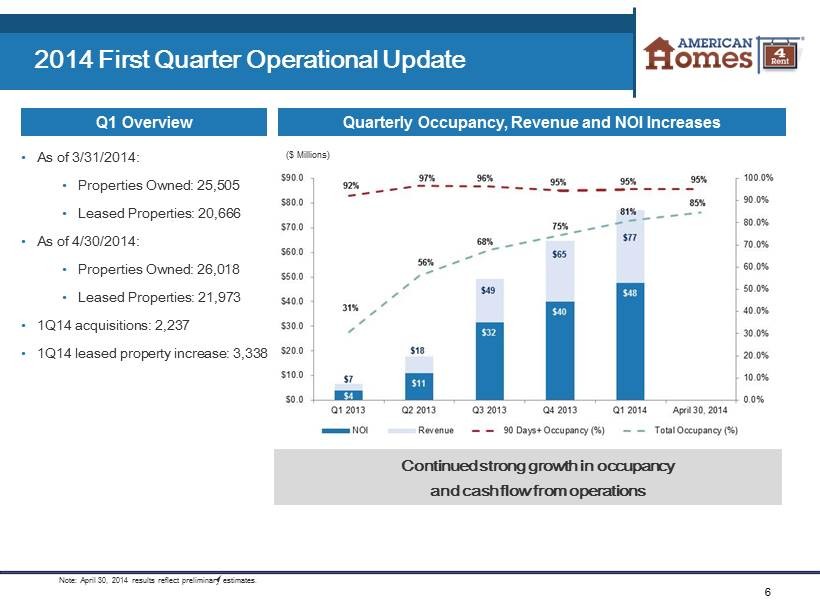
6 2014 First Quarter Operational Update Quarterly Occupancy, Revenue and NOI Increases Q1 Overview • As of 3/31/2014: • Properties Owned: 25,505 • Leased Properties: 20,666 • As of 4/30/2014: • Properties Owned: 26,018 • Leased Properties: 21,973 • 1Q14 acquisitions: 2,237 • 1Q14 leased property increase: 3,338 Continued strong growth in occupancy and cash flow from operations Note: April 30, 2014 results reflect preliminary estimates. ($ Millions)

7 First Quarter 2014 Performance Highlights • Revenues of $77.3 million, a 19.1% increase over fourth quarter of 2013 • Net Operating Income (NOI) from leased properties of $47.7 million, a 19.4% increase over fourth quarter 2013 • Acquired 2,237 properties, increasing total portfolio to 25,505 homes at March 31, 2014 • Properties rent - ready for more than 90 days were 95.1% leased at period end • Total properties owned were 81.0% occupied Quarterly Operating Overview (1) NOI is a supplemental non - GAAP financial measure that we define as rents and fees from single - family properties and tenant charg e - backs, less property operating expenses for leased single - family properties. (2) Core NOI used to calculate our Core NOI Margin is calculated as rents and fees from single - family properties, net of bad debt ex pense, less property operating expenses for leased single - family properties, excluding expenses reimbursed by tenant charge - backs and bad debt expense. Dec. 31, March 31, ($ Thousands, except per share data) 2013 2014 Operating Data Rents from single-family properties 61,843$ 73,761$ Total Revenues 64,890$ 77,278$ Leased Property Operating Expenses 24,470$ 29,266$ Net Operating Income 1 40,000$ 47,743$ Core NOI Margin 2 65.0% 64.8% Core Funds from Operations (Core FFO) 25,617$ 28,063$ Core FFO per FFO share 0.11$ 0.12$ G&A Expense Total Revenues (%) 5.7% 6.6% Annualized G&A Expense / Total Assets (%) 0.35% 0.45% For the Three Months Ended
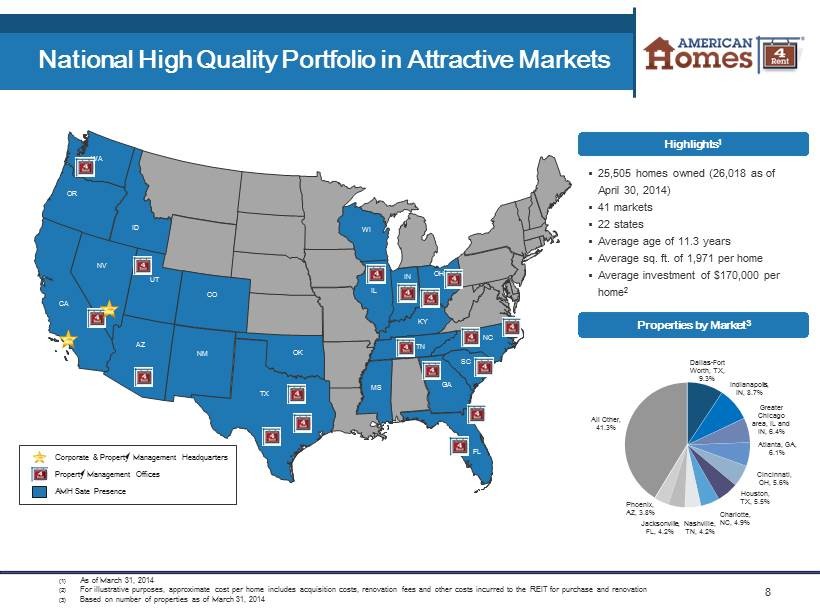
8 National High Quality Portfolio in Attractive Markets (1) As of March 31, 2014 (2) For illustrative purposes, approximate cost per home includes acquisition costs, renovation fees and other costs incurred to the REIT for purchase and renovation (3) Based on number of properties as of March 31, 2014 SC TN WA OR CA NV UT CO AZ TX IL IN OH GA FL SC TN NC KY Corporate & Property Management Headquarters Property Management Offices AMH Sate Presence OK WI ID NM MS ▪ 25,505 homes owned (26,018 as of April 30, 2014) ▪ 41 markets ▪ 22 states ▪ Average age of 11.3 years ▪ Average sq. ft. of 1,971 per home ▪ Average investment of $170,000 per home 2 Highlights 1 Properties by Market 3 Dallas - Fort Worth, TX, 9.3% Indianapolis, IN, 8.7% Greater Chicago area, IL and IN, 6.4% Atlanta, GA, 6.1% Cincinnati, OH, 5.6% Houston, TX, 5.5% Charlotte, NC, 4.9% Nashville, TN, 4.2% Jacksonville, FL, 4.2% Phoenix, AZ, 3.8% All Other, 41.3%

9 Favorable Operational Comparison to Multi - Family NOI Margin Comparison Occupancy Comparison • Renting primarily to families who desire high quality neighborhoods and school systems • 72% renewal rate for Q1 2014 • Current AMH rents of $0.70 per square foot provides superior value to renters and greater opportunity to increase rates Typical AMH Property Characteristics High Quality Tenant Characteristics • Average household income of approximately $85,000 • 4.95x Income / Rent • Average 2.0 adults per property • Average 1.2 children per property • Belief that higher quality tenants pay on time, stay longer and limit capital expenditures Note : Multi - Family REITs include AEC, AIV, AVB, BRE, CPT, EQR, ESS, HME, MAA, PPS, UDR, ACC, CCG and EDR. Single - Family Rental REITs i nclude AMH, SWAY, SBY and ARPI. Source: Public filings.
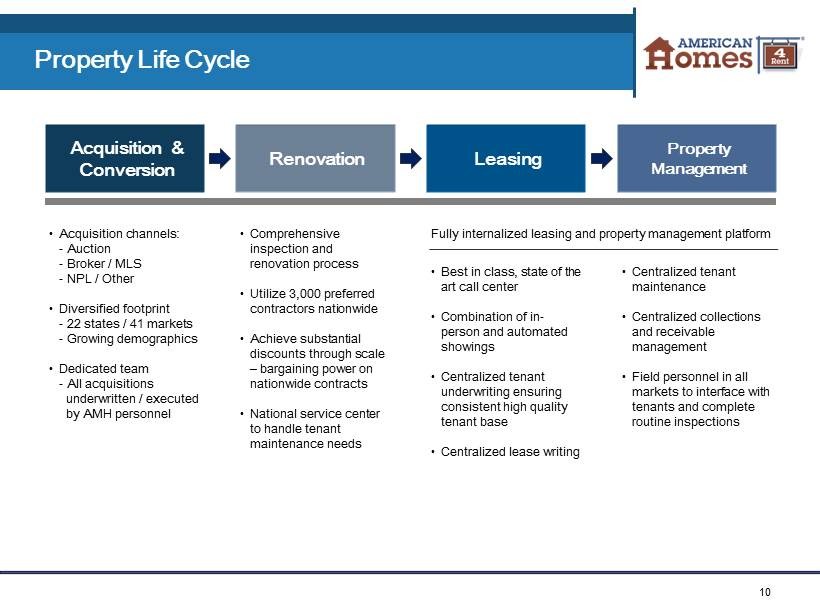
10 Property Life Cycle • Acquisition channels: - Auction - Broker / MLS - NPL / Other • Diversified footprint - 22 states / 41 markets - Growing demographics • Dedicated team - All acquisitions underwritten / executed by AMH personnel • Comprehensive inspection and renovation process • Utilize 3,000 preferred contractors nationwide • Achieve substantial discounts through scale – bargaining power on nationwide contracts • National service center to handle tenant maintenance needs • Best in class, state of the art call center • Combination of in - person and automated showings • Centralized tenant underwriting ensuring consistent high quality tenant base • Centralized lease writing • Centralized tenant maintenance • Centralized collections and receivable management • Field personnel in all markets to interface with tenants and complete routine inspections Acquisition & Conversion Renovation Leasing Property Management Fully internalized leasing and property management platform
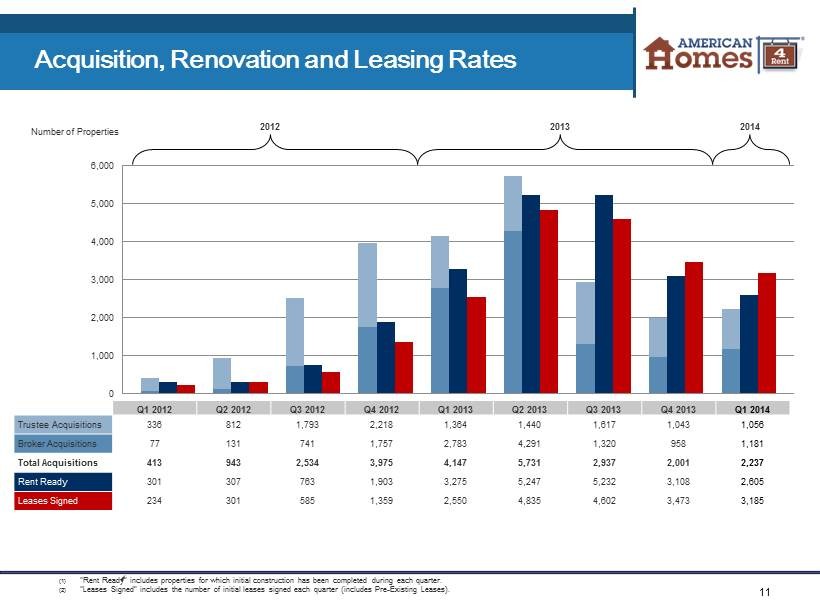
11 Acquisition, Renovation and Leasing Rates Number of Properties 2012 2013 2014 (1) “Rent Ready” includes properties for which initial construction has been completed during each quarter. (2) “Leases Signed” includes the number of initial leases signed each quarter (includes Pre - Existing Leases). 0 1,000 2,000 3,000 4,000 5,000 6,000 Q1 2012 Q2 2012 Q3 2012 Q4 2012 Q1 2013 Q2 2013 Q3 2013 Q4 2013 Q1 2014 Trustee Acquisitions 336 812 1,793 2,218 1,364 1,440 1,617 1,043 1,056 Broker Acquisitions 77 131 741 1,757 2,783 4,291 1,320 958 1,181 Total Acquisitions 413 943 2,534 3,975 4,147 5,731 2,937 2,001 2,237 Rent Ready 301 307 763 1,903 3,275 5,247 5,232 3,108 2,605 Leases Signed 234 301 585 1,359 2,550 4,835 4,602 3,473 3,185
Appendix 12
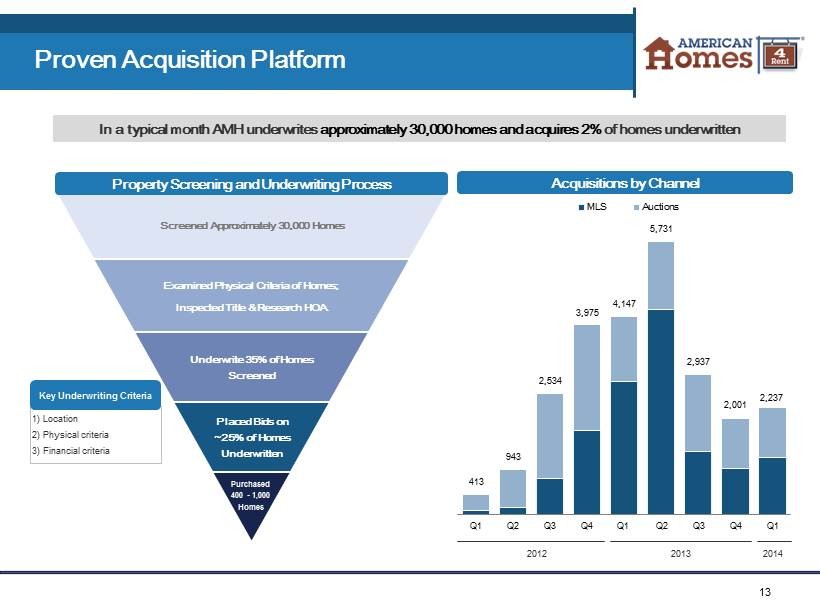
413 943 2,534 3,975 4,147 5,731 2,937 2,001 2,237 Q1 Q2 Q3 Q4 Q1 Q2 Q3 Q4 Q1 MLS Auctions 13 Proven Acquisition Platform Screened Approximately 30,000 Homes Examined Physical Criteria of Homes; Inspected Title & Research HOA Underwrite 35% of Homes Screened Placed Bids on ~25% of Homes Underwritten Purchased 400 - 1,000 Homes Property Screening and Underwriting Process Acquisitions by Channel 2012 In a typical month AMH underwrites approximately 30,000 homes and acquires 2% of homes underwritten Key Underwriting Criteria 1) Location 2) Physical criteria 3) Financial criteria 2013 2014

14 Market Leading Renovation Capabilities Standardized Renovation Process Homes Delivered Rent Ready per Quarter Before and After • Comprehensive inspection and renovation budgeting • Utilize over 3,000 preferred contractors nationwide • Achieve substantial discounts through scale - enabled bargaining power for nationwide contracts • Enables us to achieve underwritten renovation budget • Improves relationship with the local communities and HOAs, enhancing brand recognition and loyalty Illustrative Renovation Budget 1 Paint $2,400 $1.20 PSF Flooring $2,800 $1.40 PSF Appliances $1,800 Full Package Landscaping $1,500 Full Package Cleaning $500 $0.25 PSF General Repairs $7,500 $3.75 PSF Total Renovation Budget $16,500 $8.25 PSF (1) Budget based on a sample 3 bed, 2 bath 2,000 square - foot house. These budget figures are illustrative only and may not be indica tive of the renovation budget of the properties in our portfolio or properties we may acquire in the future. High quality products & control of process achieves better quality homes, which diminishes ongoing maintenance and turnover costs
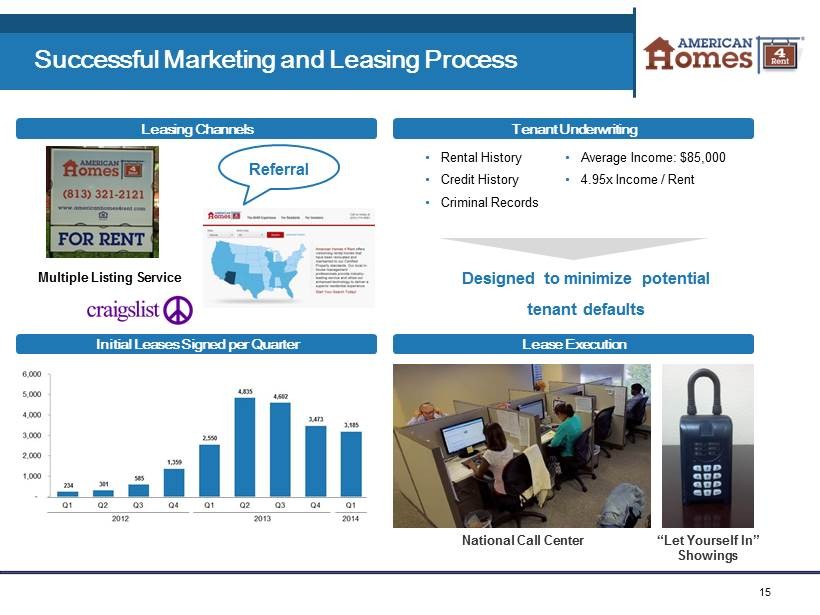
15 Successful Marketing and Leasing Process Tenant Underwriting Lease Execution 96.2% Leasing Channels Initial Leases Signed per Quarter Designed to minimize potential tenant defaults Multiple Listing Service Referral • Rental History • Credit History • Criminal Records • Average Income: $85,000 • 4.95x Income / Rent National Call Center “Let Yourself In” Showings

16 NOI and Core NOI Reconciliation NOI is a supplemental non - GAAP financial measure that we define as rents and fees from single - family properties and tenant charge - backs, less property operating expenses for leased single - family properties . Core NOI is also a supplemental non - GAAP financial measure that we define as rents and fees from single - family properties, net of bad debt expense, less property operating expenses for leased single - family properties, excluding expenses reimbursed by tenant charge - backs and bad debt expense . NOI and Core NOI also exclude income from discontinued operations, remeasurement of preferred shares, remeasurement of Series E units, gain on remeasurement of equity method investment, depreciation and amortization, acquisition fees and costs expensed, noncash share - based compensation expense, interest expense, advisory fees, general and administrative expense, property operating expenses for vacant single - family properties and other and other revenues For the Three Months Ended March 31, June 30, Sept. 30, Dec. 31, March 31, 2013 2013 2013 2013 2014 Net Operating Income Rents from single-family properties 6,495$ 17,020$ 47,364$ 61,843$ 73,761$ Fees from single-family properties 64 690 1,476 1,409 1,358 Tenant charge-backs - 47 323 1,218 1,890 Total revenues from single-family properties 6,559 17,757 49,163 64,470 77,009 Leased property operating expenses 2,503 6,859 17,579 24,470 29,266 Net operating income 4,056$ 10,898$ 31,584$ 40,000$ 47,743$ Net operating income margin 61.8% 61.4% 64.2% 62.0% 62.0% Core Net Operating Income Rents from single-family properties 6,495$ 17,020$ 47,364$ 61,843$ 73,761$ Fees from single-family properties 64 690 1,476 1,409 1,358 Bad debt expense (8) (100) (417) (1,748) (1,423) Core revenues from single-family properties 6,551 17,610 48,423 61,504 73,696 Leased property operating expenses 2,503 6,859 17,579 24,470 29,266 Expenses reimbursed by tenant charge-backs - (47) (323) (1,218) (1,890) Bad debt expense (8) (100) (417) (1,748) (1,423) Core property operating expenses 2,495 6,712 16,839 21,504 25,953 Core net operating income 4,056 10,898 31,584 40,000 47,743 Core net operating income margin 61.9% 61.9% 65.2% 65.0% 64.8%
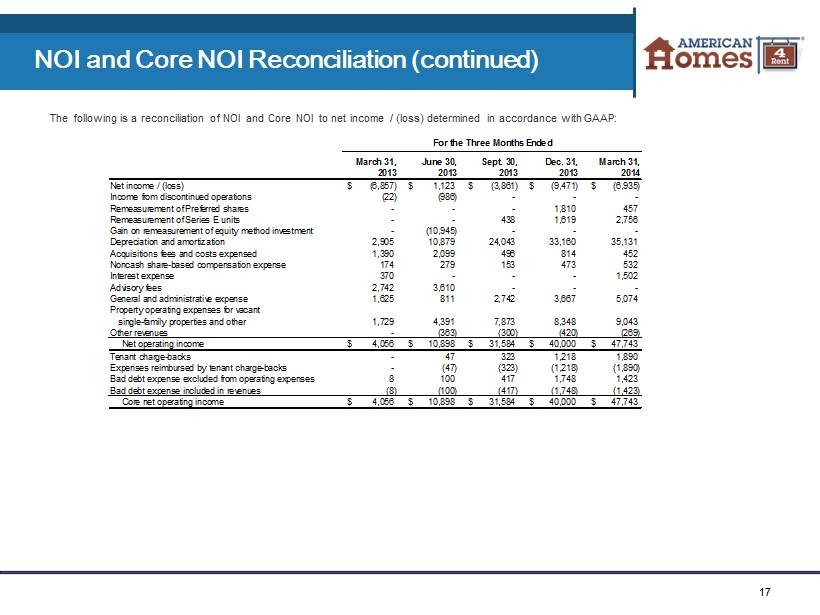
17 NOI and Core NOI Reconciliation (continued) The following is a reconciliation of NOI and Core NOI to net income / (loss) determined in accordance with GAAP : For the Three Months Ended March 31, June 30, Sept. 30, Dec. 31, March 31, 2013 2013 2013 2013 2014 Net income / (loss) (6,857)$ 1,123$ (3,861)$ (9,471)$ (6,935)$ Income from discontinued operations (22) (986) - - - Remeasurement of Preferred shares - - - 1,810 457 Remeasurement of Series E units - - 438 1,619 2,756 Gain on remeasurement of equity method investment - (10,945) - - - Depreciation and amortization 2,905 10,879 24,043 33,160 35,131 Acquisitions fees and costs expensed 1,390 2,099 496 814 452 Noncash share-based compensation expense 174 279 153 473 532 Interest expense 370 - - - 1,502 Advisory fees 2,742 3,610 - - - General and administrative expense 1,625 811 2,742 3,667 5,074 Property operating expenses for vacant single-family properties and other 1,729 4,391 7,873 8,348 9,043 Other revenues - (363) (300) (420) (269) Net operating income 4,056$ 10,898$ 31,584$ 40,000$ 47,743$ Tenant charge-backs - 47 323 1,218 1,890 Expenses reimbursed by tenant charge-backs - (47) (323) (1,218) (1,890) Bad debt expense excluded from operating expenses 8 100 417 1,748 1,423 Bad debt expense included in revenues (8) (100) (417) (1,748) (1,423) Core net operating income 4,056$ 10,898$ 31,584$ 40,000$ 47,743$

18 FFO and Core FFO Reconciliation The following is a reconciliation of net loss attributable to common shareholders to FFO and Core FFO for three months ended Dec ember 31, 2013 and March 31, 2014 (amounts in thousands, except share and per share information): We calculate FFO in accordance with the White Paper on FFO approved by the Board of Governors of the National Association of Real Estate Investment Trusts (“NAREIT”), which defines FFO as net income of loss calculated in accordance with Generally Accepted Accounting Principles (“GAAP”), excluding extraordinary items, as defined by GAAP, gains and losses from sales of depreciable real estate and impairment write - downs associated with depreciable real estate, plus real estate - related depreciation and amortization (excluding amortization of deferred financing costs and depreciation of non - real estate assets), and after adjustment for unconsolidated partnerships and joint ventures . Core FFO is a non - GAAP financial measure that we use as a supplemental measure of our performance . We compute Core FFO by adjusting FFO for ( 1 ) acquisition fees and costs expensed incurred with recent business combinations and the acquisition of properties with existing leases, ( 2 ) noncash share - based compensation expense and ( 3 ) noncash fair value adjustments associated with remeasuring our Series E units liability and Preferred shares derivative liability to fair value . (1) Includes quarterly weighted average common shares outstanding and assumes full conversion of all Operating Partnership units out standing, including 13,787,292 Class A units, 31,085,974 Series C units, 4,375,000 Series D units and 4,375,000 Series E units . Dec. 31, March 31, 2013 2014 Net loss attributable to common shareholders (14,519)$ (13,676)$ Adjustments: Noncontrolling interests in the Operating Partnership 3,718 3,715 Depreciation and amortization of real estate assets 31,702 33,827 Funds from operations 20,901$ 23,866$ Adjustments: Acquisition fees and costs expensed 814 452 Noncash share-based compensation expense 473 532 Remeasurement of Series E units 1,619 2,756 Remeasurement of Preferred shares 1,810 457 Core funds from operations 25,617$ 28,063$ Weighted average number of FFO shares (1) 239,122,332 239,127,560 FFO per weighted average FFO share 0.09$ 0.10$ Core FFO per weighted average FFO share 0.11$ 0.12$ For the Three Months Ended
MS Margin 3.45 Text Margin 2.90 MS Margin 5.00 MS Margin 5.00 Footnote Margin 4.60 Colors FBR Sky 178 210 224 FBR Forest 0 72 70 FBR Cream 222 215 170 FBR Burgundy 110 0 50 FBR Silver 178 178 178 FBR Blue 5 5 80 FBR Sage 122 178 175 FBR Tan 184 155 104 FBR Brick 200 100 100 FBR Charcoal 51 51 51 FBR Steel 45 55 125 FBR Brown 87 61 17 Shading 234 234 234 3.65 3.10 2.70 2.90 2.20 3.00 3.85