
Investor HighlightsNOVEMBER 2016
2 LEGAL DISCLOSURES Forward-Looking Statements Various statements contained in this presentation, including those that express a belief, expectation or intention, as well as those that are not statements of historical fact, are forward-looking statements. These forward-looking statements may include projections and estimates concerning the timing and success of our strategies, plans or intentions. Forward-looking statements are generally accompanied by words such as “estimate,” “project,” “predict,” “believe,” “expect,” “intend,” “anticipate,” “potential,” “plan,” “goal” or other words that convey the uncertainty of future events or outcomes. We have based these forward-looking statements on our current expectations and assumptions about future events. These assumptions include, among others, our projections and expectations regarding: market trends in the single-family home rental industry and in the local markets where we operate, our ability to institutionalize a historically fragmented business model, our business strengths, our ideal tenant profile, the quality and location of our properties in attractive neighborhoods, the scale advantage of our national platform and the superiority of our operational infrastructure, the effectiveness of our investment philosophy and diversified acquisition strategy, our ability to grow our portfolio and to create a cash flow opportunity with attractive current yields and upside from increasing rents and cost efficiencies and our understanding of our competition and general economic, demographic and real estate conditions that may impact our business. While we consider these expectations and assumptions to be reasonable, they are inherently subject to significant business, economic, competitive, regulatory and other risks, contingencies and uncertainties, most of which are difficult to predict and many of which are beyond our control and could cause actual results to differ materially from any future results, performance or achievements expressed or implied by these forward-looking statements. Investors should not place undue reliance on these forward-looking statements, which speak only as of the date of this presentation, November 14, 2016. We undertake no obligation to update any forward-looking statements to conform to actual results or changes in our expectations, unless required by applicable law. For a further description of the risks and uncertainties that could cause actual results to differ from those expressed in these forward-looking statements, as well as risks relating to the business of the Company in general, see the “Risk Factors” disclosed in the Company’s Annual Report for the year ended December 31, 2015 and the Company’s subsequent filings with the Securities and Exchange Commission. Non-GAAP Financial Measures This presentation includes certain financial measures that were not prepared in accordance with U.S. generally accepted accounting principles (GAAP) because we believe they help investors understand our performance. A reconciliation of those non-GAAP financial measures to the most directly comparable GAAP financial measures is provided in the Appendix of this presentation. Any non-GAAP financial measures presented are not, and should not be viewed as, substitutes for financial measures required by U.S. GAAP and may not be comparable to the calculation of similar measures of other companies.
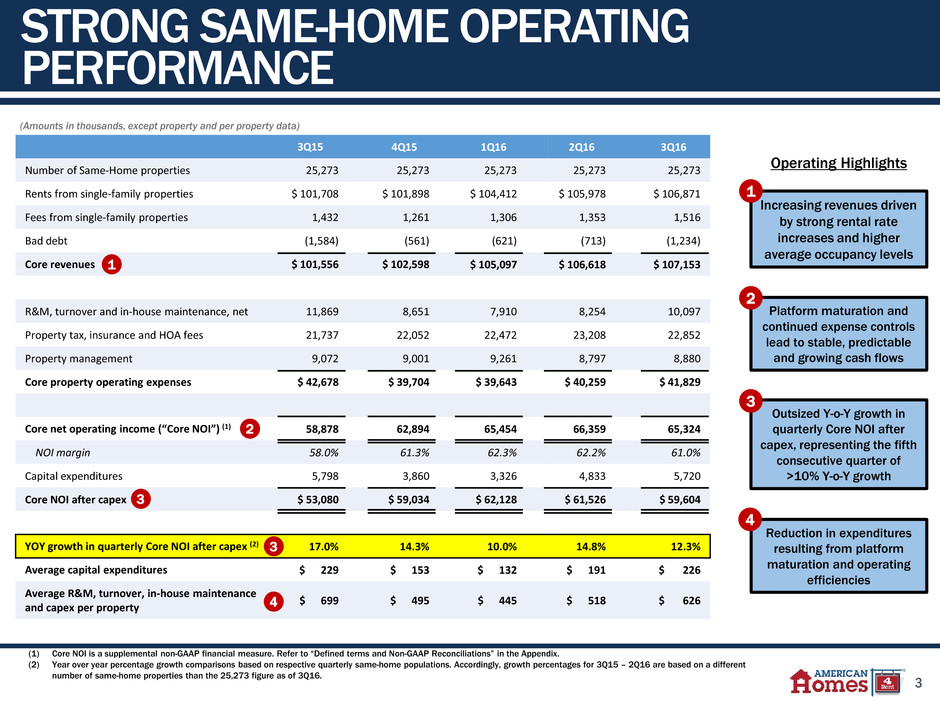
3 (1) Core NOI is a supplemental non-GAAP financial measure. Refer to “Defined terms and Non-GAAP Reconciliations” in the Appendix. (2) Year over year percentage growth comparisons based on respective quarterly same-home populations. Accordingly, growth percentages for 3Q15 – 2Q16 are based on a different number of same-home properties than the 25,273 figure as of 3Q16. STRONG SAME-HOME OPERATING PERFORMANCE Operating Highlights 3Q15 4Q15 1Q16 2Q16 3Q16 Number of Same-Home properties 25,273 25,273 25,273 25,273 25,273 Rents from single-family properties $ 101,708 $ 101,898 $ 104,412 $ 105,978 $ 106,871 Fees from single-family properties 1,432 1,261 1,306 1,353 1,516 Bad debt (1,584) (561) (621) (713) (1,234) Core revenues $ 101,556 $ 102,598 $ 105,097 $ 106,618 $ 107,153 R&M, turnover and in-house maintenance, net 11,869 8,651 7,910 8,254 10,097 Property tax, insurance and HOA fees 21,737 22,052 22,472 23,208 22,852 Property management 9,072 9,001 9,261 8,797 8,880 Core property operating expenses $ 42,678 $ 39,704 $ 39,643 $ 40,259 $ 41,829 Core net operating income (“Core NOI”) (1) 58,878 62,894 65,454 66,359 65,324 NOI margin 58.0% 61.3% 62.3% 62.2% 61.0% Capital expenditures 5,798 3,860 3,326 4,833 5,720 Core NOI after capex $ 53,080 $ 59,034 $ 62,128 $ 61,526 $ 59,604 YOY growth in quarterly Core NOI after capex (2) 17.0% 14.3% 10.0% 14.8% 12.3% Average capital expenditures $ 229 $ 153 $ 132 $ 191 $ 226 Average R&M, turnover, in-house maintenance and capex per property $ 699 $ 495 $ 445 $ 518 $ 626 (Amounts in thousands, except property and per property data) Increasing revenues driven by strong rental rate increases and higher average occupancy levels 1 Platform maturation and continued expense controls lead to stable, predictable and growing cash flows 2 Outsized Y-o-Y growth in quarterly Core NOI after capex, representing the fifth consecutive quarter of >10% Y-o-Y growth 3 Reduction in expenditures resulting from platform maturation and operating efficiencies 4 1 2 3 4 3

4 STABLE AND IMPROVING SAME-HOME OPERATING METRICS SAME-HOME Y-O-Y CORE REVENUE GROWTH SAME-HOME PERCENTAGE LEASED COMBINED MAINTENANCE AND CAPEX PER PROPERTY (2) Y-O-Y SAME-HOME CORE NOI AFTER CAPEX GROWTH Attractive Same-Home Core NOI growth due to strong revenue increases, operational efficiencies, and improving expense controls (1) Number of referenced Same-Home properties is applicable to each respective operating period reflected in other operating metrics on this page. (2) Includes average R&M and turnover costs, net of tenant charge-backs, in-house maintenance and capital expenditures per property. 5.2% 5.4% 6.6% 5.4% 5.5% 0% 2% 4% 6% 8% 10% Q3 2015 Q4 2015 Q1 2016 Q2 2016 Q3 2016 20,963 23,812 25,361 25,288 25,273 Number of Same-Home properties: (1) 95.2% 95.5% 96.9% 97.0% 95.9% 0% 25% 50% 75% 100% Q3 2015 Q4 2015 Q1 2016 Q2 2016 Q3 2016 $707 $501 $446 $518 $626 $0 $200 $400 $600 $800 $1,000 Q3 2015 Q4 2015 Q1 2016 Q2 2016 Q3 2016 (11%)Y-o-Y Same-Home percentage decrease: 17.0% 14.3% 10.0% 14.8% 12.3% 0% 5% 10% 15% 20% Q3 2015 Q4 2015 Q1 2016 Q2 2016 Q3 2016

5 STRONG GROWTH PROFILE SUPPORTED BY BEST-IN-CLASS EFFICIENCY CORE FUNDS FROM OPERATIONS ADJUSTED FUNDS FROM OPERATIONS NET DEBT TO ADJUSTED EBITDA BEST-IN-CLASS MANAGEMENT PLATFORM EFFICIENCY $30.0 $40.0 $50.0 $60.0 $70.0 $80.0 $90.0 Q3 2015 Q4 2015 Q1 2016 Q2 2016 Q3 2016 $0.21 $0.23 $0.25 $0.24 26.6%46.8%47.1%30.0% Y-o-Y Core FFO percentage increase: 23.7% (in m ill io ns ) $0.19 ( in m ill io ns ) 0.0 2.0 4.0 6.0 8.0 10.0 Q3 2015 Q4 2015 Q1 2016 Q2 2016 Q3 2016 7.4x 8.4x 6.2x 6.2x 8.8x 12% 12% 13% 13% 14% 14% 15% Q3 2015 Q4 2015 Q1 2016 Q2 2016 Q3 2016 14.2% 13.9% 14.3% 12.8% 12.7% $30.0 $40.0 $50.0 $60.0 $70.0 $80.0 $90.0 Q3 2015 Q4 2015 Q1 2016 Q2 2016 Q3 2016 $0.15 $0.18 $0.20 $0.21 $0.19 32.5% 36.1% 70.1% 76.5% 32.6% Y-o-Y AFFO percentage increase: (1) Core Funds from Operations, Adjusted Funds from Operations and Adjusted EBITDA are supplemental non-GAAP financial measures. Refer to “Defined terms and Non-GAAP Reconciliations” in the Appendix. (2) Core FFO and Adjusted FFO percentage increases are presented on a per FFO share and unit basis. (3) Total management costs as a percentage of revenues represents our management costs, including property management, general and administrative, and leasing costs, divided by total revenues excluding tenant charge-backs. To ta l m an ag em en t co st s as % o f r ev en ue s ( 3) (1) (2) (1) (2) (1)

6 Large, Diversified Portfolio (1) • 48,153 high-quality, well-located single-family properties in 22 states • Average age of properties of 13.5 years • Total leased percentage of 95.4% Strong Balance Sheet • Conservative approach to leverage • Total debt / Total market capitalization: 29.0%; Net debt / LQA Adjusted EBITDA: 6.2x • $781.3 million of liquidity Enhanced Access to Capital • Completed $498.8 million in perpetual preferred stock offerings in Q2 2016 • Obtained a new $1 billion credit agreement, comprised of a $650 million revolver and $350 million term loan, in August 2016 demonstrating the evolution of the Company's capital structure • Successfully executed registered offering of Class A common shares at $21.75 per share for gross proceeds of approximately $946 million for Alaska Permanent Fund • Ongoing focus on optimizing capital stack to reduce risk and the cost of capital Superior Operational Infrastructure • Well-developed, scalable national operating platform with local market expertise • Robust technology utilization – best-in-class call center and website Strong Alignment of Interest • Hughes family and senior management team own approximately $1.8 billion of common equity (4) Internal Corporate and Property Management • Aligned incentives and increased efficiency • Fully internalized asset and property management Experienced Management Team • Management team with a track record of successfully building and operating businesses in public markets AMERICAN HOMES 4 RENT HIGHLIGHTS (1) As of Sept. 30, 2016. Percentage leased and average age exclude 1,238 held for sale single-family properties. (2) Adjusted EBITDA is a supplemental non-GAAP financial measure. Refer to “Defined terms and Non-GAAP Reconciliations” in the Appendix. (3) Liquidity represents the sum of the cash on the balance sheet ($106 million), as of September 30, 2016, and the undrawn availability under the credit agreement ($675 million), with which the Company must remain in compliance to borrow under. (4) Based on closing stock price of $21.64 on September 30, 2016. Common equity includes common shares and operating partnership units that are convertible into common shares. Well-positioned to consolidate an attractive, fragmented business (2) (3)

7 AMH BUSINESS STRENGTHS Tenant Driven Business • AMH targets properties that fit an ideal tenant profile: • Traditional middle class neighborhoods in growing markets • Minimum 3 bedrooms, 2 bathrooms, two car garage • Newer properties in attractive neighborhoods Significant Scale Advantage • Well developed national operating platform provides for enhanced acquisition execution, lower renovation costs, operating efficiencies and increased brand awareness • Internalized management coupled with significant investment in technology further drives scale advantages “Cottage” Industry • Historical “mom & pop” landlord model • Current rent per square foot significantly below multi-family comparables • Potential opportunity to drive rents given quality and institutional approach • Ability and expertise to streamline and control all aspects of the business model Favorable Asset Dynamics • Efficient, disciplined and analytical buying strategy has allowed AMH to acquire a diversified portfolio of high quality homes • Ability to optimize cash flows as AMH institutionalizes asset class Strong Industry Trends • Largest real estate asset class with strong historical demand for rentals • Affordability and view of home ownership have changed coming out of downturn • Significant cash flow opportunity with attractive current yields and upside from increasing rents and cost efficiencies
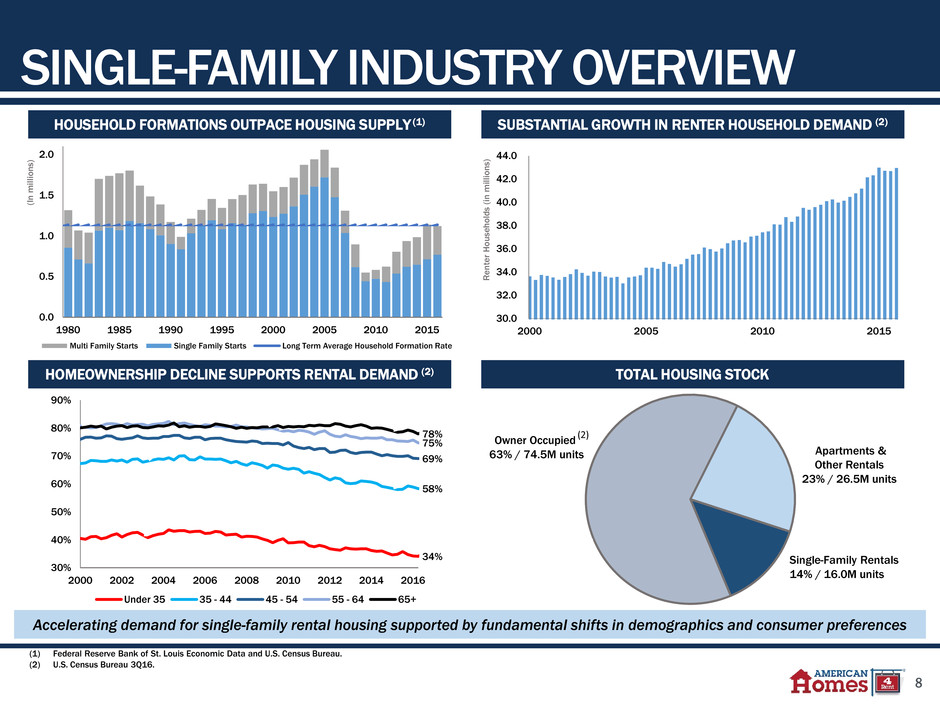
8 Owner Occupied 63% / 74.5M units Apartments & Other Rentals 23% / 26.5M units TOTAL HOUSING STOCK SUBSTANTIAL GROWTH IN RENTER HOUSEHOLD DEMAND (2)HOUSEHOLD FORMATIONS OUTPACE HOUSING SUPPLY (1) 34% 58% 69% 75% 78% 30% 40% 50% 60% 70% 80% 90% 2000 2002 2004 2006 2008 2010 2012 2014 2016 Under 35 35 - 44 45 - 54 55 - 64 65+ 0.0 0.5 1.0 1.5 2.0 1980 1985 1990 1995 2000 2005 2010 2015 Multi Family Starts Single Family Starts Long Term Average Household Formation Rate (In m ill io ns ) Single-Family Rentals 14% / 16.0M units (1) Federal Reserve Bank of St. Louis Economic Data and U.S. Census Bureau. (2) U.S. Census Bureau 3Q16. R en te r H ou se ho ld s (in m ill io ns ) SINGLE-FAMILY INDUSTRY OVERVIEW HOMEOWNERSHIP DECLINE SUPPORTS RENTAL DEMAND (2) 30.0 32.0 34.0 36.0 38.0 40.0 42.0 44.0 2000 2005 2010 2015 Accelerating demand for single-family rental housing supported by fundamental shifts in demographics and consumer preferences (2)
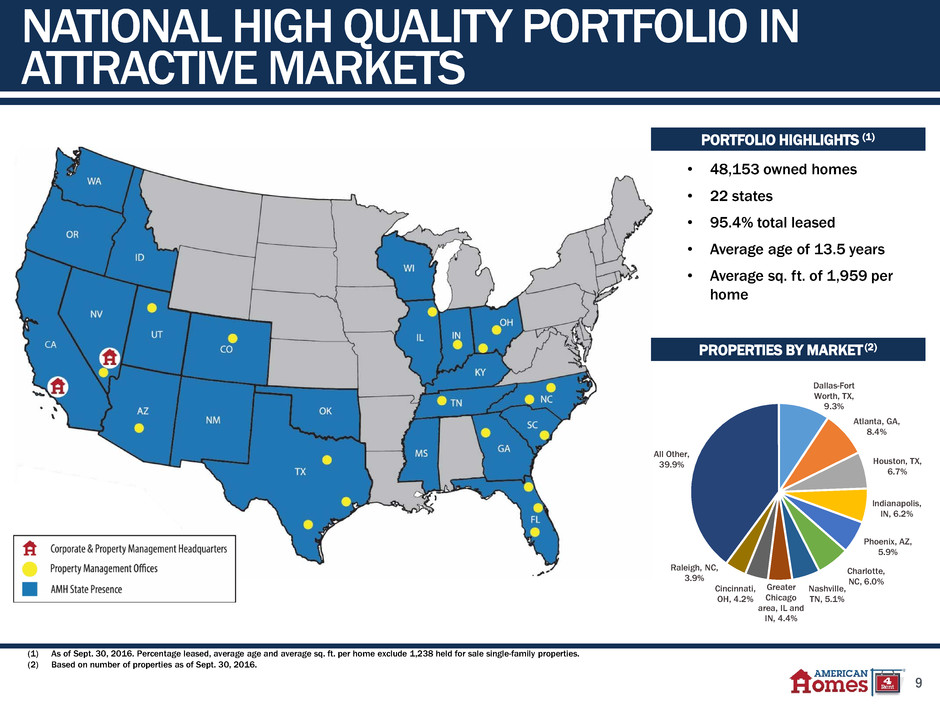
9 NATIONAL HIGH QUALITY PORTFOLIO IN ATTRACTIVE MARKETS (1) As of Sept. 30, 2016. Percentage leased, average age and average sq. ft. per home exclude 1,238 held for sale single-family properties. (2) Based on number of properties as of Sept. 30, 2016. Dallas-Fort Worth, TX, 9.3% Atlanta, GA, 8.4% Houston, TX, 6.7% Indianapolis, IN, 6.2% Phoenix, AZ, 5.9% Charlotte, NC, 6.0% Nashville, TN, 5.1% Greater Chicago area, IL and IN, 4.4% Cincinnati, OH, 4.2% Raleigh, NC, 3.9% All Other, 39.9% • 48,153 owned homes • 22 states • 95.4% total leased • Average age of 13.5 years • Average sq. ft. of 1,959 per home PORTFOLIO HIGHLIGHTS (1) PROPERTIES BY MARKET (2)
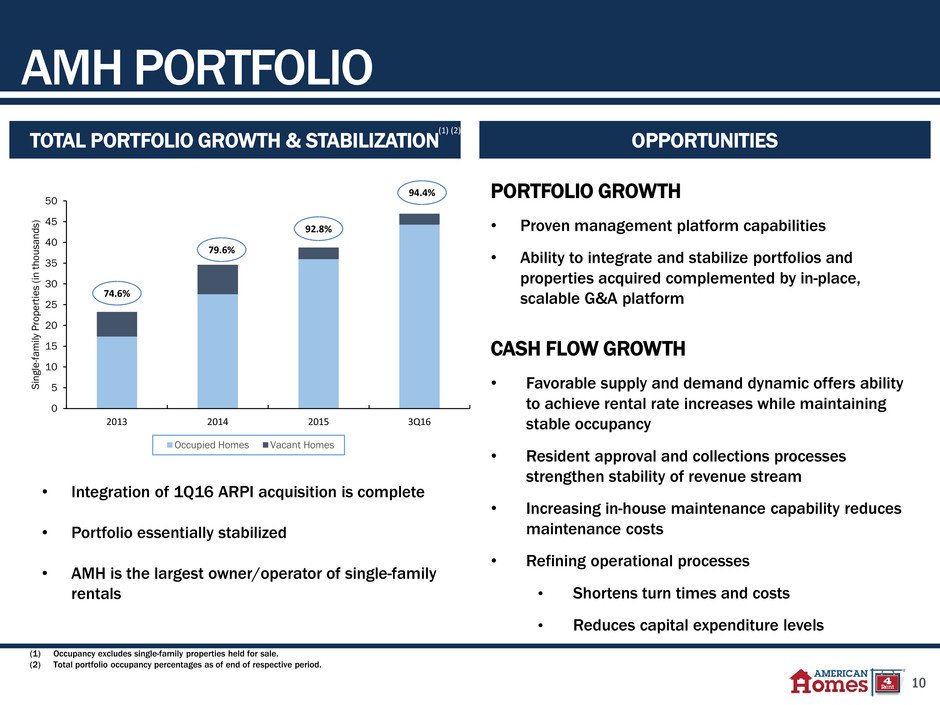
10 OPPORTUNITIES • Integration of 1Q16 ARPI acquisition is complete • Portfolio essentially stabilized • AMH is the largest owner/operator of single-family rentals TOTAL PORTFOLIO GROWTH & STABILIZATION PORTFOLIO GROWTH • Proven management platform capabilities • Ability to integrate and stabilize portfolios and properties acquired complemented by in-place, scalable G&A platform CASH FLOW GROWTH • Favorable supply and demand dynamic offers ability to achieve rental rate increases while maintaining stable occupancy • Resident approval and collections processes strengthen stability of revenue stream • Increasing in-house maintenance capability reduces maintenance costs • Refining operational processes • Shortens turn times and costs • Reduces capital expenditure levels AMH PORTFOLIO (1) Occupancy excludes single-family properties held for sale. (2) Total portfolio occupancy percentages as of end of respective period. 74.6% 79.6% 92.8% 94.4% 0 5 10 15 20 25 30 35 40 45 50 2013 2014 2015 3Q16 Si ng le -fa m ily P ro pe rt ie s (in th ou sa nd s) Occupied Homes Vacant Homes (1) (2)
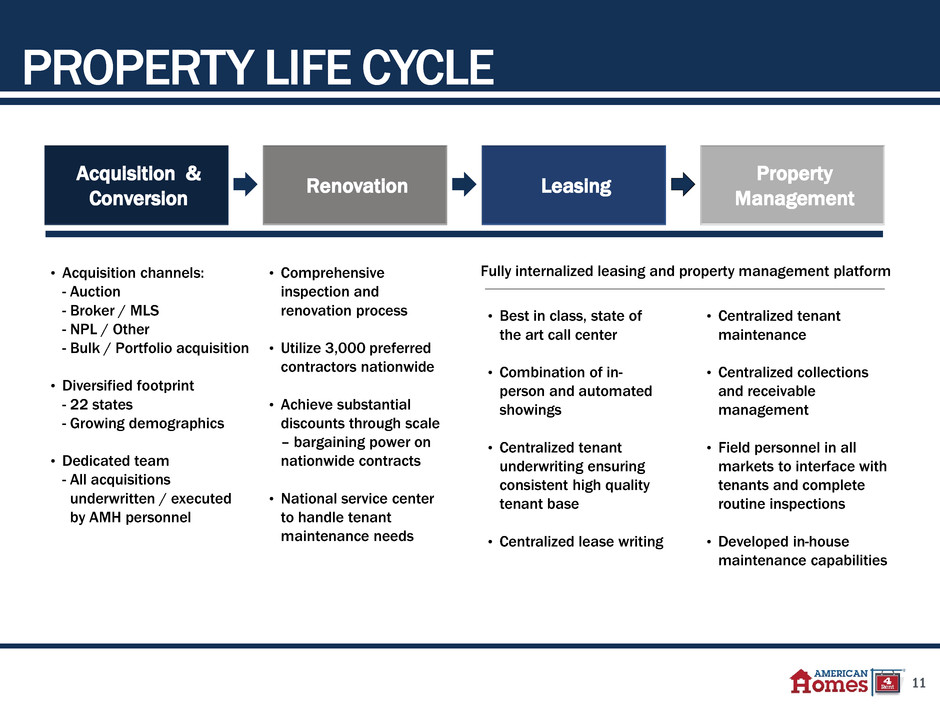
11 PROPERTY LIFE CYCLE • Acquisition channels: - Auction - Broker / MLS - NPL / Other - Bulk / Portfolio acquisition • Diversified footprint - 22 states - Growing demographics • Dedicated team - All acquisitions underwritten / executed by AMH personnel • Comprehensive inspection and renovation process • Utilize 3,000 preferred contractors nationwide • Achieve substantial discounts through scale – bargaining power on nationwide contracts • National service center to handle tenant maintenance needs • Best in class, state of the art call center • Combination of in- person and automated showings • Centralized tenant underwriting ensuring consistent high quality tenant base • Centralized lease writing • Centralized tenant maintenance • Centralized collections and receivable management • Field personnel in all markets to interface with tenants and complete routine inspections • Developed in-house maintenance capabilities Acquisition & Conversion Renovation Leasing Fully internalized leasing and property management platform Property Management
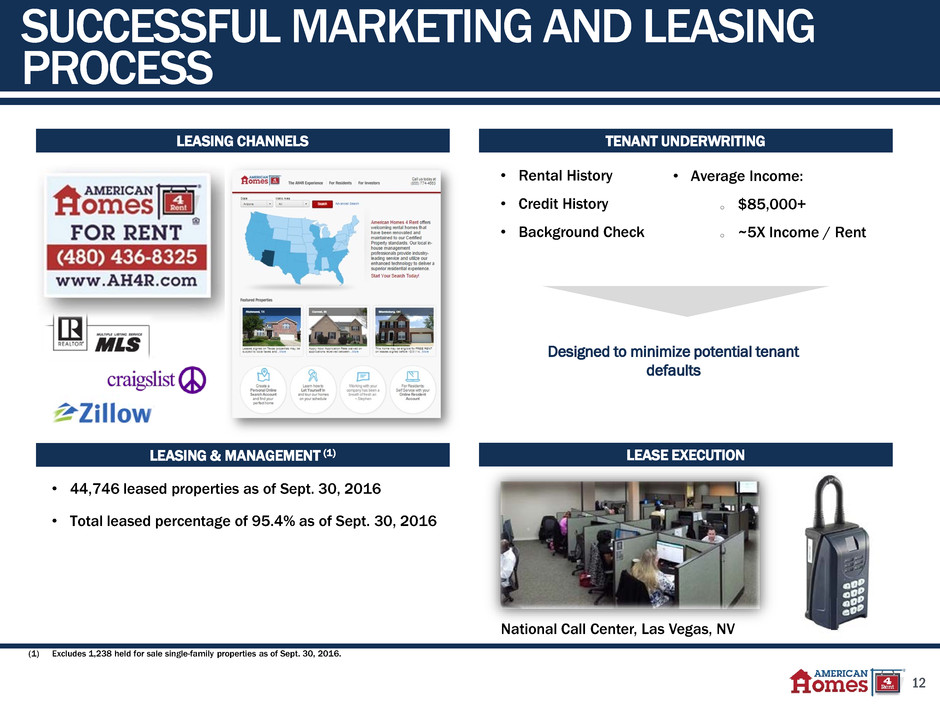
12 LEASE EXECUTION TENANT UNDERWRITING LEASING & MANAGEMENT (1) LEASING CHANNELS • Rental History • Credit History • Background Check • Average Income: o $85,000+ o ~5X Income / Rent National Call Center, Las Vegas, NV Designed to minimize potential tenant defaults • 44,746 leased properties as of Sept. 30, 2016 • Total leased percentage of 95.4% as of Sept. 30, 2016 SUCCESSFUL MARKETING AND LEASING PROCESS (1) Excludes 1,238 held for sale single-family properties as of Sept. 30, 2016.

13 PROACTIVE MAINTENANCEMAINTENANCE • Completed property management internalization in Q4 2013 • Centralized management functions provide consistency and efficiency of execution • In-house maintenance program provides enhanced customer service and efficiencies in portfolio maintenance in markets comprising approximately 90% of homes • Service center in Las Vegas handles all incoming maintenance calls • Tenants can either call the service center, contact the property manager, or make requests online • AMH personnel troubleshoot, assign and oversee performance of maintenance work utilizing local preferred vendors and in-house maintenance personnel • Extensive walkthroughs with tenants prior to occupancy • HOA requirement is another line of defense to ensure property is being maintained to standards • Utilize in-house maintenance visits to informally inspect occupied homes STRONG PROPERTY MANAGEMENT ENSURES TENANT SATISFACTION AND CONTINUING ASSET QUALITY IN-HOUSE MAINTENANCE • Reduces maintenance costs • Speeds up turn times • Provides enhanced customer service
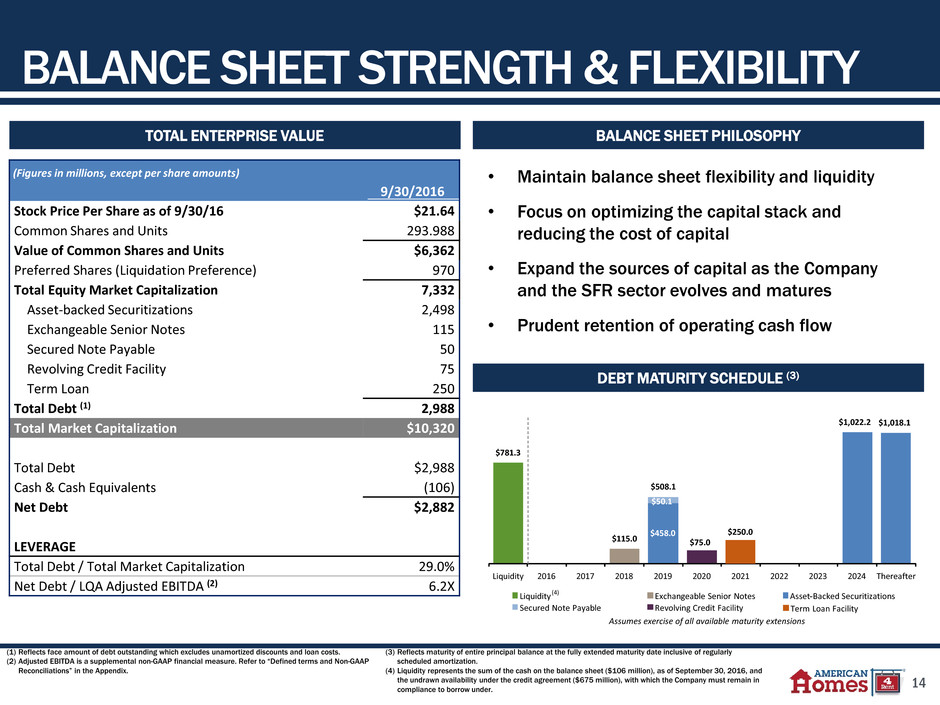
14 Stock Price Per Share as of 9/30/16 $21.64 Common Shares and Units 293.988 Value of Common Shares and Units $6,362 Preferred Shares (Liquidation Preference) 970 Total Equity Market Capitalization 7,332 Asset-backed Securitizations 2,498 Exchangeable Senior Notes 115 Secured Note Payable 50 Revolving Credit Facility 75 Term Loan 250 Total Debt (1) 2,988 Total Market Capitalization $10,320 Total Debt $2,988 Cash & Cash Equivalents (106) Net Debt $2,882 LEVERAGE Total Debt / Total Market Capitalization 29.0% Net Debt / LQA Adjusted EBITDA (2) 6.2X • Maintain balance sheet flexibility and liquidity • Focus on optimizing the capital stack and reducing the cost of capital • Expand the sources of capital as the Company and the SFR sector evolves and matures • Prudent retention of operating cash flow TOTAL ENTERPRISE VALUE BALANCE SHEET STRENGTH & FLEXIBILITY (1) Reflects face amount of debt outstanding which excludes unamortized discounts and loan costs. (2) Adjusted EBITDA is a supplemental non-GAAP financial measure. Refer to “Defined terms and Non-GAAP Reconciliations” in the Appendix. (3) Reflects maturity of entire principal balance at the fully extended maturity date inclusive of regularly scheduled amortization. (4) Liquidity represents the sum of the cash on the balance sheet ($106 million), as of September 30, 2016, and the undrawn availability under the credit agreement ($675 million), with which the Company must remain in compliance to borrow under. BALANCE SHEET PHILOSOPHY DEBT MATURITY SCHEDULE (3) (Figures in millions, except per share amounts) 9/30/2016 $458.0 $50.1 $781.3 $115.0 $508.1 $75.0 $1,022.2 $1,018.1 Liquidity 2016 2017 2018 2019 2020 2021 2022 2023 2024 Thereafter Liquidity Exchangeable Senior Notes Asset-Backed Securitizations Secured Note Payable Revolving Credit Facility (4) Assumes exercise of all available maturity extensions Term Loan Facility $250.0

15 APPENDIX

16 (1) Excludes 1,238 held for sale single-family properties as of September 30, 2016. (2) Represents 22 markets in 16 states. Highlights(1) Market Gross Book Value ($mm) % of Gross Book Value Number of Single-Family Properties (1) % of Total Single-Family Properties Avg. Gross Book Value per Property Avg. Sq. Ft. Avg. Age (years) Dallas-Fort Worth, TX 700.4$ 8.6% 4,340 9.3% 161,389$ 2,121 12.9 Atlanta, GA 645.7 7.9% 3,950 8.4% 163,473 2,109 15.7 Houston, TX 511.7 6.3% 3,153 6.7% 162,284 2,113 10.9 Indianapolis, IN 438.0 5.4% 2,901 6.2% 150,993 1,933 14.0 Phoenix, AZ 447.8 5.5% 2,776 5.9% 161,315 1,813 14.0 Charlotte, NC 485.4 6.0% 2,800 6.0% 173,351 2,024 13.3 Nashvil le, TN 469.3 5.8% 2,381 5.1% 197,101 2,087 12.3 Greater Chicago area, IL and IN 369.0 4.5% 2,047 4.4% 180,248 1,897 15.1 Cincinnati, OH 335.5 4.1% 1,952 4.2% 171,867 1,846 14.4 Raleigh, NC 321.4 3.9% 1,828 3.9% 175,832 1,845 12.0 Tampa, FL 322.3 4.0% 1,729 3.7% 186,436 1,954 13.0 Jacksonvil le, FL 254.6 3.1% 1,659 3.5% 153,475 1,902 12.7 Orlando, FL 263.6 3.2% 1,557 3.3% 169,292 1,871 15.4 Columbus, OH 230.8 2.8% 1,500 3.2% 153,856 1,830 15.2 Salt Lake City, UT 230.7 2.8% 1,048 2.2% 220,135 2,131 15.4 Las Vegas, NV 178.4 2.2% 1,023 2.2% 174,412 1,841 13.7 San Antonio, TX 155.5 1.9% 1,003 2.1% 155,029 2,010 13.6 Winston Salem, NC 113.5 1.4% 761 1.6% 149,141 1,729 12.8 Austin, TX 105.2 1.3% 695 1.5% 151,326 1,850 12.4 Charleston, SC 129.9 1.6% 725 1.5% 179,239 1,862 10.7 All Other (2) 1,437.0 17.7% 7,087 15.1% 187,893 1,874 13.4 Total / Average 8,145.7$ 100.0% 46,915 100.0% 171,382$ 1,959 13.5 TOP 20 MARKETS SUMMARY
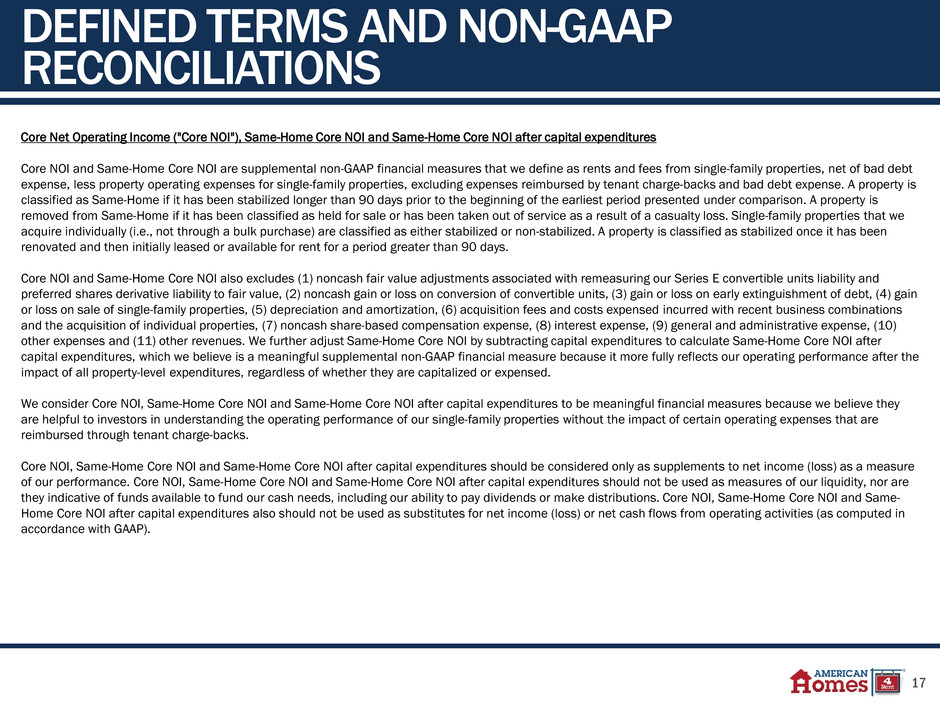
17 Highlights(1) DEFINED TERMS AND NON-GAAP RECONCILIATIONS Core Net Operating Income ("Core NOI"), Same-Home Core NOI and Same-Home Core NOI after capital expenditures Core NOI and Same-Home Core NOI are supplemental non-GAAP financial measures that we define as rents and fees from single-family properties, net of bad debt expense, less property operating expenses for single-family properties, excluding expenses reimbursed by tenant charge-backs and bad debt expense. A property is classified as Same-Home if it has been stabilized longer than 90 days prior to the beginning of the earliest period presented under comparison. A property is removed from Same-Home if it has been classified as held for sale or has been taken out of service as a result of a casualty loss. Single-family properties that we acquire individually (i.e., not through a bulk purchase) are classified as either stabilized or non-stabilized. A property is classified as stabilized once it has been renovated and then initially leased or available for rent for a period greater than 90 days. Core NOI and Same-Home Core NOI also excludes (1) noncash fair value adjustments associated with remeasuring our Series E convertible units liability and preferred shares derivative liability to fair value, (2) noncash gain or loss on conversion of convertible units, (3) gain or loss on early extinguishment of debt, (4) gain or loss on sale of single-family properties, (5) depreciation and amortization, (6) acquisition fees and costs expensed incurred with recent business combinations and the acquisition of individual properties, (7) noncash share-based compensation expense, (8) interest expense, (9) general and administrative expense, (10) other expenses and (11) other revenues. We further adjust Same-Home Core NOI by subtracting capital expenditures to calculate Same-Home Core NOI after capital expenditures, which we believe is a meaningful supplemental non-GAAP financial measure because it more fully reflects our operating performance after the impact of all property-level expenditures, regardless of whether they are capitalized or expensed. We consider Core NOI, Same-Home Core NOI and Same-Home Core NOI after capital expenditures to be meaningful financial measures because we believe they are helpful to investors in understanding the operating performance of our single-family properties without the impact of certain operating expenses that are reimbursed through tenant charge-backs. Core NOI, Same-Home Core NOI and Same-Home Core NOI after capital expenditures should be considered only as supplements to net income (loss) as a measure of our performance. Core NOI, Same-Home Core NOI and Same-Home Core NOI after capital expenditures should not be used as measures of our liquidity, nor are they indicative of funds available to fund our cash needs, including our ability to pay dividends or make distributions. Core NOI, Same-Home Core NOI and Same- Home Core NOI after capital expenditures also should not be used as substitutes for net income (loss) or net cash flows from operating activities (as computed in accordance with GAAP).
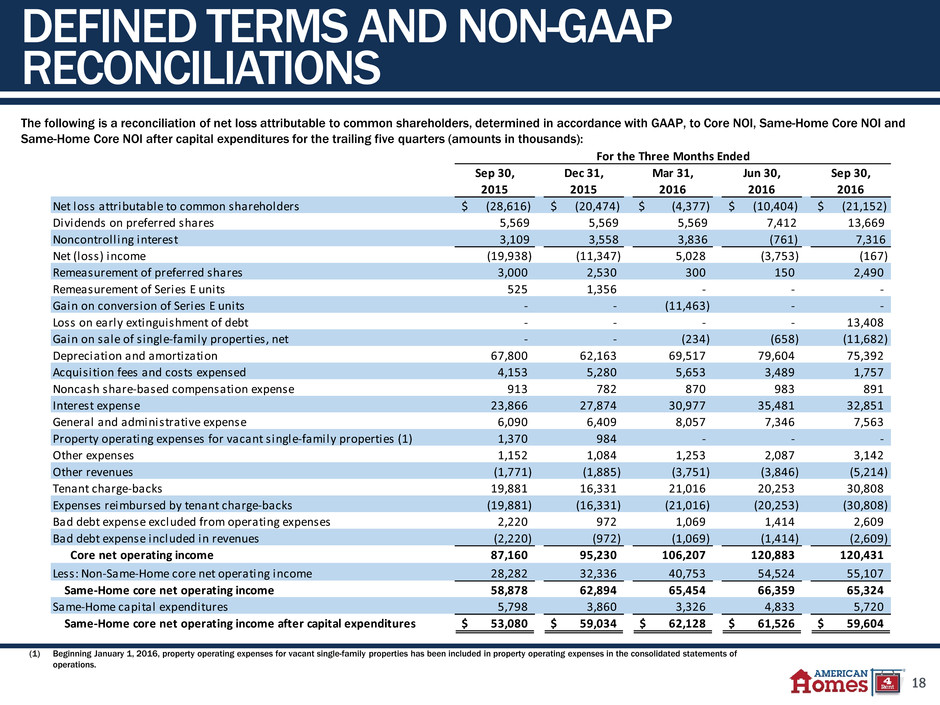
18 Sep 30, 2015 Dec 31, 2015 Mar 31, 2016 Jun 30, 2016 Sep 30, 2016 Net loss attributable to common shareholders $ (28,616) $ (20,474) $ (4,377) $ (10,404) $ (21,152) Dividends on preferred shares 5,569 5,569 5,569 7,412 13,669 Noncontroll ing interest 3,109 3,558 3,836 (761) 7,316 Net (loss) income (19,938) (11,347) 5,028 (3,753) (167) Remeasurement of preferred shares 3,000 2,530 300 150 2,490 Remeasurement of Series E units 525 1,356 - - - Gain on conversion of Series E units - - (11,463) - - Loss on early extinguishment of debt - - - - 13,408 Gain on sale of single-family properties, net - - (234) (658) (11,682) Depreciation and amortization 67,800 62,163 69,517 79,604 75,392 Acquisition fees and costs expensed 4,153 5,280 5,653 3,489 1,757 913 782 870 983 891 Interest expense 23,866 27,874 30,977 35,481 32,851 General and administrative expense 6,090 6,409 8,057 7,346 7,563 Property operating expenses for vacant single-family properties (1) 1,370 984 - - - Other expenses 1,152 1,084 1,253 2,087 3,142 Other revenues (1,771) (1,885) (3,751) (3,846) (5,214) Tenant charge-backs 19,881 16,331 21,016 20,253 30,808 (19,881) (16,331) (21,016) (20,253) (30,808) 2,220 972 1,069 1,414 2,609 (2,220) (972) (1,069) (1,414) (2,609) Core net operating income 87,160 95,230 106,207 120,883 120,431 Less: Non-Same-Home core net operating income 28,282 32,336 40,753 54,524 55,107 Same-Home core net operating income 58,878 62,894 65,454 66,359 65,324 Same-Home capital expenditures 5,798 3,860 3,326 4,833 5,720 Same-Home core net operating income after capital expenditures 53,080$ 59,034$ 62,128$ 61,526$ 59,604$ Noncash share-based compensation expense Expenses reimbursed by tenant charge-backs Bad debt expense excluded from operating expenses Bad debt expense included in revenues For the Three Months Ended (1) Beginning January 1, 2016, property operating expenses for vacant single-family properties has been included in property operating expenses in the consolidated statements of operations. Highlights(1) DEFINED TERMS AND NON-GAAP RECONCILIATIONS The following is a reconciliation of net loss attributable to common shareholders, determined in accordance with GAAP, to Core NOI, Same-Home Core NOI and Same-Home Core NOI after capital expenditures for the trailing five quarters (amounts in thousands):

19 Sep 30, 2015 Dec 31, 2015 Mar 31, 2016 Jun 30, 2016 Sep 30, 2016 Net loss attributable to common shareholders (28,616)$ (20,474)$ (4,377)$ (10,404)$ (21,152)$ Dividends on preferred shares 5,569 5,569 5,569 7,412 13,669 Noncontroll ing interest 3,109 3,558 3,836 (761) 7,316 Net (loss) income (19,938) (11,347) 5,028 (3,753) (167) Interest expense 23,866 27,874 30,977 35,481 32,851 Depreciation and amortization 67,800 62,163 69,517 79,604 75,392 EBITDA 71,728 78,690 105,522 111,332 108,076 Noncash share-based compensation expense 913 782 870 983 891 Acquisition fees and costs expensed 4,153 5,280 5,653 3,489 1,757 (Gain) loss on sale / impairment of single-family properties, net - - (60) 68 (11,115) Loss on early extinguishment of debt - - - - 13,408 Gain on conversion of Series E units - - (11,463) - - Remeasurement of Series E units 525 1,356 - - - Remeasurement of preferred shares 3,000 2,530 300 150 2,490 Adjusted EBITDA 80,319$ 88,638$ 100,822$ 116,022$ 115,507$ For the Three Months Ended DEFINED TERMS AND NON-GAAP RECONCILIATIONS EBITDA and Adjusted EBITDA EBITDA is defined as earnings before interest, taxes, depreciation and amortization. EBITDA is a non-GAAP financial measure and is used by us and others as a supplemental measure of performance. Adjusted EBITDA is a supplemental non-GAAP financial measure calculated by adjusting EBITDA for (1) acquisition fees and costs expensed incurred with recent business combinations and the acquisition of individual properties, (2) net gain or loss on sale / impairment of single- family properties, (3) noncash share-based compensation expense, (4) gain or loss on early extinguishment of debt, (5) gain or loss on conversion of convertible units and (6) noncash fair value adjustments associated with remeasuring our Series E convertible units liability and preferred shares derivative liability to fair value. We consider Adjusted EBITDA to be a meaningful financial measure of operating performance because it excludes the impact of various income and expense items that are not indicative of operating performance. The following is a reconciliation of net loss attributable to common shareholders, determined in accordance with GAAP, to EBITDA and Adjusted EBITDA for the trailing five quarters (amounts in thousands):

20 DEFINED TERMS AND NON-GAAP RECONCILIATIONS FFO, Core FFO and Adjusted FFO FFO attributable to common share and unit holders is a non-GAAP financial measure defined as net income or loss calculated in accordance with GAAP, excluding extraordinary items, as defined by GAAP, gains and losses from sales or impairment of real estate, plus real estate-related depreciation and amortization (excluding amortization of deferred financing costs and depreciation of non-real estate assets), and after adjustment for unconsolidated partnerships and joint ventures. Core FFO attributable to common share and unit holders is a non-GAAP financial measure calculated by adjusting FFO attributable to common share and unit holders for (1) acquisition fees and costs expensed incurred with recent business combinations and the acquisition of individual properties, (2) noncash share- based compensation expense, (3) noncash interest expense related to acquired debt, (4) gain or loss on early extinguishment of debt, (5) noncash gain or loss on conversion of convertible units and (6) noncash fair value adjustments associated with remeasuring our Series E convertible units liability and preferred shares derivative liability to fair value. Adjusted FFO attributable to common share and unit holders is a non-GAAP financial measure calculated by adjusting Core FFO attributable to common share and unit holders for (1) recurring capital expenditures that are necessary to help preserve the value and maintain functionality of our single-family properties and (2) actual leasing costs incurred during the period. As many of our homes are still recently acquired and / or renovated, we estimate recurring capital expenditures for our entire portfolio by multiplying (a) current period actual capital expenditures per Same-Home property by (b) our total number of properties, excluding non- stabilized and held for sale properties.

21 Sep 30, 2015 Dec 31, 2015 Mar 31, 2016 Jun 30, 2016 Sep 30, 2016 Net loss attributable to common shareholders (28,616)$ (20,474)$ (4,377)$ (10,404)$ (21,152)$ Adjustments: Noncontroll ing interests in the Operating Partnership 3,123 3,657 3,912 (616) 7,542 Net (gain) loss on sale / impairment of single-family properties - - (60) 68 (11,115) Depreciation and amortization of real estate assets 66,218 60,714 68,162 78,216 73,790 40,725$ 43,897$ 67,637$ 67,264$ 49,065$ Adjustments: Acquisition fees and costs expensed 4,153 5,280 5,653 3,489 1,757 Noncash share-based compensation expense 913 782 870 983 891 Noncash interest expense related to acquired debt - - 576 1,649 1,474 Loss on early extinguishment of debt - - - - 13,408 Gain on conversion of Series E units - - (11,463) - - Remeasurement of Series E units 525 1,356 - - - Remeasurement of preferred shares 3,000 2,530 300 150 2,490 49,316$ 53,845$ 63,573$ 73,535$ 69,085$ Recurring capital expenditures (8,458) (5,799) (6,017) (8,755) (10,411) Leasing costs (2,312) (1,844) (1,929) (2,151) (2,119) Adjusted FFO attributable to common share and unit holders 38,546$ 46,202$ 55,627$ 62,629$ 56,555$ Weighted-average number of FFO shares 265,691,012 262,322,640 273,898,215 294,044,169 293,958,490 FFO per weighted-average FFO share 0.15$ 0.17$ 0.25$ 0.23$ 0.17$ Core FFO per weighted-average FFO share 0.19$ 0.21$ 0.23$ 0.25$ 0.24$ Adjusted FFO per weighted-average FFO share 0.15$ 0.18$ 0.20$ 0.21$ 0.19$ Core funds from operations attributable to common share and unit holders Funds from operations attributable to common share and unit holders For the Three Months Ended DEFINED TERMS AND NON-GAAP RECONCILIATIONS The following is a reconciliation of net loss attributable to common shareholders, determined in accordance with GAAP, to FFO, Core FFO and Adjusted FFO for the trailing five quarters (amounts in thousands):


