Table of Contents
| | | | | |
| Summary | |
| |
| |
| |
| Financial Information | |
| |
| |
| |
| |
| |
| |
| |
| |
| Property and Other Information | |
| |
| |
| |
| |
| |
| |
American Homes 4 Rent Reports Fourth Quarter and Full Year 2020 Financial and Operating Results
CALABASAS, Calif., Feb. 25, 2021—American Homes 4 Rent (NYSE: AMH) (the “Company”), a leading provider of high-quality single-family homes for rent, today announced its financial and operating results for the quarter and full year ended December 31, 2020.
Highlights
•Total revenues increased 5.4% to $299.3 million for the fourth quarter of 2020 from $284.0 million for the fourth quarter of 2019.
•Net income attributable to common shareholders totaled $27.1 million, or $0.09 per diluted share, for the fourth quarter of 2020, compared to $23.6 million, or $0.08 per diluted share, for the fourth quarter of 2019.
•Core Funds from Operations (“Core FFO”) attributable to common share and unit holders increased 7.3% to $0.31 per FFO share and unit for the fourth quarter of 2020 from $0.29 per FFO share and unit for the fourth quarter of 2019 and Adjusted Funds from Operations (“Adjusted FFO”) attributable to common share and unit holders increased 7.9% to $0.28 per FFO share and unit for the fourth quarter of 2020 from $0.26 per FFO share and unit for the fourth quarter of 2019.
•Core Net Operating Income (“Core NOI”) from Same-Home properties increased by 3.2% year-over-year for the fourth quarter of 2020.
•Record demand drove all-time high leasing results with Same-Home portfolio Average Occupied Days Percentage of 97.3% in the fourth quarter of 2020, while achieving 7.6% rental rate growth on new leases.
•Doubled common share dividend to $0.10 in the first quarter of 2021, the first increase since distribution initiation in 2013.
“American Homes 4 Rent closed out 2020 with record breaking results, generating over 7% year-over-year growth in fourth quarter Core FFO per share and unit,” stated David Singelyn, American Homes 4 Rent’s Chief Executive Officer. “I am incredibly proud of our team’s dedication and performance this year, which has provided us with unprecedented momentum as we enter 2021. Our differentiated strategy which combines a best-in-class operating platform, the nation’s leading single-family rental home builder and an investment grade balance sheet truly sets us apart, as demonstrated by our accelerating 2021 Core FFO growth expectation of nearly 8%. And when coupled with our growing dividend, which we are doubling in the first quarter of 2021, we believe we are positioned to continue producing outsized total shareholder returns for years to come.”
Fourth Quarter 2020 Financial Results
Net income attributable to common shareholders totaled $27.1 million, or $0.09 per diluted share, for the fourth quarter of 2020, compared to $23.6 million, or $0.08 per diluted share, for the fourth quarter of 2019. This improvement was primarily attributable to growth in the Company’s portfolio and higher occupancy, as well as higher rental rates, offset in part by increased uncollectible rents and tenant utility reimbursements related to the COVID-19 pandemic.
Total revenues increased 5.4% to $299.3 million for the fourth quarter of 2020 from $284.0 million for the fourth quarter of 2019. Revenue growth was driven by an increase in our average occupied portfolio which grew to 51,181 homes for the fourth quarter of 2020, compared to 48,818 homes for the fourth quarter of 2019, as well as higher rental rates, partially offset by an increase in uncollectible rents and tenant utility reimbursements related to the COVID-19 pandemic.
Core NOI from our total portfolio increased 7.1% to $168.4 million for the fourth quarter of 2020, compared to $157.2 million for the fourth quarter of 2019. This growth was driven by a 6.5% increase in core revenues resulting from a larger
| | | | | | | | |
| | |
| Refer to “Defined Terms and Non-GAAP Reconciliations” for definitions of metrics and reconciliations to GAAP. | | 3 |
Earnings Press Release (continued)
number of occupied properties and higher rental rates, partially offset by an increase in uncollectible rents related to the COVID-19 pandemic and a 5.4% increase in core property operating expenses.
For the Company’s Same-Home portfolio, rents from single-family properties increased 4.8% to $220.9 million for the fourth quarter of 2020, compared to $210.8 million for the fourth quarter of 2019, which was driven by a 2.6% increase in Average Monthly Realized Rent per property and a 210 basis point increase in Average Occupied Days Percentage. This growth was (i) further benefited by 30 basis points of contribution from higher fees and (ii) partially offset by 160 basis points of drag from increased uncollectible rents related to the COVID-19 pandemic, which resulted in 3.5% growth in core revenues from Same-Home properties. Core property operating expenses from Same-Home properties increased 4.2% to $77.5 million for the fourth quarter of 2020, compared to $74.4 million for the fourth quarter of 2019. As a result, Core NOI from Same-Home properties increased 3.2% to $141.8 million for the fourth quarter of 2020, compared to $137.4 million for the fourth quarter of 2019.
Core FFO attributable to common share and unit holders was $113.6 million, or $0.31 per FFO share and unit, for the fourth quarter of 2020, compared to $101.4 million, or $0.29 per FFO share and unit, for the fourth quarter of 2019. Adjusted FFO attributable to common share and unit holders was $102.8 million, or $0.28 per FFO share and unit, for the fourth quarter of 2020, compared to $91.2 million, or $0.26 per FFO share and unit, for the fourth quarter of 2019. These improvements were primarily attributable to growth in the Company’s portfolio and a larger number of occupied properties as well as higher rental rates, partially offset by $3.8 million of negative financial impacts associated with the COVID-19 pandemic including $3.6 million of increased uncollectible rents and $0.2 million of increased uncollectible tenant utility reimbursements.
Full Year 2020 Financial Results
Net income attributable to common shareholders totaled $85.2 million, or $0.28 per diluted share, for the year ended December 31, 2020, compared to $85.9 million, or $0.29 per diluted share, for the year ended December 31, 2019. This decrease was primarily attributable to increased uncollectible rents and tenant utility reimbursements related to the COVID-19 pandemic as well as a noncash write-down included in other expenses associated with the liquidation of legacy joint ventures, which were acquired as part of the American Residential Properties, Inc. merger in February 2016. This decrease was offset in part by growth in the Company’s portfolio and higher occupancy, as well as higher rental rates. On a per diluted share basis, the decrease was also attributable to an increase in weighted-average common shares outstanding primarily as a result of our common equity offering in the third quarter of 2020.
Total revenues increased 3.5% to $1.18 billion for the year ended December 31, 2020 from $1.14 billion for the year ended December 31, 2019. Revenue growth was driven by an increase in our average occupied portfolio which grew to 50,065 homes for the year ended December 31, 2020, compared to 48,687 homes for the year ended December 31, 2019, as well as higher rental rates, partially offset by an increase in uncollectible rents and tenant utility reimbursements related to the COVID-19 pandemic.
Core NOI from our total portfolio increased 3.5% to $634.1 million for the year ended December 31, 2020, compared to $612.7 million for the year ended December 31, 2019. This growth was driven by a 4.1% increase in core revenues resulting from a larger number of occupied properties and higher rental rates, partially offset by an increase in uncollectible rents related to the COVID-19 pandemic and a 5.0% increase in core property operating expenses.
For the Company’s Same-Home portfolio, rents from single-family properties increased 4.0% to $867.4 million for the year ended December 31, 2020, compared to $834.3 million for the year ended December 31, 2019, which was driven by a 3.0% increase in Average Monthly Realized Rent per property and a 90 basis point increase in Average Occupied Days Percentage. This growth was (i) further benefited by 10 basis points of contribution from higher fees and (ii) partially offset by 130 basis
| | | | | | | | |
| | |
| Refer to “Defined Terms and Non-GAAP Reconciliations” for definitions of metrics and reconciliations to GAAP. | | 4 |
Earnings Press Release (continued)
points of drag from increased uncollectible rents related to the COVID-19 pandemic, which resulted in 2.8% growth in core revenues from Same-Home properties. Core property operating expenses from Same-Home properties increased 4.3% to $315.9 million for the year ended December 31, 2020, compared to $302.9 million for the year ended December 31, 2019. As a result, Core NOI from Same-Home properties increased 2.0% to $546.1 million for the year ended December 31, 2020, compared to $535.6 million for the year ended December 31, 2019.
Core FFO attributable to common share and unit holders was $417.6 million, or $1.16 per FFO share and unit, for the year ended December 31, 2020, compared to $392.8 million, or $1.11 per FFO share and unit, for the year ended December 31, 2019. Adjusted FFO attributable to common share and unit holders was $367.5 million, or $1.02 per FFO share and unit, for the year ended December 31, 2020, compared to $348.7 million, or $0.99 per FFO share and unit, for the year ended December 31, 2019. These improvements were primarily attributable to growth in the Company’s portfolio and a larger number of occupied properties as well as higher rental rates, partially offset by the negative financial impacts associated with the COVID-19 pandemic that relate to (i) the Company’s socially responsible decisions between April and July 2020 to waive month-to-month lease premiums and offer zero percent increases on newly signed renewal leases, (ii) waived late fees between April and July 2020, and (iii) $16.1 million of other negative financial impacts associated with the COVID-19 pandemic including $12.8 million of increased uncollectible rents, $2.8 million of increased uncollectible tenant utility reimbursements and $0.5 million of increased costs associated with enhanced cleaning and safety protocols. Additionally, due primarily to abnormally high home system usage during stay-at-home orders, we incurred approximately $3.4 million of incremental capital expenditures within Adjusted FFO attributable to common share and unit holders that primarily related to HVAC and home system replacements during the year ended December 31, 2020.
Collections Update
Collections continue to remain resilient throughout the pandemic. We have now received 96.7% of fourth quarter 2020 rental billings, which is consistent with pandemic payment histories within the same time frame. Additionally, collections of January 2021 rental billings continue to remain consistent with pandemic payment histories within the same time frame. Collections are reported without application of any existing resident security deposits or adjustment for deferred payment plans.
Portfolio
As of December 31, 2020, the Company had an occupancy percentage of 97.0%, compared to 97.5% as of September 30, 2020. The occupancy percentage on Same-Home properties was 97.6% as of December 31, 2020, compared to 97.8% as of September 30, 2020.
Investments
As of December 31, 2020, the Company’s wholly-owned portfolio consisted of 53,584 homes, compared to 53,229 homes as of September 30, 2020, an increase of 355 homes during the fourth quarter of 2020, which included 216 newly constructed properties delivered through our AMH Development Program and 347 homes acquired through our National Builder Program and traditional acquisition channel, partially offset by 188 homes sold and 20 homes contributed to unconsolidated joint ventures. As of December 31, 2020, the Company had 711 properties held for sale, compared to 813 properties as of September 30, 2020. Also, as of December 31, 2020, the Company had an additional 1,293 properties held in unconsolidated joint ventures, representing a net increase of 162 properties, compared to 1,131 properties held in unconsolidated joint ventures as of September 30, 2020.
| | | | | | | | |
| | |
| Refer to “Defined Terms and Non-GAAP Reconciliations” for definitions of metrics and reconciliations to GAAP. | | 5 |
Earnings Press Release (continued)
Capital Activities, Balance Sheet and Liquidity
As of December 31, 2020, the Company had cash and cash equivalents of $137.1 million and had total outstanding debt of $2.8 billion, excluding unamortized discounts and unamortized deferred financing costs, with a weighted-average interest rate of 4.4% and a weighted-average term to maturity of 12.1 years. The Company had no outstanding borrowings on its $800.0 million revolving credit facility at the end of the quarter. Additionally, the Company has no debt maturities, other than recurring principal amortization, until 2024. During the fourth quarter of 2020, the Company generated $84.3 million of Retained Cash Flow and sold 188 properties generating $44.5 million of net proceeds.
2021 Guidance
The Company is providing initial 2021 guidance based on its current and expected views of the single-family rental market and general economic conditions. However, the extent to which the pandemic may continue to impact us and our residents will continue to depend on future developments. These include resurgences, impact of government regulations, the speed and effectiveness of vaccine distribution and the direct and indirect economic effects of the pandemic and containment measures, among others. We will continue to monitor these events which may result in future revisions to our guidance estimates.
Guidance Summary
| | | | | |
| Full Year 2021 |
| Core FFO attributable to common share and unit holders | $1.22 - $1.28 |
| Core FFO attributable to common share and unit holders growth | 5.2% - 10.3% |
| |
| Same-Home | |
Core revenues growth (1) | 3.25% - 4.75% |
Core property operating expenses growth (2) | 4.00% - 5.50% |
| Core NOI growth | 2.75% - 4.25% |
(1)Includes full year bad debt assumption of 2.5% - 3.0% of rents from single-family properties, which contemplates potential uncertainties associated with ongoing COVID-19 impacts to macro-economic and regulatory environments.
(2)Comprised of expected property tax growth of 4.0% - 5.0% and all other operating expenses growth, excluding property taxes, of 4.5% - 5.5%.
Reconciliation of Core FFO attributable to common share and unit holders from 2020 to 2021 Guidance Midpoint
| | | | | |
| Per FFO Share
and Unit |
| 2020 Core FFO attributable to common share and unit holders | $ | 1.16 | |
| |
| Same-Home Core NOI | 0.06 | |
Non-Same-Home Core NOI (1) | 0.06 | |
| General and administrative expense | (0.01) | |
| Financing costs (share count and interest) | (0.02) | |
| |
| 2021 Core FFO attributable to common share and unit holders - Guidance Midpoint | $ | 1.25 | |
| 2021 Core FFO attributable to common share and unit holders growth - Guidance Midpoint | 7.8 | % |
(1)Core FFO growth from Non-Same-Home Core NOI includes (i) contribution from existing properties not included in the Company’s 2021 Same-Home portfolio, including 2020 additions, and (ii) contribution from 2021 wholly-owned portfolio additions that we expect to range between 2,500 and 2,900 properties, with an investment between $700.0 million and $900.0 million. In addition, we expect to invest (i) $250.0 million to $350.0 million of gross joint venture capital that includes 700 to 800 property deliveries and investment into the joint venture land and development pipeline and (ii) $250.0 million to $350.0 million into our wholly-owned land and development pipeline.
Note: The Company does not provide guidance for the most comparable GAAP financial measures of net income or loss, total revenues and property operating expenses, or a reconciliation of the above-listed forward-looking non-GAAP financial
| | | | | | | | |
| | |
| Refer to “Defined Terms and Non-GAAP Reconciliations” for definitions of metrics and reconciliations to GAAP. | | 6 |
Earnings Press Release (continued)
measures to the comparable GAAP financial measures because we are unable to reasonably predict certain items contained in the GAAP measures, including non-recurring and infrequent items that are not indicative of the Company’s ongoing operations. Such items include, but are not limited to, net gain or loss on sales and impairment of single-family properties, casualty loss, Non-Same-Home revenues and Non-Same-Home property operating expenses. These items are uncertain, depend on various factors and could have a material impact on our GAAP results for the guidance period.
Additional Information
A copy of the Company’s Fourth Quarter 2020 Earnings Release and Supplemental Information Package and this press release are available on our website at www.americanhomes4rent.com. This information has also been furnished to the SEC in a current report on Form 8-K.
Conference Call
A conference call is scheduled on Friday, February 26, 2021 at 11:00 a.m. Eastern Time to discuss the Company’s financial results for the quarter and full year ended December 31, 2020, and to provide an update on its business. The domestic dial-in number is (877) 451-6152 (U.S. and Canada) and the international dial-in number is (201) 389-0879 (passcode not required). A simultaneous audio webcast may be accessed by using the link at www.americanhomes4rent.com, under “For Investors.” A replay of the conference call may be accessed through Friday, March 12, 2021 by calling (844) 512-2921 (U.S. and Canada) or (412) 317-6671 (international), replay passcode number 13715263#, or by using the link at www.americanhomes4rent.com, under “For Investors.”
About American Homes 4 Rent
American Homes 4 Rent (NYSE: AMH) is a leader in the single-family home rental industry and “American Homes 4 Rent” is fast becoming a nationally recognized brand for rental homes, known for high-quality, good value and tenant satisfaction. We are an internally managed Maryland real estate investment trust, or REIT, focused on acquiring, developing, renovating, leasing, and operating attractive, single-family homes as rental properties. As of December 31, 2020, we owned 53,584 single-family properties in selected submarkets in 22 states.
Forward-Looking Statements
This press release and the accompanying Supplemental Information Package contain “forward-looking statements.” These forward-looking statements relate to beliefs, expectations or intentions and similar statements concerning matters that are not of historical fact and are generally accompanied by words such as “estimate,” “project,” “predict,” “believe,” “expect,” “anticipate,” “intend,” “potential,” “plan,” “goal,” “outlook,” “guidance” or other words that convey the uncertainty of future events or outcomes. Examples of forward-looking statements contained in this press release include, among others, our 2021 Guidance, our expectations with respect to the impacts of the COVID-19 pandemic, our belief that our acquisition and homebuilding programs will result in continued growth and the estimated timing of our development deliveries set forth in the Supplemental Information Package. The Company has based these forward-looking statements on its current expectations and assumptions about future events. While the Company’s management considers these expectations to be reasonable, they are inherently subject to risks, contingencies and uncertainties, most of which are difficult to predict and many of which are beyond the Company’s control and could cause actual results to differ materially from any future results, performance or achievements expressed or implied by these forward-looking statements. Investors should not place undue reliance on these forward-looking statements, which speak only as of the date of this press release. The Company undertakes no obligation to update any forward-looking statements to conform to actual results or changes in its expectations, unless required by
| | | | | | | | |
| | |
| Refer to “Defined Terms and Non-GAAP Reconciliations” for definitions of metrics and reconciliations to GAAP. | | 7 |
Earnings Press Release (continued)
applicable law. Currently, one of the most significant factors that could cause actual outcomes to differ materially from our forward-looking statements is the adverse effect of the COVID-19 pandemic on the financial condition, operating results and cash flows of the Company, our tenants, the real estate market, the global economy and the financial markets. The extent to which the COVID-19 pandemic continues to impact us and our tenants will depend on future developments, which are highly uncertain and cannot be predicted with confidence, including the scope, severity and duration of the pandemic, including resurgences, impact of government regulations, the speed and effectiveness of vaccine distribution and the direct and indirect economic effects of the pandemic and containment measures, among others. For a further description of the risks and uncertainties that could cause actual results to differ from those expressed in these forward-looking statements, as well as risks relating to the business of the Company in general, see the “Risk Factors” disclosed in the Company’s Annual Report on Form 10-K for the year ended December 31, 2020 and in the Company’s subsequent filings with the SEC.
| | | | | | | | |
| | |
| Refer to “Defined Terms and Non-GAAP Reconciliations” for definitions of metrics and reconciliations to GAAP. | | 8 |
Fact Sheet
(Amounts in thousands, except per share and property data)
(Unaudited)
| | | | | | | | | | | | | | | | | | | | | | | |
| For the Three Months Ended
Dec 31, | | For the Years Ended
Dec 31, |
| 2020 | | 2019 | | 2020 | | 2019 |
| Operating Data | | | | | | | |
| Net income attributable to common shareholders | $ | 27,081 | | | $ | 23,590 | | | $ | 85,246 | | | $ | 85,911 | |
| Core revenues | $ | 261,121 | | | $ | 245,175 | | | $ | 1,011,707 | | | $ | 972,286 | |
| Core NOI | $ | 168,429 | | | $ | 157,208 | | | $ | 634,100 | | | $ | 612,717 | |
| Core NOI margin | 64.5 | % | | 64.1 | % | | 62.7 | % | | 63.0 | % |
| Platform Efficiency Percentage | 12.9 | % | | 13.1 | % | | 12.9 | % | | 12.8 | % |
| Fully Adjusted EBITDAre | $ | 147,529 | | | $ | 138,154 | | | $ | 548,688 | | | $ | 538,853 | |
| Fully Adjusted EBITDAre Margin | 55.8 | % | | 55.6 | % | | 53.6 | % | | 54.7 | % |
| Per FFO share and unit: | | | | | | | |
| FFO attributable to common share and unit holders | $ | 0.29 | | | $ | 0.28 | | | $ | 1.11 | | | $ | 1.09 | |
| Core FFO attributable to common share and unit holders | $ | 0.31 | | | $ | 0.29 | | | $ | 1.16 | | | $ | 1.11 | |
| Adjusted FFO attributable to common share and unit holders | $ | 0.28 | | | $ | 0.26 | | | $ | 1.02 | | | $ | 0.99 | |
| | | | | | | | | | | | | | | | | | | | | | | | | | | | | |
| Dec 31,
2020 | | Sep 30,
2020 | | Jun 30,
2020 | | Mar 31,
2020 | | Dec 31,
2019 |
| Selected Balance Sheet Information - end of period | | | | | | | | | |
| Single-family properties in operation, net | $ | 8,245,388 | | | $ | 8,158,937 | | | $ | 8,096,223 | | | $ | 8,067,375 | | | $ | 7,986,276 | |
| Total assets | $ | 9,593,625 | | | $ | 9,600,363 | | | $ | 9,271,774 | | | $ | 9,201,365 | | | $ | 9,100,109 | |
| Outstanding borrowings under revolving credit facility | $ | — | | | $ | — | | | $ | 130,000 | | | $ | 105,000 | | | $ | — | |
| Total Debt | $ | 2,848,492 | | | $ | 2,853,883 | | | $ | 2,989,230 | | | $ | 2,970,558 | | | $ | 2,870,993 | |
| Total Market Capitalization | $ | 14,783,745 | | | $ | 14,226,536 | | | $ | 13,373,387 | | | $ | 12,043,390 | | | $ | 13,000,836 | |
| Total Debt to Total Market Capitalization | 19.3 | % | | 20.1 | % | | 22.4 | % | | 24.7 | % | | 22.1 | % |
| Net Debt to Adjusted EBITDAre | 4.4 x | | 4.2 x | | 5.0 x | | 4.9 x | | 4.7 x |
| NYSE AMH Class A common share closing price | $ | 30.00 | | | $ | 28.48 | | | $ | 26.90 | | | $ | 23.20 | | | $ | 26.21 | |
| | | | | | | | | | | | | | | | | | | | | | | | | | | | | |
| Portfolio Data - end of period | | | | | | | | | |
| | | | | | | | | |
| Occupied single-family properties | 51,271 | | | 51,090 | | | 50,170 | | | 49,029 | | | 48,767 | |
| Single-family properties recently acquired or developed | 233 | | | 82 | | | 120 | | | 499 | | | 335 | |
| Single-family properties in turnover process | 977 | | | 893 | | | 1,189 | | | 1,817 | | | 1,934 | |
| Single-family properties leased, not yet occupied | 392 | | | 351 | | | 573 | | | 471 | | | 329 | |
| Total single-family properties, excluding properties held for sale | 52,873 | | | 52,416 | | | 52,052 | | | 51,816 | | | 51,365 | |
| Single-family properties held for sale | 711 | | | 813 | | | 948 | | | 960 | | | 1,187 | |
| Total single-family properties | 53,584 | | | 53,229 | | | 53,000 | | | 52,776 | | | 52,552 | |
Total occupancy percentage (1) | 97.0 | % | | 97.5 | % | | 96.4 | % | | 94.6 | % | | 94.9 | % |
| Total Average Occupied Days Percentage | 97.2 | % | | 96.9 | % | | 95.1 | % | | 94.7 | % | | 95.0 | % |
| Same-Home occupancy percentage (44,663 properties) | 97.6 | % | | 97.8 | % | | 96.9 | % | | 96.0 | % | | 96.0 | % |
| Same-Home Average Occupied Days Percentage (44,663 properties) | 97.3 | % | | 96.9 | % | | 95.6 | % | | 95.3 | % | | 95.2 | % |
| | | | | | | | | | | | | | | | | | | | | | | | | | | | | |
| Other Data | | | | | | | | | |
| Distributions declared per common share | $ | 0.05 | | | $ | 0.05 | | | $ | 0.05 | | | $ | 0.05 | | | $ | 0.05 | |
| Distributions declared per Series D perpetual preferred share | $ | 0.41 | | | $ | 0.41 | | | $ | 0.41 | | | $ | 0.41 | | | $ | 0.41 | |
| Distributions declared per Series E perpetual preferred share | $ | 0.40 | | | $ | 0.40 | | | $ | 0.40 | | | $ | 0.40 | | | $ | 0.40 | |
| Distributions declared per Series F perpetual preferred share | $ | 0.37 | | | $ | 0.37 | | | $ | 0.37 | | | $ | 0.37 | | | $ | 0.37 | |
| Distributions declared per Series G perpetual preferred share | $ | 0.37 | | | $ | 0.37 | | | $ | 0.37 | | | $ | 0.37 | | | $ | 0.37 | |
| Distributions declared per Series H perpetual preferred share | $ | 0.39 | | | $ | 0.39 | | | $ | 0.39 | | | $ | 0.39 | | | $ | 0.39 | |
(1)Occupancy percentage is calculated based on total single-family properties, excluding properties held for sale.
| | | | | | | | |
| | |
| Refer to “Defined Terms and Non-GAAP Reconciliations” for definitions of metrics and reconciliations to GAAP. | | 9 |
Consolidated Statements of Operations
(Amounts in thousands, except share and per share data)
| | | | | | | | | | | | | | | | | | | | | | | |
| For the Three Months Ended
Dec 31, | | For the Years Ended
Dec 31, |
| 2020 | | 2019 | | 2020 | | 2019 |
| (Unaudited) | | (Unaudited) | | (Unaudited) | | |
| Revenues: | | | | | | | |
| Rents and other single-family property revenues | $ | 296,551 | | | $ | 281,465 | | | $ | 1,172,514 | | | $ | 1,132,137 | |
| Other | 2,784 | | | 2,545 | | | 10,322 | | | 11,241 | |
| Total revenues | 299,335 | | | 284,010 | | | 1,182,836 | | | 1,143,378 | |
| | | | | | | |
| Expenses: | | | | | | | |
| Property operating expenses | 106,160 | | | 102,788 | | | 450,267 | | | 433,854 | |
| Property management expenses | 22,380 | | | 21,822 | | | 89,892 | | | 86,908 | |
| General and administrative expense | 13,188 | | | 12,178 | | | 48,517 | | | 43,206 | |
| Interest expense | 28,498 | | | 31,163 | | | 117,038 | | | 127,114 | |
| Acquisition and other transaction costs | 3,579 | | | 769 | | | 9,298 | | | 3,224 | |
| Depreciation and amortization | 88,500 | | | 83,219 | | | 343,153 | | | 329,293 | |
| | | | | | | |
| Other | 2,044 | | | 1,585 | | | 14,036 | | | 6,733 | |
| Total expenses | 264,349 | | | 253,524 | | | 1,072,201 | | | 1,030,332 | |
| | | | | | | |
| Gain on sale of single-family properties and other, net | 10,356 | | | 10,978 | | | 44,194 | | | 43,873 | |
| Loss on early extinguishment of debt | — | | | — | | | — | | | (659) | |
| | | | | | | |
| | | | | | | |
| | | | | | | |
| Net income | 45,342 | | | 41,464 | | | 154,829 | | | 156,260 | |
| | | | | | | |
| Noncontrolling interest | 4,479 | | | 4,092 | | | 14,455 | | | 15,221 | |
| Dividends on preferred shares | 13,782 | | | 13,782 | | | 55,128 | | | 55,128 | |
| | | | | | | |
| | | | | | | |
| Net income attributable to common shareholders | $ | 27,081 | | | $ | 23,590 | | | $ | 85,246 | | | $ | 85,911 | |
| | | | | | | |
| Weighted-average common shares outstanding: | | | | | | | |
| Basic | 316,424,015 | | | 300,724,761 | | | 306,613,197 | | | 299,415,397 | |
| Diluted | 316,884,567 | | | 301,213,621 | | | 307,074,747 | | | 299,918,966 | |
| | | | | | | |
| Net income attributable to common shareholders per share: | | | | | | | |
| Basic | $ | 0.09 | | | $ | 0.08 | | | $ | 0.28 | | | $ | 0.29 | |
| Diluted | $ | 0.09 | | | $ | 0.08 | | | $ | 0.28 | | | $ | 0.29 | |
| | | | | | | | |
| | |
| Refer to “Defined Terms and Non-GAAP Reconciliations” for definitions of metrics and reconciliations to GAAP. | | 10 |
Funds from Operations
(Amounts in thousands, except share and per share data)
(Unaudited)
| | | | | | | | | | | | | | | | | | | | | | | |
| | For the Three Months Ended
Dec 31, | | For the Years Ended
Dec 31, |
| | 2020 | | 2019 | | 2020 | | 2019 |
| Net income attributable to common shareholders | $ | 27,081 | | | $ | 23,590 | | | $ | 85,246 | | | $ | 85,911 | |
| Adjustments: | | | | | | | |
| Noncontrolling interests in the Operating Partnership | 4,479 | | | 4,092 | | | 14,455 | | | 15,221 | |
| Net (gain) on sale / impairment of single-family properties and other | (10,206) | | | (10,398) | | | (38,107) | | | (40,210) | |
| Adjustments for unconsolidated joint ventures | 333 | | | 821 | | | 1,352 | | | 1,797 | |
| Depreciation and amortization | 88,500 | | | 83,219 | | | 343,153 | | | 329,293 | |
| Less: depreciation and amortization of non-real estate assets | (2,464) | | | (2,031) | | | (9,016) | | | (7,933) | |
| FFO attributable to common share and unit holders | $ | 107,723 | | | $ | 99,293 | | | $ | 397,083 | | | $ | 384,079 | |
| Adjustments: | | | | | | | |
| | | | | | | |
Acquisition, other transaction costs and other (1) | 3,579 | | | 769 | | | 12,223 | | | 3,224 | |
| Noncash share-based compensation - general and administrative | 1,832 | | | 946 | | | 6,573 | | | 3,466 | |
| Noncash share-based compensation - property management | 418 | | | 353 | | | 1,745 | | | 1,342 | |
| | | | | | | |
| | | | | | | |
| Loss on early extinguishment of debt | — | | | — | | | — | | | 659 | |
| | | | | | | |
| | | | | | | |
| | | | | | | |
Core FFO attributable to common share and unit holders (2) | $ | 113,552 | | | $ | 101,361 | | | $ | 417,624 | | | $ | 392,770 | |
| Recurring Capital Expenditures | (9,756) | | | (9,332) | | | (46,048) | | | (39,997) | |
| Leasing costs | (1,011) | | | (851) | | | (4,070) | | | (4,095) | |
| | | | | | | |
Adjusted FFO attributable to common share and unit holders (2) | $ | 102,785 | | | $ | 91,178 | | | $ | 367,506 | | | $ | 348,678 | |
| | | | | | | |
| Per FFO share and unit: | | | | | | | |
| FFO attributable to common share and unit holders | $ | 0.29 | | | $ | 0.28 | | | $ | 1.11 | | | $ | 1.09 | |
Core FFO attributable to common share and unit holders (2) | $ | 0.31 | | | $ | 0.29 | | | $ | 1.16 | | | $ | 1.11 | |
Adjusted FFO attributable to common share and unit holders (2) | $ | 0.28 | | | $ | 0.26 | | | $ | 1.02 | | | $ | 0.99 | |
| | | | | | | |
| Weighted-average FFO shares and units: | | | | | | | |
| Common shares outstanding | 316,424,015 | | | 300,724,761 | | | 306,613,197 | | | 299,415,397 | |
Share-based compensation plan (3) | 764,198 | | | 708,131 | | | 724,523 | | | 686,050 | |
| Operating partnership units | 51,880,241 | | | 52,026,980 | | | 51,990,094 | | | 53,045,004 | |
| Total weighted-average FFO shares and units | 369,068,454 | | | 353,459,872 | | | 359,327,814 | | | 353,146,451 | |
(1)Included in acquisition, other transaction costs and other is a net $2.9 million nonrecurring expense related to a legal matter involving a former employee during the year ended December 31, 2020.
(2)Core FFO and Adjusted FFO attributable to common share and unit holders include negative financial impacts associated with the COVID-19 pandemic that relate to (i) the Company’s socially responsible decisions between April and July 2020 to waive month-to-month lease premiums and offer zero percent increases on newly signed renewal leases, (ii) waived late fees between April and July 2020, and (iii) $3.8 million and $16.1 million of other negative financial impacts from the COVID-19 pandemic including $3.6 million and $12.8 million of increased uncollectible rents and $0.2 million and $2.8 million of increased uncollectible tenant utility reimbursements during the three months and year ended December 31, 2020, respectively. Also included is $0.5 million of increased costs associated with enhanced cleaning and safety protocols during the year ended December 31, 2020. Additionally, due primarily to abnormally high home system usage during stay-at-home orders, we incurred approximately $3.4 million of incremental capital expenditures within Adjusted FFO attributable to common share and unit holders that primarily related to HVAC and home system replacements during the year ended December 31, 2020.
(3)Reflects the effect of potentially dilutive securities issuable upon the assumed vesting/exercise of restricted stock units and stock options.
| | | | | | | | |
| | |
| Refer to “Defined Terms and Non-GAAP Reconciliations” for definitions of metrics and reconciliations to GAAP. | | 11 |
Core Net Operating Income – Total Portfolio
(Amounts in thousands)
(Unaudited)
| | | | | | | | | | | | | | | | | | | | | | | |
| For the Three Months Ended
Dec 31, | | For the Years Ended
Dec 31, |
| 2020 | | 2019 | | 2020 | | 2019 |
Rents from single-family properties (1) | $ | 262,972 | | | $ | 244,201 | | | $ | 1,017,822 | | | $ | 967,409 | |
Fees from single-family properties (1) | 4,688 | | | 3,672 | | | 16,351 | | | 13,835 | |
Bad debt (2) | (6,539) | | | (2,698) | | | (22,466) | | | (8,958) | |
| Core revenues | 261,121 | | | 245,175 | | | 1,011,707 | | | 972,286 | |
| | | | | | | |
| Property tax expense | 44,682 | | | 43,156 | | | 180,140 | | | 172,782 | |
HOA fees, net (3) | 5,095 | | | 4,532 | | | 19,654 | | | 20,468 | |
R&M and turnover costs, net (3)(4) | 18,985 | | | 17,932 | | | 83,136 | | | 77,094 | |
| Insurance | 2,492 | | | 2,275 | | | 9,692 | | | 9,023 | |
Property management expenses, net (5) | 21,438 | | | 20,072 | | | 84,985 | | | 80,202 | |
| Core property operating expenses | 92,692 | | | 87,967 | | | 377,607 | | | 359,569 | |
| | | | | | | |
| Core NOI | $ | 168,429 | | | $ | 157,208 | | | $ | 634,100 | | | $ | 612,717 | |
| Core NOI margin | 64.5 | % | | 64.1 | % | | 62.7 | % | | 63.0 | % |
| | | | | | | | | | | | | | | | | | | | | | | | | | | | | |
| For the Three Months Ended
Dec 31, 2020 |
| Same-Home Properties | | Stabilized
Properties | | Non-Stabilized Properties (6) | | Held for Sale Properties | | Total
Single-Family
Properties |
| Property count | 44,663 | | | 5,399 | | | 2,811 | | | 711 | | | 53,584 | |
| Average Occupied Days Percentage | 97.3 | % | | 98.4 | % | | 91.2 | % | | 80.5 | % | | 97.0 | % |
| | | | | | | | | |
| Rents from single-family properties | $ | 220,913 | | | $ | 28,260 | | | $ | 10,638 | | | $ | 3,161 | | | $ | 262,972 | |
| Fees from single-family properties | 3,858 | | | 500 | | | 301 | | | 29 | | | 4,688 | |
Bad debt (2) | (5,517) | | | (540) | | | (273) | | | (209) | | | (6,539) | |
| Core revenues | 219,254 | | | 28,220 | | | 10,666 | | | 2,981 | | | 261,121 | |
| | | | | | | | | |
| Property tax expense | 37,942 | | | 3,902 | | | 1,808 | | | 1,030 | | | 44,682 | |
HOA fees, net (3) | 4,242 | | | 482 | | | 286 | | | 85 | | | 5,095 | |
R&M and turnover costs, net (3)(4) | 15,876 | | | 1,415 | | | 1,158 | | | 536 | | | 18,985 | |
| Insurance | 2,021 | | | 309 | | | 112 | | | 50 | | | 2,492 | |
Property management expenses, net (5) | 17,385 | | | 2,329 | | | 1,366 | | | 358 | | | 21,438 | |
| Core property operating expenses | 77,466 | | | 8,437 | | | 4,730 | | | 2,059 | | | 92,692 | |
| | | | | | | | | |
| Core NOI | $ | 141,788 | | | $ | 19,783 | | | $ | 5,936 | | | $ | 922 | | | $ | 168,429 | |
| Core NOI margin | 64.7 | % | | 70.1 | % | | 55.7 | % | | 30.9 | % | | 64.5 | % |
(1)As a result of the COVID-19 pandemic, rents from single-family properties were impacted by the Company’s socially responsible decisions between April and July 2020 to waive month-to-month lease premiums and offer zero percent increases on newly signed renewal leases. Fees from single-family properties were also impacted as the Company waived late fees between April and July 2020.
(2)Includes increased uncollectible rents related to the COVID-19 pandemic of $3.6 million and $3.2 million for the total portfolio and Same-Home portfolio, respectively, during the three months ended December 31, 2020 and $12.8 million and $11.1 million for the total portfolio and Same-Home portfolio, respectively, during the year ended December 31, 2020.
(3)Presented net of tenant charge-backs.
(4)Includes increased uncollectible tenant utility reimbursements of $0.2 million and $0.2 million for the total portfolio and Same-Home portfolio, respectively, during the three months ended December 31, 2020 and $2.8 million and $2.6 million for the total portfolio and Same-Home portfolio, respectively, during the year ended December 31, 2020. Also includes costs associated with enhanced cleaning and safety protocols related to the COVID-19 pandemic of $0.5 million and $0.4 million for the total portfolio and Same-Home portfolio, respectively, during the year ended December 31, 2020.
(5)Presented net of tenant charge-backs and excludes noncash share-based compensation expense related to centralized and field property management employees.
(6)Includes 704 newly acquired properties that do not meet the definition of Stabilized Property at the start of the quarter and 2,107 legacy-tenant properties which have not experienced tenant turnover under our ownership (the majority of which were acquired through bulk acquisitions, such as the ARPI merger) or properties currently out of service due to a casualty loss.
| | | | | | | | |
| | |
| Refer to “Defined Terms and Non-GAAP Reconciliations” for definitions of metrics and reconciliations to GAAP. | | 12 |
Same-Home Results – Quarterly and Full Year Comparisons
(Amounts in thousands, except property and per property data)
(Unaudited)
| | | | | | | | | | | | | | | | | | | | | | | | | | | | | | | | | | | |
| For the Three Months Ended
Dec 31, | | | | For the Years Ended
Dec 31, | | |
| 2020 | | 2019 | | Change | | 2020 | | 2019 | | Change |
| Number of Same-Home properties | 44,663 | | | 44,663 | | | | | 44,663 | | | 44,663 | | | |
| Occupancy percentage as of period end | 97.6 | % | | 96.0 | % | | 1.6 | % | | 97.6 | % | | 96.0 | % | | 1.6 | % |
| Average Occupied Days Percentage | 97.3 | % | | 95.2 | % | | 2.1 | % | | 96.3 | % | | 95.4 | % | | 0.9 | % |
| Average Monthly Realized Rent per property | $ | 1,694 | | | $ | 1,651 | | | 2.6 | % | | $ | 1,680 | | | $ | 1,631 | | | 3.0 | % |
| Turnover Rate | 6.8 | % | | 7.3 | % | | (0.5) | % | | 33.1 | % | | 36.9 | % | | (3.8) | % |
| | | | | | | | | | | |
| | | | | | | | | | | |
| Core NOI: | | | | | | | | | | | |
Rents from single-family properties (1) | $ | 220,913 | | | $ | 210,809 | | | 4.8 | % | | $ | 867,380 | | | $ | 834,267 | | | 4.0 | % |
Fees from single-family properties (1) | 3,858 | | | 3,104 | | | 24.3 | % | | 13,350 | | | 11,579 | | | 15.3 | % |
Bad debt (2) | (5,517) | | | (2,125) | | | 159.6 | % | | (18,709) | | | (7,306) | | | 156.1 | % |
| Core revenues | 219,254 | | | 211,788 | | | 3.5 | % | | 862,021 | | | 838,540 | | | 2.8 | % |
| | | | | | | | | | | |
| Property tax expense | 37,942 | | | 36,837 | | | 3.0 | % | | 152,703 | | | 145,946 | | | 4.6 | % |
HOA fees, net (3) | 4,242 | | | 3,834 | | | 10.6 | % | | 16,264 | | | 17,232 | | | (5.6) | % |
R&M and turnover costs, net (3)(4) | 15,876 | | | 14,866 | | | 6.8 | % | | 69,429 | | | 64,481 | | | 7.7 | % |
| Insurance | 2,021 | | | 1,908 | | | 5.9 | % | | 7,977 | | | 7,576 | | | 5.3 | % |
Property management expenses, net (5) | 17,385 | | | 16,914 | | | 2.8 | % | | 69,500 | | | 67,707 | | | 2.6 | % |
| Core property operating expenses | 77,466 | | | 74,359 | | | 4.2 | % | | 315,873 | | | 302,942 | | | 4.3 | % |
| | | | | | | | | | | |
| Core NOI | $ | 141,788 | | | $ | 137,429 | | | 3.2 | % | | $ | 546,148 | | | $ | 535,598 | | | 2.0 | % |
| Core NOI margin | 64.7 | % | | 64.9 | % | | | | 63.4 | % | | 63.9 | % | | |
| | | | | | | | | | | |
Recurring Capital Expenditures (6) | 8,334 | | | 7,821 | | | 6.6 | % | | 39,763 | | | 34,464 | | | 15.4 | % |
| Core NOI After Capital Expenditures | $ | 133,454 | | | $ | 129,608 | | | 3.0 | % | | $ | 506,385 | | | $ | 501,134 | | | 1.0 | % |
| | | | | | | | | | | |
| Property Enhancing Capex | $ | 13,020 | | | $ | 5,629 | | | | | $ | 44,376 | | | $ | 19,826 | | | |
| | | | | | | | | | | |
| | | | | | | | | | | |
| Per property: | | | | | | | | | | | |
| Average Recurring Capital Expenditures | $ | 187 | | | $ | 175 | | | 6.6 | % | | $ | 890 | | | $ | 772 | | | 15.4 | % |
| Average R&M and turnover costs, net, plus Recurring Capital Expenditures | $ | 542 | | | $ | 508 | | | 6.7 | % | | $ | 2,445 | | | $ | 2,216 | | | 10.3 | % |
(1)As a result of the COVID-19 pandemic, rents from single-family properties were impacted by the Company’s socially responsible decisions between April and July 2020 to waive month-to-month lease premiums and offer zero percent increases on newly signed renewal leases. Fees from single-family properties were also impacted as the Company waived late fees between April and July 2020.
(2)Includes $3.2 million and $11.1 million of increased uncollectible rents related to the COVID-19 pandemic during the three months and year ended December 31, 2020, respectively.
(3)Presented net of tenant charge-backs.
(4)Includes $0.2 million and $2.6 million of increased uncollectible tenant utility reimbursements during the three months and year ended December 31, 2020, respectively, and $0.4 million of increased costs associated with enhanced cleaning and safety protocols related to the COVID-19 pandemic during the year ended December 31, 2020.
(5)Presented net of tenant charge-backs and excludes noncash share-based compensation expense related to centralized and field property management employees.
(6)Includes $3.0 million of incremental capital expenditures that primarily related to HVAC and home system replacements due to abnormally high home system usage during stay-at-home orders during the year ended December 31, 2020.
| | | | | | | | |
| | |
| Refer to “Defined Terms and Non-GAAP Reconciliations” for definitions of metrics and reconciliations to GAAP. | | 13 |
Same-Home Results – Sequential Quarterly Results
(Amounts in thousands, except per property data)
(Unaudited)
| | | | | | | | | | | | | | | | | | | | | | | | | | | | | |
| For the Three Months Ended |
| Dec 31,
2020 | | Sep 30,
2020 | | Jun 30,
2020 | | Mar 31,
2020 | | Dec 31,
2019 |
| Occupancy percentage as of period end | 97.6 | % | | 97.8 | % | | 96.9 | % | | 96.0 | % | | 96.0 | % |
| Average Occupied Days Percentage | 97.3 | % | | 96.9 | % | | 95.6 | % | | 95.3 | % | | 95.2 | % |
| Average Monthly Realized Rent per property | $ | 1,694 | | | $ | 1,685 | | | $ | 1,678 | | | $ | 1,664 | | | $ | 1,651 | |
| | | | | | | | | |
| Average Change in Rent for Renewals | 4.3 | % | | 1.1 | % | | 1.3 | % | | 4.6 | % | | 4.7 | % |
| Average Change in Rent for Re-Leases | 7.6 | % | | 5.9 | % | | 4.4 | % | | 3.3 | % | | 1.4 | % |
| Average Blended Change in Rent | 5.5 | % | | 2.8 | % | | 2.4 | % | | 4.1 | % | | 3.4 | % |
| | | | | | | | | |
| Core NOI: | | | | | | | | | |
Rents from single-family properties (1) | $ | 220,913 | | | $ | 218,905 | | | $ | 215,022 | | | $ | 212,540 | | | $ | 210,809 | |
Fees from single-family properties (1) | 3,858 | | | 3,553 | | | 2,611 | | | 3,328 | | | 3,104 | |
Bad debt (2) | (5,517) | | | (4,240) | | | (7,423) | | | (1,529) | | | (2,125) | |
| Core revenues | 219,254 | | | 218,218 | | | 210,210 | | | 214,339 | | | 211,788 | |
| | | | | | | | | |
| Property tax expense | 37,942 | | | 38,496 | | | 38,183 | | | 38,082 | | | 36,837 | |
HOA fees, net (3) | 4,242 | | | 4,219 | | | 4,078 | | | 3,725 | | | 3,834 | |
R&M and turnover costs, net (3)(4) | 15,876 | | | 20,165 | | | 19,164 | | | 14,224 | | | 14,866 | |
| Insurance | 2,021 | | | 2,021 | | | 2,000 | | | 1,935 | | | 1,908 | |
Property management expenses, net (5) | 17,385 | | | 16,886 | | | 17,375 | | | 17,854 | | | 16,914 | |
| Core property operating expenses | 77,466 | | | 81,787 | | | 80,800 | | | 75,820 | | | 74,359 | |
| | | | | | | | | |
| Core NOI | $ | 141,788 | | | $ | 136,431 | | | $ | 129,410 | | | $ | 138,519 | | | $ | 137,429 | |
| Core NOI margin | 64.7 | % | | 62.5 | % | | 61.6 | % | | 64.6 | % | | 64.9 | % |
| | | | | | | | | |
Recurring Capital Expenditures (6) | 8,334 | | | 13,166 | | | 10,601 | | | 7,662 | | | 7,821 | |
| Core NOI After Capital Expenditures | $ | 133,454 | | | $ | 123,265 | | | $ | 118,809 | | | $ | 130,857 | | | $ | 129,608 | |
| | | | | | | | | |
| Property Enhancing Capex | $ | 13,020 | | | $ | 13,469 | | | $ | 11,099 | | | $ | 6,788 | | | $ | 5,629 | |
| | | | | | | | | |
| Per property: | | | | | | | | | |
| Average Recurring Capital Expenditures | $ | 187 | | | $ | 295 | | | $ | 237 | | | $ | 171 | | | $ | 175 | |
| Average R&M and turnover costs, net, plus Recurring Capital Expenditures | $ | 542 | | | $ | 746 | | | $ | 666 | | | $ | 491 | | | $ | 508 | |
(1)As a result of the COVID-19 pandemic, rents from single-family properties were impacted by the Company’s socially responsible decisions between April and July 2020 to waive month-to-month lease premiums and offer zero percent increases on newly signed renewal leases. Fees from single-family properties were also impacted as the Company waived late fees between April and July 2020.
(2)Includes $6.0 million, $1.9 million and $3.2 million of increased uncollectible rents related to the COVID-19 pandemic during the second, third and fourth quarters of 2020, respectively.
(3)Presented net of tenant charge-backs.
(4)Includes $1.8 million, $0.6 million and $0.2 million of increased uncollectible tenant utility reimbursements during the second, third and fourth quarters of 2020, respectively, and $0.4 million of increased costs associated with enhanced cleaning and safety protocols related to the COVID-19 pandemic during the second quarter of 2020.
(5)Presented net of tenant charge-backs and excludes noncash share-based compensation expense related to centralized and field property management employees.
(6)Includes $1.2 million and $1.8 million of incremental capital expenditures that primarily related to HVAC and home system replacements due to abnormally high home system usage during stay-at-home orders during the second and third quarters of 2020, respectively.
| | | | | | | | |
| | |
| Refer to “Defined Terms and Non-GAAP Reconciliations” for definitions of metrics and reconciliations to GAAP. | | 14 |
Same-Home Results – Operating Metrics by Market
| | | | | | | | | | | | | | | | | | | | | | | | | | | | | | | | | | | |
| Number of Properties | | Gross Book Value per Property | | % of
4Q20 NOI | | Avg. Change in Rent for Renewals (1) | | Avg. Change in Rent for Re-Leases (1) | | Avg. Blended Change in Rent (1) |
| Atlanta, GA | 3,878 | | | $ | 178,155 | | | 8.2 | % | | 4.5 | % | | 10.1 | % | | 6.4 | % |
| Dallas-Fort Worth, TX | 3,770 | | | 166,096 | | | 7.8 | % | | 4.3 | % | | 4.4 | % | | 4.3 | % |
| Charlotte, NC | 3,252 | | | 192,178 | | | 7.9 | % | | 4.1 | % | | 8.4 | % | | 5.9 | % |
| Indianapolis, IN | 2,743 | | | 155,707 | | | 5.0 | % | | 4.2 | % | | 8.1 | % | | 5.7 | % |
| Houston, TX | 2,463 | | | 168,126 | | | 4.5 | % | | 3.9 | % | | 5.1 | % | | 4.3 | % |
| Phoenix, AZ | 2,293 | | | 172,343 | | | 5.5 | % | | 5.9 | % | | 17.0 | % | | 8.9 | % |
| Nashville, TN | 2,277 | | | 213,744 | | | 6.1 | % | | 4.0 | % | | 7.1 | % | | 5.1 | % |
| Jacksonville, FL | 1,993 | | | 170,915 | | | 4.3 | % | | 4.3 | % | | 8.5 | % | | 5.8 | % |
| Tampa, FL | 1,916 | | | 195,660 | | | 4.1 | % | | 4.3 | % | | 7.5 | % | | 5.6 | % |
| Cincinnati, OH | 1,927 | | | 177,143 | | | 4.4 | % | | 4.3 | % | | 7.9 | % | | 5.7 | % |
| Columbus, OH | 1,915 | | | 171,570 | | | 4.5 | % | | 4.4 | % | | 9.2 | % | | 5.9 | % |
| Raleigh, NC | 1,883 | | | 185,234 | | | 4.3 | % | | 4.0 | % | | 6.9 | % | | 5.0 | % |
| Greater Chicago area, IL and IN | 1,691 | | | 184,453 | | | 3.3 | % | | 3.7 | % | | 6.0 | % | | 4.5 | % |
| Orlando, FL | 1,399 | | | 179,337 | | | 2.9 | % | | 3.9 | % | | 5.4 | % | | 4.5 | % |
| Salt Lake City, UT | 1,249 | | | 239,381 | | | 3.8 | % | | 4.1 | % | | 8.5 | % | | 5.6 | % |
| Charleston, SC | 984 | | | 193,306 | | | 2.4 | % | | 4.3 | % | | 5.6 | % | | 5.0 | % |
| Las Vegas, NV | 910 | | | 178,904 | | | 2.1 | % | | 4.8 | % | | 10.0 | % | | 6.6 | % |
| San Antonio, TX | 900 | | | 161,852 | | | 1.7 | % | | 4.0 | % | | 3.8 | % | | 3.9 | % |
| Savannah/Hilton Head, SC | 811 | | | 178,778 | | | 1.8 | % | | 3.8 | % | | 7.0 | % | | 5.2 | % |
| Winston Salem, NC | 706 | | | 158,753 | | | 1.5 | % | | 4.8 | % | | 8.5 | % | | 6.2 | % |
All Other (2) | 5,703 | | | 197,856 | | | 13.9 | % | | 4.0 | % | | 7.8 | % | | 5.4 | % |
| Total/Average | 44,663 | | | $ | 182,371 | | | 100.0 | % | | 4.3 | % | | 7.6 | % | | 5.5 | % |
| | | | | | | | | | | | | | | | | | | | | | | | | | | | | | | | | | | |
| Average Occupied Days Percentage | | Average Monthly Realized Rent per Property |
| 4Q20 QTD | | 4Q19 QTD | | Change | | 4Q20 QTD | | 4Q19 QTD | | Change |
| Atlanta, GA | 97.7 | % | | 95.2 | % | | 2.5 | % | | $ | 1,689 | | | $ | 1,632 | | | 3.5 | % |
| Dallas-Fort Worth, TX | 97.3 | % | | 94.9 | % | | 2.4 | % | | 1,812 | | | 1,775 | | | 2.1 | % |
| Charlotte, NC | 97.5 | % | | 95.0 | % | | 2.5 | % | | 1,651 | | | 1,616 | | | 2.2 | % |
| Indianapolis, IN | 97.4 | % | | 95.2 | % | | 2.2 | % | | 1,486 | | | 1,446 | | | 2.8 | % |
| Houston, TX | 96.8 | % | | 95.3 | % | | 1.5 | % | | 1,695 | | | 1,663 | | | 1.9 | % |
| Phoenix, AZ | 98.3 | % | | 95.5 | % | | 2.8 | % | | 1,544 | | | 1,469 | | | 5.1 | % |
| Nashville, TN | 95.4 | % | | 93.9 | % | | 1.5 | % | | 1,797 | | | 1,760 | | | 2.1 | % |
| Jacksonville, FL | 97.3 | % | | 95.2 | % | | 2.1 | % | | 1,626 | | | 1,596 | | | 1.9 | % |
| Tampa, FL | 97.5 | % | | 95.4 | % | | 2.1 | % | | 1,760 | | | 1,738 | | | 1.3 | % |
| Cincinnati, OH | 97.3 | % | | 96.0 | % | | 1.3 | % | | 1,674 | | | 1,621 | | | 3.3 | % |
| Columbus, OH | 98.6 | % | | 96.3 | % | | 2.3 | % | | 1,715 | | | 1,658 | | | 3.4 | % |
| Raleigh, NC | 96.7 | % | | 93.9 | % | | 2.8 | % | | 1,584 | | | 1,556 | | | 1.8 | % |
| Greater Chicago area, IL and IN | 97.3 | % | | 95.1 | % | | 2.2 | % | | 1,911 | | | 1,886 | | | 1.3 | % |
| Orlando, FL | 96.7 | % | | 95.6 | % | | 1.1 | % | | 1,747 | | | 1,697 | | | 2.9 | % |
| Salt Lake City, UT | 98.1 | % | | 96.4 | % | | 1.7 | % | | 1,840 | | | 1,788 | | | 2.9 | % |
| Charleston, SC | 97.3 | % | | 95.3 | % | | 2.0 | % | | 1,753 | | | 1,708 | | | 2.6 | % |
| Las Vegas, NV | 97.7 | % | | 95.1 | % | | 2.6 | % | | 1,639 | | | 1,600 | | | 2.4 | % |
| San Antonio, TX | 95.5 | % | | 95.0 | % | | 0.5 | % | | 1,584 | | | 1,560 | | | 1.5 | % |
| Savannah/Hilton Head, SC | 98.0 | % | | 94.3 | % | | 3.7 | % | | 1,606 | | | 1,574 | | | 2.0 | % |
| Winston Salem, NC | 97.7 | % | | 94.8 | % | | 2.9 | % | | 1,427 | | | 1,388 | | | 2.8 | % |
All Other (2) | 97.5 | % | | 95.7 | % | | 1.8 | % | | 1,752 | | | 1,708 | | | 2.6 | % |
| Total/Average | 97.3 | % | | 95.2 | % | | 2.1 | % | | $ | 1,694 | | | $ | 1,651 | | | 2.6 | % |
(1)Reflected for the three months ended December 31, 2020.
(2)Represents 15 markets in 14 states.
| | | | | | | | |
| | |
| Refer to “Defined Terms and Non-GAAP Reconciliations” for definitions of metrics and reconciliations to GAAP. | | 15 |
Consolidated Balance Sheets
(Amounts in thousands)
| | | | | | | | | | | |
| Dec 31, 2020 | | Dec 31, 2019 |
| (Unaudited) | | |
| Assets | | | |
| Single-family properties: | | | |
| Land | $ | 1,836,798 | | | $ | 1,756,504 | |
| Buildings and improvements | 8,163,023 | | | 7,691,877 | |
| Single-family properties in operation | 9,999,821 | | | 9,448,381 | |
| Less: accumulated depreciation | (1,754,433) | | | (1,462,105) | |
| Single-family properties in operation, net | 8,245,388 | | | 7,986,276 | |
| Single-family properties under development and development land | 510,365 | | | 355,427 | |
| Single-family properties held for sale, net | 129,026 | | | 209,828 | |
| Total real estate assets, net | 8,884,779 | | | 8,551,531 | |
| Cash and cash equivalents | 137,060 | | | 37,575 | |
| Restricted cash | 128,017 | | | 126,544 | |
| Rent and other receivables | 41,544 | | | 29,618 | |
| Escrow deposits, prepaid expenses and other assets | 163,171 | | | 140,961 | |
| Investments in unconsolidated joint ventures | 93,109 | | | 67,935 | |
| Asset-backed securitization certificates | 25,666 | | | 25,666 | |
| Goodwill | 120,279 | | | 120,279 | |
| Total assets | $ | 9,593,625 | | | $ | 9,100,109 | |
| | | |
| Liabilities | | | |
| Revolving credit facility | $ | — | | | $ | — | |
| | | |
| Asset-backed securitizations, net | 1,927,607 | | | 1,945,044 | |
| Unsecured senior notes, net | 889,805 | | | 888,453 | |
| | | |
| | | |
| Accounts payable and accrued expenses | 298,949 | | | 243,193 | |
| Amounts payable to affiliates | 4,834 | | | 4,629 | |
| | | |
| Total liabilities | 3,121,195 | | | 3,081,319 | |
| | | |
| Commitments and contingencies | | | |
| | | |
| Equity | | | |
| Shareholders' equity: | | | |
| Class A common shares | 3,160 | | | 3,001 | |
| Class B common shares | 6 | | | 6 | |
| Preferred shares | 354 | | | 354 | |
| Additional paid-in capital | 6,223,256 | | | 5,790,775 | |
| Accumulated deficit | (443,522) | | | (465,368) | |
| Accumulated other comprehensive income | 5,840 | | | 6,658 | |
| Total shareholders' equity | 5,789,094 | | | 5,335,426 | |
| Noncontrolling interest | 683,336 | | | 683,364 | |
| Total equity | 6,472,430 | | | 6,018,790 | |
| | | |
| Total liabilities and equity | $ | 9,593,625 | | | $ | 9,100,109 | |
| | | | | | | | |
| | |
| Refer to “Defined Terms and Non-GAAP Reconciliations” for definitions of metrics and reconciliations to GAAP. | | 16 |
Debt Summary as of December 31, 2020
(Amounts in thousands)
(Unaudited)
| | | | | | | | | | | | | | | | | | | | | | | | | | | | | | | | | | | |
| Secured | | Unsecured | | Total Balance | | % of Total | | Interest Rate (1) | | Years to Maturity (2) |
| Floating rate debt: | | | | | | | | | | | |
Revolving credit facility (3) | $ | — | | | $ | — | | | $ | — | | | — | % | | 1.34 | % | | 1.5 |
| | | | | | | | | | | |
| Total floating rate debt | — | | | — | | | — | | | — | % | | 1.34 | % | | 1.5 |
| | | | | | | | | | | |
| Fixed rate debt: | | | | | | | | | | | |
| AH4R 2014-SFR2 | 479,981 | | | — | | | 479,981 | | | 16.8 | % | | 4.42 | % | | 3.8 |
| AH4R 2014-SFR3 | 495,392 | | | — | | | 495,392 | | | 17.4 | % | | 4.40 | % | | 3.9 |
| AH4R 2015-SFR1 | 520,957 | | | — | | | 520,957 | | | 18.3 | % | | 4.14 | % | | 24.3 |
| AH4R 2015-SFR2 | 452,162 | | | — | | | 452,162 | | | 15.9 | % | | 4.36 | % | | 24.8 |
2028 unsecured senior notes (4) | — | | | 500,000 | | | 500,000 | | | 17.6 | % | | 4.08 | % | | 7.1 |
| 2029 unsecured senior notes | — | | | 400,000 | | | 400,000 | | | 14.0 | % | | 4.90 | % | | 8.1 |
| Total fixed rate debt | 1,948,492 | | | 900,000 | | | 2,848,492 | | | 100.0 | % | | 4.36 | % | | 12.1 |
| | | | | | | | | | | |
| Total Debt | $ | 1,948,492 | | | $ | 900,000 | | | 2,848,492 | | | 100.0 | % | | 4.36 | % | | 12.1 |
| | | | | | | | | | | |
| Unamortized discounts and loan costs | | | | | (31,080) | | | | | | | |
| Total debt per balance sheet | | | | | $ | 2,817,412 | | | | | | | |
| | | | | | | | | | | | | | |
Maturity Schedule by Year (2) | | Total Debt | | % of Total |
| 2021 | | $ | 20,714 | | | 0.7 | % |
| 2022 | | 20,714 | | | 0.7 | % |
| 2023 | | 20,714 | | | 0.7 | % |
| 2024 | | 954,439 | | | 33.5 | % |
| 2025 | | 10,302 | | | 0.4 | % |
| 2026 | | 10,302 | | | 0.4 | % |
| 2027 | | 10,302 | | | 0.4 | % |
| 2028 | | 510,302 | | | 17.9 | % |
| 2029 | | 410,302 | | | 14.4 | % |
| 2030 | | 10,302 | | | 0.4 | % |
| Thereafter | | 870,099 | | | 30.5 | % |
| Total | | $ | 2,848,492 | | | 100.0 | % |
(1)Interest rates are as of December 31, 2020.
(2)Years to maturity and maturity schedule reflect all debt on a fully extended basis.
(3)The interest rate shown above reflects the Company’s LIBOR-based borrowing rate, based on 1-month LIBOR and applicable margin as of period end. Balance reflects borrowings outstanding as of December 31, 2020.
(4)The stated interest rate on the 2028 unsecured senior notes is 4.25%, which was effectively hedged to yield an interest rate of 4.08%.
Interest Expense Reconciliation
| | | | | | | | | | | | | | | | | | | | | | | |
| For the Three Months Ended
Dec 31, | | For the Years Ended
Dec 31, |
| (Amounts in thousands) | 2020 | | 2019 | | 2020 | | 2019 |
| | | | | | | |
| | | | | | | |
| Interest expense per income statement and included in Core FFO attributable to common share and unit holders | $ | 28,498 | | | $ | 31,163 | | | $ | 117,038 | | | $ | 127,114 | |
| Less: amortization of discounts, loan costs and cash flow hedge | (1,867) | | | (1,869) | | | (7,431) | | | (7,457) | |
| Add: capitalized interest | 5,467 | | | 3,002 | | | 19,996 | | | 11,097 | |
| Cash interest | $ | 32,098 | | | $ | 32,296 | | | $ | 129,603 | | | $ | 130,754 | |
| | | | | | | | |
| | |
| Refer to “Defined Terms and Non-GAAP Reconciliations” for definitions of metrics and reconciliations to GAAP. | | 17 |
Capital Structure and Credit Metrics as of December 31, 2020
(Amounts in thousands, except share and per share data)
(Unaudited)
Total Capitalization
| | | | | | | | | | | | | | | | | |
| Total Debt | | | $ | 2,848,492 | | | 19.3 | % |
| | | | | |
| Total preferred shares | | | 883,750 | | | 6.0 | % |
| | | | | |
| Common equity at market value: | | | | | |
| Common shares outstanding | 316,656,460 | | | | | |
| Operating partnership units | 51,726,980 | | | | | |
| Total shares and units | 368,383,440 | | | | | |
| NYSE AMH Class A common share closing price at December 31, 2020 | $ | 30.00 | | | | | |
| Market value of common shares and operating partnership units | | | 11,051,503 | | | 74.7 | % |
| | | | | |
| Total Market Capitalization | | | $ | 14,783,745 | | | 100.0 | % |
Preferred Shares
| | | | | | | | | | | | | | | | | | | | | | | | | | | | | | | | | | | | | | |
| | Earliest
Redemption Date | | Outstanding Shares | | Per Share | | Total | | Annual Dividend Per Share | | Annual Dividend Amount |
| Series | | | | | | |
| 6.500% Series D Perpetual Preferred Shares | | 5/24/2021 | | 10,750,000 | | | $ | 25.00 | | | $ | 268,750 | | | $ | 1.625 | | | $ | 17,469 | |
| 6.350% Series E Perpetual Preferred Shares | | 6/29/2021 | | 9,200,000 | | | $ | 25.00 | | | 230,000 | | | $ | 1.588 | | | 14,605 | |
| 5.875% Series F Perpetual Preferred Shares | | 4/24/2022 | | 6,200,000 | | | $ | 25.00 | | | 155,000 | | | $ | 1.469 | | | 9,106 | |
| 5.875% Series G Perpetual Preferred Shares | | 7/17/2022 | | 4,600,000 | | | $ | 25.00 | | | 115,000 | | | $ | 1.469 | | | 6,756 | |
| 6.250% Series H Perpetual Preferred Shares | | 9/19/2023 | | 4,600,000 | | | $ | 25.00 | | | 115,000 | | | $ | 1.563 | | | 7,188 | |
| Total preferred shares | | | | 35,350,000 | | | | | $ | 883,750 | | | | | $ | 55,124 | |
| | | | | | | | | | | | | | | | | | | | | | | |
| Credit Ratios | | | Credit Ratings | | | | |
| | | | | | | |
| Net Debt to Adjusted EBITDAre | 4.4 x | | Rating Agency | | Rating | | Outlook |
| Debt and Preferred Shares to Adjusted EBITDAre | 6.2 x | | Moody's Investor Service | | Baa3 | | Stable |
| Fixed Charge Coverage | 3.2 x | | S&P Global Ratings | | BBB- | | Stable |
| Unencumbered Core NOI percentage | 66.6 | % | | | | | | |
| | | | | | | | | | | | | | |
| Unsecured Senior Notes Covenant Ratios | Requirement | | Actual |
| Ratio of Indebtedness to Total Assets | < | 60.0 | % | | 25.6 | % |
| Ratio of Secured Debt to Total Assets | < | 40.0 | % | | 17.4 | % |
| Ratio of Unencumbered Assets to Unsecured Debt | > | 150.0 | % | | 880.6 | % |
| Ratio of Consolidated Income Available for Debt Service to Interest Expense | > | 1.50 x | | 4.54 x |
| | | | | | | | | | | | | | |
| Unsecured Credit Facility Covenant Ratios | Requirement | | Actual |
| Ratio of Total Indebtedness to Total Asset Value | < | 60.0% | | 27.0% |
| Ratio of Secured Indebtedness to Total Asset Value | < | 40.0% | | 17.5% |
| Ratio of Unsecured Indebtedness to Unencumbered Asset Value | < | 60.0% | | 14.6% |
| Ratio of EBITDA to Fixed Charges | > | 1.75 x | | 2.94 x |
| Ratio of Unencumbered NOI to Unsecured Interest Expense | > | 1.75 x | | 10.14 x |
| | | | | | | | |
| | |
| Refer to “Defined Terms and Non-GAAP Reconciliations” for definitions of metrics and reconciliations to GAAP. | | 18 |
Top 20 Markets Summary as of December 31, 2020
Property Information (1)
| | | | | | | | | | | | | | | | | | | | | | | | | | | | | | | | |
| Market | | Number of
Properties | | Percentage
of Total
Properties | | Gross Book
Value per
Property | | Avg.
Sq. Ft. | | Avg. Age
(years) |
| Atlanta, GA | | 4,977 | | | 9.4 | % | | $ | 185,301 | | | 2,165 | | | 17.4 | |
| Dallas-Fort Worth, TX | | 4,313 | | | 8.2 | % | | 167,085 | | | 2,117 | | | 16.7 | |
| Charlotte, NC | | 3,811 | | | 7.2 | % | | 198,541 | | | 2,100 | | | 16.2 | |
| Phoenix, AZ | | 3,147 | | | 6.0 | % | | 179,899 | | | 1,837 | | | 17.2 | |
| Houston, TX | | 2,979 | | | 5.6 | % | | 166,244 | | | 2,094 | | | 15.0 | |
| Nashville, TN | | 2,907 | | | 5.5 | % | | 218,157 | | | 2,109 | | | 15.1 | |
| Indianapolis, IN | | 2,813 | | | 5.3 | % | | 155,613 | | | 1,930 | | | 18.2 | |
| Tampa, FL | | 2,464 | | | 4.7 | % | | 203,648 | | | 1,945 | | | 14.5 | |
| Jacksonville, FL | | 2,424 | | | 4.6 | % | | 183,807 | | | 1,937 | | | 14.6 | |
| Raleigh, NC | | 2,118 | | | 4.0 | % | | 187,288 | | | 1,878 | | | 15.4 | |
| Columbus, OH | | 2,062 | | | 3.9 | % | | 175,438 | | | 1,870 | | | 18.9 | |
| Cincinnati, OH | | 1,982 | | | 3.7 | % | | 177,441 | | | 1,852 | | | 18.4 | |
| Greater Chicago area, IL and IN | | 1,730 | | | 3.3 | % | | 184,161 | | | 1,869 | | | 19.3 | |
| Orlando, FL | | 1,743 | | | 3.3 | % | | 186,200 | | | 1,903 | | | 18.4 | |
| Salt Lake City, UT | | 1,595 | | | 3.0 | % | | 260,946 | | | 2,182 | | | 16.9 | |
| Charleston, SC | | 1,238 | | | 2.3 | % | | 204,280 | | | 1,971 | | | 12.3 | |
| Las Vegas, NV | | 1,127 | | | 2.1 | % | | 190,839 | | | 1,854 | | | 16.5 | |
| San Antonio, TX | | 938 | | | 1.8 | % | | 163,531 | | | 2,023 | | | 16.6 | |
| Savannah/Hilton Head, SC | | 917 | | | 1.7 | % | | 183,967 | | | 1,871 | | | 12.8 | |
| Denver, CO | | 831 | | | 1.6 | % | | 300,562 | | | 2,103 | | | 18.3 | |
All Other (3) | | 6,757 | | | 12.8 | % | | 193,950 | | | 1,876 | | | 15.8 | |
| Total/Average | | 52,873 | | | 100.0 | % | | $ | 189,129 | | | 1,987 | | | 16.4 | |
Leasing Information (1)
| | | | | | | | | | | | | | | | | | | | | | | | | | | | | | | | |
| Market | | Avg. Occupied Days Percentage (2) | | Avg. Monthly Realized Rent per Property (2) | | Avg. Change in Rent for Renewals (2) | | Avg. Change in Rent for Re-Leases (2) | | Avg. Blended Change in Rent (2) |
| Atlanta, GA | | 97.6 | % | | $ | 1,692 | | | 4.5 | % | | 9.8 | % | | 6.2 | % |
| Dallas-Fort Worth, TX | | 97.2 | % | | 1,819 | | | 4.2 | % | | 4.5 | % | | 4.4 | % |
| Charlotte, NC | | 97.6 | % | | 1,671 | | | 4.1 | % | | 8.6 | % | | 5.8 | % |
| Phoenix, AZ | | 97.8 | % | | 1,543 | | | 5.8 | % | | 17.1 | % | | 8.8 | % |
| Houston, TX | | 96.5 | % | | 1,700 | | | 3.9 | % | | 5.0 | % | | 4.3 | % |
| Nashville, TN | | 95.4 | % | | 1,798 | | | 3.9 | % | | 7.1 | % | | 5.1 | % |
| Indianapolis, IN | | 97.0 | % | | 1,493 | | | 4.2 | % | | 8.2 | % | | 5.7 | % |
| Tampa, FL | | 97.8 | % | | 1,770 | | | 4.3 | % | | 7.4 | % | | 5.5 | % |
| Jacksonville, FL | | 97.0 | % | | 1,644 | | | 4.3 | % | | 8.1 | % | | 5.7 | % |
| Raleigh, NC | | 96.6 | % | | 1,598 | | | 4.0 | % | | 6.8 | % | | 5.0 | % |
| Columbus, OH | | 98.4 | % | | 1,722 | | | 4.4 | % | | 9.0 | % | | 5.9 | % |
| Cincinnati, OH | | 97.0 | % | | 1,675 | | | 4.3 | % | | 7.9 | % | | 5.7 | % |
| Greater Chicago area, IL and IN | | 97.0 | % | | 1,941 | | | 3.7 | % | | 6.4 | % | | 4.7 | % |
| Orlando, FL | | 96.6 | % | | 1,759 | | | 3.9 | % | | 5.9 | % | | 4.6 | % |
| Salt Lake City, UT | | 98.2 | % | | 1,864 | | | 4.2 | % | | 8.7 | % | | 5.8 | % |
| Charleston, SC | | 96.8 | % | | 1,779 | | | 4.3 | % | | 6.3 | % | | 5.3 | % |
| Las Vegas, NV | | 97.4 | % | | 1,671 | | | 4.8 | % | | 9.7 | % | | 6.5 | % |
| San Antonio, TX | | 94.9 | % | | 1,583 | | | 4.1 | % | | 3.8 | % | | 4.0 | % |
| Savannah/Hilton Head, SC | | 98.1 | % | | 1,624 | | | 3.8 | % | | 6.9 | % | | 5.2 | % |
| Denver, CO | | 95.7 | % | | 2,309 | | | 4.2 | % | | 4.8 | % | | 4.5 | % |
All Other (3) | | 97.4 | % | | 1,685 | | | 3.9 | % | | 8.1 | % | | 5.5 | % |
| Total/Average | | 97.2 | % | | $ | 1,708 | | | 4.3 | % | | 7.7 | % | | 5.5 | % |
(1)Property and leasing information excludes held for sale properties.
(2)Reflected for the three months ended December 31, 2020.
(3)Represents 15 markets in 14 states.
| | | | | | | | |
| | |
| Refer to “Defined Terms and Non-GAAP Reconciliations” for definitions of metrics and reconciliations to GAAP. | | 19 |
Property Additions
| | | | | | | | | | | | | | | | | | | | | | | | | | |
| | 4Q20 Additions | | 2020 Additions |
| Market | | Number of Properties | | Average Total Investment Cost (1) | | Number of Properties | | Average Total Investment Cost (1) |
| Atlanta, GA | | 68 | | | $ | 273,078 | | | 289 | | | $ | 250,889 | |
| Las Vegas, NV | | 52 | | | 303,909 | | | 90 | | | 304,261 | |
| Jacksonville, FL | | 51 | | | 261,291 | | | 194 | | | 258,878 | |
| Salt Lake City, UT | | 50 | | | 357,380 | | | 174 | | | 332,790 | |
| Nashville, TN | | 49 | | | 290,216 | | | 193 | | | 276,730 | |
| Tampa, FL | | 48 | | | 268,738 | | | 251 | | | 244,449 | |
| Phoenix, AZ | | 38 | | | 348,409 | | | 71 | | | 322,483 | |
| Raleigh, NC | | 29 | | | 246,104 | | | 73 | | | 250,683 | |
| Charlotte, NC | | 24 | | | 314,783 | | | 143 | | | 295,568 | |
| Austin, TX | | 22 | | | 229,457 | | | 118 | | | 213,588 | |
| Cincinnati, OH | | 17 | | | 257,197 | | | 17 | | | 257,197 | |
| Charleston, SC | | 16 | | | 268,256 | | | 114 | | | 252,735 | |
| Columbus, OH | | 16 | | | 276,792 | | | 40 | | | 261,179 | |
| Tucson, AZ | | 16 | | | 269,385 | | | 48 | | | 250,495 | |
| Indianapolis, IN | | 12 | | | 241,690 | | | 12 | | | 241,690 | |
| Orlando, FL | | 11 | | | 280,492 | | | 82 | | | 260,292 | |
| Greenville, SC | | 10 | | | 191,533 | | | 15 | | | 188,970 | |
| San Antonio, TX | | 10 | | | 253,030 | | | 10 | | | 253,030 | |
| Denver, CO | | 8 | | | 408,390 | | | 24 | | | 401,630 | |
| Dallas-Fort Worth, TX | | 5 | | | 265,376 | | | 25 | | | 251,307 | |
All Other (2) | | 11 | | | 277,717 | | | 120 | | | 303,569 | |
| Total/Average | | 563 | | | $ | 286,235 | | | 2,103 | | | $ | 270,596 | |
(1)Reflects on a per property basis Estimated Total Investment Cost of traditional channel acquisitions and purchase price, including closing costs, or total internal development costs of newly constructed homes.
(2)Represents 6 markets in 5 states.
Property Dispositions
| | | | | | | | | | | | | | | | | | | | | | | | | | | | | | | | |
| | Dec 31, 2020 Single-Family Properties Held for Sale | | 4Q20 Dispositions | | 2020 Dispositions |
| Market | | | Number of
Properties | | Average Net Proceeds per Property | | Number of
Properties | | Average Net Proceeds per Property |
| Inland Empire, CA | | 158 | | | 11 | | | $ | 346,545 | | | 35 | | | $ | 354,126 | |
| Greater Chicago area, IL and IN | | 131 | | | 16 | | | 195,875 | | | 98 | | | 177,924 | |
| Bay Area, CA | | 65 | | | 4 | | | 459,750 | | | 25 | | | 469,738 | |
| Central Valley, CA | | 62 | | | 6 | | | 291,333 | | | 35 | | | 251,385 | |
| Houston, TX | | 52 | | | 26 | | | 189,423 | | | 98 | | | 206,545 | |
| Atlanta, GA | | 38 | | | 28 | | | 234,964 | | | 142 | | | 222,470 | |
| Dallas-Fort Worth, TX | | 26 | | | 17 | | | 270,412 | | | 68 | | | 243,971 | |
| Oklahoma City, OK | | 22 | | | 16 | | | 169,750 | | | 177 | | | 170,935 | |
| Austin, TX | | 19 | | | 4 | | | 199,750 | | | 49 | | | 148,271 | |
| Nashville, TN | | 15 | | | 3 | | | 288,000 | | | 33 | | | 268,130 | |
| Orlando, FL | | 14 | | | 11 | | | 233,091 | | | 34 | | | 239,362 | |
| Tampa, FL | | 14 | | | 5 | | | 219,200 | | | 42 | | | 252,199 | |
| Miami, FL | | 13 | | | 3 | | | 215,000 | | | 9 | | | 277,206 | |
| Phoenix, AZ | | 10 | | | 3 | | | 217,000 | | | 15 | | | 248,991 | |
| San Antonio, TX | | 10 | | | 3 | | | 213,667 | | | 18 | | | 185,654 | |
| Cincinnati, OH | | 9 | | | 1 | | | 152,000 | | | 6 | | | 168,817 | |
| Denver, CO | | 6 | | | 4 | | | 390,500 | | | 6 | | | 393,880 | |
| Milwaukee, WI | | 6 | | | — | | | — | | | 3 | | | 279,585 | |
| Charlotte, NC | | 5 | | | 3 | | | 233,333 | | | 18 | | | 218,133 | |
| Greenville, SC | | 5 | | | — | | | — | | | 9 | | | 181,264 | |
All Other (1) | | 31 | | | 24 | | | 228,542 | | | 127 | | | 206,354 | |
| Total/Average | | 711 | | | 188 | | | $ | 236,750 | | | 1,047 | | | $ | 219,146 | |
(1)Represents 18 markets in 13 states.
| | | | | | | | |
| | |
| Refer to “Defined Terms and Non-GAAP Reconciliations” for definitions of metrics and reconciliations to GAAP. | | 20 |
AMH Development Pipeline Summary as of December 31, 2020
| | | | | | | | | | | | | | | | | | | | | | | | | | |
| | 2020 Deliveries | | Dec 31, 2020
Lots for
Future Delivery |
| Market | | Number of Properties | | Average Total Investment Cost | | Average
Monthly Rent | |
| Nashville, TN | | 220 | | | $ | 263,000 | | | $ | 1,850 | | | 653 | |
| Atlanta, GA | | 179 | | | 257,000 | | | 1,790 | | | 835 | |
| Tampa, FL | | 176 | | | 241,000 | | | 1,830 | | | 401 | |
| Charlotte, NC | | 165 | | | 291,000 | | | 2,000 | | | 787 | |
| Jacksonville, FL | | 155 | | | 253,000 | | | 1,790 | | | 550 | |
| Salt Lake City, UT | | 154 | | | 328,000 | | | 1,940 | | | 453 | |
| Austin, TX | | 116 | | | 213,000 | | | 1,800 | | | 99 | |
| Las Vegas, NV | | 105 | | | 287,000 | | | 1,940 | | | 998 | |
| Charleston, SC | | 101 | | | 243,000 | | | 1,800 | | | 370 | |
| Seattle, WA | | 98 | | | 370,000 | | | 2,400 | | | 418 | |
| Denver, CO | | 48 | | | 337,000 | | | 2,290 | | | 178 | |
| Raleigh, NC | | 38 | | | 254,000 | | | 1,830 | | | 74 | |
| Phoenix, AZ | | 34 | | | 271,000 | | | 1,920 | | | 332 | |
| Orlando, FL | | 33 | | | 275,000 | | | 1,890 | | | 420 | |
| Boise, ID | | 25 | | | 291,000 | | | 1,950 | | | 503 | |
| Total/Average | | 1,647 | | | $ | 274,000 | | | $ | 1,910 | | | 7,071 | |
Estimated Delivery Timing
| | | | | | | | | | | | | | | | | | | | | | |
| | 2020 Deliveries | | | | Estimated 2021 Deliveries (2) | | Thereafter |
| Consolidated development properties | | 1,158 | | | | 1,200—1,400 | | 4,575 |
Joint venture development properties (1) | | 489 | | | | 700—800 | | 446 |
| Total development properties | | 1,647 | | | | 1,900—2,200 | | 5,021 |
(1)Represents two unconsolidated joint ventures for each of which the Company holds a 20% interest.
(2)Reflects the Company’s latest development program estimates as of February 25, 2021.
| | | | | | | | |
| | |
| Refer to “Defined Terms and Non-GAAP Reconciliations” for definitions of metrics and reconciliations to GAAP. | | 21 |
Lease Expirations
| | | | | | | | | | | | | | | | | | | | | | | | | | | | | | | | | | | | | | |
| | MTM | | 1Q21 | | 2Q21 | | 3Q21 | | 4Q21 | | Thereafter |
| Lease expirations | | 2,252 | | | 10,654 | | | 13,541 | | | 12,157 | | | 8,018 | | | 5,041 | |
Share Repurchase / ATM Share Issuance History
(Amounts in thousands, except share and per share data)
| | | | | | | | | | | | | | | | | | | | | | | | | | | | | | | | | | | | | | |
| | Share Repurchases | | ATM Share Issuances |
| Period | | Common Shares Repurchased | | Purchase Price | | Avg. Price Paid Per Share | | Common Shares Issued | | Gross Proceeds | | Avg. Issuance Price Per Share |
| 2018 | | 1,804,163 | | | $ | 34,933 | | | $ | 19.36 | | | — | | | $ | — | | | $ | — | |
| 2019 | | — | | | — | | | — | | | — | | | — | | | — | |
| 1Q20 | | — | | | — | | | — | | | — | | | — | | | — | |
| 2Q20 | | — | | | — | | | — | | | — | | | — | | | — | |
| 3Q20 | | — | | | — | | | — | | | 86,130 | | | 2,414 | | | 28.03 | |
| 4Q20 | | — | | | — | | | — | | | — | | | — | | | — | |
| Total | | 1,804,163 | | | 34,933 | | | $ | 19.36 | | | 86,130 | | | 2,414 | | | $ | 28.03 | |
| | Remaining authorization: | | $ | 265,067 | | | | | Remaining authorization: | | $ | 497,586 | | | |
Home Price Appreciation Trends
The table below summarizes historic changes in the House Price Index of the Federal Housing Finance Agency (“FHFA”), known as the Quarterly Purchase-Only Index, specifically the non-seasonally adjusted “Purchase-Only Index” for the “100 Largest Metropolitan Statistical Areas.”
| | | | | | | | | | | | | | | | | | | | | | | | | | | | | | | | | | | | | | | | | | | | | | | | | | | | | | | | | | | | | | | | | | | | | | | | | | |
| | HPA Index (1) | | HPA Index Change |
Market (2) | | Dec 31, 2012 | | Dec 31, 2013 | | Dec 31, 2014 | | Dec 31, 2015 | | Dec 31, 2016 | | Dec 31, 2017 | | Dec 31, 2018 | | Dec 31, 2019 | | Mar 31, 2020 | | Jun 30, 2020 | | Sep 30, 2020 | |
| | | | | | | | | | | |
| Atlanta, GA | | 100.0 | | | 114.2 | | | 122.3 | | | 132.0 | | | 143.0 | | | 152.6 | | | 165.1 | | | 174.0 | | | 177.5 | | | 181.4 | | | 186.0 | | | 86.0 | % |
Dallas-Fort Worth, TX (3) | | 100.0 | | | 108.4 | | | 115.2 | | | 127.6 | | | 140.1 | | | 153.7 | | | 160.7 | | | 167.4 | | | 169.1 | | | 172.6 | | | 176.9 | | | 76.9 | % |
| Charlotte, NC | | 100.0 | | | 113.4 | | | 118.8 | | | 126.8 | | | 136.6 | | | 148.2 | | | 157.5 | | | 165.1 | | | 171.8 | | | 175.3 | | | 180.4 | | | 80.4 | % |
| Phoenix, AZ | | 100.0 | | | 118.0 | | | 123.3 | | | 135.9 | | | 146.1 | | | 157.2 | | | 170.2 | | | 180.7 | | | 187.0 | | | 193.2 | | | 199.0 | | | 99.0 | % |
| Houston, TX | | 100.0 | | | 110.8 | | | 123.1 | | | 130.1 | | | 133.0 | | | 137.0 | | | 139.7 | | | 144.4 | | | 146.0 | | | 148.8 | | | 146.5 | | | 46.5 | % |
| Nashville, TN | | 100.0 | | | 111.0 | | | 117.4 | | | 131.1 | | | 141.1 | | | 156.6 | | | 165.0 | | | 173.2 | | | 175.3 | | | 181.4 | | | 186.3 | | | 86.3 | % |
| Indianapolis, IN | | 100.0 | | | 106.4 | | | 112.3 | | | 117.8 | | | 124.5 | | | 134.2 | | | 142.3 | | | 152.7 | | | 157.2 | | | 162.9 | | | 167.4 | | | 67.4 | % |
| Tampa, FL | | 100.0 | | | 113.0 | | | 121.1 | | | 132.3 | | | 149.1 | | | 160.4 | | | 173.4 | | | 186.6 | | | 190.4 | | | 196.0 | | | 201.1 | | | 101.1 | % |
| Jacksonville, FL | | 100.0 | | | 114.2 | | | 121.7 | | | 127.7 | | | 142.3 | | | 150.6 | | | 166.7 | | | 177.6 | | | 180.8 | | | 183.5 | | | 185.9 | | | 85.9 | % |
| Raleigh, NC | | 100.0 | | | 106.7 | | | 111.6 | | | 120.0 | | | 130.8 | | | 135.8 | | | 146.0 | | | 153.0 | | | 153.3 | | | 161.3 | | | 162.8 | | | 62.8 | % |
| Columbus, OH | | 100.0 | | | 108.9 | | | 114.5 | | | 120.8 | | | 131.5 | | | 141.8 | | | 148.9 | | | 157.4 | | | 161.4 | | | 169.0 | | | 172.9 | | | 72.9 | % |
| Cincinnati, OH | | 100.0 | | | 104.9 | | | 111.2 | | | 115.7 | | | 121.4 | | | 128.3 | | | 136.2 | | | 143.2 | | | 144.8 | | | 151.1 | | | 158.5 | | | 58.5 | % |
Greater Chicago area,
IL and IN | | 100.0 | | | 111.0 | | | 115.1 | | | 118.8 | | | 126.3 | | | 130.5 | | | 133.7 | | | 135.5 | | | 137.4 | | | 140.4 | | | 143.7 | | | 43.7 | % |
| Orlando, FL | | 100.0 | | | 110.3 | | | 123.5 | | | 135.4 | | | 144.9 | | | 158.9 | | | 168.6 | | | 184.6 | | | 187.2 | | | 188.3 | | | 189.9 | | | 89.9 | % |
| Salt Lake City, UT | | 100.0 | | | 109.4 | | | 114.5 | | | 123.2 | | | 133.0 | | | 146.5 | | | 158.8 | | | 170.4 | | | 178.2 | | | 182.0 | | | 187.5 | | | 87.5 | % |
Charleston, SC (4) | | 100.0 | | | 109.4 | | | 119.9 | | | 137.0 | | | 148.0 | | | 165.5 | | | 165.8 | | | 171.4 | | | 177.6 | | | 180.9 | | | 188.6 | | | 88.6 | % |
| Las Vegas, NV | | 100.0 | | | 125.1 | | | 141.3 | | | 149.0 | | | 161.5 | | | 182.0 | | | 207.9 | | | 215.9 | | | 217.9 | | | 223.4 | | | 228.1 | | | 128.1 | % |
| San Antonio, TX | | 100.0 | | | 101.1 | | | 108.0 | | | 113.9 | | | 124.7 | | | 133.8 | | | 137.7 | | | 145.4 | | | 151.2 | | | 149.0 | | | 151.4 | | | 51.4 | % |
Savannah/Hilton Head, SC (4) | | 100.0 | | | 109.4 | | | 119.9 | | | 137.0 | | | 148.0 | | | 165.5 | | | 165.8 | | | 171.4 | | | 177.6 | | | 180.9 | | | 188.6 | | | 88.6 | % |
| Denver, CO | | 100.0 | | | 110.1 | | | 121.3 | | | 136.4 | | | 151.4 | | | 166.9 | | | 177.5 | | | 187.6 | | | 193.6 | | | 194.6 | | | 197.6 | | | 97.6 | % |
| Average | | | | | | | | | | | | | | | | | | | | | | | | 80.0 | % |
(1)Updates to the Quarterly Purchase-Only Index are released by the FHFA on approximately the 20th day of the second month following quarter-end. Accordingly, information in the above table has been presented through September 30, 2020. For the illustrative purposes of this table, the HPA Index has been indexed as of December 31, 2012, and, as such, HPA Index values presented are relative measures calculated in relation to the baseline index value of 100.0 as of December 31, 2012.
(2)Reflects top 20 markets as of December 31, 2020.
(3)Our Dallas-Fort Worth, TX market is comprised of the Dallas-Plano-Irving and Fort Worth-Arlington-Grapevine Metropolitan Divisions.
(4)Our Charleston, SC and Savannah/Hilton Head, SC markets are both indexed to the Charleston-North Charleston Metropolitan Division.
| | | | | | | | |
| | |
| Refer to “Defined Terms and Non-GAAP Reconciliations” for definitions of metrics and reconciliations to GAAP. | | 22 |
2021 Guidance
The Company is providing initial 2021 guidance based on its current and expected views of the single-family rental market and general economic conditions. However, the extent to which the pandemic may continue to impact us and our residents will continue to depend on future developments. These include resurgences, impact of government regulations, the speed and effectiveness of vaccine distribution and the direct and indirect economic effects of the pandemic and containment measures, among others. We will continue to monitor these events which may result in future revisions to our guidance estimates.
Guidance Summary
| | | | | |
| Full Year 2021 |
| Core FFO attributable to common share and unit holders | $1.22 - $1.28 |
| Core FFO attributable to common share and unit holders growth | 5.2% - 10.3% |
| |
| Same-Home | |
Core revenues growth (1) | 3.25% - 4.75% |
Core property operating expenses growth (2) | 4.00% - 5.50% |
| Core NOI growth | 2.75% - 4.25% |
(1)Includes full year bad debt assumption of 2.5% - 3.0% of rents from single-family properties, which contemplates potential uncertainties associated with ongoing COVID-19 impacts to macro-economic and regulatory environments.
(2)Comprised of expected property tax growth of 4.0% - 5.0% and all other operating expenses growth, excluding property taxes, of 4.5% - 5.5%.
Reconciliation of Core FFO attributable to common share and unit holders from 2020 to 2021 Guidance Midpoint
| | | | | |
| Per FFO Share
and Unit |
| 2020 Core FFO attributable to common share and unit holders | $ | 1.16 | |
| |
| Same-Home Core NOI | 0.06 | |
Non-Same-Home Core NOI (1) | 0.06 | |
| General and administrative expense | (0.01) | |
| Financing costs (share count and interest) | (0.02) | |
| |
| 2021 Core FFO attributable to common share and unit holders - Guidance Midpoint | $ | 1.25 | |
| 2021 Core FFO attributable to common share and unit holders growth - Guidance Midpoint | 7.8 | % |
(1)Core FFO growth from Non-Same-Home Core NOI includes (i) contribution from existing properties not included in the Company’s 2021 Same-Home portfolio, including 2020 additions, and (ii) contribution from 2021 wholly-owned portfolio additions that we expect to range between 2,500 and 2,900 properties, with an investment between $700.0 million and $900.0 million. In addition, we expect to invest (i) $250.0 million to $350.0 million of gross joint venture capital that includes 700 to 800 property deliveries and investment into the joint venture land and development pipeline and (ii) $250.0 million to $350.0 million into our wholly-owned land and development pipeline.
Note: The Company does not provide guidance for the most comparable GAAP financial measures of net income or loss, total revenues and property operating expenses, or a reconciliation of the above-listed forward-looking non-GAAP financial measures to the comparable GAAP financial measures because we are unable to reasonably predict certain items contained in the GAAP measures, including non-recurring and infrequent items that are not indicative of the Company’s ongoing operations. Such items include, but are not limited to, net gain or loss on sales and impairment of single-family properties, casualty loss, Non-Same-Home revenues and Non-Same-Home property operating expenses. These items are uncertain, depend on various factors and could have a material impact on our GAAP results for the guidance period.
| | | | | | | | |
| | |
| Refer to “Defined Terms and Non-GAAP Reconciliations” for definitions of metrics and reconciliations to GAAP. | | 23 |
Defined Terms and Non-GAAP Reconciliations
(Unaudited)
Average Blended Change in Rent
The percentage change in rent on all non-month-to-month lease renewals and re-leases during the period, compared to the annual rent of the previous expired non-month-to-month comparable long-term lease for each individual property.
Average Change in Rent for Re-Leases
The percentage change in annual rent on properties re-leased during the period, compared to the annual rent of the comparable long-term previous expired lease for each individual property.
Average Change in Rent for Renewals
The percentage change in rent on non-month-to-month comparable long-term lease renewals during the period.
Average Monthly Realized Rent
For the related period, Average Monthly Realized Rent is calculated as the lease component of rents and other single-family property revenues (i.e., rents from single-family properties) divided by the product of (a) number of properties and (b) Average Occupied Days Percentage, divided by the number of months. For properties partially owned during the period, this calculation is adjusted to reflect the number of days of ownership.
Average Occupied Days Percentage
The number of days a property is occupied in the period divided by the total number of days the property is owned during the same period after initially being placed in-service. This calculation excludes properties classified as held for sale except where presented for the Total Single-Family Properties portfolio.
Core Net Operating Income (“Core NOI”) and Same-Home Core NOI After Capital Expenditures
Core NOI, which we also present separately for our Same-Home, unencumbered and encumbered portfolios, is a supplemental non-GAAP financial measure that we define as core revenues, which is calculated as total revenues, excluding expenses reimbursed by tenant charge-backs and other revenues, less core property operating expenses, which is calculated as property operating and property management expenses, excluding noncash share-based compensation expense and expenses reimbursed by tenant charge-backs.
Core NOI also excludes (1) gain or loss on early extinguishment of debt, (2) hurricane-related charges, net, which result in material charges to the impacted single-family properties, (3) gain or loss on sales of single-family properties and other, (4) depreciation and amortization, (5) acquisition and other transaction costs incurred with business combinations and the acquisition or disposition of properties as well as nonrecurring items unrelated to ongoing operations, (6) noncash share-based compensation expense, (7) interest expense, (8) general and administrative expense, (9) other expenses and (10) other revenues. We believe Core NOI provides useful information to investors about the operating performance of our single-family properties without the impact of certain operating expenses that are reimbursed through tenant charge-backs. We further adjust Core NOI for our Same-Home portfolio by subtracting Recurring Capital Expenditures to calculate Same-Home Core NOI After Capital Expenditures, which we believe provides useful information to investors because it more fully reflects our operating performance after the impact of all property-level expenditures, regardless of whether they are capitalized or expensed.
Core NOI and Same-Home Core NOI After Capital Expenditures should be considered only as supplements to net income or loss as a measure of our performance and should not be used as measures of our liquidity, nor are they indicative of funds available to fund our cash needs, including our ability to pay dividends or make distributions. Additionally, these metrics should not be used as substitutes for net income or loss or net cash flows from operating activities (as computed in accordance with GAAP).
Defined Terms and Non-GAAP Reconciliations (continued)
(Unaudited)
The following are reconciliations of core revenues, Same-Home core revenues, core property operating expenses, Same-Home core property operating expenses, Core NOI, Same-Home Core NOI and Same-Home Core NOI After Capital Expenditures to their respective GAAP metrics for the three months and years ended December 31, 2020 and 2019 (amounts in thousands):
| | | | | | | | | | | | | | | | | | | | | | | |
| For the Three Months Ended
Dec 31, | | For the Years Ended
Dec 31, |
| 2020 | | 2019 | | 2020 | | 2019 |
| Core revenues and Same-Home core revenues | | | | | | | |
| Total revenues | $ | 299,335 | | | $ | 284,010 | | | $ | 1,182,836 | | | $ | 1,143,378 | |
| Tenant charge-backs | (35,430) | | | (36,290) | | | (160,807) | | | (159,851) | |
| Other revenues | (2,784) | | | (2,545) | | | (10,322) | | | (11,241) | |
| | | | | | | |
| Core revenues | 261,121 | | | 245,175 | | | 1,011,707 | | | 972,286 | |
| Less: Non-Same-Home core revenues | 41,867 | | | 33,387 | | | 149,686 | | | 133,746 | |
| Same-Home core revenues | $ | 219,254 | | | $ | 211,788 | | | $ | 862,021 | | | $ | 838,540 | |
| | | | | | | | | | | | | | | | | | | | | | | |
| | | |
| | | | | | | |
| Core property operating expenses and Same-Home core property operating expenses | | | | |
| Property operating expenses | $ | 106,160 | | | $ | 102,788 | | | $ | 450,267 | | | $ | 433,854 | |
| Property management expenses | 22,380 | | | 21,822 | | | 89,892 | | | 86,908 | |
| Noncash share-based compensation - property management | (418) | | | (353) | | | (1,745) | | | (1,342) | |
| Expenses reimbursed by tenant charge-backs | (35,430) | | | (36,290) | | | (160,807) | | | (159,851) | |
| | | | | | | |
| | | | | | | |
| Core property operating expenses | 92,692 | | | 87,967 | | | 377,607 | | | 359,569 | |
| Less: Non-Same-Home core property operating expenses | 15,226 | | | 13,608 | | | 61,734 | | | 56,627 | |
| Same-Home core property operating expenses | $ | 77,466 | | | $ | 74,359 | | | $ | 315,873 | | | $ | 302,942 | |
| | | | | | | | | | | | | | | | | | | | | | | |
| | | |
| | | | | | | |
| Core NOI, Same-Home Core NOI and Same-Home Core NOI After Capital Expenditures | | | | |
| | | | | | | |
| | | | | | | |
| | | | | | | |
| Net income | $ | 45,342 | | | $ | 41,464 | | | $ | 154,829 | | | $ | 156,260 | |
| | | | | | | |
| Loss on early extinguishment of debt | — | | | — | | | — | | | 659 | |
| | | | | | | |
| Gain on sale of single-family properties and other, net | (10,356) | | | (10,978) | | | (44,194) | | | (43,873) | |
| Depreciation and amortization | 88,500 | | | 83,219 | | | 343,153 | | | 329,293 | |
| Acquisition and other transaction costs | 3,579 | | | 769 | | | 9,298 | | | 3,224 | |
| Noncash share-based compensation - property management | 418 | | | 353 | | | 1,745 | | | 1,342 | |
| Interest expense | 28,498 | | | 31,163 | | | 117,038 | | | 127,114 | |
| General and administrative expense | 13,188 | | | 12,178 | | | 48,517 | | | 43,206 | |
| Other expenses | 2,044 | | | 1,585 | | | 14,036 | | | 6,733 | |
| Other revenues | (2,784) | | | (2,545) | | | (10,322) | | | (11,241) | |
| | | | | | | |
| Core NOI | 168,429 | | | 157,208 | | | 634,100 | | | 612,717 | |
| Less: Non-Same-Home Core NOI | 26,641 | | | 19,779 | | | 87,952 | | | 77,119 | |
| Same-Home Core NOI | 141,788 | | | 137,429 | | | 546,148 | | | 535,598 | |
| Less: Same-Home Recurring Capital Expenditures | 8,334 | | | 7,821 | | | 39,763 | | | 34,464 | |
| Same-Home Core NOI After Capital Expenditures | $ | 133,454 | | | $ | 129,608 | | | $ | 506,385 | | | $ | 501,134 | |
Defined Terms and Non-GAAP Reconciliations (continued)
(Unaudited)
The following are reconciliations of core revenues, Same-Home core revenues, core property operating expenses, Same-Home core property operating expenses, Core NOI, Same-Home Core NOI, Same-Home Core NOI After Capital Expenditures, Unencumbered Core NOI and Encumbered Core NOI to their respective GAAP metrics for the trailing five quarters (amounts in thousands):
| | | | | | | | | | | | | | | | | | | | | | | | | | | | | |
| For the Three Months Ended |
| Dec 31,
2020 | | Sep 30,
2020 | | Jun 30,
2020 | | Mar 31,
2020 | | Dec 31,
2019 |
| Core revenues and Same-Home core revenues | | | | | | | | | |
| Total revenues | $ | 299,335 | | | $ | 310,809 | | | $ | 283,098 | | | $ | 289,594 | | | $ | 284,010 | |
| Tenant charge-backs | (35,430) | | | (49,935) | | | (35,429) | | | (40,013) | | | (36,290) | |
| Other revenues | (2,784) | | | (2,877) | | | (2,409) | | | (2,252) | | | (2,545) | |
| | | | | | | | | |
| Core revenues | 261,121 | | | 257,997 | | | 245,260 | | | 247,329 | | | 245,175 | |
| Less: Non-Same-Home core revenues | 41,867 | | | 39,779 | | | 35,050 | | | 32,990 | | | 33,387 | |
| Same-Home core revenues | $ | 219,254 | | | $ | 218,218 | | | $ | 210,210 | | | $ | 214,339 | | | $ | 211,788 | |
| | | | | | | | | | | | | | | | | | | | | | | | | | | | | |
| Core property operating expenses and Same-Home core property operating expenses | | | | | | |
| Property operating expenses | $ | 106,160 | | | $ | 126,174 | | | $ | 110,436 | | | $ | 107,497 | | | $ | 102,788 | |
| Property management expenses | 22,380 | | | 21,976 | | | 22,260 | | | 23,276 | | | 21,822 | |
| Noncash share-based compensation - property management | (418) | | | (447) | | | (441) | | | (439) | | | (353) | |
| Expenses reimbursed by tenant charge-backs | (35,430) | | | (49,935) | | | (35,429) | | | (40,013) | | | (36,290) | |
| | | | | | | | | |
| | | | | | | | | |
| Core property operating expenses | 92,692 | | | 97,768 | | | 96,826 | | | 90,321 | | | 87,967 | |
| Less: Non-Same-Home core property operating expenses | 15,226 | | | 15,981 | | | 16,026 | | | 14,501 | | | 13,608 | |
| Same-Home core property operating expenses | $ | 77,466 | | | $ | 81,787 | | | $ | 80,800 | | | $ | 75,820 | | | $ | 74,359 | |
| | | | | | | | | | | | | | | | | | | | | | | | | | | | | |
| Core NOI, Same-Home Core NOI and Same-Home Core NOI After Capital Expenditures |
| Net income | $ | 45,342 | | | $ | 40,153 | | | $ | 31,807 | | | $ | 37,527 | | | $ | 41,464 | |
| | | | | | | | | |
| | | | | | | | | |
| | | | | | | | | |
| Gain on sale of single-family properties and other, net | (10,356) | | | (12,422) | | | (10,651) | | | (10,765) | | | (10,978) | |
| Depreciation and amortization | 88,500 | | | 86,996 | | | 84,836 | | | 82,821 | | | 83,219 | |
| Acquisition and other transaction costs | 3,579 | | | 1,616 | | | 1,956 | | | 2,147 | | | 769 | |
| Noncash share-based compensation - property management | 418 | | | 447 | | | 441 | | | 439 | | | 353 | |
| Interest expense | 28,498 | | | 29,267 | | | 29,558 | | | 29,715 | | | 31,163 | |
| General and administrative expense | 13,188 | | | 12,570 | | | 11,493 | | | 11,266 | | | 12,178 | |
| Other expenses | 2,044 | | | 4,479 | | | 1,403 | | | 6,110 | | | 1,585 | |
| Other revenues | (2,784) | | | (2,877) | | | (2,409) | | | (2,252) | | | (2,545) | |
| | | | | | | | | |
| Core NOI | 168,429 | | | 160,229 | | | 148,434 | | | 157,008 | | | 157,208 | |
| Less: Non-Same-Home Core NOI | 26,641 | | | 23,798 | | | 19,024 | | | 18,489 | | | 19,779 | |
| Same-Home Core NOI | 141,788 | | | 136,431 | | | 129,410 | | | 138,519 | | | 137,429 | |
| Less: Same-Home Recurring Capital Expenditures | 8,334 | | | 13,166 | | | 10,601 | | | 7,662 | | | 7,821 | |
| Same-Home Core NOI After Capital Expenditures | $ | 133,454 | | | $ | 123,265 | | | $ | 118,809 | | | $ | 130,857 | | | $ | 129,608 | |
| | | | | | | | | | | | | | | | | | | | | | | | | | | | | |
| Unencumbered Core NOI and Encumbered Core NOI | | | | | | | | | |
| Core NOI | $ | 168,429 | | | $ | 160,229 | | | $ | 148,434 | | | $ | 157,008 | | | $ | 157,208 | |
| Less: Encumbered Core NOI | 55,432 | | | 52,573 | | | 50,135 | | | 53,881 | | | 53,679 | |
| Unencumbered Core NOI | $ | 112,997 | | | $ | 107,656 | | | $ | 98,299 | | | $ | 103,127 | | | $ | 103,529 | |
Defined Terms and Non-GAAP Reconciliations (continued)
(Unaudited)
Credit Ratios
We present the following selected metrics because we believe they are helpful as supplemental measures in assessing the Company’s ability to service its financing obligations and in evaluating balance sheet leverage against that of other real estate companies. The tables below reconcile these metrics, which are calculated in part based on several non-GAAP financial measures.
Debt and Preferred Shares to Adjusted EBITDAre
| | | | | |
| (Amounts in thousands) | Dec 31,
2020 |
| Total Debt | $ | 2,848,492 | |
| Preferred shares at liquidation value | 883,750 | |
| Total Debt and preferred shares | $ | 3,732,242 | |
| |
| Adjusted EBITDAre - TTM | $ | 598,806 | |
| |
| Debt and Preferred Shares to Adjusted EBITDAre | 6.2 x |
Fixed Charge Coverage
| | | | | |
| (Amounts in thousands) | For the Trailing Twelve Months Ended
Dec 31, 2020 |
| Interest expense per income statement | $ | 117,038 | |
| Less: amortization of discounts, loan costs and cash flow hedge | (7,431) | |
| Add: capitalized interest | 19,996 | |
| Cash interest | 129,603 | |
| Dividends on preferred shares | 55,128 | |
| Fixed charges | $ | 184,731 | |
| |
| Adjusted EBITDAre - TTM | $ | 598,806 | |
| |
| Fixed Charge Coverage | 3.2 x |
Net Debt to Adjusted EBITDAre
| | | | | | | | | | | | | | | | | | | | | | | | | | | | | |
| (Amounts in thousands) | Dec 31,
2020 | | Sep 30,
2020 | | Jun 30,
2020 | | Mar 31,
2020 | | Dec 31,
2019 |
| Total Debt | $ | 2,848,492 | | | $ | 2,853,883 | | | $ | 2,989,230 | | | $ | 2,970,558 | | | $ | 2,870,993 | |
| Less: cash and cash equivalents | (137,060) | | | (315,808) | | | (32,010) | | | (33,108) | | | (37,575) | |
| Less: asset-backed securitization certificates | (25,666) | | | (25,666) | | | (25,666) | | | (25,666) | | | (25,666) | |
| Less: restricted cash related to securitizations | (36,015) | | | (35,315) | | | (39,892) | | | (42,060) | | | (40,558) | |
| Net Debt | $ | 2,649,751 | | | $ | 2,477,094 | | | $ | 2,891,662 | | | $ | 2,869,724 | | | $ | 2,767,194 | |
| | | | | | | | | |
| Adjusted EBITDAre - TTM | $ | 598,806 | | | $ | 588,847 | | | $ | 582,003 | | | $ | 588,225 | | | $ | 582,945 | |
| | | | | | | | | |
| Net Debt to Adjusted EBITDAre | 4.4 x | | 4.2 x | | 5.0 x | | 4.9 x | | 4.7 x |
Defined Terms and Non-GAAP Reconciliations (continued)
(Unaudited)
Unencumbered Core NOI Percentage
| | | | | | | | | | | | | | | | | | | | | | | | | | | | | |
| For the Three Months Ended | | For the Trailing Twelve Months Ended
Dec 31, 2020 |
| (Amounts in thousands) | Mar 31,
2020 | | Jun 30,
2020 | | Sep 30,
2020 | | Dec 31,
2020 | |
| Unencumbered Core NOI | $ | 103,127 | | | $ | 98,299 | | | $ | 107,656 | | | $ | 112,997 | | | $ | 422,079 | |
| Core NOI | 157,008 | | | 148,434 | | | 160,229 | | | 168,429 | | | 634,100 | |
| Unencumbered Core NOI Percentage | | | | | | | | | 66.6 | % |
EBITDA / EBITDAre / Adjusted EBITDAre / Fully Adjusted EBITDAre / Adjusted EBITDAre Margin / Fully Adjusted EBITDAre Margin
EBITDA is defined as earnings before interest, taxes, depreciation and amortization. EBITDA is a non-GAAP financial measure and is used by us and others as a supplemental measure of performance. EBITDAre is a supplemental non-GAAP financial measure, which we calculate in accordance with the definition approved by the National Association of Real Estate Investment Trusts (“NAREIT”) by adjusting EBITDA for the net gain or loss on sales / impairment of single-family properties and other and adjusting for unconsolidated partnerships and joint ventures on the same basis. Adjusted EBITDAre is a supplemental non-GAAP financial measure calculated by adjusting EBITDAre for (1) acquisition and other transaction costs incurred with business combinations and the acquisition or disposition of properties as well as nonrecurring items unrelated to ongoing operations, (2) noncash share-based compensation expense, (3) hurricane-related charges, net, which result in material charges to the impacted single-family properties, and (4) gain or loss on early extinguishment of debt. Fully Adjusted EBITDAre (formerly known as Adjusted EBITDAre after Capex and Leasing Costs) is a supplemental non-GAAP financial measure calculated by adjusting Adjusted EBITDAre for (1) Recurring Capital Expenditures and (2) leasing costs. Adjusted EBITDAre Margin is a supplemental non-GAAP financial measure calculated as Adjusted EBITDAre divided by total revenues, net of tenant charge-backs and adjusted for unconsolidated joint ventures. Fully Adjusted EBITDAre Margin is a supplemental non-GAAP financial measure calculated as Fully Adjusted EBITDAre divided by total revenues, net of tenant charge-backs and adjusted for unconsolidated joint ventures. We believe these metrics provide useful information to investors because they exclude the impact of various income and expense items that are not indicative of operating performance.
Defined Terms and Non-GAAP Reconciliations (continued)
(Unaudited)
The following is a reconciliation of net income, as determined in accordance with GAAP, to EBITDA, EBITDAre, Adjusted EBITDAre, Fully Adjusted EBITDAre, Adjusted EBITDAre Margin and Fully Adjusted EBITDAre Margin for the three months and years ended December 31, 2020 and 2019 (amounts in thousands):
| | | | | | | | | | | | | | | | | | | | | | | |
| For the Three Months Ended
Dec 31, | | For the Years Ended
Dec 31, |
| 2020 | | 2019 | | 2020 | | 2019 |
| Net income | $ | 45,342 | | | $ | 41,464 | | | $ | 154,829 | | | $ | 156,260 | |
| Interest expense | 28,498 | | | 31,163 | | | 117,038 | | | 127,114 | |
| Depreciation and amortization | 88,500 | | | 83,219 | | | 343,153 | | | 329,293 | |
| EBITDA | $ | 162,340 | | | $ | 155,846 | | | $ | 615,020 | | | $ | 612,667 | |
| | | | | | | |
| Net (gain) on sale / impairment of single-family properties and other | (10,206) | | | (10,398) | | | (38,107) | | | (40,210) | |
| Adjustments for unconsolidated joint ventures | 333 | | | 821 | | | 1,352 | | | 1,797 | |
| EBITDAre | $ | 152,467 | | | $ | 146,269 | | | $ | 578,265 | | | $ | 574,254 | |
| | | | | | | |
| Noncash share-based compensation - general and administrative | 1,832 | | | 946 | | | 6,573 | | | 3,466 | |
| Noncash share-based compensation - property management | 418 | | | 353 | | | 1,745 | | | 1,342 | |
Acquisition, other transaction costs and other (1) | 3,579 | | | 769 | | | 12,223 | | | 3,224 | |
| | | | | | | |
| Loss on early extinguishment of debt | — | | | — | | | — | | | 659 | |
| | | | | | | |
| Adjusted EBITDAre | $ | 158,296 | | | $ | 148,337 | | | $ | 598,806 | | | $ | 582,945 | |
| | | | | | | |
| Recurring Capital Expenditures | (9,756) | | | (9,332) | | | (46,048) | | | (39,997) | |
| Leasing costs | (1,011) | | | (851) | | | (4,070) | | | (4,095) | |
| Fully Adjusted EBITDAre | $ | 147,529 | | | $ | 138,154 | | | $ | 548,688 | | | $ | 538,853 | |
| | | | | | | |
| Total revenues | $ | 299,335 | | | $ | 284,010 | | | $ | 1,182,836 | | | $ | 1,143,378 | |
| Less: tenant charge-backs | (35,430) | | | (36,290) | | | (160,807) | | | (159,851) | |
| Adjustments for unconsolidated joint ventures | 333 | | | 821 | | | 1,352 | | | 1,797 | |
| | | | | | | |
| Total revenues, net of tenant charge-backs and adjustments for unconsolidated joint ventures | $ | 264,238 | | | $ | 248,541 | | | $ | 1,023,381 | | | $ | 985,324 | |
| | | | | | | |
| Adjusted EBITDAre Margin | 59.9 | % | | 59.7 | % | | 58.5 | % | | 59.2 | % |
| | | | | | | |
| Fully Adjusted EBITDAre Margin | 55.8 | % | | 55.6 | % | | 53.6 | % | | 54.7 | % |
(1)Included in acquisition, other transaction costs and other is a net $2.9 million nonrecurring expense related to a legal matter involving a former employee during the year ended December 31, 2020.
Defined Terms and Non-GAAP Reconciliations (continued)
(Unaudited)
The following is a reconciliation of net income, as determined in accordance with GAAP, to EBITDA, EBITDAre and Adjusted EBITDAre for the following trailing twelve-month periods (amounts in thousands):
| | | | | | | | | | | | | | | | | | | | | | | | | | | | | |
| For the Trailing Twelve Months Ended |
| Dec 31,
2020 | | Sep 30,
2020 | | Jun 30,
2020 | | Mar 31,
2020 | | Dec 31,
2019 |
| Net income | $ | 154,829 | | | $ | 150,951 | | | $ | 152,199 | | | $ | 160,696 | | | $ | 156,260 | |
| Interest expense | 117,038 | | | 119,703 | | | 121,901 | | | 124,914 | | | 127,114 | |
| Depreciation and amortization | 343,153 | | | 337,872 | | | 332,949 | | | 330,953 | | | 329,293 | |
| EBITDA | $ | 615,020 | | | $ | 608,526 | | | $ | 607,049 | | | $ | 616,563 | | | $ | 612,667 | |
| | | | | | | | | |
| Net (gain) on sale / impairment of single-family properties and other | (38,107) | | | (38,299) | | | (38,176) | | | (40,679) | | | (40,210) | |
| Adjustments for unconsolidated joint ventures | 1,352 | | | 1,840 | | | 1,122 | | | 1,481 | | | 1,797 | |
| EBITDAre | $ | 578,265 | | | $ | 572,067 | | | $ | 569,995 | | | $ | 577,365 | | | $ | 574,254 | |
| | | | | | | | | |
| Noncash share-based compensation - general and administrative | 6,573 | | | 5,687 | | | 4,902 | | | 4,176 | | | 3,466 | |
| Noncash share-based compensation - property management | 1,745 | | | 1,680 | | | 1,583 | | | 1,488 | | | 1,342 | |
Acquisition, other transaction costs and other (1) | 12,223 | | | 9,413 | | | 5,523 | | | 4,537 | | | 3,224 | |
| | | | | | | | | |
| Loss on early extinguishment of debt | — | | | — | | | — | | | 659 | | | 659 | |
| | | | | | | | | |
| Adjusted EBITDAre | $ | 598,806 | | | $ | 588,847 | | | $ | 582,003 | | | $ | 588,225 | | | $ | 582,945 | |
(1)Included in acquisition, other transaction costs and other is a net $2.9 million nonrecurring expense related to a legal matter involving a former employee during the three months ended September 30, 2020.
Estimated Total Investment Cost
Represents the sum of purchase price, closing costs and if applicable, estimated initial renovation costs for homes purchased through traditional broker and trustee channels.
FFO / Core FFO / Adjusted FFO attributable to common share and unit holders
FFO attributable to common share and unit holders is a non-GAAP financial measure that we calculate in accordance with the definition approved by NAREIT, which defines FFO as net income or loss calculated in accordance with GAAP, excluding gains and losses from sales or impairment of real estate, plus real estate-related depreciation and amortization (excluding amortization of deferred financing costs and depreciation of non-real estate assets), and after adjustments for unconsolidated partnerships and joint ventures to reflect FFO on the same basis.
Core FFO attributable to common share and unit holders is a non-GAAP financial measure that we use as a supplemental measure of our performance. We compute this metric by adjusting FFO attributable to common share and unit holders for (1) acquisition and other transaction costs incurred with business combinations and the acquisition or disposition of properties as well as nonrecurring items unrelated to ongoing operations, (2) noncash share-based compensation expense, (3) hurricane-related charges, net, which result in material charges to the impacted single-family properties, and (4) gain or loss on early extinguishment of debt.
Adjusted FFO attributable to common share and unit holders is a non-GAAP financial measure that we use as a supplemental measure of our performance. We compute this metric by adjusting Core FFO attributable to common share and unit holders for (1) Recurring Capital Expenditures that are necessary to help preserve the value and maintain functionality of our properties and (2) capitalized leasing costs incurred during the period. As a portion of our homes are recently developed, acquired and/or renovated, we estimate Recurring Capital Expenditures for our entire portfolio by multiplying (a) current period actual Recurring Capital Expenditures per Same-Home Property by (b) our total number of properties, excluding newly acquired non-stabilized properties and properties classified as held for sale.
Defined Terms and Non-GAAP Reconciliations (continued)
(Unaudited)
We present FFO attributable to common share and unit holders, as well as on a per FFO share and unit basis, because we consider this metric to be an important measure of the performance of real estate companies, as do many investors and analysts in evaluating the Company. We believe that FFO attributable to common share and unit holders provides useful information to investors because this metric excludes depreciation, which is included in computing net income and assumes the value of real estate diminishes predictably over time. We believe that real estate values fluctuate due to market conditions and in response to inflation. We also believe that Core FFO and Adjusted FFO attributable to common share and unit holders, as well as on a per FFO share and unit basis, provide useful information to investors because they allow investors to compare our operating performance to prior reporting periods without the effect of certain items that, by nature, are not comparable from period to period.
FFO, Core FFO and Adjusted FFO attributable to common share and unit holders are not a substitute for net income or net cash provided by operating activities, each as determined in accordance with GAAP, as a measure of our operating performance, liquidity or ability to pay dividends. These metrics also are not necessarily indicative of cash available to fund future cash needs. Because other REITs may not compute these measures in the same manner, they may not be comparable among REITs.
Refer to Funds from Operations for a reconciliation of these metrics to net income attributable to common shareholders, determined in accordance with GAAP.
FFO Shares and Units
Includes weighted-average common shares and operating partnership units outstanding, as well as potentially dilutive securities.
Occupied Property
A property is classified as occupied upon commencement (i.e., start date) of a lease agreement, which can occur contemporaneously with or subsequent to execution (i.e., signature).
Defined Terms and Non-GAAP Reconciliations (continued)
(Unaudited)
Platform Efficiency Percentage
Management costs, including (1) property management expenses, net of tenant charge-backs and excluding noncash share-based compensation expense, (2) general and administrative expense, excluding noncash share-based compensation expense and (3) leasing costs, as a percentage of total revenues, net of tenant charge-backs and other revenues.
| | | | | | | | | | | | | | | | | | | | | | | |
| For the Three Months Ended
Dec 31, | | For the Years Ended
Dec 31, |
| (Amounts in thousands) | 2020 | | 2019 | | 2020 | | 2019 |
| Property management expenses | $ | 22,380 | | | $ | 21,822 | | | $ | 89,892 | | | $ | 86,908 | |
| Less: tenant charge-backs | (524) | | | (1,397) | | | (3,162) | | | (5,364) | |
| Less: noncash share-based compensation - property management | (418) | | | (353) | | | (1,745) | | | (1,342) | |
| | | | | | | |
| Property management expenses, net | 21,438 | | | 20,072 | | | 84,985 | | | 80,202 | |
| | | | | | | |
| General and administrative expense | 13,188 | | | 12,178 | | | 48,517 | | | 43,206 | |
| Less: noncash share-based compensation - general and administrative | (1,832) | | | (946) | | | (6,573) | | | (3,466) | |
| General and administrative expense, net | 11,356 | | | 11,232 | | | 41,944 | | | 39,740 | |
| | | | | | | |
| Leasing costs | 1,011 | | | 851 | | | 4,070 | | | 4,095 | |
| | | | | | | |
| | | | | | | |
| | | | | | | |
| Platform costs | $ | 33,805 | | | $ | 32,155 | | | $ | 130,999 | | | $ | 124,037 | |
| | | | | | | |
| Total revenues | $ | 299,335 | | | $ | 284,010 | | | $ | 1,182,836 | | | $ | 1,143,378 | |
| Less: tenant charge-backs | (35,430) | | | (36,290) | | | (160,807) | | | (159,851) | |
| Less: other revenues | (2,784) | | | (2,545) | | | (10,322) | | | (11,241) | |
| | | | | | | |
| Total portfolio rents and fees | $ | 261,121 | | | $ | 245,175 | | | $ | 1,011,707 | | | $ | 972,286 | |
| | | | | | | |
| Platform Efficiency Percentage | 12.9 | % | | 13.1 | % | | 12.9 | % | | 12.8 | % |
Property Enhancing Capex
Includes elective capital expenditures to enhance the operating profile of a property, such as investments to increase future revenues or reduce maintenance expenditures.
Recurring Capital Expenditures
For our Same-Home portfolio, Recurring Capital Expenditures includes replacement costs and other capital expenditures recorded during the period that are necessary to help preserve the value and maintain functionality of our properties. For our total portfolio, we calculate Recurring Capital Expenditures by multiplying (a) current period actual Recurring Capital Expenditures per Same-Home property by (b) our total number of properties, excluding newly acquired non-stabilized properties and properties classified as held for sale.
Defined Terms and Non-GAAP Reconciliations (continued)
(Unaudited)
Retained Cash Flow
Retained Cash Flow is a non-GAAP financial measure that we believe is helpful as a supplemental measure in assessing the Company’s liquidity. This metric is computed by reducing Adjusted FFO attributable to common share and unit holders by common distributions.
Refer to Funds from Operations for a reconciliation of Adjusted FFO attributable to common share and unit holders to net income attributable to common shareholders, determined in accordance with GAAP. The following is a reconciliation of Adjusted FFO attributable to common share and unit holders to Retained Cash Flow (amounts in thousands):
| | | | | |
| For the Three Months Ended
Dec 31, 2020 |
| Adjusted FFO attributable to common share and unit holders | $ | 102,785 | |
| Common distributions | (18,493) | |
| Retained Cash Flow | $ | 84,292 | |
Same-Home Property
A property is classified as Same-Home if it has been stabilized longer than 90 days prior to the beginning of the earliest period presented under comparison. A property is removed from Same-Home if it has been classified as held for sale or has been taken out of service as a result of a casualty loss.
Stabilized Property
A property acquired individually (i.e., not through a bulk purchase) is classified as stabilized once it has been renovated by the Company or newly constructed and then initially leased or available for rent for a period greater than 90 days. Properties acquired through a bulk purchase are first considered non-stabilized, as an entire group, until (1) we have owned them for an adequate period of time to allow for complete on-boarding to our operating platform, and (2) a substantial portion of the properties have experienced tenant turnover at least once under our ownership, providing the opportunity for renovations and improvements to meet our property standards. After such time has passed, properties acquired through a bulk purchase are then evaluated on an individual property basis under our standard stabilization criteria.
Total Debt
Includes principal balances on asset-backed securitizations, unsecured senior notes and borrowings outstanding under our revolving credit facility as of period end, and excludes unamortized discounts, the value of exchangeable senior notes classified within equity and unamortized deferred financing costs.
Total Market Capitalization
Includes the market value of all outstanding common shares and operating partnership units (based on the NYSE AMH Class A common share closing price as of period end), the current liquidation value of preferred shares as of period end and Total Debt.
Turnover Rate
The number of tenant move-outs during the period divided by the total number of properties.
Defined Terms and Non-GAAP Reconciliations (continued)
(Unaudited)
Unsecured Senior Notes Covenant Ratios and Unsecured Credit Facility Covenant Ratios
Debt covenant compliance ratios for the unsecured senior notes show the Company’s compliance with selected covenants on the 2028 Unsecured Senior Notes provided in the Indenture dated as of February 7, 2018, as supplemented by the First Supplemental Indenture dated as of February 7, 2018, which have been filed as exhibits to the Company’s SEC reports, and the 2029 Unsecured Senior Notes provided in the Indenture dated as of February 7, 2018, as supplemented by the Second Supplemental Indenture dated as of January 23, 2019, which have been filed as exhibits to the Company’s SEC reports. The ratios for the Unsecured Credit Facility covenants show the Company’s compliance with selected covenants provided in the Credit Agreement dated as of August 17, 2016, as amended by Amendment No. 1 to Credit Agreement dated as of June 30, 2017, which have been filed as exhibits to the Company’s SEC reports.
The debt covenant compliance ratios are provided only to show the Company’s compliance with certain covenants contained in the Indenture governing its unsecured debt securities and in the Credit Agreement, as of the date reported. These ratios should not be used for any other purpose, including without limitation to evaluate the Company’s financial condition or results of operations, nor do they indicate the Company’s covenant compliance as of any other date or for any other period. The capitalized terms in the disclosure are defined in the Indenture or the Credit Agreement, and may differ materially from similar terms used elsewhere in this document and used by other companies that present information about their covenant compliance. For risks related to failure to comply with these covenants, see “Risk Factors – Risks Related to Our Business” and other risks discussed in the Company’s Annual Report on Form 10-K for the year ended December 31, 2020 and in the Company’s subsequent filings with the SEC.
| | | | | | | | |
| Executive Management |
| | |
| David P. Singelyn | | Jack Corrigan |
| Chief Executive Officer | | Chief Investment Officer |
| | |
| Bryan Smith | | Christopher C. Lau |
| Chief Operating Officer | | Chief Financial Officer |
| | |
| Sara H. Vogt-Lowell | | |
| Chief Legal Officer | | |
| | |
| | |
| Corporate Information | | Investor Relations |
| | |
| American Homes 4 Rent | | (855) 794-AH4R (2447) |
| 23975 Park Sorrento, Suite 300 | | investors@ah4r.com |
| Calabasas, CA 91302 | | |
| (805) 413-5300 | | |
| www.americanhomes4rent.com | | |
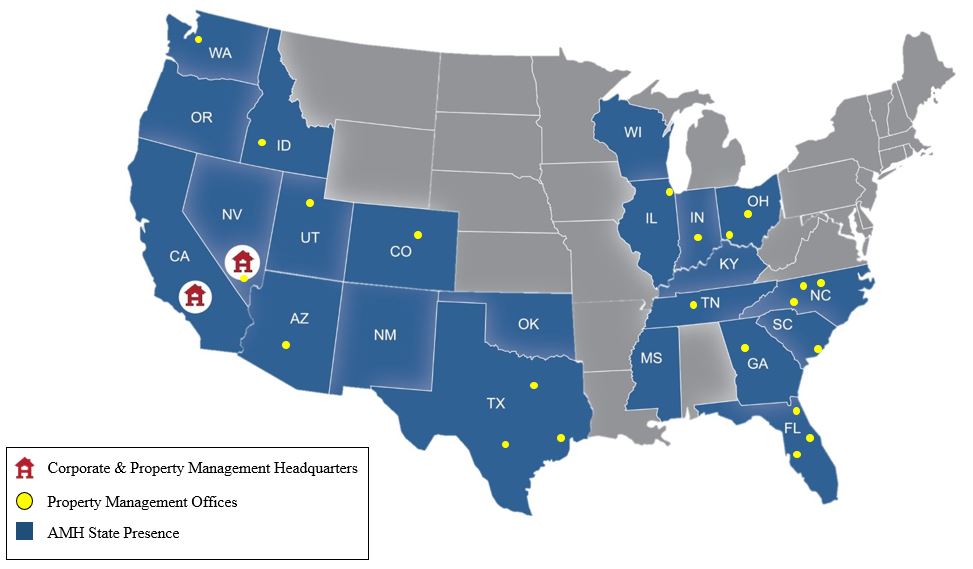
| | | | | | | | | | | |
Analyst Coverage (1) | | | |
| | | |
| B. Riley Securities | Berenberg Capital Markets | BofA Global Research | BTIG |
| Craig Kucera | Keegan Carl | Jeff Spector | Ryan Gilbert |
| craigkucera@brileyfin.com | keegan.carl@berenberg-us.com | jeff.spector@bofa.com | rgilbert@btig.com |
| | | |
| Citi | Credit Suisse | Evercore ISI | Goldman Sachs & Co. |
| Nicholas Joseph | Sam Choe | Steve Sakwa | Richard Skidmore |
| nicholas.joseph@citi.com | samuel.choe@credit-suisse.com | steve.sakwa@evercoreisi.com | richard.skidmore@gs.com |
| | | |
| Green Street Advisors | Janney Montgomery Scott | JMP Securities | J.P. Morgan Securities |
| John Pawlowski | Tyler Batory | Aaron Hecht | Anthony Paolone |
| jpawlowski@greenst.com | tbatory@janney.com | ahecht@jmpsecurities.com | anthony.paolone@jpmorgan.com |
| | | |
| Keefe, Bruyette & Woods, Inc. | Mizuho Securities USA Inc. | Morgan Stanley | Raymond James & Associates, Inc. |
| Jade Rahmani | Haendel St. Juste | Richard Hill | Buck Horne |
| jrahmani@kbw.com | haendel.st.juste@mizuho-sc.com | richard.hill1@morganstanley.com | buck.horne@raymondjames.com |
| | | |
| Wells Fargo Securities | Zelman & Associates | | |
| Todd Stender | Alexander Kalmus | | |
| todd.stender@wellsfargo.com | alex@zelmanassociates.com | | |
(1)The sell-side analysts listed above follow American Homes 4 Rent (“AMH”). Any opinions, estimates or forecasts regarding AMH’s performance made by these analysts are theirs alone and do not represent the opinions, forecasts or predictions of AMH or its management. AMH does not by its reference above or distribution imply its endorsement of or concurrence with such information, conclusions, or recommendations. The above list may not be complete and is subject to change as firms add or discontinue coverage.