First Internet Bancorp Investor Presentation Fourth Quarter 2014 Exhibit 99.1

Forward Looking Statement This presentation may contain forward - looking statements with respect to the financial condition, results of operations, plans, objectives, future performance or business of the Company. Forward - looking statements are generally identifiable by the use of words such as “believe,” “expect,” “anticipate,” “plan,” “intend,” “estimate,” “may,” “will,” “would,” “could,” “should” or other similar expressions. Forward - looking statements are not a guarantee of future performance or results, are based on information available at the time the statements are made and involve known and unknown risks, uncertainties and other factors that could cause actual results to differ materially from the information in the forward - looking statements. Factors that may cause such differences include: failures of or interruptions in the communications and information systems on which we rely to conduct our business; our plans to grow our commercial real estate and commercial and industrial loan portfolios; competition with national, regional and community financial institutions; the loss of any key members of senior management; fluctuations in interest rates; general economic conditions; risks relating to the regulation of financial institutions; and other factors identified in reports we file with the SEC. All statements in this presentation, including forward - looking statements, speak only as of the date they are made, and the Company undertakes no obligation to update any statement in light of new information or future events. 2
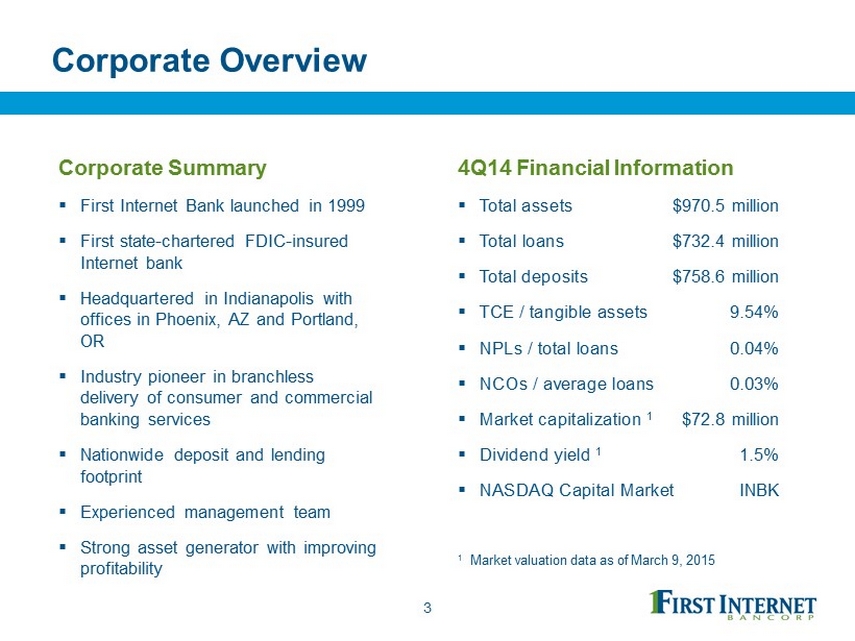
Corporate Overview Corporate Summary ▪ First Internet Bank launched in 1999 ▪ First state - chartered FDIC - insured Internet bank ▪ Headquartered in Indianapolis with offices in Phoenix, AZ and Portland, OR ▪ Industry pioneer in branchless delivery of consumer and commercial banking services ▪ Nationwide deposit and lending footprint ▪ Experienced management team ▪ Strong asset generator with improving profitability 3 4Q14 Financial Information ▪ Total assets $970.5 million ▪ Total loans $732.4 million ▪ Total deposits $758.6 million ▪ TCE / tangible assets 9.54% ▪ NPLs / total loans 0.04% ▪ NCOs / average loans 0.03% ▪ Market capitalization 1 $72.8 million ▪ Dividend yield 1 1.5% ▪ NASDAQ Capital Market INBK 1 Market valuation data as of March 9 , 2015
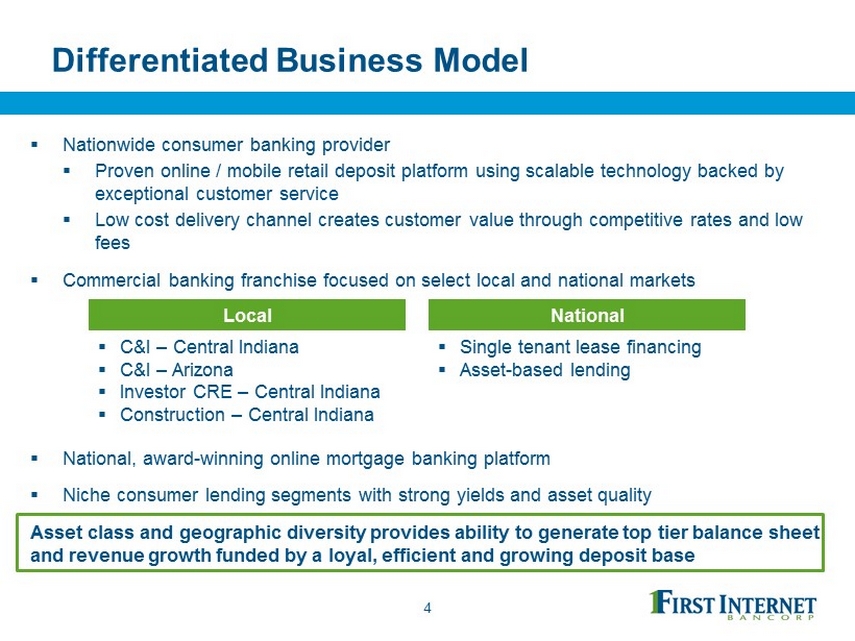
Differentiated Business Model ▪ Nationwide consumer banking provider ▪ Proven online / mobile retail deposit platform using scalable technology backed by exceptional customer service ▪ Low cost delivery channel creates customer value through competitive rates and low fees ▪ Commercial banking franchise focused on select local and national markets 4 ▪ National, award - winning online mortgage banking platform ▪ Niche consumer lending segments with strong yields and asset quality Asset class and geographic diversity provides ability to generate top tier balance sheet and revenue growth funded by a loyal, efficient and growing deposit base Local National ▪ C&I – Central Indiana ▪ C&I – Arizona ▪ Investor CRE – Central Indiana ▪ Construction – Central Indiana ▪ Single tenant lease financing ▪ Asset - based lending
Strategic Objectives ▪ Drive revenue growth and positive operating leverage ▪ Achieve consistent strong profitability ▪ Deploy capital in an accretive manner focused on building shareholder value ▪ Capitalize on consumer trends by capturing greater deposit market share among digital banking adopters ▪ Maintain strong asset quality and focus on disciplined risk management ▪ Expand asset generation channels to supplement growth and increase profitability ▪ Continue investing in technology to remain a digital banking leader and increase efficiency 5

Improving Performance 6 The Company’s focus on enhancing profitability resulted in continual performance improvement throughout 2014 Diluted Earnings Per Share Net Interest Margin Return on Average Assets Return on Average Tangible Common Equity $0.13 $0.22 $0.28 $0.32 1Q14 2Q14 3Q14 4Q14 2.51% 2.61% 2.68% 2.78% 1Q14 2Q14 3Q14 4Q14 0.30% 0.45% 0.59% 0.62% 1Q14 2Q14 3Q14 4Q14 2.79% 4.46% 5.64% 6.38% 1Q14 2Q14 3Q14 4Q14
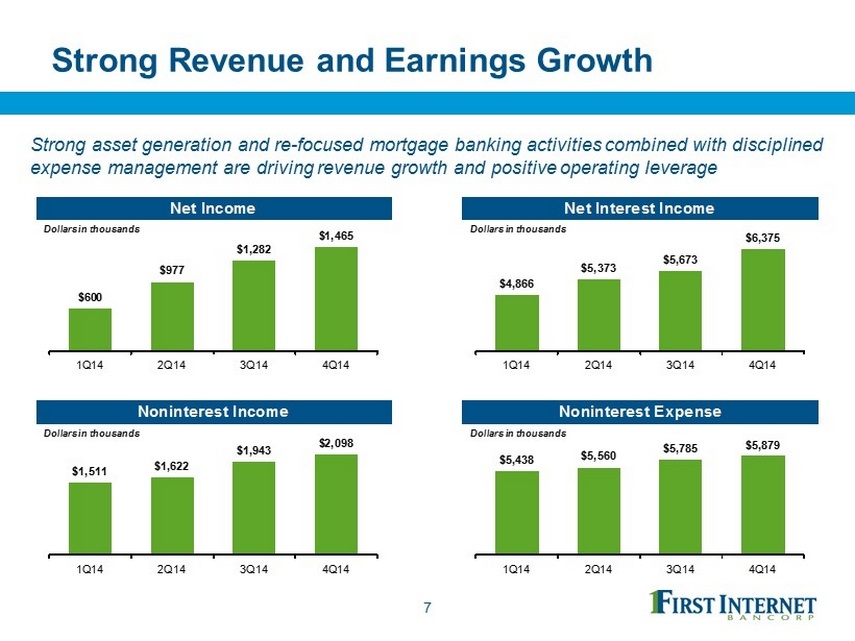
Strong Revenue and Earnings Growth 7 Strong asset generation and re - focused mortgage banking activities combined with disciplined expense management are driving revenue growth and positive operating leverage Net Income Net Interest Income Noninterest Income Noninterest Expense $600 $977 $1,282 $1,465 1Q14 2Q14 3Q14 4Q14 Dollars in thousands $4,866 $5,373 $5,673 $6,375 1Q14 2Q14 3Q14 4Q14 Dollars in thousands $1,511 $1,622 $1,943 $2,098 1Q14 2Q14 3Q14 4Q14 Dollars in thousands $5,438 $5,560 $5,785 $5,879 1Q14 2Q14 3Q14 4Q14 Dollars in thousands
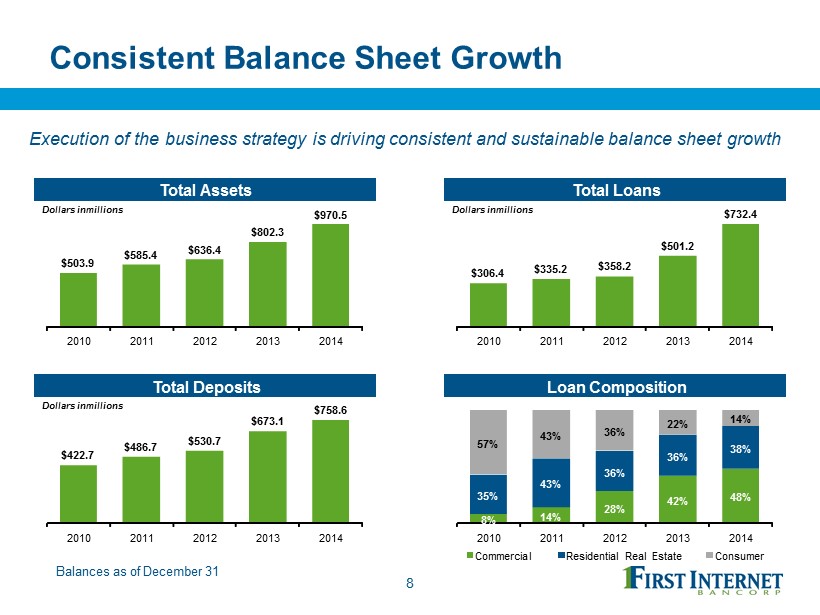
Consistent Balance Sheet Growth 8 Execution of the business strategy is driving consistent and sustainable balance sheet growth Balances as of December 31 Total Assets Total Loans Total Deposits Loan Composition $503.9 $585.4 $636.4 $802.3 $970.5 2010 2011 2012 2013 2014 Dollars in millions $306.4 $335.2 $358.2 $501.2 $732.4 2010 2011 2012 2013 2014 Dollars in millions $422.7 $486.7 $530.7 $673.1 $758.6 2010 2011 2012 2013 2014 Dollars in millions 8% 14% 28% 42% 48% 35% 43% 36% 36% 38% 57% 43% 36% 22% 14% 2010 2011 2012 2013 2014 Commercial Residential Real Estate Consumer

Five Year Balance Sheet Growth ▪ Five year balance sheet growth rates far exceed the median rates for similar institutions ▪ INBK growth over this period has been primarily organic as opposed to through acquisitions 9 Source: Company data and SNL Financial; financial data as of December 31, 2014; peer data represents median value of component companies. SNL Micro Cap US Banks represent publicly traded micro cap banks with a market capitalization of less than $250 million; peer data based on index components as of March 9, 2014. Five Year Total Asset Growth Five Year Total Loan Growth Five Year Total Deposit Growth 132% 18% INBK SNL Micro Cap US Banks 84% 22% INBK SNL Micro Cap US Banks 92% 20% INBK SNL Micro Cap US Banks
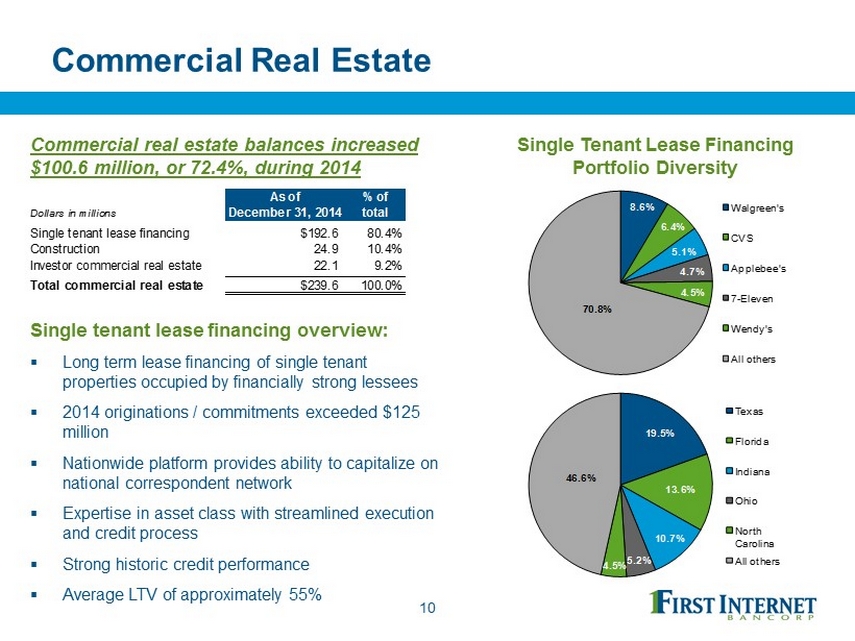
Commercial Real Estate Single tenant lease financing overview: ▪ Long term lease financing of single tenant properties occupied by financially strong lessees ▪ 2014 originations / commitments exceeded $125 million ▪ Nationwide platform provides ability to capitalize on national correspondent network ▪ Expertise in asset class with streamlined execution and credit process ▪ Strong historic credit performance ▪ Average LTV of approximately 55% 10 Commercial real estate balances increased $100.6 million, or 72.4%, during 2014 8.6% 6.4% 5.1% 4.7% 4.5% 70.8% Walgreen's CVS Applebee's 7 - Eleven Wendy's All others Single Tenant Lease Financing Portfolio Diversity 19.5% 13.6% 10.7% 5.2% 4.5% 46.6% Texas Florida Indiana Ohio North Carolina All others As of % of Dollars in millions December 31, 2014 total Single tenant lease financing $192.6 80.4% Construction 24.9 10.4% Investor commercial real estate 22.1 9.2% Total commercial real estate $239.6 100.0%
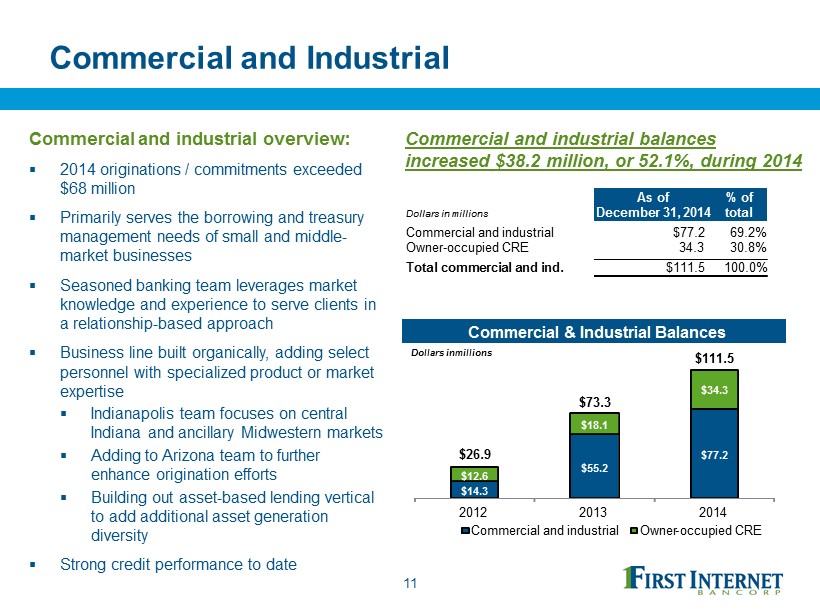
Commercial and Industrial Commercial and industrial overview: ▪ 2014 originations / commitments exceeded $68 million ▪ Primarily serves the borrowing and treasury management needs of small and middle - market businesses ▪ Seasoned banking team leverages market knowledge and experience to serve clients in a relationship - based approach ▪ Business line built organically, adding select personnel with specialized product or market expertise ▪ Indianapolis team focuses on central Indiana and ancillary Midwestern markets ▪ Adding to Arizona team to further enhance origination efforts ▪ Building out asset - based lending vertical to add additional asset generation diversity ▪ Strong credit performance to date 11 Commercial and industrial balances increased $38.2 million, or 52.1%, during 2014 As of % of Dollars in millions December 31, 2014 total Commercial and industrial $77.2 69.2% Owner-occupied CRE 34.3 30.8% Total commercial and ind. $111.5 100.0% Commercial & Industrial Balances $14.3 $55.2 $77.2 $12.6 $18.1 $34.3 2012 2013 2014 Commercial and industrial Owner - occupied CRE Dollars in millions $26.9 $73.3 $111.5
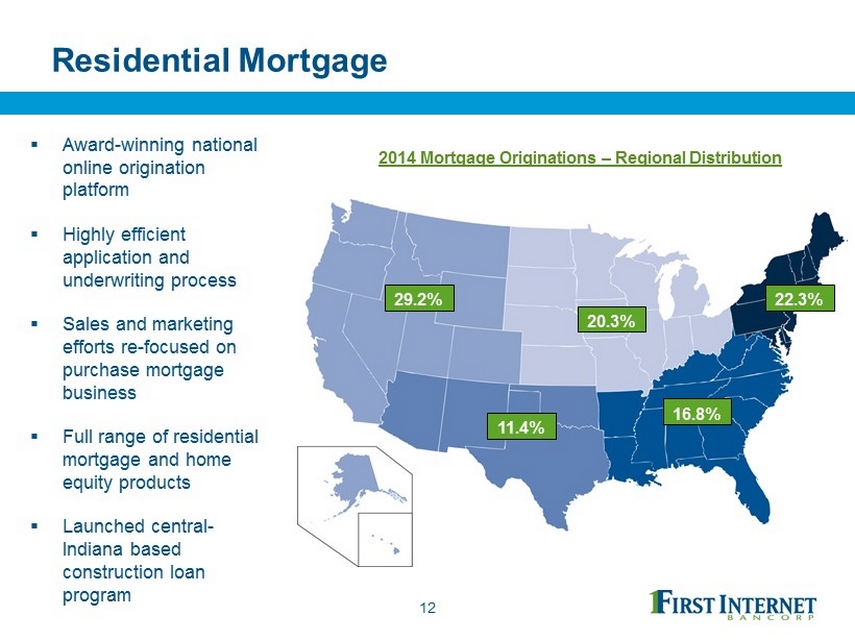
Residential Mortgage 12 2014 Mortgage Originations – Regional Distribution ▪ Award - winning national online origination platform ▪ Highly efficient application and underwriting process ▪ Sales and marketing efforts re - focused on purchase mortgage business ▪ Full range of residential mortgage and home equity products ▪ Launched central - Indiana based construction loan program 29.2% 11.4% 20.3% 16.8% 22.3%
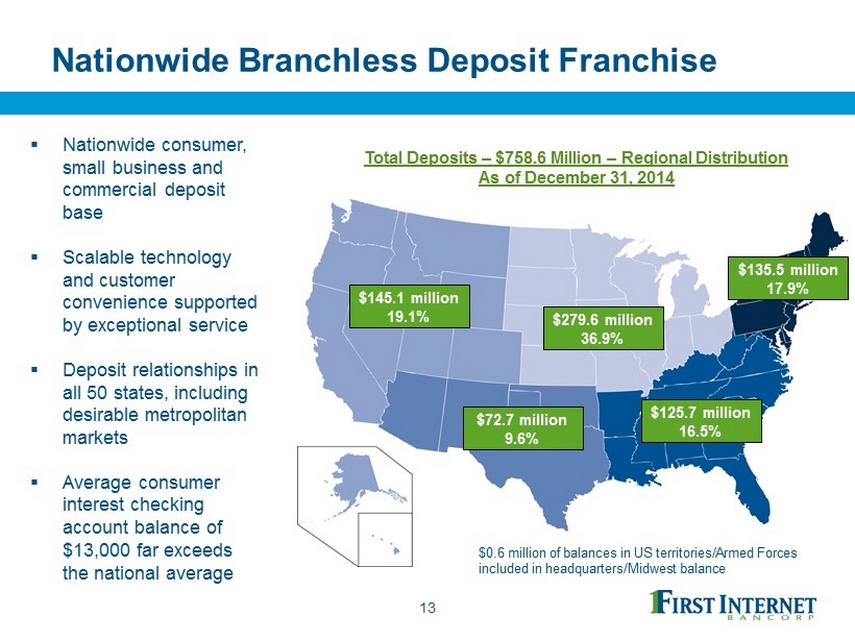
Nationwide Branchless Deposit Franchise 13 Total Deposits – $758.6 Million – Regional Distribution As of December 31, 2014 ▪ Nationwide consumer, small business and commercial deposit base ▪ Scalable technology and customer convenience supported by exceptional service ▪ Deposit relationships in all 50 states, including desirable metropolitan markets ▪ Average consumer interest checking account balance of $13,000 far exceeds the national average $145.1 million 19.1% $72.7 million 9.6% $279.6 million 36.9% $125.7 million 16.5% $135.5 million 17.9% $0.6 million of balances in US territories/Armed Forces included in headquarters/Midwest balance
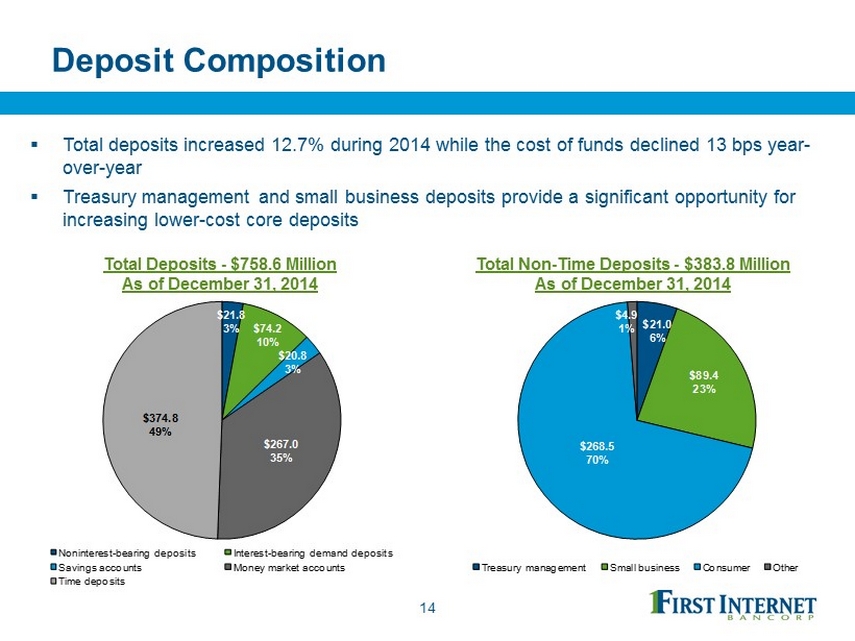
Deposit Composition ▪ Total deposits increased 12.7% during 2014 while the cost of funds declined 13 bps year - over - year ▪ Treasury management and small business deposits provide a significant opportunity for increasing lower - cost core deposits 14 $21.8 3% $74.2 10% $20.8 3% $267.0 35% $374.8 49% Noninterest - bearing deposits Interest - bearing demand deposits Savings accounts Money market accounts Time deposits $21.0 6% $89.4 23% $268.5 70% $4.9 1% Treasury management Small business Consumer Other Total Deposits - $758.6 Million As of December 31, 2014 Total Non - Time Deposits - $383.8 Million As of December 31, 2014

Asset Quality 15 Asset quality has improved significantly while balance sheet growth has continued on a strong upward trend NPAs / Total Assets NPLs / Total Loans Allowance for Loan Losses / NPLs Net Charge-Offs / Average Loans 3.36% 2.29% 1.62% 0.90% 0.50% 2010 2011 2012 2013 2014 3.17% 2.64% 1.23% 0.37% 0.04% 2010 2011 2012 2013 2014 71.4% 64.6% 133.3% 293.0% 1,959.5% 2010 2011 2012 2013 2014 1.35% 1.05% 0.69% 0.19% 0.00% 2010 2011 2012 2013 2014

Capital 16 Tangible Common Equity Regulatory Capital Ratios $20.13 $19.38 $19.54 $20.19 $20.29 $20.74 9.0% 10.8% 10.3% 10.4% 9.8% 9.5% 2012 2013 1Q14 2Q14 3Q14 4Q14 TBV Per Share TCE / TA 8.9% 11.7% 10.9% 10.5% 10.5% 9.9% 12.2% 15.6% 15.1% 14.0% 13.2% 12.6% 13.5% 17.1% 16.6% 15.3% 14.5% 13.8% 2012 2013 1Q14 2Q14 3Q14 4Q14 Tier 1 Leverage Tier 1 Capital Total Capital ▪ Following the equity offering in late 2013, the Company has deployed capital to fund commercial loan growth, driving revenue growth and improved profitability ▪ Strong insider ownership ensures board, management and shareholder interests are aligned

Compelling Valuation ▪ INBK trades at a significant discount to other micro - cap institutions despite its superior growth profile ▪ The asset - generation capabilities combined with the focus on continued profitability improvement is expected to drive 2015 earnings per share growth at rates exceeding expectations for the community / regional bank sector 2 17 Price / Tangible Book Value Per Share 1 1 Market valuation data as of March 9, 2015; source: SNL Financial 2 Full year 2015 EPS average analyst EPS estimate represents growth of 54% compared to 2014 EPS 50.0 70.0 90.0 110.0 130.0 150.0 Dec 2013 Mar 2014 Jun 2014 Sep 2014 Dec 2014 Mar 2015 INBK SNL Micro Cap US Bank Percentage 126.2 79.0

18 First Internet Banking Experience ▪ Full suite of online capabilities and mobile apps for consumers and businesses ▪ Technology supports security, productivity, fast response and high - touch service ▪ One click “get started” call to action ▪ Supports growing customer preference for online / mobile – based financial services with personalized attention ▪ Multiple options for personal interaction with a First Internet Bank associate ▪ Informative “how to” video demonstrations
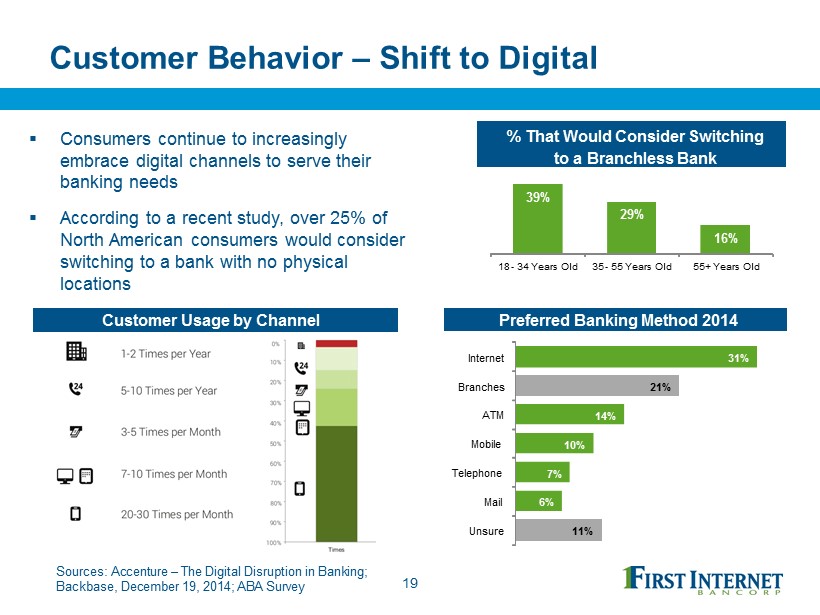
Customer Behavior – Shift to Digital ▪ Consumers continue to increasingly embrace digital channels to serve their banking needs ▪ According to a recent study, over 25% of North American consumers would consider switching to a bank with no physical locations 19 Sources: Accenture – The Digital Disruption in Banking; Backbase, December 19, 2014; ABA Survey Customer Usage by Channel % That Would Consider Switching to a Branchless Bank 39% 29% 16% 18 - 34 Years Old 35 - 55 Years Old 55+ Years Old Preferred Banking Method 2014 31% 21% 14% 10% 7% 6% 11% Internet Branches ATM Mobile Telephone Mail Unsure

20 Demographics of Digital Banking ▪ According to Pew Research Center, 61% of Internet users bank online and 35% of cell phone users bank using their mobile device ▪ Online and mobile banking users represent attractive demographic segments ▪ Additional research shows that digitally oriented consumers also tend to be desirable and loyal customers ▪ Mobile banking adopters tend to maintain deeper relationships with their primary bank as measured by the average number of products Sources: Pew Research Center, August 7, 2013; AlixPartners – The Innovation Commitment, May 2014 % Who Bank Online / Mobile by Age % Who Bank Online / Mobile by Household Income 67% 65% 55% 47% 54% 40% 25% 14% 18 - 29 30 - 49 50 - 64 65+ Online Mobile 48% 57% 71% 75% 31% 32% 45% 44% < $30k $30k - $49k $50k - $74k $75k + Online Mobile
Investment Summary ▪ Strong earnings growth and rapidly improving profitability ▪ Demonstrated track record of deploying capital to fuel loan growth while maintaining strong asset quality ▪ Investments in commercial lending platform are producing results ▪ Geographic and credit product diversity provide ability to generate sustained balance sheet growth ▪ Consumer banking platform well - positioned to capitalize on changing consumer preferences ▪ Full service, technology - driven model will deliver increasing efficiency ▪ Attractive relative valuation ▪ Strong management team committed to building shareholder value 21

First Internet Bancorp Investor Presentation Fourth Quarter 2014