First Internet Bancorp Investor Presentation Fourth Quarter 2016 Exhibit 99.1
Forward Looking Statement This presentation may contain forward-looking statements with respect to the financial condition, results of operations, plans, objectives, future performance or business of the Company. Forward-looking statements are generally identifiable by the use of words such as “believe,” “expect,” “anticipate,” “plan,” “intend,” “estimate,” “may,” “will,” “would,” “could,” “should” or other similar expressions. Forward-looking statements are not a guarantee of future performance or results, are based on information available at the time the statements are made and involve known and unknown risks, uncertainties and other factors that could cause actual results to differ materially from the information in the forward-looking statements. Factors that may cause such differences include: failures of or interruptions in the communications and information systems on which we rely to conduct our business; our plans to grow our commercial real estate and commercial and industrial loan portfolios; competition with national, regional and community financial institutions; the loss of any key members of senior management; fluctuations in interest rates; general economic conditions; risks relating to the regulation of financial institutions; and other factors identified in reports we file with the SEC. All statements in this presentation, including forward-looking statements, speak only as of the date they are made, and the Company undertakes no obligation to update any statement in light of new information or future events. 2
Non-GAAP Financial Measures 3 This presentation contains financial information determined by methods other than in accordance with U.S. generally accepted accounting principles (“GAAP”). Non-GAAP financial measures, specifically tangible common equity, tangible assets, tangible book value per common share, return on average tangible common equity and tangible common equity to tangible assets are used by the Company’s management to measure the strength of its capital and its ability to generate earnings on tangible capital invested by its shareholders. Although management believes these non-GAAP measures provide a greater understanding of its business, they should not be considered a substitute for financial measures determined in accordance with GAAP, nor are they necessarily comparable to non-GAAP performance measures that may be presented by other companies. Reconciliations of these non-GAAP financial measures to the most directly comparable GAAP financial measures are included in the table at the end of this presentation under the caption “Reconciliation of Non-GAAP Financial Measures.”
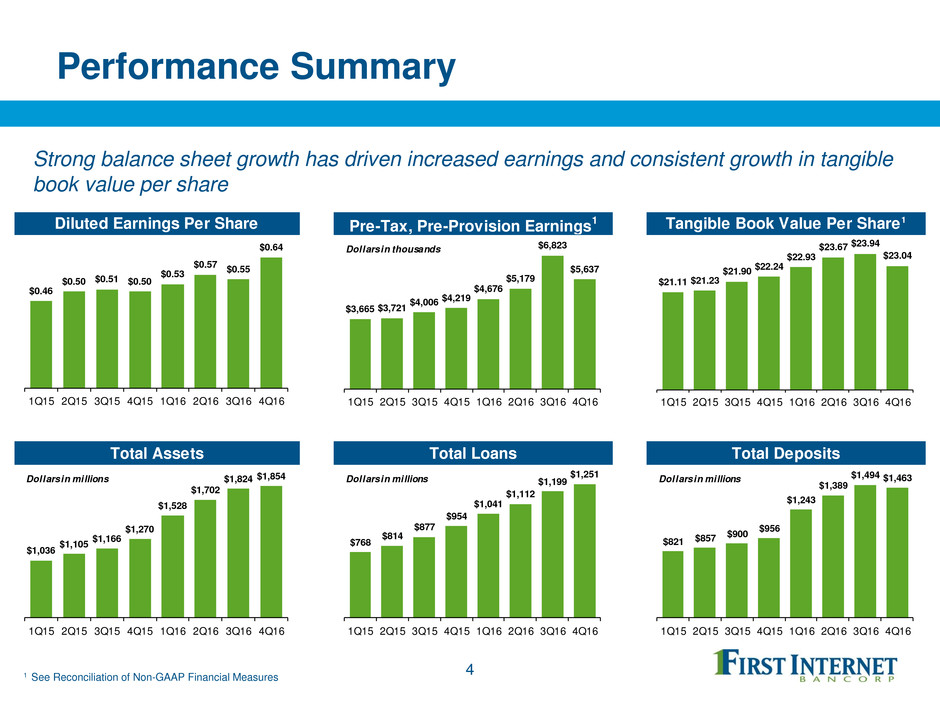
Performance Summary 4 Strong balance sheet growth has driven increased earnings and consistent growth in tangible book value per share 1 See Reconciliation of Non-GAAP Financial Measures Diluted Earnings Per Share Pre-Tax, Pre-Provision Earnings 1 Tangible Book Value Per Share1 Total Assets Total Loans Total Deposits $0.46 $0.50 $0.51 $0.50 $0.53 $0.57 $0.55 $0.64 1Q15 2Q15 3Q15 4Q15 1Q16 2Q16 3Q16 4Q16 $3,665 $3,721 $4,006 $4,219 $4,676 $5,179 $6,823 $5,637 1Q15 2Q15 3Q15 4Q15 1Q16 2Q16 3Q16 4Q16 Dollars in thousands $1,036 $1,105 $1,166 $1,270 $1,528 $1,702 $1,824 $1,854 1Q15 2Q15 3Q15 4Q15 1Q16 2Q16 3Q16 4Q16 Dollars in millions $768 $814 $877 $954 $1,041 $1,112 $1,199 $1,251 1Q15 2Q15 3Q15 4Q15 1Q16 2Q16 3Q16 4Q16 Dollars in millions $21.11 $21.23 $21.90 $22.24 $22.93 $23.67 $23.94 $23.04 1Q15 2Q15 3Q15 4Q15 1Q16 2Q16 3Q16 4Q16 $821 $857 $900 $956 $1,243 $1,389 $1,494 $1,463 1Q15 2Q15 3Q15 4Q15 1Q16 2Q16 3Q16 4Q16 Dollars in millions

Fourth Quarter & Full Year 2016 Highlights Record quarterly net income of $3.7 million, up 63% over 4Q15 Record annual net income of $12.1 million, up 35% over FY2015 Record quarterly diluted EPS of $0.64, up 28% over 4Q15 Record annual diluted EPS of $2.30, up 17% over FY2015 Quarterly ROAA of 0.81% Quarterly ROATCE of 11.24%1 Total year-over-year asset growth of $584.5 million, or 46% Total year-over-year loan growth of $296.9 million, or 31% Quarterly net interest income of $10.9 million, up 27% over 4Q15 Annual net interest income of $39.7 million, up 29% over FY2015 5 1 See Reconciliation of Non-GAAP Financial Measures
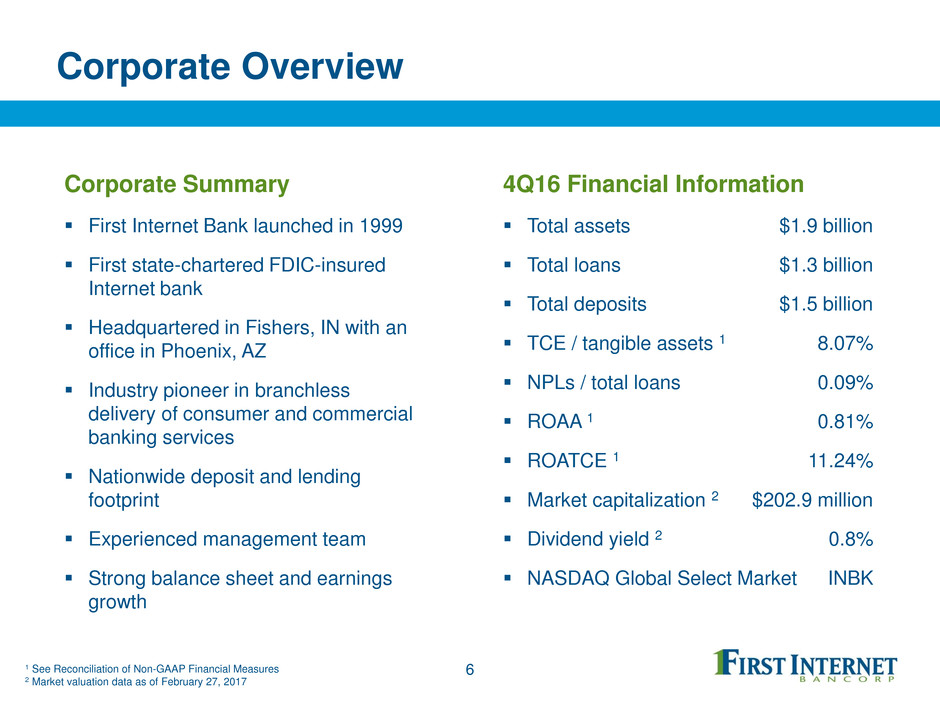
Corporate Overview Corporate Summary First Internet Bank launched in 1999 First state-chartered FDIC-insured Internet bank Headquartered in Fishers, IN with an office in Phoenix, AZ Industry pioneer in branchless delivery of consumer and commercial banking services Nationwide deposit and lending footprint Experienced management team Strong balance sheet and earnings growth 6 4Q16 Financial Information Total assets $1.9 billion Total loans $1.3 billion Total deposits $1.5 billion TCE / tangible assets 1 8.07% NPLs / total loans 0.09% ROAA 1 0.81% ROATCE 1 11.24% Market capitalization 2 $202.9 million Dividend yield 2 0.8% NASDAQ Global Select Market INBK 1 See Reconciliation of Non-GAAP Financial Measures 2 Market valuation data as of February 27, 2017

Differentiated Business Model Nationwide consumer banking provider Proven online / mobile retail deposit platform using scalable technology backed by exceptional customer service Low cost delivery channel creates customer value through competitive rates and low fees Commercial banking franchise focused on select local and national markets 7 National, award-winning online direct-to-consumer mortgage banking platform National, niche consumer lending segments with solid yields and asset quality Asset class and geographic diversity provides ability to generate top tier balance sheet and revenue growth funded by a loyal, efficient and growing deposit base Local National C&I – Central Indiana C&I – Arizona Investor CRE – Central Indiana Construction – Central Indiana Single tenant lease financing Public Finance (January 2017)
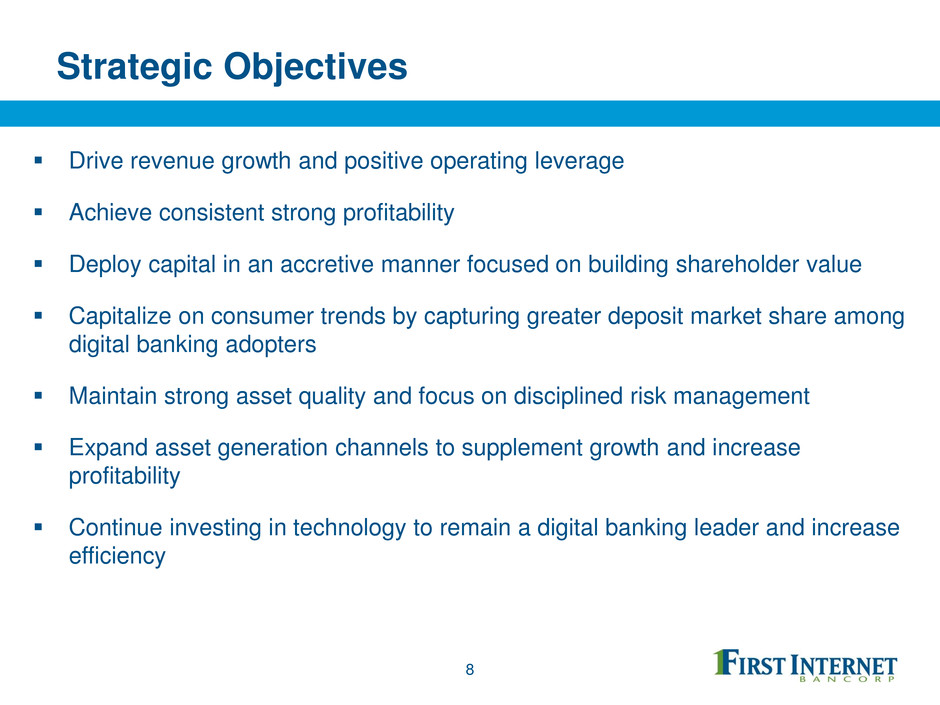
Strategic Objectives Drive revenue growth and positive operating leverage Achieve consistent strong profitability Deploy capital in an accretive manner focused on building shareholder value Capitalize on consumer trends by capturing greater deposit market share among digital banking adopters Maintain strong asset quality and focus on disciplined risk management Expand asset generation channels to supplement growth and increase profitability Continue investing in technology to remain a digital banking leader and increase efficiency 8

9 Corporate Recognition First Internet Bank has been recognized for its innovation and is consistently ranked among the best banks to work for, enhancing its ability to attract and retain top-level talent TechPoint 2016 Mira Award “Tech-enabled Company of the Year” Top 10 finalist – 2016 Indiana Public Company of the year presented by the CFA Society and FEI American Banker’s “Best Banks to Work For” 2016 2015 2014 2013 Workplace Dynamics’ “Indianapolis Star Top Workplaces” 2016 2015 2014 “Best Places to Work in Indiana” 2017 2016 2013 Mortgage Technology 2013 awarded top honors in the Online Mortgage Originator category

Total Assets Total Loans Total Deposits Shareholders' Equity $636 $802 $971 $1,270 $1,854 2012 2013 2014 2015 2016 Dollars in millions $358 $501 $732 $954 $1,251 2012 2013 2014 2015 2016 Dollars in millions $531 $673 $759 $956 $1,463 2012 2013 2014 2015 2016 Dollars in millions $61 $91 $97 $104 $154 2012 2013 2014 2015 2016 Dollars in millions Consistent Balance Sheet Growth 10 Execution of the business strategy is driving consistent and sustainable balance sheet growth CAGR: 30.7% CAGR: 36.7% CAGR: 28.8% CAGR: 26.1%

Five Year Balance Sheet Growth Five year balance sheet growth rates far exceed the median rates for similar institutions INBK growth over this period has been primarily organic as opposed to through acquisitions 11 Source: Company data and SNL Financial; financial data as of December 31, 2016; peer data represents median value of component companies. SNL Micro Cap US Banks represent publicly traded micro cap banks with a market capitalization of less than $250 million; peer data based on index components as of December 31, 2016. Five Year Total Asset Growth Five Year Total Loan Growth Five Year Total Deposit Growth 273% 44% INBK SNL Micro Cap US Banks 201% 34% INBK SNL Micro Cap US Banks 217% 31% INBK SNL Micro Cap US Banks
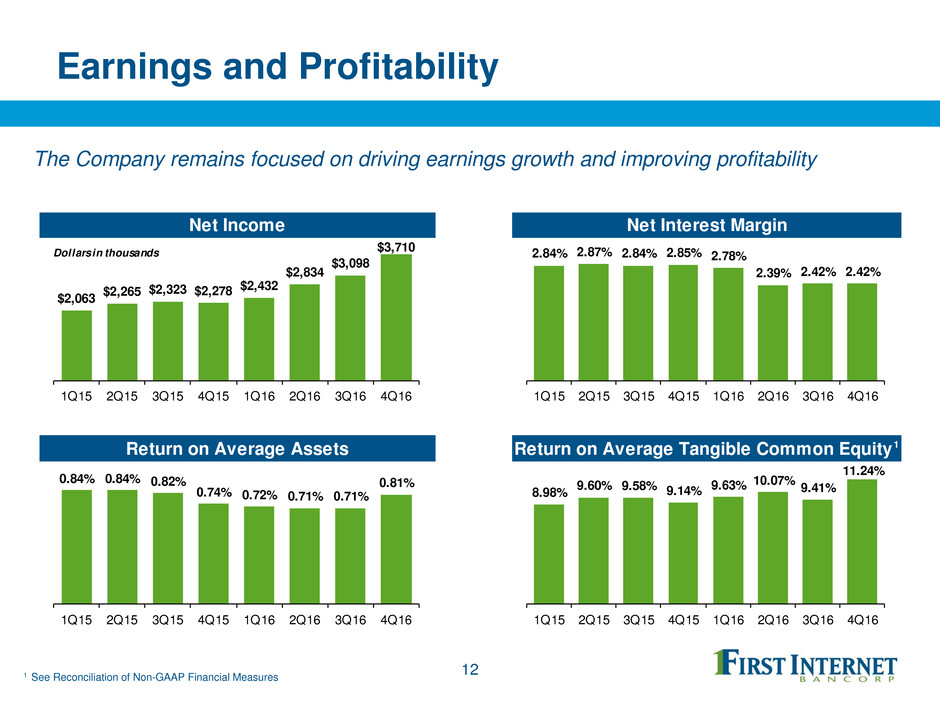
Earnings and Profitability 12 The Company remains focused on driving earnings growth and improving profitability 1 See Reconciliation of Non-GAAP Financial Measures Net Income Net Interest Margin Return on Average Assets Return on Average Tangible Common Equity1 $2,063 $2,265 $2,323 $2,278 $2,432 $2,834 $3,098 $3,710 1Q15 2Q15 3Q15 4Q15 1Q16 2Q16 3Q16 4Q16 Dollars in thousands 2.84% 2.87% 2.84% 2.85% 2.78% 2.39% 2.42% 2.42% 1Q15 2Q15 3Q15 4Q15 1Q16 2Q16 3Q16 4Q16 0.84% 0.84% 0.82% 0.74% 0.72% 0.71% 0.71% 0.81% 1Q15 2Q15 3Q15 4Q15 1Q16 2Q16 3Q16 4Q16 8.98% 9.60% 9.58% 9.14% 9.63% 10.07% 9.41% 11.24% 1Q15 2Q15 3Q15 4Q15 1Q16 2Q16 3Q16 4Q16
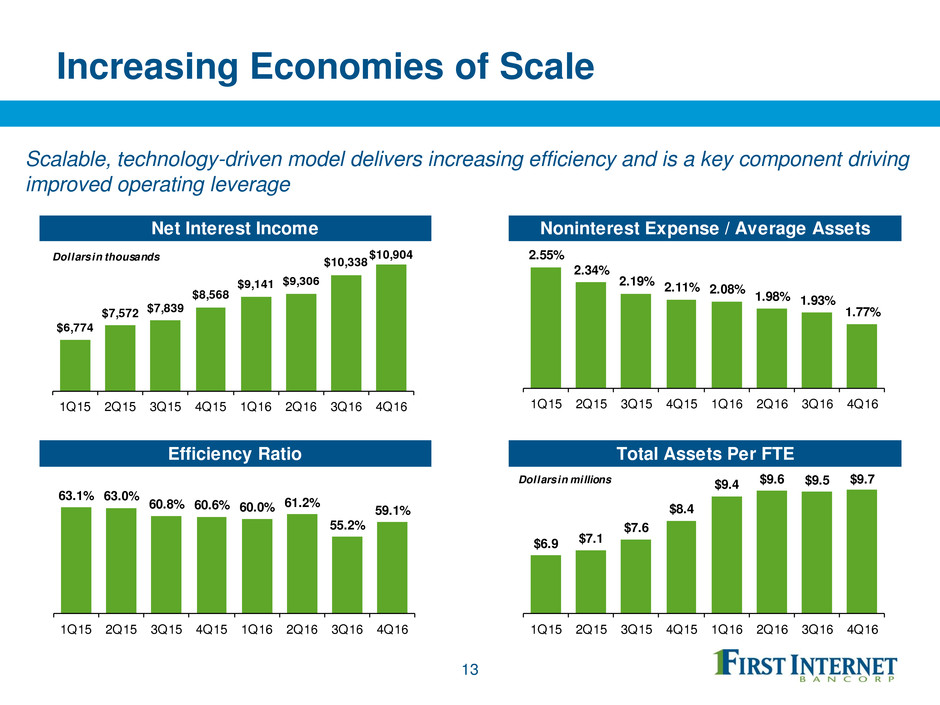
Increasing Economies of Scale 13 Scalable, technology-driven model delivers increasing efficiency and is a key component driving improved operating leverage Net Interest Income Noninterest Expense / Average Assets Efficiency Ratio Total Assets Per FTE 2.55% 2.34% 2.19% 2.11% 2.08% 1.98% 1.93% 1.77% 1Q15 2Q15 3Q15 4Q15 1Q16 2Q16 3Q16 4Q16 63.1% 63.0% 60.8% 60.6% 60.0% 61.2% 55.2% 59.1% 1Q15 2Q15 3Q15 4Q15 1Q16 2Q16 3Q16 4Q16 $6.9 $7.1 $7.6 $8.4 $9.4 $9.6 $9.5 $9.7 1Q15 2Q15 3Q15 4Q15 1Q16 2Q16 3Q16 4Q16 Dollars in millions $6,774 $7,572 $7,839 $8,568 $9,141 $9,306 $10,338 $10,904 1Q15 2Q15 3Q15 4Q15 1Q16 2Q16 3Q16 4Q16 Dollars in thousands

Loan Portfolio Overview 14 Dollars in thousands 2013 2014 4Q15 1Q16 2Q16 3Q16 4Q16 Commercial loans Commercial and industrial 55,168$ 77,232$ 102,000$ 106,431$ 111,130$ 107,250$ 102,437$ Owner-occupied commercial real estate 18,165 34,295 44,462 47,010 46,543 45,540 57,668 Investor commercial real estate 26,574 22,069 16,184 14,756 12,976 12,752 13,181 Construction 28,200 24,883 45,898 52,591 53,368 56,391 53,291 Single tenant lease financing 84,173 192,608 374,344 445,534 500,937 571,972 606,568 Total commercial loans 212,280 351,087 582,888 666,322 724,954 793,905 833,145 Consumer loans Residential mortgage 138,418 220,612 214,559 208,636 202,107 200,889 205,554 Home equity 37,906 58,434 43,279 40,000 38,981 37,849 35,036 Trailers 68,991 63,288 67,326 69,845 74,777 78,419 81,186 Recreational vehicles 34,738 30,605 38,597 41,227 44,387 49,275 52,350 Other consumer loans 3,833 3,201 2,389 10,251 22,592 35,464 39,913 Total consumer loans 283,886 376,140 366,150 369,959 382,844 401,896 414,039 3,605 Net def. loan fees, prem. and disc. 4,987 5,199 4,821 4,402 3,824 3,131 3,605 Total loans 501,153$ 732,426$ 953,859$ 1,040,683$ 1,111,622$ 1,198,932$ 1,250,789$ 22% 14% 12% 12% 13% 13% 14% 36% 38% 27% 24% 22% 20% 19% 17% 26% 39% 43% 45% 48% 49% 11% 7% 7% 6% 6% 6% 5% 14% 15% 15% 15% 14% 13 13 2013 2014 4Q15 1Q16 2Q16 3Q16 4Q16 Commercial and industrial Commercial real estate Single Tenant lease financing Residential mortgage/HE/HELOCs Consumer 1 1 Includes commercial and industrial and owner-occupied commercial real estate balances
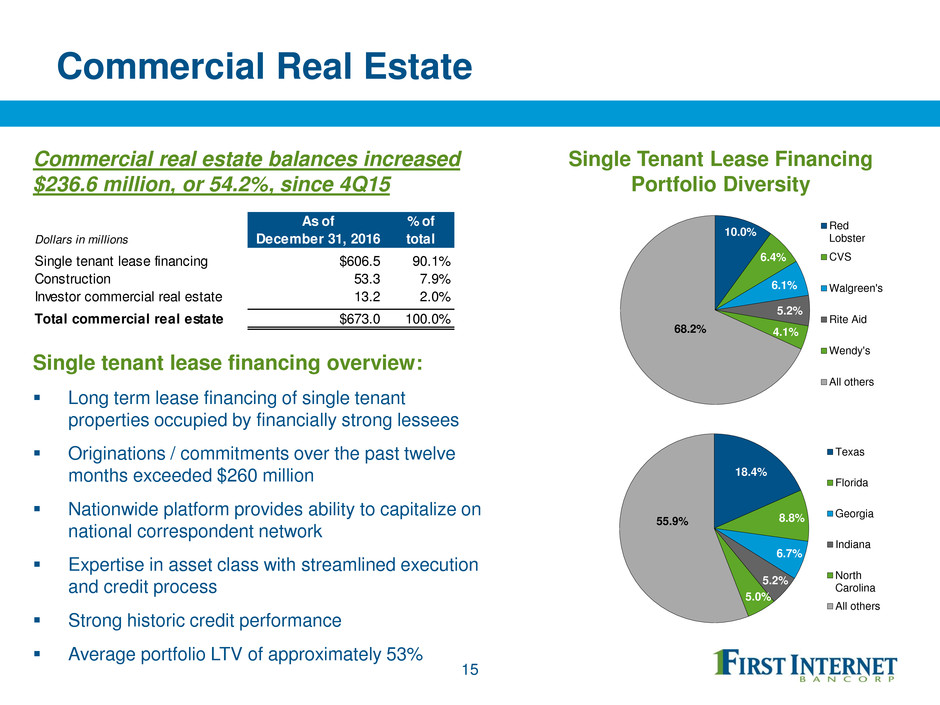
Commercial Real Estate Single tenant lease financing overview: Long term lease financing of single tenant properties occupied by financially strong lessees Originations / commitments over the past twelve months exceeded $260 million Nationwide platform provides ability to capitalize on national correspondent network Expertise in asset class with streamlined execution and credit process Strong historic credit performance Average portfolio LTV of approximately 53% 15 Commercial real estate balances increased $236.6 million, or 54.2%, since 4Q15 Single Tenant Lease Financing Portfolio Diversity 10.0% 6.4% 6.1% 5.2% 4.1%68.2% Red Lobster CVS Walgreen's Rite Aid Wendy's All others 18.4% 8.8% 6.7% 5.2% 5.0% 55.9% Texas Florida Georgia Indiana North Carolina All others As of % of Dollars in millions December 31, 2016 total Single tenant lease financing $606.5 90.1% Construction 53.3 7.9% Investor commercial real estate 13.2 2.0% Total commercial real estate $673.0 100.0%
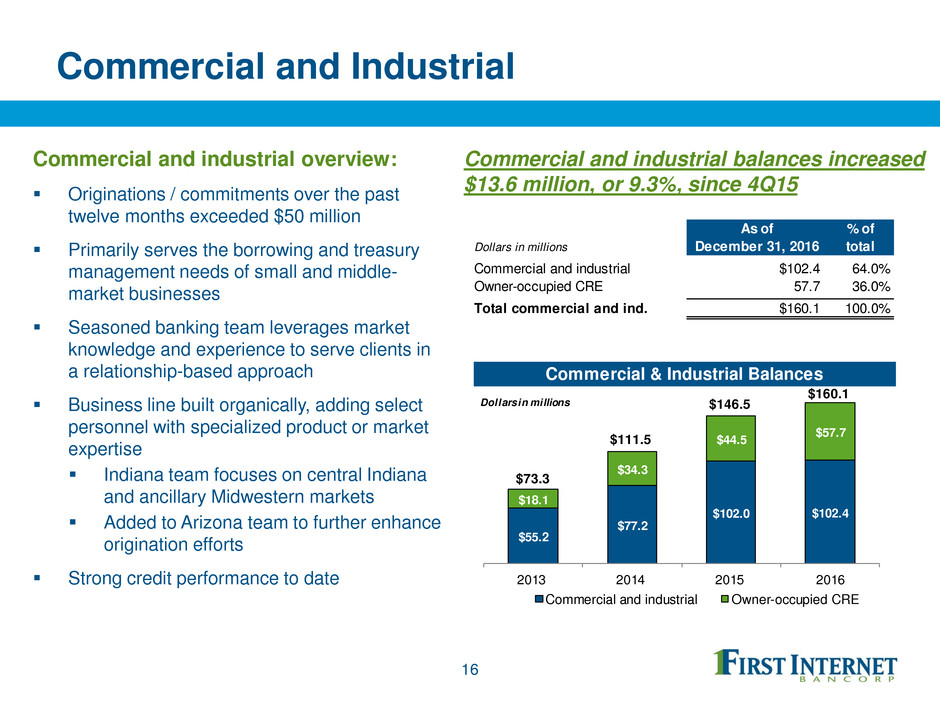
Commercial and Industrial Commercial and industrial overview: Originations / commitments over the past twelve months exceeded $50 million Primarily serves the borrowing and treasury management needs of small and middle- market businesses Seasoned banking team leverages market knowledge and experience to serve clients in a relationship-based approach Business line built organically, adding select personnel with specialized product or market expertise Indiana team focuses on central Indiana and ancillary Midwestern markets Added to Arizona team to further enhance origination efforts Strong credit performance to date 16 Commercial and industrial balances increased $13.6 million, or 9.3%, since 4Q15 As of % of Dollars in millions December 31, 2016 total Commercial and industrial $102.4 64.0% Owner-occupied CRE 57.7 36.0% Total commercial and ind. $160.1 100.0% Commercial & Industrial Balances $55.2 $77.2 $102.0 $102.4 $18.1 $34.3 $44.5 $57.7 2013 2014 2015 2016 Commercial and industrial Owner-occupied CRE Dollars in millions $73.3 $111.5 $146.5 $160.1
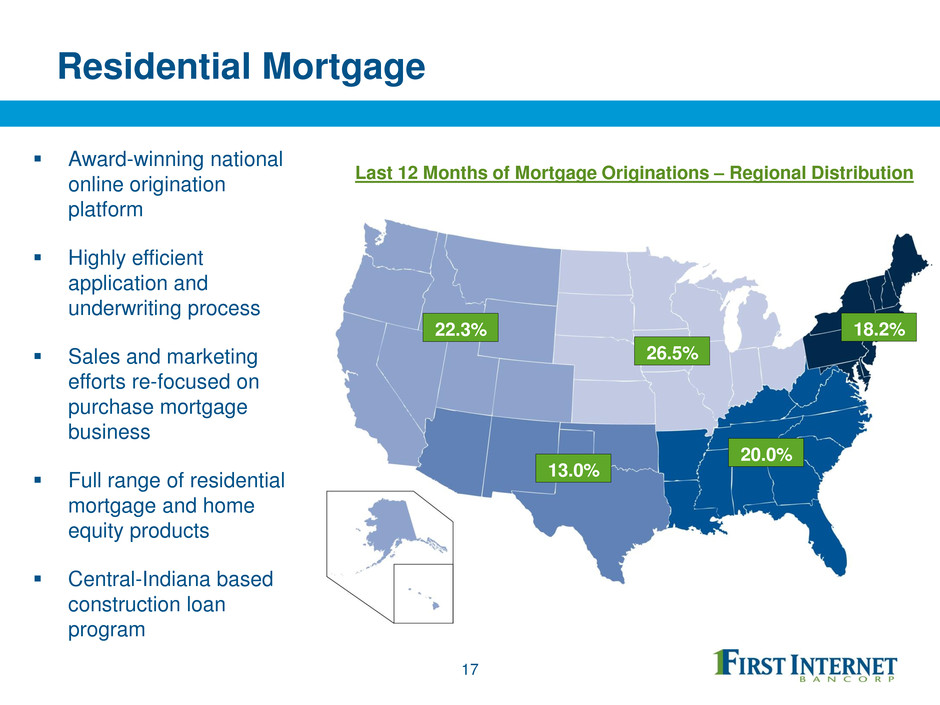
Residential Mortgage 17 Last 12 Months of Mortgage Originations – Regional Distribution Award-winning national online origination platform Highly efficient application and underwriting process Sales and marketing efforts re-focused on purchase mortgage business Full range of residential mortgage and home equity products Central-Indiana based construction loan program 22.3% 13.0% 26.5% 20.0% 18.2%
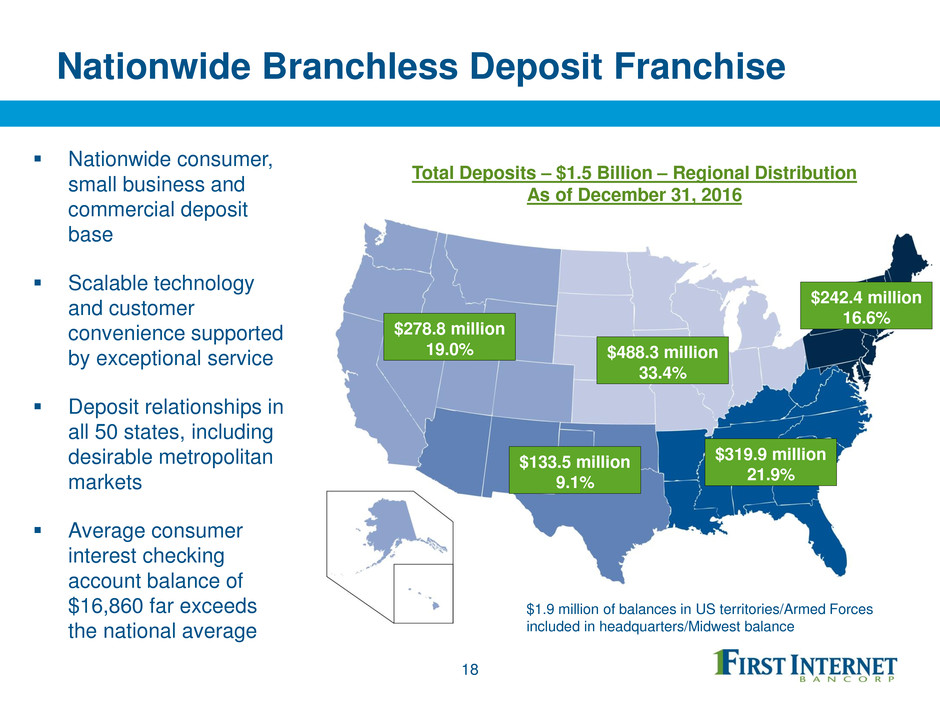
Nationwide Branchless Deposit Franchise 18 Total Deposits – $1.5 Billion – Regional Distribution As of December 31, 2016 Nationwide consumer, small business and commercial deposit base Scalable technology and customer convenience supported by exceptional service Deposit relationships in all 50 states, including desirable metropolitan markets Average consumer interest checking account balance of $16,860 far exceeds the national average $278.8 million 19.0% $133.5 million 9.1% $488.3 million 33.4% $319.9 million 21.9% $242.4 million 16.6% $1.9 million of balances in US territories/Armed Forces included in headquarters/Midwest balance
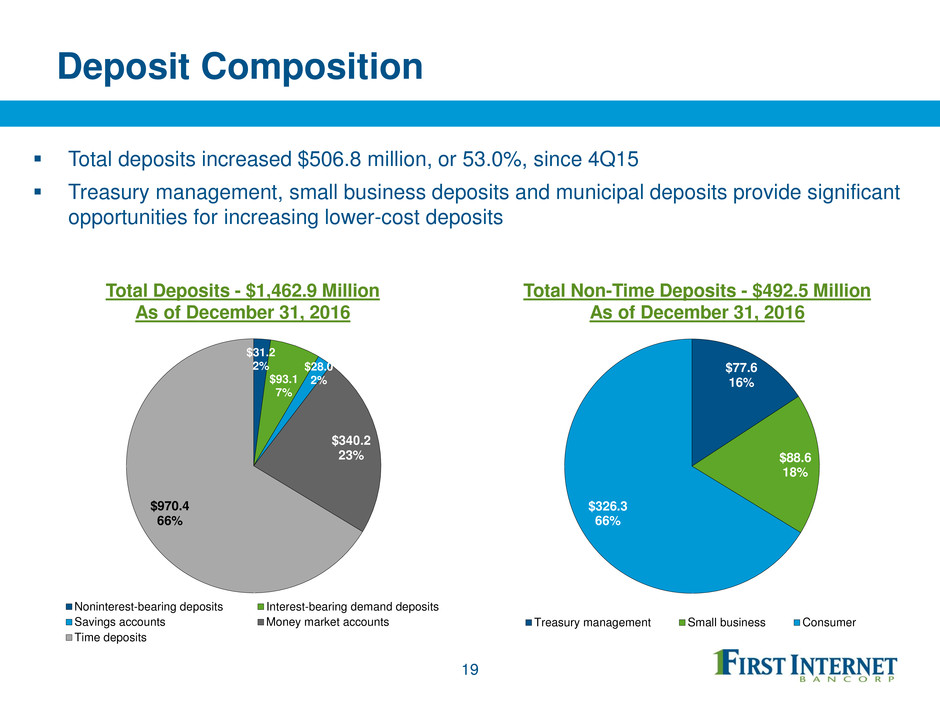
Deposit Composition Total deposits increased $506.8 million, or 53.0%, since 4Q15 Treasury management, small business deposits and municipal deposits provide significant opportunities for increasing lower-cost deposits 19 Total Deposits - $1,462.9 Million As of December 31, 2016 Total Non-Time Deposits - $492.5 Million As of December 31, 2016 $31.2 2% $93.1 7% $28.0 2% $340.2 23% $970.4 66% Noninterest-bearing deposits Interest-bearing demand deposits Savings accounts Money market accounts Time deposits $77.6 16% $88.6 18% $326.3 66% Treasury managem nt Small business Consumer
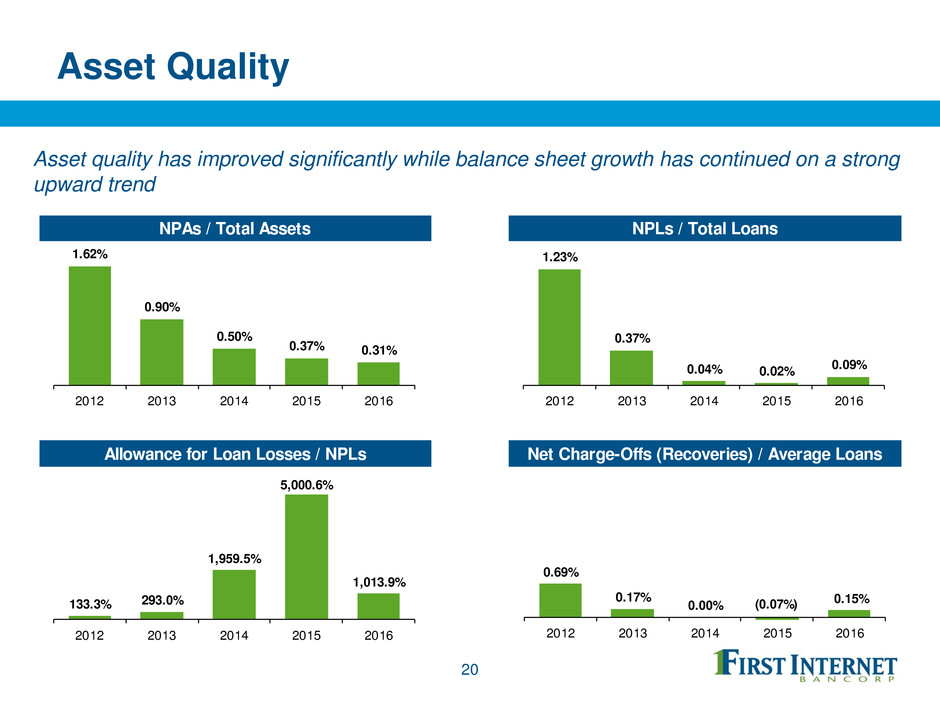
Asset Quality 20 Asset quality has improved significantly while balance sheet growth has continued on a strong upward trend NPAs / Total Assets NPLs / Total Loans Allowance for Loan Losses / NPLs Net Charge-Offs (Recoveries) / Average Loans 1.62% 0.90% 0.50% 0.37% 0.31% 2012 2013 2014 2015 2016 1.23% 0.37% 0.04% 0.02% 0.09% 2012 2013 2014 2015 2016 133.3% 293.0% 1,959.5% 5,000.6% 1,013.9% 2012 2013 2014 2015 2016 0.69% 0.17% 0.00% (0.07%) 0.15% 2012 2013 2014 2015 2016
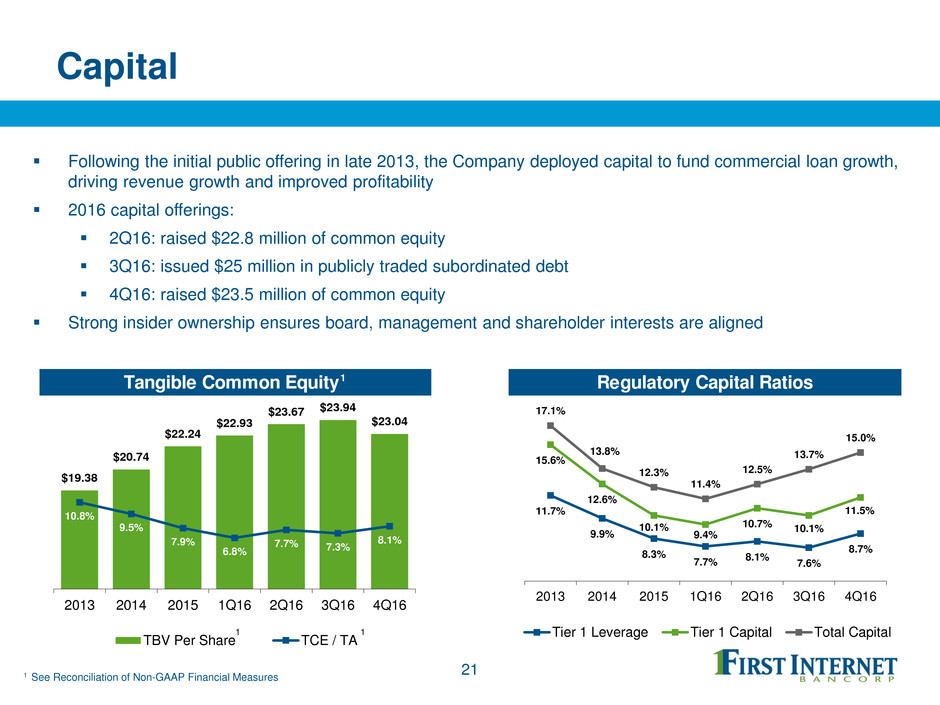
Capital 21 Following the initial public offering in late 2013, the Company deployed capital to fund commercial loan growth, driving revenue growth and improved profitability 2016 capital offerings: 2Q16: raised $22.8 million of common equity 3Q16: issued $25 million in publicly traded subordinated debt 4Q16: raised $23.5 million of common equity Strong insider ownership ensures board, management and shareholder interests are aligned Tangible Common Equity1 Regulatory Capital Ratios 1 1 1 See Reconciliation of Non-GAAP Financial Measures $19.38 $20.74 $22.24 $22.93 $23.67 $23.94 $23.04 10.8% 9.5% 7.9% 6.8% 7.7% 7.3% 8.1% 2013 2014 2015 1Q16 2Q16 3Q16 4Q16 TBV Per Share TCE / TA 11.7% 9.9% 8.3% 7.7% 8.1% 7.6% 8.7% 15.6% 12.6% 10.1% 9.4% 10.7% 10.1% 11.5% 17.1% 13.8% 12.3% 11.4% 12.5% 13.7% 15.0% 2013 2014 2015 1Q16 2Q16 3Q16 4Q16 Tier 1 Leverage Tier 1 Capital Total Capital
Investment Summary Strong earnings growth improving profitability Demonstrated track record of deploying capital to fuel loan growth while maintaining strong asset quality Investments in commercial lending platforms are producing results Geographic and credit product diversity provide ability to generate sustained balance sheet growth Consumer banking platform well-positioned to capitalize on changing consumer preferences Full service, technology-driven model will deliver increasing efficiency Experienced management team committed to building shareholder value 22
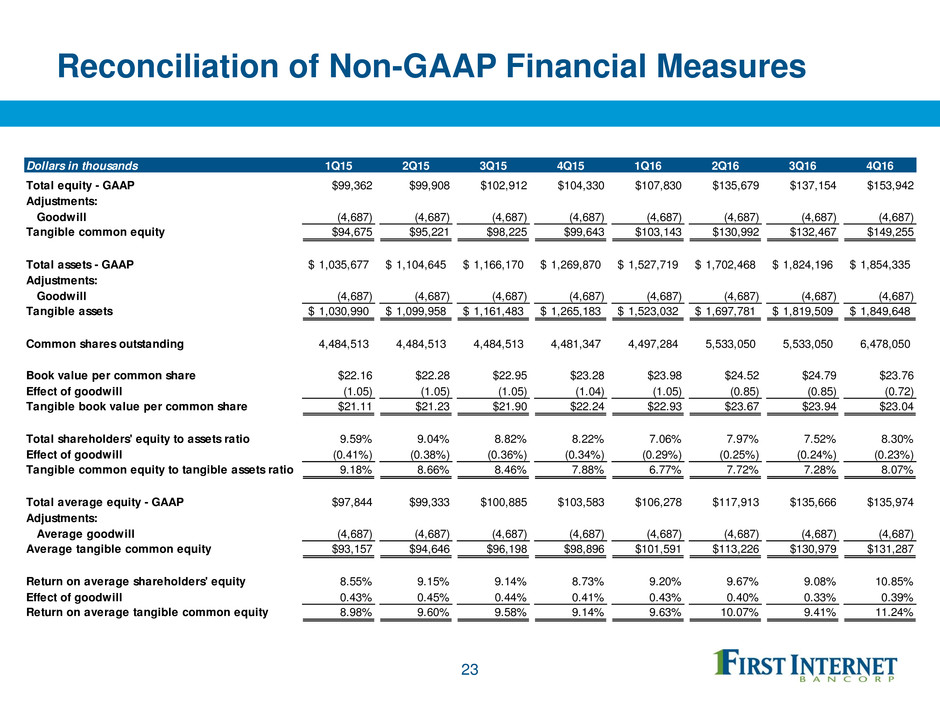
Reconciliation of Non-GAAP Financial Measures 23 Dollars in thousands 1Q15 2Q15 3Q15 4Q15 1Q16 2Q16 3Q16 4Q16 Total equity - GAAP $99,362 $99,908 $102,912 $104,330 $107,830 $135,679 $137,154 $153,942 Adjustments: Goodwill (4,687) (4,687) (4,687) (4,687) (4,687) (4,687) (4,687) (4,687) Tangible common equity $94,675 $95,221 $98,225 $99,643 $103,143 $130,992 $132,467 $149,255 Total assets - GAAP 1,035,677$ 1,104,645$ 1,166,170$ 1,269,870$ 1,527,719$ 1,702,468$ 1,824,196$ 1,854,335$ Adjustments: Goodwill (4,687) (4,687) (4,687) (4,687) (4,687) (4,687) (4,687) (4,687) Tangible assets 1,030,990$ 1,099,958$ 1,161,483$ 1,265,183$ 1,523,032$ 1,697,781$ 1,819,509$ 1,849,648$ Common shares outstanding 4,484,513 4,484,513 4,484,513 4,481,347 4,497,284 5,533,050 5,533,050 6,478,050 Book value per common share $22.16 $22.28 $22.95 $23.28 $23.98 $24.52 $24.79 $23.76 Effect of goodwill (1.05) (1.05) (1.05) (1.04) (1.05) (0.85) (0.85) (0.72) Tangible book value per common share $21.11 $21.23 $21.90 $22.24 $22.93 $23.67 $23.94 $23.04 Total shareholders' equity to assets ratio 9.59% 9.04% 8.82% 8.22% 7.06% 7.97% 7.52% 8.30% Effect of goodwill (0.41%) (0.38%) (0.36%) (0.34%) (0.29%) (0.25%) (0.24%) (0.23%) Tangible common equity to tangible assets ratio 9.18% 8.66% 8.46% 7.88% 6.77% 7.72% 7.28% 8.07% Total average equity - GAAP $97,844 $99,333 $100,885 $103,583 $106,278 $117,913 $135,666 $135,974 Adjustments: Average goodwill (4,687) (4,687) (4,687) (4,687) (4,687) (4,687) (4,687) (4,687) Average tangible common equity $93,157 $94,646 $96,198 $98,896 $101,591 $113,226 $130,979 $131,287 Return on average shareholders' equity 8.55% 9.15% 9.14% 8.73% 9.20% 9.67% 9.08% 10.85% Effect of goodwill 0.43% 0.45% 0.44% 0.41% 0.43% 0.40% 0.33% 0.39% Return on average tangible common equity 8.98% 9.60% 9.58% 9.14% 9.63% 10.07% 9.41% 11.24%

Reconciliation of Non-GAAP Financial Measures 24 Dollars in thousands 1Q15 2Q15 3Q15 4Q15 1Q16 2Q16 3Q16 4Q16 Net Income 2,063$ 2,265$ 2,323$ 2,278$ 2,432$ 2,834$ 3,098$ 3,710$ Adjustments: Inco tax provision 442 1,152 1,229 1,195 1,298 1,421 1,521 1,671 Provision for l an losses 1,160 304 454 746 946 9 4 2,204 256 Pre-tax, pre-provision earnings 3,6 5$ 3,721$ 4,006$ 4,219$ 4,67$ 5,179$ 6,823$ 5,637$
First Internet Bancorp Investor Presentation Fourth Quarter 2016


