Annual Meeting of Shareholders May 15, 2017 Exhibit 99.1
PROPOSALS 2
Election of Directors Proposal 1 3
Advisory Vote to Approve Executive Compensation Proposal 2 4
Ratification of Appointment of Independent Registered Public Accounting Firm Proposal 3 5
VOTING 6
Company Update May 15, 2017
This presentation may contain forward-looking statements with respect to the financial condition, results of operations, plans, objectives, future performance or business of the Company. Forward-looking statements are generally identifiable by the use of words such as “believe,” “expect,” “anticipate,” “plan,” “intend,” “estimate,” “consider,” “may,” “will,” “would,” “could,” “should” or other similar expressions. Forward-looking statements are not a guarantee of future performance or results, are based on information available at the time the statements are made and involve known and unknown risks, uncertainties and other factors that could cause actual results to differ materially from the information in the forward-looking statements. Factors that may cause such differences include: failures of or interruptions in the communications and information systems on which we rely to conduct our business; failure of our plans to grow our commercial real estate, commercial and industrial, and public finance loan portfolios; competition with national, regional and community financial institutions; the loss of any key members of senior management; fluctuations in interest rates; general economic conditions; risks relating to the regulation of financial institutions; and other factors identified in reports we file with the U.S. Securities and Exchange Commission. All statements in this presentation, including forward-looking statements, speak only as of the date they are made, and the Company undertakes no obligation to update any statement in light of new information or future events. Safe Harbor 8
Who We Are First Internet Bank launched in 1999 First state-chartered, FDIC-insured Internet bank Industry pioneer in branchless delivery of consumer and commercial banking services Headquartered in Fishers, IN with a loan production office in Phoenix, AZ Experienced management team 9
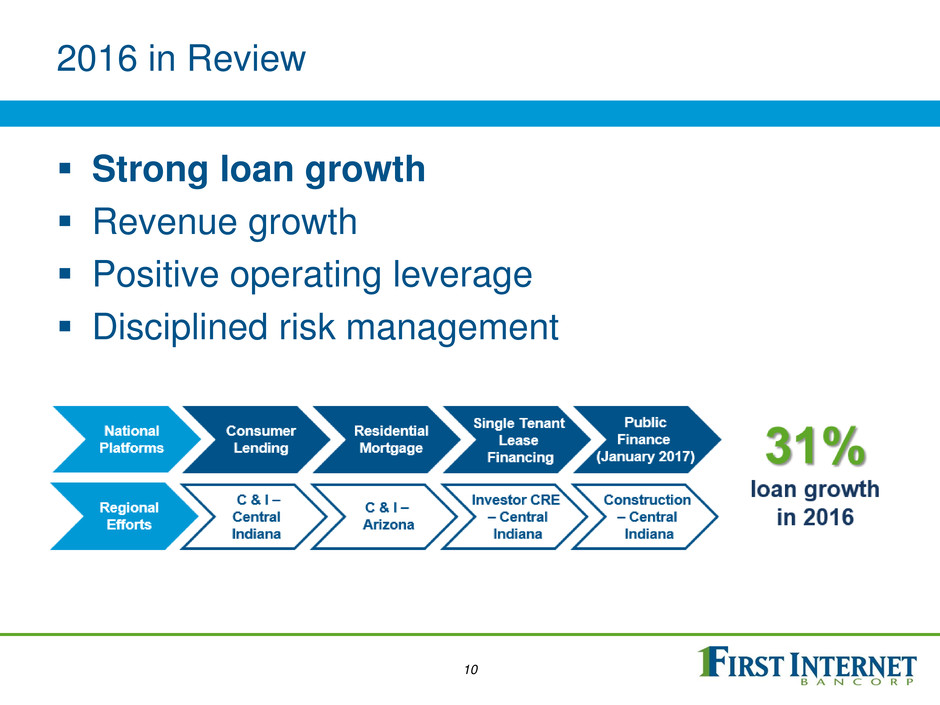
2016 in Review Strong loan growth Revenue growth Positive operating leverage Disciplined risk management 10
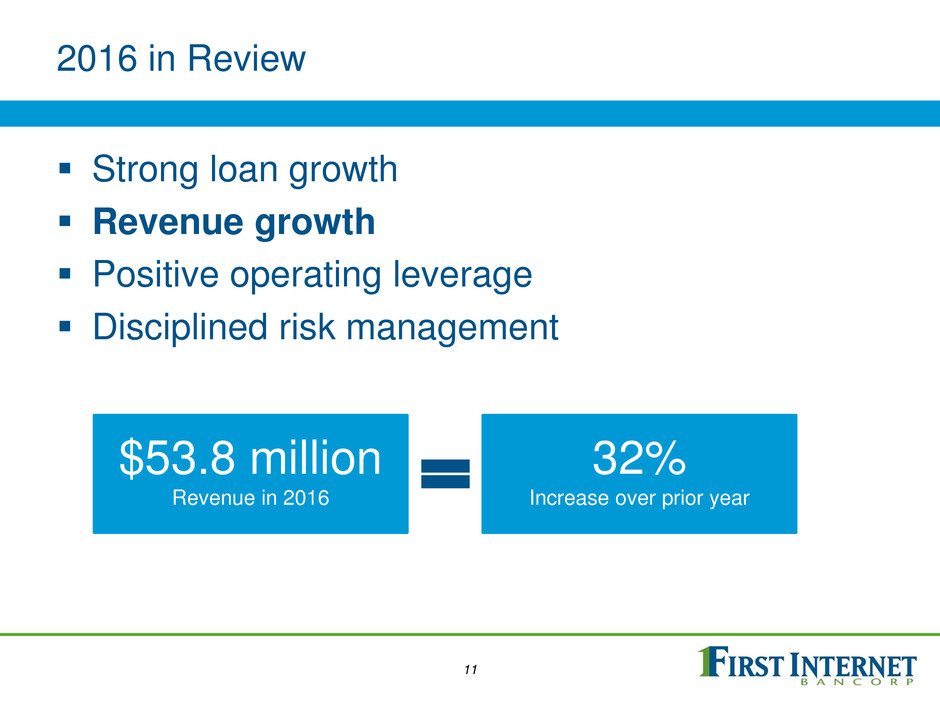
2016 in Review Strong loan growth Revenue growth Positive operating leverage Disciplined risk management $53.8 million Revenue in 2016 32% Increase over prior year 11
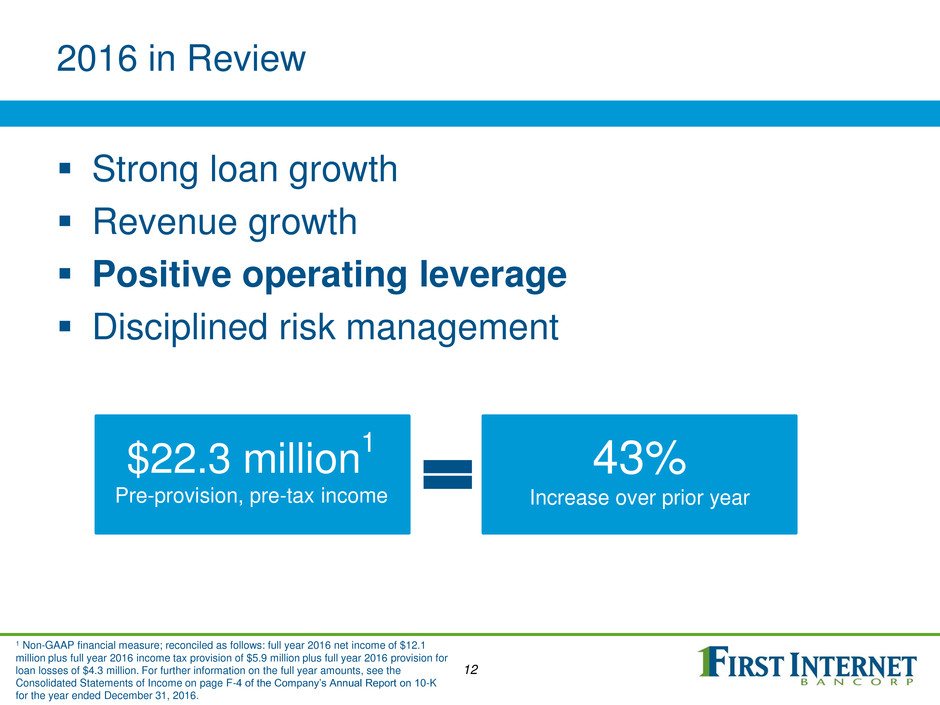
2016 in Review Strong loan growth Revenue growth Positive operating leverage Disciplined risk management $22.3 million 1 Pre-provision, pre-tax income 43% Increase over prior year 12 1 Non-GAAP financial measure; reconciled as follows: full year 2016 net income of $12.1 million plus full year 2016 income tax provision of $5.9 million plus full year 2016 provision for loan losses of $4.3 million. For further information on the full year amounts, see the Consolidated Statements of Income on page F-4 of the Company’s Annual Report on 10-K for the year ended December 31, 2016.
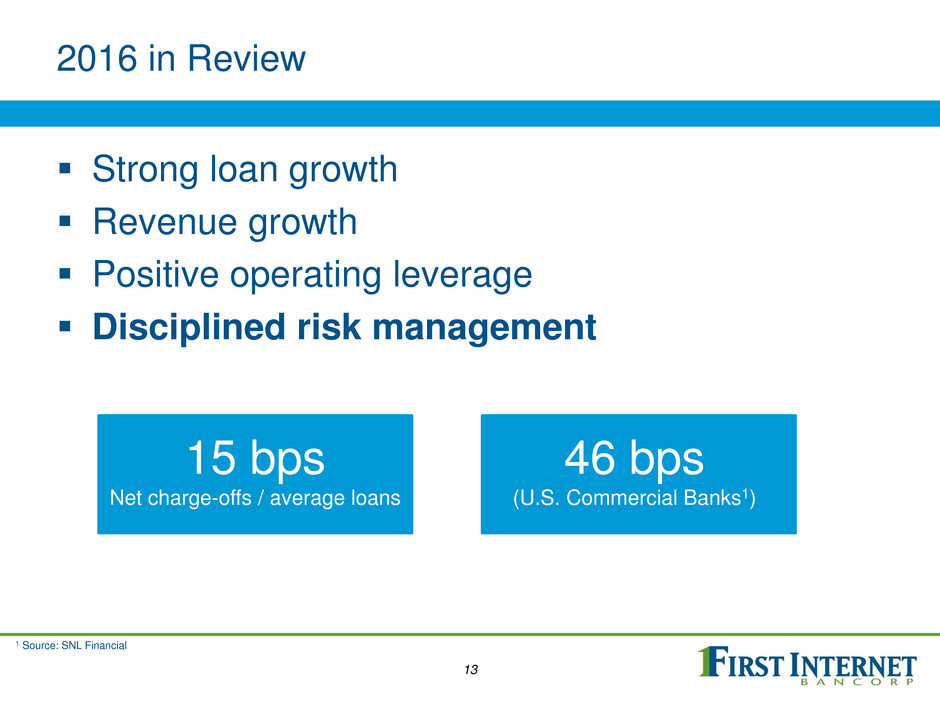
2016 in Review Strong loan growth Revenue growth Positive operating leverage Disciplined risk management 15 bps Net charge-offs / average loans 46 bps (U.S. Commercial Banks1) 1 Source: SNL Financial 13
FIRST LOOK Focused on the Future 14

Driving to $3 Billion in Total Assets 15
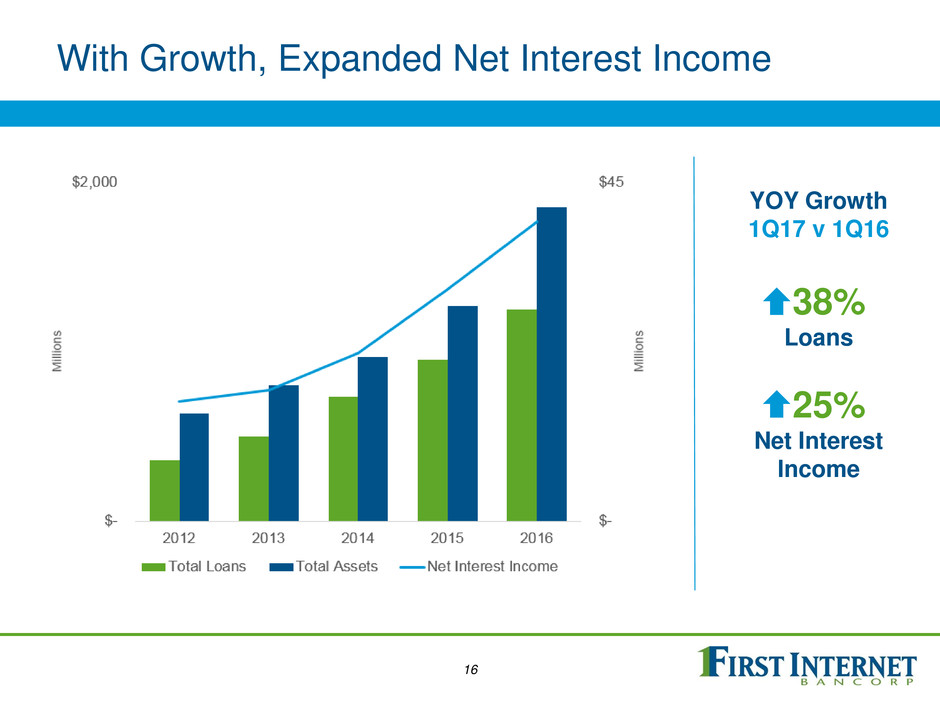
With Growth, Expanded Net Interest Income YOY Growth 1Q17 v 1Q16 16 38% Loans 25% Net Interest Income
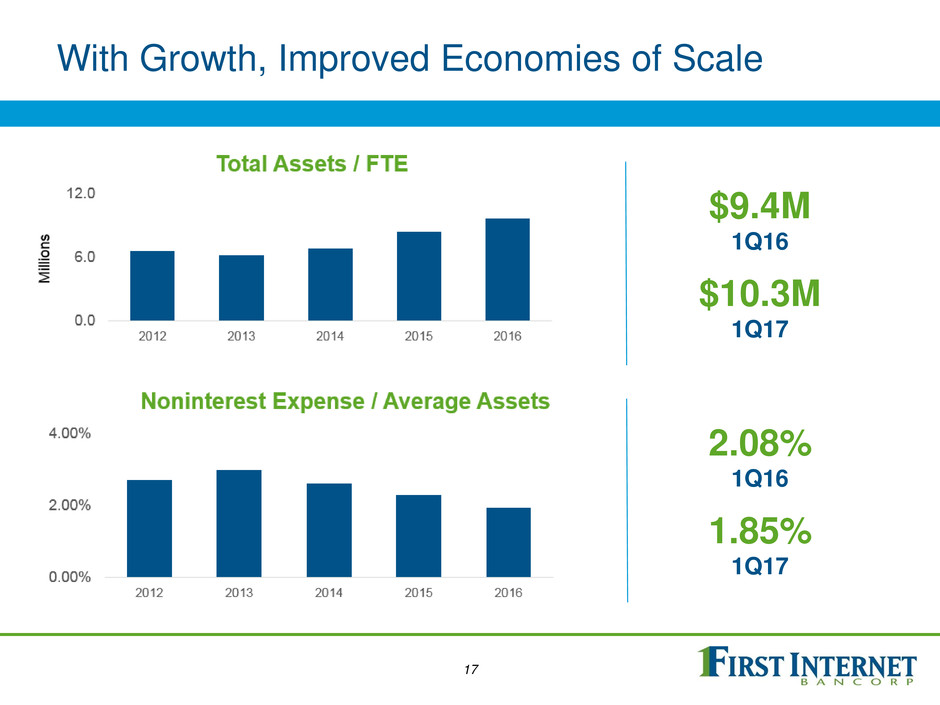
With Growth, Improved Economies of Scale $9.4M 1Q16 $10.3M 1Q17 2.08% 1Q16 1.85% 1Q17 17
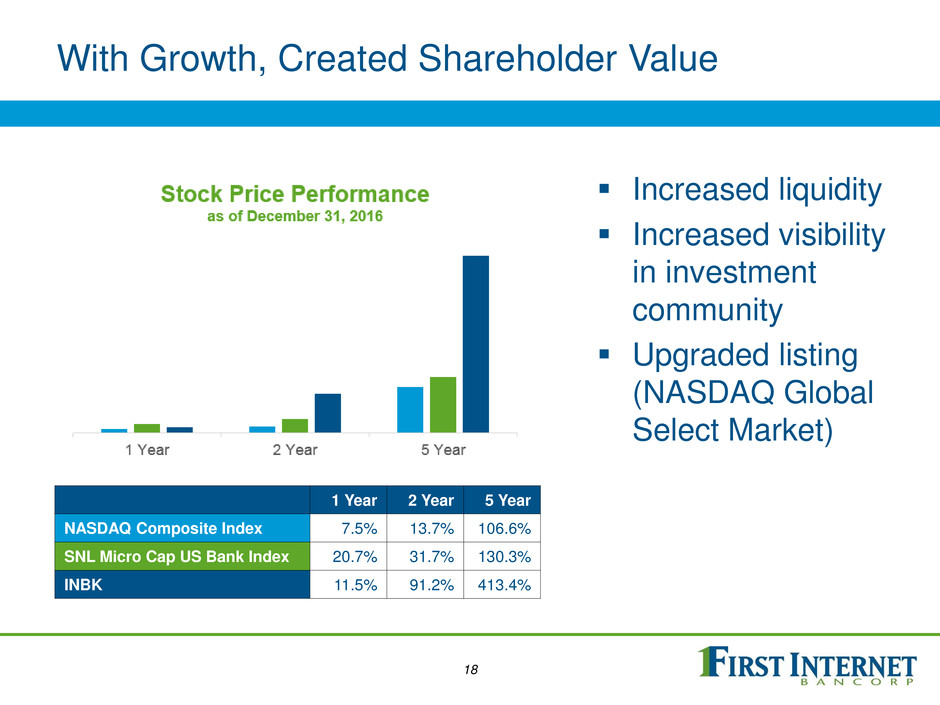
With Growth, Created Shareholder Value 1 Year 2 Year 5 Year NASDAQ Composite Index 7.5% 13.7% 106.6% SNL Micro Cap US Bank Index 20.7% 31.7% 130.3% INBK 11.5% 91.2% 413.4% 18 Increased liquidity Increased visibility in investment community Upgraded listing (NASDAQ Global Select Market)

Our Growth: Organic Five-year balance sheet growth rates far exceed median rates for similar institutions 19 Source: Company data and SNL Financial; financial data as March 31, 2017; peer data represents median value of component companies. SNL Micro Cap US Banks represent publicly traded micro cap banks with a market capitalization of less than $250 million; peer data based on index components as of March 31, 2017.
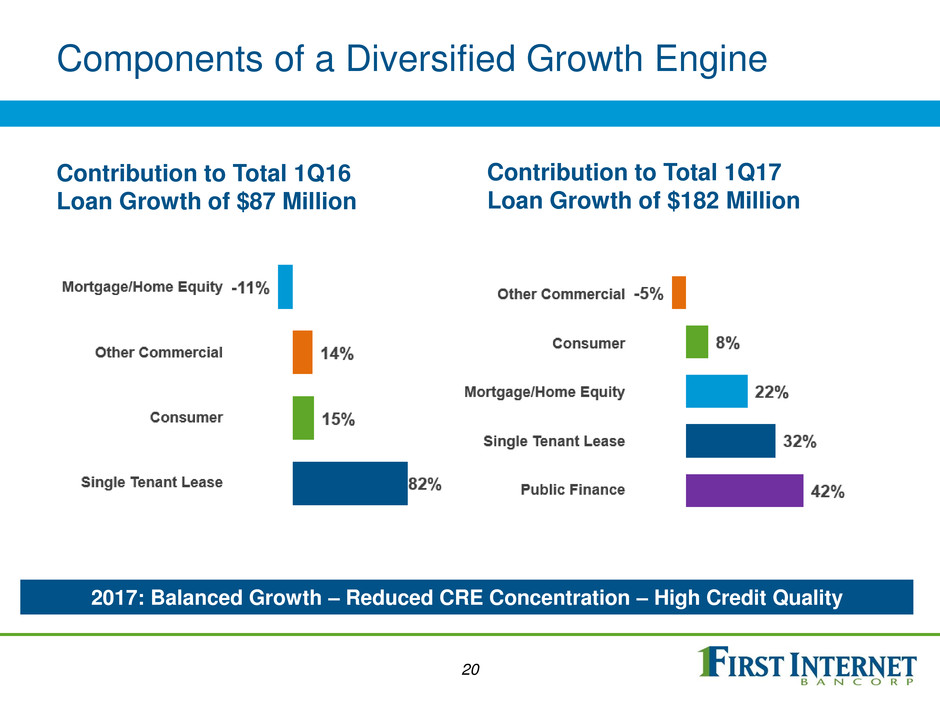
Components of a Diversified Growth Engine Contribution to Total 1Q16 Loan Growth of $87 Million Contribution to Total 1Q17 Loan Growth of $182 Million 2017: Balanced Growth – Reduced CRE Concentration – High Credit Quality 20

Growth Opportunities under Consideration Marketplace lending Healthcare or other industry-focused lending Asset-based lending Specialty finance (equipment, franchise, lender, trade) SBA lending Other niche consumer lending 21
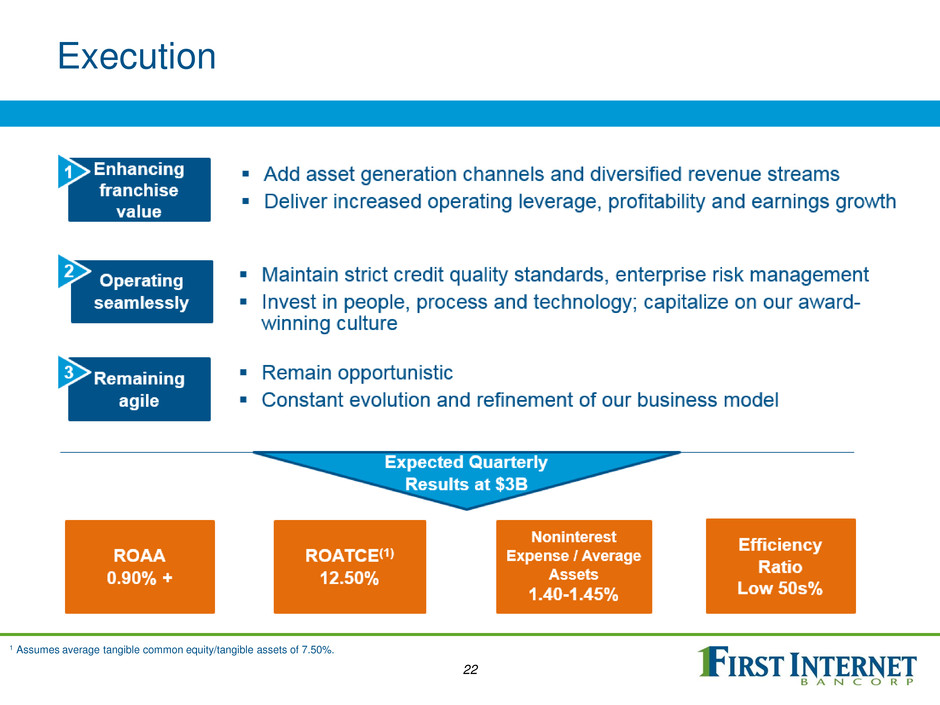
Execution 1 Assumes average tangible common equity/tangible assets of 7.50%. 22
Investor Relations www.firstinternetbancorp.com investors@firstib.com NASDAQ: INBK 23


