
Investor Presentation First Quarter 2019 Exhibit 99.1
Forward-Looking Statements This presentation may contain forward-looking statements with respect to the financial condition, results of operations, trends in lending policies, plans, objectives, future performance or business of the Company. Forward-looking statements are generally identifiable by the use of words such as “anticipate,” “believe,” “could,” “estimate,” “expect,” “intend,” “may,” “pending,” “plan,” “preliminary,” “should,” “will,” “would” or other similar expressions. Forward-looking statements are not a guarantee of future performance or results, are based on information available at the time the statements are made and involve known and unknown risks, uncertainties and other factors that could cause actual results to differ materially from the information in the forward-looking statements. Factors that may cause such differences include: failures or breaches of or interruptions in the communications and information systems on which we rely to conduct our business; failure of our plans to grow our commercial real estate, commercial and industrial, public finance and healthcare finance loan portfolios; competition with national, regional and community financial institutions; the loss of any key members of senior management; fluctuations in interest rates; general economic conditions; risks relating to the regulation of financial institutions; and other factors identified in reports we file with the U.S. Securities and Exchange Commission. All statements in this presentation, including forward-looking statements, speak only as of the date they are made, and the Company undertakes no obligation to update any statement in light of new information or future events. 2
Non-GAAP Financial Measures This presentation contains financial information determined by methods other than in accordance with U.S. generally accepted accounting principles (“GAAP”). Non-GAAP financial measures, specifically adjusted net income, adjusted diluted earnings per share, average tangible common equity, adjusted return on average assets, return on average tangible common equity (“ROATCE”), adjusted ROATCE, tangible common equity (“TCE”), tangible assets (“TA”), tangible book value (“TBV”) per common share, tangible common equity to tangible assets, net interest margin – FTE, adjusted noninterest expense/average assets and adjusted efficiency ratio are used by the Company’s management to measure the strength of its capital and analyze profitability, including its ability to generate earnings on tangible capital invested by its shareholders. Although management believes these non-GAAP measures are useful to investors by providing a greater understanding of its business, they should not be considered a substitute for financial measures determined in accordance with GAAP, nor are they necessarily comparable to non-GAAP financial measures that may be presented by other companies. Reconciliations of these non-GAAP financial measures to the most directly comparable GAAP financial measures are included in the table at the end of this presentation under the caption “Reconciliation of Non-GAAP Financial Measures.” 3

A Pioneer in Branchless Banking • Digital bank with unique business model and over 20 years of operations • Highly scalable technology driven business • Nationwide deposit gathering and asset generation platforms • Attractive lending niches with growth opportunities • History of strong growth and a pathway to greater profitability $3.7B Assets $2.8B Loans $2.8B Deposits 4
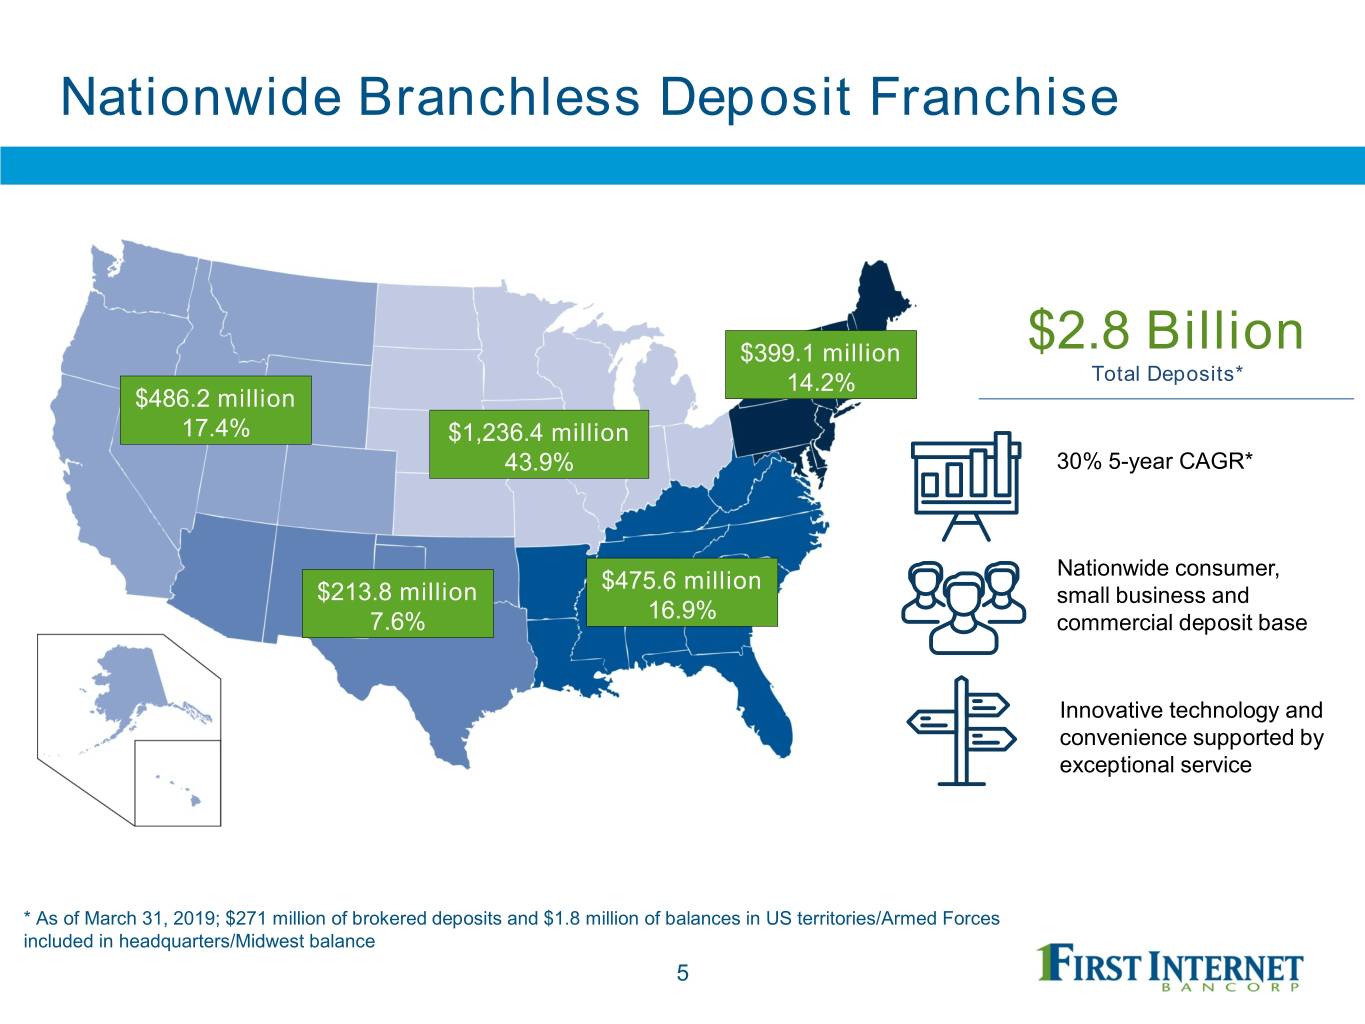
Nationwide Branchless Deposit Franchise $399.1 million $2.8 Billion 14.2% Total Deposits* $486.2 million 17.4% $1,236.4 million 43.9% 30% 5-year CAGR* Nationwide consumer, $475.6 million $213.8 million small business and 7.6% 16.9% commercial deposit base Innovative technology and convenience supported by exceptional service * As of March 31, 2019; $271 million of brokered deposits and $1.8 million of balances in US territories/Armed Forces included in headquarters/Midwest balance 5

Multiple Opportunities to Grow Deposits . Capitalize on the enduring trend toward branchless banking – consumers and small business are increasingly moving their banking business online . Generate an increased level of lower-cost deposits as expansion of small-business, municipal and commercial relationships continue . Selectively target consumer deposits in tech-centric markets – building off success with Gen-Xers . Draw on over 20 years of branchless banking experience to attract more customers with best practices such as dedicated online relationship bankers delivering a superior client experience 6

National and Regional Asset Generation Platform DIVERSIFIED ASSET GENERATION PLATFORM Commercial - National Commercial - Regional . C&I – Central Indiana . Single tenant lease financing . C&I – Arizona . Public finance . Investor CRE – Central Indiana . Healthcare finance (via relationship with . Construction – Central Indiana Lendeavor) Consumer - National . Digital direct-to-consumer mortgages . Specialty lending – horse trailers and RVs 7

Attractive Loan Growth Opportunities . Entrance into new verticals – complement existing lines and add diversity . SBA lending – pending acquisition of small business lending division of First Colorado National Bank accelerates recent hiring initiatives to build this line of business . Further market penetration of niche specialty lending . Public finance – geographic and product expansion; increased network of origination sources . Healthcare finance – geographic and product expansion . Focus is on specialty lending lines that are relatively low-risk and rooted in sustainable industries . Historic strong credit performance and/or favorable regulatory capital treatment . Long-term commitment to our specialty-line customers as major competitors often move in and out of these sectors . First Internet’s consistent market presence builds brand reputation within its niche markets 8

Small Business, Big Opportunity . Complementary to existing business lines . Diversifies revenue in a capital efficient manner . Opportunities on both sides of the balance sheet Enhanced Treasury Upgraded Digital SBA Lending Management Capabilities Account Access 9

Entrepreneurial Culture Key to Success First Internet Bank has been recognized for its innovation and is consistently ranked among the best banks to work for, enhancing its ability to attract and retain top talent . American Banker’s “Best Banks to Work For” Six years in a row . “Top Workplaces in Indianapolis” The Indianapolis Star Five years in a row including being #4 in 2018 and #2 on the list in 2017 . “Best Places to Work in Indiana” Five of last seven years . Top Rated Online Business Bank in 2017 – Advisory HQ . TechPoint 2016 Mira Award “Tech-enabled Company of the Year” . Top 10 finalist – 2016 Indiana Public Company of the year presented by the CFA Society and FEI . Magnify Money ranked #1 amongst 2016 Best Banking Apps (Banker’s “Online Direct Banks”) . Mortgage Technology 2013 awarded top honors in the Online Mortgage Originator category 10

History of Strong Organic Growth Execution of the business strategy has driven consistent and sustained balance sheet growth Total Assets Total Loans Dollars in millions Dollars in millions $2,840 $2,716 $3,542 $3,670 CAGR: 30.5% vs. Peers1 at 13.1% CAGR: 31.1% vs. Peers1 at 16.4% $2,768 $2,091 $1,854 $1,251 $1,270 $954 $971 $732 2014 2015 2016 2017 2018 1Q19 2014 2015 2016 2017 2018 1Q19 Total Deposits Shareholders’ Equity Dollars in millions Dollars in millions $2,671 $2,811 $289 $294 CAGR: 29.9% vs. Peers1 at 14.0% CAGR: 24.8% $2,085 $224 $1,463 $154 $956 $104 $759 $97 2014 2015 2016 2017 2018 1Q19 2014 2015 2016 2017 2018 1Q19 1 Source: SNL Financial; Small Cap US Banks. Peer data represents median value of publically traded Small Cap banks with a market capitalization between $250 million and $1.0 billion as of 03/31/19. 11

Profitability Driven by Capital Deployment Capital has been deployed into new loan verticals, driving earnings growth Net Income1,2,3 Diluted EPS1,2,3 Dollars in thousands $23,814 $23,482 $2.30 $2.39 $2.50 $2.37 $21,900 $21,568 $1.96 $17,072 $2.30 $2.13 $2.19 $12,074 $15,226 $8,929 $0.96 $4,324 2014 2015 2016 2017 2018 TTM 1Q19 2014 2015 2016 2017 2018 TTM 1Q19 Return on Average Assets1,2,3 Return on Average Tangible Common Equity1,2,3 0.81% 0.74% 0.74% 0.78% 0.72% 10.12% 9.84% 9.33% 9.35% 8.64% 0.72% 0.50% 0.66% 0.66% 8.77% 8.60% 7.94% 4.85% 2014 2015 2016 2017 2018 TTM 1Q19 2014 2015 2016 2017 2018 TTM 1Q19 1 See Reconciliation of Non-GAAP Financial Measures. 2 2017 reported net income of $15.2 million included the revaluation of the Company’s net deferred tax asset which reduced net income by $1.8 million and negatively impacted Net Income, EPS, ROAA and ROATCE. 3 2018 reported net income of $21.9 million and TTM 1Q19 net income of $19.7 million included a write-down of legacy other real estate owned which 12 reduced net income by $1.9 million and negatively impacted Net Income, EPS, ROAA and ROATCE.

Growth Drives Economies of Scale Scalable, technology-driven model has delivered increasing efficiency and is a key component driving improved operating leverage Net Interest Income - FTE1 Noninterest Expense / Average Assets2 Dollars in millions $17.8 $16.9 $16.6 $17.3 $16.9 1.63% $15.5 $16.4 1.50% 1.45% 1.47% 1.40% 1.52% $13.5 1.27% 1.24% 1.23% 2Q17 3Q17 4Q17 1Q18 2Q18 3Q18 4Q18 1Q19 2Q17 3Q17 4Q17 1Q18 2Q18 3Q18 4Q18 1Q19 Efficiency Ratio2 Total Assets Per FTE 72.9% Dollars in millions $17.6 $17.6 59.7% $15.6 56.8% 55.9% $15.1 54.2% 54.2% 56.9% 57.7% $14.0 $12.9 $13.4 59.1% $12.1 2Q17 3Q17 4Q17 1Q18 2Q18 3Q18 4Q18 1Q19 2Q17 3Q17 4Q17 1Q18 2Q18 3Q18 4Q18 1Q19 1 See Reconciliation of Non-GAAP Financial Measures 2 4Q18 results included a write-down of legacy other real estate owned which increased noninterest expense by $2.4 million. 13
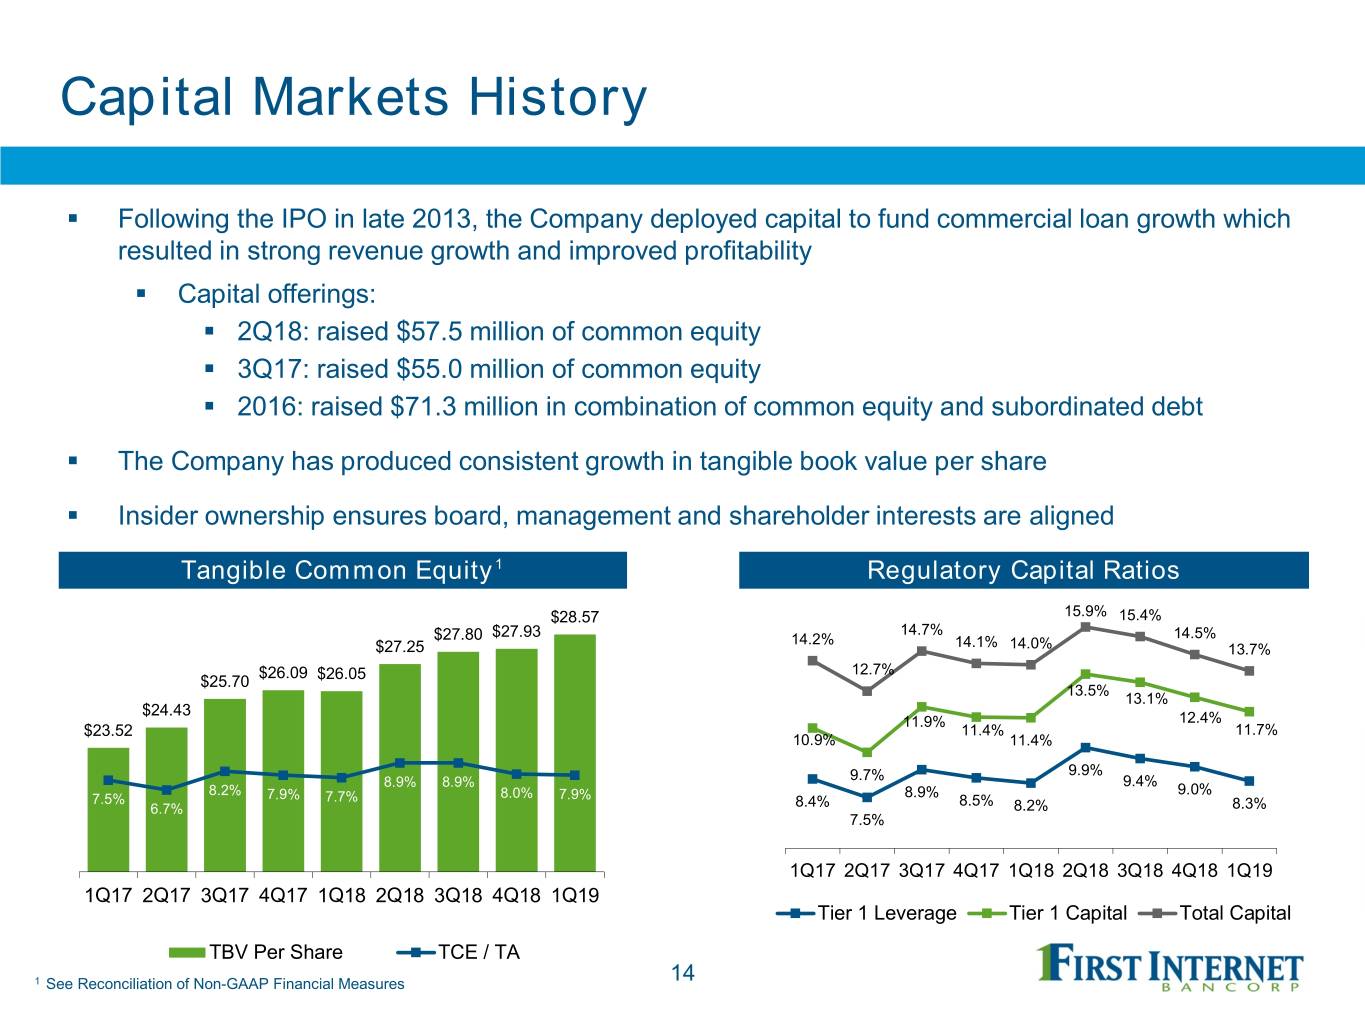
Capital Markets History . Following the IPO in late 2013, the Company deployed capital to fund commercial loan growth which resulted in strong revenue growth and improved profitability . Capital offerings: . 2Q18: raised $57.5 million of common equity . 3Q17: raised $55.0 million of common equity . 2016: raised $71.3 million in combination of common equity and subordinated debt . The Company has produced consistent growth in tangible book value per share . Insider ownership ensures board, management and shareholder interests are aligned Tangible Common Equity1 Regulatory Capital Ratios $28.57 15.9% 15.4% 14.7% $27.80 $27.93 14.2% 14.5% $27.25 14.1% 14.0% 13.7% $26.09 12.7% $25.70 $26.05 13.5% 13.1% $24.43 11.9% 12.4% $23.52 11.4% 11.7% 10.9% 11.4% 9.9% 8.9% 8.9% 9.7% 9.4% 8.2% 8.0% 8.9% 9.0% 7.5% 7.9% 7.7% 7.9% 8.5% 6.7% 8.4% 8.2% 8.3% 7.5% 1Q17 2Q17 3Q17 4Q17 1Q18 2Q18 3Q18 4Q18 1Q19 1Q17 2Q17 3Q17 4Q17 1Q18 2Q18 3Q18 4Q18 1Q19 Tier 1 Leverage Tier 1 Capital Total Capital TBV Per Share TCE / TA 1 See Reconciliation of Non-GAAP Financial Measures 14

Capital and Balance Sheet Management . Combination of lower risk asset profile and top quartile asset quality performance provides ability to maximize capital leverage . Announced a stock repurchase program in 4Q18 to repurchase up to $10.0 million in common stock . Through the date of the Company’s 1Q19 earnings release, 128,183 shares have been repurchased at an aggregate amount of $2.6 million . Active balance sheet management to ensure growth and capital are managed efficiently . Repositioning of loan portfolio to improve net interest margin and EPS . Sold $35.6 million of loans during 1Q19; expect continued sales to manage portfolio growth . Existing capital levels provides capacity to handle balance sheet growth Risk-Weighted Assets / Nonperforming Loans / Nonperforming Assets / Total Assets Total Loans1 Total Assets1 77% 0.94% 0.73% 71% 0.18% 0.13% INBK Peers2 Source: S&P Global Intelligence 1 Nonperforming loans and nonperforming assets include current troubled debt restructurings 2 Peer group includes publicly traded banks with assets of $2.5 billion to $5.0 billion; data as of March 31, 2019 15

Deposit Composition . Total deposits increased $634.0 million, or 29.1%, since 1Q18 Total Deposits - $2.8 Billion Total Non-Time Deposits - $773.4 Million As of March 31, 2019 As of March 31, 2019 1 $45.9 $42.0 2% $111.6 2% 4% $203.8 $573.9 26% 20% $407.7 53% $78.4 $2,037.7 10% 72% $83.5 11% Noninterest-bearing deposits Interest-bearing demand deposits Savings accounts Money market accounts Treasury management Public funds Small business Consumer Certificates and brokered deposits 1 Total non-time deposits excludes brokered non-time deposits 16
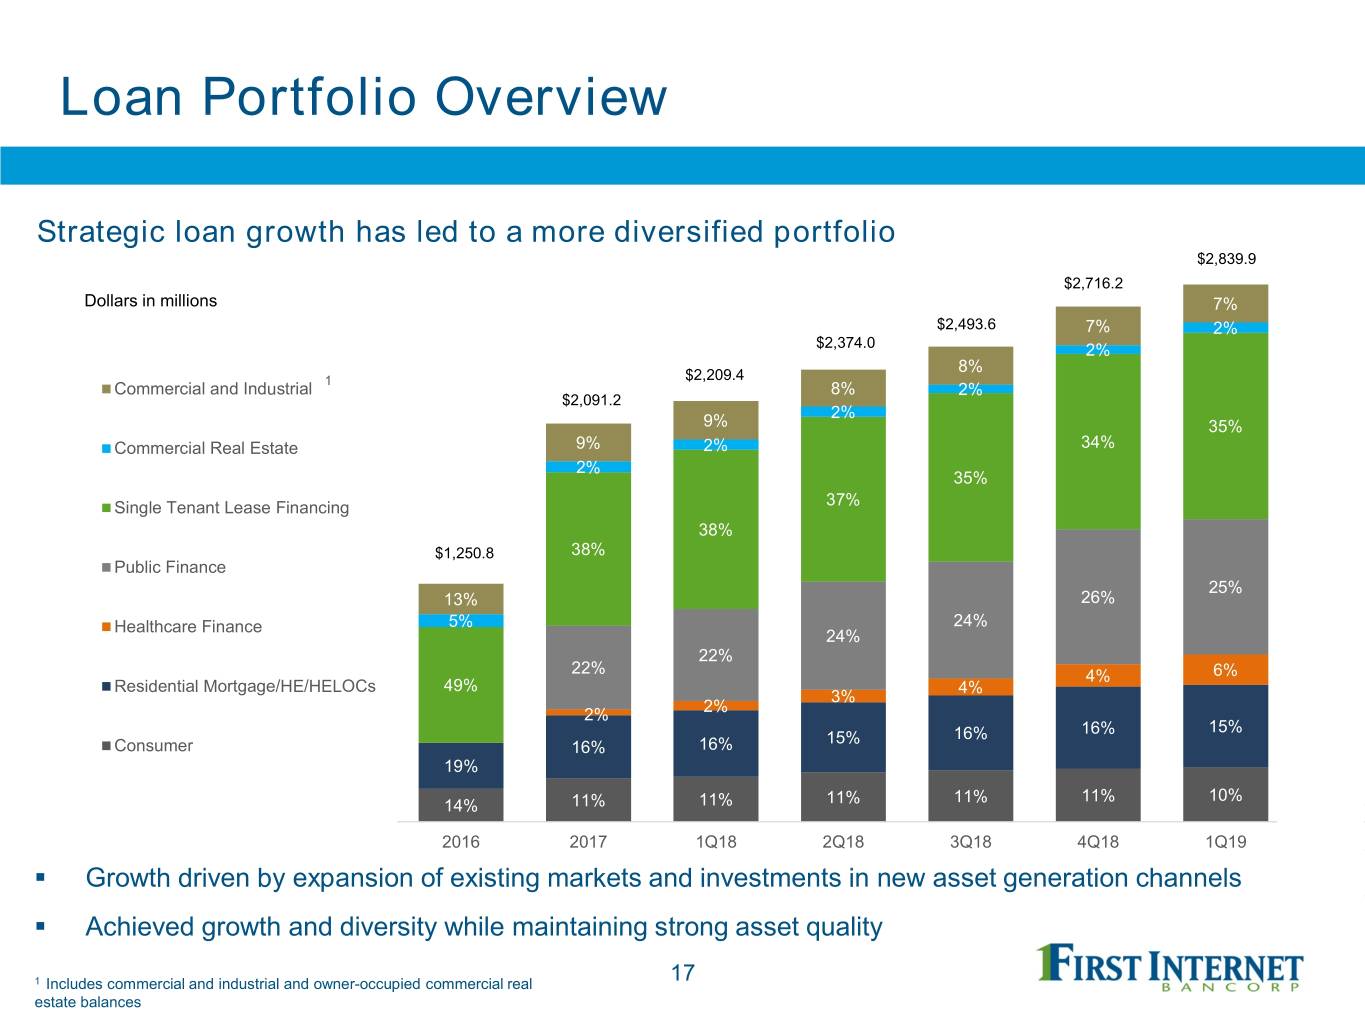
Loan Portfolio Overview Strategic loan growth has led to a more diversified portfolio $2,839.9 $2,716.2 Dollars in millions 7% $2,493.6 7% 2% $2,374.0 2% 8% 1 $2,209.4 Commercial and Industrial 8% 2% $2,091.2 2% 9% 35% Commercial Real Estate 9% 2% 34% 2% 35% Single Tenant Lease Financing 37% 38% $1,250.8 38% Public Finance 25% 13% 26% Healthcare Finance 5% 24% 24% 22% 22% 4% 6% Residential Mortgage/HE/HELOCs 49% 4% 3% 2% 2% 16% 15% 15% 16% Consumer 16% 16% 19% 11% 11% 10% 14% 11% 11% 11% 2016 2017 1Q18 2Q18 3Q18 4Q18 1Q19 . Growth driven by expansion of existing markets and investments in new asset generation channels . Achieved growth and diversity while maintaining strong asset quality 1 Includes commercial and industrial and owner-occupied commercial real 17 estate balances

Commercial Real Estate Commercial real estate balances increased Single Tenant Lease Financing $141.7 million, or 16.0%, since 1Q18 Portfolio Diversity Red Lobster As of % of 7.0% Dollars in millions March 31, 2019 total 6.5% Walgreen's Single tenant lease financing $975.8 94.8% 5.4% Construction 42.3 4.1% Bob Evans 4.4% Investor commercial real estate 11.2 1.1% 4.4% Total commercial real estate $1,029.3 100.0% Intl Car Wash Grp Single tenant lease financing overview: 72.3% CVS . Long term lease financing of single tenant All others properties occupied by financially strong lessees . Originations / commitments over the past twelve Texas 16.0% months exceeded $232 million Ohio . Nationwide platform provides ability to capitalize on 7.5% Florida national correspondent network 5.8% Georgia . 59.7% Expertise in asset class with streamlined execution 5.7% and credit process North 5.3% Carolina . Strong historical credit performance All others . Average portfolio LTV of approximately 52% 18
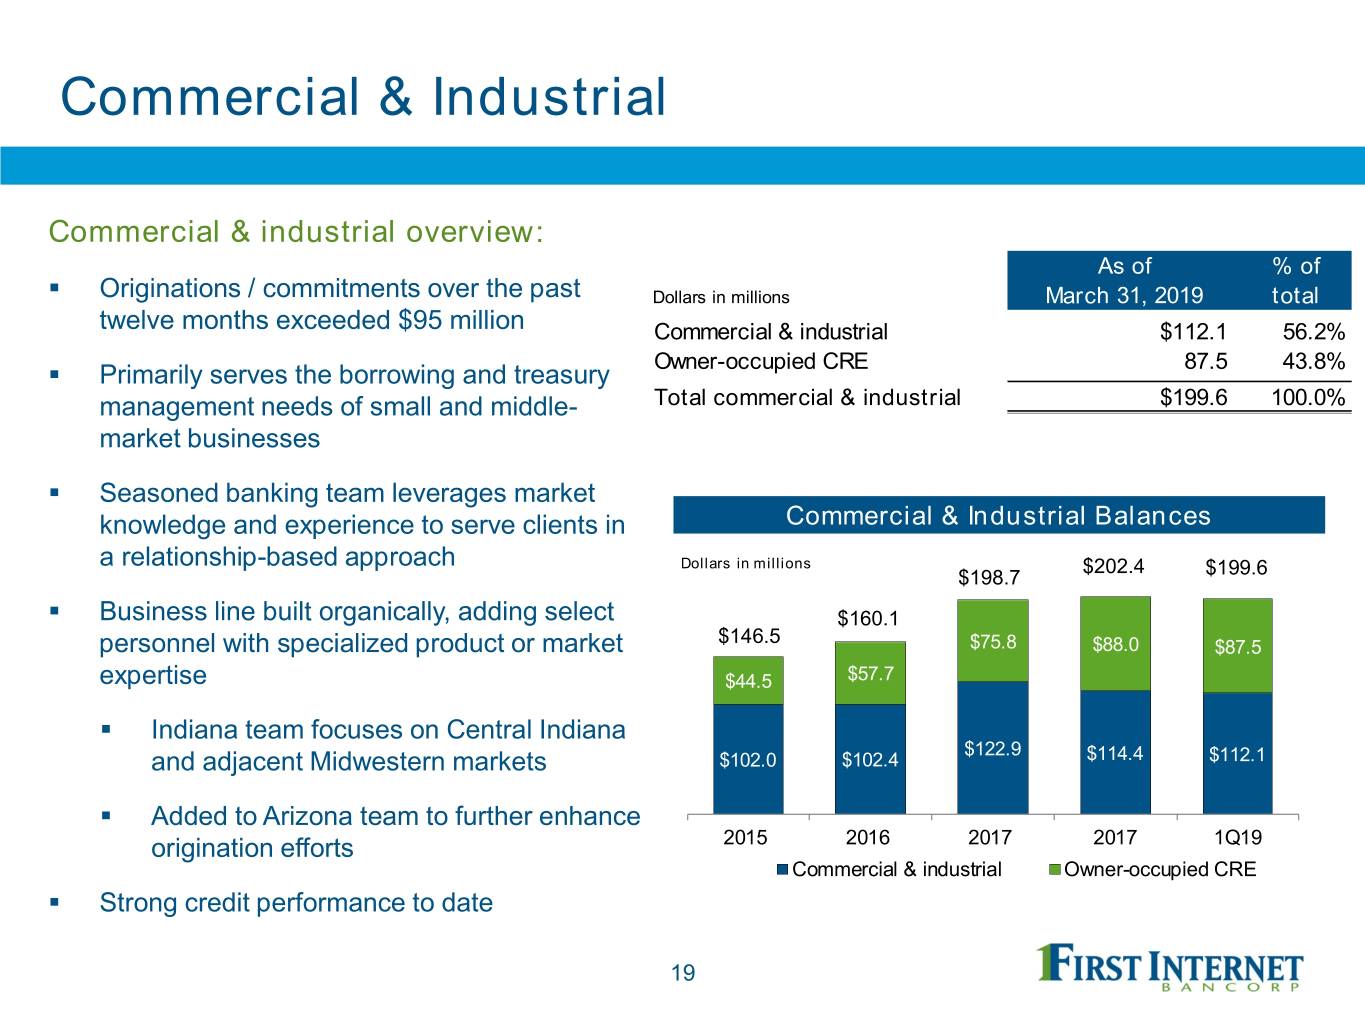
Commercial & Industrial Commercial & industrial overview: As of % of . Originations / commitments over the past Dollars in millions March 31, 2019 total twelve months exceeded $95 million Commercial & industrial $112.1 56.2% Owner-occupied CRE 87.5 43.8% . Primarily serves the borrowing and treasury management needs of small and middle- Total commercial & industrial $199.6 100.0% market businesses . Seasoned banking team leverages market knowledge and experience to serve clients in Commercial & Industrial Balances a relationship-based approach Dollars in millions $202.4 $198.7 $199.6 . Business line built organically, adding select $160.1 $146.5 personnel with specialized product or market $75.8 $88.0 $87.5 expertise $44.5 $57.7 . Indiana team focuses on Central Indiana $122.9 and adjacent Midwestern markets $102.0 $102.4 $114.4 $112.1 . Added to Arizona team to further enhance origination efforts 2015 2016 2017 2017 1Q19 Commercial & industrial Owner-occupied CRE . Strong credit performance to date 19
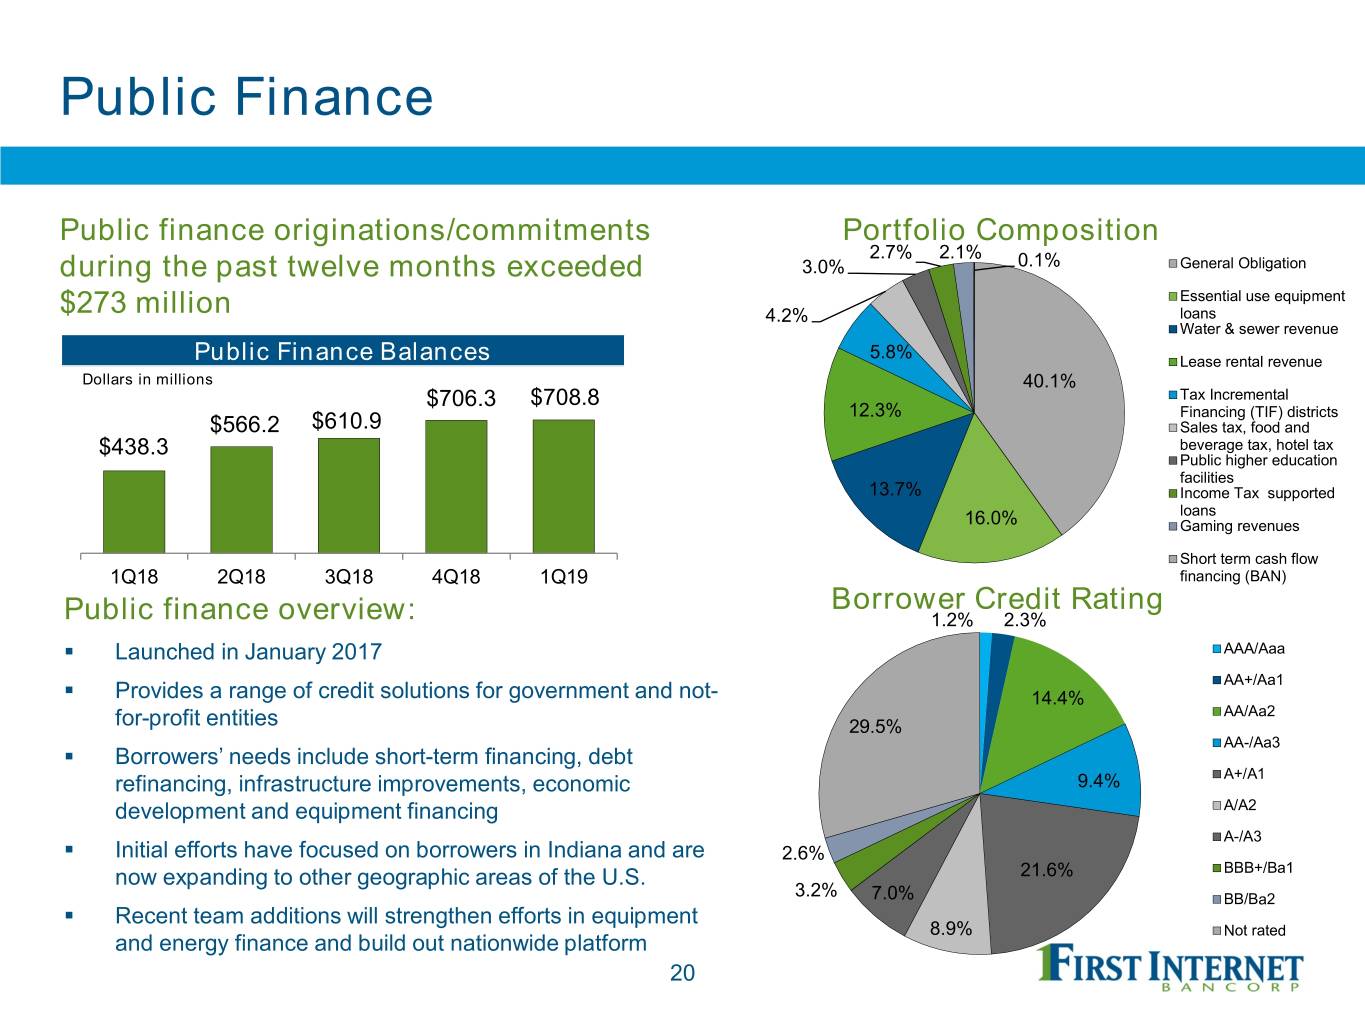
Public Finance Public finance originations/commitments Portfolio Composition 2.7% 2.1% during the past twelve months exceeded 3.0% 0.1% General Obligation Essential use equipment $273 million 4.2% loans Water & sewer revenue Public Finance Balances 5.8% Lease rental revenue Dollars in millions 40.1% $706.3 $708.8 Tax Incremental 12.3% Financing (TIF) districts $566.2 $610.9 Sales tax, food and beverage tax, hotel tax $438.3 Public higher education facilities 13.7% Income Tax supported loans 16.0% Gaming revenues Short term cash flow 1Q18 2Q18 3Q18 4Q18 1Q19 financing (BAN) Borrower Credit Rating Public finance overview: 1.2% 2.3% . Launched in January 2017 AAA/Aaa AA+/Aa1 . Provides a range of credit solutions for government and not- 14.4% AA/Aa2 for-profit entities 29.5% AA-/Aa3 . Borrowers’ needs include short-term financing, debt refinancing, infrastructure improvements, economic 9.4% A+/A1 development and equipment financing A/A2 A-/A3 . Initial efforts have focused on borrowers in Indiana and are 2.6% now expanding to other geographic areas of the U.S. 21.6% BBB+/Ba1 3.2% 7.0% BB/Ba2 . Recent team additions will strengthen efforts in equipment 8.9% Not rated and energy finance and build out nationwide platform 20

Healthcare Finance Healthcare finance originations/commitments over Portfolio Composition 0.9% 0.2% the past twelve months exceeded $126 million 4.6% Practice Refinance Healthcare Finance Balances or Acquisition 14.6% Dollars in millions Owner Occupied Dollars in millions $158.8$65.6 CRE $48.9$117.0 Projects $89.5 79.7% $31.6 $65.6 Equipment $48.9 $12.4 Start Up 1Q18 2Q18 3Q18 4Q18 1Q19 3Q17 4Q17 1Q18 2Q18 California Healthcare finance overview: . Launched in second quarter 2017 Texas . Strategic partnership with San Francisco–based 35.8% 39.4% Lendeavor Arizona . Currently focused on dental and veterinary practices Utah . Borrowers’ needs include practice finance or acquisition, acquiring or refinancing owner-occupied commercial real 4.0% Michigan estate and equipment purchases 3.8% 11.7% 5.3% . Initial efforts have primarily focused on west coast with All Others plans to expand nationwide 21

Residential Mortgage . Award-winning national online origination platform Well Diversified Mortgage Originations* . Direct-to-consumer originations managed by sales and underwriting personnel located in Indiana- based corporate HQ 18.9% 18.0% . Geographic diversity 35.0% provides opportunity to benefit from strengths in certain regions when there is weakness in others 17.3% . Highly efficient application 10.8% and underwriting process . Full range of residential mortgage and home equity products . Central-Indiana based construction loan program *Last 12 months mortgage originations 22
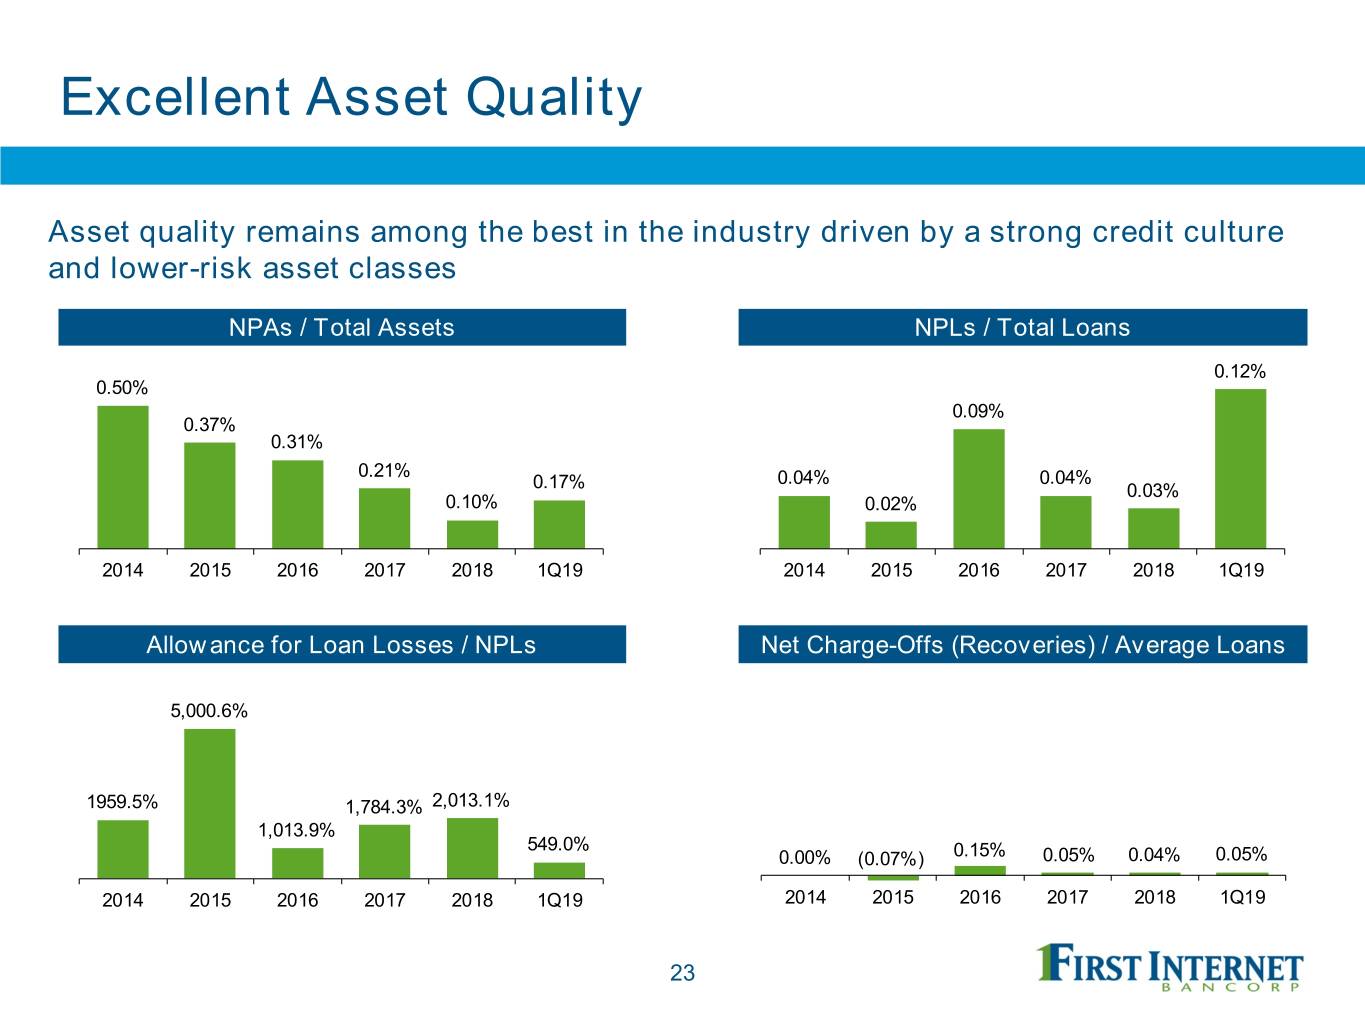
Excellent Asset Quality Asset quality remains among the best in the industry driven by a strong credit culture and lower-risk asset classes NPAs / Total Assets NPLs / Total Loans 0.12% 0.50% 0.09% 0.37% 0.31% 0.21% 0.04% 0.04% 0.17% 0.03% 0.10% 0.02% 2014 2015 2016 2017 2018 1Q19 2014 2015 2016 2017 2018 1Q19 Allowance for Loan Losses / NPLs Net Charge-Offs (Recoveries) / Average Loans 5,000.6% 1959.5% 1,784.3% 2,013.1% 1,013.9% 549.0% 0.00% (0.07%) 0.15% 0.05% 0.04% 0.05% 2014 2015 2016 2017 2018 1Q19 2014 2015 2016 2017 2018 1Q19 23
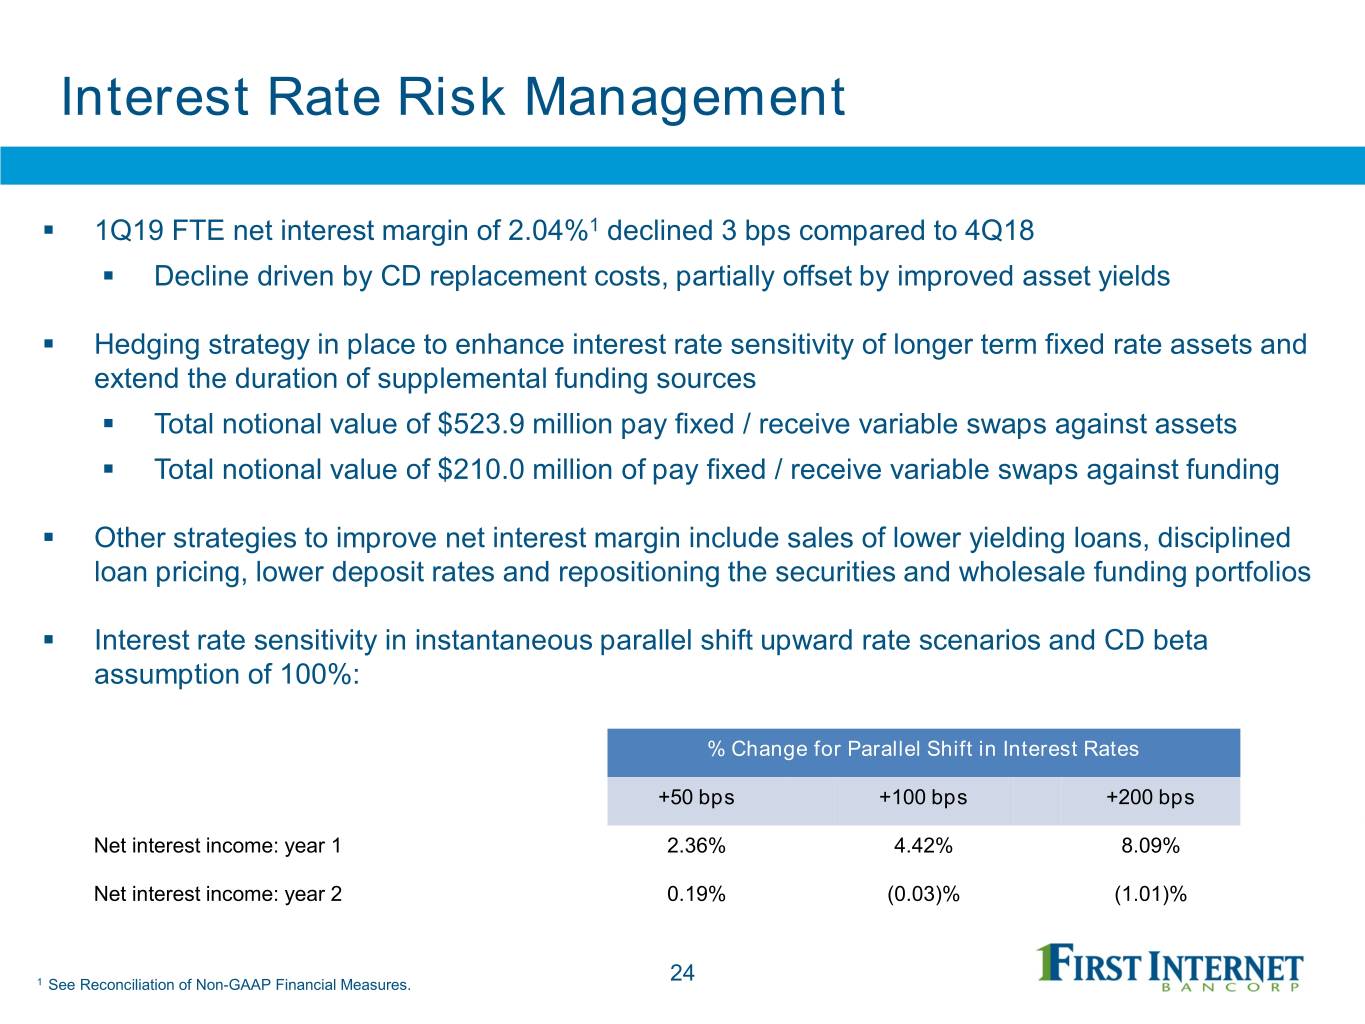
Interest Rate Risk Management . 1Q19 FTE net interest margin of 2.04%1 declined 3 bps compared to 4Q18 . Decline driven by CD replacement costs, partially offset by improved asset yields . Hedging strategy in place to enhance interest rate sensitivity of longer term fixed rate assets and extend the duration of supplemental funding sources . Total notional value of $523.9 million pay fixed / receive variable swaps against assets . Total notional value of $210.0 million of pay fixed / receive variable swaps against funding . Other strategies to improve net interest margin include sales of lower yielding loans, disciplined loan pricing, lower deposit rates and repositioning the securities and wholesale funding portfolios . Interest rate sensitivity in instantaneous parallel shift upward rate scenarios and CD beta assumption of 100%: % Change for Parallel Shift in Interest Rates +50 bps +100 bps +200 bps Net interest income: year 1 2.36% 4.42% 8.09% Net interest income: year 2 0.19% (0.03)% (1.01)% 1 See Reconciliation of Non-GAAP Financial Measures. 24

Drivers of Value Creation Management has aligned interests and is committed to building shareholder value . Further extend the scope and market penetration in specialty lending lines . Diversify the revenue stream with additional sources of noninterest income . Expand deposit channels and drive mix toward an increase in low-cost deposits . Deepen niche business relationships to attract more deposits . Build upon entrepreneurial culture to attract and retain top talent 25
Appendix 26

First Quarter 2019 Highlights . Quarterly net income of $5.7 million and diluted EPS of $0.56 . Quarterly net interest income of $16.2 million, up 5.4% from 1Q18 . Quarterly net interest income – FTE1 of $17.8 million, up 8.3% from 1Q18 . Total quarterly loan growth of $124 million, or 5% . Total year-over-year loan growth of $631 million, or 29% . Total quarterly asset growth of $128 million, or 4% . Total year-over-year asset growth of $807 million, or 28% . NPLs to total loans of 0.12% . Net charge-offs to average loans of 0.05% 1 See Reconciliation of Non-GAAP Financial Measures 27
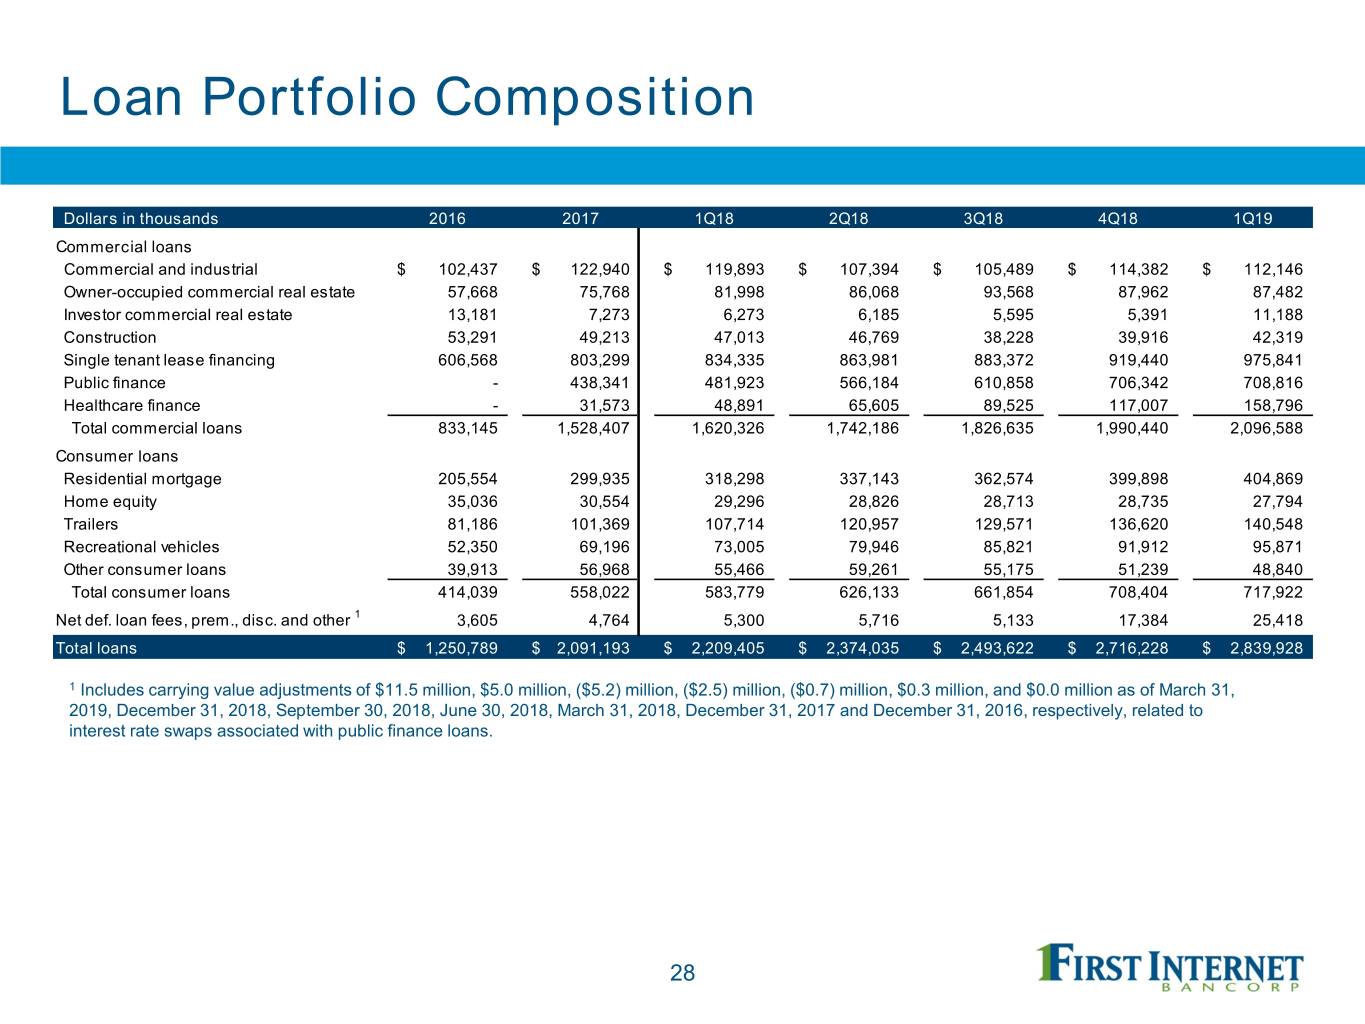
Loan Portfolio Composition Dollars in thousands 2016 2017 1Q18 2Q18 3Q18 4Q18 1Q19 Commercial loans Commercial and industrial $ 102,437 $ 122,940 $ 119,893 $ 107,394 $ 105,489 $ 114,382 $ 112,146 Owner-occupied commercial real estate 57,668 75,768 81,998 86,068 93,568 87,962 87,482 Investor commercial real estate 13,181 7,273 6,273 6,185 5,595 5,391 11,188 Construction 53,291 49,213 47,013 46,769 38,228 39,916 42,319 Single tenant lease financing 606,568 803,299 834,335 863,981 883,372 919,440 975,841 Public finance - 438,341 481,923 566,184 610,858 706,342 708,816 Healthcare finance - 31,573 48,891 65,605 89,525 117,007 158,796 Total commercial loans 833,145 1,528,407 1,620,326 1,742,186 1,826,635 1,990,440 2,096,588 Consumer loans Residential mortgage 205,554 299,935 318,298 337,143 362,574 399,898 404,869 Home equity 35,036 30,554 29,296 28,826 28,713 28,735 27,794 Trailers 81,186 101,369 107,714 120,957 129,571 136,620 140,548 Recreational vehicles 52,350 69,196 73,005 79,946 85,821 91,912 95,871 Other consumer loans 39,913 56,968 55,466 59,261 55,175 51,239 48,840 Total consumer loans 414,039 558,022 583,779 626,133 661,854 708,404 717,922 Net def. loan fees, prem., disc. and other 1 3,605 4,764 5,300 5,716 5,133 17,384 25,418 Total loans $ 1,250,789 $ 2,091,193 $ 2,209,405 $ 2,374,035 $ 2,493,622 $ 2,716,228 $ 2,839,928 1 Includes carrying value adjustments of $11.5 million, $5.0 million, ($5.2) million, ($2.5) million, ($0.7) million, $0.3 million, and $0.0 million as of March 31, 2019, December 31, 2018, September 30, 2018, June 30, 2018, March 31, 2018, December 31, 2017 and December 31, 2016, respectively, related to interest rate swaps associated with public finance loans. 28

Reconciliation of Non-GAAP Financial Measures 2014 2015 2016 2017 2018 TTM 1Q19 Net income - GAAP $4,324 $8,929 $12,074 $15,226 $21,900 $21,568 Adjustments: Write-down of other real estate owned - - - - 1,914 1,914 Net deferred tax asset revaluation - - - 1,846 - - Adjusted net income $4,324 $8,929 $12,074 $17,072 $23,814 $23,482 Diluted average common shares outstanding 4,507,995 4,554,219 5,239,082 7,149,302 9,508,653 9,924,699 Diluted earnings per share - GAAP $0.96 $1.96 $2.30 $2.13 $2.30 $2.19 Adjustments: Effect of write-down of other real estate owned - - - - 0.20 0.18 Effect of net deferred tax asset revaluation - - - 0.26 - 0.00 Adjusted diluted earnings per share $0.96 $1.96 $2.30 $2.39 $2.50 $2.37 Total average equity - GAAP $93,796 $100,428 $124,023 $178,212 $259,416 $276,350 Adjustments: Average goodwill (4,687) (4,687) (4,687) (4,687) (4,687) (4,687) Average tangible common equity $89,109 $95,741 $119,336 $173,525 $254,729 $271,663 Return on average assets 0.50% 0.81% 0.74% 0.66% 0.72% 0.66% Effect of write-down of other real estate owned 0.00% 0.00% 0.00% 0.00% 0.06% 0.06% Effect of net deferred tax asset revaluation 0.00% 0.00% 0.00% 0.08% 0.00% 0.00% Adjusted return on average assets 0.50% 0.81% 0.74% 0.74% 0.78% 0.72% Return on average shareholders' equity 4.61% 8.89% 9.74% 8.54% 8.44% 7.80% Effect of goodwill 0.24% 0.44% 0.38% 0.23% 0.16% 0.14% Return on average tangible common equity 4.85% 9.33% 10.12% 8.77% 8.60% 7.94% Return on average tangible common equity 4.85% 9.33% 10.12% 8.77% 8.60% 7.94% Effect of write-down of other real estate owned 0.00% 0.00% 0.00% 0.00% 0.75% 0.70% Effect of net deferred tax asset revaluation 0.00% 0.00% 0.00% 1.07% 0.00% 0.00% Adjusted return on average tangible common equity 4.85% 9.33% 10.12% 9.84% 9.35% 8.64% 29
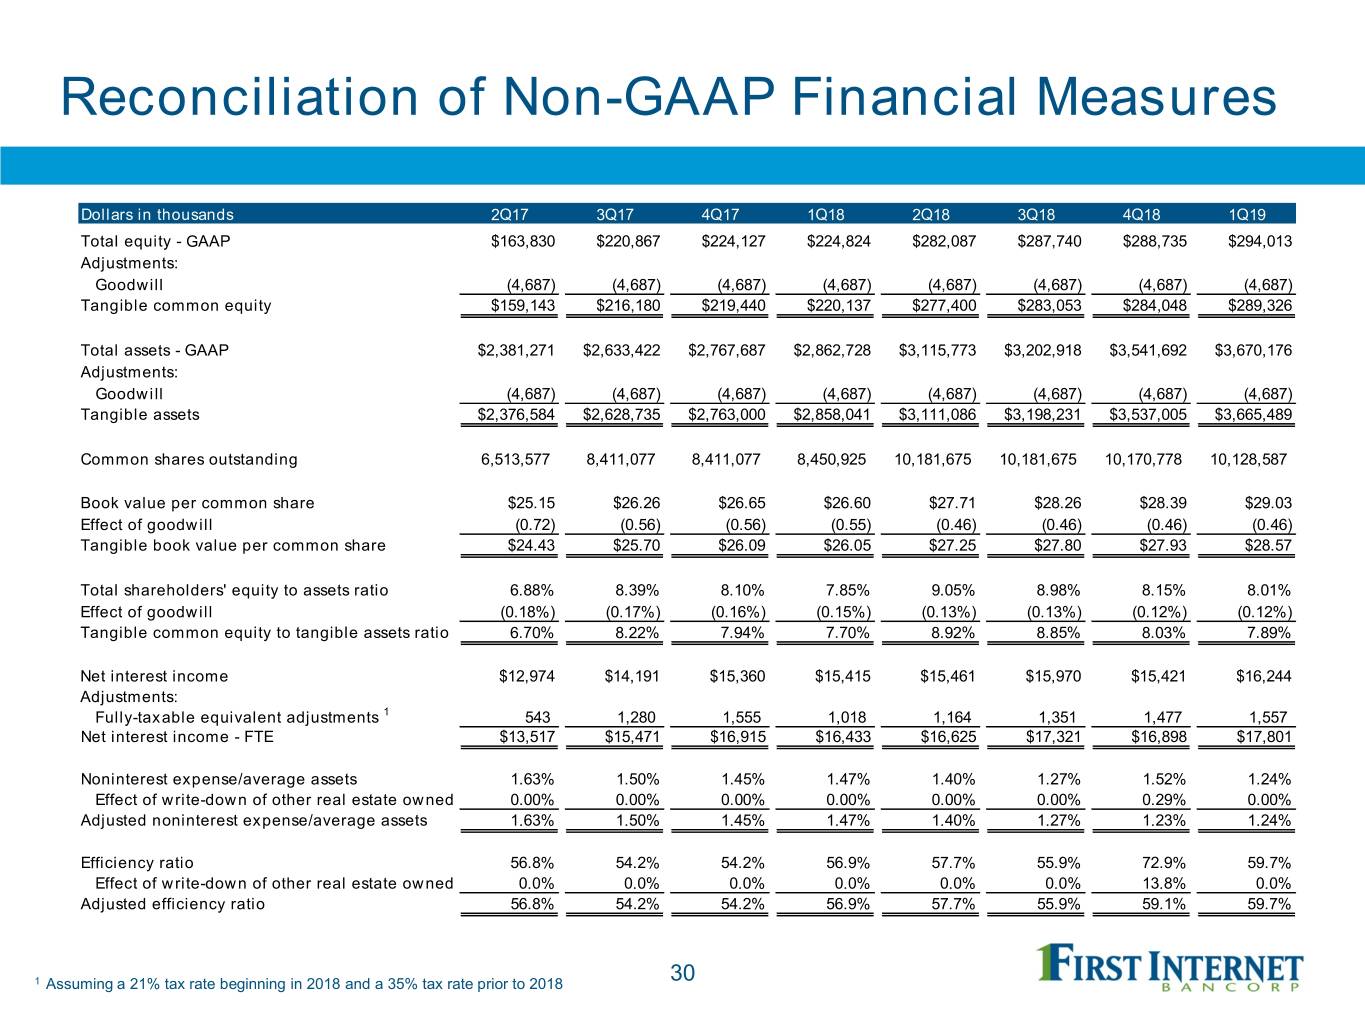
Reconciliation of Non-GAAP Financial Measures Dollars in thousands 2Q17 3Q17 4Q17 1Q18 2Q18 3Q18 4Q18 1Q19 Total equity - GAAP $163,830 $220,867 $224,127 $224,824 $282,087 $287,740 $288,735 $294,013 Adjustments: Goodwill (4,687) (4,687) (4,687) (4,687) (4,687) (4,687) (4,687) (4,687) Tangible common equity $159,143 $216,180 $219,440 $220,137 $277,400 $283,053 $284,048 $289,326 Tota l a sse ts - GAAP $2,381,271 $2,633,422 $2,767,687 $2,862,728 $3,115,773 $3,202,918 $3,541,692 $3,670,176 Adjustments: Goodwill (4,687) (4,687) (4,687) (4,687) (4,687) (4,687) (4,687) (4,687) Tangible assets $2,376,584 $2,628,735 $2,763,000 $2,858,041 $3,111,086 $3,198,231 $3,537,005 $3,665,489 Common shares outstanding 6,513,577 8,411,077 8,411,077 8,450,925 10,181,675 10,181,675 10,170,778 10,128,587 Book value per common share $25.15 $26.26 $26.65 $26.60 $27.71 $28.26 $28.39 $29.03 Effect of goodwill (0.72) (0.56) (0.56) (0.55) (0.46) (0.46) (0.46) (0.46) Tangible book value per common share $24.43 $25.70 $26.09 $26.05 $27.25 $27.80 $27.93 $28.57 Total shareholders' equity to assets ratio 6.88% 8.39% 8.10% 7.85% 9.05% 8.98% 8.15% 8.01% Effect of goodwill (0.18%) (0.17%) (0.16%) (0.15%) (0.13%) (0.13%) (0.12%) (0.12%) Tangible common equity to tangible assets ratio 6.70% 8.22% 7.94% 7.70% 8.92% 8.85% 8.03% 7.89% Net interest income $12,974 $14,191 $15,360 $15,415 $15,461 $15,970 $15,421 $16,244 Adjustments: Fully-taxable equivalent adjustments 1 543 1,280 1,555 1,018 1,164 1,351 1,477 1,557 Net interest income - FTE $13,517 $15,471 $16,915 $16,433 $16,625 $17,321 $16,898 $17,801 Noninterest expense/average assets 1.63% 1.50% 1.45% 1.47% 1.40% 1.27% 1.52% 1.24% Effect of write-down of other real estate owned 0.00% 0.00% 0.00% 0.00% 0.00% 0.00% 0.29% 0.00% Adjusted noninterest expense/average assets 1.63% 1.50% 1.45% 1.47% 1.40% 1.27% 1.23% 1.24% Efficiency ratio 56.8% 54.2% 54.2% 56.9% 57.7% 55.9% 72.9% 59.7% Effect of write-down of other real estate owned 0.0% 0.0% 0.0% 0.0% 0.0% 0.0% 13.8% 0.0% Adjusted efficiency ratio 56.8% 54.2% 54.2% 56.9% 57.7% 55.9% 59.1% 59.7% 1 Assuming a 21% tax rate beginning in 2018 and a 35% tax rate prior to 2018 30


