Exhibit 99.2

Franklin BSP Realty Trust Supplemental Information Third Quarter 2021
Important Information The information herein relates to the Company’s business and financial information as of September 30 , 2021 and does not reflect subsequent developments . Risk Factors Investing in and owning our common stock involves a high degree of risk . See the section entitled “Risk Factors” in our Annual Report on Form 10 - K filed March 11 , 2021 and in our Quarterly Report on Form 10 - Q filed November 11 , 2021 for a discussion of these risks . Forward - Looking Statements Certain statements included in this presentation are forward - looking statements . Those statements include statements regarding the intent, belief or current expectations of Franklin BSP Realty Trust, Inc . (“FBRT” or the “Company”) and may include the assumptions on which such statements are based, and generally are identified by the use of words such as "may," "will," "seeks," "anticipates," "believes," "estimates," "expects," "plans," "intends," "should" or similar expressions . Actual results may differ materially from those contemplated by such forward - looking statements . Factors that could cause actual outcomes to differ materially from our forward - looking statements include material changes in the value of the securities we acquired in our merger with Capstead Mortgage Corporation, continuing adverse effects from the COVID - 19 pandemic on our financial condition, operating results and cash flows, and the financial stability of our borrowers, and the other factors set forth in the risk factors section of our most recent Form 10 - K and Form 10 - Q . The extent to which these factors impact us and our borrowers will depend on future developments, which are highly uncertain and cannot be predicted with confidence . Further, forward - looking statements speak only as of the date they are made, and we undertake no obligation to update or revise forward - looking statements to reflect changed assumptions, the occurrence of unanticipated events or changes to future operating results over time, except as required by law . Additional Important Information The summary information provided in this presentation does not purport to be complete and no obligation to update or otherwise revise such information is being assumed . Nothing shall be relied upon as a promise or representation as to the future performance of the Company . This summary is not an offer to sell securities and is not soliciting an offer to buy securities in any jurisdiction where the offer or sale is not permitted . This summary is not advice, a recommendation or an offer to enter into any transaction with us or any of our affiliated funds . There is no guarantee that any of the goals, targets or objectives described in this summary will be achieved . The information contained herein is not intended to provide, and should not be relied upon for, accounting, legal, ERISA or tax advice or investment recommendations . Investors should also seek advice from their own independent tax, accounting, financial, ERISA, investment and legal advisors to properly assess the merits and risks associated with their investment in light of their own financial condition and other circumstances . The information contained herein is qualified in its entirety by reference to our most recent Annual Report on Form 10 - K and Quarterly Report on Form 10 - Q . You may obtain a copy of the most recent Annual Report or Quarterly Report by calling ( 844 ) 785 - 4393 and/or visiting www . bsprealtytrust . com . PAST PERFORMANCE IS NOT A GUARANTEE OR INDICATIVE OF FUTURE RESULTS . INVESTMENTS INVOLVE SIGNIFICANT RISKS, INCLUDING LOSS OF THE ENTIRE INVESTMENT . There is no guarantee that any of the estimates, targets or projections illustrated in this summary will be achieved . Any references herein to any of the Company’s past or present investments, portfolio characteristics, or performance, have been provided for illustrative purposes only . It should not be assumed that these investments were or will be profitable or that any future investments will be profitable or will equal the performance of these investments . There can be no guarantee that the investment objective of the Company will be achieved . Any investment entails a risk of loss . An investor could lose all or substantially all of his or her investment . Please refer to our most recent Annual Report on Form 10 - K and Quarterly Report on Form 10 - Q for a more complete list of risk factors . The following slides contain summaries of certain financial information about the Company . The information contained in this presentation is summary information that is intended to be considered in the context of our filings with the Securities and Exchange Commission and other public announcements that we may make, by press release or otherwise, from time to time . 2

Highlights 3
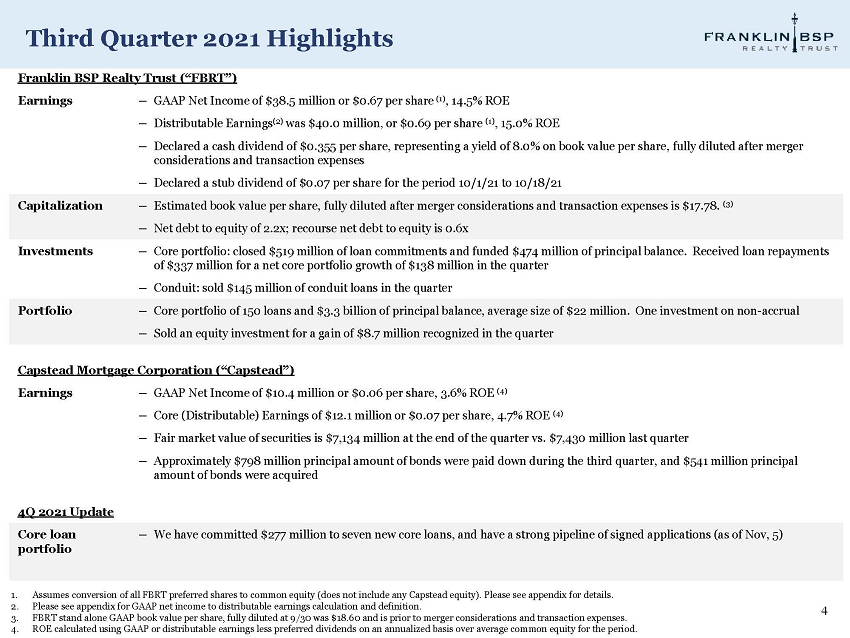
Third Quarter 2021 Highlights 4 1. Assumes conversion of all FBRT preferred shares to common equity (does not include any Capstead equity). Please see appendix for details. 2. Please see appendix for GAAP net income to distributable earnings calculation and definition. 3. FBRT stand alone GAAP book value per share, fully diluted at 9/30 was $18.60 and is prior to merger considerations and transaction expenses. 4. ROE calculated using GAAP or distributable earnings less preferred dividends on an annualized basis over average common equity for the period. F ranklin BSP Realty Trust (“FBRT”) Earnings — GAAP Net Income of $38.5 million or $0.67 per share (1) , 14.5% ROE — Distributable Earnings (2) was $40.0 million, or $0.69 per share (1) , 15.0% ROE — Declared a cash dividend of $0.355 per share, representing a yield of 8.0% on book value per share, fully diluted after merger considerations and transaction expenses — Declared a stub dividend of $0.07 per share for the period 10/1/21 to 10/18/21 Capitalization — Estimated book value per share, fully diluted after merger considerations and transaction expenses is $17.78. (3) — Net debt to equity of 2.2x; recourse net debt to equity is 0.6x Investments — Core portfolio: closed $519 million of loan commitments and funded $474 million of principal balance. Received loan repayments of $337 million for a net core portfolio growth of $138 million in the quarter — Conduit: sold $145 million of conduit loans in the quarter Portfolio — Core portfolio of 150 loans and $3.3 billion of principal balance, average size of $22 million. One investment on non - accrual — Sold an equity investment for a gain of $8.7 million recognized in the quarter Capstead Mortgage Corporation (“Capstead”) Earnings — GAAP Net Income of $10.4 million or $0.06 per share, 3.6% ROE (4) — Core (Distributable) Earnings of $12.1 million or $0.07 per share, 4.7% ROE (4) — Fair market value of securities is $7,134 million at the end of the quarter vs. $7,430 million last quarter — Approximately $798 million principal amount of bonds were paid down during the third quarter, and $541 million principal amount of bonds were acquired Combined 4Q2021 Update (As of Nov, 5) — Core loan portfolio: We have committed $277 million to seven new core loans, and have a strong pipeline of signed applications — Capstead securities: The portfolio was reduced by approximately $1.6 billion through a combination of prepayments and sales.

FBRT Merger with Capstead 5
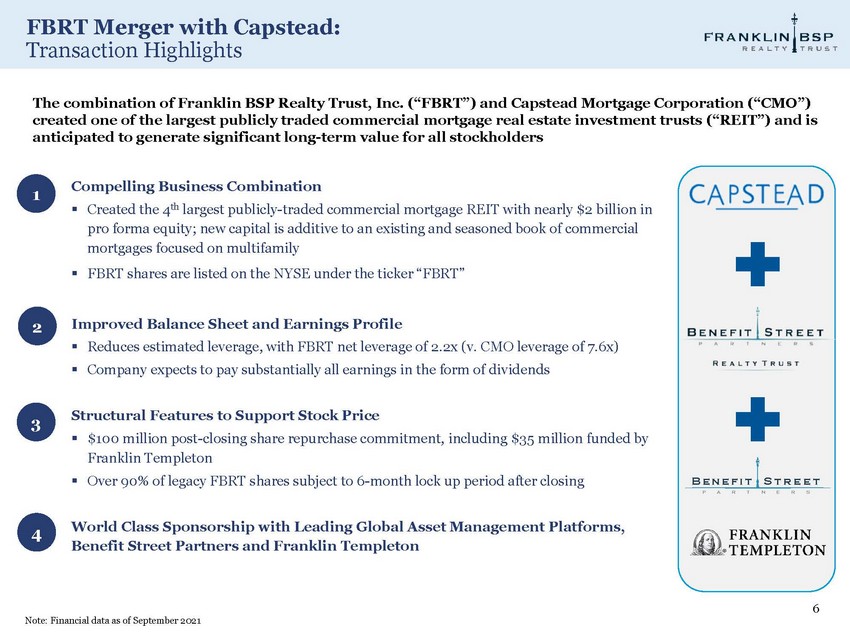
FBRT Merger with Capstead: Transaction Highlights 6 Compelling Business Combination ▪ Created the 4 th largest publicly - traded commercial mortgage REIT with nearly $2 billion in pro forma equity; new capital is additive to an existing and seasoned book of commercial mortgages focused on multifamily ▪ FBRT shares are listed on the NYSE under the ticker “FBRT” Improved Balance Sheet and Earnings Profile ▪ Reduces estimated leverage, with FBRT net leverage of 2.2x (v. CMO leverage of 7.6x) ▪ Company expects to pay substantially all earnings in the form of dividends Structural Features to Support Stock Price ▪ $100 million post - closing share repurchase commitment, including $35 million funded by Franklin Templeton ▪ Over 90% of legacy FBRT shares subject to 6 - month lock up period after closing World Class Sponsorship with Leading Global Asset Management Platforms, Benefit Street Partners and Franklin Templeton 1 2 3 4 B e n e f i t S t r e e t P A R T N E R S Note: Financial data as of September 2021 The combination of Franklin BSP Realty Trust, Inc. (“FBRT”) and Capstead Mortgage Corporation (“CMO”) created one of the largest publicly traded commercial mortgage real estate investment trusts (“REIT”) and is anticipated to generate significant long - term value for all stockholders
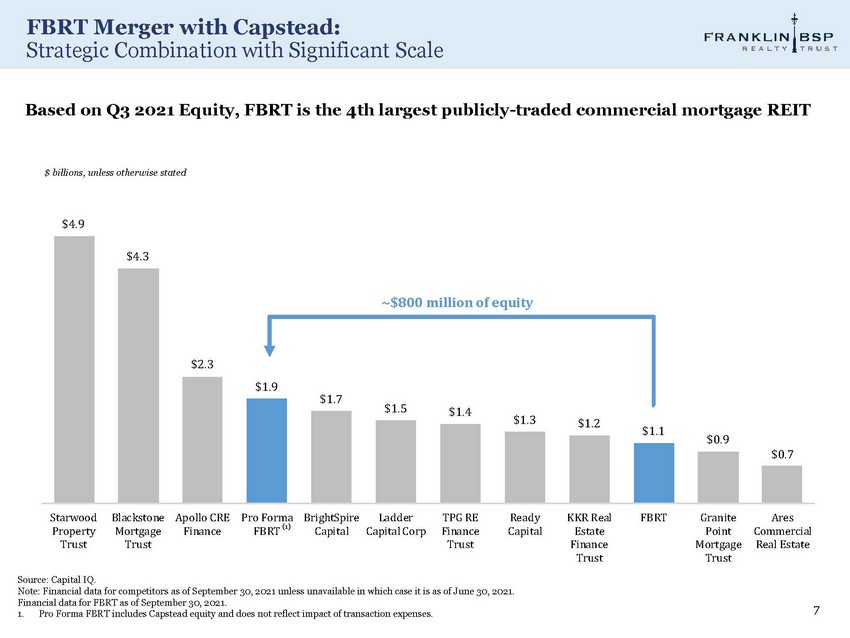
$4.9 $ 4 . 3 $2.3 $ 1 . 9 $ 1 . 7 $ 1 . 5 $ 1 . 4 $ 1 . 3 $ 1 . 2 $ 1 . 1 $ 0 . 9 $ 0 . 7 Starwood Blackstone Apollo CRE Pro Forma BrightSpire Ladder TPG RE Ready KKR Real FBRT Granite Ares Property Mortgage Finance FBRT (1) Capital Capital Corp Finance Capital Estate Point Commercial Trust Trust Trust Finance Mortgage Real Estate Trust Trust FBRT Merger with Capstead: Strategic Combination with Significant Scale 7 Based on Q3 2021 Equity, FBRT is the 4th largest publicly - traded commercial mortgage REIT ~$800 million of equity $ billions, unless otherwise stated Source: Capital IQ. Note: Financial data for competitors as of September 30, 2021 unless unavailable in which case it is as of June 30, 2021. Financial data for FBRT as of September 30, 2021. 1. Pro Forma FBRT includes Capstead equity and does not reflect impact of transaction expenses.
FBRT Merger with Capstead: FBRT Key Differentiators 8 Strong Team/Sponsorship Diversified Portfolio of Senior, Floating Rate Loans Differentiated Strategy is Intended to Produce Best Risk/Reward Attractive NIM Spread & Leverage Conservative and Flexible Balance Sheet Credit Focused Culture

3Q2021 Financial Update Capstead 9
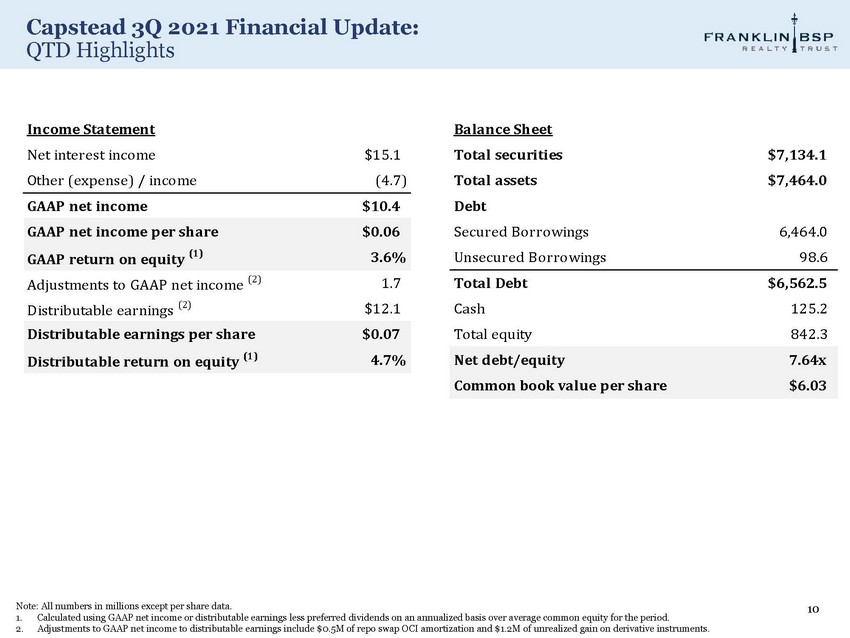
Capstead 3Q 2021 Financial Update: QTD Highlights 10 Income Statement Net interest income $ 15 . 1 Balance Sheet Total securities $ 7 , 134 . 1 Other (expense) / income ( 4 . 7 ) Total assets $ 7 , 464 . 0 GAAP net income $ 10 . 4 Debt GAAP net income per share $ 0 . 0 6 Secured Borrowings 6 , 464 . 0 GAAP return on equity (1) 3 . 6 % Unsecured Borrowings 98 . 6 Adjustments to GAAP net income (2) 1 . 7 Total Debt $ 6 , 562 . 5 Distributable earnings (2) $ 12 . 1 Cash 125 . 2 Distributable earnings per share $ 0 . 0 7 Total equity 842 . 3 Distributable return on equity (1) 4 . 7 % Net debt/equity 7 . 64 x Common book value per share $ 6 . 0 3 Note: All numbers in millions except per share data. 1. Calculated using GAAP net income or distributable earnings less preferred dividends on an annualized basis over average common equity for the period. 2. Adjustments to GAAP net income to distributable earnings include $0.5M of repo swap OCI amortization and $1.2M of unrealized gain on derivative instruments.
3Q2021 Financial Update Franklin BSP Realty Trust (excludes Capstead) 11
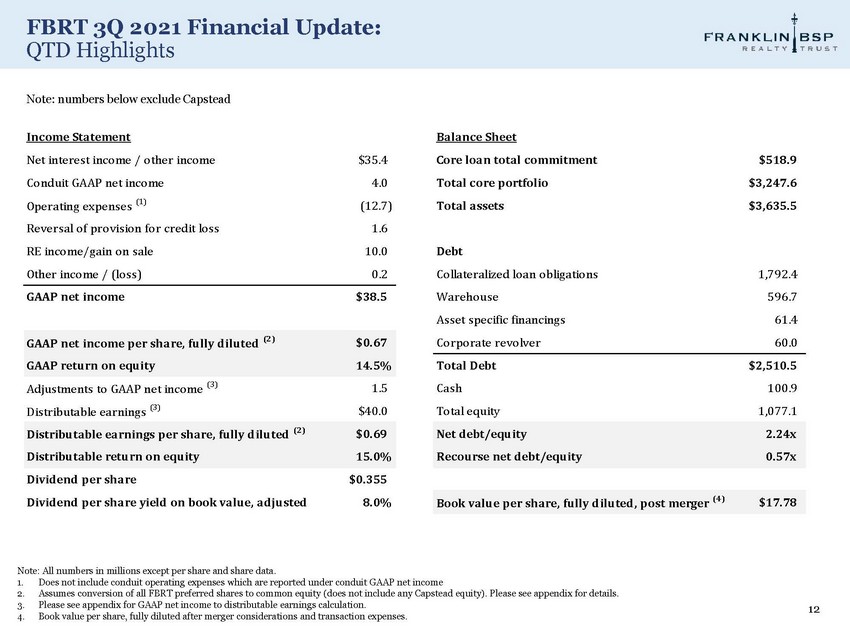
FBRT 3Q 2021 Financial Update: QTD Highlights 12 Note: All numbers in millions except per share and share data. 1. Does not include conduit operating expenses which are reported under conduit GAAP net income 2. Assumes conversion of all FBRT preferred shares to common equity (does not include any Capstead equity). Please see appendix for details. 3. Please see appendix for GAAP net income to distributable earnings calculation. 4. Book value per share, fully diluted after merger considerations and transaction expenses. Note: numbers below exclude Capstead Income Statement Balance Sheet Net interest income / other income $35.4 Core loan total commitment $ 518 . 9 Conduit GAAP net income 4.0 Total core portfolio $ 3 , 247 . 6 Operating expenses (1) (12.7) Total assets $ 3 , 635 . 5 Reversal of provision for credit loss 1.6 RE income/gain on sale 10.0 Debt Other income / (loss) 0.2 Collateralized loan obligations 1 , 792 . 4 GAAP net income $38.5 Warehouse 596 . 7 Asset specific financings 61 . 4 GAAP net income per share, fully diluted (2) $0.67 Corporate revolver 60 . 0 GAAP return on equity 14.5% Total Debt $ 2 , 510 . 5 Adjustments to GAAP net income (3) 1.5 Cash 100 . 9 Distributable earnings (3) $40.0 Total equity 1 , 077 . 1 Distributable earnings per share, fully diluted (2) $0.69 Net debt/equity 2 . 24 x Distributable return on equity 15.0% Recourse net debt/equity 0 . 57 x Dividend per share $0.355 Dividend per share yield on book value, adjusted 8.0% Book value per share, fully diluted, post merger (4) $ 17 . 7 8
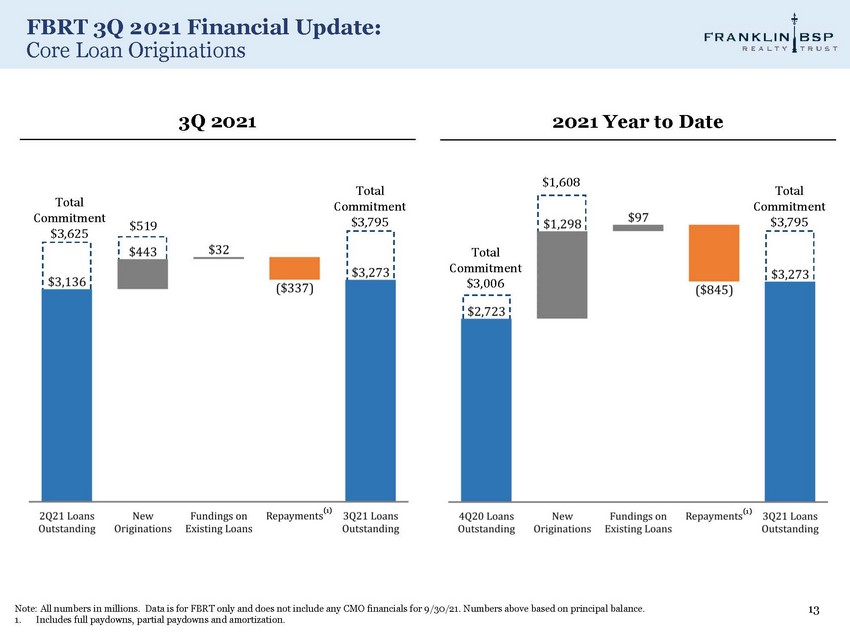
FBRT 3Q 2021 Financial Update: Core Loan Originations 13 Note: All numbers in millions. Data is for FBRT only and does not include any CMO financials for 9/30/21. Numbers above based on principal balance. 1. Includes full paydowns, partial paydowns and amortization. 3Q 2021 2021 Year to Date Total Com m itment $3,795 $519 Total Com m itment $3,625 (1) (1) Total Com m itment $3,006 $1,608 Total Com m itment $3,795
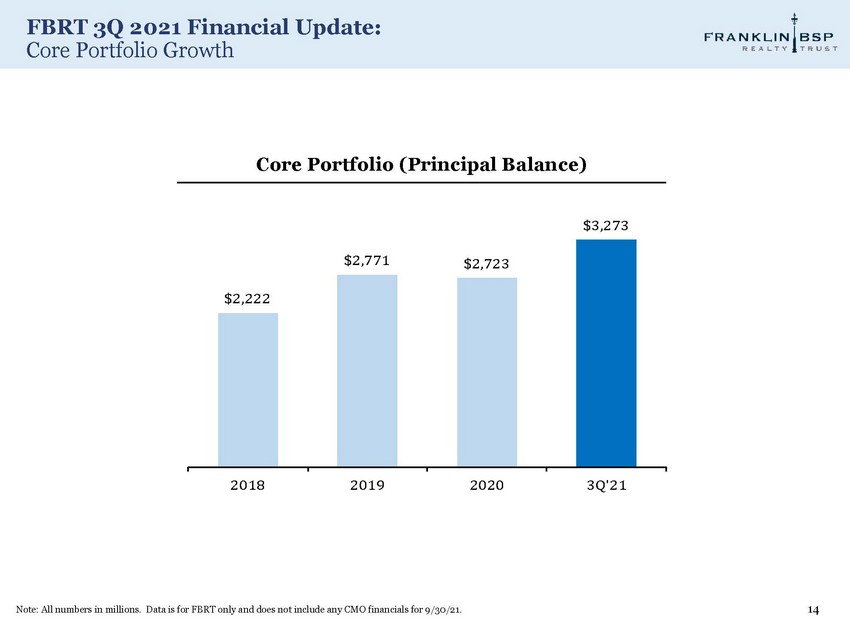
FBRT 3Q 2021 Financial Update: Core Portfolio Growth 14 Core Portfolio (Principal Balance) $3,27 3 $ 2 , 2 2 2 $ 2 , 7 7 1 $2,72 3 2018 2019 2020 3 Q ' 21 Note: All numbers in millions. Data is for FBRT only and does not include any CMO financials for 9/30/21.
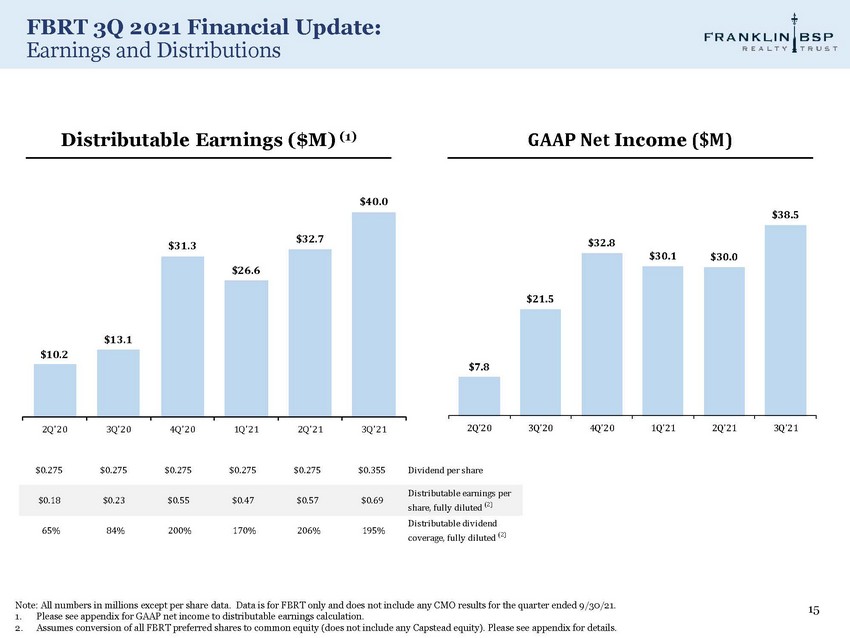
FBRT 3Q 2021 Financial Update: Earnings and Distributions 15 Note: All numbers in millions except per share data. Data is for FBRT only and does not include any CMO results for the quarter ended 9/30/21. 1. Please see appendix for GAAP net income to distributable earnings calculation. 2. Assumes conversion of all FBRT preferred shares to common equity (does not include any Capstead equity). Please see appendix for details. GAAP Net Income ($M) Distributable Earnings ($M) (1) $ 7 .8 $ 21 .5 $ 32 .8 $ 30 .1 $ 30 .0 $ 38 .5 2 Q' 2 0 3 Q' 2 0 4 Q' 2 0 1 Q' 2 1 2 Q ' 2 1 3 Q' 2 1 $ 13 .1 $10.2 $ 31 .3 $ 26 .6 $ 32 .7 $ 40 .0 2 Q' 2 0 3 Q' 2 0 4 Q ' 2 0 1 Q' 2 1 2 Q' 2 1 3 Q ' 2 1 $ 0 . 27 5 $ 0 . 27 5 $0.275 $0.275 $0.275 $0.355 Dividend per share $ 0 . 1 8 $ 0 . 2 3 $0.55 $0.47 $0.57 $0.69 Distributable earnings per share, fully diluted (2) 65% 84% 200% 170% 206% 195% Distributable dividend coverage, fully diluted (2)
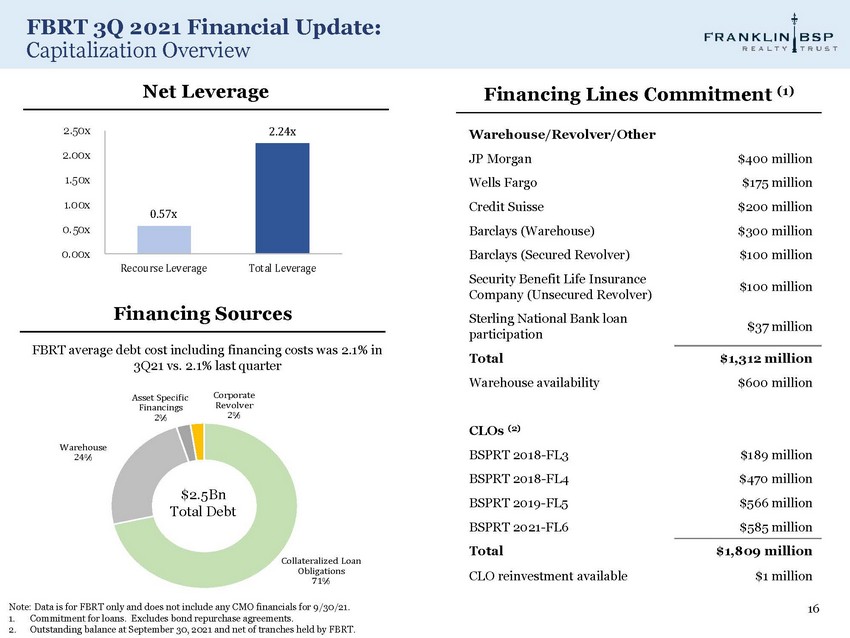
Collateralized Loan Obligations 71% W a r eh o u s e 24% Asset Specific Financings 2% C o r p o ra te Revolver 2% FBRT 3Q 2021 Financial Update: Capitalization Overview 16 Note: Data is for FBRT only and does not include any CMO financials for 9/30/21. 1. Commitment for loans. Excludes bond repurchase agreements. 2. Outstanding balance at September 30, 2021 and net of tranches held by FBRT. Warehouse/Revolver/Other JP Morgan $400 million Wells Fargo $175 million Credit Suisse $200 million Barclays (Warehouse) $300 million Barclays (Secured Revolver) $100 million Security Benefit Life Insurance Company (Unsecured Revolver) $100 million Sterling National Bank loan participation $37 million Total $1,312 million Warehouse availability $600 million CLOs (2) BSPRT 2018 - FL3 $189 million BSPRT 2018 - FL4 $470 million BSPRT 2019 - FL5 $566 million BSPRT 2021 - FL6 $585 million Total $1,809 million CLO reinvestment available $1 million Financing Sources FBRT average debt cost including financing costs was 2.1% in 3Q21 vs. 2.1% last quarter Financing Lines Commitment (1) Net Leverage $2.5Bn Total Debt 0 . 57 x 2 . 24 x 0 . 50 x 0 . 00 x 1. 0 0 x 2 . 0 0 x 1.50x 2 . 5 0 x Recourse Leverage Total Leverage
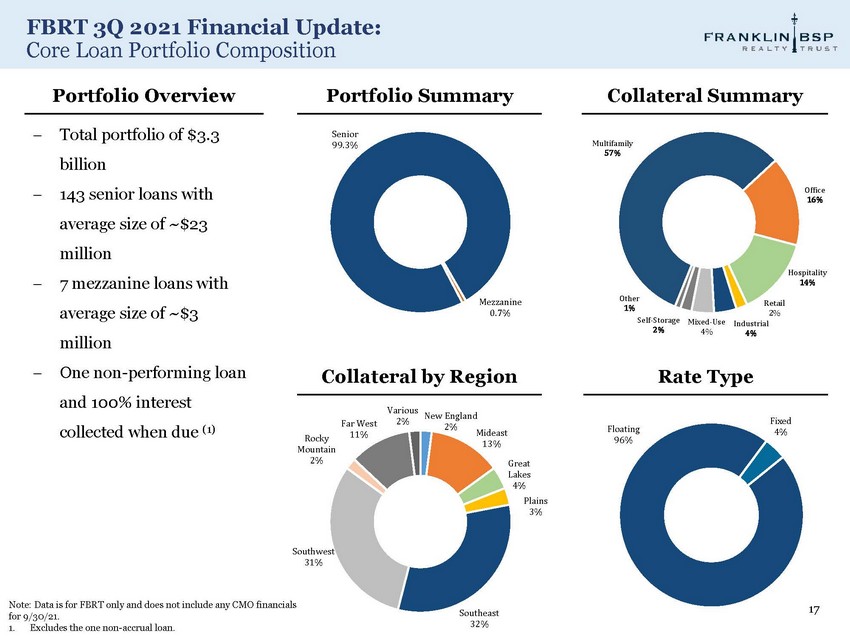
FBRT 3Q 2021 Financial Update: Core Loan Portfolio Composition 17 Note: Data is for FBRT only and does not include any CMO financials for 9/30/21. 1. Excludes the one non - accrual loan. Me z zanine 0.7% Senior 99 .3% New England 2% Mideast 13% Great La kes 4 % P lains 3% S o utheast 32% S o uthwes t 31% Rocky Mountain 2% Far West 11% Variou s 2% Flo a ting 96% F i x ed 4% Portfolio Summary Collateral Summary Collateral by Region Rate Type Portfolio Overview Total portfolio of $3.3 billion 143 senior loans with average size of ~$23 million 7 mezzanine loans with average size of ~$3 million One non - performing loan and 100% interest collected when due (1) M u l ti fam i ly 57% Off ice 16% H o sp it al ity 14% Retail 2% Indus t r i al 4% 4% 2% O ther 1% Self - Storage Mixed - Use

Appendix 18
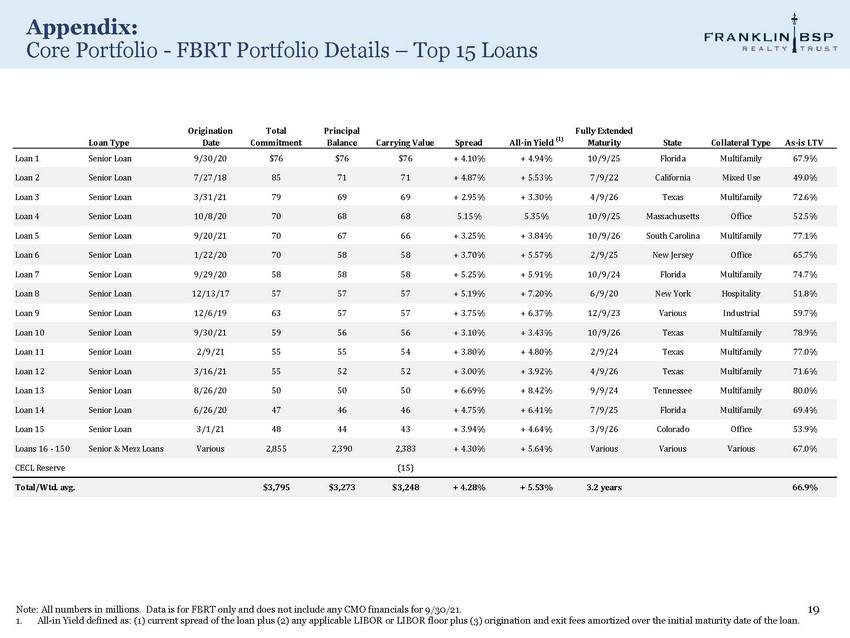
Appendix: Core Portfolio - FBRT Portfolio Details – Top 15 Loans 19 Loan Type Origination Date Total Commitment Principal Balance Carrying Value Spread All - in Yield (1) Fully Extended Maturity State Collateral Type As - is LTV Loan 1 Senior Loan 9/30/20 $76 $76 $76 + 4.10% + 4.94% 10 / 9 / 2 5 Florida Multifamily 67.9% Loan 2 Senior Loan 7/27/18 85 71 71 + 4.87% + 5.53% 7 / 9 / 2 2 California Mixed Use 49.0% Loan 3 Senior Loan 3/31/21 79 69 69 + 2.95% + 3.30% 4 / 9 / 2 6 Texas Multifamily 72.6% Loan 4 Senior Loan 10/8/20 70 68 68 5.15% 5.35% 10 / 9 / 2 5 Massachusetts Office 52.5% Loan 5 Senior Loan 9/20/21 70 67 66 + 3.25% + 3.84% 10 / 9 / 2 6 South Carolina Multifamily 77.1% Loan 6 Senior Loan 1/22/20 70 58 58 + 3.70% + 5.57% 2 / 9 / 2 5 New Jersey Office 65.7% Loan 7 Senior Loan 9/29/20 58 58 58 + 5.25% + 5.91% 10 / 9 / 2 4 Florida Multifamily 74.7% Loan 8 Senior Loan 12/13/17 57 57 57 + 5.19% + 7.20% 6 / 9 / 2 0 New York Hospitality 51.8% Loan 9 Senior Loan 12/6/19 63 57 57 + 3.75% + 6.37% 12 / 9 / 2 3 Various Industrial 59.7% Loan 10 Senior Loan 9/30/21 59 56 56 + 3.10% + 3.43% 10 / 9 / 2 6 Texas Multifamily 78.9% Loan 11 Senior Loan 2/9/21 55 55 54 + 3.80% + 4.80% 2 / 9 / 2 4 Texas Multifamily 77.0% Loan 12 Senior Loan 3/16/21 55 52 52 + 3.00% + 3.92% 4 / 9 / 2 6 Texas Multifamily 71.6% Loan 13 Senior Loan 8/26/20 50 50 50 + 6.69% + 8.42% 9 / 9 / 2 4 Tennessee Multifamily 80.0% Loan 14 Senior Loan 6/26/20 47 46 46 + 4.75% + 6.41% 7 / 9 / 2 5 Florida Multifamily 69.4% Loan 15 Senior Loan 3/1/21 48 44 43 + 3.94% + 4.64% 3 / 9 / 2 6 Colorado Office 53.9% Loans 16 - 150 Senior & Mezz Loans Various 2,855 2,390 2,383 + 4.30% + 5.64% V a r i o u s Various Various 67.0% CECL Reserve (15) Total/Wtd. avg. $3,795 $3,273 $3,248 + 4.28% + 5.53% 3.2 years 66.9% Note: All numbers in millions. Data is for FBRT only and does not include any CMO financials for 9/30/21. 1. All - in Yield defined as: (1) current spread of the loan plus (2) any applicable LIBOR or LIBOR floor plus (3) origination and exit fees amortized over the initial maturity date of the loan.
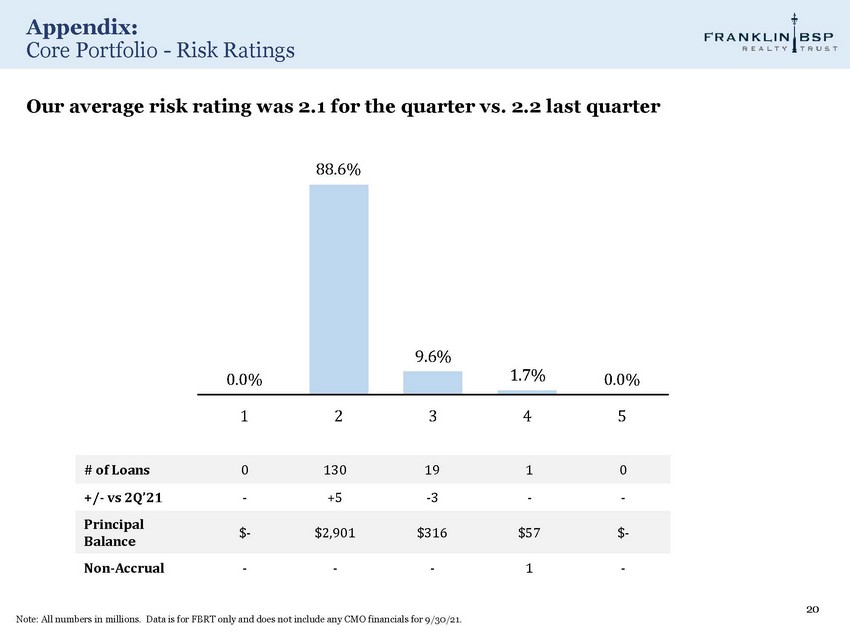
Appendix: Core Portfolio - Risk Ratings 20 0 . 0 % Our average risk rating was 2.1 for the quarter vs. 2.2 last quarter 88.6% 9 .6 % 1 . 7 % 0 . 0 % 1 2 3 4 5 # of Loans 0 130 19 1 0 +/ - vs 2Q’21 - +5 - 3 - - Principal Balance $ - $2,901 $316 $57 $ - Non - Accrual - - - 1 - Note: All numbers in millions. Data is for FBRT only and does not include any CMO financials for 9/30/21.
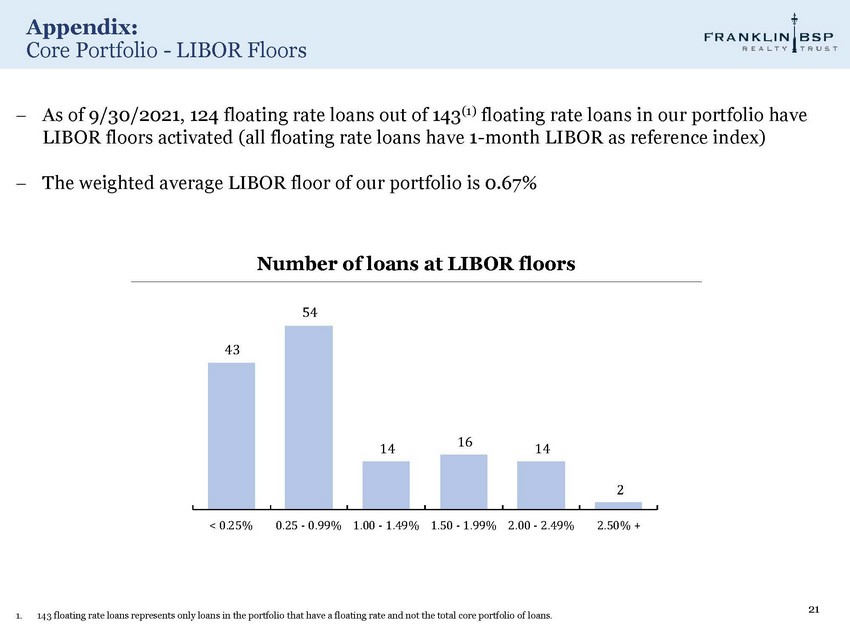
Appendix: Core Portfolio - LIBOR Floors 21 1. 143 floating rate loans represents only loans in the portfolio that have a floating rate and not the total core portfolio of loans. As of 9/30/2021, 124 floating rate loans out of 143 (1) floating rate loans in our portfolio have LIBOR floors activated (all floating rate loans have 1 - month LIBOR as reference index) The weighted average LIBOR floor of our portfolio is 0.67% Number of loans at LIBOR floors 54 43 14 16 14 2 < 0.25% 0.25 - 0.99% 1.00 - 1.49% 1.50 - 1.99% 2.00 - 2.49% 2.50% +
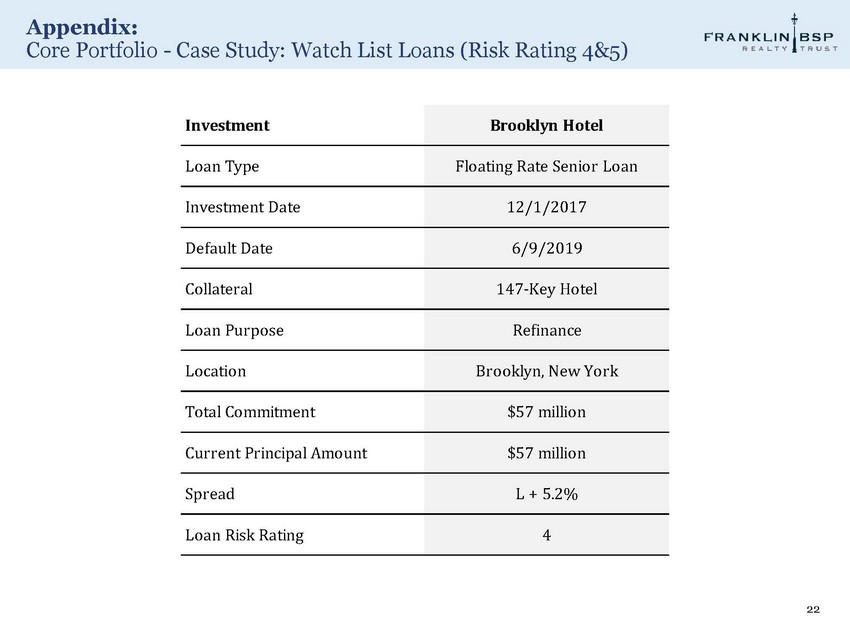
Appendix: Core Portfolio - Case Study: Watch List Loans (Risk Rating 4&5) 22 Investment Brooklyn Hotel Loan Type Floating Rate Senior Loan Investment Date 12/1/2017 Default Date 6/9/2019 Collateral 147 - Key Hotel Loan Purpose Refinance Location Brooklyn, New York Total Commitment $57 million Current Principal Amount $57 million Spread L + 5.2% Loan Risk Rating 4
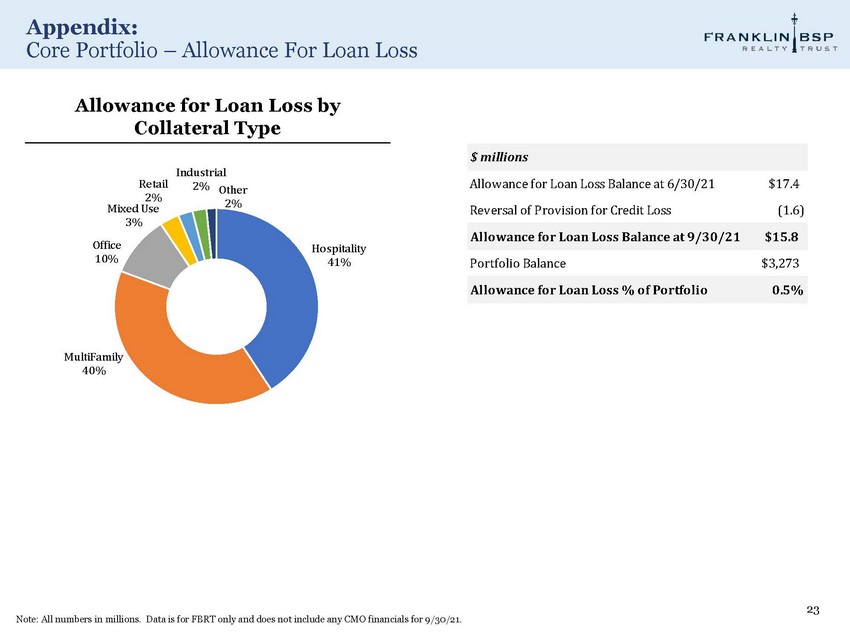
Appendix: Core Portfolio – Allowance For Loan Loss 23 Allowance for Loan Loss by Collateral Type H o s p it a l it y 41% M u l ti F a m i l y 40% R e t a i l 2% Mixed Use 3% O ff i ce 10% Industrial 2% Ot he r 2% Note: All numbers in millions. Data is for FBRT only and does not include any CMO financials for 9/30/21. $ millions Allowance for Loan Loss Balance at 6/30/21 Reversal of Provision for Credit Los Allowance for Loan Los Portfolio Balan Allow
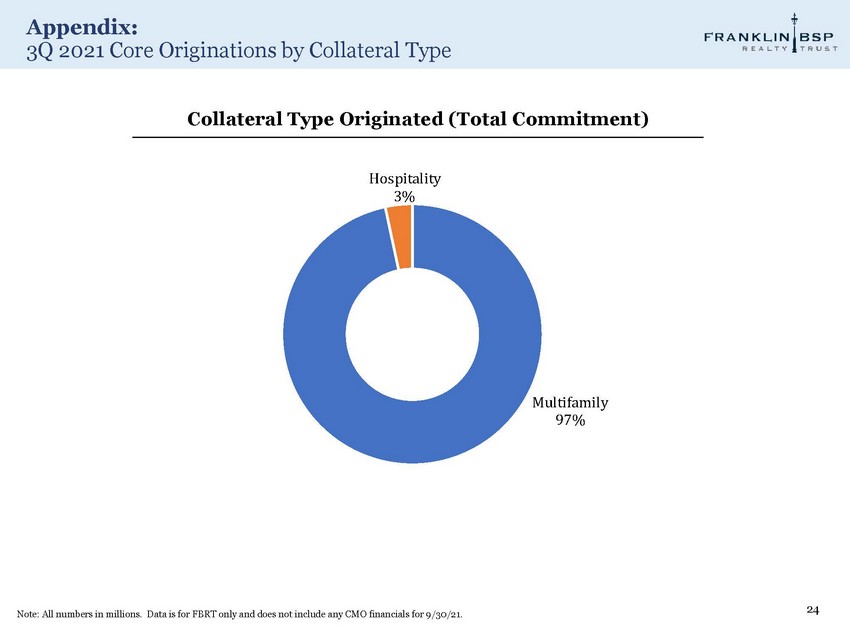
Appendix: 3Q 2021 Core Originations by Collateral Type 24 Note: All numbers in millions. Data is for FBRT only and does not include any CMO financials for 9/30/21. M u l t i f a m i l y 97% Collateral Type Originated (Total Commitment) Hospitality 3%
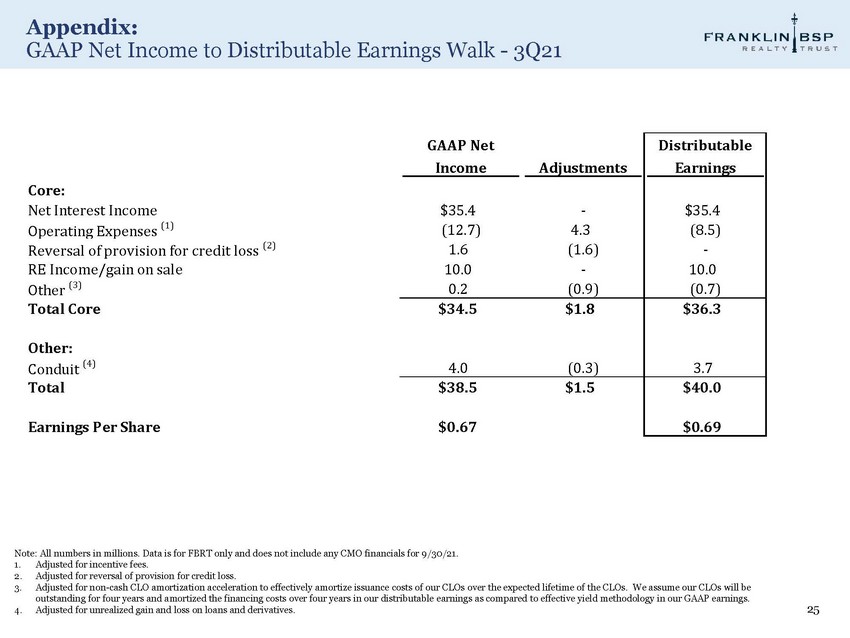
Appendix: GAAP Net Income to Distributable Earnings Walk - 3Q21 25 Note: All numbers in millions. Data is for FBRT only and does not include any CMO financials for 9/30/21. 1. Adjusted for incentive fees. 2. Adjusted for reversal of provision for credit loss. 3. Adjusted for non - cash CLO amortization acceleration to effectively amortize issuance costs of our CLOs over the expected lifetime of the CLOs. We assume our CLOs will be outstanding for four years and amortized the financing costs over four years in our distributable earnings as compared to effective yield methodology in our GAAP earnings. 4. Adjusted for unrealized gain and loss on loans and derivatives. GAAP Net Distributable Income Adjustments Earnings $35.4 - $35.4 (12.7) 4.3 (8.5) 1.6 (1.6) - 10.0 - 10.0 0.2 (0.9) (0.7) $34.5 $1.8 $36.3 4.0 (0.3) 3.7 $38.5 $1.5 $40.0 $0.67 $0.69 Core: Net Interest Income Operating Expenses (1) Reversal of provision for credit loss (2) RE Income/gain on sale Other (3) Total Core Other: Conduit (4) Total Earnings Per Share
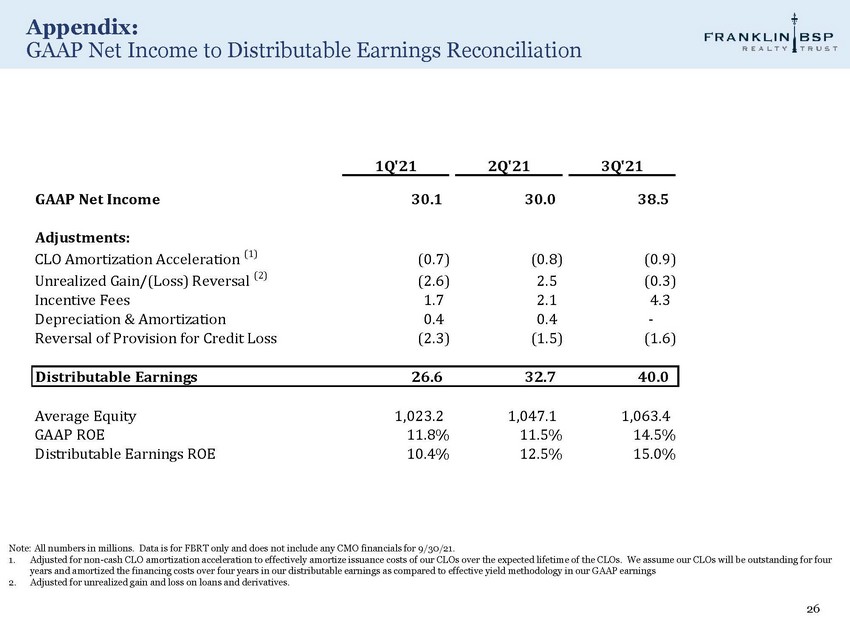
Appendix: GAAP Net Income to Distributable Earnings Reconciliation Note: All numbers in millions. Data is for FBRT only and does not include any CMO financials for 9/30/21. 1. Adjusted for non - cash CLO amortization acceleration to effectively amortize issuance costs of our CLOs over the expected lifetime of the CLOs. We assume our CLOs will be outstanding for four years and amortized the financing costs over four years in our distributable earnings as compared to effective yield methodology in our GAAP earnings 2. Adjusted for unrealized gain and loss on loans and derivatives. 26 1 Q ' 2 1 2 Q ' 2 1 3 Q ' 21 GAAP Net Income 3 0. 1 30.0 Adjustments: CLO Amortization Acceleration (1) ( 0 . 7 ) Unrealized Gain/(Loss) Reversal (2) Incentive Fees Depreciation & Amortization Reversal of Provision for Credit Loss Distributable Earnings Average Equity GAAP RO Dis
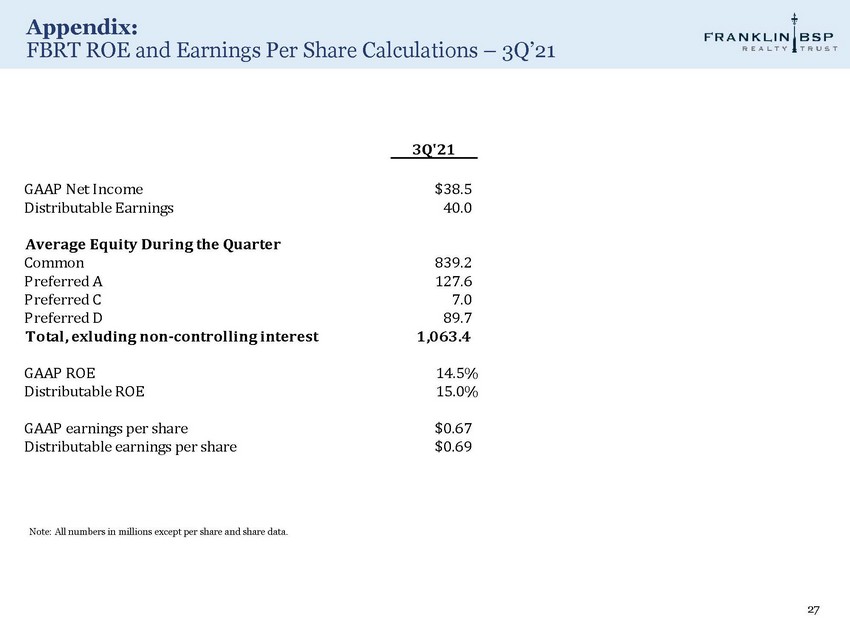
Appendix: FBRT ROE and Earnings Per Share Calculations – 3Q’21 27 Note: All numbers in millions except per share and share data. 3Q'21 GAAP Net Income $ 38 . 5 Distributable Earnings 40 . 0 Average Equity During the Quarter Common 839 . 2 Preferred A 127 . 6 Preferred C 7 . 0 Preferred D 89 . 7 Total, exluding non - controlling interest 1 , 063 . 4 GAAP ROE 14 . 5 % Distributable ROE 15 . 0 % GAAP earnings per share $ 0 . 6 7 Distributable earnings per share $ 0 . 6 9
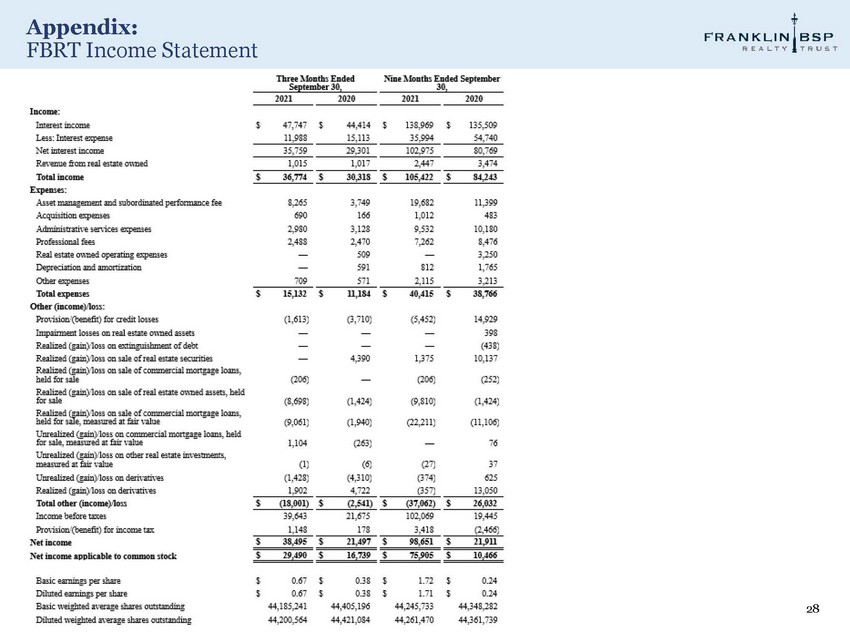
Appendix: FBRT Income Statement 28
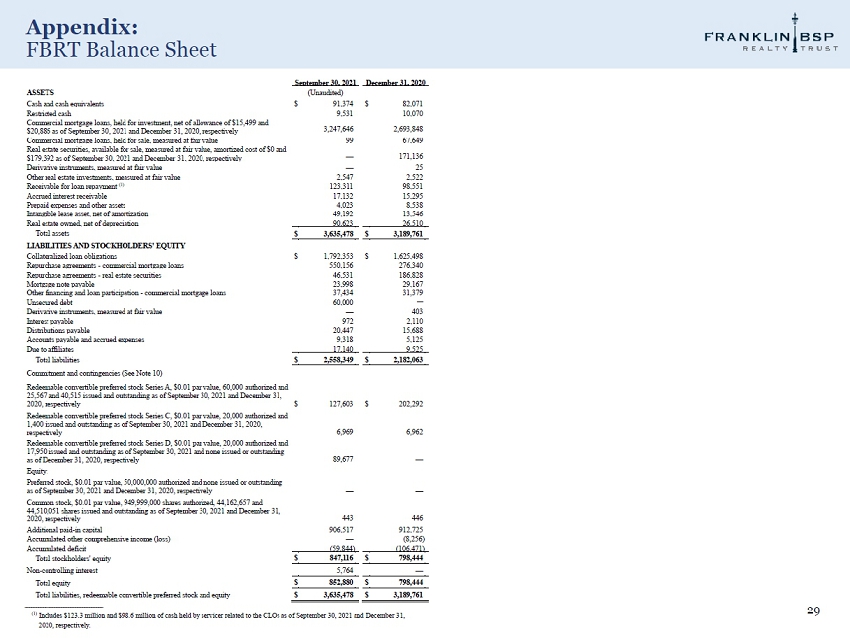
Appendix: FBRT Balance Sheet 29
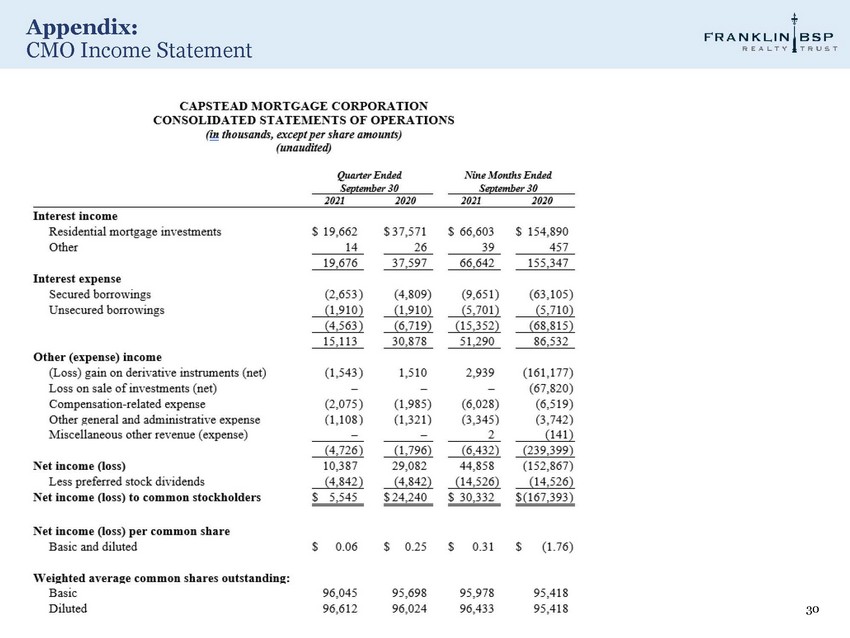
Appendix: CMO Income Statement 30
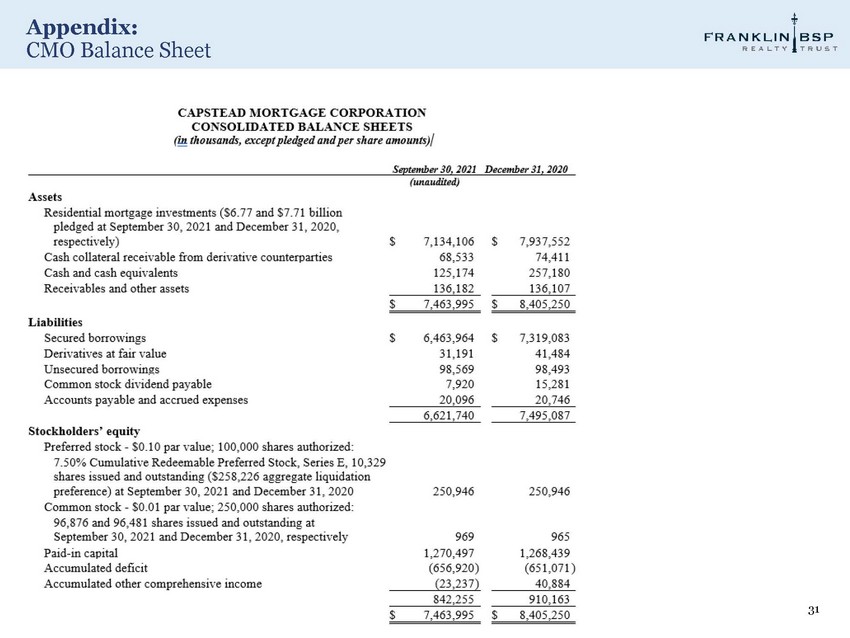
Appendix: CMO Balance Sheet 31