Exhibit 99.2

Franklin BSP Realty Trust Supplemental Information 2021, Fourth Quarter
Important Information 2 The information herein relates to the Company’s business and financial information as of December 31 , 2021 and does not reflect subsequent developments . Risk Factors Investing in and owning our common stock involves a high degree of risk . See the section entitled “Risk Factors” in our Annual Report on Form 10 - K filed February 25 , 2022 for a discussion of these risks . Forward - Looking Statements Certain statements included in this presentation are forward - looking statements . Those statements include statements regarding the intent, belief or current expectations of Franklin BSP Realty Trust, Inc . (“FBRT” or the “Company”) and may include the assumptions on which such statements are based, and generally are identified by the use of words such as "may," "will," "seeks," "anticipates," "believes," "estimates," "expects," "plans," "intends," "should" or similar expressions . Actual results may differ materially from those contemplated by such forward - looking statements . Factors that could cause actual outcomes to differ materially from our forward - looking statements include material changes in the value of the securities we acquired in our merger with Capstead Mortgage Corporation, continuing adverse effects from the COVID - 19 pandemic on our financial condition, operating results and cash flows, and the financial stability of our borrowers, and the other factors set forth in the risk factors section of our most recent Form 10 - K and Form 10 - Q . The extent to which these factors impact us and our borrowers will depend on future developments, which are highly uncertain and cannot be predicted with confidence . Further, forward - looking statements speak only as of the date they are made, and we undertake no obligation to update or revise forward - looking statements to reflect changed assumptions, the occurrence of unanticipated events or changes to future operating results over time, except as required by law . Additional Important Information The summary information provided in this presentation does not purport to be complete and no obligation to update or otherwise revise such information is being assumed . Nothing shall be relied upon as a promise or representation as to the future performance of the Company . This summary is not an offer to sell securities and is not soliciting an offer to buy securities in any jurisdiction where the offer or sale is not permitted . This summary is not advice, a recommendation or an offer to enter into any transaction with us or any of our affiliated funds . There is no guarantee that any of the goals, targets or objectives described in this summary will be achieved . The information contained herein is not intended to provide, and should not be relied upon for, accounting, legal, ERISA or tax advice or investment recommendations . Investors should also seek advice from their own independent tax, accounting, financial, ERISA, investment and legal advisors to properly assess the merits and risks associated with their investment in light of their own financial condition and other circumstances . The information contained herein is qualified in its entirety by reference to our most recent Annual Report on Form 10 - K and Quarterly Report on Form 10 - Q . You may obtain a copy of the most recent Annual Report or Quarterly Report by calling ( 844 ) 785 - 4393 and/or visiting www . fbrtreit . com . PAST PERFORMANCE IS NOT A GUARANTEE OR INDICATIVE OF FUTURE RESULTS . INVESTMENTS INVOLVE SIGNIFICANT RISKS, INCLUDING LOSS OF THE ENTIRE INVESTMENT . There is no guarantee that any of the estimates, targets or projections illustrated in this summary will be achieved . Any references herein to any of the Company’s past or present investments, portfolio characteristics, or performance, have been provided for illustrative purposes only . It should not be assumed that these investments were or will be profitable or that any future investments will be profitable or will equal the performance of these investments . There can be no guarantee that the investment objective of the Company will be achieved . Any investment entails a risk of loss . An investor could lose all or substantially all of his or her investment . Please refer to our most recent Annual Report on Form 10 - K and Quarterly Report on Form 10 - Q for a more complete list of risk factors . The following slides contain summaries of certain financial information about the Company . The information contained in this presentation is summary information that is intended to be considered in the context of our filings with the Securities and Exchange Commission and other public announcements that we may make, by press release or otherwise, from time to time .

FBRT 4Q 2021 Financial Update 3
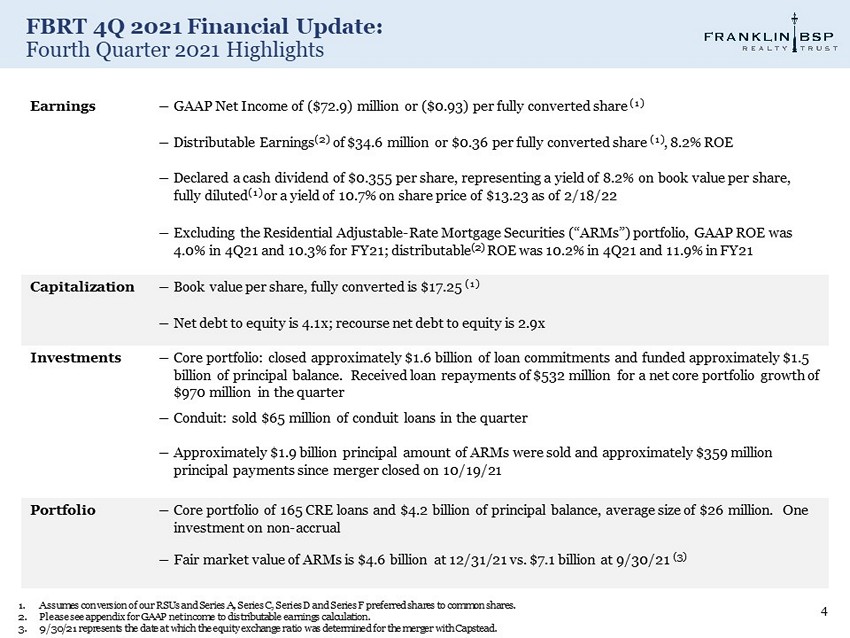
FBRT 4Q 2021 Financial Update: Fourth Quarter 2021 Highlights 4 Earnings ― GAAP Net Income of ($72.9) million or ($0.93) per fully converted share (1) ― Distributable Earnings (2) of $34.6 million or $0.36 per fully converted share (1) , 8.2% ROE ― Declared a cash dividend of $0.355 per share, representing a yield of 8.2% on book value per share, fully diluted (1) or a yield of 10.7% on share price of $13.23 as of 2/18/22 ― Excluding the Residential Adjustable - Rate Mortgage Securities (“ ARMs”) portfolio, GAAP ROE was 4.0% in 4Q21 and 10.3% for FY21; distributable (2) ROE was 10.2% in 4Q21 and 11.9% in FY21 Capitalization ― Book value per share, fully converted is $17.25 (1) ― Net debt to equity is 4.1x; recourse net debt to equity is 2.9x Investments ― Core portfolio: closed approximately $1.6 billion of loan commitments and funded approximately $1.5 billion of principal balance. Received loan repayments of $532 million for a net core portfolio growth of $970 million in the quarter ― Conduit: sold $65 million of conduit loans in the quarter ― Approximately $1.9 billion principal amount of ARMs were sold and approximately $359 million principal payments since merger closed on 10/19/21 Portfolio ― Core portfolio of 165 CRE loans and $4.2 billion of principal balance, average size of $26 million. One investment on non - accrual ― Fair market value of ARMs is $4.6 billion at 12/31/21 vs. $7.1 billion at 9/30/21 (3) 1. Assumes conversion of our RSUs and Series A, Series C, Series D and Series F preferred shares to common shares. 2. Please see appendix for GAAP net income to distributable earnings calculation. 3. 9/30/21 represents the date at which the equity exchange ratio was determined for the merger with Capstead.
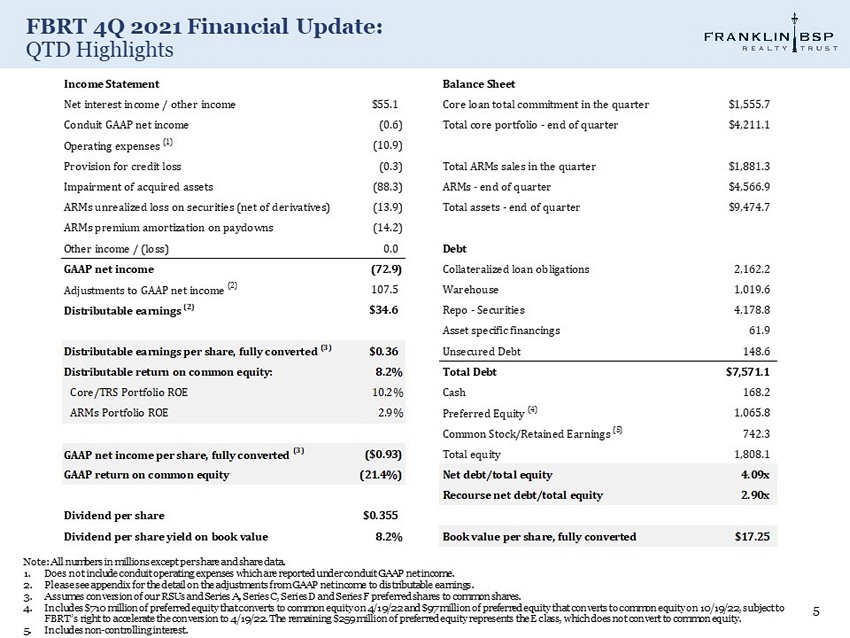
FBRT 4Q 2021 Financial Update: QTD Highlights 5 Income Statement Balance Sheet Net interest income / other income $55.1 Core loan total commitment in the quarter $1,555.7 Conduit GAAP net income (0.6) Total core portfolio - end of quarter $4,211.1 Operating expenses (1) (10.9) Provision for credit loss (0.3) Total ARMs sales in the quarter $1,881.3 Impairment of acquired assets (88.3) ARMs - end of quarter $4,566.9 ARMs unrealized loss on securities (net of derivatives) (13.9) Total assets - end of quarter $9,474.7 ARMs premium amortization on paydowns (14.2) Other income / (loss) 0.0 Debt GAAP net income (72.9) Collateralized loan obligations 2,162.2 Adjustments to GAAP net income (2) 107.5 Warehouse 1,019.6 Distributable earnings (2) $34.6 Repo - Securities 4,178.8 Asset specific financings 61.9 Distributable earnings per share, fully converted (3) $0.36 Unsecured Debt 148.6 Distributable return on common equity: 8.2% Total Debt $7,571.1 Core/TRS Portfolio ROE 10.2% Cash 168.2 ARMs Portfolio ROE 2.9% Preferred Equity (4) 1,065.8 Common Stock/Retained Earnings (5) 742.3 GAAP net income per share, fully converted (3) ($0.93) Total equity 1,808.1 GAAP return on common equity (21.4%) Net debt/total equity 4.09x Recourse net debt/total equity 2.90x Dividend per share $0.355 Dividend per share yield on book value 8.2% Book value per share, fully converted $17.25 Note: All numbers in millions except per share and share data. 1. Does not include conduit operating expenses which are reported under conduit GAAP net income. 2. Please see appendix for the detail on the adjustments from GAAP net income to distributable earnings. 3. Assumes conversion of our RSUs and Series A, Series C, Series D and Series F preferred shares to common shares. 4. Includes $710 million of preferred equity that converts to common equity on 4/19/22 and $97 million of preferred equity that con verts to common equity on 10/19/22, subject to FBRT’s right to accelerate the conversion to 4/19/22. The remaining $259 million of preferred equity represents the E class, whi ch does not convert to common equity. 5. Includes non - controlling interest.
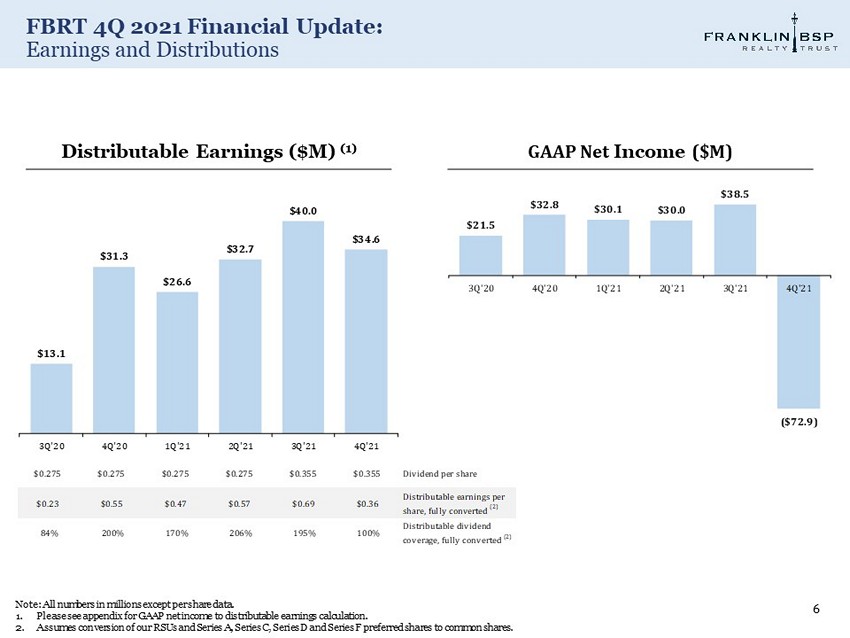
FBRT 4Q 2021 Financial Update: Earnings and Distributions 6 Note: All numbers in millions except per share data. 1. Please see appendix for GAAP net income to distributable earnings calculation. 2. Assumes conversion of our RSUs and Series A, Series C, Series D and Series F preferred shares to common shares. GAAP Net Income ($M) Distributable Earnings ($M) (1) $21.5 $32.8 $30.1 $30.0 $38.5 ($72.9) 3Q'20 4Q'20 1Q'21 2Q'21 3Q'21 4Q'21 $13.1 $31.3 $26.6 $32.7 $40.0 $34.6 3Q'20 4Q'20 1Q'21 2Q'21 3Q'21 4Q'21 $0.275 $0.275 $0.275 $0.275 $0.355 $0.355 Dividend per share $0.23 $0.55 $0.47 $0.57 $0.69 $0.36 Distributable earnings per share, fully converted (2) 84% 200% 170% 206% 195% 100% Distributable dividend coverage, fully converted (2)
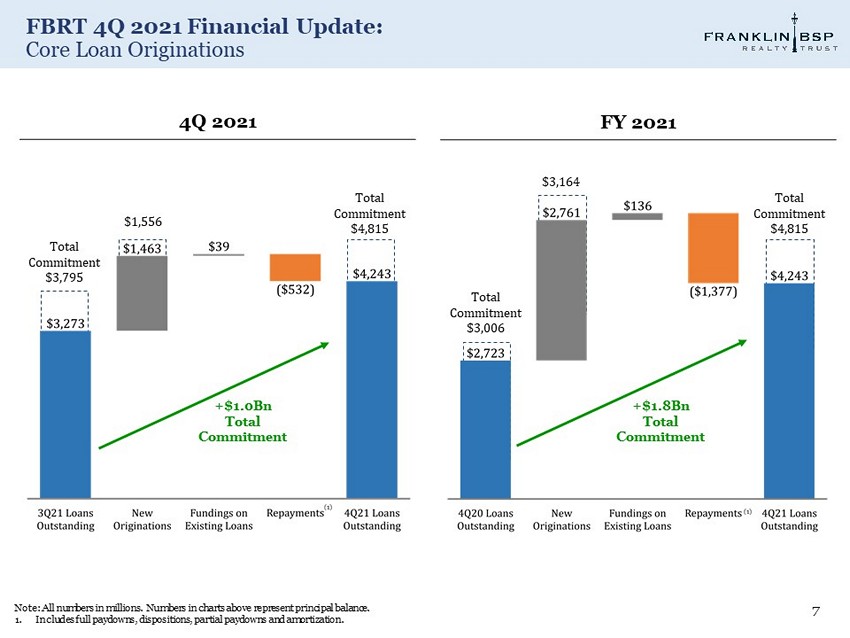
FBRT 4Q 2021 Financial Update: Core Loan Originations 7 Note: All numbers in millions. Numbers in charts above represent principal balance. 1. Includes full paydowns, dispositions, partial paydowns and amortization. 4Q 2021 FY 2021 Total Commitment $4,815 $1,556 Total Commitment $3,795 (1) (1) Total Commitment $3,006 $3,164 Total Commitment $4,815 +$1.0Bn Total Commitment +$1.8Bn Total Commitment
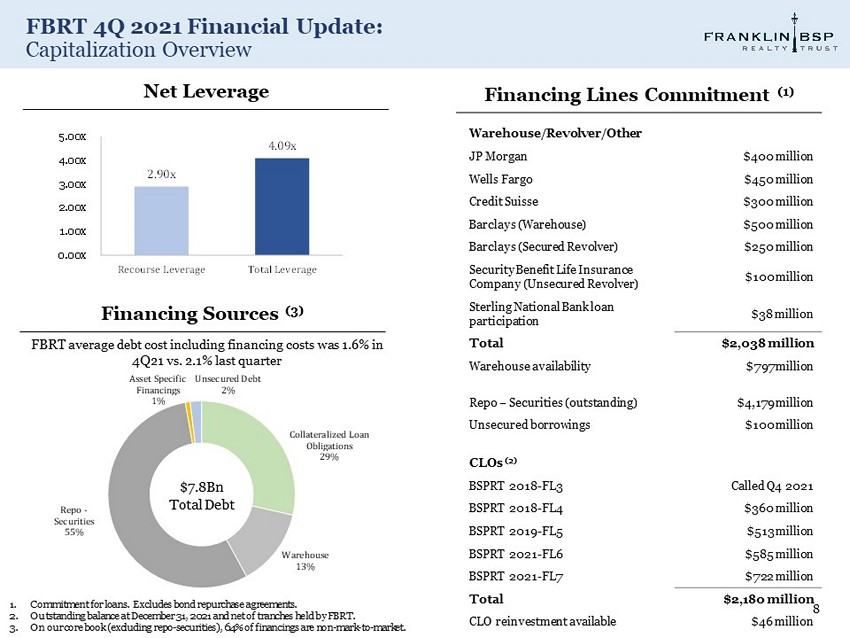
FBRT 4Q 2021 Financial Update: Capitalization Overview 8 1. Commitment for loans. Excludes bond repurchase agreements. 2. Outstanding balance at December 31, 2021 and net of tranches held by FBRT. 3. On our core book (excluding repo - securities), 64% of financings are non - mark - to - market. Collateralized Loan Obligations 29% Warehouse 13% Repo - Securities 55% Asset Specific Financings 1% Unsecured Debt 2% Warehouse/Revolver/Other JP Morgan $400 million Wells Fargo $450 million Credit Suisse $300 million Barclays (Warehouse) $500 million Barclays (Secured Revolver) $250 million Security Benefit Life Insurance Company (Unsecured Revolver) $100 million Sterling National Bank loan participation $38 million Total $2,038 million Warehouse availability $797 million Repo – Securities (outstanding) $4,179 million Unsecured borrowings $100 million CLOs (2) BSPRT 2018 - FL3 Called Q4 2021 BSPRT 2018 - FL4 $360 million BSPRT 2019 - FL5 $513 million BSPRT 2021 - FL6 $585 million BSPRT 2021 - FL7 $722 million Total $2,180 million CLO reinvestment available $46 million Financing Sources (3) Financing Lines Commitment (1) FBRT average debt cost including financing costs was 1.6% in 4Q21 vs. 2.1% last quarter Net Leverage $7.8Bn Total Debt 2.90x 4.09x 0.00x 1.00x 2.00x 3.00x 4.00x 5.00x Recourse Leverage Total Leverage

Portfolio 9
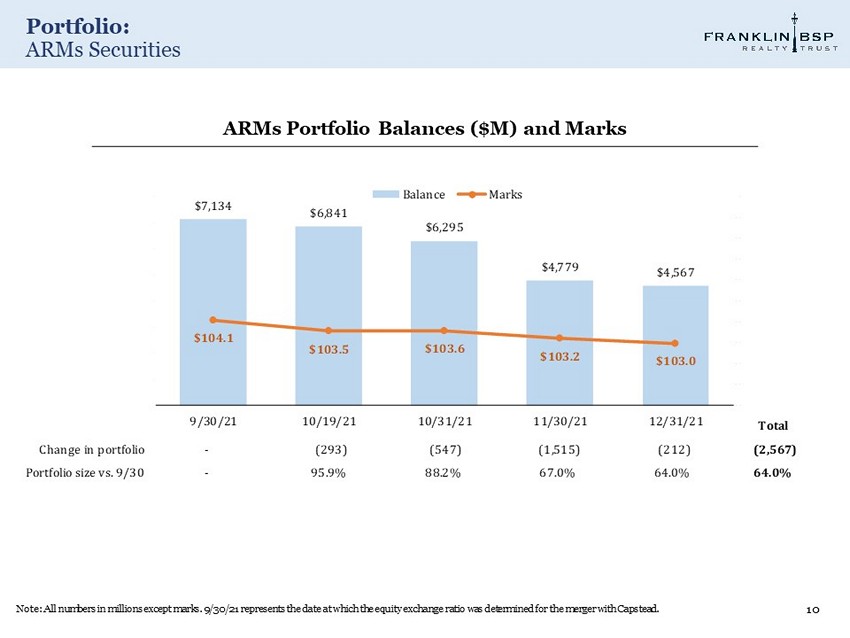
Portfolio: ARMs Securities 10 Note: All numbers in millions except marks. 9/30/21 represents the date at which the equity exchange ratio was determined for th e merger with Capstead. ARMs Portfolio Balances ($M) and Marks Total Change in portfolio - (293) (547) (1,515) (212) (2,567) Portfolio size vs. 9/30 - 95.9% 88.2% 67.0% 64.0% 64.0% $7,134 $6,841 $6,295 $4,779 $4,567 $104.1 $103.5 $103.6 $103.2 $103.0 100.00 101.00 102.00 103.00 104.00 105.00 106.00 107.00 108.00 109.00 110.00 $0 $1,000 $2,000 $3,000 $4,000 $5,000 $6,000 $7,000 $8,000 9/30/21 10/19/21 10/31/21 11/30/21 12/31/21 Balance Marks
Portfolio: 1Q 2022 ARMs Update 11 As of February 18 , 2022: ‒ Value of the ARMs portfolio was $2.4 billion ‒ The reduction in the value of the ARMs portfolio from January 1, 2022 to February 18 , 2022 is due in part to: ▪ $1.8 billion of sales ▪ $265 million of principal payments ‒ From January 1, 2022 to February 18, 2022, FBRT experienced losses of $38.1 million related to the ARMs portfolio as a result of net trading losses totaling $59.5 million related to principal paydowns, changes in market price and losses on sales of securities, net of portfolio related derivative gains of $21.4 million
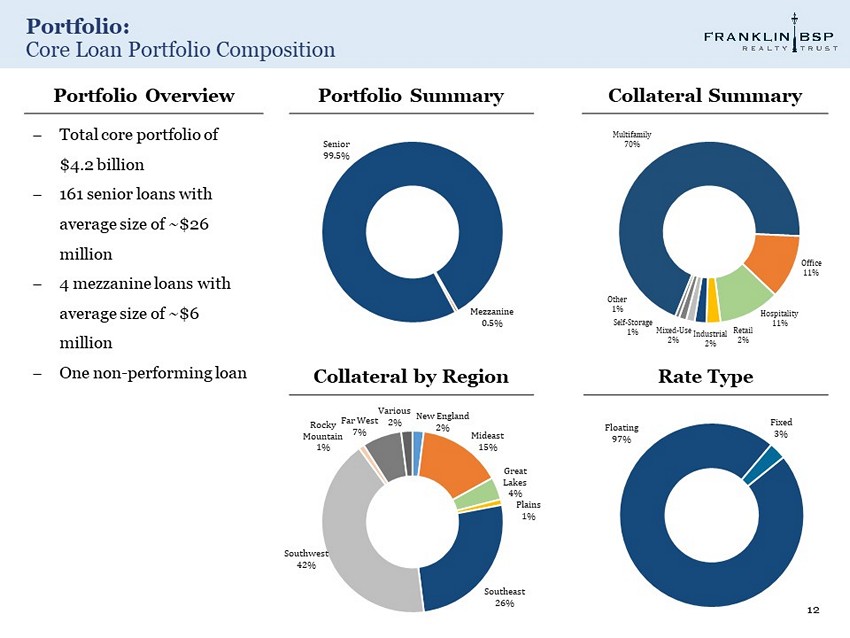
Portfolio: Core Loan Portfolio Composition 12 Mezzanine 0.5% Senior 99.5% New England 2% Mideast 15% Great Lakes 4% Plains 1% Southeast 26% Southwest 42% Rocky Mountain 1% Far West 7% Various 2% Floating 97% Fixed 3% Portfolio Summary Collateral Summary Collateral by Region Rate Type Portfolio Overview Total core portfolio of $4.2 billion 161 senior loans with average size of ~$26 million 4 mezzanine loans with average size of ~$6 million One non - performing loan Multifamily 70% Office 11% Hospitality 11% Retail 2% Industrial 2% Mixed - Use 2% Self - Storage 1% Other 1%

Portfolio: Core Originations in the Quarter 13 Note: All numbers in millions. Charts shown above are based on the initial funding/unpaid principal balance of the newly orig ina ted loans. Multifamily 93% Industrial 3% Retail 2% Other 2% Originated 38 loans for a total commitment of $1.6 billion ($1.5 billion of initial funding and $93 million of future funding) Weighted average spread of 3.4% with an all - in coupon of 3.5% By Collateral By Region By State Texas 51% Florida 9% New York 7% North Carolina 7% District of Columbia 6% South Carolina 4% Michigan 4% Other 12% Overview Southwest 53% Southeast 23% Mideast 15% Far West 5% Great Lakes 4%

Appendix 14

Appendix: Core Portfolio - FBRT Portfolio Details – Top 15 Loans 15 Note: All numbers in millions. 1. All - in Yield defined as: (1) current spread of the loan plus (2) any applicable index or index floor plus (3) origination and ex it fees amortized over the initial maturity date of the loan. Loan Type Origination Date Total Commitment Principal Balance Carrying Value Spread All-in Yield (1) Fully Extended Maturity State Collateral Type As-is LTV Loan 1 Senior Loan 10/8/21 $89 $89 $88 + 2.75% + 3.07% 10/9/26 District of Columbia Multifamily 50.3% Loan 2 Senior Loan 12/21/21 79 78 78 + 3.45% + 3.70% 1/9/27 Florida Multifamily 78.8% Loan 3 Senior Loan 12/15/21 84 78 78 + 3.21% + 3.49% 1/9/27 North Carolina Multifamily 76.1% Loan 4 Senior Loan 3/31/21 79 71 71 + 2.95% + 3.30% 4/9/26 Texas Multifamily 72.6% Loan 5 Senior Loan 10/8/20 70 68 67 5.15% 5.35% 10/9/25 Massachusetts Office 52.5% Loan 6 Senior Loan 9/20/21 70 67 66 + 3.25% + 3.84% 10/9/26 South Carolina Multifamily 77.1% Loan 7 Senior Loan 12/20/21 74 65 65 + 5.14% + 6.16% 7/9/26 New York Multifamily 74.7% Loan 8 Senior Loan 11/30/21 69 64 64 + 2.88% + 3.37% 12/9/26 Texas Multifamily 74.8% Loan 9 Senior Loan 11/10/21 63 63 63 + 3.35% + 4.05% 12/9/26 South Carolina Multifamily 78.0% Loan 10 Senior Loan 11/30/21 67 62 62 + 2.88% + 3.37% 12/9/26 Texas Multifamily 75.5% Loan 11 Senior Loan 10/29/21 70 60 60 + 2.85% + 3.37% 11/9/26 Texas Multifamily 70.6% Loan 12 Senior Loan 1/22/20 70 59 58 + 3.70% + 5.57% 2/9/25 New Jersey Office 65.7% Loan 13 Senior Loan 12/10/21 59 59 58 + 3.45% + 4.32% 1/9/27 Texas Multifamily 74.8% Loan 14 Senior Loan 12/13/17 57 57 57 + 5.19% + 7.20% 6/9/20 New York Hospitality 51.8% Loan 15 Senior Loan 12/6/19 63 57 57 + 3.75% + 6.37% 12/9/23 Various Industrial 59.7% Loans 16 - 165 Senior & Mezz Loans Various 3,754 3,248 3,236 + 3.98% + 5.04% Various Various Various 68.8% CECL Reserve (16) Total/Wtd. avg. $4,815 $4,243 $4,211 + 3.88% + 4.88% 3.7 years 68.8%
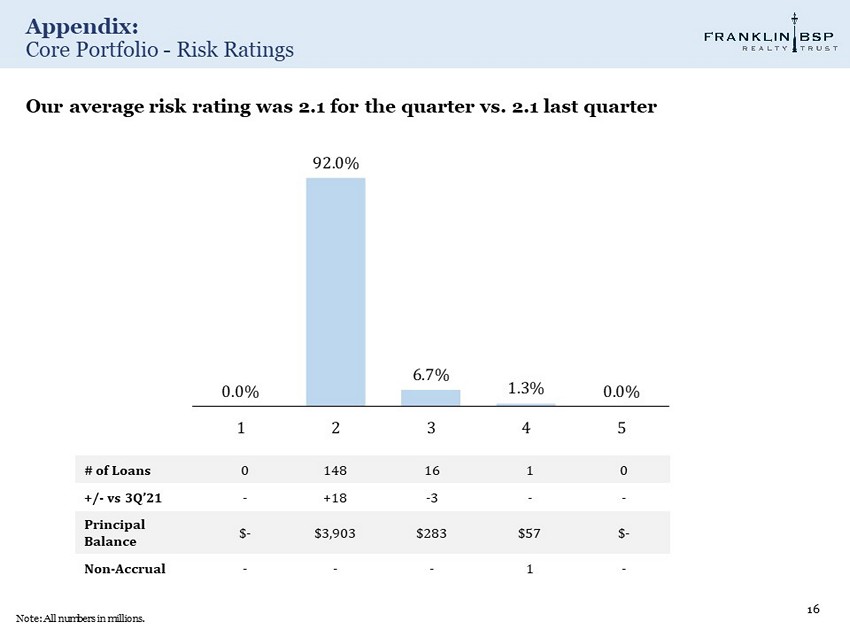
Appendix: Core Portfolio - Risk Ratings 16 Note: All numbers in millions. # of Loans 0 148 16 1 0 +/ - vs 3Q’21 - +18 - 3 - - Principal Balance $ - $3,903 $283 $57 $ - Non - Accrual - - - 1 - Our average risk rating was 2.1 for the quarter vs. 2.1 last quarter 0.0% 92.0% 6.7% 1.3% 0.0% 1 2 3 4 5
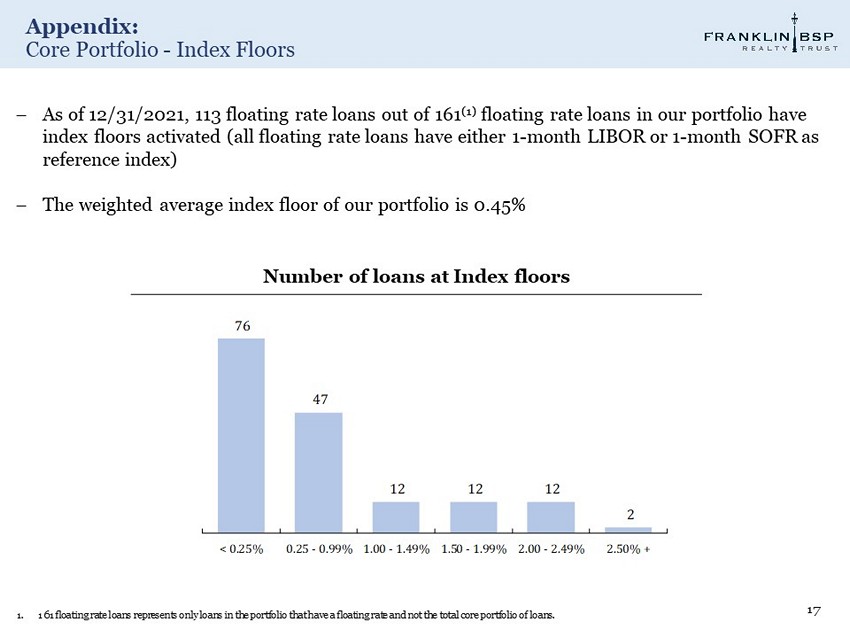
Appendix: Core Portfolio - Index Floors 17 1. 161 floating rate loans represents only loans in the portfolio that have a floating rate and not the total core portfolio of loa ns. Number of loans at Index floors As of 12/31/2021, 113 floating rate loans out of 161 (1) floating rate loans in our portfolio have index floors activated (all floating rate loans have either 1 - month LIBOR or 1 - month SOFR as reference index) The weighted average index floor of our portfolio is 0.45% 76 47 12 12 12 2 < 0.25% 0.25 - 0.99% 1.00 - 1.49% 1.50 - 1.99% 2.00 - 2.49% 2.50% +

Appendix: Core Portfolio - Case Study: Watch List Loans (Risk Rating 4&5) 18 Investment Brooklyn Hotel Loan Type Floating Rate Senior Loan Investment Date 12/1/2017 Default Date 6/9/2019 Collateral 147-Key Hotel Loan Purpose Refinance Location Brooklyn, New York Total Commitment $57 million Current Principal Amount $57 million Spread L + 5.2% Loan Risk Rating 4

Appendix: Core Portfolio – Allowance For Loan Loss 19 Note: All numbers in millions. Allowance for loan loss above includes future funding. Allowance for Loan Loss by Collateral Type Hospitality 17% MultiFamily 69% Office 9% Mixed Use 1% Retail 2% Industrial 1% Other 1% $ millions Allowance for Loan Loss Balance at 9/30/21 $15.8 Reversal of Provision for Credit Loss 0.3 Allowance for Loan Loss Balance at 12/31/21 $16.1 Portfolio Balance $4,243 Allowance for Loan Loss % of Portfolio 0.4%
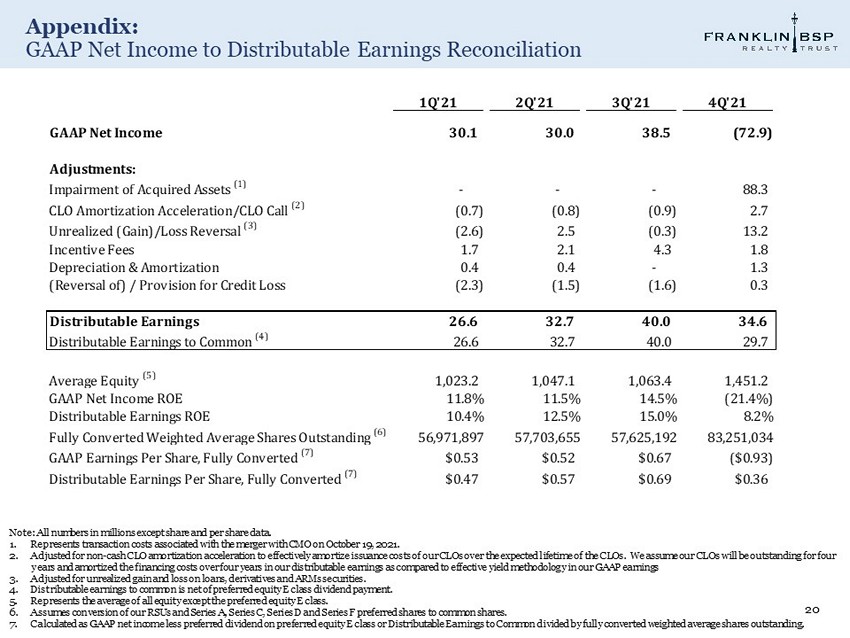
Appendix: GAAP Net Income to Distributable Earnings Reconciliation 20 Note: All numbers in millions except share and per share data. 1. Represents transaction costs associated with the merger with CMO on October 19, 2021. 2. Adjusted for non - cash CLO amortization acceleration to effectively amortize issuance costs of our CLOs over the expected lifetim e of the CLOs. We assume our CLOs will be outstanding for four years and amortized the financing costs over four years in our distributable earnings as compared to effective yield methodology in our GAAP earnings 3. Adjusted for unrealized gain and loss on loans, derivatives and ARMs securities. 4. Distributable earnings to common is net of preferred equity E class dividend payment. 5. Represents the average of all equity except the preferred equity E class. 6. Assumes conversion of our RSUs and Series A, Series C, Series D and Series F preferred shares to common shares. 7. Calculated as GAAP net income less preferred dividend on preferred equity E class or Distributable Earnings to Common divided by fully converted weighted average shares outstanding. 1Q'21 2Q'21 3Q'21 4Q'21 GAAP Net Income 30.1 30.0 38.5 (72.9) Adjustments: Impairment of Acquired Assets (1) - - - 88.3 CLO Amortization Acceleration/CLO Call (2) (0.7) (0.8) (0.9) 2.7 Unrealized (Gain)/Loss Reversal (3) (2.6) 2.5 (0.3) 13.2 Incentive Fees 1.7 2.1 4.3 1.8 Depreciation & Amortization 0.4 0.4 - 1.3 (Reversal of) / Provision for Credit Loss (2.3) (1.5) (1.6) 0.3 Distributable Earnings 26.6 32.7 40.0 34.6 Distributable Earnings to Common (4) 26.6 32.7 40.0 29.7 Average Equity (5) 1,023.2 1,047.1 1,063.4 1,451.2 GAAP Net Income ROE 11.8% 11.5% 14.5% (21.4%) Distributable Earnings ROE 10.4% 12.5% 15.0% 8.2% Fully Converted Weighted Average Shares Outstanding (6) 56,971,897 57,703,655 57,625,192 83,251,034 GAAP Earnings Per Share, Fully Converted (7) $0.53 $0.52 $0.67 ($0.93) Distributable Earnings Per Share, Fully Converted (7) $0.47 $0.57 $0.69 $0.36

Appendix: Book Value Per Share & Shares Outstanding 21 Note: All numbers in thousands except per share and share data. December 31, 2021 December 31, 2020 Stockholders' equity applicable to convertible common stock $ 1,543,550 $ 1,007,698 Shares Common stock 43,951,382 44,494,496 Restricted stock 14,546 15,555 Series A convertible preferred stock — 12,122,088 Series C convertible preferred stock 418,880 418,880 Series D convertible preferred stock 5,370,640 — Series F convertible preferred stock 39,733,299 — Total outstanding 89,488,747 57,051,019 Fully - converted book value per share $ 17.25 $ 17.66
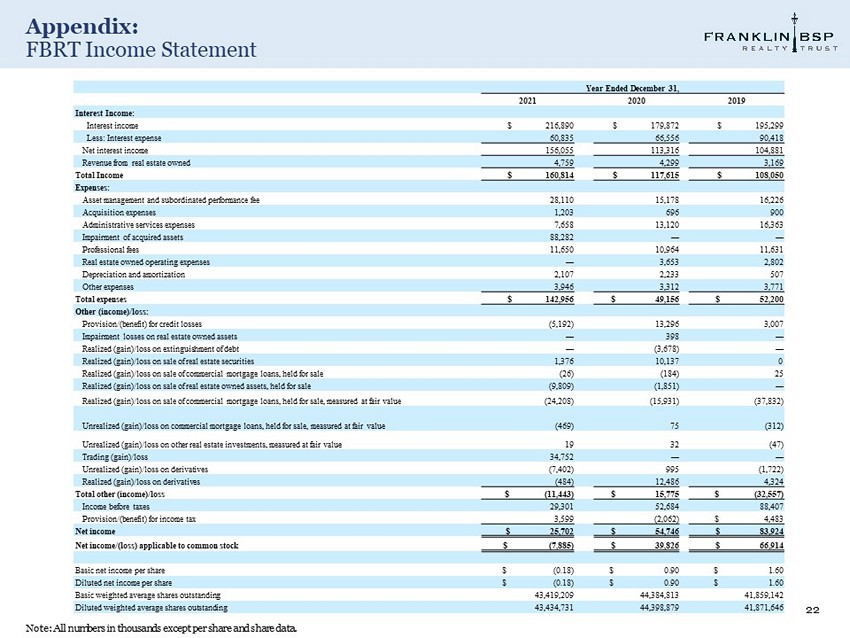
Appendix: FBRT Income Statement 22 Note: All numbers in thousands except per share and share data. Year Ended December 31, 2021 2020 2019 Interest Income: Interest income $ 216,890 $ 179,872 $ 195,299 Less: Interest expense 60,835 66,556 90,418 Net interest income 156,055 113,316 104,881 Revenue from real estate owned 4,759 4,299 3,169 Total Income $ 160,814 $ 117,615 $ 108,050 Expenses: Asset management and subordinated performance fee 28,110 15,178 16,226 Acquisition expenses 1,203 696 900 Administrative services expenses 7,658 13,120 16,363 Impairment of acquired assets 88,282 — — Professional fees 11,650 10,964 11,631 Real estate owned operating expenses — 3,653 2,802 Depreciation and amortization 2,107 2,233 507 Other expenses 3,946 3,312 3,771 Total expenses $ 142,956 $ 49,156 $ 52,200 Other (income)/loss: Provision/(benefit) for credit losses (5,192) 13,296 3,007 Impairment losses on real estate owned assets — 398 — Realized (gain)/loss on extinguishment of debt — (3,678) — Realized (gain)/loss on sale of real estate securities 1,376 10,137 0 Realized (gain)/loss on sale of commercial mortgage loans, held for sale (26) (184) 25 Realized (gain)/loss on sale of real estate owned assets, held for sale (9,809) (1,851) — Realized (gain)/loss on sale of commercial mortgage loans, held for sale, measured at fair value (24,208) (15,931) (37,832) Unrealized (gain)/loss on commercial mortgage loans, held for sale, measured at fair value (469) 75 (312) Unrealized (gain)/loss on other real estate investments, measured at fair value 19 32 (47) Trading (gain)/loss 34,752 — — Unrealized (gain)/loss on derivatives (7,402) 995 (1,722) Realized (gain)/loss on derivatives (484) 12,486 4,324 Total other (income)/loss $ (11,443) $ 15,775 $ (32,557) Income before taxes 29,301 52,684 88,407 Provision/(benefit) for income tax 3,599 (2,062) $ 4,483 Net income $ 25,702 $ 54,746 $ 83,924 Net income/(loss) applicable to common stock $ (7,885) $ 39,826 $ 66,914 Basic net income per share $ (0.18) $ 0.90 $ 1.60 Diluted net income per share $ (0.18) $ 0.90 $ 1.60 Basic weighted average shares outstanding 43,419,209 44,384,813 41,859,142 Diluted weighted average shares outstanding 43,434,731 44,398,879 41,871,646
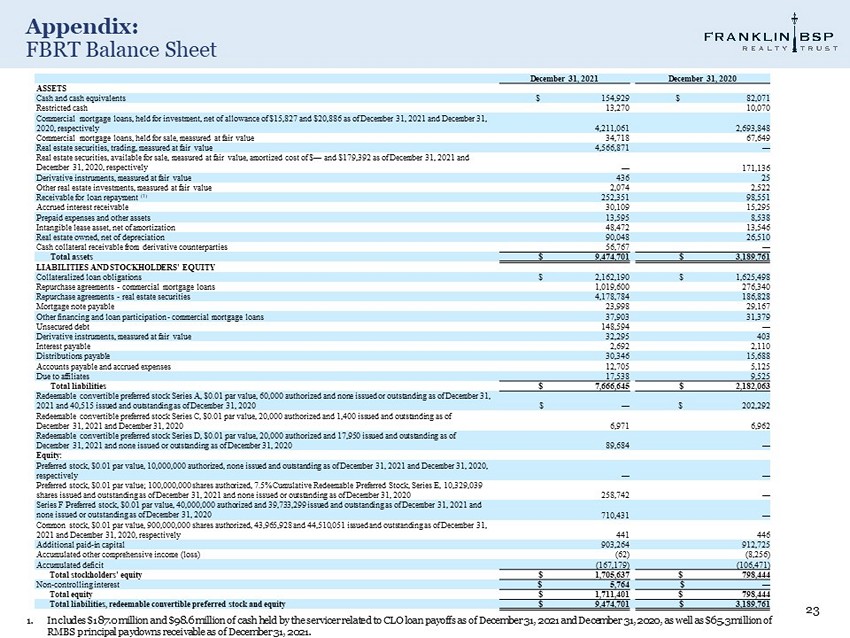
Appendix: FBRT Balance Sheet 23 December 31, 2021 December 31, 2020 ASSETS Cash and cash equivalents $ 154,929 $ 82,071 Restricted cash 13,270 10,070 Commercial mortgage loans, held for investment, net of allowance of $15,827 and $20,886 as of December 31, 2021 and December 31, 2020, respectively 4,211,061 2,693,848 Commercial mortgage loans, held for sale, measured at fair value 34,718 67,649 Real estate securities, trading, measured at fair value 4,566,871 — Real estate securities, available for sale, measured at fair value, amortized cost of $ — and $179,392 as of December 31, 2021 an d December 31, 2020, respectively — 171,136 Derivative instruments, measured at fair value 436 25 Other real estate investments, measured at fair value 2,074 2,522 Receivable for loan repayment (1) 252,351 98,551 Accrued interest receivable 30,109 15,295 Prepaid expenses and other assets 13,595 8,538 Intangible lease asset, net of amortization 48,472 13,546 Real estate owned, net of depreciation 90,048 26,510 Cash collateral receivable from derivative counterparties 56,767 — Total assets $ 9,474,701 $ 3,189,761 LIABILITIES AND STOCKHOLDERS' EQUITY Collateralized loan obligations $ 2,162,190 $ 1,625,498 Repurchase agreements - commercial mortgage loans 1,019,600 276,340 Repurchase agreements - real estate securities 4,178,784 186,828 Mortgage note payable 23,998 29,167 Other financing and loan participation - commercial mortgage loans 37,903 31,379 Unsecured debt 148,594 — Derivative instruments, measured at fair value 32,295 403 Interest payable 2,692 2,110 Distributions payable 30,346 15,688 Accounts payable and accrued expenses 12,705 5,125 Due to affiliates 17,538 9,525 Total liabilities $ 7,666,645 $ 2,182,063 Redeemable convertible preferred stock Series A, $0.01 par value, 60,000 authorized and none issued or outstanding as of Dece mbe r 31, 2021 and 40,515 issued and outstanding as of December 31, 2020 $ — $ 202,292 Redeemable convertible preferred stock Series C, $0.01 par value, 20,000 authorized and 1,400 issued and outstanding as of December 31, 2021 and December 31, 2020 6,971 6,962 Redeemable convertible preferred stock Series D, $0.01 par value, 20,000 authorized and 17,950 issued and outstanding as of December 31, 2021 and none issued or outstanding as of December 31, 2020 89,684 — Equity: Preferred stock, $0.01 par value, 10,000,000 authorized, none issued and outstanding as of December 31, 2021 and December 31, 20 20, respectively — — Preferred stock, $0.01 par value; 100,000,000 shares authorized, 7.5% Cumulative Redeemable Preferred Stock, Series E, 10,329 ,03 9 shares issued and outstanding as of December 31, 2021 and none issued or outstanding as of December 31, 2020 258,742 — Series F Preferred stock, $0.01 par value, 40,000,000 authorized and 39,733,299 issued and outstanding as of December 31, 2021 a nd none issued or outstanding as of December 31, 2020 710,431 — Common stock, $0.01 par value, 900,000,000 shares authorized, 43,965,928 and 44,510,051 issued and outstanding as of December 31 , 2021 and December 31, 2020, respectively 441 446 Additional paid - in capital 903,264 912,725 Accumulated other comprehensive income (loss) (62) (8,256) Accumulated deficit (167,179) (106,471) Total stockholders' equity $ 1,705,637 $ 798,444 Non - controlling interest $ 5,764 $ — Total equity $ 1,711,401 $ 798,444 Total liabilities, redeemable convertible preferred stock and equity $ 9,474,701 $ 3,189,761 1. Includes $187.0 million and $98.6 million of cash held by the servicer related to CLO loan payoffs as of December 31, 2021 an d D ecember 31, 2020, as well as $65.3 million of RMBS principal paydowns receivable as of December 31, 2021.