Exhibit 99.2
Franklin BSP Realty Trust Supplemental Information First Quarter 2022
Important Information The information herein relates to the Company’s business and financial information as of March 31 , 2022 and does not reflect subsequent developments . Risk Factors Investing in and owning our common stock involves a high degree of risk . See the section entitled “Risk Factors” in our Annual Report on Form 10 - K filed February 25 , 2022 and in our Quarterly Report on Form 10 - Q filed May 4 , 2022 for a discussion of these risks . Forward - Looking Statements Certain statements included in this presentation are forward - looking statements . Those statements include statements regarding the intent, belief or current expectations of Franklin BSP Realty Trust, Inc . (“FBRT” or the “Company”) and may include the assumptions on which such statements are based, and generally are identified by the use of words such as "may," "will," "seeks," "anticipates," "believes," "estimates," "expects," "plans," "intends," "should" or similar expressions . Actual results may differ materially from those contemplated by such forward - looking statements . Factors that could cause actual outcomes to differ materially from our forward - looking statements include material changes in the value of the securities we acquired in our merger with Capstead Mortgage Corporation, continuing adverse effects from the COVID - 19 pandemic on our financial condition, operating results and cash flows, and the financial stability of our borrowers, and the other factors set forth in the risk factors section of our most recent Form 10 - K and Form 10 - Q . The extent to which these factors impact us and our borrowers will depend on future developments, which are highly uncertain and cannot be predicted with confidence . Further, forward - looking statements speak only as of the date they are made, and we undertake no obligation to update or revise forward - looking statements to reflect changed assumptions, the occurrence of unanticipated events or changes to future operating results over time, except as required by law . Additional Important Information The summary information provided in this presentation does not purport to be complete and no obligation to update or otherwise revise such information is being assumed . Nothing shall be relied upon as a promise or representation as to the future performance of the Company . This summary is not an offer to sell securities and is not soliciting an offer to buy securities in any jurisdiction where the offer or sale is not permitted . This summary is not advice, a recommendation or an offer to enter into any transaction with us or any of our affiliated funds . There is no guarantee that any of the goals, targets or objectives described in this summary will be achieved . The information contained herein is not intended to provide, and should not be relied upon for, accounting, legal, ERISA or tax advice or investment recommendations . Investors should also seek advice from their own independent tax, accounting, financial, ERISA, investment and legal advisors to properly assess the merits and risks associated with their investment in light of their own financial condition and other circumstances . The information contained herein is qualified in its entirety by reference to our most recent Annual Report on Form 10 - K and Quarterly Report on Form 10 - Q . You may obtain a copy of the most recent Annual Report or Quarterly Report by calling ( 844 ) 785 - 4393 and/or visiting www . fbrtreit . com . PAST PERFORMANCE IS NOT A GUARANTEE OR INDICATIVE OF FUTURE RESULTS . INVESTMENTS INVOLVE SIGNIFICANT RISKS, INCLUDING LOSS OF THE ENTIRE INVESTMENT . There is no guarantee that any of the estimates, targets or projections illustrated in this summary will be achieved . Any references herein to any of the Company’s past or present investments, portfolio characteristics, or performance, have been provided for illustrative purposes only . It should not be assumed that these investments were or will be profitable or that any future investments will be profitable or will equal the performance of these investments . There can be no guarantee that the investment objective of the Company will be achieved . Any investment entails a risk of loss . An investor could lose all or substantially all of his or her investment . Please refer to our most recent Annual Report on Form 10 - K and Quarterly Report on Form 10 - Q for a more complete list of risk factors . The following slides contain summaries of certain financial information about the Company . The information contained in this presentation is summary information that is intended to be considered in the context of our filings with the Securities and Exchange Commission and other public announcements that we may make, by press release or otherwise, from time to time . 2
FBRT 1Q 2022 Financial Update 3

FBRT 1Q 2022 Financial Update: First Quarter 2022 Highlights 4 1. Assumes conversion of our RSUs and Series C, Series D and Series F preferred shares to common shares. 2. Please see appendix for GAAP net income to Distributable Earnings and Run - Rate Distributable Earnings calculation. Earnings — GAAP Net Income (Loss) of ($22.5) million or ($0.30) per fully converted share (1) — Distributable Earnings before trading and derivatives gain/loss on ARMs (2) (“Run - Rate Distributable Earnings”) of $40.1M or $0.39 per fully converted share (1) — Distributable Earnings (2) of $12.1 million or $0.08 per fully converted share (1) — Declared a cash dividend of $0.355 per share, representing a yield of 8.6% on book value per share, fully converted (1) or a yield of 10.1% on share price of $14.01 as of 5/3/22 Capitalization — Book value per share, fully converted is $16.50 (1) — Net debt to equity is 2.9x; recourse net debt to equity is 1.3x — Closed BSPRT 2022 - FL8 in February 2022, a $1.2 billion managed CLO with an advance rate of 80%, weighted average interest rate of S+172 and a 2 - year reinvestment period — 81% of financings sourced are non - mark - to - market on our core book (excludes repo - securities) Investments — Core portfolio: closed $603 million of loan commitments and funded $577 million of principal balance. Received loan repayments of $321 million for a net core portfolio growth of $319 million in the quarter — Conduit: sold $76 million of conduit loans in the quarter — Approximately $2.6 billion principal reduction in our Adjustable - Rate Mortgage Securities (“ARMs”) portfolio in the first quarter. $1.3 billion principal reduction of ARMs in the second quarter through 5/3/22 Portfolio — Core portfolio of 166 CRE loans and $4.6 billion of principal balance, average size of $27 million. One investment on non - accrual — Fair market value of ARMs is $1.9 billion at 3/31/22 vs. $4.6 billion at 12/31/21, vs. $7.1 billion at 9/30/21 — As of 5/3/22, fair market value of ARMs was $649 million
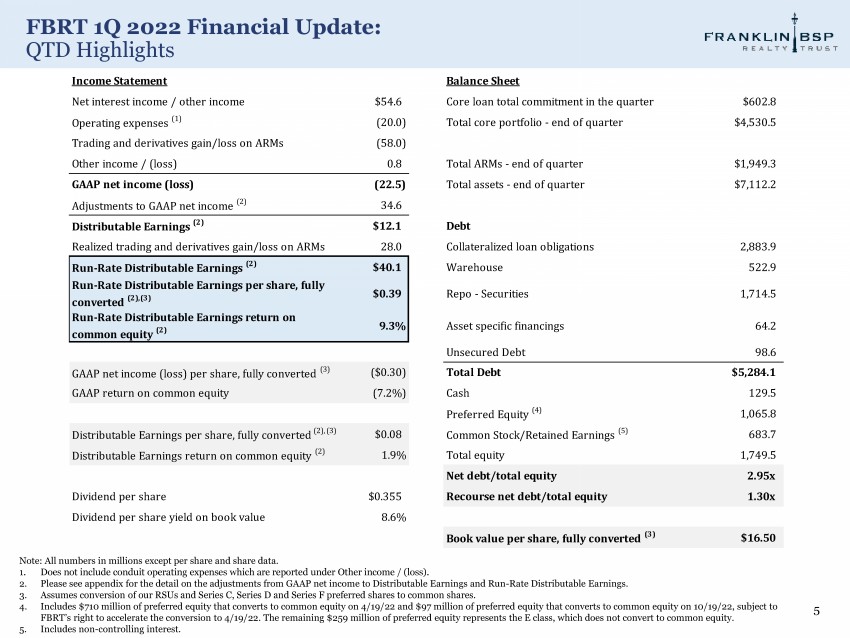
FBRT 1Q 2022 Financial Update: QTD Highlights 5 Note: All numbers in millions except per share and share data. 1. Does not include conduit operating expenses which are reported under Other income / (loss). 2. Please see appendix for the detail on the adjustments from GAAP net income to Distributable Earnings and Run - Rate Distributable Earnings. 3. Assumes conversion of our RSUs and Series C, Series D and Series F preferred shares to common shares. 4. Includes $710 million of preferred equity that converts to common equity on 4/19/22 and $97 million of preferred equity that converts to common equity on 10/19/22, subject to FBRT’s right to accelerate the conversion to 4/19/22. The remaining $259 million of preferred equity represents the E class, which does not convert to common equity. 5. Includes non - controlling interest. Repo - Securities 1 , 714 . 5 Income Statement Balance Sheet Net interest income / other income $54.6 Core loan total commitment in the quarter $ 602 . 8 Operating expenses (1) ( 20 . 0 ) Total core portfolio - end of quarter $ 4 , 530 . 5 Trading and derivatives gain/loss on ARMs ( 58 . 0 ) Other income / (loss) 0 . 8 Total ARMs - end of quarter $ 1 , 949 . 3 GAAP net income (loss) (22.5) Total assets - end of quarter $ 7 , 112 . 2 Adjustments to GAAP net income (2) 34 . 6 Distributable Earnings (2) $12.1 Debt Realized trading and derivatives gain/loss on ARMs 28 . 0 Collateralized loan obligations 2 , 883 . 9 Run - Rate Distributable Earnings (2) $40.1 Warehouse 522 . 9 $ 0 . 3 9 Run - Rate Distributable Earnings per share, fully converted (2),(3) Run - Rate Distributable Earnings return on 9 . 3 % Asset specific financings 64 . 2 common equity (2) Unsecured Debt 98 . 6 GAAP net income (loss) per share, fully converted (3) ($ 0 . 30 ) Total Debt $ 5 , 284 . 1 GAAP return on common equity ( 7 . 2 % ) Cash 129 . 5 Preferred Equity (4) 1 , 065 . 8 Distributable Earnings per share, fully converted (2), (3) $0.08 Common Stock/Retained Earnings (5) 683 . 7 Distributable Earnings return on common equity (2) 1 . 9 % Total equity 1 , 749 . 5 Net debt/total equity 2 . 95 x Dividend per share $0.355 Recourse net debt/total equity 1 . 30 x Dividend per share yield on book value 8 . 6 % Book value per share, fully converted (3) $ 16 . 5 0
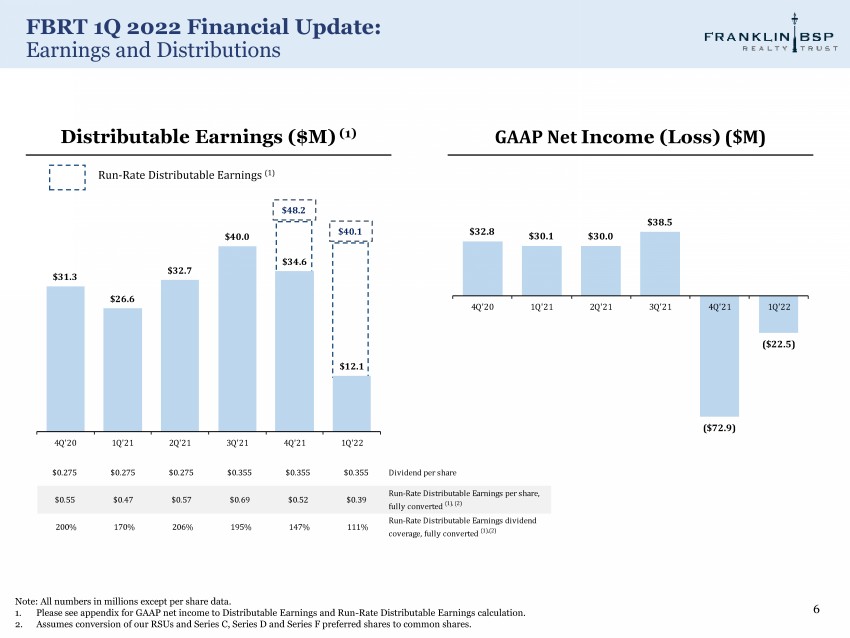
FBRT 1Q 2022 Financial Update: Earnings and Distributions 6 Note: All numbers in millions except per share data. 1. Please see appendix for GAAP net income to Distributable Earnings and Run - Rate Distributable Earnings calculation. 2. Assumes conversion of our RSUs and Series C, Series D and Series F preferred shares to common shares. GAAP Net Income (Loss) ($M) Distributable Earnings ($M) (1) Run - Rate Distributable Earnings (1) $48.2 $40.1 $ 32 .8 $ 30 .1 $ 30 .0 $ 38 .5 ($72.9) ( $ 22 . 5 ) 4 Q' 2 0 1 Q' 2 1 2 Q' 2 1 3Q'21 4Q'21 1Q'22 $ 31 .3 $ 26 .6 $ 32 .7 $ 40 .0 $ 34 .6 $ 12 .1 4Q'20 $0.275 1Q'21 $0.275 2Q'21 $0.275 3Q'21 $0.355 4Q'21 $0.355 1Q'22 $0.355 Dividend per share $0.55 $0.47 $ 0 . 5 7 $ 0 . 6 9 $0.52 $0.39 Run - Rate Distributable Earnings per share, fully converted (1), (2) 200% 170% 206% 195% 147% 111% Run - Rate Distributable Earnings dividend coverage, fully converted (1),(2)
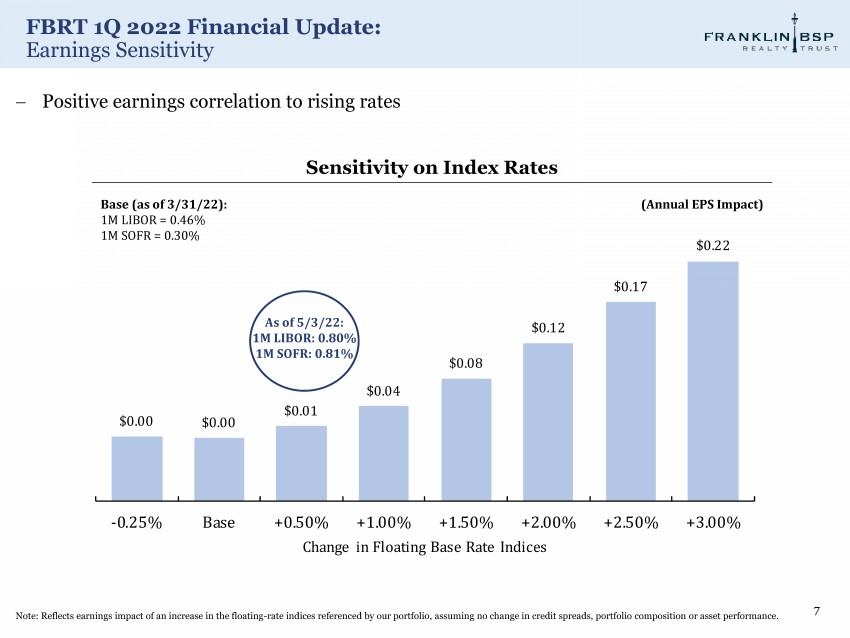
FBRT 1Q 2022 Financial Update: Earnings Sensitivity 7 Positive earnings correlation to rising rates Sensitivity on Index Rates $ 0 . 0 0 $ 0 . 0 0 $ 0 . 0 1 $ 0 . 0 4 $ 0 . 0 8 $ 0 $ 0 $ - 0 . 25 % Base (as of 3/31/22): 1M LIBOR = 0.46% 1M SOFR = 0.30% (Annual EPS Impact) Note: Reflects earnings impact of an increase in the floating - rate indices referenced by our portfolio, assuming no change in credit spreads, portfolio composition or asset performance. As of 5/3/22: 1M LIBOR: 0.80% 1M SOFR: 0.81%
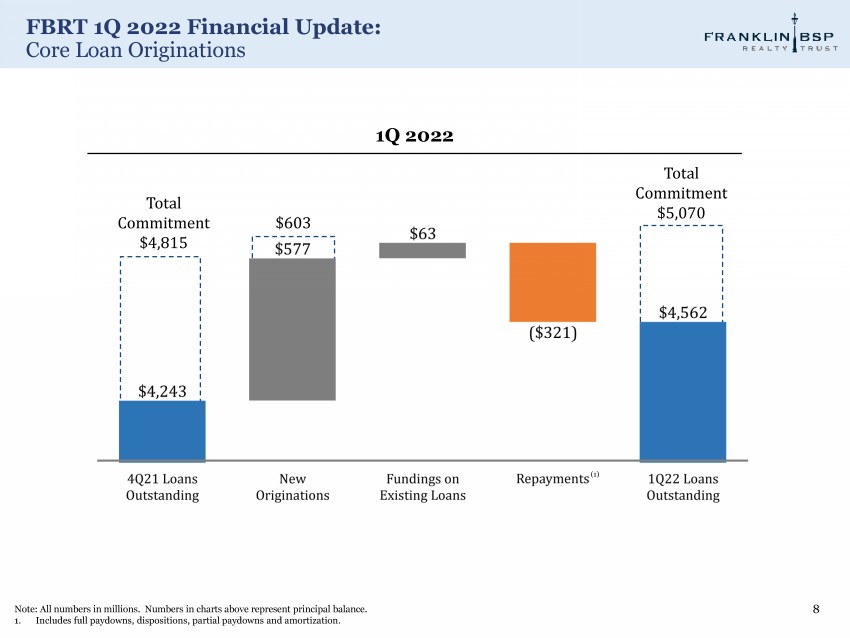
FBRT 1Q 2022 Financial Update: Core Loan Originations 8 Note: All numbers in millions. Numbers in charts above represent principal balance. 1. Includes full paydowns, dispositions, partial paydowns and amortization. 1Q 2022 Total Commitment $5,070 $603 Total Commitment $4,815 (1)
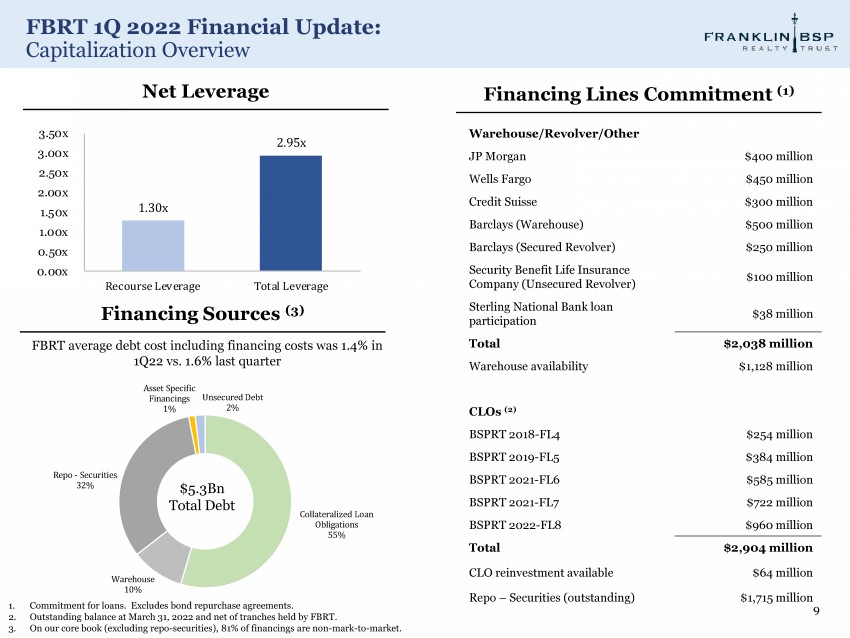
FBRT 1Q 2022 Financial Update: Capitalization Overview Warehouse 10% 1. Commitment for loans. Excludes bond repurchase agreements. 2. Outstanding balance at March 31, 2022 and net of tranches held by FBRT. 3. On our core book (excluding repo - securities), 81% of financings are non - mark - to - market. Collateralized Loan Obligations 55% Repo - Securities 32% Asset Specific Financings 1% Unsecured Debt 2% Warehouse/Revolver/Other JP Morgan $400 million Wells Fargo $450 million Credit Suisse $300 million Barclays (Warehouse) $500 million Barclays (Secured Revolver) $250 million Security Benefit Life Insurance Company (Unsecured Revolver) $100 million Sterling National Bank loan participation $38 million Total $2,038 million Warehouse availability $1,128 million CLOs (2) BSPRT 2018 - FL4 $254 million BSPRT 2019 - FL5 $384 million BSPRT 2021 - FL6 $585 million BSPRT 2021 - FL7 $722 million BSPRT 2022 - FL8 $960 million Total $2,904 million CLO reinvestment available $64 million Repo – Securities (outstanding) $1,715 million Financing Lines Commitment (1) Net Leverage $5.3Bn Total Debt 1 . 30 x 2 . 95 x 3 . 5 0 x 3 . 0 0 x 2 . 5 0 x 2.00x 1.50x 1.00x 0.50x 0.00x Recourse Leverage Total Leverage Financing Sources (3) FBRT average debt cost including financing costs was 1.4% in 1Q22 vs. 1.6% last quarter 9

Portfolio 10
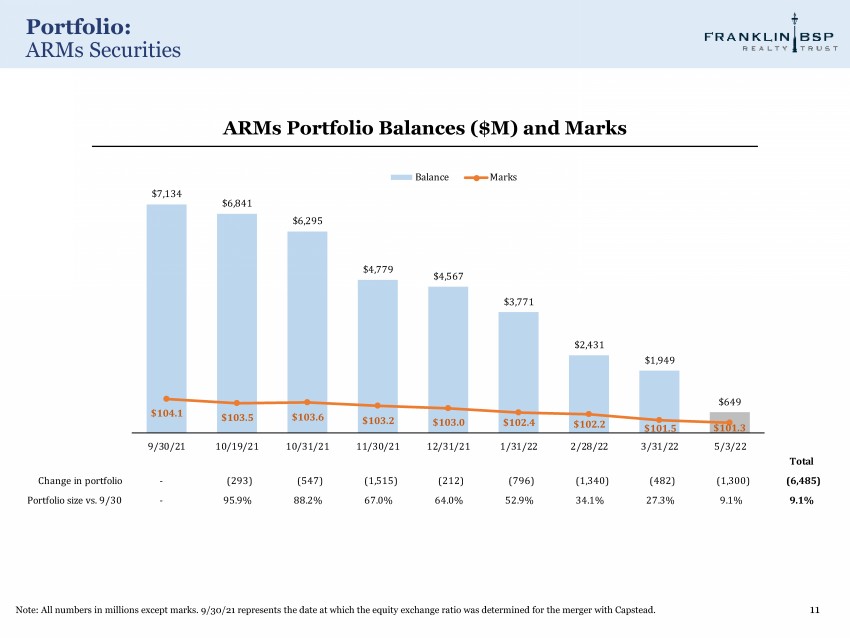
Portfolio: ARMs Securities 11 Note: All numbers in millions except marks. 9/30/21 represents the date at which the equity exchange ratio was determined for the merger with Capstead. ARMs Portfolio Balances ($M) and Marks $7,134 $6,841 $6,295 $ 4 , 77 9 $4,567 $3,771 $2,431 $1,949 $ 64 9 $104.1 $103.5 $103.6 $ 103 . 2 $103.0 $ 102 . 4 $102.2 $101.5 $101.3 9 / 3 0 / 2 1 10/19/21 10/31/21 1 1 / 3 0 / 2 1 12/31/21 1 / 3 1 / 2 2 2/28/22 3/31/22 5/3/22 Total Change in portfolio - (293) (547) ( 1 , 515 ) (212) ( 796 ) (1,340) ( 482 ) (1,300) (6,485) Portfolio size vs. 9/30 - 95.9% 88.2% 67.0% 64.0% 52 . 9 % 34.1% 27 . 3 % 9.1% 9.1% Balance M a r k s
Portfolio: 2Q 2022 ARMs Update 12 Update on ARMs portfolio: − From April 1, 2022 to May 3, 2022, the value of the ARMs portfolio was reduced by $1.3 billion − As of May 3, 2022, value of the ARMs portfolio was $649 million compared to $7.1 billion at September 30, 2021, which represents a 91% reduction of the portfolio − From April 1, 2022 to May 3, 2022, FBRT experienced losses of $6.9 million related to the ARMs portfolio as a result of net trading losses totaling $15.4 million related to principal paydowns, changes in market price and losses on sales of securities, net of portfolio related derivative gains of $8.6 million
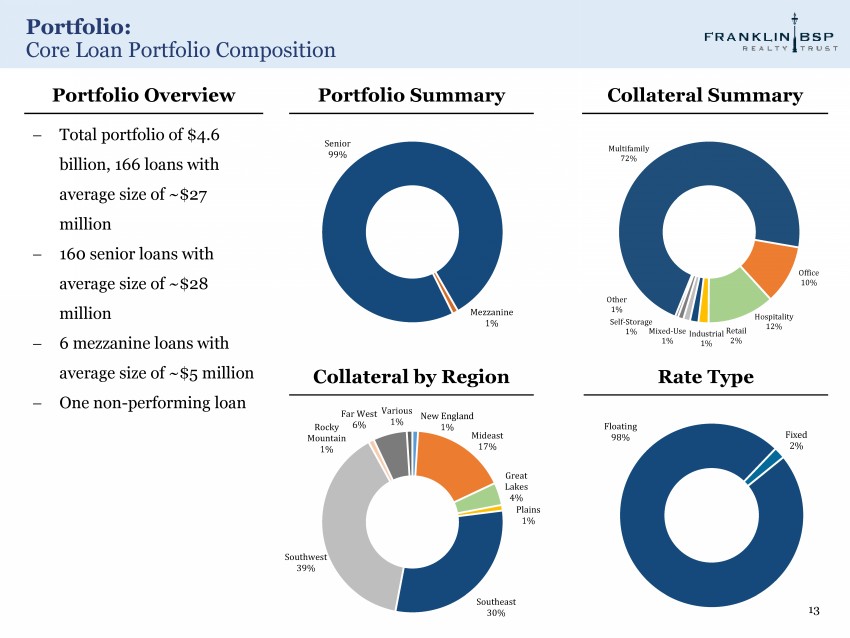
Portfolio: Core Loan Portfolio Composition 13 Me z zanine 1% Senior 99% New England 1% Mideast 17% Great La kes 4 % P lains 1% S o utheast 30% S o uthwes t 39% Roc ky Mountain 1% Far West 6% Various 1% Flo a ting 98% F i x ed 2% Portfolio Summary Collateral Summary Collateral by Region Rate Type Portfolio Overview Total portfolio of $4.6 billion, 166 loans with average size of ~$27 million 160 senior loans with average size of ~$28 million 6 mezzanine loans with average size of ~$5 million One non - performing loan M u l ti fam i ly 72% Off ice 10% H o sp it al ity 12% Retail 2% 1% Mixed - Use Industrial 1% 1% O ther 1% Self - Storage

Portfolio: Core Originations in the Quarter 14 Note: All numbers in millions. Charts shown above are based on the initial funding/unpaid principal balance of the newly originated loans. Originated 16 loans for a total commitment of $603 million ($578 million of initial funding and $26 million of future funding) Weighted average spread of 3.77% with an all - in coupon of 3.84%. Weighted average originations and exit fees of 1.0% and 0.3%, respectively By Collateral By Region By State Overview M u l t i f am i l y 68% H o s p i t a l i t y 16% I n du s tr i a l 10% O t h e r 7% S o u t h ea s t 49% M i d ea s t 25% S o u t h w e s t 22% Far West 4% North Carolina 24% A r i z o n a 15% New Jersey 15% F l o r i d a 14% G e o rg i a 11% New York 10% T exa s 7% O t h e r 4%

Appendix 15
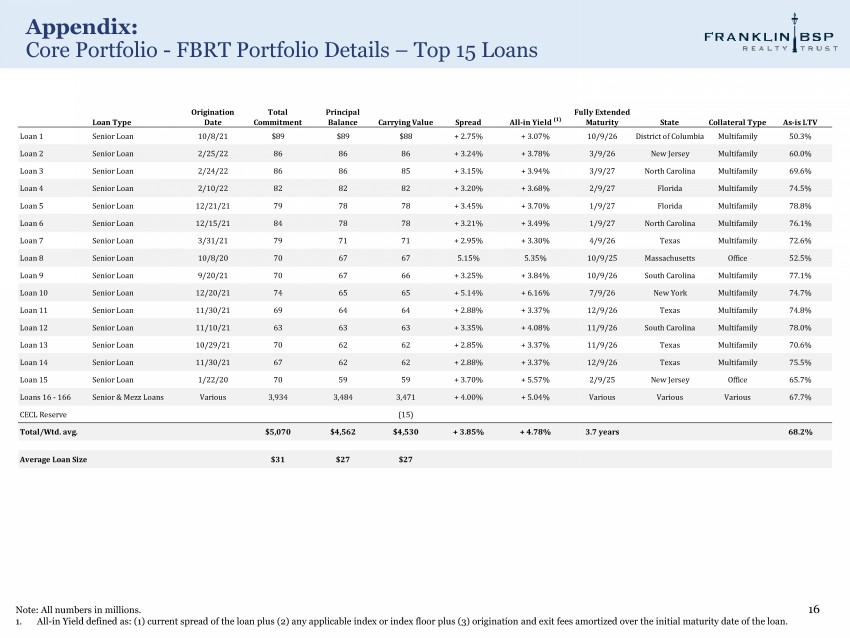
Appendix: Core Portfolio - FBRT Portfolio Details – Top 15 Loans 16 Note: All numbers in millions. 1. All - in Yield defined as: (1) current spread of the loan plus (2) any applicable index or index floor plus (3) origination and exit fees amortized over the initial maturity date of the loan. Loan Type Origination Date Total Commitment Principal Balance Carrying Value Spread All - in Yield (1) Fully Extended Maturity S t a t e C o ll a te r a l Ty p e A Loan 1 Senior Loan 10 / 8 / 21 $89 $ 89 $88 + 2.75% + 3.07% 10/9/26 District of Columbia Multifamily Loan 2 Senior Loan 2 / 25 / 22 86 86 86 + 3.24% + 3.78% 3/9/26 New Jersey Mu Loan 3 Senior Loan 2 / 24 / 22 86 86 85 + 3.15% + 3.94% 3/9/27 North Carolin Loan 4 Senior Loan 2 / 10 / 22 82 82 82 + 3.20% + 3.68% 2/9/27 Loan 5 Senior Loan 12 / 21 / 21 79 78 78 + 3.45% + 3.70% 1/9/2 Loan 6 Senior Loan 12 / 15 / 21 84 78 78 + 3.21% + 3.49% s - i Loan 7 Senior Loan 3/31/21 79 71 71 + 2.95% + 3 Loan 8 Senior Loan 10/8/20 70 67 67 5.15% Loan 9 Senior Loan 9/20/21 70 67 66 Loan 10 Senior Loan 12/20/21 74 65 65 Loan 11 Senior Loan 11/30/21 69 64 Loan 12 Senior Loan 11/10/21 63 Loan 13 Senior Loan 10/29/21 70 Loan 14 Senior Loan 11/30/21 Loan 15 Senior Loan 1/22/ Loans 16 - 166 Senior & Mezz Loans CECL Reserve Total/Wtd. avg. Avera
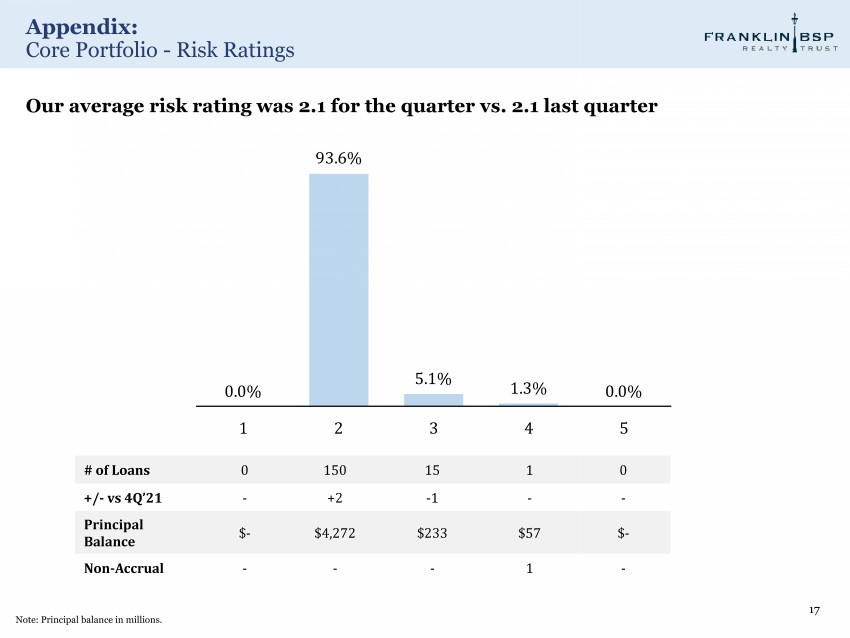
Appendix: Core Portfolio - Risk Ratings 17 Note: Principal balance in millions. # of Loans 0 150 15 1 0 +/ - vs 4Q’21 - +2 - 1 - - Principal Balance $ - $4,272 $233 $57 $ - Non - Accrual - - - 1 - Our average risk rating was 2.1 for the quarter vs. 2.1 last quarter 93.6% 0.0% 5.1% 1.3% 0.0% 1 2 3 4 5

Appendix: Core Portfolio - Index Floors 18 1. 163 floating rate loans represents only loans in the portfolio that have a floating rate and not the total core portfolio of loans. As of 3/31/2022, 41 floating rate loans out of 163 (1) floating rate loans in our portfolio have index floors activated (all floating rate loans have either 1 - month LIBOR or 1 - month SOFR as reference index) The weighted average index floor of our portfolio is 0.37% As of 3/31/2022, 1 - month LIBOR and 1 - month SOFR were 0.46% and 0.30%, respectively Number of loans at Index floors 90 42 8 11 11 1 < 0.25% 0.25 - 0.99% 1.00 - 1.49% 1.50 - 1.99% 2.00 - 2.49% 2.50% +

Appendix: Core Portfolio - Case Study: Watch List Loans (Risk Rating 4&5) 19 Investment Brooklyn Hotel Loan Type Floating Rate Senior Loan Investment Date 12/1/2017 Default Date 6/9/2019 Collateral 147 - Key Hotel Loan Purpose Refinance Location Brooklyn, New York Total Commitment $57 million Current Principal Amount $57 million Spread L + 5.2% Loan Risk Rating 4

Appendix: Core Portfolio – Allowance For Loan Loss 20 Note: All numbers in millions. Allowance for loan loss above includes future funding. Allowance for Loan Loss by Collateral Type $ millions Allowance for Loan Loss Balance at 12/31/21 Reversal of Provision for Credit Loss $ 16 . 1 ( 1 . 0 ) Allowance for Loan Loss Balance at 3/31/22 $15.1 Portfolio Principal Balance $4,562 Allowance for Loan Loss % of Portfolio 0.3% H o sp it a lit y 25% Mu lti f a m i l y 65% Office 5% R e t a i l 4% Ot he r 2%
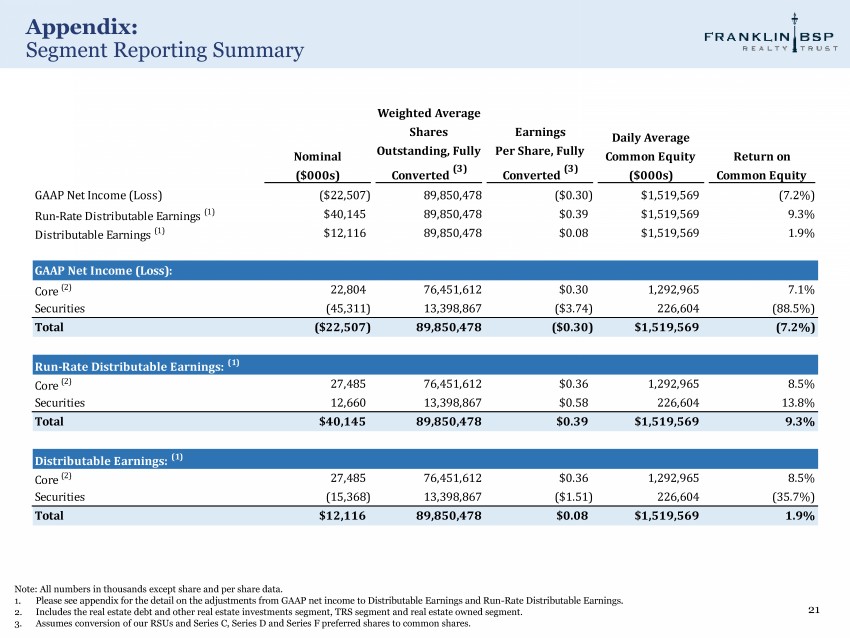
Appendix: Segment Reporting Summary 21 Note: All numbers in thousands except share and per share data. 1. Please see appendix for the detail on the adjustments from GAAP net income to Distributable Earnings and Run - Rate Distributable Earnings. 2. Includes the real estate debt and other real estate investments segment, TRS segment and real estate owned segment. 3. Assumes conversion of our RSUs and Series C, Series D and Series F preferred shares to common shares. Nominal Outstanding, Fully Per Share, Fully Common Equity Return on ($000s) Converted (3) Converted (3) ($000s) Common Equity GAAP Net Income (Loss) ( $ 22 , 507 ) 89 , 850 , 47 8 ( $ 0 . 30 ) $ 1 , 519 , 56 9 ( 7 . 2 % ) Run - Rate Distributable Earnings (1) $40,145 89 , 850 , 47 8 $ 0 . 3 9 $ 1 , 519 , 56 9 9 . 3 % Distributable Earnings (1) $12,116 89 , 850 , 47 8 $ 0 . 0 8 $ 1 , 519 , 56 9 1 . 9 % GAAP Net Income (Loss): Core (2) 22,804 76 , 451 , 61 2 $ 0 . 3 0 1 , 292 , 96 5 7 . 1 % Securities ( 45 , 311 ) 13 , 398 , 86 7 ( $ 3 . 74 ) 226 , 60 4 ( 88 . 5 % ) Total ( $ 22 , 5 07 ) 89 , 8 50 , 4 7 8 ( $ 0 . 3 0 ) $ 1 , 5 19 , 5 6 9 ( 7 . 2 % ) Run - Rate Distributable Earnings: (1) Core (2) 27,485 76 , 451 , 61 2 $ 0 . 3 6 1 , 292 , 96 5 8 . 5 % Securities 12,660 13 , 398 , 86 7 $ 0 . 5 8 226 , 60 4 13 . 8 % Total $40,145 89 , 8 50 , 4 7 8 $ 0 . 3 9 $ 1 , 5 19 , 5 6 9 9 . 3 % Distributable Earnings: (1) Core (2) 27,485 76 , 451 , 61 2 $ 0 . 3 6 1 , 292 , 96 5 8 . 5 % Securities ( 15 , 368 ) 13 , 398 , 86 7 ( $ 1 . 51 ) 226 , 60 4 ( 35 . 7 % ) Total $12,116 89 , 8 50 , 4 7 8 $ 0 . 0 8 $ 1 , 5 19 , 5 6 9 1 . 9 % Weighted Average Shares E ar n i n g s Daily Average

Appendix: GAAP Net Income to Distributable Earnings Reconciliation 22 Note: All numbers in millions except share and per share data. 1. Represents transaction costs associated with the merger with CMO on October 19, 2021. 2. Adjusted for non - cash CLO amortization acceleration to effectively amortize issuance costs of our CLOs over the expected lifetime of the CLOs. We assume our CLOs will be outstanding for four years and amortized the financing costs over four years in our distributable earnings as compared to effective yield methodology in our GAAP earnings 3. Adjusted for unrealized gain and loss on loans, derivatives and ARMs securities. 4. Represents costs related to loan workouts where they are either viewed as one - time and non - recurring or we expect such costs may be recuperated in the future. 5. Equal to Distributable Earnings excluding the realized trading and derivatives gain/loss on ARMs. 6. Distributable Earnings to common is net of preferred equity E class dividend payment. 7. Represents the average of all equity except the preferred equity E class. 8. Assumes conversion of our RSUs and Series C, Series D and Series F preferred shares to common shares. 9. Calculated as GAAP net income less preferred dividend on preferred equity E class or Distributable Earnings to Common divided by fully converted weighted average shares outstanding. 2Q'21 3Q'21 4Q'21 1Q'22 GAAP Net Income (Loss) 30 .0 38 .5 ( 72 . 9 ) ( 22 . 5 ) Adjustments: Impairment of Acquired Assets (1) - - 88 . 3 - CLO Amortization Acceleration/CLO Call (2) ( 0 . 8 ) ( 0 . 9 ) 2 . 7 ( 1 . 0 ) Unrealized (Gain)/Loss Reversal (3) 2 . 5 ( 0 . 3 ) 13 . 2 33 . 4 Incentive Fees 2 . 1 4 . 3 1 . 8 - Depreciation & Amortization 0 . 4 - 1 . 3 1 . 3 (Reversal of) / Provision for Credit Loss ( 1 . 5 ) ( 1 . 6 ) 0 . 3 ( 1 . 0 ) Loan Workout Charges (4) - - - 1 . 9 Realized trading and derivatives gain/loss on ARMs - - 13 . 6 28 . 0 Run - Rate Distributable Earnings (5) 32 .7 40 .0 48 .2 40 .1 Realized trading and derivatives gain/loss on ARMs - - (13.6) (28.0) Distributable Earnings 32.7 40.0 34.6 12.1 Preferred Equity E Class Dividend - - (4.8) (4.8) Distributable Earnings to Common (6) 32 .7 40 .0 29 .7 7 .3 Average Equity (7) 1 , 047 . 1 1,063.4 1,451.2 1 , 519 . 6 GAAP Net Income (Loss) ROE 11 . 5 % 14 . 5 % ( 2 1 . 4 % ) ( 7 . 2 % ) Run - Rate Distributable Earnings ROE 12 . 5 % 15 . 0 % 11.9% 9 . 3 % Distributable Earnings ROE 12 . 5 % 15 . 0 % 8 . 2 % 1 . 9 % Fully Converted Weighted Average Shares Outstanding (8) 57 , 703 , 65 5 57 , 625 , 19 2 83 , 251 , 03 4 89 , 850 , 47 8 GAAP Earnings Per Share, Fully Converted (9) $ 0 . 5 2 $ 0 . 6 7 ( $ 0 . 93 ) ( $ 0 . 30 ) Run - Rate Distributable Earnings Per Share, Fully Converted (9) $ 0 . 5 7 $ 0 . 6 9 $0.52 $ 0 . 3 9 Distributable Earnings Per Share, Fully Converted (9) $ 0 . 5 7 $ 0 . 6 9 $0.36 $ 0 . 0 8
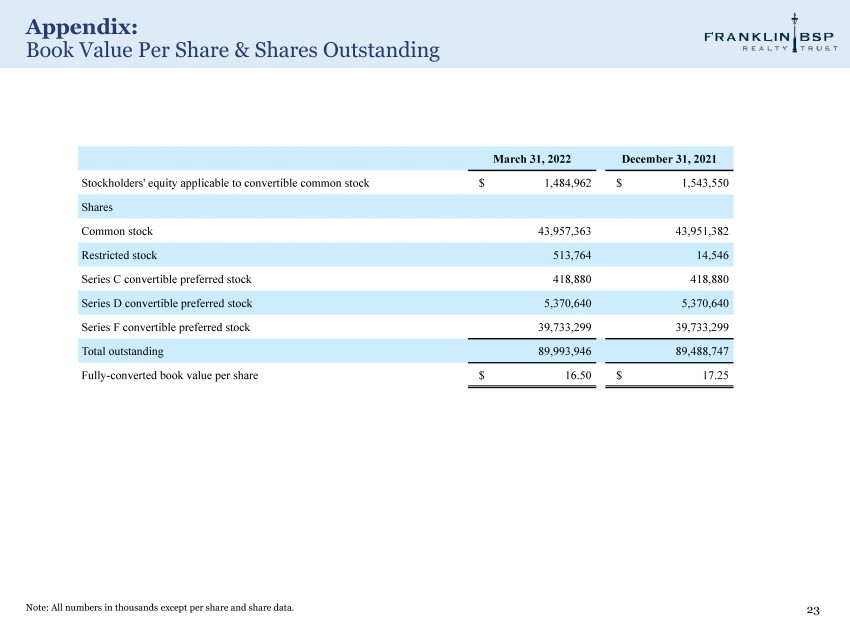
Appendix: Book Value Per Share & Shares Outstanding 23 Note: All numbers in thousands except per share and share data. March 31, 2022 December 31, 2021 Stockholders' equity applicable to convertible common stock $ 1,4 8 4,9 6 2 $ 1,5 4 3,5 5 0 Shares Common stock 4 3 ,957,363 4 3 ,951,382 Restricted stock 5 1 3,764 1 4 ,546 Series C convertible preferred stock 4 1 8,880 4 1 8,880 Series D convertible preferred stock 5,3 7 0,6 4 0 5,3 7 0,6 4 0 Series F convertible preferred stock 3 9 ,733,299 3 9 ,733,299 Total outstanding 8 9 ,993,946 8 9 ,488,747 Fully - converted book value per share $ 1 6 .50 $ 1 7 .25

Appendix: FBRT Income Statement 24 Note: All numbers in thousands except per share and share data. Three Months Ended March 31, 2022 2021 Income: Interest income $ 75,258 $ 42,237 Less: Interest expense 22,480 11,369 Net interest income 52,778 30,868 Revenue from real estate owned 2,312 716 Total income $ 55,090 $ 31,584 Expenses: Asset management and subordinated performance fee 6,745 5,416 Acquisition expenses 315 153 Administrative services expenses 3,353 3,474 Professional fees 6,659 1,997 Depreciation and amortization 1,295 406 Other expenses 1,762 495 Total expenses $ 20,129 $ 11,941 Other (income)/loss: Provision/(benefit) for credit losses (955) (2,331) Realized (gain)/loss on sale of real estate securities — 1,060 Realized (gain)/loss on sale of commercial mortgage loans, held for sale, measured at fair value (1,889) (6,630) Realized (gain)/loss on other real estate investments, measured at fair value 33 — Unrealized (gain)/loss on commercial mortgage loans, held for sale, measured at fair value 939 (479) Unrealized (gain)/loss on other real estate investments, measured at fair value (4) (6) Trading (gain)/loss 88,435 — Unrealized (gain)/loss on derivatives 4,963 (2,109) Realized (gain)/loss on derivatives (34,030) (1,978) Total other (income)/loss $ 57,492 $ (12,473) Income before taxes (22,531) 32,116 Provision/(benefit) for income tax (24) 1,970 Net income/(loss) $ (22,507) $ 30,146 Net income/(loss) applicable to common stock $ (43,518) $ 23,408 Basic earnings per share $ (0.99) $ 0.53 Diluted earnings per share $ (0.99) $ 0.53 Basic weighted average shares outstanding 43,956,965 44,290,177 Diluted weighted average shares outstanding 43,956,965 44,306,065
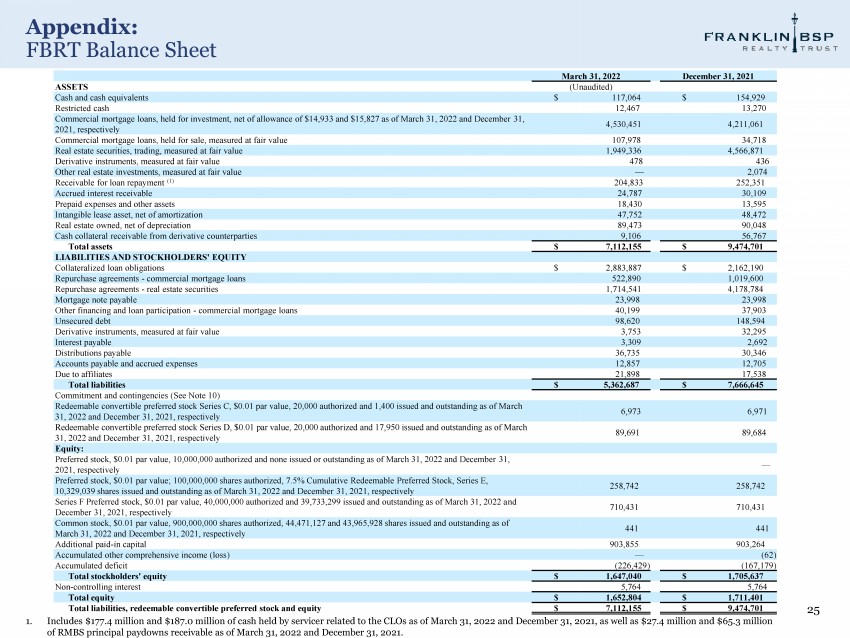
Appendix: FBRT Balance Sheet 25 1. Includes $177.4 million and $187.0 million of cash held by servicer related to the CLOs as of March 31, 2022 and December 31, 2021, as well as $27.4 million and $65.3 million of RMBS principal paydowns receivable as of March 31, 2022 and December 31, 2021. March 31, 2022 December 31, 2021 ASSETS (Unaudited) Cash and cash equivalents $ 117,064 $ 154,929 Restricted cash 12,467 13,270 Commercial mortgage loans, held for investment, net of allowance of $14,933 and $15,827 as of March 31, 2022 and December 31, 2021, respectively 4,530,451 4,211,061 Commercial mortgage loans, held for sale, measured at fair value 107,978 34,718 Real estate securities, trading, measured at fair value 1,949,336 4,566,871 Derivative instruments, measured at fair value 478 436 Other real estate investments, measured at fair value — 2,074 Receivable for loan repayment (1) 204,833 252,351 Accrued interest receivable 24,787 30,109 Prepaid expenses and other assets 18,430 13,595 Intangible lease asset, net of amortization 47,752 48,472 Real estate owned, net of depreciation 89,473 90,048 Cash collateral receivable from derivative counterparties 9,106 56,767 Total assets $ 7,112,155 $ 9,474,701 LIABILITIES AND STOCKHOLDERS' EQUITY Collateralized loan obligations $ 2,883,887 $ 2,162,190 Repurchase agreements - commercial mortgage loans 522,890 1,019,600 Repurchase agreements - real estate securities 1,714,541 4,178,784 Mortgage note payable 23,998 23,998 Other financing and loan participation - commercial mortgage loans 40,199 37,903 Unsecured debt 98,620 148,594 Derivative instruments, measured at fair value 3,753 32,295 Interest payable 3,309 2,692 Distributions payable 36,735 30,346 Accounts payable and accrued expenses 12,857 12,705 Due to affiliates 21,898 17,538 Total liabilities $ 5,362,687 $ 7,666,645 Commitment and contingencies (See Note 10) Redeemable convertible preferred stock Series C, $0.01 par value, 20,000 authorized and 1,400 issued and outstanding as of March 31, 2022 and December 31, 2021, respectively 6,973 6,971 Redeemable convertible preferred stock Series D, $0.01 par value, 20,000 authorized and 17,950 issued and outstanding as of March 31, 2022 and December 31, 2021, respectively 89,691 89,684 Equity: Preferred stock, $0.01 par value, 10,000,000 authorized and none issued or outstanding as of March 31, 2022 and December 31, 2021, respectively — Preferred stock, $0.01 par value; 100,000,000 shares authorized, 7.5% Cumulative Redeemable Preferred Stock, Series E, 10,329,039 shares issued and outstanding as of March 31, 2022 and December 31, 2021, respectively 258,742 258,742 Series F Preferred stock, $0.01 par value, 40,000,000 authorized and 39,733,299 issued and outstanding as of March 31, 2022 and December 31, 2021, respectively 710,431 710,431 Common stock, $0.01 par value, 900,000,000 shares authorized, 44,471,127 and 43,965,928 shares issued and outstanding as of March 31, 2022 and December 31, 2021, respectively 441 441 Additional paid - in capital 903,855 903,264 Accumulated other comprehensive income (loss) — (62) Accumulated deficit (226,429) (167,179) Total stockholders' equity $ 1,647,040 $ 1,705,637 Non - controlling interest 5,764 5,764 Total equity $ 1,652,804 $ 1,711,401 Total liabilities, redeemable convertible preferred stock and equity $ 7,112,155 $ 9,474,701