UNITED STATES
SECURITIES AND EXCHANGE COMMISSION
Washington, D.C. 20549
FORM N-CSR
CERTIFIED SHAREHOLDER REPORT OF REGISTERED
MANAGEMENT INVESTMENT COMPANIES
Investment Company Act file number 811-22796
Fidelity Merrimack Street Trust
(Exact name of registrant as specified in charter)
245 Summer St., Boston, Massachusetts 02210
(Address of principal executive offices) (Zip code)
Margaret Carey, Secretary
245 Summer St.
Boston, Massachusetts 02210
(Name and address of agent for service)
Registrant's telephone number, including area code:
617-563-7000
Date of fiscal year end: | August 31 |
Date of reporting period: | August 31, 2023 |
Item 1.
Reports to Stockholders


Contents
| Average Annual Total Returns | |||
Periods ended August 31, 2023 | Past 1 year | Life of Fund |
Fidelity® Sustainable Core Plus Bond ETF - NAV A | -0.09% | -2.06% |
Fidelity® Sustainable Core Plus Bond ETF - Market Price B | -0.18% | -2.05% |
Bloomberg U.S. Aggregate Bond Index A | -1.19% | -1.98% |
Bloomberg MSCI U.S. Aggregate ESG Choice Bond Index A | -1.16% | -1.93% |
| $10,000 Over Life of Fund |
Let's say hypothetically that $10,000 was invested in Fidelity® Sustainable Core Plus Bond ETF - NAV, on April 19, 2022, when the fund started. The chart shows how the value of your investment would have changed, and also shows how the Bloomberg U.S. Aggregate Bond Index performed over the same period. |
 |
Quality Diversification (% of Fund's net assets) |
 |
Short-Term Investments and Net Other Assets (Liabilities) - (3.8)%* |
| We have used ratings from Moody's Investors Service, Inc. Where Moody's® ratings are not available, we have used S&P® ratings. All ratings are as of the date indicated and do not reflect subsequent changes. |
Asset Allocation (% of Fund's net assets) |
 |
Short-Term Investments and Net Other Assets (Liabilities) - (3.8)% |
Futures - 2.5% |
Forward foreign currency contracts - (4.5)% |
Percentages in the above tables are adjusted for the effect of TBA Sale Commitments. |
Geographic Diversification (% of Fund's net assets) |
 |
* Includes Short-Term investments and Net Other Assets (Liabilities). Percentages are adjusted for the effect of derivatives, if applicable. |
| Corporate Bonds - 42.2% | |||
Principal Amount (a) | Value ($) | ||
| Convertible Bonds - 0.2% | |||
| COMMUNICATION SERVICES - 0.1% | |||
| Media - 0.1% | |||
| DISH Network Corp.: | |||
| 2.375% 3/15/24 | 3,000 | 2,835 | |
| 3.375% 8/15/26 | 16,000 | 9,680 | |
| 12,515 | |||
| CONSUMER DISCRETIONARY - 0.0% | |||
| Specialty Retail - 0.0% | |||
| Wayfair LLC 0.625% 10/1/25 | 2,000 | 1,735 | |
| INFORMATION TECHNOLOGY - 0.0% | |||
| Software - 0.0% | |||
| MicroStrategy, Inc. 0% 2/15/27 | 2,000 | 1,378 | |
| REAL ESTATE - 0.1% | |||
| Real Estate Management & Development - 0.1% | |||
| Redfin Corp. 0.5% 4/1/27 | 8,000 | 5,080 | |
| TOTAL CONVERTIBLE BONDS | 20,708 | ||
| Nonconvertible Bonds - 42.0% | |||
| COMMUNICATION SERVICES - 3.6% | |||
| Diversified Telecommunication Services - 1.4% | |||
| Altice France SA 5.125% 7/15/29 (b) | 5,000 | 3,534 | |
| C&W Senior Financing Designated Activity Co. 6.875% 9/15/27 (b) | 5,000 | 4,600 | |
| Frontier Communications Holdings LLC 8.75% 5/15/30 (b) | 5,000 | 4,860 | |
| Level 3 Financing, Inc. 3.75% 7/15/29 (b) | 13,000 | 7,755 | |
| TELUS Corp. 3.4% 5/13/32 | 45,000 | 37,891 | |
| Verizon Communications, Inc. 5.05% 5/9/33 | 95,000 | 92,180 | |
| Virgin Media Finance PLC 5% 7/15/30 (b) | 4,000 | 3,245 | |
| Zayo Group Holdings, Inc. 6.125% 3/1/28 (b) | 2,000 | 1,300 | |
| 155,365 | |||
| Entertainment - 0.4% | |||
| The Walt Disney Co. 2.65% 1/13/31 | 55,000 | 47,118 | |
| Media - 1.4% | |||
| Altice Financing SA 5.75% 8/15/29 (b) | 12,000 | 9,506 | |
| Altice France Holding SA 6% 2/15/28 (b) | 6,000 | 2,625 | |
| CCO Holdings LLC/CCO Holdings Capital Corp.: | |||
| 4.25% 1/15/34(b) | 5,000 | 3,829 | |
| 4.75% 3/1/30(b) | 3,000 | 2,579 | |
| 4.75% 2/1/32(b) | 15,000 | 12,413 | |
| Clear Channel Outdoor Holdings, Inc.: | |||
| 5.125% 8/15/27(b) | 1,000 | 896 | |
| 7.5% 6/1/29(b) | 1,000 | 745 | |
| 9% 9/15/28(b) | 5,000 | 5,025 | |
| DIRECTV Financing LLC / DIRECTV Financing Co-Obligor, Inc. 5.875% 8/15/27 (b) | 5,000 | 4,431 | |
| DISH DBS Corp. 5.75% 12/1/28 (b) | 1,000 | 776 | |
| DISH Network Corp. 11.75% 11/15/27 (b) | 3,000 | 3,044 | |
| Magallanes, Inc.: | |||
| 4.279% 3/15/32 | 54,000 | 47,652 | |
| 5.141% 3/15/52 | 56,000 | 44,638 | |
| Mcgraw-Hill Education, Inc. 8% 8/1/29 (b) | 3,000 | 2,671 | |
| Univision Communications, Inc.: | |||
| 5.125% 2/15/25(b) | 5,000 | 4,931 | |
| 7.375% 6/30/30(b) | 5,000 | 4,839 | |
| 8% 8/15/28(b) | 5,000 | 4,997 | |
| 155,597 | |||
| Wireless Telecommunication Services - 0.4% | |||
| Millicom International Cellular SA 4.5% 4/27/31 (b) | 9,000 | 7,068 | |
| Rogers Communications, Inc.: | |||
| 3.2% 3/15/27 | 25,000 | 23,111 | |
| 4.55% 3/15/52 | 25,000 | 19,371 | |
| 49,550 | |||
TOTAL COMMUNICATION SERVICES | 407,630 | ||
| CONSUMER DISCRETIONARY - 3.6% | |||
| Automobile Components - 0.1% | |||
| Hertz Corp. 4.625% 12/1/26 (b) | 6,000 | 5,432 | |
| Macquarie AirFinance Holdings 8.375% 5/1/28 (b) | 5,000 | 5,105 | |
| Patrick Industries, Inc. 4.75% 5/1/29 (b) | 4,000 | 3,420 | |
| PECF USS Intermediate Holding III Corp. 8% 11/15/29 (b) | 2,000 | 1,276 | |
| 15,233 | |||
| Automobiles - 0.3% | |||
| General Motors Co. 5.4% 10/15/29 | 20,000 | 19,335 | |
| Rivian Holdco & Rivian LLC & Rivian Automotive LLC 6 month U.S. LIBOR + 5.620% 10.9311% 10/15/26 (b)(c)(d) | 9,000 | 8,970 | |
| 28,305 | |||
| Broadline Retail - 0.0% | |||
| Macy's Retail Holdings LLC 5.875% 4/1/29 (b) | 2,000 | 1,808 | |
| Nordstrom, Inc. 4.375% 4/1/30 | 4,000 | 3,196 | |
| 5,004 | |||
| Diversified Consumer Services - 0.2% | |||
| GEMS MENASA Cayman Ltd. 7.125% 7/31/26 (b) | 8,000 | 7,754 | |
| Sotheby's 7.375% 10/15/27 (b) | 5,000 | 4,552 | |
| StoneMor, Inc. 8.5% 5/15/29 (b) | 3,000 | 2,504 | |
| WASH Multifamily Acquisition, Inc. 5.75% 4/15/26 (b) | 11,000 | 10,201 | |
| 25,011 | |||
| Hotels, Restaurants & Leisure - 0.7% | |||
| Aramark Services, Inc.: | |||
| 5% 4/1/25(b) | 5,000 | 4,939 | |
| 5% 2/1/28(b) | 2,000 | 1,866 | |
| Carnival Corp.: | |||
| 5.75% 3/1/27(b) | 1,000 | 939 | |
| 6% 5/1/29(b) | 15,000 | 13,577 | |
| Constellation Merger Sub, Inc. 8.5% 9/15/25 (b) | 4,000 | 3,340 | |
| Hilton Domestic Operating Co., Inc. 3.625% 2/15/32 (b) | 13,000 | 10,872 | |
| Life Time, Inc. 8% 4/15/26 (b) | 11,000 | 10,918 | |
| MajorDrive Holdings IV LLC 6.375% 6/1/29 (b) | 6,000 | 4,944 | |
| Royal Caribbean Cruises Ltd.: | |||
| 5.375% 7/15/27(b) | 3,000 | 2,823 | |
| 5.5% 4/1/28(b) | 12,000 | 11,230 | |
| Viking Cruises Ltd. 9.125% 7/15/31 (b) | 5,000 | 5,166 | |
| Yum! Brands, Inc. 4.625% 1/31/32 | 7,000 | 6,263 | |
| 76,877 | |||
| Household Durables - 0.1% | |||
| Tempur Sealy International, Inc. 4% 4/15/29 (b) | 8,000 | 6,872 | |
| TRI Pointe Homes, Inc. 5.25% 6/1/27 | 2,000 | 1,908 | |
| 8,780 | |||
| Specialty Retail - 1.8% | |||
| At Home Group, Inc. 4.875% 7/15/28 (b) | 4,000 | 1,924 | |
| Bath & Body Works, Inc.: | |||
| 6.75% 7/1/36 | 2,000 | 1,846 | |
| 6.95% 3/1/33 | 4,000 | 3,739 | |
| Carvana Co.: | |||
| 4.875% 9/1/29(b) | 7,000 | 4,178 | |
| 9% 12/1/28 pay-in-kind(b) | 1,000 | 860 | |
| 9% 6/1/30 pay-in-kind(b) | 1,000 | 860 | |
| 9% 6/1/31 pay-in-kind(b) | 2,000 | 1,720 | |
| LBM Acquisition LLC 6.25% 1/15/29 (b) | 5,000 | 4,363 | |
| Lowe's Companies, Inc.: | |||
| 3.75% 4/1/32 | 50,000 | 44,799 | |
| 4.25% 4/1/52 | 50,000 | 39,554 | |
| Michaels Companies, Inc. 5.25% 5/1/28 (b) | 12,000 | 10,005 | |
| The Home Depot, Inc. 3.25% 4/15/32 | 50,000 | 44,429 | |
| TJX Companies, Inc. 3.875% 4/15/30 | 40,000 | 37,733 | |
| Upbound Group, Inc. 6.375% 2/15/29 (b) | 7,000 | 6,360 | |
| Victoria's Secret & Co. 4.625% 7/15/29 (b) | 2,000 | 1,448 | |
| 203,818 | |||
| Textiles, Apparel & Luxury Goods - 0.4% | |||
| Crocs, Inc. 4.125% 8/15/31 (b) | 9,000 | 7,133 | |
| Tapestry, Inc. 3.05% 3/15/32 | 55,000 | 42,309 | |
| 49,442 | |||
TOTAL CONSUMER DISCRETIONARY | 412,470 | ||
| CONSUMER STAPLES - 1.4% | |||
| Beverages - 0.1% | |||
| Triton Water Holdings, Inc. 6.25% 4/1/29 (b) | 6,000 | 5,100 | |
| Consumer Staples Distribution & Retail - 0.4% | |||
| Albertsons Companies LLC/Safeway, Inc./New Albertson's, Inc./Albertson's LLC: | |||
| 3.25% 3/15/26(b) | 6,000 | 5,577 | |
| 4.875% 2/15/30(b) | 3,000 | 2,753 | |
| Alimentation Couche-Tard, Inc. 3.625% 5/13/51 (b) | 55,000 | 36,223 | |
| Performance Food Group, Inc. 4.25% 8/1/29 (b) | 3,000 | 2,640 | |
| U.S. Foods, Inc. 4.625% 6/1/30 (b) | 4,000 | 3,555 | |
| 50,748 | |||
| Food Products - 0.9% | |||
| Darling Ingredients, Inc. 6% 6/15/30 (b) | 5,000 | 4,887 | |
| General Mills, Inc. 2.25% 10/14/31 | 115,000 | 92,914 | |
| Post Holdings, Inc.: | |||
| 4.5% 9/15/31(b) | 5,000 | 4,307 | |
| 4.625% 4/15/30(b) | 3,000 | 2,658 | |
| TreeHouse Foods, Inc. 4% 9/1/28 | 4,000 | 3,424 | |
| 108,190 | |||
TOTAL CONSUMER STAPLES | 164,038 | ||
| ENERGY - 1.5% | |||
| Energy Equipment & Services - 0.2% | |||
| Archrock Partners LP / Archrock Partners Finance Corp. 6.25% 4/1/28 (b) | 6,000 | 5,728 | |
| CGG SA 8.75% 4/1/27 (b) | 9,000 | 7,745 | |
| Oceaneering International, Inc. 6% 2/1/28 | 6,000 | 5,640 | |
| Transocean Titan Finance Ltd. 8.375% 2/1/28 (b) | 2,000 | 2,055 | |
| Transocean, Inc.: | |||
| 8% 2/1/27(b) | 1,000 | 976 | |
| 8.75% 2/15/30(b) | 4,750 | 4,859 | |
| 27,003 | |||
| Oil, Gas & Consumable Fuels - 1.3% | |||
| California Resources Corp. 7.125% 2/1/26 (b) | 13,000 | 13,033 | |
| Centennial Resource Production LLC 5.875% 7/1/29 (b) | 4,000 | 3,840 | |
| CNX Resources Corp.: | |||
| 6% 1/15/29(b) | 2,000 | 1,905 | |
| 7.375% 1/15/31(b) | 5,000 | 4,991 | |
| Crestwood Midstream Partners LP/Crestwood Midstream Finance Corp. 6% 2/1/29 (b) | 10,000 | 9,817 | |
| CVR Energy, Inc. 5.75% 2/15/28 (b) | 3,000 | 2,731 | |
| EG Global Finance PLC 6.75% 2/7/25 (b) | 13,000 | 12,809 | |
| Energean PLC 6.5% 4/30/27 (b) | 5,000 | 4,561 | |
| Global Partners LP/GLP Finance Corp. 6.875% 1/15/29 | 4,000 | 3,780 | |
| Holly Energy Partners LP/Holly Energy Finance Corp. 5% 2/1/28 (b) | 5,000 | 4,690 | |
| MEG Energy Corp. 5.875% 2/1/29 (b) | 15,000 | 14,330 | |
| Murphy Oil Corp. 6.375% 7/15/28 | 3,000 | 2,998 | |
| Murphy Oil U.S.A., Inc. 3.75% 2/15/31 (b) | 3,000 | 2,524 | |
| New Fortress Energy, Inc. 6.5% 9/30/26 (b) | 24,000 | 22,309 | |
| Northern Oil & Gas, Inc. 8.125% 3/1/28 (b) | 4,000 | 4,010 | |
| Parkland Corp. 4.625% 5/1/30 (b) | 3,000 | 2,645 | |
| SM Energy Co. 6.5% 7/15/28 | 4,000 | 3,910 | |
| Southwestern Energy Co. 5.375% 3/15/30 | 3,000 | 2,809 | |
| Sunoco LP/Sunoco Finance Corp. 4.5% 5/15/29 | 12,000 | 10,852 | |
| Tallgrass Energy Partners LP / Tallgrass Energy Finance Corp.: | |||
| 6% 3/1/27(b) | 5,000 | 4,791 | |
| 7.5% 10/1/25(b) | 5,000 | 5,030 | |
| Teine Energy Ltd. 6.875% 4/15/29 (b) | 9,000 | 8,348 | |
| 146,713 | |||
TOTAL ENERGY | 173,716 | ||
| FINANCIALS - 10.9% | |||
| Banks - 6.2% | |||
| AIB Group PLC 2.875% 5/30/31 (Reg. S) (c) | EUR | 100,000 | 100,369 |
| Bank of America Corp.: | |||
| 2.456% 10/22/25(c) | 130,000 | 124,957 | |
| 2.687% 4/22/32(c) | 40,000 | 32,728 | |
| 5.015% 7/22/33(c) | 24,000 | 23,099 | |
| Citigroup, Inc. 2.014% 1/25/26 (c) | 130,000 | 122,983 | |
| JPMorgan Chase & Co.: | |||
| 0.768% 8/9/25(c) | 130,000 | 123,504 | |
| 2.963% 1/25/33(c) | 40,000 | 33,233 | |
| 4.912% 7/25/33(c) | 13,000 | 12,503 | |
| NatWest Group PLC 2.057% 11/9/28 (Reg. S) (c) | GBP | 100,000 | 106,390 |
| Santander Holdings U.S.A., Inc.: | |||
| 5.807% 9/9/26(c) | 15,000 | 14,860 | |
| 6.499% 3/9/29(c) | 10,000 | 9,943 | |
| Western Alliance Bancorp. 3% 6/15/31 (c) | 2,000 | 1,582 | |
| 706,151 | |||
| Capital Markets - 2.5% | |||
| Coinbase Global, Inc. 3.625% 10/1/31 (b) | 3,000 | 2,020 | |
| Goldman Sachs Group, Inc.: | |||
| 3.102% 2/24/33(c) | 19,000 | 15,803 | |
| 3.615% 3/15/28(c) | 70,000 | 65,451 | |
| Hightower Holding LLC 6.75% 4/15/29 (b) | 5,000 | 4,352 | |
| Morgan Stanley: | |||
| 0.864% 10/21/25(c) | 140,000 | 131,739 | |
| 4.889% 7/20/33(c) | 31,000 | 29,366 | |
| State Street Corp. 3.031% 11/1/34 (c) | 45,000 | 38,681 | |
| 287,412 | |||
| Consumer Finance - 0.5% | |||
| Ally Financial, Inc. 2.2% 11/2/28 | 55,000 | 44,368 | |
| Ford Motor Credit Co. LLC 4.687% 6/9/25 | 5,000 | 4,813 | |
| OneMain Finance Corp.: | |||
| 3.5% 1/15/27 | 3,000 | 2,611 | |
| 3.875% 9/15/28 | 13,000 | 10,660 | |
| 62,452 | |||
| Financial Services - 0.2% | |||
| Block, Inc. 3.5% 6/1/31 | 12,000 | 9,840 | |
| GGAM Finance Ltd.: | |||
| 7.75% 5/15/26(b) | 5,000 | 5,000 | |
| 8% 6/15/28(b) | 5,000 | 5,071 | |
| 19,911 | |||
| Insurance - 1.5% | |||
| Equitable Financial Life Global Funding 1.3% 7/12/26 (b) | 100,000 | 87,638 | |
| Marsh & McLennan Companies, Inc. 2.375% 12/15/31 | 110,000 | 89,428 | |
| 177,066 | |||
TOTAL FINANCIALS | 1,252,992 | ||
| HEALTH CARE - 3.6% | |||
| Biotechnology - 0.8% | |||
| Amgen, Inc. 3% 2/22/29 | 100,000 | 90,421 | |
| Emergent BioSolutions, Inc. 3.875% 8/15/28 (b) | 5,000 | 2,400 | |
| 92,821 | |||
| Health Care Providers & Services - 1.7% | |||
| Akumin Escrow, Inc. 7.5% 8/1/28 (b) | 4,000 | 2,650 | |
| Cano Health, Inc. 6.25% 10/1/28 (b) | 7,000 | 2,380 | |
| Cigna Group 3.4% 3/15/51 | 55,000 | 38,484 | |
| Community Health Systems, Inc.: | |||
| 4.75% 2/15/31(b) | 18,000 | 13,410 | |
| 5.25% 5/15/30(b) | 5,000 | 3,943 | |
| 6.875% 4/15/29(b) | 10,000 | 6,133 | |
| DaVita HealthCare Partners, Inc. 3.75% 2/15/31 (b) | 6,000 | 4,778 | |
| Encompass Health Corp. 4.625% 4/1/31 | 5,000 | 4,385 | |
| Horizon Pharma U.S.A., Inc. 5.5% 8/1/27 (b) | 4,000 | 4,085 | |
| Humana, Inc. 3.7% 3/23/29 | 70,000 | 64,809 | |
| Owens & Minor, Inc. 6.625% 4/1/30 (b) | 3,000 | 2,729 | |
| Pediatrix Medical Group, Inc. 5.375% 2/15/30 (b) | 12,000 | 10,943 | |
| RegionalCare Hospital Partners Holdings, Inc.: | |||
| 5.375% 1/15/29(b) | 6,000 | 4,148 | |
| 9.875% 8/15/30(b) | 5,000 | 4,938 | |
| RP Escrow Issuer LLC 5.25% 12/15/25 (b) | 2,000 | 1,540 | |
| Tenet Healthcare Corp. 6.125% 10/1/28 | 20,000 | 19,263 | |
| 188,618 | |||
| Health Care Technology - 0.0% | |||
| Athenahealth Group, Inc. 6.5% 2/15/30 (b) | 5,000 | 4,342 | |
| Life Sciences Tools & Services - 0.0% | |||
| Charles River Laboratories International, Inc. 3.75% 3/15/29 (b) | 2,000 | 1,765 | |
| Pharmaceuticals - 1.1% | |||
| AstraZeneca Finance LLC 1.75% 5/28/28 | 70,000 | 60,747 | |
| Bristol-Myers Squibb Co. 2.95% 3/15/32 | 25,000 | 21,669 | |
| Jazz Securities DAC 4.375% 1/15/29 (b) | 3,000 | 2,688 | |
| Organon & Co. / Organon Foreign Debt Co-Issuer BV 5.125% 4/30/31 (b) | 5,000 | 4,260 | |
| Zoetis, Inc. 2% 5/15/30 | 50,000 | 41,160 | |
| 130,524 | |||
TOTAL HEALTH CARE | 418,070 | ||
| INDUSTRIALS - 3.1% | |||
| Aerospace & Defense - 0.1% | |||
| Bombardier, Inc. 6% 2/15/28 (b) | 11,000 | 10,281 | |
| TransDigm, Inc. 4.875% 5/1/29 | 3,000 | 2,699 | |
| 12,980 | |||
| Air Freight & Logistics - 0.1% | |||
| Aercap Global Aviation Trust 6.5% 6/15/45 (b)(c) | 5,000 | 4,930 | |
| Rand Parent LLC 8.5% 2/15/30 (b) | 5,000 | 4,760 | |
| 9,690 | |||
| Building Products - 0.6% | |||
| Advanced Drain Systems, Inc. 6.375% 6/15/30 (b) | 1,000 | 985 | |
| Carrier Global Corp. 2.493% 2/15/27 | 70,000 | 63,591 | |
| Cornerstone Building Brands, Inc. 6.125% 1/15/29 (b) | 4,000 | 3,247 | |
| Oscar Acquisition Co. LLC / Oscar Finance, Inc. 9.5% 4/15/30 (b) | 1,000 | 936 | |
| 68,759 | |||
| Commercial Services & Supplies - 0.4% | |||
| APX Group, Inc. 5.75% 7/15/29 (b) | 6,000 | 5,169 | |
| Brand Energy & Infrastructure Services, Inc. 10.375% 8/1/30 (b) | 5,000 | 5,156 | |
| Covanta Holding Corp. 4.875% 12/1/29 (b) | 14,000 | 12,040 | |
| Madison IAQ LLC 5.875% 6/30/29 (b) | 5,000 | 4,210 | |
| Neptune BidCo U.S., Inc. 9.29% 4/15/29 (b) | 5,000 | 4,669 | |
| Stericycle, Inc.: | |||
| 3.875% 1/15/29(b) | 12,000 | 10,448 | |
| 5.375% 7/15/24(b) | 7,000 | 6,975 | |
| �� | 48,667 | ||
| Construction & Engineering - 0.1% | |||
| AECOM 5.125% 3/15/27 | 6,000 | 5,757 | |
| Railworks Holdings LP 8.25% 11/15/28 (b) | 5,000 | 4,775 | |
| 10,532 | |||
| Electrical Equipment - 0.1% | |||
| Atkore, Inc. 4.25% 6/1/31 (b) | 4,000 | 3,440 | |
| Sensata Technologies BV: | |||
| 4% 4/15/29(b) | 4,000 | 3,512 | |
| 5% 10/1/25(b) | 5,000 | 4,873 | |
| 11,825 | |||
| Ground Transportation - 0.3% | |||
| Avis Budget Car Rental LLC/Avis Budget Finance, Inc.: | |||
| 5.375% 3/1/29(b) | 3,000 | 2,754 | |
| 5.75% 7/15/27(b) | 3,000 | 2,864 | |
| Uber Technologies, Inc.: | |||
| 4.5% 8/15/29(b) | 32,000 | 29,300 | |
| 8% 11/1/26(b) | 1,000 | 1,018 | |
| 35,936 | |||
| Industrial Conglomerates - 0.4% | |||
| Honeywell International, Inc. 1.75% 9/1/31 | 55,000 | 43,732 | |
| Machinery - 0.9% | |||
| Chart Industries, Inc. 9.5% 1/1/31 (b) | 2,000 | 2,153 | |
| Ingersoll-Rand Luxembourg Finance SA 3.8% 3/21/29 | 60,000 | 55,993 | |
| Otis Worldwide Corp. 2.565% 2/15/30 | 50,000 | 42,759 | |
| Vertical Holdco GmbH 7.625% 7/15/28 (b) | 2,000 | 1,853 | |
| 102,758 | |||
| Marine Transportation - 0.0% | |||
| Seaspan Corp. 5.5% 8/1/29 (b) | 5,000 | 3,886 | |
| Professional Services - 0.0% | |||
| Dun & Bradstreet Corp. 5% 12/15/29 (b) | 2,000 | 1,795 | |
| Trading Companies & Distributors - 0.1% | |||
| Beacon Roofing Supply, Inc. 6.5% 8/1/30 (b) | 5,000 | 4,939 | |
| Fortress Transportation & Infrastructure Investors LLC 5.5% 5/1/28 (b) | 6,000 | 5,573 | |
| 10,512 | |||
TOTAL INDUSTRIALS | 361,072 | ||
| INFORMATION TECHNOLOGY - 2.1% | |||
| Communications Equipment - 0.1% | |||
| CommScope, Inc. 4.75% 9/1/29 (b) | 8,000 | 5,945 | |
| HTA Group Ltd. 7% 12/18/25 (b) | 6,000 | 5,670 | |
| IHS Netherlands Holdco BV 8% 9/18/27 (b) | 2,000 | 1,787 | |
| 13,402 | |||
| Electronic Equipment, Instruments & Components - 0.4% | |||
| Dell International LLC/EMC Corp. 6.2% 7/15/30 | 45,000 | 46,310 | |
| TTM Technologies, Inc. 4% 3/1/29 (b) | 4,000 | 3,474 | |
| 49,784 | |||
| IT Services - 0.1% | |||
| Go Daddy Operating Co. LLC / GD Finance Co., Inc. 3.5% 3/1/29 (b) | 14,000 | 12,034 | |
| Rackspace Hosting, Inc. 3.5% 2/15/28 (b) | 2,000 | 949 | |
| Virtusa Corp. 7.125% 12/15/28 (b) | 6,000 | 4,913 | |
| 17,896 | |||
| Semiconductors & Semiconductor Equipment - 0.9% | |||
| Entegris Escrow Corp. 5.95% 6/15/30 (b) | 10,000 | 9,576 | |
| Entegris, Inc. 3.625% 5/1/29 (b) | 9,000 | 7,735 | |
| Micron Technology, Inc. 2.703% 4/15/32 | 55,000 | 43,405 | |
| NXP BV/NXP Funding LLC/NXP U.S.A., Inc. 2.5% 5/11/31 | 50,000 | 40,242 | |
| ON Semiconductor Corp. 3.875% 9/1/28 (b) | 1,000 | 890 | |
| 101,848 | |||
| Software - 0.5% | |||
| Black Knight InfoServ LLC 3.625% 9/1/28 (b) | 4,000 | 3,680 | |
| Cloud Software Group, Inc. 9% 9/30/29 (b) | 5,000 | 4,469 | |
| Elastic NV 4.125% 7/15/29 (b) | 9,000 | 7,737 | |
| Gen Digital, Inc.: | |||
| 5% 4/15/25(b) | 7,000 | 6,862 | |
| 7.125% 9/30/30(b) | 3,000 | 3,020 | |
| MicroStrategy, Inc. 6.125% 6/15/28 (b) | 2,000 | 1,790 | |
| NCR Corp.: | |||
| 5.125% 4/15/29(b) | 3,000 | 2,728 | |
| 6.125% 9/1/29(b) | 7,500 | 7,725 | |
| Open Text Corp.: | |||
| 3.875% 2/15/28(b) | 3,000 | 2,670 | |
| 3.875% 12/1/29(b) | 7,000 | 5,936 | |
| Open Text Holdings, Inc.: | |||
| 4.125% 2/15/30(b) | 5,000 | 4,309 | |
| 4.125% 12/1/31(b) | 2,000 | 1,660 | |
| 52,586 | |||
| Technology Hardware, Storage & Peripherals - 0.1% | |||
| Seagate HDD Cayman: | |||
| 4.125% 1/15/31 | 3,000 | 2,450 | |
| 5.75% 12/1/34 | 2,000 | 1,771 | |
| 8.25% 12/15/29(b) | 5,000 | 5,245 | |
| 9,466 | |||
TOTAL INFORMATION TECHNOLOGY | 244,982 | ||
| MATERIALS - 2.1% | |||
| Chemicals - 1.1% | |||
| Axalta Coating Systems LLC 3.375% 2/15/29 (b) | 3,000 | 2,544 | |
| International Flavors & Fragrances, Inc. 2.3% 11/1/30 (b) | 80,000 | 62,072 | |
| Kobe U.S. Midco 2, Inc. 9.25% 11/1/26 pay-in-kind (b)(c) | 3,000 | 2,190 | |
| Methanex Corp.: | |||
| 5.125% 10/15/27 | 5,000 | 4,690 | |
| 5.65% 12/1/44 | 15,000 | 12,269 | |
| NOVA Chemicals Corp.: | |||
| 4.25% 5/15/29(b) | 1,000 | 811 | |
| 4.875% 6/1/24(b) | 5,000 | 4,918 | |
| 5.25% 6/1/27(b) | 5,000 | 4,445 | |
| Nufarm Australia Ltd. 5% 1/27/30 (b) | 5,000 | 4,447 | |
| Olympus Water U.S. Holding Corp.: | |||
| 6.25% 10/1/29(b) | 9,000 | 7,246 | |
| 9.75% 11/15/28(b) | 2,000 | 2,015 | |
| SCIH Salt Holdings, Inc. 6.625% 5/1/29 (b) | 1,000 | 882 | |
| The Chemours Co. LLC 4.625% 11/15/29 (b) | 19,000 | 15,796 | |
| 124,325 | |||
| Construction Materials - 0.1% | |||
| Eco Material Technologies, Inc. 7.875% 1/31/27 (b) | 6,000 | 5,850 | |
| VM Consolidated, Inc. 5.5% 4/15/29 (b) | 2,000 | 1,823 | |
| 7,673 | |||
| Containers & Packaging - 0.3% | |||
| Ardagh Packaging Finance PLC/Ardagh MP Holdings U.S.A., Inc.: | |||
| 5.25% 8/15/27(b) | 5,000 | 4,254 | |
| 5.25% 8/15/27(b) | 7,000 | 5,955 | |
| Ball Corp. 6% 6/15/29 | 5,000 | 4,926 | |
| Berry Global, Inc. 5.625% 7/15/27 (b) | 10,000 | 9,802 | |
| Clydesdale Acquisition Holdings, Inc. 6.625% 4/15/29 (b) | 2,000 | 1,903 | |
| Crown Americas LLC/Crown Americas Capital Corp. IV 4.75% 2/1/26 | 5,000 | 4,821 | |
| Graphic Packaging International, Inc. 4.75% 7/15/27 (b) | 3,000 | 2,850 | |
| OI European Group BV 4.75% 2/15/30 (b) | 3,000 | 2,735 | |
| 37,246 | |||
| Metals & Mining - 0.5% | |||
| ATI, Inc.: | |||
| 4.875% 10/1/29 | 6,000 | 5,417 | |
| 7.25% 8/15/30 | 5,000 | 5,051 | |
| Coeur d'Alene Mines Corp. 5.125% 2/15/29 (b) | 3,000 | 2,630 | |
| Constellium NV 3.75% 4/15/29 (b) | 3,000 | 2,577 | |
| Eldorado Gold Corp. 6.25% 9/1/29 (b) | 5,000 | 4,262 | |
| ERO Copper Corp. 6.5% 2/15/30 (b) | 11,000 | 9,554 | |
| First Quantum Minerals Ltd. 6.875% 10/15/27 (b) | 5,000 | 4,832 | |
| FMG Resources Pty Ltd. 6.125% 4/15/32 (b) | 10,000 | 9,305 | |
| HudBay Minerals, Inc. 6.125% 4/1/29 (b) | 2,000 | 1,880 | |
| IAMGOLD Corp. 5.75% 10/15/28 (b) | 3,000 | 2,302 | |
| Infrabuild Australia Pty Ltd. 12% 10/1/24 (b) | 2,000 | 1,942 | |
| Mineral Resources Ltd. 8.5% 5/1/30 (b) | 12,000 | 12,043 | |
| 61,795 | |||
| Paper & Forest Products - 0.1% | |||
| Domtar Corp. 6.75% 10/1/28 (b) | 4,000 | 3,460 | |
| LABL, Inc. 10.5% 7/15/27 (b) | 2,000 | 1,914 | |
| Mercer International, Inc. 5.125% 2/1/29 | 9,000 | 7,363 | |
| 12,737 | |||
TOTAL MATERIALS | 243,776 | ||
| REAL ESTATE - 4.3% | |||
| Equity Real Estate Investment Trusts (REITs) - 3.0% | |||
| Alexandria Real Estate Equities, Inc. 2% 5/18/32 | 70,000 | 53,071 | |
| Boston Properties, Inc.: | |||
| 2.45% 10/1/33 | 75,000 | 53,094 | |
| 6.75% 12/1/27 | 8,000 | 8,171 | |
| Corporate Office Properties LP 2% 1/15/29 | 40,000 | 31,498 | |
| Hudson Pacific Properties LP 5.95% 2/15/28 | 54,000 | 45,663 | |
| MPT Operating Partnership LP/MPT Finance Corp.: | |||
| 4.625% 8/1/29 | 5,000 | 3,611 | |
| 5% 10/15/27 | 24,000 | 18,959 | |
| Omega Healthcare Investors, Inc. 3.25% 4/15/33 | 2,000 | 1,493 | |
| Prologis LP 2.875% 11/15/29 | 65,000 | 56,932 | |
| SBA Communications Corp. 3.125% 2/1/29 | 1,000 | 856 | |
| Uniti Group LP / Uniti Group Finance, Inc. 10.5% 2/15/28 (b) | 8,000 | 7,981 | |
| Uniti Group, Inc. 6% 1/15/30 (b) | 17,000 | 11,230 | |
| WP Carey, Inc. 2.45% 2/1/32 | 70,000 | 54,510 | |
| 347,069 | |||
| Real Estate Management & Development - 1.3% | |||
| Anywhere Real Estate Group LLC 7% 4/15/30 (b) | 800 | 721 | |
| CBRE Group, Inc. 2.5% 4/1/31 | 55,000 | 44,173 | |
| Greystar Real Estate Partners 7.75% 9/1/30 (b) | 5,000 | 5,050 | |
| Howard Hughes Corp. 4.375% 2/1/31 (b) | 10,000 | 7,970 | |
| Realogy Group LLC/Realogy Co.-Issuer Corp. 5.25% 4/15/30 (b) | 1,000 | 694 | |
| Taylor Morrison Communities, Inc./Monarch Communities, Inc. 5.125% 8/1/30 (b) | 7,000 | 6,420 | |
| Vonovia SE 0.625% 3/24/31 (Reg. S) | EUR | 100,000 | 78,375 |
| 143,403 | |||
TOTAL REAL ESTATE | 490,472 | ||
| UTILITIES - 5.8% | |||
| Electric Utilities - 2.2% | |||
| DPL, Inc. 4.35% 4/15/29 | 2,000 | 1,723 | |
| Duke Energy Carolinas LLC 3.95% 11/15/28 | 65,000 | 61,897 | |
| Northern States Power Co. 2.25% 4/1/31 | 80,000 | 66,195 | |
| Oncor Electric Delivery Co. LLC 4.15% 6/1/32 | 45,000 | 41,922 | |
| PG&E Corp.: | |||
| 5% 7/1/28 | 7,000 | 6,439 | |
| 5.25% 7/1/30 | 3,000 | 2,665 | |
| Wisconsin Electric Power Co. 4.75% 9/30/32 | 65,000 | 63,502 | |
| 244,343 | |||
| Independent Power and Renewable Electricity Producers - 1.2% | |||
| Atlantica Sustainable Infrastructure PLC 4.125% 6/15/28 (b) | 12,000 | 10,700 | |
| Sunnova Energy Corp. 5.875% 9/1/26 (b) | 10,000 | 8,800 | |
| TerraForm Power Operating LLC 4.75% 1/15/30 (b) | 4,000 | 3,428 | |
| The AES Corp.: | |||
| 1.375% 1/15/26 | 70,000 | 62,960 | |
| 2.45% 1/15/31 | 68,000 | 53,994 | |
| 139,882 | |||
| Multi-Utilities - 2.4% | |||
| Consolidated Edison Co. of New York, Inc. 3.35% 4/1/30 | 75,000 | 67,629 | |
| Dominion Energy, Inc. 2.25% 8/15/31 | 80,000 | 63,721 | |
| NiSource, Inc. 1.7% 2/15/31 | 120,000 | 92,684 | |
| Puget Energy, Inc. 4.224% 3/15/32 | 60,000 | 52,869 | |
| 276,903 | |||
TOTAL UTILITIES | 661,128 | ||
| TOTAL NONCONVERTIBLE BONDS | 4,830,346 | ||
| TOTAL CORPORATE BONDS (Cost $5,177,463) | 4,851,054 | ||
| U.S. Treasury Obligations - 29.2% | |||
Principal Amount (a) | Value ($) | ||
| U.S. Treasury Bonds: | |||
| 2.25% 5/15/41 (e) | 36,000 | 26,526 | |
| 2.25% 2/15/52 | 1,170,000 | 789,294 | |
| 3.375% 8/15/42 | 80,000 | 69,422 | |
| 3.625% 2/15/53 | 113,000 | 101,806 | |
| U.S. Treasury Notes: | |||
| 2.5% 4/30/24 | 350,000 | 343,396 | |
| 2.5% 3/31/27 | 50,000 | 46,852 | |
| 3.375% 5/15/33 | 375,000 | 353,262 | |
| 3.5% 1/31/30 | 50,000 | 47,963 | |
| 3.5% 2/15/33 | 715,000 | 680,926 | |
| 3.625% 3/31/28 | 260,000 | 252,748 | |
| 3.625% 3/31/30 | 460,000 | 444,331 | |
| 3.75% 5/31/30 | 100,000 | 97,301 | |
| 4.125% 7/31/28 | 100,000 | 99,414 | |
| TOTAL U.S. TREASURY OBLIGATIONS (Cost $3,665,169) | 3,353,241 | ||
| U.S. Government Agency - Mortgage Securities - 20.3% | |||
Principal Amount (a) | Value ($) | ||
| Fannie Mae - 3.0% | |||
| 2% 2/1/37 | 97,798 | 85,846 | |
| 2.5% 11/1/51 to 1/1/52 | 96,633 | 80,158 | |
| 3% 5/1/52 | 23,531 | 20,289 | |
| 3.5% 6/1/52 | 98,891 | 88,366 | |
| 4.5% 7/1/52 | 23,817 | 22,866 | |
| 5% 12/1/52 | 48,331 | 46,893 | |
TOTAL FANNIE MAE | 344,418 | ||
| Freddie Mac - 2.8% | |||
| 1.5% 4/1/51 | 48,733 | 36,783 | |
| 2% 11/1/51 | 172,640 | 137,753 | |
| 2.5% 12/1/51 | 48,295 | 40,042 | |
| 3% 5/1/35 to 5/1/51 | 71,693 | 65,023 | |
| 4.5% 12/1/52 | 49,001 | 46,478 | |
TOTAL FREDDIE MAC | 326,079 | ||
| Ginnie Mae - 3.9% | |||
| 2% 2/20/51 | 22,666 | 18,761 | |
| 2% 9/1/53 (f) | 50,000 | 41,250 | |
| 2% 9/1/53 (f) | 50,000 | 41,250 | |
| 2% 9/1/53 (f) | 50,000 | 41,250 | |
| 2% 10/1/53 (f) | 50,000 | 41,293 | |
| 2.5% 9/1/53 (f) | 50,000 | 42,559 | |
| 2.5% 9/1/53 (f) | 50,000 | 42,559 | |
| 3% 9/1/53 (f) | 50,000 | 43,965 | |
| 3% 9/1/53 (f) | 25,000 | 21,982 | |
| 3% 10/1/53 (f) | 50,000 | 43,994 | |
| 3.5% 9/1/53 (f) | 25,000 | 22,699 | |
| 3.5% 9/1/53 (f) | 25,000 | 22,699 | |
| 5% 9/1/53 (f) | 25,000 | 24,327 | |
TOTAL GINNIE MAE | 448,588 | ||
| Uniform Mortgage Backed Securities - 10.6% | |||
| 2% 9/1/38 (f) | 100,000 | 87,703 | |
| 2% 9/1/53 (f) | 50,000 | 39,803 | |
| 2% 9/1/53 (f) | 50,000 | 39,803 | |
| 2% 9/1/53 (f) | 100,000 | 79,606 | |
| 2% 9/1/53 (f) | 50,000 | 39,803 | |
| 2% 9/1/53 (f) | 50,000 | 39,803 | |
| 2% 9/1/53 (f) | 25,000 | 19,902 | |
| 2% 9/1/53 (f) | 25,000 | 19,902 | |
| 2% 9/1/53 (f) | 100,000 | 79,606 | |
| 2% 10/1/53 (f) | 100,000 | 79,720 | |
| 2% 10/1/53 (f) | 50,000 | 39,860 | |
| 2% 10/1/53 (f) | 50,000 | 39,860 | |
| 2% 10/1/53 (f) | 50,000 | 39,860 | |
| 2.5% 9/1/53 (f) | 100,000 | 82,879 | |
| 2.5% 9/1/53 (f) | 50,000 | 41,439 | |
| 2.5% 9/1/53 (f) | 50,000 | 41,439 | |
| 2.5% 9/1/53 (f) | 25,000 | 20,720 | |
| 2.5% 9/1/53 (f) | 50,000 | 41,439 | |
| 3% 9/1/53 (f) | 50,000 | 43,076 | |
| 3% 9/1/53 (f) | 100,000 | 86,152 | |
| 3% 9/1/53 (f) | 25,000 | 21,538 | |
| 4% 9/1/53 (f) | 75,000 | 69,234 | |
| 4% 9/1/53 (f) | 25,000 | 23,078 | |
| 4% 9/1/53 (f) | 25,000 | 23,078 | |
| 5.5% 9/1/53 (f) | 50,000 | 49,391 | |
| 5.5% 9/1/53 (f) | 25,000 | 24,695 | |
TOTAL UNIFORM MORTGAGE BACKED SECURITIES | 1,213,389 | ||
| TOTAL U.S. GOVERNMENT AGENCY - MORTGAGE SECURITIES (Cost $2,369,036) | 2,332,474 | ||
| Asset-Backed Securities - 8.8% | |||
Principal Amount (a) | Value ($) | ||
| Allegro CLO XV, Ltd. / Allegro CLO VX LLC Series 2022-1A Class A, CME Term SOFR 3 Month Index + 1.500% 6.8261% 7/20/35 (b)(c)(d) | 250,000 | 247,275 | |
| Cedar Funding Ltd. Series 2021-14A Class A, CME Term SOFR 3 Month Index + 1.360% 6.6696% 7/15/33 (b)(c)(d) | 250,000 | 248,367 | |
| CEDF Series 2021-6A Class ARR, CME Term SOFR 3 Month Index + 1.310% 6.6378% 4/20/34 (b)(c)(d) | 100,000 | 98,444 | |
| Planet Fitness Master Issuer LLC Series 2019-1A Class A2, 3.858% 12/5/49 (b) | 48,250 | 40,837 | |
| Symphony CLO XXVI Ltd. / Symphony CLO XXVI LLC Series 2021-26A Class AR, CME Term SOFR 3 Month Index + 1.340% 6.6678% 4/20/33 (b)(c)(d) | 320,000 | 318,062 | |
| Verizon Master Trust Series 2021-2 Class A, 0.99% 4/20/28 | 54,000 | 51,183 | |
| TOTAL ASSET-BACKED SECURITIES (Cost $1,011,286) | 1,004,168 | ||
| Commercial Mortgage Securities - 1.0% | |||
Principal Amount (a) | Value ($) | ||
BXHPP Trust floater Series 2021-FILM Class A, CME Term SOFR 1 Month Index + 0.760% 6.0745% 8/15/36 (b)(c)(d) (Cost $121,200) | 125,000 | 117,641 | |
| Foreign Government and Government Agency Obligations - 0.3% | |||
Principal Amount (a) | Value ($) | ||
German Federal Republic 4.75% 7/4/34 (Cost $37,624) | EUR | 28,000 | 36,792 |
| Common Stocks - 0.1% | |||
| Shares | Value ($) | ||
| CONSUMER DISCRETIONARY - 0.0% | |||
| Automobile Components - 0.0% | |||
| Aptiv PLC (g) | 12 | 1,217 | |
| ENERGY - 0.0% | |||
| Oil, Gas & Consumable Fuels - 0.0% | |||
| New Fortress Energy, Inc. | 57 | 1,769 | |
| HEALTH CARE - 0.0% | |||
| Health Care Providers & Services - 0.0% | |||
| Centene Corp. (g) | 29 | 1,788 | |
| INDUSTRIALS - 0.0% | |||
| Electrical Equipment - 0.0% | |||
| Regal Rexnord Corp. | 10 | 1,622 | |
| INFORMATION TECHNOLOGY - 0.1% | |||
| Electronic Equipment, Instruments & Components - 0.1% | |||
| Coherent Corp. (g) | 51 | 1,919 | |
| TOTAL COMMON STOCKS (Cost $8,937) | 8,315 | ||
| Bank Loan Obligations - 0.2% | |||
Principal Amount (a) | Value ($) | ||
| CONSUMER DISCRETIONARY - 0.1% | |||
| Hotels, Restaurants & Leisure - 0.1% | |||
| ClubCorp Holdings, Inc. Tranche B 1LN, term loan 3 month U.S. LIBOR + 2.750% 8.2879% 9/18/24 (c)(d)(h) | 4,987 | 4,915 | |
| INDUSTRIALS - 0.0% | |||
| Commercial Services & Supplies - 0.0% | |||
| Neptune BidCo U.S., Inc. Tranche B 1LN, term loan CME Term SOFR 1 Month Index + 5.000% 10.3985% 4/11/29 (c)(d)(h) | 4,988 | 4,537 | |
| INFORMATION TECHNOLOGY - 0.1% | |||
| Software - 0.1% | |||
| Ascend Learning LLC 2LN, term loan CME Term SOFR 1 Month Index + 5.750% 11.1811% 12/10/29 (c)(d)(h) | 2,000 | 1,706 | |
| Finastra U.S.A., Inc. Tranche 2LN, term loan 3 month U.S. LIBOR + 7.250% 12.981% 6/13/25 (c)(d)(h) | 3,000 | 2,996 | |
| Ultimate Software Group, Inc.: | |||
| 1LN, term loan 1 month U.S. LIBOR + 3.250% 8.6184% 5/3/26 (c)(d)(h) | 4,987 | 4,982 | |
| 2LN, term loan CME Term SOFR 3 Month Index + 5.250% 10.6184% 5/3/27 (c)(d)(h) | 1,000 | 993 | |
| 10,677 | |||
| TOTAL BANK LOAN OBLIGATIONS (Cost $19,324) | 20,129 | ||
| Preferred Securities - 1.7% | |||
Principal Amount (a) | Value ($) | ||
| COMMUNICATION SERVICES - 0.8% | |||
| Diversified Telecommunication Services - 0.8% | |||
| Telefonica Europe BV 2.502% (Reg. S) (c)(i) | EUR | 100,000 | 95,359 |
| CONSUMER STAPLES - 0.8% | |||
| Food Products - 0.8% | |||
| Danone SA 1% (Reg. S) (c)(i) | EUR | 100,000 | 95,381 |
| FINANCIALS - 0.1% | |||
| Consumer Finance - 0.1% | |||
| Ally Financial, Inc. 4.7% (c)(i) | 5,000 | 3,523 | |
| INDUSTRIALS - 0.0% | |||
| Trading Companies & Distributors - 0.0% | |||
| AerCap Holdings NV 5.875% 10/10/79 (c) | 3,000 | 2,966 | |
| TOTAL PREFERRED SECURITIES (Cost $202,286) | 197,229 | ||
| Money Market Funds - 9.7% | |||
| Shares | Value ($) | ||
Fidelity Cash Central Fund 5.43% (j) (Cost $1,117,825) | 1,117,601 | 1,117,825 | |
| TOTAL INVESTMENT IN SECURITIES - 113.5% (Cost $13,730,150) | 13,038,868 |
NET OTHER ASSETS (LIABILITIES) - (13.5)% | (1,547,723) |
| NET ASSETS - 100.0% | 11,491,145 |
| TBA Sale Commitments | ||
Principal Amount (a) | Value ($) | |
| Ginnie Mae | ||
| 2% 9/1/53 | (50,000) | (41,252) |
| 3% 9/1/53 | (50,000) | (43,965) |
| TOTAL GINNIE MAE | (85,217) | |
| Uniform Mortgage Backed Securities | ||
| 2% 9/1/38 | (50,000) | (43,851) |
| 2% 9/1/53 | (100,000) | (79,606) |
| 2% 9/1/53 | (50,000) | (39,803) |
| 2% 9/1/53 | (50,000) | (39,803) |
| 2% 9/1/53 | (100,000) | (79,606) |
| 2% 9/1/53 | (50,000) | (39,803) |
| TOTAL UNIFORM MORTGAGE BACKED SECURITIES | (322,472) | |
TOTAL TBA SALE COMMITMENTS (Proceeds $403,015) | (407,689) | |
| Futures Contracts | |||||
Number of contracts | Expiration Date | Notional Amount ($) | Value ($) | Unrealized Appreciation/ (Depreciation) ($) | |
| Purchased | |||||
| Treasury Contracts | |||||
| CBOT 2-Year U.S. Treasury Note Contracts (United States) | 1 | Dec 2023 | 203,805 | 592 | 592 |
| CBOT 5-Year U.S. Treasury Note Contracts (United States) | 2 | Dec 2023 | 213,844 | 1,481 | 1,481 |
| TOTAL PURCHASED | 2,073 | ||||
| Sold | |||||
| Bond Index Contracts | |||||
| Eurex Euro-Bobl Contracts (Germany) | 1 | Dec 2023 | 127,379 | (829) | (829) |
| TOTAL FUTURES CONTRACTS | 1,244 | ||||
| The notional amount of futures purchased as a percentage of Net Assets is 3.6% | |||||
| The notional amount of futures sold as a percentage of Net Assets is 1.1% | |||||
| Forward Foreign Currency Contracts | ||||||
Currency Purchased | Currency Sold | Counterparty | Settlement Date | Unrealized Appreciation/ (Depreciation) ($) | ||
| EUR | 1,000 | USD | 1,127 | BNP Paribas S.A. | 9/15/23 | (42) |
| EUR | 1,000 | USD | 1,095 | BNP Paribas S.A. | 9/15/23 | (10) |
| EUR | 1,000 | USD | 1,089 | BNP Paribas S.A. | 9/15/23 | (4) |
| EUR | 2,000 | USD | 2,172 | Brown Brothers Harriman & Co | 9/15/23 | (2) |
| EUR | 1,000 | USD | 1,094 | Canadian Imperial Bk. of Comm. | 9/15/23 | (9) |
| EUR | 1,000 | USD | 1,082 | JPMorgan Chase Bank, N.A. | 9/15/23 | 3 |
| GBP | 1,000 | USD | 1,264 | BNP Paribas S.A. | 9/15/23 | 3 |
| USD | 1,117 | EUR | 1,000 | BNP Paribas S.A. | 9/15/23 | 33 |
| USD | 416,676 | EUR | 379,000 | Bank of America, N.A. | 9/15/23 | 5,510 |
| USD | 1,102 | EUR | 1,000 | Brown Brothers Harriman & Co | 9/15/23 | 17 |
| USD | 1,105 | EUR | 1,000 | Canadian Imperial Bk. of Comm. | 9/15/23 | 20 |
| USD | 1,086 | EUR | 1,000 | JPMorgan Chase Bank, N.A. | 9/15/23 | 1 |
| USD | 1,105 | EUR | 1,000 | JPMorgan Chase Bank, N.A. | 9/15/23 | 20 |
| USD | 2,190 | EUR | 2,000 | JPMorgan Chase Bank, N.A. | 9/15/23 | 20 |
| USD | 109,022 | GBP | 85,000 | BNP Paribas S.A. | 9/15/23 | 1,339 |
| USD | 1,311 | GBP | 1,000 | Bank of America, N.A. | 9/15/23 | 44 |
| USD | 1,270 | GBP | 1,000 | Brown Brothers Harriman & Co | 9/15/23 | 3 |
| TOTAL FORWARD FOREIGN CURRENCY CONTRACTS | 6,946 | |||||
| Unrealized Appreciation | 7,013 | |||||
| Unrealized Depreciation | (67) | |||||
| EUR | - | European Monetary Unit |
| GBP | - | British pound sterling |
| USD | - | U.S. dollar |
| (a) | Amount is stated in United States dollars unless otherwise noted. |
| (b) | Security exempt from registration under Rule 144A of the Securities Act of 1933. These securities may be resold in transactions exempt from registration, normally to qualified institutional buyers. At the end of the period, the value of these securities amounted to $2,245,872 or 19.5% of net assets. |
| (c) | Coupon rates for floating and adjustable rate securities reflect the rates in effect at period end. |
| (d) | Coupon is indexed to a floating interest rate which may be multiplied by a specified factor and/or subject to caps or floors. |
| (e) | Security or a portion of the security was pledged to cover margin requirements for futures contracts. At period end, the value of securities pledged amounted to $18,421. |
| (f) | Security or a portion of the security purchased on a delayed delivery or when-issued basis. |
| (g) | Non-income producing |
| (h) | Remaining maturities of bank loan obligations may be less than the stated maturities shown as a result of contractual or optional prepayments by the borrower. Such prepayments cannot be predicted with certainty. |
| (i) | Security is perpetual in nature with no stated maturity date. |
| (j) | Affiliated fund that is generally available only to investment companies and other accounts managed by Fidelity Investments. The rate quoted is the annualized seven-day yield of the fund at period end. A complete unaudited listing of the fund's holdings as of its most recent quarter end is available upon request. In addition, each Fidelity Central Fund's financial statements, which are not covered by the Fund's Report of Independent Registered Public Accounting Firm, are available on the SEC's website or upon request. |
| Affiliate | Value, beginning of period ($) | Purchases ($) | Sales Proceeds ($) | Dividend Income ($) | Realized Gain (loss) ($) | Change in Unrealized appreciation (depreciation) ($) | Value, end of period ($) | % ownership, end of period |
| Fidelity Cash Central Fund 5.43% | - | 3,499,196 | 2,381,371 | 70,576 | - | - | 1,117,825 | 0.0% |
| Total | - | 3,499,196 | 2,381,371 | 70,576 | - | - | 1,117,825 | |
| Valuation Inputs at Reporting Date: | ||||
| Description | Total ($) | Level 1 ($) | Level 2 ($) | Level 3 ($) |
Investments in Securities: | ||||
| Equities: | ||||
Consumer Discretionary | 1,217 | 1,217 | - | - |
Energy | 1,769 | 1,769 | - | - |
Health Care | 1,788 | 1,788 | - | - |
Industrials | 1,622 | 1,622 | - | - |
Information Technology | 1,919 | 1,919 | - | - |
| Corporate Bonds | 4,851,054 | - | 4,851,054 | - |
| U.S. Government and Government Agency Obligations | 3,353,241 | - | 3,353,241 | - |
| U.S. Government Agency - Mortgage Securities | 2,332,474 | - | 2,332,474 | - |
| Asset-Backed Securities | 1,004,168 | - | 1,004,168 | - |
| Commercial Mortgage Securities | 117,641 | - | 117,641 | - |
| Foreign Government and Government Agency Obligations | 36,792 | - | 36,792 | - |
| Bank Loan Obligations | 20,129 | - | 20,129 | - |
| Preferred Securities | 197,229 | - | 197,229 | - |
| Money Market Funds | 1,117,825 | 1,117,825 | - | - |
| Total Investments in Securities: | 13,038,868 | 1,126,140 | 11,912,728 | - |
Derivative Instruments: | ||||
| Assets | ||||
Futures Contracts | 2,073 | 2,073 | - | - |
Forward Foreign Currency Contracts | 7,013 | - | 7,013 | - |
| Total Assets | 9,086 | 2,073 | 7,013 | - |
| Liabilities | ||||
Futures Contracts | (829) | (829) | - | - |
Forward Foreign Currency Contracts | (67) | - | (67) | - |
| Total Liabilities | (896) | (829) | (67) | - |
| Total Derivative Instruments: | 8,190 | 1,244 | 6,946 | - |
Other Financial Instruments: | ||||
| TBA Sale Commitments | (407,689) | - | (407,689) | - |
| Total Other Financial Instruments: | (407,689) | - | (407,689) | - |
Primary Risk Exposure / Derivative Type | Value | |
| Asset ($) | Liability ($) | |
| Foreign Exchange Risk | ||
Forward Foreign Currency Contracts (a) | 7,013 | (67) |
| Total Foreign Exchange Risk | 7,013 | (67) |
| Interest Rate Risk | ||
Futures Contracts (b) | 2,073 | (829) |
| Total Interest Rate Risk | 2,073 | (829) |
| Total Value of Derivatives | 9,086 | (896) |
| Statement of Assets and Liabilities | ||||
| August 31, 2023 | ||||
| Assets | ||||
| Investment in securities, at value - See accompanying schedule: | ||||
Unaffiliated issuers (cost $12,612,325) | $ | 11,921,043 | ||
Fidelity Central Funds (cost $1,117,825) | 1,117,825 | |||
| Total Investment in Securities (cost $13,730,150) | $ | 13,038,868 | ||
| Cash | 54,397 | |||
| Foreign currency held at value (cost $4,191) | 4,158 | |||
| Receivable for TBA sale commitments | 403,015 | |||
| Unrealized appreciation on forward foreign currency contracts | 7,013 | |||
| Dividends receivable | 4 | |||
| Interest receivable | 88,650 | |||
| Distributions receivable from Fidelity Central Funds | 5,337 | |||
Total assets | 13,601,442 | |||
| Liabilities | ||||
| Payable for investments purchased | ||||
Regular delivery | $ | 5,664 | ||
Delayed delivery | 1,650,916 | |||
| TBA sale commitments, at value | 407,689 | |||
| Unrealized depreciation on forward foreign currency contracts | 67 | |||
| Distributions payable | 42,250 | |||
| Accrued management fee | 3,436 | |||
| Payable for daily variation margin on futures contracts | 200 | |||
| Other payables and accrued expenses | 75 | |||
| Total Liabilities | 2,110,297 | |||
| Net Assets | $ | 11,491,145 | ||
| Net Assets consist of: | ||||
| Paid in capital | $ | 12,505,494 | ||
| Total accumulated earnings (loss) | (1,014,349) | |||
| Net Assets | $ | 11,491,145 | ||
Net Asset Value, offering price and redemption price per share ($11,491,145 ÷ 250,000 shares) | $ | 45.96 | ||
| Statement of Operations | ||||
Year ended August 31, 2023 | ||||
| Investment Income | ||||
| Dividends | $ | 4,387 | ||
| Interest | 449,444 | |||
| Income from Fidelity Central Funds | 70,576 | |||
| Total Income | 524,407 | |||
| Expenses | ||||
| Management fee | $ | 42,023 | ||
| Independent trustees' fees and expenses | 42 | |||
| Miscellaneous | 76 | |||
| Total expenses before reductions | 42,141 | |||
| Expense reductions | (1,422) | |||
| Total expenses after reductions | 40,719 | |||
| Net Investment income (loss) | 483,688 | |||
| Realized and Unrealized Gain (Loss) | ||||
| Net realized gain (loss) on: | ||||
| Investment Securities: | ||||
| Unaffiliated issuers | (275,231) | |||
| Forward foreign currency contracts | (21,219) | |||
| Foreign currency transactions | 4,792 | |||
| Futures contracts | (16,621) | |||
| Total net realized gain (loss) | (308,279) | |||
| Change in net unrealized appreciation (depreciation) on: | ||||
| Investment Securities: | ||||
| Unaffiliated issuers | (184,466) | |||
| Forward foreign currency contracts | (4,867) | |||
| Assets and liabilities in foreign currencies | 305 | |||
| Futures contracts | 2,381 | |||
| TBA Sale commitments | (4,674) | |||
| Total change in net unrealized appreciation (depreciation) | (191,321) | |||
| Net gain (loss) | (499,600) | |||
| Net increase (decrease) in net assets resulting from operations | $ | (15,912) | ||
| Statement of Changes in Net Assets | ||||
Year ended August 31, 2023 | For the period April 19, 2022 (commencement of operations) through August 31, 2022 | |||
| Increase (Decrease) in Net Assets | ||||
| Operations | ||||
| Net investment income (loss) | $ | 483,688 | $ | 124,753 |
| Net realized gain (loss) | (308,279) | 26,876 | ||
| Change in net unrealized appreciation (depreciation) | (191,321) | (496,448) | ||
| Net increase (decrease) in net assets resulting from operations | (15,912) | (344,819) | ||
| Distributions to shareholders | (529,500) | (124,500) | ||
| Share transactions | ||||
| Proceeds from sales of shares | - | 12,505,876 | ||
Net increase (decrease) in net assets resulting from share transactions | - | 12,505,876 | ||
| Total increase (decrease) in net assets | (545,412) | 12,036,557 | ||
| Net Assets | ||||
| Beginning of period | 12,036,557 | - | ||
| End of period | $ | 11,491,145 | $ | 12,036,557 |
| Other Information | ||||
| Shares | ||||
| Sold | - | 250,000 | ||
| Net increase (decrease) | - | 250,000 | ||
| Fidelity® Sustainable Core Plus Bond ETF |
| Years ended August 31, | 2023 | 2022 A | ||
Selected Per-Share Data | ||||
| Net asset value, beginning of period | $ | 48.15 | $ | 50.00 |
| Income from Investment Operations | ||||
Net investment income (loss) B,C | 1.935 | .499 | ||
| Net realized and unrealized gain (loss) | (2.007) | (1.851) | ||
| Total from investment operations | (.072) | (1.352) | ||
| Distributions from net investment income | (2.089) | (.498) | ||
| Distributions from net realized gain | (.029) | - | ||
| Total distributions | (2.118) | (.498) | ||
| Net asset value, end of period | $ | 45.96 | $ | 48.15 |
Total Return D,E | (.09)% | (2.72)% | ||
Ratios to Average Net Assets C,F,G | ||||
| Expenses before reductions | .36% | .36% H | ||
| Expenses net of fee waivers, if any | .36% | .36% H | ||
| Expenses net of all reductions | .35% | .36% H | ||
| Net investment income (loss) | 4.14% | 2.77% H | ||
| Supplemental Data | ||||
| Net assets, end of period (000 omitted) | $ | 11,491 | $ | 12,037 |
Portfolio turnover rate I | 303% | 11% J |
| Average Annual Total Returns | |||
Periods ended August 31, 2023 | Past 1 year | Life of Fund |
Fidelity® Sustainable Low Duration Bond ETF - NAV A | 4.27% | 3.23% |
Fidelity® Sustainable Low Duration Bond ETF - Market Price B | 4.27% | 3.30% |
Bloomberg US Treasury Bill: 6-9 Months Index A | 3.11% | 2.20% |
| $10,000 Over Life of Fund |
Let's say hypothetically that $10,000 was invested in Fidelity® Sustainable Low Duration Bond ETF - NAV, on April 19, 2022, when the fund started. The chart shows how the value of your investment would have changed, and also shows how the Bloomberg US Treasury Bill: 6-9 Months Index performed over the same period. |
 |
Quality Diversification (% of Fund's net assets) |
 |
Percentages shown as 0.0% may reflect amounts less than 0.05%. |
| We have used ratings from Moody's Investors Service, Inc. Where Moody's® ratings are not available, we have used S&P® ratings. All ratings are as of the date indicated and do not reflect subsequent changes. |
Asset Allocation (% of Fund's net assets) |
 |
Geographic Diversification (% of Fund's net assets) |
 |
* Includes Short-Term investments and Net Other Assets (Liabilities). Percentages are adjusted for the effect of derivatives, if applicable. |
| Nonconvertible Bonds - 63.2% | |||
Principal Amount (a) | Value ($) | ||
| COMMUNICATION SERVICES - 2.7% | |||
| Diversified Telecommunication Services - 1.6% | |||
| AT&T, Inc.: | |||
| 0.9% 3/25/24 | 35,000 | 34,039 | |
| 5.539% 2/20/26 | 20,000 | 19,966 | |
| Verizon Communications, Inc. 0.75% 3/22/24 | 45,000 | 43,773 | |
| 97,778 | |||
| Media - 0.6% | |||
| Magallanes, Inc.: | |||
| 3.428% 3/15/24 | 25,000 | 24,647 | |
| 3.788% 3/15/25 | 16,000 | 15,483 | |
| 40,130 | |||
| Wireless Telecommunication Services - 0.5% | |||
| T-Mobile U.S.A., Inc. 3.5% 4/15/25 | 32,000 | 30,934 | |
TOTAL COMMUNICATION SERVICES | 168,842 | ||
| CONSUMER DISCRETIONARY - 3.9% | |||
| Automobiles - 2.2% | |||
| American Honda Finance Corp.: | |||
| 0.55% 7/12/24 | 20,000 | 19,160 | |
| 2.15% 9/10/24 | 26,000 | 25,102 | |
| General Motors Financial Co., Inc.: | |||
| U.S. Secured Overnight Fin. Rate (SOFR) Index + 0.620% 5.8684% 10/15/24 (b)(c) | 25,000 | 24,922 | |
| U.S. Secured Overnight Fin. Rate (SOFR) Index + 0.760% 5.9467% 3/8/24 (b)(c) | 50,000 | 49,995 | |
| 3.95% 4/13/24 | 20,000 | 19,738 | |
| 138,917 | |||
| Hotels, Restaurants & Leisure - 0.4% | |||
| Starbucks Corp. U.S. Secured Overnight Fin. Rate (SOFR) Averages Index + 0.420% 5.7275% 2/14/24 (b)(c) | 25,000 | 25,001 | |
| Specialty Retail - 1.3% | |||
| AutoZone, Inc. 3.625% 4/15/25 | 20,000 | 19,400 | |
| Lowe's Companies, Inc. 4% 4/15/25 | 36,000 | 35,181 | |
| The Home Depot, Inc. 3.75% 2/15/24 | 25,000 | 24,815 | |
| 79,396 | |||
TOTAL CONSUMER DISCRETIONARY | 243,314 | ||
| ENERGY - 2.3% | |||
| Oil, Gas & Consumable Fuels - 2.3% | |||
| Enbridge, Inc.: | |||
| 2.15% 2/16/24 | 35,000 | 34,419 | |
| 2.5% 1/15/25 | 20,000 | 19,158 | |
| 5.969% 3/8/26 | 16,000 | 16,012 | |
| Enterprise Products Operating LP 3.75% 2/15/25 | 16,000 | 15,566 | |
| MPLX LP 4.875% 12/1/24 | 25,000 | 24,675 | |
| The Williams Companies, Inc. 4.55% 6/24/24 | 35,000 | 34,624 | |
| 144,454 | |||
| FINANCIALS - 39.0% | |||
| Banks - 22.8% | |||
| Bank of America Corp.: | |||
| U.S. Secured Overnight Fin. Rate (SOFR) Index + 0.730% 6.0297% 10/24/24 (b)(c) | 50,000 | 50,001 | |
| 2.456% 10/22/25 (b) | 30,000 | 28,836 | |
| 3.366% 1/23/26 (b) | 33,000 | 31,825 | |
| 4.125% 1/22/24 | 50,000 | 49,679 | |
| Bank of Montreal: | |||
| U.S. Secured Overnight Fin. Rate (SOFR) Averages Index + 0.460% 5.6944% 1/10/25 (b)(c) | 40,000 | 39,873 | |
| 3.3% 2/5/24 | 50,000 | 49,451 | |
| 5.2% 12/12/24 | 45,000 | 44,747 | |
| Bank of Nova Scotia: | |||
| U.S. Secured Overnight Fin. Rate (SOFR) Index + 0.380% 5.6938% 7/31/24 (b)(c) | 50,000 | 49,914 | |
| 3.4% 2/11/24 | 50,000 | 49,446 | |
| 5.25% 12/6/24 | 45,000 | 44,753 | |
| Canadian Imperial Bank of Commerce: | |||
| 1% 10/18/24 | 20,000 | 18,968 | |
| 2.25% 1/28/25 | 33,000 | 31,451 | |
| 3.1% 4/2/24 | 50,000 | 49,212 | |
| Citigroup, Inc.: | |||
| 0.981% 5/1/25 (b) | 75,000 | 72,432 | |
| 3.106% 4/8/26 (b) | 33,000 | 31,581 | |
| 4.14% 5/24/25 (b) | 52,000 | 51,302 | |
| Fifth Third Bancorp 3.65% 1/25/24 | 25,000 | 24,764 | |
| JPMorgan Chase & Co.: | |||
| 0.563% 2/16/25 (b) | 75,000 | 73,120 | |
| 2.301% 10/15/25 (b) | 30,000 | 28,779 | |
| 4.023% 12/5/24 (b) | 50,000 | 49,739 | |
| PNC Financial Services Group, Inc. 3.5% 1/23/24 | 25,000 | 24,730 | |
| Royal Bank of Canada: | |||
| U.S. Secured Overnight Fin. Rate (SOFR) Averages Index + 0.340% 5.5671% 10/7/24 (b)(c) | 50,000 | 49,806 | |
| U.S. Secured Overnight Fin. Rate (SOFR) Averages Index + 0.360% 5.6738% 7/29/24 (b)(c) | 50,000 | 49,960 | |
| U.S. Secured Overnight Fin. Rate (SOFR) Averages Index + 0.450% 5.7456% 10/26/23 (b)(c) | 50,000 | 50,013 | |
| 5.66% 10/25/24 | 20,000 | 20,004 | |
| The Toronto-Dominion Bank: | |||
| U.S. Secured Overnight Fin. Rate (SOFR) Index + 0.350% 5.5347% 3/4/24 (b)(c) | 50,000 | 49,989 | |
| 1.45% 1/10/25 | 33,000 | 31,277 | |
| 2.35% 3/8/24 | 25,000 | 24,572 | |
| 4.285% 9/13/24 | 20,000 | 19,701 | |
| Truist Financial Corp.: | |||
| U.S. Secured Overnight Fin. Rate (SOFR) Index + 0.400% 5.5876% 6/9/25 (b)(c) | 25,000 | 24,375 | |
| 2.5% 8/1/24 | 36,000 | 34,837 | |
| 4% 5/1/25 | 32,000 | 30,992 | |
| U.S. Bancorp 2.4% 7/30/24 | 46,000 | 44,648 | |
| Wells Fargo & Co.: | |||
| 2.164% 2/11/26 (b) | 47,000 | 44,437 | |
| 3.75% 1/24/24 | 25,000 | 24,801 | |
| 3.908% 4/25/26 (b) | 32,000 | 30,937 | |
| 1,424,952 | |||
| Capital Markets - 8.1% | |||
| Bank of New York Mellon Corp. 2.1% 10/24/24 | 70,000 | 67,479 | |
| Goldman Sachs Group, Inc.: | |||
| U.S. Secured Overnight Fin. Rate (SOFR) Index + 1.390% 6.5836% 3/15/24 (b)(c) | 75,000 | 75,304 | |
| 1.757% 1/24/25 (b) | 50,000 | 49,073 | |
| 3.5% 1/23/25 | 20,000 | 19,367 | |
| Moody's Corp.: | |||
| 3.75% 3/24/25 | 20,000 | 19,464 | |
| 4.875% 2/15/24 | 21,000 | 21,000 | |
| Morgan Stanley: | |||
| 0.791% 1/22/25 (b) | 125,000 | 122,273 | |
| 3.62% 4/17/25 (b) | 45,000 | 44,311 | |
| NASDAQ, Inc. 5.65% 6/28/25 | 2,000 | 2,002 | |
| State Street Corp.: | |||
| 3.7% 11/20/23 | 50,000 | 49,796 | |
| 4.857% 1/26/26 (b) | 35,000 | 34,535 | |
| 504,604 | |||
| Consumer Finance - 4.8% | |||
| Ally Financial, Inc.: | |||
| 1.45% 10/2/23 | 25,000 | 24,874 | |
| 3.875% 5/21/24 | 25,000 | 24,512 | |
| American Express Co.: | |||
| U.S. Secured Overnight Fin. Rate (SOFR) Averages Index + 0.230% 5.5413% 11/3/23 (b)(c) | 50,000 | 49,980 | |
| 2.25% 3/4/25 | 10,000 | 9,508 | |
| 3% 10/30/24 | 26,000 | 25,240 | |
| Capital One Financial Corp.: | |||
| U.S. Secured Overnight Fin. Rate (SOFR) Index + 1.350% 6.6597% 5/9/25 (b)(c) | 15,000 | 14,965 | |
| 1.343% 12/6/24 (b) | 25,000 | 24,641 | |
| 3.9% 1/29/24 | 25,000 | 24,774 | |
| 4.166% 5/9/25 (b) | 20,000 | 19,623 | |
| Hyundai Capital America: | |||
| 2.65% 2/10/25 (d) | 32,000 | 30,590 | |
| 5.8% 6/26/25 (d) | 15,000 | 15,018 | |
| Toyota Motor Credit Corp.: | |||
| U.S. Secured Overnight Fin. Rate (SOFR) Averages Index + 0.650% 5.8632% 12/29/23 (b)(c) | 20,000 | 20,024 | |
| 0.5% 6/18/24 | 17,000 | 16,330 | |
| 300,079 | |||
| Financial Services - 1.5% | |||
| Athene Global Funding U.S. Secured Overnight Fin. Rate (SOFR) Averages Index + 0.700% 6.0029% 5/24/24 (b)(c)(d) | 40,000 | 39,708 | |
| Corebridge Financial, Inc. 3.5% 4/4/25 | 16,000 | 15,375 | |
| Jackson Financial, Inc. 1.125% 11/22/23 | 25,000 | 24,743 | |
| The Western Union Co. 2.85% 1/10/25 | 16,000 | 15,331 | |
| 95,157 | |||
| Insurance - 1.8% | |||
| American International Group, Inc. 4.125% 2/15/24 | 35,000 | 34,705 | |
| Equitable Financial Life Global Funding 1.1% 11/12/24 (d) | 33,000 | 31,145 | |
| Marsh & McLennan Companies, Inc. 3.875% 3/15/24 | 45,000 | 44,531 | |
| 110,381 | |||
TOTAL FINANCIALS | 2,435,173 | ||
| HEALTH CARE - 5.5% | |||
| Biotechnology - 1.7% | |||
| AbbVie, Inc.: | |||
| 3.75% 11/14/23 | 25,000 | 24,900 | |
| 3.8% 3/15/25 | 20,000 | 19,475 | |
| 3.85% 6/15/24 | 25,000 | 24,639 | |
| Amgen, Inc. 5.25% 3/2/25 | 35,000 | 34,851 | |
| 103,865 | |||
| Health Care Equipment & Supplies - 0.6% | |||
| Boston Scientific Corp.: | |||
| 1.9% 6/1/25 | 17,000 | 15,969 | |
| 3.45% 3/1/24 | 25,000 | 24,693 | |
| 40,662 | |||
| Health Care Providers & Services - 1.2% | |||
| Cigna Group 0.613% 3/15/24 | 35,000 | 34,050 | |
| CVS Health Corp.: | |||
| 2.625% 8/15/24 | 26,000 | 25,221 | |
| 4.1% 3/25/25 | 16,000 | 15,655 | |
| 74,926 | |||
| Pharmaceuticals - 2.0% | |||
| AstraZeneca Finance LLC 0.7% 5/28/24 | 35,000 | 33,791 | |
| Bayer U.S. Finance II LLC 3.375% 7/15/24 (d) | 35,000 | 34,234 | |
| Bristol-Myers Squibb Co. 2.9% 7/26/24 | 35,000 | 34,203 | |
| Shire Acquisitions Investments Ireland DAC 2.875% 9/23/23 | 25,000 | 24,954 | |
| 127,182 | |||
TOTAL HEALTH CARE | 346,635 | ||
| INDUSTRIALS - 1.4% | |||
| Machinery - 1.2% | |||
| Caterpillar Financial Services Corp. U.S. Secured Overnight Fin. Rate (SOFR) Index + 0.270% 5.4595% 9/13/24 (b)(c) | 75,000 | 74,939 | |
| Trading Companies & Distributors - 0.2% | |||
| Air Lease Corp. 0.7% 2/15/24 | 16,000 | 15,614 | |
TOTAL INDUSTRIALS | 90,553 | ||
| INFORMATION TECHNOLOGY - 3.3% | |||
| Electronic Equipment, Instruments & Components - 0.5% | |||
| Dell International LLC/EMC Corp. 4% 7/15/24 | 35,000 | 34,465 | |
| Semiconductors & Semiconductor Equipment - 1.1% | |||
| Analog Devices, Inc. U.S. Secured Overnight Fin. Rate (SOFR) Index + 0.250% 5.4668% 10/1/24 (b)(c) | 50,000 | 49,973 | |
| NXP BV/NXP Funding LLC/NXP U.S.A., Inc. 2.7% 5/1/25 | 17,000 | 16,177 | |
| 66,150 | |||
| Software - 1.7% | |||
| Oracle Corp. 2.95% 11/15/24 | 46,000 | 44,546 | |
| Roper Technologies, Inc.: | |||
| 2.35% 9/15/24 | 25,000 | 24,155 | |
| 3.65% 9/15/23 | 35,000 | 34,978 | |
| 103,679 | |||
TOTAL INFORMATION TECHNOLOGY | 204,294 | ||
| MATERIALS - 0.4% | |||
| Chemicals - 0.4% | |||
| The Mosaic Co. 4.25% 11/15/23 | 25,000 | 24,918 | |
| UTILITIES - 4.7% | |||
| Electric Utilities - 3.8% | |||
| Duke Energy Corp. 3.75% 4/15/24 | 55,000 | 54,311 | |
| Mississippi Power Co. U.S. Secured Overnight Fin. Rate (SOFR) Index + 0.300% 5.5115% 6/28/24 (b)(c) | 50,000 | 49,760 | |
| NextEra Energy Capital Holdings, Inc. U.S. Secured Overnight Fin. Rate (SOFR) Averages Index + 0.400% 5.7113% 11/3/23 (b)(c) | 50,000 | 50,017 | |
| Southern California Edison Co. U.S. Secured Overnight Fin. Rate (SOFR) Averages Index + 0.830% 6.0468% 4/1/24 (b)(c) | 75,000 | 75,004 | |
| Tampa Electric Co. 3.875% 7/12/24 | 7,000 | 6,888 | |
| 235,980 | |||
| Multi-Utilities - 0.9% | |||
| CenterPoint Energy, Inc. U.S. Secured Overnight Fin. Rate (SOFR) Averages Index + 0.650% 5.9575% 5/13/24 (b)(c) | 40,000 | 39,990 | |
| Sempra 3.3% 4/1/25 | 16,000 | 15,414 | |
| 55,404 | |||
TOTAL UTILITIES | 291,384 | ||
| TOTAL NONCONVERTIBLE BONDS (Cost $3,949,051) | 3,949,567 | ||
| U.S. Treasury Obligations - 31.6% | |||
Principal Amount (a) | Value ($) | ||
| U.S. Treasury Bills, yield at date of purchase 4.58% to 5.24% 11/2/23 to 3/21/24 | 1,723,300 | 1,679,674 | |
| U.S. Treasury Notes 3% 6/30/24 | 300,000 | 294,152 | |
| TOTAL U.S. TREASURY OBLIGATIONS (Cost $1,979,127) | 1,973,826 | ||
| Asset-Backed Securities - 4.6% | |||
Principal Amount (a) | Value ($) | ||
| BMW Vechicle Lease Trust 2023-1 Series 2023-1 Class A2, 5.27% 2/25/25 | 7,979 | 7,957 | |
| Bmw Vechile Owner Trust 2023-A Series 2023-A Class A2A, 5.72% 4/27/26 | 25,000 | 25,001 | |
| BMW Vehicle Owner Trust Series 2022-A Class A2B, U.S. 30-Day Avg. Secured Overnight Fin. Rate (SOFR) Index + 0.520% 5.8076% 12/26/24 (b)(c) | 5,663 | 5,664 | |
| BMWLT 2021 Series 2021-2 Class A3, 0.33% 12/26/24 | 5,646 | 5,602 | |
| Capital One Prime Auto Receivables Series 2023-1 Class A2, 5.2% 5/15/26 | 9,676 | 9,639 | |
| CarMax Auto Owner Trust: | |||
| Series 2021-1 Class A3, 0.34% 12/15/25 | 4,165 | 4,059 | |
| Series 2022-2 Class A2B, U.S. 30-Day Avg. Secured Overnight Fin. Rate (SOFR) Index + 0.600% 5.7885% 5/15/25 (b)(c) | 1,685 | 1,685 | |
| Series 2022-3 Class A2A, 3.81% 9/15/25 | 5,738 | 5,703 | |
| Carmax Auto Owner Trust Series 2023 2 Class A2A, 5.5% 6/15/26 | 10,000 | 9,973 | |
| Dllaa 2023-1A Series 2023-1A Class A2, 5.93% 7/20/26 (d) | 2,000 | 2,002 | |
| DLLAD Series 2023-1A Class A2, 5.19% 4/20/26 (d) | 11,000 | 10,930 | |
| Ford Credit Auto Lease Trust Series 2022-A Class A2B, U.S. 30-Day Avg. Secured Overnight Fin. Rate (SOFR) Index + 0.600% 5.7885% 10/15/24 (b)(c) | 646 | 646 | |
| Ford Credit Auto Owner Trust Series 2022-C Class A2A, 4.52% 4/15/25 | 5,393 | 5,376 | |
| Ford Credit Auto Owner Trust 2 Series 2023-B Class A2A, 5.57% 6/15/26 | 10,000 | 9,983 | |
| Fordl 2023-A Series 2023-A Class A2A, 5.19% 6/15/25 | 5,603 | 5,590 | |
| FORDO Series 2022-B Class A2B, U.S. 30-Day Avg. Secured Overnight Fin. Rate (SOFR) Index + 0.600% 5.7885% 2/15/25 (b)(c) | 3,680 | 3,681 | |
| GM Financial Automobile Leasing Trust: | |||
| Series 2021-3 Class A3, 0.39% 10/21/24 | 10,978 | 10,881 | |
| Series 2022-2 Class A2, 2.93% 10/21/24 | 2,625 | 2,613 | |
| Series 2023-A Class A2A, 5.27% 6/20/25 | 11,521 | 11,487 | |
| Gm Financial Consumer Automobile Re Series 2023-1 Class A2A, 5.19% 3/16/26 | 5,750 | 5,730 | |
| GM Financial Consumer Automobile Receivables Trust: | |||
| Series 2022-3 Class A2A, 3.5% 9/16/25 | 12,341 | 12,245 | |
| Series 2022-4 Class A2A, 4.6% 11/17/25 | 6,540 | 6,507 | |
| Gm Financial Leasing Trust 202 Series 2023-3 Class A2A, 5.58% 1/20/26 | 20,000 | 19,988 | |
| Hyundai Auto Receivables Trust: | |||
| Series 2022-B Class A2A, 3.64% 5/15/25 | 7,194 | 7,144 | |
| Series 2022-C, Class A2A, 5.35% 11/17/25 | 13,462 | 13,438 | |
| Mercedes-Benz Auto Receivables Series 2023-1 Class A2, 5.09% 1/15/26 | 6,410 | 6,383 | |
| Tesla Auto Lease Trust 23-A Series 2023-A Class A2, 5.86% 8/20/25 (d) | 11,000 | 10,993 | |
| Toyota Auto Receivables Series 2022-D Class A2A, 5.27% 1/15/26 | 15,971 | 15,929 | |
| Toyota Auto Receivables 2023-C Series 2023-C Class A2A, 5.6% 8/17/26 | 17,000 | 16,972 | |
| Toyota Auto Receivables Owner Trust Series 2023-A Class A2, 5.05% 1/15/26 | 11,582 | 11,537 | |
| World Omni Auto Receivables Trust: | |||
| Series 2022-B, Class A2B, U.S. 30-Day Avg. Secured Overnight Fin. Rate (SOFR) Index + 0.570% 5.7585% 10/15/25 (b)(c) | 4,815 | 4,817 | |
| Series 2023-C Class A2A, 5.57% 12/15/26 | 14,000 | 13,988 | |
| TOTAL ASSET-BACKED SECURITIES (Cost $284,694) | 284,143 | ||
| Money Market Funds - 0.3% | |||
| Shares | Value ($) | ||
Fidelity Cash Central Fund 5.43% (e) (Cost $19,547) | 19,543 | 19,547 | |
| TOTAL INVESTMENT IN SECURITIES - 99.7% (Cost $6,232,419) | 6,227,083 |
NET OTHER ASSETS (LIABILITIES) - 0.3% | 18,940 |
| NET ASSETS - 100.0% | 6,246,023 |
| (a) | Amount is stated in United States dollars unless otherwise noted. |
| (b) | Coupon rates for floating and adjustable rate securities reflect the rates in effect at period end. |
| (c) | Coupon is indexed to a floating interest rate which may be multiplied by a specified factor and/or subject to caps or floors. |
| (d) | Security exempt from registration under Rule 144A of the Securities Act of 1933. These securities may be resold in transactions exempt from registration, normally to qualified institutional buyers. At the end of the period, the value of these securities amounted to $174,620 or 2.8% of net assets. |
| (e) | Affiliated fund that is generally available only to investment companies and other accounts managed by Fidelity Investments. The rate quoted is the annualized seven-day yield of the fund at period end. A complete unaudited listing of the fund's holdings as of its most recent quarter end is available upon request. In addition, each Fidelity Central Fund's financial statements, which are not covered by the Fund's Report of Independent Registered Public Accounting Firm, are available on the SEC's website or upon request. |
| Affiliate | Value, beginning of period ($) | Purchases ($) | Sales Proceeds ($) | Dividend Income ($) | Realized Gain (loss) ($) | Change in Unrealized appreciation (depreciation) ($) | Value, end of period ($) | % ownership, end of period |
| Fidelity Cash Central Fund 5.43% | 513,294 | 3,954,829 | 4,448,576 | 7,337 | - | - | 19,547 | 0.0% |
| Total | 513,294 | 3,954,829 | 4,448,576 | 7,337 | - | - | 19,547 | |
| Valuation Inputs at Reporting Date: | ||||
| Description | Total ($) | Level 1 ($) | Level 2 ($) | Level 3 ($) |
Investments in Securities: | ||||
| Corporate Bonds | 3,949,567 | - | 3,949,567 | - |
| U.S. Government and Government Agency Obligations | 1,973,826 | - | 1,973,826 | - |
| Asset-Backed Securities | 284,143 | - | 284,143 | - |
| Money Market Funds | 19,547 | 19,547 | - | - |
| Total Investments in Securities: | 6,227,083 | 19,547 | 6,207,536 | - |
| Statement of Assets and Liabilities | ||||
| August 31, 2023 | ||||
| Assets | ||||
| Investment in securities, at value - See accompanying schedule: | ||||
Unaffiliated issuers (cost $6,212,872) | $ | 6,207,536 | ||
Fidelity Central Funds (cost $19,547) | 19,547 | |||
| Total Investment in Securities (cost $6,232,419) | $ | 6,227,083 | ||
| Cash | 13,871 | |||
| Interest receivable | 33,297 | |||
| Distributions receivable from Fidelity Central Funds | 365 | |||
Total assets | 6,274,616 | |||
| Liabilities | ||||
| Distributions payable | $ | 27,500 | ||
| Accrued management fee | 1,043 | |||
| Other payables and accrued expenses | 50 | |||
| Total Liabilities | 28,593 | |||
| Net Assets | $ | 6,246,023 | ||
| Net Assets consist of: | ||||
| Paid in capital | $ | 6,252,410 | ||
| Total accumulated earnings (loss) | (6,387) | |||
| Net Assets | $ | 6,246,023 | ||
Net Asset Value, offering price and redemption price per share ($6,246,023 ÷ 125,000 shares) | $ | 49.97 | ||
| Statement of Operations | ||||
Year ended August 31, 2023 | ||||
| Investment Income | ||||
| Dividends | $ | 273 | ||
| Interest | 213,194 | |||
| Income from Fidelity Central Funds | 7,337 | |||
| Total Income | 220,804 | |||
| Expenses | ||||
| Management fee | $ | 13,196 | ||
| Independent trustees' fees and expenses | 18 | |||
| Miscellaneous | 51 | |||
| Total expenses before reductions | 13,265 | |||
| Expense reductions | (268) | |||
| Total expenses after reductions | 12,997 | |||
| Net Investment income (loss) | 207,807 | |||
| Realized and Unrealized Gain (Loss) | ||||
| Net realized gain (loss) on: | ||||
| Investment Securities: | ||||
| Unaffiliated issuers | (6,692) | |||
| Total net realized gain (loss) | (6,692) | |||
| Change in net unrealized appreciation (depreciation) on investment securities | 14,962 | |||
| Net gain (loss) | 8,270 | |||
| Net increase (decrease) in net assets resulting from operations | $ | 216,077 | ||
| Statement of Changes in Net Assets | ||||
Year ended August 31, 2023 | For the period April 19, 2022 (commencement of operations) through August 31, 2022 | |||
| Increase (Decrease) in Net Assets | ||||
| Operations | ||||
| Net investment income (loss) | $ | 207,807 | $ | 27,839 |
| Net realized gain (loss) | (6,692) | (265) | ||
| Change in net unrealized appreciation (depreciation) | 14,962 | (20,299) | ||
| Net increase (decrease) in net assets resulting from operations | 216,077 | 7,275 | ||
| Distributions to shareholders | (202,625) | (27,100) | ||
| Share transactions | ||||
| Proceeds from sales of shares | 3,746,758 | 5,000,824 | ||
| Cost of shares redeemed | (2,495,186) | - | ||
Net increase (decrease) in net assets resulting from share transactions | 1,251,572 | 5,000,824 | ||
| Total increase (decrease) in net assets | 1,265,024 | 4,980,999 | ||
| Net Assets | ||||
| Beginning of period | 4,980,999 | - | ||
| End of period | $ | 6,246,023 | $ | 4,980,999 |
| Other Information | ||||
| Shares | ||||
| Sold | 75,000 | 100,000 | ||
| Redeemed | (50,000) | - | ||
| Net increase (decrease) | 25,000 | 100,000 | ||
| Fidelity® Sustainable Low Duration Bond ETF |
| Years ended August 31, | 2023 | 2022 A | ||
Selected Per-Share Data | ||||
| Net asset value, beginning of period | $ | 49.81 | $ | 50.00 |
| Income from Investment Operations | ||||
Net investment income (loss) B,C | 2.012 | .278 | ||
| Net realized and unrealized gain (loss) | .080 | (.197) | ||
| Total from investment operations | 2.092 | .081 | ||
| Distributions from net investment income | (1.932) | (.271) | ||
| Total distributions | (1.932) | (.271) | ||
| Net asset value, end of period | $ | 49.97 | $ | 49.81 |
Total Return D,E | 4.27% | .16% | ||
Ratios to Average Net Assets C,F,G | ||||
| Expenses before reductions | .26% | .30% H | ||
| Expenses net of fee waivers, if any | .26% | .30% H | ||
| Expenses net of all reductions | .25% | .30% H | ||
| Net investment income (loss) | 4.03% | 1.52% H | ||
| Supplemental Data | ||||
| Net assets, end of period (000 omitted) | $ | 6,246 | $ | 4,981 |
Portfolio turnover rate I | 40% | 4% J |
| Fidelity Central Fund | Investment Manager | Investment Objective | Investment Practices | Expense RatioA |
| Fidelity Money Market Central Funds | Fidelity Management & Research Company LLC (FMR) | Each fund seeks to obtain a high level of current income consistent with the preservation of capital and liquidity. | Short-term Investments | Less than .005% |
| Tax cost | Gross unrealized appreciation | Gross unrealized depreciation | Net unrealized appreciation (depreciation) | |
| Fidelity Sustainable Core Plus Bond ETF. | $13,730,320 | $29,105 | $(725,231) | $(696,126) |
Fidelity Sustainable Low Duration Bond ETF | 6,232,446 | 5,952 | (11,315) | (5,363) |
| Undistributed ordinary income | Capital loss carryforward | Net unrealized appreciation (depreciation) on securities and other investments | |
| Fidelity Sustainable Core Plus Bond ETF. | $- | $(297,119) | $(696,129) |
Fidelity Sustainable Low Duration Bond ETF | 5,906 | (6,930) | (5,363) |
| Short-term | Long-term | Total capital loss carryforward | |
| Fidelity Sustainable Core Plus Bond ETF. | $(239,674) | $(57,445) | $(297,119) |
Fidelity Sustainable Low Duration Bond ETF | (6,930) | (-) | (6,930) |
| August 31, 2023 | |
| Ordinary Income | |
| Fidelity Sustainable Core Plus Bond ETF. | $529,500 |
Fidelity Sustainable Low Duration Bond ETF | 202,625 |
| August 31, 2022 | |
| Ordinary Income | |
| Fidelity Sustainable Core Plus Bond ETF. | $124,500 |
Fidelity Sustainable Low Duration Bond ETF | 27,100 |
| Foreign Exchange Risk | Foreign exchange rate risk relates to fluctuations in the value of an asset or liability due to changes in currency exchange rates. |
| Interest Rate Risk | Interest rate risk relates to the fluctuations in the value of interest-bearing securities due to changes in the prevailing levels of market interest rates. |
| Primary Risk Exposure / Derivative Type | Net Realized Gain (Loss)($) | Change in Net Unrealized Appreciation (Depreciation)($) |
| Fidelity Sustainable Core Plus Bond ETF | ||
| Foreign Exchange Risk | ||
| Forward Foreign Currency Contracts | (21,219) | (4,867) |
| Total Foreign Exchange Risk | (21,219) | (4,867) |
| Interest Rate Risk | ||
| Futures Contracts | (16,621) | 2,381 |
| Total Interest Rate Risk | (16,621) | 2,381 |
| Totals | (37,840) | (2,486) |
| Purchases ($) | Sales ($) | |
| Fidelity Sustainable Core Plus Bond ETF | 25,432,152 | 25,285,276 |
| Fidelity Sustainable Low Duration Bond ETF | 2,868,148 | 1,122,467 |
| Fee Rate | |
| Fidelity Sustainable Core Plus Bond ETF | .36% |
| Fidelity Sustainable Low Duration Bond ETF | .20% |
| Purchases ($) | Sales ($) | Realized Gain (Loss) ($) | |
| Fidelity Sustainable Core Plus Bond ETF | 1,289 | - | - |
| Fidelity Sustainable Low Duration Bond ETF | - | - | - |
| Custodian credits | |
Fidelity Sustainable Core Plus Bond ETF | $1,422 |
Fidelity Sustainable Low Duration Bond ETF | 268 |
| The Example is based on an investment of $1,000 invested at the beginning of the period and held for the entire period (March 1, 2023 to August 31, 2023). |
Annualized Expense Ratio- A | Beginning Account Value March 1, 2023 | Ending Account Value August 31, 2023 | Expenses Paid During Period- C March 1, 2023 to August 31, 2023 | |||||||
| Fidelity® Sustainable Core Plus Bond ETF | .36% | |||||||||
| Actual | $ 1,000 | $ 1,011.50 | $ 1.83 | |||||||
Hypothetical-B | $ 1,000 | $ 1,023.39 | $ 1.84 | |||||||
Fidelity® Sustainable Low Duration Bond ETF ** | .22% | |||||||||
| Actual | $ 1,000 | $ 1,024.30 | $ 1.12 | |||||||
Hypothetical-B | $ 1,000 | $ 1,024.10 | $ 1.12 | |||||||
Annualized Expense Ratio- A | Expenses Paid | |||||
| Fidelity® Sustainable Low Duration Bond ETF | .20% | |||||
| Actual | $ 1.02 | |||||
Hypothetical- B | $ 1.02 | |||||
| A Annualized expense ratio reflects expenses net of applicable fee waivers. | ||||||
| B 5% return per year before expenses |
| Fidelity Sustainable Core Plus Bond ETF | 15.67% |
| Fidelity Sustainable Low Duration Bond ETF | 27.56% |
| Fidelity Sustainable Core Plus Bond ETF | $211,984 |
| Fidelity Sustainable Low Duration Bond ETF | $58,957 |
| December, 2022 | |
| Fidelity Sustainable Core Plus Bond ETF | 94.61% |
| Fidelity Sustainable Core Plus Bond ETF | $450,123 |
| Fidelity Sustainable Low Duration Bond ETF | $193,192 |
 |


Contents
| Average Annual Total Returns | |||
Periods ended August 31, 2023 | Past 1 year | Past 5 years | Life of Fund |
Fidelity® Corporate Bond ETF - NAV A | 1.19% | 1.60% | 1.99% |
Fidelity® Corporate Bond ETF - Market Price B | 1.78% | 1.64% | 1.94% |
Bloomberg U.S. Credit Bond Index A | 0.85% | 1.32% | 1.86% |
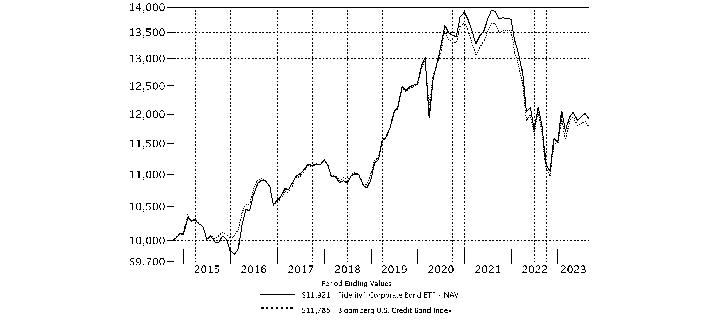
| $10,000 Over Life of Fund |
Let's say hypothetically that $10,000 was invested in Fidelity® Corporate Bond ETF - NAV, on October 6, 2014, when the fund started. The chart shows how the value of your investment would have changed, and also shows how the Bloomberg U.S. Credit Bond Index performed over the same period. |
 |
Quality Diversification (% of Fund's net assets) |
 |
| We have used ratings from Moody's Investors Service, Inc. Where Moody's® ratings are not available, we have used S&P® ratings. All ratings are as of the date indicated and do not reflect subsequent changes. |
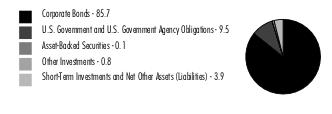
Asset Allocation (% of Fund's net assets) |
 |
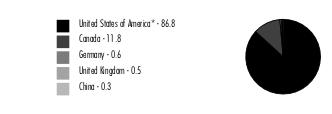
Geographic Diversification (% of Fund's net assets) |
 |
* Includes Short-Term investments and Net Other Assets (Liabilities). Percentages are adjusted for the effect of derivatives, if applicable. |
| Nonconvertible Bonds - 85.7% | |||
Principal Amount (a) | Value ($) | ||
| COMMUNICATION SERVICES - 6.0% | |||
| Diversified Telecommunication Services - 1.4% | |||
| AT&T, Inc.: | |||
| 3.55% 9/15/55 | 322,000 | 210,159 | |
| 3.65% 9/15/59 | 535,000 | 346,236 | |
| 4.3% 2/15/30 | 412,000 | 384,134 | |
| 4.5% 5/15/35 | 293,000 | 260,391 | |
| Verizon Communications, Inc.: | |||
| 2.55% 3/21/31 | 312,000 | 256,834 | |
| 3.7% 3/22/61 | 705,000 | 480,304 | |
| 4.4% 11/1/34 | 412,000 | 373,284 | |
| 2,311,342 | |||
| Entertainment - 0.1% | |||
| The Walt Disney Co. 4.75% 11/15/46 | 204,000 | 185,657 | |
| Media - 3.1% | |||
| CCO Holdings LLC/CCO Holdings Capital Corp. 4.5% 8/15/30 (b) | 443,000 | 372,650 | |
| Charter Communications Operating LLC/Charter Communications Operating Capital Corp.: | |||
| 3.7% 4/1/51 | 228,000 | 141,685 | |
| 3.85% 4/1/61 | 620,000 | 370,403 | |
| 4.2% 3/15/28 | 778,000 | 724,639 | |
| 5.375% 5/1/47 | 338,000 | 270,087 | |
| Comcast Corp. 2.937% 11/1/56 | 335,000 | 208,463 | |
| Discovery Communications LLC 4.125% 5/15/29 | 295,000 | 270,807 | |
| Fox Corp.: | |||
| 3.5% 4/8/30 | 218,000 | 194,997 | |
| 5.476% 1/25/39 | 78,000 | 70,789 | |
| Magallanes, Inc.: | |||
| 3.755% 3/15/27 | 252,000 | 236,355 | |
| 4.054% 3/15/29 | 129,000 | 118,628 | |
| 4.279% 3/15/32 | 557,000 | 491,519 | |
| 5.05% 3/15/42 | 171,000 | 140,567 | |
| 5.141% 3/15/52 | 426,000 | 339,569 | |
| 5.391% 3/15/62 | 385,000 | 305,563 | |
| Time Warner Cable LLC: | |||
| 4.5% 9/15/42 | 273,000 | 199,476 | |
| 5.875% 11/15/40 | 354,000 | 308,011 | |
| 7.3% 7/1/38 | 538,000 | 545,020 | |
| 5,309,228 | |||
| Wireless Telecommunication Services - 1.4% | |||
| Rogers Communications, Inc.: | |||
| 3.8% 3/15/32 | 629,000 | 537,967 | |
| 4.3% 2/15/48 | 100,000 | 74,958 | |
| 4.55% 3/15/52 | 314,000 | 243,304 | |
| T-Mobile U.S.A., Inc.: | |||
| 2.4% 3/15/29 | 242,000 | 208,027 | |
| 2.7% 3/15/32 | 960,000 | 781,716 | |
| 3.75% 4/15/27 | 412,000 | 390,491 | |
| Vodafone Group PLC 3.25% 6/4/81 (c) | 250,000 | 220,901 | |
| 2,457,364 | |||
TOTAL COMMUNICATION SERVICES | 10,263,591 | ||
| CONSUMER DISCRETIONARY - 3.6% | |||
| Automobiles - 1.7% | |||
| Ford Motor Co. 3.25% 2/12/32 | 850,000 | 663,464 | |
| General Motors Co.: | |||
| 5.4% 4/1/48 | 500,000 | 415,903 | |
| 5.95% 4/1/49 | 416,000 | 373,043 | |
| General Motors Financial Co., Inc. 3.1% 1/12/32 | 400,000 | 320,497 | |
| Volkswagen Group of America Finance LLC: | |||
| 1.625% 11/24/27 (b) | 390,000 | 336,067 | |
| 4.75% 11/13/28 (b) | 790,000 | 763,720 | |
| 2,872,694 | |||
| Distributors - 0.2% | |||
| Genuine Parts Co. 2.75% 2/1/32 | 450,000 | 366,794 | |
| Specialty Retail - 1.5% | |||
| Advance Auto Parts, Inc. 1.75% 10/1/27 | 338,000 | 285,149 | |
| AutoNation, Inc.: | |||
| 3.85% 3/1/32 | 890,000 | 753,479 | |
| 4.75% 6/1/30 | 19,000 | 17,696 | |
| Lowe's Companies, Inc.: | |||
| 3.65% 4/5/29 | 291,000 | 270,279 | |
| 5.15% 7/1/33 | 600,000 | 592,749 | |
| 5.625% 4/15/53 | 250,000 | 242,795 | |
| O'Reilly Automotive, Inc. 4.35% 6/1/28 | 416,000 | 403,674 | |
| 2,565,821 | |||
| Textiles, Apparel & Luxury Goods - 0.2% | |||
| Tapestry, Inc. 3.05% 3/15/32 | 434,000 | 333,860 | |
TOTAL CONSUMER DISCRETIONARY | 6,139,169 | ||
| CONSUMER STAPLES - 6.5% | |||
| Beverages - 1.4% | |||
| Anheuser-Busch Companies LLC / Anheuser-Busch InBev Worldwide, Inc.: | |||
| 4.7% 2/1/36 | 198,000 | 189,508 | |
| 4.9% 2/1/46 | 368,000 | 342,332 | |
| Anheuser-Busch InBev Finance, Inc. 4.7% 2/1/36 | 784,000 | 750,374 | |
| Anheuser-Busch InBev Worldwide, Inc. 4.5% 6/1/50 | 466,000 | 415,843 | |
| Constellation Brands, Inc. 2.875% 5/1/30 | 363,000 | 313,240 | |
| Molson Coors Beverage Co. 3% 7/15/26 | 321,000 | 300,776 | |
| 2,312,073 | |||
| Consumer Staples Distribution & Retail - 0.1% | |||
| Alimentation Couche-Tard, Inc. 2.95% 1/25/30 (b) | 269,000 | 228,806 | |
| Food Products - 2.0% | |||
| JBS U.S.A. Lux SA / JBS Food Co.: | |||
| 2.5% 1/15/27 | 1,000,000 | 898,895 | |
| 3% 5/15/32 | 435,000 | 343,517 | |
| 4.375% 2/2/52 | 405,000 | 287,086 | |
| 5.5% 1/15/30 | 530,000 | 513,170 | |
| 5.75% 4/1/33 | 340,000 | 323,590 | |
| McCormick & Co., Inc. 1.85% 2/15/31 | 261,000 | 205,431 | |
| Smithfield Foods, Inc. 3% 10/15/30 (b) | 135,000 | 106,076 | |
| Viterra Finance BV 4.9% 4/21/27 (b) | 780,000 | 754,672 | |
| 3,432,437 | |||
| Tobacco - 3.0% | |||
| Altria Group, Inc.: | |||
| 2.45% 2/4/32 | 440,000 | 343,419 | |
| 4.25% 8/9/42 | 235,000 | 178,016 | |
| 4.8% 2/14/29 | 253,000 | 245,139 | |
| BAT Capital Corp.: | |||
| 2.726% 3/25/31 | 740,000 | 585,907 | |
| 3.557% 8/15/27 | 192,000 | 178,114 | |
| 3.984% 9/25/50 | 440,000 | 290,960 | |
| Imperial Tobacco Finance PLC: | |||
| 3.5% 7/26/26 (b) | 670,000 | 629,429 | |
| 4.25% 7/21/25 (b) | 250,000 | 241,763 | |
| Philip Morris International, Inc.: | |||
| 5.625% 11/17/29 | 760,000 | 768,432 | |
| 5.75% 11/17/32 | 1,041,000 | 1,055,810 | |
| Reynolds American, Inc. 4.45% 6/12/25 | 600,000 | 586,995 | |
| 5,103,984 | |||
TOTAL CONSUMER STAPLES | 11,077,300 | ||
| ENERGY - 7.5% | |||
| Oil, Gas & Consumable Fuels - 7.5% | |||
| Canadian Natural Resources Ltd.: | |||
| 4.95% 6/1/47 | 134,000 | 116,339 | |
| 6.25% 3/15/38 | 450,000 | 453,519 | |
| Cenovus Energy, Inc.: | |||
| 2.65% 1/15/32 | 99,000 | 79,690 | |
| 3.75% 2/15/52 | 350,000 | 245,632 | |
| 5.4% 6/15/47 | 288,000 | 258,883 | |
| 6.75% 11/15/39 | 112,000 | 116,127 | |
| Cheniere Corpus Christi Holdings LLC 5.875% 3/31/25 | 565,000 | 563,079 | |
| Columbia Pipelines Operating Co. LLC: | |||
| 5.927% 8/15/30 (b) | 24,000 | 24,210 | |
| 6.036% 11/15/33 (b) | 64,000 | 64,656 | |
| 6.497% 8/15/43 (b) | 19,000 | 19,258 | |
| 6.544% 11/15/53 (b) | 34,000 | 34,755 | |
| DCP Midstream Operating LP 5.125% 5/15/29 | 515,000 | 502,176 | |
| Eastern Gas Transmission & Storage, Inc. 3.9% 11/15/49 | 356,000 | 248,597 | |
| Enbridge, Inc. 4.25% 12/1/26 | 214,000 | 206,580 | |
| Energy Transfer LP: | |||
| 4% 10/1/27 | 632,000 | 593,841 | |
| 5% 5/15/50 | 450,000 | 370,411 | |
| 5.4% 10/1/47 | 316,000 | 272,186 | |
| 5.8% 6/15/38 | 123,000 | 116,592 | |
| 6% 6/15/48 | 257,000 | 237,567 | |
| Enterprise Products Operating LP 4.9% 5/15/46 | 183,000 | 162,583 | |
| Equinor ASA 2.375% 5/22/30 | 422,000 | 362,458 | |
| Hess Corp.: | |||
| 4.3% 4/1/27 | 354,000 | 340,549 | |
| 5.6% 2/15/41 | 410,000 | 385,480 | |
| 5.8% 4/1/47 | 240,000 | 229,046 | |
| 6% 1/15/40 | 405,000 | 397,499 | |
| MPLX LP: | |||
| 1.75% 3/1/26 | 351,000 | 319,684 | |
| 2.65% 8/15/30 | 722,000 | 599,213 | |
| 5.65% 3/1/53 | 240,000 | 217,457 | |
| Occidental Petroleum Corp.: | |||
| 2.9% 8/15/24 | 86,000 | 83,606 | |
| 3.45% 7/15/24 | 481,000 | 467,171 | |
| Ovintiv, Inc. 7.2% 11/1/31 | 270,000 | 284,805 | |
| Petroleos Mexicanos: | |||
| 5.35% 2/12/28 | 394,000 | 315,092 | |
| 6.49% 1/23/27 | 85,000 | 74,132 | |
| 6.5% 3/13/27 | 280,000 | 244,461 | |
| Plains All American Pipeline LP/PAA Finance Corp. 4.65% 10/15/25 | 456,000 | 444,711 | |
| Spectra Energy Partners LP 3.375% 10/15/26 | 338,000 | 318,225 | |
| Suncor Energy, Inc.: | |||
| 6.5% 6/15/38 | 255,000 | 260,996 | |
| 6.85% 6/1/39 | 166,000 | 173,248 | |
| The Williams Companies, Inc.: | |||
| 4.65% 8/15/32 | 743,000 | 697,702 | |
| 5.3% 8/15/52 | 57,000 | 51,322 | |
| 5.75% 6/24/44 | 360,000 | 340,667 | |
| Transcontinental Gas Pipe Line Co. LLC 3.25% 5/15/30 | 606,000 | 534,124 | |
| Western Gas Partners LP 4.05% 2/1/30 | 1,204,000 | 1,073,975 | |
| 12,902,304 | |||
| FINANCIALS - 31.9% | |||
| Banks - 16.7% | |||
| AIB Group PLC 4.263% 4/10/25 (b)(c) | 250,000 | 246,287 | |
| Banco Santander SA 2.749% 12/3/30 | 720,000 | 557,948 | |
| Bank of America Corp.: | |||
| 2.676% 6/19/41 (c) | 619,000 | 426,238 | |
| 2.884% 10/22/30 (c) | 487,000 | 417,802 | |
| 3.194% 7/23/30 (c) | 495,000 | 434,570 | |
| 3.705% 4/24/28 (c) | 362,000 | 338,859 | |
| 4.45% 3/3/26 | 350,000 | 340,329 | |
| 4.571% 4/27/33 (c) | 1,540,000 | 1,427,564 | |
| 5.015% 7/22/33 (c) | 640,000 | 615,972 | |
| Bank of Ireland Group PLC 4.5% 11/25/23 (b) | 600,000 | 596,616 | |
| Bank of Nova Scotia 4.5% 12/16/25 | 756,000 | 732,953 | |
| Barclays PLC: | |||
| 2.645% 6/24/31 (c) | 550,000 | 438,856 | |
| 2.894% 11/24/32 (c) | 920,000 | 718,522 | |
| 4.836% 5/9/28 | 415,000 | 384,555 | |
| 5.088% 6/20/30 (c) | 200,000 | 183,242 | |
| BNP Paribas SA: | |||
| 1.904% 9/30/28 (b)(c) | 670,000 | 574,866 | |
| 2.591% 1/20/28 (b)(c) | 510,000 | 459,234 | |
| 2.824% 1/26/41 (b) | 660,000 | 430,312 | |
| BPCE SA: | |||
| 2.277% 1/20/32 (b)(c) | 590,000 | 455,949 | |
| 4.875% 4/1/26 (b) | 350,000 | 337,607 | |
| Citigroup, Inc.: | |||
| 2.572% 6/3/31 (c) | 296,000 | 244,449 | |
| 2.666% 1/29/31 (c) | 307,000 | 257,291 | |
| 4.3% 11/20/26 | 431,000 | 414,082 | |
| 4.91% 5/24/33 (c) | 295,000 | 280,419 | |
| 6.174% 5/25/34 (c) | 271,000 | 270,054 | |
| Citizens Financial Group, Inc. 2.638% 9/30/32 | 427,000 | 311,439 | |
| Commonwealth Bank of Australia 3.784% 3/14/32 (b) | 610,000 | 508,129 | |
| Credit Agricole SA 2.811% 1/11/41 (b) | 488,000 | 317,515 | |
| Fifth Third Bancorp 8.25% 3/1/38 | 395,000 | 445,950 | |
| HSBC Holdings PLC: | |||
| 1.589% 5/24/27 (c) | 790,000 | 701,920 | |
| 2.357% 8/18/31 (c) | 570,000 | 451,408 | |
| 2.848% 6/4/31 (c) | 400,000 | 329,891 | |
| 4.041% 3/13/28 (c) | 300,000 | 281,755 | |
| 7.39% 11/3/28 (c) | 300,000 | 315,187 | |
| Huntington Bancshares, Inc.: | |||
| 2.487% 8/15/36 (c) | 1,188,000 | 871,065 | |
| 6.208% 8/21/29 (c) | 500,000 | 503,282 | |
| Intesa Sanpaolo SpA 5.71% 1/15/26 (b) | 200,000 | 191,861 | |
| JPMorgan Chase & Co.: | |||
| 2.522% 4/22/31 (c) | 456,000 | 382,461 | |
| 2.956% 5/13/31 (c) | 467,000 | 396,960 | |
| 4.912% 7/25/33 (c) | 890,000 | 855,950 | |
| 4.95% 6/1/45 | 204,000 | 187,504 | |
| 5.717% 9/14/33 (c) | 1,400,000 | 1,399,200 | |
| Lloyds Banking Group PLC: | |||
| 1.627% 5/11/27 (c) | 600,000 | 535,195 | |
| 7.953% 11/15/33 (c) | 350,000 | 374,896 | |
| PNC Financial Services Group, Inc. 5.582% 6/12/29 (c) | 400,000 | 396,722 | |
| Rabobank Nederland 3.75% 7/21/26 | 700,000 | 656,958 | |
| Santander Holdings U.S.A., Inc. 2.49% 1/6/28 (c) | 1,135,000 | 995,152 | |
| Societe Generale: | |||
| 1.488% 12/14/26 (b)(c) | 325,000 | 291,227 | |
| 3% 1/22/30 (b) | 555,000 | 463,502 | |
| 3.625% 3/1/41 (b) | 750,000 | 484,106 | |
| 6.221% 6/15/33 (b)(c) | 640,000 | 601,275 | |
| Standard Chartered PLC 3.785% 5/21/25 (b)(c) | 500,000 | 490,639 | |
| Synchrony Bank 5.625% 8/23/27 | 250,000 | 236,471 | |
| U.S. Bancorp 5.775% 6/12/29 (c) | 600,000 | 598,689 | |
| UniCredit SpA 1.982% 6/3/27 (b)(c) | 625,000 | 555,181 | |
| Wells Fargo & Co.: | |||
| 4.478% 4/4/31 (c) | 432,000 | 404,159 | |
| 4.65% 11/4/44 | 864,000 | 714,767 | |
| Westpac Banking Corp. 1 year U.S. Treasury Index + 2.680% 5.405% 8/10/33 (c)(d) | 480,000 | 451,447 | |
| Zions Bancorp NA 3.25% 10/29/29 | 420,000 | 329,913 | |
| 28,616,352 | |||
| Capital Markets - 4.6% | |||
| Ares Capital Corp.: | |||
| 2.15% 7/15/26 | 335,000 | 294,400 | |
| 3.875% 1/15/26 | 772,000 | 722,096 | |
| 4.2% 6/10/24 | 406,000 | 398,883 | |
| 4.25% 3/1/25 | 378,000 | 363,620 | |
| Blackstone Holdings Finance Co. LLC 3.5% 9/10/49 (b) | 268,000 | 174,969 | |
| Deutsche Bank AG 4.5% 4/1/25 | 320,000 | 308,314 | |
| Deutsche Bank AG New York Branch: | |||
| 2.129% 11/24/26 (c) | 731,000 | 663,213 | |
| 3.035% 5/28/32 (c) | 566,000 | 450,242 | |
| Goldman Sachs Group, Inc. 4.223% 5/1/29 (c) | 336,000 | 316,564 | |
| Morgan Stanley: | |||
| 1.794% 2/13/32 (c) | 434,000 | 333,748 | |
| 2.239% 7/21/32 (c) | 910,000 | 715,834 | |
| 2.699% 1/22/31 (c) | 286,000 | 240,719 | |
| 4.431% 1/23/30 (c) | 410,000 | 389,358 | |
| UBS Group AG: | |||
| 3.091% 5/14/32 (b)(c) | 725,000 | 597,462 | |
| 3.126% 8/13/30 (b)(c) | 500,000 | 428,608 | |
| 3.869% 1/12/29 (b)(c) | 250,000 | 229,828 | |
| 4.194% 4/1/31 (b)(c) | 700,000 | 630,299 | |
| 4.55% 4/17/26 | 250,000 | 241,944 | |
| 9.016% 11/15/33 (b)(c) | 300,000 | 363,267 | |
| 7,863,368 | |||
| Consumer Finance - 3.9% | |||
| AerCap Ireland Capital Ltd./AerCap Global Aviation Trust: | |||
| 1.65% 10/29/24 | 350,000 | 332,751 | |
| 2.45% 10/29/26 | 150,000 | 134,962 | |
| 3% 10/29/28 | 151,000 | 130,851 | |
| 3.3% 1/30/32 | 161,000 | 130,834 | |
| 3.4% 10/29/33 | 333,000 | 263,997 | |
| 3.85% 10/29/41 | 470,000 | 348,784 | |
| Ally Financial, Inc.: | |||
| 2.2% 11/2/28 | 254,000 | 204,901 | |
| 5.75% 11/20/25 | 141,000 | 136,766 | |
| 5.8% 5/1/25 | 309,000 | 304,364 | |
| 7.1% 11/15/27 | 1,030,000 | 1,043,507 | |
| Capital One Financial Corp.: | |||
| 2.359% 7/29/32 (c) | 982,000 | 700,512 | |
| 5.247% 7/26/30 (c) | 321,000 | 305,363 | |
| 5.468% 2/1/29 (c) | 114,000 | 110,588 | |
| 5.817% 2/1/34 (c) | 238,000 | 226,074 | |
| 6.312% 6/8/29 (c) | 390,000 | 389,787 | |
| Discover Financial Services: | |||
| 4.5% 1/30/26 | 488,000 | 468,778 | |
| 6.7% 11/29/32 | 35,000 | 34,834 | |
| Ford Motor Credit Co. LLC: | |||
| 3.375% 11/13/25 | 615,000 | 573,355 | |
| 4.063% 11/1/24 | 350,000 | 339,112 | |
| 4.95% 5/28/27 | 500,000 | 469,176 | |
| 6,649,296 | |||
| Financial Services - 3.3% | |||
| Athene Global Funding: | |||
| 1.45% 1/8/26 (b) | 290,000 | 258,513 | |
| 1.985% 8/19/28 (b) | 380,000 | 314,468 | |
| 2.5% 3/24/28 (b) | 340,000 | 291,256 | |
| Blackstone Private Credit Fund: | |||
| 4.7% 3/24/25 | 556,000 | 540,443 | |
| 7.05% 9/29/25 | 247,000 | 248,709 | |
| Brixmor Operating Partnership LP: | |||
| 2.25% 4/1/28 | 302,000 | 256,626 | |
| 4.05% 7/1/30 | 629,000 | 568,245 | |
| 4.125% 5/15/29 | 365,000 | 332,016 | |
| Corebridge Financial, Inc.: | |||
| 3.65% 4/5/27 | 95,000 | 89,366 | |
| 3.85% 4/5/29 | 183,000 | 167,473 | |
| 3.9% 4/5/32 | 241,000 | 210,728 | |
| 4.35% 4/5/42 | 25,000 | 19,778 | |
| 4.4% 4/5/52 | 95,000 | 73,480 | |
| Equitable Holdings, Inc.: | |||
| 4.35% 4/20/28 | 227,000 | 214,778 | |
| 5% 4/20/48 | 436,000 | 366,748 | |
| Jackson Financial, Inc.: | |||
| 3.125% 11/23/31 | 420,000 | 330,126 | |
| 4% 11/23/51 | 485,000 | 323,739 | |
| 5.17% 6/8/27 | 84,000 | 82,334 | |
| 5.67% 6/8/32 | 90,000 | 85,723 | |
| Rexford Industrial Realty LP 2.15% 9/1/31 | 394,000 | 304,162 | |
| Voya Financial, Inc.: | |||
| 4.7% 1/23/48 (c) | 423,000 | 344,768 | |
| 4.8% 6/15/46 | 204,000 | 161,246 | |
| 5.7% 7/15/43 | 56,000 | 51,620 | |
| 5,636,345 | |||
| Insurance - 3.4% | |||
| American International Group, Inc. 5.75% 4/1/48 (c) | 558,000 | 526,892 | |
| AmFam Holdings, Inc. 2.805% 3/11/31 (b) | 310,000 | 230,486 | |
| Assurant, Inc. 2.65% 1/15/32 | 420,000 | 316,552 | |
| Athene Holding Ltd.: | |||
| 3.45% 5/15/52 | 250,000 | 159,124 | |
| 6.65% 2/1/33 | 700,000 | 718,179 | |
| Empower Finance 2020 LP 1.776% 3/17/31 (b) | 353,000 | 276,162 | |
| Fairfax Financial Holdings Ltd.: | |||
| 3.375% 3/3/31 | 20,000 | 16,764 | |
| 4.85% 4/17/28 | 315,000 | 303,367 | |
| 5.625% 8/16/32 | 740,000 | 714,207 | |
| Five Corners Funding Trust II 2.85% 5/15/30 (b) | 630,000 | 539,353 | |
| Intact Financial Corp. 5.459% 9/22/32 (b) | 447,000 | 441,107 | |
| Liberty Mutual Group, Inc. 5.5% 6/15/52 (b) | 560,000 | 506,579 | |
| Massachusetts Mutual Life Insurance Co. 3.729% 10/15/70 (b) | 273,000 | 178,824 | |
| Pacific LifeCorp 5.125% 1/30/43 (b) | 309,000 | 281,881 | |
| Unum Group 4.125% 6/15/51 | 530,000 | 374,573 | |
| Willis Group North America, Inc. 5.35% 5/15/33 | 385,000 | 371,643 | |
| 5,955,693 | |||
TOTAL FINANCIALS | 54,721,054 | ||
| HEALTH CARE - 7.3% | |||
| Biotechnology - 0.9% | |||
| AbbVie, Inc. 4.55% 3/15/35 | 381,000 | 360,384 | |
| Amgen, Inc.: | |||
| 3.375% 2/21/50 | 312,000 | 218,308 | |
| 5.25% 3/2/30 | 458,000 | 458,634 | |
| 5.25% 3/2/33 | 88,000 | 87,542 | |
| 5.65% 3/2/53 | 41,000 | 40,645 | |
| 5.75% 3/2/63 | 75,000 | 74,066 | |
| Regeneron Pharmaceuticals, Inc. 1.75% 9/15/30 | 278,000 | 221,245 | |
| 1,460,824 | |||
| Health Care Providers & Services - 3.5% | |||
| Centene Corp.: | |||
| 2.625% 8/1/31 | 1,320,000 | 1,050,098 | |
| 3% 10/15/30 | 294,000 | 245,919 | |
| 4.25% 12/15/27 | 160,000 | 149,665 | |
| 4.625% 12/15/29 | 990,000 | 910,305 | |
| Cigna Group: | |||
| 3.4% 3/15/50 | 397,000 | 277,464 | |
| 4.8% 8/15/38 | 796,000 | 733,767 | |
| 4.9% 12/15/48 | 40,000 | 35,669 | |
| CVS Health Corp.: | |||
| 4.78% 3/25/38 | 566,000 | 506,886 | |
| 4.875% 7/20/35 | 134,000 | 124,676 | |
| 5% 1/30/29 | 65,000 | 64,038 | |
| 5.25% 1/30/31 | 26,000 | 25,692 | |
| 5.3% 6/1/33 | 450,000 | 440,731 | |
| HCA Holdings, Inc.: | |||
| 3.625% 3/15/32 | 200,000 | 172,014 | |
| 4.625% 3/15/52 | 370,000 | 296,885 | |
| Sabra Health Care LP 3.2% 12/1/31 | 615,000 | 469,735 | |
| Universal Health Services, Inc.: | |||
| 2.65% 10/15/30 | 388,000 | 312,555 | |
| 2.65% 1/15/32 | 275,000 | 213,894 | |
| 6,029,993 | |||
| Pharmaceuticals - 2.9% | |||
| AstraZeneca PLC 6.45% 9/15/37 | 276,000 | 310,454 | |
| Bayer U.S. Finance II LLC: | |||
| 4.25% 12/15/25 (b) | 447,000 | 432,911 | |
| 4.375% 12/15/28 (b) | 410,000 | 389,497 | |
| Elanco Animal Health, Inc. 6.65% 8/28/28 (c) | 452,000 | 445,785 | |
| Mylan NV 4.55% 4/15/28 | 740,000 | 696,698 | |
| Pfizer Investment Enterprises: | |||
| 4.75% 5/19/33 | 780,000 | 767,561 | |
| 5.3% 5/19/53 | 602,000 | 602,219 | |
| Utah Acquisition Sub, Inc. 3.95% 6/15/26 | 547,000 | 517,030 | |
| Viatris, Inc.: | |||
| 2.7% 6/22/30 | 875,000 | 710,616 | |
| 4% 6/22/50 | 280,000 | 185,473 | |
| 5,058,244 | |||
TOTAL HEALTH CARE | 12,549,061 | ||
| INDUSTRIALS - 4.6% | |||
| Aerospace & Defense - 1.4% | |||
| BAE Systems PLC 1.9% 2/15/31 (b) | 525,000 | 416,729 | |
| The Boeing Co.: | |||
| 3.625% 2/1/31 | 695,000 | 620,444 | |
| 5.04% 5/1/27 | 558,000 | 551,858 | |
| 5.15% 5/1/30 | 888,000 | 873,645 | |
| 2,462,676 | |||
| Air Freight & Logistics - 0.1% | |||
| FedEx Corp. 4.05% 2/15/48 | 348,000 | 271,012 | |
| Ground Transportation - 0.2% | |||
| CSX Corp. 4.75% 11/15/48 | 402,000 | 358,548 | |
| Machinery - 0.9% | |||
| Ingersoll Rand, Inc.: | |||
| 5.4% 8/14/28 | 194,000 | 194,438 | |
| 5.7% 8/14/33 | 214,000 | 216,997 | |
| Ingersoll-Rand Luxembourg Finance SA 3.8% 3/21/29 | 250,000 | 233,305 | |
| Westinghouse Air Brake Tech Co.: | |||
| 3.2% 6/15/25 | 438,000 | 417,822 | |
| 3.45% 11/15/26 | 456,000 | 428,714 | |
| 1,491,276 | |||
| Passenger Airlines - 0.6% | |||
| American Airlines 2017-2 Class B Pass Through Trust equipment trust certificate 3.7% 4/15/27 | 387,664 | 367,491 | |
| American Airlines 2019-1 Class B Pass Through Trust equipment trust certificate 3.85% 8/15/29 | 156,657 | 138,562 | |
| American Airlines, Inc. 3.75% 4/15/27 | 125,903 | 118,048 | |
| British Airways 2021-1 Class A Pass Through Trust equipment trust certificate 2.9% 9/15/36 (b) | 187,133 | 157,213 | |
| United Airlines 2019-2 Class B Pass Through Trust equipment trust certificate 3.5% 11/1/29 | 148,682 | 134,255 | |
| United Airlines, Inc. equipment trust certificate 4.6% 9/1/27 | 78,987 | 74,657 | |
| 990,226 | |||
| Professional Services - 0.2% | |||
| Booz Allen Hamilton, Inc. 5.95% 8/4/33 | 298,000 | 301,403 | |
| Trading Companies & Distributors - 0.4% | |||
| Air Lease Corp.: | |||
| 2.875% 1/15/32 | 460,000 | 368,089 | |
| 3.25% 3/1/25 | 331,000 | 316,780 | |
| 684,869 | |||
| Transportation Infrastructure - 0.8% | |||
| Avolon Holdings Funding Ltd.: | |||
| 2.528% 11/18/27 (b) | 219,000 | 186,955 | |
| 4.25% 4/15/26 (b) | 725,000 | 683,718 | |
| 5.5% 1/15/26 (b) | 312,000 | 303,748 | |
| 6.375% 5/4/28 (b) | 139,000 | 137,882 | |
| 1,312,303 | |||
TOTAL INDUSTRIALS | 7,872,313 | ||
| INFORMATION TECHNOLOGY - 3.6% | |||
| Electronic Equipment, Instruments & Components - 1.1% | |||
| Dell International LLC/EMC Corp.: | |||
| 3.45% 12/15/51 (b) | 725,000 | 472,042 | |
| 4.9% 10/1/26 | 1,006,000 | 987,998 | |
| Vontier Corp. 2.95% 4/1/31 | 632,000 | 500,855 | |
| 1,960,895 | |||
| IT Services - 0.3% | |||
| CDW LLC/CDW Finance Corp. 2.67% 12/1/26 | 544,000 | 493,117 | |
| Semiconductors & Semiconductor Equipment - 1.3% | |||
| Broadcom, Inc.: | |||
| 1.95% 2/15/28 (b) | 302,000 | 261,898 | |
| 2.45% 2/15/31 (b) | 175,000 | 141,084 | |
| 2.6% 2/15/33 (b) | 782,000 | 604,589 | |
| 3.5% 2/15/41 (b) | 363,000 | 265,925 | |
| Micron Technology, Inc.: | |||
| 2.703% 4/15/32 | 395,000 | 311,723 | |
| 4.185% 2/15/27 | 401,000 | 382,204 | |
| NXP BV/NXP Funding LLC/NXP U.S.A., Inc. 2.7% 5/1/25 | 337,000 | 320,689 | |
| 2,288,112 | |||
| Software - 0.9% | |||
| Oracle Corp.: | |||
| 2.3% 3/25/28 | 408,000 | 359,031 | |
| 2.875% 3/25/31 | 190,000 | 160,526 | |
| 3.95% 3/25/51 | 430,000 | 314,279 | |
| 4.3% 7/8/34 | 347,000 | 311,141 | |
| Roper Technologies, Inc. 2.95% 9/15/29 | 389,000 | 344,030 | |
| 1,489,007 | |||
TOTAL INFORMATION TECHNOLOGY | 6,231,131 | ||
| MATERIALS - 1.2% | |||
| Chemicals - 1.0% | |||
| Celanese U.S. Holdings LLC: | |||
| 6.165% 7/15/27 | 620,000 | 620,332 | |
| 6.35% 11/15/28 | 82,000 | 82,211 | |
| 6.55% 11/15/30 | 84,000 | 84,041 | |
| 6.7% 11/15/33 | 49,000 | 49,206 | |
| International Flavors & Fragrances, Inc.: | |||
| 1.832% 10/15/27 (b) | 352,000 | 296,065 | |
| 3.468% 12/1/50 (b) | 532,000 | 330,732 | |
| LYB International Finance III LLC 2.25% 10/1/30 | 368,000 | 298,854 | |
| 1,761,441 | |||
| Containers & Packaging - 0.2% | |||
| Avery Dennison Corp. 4.875% 12/6/28 | 325,000 | 317,703 | |
TOTAL MATERIALS | 2,079,144 | ||
| REAL ESTATE - 5.5% | |||
| Equity Real Estate Investment Trusts (REITs) - 5.0% | |||
| Agree LP 4.8% 10/1/32 | 441,000 | 405,943 | |
| American Homes 4 Rent LP: | |||
| 3.375% 7/15/51 | 45,000 | 28,747 | |
| 4.3% 4/15/52 | 71,000 | 54,852 | |
| Camden Property Trust: | |||
| 2.8% 5/15/30 | 105,000 | 91,145 | |
| 3.15% 7/1/29 | 447,000 | 401,738 | |
| Corporate Office Properties LP 2% 1/15/29 | 278,000 | 218,911 | |
| Crown Castle International Corp. 2.25% 1/15/31 | 323,000 | 259,328 | |
| Hudson Pacific Properties LP: | |||
| 3.95% 11/1/27 | 422,000 | 331,712 | |
| 5.95% 2/15/28 | 355,000 | 300,194 | |
| Invitation Homes Operating Partnership LP: | |||
| 2% 8/15/31 | 395,000 | 302,250 | |
| 4.15% 4/15/32 | 153,000 | 136,170 | |
| Kite Realty Group Trust: | |||
| 4% 3/15/25 | 15,000 | 14,411 | |
| 4.75% 9/15/30 | 317,000 | 290,174 | |
| LXP Industrial Trust (REIT) 4.4% 6/15/24 | 242,000 | 237,201 | |
| MPT Operating Partnership LP/MPT Finance Corp. 3.5% 3/15/31 | 606,000 | 393,520 | |
| Omega Healthcare Investors, Inc.: | |||
| 3.25% 4/15/33 | 394,000 | 294,069 | |
| 3.625% 10/1/29 | 747,000 | 632,959 | |
| 4.5% 1/15/25 | 204,000 | 198,921 | |
| Piedmont Operating Partnership LP 2.75% 4/1/32 | 53,000 | 35,797 | |
| Realty Income Corp. 2.2% 6/15/28 | 27,000 | 23,433 | |
| Spirit Realty LP 2.1% 3/15/28 | 398,000 | 339,380 | |
| Store Capital Corp.: | |||
| 2.7% 12/1/31 | 450,000 | 318,375 | |
| 2.75% 11/18/30 | 67,000 | 49,152 | |
| Sun Communities Operating LP: | |||
| 2.3% 11/1/28 | 520,000 | 437,171 | |
| 2.7% 7/15/31 | 445,000 | 353,323 | |
| 4.2% 4/15/32 | 280,000 | 246,225 | |
| 5.7% 1/15/33 | 450,000 | 438,437 | |
| Ventas Realty LP 3% 1/15/30 | 767,000 | 653,478 | |
| VICI Properties LP: | |||
| 4.75% 2/15/28 | 348,000 | 330,926 | |
| 4.95% 2/15/30 | 540,000 | 507,924 | |
| 5.125% 5/15/32 | 41,000 | 38,000 | |
| Vornado Realty LP: | |||
| 2.15% 6/1/26 | 73,000 | 63,100 | |
| 3.4% 6/1/31 | 265,000 | 195,558 | |
| 8,622,524 | |||
| Real Estate Management & Development - 0.5% | |||
| Brandywine Operating Partnership LP 7.55% 3/15/28 | 153,000 | 143,462 | |
| Tanger Properties LP: | |||
| 2.75% 9/1/31 | 313,000 | 232,843 | |
| 3.125% 9/1/26 | 410,000 | 372,064 | |
| 748,369 | |||
TOTAL REAL ESTATE | 9,370,893 | ||
| UTILITIES - 8.0% | |||
| Electric Utilities - 3.5% | |||
| Cleco Corporate Holdings LLC: | |||
| 3.743% 5/1/26 | 1,701,000 | 1,597,418 | |
| 4.973% 5/1/46 | 356,000 | 285,601 | |
| Cleveland Electric Illuminating Co. 3.5% 4/1/28 (b) | 224,000 | 205,871 | |
| Duke Energy Corp.: | |||
| 4.5% 8/15/32 | 990,000 | 921,241 | |
| 5% 8/15/52 | 550,000 | 482,036 | |
| Duke Energy Industries, Inc. 4.9% 7/15/43 | 88,000 | 79,395 | |
| Duquesne Light Holdings, Inc.: | |||
| 2.532% 10/1/30 (b) | 86,000 | 68,539 | |
| 2.775% 1/7/32 (b) | 177,000 | 136,572 | |
| 3.616% 8/1/27 (b) | 250,000 | 226,605 | |
| Exelon Corp.: | |||
| 3.35% 3/15/32 | 838,000 | 720,009 | |
| 4.05% 4/15/30 | 240,000 | 221,759 | |
| 4.1% 3/15/52 | 213,000 | 164,804 | |
| FirstEnergy Corp.: | |||
| 2.25% 9/1/30 | 639,000 | 512,868 | |
| 4.15% 7/15/27 | 416,000 | 392,395 | |
| 6,015,113 | |||
| Gas Utilities - 0.4% | |||
| ONE Gas, Inc. 2% 5/15/30 | 254,000 | 208,138 | |
| Southern Co. Gas Capital Corp.: | |||
| 3.15% 9/30/51 | 416,000 | 268,829 | |
| 4.4% 5/30/47 | 204,000 | 163,395 | |
| 640,362 | |||
| Independent Power and Renewable Electricity Producers - 2.2% | |||
| Atlantica Sustainable Infrastructure PLC 4.125% 6/15/28 (b) | 550,000 | 490,433 | |
| Emera U.S. Finance LP: | |||
| 3.55% 6/15/26 | 1,271,000 | 1,202,479 | |
| 4.75% 6/15/46 | 426,000 | 333,426 | |
| The AES Corp.: | |||
| 1.375% 1/15/26 | 392,000 | 352,578 | |
| 2.45% 1/15/31 | 402,000 | 319,200 | |
| 3.3% 7/15/25 (b) | 804,000 | 764,499 | |
| 3.95% 7/15/30 (b) | 382,000 | 339,542 | |
| 3,802,157 | |||
| Multi-Utilities - 1.9% | |||
| Dominion Energy, Inc. 4.25% 6/1/28 | 343,000 | 327,092 | |
| NiSource, Inc.: | |||
| 3.49% 5/15/27 | 594,000 | 557,168 | |
| 3.6% 5/1/30 | 100,000 | 89,622 | |
| 3.95% 3/30/48 | 426,000 | 325,861 | |
| 4.8% 2/15/44 | 268,000 | 234,097 | |
| Puget Energy, Inc.: | |||
| 3.65% 5/15/25 | 848,000 | 813,961 | |
| 4.1% 6/15/30 | 744,000 | 665,440 | |
| Sempra 3.8% 2/1/38 | 342,000 | 278,461 | |
| 3,291,702 | |||
TOTAL UTILITIES | 13,749,334 | ||
| TOTAL NONCONVERTIBLE BONDS (Cost $167,940,164) | 146,955,294 | ||
| U.S. Treasury Obligations - 9.5% | |||
Principal Amount (a) | Value ($) | ||
| U.S. Treasury Bonds: | |||
| 1.875% 2/15/41 | 540,000 | 374,752 | |
| 2% 11/15/41 | 600,000 | 419,836 | |
| 3.625% 2/15/53 | 12,670,000 | 11,414,871 | |
| 3.625% 5/15/53 | 2,400,000 | 2,164,500 | |
| 4.125% 8/15/53 | 700,000 | 690,594 | |
| U.S. Treasury Notes 3.5% 2/15/33 | 1,215,000 | 1,157,098 | |
| TOTAL U.S. TREASURY OBLIGATIONS (Cost $17,577,604) | 16,221,651 | ||
| Asset-Backed Securities - 0.1% | |||
Principal Amount (a) | Value ($) | ||
Dominos Pizza Master Issuer LLC Series 2018-1A Class A2I, 4.116% 7/25/48 (b) (Cost $122,873) | 122,873 | 117,176 | |
| Bank Notes - 0.2% | |||
Principal Amount (a) | Value ($) | ||
Truist Bank 2.25% 3/11/30 (Cost $499,458) | 500,000 | 397,281 | |
| Preferred Securities - 0.6% | |||
Principal Amount (a) | Value ($) | ||
| ENERGY - 0.2% | |||
| Oil, Gas & Consumable Fuels - 0.2% | |||
| Enbridge, Inc. 5.75% 7/15/80 (c) | 355,000 | 325,763 | |
| FINANCIALS - 0.4% | |||
| Capital Markets - 0.4% | |||
| UBS Group AG: | |||
| 4.375% (b)(c)(e) | 265,000 | 196,263 | |
| 4.875% (b)(c)(e) | 570,000 | 476,739 | |
| 673,002 | |||
| TOTAL PREFERRED SECURITIES (Cost $1,200,948) | 998,765 | ||
| Money Market Funds - 3.4% | |||
| Shares | Value ($) | ||
Fidelity Cash Central Fund 5.43% (f) (Cost $5,830,999) | 5,829,915 | 5,831,081 | |
| TOTAL INVESTMENT IN SECURITIES - 99.5% (Cost $193,172,046) | 170,521,248 |
NET OTHER ASSETS (LIABILITIES) - 0.5% | 825,717 |
| NET ASSETS - 100.0% | 171,346,965 |
| (a) | Amount is stated in United States dollars unless otherwise noted. |
| (b) | Security exempt from registration under Rule 144A of the Securities Act of 1933. These securities may be resold in transactions exempt from registration, normally to qualified institutional buyers. At the end of the period, the value of these securities amounted to $24,426,657 or 14.3% of net assets. |
| (c) | Coupon rates for floating and adjustable rate securities reflect the rates in effect at period end. |
| (d) | Coupon is indexed to a floating interest rate which may be multiplied by a specified factor and/or subject to caps or floors. |
| (e) | Security is perpetual in nature with no stated maturity date. |
| (f) | Affiliated fund that is generally available only to investment companies and other accounts managed by Fidelity Investments. The rate quoted is the annualized seven-day yield of the fund at period end. A complete unaudited listing of the fund's holdings as of its most recent quarter end is available upon request. In addition, each Fidelity Central Fund's financial statements, which are not covered by the Fund's Report of Independent Registered Public Accounting Firm, are available on the SEC's website or upon request. |
| Affiliate | Value, beginning of period ($) | Purchases ($) | Sales Proceeds ($) | Dividend Income ($) | Realized Gain (loss) ($) | Change in Unrealized appreciation (depreciation) ($) | Value, end of period ($) | % ownership, end of period |
| Fidelity Cash Central Fund 5.43% | 6,102,184 | 29,588,128 | 29,859,231 | 203,060 | - | - | 5,831,081 | 0.0% |
| Total | 6,102,184 | 29,588,128 | 29,859,231 | 203,060 | - | - | 5,831,081 | |
| Valuation Inputs at Reporting Date: | ||||
| Description | Total ($) | Level 1 ($) | Level 2 ($) | Level 3 ($) |
Investments in Securities: | ||||
| Corporate Bonds | 146,955,294 | - | 146,955,294 | - |
| U.S. Government and Government Agency Obligations | 16,221,651 | - | 16,221,651 | - |
| Asset-Backed Securities | 117,176 | - | 117,176 | - |
| Bank Notes | 397,281 | - | 397,281 | - |
| Preferred Securities | 998,765 | - | 998,765 | - |
| Money Market Funds | 5,831,081 | 5,831,081 | - | - |
| Total Investments in Securities: | 170,521,248 | 5,831,081 | 164,690,167 | - |
| Statement of Assets and Liabilities | ||||
| August 31, 2023 | ||||
| Assets | ||||
| Investment in securities, at value - See accompanying schedule: | ||||
Unaffiliated issuers (cost $187,341,047) | $ | 164,690,167 | ||
Fidelity Central Funds (cost $5,830,999) | 5,831,081 | |||
| Total Investment in Securities (cost $193,172,046) | $ | 170,521,248 | ||
| Cash | 15,029 | |||
| Receivable for fund shares sold | 2,255,155 | |||
| Dividends receivable | 3,105 | |||
| Interest receivable | 1,779,875 | |||
| Distributions receivable from Fidelity Central Funds | 20,154 | |||
Total assets | 174,594,566 | |||
| Liabilities | ||||
| Payable for investments purchased | $ | 2,642,707 | ||
| Distributions payable | 555,000 | |||
| Accrued management fee | 49,894 | |||
| Total Liabilities | 3,247,601 | |||
| Net Assets | $ | 171,346,965 | ||
| Net Assets consist of: | ||||
| Paid in capital | $ | 203,444,230 | ||
| Total accumulated earnings (loss) | (32,097,265) | |||
| Net Assets | $ | 171,346,965 | ||
Net Asset Value, offering price and redemption price per share ($171,346,965 ÷ 3,800,000 shares) | $ | 45.09 | ||
| Statement of Operations | ||||
Year ended August 31, 2023 | ||||
| Investment Income | ||||
| Dividends | $ | 59,794 | ||
| Interest | 5,972,192 | |||
| Income from Fidelity Central Funds | 203,060 | |||
| Total Income | 6,235,046 | |||
| Expenses | ||||
| Management fee | $ | 555,102 | ||
| Independent trustees' fees and expenses | 558 | |||
| Total expenses before reductions | 555,660 | |||
| Expense reductions | (540) | |||
| Total expenses after reductions | 555,120 | |||
| Net Investment income (loss) | 5,679,926 | |||
| Realized and Unrealized Gain (Loss) | ||||
| Net realized gain (loss) on: | ||||
| Investment Securities: | ||||
| Unaffiliated issuers | (5,863,890) | |||
| Redemptions in-kind | (1,399,753) | |||
| Total net realized gain (loss) | (7,263,643) | |||
| Change in net unrealized appreciation (depreciation) on investment securities | 3,041,236 | |||
| Net gain (loss) | (4,222,407) | |||
| Net increase (decrease) in net assets resulting from operations | $ | 1,457,519 | ||
| Statement of Changes in Net Assets | ||||
Year ended August 31, 2023 | Year ended August 31, 2022 | |||
| Increase (Decrease) in Net Assets | ||||
| Operations | ||||
| Net investment income (loss) | $ | 5,679,926 | $ | 6,108,217 |
| Net realized gain (loss) | (7,263,643) | (9,167,989) | ||
| Change in net unrealized appreciation (depreciation) | 3,041,236 | (37,051,282) | ||
| Net increase (decrease) in net assets resulting from operations | 1,457,519 | (40,111,054) | ||
| Distributions to shareholders | (5,667,200) | (6,112,550) | ||
| Share transactions | ||||
| Proceeds from sales of shares | 43,194,326 | 11,095,233 | ||
| Cost of shares redeemed | (27,127,792) | (99,842,693) | ||
Net increase (decrease) in net assets resulting from share transactions | 16,066,534 | (88,747,460) | ||
| Total increase (decrease) in net assets | 11,856,853 | (134,971,064) | ||
| Net Assets | ||||
| Beginning of period | 159,490,112 | 294,461,176 | ||
| End of period | $ | 171,346,965 | $ | 159,490,112 |
| Other Information | ||||
| Shares | ||||
| Sold | 950,000 | 200,000 | ||
| Redeemed | (600,000) | (2,000,000) | ||
| Net increase (decrease) | 350,000 | (1,800,000) | ||
| Fidelity® Corporate Bond ETF |
| Years ended August 31, | 2023 | 2022 | 2021 | 2020 | 2019 | |||||
Selected Per-Share Data | ||||||||||
| Net asset value, beginning of period | $ | 46.23 | $ | 56.09 | $ | 55.93 | $ | 53.26 | $ | 48.64 |
| Income from Investment Operations | ||||||||||
Net investment income (loss) A,B | 1.663 | 1.339 | 1.321 | 1.546 | 1.732 | |||||
| Net realized and unrealized gain (loss) | (1.142) | (9.824) | .387 | 2.655 | 4.610 | |||||
| Total from investment operations | .521 | (8.485) | 1.708 | 4.201 | 6.342 | |||||
| Distributions from net investment income | (1.661) | (1.375) | (1.308) | (1.531) | (1.722) | |||||
| Distributions from net realized gain | - | - | (.244) | - | - | |||||
| Total distributions | (1.661) | (1.375) | (1.552) | (1.531) | (1.722) | |||||
| Net asset value, end of period | $ | 45.09 | $ | 46.23 | $ | 56.09 | $ | 55.93 | $ | 53.26 |
Total Return C,D | 1.19% | (15.30)% | 3.11% | 8.06% | 13.39% | |||||
Ratios to Average Net Assets B,E,F | ||||||||||
| Expenses before reductions | .36% | .36% | .36% | .36% | .36% | |||||
| Expenses net of fee waivers, if any | .36% | .36% | .36% | .36% | .36% | |||||
| Expenses net of all reductions | .36% | .36% | .36% | .36% | .36% | |||||
| Net investment income (loss) | 3.68% | 2.60% | 2.38% | 2.88% | 3.45% | |||||
| Supplemental Data | ||||||||||
| Net assets, end of period (000 omitted) | $ | 171,347 | $ | 159,490 | $ | 294,461 | $ | 206,932 | $ | 127,822 |
Portfolio turnover rate G | 28% H | 32% H | 26% H | 31% H | 40% |
| Average Annual Total Returns | |||
Periods ended August 31, 2023 | Past 1 year | Life of Fund |
Fidelity® Investment Grade Bond ETF - NAV A | -0.83% | -4.34% |
Fidelity® Investment Grade Bond ETF - Market Price B | -0.55% | -4.09% |
Bloomberg U.S. Aggregate Bond Index A | -1.19% | -4.65% |
| $10,000 Over Life of Fund |
Let's say hypothetically that $10,000 was invested in Fidelity® Investment Grade Bond ETF - NAV, on March 2, 2021, when the fund started. The chart shows how the value of your investment would have changed, and also shows how the Bloomberg U.S. Aggregate Bond Index performed over the same period. |
 |
Quality Diversification (% of Fund's net assets) |
 |
| We have used ratings from Moody's Investors Service, Inc. Where Moody's® ratings are not available, we have used S&P® ratings. All ratings are as of the date indicated and do not reflect subsequent changes. |
Asset Allocation (% of Fund's net assets) |
 |
Percentages in the above tables are adjusted for the effect of TBA Sale Commitments. |
| Nonconvertible Bonds - 30.9% | |||
Principal Amount (a) | Value ($) | ||
| COMMUNICATION SERVICES - 4.1% | |||
| Diversified Telecommunication Services - 1.8% | |||
| AT&T, Inc. 4.3% 2/15/30 | 288,000 | 268,521 | |
| Verizon Communications, Inc.: | |||
| 3.15% 3/22/30 | 204,000 | 178,927 | |
| 4.329% 9/21/28 | 80,000 | 76,619 | |
| 524,067 | |||
| Entertainment - 0.5% | |||
| The Walt Disney Co. 2.65% 1/13/31 | 174,000 | 149,064 | |
| Media - 1.5% | |||
| Charter Communications Operating LLC/Charter Communications Operating Capital Corp. 2.8% 4/1/31 | 338,000 | 272,362 | |
| Magallanes, Inc.: | |||
| 3.638% 3/15/25 | 3,000 | 2,903 | |
| 3.755% 3/15/27 | 6,000 | 5,628 | |
| 4.054% 3/15/29 | 2,000 | 1,839 | |
| 4.279% 3/15/32 | 77,000 | 67,948 | |
| 5.05% 3/15/42 | 3,000 | 2,466 | |
| 5.141% 3/15/52 | 42,000 | 33,479 | |
| Time Warner Cable LLC 5.5% 9/1/41 | 60,000 | 49,293 | |
| 435,918 | |||
| Wireless Telecommunication Services - 0.3% | |||
| T-Mobile U.S.A., Inc. 4.5% 4/15/50 | 126,000 | 104,078 | |
TOTAL COMMUNICATION SERVICES | 1,213,127 | ||
| CONSUMER DISCRETIONARY - 1.4% | |||
| Automobiles - 0.1% | |||
| General Motors Financial Co., Inc.: | |||
| 4% 1/15/25 | 36,000 | 34,995 | |
| 5.85% 4/6/30 | 5,000 | 4,897 | |
| 39,892 | |||
| Household Durables - 0.8% | |||
| Lennar Corp. 4.75% 11/29/27 | 244,000 | 236,588 | |
| Specialty Retail - 0.5% | |||
| Lowe's Companies, Inc.: | |||
| 3.35% 4/1/27 | 2,000 | 1,882 | |
| 3.75% 4/1/32 | 128,000 | 114,684 | |
| 4.25% 4/1/52 | 10,000 | 7,911 | |
| 4.45% 4/1/62 | 10,000 | 7,799 | |
| 132,276 | |||
| Textiles, Apparel & Luxury Goods - 0.0% | |||
| Tapestry, Inc. 3.05% 3/15/32 | 18,000 | 13,847 | |
TOTAL CONSUMER DISCRETIONARY | 422,603 | ||
| CONSUMER STAPLES - 1.9% | |||
| Beverages - 0.9% | |||
| Anheuser-Busch InBev Worldwide, Inc. 5.45% 1/23/39 | 267,000 | 271,036 | |
| Consumer Staples Distribution & Retail - 0.1% | |||
| Sysco Corp. 6.6% 4/1/50 | 27,000 | 29,769 | |
| Food Products - 0.9% | |||
| JBS U.S.A. Lux SA / JBS Food Co.: | |||
| 5.125% 2/1/28 | 5,000 | 4,859 | |
| 5.5% 1/15/30 | 243,000 | 235,283 | |
| 5.75% 4/1/33 | 10,000 | 9,517 | |
| 249,659 | |||
TOTAL CONSUMER STAPLES | 550,464 | ||
| ENERGY - 3.2% | |||
| Oil, Gas & Consumable Fuels - 3.2% | |||
| Columbia Pipelines Operating Co. LLC: | |||
| 5.927% 8/15/30 (b) | 3,000 | 3,026 | |
| 6.036% 11/15/33 (b) | 10,000 | 10,103 | |
| 6.497% 8/15/43 (b) | 3,000 | 3,041 | |
| 6.544% 11/15/53 (b) | 5,000 | 5,111 | |
| 6.714% 8/15/63 (b) | 3,000 | 3,067 | |
| DCP Midstream Operating LP 5.125% 5/15/29 | 117,000 | 114,087 | |
| Energy Transfer LP 4.95% 6/15/28 | 137,000 | 132,683 | |
| Hess Corp.: | |||
| 4.3% 4/1/27 | 144,000 | 138,528 | |
| 5.6% 2/15/41 | 2,000 | 1,880 | |
| MPLX LP 4.8% 2/15/29 | 137,000 | 132,006 | |
| Petroleos Mexicanos 7.69% 1/23/50 | 333,000 | 221,711 | |
| The Williams Companies, Inc.: | |||
| 4.65% 8/15/32 | 83,000 | 77,940 | |
| 5.3% 8/15/52 | 2,000 | 1,801 | |
| Western Gas Partners LP 4.05% 2/1/30 | 124,000 | 110,609 | |
| 955,593 | |||
| FINANCIALS - 12.2% | |||
| Banks - 6.4% | |||
| Bank of America Corp.: | |||
| 2.299% 7/21/32 (c) | 5,000 | 3,943 | |
| 4.183% 11/25/27 | 254,000 | 241,090 | |
| 5.015% 7/22/33 (c) | 328,000 | 315,686 | |
| Citigroup, Inc. 4.45% 9/29/27 | 236,000 | 225,583 | |
| JPMorgan Chase & Co.: | |||
| 4.493% 3/24/31 (c) | 500,000 | 473,954 | |
| 4.912% 7/25/33 (c) | 40,000 | 38,470 | |
| NatWest Group PLC 3.073% 5/22/28 (c) | 200,000 | 180,329 | |
| Wells Fargo & Co.: | |||
| 4.478% 4/4/31 (c) | 388,000 | 362,995 | |
| 4.897% 7/25/33 (c) | 40,000 | 37,637 | |
| 1,879,687 | |||
| Capital Markets - 4.1% | |||
| Ares Capital Corp. 3.875% 1/15/26 | 132,000 | 123,467 | |
| Deutsche Bank AG New York Branch 4.1% 1/13/26 | 100,000 | 95,387 | |
| Goldman Sachs Group, Inc.: | |||
| 2.383% 7/21/32 (c) | 4,000 | 3,162 | |
| 3.8% 3/15/30 | 543,000 | 493,931 | |
| Morgan Stanley: | |||
| 4.431% 1/23/30 (c) | 493,000 | 468,179 | |
| 6.342% 10/18/33 (c) | 40,000 | 41,906 | |
| 1,226,032 | |||
| Consumer Finance - 1.1% | |||
| Ally Financial, Inc.: | |||
| 2.2% 11/2/28 | 11,000 | 8,874 | |
| 7.1% 11/15/27 | 87,000 | 88,141 | |
| 8% 11/1/31 | 45,000 | 46,529 | |
| Capital One Financial Corp.: | |||
| 2.359% 7/29/32 (c) | 16,000 | 11,414 | |
| 3.8% 1/31/28 | 152,000 | 139,377 | |
| 4.985% 7/24/26 (c) | 6,000 | 5,865 | |
| 5.247% 7/26/30 (c) | 9,000 | 8,562 | |
| Discover Financial Services 6.7% 11/29/32 | 2,000 | 1,991 | |
| 310,753 | |||
| Financial Services - 0.4% | |||
| Blackstone Private Credit Fund 7.05% 9/29/25 | 8,000 | 8,055 | |
| Brixmor Operating Partnership LP 4.05% 7/1/30 | 56,000 | 50,591 | |
| Corebridge Financial, Inc.: | |||
| 3.85% 4/5/29 | 49,000 | 44,842 | |
| 3.9% 4/5/32 | 3,000 | 2,623 | |
| 4.35% 4/5/42 | 2,000 | 1,582 | |
| 4.4% 4/5/52 | 2,000 | 1,547 | |
| Jackson Financial, Inc.: | |||
| 3.125% 11/23/31 | 2,000 | 1,572 | |
| 5.17% 6/8/27 | 4,000 | 3,921 | |
| 5.67% 6/8/32 | 4,000 | 3,810 | |
| 118,543 | |||
| Insurance - 0.2% | |||
| Unum Group 4% 6/15/29 | 56,000 | 51,330 | |
TOTAL FINANCIALS | 3,586,345 | ||
| HEALTH CARE - 2.5% | |||
| Biotechnology - 0.5% | |||
| Amgen, Inc.: | |||
| 5.15% 3/2/28 | 7,000 | 6,993 | |
| 5.25% 3/2/30 | 119,000 | 119,165 | |
| 5.25% 3/2/33 | 7,000 | 6,964 | |
| 5.6% 3/2/43 | 7,000 | 6,869 | |
| 5.65% 3/2/53 | 3,000 | 2,974 | |
| 5.75% 3/2/63 | 6,000 | 5,925 | |
| 148,890 | |||
| Health Care Providers & Services - 1.5% | |||
| Centene Corp.: | |||
| 2.45% 7/15/28 | 13,000 | 11,129 | |
| 2.625% 8/1/31 | 5,000 | 3,978 | |
| 4.625% 12/15/29 | 218,000 | 200,451 | |
| Cigna Group 4.8% 8/15/38 | 239,000 | 220,315 | |
| Humana, Inc. 3.7% 3/23/29 | 3,000 | 2,778 | |
| Sabra Health Care LP 3.2% 12/1/31 | 12,000 | 9,166 | |
| 447,817 | |||
| Pharmaceuticals - 0.5% | |||
| Viatris, Inc. 2.7% 6/22/30 | 176,000 | 142,935 | |
TOTAL HEALTH CARE | 739,642 | ||
| INDUSTRIALS - 1.1% | |||
| Aerospace & Defense - 0.8% | |||
| The Boeing Co. 5.15% 5/1/30 | 232,000 | 228,250 | |
| Transportation Infrastructure - 0.3% | |||
| Avolon Holdings Funding Ltd.: | |||
| 3.95% 7/1/24 (b) | 68,000 | 66,329 | |
| 6.375% 5/4/28 (b) | 21,000 | 20,831 | |
| 87,160 | |||
TOTAL INDUSTRIALS | 315,410 | ||
| INFORMATION TECHNOLOGY - 1.1% | |||
| Electronic Equipment, Instruments & Components - 0.3% | |||
| Dell International LLC/EMC Corp. 6.2% 7/15/30 | 100,000 | 102,911 | |
| Semiconductors & Semiconductor Equipment - 0.6% | |||
| Broadcom, Inc. 2.45% 2/15/31 (b) | 163,000 | 131,410 | |
| Marvell Technology, Inc. 2.95% 4/15/31 | 38,000 | 31,707 | |
| 163,117 | |||
| Software - 0.2% | |||
| Oracle Corp. 3.6% 4/1/40 | 74,000 | 56,003 | |
| VMware, Inc. 1.4% 8/15/26 | 7,000 | 6,207 | |
| 62,210 | |||
TOTAL INFORMATION TECHNOLOGY | 328,238 | ||
| MATERIALS - 0.1% | |||
| Chemicals - 0.1% | |||
| Celanese U.S. Holdings LLC: | |||
| 6.35% 11/15/28 | 14,000 | 14,036 | |
| 6.55% 11/15/30 | 17,000 | 17,008 | |
| 6.7% 11/15/33 | 9,000 | 9,038 | |
| 40,082 | |||
| REAL ESTATE - 2.1% | |||
| Equity Real Estate Investment Trusts (REITs) - 1.8% | |||
| American Homes 4 Rent LP: | |||
| 2.375% 7/15/31 | 1,000 | 792 | |
| 3.375% 7/15/51 | 2,000 | 1,278 | |
| 3.625% 4/15/32 | 3,000 | 2,570 | |
| 4.3% 4/15/52 | 2,000 | 1,545 | |
| Corporate Office Properties LP 2.75% 4/15/31 | 149,000 | 114,839 | |
| Invitation Homes Operating Partnership LP 2% 8/15/31 | 161,000 | 123,195 | |
| Kite Realty Group Trust 4.75% 9/15/30 | 74,000 | 67,738 | |
| LXP Industrial Trust (REIT) 2.7% 9/15/30 | 66,000 | 52,299 | |
| Omega Healthcare Investors, Inc.: | |||
| 3.25% 4/15/33 | 103,000 | 76,876 | |
| 3.625% 10/1/29 | 74,000 | 62,703 | |
| Piedmont Operating Partnership LP 2.75% 4/1/32 | 2,000 | 1,351 | |
| Sun Communities Operating LP: | |||
| 2.3% 11/1/28 | 2,000 | 1,681 | |
| 2.7% 7/15/31 | 8,000 | 6,352 | |
| VICI Properties LP: | |||
| 4.375% 5/15/25 | 2,000 | 1,944 | |
| 4.75% 2/15/28 | 7,000 | 6,657 | |
| 4.95% 2/15/30 | 7,000 | 6,584 | |
| Vornado Realty LP: | |||
| 2.15% 6/1/26 | 1,000 | 864 | |
| 3.4% 6/1/31 | 3,000 | 2,214 | |
| 531,482 | |||
| Real Estate Management & Development - 0.3% | |||
| Brandywine Operating Partnership LP 7.55% 3/15/28 | 9,000 | 8,439 | |
| CBRE Group, Inc. 2.5% 4/1/31 | 8,000 | 6,425 | |
| Tanger Properties LP: | |||
| 2.75% 9/1/31 | 6,000 | 4,463 | |
| 3.875% 7/15/27 | 74,000 | 66,061 | |
| 85,388 | |||
TOTAL REAL ESTATE | 616,870 | ||
| UTILITIES - 1.2% | |||
| Electric Utilities - 0.4% | |||
| Cleco Corporate Holdings LLC 3.743% 5/1/26 | 60,000 | 56,346 | |
| Duquesne Light Holdings, Inc.: | |||
| 2.532% 10/1/30 (b) | 74,000 | 58,976 | |
| 2.775% 1/7/32 (b) | 6,000 | 4,630 | |
| 119,952 | |||
| Independent Power and Renewable Electricity Producers - 0.5% | |||
| The AES Corp.: | |||
| 2.45% 1/15/31 | 3,000 | 2,382 | |
| 3.95% 7/15/30 (b) | 158,000 | 140,439 | |
| 142,821 | |||
| Multi-Utilities - 0.3% | |||
| NiSource, Inc. 3.6% 5/1/30 | 90,000 | 80,660 | |
TOTAL UTILITIES | 343,433 | ||
| TOTAL NONCONVERTIBLE BONDS (Cost $9,602,583) | 9,111,807 | ||
| U.S. Treasury Obligations - 48.0% | |||
Principal Amount (a) | Value ($) | ||
| U.S. Treasury Bonds: | |||
| 2.25% 5/15/41 | 22,600 | 16,652 | |
| 2.375% 5/15/51 | 1,265,000 | 879,224 | |
| 2.875% 5/15/52 | 113,000 | 87,721 | |
| 3.625% 2/15/53 | 1,772,000 | 1,596,461 | |
| 3.625% 5/15/53 | 300,000 | 270,563 | |
| U.S. Treasury Notes: | |||
| 1.25% 4/30/28 | 165,100 | 143,985 | |
| 2.75% 8/15/32 | 440,000 | 394,952 | |
| 2.875% 5/15/32 | 397,000 | 360,789 | |
| 3.375% 5/15/33 | 400,000 | 376,813 | |
| 3.5% 1/31/30 | 2,356,000 | 2,260,008 | |
| 3.5% 2/15/33 | 1,487,000 | 1,416,135 | |
| 3.625% 3/31/28 | 120,000 | 116,653 | |
| 3.625% 3/31/30 | 100,000 | 96,594 | |
| 3.75% 5/31/30 | 544,000 | 529,316 | |
| 3.75% 6/30/30 | 300,000 | 291,891 | |
| 3.875% 11/30/27 | 1,206,000 | 1,183,859 | |
| 3.875% 11/30/29 | 1,000,000 | 979,961 | |
| 3.875% 12/31/29 | 80,000 | 78,391 | |
| 4% 6/30/28 | 440,000 | 434,741 | |
| 4% 2/28/30 | 490,000 | 483,760 | |
| 4.125% 7/31/28 | 2,000,000 | 1,988,281 | |
| 4.125% 11/15/32 | 187,000 | 186,912 | |
| TOTAL U.S. TREASURY OBLIGATIONS (Cost $14,746,144) | 14,173,662 | ||
| U.S. Government Agency - Mortgage Securities - 9.9% | |||
Principal Amount (a) | Value ($) | ||
| Fannie Mae - 1.5% | |||
| 2% 6/1/35 to 1/1/52 | 158,065 | 132,363 | |
| 2.5% 2/1/37 to 7/1/51 | 270,889 | 241,306 | |
| 3.5% 11/1/45 to 3/1/52 | 75,156 | 68,542 | |
TOTAL FANNIE MAE | 442,211 | ||
| Freddie Mac - 0.8% | |||
| 1.5% 12/1/35 to 4/1/51 | 100,921 | 78,970 | |
| 2.5% 7/1/36 to 2/1/51 | 73,567 | 64,214 | |
| 3% 2/1/50 | 63,029 | 55,069 | |
| 5.5% 3/1/53 | 48,358 | 48,478 | |
TOTAL FREDDIE MAC | 246,731 | ||
| Ginnie Mae - 2.3% | |||
| 2% 9/1/53 (d) | 50,000 | 41,250 | |
| 2% 9/1/53 (d) | 50,000 | 41,250 | |
| 2% 9/1/53 (d) | 50,000 | 41,250 | |
| 2% 9/1/53 (d) | 25,000 | 20,625 | |
| 2% 10/1/53 (d) | 100,000 | 82,586 | |
| 2.5% 9/1/53 (d) | 50,000 | 42,559 | |
| 2.5% 9/1/53 (d) | 50,000 | 42,559 | |
| 3% 9/1/53 (d) | 25,000 | 21,982 | |
| 3% 9/1/53 (d) | 50,000 | 43,965 | |
| 3% 9/1/53 (d) | 25,000 | 21,982 | |
| 3% 10/1/53 (d) | 50,000 | 43,994 | |
| 3.5% 9/1/53 (d) | 50,000 | 45,398 | |
| 3.5% 9/1/53 (d) | 25,000 | 22,699 | |
| 3.5% 9/1/53 (d) | 25,000 | 22,699 | |
| 4% 9/1/53 (d) | 50,000 | 46,594 | |
| 4.5% 9/1/53 (d) | 50,000 | 47,649 | |
| 5% 9/1/53 (d) | 25,000 | 24,327 | |
| 5.5% 9/1/53 (d) | 25,000 | 24,754 | |
TOTAL GINNIE MAE | 678,122 | ||
| Uniform Mortgage Backed Securities - 5.3% | |||
| 2% 9/1/38 (d) | 100,000 | 87,703 | |
| 2% 9/1/53 (d) | 50,000 | 39,803 | |
| 2% 9/1/53 (d) | 50,000 | 39,803 | |
| 2% 9/1/53 (d) | 100,000 | 79,606 | |
| 2% 9/1/53 (d) | 75,000 | 59,705 | |
| 2% 9/1/53 (d) | 50,000 | 39,803 | |
| 2% 9/1/53 (d) | 25,000 | 19,902 | |
| 2% 9/1/53 (d) | 50,000 | 39,803 | |
| 2% 9/1/53 (d) | 50,000 | 39,803 | |
| 2% 10/1/53 (d) | 100,000 | 79,720 | |
| 2% 10/1/53 (d) | 50,000 | 39,860 | |
| 2% 10/1/53 (d) | 50,000 | 39,860 | |
| 2% 10/1/53 (d) | 50,000 | 39,860 | |
| 2.5% 9/1/53 (d) | 100,000 | 82,879 | |
| 2.5% 9/1/53 (d) | 50,000 | 41,439 | |
| 2.5% 9/1/53 (d) | 50,000 | 41,439 | |
| 2.5% 9/1/53 (d) | 100,000 | 82,879 | |
| 3% 9/1/53 (d) | 50,000 | 43,076 | |
| 3% 9/1/53 (d) | 75,000 | 64,614 | |
| 3% 9/1/53 (d) | 25,000 | 21,538 | |
| 3.5% 9/1/53 (d) | 50,000 | 44,678 | |
| 4% 9/1/53 (d) | 75,000 | 69,234 | |
| 4% 9/1/53 (d) | 50,000 | 46,156 | |
| 4% 9/1/53 (d) | 25,000 | 23,078 | |
| 4.5% 9/1/53 (d) | 50,000 | 47,414 | |
| 5% 9/1/53 (d) | 125,000 | 121,206 | |
| 5.5% 9/1/53 (d) | 50,000 | 49,391 | |
| 5.5% 9/1/53 (d) | 100,000 | 98,781 | |
| 5.5% 9/1/53 (d) | 25,000 | 24,695 | |
TOTAL UNIFORM MORTGAGE BACKED SECURITIES | 1,547,728 | ||
| TOTAL U.S. GOVERNMENT AGENCY - MORTGAGE SECURITIES (Cost $2,977,763) | 2,914,792 | ||
| Asset-Backed Securities - 4.8% | |||
Principal Amount (a) | Value ($) | ||
| AIMCO CLO Series 2021-AA Class AR2, CME Term SOFR 3 Month Index + 1.400% 6.7096% 10/17/34 (b)(c)(e) | 250,000 | 247,719 | |
| Cedar Funding Ltd. Series 2022-15A Class A, CME Term SOFR 3 Month Index + 1.320% 6.6461% 4/20/35 (b)(c)(e) | 100,000 | 98,694 | |
| Eaton Vance CLO, Ltd. Series 2021-2A Class AR, CME Term SOFR 3 Month Index + 1.410% 6.7196% 1/15/35 (b)(c)(e) | 100,000 | 99,182 | |
| Flatiron CLO Ltd. / Flatiron CLO LLC Series 2020-1A Class A, CME Term SOFR 3 Month Index + 1.560% 6.9414% 11/20/33 (b)(c)(e) | 100,000 | 99,880 | |
| Madison Park Funding XLV Ltd./Madison Park Funding XLV LLC Series 2021-45A Class AR, CME Term SOFR 3 Month Index + 1.380% 6.6896% 7/15/34 (b)(c)(e) | 250,000 | 247,978 | |
| Magnetite CLO LTD Series 2023-36A Class A, CME Term SOFR 3 Month Index + 1.800% 6.9585% 4/22/36 (b)(c)(e) | 250,000 | 250,573 | |
| SYMP Series 2022-32A Class A1, CME Term SOFR 3 Month Index + 1.320% 6.6656% 4/23/35 (b)(c)(e) | 250,000 | 246,857 | |
| Thunderbolt Aircraft Lease Ltd. Series 2018-A Class A, 4.147% 9/15/38 (b)(c) | 166,290 | 141,350 | |
| TOTAL ASSET-BACKED SECURITIES (Cost $1,457,213) | 1,432,233 | ||
| Commercial Mortgage Securities - 2.6% | |||
Principal Amount (a) | Value ($) | ||
| BPR Trust floater Series 2022-OANA Class A, CME Term SOFR 1 Month Index + 1.890% 7.2085% 4/15/37 (b)(c)(e) | 15,000 | 14,729 | |
| BX Commercial Mortgage Trust floater Series 2021-PAC: | |||
| Class B, CME Term SOFR 1 Month Index + 1.010% 6.3233% 10/15/36 (b)(c)(e) | 100,000 | 96,926 | |
| Class C, CME Term SOFR 1 Month Index + 1.210% 6.5231% 10/15/36 (b)(c)(e) | 100,000 | 96,613 | |
| BX Trust floater: | |||
| Series 2019-XL Class C, CME Term SOFR 1 Month Index + 1.360% 6.675% 10/15/36 (b)(c)(e) | 85,000 | 84,355 | |
| Series 2022-IND: | |||
Class A, CME Term SOFR 1 Month Index + 1.490% 6.8015% 4/15/37 (b)(c)(e) | 8,021 | 7,984 | |
Class B, CME Term SOFR 1 Month Index + 1.940% 7.2505% 4/15/37 (b)(c)(e) | 8,021 | 7,888 | |
| CF Hippolyta Issuer LLC sequential payer Series 2021-1A Class A1, 1.53% 3/15/61 (b) | 94,245 | 82,787 | |
| Extended Stay America Trust floater Series 2021-ESH Class D, CME Term SOFR 1 Month Index + 2.360% 7.6745% 7/15/38 (b)(c)(e) | 95,431 | 93,873 | |
| GS Mortgage Securities Trust floater Series 2021-IP Class C, CME Term SOFR 1 Month Index + 1.660% 6.9755% 10/15/36 (b)(c)(e) | 100,000 | 92,107 | |
| LIFE Mortgage Trust floater Series 2021-BMR Class E, CME Term SOFR 1 Month Index + 1.860% 7.1745% 3/15/38 (b)(c)(e) | 98,297 | 94,593 | |
| SREIT Trust floater Series 2021-MFP Class D, CME Term SOFR 1 Month Index + 1.690% 7.0032% 11/15/38 (b)(c)(e) | 100,000 | 97,232 | |
| TOTAL COMMERCIAL MORTGAGE SECURITIES (Cost $799,441) | 769,087 | ||
| Money Market Funds - 11.7% | |||
| Shares | Value ($) | ||
Fidelity Cash Central Fund 5.43% (f) (Cost $3,456,667) | 3,455,976 | 3,456,667 | |
| TOTAL INVESTMENT IN SECURITIES - 107.9% (Cost $33,039,811) | 31,858,248 |
NET OTHER ASSETS (LIABILITIES) - (7.9)% | (2,327,331) |
| NET ASSETS - 100.0% | 29,530,917 |
| TBA Sale Commitments | ||
Principal Amount (a) | Value ($) | |
| Ginnie Mae | ||
| 2% 9/1/53 | (100,000) | (82,500) |
| 3% 9/1/53 | (50,000) | (43,965) |
| TOTAL GINNIE MAE | (126,465) | |
| Uniform Mortgage Backed Securities | ||
| 2% 9/1/53 | (100,000) | (79,606) |
| 2% 9/1/53 | (50,000) | (39,803) |
| 2% 9/1/53 | (50,000) | (39,803) |
| 2% 9/1/53 | (50,000) | (39,803) |
| TOTAL UNIFORM MORTGAGE BACKED SECURITIES | (199,015) | |
TOTAL TBA SALE COMMITMENTS (Proceeds $321,589) | (325,480) | |
| (a) | Amount is stated in United States dollars unless otherwise noted. |
| (b) | Security exempt from registration under Rule 144A of the Securities Act of 1933. These securities may be resold in transactions exempt from registration, normally to qualified institutional buyers. At the end of the period, the value of these securities amounted to $2,648,283 or 9.0% of net assets. |
| (c) | Coupon rates for floating and adjustable rate securities reflect the rates in effect at period end. |
| (d) | Security or a portion of the security purchased on a delayed delivery or when-issued basis. |
| (e) | Coupon is indexed to a floating interest rate which may be multiplied by a specified factor and/or subject to caps or floors. |
| (f) | Affiliated fund that is generally available only to investment companies and other accounts managed by Fidelity Investments. The rate quoted is the annualized seven-day yield of the fund at period end. A complete unaudited listing of the fund's holdings as of its most recent quarter end is available upon request. In addition, each Fidelity Central Fund's financial statements, which are not covered by the Fund's Report of Independent Registered Public Accounting Firm, are available on the SEC's website or upon request. |
| Affiliate | Value, beginning of period ($) | Purchases ($) | Sales Proceeds ($) | Dividend Income ($) | Realized Gain (loss) ($) | Change in Unrealized appreciation (depreciation) ($) | Value, end of period ($) | % ownership, end of period |
| Fidelity Cash Central Fund 5.43% | 666,354 | 7,429,765 | 4,639,452 | 90,859 | - | - | 3,456,667 | 0.0% |
| Total | 666,354 | 7,429,765 | 4,639,452 | 90,859 | - | - | 3,456,667 | |
| Valuation Inputs at Reporting Date: | ||||
| Description | Total ($) | Level 1 ($) | Level 2 ($) | Level 3 ($) |
Investments in Securities: | ||||
| Corporate Bonds | 9,111,807 | - | 9,111,807 | - |
| U.S. Government and Government Agency Obligations | 14,173,662 | - | 14,173,662 | - |
| U.S. Government Agency - Mortgage Securities | 2,914,792 | - | 2,914,792 | - |
| Asset-Backed Securities | 1,432,233 | - | 1,432,233 | - |
| Commercial Mortgage Securities | 769,087 | - | 769,087 | - |
| Money Market Funds | 3,456,667 | 3,456,667 | - | - |
| Total Investments in Securities: | 31,858,248 | 3,456,667 | 28,401,581 | - |
Other Financial Instruments: | ||||
| TBA Sale Commitments | (325,480) | - | (325,480) | - |
| Total Other Financial Instruments: | (325,480) | - | (325,480) | - |
| Statement of Assets and Liabilities | ||||
| August 31, 2023 | ||||
| Assets | ||||
| Investment in securities, at value - See accompanying schedule: | ||||
Unaffiliated issuers (cost $29,583,144) | $ | 28,401,581 | ||
Fidelity Central Funds (cost $3,456,667) | 3,456,667 | |||
| Total Investment in Securities (cost $33,039,811) | $ | 31,858,248 | ||
| Cash | 1,689 | |||
| Receivable for TBA sale commitments | 321,589 | |||
| Interest receivable | 205,311 | |||
| Distributions receivable from Fidelity Central Funds | 14,013 | |||
| Receivable from investment adviser for expense reductions | 230 | |||
Total assets | 32,401,080 | |||
| Liabilities | ||||
| Payable for investments purchased | ||||
Regular delivery | $ | 199,947 | ||
Delayed delivery | 2,236,717 | |||
| TBA sale commitments, at value | 325,480 | |||
| Distributions payable | 99,400 | |||
| Accrued management fee | 7,965 | |||
| Other payables and accrued expenses | 654 | |||
| Total Liabilities | 2,870,163 | |||
| Net Assets | $ | 29,530,917 | ||
| Net Assets consist of: | ||||
| Paid in capital | $ | 31,112,083 | ||
| Total accumulated earnings (loss) | (1,581,166) | |||
| Net Assets | $ | 29,530,917 | ||
Net Asset Value, offering price and redemption price per share ($29,530,917 ÷ 700,000 shares) | $ | 42.19 | ||
| Statement of Operations | ||||
Year ended August 31, 2023 | ||||
| Investment Income | ||||
| Interest | $ | 496,454 | ||
| Income from Fidelity Central Funds | 90,859 | |||
| Total Income | 587,313 | |||
| Expenses | ||||
| Management fee | $ | 50,462 | ||
| Independent trustees' fees and expenses | 39 | |||
| Miscellaneous | 654 | |||
| Total expenses before reductions | 51,155 | |||
| Expense reductions | (1,001) | |||
| Total expenses after reductions | 50,154 | |||
| Net Investment income (loss) | 537,159 | |||
| Realized and Unrealized Gain (Loss) | ||||
| Net realized gain (loss) on: | ||||
| Investment Securities: | ||||
| Unaffiliated issuers | (230,687) | |||
| Total net realized gain (loss) | (230,687) | |||
| Change in net unrealized appreciation (depreciation) on: | ||||
| Investment Securities: | ||||
| Unaffiliated issuers | (412,242) | |||
| TBA Sale commitments | (3,891) | |||
| Total change in net unrealized appreciation (depreciation) | (416,133) | |||
| Net gain (loss) | (646,820) | |||
| Net increase (decrease) in net assets resulting from operations | $ | (109,661) | ||
| Statement of Changes in Net Assets | ||||
Year ended August 31, 2023 | Year ended August 31, 2022 | |||
| Increase (Decrease) in Net Assets | ||||
| Operations | ||||
| Net investment income (loss) | $ | 537,159 | $ | 138,700 |
| Net realized gain (loss) | (230,687) | (215,358) | ||
| Change in net unrealized appreciation (depreciation) | (416,133) | (929,961) | ||
| Net increase (decrease) in net assets resulting from operations | (109,661) | (1,006,619) | ||
| Distributions to shareholders | (532,050) | (144,300) | ||
| Share transactions | ||||
| Proceeds from sales of shares | 23,565,192 | - | ||
| Cost of shares redeemed | - | (2,393,113) | ||
Net increase (decrease) in net assets resulting from share transactions | 23,565,192 | (2,393,113) | ||
| Total increase (decrease) in net assets | 22,923,481 | (3,544,032) | ||
| Net Assets | ||||
| Beginning of period | 6,607,436 | 10,151,468 | ||
| End of period | $ | 29,530,917 | $ | 6,607,436 |
| Other Information | ||||
| Shares | ||||
| Sold | 550,000 | - | ||
| Redeemed | - | (50,000) | ||
| Net increase (decrease) | 550,000 | (50,000) | ||
| Fidelity® Investment Grade Bond ETF |
| Years ended August 31, | 2023 | 2022 | 2021 A | |||
Selected Per-Share Data | ||||||
| Net asset value, beginning of period | $ | 44.05 | $ | 50.76 | $ | 50.00 |
| Income from Investment Operations | ||||||
Net investment income (loss) B,C | 1.615 | .788 | .287 | |||
| Net realized and unrealized gain (loss) | (1.987) | (6.657) | .790 | |||
| Total from investment operations | (.372) | (5.869) | 1.077 | |||
| Distributions from net investment income | (1.488) | (.841) | (.317) | |||
| Total distributions | (1.488) | (.841) | (.317) | |||
| Net asset value, end of period | $ | 42.19 | $ | 44.05 | $ | 50.76 |
Total Return D,E,F | (.83)% | (11.65)% | 2.16% | |||
Ratios to Average Net Assets C,G,H | ||||||
| Expenses before reductions | .36% | .36% | .36% I | |||
| Expenses net of fee waivers, if any | .36% | .36% | .36% I | |||
| Expenses net of all reductions | .36% | .36% | .36% I | |||
| Net investment income (loss) | 3.80% | 1.65% | 1.14% I | |||
| Supplemental Data | ||||||
| Net assets, end of period (000 omitted) | $ | 29,531 | $ | 6,607 | $ | 10,151 |
Portfolio turnover rate J | 190% | 37% K | 19% L |
| Average Annual Total Returns | |||
Periods ended August 31, 2023 | Past 1 year | Life of Fund |
Fidelity® Investment Grade Securitized ETF - NAV A | -2.10% | -5.01% |
Fidelity® Investment Grade Securitized ETF - Market Price B | -2.19% | -5.00% |
Bloomberg U.S. Securitized Index A | -1.96% | -4.70% |
| $10,000 Over Life of Fund |
Let's say hypothetically that $10,000 was invested in Fidelity® Investment Grade Securitized ETF - NAV, on March 2, 2021, when the fund started. The chart shows how the value of your investment would have changed, and also shows how the Bloomberg U.S. Securitized Index performed over the same period. |
 |
Quality Diversification (% of Fund's net assets) |
 |
Short-Term Investments and Net Other Assets (Liabilities) - (37.4)%* |
| We have used ratings from Moody's Investors Service, Inc. Where Moody's® ratings are not available, we have used S&P® ratings. All ratings are as of the date indicated and do not reflect subsequent changes. |
Asset Allocation (% of Fund's net assets) |
 |
Short-Term Investments and Net Other Assets (Liabilities) - (37.4)% |
Futures and Swaps - 32.4% |
Percentages in the above tables are adjusted for the effect of TBA Sale Commitments. |
| U.S. Treasury Obligations - 17.6% | |||
Principal Amount (a) | Value ($) | ||
| U.S. Treasury Bonds: | |||
| 3.625% 2/15/53 | 77,000 | 69,372 | |
| 3.625% 5/15/53 | 49,000 | 44,192 | |
| 4.125% 8/15/53 | 13,000 | 12,825 | |
| U.S. Treasury Notes: | |||
| 3.375% 5/15/33 | 37,000 | 34,855 | |
| 3.5% 2/15/33 | 25,000 | 23,809 | |
| 3.625% 5/15/26 | 158,000 | 154,063 | |
| 3.75% 4/15/26 | 35,000 | 34,244 | |
| 3.75% 6/30/30 | 6,000 | 5,838 | |
| 3.875% 4/30/25 | 10,000 | 9,818 | |
| 3.875% 1/15/26 | 11,000 | 10,792 | |
| 4% 7/31/30 | 11,000 | 10,869 | |
| 4.125% 8/31/30 | 21,000 | 20,905 | |
| 4.25% 12/31/24 | 66,000 | 65,193 | |
| 4.375% 10/31/24 | 41,000 | 40,576 | |
| 4.625% 2/28/25 | 12,000 | 11,917 | |
| TOTAL U.S. TREASURY OBLIGATIONS (Cost $562,916) | 549,268 | ||
| U.S. Government Agency - Mortgage Securities - 119.2% | |||
Principal Amount (a) | Value ($) | ||
| Fannie Mae - 28.2% | |||
| 1.5% 1/1/37 to 1/1/51 | 122,943 | 99,718 | |
| 2% 11/1/41 | 24,578 | 20,487 | |
| 2.5% 12/1/32 to 1/1/52 | 224,799 | 195,590 | |
| 3% 11/1/34 to 5/1/52 | 96,729 | 87,008 | |
| 3.5% 3/1/45 to 7/1/51 | 156,868 | 142,551 | |
| 4% 5/1/40 to 6/1/52 | 104,196 | 97,554 | |
| 4.5% 7/1/47 to 7/1/52 | 127,243 | 123,103 | |
| 5% 10/1/52 to 12/1/52 (b)(c) | 95,744 | 93,176 | |
| 6% 11/1/52 | 23,775 | 23,876 | |
TOTAL FANNIE MAE | 883,063 | ||
| Freddie Mac - 29.4% | |||
| 1.5% 1/1/51 to 4/1/51 | 114,360 | 86,380 | |
| 2% 6/1/35 to 11/1/51 | 379,208 | 318,467 | |
| 2.5% 7/1/36 to 2/1/51 | 306,332 | 261,803 | |
| 3% 9/1/34 | 22,573 | 21,025 | |
| 3.5% 8/1/51 | 43,126 | 38,910 | |
| 4% 3/1/49 | 54,323 | 50,781 | |
| 5.5% 10/1/52 to 4/1/53 | 142,154 | 141,238 | |
TOTAL FREDDIE MAC | 918,604 | ||
| Ginnie Mae - 24.7% | |||
| 2% 1/20/51 | 35,982 | 29,783 | |
| 2% 9/1/53 (d) | 50,000 | 41,250 | |
| 2% 9/1/53 (d) | 100,000 | 82,500 | |
| 2% 9/1/53 (d) | 50,000 | 41,250 | |
| 2% 9/1/53 (d) | 25,000 | 20,625 | |
| 2% 10/1/53 (d) | 100,000 | 82,586 | |
| 2.5% 7/20/51 | 80,552 | 68,653 | |
| 2.5% 9/1/53 (d) | 50,000 | 42,559 | |
| 2.5% 9/1/53 (d) | 50,000 | 42,559 | |
| 3% 9/1/53 (d) | 50,000 | 43,965 | |
| 3% 9/1/53 (d) | 25,000 | 21,982 | |
| 3% 9/1/53 (d) | 50,000 | 43,965 | |
| 3% 10/1/53 (d) | 50,000 | 43,994 | |
| 3.5% 9/1/53 (d) | 25,000 | 22,699 | |
| 3.5% 9/1/53 (d) | 25,000 | 22,699 | |
| 4.5% 9/1/53 (d) | 50,000 | 47,649 | |
| 5% 9/1/53 (d) | 25,000 | 24,327 | |
| 5.5% 9/1/53 (d) | 50,000 | 49,508 | |
TOTAL GINNIE MAE | 772,553 | ||
| Uniform Mortgage Backed Securities - 36.9% | |||
| 1.5% 9/1/53 (d) | 25,000 | 18,847 | |
| 1.5% 9/1/53 (d) | 25,000 | 18,847 | |
| 2% 9/1/53 (d) | 100,000 | 79,606 | |
| 2% 9/1/53 (d) | 50,000 | 39,803 | |
| 2% 9/1/53 (d) | 100,000 | 79,606 | |
| 2% 9/1/53 (d) | 50,000 | 39,803 | |
| 2% 9/1/53 (d) | 50,000 | 39,803 | |
| 2% 9/1/53 (d) | 25,000 | 19,902 | |
| 2% 9/1/53 (d) | 50,000 | 39,803 | |
| 2% 9/1/53 (d) | 25,000 | 19,902 | |
| 2% 9/1/53 (d) | 125,000 | 99,508 | |
| 2% 10/1/53 (d) | 100,000 | 79,720 | |
| 2% 10/1/53 (d) | 50,000 | 39,860 | |
| 2% 10/1/53 (d) | 50,000 | 39,860 | |
| 2% 10/1/53 (d) | 50,000 | 39,860 | |
| 2.5% 9/1/53 (d) | 50,000 | 41,439 | |
| 3% 9/1/53 (d) | 50,000 | 43,076 | |
| 3% 9/1/53 (d) | 75,000 | 64,614 | |
| 3% 9/1/53 (d) | 25,000 | 21,538 | |
| 3% 9/1/53 (d) | 50,000 | 43,076 | |
| 4% 9/1/53 (d) | 25,000 | 23,078 | |
| 4.5% 9/1/53 (d) | 25,000 | 23,707 | |
| 5% 9/1/38 (d) | 25,000 | 24,693 | |
| 5.5% 9/1/53 (d) | 50,000 | 49,391 | |
| 5.5% 9/1/53 (d) | 25,000 | 24,695 | |
| 5.5% 9/1/53 (d) | 100,000 | 98,781 | |
TOTAL UNIFORM MORTGAGE BACKED SECURITIES | 1,152,818 | ||
| TOTAL U.S. GOVERNMENT AGENCY - MORTGAGE SECURITIES (Cost $3,903,736) | 3,727,038 | ||
| Asset-Backed Securities - 0.9% | |||
Principal Amount (a) | Value ($) | ||
| Carmax Auto Owner Trust Series 2023 2 Class A2A, 5.5% 6/15/26 | 10,000 | 9,973 | |
| CNH Equipment Trust Series 2023 A Class A2, 5.34% 9/15/26 | 5,000 | 4,978 | |
| GM Financial Automobile Leasing Series 2023-2 Class A2A, 5.44% 10/20/25 | 1,000 | 997 | |
| GM Financial Consumer Automobile Re Series 2023 2 Class A3, 4.47% 2/16/28 | 2,000 | 1,966 | |
| Verizon Master Trust Series 2023 2 Class A, 4.89% 4/13/28 | 6,000 | 5,942 | |
| World Omni Auto Receivables Trust Series 2023 B: | |||
| Class A2A, 5.25% 11/16/26 | 1,000 | 995 | |
| Class A3, 4.66% 5/15/28 | 2,000 | 1,972 | |
| TOTAL ASSET-BACKED SECURITIES (Cost $27,000) | 26,823 | ||
| Collateralized Mortgage Obligations - 6.0% | |||
Principal Amount (a) | Value ($) | ||
| Private Sponsor - 4.7% | |||
| Ajax Mortgage Loan Trust sequential payer Series 2021-E Class A1, 1.74% 12/25/60 (e) | 73,690 | 61,356 | |
| Cascade Funding Mortgage Trust Series 2021-EBO1 Class A, 0.9849% 11/25/50 (e)(f) | 38,308 | 35,366 | |
| Preston Ridge Partners Mortgage Trust Series 2021-2 Class A1, 2.115% 3/25/26 (e) | 52,021 | 49,249 | |
TOTAL PRIVATE SPONSOR | 145,971 | ||
| U.S. Government Agency - 1.3% | |||
| Fannie Mae sequential payer Series 2022-3 Class N, 2% 10/25/47 | 24,335 | 20,347 | |
| Freddie Mac sequential payer Series 2022-5198 Class BA, 2.5% 11/25/47 | 24,114 | 21,094 | |
TOTAL U.S. GOVERNMENT AGENCY | 41,441 | ||
| TOTAL COLLATERALIZED MORTGAGE OBLIGATIONS (Cost $207,232) | 187,412 | ||
| Commercial Mortgage Securities - 12.9% | |||
Principal Amount (a) | Value ($) | ||
| BANK sequential payer: | |||
| Series 2018-BN14 Class A4, 4.231% 9/15/60 | 20,000 | 18,814 | |
| Series 2023-5YR1: | |||
Class A2, 5.779% 4/15/56 | 10,000 | 9,977 | |
Class A3, 6.26% 4/15/56 | 10,000 | 10,160 | |
| BX Commercial Mortgage Trust floater Series 2021-PAC Class A, CME Term SOFR 1 Month Index + 0.800% 6.1136% 10/15/36 (e)(f)(g) | 100,000 | 97,678 | |
| Citigroup Commercial Mortgage Trust sequential payer Series 2019-C7 Class A4, 3.102% 12/15/72 | 15,626 | 13,511 | |
| CSAIL Commercial Mortgage Trust sequential payer Series 2015-C4 Class A3, 3.5438% 11/15/48 | 9,930 | 9,552 | |
| Freddie Mac: | |||
| sequential payer: | |||
Series 2016-K054 Class A2, 2.745% 1/25/26 | 7,562 | 7,161 | |
Series 2021-K126 Class A2, 2.074% 1/25/31 | 10,000 | 8,313 | |
Series 2021-K127 Class A2, 2.108% 1/25/31 | 10,000 | 8,324 | |
Series 2022-K141 Class A2, 2.25% 2/25/32 | 5,000 | 4,121 | |
Series 2022-K142 Class A2, 2.4% 3/25/32 | 40,000 | 33,312 | |
Series 2022-K145 Class A2, 2.58% 5/25/32 | 10,000 | 8,420 | |
Series 2022-K750 Class A2, 3% 9/25/29 | 30,000 | 27,237 | |
| Series K047 Class A2, 3.329% 5/25/25 | 12,309 | 11,901 | |
| Freddie Mac Multi-family Structured pass-thru certificates sequential payer Series 2015 K045 Class A2, 3.023% 1/25/25 | 7,198 | 6,958 | |
| Morgan Stanley Capital I Trust sequential payer Series 2017-HR2 Class A4, 3.587% 12/15/50 | 15,000 | 13,698 | |
| Wells Fargo Commercial Mortgage Trust: | |||
| floater Series 2021-FCMT Class A, CME Term SOFR 1 Month Index + 1.310% 6.6255% 5/15/31 (e)(f)(g) | 100,000 | 95,712 | |
| sequential payer Series 2014-LC16 Class A5, 3.817% 8/15/50 | 20,000 | 19,526 | |
| TOTAL COMMERCIAL MORTGAGE SECURITIES (Cost $414,948) | 404,375 | ||
| Money Market Funds - 3.7% | |||
| Shares | Value ($) | ||
Fidelity Cash Central Fund 5.43% (h) (Cost $115,924) | 115,901 | 115,924 | |
| TOTAL INVESTMENT IN SECURITIES - 160.3% (Cost $5,231,756) | 5,010,840 |
NET OTHER ASSETS (LIABILITIES) - (60.3)% | (1,884,514) |
| NET ASSETS - 100.0% | 3,126,326 |
| TBA Sale Commitments | ||
Principal Amount (a) | Value ($) | |
| Ginnie Mae | ||
| 2% 9/1/53 | (100,000) | (82,500) |
| 2% 9/1/53 | (25,000) | (20,625) |
| 3% 9/1/53 | (50,000) | (43,965) |
| TOTAL GINNIE MAE | (147,090) | |
| Uniform Mortgage Backed Securities | ||
| 1.5% 9/1/53 | (25,000) | (18,847) |
| 2% 9/1/53 | (75,000) | (59,705) |
| 2% 9/1/53 | (100,000) | (79,606) |
| 2% 9/1/53 | (50,000) | (39,803) |
| 2% 9/1/53 | (50,000) | (39,803) |
| 2% 9/1/53 | (125,000) | (99,508) |
| 2% 9/1/53 | (50,000) | (39,803) |
| 4.5% 9/1/53 | (25,000) | (23,707) |
| 5.5% 9/1/53 | (50,000) | (49,391) |
| TOTAL UNIFORM MORTGAGE BACKED SECURITIES | (450,173) | |
TOTAL TBA SALE COMMITMENTS (Proceeds $591,372) | (597,263) | |
| Futures Contracts | |||||
Number of contracts | Expiration Date | Notional Amount ($) | Value ($) | Unrealized Appreciation/ (Depreciation) ($) | |
| Sold | |||||
| Treasury Contracts | |||||
| CBOT 10-Year U.S. Treasury Note Contracts (United States) | 2 | Dec 2023 | 222,063 | (2,218) | (2,218) |
| CBOT 5-Year U.S. Treasury Note Contracts (United States) | 3 | Dec 2023 | 320,766 | (2,256) | (2,256) |
| CBOT Long Term U.S. Treasury Bond Contracts (United States) | 2 | Dec 2023 | 243,375 | (3,473) | (3,473) |
| TOTAL FUTURES CONTRACTS | (7,947) | ||||
| The notional amount of futures sold as a percentage of Net Assets is 25.2% | |||||
| Credit Default Swaps | ||||||||||
| Underlying Reference | Rating(1) | Maturity Date | Clearinghouse / Counterparty | Fixed Payment Received/ (Paid) | Payment Frequency | Notional Amount(2)(3) | Value ($)(1) | Upfront Premium Received/ (Paid) ($) | Unrealized Appreciation/ (Depreciation) ($) | |
| Buy Protection | ||||||||||
| CMBX N.A. BBB- Index Series 16 | Apr 2065 | Goldman Sachs & Co. LLC | (3%) | Monthly | 3,000 | 721 | (883) | (162) | ||
| CMBX N.A. BBB- Index Series 16 | Apr 2065 | Goldman Sachs & Co. LLC | (3%) | Monthly | 5,000 | 1,203 | (1,493) | (290) | ||
| CMBX N.A. BBB- Index Series 16 | Apr 2065 | Goldman Sachs & Co. LLC | (3%) | Monthly | 3,000 | 722 | (748) | (26) | ||
| TOTAL BUY PROTECTION | 2,646 | (3,124) | (478) | |||||||
| Sell Protection | ||||||||||
| CMBX N.A. AAA Index Series 15 | NR | Nov 2064 | Goldman Sachs & Co. LLC | 0.5% | Monthly | 10,000 | (277) | 272 | (5) | |
| TOTAL CREDIT DEFAULT SWAPS | 2,369 | (2,852) | (483) | |||||||
| Interest Rate Swaps | ||||||||||
| Payment Received | Payment Frequency | Payment Paid | Payment Frequency | Clearinghouse / Counterparty(1) | Maturity Date | Notional Amount(2) | Value ($) | Upfront Premium Received/ (Paid) ($)(3) | Unrealized Appreciation/ (Depreciation) ($) | |
| 4.5% | Annual | U.S. Secured Overnight Fin. Rate (SOFR) Index(4) | Annual | LCH | Sep 2025 | 64,000 | (488) | 0 | (488) | |
| 3.75% | Annual | U.S. Secured Overnight Fin. Rate (SOFR) Index(4) | Annual | LCH | Sep 2028 | 111,000 | (2,031) | 0 | (2,031) | |
| 3.5% | Annual | U.S. Secured Overnight Fin. Rate (SOFR) Index(4) | Annual | LCH | Sep 2030 | 55,000 | (1,208) | 0 | (1,208) | |
| TOTAL INTEREST RATE SWAPS | (3,727) | 0 | (3,727) | |||||||
| (a) | Amount is stated in United States dollars unless otherwise noted. |
| (b) | Security or a portion of the security was pledged to cover margin requirements for futures contracts. At period end, the value of securities pledged amounted to $45,173. |
| (c) | Security or a portion of the security was pledged to cover margin requirements for centrally cleared OTC swaps. At period end, the value of securities pledged amounted to $16,621. |
| (d) | Security or a portion of the security purchased on a delayed delivery or when-issued basis. |
| (e) | Security exempt from registration under Rule 144A of the Securities Act of 1933. These securities may be resold in transactions exempt from registration, normally to qualified institutional buyers. At the end of the period, the value of these securities amounted to $339,361 or 10.9% of net assets. |
| (f) | Coupon rates for floating and adjustable rate securities reflect the rates in effect at period end. |
| (g) | Coupon is indexed to a floating interest rate which may be multiplied by a specified factor and/or subject to caps or floors. |
| (h) | Affiliated fund that is generally available only to investment companies and other accounts managed by Fidelity Investments. The rate quoted is the annualized seven-day yield of the fund at period end. A complete unaudited listing of the fund's holdings as of its most recent quarter end is available upon request. In addition, each Fidelity Central Fund's financial statements, which are not covered by the Fund's Report of Independent Registered Public Accounting Firm, are available on the SEC's website or upon request. |
| Affiliate | Value, beginning of period ($) | Purchases ($) | Sales Proceeds ($) | Dividend Income ($) | Realized Gain (loss) ($) | Change in Unrealized appreciation (depreciation) ($) | Value, end of period ($) | % ownership, end of period |
| Fidelity Cash Central Fund 5.43% | 812,433 | 1,928,238 | 2,624,747 | 18,689 | - | - | 115,924 | 0.0% |
| Total | 812,433 | 1,928,238 | 2,624,747 | 18,689 | - | - | 115,924 | |
| Valuation Inputs at Reporting Date: | ||||
| Description | Total ($) | Level 1 ($) | Level 2 ($) | Level 3 ($) |
Investments in Securities: | ||||
| U.S. Government and Government Agency Obligations | 549,268 | - | 549,268 | - |
| U.S. Government Agency - Mortgage Securities | 3,727,038 | - | 3,727,038 | - |
| Asset-Backed Securities | 26,823 | - | 26,823 | - |
| Collateralized Mortgage Obligations | 187,412 | - | 187,412 | - |
| Commercial Mortgage Securities | 404,375 | - | 404,375 | - |
| Money Market Funds | 115,924 | 115,924 | - | - |
| Total Investments in Securities: | 5,010,840 | 115,924 | 4,894,916 | - |
Derivative Instruments: | ||||
| Assets | ||||
Swaps | 2,646 | - | 2,646 | - |
| Total Assets | 2,646 | - | 2,646 | - |
| Liabilities | ||||
Futures Contracts | (7,947) | (7,947) | - | - |
Swaps | (4,004) | - | (4,004) | - |
| Total Liabilities | (11,951) | (7,947) | (4,004) | - |
| Total Derivative Instruments: | (9,305) | (7,947) | (1,358) | - |
Other Financial Instruments: | ||||
| TBA Sale Commitments | (597,263) | - | (597,263) | - |
| Total Other Financial Instruments: | (597,263) | - | (597,263) | - |
Primary Risk Exposure / Derivative Type | Value | |
| Asset ($) | Liability ($) | |
| Credit Risk | ||
Swaps (c) | 2,646 | (277) |
| Total Credit Risk | 2,646 | (277) |
| Interest Rate Risk | ||
Futures Contracts (a) | 0 | (7,947) |
Swaps (b) | 0 | (3,727) |
| Total Interest Rate Risk | 0 | (11,674) |
| Total Value of Derivatives | 2,646 | (11,951) |
| Statement of Assets and Liabilities | ||||
| August 31, 2023 | ||||
| Assets | ||||
| Investment in securities, at value - See accompanying schedule: | ||||
Unaffiliated issuers (cost $5,115,832) | $ | 4,894,916 | ||
Fidelity Central Funds (cost $115,924) | 115,924 | |||
| Total Investment in Securities (cost $5,231,756) | $ | 5,010,840 | ||
| Cash | 19,960 | |||
| Receivable for investments sold | 4,930 | |||
| Receivable for TBA sale commitments | 591,372 | |||
| Interest receivable | 11,385 | |||
| Distributions receivable from Fidelity Central Funds | 557 | |||
| Receivable for daily variation margin on centrally cleared OTC swaps | 674 | |||
| Bi-lateral OTC swaps, at value | 2,646 | |||
| Receivable from investment adviser for expense reductions | 134 | |||
Total assets | 5,642,498 | |||
| Liabilities | ||||
| Payable for investments purchased | ||||
Regular delivery | $ | 75,884 | ||
Delayed delivery | 1,830,758 | |||
| TBA sale commitments, at value | 597,263 | |||
| Distributions payable | 9,225 | |||
| Bi-lateral OTC swaps, at value | 277 | |||
| Accrued management fee | 934 | |||
| Payable for daily variation margin on futures contracts | 1,602 | |||
| Other payables and accrued expenses | 229 | |||
| Total Liabilities | 2,516,172 | |||
| Net Assets | $ | 3,126,326 | ||
| Net Assets consist of: | ||||
| Paid in capital | $ | 3,980,473 | ||
| Total accumulated earnings (loss) | (854,147) | |||
| Net Assets | $ | 3,126,326 | ||
Net Asset Value, offering price and redemption price per share ($3,126,326 ÷ 75,000 shares) | $ | 41.68 | ||
| Statement of Operations | ||||
Year ended August 31, 2023 | ||||
| Investment Income | ||||
| Interest | $ | 95,079 | ||
| Income from Fidelity Central Funds | 18,689 | |||
| Total Income | 113,768 | |||
| Expenses | ||||
| Management fee | $ | 11,461 | ||
| Independent trustees' fees and expenses | 12 | |||
| Miscellaneous | 229 | |||
| Total expenses before reductions | 11,702 | |||
| Expense reductions | (320) | |||
| Total expenses after reductions | 11,382 | |||
| Net Investment income (loss) | 102,386 | |||
| Realized and Unrealized Gain (Loss) | ||||
| Net realized gain (loss) on: | ||||
| Investment Securities: | ||||
| Unaffiliated issuers | (190,566) | |||
| Futures contracts | 61,196 | |||
| Swaps | (12,544) | |||
| Total net realized gain (loss) | (141,914) | |||
| Change in net unrealized appreciation (depreciation) on: | ||||
| Investment Securities: | ||||
| Unaffiliated issuers | (6,951) | |||
| Futures contracts | (14,503) | |||
| Swaps | (2,459) | |||
| TBA Sale commitments | (5,891) | |||
| Total change in net unrealized appreciation (depreciation) | (29,804) | |||
| Net gain (loss) | (171,718) | |||
| Net increase (decrease) in net assets resulting from operations | $ | (69,332) | ||
| Statement of Changes in Net Assets | ||||
Year ended August 31, 2023 | Year ended August 31, 2022 | |||
| Increase (Decrease) in Net Assets | ||||
| Operations | ||||
| Net investment income (loss) | $ | 102,386 | $ | 40,569 |
| Net realized gain (loss) | (141,914) | (462,532) | ||
| Change in net unrealized appreciation (depreciation) | (29,804) | (219,545) | ||
| Net increase (decrease) in net assets resulting from operations | (69,332) | (641,508) | ||
| Distributions to shareholders | (103,575) | (37,844) | ||
| Distributions to shareholders from tax return of capital | - | (56,681) | ||
| Total Distributions | (103,575) | (94,525) | ||
| Share transactions | ||||
| Cost of shares redeemed | - | (5,950,256) | ||
Net increase (decrease) in net assets resulting from share transactions | - | (5,950,256) | ||
| Total increase (decrease) in net assets | (172,907) | (6,686,289) | ||
| Net Assets | ||||
| Beginning of period | 3,299,233 | 9,985,522 | ||
| End of period | $ | 3,126,326 | $ | 3,299,233 |
| Other Information | ||||
| Shares | ||||
| Redeemed | - | (125,000) | ||
| Net increase (decrease) | - | (125,000) | ||
| Fidelity® Investment Grade Securitized ETF |
| Years ended August 31, | 2023 | 2022 | 2021 A | |||
Selected Per-Share Data | ||||||
| Net asset value, beginning of period | $ | 43.99 | $ | 49.93 | $ | 50.00 |
| Income from Investment Operations | ||||||
Net investment income (loss) B,C | 1.365 | .301 | .023 | |||
| Net realized and unrealized gain (loss) | (2.294) | (5.501) | .160 | |||
| Total from investment operations | (.929) | (5.200) | .183 | |||
| Distributions from net investment income | (1.381) | (.300) | (.078) D | |||
| Distributions from net realized gain | - | - | (.027) D | |||
| Tax return of capital | - | (.440) | (.145) | |||
| Total distributions | (1.381) | (.740) | (.250) | |||
| Net asset value, end of period | $ | 41.68 | $ | 43.99 | $ | 49.93 |
Total Return E,F,G | (2.10)% | (10.49)% | .36% | |||
Ratios to Average Net Assets C,H,I | ||||||
| Expenses before reductions | .37% | .36% | .36% J | |||
| Expenses net of fee waivers, if any | .36% | .36% | .36% J | |||
| Expenses net of all reductions | .36% | .36% | .36% J | |||
| Net investment income (loss) | 3.22% | .63% | .09% J | |||
| Supplemental Data | ||||||
| Net assets, end of period (000 omitted) | $ | 3,126 | $ | 3,299 | $ | 9,986 |
Portfolio turnover rate K | 865% | 141% | 65% L |
| Average Annual Total Returns | |||
Periods ended August 31, 2023 | Past 1 year | Past 5 years | Life of Fund |
Fidelity® Limited Term Bond ETF - NAV A | 2.02% | 1.45% | 1.44% |
Fidelity® Limited Term Bond ETF - Market Price B | 2.05% | 1.43% | 1.39% |
Bloomberg U.S. 1-5 Year Government/Credit Bond Index A | 1.19% | 1.18% | 1.13% |
Fidelity Limited Term Composite Index℠ A | 1.81% | 1.54% | 1.50% |
Bloomberg U.S. 1-5 Year Government Bond Index A | 0.76% | 0.91% | 0.85% |
Bloomberg U.S. 1-5 Year Credit Bond Index A | 2.08% | 1.69% | 1.66% |
| $10,000 Over Life of Fund |
Let's say hypothetically that $10,000 was invested in Fidelity® Limited Term Bond ETF - NAV, on October 6, 2014, when the fund started. The chart shows how the value of your investment would have changed, and also shows how the Bloomberg U.S. 1-5 Year Government/Credit Bond Index performed over the same period. |
 |
Quality Diversification (% of Fund's net assets) |
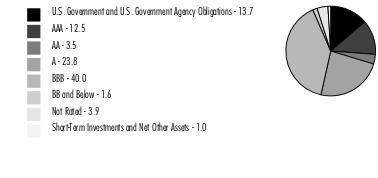 |
| We have used ratings from Moody's Investors Service, Inc. Where Moody's® ratings are not available, we have used S&P® ratings. All ratings are as of the date indicated and do not reflect subsequent changes. |
Asset Allocation (% of Fund's net assets) |
 |
Futures - 11.2% |
Geographic Diversification (% of Fund's net assets) |
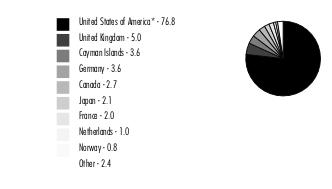 |
* Includes Short-Term investments and Net Other Assets (Liabilities). Percentages are adjusted for the effect of derivatives, if applicable. |
| Nonconvertible Bonds - 65.6% | |||
Principal Amount (a) | Value ($) | ||
| COMMUNICATION SERVICES - 3.7% | |||
| Diversified Telecommunication Services - 1.7% | |||
| AT&T, Inc.: | |||
| 0.9% 3/25/24 | 520,000 | 505,721 | |
| 1.65% 2/1/28 | 1,082,000 | 925,124 | |
| NTT Finance Corp.: | |||
| 0.583% 3/1/24 (b) | 268,000 | 261,107 | |
| 1.162% 4/3/26 (b) | 142,000 | 128,044 | |
| 1.591% 4/3/28 (b) | 450,000 | 385,927 | |
| Verizon Communications, Inc.: | |||
| 2.355% 3/15/32 | 747,000 | 590,831 | |
| 3% 3/22/27 | 290,000 | 269,558 | |
| 3,066,312 | |||
| Media - 0.7% | |||
| Comcast Corp. 3.95% 10/15/25 | 181,000 | 176,294 | |
| Magallanes, Inc.: | |||
| 3.638% 3/15/25 | 132,000 | 127,713 | |
| 3.755% 3/15/27 | 1,071,000 | 1,004,510 | |
| 1,308,517 | |||
| Wireless Telecommunication Services - 1.3% | |||
| Rogers Communications, Inc.: | |||
| 2.95% 3/15/25 | 467,000 | 445,776 | |
| 3.2% 3/15/27 | 480,000 | 443,722 | |
| T-Mobile U.S.A., Inc.: | |||
| 2.625% 4/15/26 | 710,000 | 658,788 | |
| 3.5% 4/15/25 | 213,000 | 205,908 | |
| 4.95% 3/15/28 | 450,000 | 443,735 | |
| 2,197,929 | |||
TOTAL COMMUNICATION SERVICES | 6,572,758 | ||
| CONSUMER DISCRETIONARY - 4.7% | |||
| Automobiles - 3.2% | |||
| American Honda Finance Corp.: | |||
| 4.6% 4/17/25 | 240,000 | 236,838 | |
| 5.125% 7/7/28 | 440,000 | 440,296 | |
| Daimler Finance North America LLC: | |||
| 0.75% 3/1/24 (b) | 458,000 | 446,826 | |
| 1.45% 3/2/26 (b) | 187,000 | 170,445 | |
| 4.8% 3/30/28 (b) | 450,000 | 442,751 | |
| 5.5% 11/27/24 (b) | 310,000 | 309,536 | |
| General Motors Financial Co., Inc.: | |||
| U.S. Secured Overnight Fin. Rate (SOFR) Index + 1.200% 6.5056% 11/17/23 (c)(d) | 468,000 | 468,613 | |
| 1.05% 3/8/24 | 188,000 | 183,262 | |
| 1.25% 1/8/26 | 206,000 | 185,315 | |
| 2.35% 2/26/27 | 300,000 | 266,703 | |
| 5.8% 6/23/28 | 810,000 | 803,020 | |
| 6% 1/9/28 | 690,000 | 691,707 | |
| Volkswagen Group of America Finance LLC: | |||
| 1.25% 11/24/25 (b) | 250,000 | 227,898 | |
| 3.95% 6/6/25 (b) | 275,000 | 266,916 | |
| 4.35% 6/8/27 (b) | 460,000 | 443,006 | |
| 5,583,132 | |||
| Distributors - 0.2% | |||
| Genuine Parts Co. 1.75% 2/1/25 | 440,000 | 415,943 | |
| Hotels, Restaurants & Leisure - 0.1% | |||
| McDonald's Corp. 3.3% 7/1/25 | 55,000 | 53,118 | |
| Starbucks Corp. 3.8% 8/15/25 | 126,000 | 122,529 | |
| 175,647 | |||
| Specialty Retail - 1.2% | |||
| Advance Auto Parts, Inc. 5.95% 3/9/28 | 489,000 | 483,568 | |
| AutoNation, Inc. 1.95% 8/1/28 | 540,000 | 447,344 | |
| AutoZone, Inc. 3.625% 4/15/25 | 378,000 | 366,658 | |
| Lowe's Companies, Inc.: | |||
| 4.4% 9/8/25 | 275,000 | 270,011 | |
| 4.8% 4/1/26 | 74,000 | 73,143 | |
| Ross Stores, Inc. 0.875% 4/15/26 | 473,000 | 422,434 | |
| 2,063,158 | |||
TOTAL CONSUMER DISCRETIONARY | 8,237,880 | ||
| CONSUMER STAPLES - 5.9% | |||
| Beverages - 1.0% | |||
| Constellation Brands, Inc.: | |||
| 3.6% 5/9/24 | 440,000 | 433,227 | |
| 3.6% 2/15/28 | 470,000 | 438,261 | |
| Dr. Pepper Snapple Group, Inc.: | |||
| 0.75% 3/15/24 | 310,000 | 301,693 | |
| 4.597% 5/25/28 | 450,000 | 439,561 | |
| Molson Coors Beverage Co. 3% 7/15/26 | 223,000 | 208,950 | |
| 1,821,692 | |||
| Consumer Staples Distribution & Retail - 1.1% | |||
| 7-Eleven, Inc.: | |||
| 0.8% 2/10/24 (b) | 92,000 | 89,914 | |
| 0.95% 2/10/26 (b) | 297,000 | 266,689 | |
| 1.3% 2/10/28 (b) | 181,000 | 153,176 | |
| Dollar General Corp.: | |||
| 4.25% 9/20/24 | 200,000 | 196,854 | |
| 4.625% 11/1/27 | 432,000 | 420,761 | |
| Dollar Tree, Inc.: | |||
| 4% 5/15/25 | 177,000 | 171,717 | |
| 4.2% 5/15/28 | 460,000 | 436,515 | |
| Mondelez International Holdings Netherlands BV 0.75% 9/24/24 (b) | 186,000 | 176,465 | |
| 1,912,091 | |||
| Food Products - 1.4% | |||
| JBS U.S.A. Lux SA / JBS Food Co. 2.5% 1/15/27 | 1,080,000 | 970,807 | |
| JDE Peet's BV: | |||
| 0.8% 9/24/24 (b) | 149,000 | 140,424 | |
| 1.375% 1/15/27 (b) | 824,000 | 715,640 | |
| McCormick & Co., Inc. 0.9% 2/15/26 | 390,000 | 351,033 | |
| Mondelez International, Inc. 2.125% 3/17/24 | 350,000 | 343,157 | |
| 2,521,061 | |||
| Tobacco - 2.4% | |||
| Altria Group, Inc. 2.35% 5/6/25 | 228,000 | 215,850 | |
| BAT Capital Corp.: | |||
| 3.222% 8/15/24 | 419,000 | 408,607 | |
| 4.7% 4/2/27 | 520,000 | 504,321 | |
| BAT International Finance PLC: | |||
| 1.668% 3/25/26 | 46,000 | 41,657 | |
| 3.95% 6/15/25 (b) | 326,000 | 316,506 | |
| 5.931% 2/2/29 | 1,000,000 | 996,056 | |
| Imperial Tobacco Finance PLC: | |||
| 3.125% 7/26/24 (b) | 250,000 | 243,313 | |
| 4.25% 7/21/25 (b) | 270,000 | 261,104 | |
| 6.125% 7/27/27 (b) | 440,000 | 444,817 | |
| Philip Morris International, Inc.: | |||
| 0.875% 5/1/26 | 296,000 | 265,025 | |
| 1.5% 5/1/25 | 136,000 | 127,630 | |
| 2.875% 5/1/24 | 332,000 | 325,866 | |
| 4,150,752 | |||
TOTAL CONSUMER STAPLES | 10,405,596 | ||
| ENERGY - 3.9% | |||
| Energy Equipment & Services - 0.1% | |||
| Baker Hughes Co.: | |||
| 1.231% 12/15/23 | 142,000 | 140,169 | |
| 2.061% 12/15/26 | 133,000 | 120,301 | |
| 260,470 | |||
| Oil, Gas & Consumable Fuels - 3.8% | |||
| Canadian Natural Resources Ltd. 2.05% 7/15/25 | 143,000 | 133,965 | |
| ConocoPhillips Co. 2.4% 3/7/25 | 71,000 | 68,050 | |
| DCP Midstream Operating LP 5.625% 7/15/27 | 440,000 | 440,469 | |
| Enbridge, Inc.: | |||
| 1.6% 10/4/26 | 320,000 | 286,876 | |
| 2.15% 2/16/24 | 111,000 | 109,158 | |
| 2.5% 2/14/25 | 116,000 | 110,825 | |
| Energy Transfer LP: | |||
| 2.9% 5/15/25 | 373,000 | 354,500 | |
| 4.2% 9/15/23 | 169,000 | 168,917 | |
| 4.5% 4/15/24 | 322,000 | 318,886 | |
| 5.5% 6/1/27 | 440,000 | 437,439 | |
| Enterprise Products Operating LP 5.05% 1/10/26 | 475,000 | 472,615 | |
| Equinor ASA: | |||
| 1.75% 1/22/26 | 83,000 | 76,937 | |
| 2.875% 4/6/25 | 305,000 | 294,223 | |
| Hess Corp. 4.3% 4/1/27 | 480,000 | 461,761 | |
| Kinder Morgan, Inc. 4.3% 3/1/28 | 460,000 | 438,490 | |
| MPLX LP: | |||
| 1.75% 3/1/26 | 159,000 | 144,814 | |
| 4.25% 12/1/27 | 460,000 | 437,717 | |
| Occidental Petroleum Corp. 2.9% 8/15/24 | 414,000 | 402,474 | |
| Petroleos Mexicanos: | |||
| 6.49% 1/23/27 | 420,000 | 366,299 | |
| 6.5% 3/13/27 | 600,000 | 523,845 | |
| Phillips 66 Co.: | |||
| 1.3% 2/15/26 | 296,000 | 268,693 | |
| 3.85% 4/9/25 | 77,000 | 74,922 | |
| The Williams Companies, Inc. 5.4% 3/2/26 | 101,000 | 100,839 | |
| Valero Energy Corp. 2.85% 4/15/25 | 99,000 | 94,555 | |
| 6,587,269 | |||
TOTAL ENERGY | 6,847,739 | ||
| FINANCIALS - 29.0% | |||
| Banks - 17.0% | |||
| ABN AMRO Bank NV 1.542% 6/16/27 (b)(c) | 186,000 | 164,071 | |
| Banco Santander SA 1.722% 9/14/27 (c) | 400,000 | 351,586 | |
| Bank of America Corp.: | |||
| U.S. Secured Overnight Fin. Rate (SOFR) Index + 1.290% 5.08% 1/20/27 (c)(d) | 1,400,000 | 1,381,597 | |
| 0.976% 4/22/25 (c) | 200,000 | 193,205 | |
| 1.197% 10/24/26 (c) | 666,000 | 603,540 | |
| 1.319% 6/19/26 (c) | 454,000 | 417,798 | |
| 1.734% 7/22/27 (c) | 840,000 | 751,623 | |
| 2.015% 2/13/26 (c) | 342,000 | 322,477 | |
| 4.2% 8/26/24 | 100,000 | 98,219 | |
| Bank of Nova Scotia: | |||
| 0.55% 9/15/23 | 245,000 | 244,651 | |
| 5.45% 6/12/25 | 340,000 | 338,015 | |
| Banque Federative du Credit Mutuel SA 4.524% 7/13/25 (b) | 293,000 | 286,219 | |
| Barclays PLC: | |||
| 2.279% 11/24/27 (c) | 800,000 | 710,430 | |
| 2.852% 5/7/26 (c) | 300,000 | 283,537 | |
| 3.932% 5/7/25 (c) | 275,000 | 270,980 | |
| BNP Paribas SA: | |||
| U.S. Secured Overnight Fin. Rate (SOFR) Index + 1.000% 1.323% 1/13/27 (b)(c)(d) | 813,000 | 731,061 | |
| 2.219% 6/9/26 (b)(c) | 100,000 | 93,424 | |
| BPCE SA: | |||
| 1.652% 10/6/26 (b)(c) | 198,000 | 179,972 | |
| 2.045% 10/19/27 (b)(c) | 378,000 | 334,733 | |
| Canadian Imperial Bank of Commerce 3.945% 8/4/25 | 243,000 | 235,485 | |
| Capital One NA 2.28% 1/28/26 (c) | 177,000 | 167,384 | |
| Citigroup, Inc.: | |||
| 0.981% 5/1/25 (c) | 286,000 | 276,207 | |
| 1.122% 1/28/27 (c) | 455,000 | 407,774 | |
| 2.014% 1/25/26 (c) | 390,000 | 368,950 | |
| 3.106% 4/8/26 (c) | 953,000 | 912,033 | |
| Danske Bank A/S 6.466% 1/9/26 (b)(c) | 250,000 | 250,114 | |
| DNB Bank ASA: | |||
| 1.535% 5/25/27 (b)(c) | 381,000 | 338,063 | |
| 1.605% 3/30/28 (b)(c) | 879,000 | 762,850 | |
| HSBC Holdings PLC: | |||
| 0.976% 5/24/25 (c) | 200,000 | 192,229 | |
| 1.589% 5/24/27 (c) | 210,000 | 186,586 | |
| 3.803% 3/11/25 (c) | 250,000 | 246,871 | |
| 4.041% 3/13/28 (c) | 500,000 | 469,591 | |
| 4.292% 9/12/26 (c) | 500,000 | 482,281 | |
| 5.21% 8/11/28 (c) | 342,000 | 333,724 | |
| Huntington Bancshares, Inc. 4.443% 8/4/28 (c) | 314,000 | 295,376 | |
| Huntington National Bank 5.699% 11/18/25 (c) | 148,000 | 145,160 | |
| ING Groep NV 1.726% 4/1/27 (c) | 181,000 | 162,766 | |
| Intesa Sanpaolo SpA 5.71% 1/15/26 (b) | 357,000 | 342,472 | |
| JPMorgan Chase & Co.: | |||
| 0.824% 6/1/25 (c) | 189,000 | 181,491 | |
| 1.04% 2/4/27 (c) | 600,000 | 537,039 | |
| 1.045% 11/19/26 (c) | 198,000 | 178,521 | |
| 1.47% 9/22/27 (c) | 265,000 | 234,076 | |
| 2.083% 4/22/26 (c) | 235,000 | 221,037 | |
| 3.22% 3/1/25 (c) | 164,000 | 161,732 | |
| 3.54% 5/1/28 (c) | 500,000 | 466,611 | |
| 4.323% 4/26/28 (c) | 1,230,000 | 1,182,719 | |
| KeyCorp 3.878% 5/23/25 (c) | 213,000 | 203,249 | |
| Lloyds Banking Group PLC: | |||
| 2.438% 2/5/26 (c) | 200,000 | 189,435 | |
| 5.985% 8/7/27 (c) | 230,000 | 229,765 | |
| Mitsubishi UFJ Financial Group, Inc.: | |||
| 1.412% 7/17/25 | 450,000 | 415,611 | |
| 1.538% 7/20/27 (c) | 300,000 | 267,447 | |
| 1.64% 10/13/27 (c) | 260,000 | 230,535 | |
| 2.193% 2/25/25 | 430,000 | 407,874 | |
| Mizuho Financial Group, Inc.: | |||
| 0.849% 9/8/24 (c) | 289,000 | 288,900 | |
| 1.234% 5/22/27 (c) | 200,000 | 177,011 | |
| 1.554% 7/9/27 (c) | 200,000 | 177,566 | |
| Morgan Stanley Bank, West Valley City Utah: | |||
| 4.754% 4/21/26 | 297,000 | 293,154 | |
| 5.479% 7/16/25 | 500,000 | 500,688 | |
| NatWest Group PLC: | |||
| 3.073% 5/22/28 (c) | 500,000 | 450,822 | |
| 3.875% 9/12/23 | 300,000 | 299,892 | |
| 5.847% 3/2/27 (c) | 415,000 | 412,536 | |
| NatWest Markets PLC 0.8% 8/12/24 (b) | 377,000 | 359,724 | |
| PNC Financial Services Group, Inc. 5.354% 12/2/28 (c) | 90,000 | 88,674 | |
| Rabobank Nederland 1.98% 12/15/27 (b)(c) | 655,000 | 578,095 | |
| Regions Financial Corp. 2.25% 5/18/25 | 166,000 | 155,111 | |
| Royal Bank of Canada 1.15% 6/10/25 | 367,000 | 339,864 | |
| Santander Holdings U.S.A., Inc.: | |||
| 2.49% 1/6/28 (c) | 218,000 | 191,139 | |
| 3.45% 6/2/25 | 545,000 | 520,011 | |
| 5.807% 9/9/26 (c) | 250,000 | 247,668 | |
| Societe Generale: | |||
| 1.488% 12/14/26 (b)(c) | 448,000 | 401,446 | |
| 1.792% 6/9/27 (b)(c) | 896,000 | 794,805 | |
| 2.625% 10/16/24 (b) | 200,000 | 192,416 | |
| 3.875% 3/28/24 (b) | 343,000 | 338,163 | |
| Sumitomo Mitsui Financial Group, Inc.: | |||
| 1.402% 9/17/26 | 805,000 | 712,312 | |
| 1.474% 7/8/25 | 190,000 | 175,904 | |
| Truist Financial Corp. 5.9% 10/28/26 (c) | 390,000 | 388,941 | |
| Wells Fargo & Co.: | |||
| 2.164% 2/11/26 (c) | 104,000 | 98,328 | |
| 2.406% 10/30/25 (c) | 356,000 | 341,372 | |
| 3.526% 3/24/28 (c) | 880,000 | 818,772 | |
| 4.3% 7/22/27 | 411,000 | 393,568 | |
| Wells Fargo Bank NA 5.55% 8/1/25 | 500,000 | 501,030 | |
| Westpac Banking Corp. 4.11% 7/24/34 (c) | 245,000 | 214,636 | |
| 29,892,744 | |||
| Capital Markets - 4.7% | |||
| Ares Capital Corp. 3.25% 7/15/25 | 460,000 | 431,332 | |
| Bank of New York Mellon Corp. 3.85% 4/28/28 | 870,000 | 827,177 | |
| Deutsche Bank AG New York Branch: | |||
| 0.898% 5/28/24 | 125,000 | 120,524 | |
| 1.447% 4/1/25 (c) | 474,000 | 459,131 | |
| 2.129% 11/24/26 (c) | 388,000 | 352,020 | |
| 2.222% 9/18/24 (c) | 501,000 | 500,215 | |
| 2.311% 11/16/27 (c) | 217,000 | 190,258 | |
| Goldman Sachs Group, Inc.: | |||
| 0.657% 9/10/24 (c) | 300,000 | 299,764 | |
| 1.757% 1/24/25 (c) | 250,000 | 245,363 | |
| 2.64% 2/24/28 (c) | 1,020,000 | 923,112 | |
| 3.272% 9/29/25 (c) | 266,000 | 257,964 | |
| 5.7% 11/1/24 | 100,000 | 99,808 | |
| Intercontinental Exchange, Inc.: | |||
| 3.65% 5/23/25 | 361,000 | 349,957 | |
| 4% 9/15/27 | 282,000 | 269,969 | |
| Moody's Corp. 4.875% 2/15/24 | 236,000 | 236,002 | |
| Morgan Stanley: | |||
| 0.79% 5/30/25 (c) | 225,000 | 215,726 | |
| 2.475% 1/21/28 (c) | 270,000 | 243,572 | |
| 2.72% 7/22/25 (c) | 144,000 | 139,744 | |
| 3.591% 7/22/28 (c) | 520,000 | 481,063 | |
| 3.772% 1/24/29 (c) | 500,000 | 463,766 | |
| Nomura Holdings, Inc. 1.653% 7/14/26 | 200,000 | 177,274 | |
| S&P Global, Inc. 2.45% 3/1/27 | 218,000 | 201,004 | |
| State Street Corp. 2.901% 3/30/26 (c) | 16,000 | 15,322 | |
| UBS AG London Branch: | |||
| 1.25% 6/1/26 (b) | 200,000 | 179,570 | |
| 1.375% 1/13/25 (b) | 115,000 | 108,315 | |
| UBS Group AG: | |||
| 1.305% 2/2/27 (b)(c) | 200,000 | 177,813 | |
| 2.593% 9/11/25 (b)(c) | 220,000 | 212,127 | |
| 8,177,892 | |||
| Consumer Finance - 3.7% | |||
| AerCap Ireland Capital Ltd./AerCap Global Aviation Trust: | |||
| 1.65% 10/29/24 | 262,000 | 249,088 | |
| 1.75% 1/30/26 | 245,000 | 221,682 | |
| 2.45% 10/29/26 | 151,000 | 135,862 | |
| 4.875% 1/16/24 | 150,000 | 149,249 | |
| Ally Financial, Inc.: | |||
| 1.45% 10/2/23 | 151,000 | 150,238 | |
| 4.75% 6/9/27 | 530,000 | 496,797 | |
| 5.125% 9/30/24 | 207,000 | 203,807 | |
| American Express Co.: | |||
| 2.25% 3/4/25 | 326,000 | 309,973 | |
| 5.389% 7/28/27 (c) | 390,000 | 387,687 | |
| Capital One Financial Corp.: | |||
| 1.343% 12/6/24 (c) | 320,000 | 315,409 | |
| 1.878% 11/2/27 (c) | 420,000 | 368,191 | |
| 4.985% 7/24/26 (c) | 228,000 | 222,854 | |
| Ford Motor Credit Co. LLC: | |||
| 2.3% 2/10/25 | 420,000 | 394,580 | |
| 6.95% 6/10/26 | 500,000 | 500,638 | |
| Hyundai Capital America: | |||
| 1% 9/17/24 (b) | 423,000 | 402,077 | |
| 5.6% 3/30/28 (b) | 440,000 | 437,674 | |
| 5.8% 6/26/25 (b) | 340,000 | 340,408 | |
| John Deere Capital Corp.: | |||
| 3.4% 6/6/25 | 177,000 | 171,559 | |
| 4.75% 6/8/26 | 206,000 | 204,976 | |
| Synchrony Financial: | |||
| 4.25% 8/15/24 | 338,000 | 329,218 | |
| 4.375% 3/19/24 | 333,000 | 328,980 | |
| Toyota Motor Credit Corp. 5.4% 11/10/25 | 220,000 | 221,099 | |
| 6,542,046 | |||
| Financial Services - 1.9% | |||
| AIG Global Funding 0.9% 9/22/25 (b) | 200,000 | 181,478 | |
| Athene Global Funding: | |||
| 0.95% 1/8/24 (b) | 275,000 | 269,746 | |
| 1% 4/16/24 (b) | 170,000 | 164,129 | |
| 1.73% 10/2/26 (b) | 840,000 | 731,137 | |
| Blackstone Private Credit Fund 4.7% 3/24/25 | 150,000 | 145,803 | |
| Brixmor Operating Partnership LP 2.25% 4/1/28 | 177,000 | 150,407 | |
| Corebridge Financial, Inc.: | |||
| 3.5% 4/4/25 | 74,000 | 71,111 | |
| 3.65% 4/5/27 | 105,000 | 98,773 | |
| GA Global Funding Trust 1.25% 12/8/23 (b) | 390,000 | 384,797 | |
| Jackson Financial, Inc.: | |||
| 1.125% 11/22/23 | 150,000 | 148,457 | |
| 5.17% 6/8/27 | 378,000 | 370,502 | |
| PayPal Holdings, Inc. 1.65% 6/1/25 | 230,000 | 215,470 | |
| The Western Union Co. 1.35% 3/15/26 | 490,000 | 438,587 | |
| 3,370,397 | |||
| Insurance - 1.7% | |||
| Empower Finance 2020 LP 1.357% 9/17/27 (b) | 258,000 | 222,629 | |
| Equitable Financial Life Global Funding: | |||
| 0.5% 11/17/23 (b) | 344,000 | 340,116 | |
| 1.4% 8/27/27 (b) | 344,000 | 292,601 | |
| 1.7% 11/12/26 (b) | 451,000 | 395,348 | |
| Great-West Lifeco U.S. Finance 2020 LP 0.904% 8/12/25 (b) | 392,000 | 354,250 | |
| Guardian Life Global Funding: | |||
| 1.1% 6/23/25 (b) | 215,000 | 197,781 | |
| 1.4% 7/6/27 (b) | 438,000 | 382,193 | |
| Pacific Life Global Funding II 1.2% 6/24/25 (b) | 130,000 | 120,345 | |
| Pricoa Global Funding I 2.4% 9/23/24 (b) | 117,000 | 112,699 | |
| Protective Life Global Funding 3.218% 3/28/25 (b) | 157,000 | 150,835 | |
| RGA Global Funding 2% 11/30/26 (b) | 273,000 | 242,907 | |
| Willis Group North America, Inc. 4.65% 6/15/27 | 240,000 | 232,417 | |
| 3,044,121 | |||
TOTAL FINANCIALS | 51,027,200 | ||
| HEALTH CARE - 3.6% | |||
| Biotechnology - 0.3% | |||
| Amgen, Inc. 5.15% 3/2/28 | 491,000 | 490,487 | |
| Health Care Equipment & Supplies - 0.4% | |||
| Alcon Finance Corp. 2.75% 9/23/26 (b) | 200,000 | 184,673 | |
| Boston Scientific Corp.: | |||
| 1.9% 6/1/25 | 147,000 | 138,081 | |
| 3.45% 3/1/24 | 319,000 | 315,078 | |
| 637,832 | |||
| Health Care Providers & Services - 1.2% | |||
| Cigna Group: | |||
| 0.613% 3/15/24 | 153,000 | 148,846 | |
| 3.4% 3/1/27 | 650,000 | 611,129 | |
| CVS Health Corp.: | |||
| 4.3% 3/25/28 | 460,000 | 441,812 | |
| 5% 2/20/26 | 600,000 | 595,384 | |
| HCA Holdings, Inc. 3.125% 3/15/27 | 300,000 | 275,709 | |
| 2,072,880 | |||
| Life Sciences Tools & Services - 0.3% | |||
| Revvity, Inc. 0.85% 9/15/24 | 410,000 | 388,644 | |
| Thermo Fisher Scientific, Inc. 1.215% 10/18/24 | 180,000 | 171,591 | |
| 560,235 | |||
| Pharmaceuticals - 1.4% | |||
| AstraZeneca Finance LLC 0.7% 5/28/24 | 460,000 | 444,116 | |
| Bayer U.S. Finance II LLC: | |||
| 4.25% 12/15/25 (b) | 180,000 | 174,327 | |
| 4.375% 12/15/28 (b) | 470,000 | 446,496 | |
| Bayer U.S. Finance LLC 3.375% 10/8/24 (b) | 300,000 | 291,887 | |
| GSK Consumer Healthcare Capital 3.125% 3/24/25 | 260,000 | 250,075 | |
| Viatris, Inc.: | |||
| 1.65% 6/22/25 | 353,000 | 326,629 | |
| 2.3% 6/22/27 | 620,000 | 542,152 | |
| 2,475,682 | |||
TOTAL HEALTH CARE | 6,237,116 | ||
| INDUSTRIALS - 4.5% | |||
| Aerospace & Defense - 1.2% | |||
| L3Harris Technologies, Inc. 5.4% 1/15/27 | 550,000 | 551,336 | |
| RTX Corp. 5% 2/27/26 | 286,000 | 284,764 | |
| The Boeing Co.: | |||
| 1.95% 2/1/24 | 143,000 | 140,598 | |
| 3.2% 3/1/29 | 540,000 | 485,255 | |
| 4.875% 5/1/25 | 256,000 | 252,461 | |
| 5.04% 5/1/27 | 440,000 | 435,157 | |
| 2,149,571 | |||
| Building Products - 0.2% | |||
| Carrier Global Corp. 2.242% 2/15/25 | 374,000 | 355,765 | |
| Commercial Services & Supplies - 0.5% | |||
| Republic Services, Inc.: | |||
| 0.875% 11/15/25 | 441,000 | 399,628 | |
| 3.375% 11/15/27 | 470,000 | 437,311 | |
| 836,939 | |||
| Ground Transportation - 0.1% | |||
| Canadian Pacific Railway Co. 1.75% 12/2/26 | 155,000 | 139,291 | |
| Industrial Conglomerates - 0.3% | |||
| Siemens Financieringsmaatschappij NV: | |||
| 0.65% 3/11/24 (b) | 301,000 | 293,346 | |
| 1.2% 3/11/26 (b) | 325,000 | 294,929 | |
| 588,275 | |||
| Machinery - 0.9% | |||
| Daimler Trucks Finance North America LLC: | |||
| 1.625% 12/13/24 (b) | 234,000 | 222,118 | |
| 2% 12/14/26 (b) | 350,000 | 314,635 | |
| Otis Worldwide Corp. 2.056% 4/5/25 | 362,000 | 343,020 | |
| Parker Hannifin Corp.: | |||
| 3.65% 6/15/24 | 370,000 | 363,606 | |
| 4.25% 9/15/27 | 242,000 | 234,757 | |
| Westinghouse Air Brake Tech Co. 4.4% 3/15/24 | 161,000 | 159,266 | |
| 1,637,402 | |||
| Passenger Airlines - 0.4% | |||
| American Airlines 2019-1 Class B Pass Through Trust equipment trust certificate 3.85% 8/15/29 | 267,984 | 237,029 | |
| Delta Air Lines, Inc. 2.9% 10/28/24 | 306,000 | 296,353 | |
| United Airlines 2019-2 Class B Pass Through Trust equipment trust certificate 3.5% 11/1/29 | 180,121 | 162,644 | |
| 696,026 | |||
| Trading Companies & Distributors - 0.6% | |||
| Air Lease Corp.: | |||
| 0.7% 2/15/24 | 467,000 | 455,724 | |
| 0.8% 8/18/24 | 421,000 | 400,430 | |
| 2.2% 1/15/27 | 270,000 | 241,271 | |
| 1,097,425 | |||
| Transportation Infrastructure - 0.3% | |||
| Avolon Holdings Funding Ltd.: | |||
| 2.875% 2/15/25 (b) | 185,000 | 174,556 | |
| 3.95% 7/1/24 (b) | 49,000 | 47,796 | |
| 5.5% 1/15/26 (b) | 202,000 | 196,658 | |
| 419,010 | |||
TOTAL INDUSTRIALS | 7,919,704 | ||
| INFORMATION TECHNOLOGY - 2.7% | |||
| Communications Equipment - 0.3% | |||
| Bank of America NA 5.526% 8/18/26 | 500,000 | 502,432 | |
| Electronic Equipment, Instruments & Components - 0.4% | |||
| Amphenol Corp. 3.2% 4/1/24 | 37,000 | 36,462 | |
| Dell International LLC/EMC Corp. 5.25% 2/1/28 | 726,000 | 724,296 | |
| 760,758 | |||
| Semiconductors & Semiconductor Equipment - 0.6% | |||
| Broadcom, Inc. 1.95% 2/15/28 (b) | 790,000 | 685,098 | |
| Microchip Technology, Inc. 0.983% 9/1/24 | 285,000 | 271,418 | |
| Micron Technology, Inc. 4.185% 2/15/27 | 116,000 | 110,563 | |
| 1,067,079 | |||
| Software - 1.4% | |||
| Oracle Corp.: | |||
| 1.65% 3/25/26 | 430,000 | 391,844 | |
| 4.5% 5/6/28 | 450,000 | 436,562 | |
| 5.8% 11/10/25 | 200,000 | 201,945 | |
| Roper Technologies, Inc.: | |||
| 2.35% 9/15/24 | 180,000 | 173,916 | |
| 3.65% 9/15/23 | 452,000 | 451,714 | |
| VMware, Inc.: | |||
| 1% 8/15/24 | 421,000 | 402,359 | |
| 1.4% 8/15/26 | 325,000 | 288,182 | |
| 2,346,522 | |||
TOTAL INFORMATION TECHNOLOGY | 4,676,791 | ||
| MATERIALS - 0.8% | |||
| Chemicals - 0.8% | |||
| International Flavors & Fragrances, Inc. 1.23% 10/1/25 (b) | 443,000 | 396,650 | |
| LYB International Finance III LLC 1.25% 10/1/25 | 204,000 | 186,058 | |
| Nutrien Ltd.: | |||
| 4.9% 3/27/28 | 600,000 | 586,326 | |
| 5.9% 11/7/24 | 313,000 | 312,897 | |
| 1,481,931 | |||
| REAL ESTATE - 1.5% | |||
| Equity Real Estate Investment Trusts (REITs) - 1.5% | |||
| American Tower Corp. 1.3% 9/15/25 | 129,000 | 118,317 | |
| Boston Properties, Inc. 3.2% 1/15/25 | 295,000 | 282,886 | |
| Crown Castle International Corp.: | |||
| 1.35% 7/15/25 | 27,000 | 24,922 | |
| 5% 1/11/28 | 450,000 | 441,761 | |
| Healthcare Trust of America Holdings LP 3.5% 8/1/26 | 450,000 | 420,087 | |
| Kite Realty Group Trust 4% 3/15/25 | 150,000 | 144,105 | |
| Realty Income Corp. 2.2% 6/15/28 | 24,000 | 20,829 | |
| Spirit Realty LP 2.1% 3/15/28 | 359,000 | 306,124 | |
| Ventas Realty LP: | |||
| 2.65% 1/15/25 | 199,000 | 189,577 | |
| 3% 1/15/30 | 426,000 | 362,949 | |
| 3.5% 4/15/24 | 129,000 | 126,885 | |
| Vornado Realty LP 2.15% 6/1/26 | 80,000 | 69,151 | |
| Welltower OP LLC 3.625% 3/15/24 | 110,000 | 108,581 | |
| 2,616,174 | |||
| Real Estate Management & Development - 0.0% | |||
| Brandywine Operating Partnership LP 4.1% 10/1/24 | 19,000 | 18,141 | |
TOTAL REAL ESTATE | 2,634,315 | ||
| UTILITIES - 5.3% | |||
| Electric Utilities - 2.3% | |||
| Cleco Corporate Holdings LLC 3.743% 5/1/26 | 490,000 | 460,162 | |
| Duke Energy Corp. 4.3% 3/15/28 | 755,000 | 726,899 | |
| Eversource Energy 5.45% 3/1/28 | 840,000 | 842,818 | |
| Exelon Corp. 2.75% 3/15/27 | 54,000 | 49,562 | |
| FirstEnergy Corp.: | |||
| 1.6% 1/15/26 | 29,000 | 26,333 | |
| 2.05% 3/1/25 | 138,000 | 128,872 | |
| Florida Power & Light Co. 2.85% 4/1/25 | 178,000 | 171,217 | |
| Georgia Power Co. 4.65% 5/16/28 | 264,000 | 257,446 | |
| Pennsylvania Electric Co. 5.15% 3/30/26 (b) | 189,000 | 185,937 | |
| Southern Co. 0.6% 2/26/24 | 428,000 | 417,446 | |
| Tampa Electric Co. 3.875% 7/12/24 | 331,000 | 325,717 | |
| Vistra Operations Co. LLC 5% 7/31/27 (b) | 370,000 | 347,988 | |
| 3,940,397 | |||
| Gas Utilities - 0.4% | |||
| CenterPoint Energy Resources Corp. 5.25% 3/1/28 | 440,000 | 438,978 | |
| Dominion Gas Holdings LLC 2.5% 11/15/24 | 343,000 | 329,971 | |
| 768,949 | |||
| Independent Power and Renewable Electricity Producers - 0.5% | |||
| Emera U.S. Finance LP 0.833% 6/15/24 | 362,000 | 344,668 | |
| The AES Corp.: | |||
| 3.3% 7/15/25 (b) | 166,000 | 157,844 | |
| 5.45% 6/1/28 | 360,000 | 353,278 | |
| 855,790 | |||
| Multi-Utilities - 2.1% | |||
| Dominion Energy, Inc. 1.45% 4/15/26 | 670,000 | 604,411 | |
| DTE Energy Co.: | |||
| 4.22% 11/1/24 | 140,000 | 137,314 | |
| 4.875% 6/1/28 | 450,000 | 440,014 | |
| NiSource, Inc.: | |||
| 0.95% 8/15/25 | 314,000 | 287,828 | |
| 2.95% 9/1/29 | 827,000 | 727,717 | |
| 5.25% 3/30/28 | 440,000 | 438,156 | |
| Sempra: | |||
| 3.3% 4/1/25 | 261,000 | 251,443 | |
| 3.4% 2/1/28 | 196,000 | 181,370 | |
| WEC Energy Group, Inc.: | |||
| 4.75% 1/15/28 | 450,000 | 440,686 | |
| 5% 9/27/25 | 228,000 | 225,871 | |
| 3,734,810 | |||
TOTAL UTILITIES | 9,299,946 | ||
| TOTAL NONCONVERTIBLE BONDS (Cost $120,469,012) | 115,340,976 | ||
| U.S. Treasury Obligations - 13.3% | |||
Principal Amount (a) | Value ($) | ||
| U.S. Treasury Notes: | |||
| 0.75% 3/31/26 (e) | 4,887,400 | 4,435,697 | |
| 3.875% 1/15/26 | 5,000,000 | 4,905,469 | |
| 4% 6/30/28 | 3,000,000 | 2,964,141 | |
| 4.5% 11/15/25 | 11,071,300 | 11,003,825 | |
| TOTAL U.S. TREASURY OBLIGATIONS (Cost $23,895,487) | 23,309,132 | ||
| U.S. Government Agency - Mortgage Securities - 0.1% | |||
Principal Amount (a) | Value ($) | ||
| Fannie Mae - 0.1% | |||
4.5% 3/1/39 to 9/1/49 (Cost $234,300) | 219,665 | 212,511 | |
| Asset-Backed Securities - 11.8% | |||
Principal Amount (a) | Value ($) | ||
| AASET Trust: | |||
| Series 2019-2 Class A, 3.376% 10/16/39 (b) | 161,101 | 135,145 | |
| Series 2021-1A Class A, 2.95% 11/16/41 (b) | 190,472 | 167,810 | |
| Series 2021-2A Class A, 2.798% 1/15/47 (b) | 362,086 | 312,832 | |
| Aimco Series 2021-10A Class AR, CME Term SOFR 3 Month Index + 1.320% 6.6672% 7/22/32 (b)(c)(d) | 723,000 | 719,295 | |
| AIMCO CLO Ltd. Series 2022-12A Class AR, CME Term SOFR 3 Month Index + 1.170% 6.478% 1/17/32 (b)(c)(d) | 500,000 | 496,719 | |
| AmeriCredit Automobile Receivables Trust Series 2021-3 Class A3, 0.76% 8/18/26 | 567,131 | 550,053 | |
| Blackbird Capital Aircraft Series 2021-1A Class A, 2.443% 7/15/46 (b) | 411,366 | 353,667 | |
| Carvana Auto Receivables Trust Series 2021-P2 Class A3, 0.49% 3/10/26 | 429,282 | 419,500 | |
| Castlelake Aircraft Structured Trust Series 2021-1A Class A, 3.474% 1/15/46 (b) | 292,376 | 269,726 | |
| Cedar Funding Ltd.: | |||
| Series 2021-10A Class AR, CME Term SOFR 3 Month Index + 1.360% 6.6878% 10/20/32 (b)(c)(d) | 250,000 | 248,971 | |
| Series 2021-14A Class A, CME Term SOFR 3 Month Index + 1.360% 6.6696% 7/15/33 (b)(c)(d) | 798,000 | 792,786 | |
| Cent CLO LP Series 2021-21A Class A1R3, CME Term SOFR 3 Month Index + 1.230% 6.589% 7/27/30 (b)(c)(d) | 476,915 | 474,785 | |
| CFMT LLC Series 2023 HB12 Class A, 4.25% 4/25/33 (b) | 78,590 | 75,231 | |
| Chase Issuance Trust Series 2022-A1 Class A, 3.97% 9/15/27 | 578,000 | 563,730 | |
| DB Master Finance LLC Series 2021-1A Class A2I, 2.045% 11/20/51 (b) | 982,500 | 861,680 | |
| Dell Equipment Finance Trust Series 2021-1 Class A3, 0.43% 5/22/26 (b) | 39,297 | 39,164 | |
| Donlen Fleet Lease Funding Series 2021-2 Class A2, 0.56% 12/11/34 (b) | 129,250 | 126,703 | |
| Enterprise Fleet Financing LLC: | |||
| Series 2020-2 Class A2, 0.61% 7/20/26 (b) | 57,760 | 57,032 | |
| Series 2021-1 Class A2, 0.44% 12/21/26 (b) | 56,200 | 55,274 | |
| Series 2022-3 Class A2, 4.38% 7/20/29 (b) | 93,483 | 91,695 | |
| Series 2023-1 Class A2, 5.51% 1/22/29 (b) | 367,000 | 364,794 | |
| Ford Credit Auto Owner Trust: | |||
| Series 2019-1 Class A, 3.52% 7/15/30 (b) | 250,000 | 247,701 | |
| Series 2020-2 Class A, 1.06% 4/15/33 (b) | 1,483,000 | 1,350,063 | |
| Ford Credit Floorplan Master Owner Trust: | |||
| Series 2020-1 Class A1, 0.7% 9/15/25 | 900,000 | 898,503 | |
| Series 2023-1 Class A1, 4.92% 5/15/28 (b) | 310,000 | 306,287 | |
| GM Financial Automobile Leasing Series 2023-2 Class A3, 5.05% 7/20/26 | 309,000 | 306,556 | |
| GMF Floorplan Owner Revolving Trust: | |||
| Series 2020-2 Class A, 0.69% 10/15/25 (b) | 403,000 | 400,443 | |
| Series 2023-1 Class A1, 5.34% 6/15/28 (b) | 425,000 | 424,455 | |
| Madison Park Funding XXXII, Ltd. / Madison Park Funding XXXII LLC Series 2021-32A Class A1R, CME Term SOFR 3 Month Index + 1.260% 6.6072% 1/22/31 (b)(c)(d) | 512,000 | 510,182 | |
| Marlette Funding Trust: | |||
| Series 2022-1A Class A, 1.36% 4/15/32 (b) | 14,390 | 14,363 | |
| Series 2022-2A Class A, 4.25% 8/15/32 (b) | 132,722 | 132,020 | |
| MMAF Equipment Finance LLC Series 2019-B Class A3, 2.01% 12/12/24 (b) | 43,160 | 42,763 | |
| Niagara Park CLO, Ltd. Series 2021-1A Class AR, CME Term SOFR 3 Month Index + 1.260% 6.5696% 7/17/32 (b)(c)(d) | 1,070,000 | 1,062,009 | |
| OneMain Direct Auto Receivables Trust Series 2021-1A Class A, 0.87% 7/14/28 (b) | 695,000 | 659,409 | |
| Palmer Square Loan Funding, Ltd. / Palmer Square Loan Funding LLC Series 2022-1A Class A1, CME Term SOFR 3 Month Index + 1.050% 6.358% 4/15/30 (b)(c)(d) | 580,055 | 575,506 | |
| Prpm 2021-5, LLC Series 2021-5 Class A1, 1.793% 6/25/26 (b)(c) | 537,271 | 498,823 | |
| Santander Drive Auto Receivables Trust Series 2022-5 Class A3, 4.11% 8/17/26 | 394,000 | 391,120 | |
| Santander Retail Auto Lease Trust Series 2021-A Class A3, 0.51% 7/22/24 (b) | 116,227 | 115,546 | |
| SBA Tower Trust: | |||
| Series 2019, 2.836% 1/15/50 (b) | 137,000 | 130,704 | |
| 1.884% 7/15/50 (b) | 86,000 | 77,644 | |
| SLAM Ltd. / SLAM LLC Series 2021-1A Class A, 2.434% 6/15/46 (b) | 1,384,225 | 1,194,586 | |
| Sofi Consumer Loan Program Series 2023-1S Class A, 5.81% 5/15/31 (b) | 151,120 | 150,832 | |
| Symphony CLO XXI, Ltd. Series 2021-21A Class AR, CME Term SOFR 3 Month Index + 1.320% 6.6296% 7/15/32 (b)(c)(d) | 791,000 | 786,330 | |
| TCI-Symphony CLO Series 2021-1A Class AR, CME Term SOFR 3 Month Index + 1.190% 6.4996% 7/15/30 (b)(c)(d) | 744,586 | 740,875 | |
| Tesla Auto Lease Trust Series 2021-A Class A3, 0.56% 3/20/25 (b) | 110,055 | 109,765 | |
| Upstart Securitization Trust: | |||
| Series 2021-3 Class A, 0.83% 7/20/31 (b) | 22,210 | 22,101 | |
| Series 2021-4 Class A, 0.84% 9/20/31 (b) | 84,738 | 83,689 | |
| Series 2021-5 Class A, 1.31% 11/20/31 (b) | 136,683 | 134,347 | |
| VCAT Asset Securitization, LLC: | |||
| Series 2021-NPL1 Class A1, 2.2891% 12/26/50 (b) | 50,565 | 48,920 | |
| Series 2021-NPL2 Class A1, 2.115% 3/27/51 (b) | 329,802 | 314,131 | |
| Series 2021-NPL3 Class A1, 1.743% 5/25/51 (b)(c) | 675,660 | 621,318 | |
| Verizon Master Trust Series 2021-1: | |||
| Class A, 0.5% 5/20/27 | 612,000 | 588,905 | |
| Class B, 0.69% 5/20/27 | 700,000 | 673,256 | |
| TOTAL ASSET-BACKED SECURITIES (Cost $21,650,423) | 20,789,744 | ||
| Collateralized Mortgage Obligations - 2.5% | |||
Principal Amount (a) | Value ($) | ||
| Private Sponsor - 2.2% | |||
| Ajax Mortgage Loan Trust sequential payer Series 2021-B Class A, 2.239% 6/25/66 (b)(c) | 174,950 | 165,953 | |
| Angel Oak Mortgage Trust Series 2021-8 Class A1, 1.82% 11/25/66 (b) | 418,200 | 348,794 | |
| Brass PLC Series 2021-10A Class A1, 0.669% 4/16/69 (b)(c) | 66,547 | 63,640 | |
| Cascade Funding Mortgage Trust: | |||
| Series 2021-EBO1 Class A, 0.9849% 11/25/50 (b)(c) | 107,263 | 99,024 | |
| Series 2021-HB5 Class A, 0.8006% 2/25/31 (b) | 60,485 | 58,913 | |
| Series 2021-HB6 Class A, 0.8983% 6/25/36 (b) | 158,887 | 153,655 | |
| Series 2021-HB7 Class A, 1.1512% 10/27/31 (b) | 140,252 | 133,447 | |
| Cfmt 2022-Ebo2 sequential payer Series 2022-EBO2 Class A, 3.169% 7/25/54 (b) | 56,739 | 55,791 | |
| Csmc 2021-Rpl9 Trust sequential payer Series 2021-RPL9 Class A1, 2.4364% 2/25/61 (b) | 597,426 | 560,532 | |
| Finance of America HECM Buyout sequential payer Series 2022-HB1 Class A, 2.6948% 2/25/32 (b)(c) | 345,908 | 325,751 | |
| GCAT Trust sequential payer Series 2021-NQM7 Class A1, 1.915% 8/25/66 (b) | 220,773 | 192,278 | |
| Legacy Mortgage Asset Trust Series 2021-GS5 Class A1, 2.25% 7/25/67 (b)(c) | 483,214 | 451,377 | |
| New Residential Mortgage Loan Trust Series 2019-5A Class A1B, 3.5% 8/25/59 (b) | 58,397 | 53,573 | |
| New York Mortgage Trust sequential payer Series 2021-SP1 Class A1, 1.6696% 8/25/61 (b) | 163,849 | 149,215 | |
| Oceanview Trust sequential payer Series 2021-1 Class A, 1.2187% 12/29/51 (b)(c) | 62,309 | 61,153 | |
| Preston Ridge Partners Mortgage Trust: | |||
| sequential payer Series 2021-8 Class A1, 1.743% 9/25/26 (b)(c) | 417,459 | 386,233 | |
| Series 2021-2 Class A1, 2.115% 3/25/26 (b) | 308,482 | 292,045 | |
| Series 2021-RPL1 Class A1, 1.319% 7/25/51 (b) | 68,888 | 60,644 | |
| Series 2021-RPL2 Class A1, 1.455% 10/25/51 (b)(c) | 91,853 | 80,290 | |
| RMF Buyout Issuance Trust sequential payer: | |||
| Series 2021-HB1 Class A, 1.2586% 11/25/31 (b) | 131,996 | 126,010 | |
| Series 2022-HB1 Class A, 4.272% 4/25/32 (b) | 64,110 | 60,474 | |
TOTAL PRIVATE SPONSOR | 3,878,792 | ||
| U.S. Government Agency - 0.3% | |||
| Fannie Mae: | |||
| planned amortization class: | |||
Series 2015-28 Class P, 2.5% 5/25/45 | 35,222 | 32,148 | |
Series 2019-33 Class N, 3% 3/25/48 | 269,925 | 249,226 | |
| Series 2019-59 Class AB, 2.5% 10/25/39 | 90,084 | 80,793 | |
| Freddie Mac planned amortization class Series 2019-4903 Class DA, 3% 10/25/48 | 129,746 | 117,666 | |
TOTAL U.S. GOVERNMENT AGENCY | 479,833 | ||
| TOTAL COLLATERALIZED MORTGAGE OBLIGATIONS (Cost $4,733,558) | 4,358,625 | ||
| Commercial Mortgage Securities - 5.3% | |||
Principal Amount (a) | Value ($) | ||
| BAMLL Commercial Mortgage Securities Trust: | |||
| floater Series 2022-DKLX Class A, CME Term SOFR 1 Month Index + 1.150% 6.461% 1/15/39 (b)(c)(d) | 174,000 | 169,266 | |
| sequential payer Series 2019-BPR Class ANM, 3.112% 11/5/32 (b) | 138,000 | 125,698 | |
| Bank of America Commercial Mortgage Trust sequential payer Series 2015-UBS7 Class ASB, 3.429% 9/15/48 | 264,028 | 256,271 | |
| BBCMS Mortgage Trust sequential payer Series 2017-C1 Class ASB, 3.488% 2/15/50 | 590,018 | 562,034 | |
| Benchmark Mortgage Trust sequential payer Series 2018-B2 Class A2, 3.6623% 2/15/51 | 50,020 | 49,886 | |
| BLOX Trust floater sequential payer Series 2021-BLOX Class A, CME Term SOFR 1 Month Index + 0.860% 6.1755% 9/15/26 (b)(c)(d) | 352,000 | 336,592 | |
| BPR Trust floater Series 2022-OANA Class A, CME Term SOFR 1 Month Index + 1.890% 7.2085% 4/15/37 (b)(c)(d) | 566,000 | 555,774 | |
| BX Commercial Mortgage Trust floater: | |||
| Series 2021-PAC Class A, CME Term SOFR 1 Month Index + 0.800% 6.1136% 10/15/36 (b)(c)(d) | 323,000 | 315,501 | |
| Series 2021-VINO Class A, CME Term SOFR 1 Month Index + 0.760% 6.0768% 5/15/38 (b)(c)(d) | 226,749 | 222,335 | |
| Series 2022-LP2 Class A, CME Term SOFR 1 Month Index + 1.010% 6.3234% 2/15/39 (b)(c)(d) | 359,671 | 349,746 | |
| BX Trust: | |||
| floater: | |||
Series 2021-ACNT Class A, CME Term SOFR 1 Month Index + 0.960% 6.2745% 11/15/38 (b)(c)(d) | 319,000 | 313,099 | |
Series 2021-BXMF Class A, CME Term SOFR 1 Month Index + 0.750% 6.0604% 10/15/26 (b)(c)(d) | 298,000 | 291,175 | |
Series 2022-GPA Class A, CME Term SOFR 1 Month Index + 2.160% 7.4755% 8/15/39 (b)(c)(d) | 132,000 | 132,000 | |
| floater sequential payer: | |||
Series 2019-XL Class A, CME Term SOFR 1 Month Index + 1.030% 6.345% 10/15/36 (b)(c)(d) | 250,840 | 250,205 | |
Series 2021-SOAR Class A, CME Term SOFR 1 Month Index + 0.780% 6.0955% 6/15/38 (b)(c)(d) | 430,780 | 422,396 | |
| CF Hippolyta Issuer LLC sequential payer: | |||
| Series 2020-1 Class A1, 1.69% 7/15/60 (b) | 484,805 | 438,269 | |
| Series 2021-1A Class A1, 1.53% 3/15/61 (b) | 340,224 | 298,862 | |
| CGDB Commercial Mortgage Trust floater Series 2019-MOB Class A, CME Term SOFR 1 Month Index + 1.060% 6.375% 11/15/36 (b)(c)(d) | 100,000 | 98,301 | |
| Citigroup Commercial Mortgage Trust sequential payer Series 2016-GC36 Class AAB, 3.368% 2/10/49 | 61,388 | 59,347 | |
| COMM Mortgage Trust: | |||
| sequential payer Series 2020-SBX Class A, 1.67% 1/10/38 (b) | 625,000 | 541,031 | |
| Series 2013-CR13 Class AM, 4.449% 11/10/46 | 131,000 | 129,537 | |
| Credit Suisse Mortgage Trust sequential payer Series 2020-NET Class A, 2.2569% 8/15/37 (b) | 97,069 | 87,470 | |
| ELP Commercial Mortgage Trust floater Series 2021-ELP Class A, CME Term SOFR 1 Month Index + 0.810% 6.1265% 11/15/38 (b)(c)(d) | 443,000 | 433,550 | |
| GS Mortgage Securities Trust floater Series 2021-IP Class A, CME Term SOFR 1 Month Index + 1.060% 6.3755% 10/15/36 (b)(c)(d) | 190,000 | 180,706 | |
| JPMBB Commercial Mortgage Securities Trust: | |||
| sequential payer Series 2014-C22 Class A4, 3.8012% 9/15/47 | 189,000 | 183,610 | |
| Series 2013-C17 Class A/S, 4.4584% 1/15/47 | 327,000 | 315,645 | |
| JPMorgan Chase Commercial Mortgage Securities Trust floater Series 2019-BKWD Class A, CME Term SOFR 1 Month Index + 1.360% 6.6755% 9/15/29 (b)(c)(d) | 91,583 | 84,960 | |
| LIFE Mortgage Trust floater Series 2021-BMR Class A, CME Term SOFR 1 Month Index + 0.810% 6.1245% 3/15/38 (b)(c)(d) | 286,044 | 280,295 | |
| Morgan Stanley BAML Trust sequential payer: | |||
| Series 2014-C15 Class ASB, 3.654% 4/15/47 | 59,090 | 58,725 | |
| Series 2014-C19 Class ASB, 3.326% 12/15/47 | 128,997 | 127,157 | |
| Series 2016-C28 Class A3, 3.272% 1/15/49 | 106,361 | 99,888 | |
| Morgan Stanley Capital I Trust sequential payer Series 2019-MEAD Class A, 3.17% 11/10/36 (b) | 302,000 | 276,262 | |
| OPG Trust floater Series 2021-PORT Class A, CME Term SOFR 1 Month Index + 0.590% 5.9095% 10/15/36 (b)(c)(d) | 479,407 | 467,074 | |
| SREIT Trust floater Series 2021-MFP Class A, CME Term SOFR 1 Month Index + 0.840% 6.1558% 11/15/38 (b)(c)(d) | 299,000 | 292,997 | |
| Wells Fargo Commercial Mortgag Trust sequential payer Series 2015-NXS3 Class ASB, 3.371% 9/15/57 | 146,869 | 141,565 | |
| Wells Fargo Commercial Mortgage Trust sequential payer: | |||
| Series 2015-LC22 Class ASB, 3.571% 9/15/58 | 136,584 | 132,706 | |
| Series 2017-RC1 Class ASB, 3.453% 1/15/60 | 176,166 | 168,541 | |
| TOTAL COMMERCIAL MORTGAGE SECURITIES (Cost $9,811,656) | 9,248,476 | ||
| Municipal Securities - 0.1% | |||
Principal Amount (a) | Value ($) | ||
California Gen. Oblig. Series 2019, 2.4% 10/1/25 (Cost $220,804) | 220,000 | 207,954 | |
| Foreign Government and Government Agency Obligations - 0.1% | |||
Principal Amount (a) | Value ($) | ||
United Mexican States 3.25% 4/16/30 (Cost $199,272) | 200,000 | 177,058 | |
| Bank Notes - 0.2% | |||
Principal Amount (a) | Value ($) | ||
First Citizens Bank & Trust Co. 2.969% 9/27/25 (c) (Cost $325,000) | 325,000 | 311,067 | |
| Money Market Funds - 1.6% | |||
| Shares | Value ($) | ||
Fidelity Cash Central Fund 5.43% (f) (Cost $2,892,593) | 2,892,015 | 2,892,593 | |
| TOTAL INVESTMENT IN SECURITIES - 100.6% (Cost $184,432,105) | 176,848,136 |
NET OTHER ASSETS (LIABILITIES) - (0.6)% | (1,115,775) |
| NET ASSETS - 100.0% | 175,732,361 |
| Futures Contracts | |||||
Number of contracts | Expiration Date | Notional Amount ($) | Value ($) | Unrealized Appreciation/ (Depreciation) ($) | |
| Purchased | |||||
| Treasury Contracts | |||||
| CBOT 2-Year U.S. Treasury Note Contracts (United States) | 28 | Dec 2023 | 5,706,531 | 16,570 | 16,570 |
| CBOT 5-Year U.S. Treasury Note Contracts (United States) | 131 | Dec 2023 | 14,006,766 | 97,019 | 97,019 |
| TOTAL FUTURES CONTRACTS | 113,589 | ||||
| The notional amount of futures purchased as a percentage of Net Assets is 11.2% | |||||
| (a) | Amount is stated in United States dollars unless otherwise noted. |
| (b) | Security exempt from registration under Rule 144A of the Securities Act of 1933. These securities may be resold in transactions exempt from registration, normally to qualified institutional buyers. At the end of the period, the value of these securities amounted to $50,094,522 or 28.5% of net assets. |
| (c) | Coupon rates for floating and adjustable rate securities reflect the rates in effect at period end. |
| (d) | Coupon is indexed to a floating interest rate which may be multiplied by a specified factor and/or subject to caps or floors. |
| (e) | Security or a portion of the security was pledged to cover margin requirements for futures contracts. At period end, the value of securities pledged amounted to $250,502. |
| (f) | Affiliated fund that is generally available only to investment companies and other accounts managed by Fidelity Investments. The rate quoted is the annualized seven-day yield of the fund at period end. A complete unaudited listing of the fund's holdings as of its most recent quarter end is available upon request. In addition, each Fidelity Central Fund's financial statements, which are not covered by the Fund's Report of Independent Registered Public Accounting Firm, are available on the SEC's website or upon request. |
| Affiliate | Value, beginning of period ($) | Purchases ($) | Sales Proceeds ($) | Dividend Income ($) | Realized Gain (loss) ($) | Change in Unrealized appreciation (depreciation) ($) | Value, end of period ($) | % ownership, end of period |
| Fidelity Cash Central Fund 5.43% | 2,815,032 | 100,250,361 | 100,172,800 | 105,205 | 2 | (2) | 2,892,593 | 0.0% |
| Total | 2,815,032 | 100,250,361 | 100,172,800 | 105,205 | 2 | (2) | 2,892,593 | |
| Valuation Inputs at Reporting Date: | ||||
| Description | Total ($) | Level 1 ($) | Level 2 ($) | Level 3 ($) |
Investments in Securities: | ||||
| Corporate Bonds | 115,340,976 | - | 115,340,976 | - |
| U.S. Government and Government Agency Obligations | 23,309,132 | - | 23,309,132 | - |
| U.S. Government Agency - Mortgage Securities | 212,511 | - | 212,511 | - |
| Asset-Backed Securities | 20,789,744 | - | 20,789,744 | - |
| Collateralized Mortgage Obligations | 4,358,625 | - | 4,358,625 | - |
| Commercial Mortgage Securities | 9,248,476 | - | 9,248,476 | - |
| Municipal Securities | 207,954 | - | 207,954 | - |
| Foreign Government and Government Agency Obligations | 177,058 | - | 177,058 | - |
| Bank Notes | 311,067 | - | 311,067 | - |
| Money Market Funds | 2,892,593 | 2,892,593 | - | - |
| Total Investments in Securities: | 176,848,136 | 2,892,593 | 173,955,543 | - |
Derivative Instruments: | ||||
| Assets | ||||
Futures Contracts | 113,589 | 113,589 | - | - |
| Total Assets | 113,589 | 113,589 | - | - |
| Total Derivative Instruments: | 113,589 | 113,589 | - | - |
Primary Risk Exposure / Derivative Type | Value | |
| Asset ($) | Liability ($) | |
| Interest Rate Risk | ||
Futures Contracts (a) | 113,589 | 0 |
| Total Interest Rate Risk | 113,589 | 0 |
| Total Value of Derivatives | 113,589 | 0 |
| Statement of Assets and Liabilities | ||||
| August 31, 2023 | ||||
| Assets | ||||
| Investment in securities, at value - See accompanying schedule: | ||||
Unaffiliated issuers (cost $181,539,512) | $ | 173,955,543 | ||
Fidelity Central Funds (cost $2,892,593) | 2,892,593 | |||
| Total Investment in Securities (cost $184,432,105) | $ | 176,848,136 | ||
| Cash | 10,839 | |||
| Interest receivable | 1,338,999 | |||
| Distributions receivable from Fidelity Central Funds | 9,561 | |||
| Receivable for daily variation margin on futures contracts | 16,883 | |||
Total assets | 178,224,418 | |||
| Liabilities | ||||
| Payable for investments purchased | $ | 1,962,109 | ||
| Distributions payable | 492,750 | |||
| Accrued management fee | 37,198 | |||
| Total Liabilities | 2,492,057 | |||
| Net Assets | $ | 175,732,361 | ||
| Net Assets consist of: | ||||
| Paid in capital | $ | 190,046,763 | ||
| Total accumulated earnings (loss) | (14,314,402) | |||
| Net Assets | $ | 175,732,361 | ||
Net Asset Value, offering price and redemption price per share ($175,732,361 ÷ 3,650,000 shares) | $ | 48.15 | ||
| Statement of Operations | ||||
Year ended August 31, 2023 | ||||
| Investment Income | ||||
| Interest | $ | 6,710,831 | ||
| Income from Fidelity Central Funds | 105,205 | |||
| Total Income | 6,816,036 | |||
| Expenses | ||||
| Management fee | $ | 718,423 | ||
| Independent trustees' fees and expenses | 837 | |||
| Total expenses before reductions | 719,260 | |||
| Expense reductions | (2,021) | |||
| Total expenses after reductions | 717,239 | |||
| Net Investment income (loss) | 6,098,797 | |||
| Realized and Unrealized Gain (Loss) | ||||
| Net realized gain (loss) on: | ||||
| Investment Securities: | ||||
| Unaffiliated issuers | (2,842,510) | |||
| Redemptions in-kind | (4,075,658) | |||
| Fidelity Central Funds | 2 | |||
| Futures contracts | (1,225,377) | |||
| Total net realized gain (loss) | (8,143,543) | |||
| Change in net unrealized appreciation (depreciation) on: | ||||
| Investment Securities: | ||||
| Unaffiliated issuers | 7,674,990 | |||
| Fidelity Central Funds | (2) | |||
| Futures contracts | 237,112 | |||
| Total change in net unrealized appreciation (depreciation) | 7,912,100 | |||
| Net gain (loss) | (231,443) | |||
| Net increase (decrease) in net assets resulting from operations | $ | 5,867,354 | ||
| Statement of Changes in Net Assets | ||||
Year ended August 31, 2023 | Year ended August 31, 2022 | |||
| Increase (Decrease) in Net Assets | ||||
| Operations | ||||
| Net investment income (loss) | $ | 6,098,797 | $ | 2,850,328 |
| Net realized gain (loss) | (8,143,543) | (4,476,824) | ||
| Change in net unrealized appreciation (depreciation) | 7,912,100 | (16,393,659) | ||
| Net increase (decrease) in net assets resulting from operations | 5,867,354 | (18,020,155) | ||
| Distributions to shareholders | (6,097,800) | (2,935,700) | ||
| Share transactions | ||||
| Proceeds from sales of shares | 102,725,889 | 43,188,875 | ||
| Cost of shares redeemed | (167,087,505) | (65,105,164) | ||
Net increase (decrease) in net assets resulting from share transactions | (64,361,616) | (21,916,289) | ||
| Total increase (decrease) in net assets | (64,592,062) | (42,872,144) | ||
| Net Assets | ||||
| Beginning of period | 240,324,423 | 283,196,567 | ||
| End of period | $ | 175,732,361 | $ | 240,324,423 |
| Other Information | ||||
| Shares | ||||
| Sold | 2,150,000 | 850,000 | ||
| Redeemed | (3,450,000) | (1,300,000) | ||
| Net increase (decrease) | (1,300,000) | (450,000) | ||
| Fidelity® Limited Term Bond ETF |
| Years ended August 31, | 2023 | 2022 | 2021 | 2020 | 2019 | |||||
Selected Per-Share Data | ||||||||||
| Net asset value, beginning of period | $ | 48.55 | $ | 52.44 | $ | 52.52 | $ | 51.07 | $ | 49.42 |
| Income from Investment Operations | ||||||||||
Net investment income (loss) A,B | 1.315 | .539 | .470 | 1.039 | 1.344 | |||||
| Net realized and unrealized gain (loss) | (.351) | (3.868) | (.044) | 1.495 | 1.687 | |||||
| Total from investment operations | .964 | (3.329) | .426 | 2.534 | 3.031 | |||||
| Distributions from net investment income | (1.364) | (.561) | (.486) C | (1.084) | (1.381) | |||||
| Distributions from net realized gain | - | - | (.020) C | - | - | |||||
| Total distributions | (1.364) | (.561) | (.506) | (1.084) | (1.381) | |||||
| Net asset value, end of period | $ | 48.15 | $ | 48.55 | $ | 52.44 | $ | 52.52 | $ | 51.07 |
Total Return D,E | 2.02% | (6.38)% | .83% | 5.04% | 6.22% | |||||
Ratios to Average Net Assets B,F,G | ||||||||||
| Expenses before reductions | .32% | .36% | .36% | .36% | .36% | |||||
| Expenses net of fee waivers, if any | .32% | .36% | .36% | .36% | .36% | |||||
| Expenses net of all reductions | .32% | .36% | .36% | .36% | .36% | |||||
| Net investment income (loss) | 2.73% | 1.07% | .90% | 2.02% | 2.69% | |||||
| Supplemental Data | ||||||||||
| Net assets, end of period (000 omitted) | $ | 175,732 | $ | 240,324 | $ | 283,197 | $ | 181,184 | $ | 127,663 |
Portfolio turnover rate H,I | 59% | 38% | 75% | 102% | 32% |
| Average Annual Total Returns | |||
Periods ended August 31, 2023 | Past 1 year | Past 5 years | Life of Fund |
Fidelity® Low Duration Bond Factor ETF - NAV A | 4.87% | 2.00% | 2.06% |
Fidelity® Low Duration Bond Factor ETF - Market Price B | 4.96% | 1.99% | 2.08% |
Fidelity Low Duration Investment Grade Factor Index℠ A | 5.03% | 2.23% | 2.28% |
Bloomberg US Treasury Bill: 6-9 Months Index A | 3.11% | 1.46% | 1.48% |
| $10,000 Over Life of Fund |
Let's say hypothetically that $10,000 was invested in Fidelity® Low Duration Bond Factor ETF - NAV, on June 12, 2018, when the fund started. The chart shows how the value of your investment would have changed, and also shows how the Fidelity Low Duration Investment Grade Factor Index℠ and Bloomberg U.S. Treasury Bill: 6-9 Months Index performed over the same period. |
 |
Quality Diversification (% of Fund's net assets) |
 |
| We have used ratings from Moody's Investors Service, Inc. Where Moody's® ratings are not available, we have used S&P® ratings. All ratings are as of the date indicated and do not reflect subsequent changes. |
Asset Allocation (% of Fund's net assets) |
 |
Geographic Diversification (% of Fund's net assets) |
 |
* Includes Short-Term investments and Net Other Assets (Liabilities). Percentages are adjusted for the effect of derivatives, if applicable. |
| Nonconvertible Bonds - 86.2% | |||
Principal Amount (a) | Value ($) | ||
| COMMUNICATION SERVICES - 3.5% | |||
| Diversified Telecommunication Services - 2.5% | |||
| AT&T, Inc. 3 month U.S. LIBOR + 1.180% 6.7197% 6/12/24 (b)(c) | 2,370,000 | 2,380,658 | |
| Verizon Communications, Inc.: | |||
| CME Term SOFR 3 Month Index + 1.360% 6.7262% 5/15/25 (b)(c) | 2,113,000 | 2,133,923 | |
| U.S. Secured Overnight Fin. Rate (SOFR) Averages Index + 0.790% 5.9859% 3/20/26 (b)(c) | 1,380,000 | 1,387,506 | |
| 5,902,087 | |||
| Interactive Media & Services - 0.3% | |||
| Tencent Holdings Ltd.: | |||
| CME Term SOFR 3 Month Index + 1.170% 6.4701% 4/11/24 (b)(c)(d) | 600,000 | 601,710 | |
| CME Term SOFR 3 Month Index + 1.170% 6.4701% 4/11/24 (Reg. S) (b)(c) | 200,000 | 200,570 | |
| 802,280 | |||
| Media - 0.5% | |||
| Charter Communications Operating LLC/Charter Communications Operating Capital Corp. CME Term SOFR 3 Month Index + 1.910% 7.2835% 2/1/24 (b)(c) | 538,000 | 540,215 | |
| Comcast Corp. CME Term SOFR 3 Month Index + 0.890% 6.1996% 4/15/24 (b)(c) | 591,000 | 592,297 | |
| 1,132,512 | |||
| Wireless Telecommunication Services - 0.2% | |||
| Vodafone Group PLC CME Term SOFR 3 Month Index + 1.250% 6.5596% 1/16/24 (b)(c) | 400,000 | 400,608 | |
TOTAL COMMUNICATION SERVICES | 8,237,487 | ||
| CONSUMER DISCRETIONARY - 4.0% | |||
| Automobiles - 3.7% | |||
| American Honda Finance Corp.: | |||
| 3 month U.S. LIBOR + 0.420% 5.9333% 9/8/23 (b)(c) | 900,000 | 900,010 | |
| U.S. Secured Overnight Fin. Rate (SOFR) Averages Index + 0.670% 5.9094% 1/10/25 (b)(c) | 600,000 | 601,189 | |
| U.S. Secured Overnight Fin. Rate (SOFR) Index + 0.920% 6.1594% 1/12/26 (b)(c) | 300,000 | 302,391 | |
| BMW U.S. Capital LLC: | |||
| U.S. Secured Overnight Fin. Rate (SOFR) Averages Index + 0.380% 5.6875% 8/12/24 (b)(c)(d) | 1,900,000 | 1,898,873 | |
| U.S. Secured Overnight Fin. Rate (SOFR) Averages Index + 0.620% 5.9279% 8/11/25 (b)(c)(d) | 700,000 | 701,437 | |
| U.S. Secured Overnight Fin. Rate (SOFR) Averages Index + 0.840% 6.0568% 4/1/25 (b)(c)(d) | 600,000 | 603,612 | |
| Daimler Finance North America LLC U.S. Secured Overnight Fin. Rate (SOFR) Index + 0.930% 6.13% 3/30/25 (b)(c)(d) | 300,000 | 302,077 | |
| General Motors Financial Co., Inc.: | |||
| U.S. Secured Overnight Fin. Rate (SOFR) Averages Index + 1.300% 6.5271% 4/7/25 (b)(c) | 500,000 | 500,747 | |
| U.S. Secured Overnight Fin. Rate (SOFR) Index + 0.760% 5.9467% 3/8/24 (b)(c) | 1,440,000 | 1,439,846 | |
| U.S. Secured Overnight Fin. Rate (SOFR) Index + 1.040% 6.342% 2/26/27 (b)(c) | 400,000 | 396,831 | |
| U.S. Secured Overnight Fin. Rate (SOFR) Index + 1.200% 6.5056% 11/17/23 (b)(c) | 300,000 | 300,393 | |
| Nissan Motor Acceptance Corp. 3 month U.S. LIBOR + 0.640% 6.1533% 3/8/24 (b)(c)(d) | 420,000 | 417,591 | |
| Volkswagen Group of America Finance LLC U.S. Secured Overnight Fin. Rate (SOFR) Index + 0.950% 6.136% 6/7/24 (b)(c)(d) | 400,000 | 401,044 | |
| 8,766,041 | |||
| Hotels, Restaurants & Leisure - 0.3% | |||
| Starbucks Corp. U.S. Secured Overnight Fin. Rate (SOFR) Averages Index + 0.420% 5.7275% 2/14/24 (b)(c) | 600,000 | 600,012 | |
TOTAL CONSUMER DISCRETIONARY | 9,366,053 | ||
| CONSUMER STAPLES - 0.4% | |||
| Beverages - 0.2% | |||
| PepsiCo, Inc. U.S. Secured Overnight Fin. Rate (SOFR) Averages Index + 0.400% 5.7075% 2/13/26 (b)(c) | 400,000 | 400,971 | |
| Food Products - 0.2% | |||
| General Mills, Inc. CME Term SOFR 3 Month Index + 1.270% 6.5796% 10/17/23 (b)(c) | 502,000 | 502,448 | |
TOTAL CONSUMER STAPLES | 903,419 | ||
| ENERGY - 0.4% | |||
| Oil, Gas & Consumable Fuels - 0.4% | |||
| Enbridge, Inc. U.S. Secured Overnight Fin. Rate (SOFR) Averages Index + 0.630% 5.936% 2/16/24 (b)(c) | 500,000 | 500,369 | |
| Shell International Finance BV CME Term SOFR 3 Month Index + 0.660% 6.0308% 11/13/23 (b)(c) | 495,000 | 495,523 | |
| 995,892 | |||
| FINANCIALS - 70.1% | |||
| Banks - 43.4% | |||
| ANZ New Zealand International Ltd. London Branch U.S. Secured Overnight Fin. Rate (SOFR) Index + 0.600% 5.9052% 2/18/25 (b)(c)(d) | 400,000 | 399,446 | |
| Australia & New Zealand Banking Group Ltd. U.S. Secured Overnight Fin. Rate (SOFR) Index + 0.750% 5.9668% 7/3/25 (b)(c)(d) | 400,000 | 400,908 | |
| Banco Santander SA U.S. Secured Overnight Fin. Rate (SOFR) Index + 1.240% 6.5435% 5/24/24 (b)(c) | 800,000 | 803,230 | |
| Bank of America Corp.: | |||
| 3 month U.S. LIBOR + 0.760% 6.312% 9/15/26 (b)(c) | 600,000 | 591,174 | |
| CME Term SOFR 3 Month Index + 1.030% 6.4015% 2/5/26 (b)(c) | 1,961,000 | 1,962,357 | |
| U.S. Secured Overnight Fin. Rate (SOFR) Index + 0.660% 5.9717% 2/4/25 (b)(c) | 200,000 | 199,830 | |
| U.S. Secured Overnight Fin. Rate (SOFR) Index + 0.690% 5.9897% 4/22/25 (b)(c) | 2,300,000 | 2,298,198 | |
| U.S. Secured Overnight Fin. Rate (SOFR) Index + 0.730% 6.0297% 10/24/24 (b)(c) | 2,210,000 | 2,210,052 | |
| U.S. Secured Overnight Fin. Rate (SOFR) Index + 0.970% 6.2452% 7/22/27 (b)(c) | 500,000 | 497,012 | |
| U.S. Secured Overnight Fin. Rate (SOFR) Index + 1.050% 6.3617% 2/4/28 (b)(c) | 300,000 | 299,400 | |
| U.S. Secured Overnight Fin. Rate (SOFR) Index + 1.330% 6.5625% 4/2/26 (b)(c) | 600,000 | 603,848 | |
| Bank of Montreal: | |||
| U.S. Secured Overnight Fin. Rate (SOFR) Averages Index + 0.320% 5.5494% 7/9/24 (b)(c) | 2,060,000 | 2,056,596 | |
| U.S. Secured Overnight Fin. Rate (SOFR) Averages Index + 0.350% 5.5367% 12/8/23 (b)(c) | 200,000 | 199,994 | |
| U.S. Secured Overnight Fin. Rate (SOFR) Averages Index + 0.460% 5.6944% 1/10/25 (b)(c) | 320,000 | 318,984 | |
| U.S. Secured Overnight Fin. Rate (SOFR) Averages Index + 0.620% 5.8136% 9/15/26 (b)(c) | 500,000 | 494,307 | |
| U.S. Secured Overnight Fin. Rate (SOFR) Averages Index + 0.710% 5.8985% 12/12/24 (b)(c) | 400,000 | 400,332 | |
| U.S. Secured Overnight Fin. Rate (SOFR) Averages Index + 1.060% 6.246% 6/7/25 (b)(c) | 600,000 | 601,802 | |
| U.S. Secured Overnight Fin. Rate (SOFR) Averages Index + 1.330% 6.5097% 6/5/26 (b)(c) | 700,000 | 706,756 | |
| Bank of New Zealand U.S. Secured Overnight Fin. Rate (SOFR) Index + 0.810% 6.1115% 1/27/27 (b)(c)(d) | 350,000 | 348,392 | |
| Bank of Nova Scotia: | |||
| U.S. Secured Overnight Fin. Rate (SOFR) Averages Index + 0.540% 5.7243% 3/2/26 (b)(c) | 1,859,000 | 1,839,278 | |
| U.S. Secured Overnight Fin. Rate (SOFR) Averages Index + 0.550% 5.7436% 9/15/23 (b)(c) | 400,000 | 400,050 | |
| U.S. Secured Overnight Fin. Rate (SOFR) Averages Index + 0.900% 6.1317% 4/11/25 (b)(c) | 500,000 | 500,484 | |
| U.S. Secured Overnight Fin. Rate (SOFR) Index + 0.380% 5.6938% 7/31/24 (b)(c) | 810,000 | 808,606 | |
| U.S. Secured Overnight Fin. Rate (SOFR) Index + 0.460% 5.6894% 1/10/25 (b)(c) | 400,000 | 398,405 | |
| Banque Federative du Credit Mutuel SA: | |||
| U.S. Secured Overnight Fin. Rate (SOFR) Averages Index + 0.410% 5.7206% 2/4/25 (b)(c)(d) | 1,330,000 | 1,320,593 | |
| U.S. Secured Overnight Fin. Rate (SOFR) Averages Index + 1.400% 6.6422% 7/13/26 (b)(c)(d) | 600,000 | 602,434 | |
| BPCE SA: | |||
| 3 month U.S. LIBOR + 1.240% 6.7797% 9/12/23 (b)(c)(d) | 250,000 | 250,037 | |
| U.S. Secured Overnight Fin. Rate (SOFR) Index + 0.570% 5.8151% 1/14/25 (b)(c)(d) | 480,000 | 478,028 | |
| Canadian Imperial Bank of Commerce: | |||
| 3 month U.S. LIBOR + 0.660% 6.2044% 9/13/23 (b)(c) | 654,000 | 654,046 | |
| U.S. Secured Overnight Fin. Rate (SOFR) Averages Index + 0.400% 5.5925% 12/14/23 (b)(c) | 1,224,000 | 1,223,691 | |
| U.S. Secured Overnight Fin. Rate (SOFR) Averages Index + 0.420% 5.6715% 10/18/24 (b)(c) | 790,000 | 787,576 | |
| U.S. Secured Overnight Fin. Rate (SOFR) Index + 0.940% 6.1671% 4/7/25 (b)(c) | 1,500,000 | 1,504,035 | |
| Citigroup, Inc.: | |||
| 3 month U.S. LIBOR + 1.250% 6.7834% 7/1/26 (b)(c) | 990,000 | 997,261 | |
| U.S. Secured Overnight Fin. Rate (SOFR) Index + 0.660% 5.9822% 5/1/25 (b)(c) | 1,610,000 | 1,609,356 | |
| U.S. Secured Overnight Fin. Rate (SOFR) Index + 0.690% 5.9737% 1/25/26 (b)(c) | 640,000 | 638,126 | |
| U.S. Secured Overnight Fin. Rate (SOFR) Index + 0.770% 5.9694% 6/9/27 (b)(c) | 400,000 | 394,307 | |
| U.S. Secured Overnight Fin. Rate (SOFR) Index + 1.280% 6.5837% 2/24/28 (b)(c) | 1,200,000 | 1,200,432 | |
| U.S. Secured Overnight Fin. Rate (SOFR) Index + 1.370% 6.6749% 5/24/25 (b)(c) | 200,000 | 200,899 | |
| U.S. Secured Overnight Fin. Rate (SOFR) Index + 1.520% 6.7239% 3/17/26 (b)(c) | 600,000 | 605,111 | |
| Commonwealth Bank of Australia: | |||
| 3 month U.S. LIBOR + 0.820% 6.3186% 6/4/24 (b)(c)(d) | 103,000 | 103,444 | |
| U.S. Secured Overnight Fin. Rate (SOFR) Index + 0.400% 5.6271% 7/7/25 (b)(c)(d) | 2,100,000 | 2,092,465 | |
| U.S. Secured Overnight Fin. Rate (SOFR) Index + 0.520% 5.7136% 6/15/26 (b)(c)(d) | 610,000 | 605,646 | |
| U.S. Secured Overnight Fin. Rate (SOFR) Index + 0.630% 5.93% 1/10/25 (b)(c)(d) | 1,000,000 | 1,001,351 | |
| U.S. Secured Overnight Fin. Rate (SOFR) Index + 0.740% 5.9325% 3/14/25 (b)(c)(d) | 700,000 | 701,132 | |
| U.S. Secured Overnight Fin. Rate (SOFR) Index + 0.970% 6.1625% 3/14/27 (b)(c)(d) | 600,000 | 600,961 | |
| Credit Agricole SA U.S. Secured Overnight Fin. Rate (SOFR) Index + 1.290% 6.5086% 7/5/26 (b)(c)(d) | 600,000 | 604,532 | |
| Danske Bank A/S 3 month U.S. LIBOR + 1.060% 6.5997% 9/12/23 (b)(c)(d) | 400,000 | 400,018 | |
| DNB Bank ASA U.S. Secured Overnight Fin. Rate (SOFR) Averages Index + 0.830% 6.0415% 3/28/25 (b)(c)(d) | 300,000 | 300,052 | |
| Federation des caisses Desjardin U.S. Secured Overnight Fin. Rate (SOFR) Index + 0.430% 5.735% 5/21/24 (b)(c)(d) | 510,000 | 509,317 | |
| HSBC Holdings PLC: | |||
| 3 month U.S. LIBOR + 1.230% 6.7697% 3/11/25 (b)(c) | 1,200,000 | 1,202,541 | |
| U.S. Secured Overnight Fin. Rate (SOFR) Index + 0.000% 6.8775% 8/14/27 (b)(c) | 1,000,000 | 1,004,672 | |
| U.S. Secured Overnight Fin. Rate (SOFR) Index + 0.580% 5.8843% 11/22/24 (b)(c) | 1,660,000 | 1,658,929 | |
| U.S. Secured Overnight Fin. Rate (SOFR) Index + 1.430% 6.6029% 3/10/26 (b)(c) | 800,000 | 803,827 | |
| Huntington National Bank U.S. Secured Overnight Fin. Rate (SOFR) Averages Index + 1.190% 6.496% 5/16/25 (b)(c) | 600,000 | 587,466 | |
| ING Groep NV: | |||
| 3 month U.S. LIBOR + 1.000% 6.5334% 10/2/23 (b)(c) | 800,000 | 800,343 | |
| U.S. Secured Overnight Fin. Rate (SOFR) Averages Index + 1.010% 6.2149% 4/1/27 (b)(c) | 200,000 | 198,135 | |
| U.S. Secured Overnight Fin. Rate (SOFR) Averages Index + 1.640% 6.8515% 3/28/26 (b)(c) | 1,300,000 | 1,308,592 | |
| JPMorgan Chase & Co.: | |||
| CME Term SOFR 3 Month Index + 1.110% 6.3925% 1/10/25 (b)(c) | 702,000 | 703,367 | |
| U.S. Secured Overnight Fin. Rate (SOFR) Index + 0.530% 5.7137% 6/1/25 (b)(c) | 1,310,000 | 1,306,044 | |
| U.S. Secured Overnight Fin. Rate (SOFR) Index + 0.580% 5.7836% 6/23/25 (b)(c) | 600,000 | 598,338 | |
| U.S. Secured Overnight Fin. Rate (SOFR) Index + 0.600% 5.7885% 12/10/25 (b)(c) | 1,950,000 | 1,940,667 | |
| U.S. Secured Overnight Fin. Rate (SOFR) Index + 0.760% 5.9672% 9/22/27 (b)(c) | 500,000 | 495,007 | |
| U.S. Secured Overnight Fin. Rate (SOFR) Index + 0.880% 6.1602% 4/22/27 (b)(c) | 1,000,000 | 997,042 | |
| U.S. Secured Overnight Fin. Rate (SOFR) Index + 0.920% 6.2229% 2/24/26 (b)(c) | 1,800,000 | 1,801,090 | |
| U.S. Secured Overnight Fin. Rate (SOFR) Index + 0.970% 6.1625% 6/14/25 (b)(c) | 400,000 | 400,828 | |
| U.S. Secured Overnight Fin. Rate (SOFR) Index + 1.320% 6.6156% 4/26/26 (b)(c) | 1,300,000 | 1,308,683 | |
| KeyBank NA U.S. Secured Overnight Fin. Rate (SOFR) Averages Index + 0.320% 5.5125% 6/14/24 (b)(c) | 600,000 | 588,319 | |
| Lloyds Banking Group PLC U.S. Secured Overnight Fin. Rate (SOFR) Averages Index + 1.560% 6.8709% 8/7/27 (b)(c) | 900,000 | 905,004 | |
| Mitsubishi UFJ Financial Group, Inc.: | |||
| U.S. Secured Overnight Fin. Rate (SOFR) Index + 0.940% 6.2447% 2/20/26 (b)(c) | 500,000 | 499,358 | |
| U.S. Secured Overnight Fin. Rate (SOFR) Index + 1.380% 6.5646% 9/12/25 (b)(c) | 500,000 | 502,321 | |
| U.S. Secured Overnight Fin. Rate (SOFR) Index + 1.440% 6.6734% 4/17/26 (b)(c) | 1,100,000 | 1,107,003 | |
| U.S. Secured Overnight Fin. Rate (SOFR) Index + 1.650% 6.9015% 7/18/25 (b)(c) | 600,000 | 603,416 | |
| Mizuho Financial Group, Inc.: | |||
| 3 month U.S. LIBOR + 1.000% 6.5397% 9/11/24 (b)(c) | 1,140,000 | 1,140,170 | |
| U.S. Secured Overnight Fin. Rate (SOFR) Index + 0.960% 6.2643% 5/22/26 (b)(c) | 700,000 | 698,602 | |
| Morgan Stanley Bank, West Valley City Utah U.S. Secured Overnight Fin. Rate (SOFR) Index + 0.780% 6.0655% 7/16/25 (b)(c) | 500,000 | 500,179 | |
| National Australia Bank Ltd.: | |||
| U.S. Secured Overnight Fin. Rate (SOFR) Index + 0.380% 5.6194% 1/12/25 (b)(c)(d) | 2,670,000 | 2,664,108 | |
| U.S. Secured Overnight Fin. Rate (SOFR) Index + 0.650% 5.8894% 1/12/27 (b)(c)(d) | 300,000 | 297,994 | |
| U.S. Secured Overnight Fin. Rate (SOFR) Index + 0.760% 6.0675% 5/13/25 (b)(c)(d) | 500,000 | 501,194 | |
| U.S. Secured Overnight Fin. Rate (SOFR) Index + 0.860% 6.0476% 6/9/25 (b)(c)(d) | 400,000 | 401,617 | |
| National Bank of Canada U.S. Secured Overnight Fin. Rate (SOFR) Index + 0.490% 5.8002% 8/6/24 (b)(c) | 300,000 | 299,107 | |
| NatWest Markets PLC: | |||
| U.S. Secured Overnight Fin. Rate (SOFR) Index + 0.530% 5.8375% 8/12/24 (b)(c)(d) | 1,000,000 | 996,354 | |
| U.S. Secured Overnight Fin. Rate (SOFR) Index + 0.760% 5.9732% 9/29/26 (b)(c)(d) | 650,000 | 639,022 | |
| Nordea Bank Abp U.S. Secured Overnight Fin. Rate (SOFR) Index + 0.960% 6.1443% 6/6/25 (b)(c)(d) | 200,000 | 200,536 | |
| Rabobank Nederland New York Branch: | |||
| U.S. Secured Overnight Fin. Rate (SOFR) Averages Index + 0.300% 5.5394% 1/12/24 (b)(c) | 546,000 | 545,910 | |
| U.S. Secured Overnight Fin. Rate (SOFR) Averages Index + 0.380% 5.6094% 1/10/25 (b)(c) | 930,000 | 928,057 | |
| U.S. Secured Overnight Fin. Rate (SOFR) Averages Index + 0.700% 5.9515% 7/18/25 (b)(c) | 600,000 | 601,524 | |
| Royal Bank of Canada: | |||
| CME Term SOFR 3 Month Index + 0.920% 6.1904% 10/5/23 (b)(c) | 660,000 | 660,140 | |
| U.S. Secured Overnight Fin. Rate (SOFR) Averages Index + 0.000% 5.9807% 1/21/27 (b)(c) | 500,000 | 494,069 | |
| U.S. Secured Overnight Fin. Rate (SOFR) Averages Index + 0.340% 5.5671% 10/7/24 (b)(c) | 1,180,000 | 1,175,422 | |
| U.S. Secured Overnight Fin. Rate (SOFR) Averages Index + 0.360% 5.6738% 7/29/24 (b)(c) | 1,000,000 | 999,195 | |
| U.S. Secured Overnight Fin. Rate (SOFR) Averages Index + 0.450% 5.7456% 10/26/23 (b)(c) | 210,000 | 210,055 | |
| U.S. Secured Overnight Fin. Rate (SOFR) Averages Index + 0.520% 5.7916% 1/20/26 (b)(c) | 1,992,000 | 1,975,136 | |
| U.S. Secured Overnight Fin. Rate (SOFR) Averages Index + 0.570% 5.8715% 4/27/26 (b)(c) | 200,000 | 197,386 | |
| U.S. Secured Overnight Fin. Rate (SOFR) Averages Index + 0.590% 5.9021% 11/2/26 (b)(c) | 830,000 | 820,578 | |
| U.S. Secured Overnight Fin. Rate (SOFR) Averages Index + 1.080% 6.3194% 1/12/26 (b)(c) | 400,000 | 400,968 | |
| Societe Generale U.S. Secured Overnight Fin. Rate (SOFR) Index + 1.050% 6.3207% 1/21/26 (b)(c)(d) | 1,130,000 | 1,122,990 | |
| Standard Chartered PLC: | |||
| U.S. Secured Overnight Fin. Rate (SOFR) Index + 0.930% 6.2333% 11/23/25 (b)(c)(d) | 1,000,000 | 996,523 | |
| U.S. Secured Overnight Fin. Rate (SOFR) Index + 1.740% 6.955% 3/30/26 (b)(c)(d) | 970,000 | 975,028 | |
| U.S. Secured Overnight Fin. Rate (SOFR) Index + 1.930% 7.1529% 7/6/27 (b)(c)(d) | 500,000 | 503,878 | |
| Sumitomo Mitsui Financial Group, Inc.: | |||
| U.S. Secured Overnight Fin. Rate (SOFR) Index + 0.880% 6.1054% 1/14/27 (b)(c) | 670,000 | 663,901 | |
| U.S. Secured Overnight Fin. Rate (SOFR) Index + 1.300% 6.5441% 7/13/26 (b)(c) | 500,000 | 503,072 | |
| U.S. Secured Overnight Fin. Rate (SOFR) Index + 1.430% 6.653% 1/13/26 (b)(c) | 700,000 | 706,088 | |
| Sumitomo Mitsui Trust Bank Ltd.: | |||
| U.S. Secured Overnight Fin. Rate (SOFR) Index + 0.440% 5.6282% 9/16/24 (b)(c)(d) | 800,000 | 797,816 | |
| U.S. Secured Overnight Fin. Rate (SOFR) Index + 1.120% 6.298% 3/9/26 (b)(c)(d) | 1,000,000 | 1,001,630 | |
| Svenska Handelsbanken AB: | |||
| U.S. Secured Overnight Fin. Rate (SOFR) Averages Index + 0.910% 6.0985% 6/10/25 (b)(c)(d) | 900,000 | 902,727 | |
| U.S. Secured Overnight Fin. Rate (SOFR) Averages Index + 1.250% 6.4436% 6/15/26 (b)(c)(d) | 500,000 | 504,491 | |
| Swedbank AB: | |||
| U.S. Secured Overnight Fin. Rate (SOFR) Averages Index + 0.910% 6.1286% 4/4/25 (b)(c)(d) | 400,000 | 400,302 | |
| U.S. Secured Overnight Fin. Rate (SOFR) Averages Index + 1.380% 6.5736% 6/15/26 (b)(c)(d) | 500,000 | 504,213 | |
| The Toronto-Dominion Bank: | |||
| U.S. Secured Overnight Fin. Rate (SOFR) Index + 0.350% 5.5347% 3/4/24 (b)(c) | 1,500,000 | 1,499,659 | |
| U.S. Secured Overnight Fin. Rate (SOFR) Index + 0.350% 5.5385% 9/10/24 (b)(c) | 2,150,000 | 2,144,037 | |
| U.S. Secured Overnight Fin. Rate (SOFR) Index + 0.410% 5.6394% 1/10/25 (b)(c) | 1,450,000 | 1,443,217 | |
| U.S. Secured Overnight Fin. Rate (SOFR) Index + 0.450% 5.6615% 9/28/23 (b)(c) | 400,000 | 400,047 | |
| U.S. Secured Overnight Fin. Rate (SOFR) Index + 0.590% 5.7785% 9/10/26 (b)(c) | 800,000 | 792,040 | |
| U.S. Secured Overnight Fin. Rate (SOFR) Index + 0.910% 6.0967% 3/8/24 (b)(c) | 200,000 | 200,528 | |
| Truist Bank U.S. Secured Overnight Fin. Rate (SOFR) Index + 0.200% 5.4484% 1/17/24 (b)(c) | 1,500,000 | 1,492,809 | |
| Truist Financial Corp. U.S. Secured Overnight Fin. Rate (SOFR) Index + 0.400% 5.5876% 6/9/25 (b)(c) | 1,760,000 | 1,715,982 | |
| Wells Fargo & Co. U.S. Secured Overnight Fin. Rate (SOFR) Index + 1.320% 6.5997% 4/25/26 (b)(c) | 1,240,000 | 1,248,953 | |
| Wells Fargo Bank NA U.S. Secured Overnight Fin. Rate (SOFR) Index + 0.800% 6.1087% 8/1/25 (b)(c) | 1,200,000 | 1,201,953 | |
| Westpac Banking Corp.: | |||
| CME Term SOFR 3 Month Index + 1.030% 6.4355% 2/26/24 (b)(c) | 1,072,000 | 1,074,677 | |
| U.S. Secured Overnight Fin. Rate (SOFR) Index + 0.300% 5.6052% 11/18/24 (b)(c) | 200,000 | 199,601 | |
| U.S. Secured Overnight Fin. Rate (SOFR) Index + 0.520% 5.6997% 6/3/26 (b)(c) | 860,000 | 855,069 | |
| U.S. Secured Overnight Fin. Rate (SOFR) Index + 1.000% 6.3016% 8/26/25 (b)(c) | 500,000 | 503,879 | |
| 101,747,716 | |||
| Capital Markets - 12.8% | |||
| Bank of New York Mellon Corp.: | |||
| U.S. Secured Overnight Fin. Rate (SOFR) Index + 0.200% 5.4797% 10/25/24 (b)(c) | 150,000 | 149,234 | |
| U.S. Secured Overnight Fin. Rate (SOFR) Index + 0.260% 5.5556% 4/26/24 (b)(c) | 400,000 | 399,402 | |
| U.S. Secured Overnight Fin. Rate (SOFR) Index + 0.620% 5.8997% 4/25/25 (b)(c) | 1,100,000 | 1,099,420 | |
| Charles Schwab Corp.: | |||
| U.S. Secured Overnight Fin. Rate (SOFR) Averages Index + 0.500% 5.6959% 3/18/24 (b)(c) | 1,003,000 | 1,001,895 | |
| U.S. Secured Overnight Fin. Rate (SOFR) Averages Index + 0.520% 5.8275% 5/13/26 (b)(c) | 780,000 | 766,883 | |
| U.S. Secured Overnight Fin. Rate (SOFR) Averages Index + 1.050% 1.05% 3/3/27 (b)(c) | 1,000,000 | 987,607 | |
| Credit Suisse AG U.S. Secured Overnight Fin. Rate (SOFR) Averages Index + 0.390% 5.7021% 2/2/24 (b)(c) | 1,400,000 | 1,395,386 | |
| Deutsche Bank AG New York Branch: | |||
| U.S. Secured Overnight Fin. Rate (SOFR) Index + 0.500% 5.8098% 11/8/23 (b)(c) | 1,500,000 | 1,499,755 | |
| U.S. Secured Overnight Fin. Rate (SOFR) Index + 1.210% 6.525% 11/16/27 (b)(c) | 500,000 | 473,550 | |
| Goldman Sachs Group, Inc.: | |||
| CME Term SOFR 3 Month Index + 1.430% 6.7962% 5/15/26 (b)(c) | 1,100,000 | 1,103,206 | |
| CME Term SOFR 3 Month Index + 1.860% 7.2655% 11/29/23 (b)(c) | 2,556,000 | 2,564,617 | |
| U.S. Secured Overnight Fin. Rate (SOFR) Index + 0.490% 5.7607% 10/21/24 (b)(c) | 200,000 | 199,719 | |
| U.S. Secured Overnight Fin. Rate (SOFR) Index + 0.500% 5.6885% 9/10/24 (b)(c) | 1,330,000 | 1,328,451 | |
| U.S. Secured Overnight Fin. Rate (SOFR) Index + 0.700% 5.9752% 1/24/25 (b)(c) | 1,100,000 | 1,098,389 | |
| U.S. Secured Overnight Fin. Rate (SOFR) Index + 0.810% 5.9976% 3/9/27 (b)(c) | 50,000 | 49,353 | |
| U.S. Secured Overnight Fin. Rate (SOFR) Index + 0.820% 6.0085% 9/10/27 (b)(c) | 400,000 | 393,897 | |
| U.S. Secured Overnight Fin. Rate (SOFR) Index + 0.920% 6.1907% 10/21/27 (b)(c) | 1,000,000 | 982,767 | |
| U.S. Secured Overnight Fin. Rate (SOFR) Index + 1.120% 6.4229% 2/24/28 (b)(c) | 300,000 | 299,100 | |
| U.S. Secured Overnight Fin. Rate (SOFR) Index + 1.390% 6.5836% 3/15/24 (b)(c) | 600,000 | 602,431 | |
| U.S. Secured Overnight Fin. Rate (SOFR) Index + 1.850% 7.0436% 3/15/28 (b)(c) | 1,000,000 | 1,015,397 | |
| 6.4003% 8/10/26 (b) | 500,000 | 499,985 | |
| Macquarie Bank Ltd.: | |||
| U.S. Secured Overnight Fin. Rate (SOFR) Index + 1.240% 6.4336% 6/15/26 (b)(c)(d) | 500,000 | 502,723 | |
| U.S. Secured Overnight Fin. Rate (SOFR) Index + 1.310% 6.5069% 3/21/25 (b)(c)(d) | 1,400,000 | 1,411,615 | |
| Macquarie Group Ltd.: | |||
| U.S. Secured Overnight Fin. Rate (SOFR) Index + 0.710% 5.9551% 10/14/25 (b)(c)(d) | 1,160,000 | 1,152,409 | |
| U.S. Secured Overnight Fin. Rate (SOFR) Index + 0.920% 6.1236% 9/23/27 (b)(c)(d) | 200,000 | 196,761 | |
| Morgan Stanley: | |||
| U.S. Secured Overnight Fin. Rate (SOFR) Index + 0.620% 5.9247% 1/24/25 (b)(c) | 2,190,000 | 2,186,172 | |
| U.S. Secured Overnight Fin. Rate (SOFR) Index + 0.950% 6.2561% 2/18/26 (b)(c) | 1,000,000 | 1,001,592 | |
| U.S. Secured Overnight Fin. Rate (SOFR) Index + 1.160% 6.4155% 4/17/25 (b)(c) | 800,000 | 802,066 | |
| State Street Corp. U.S. Secured Overnight Fin. Rate (SOFR) Averages Index + 0.840% 6.1563% 8/3/26 (b)(c) | 500,000 | 499,505 | |
| UBS AG London Branch: | |||
| U.S. Secured Overnight Fin. Rate (SOFR) Index + 0.360% 5.6687% 2/9/24 (b)(c)(d) | 1,651,000 | 1,650,308 | |
| U.S. Secured Overnight Fin. Rate (SOFR) Index + 0.450% 5.7587% 8/9/24 (b)(c)(d) | 1,870,000 | 1,866,510 | |
| U.S. Secured Overnight Fin. Rate (SOFR) Index + 0.470% 5.7122% 1/13/25 (b)(c)(d) | 200,000 | 199,401 | |
| UBS Group AG U.S. Secured Overnight Fin. Rate (SOFR) Index + 1.580% 6.8875% 5/12/26 (b)(c)(d) | 700,000 | 705,668 | |
| 30,085,174 | |||
| Consumer Finance - 5.7% | |||
| AerCap Ireland Capital Ltd./AerCap Global Aviation Trust U.S. Secured Overnight Fin. Rate (SOFR) Index + 0.680% 5.8932% 9/29/23 (b)(c) | 300,000 | 299,914 | |
| American Express Co.: | |||
| U.S. Secured Overnight Fin. Rate (SOFR) Averages Index + 0.650% 5.9606% 11/4/26 (b)(c) | 950,000 | 945,070 | |
| U.S. Secured Overnight Fin. Rate (SOFR) Averages Index + 0.720% 6.0313% 5/3/24 (b)(c) | 1,100,000 | 1,104,425 | |
| U.S. Secured Overnight Fin. Rate (SOFR) Averages Index + 0.970% 6.2775% 7/28/27 (b)(c) | 400,000 | 398,400 | |
| U.S. Secured Overnight Fin. Rate (SOFR) Index + 0.760% 6.0675% 2/13/26 (b)(c) | 700,000 | 699,326 | |
| Capital One Financial Corp.: | |||
| U.S. Secured Overnight Fin. Rate (SOFR) Index + 0.690% 5.8866% 12/6/24 (b)(c) | 1,700,000 | 1,681,691 | |
| U.S. Secured Overnight Fin. Rate (SOFR) Index + 1.350% 6.6597% 5/9/25 (b)(c) | 500,000 | 498,830 | |
| John Deere Capital Corp.: | |||
| U.S. Secured Overnight Fin. Rate (SOFR) Averages Index + 0.790% 5.9676% 6/8/26 (b)(c) | 700,000 | 703,540 | |
| U.S. Secured Overnight Fin. Rate (SOFR) Index + 0.200% 5.4164% 10/11/24 (b)(c) | 1,810,000 | 1,807,296 | |
| U.S. Secured Overnight Fin. Rate (SOFR) Index + 0.570% 5.7335% 3/3/26 (b)(c) | 500,000 | 500,581 | |
| Toyota Motor Credit Corp.: | |||
| U.S. Secured Overnight Fin. Rate (SOFR) Averages Index + 0.260% 5.4559% 6/18/24 (b)(c) | 1,300,000 | 1,299,106 | |
| U.S. Secured Overnight Fin. Rate (SOFR) Averages Index + 0.330% 5.5617% 1/11/24 (b)(c) | 1,000,000 | 1,000,112 | |
| U.S. Secured Overnight Fin. Rate (SOFR) Averages Index + 0.890% 6.1951% 5/18/26 (b)(c) | 500,000 | 502,414 | |
| U.S. Secured Overnight Fin. Rate (SOFR) Index + 0.290% 5.4795% 9/13/24 (b)(c) | 1,200,000 | 1,198,087 | |
| U.S. Secured Overnight Fin. Rate (SOFR) Index + 0.320% 5.5622% 1/13/25 (b)(c) | 590,000 | 588,623 | |
| U.S. Secured Overnight Fin. Rate (SOFR) Index + 0.620% 5.8222% 3/22/24 (b)(c) | 200,000 | 200,224 | |
| 13,427,639 | |||
| Financial Services - 1.4% | |||
| AIG Global Funding U.S. Secured Overnight Fin. Rate (SOFR) Index + 0.380% 5.5736% 12/15/23 (b)(c)(d) | 344,000 | 343,877 | |
| Athene Global Funding: | |||
| U.S. Secured Overnight Fin. Rate (SOFR) Averages Index + 0.560% 5.8651% 8/19/24 (b)(c)(d) | 1,000,000 | 986,802 | |
| U.S. Secured Overnight Fin. Rate (SOFR) Averages Index + 0.700% 6.0029% 5/24/24 (b)(c)(d) | 1,000,000 | 992,706 | |
| GA Global Funding Trust U.S. Secured Overnight Fin. Rate (SOFR) Index + 1.360% 6.5917% 4/11/25 (b)(c)(d) | 500,000 | 493,630 | |
| National Rural Utilities Cooperative Finance Corp. U.S. Secured Overnight Fin. Rate (SOFR) Index + 0.330% 5.5815% 10/18/24 (b)(c) | 400,000 | 398,689 | |
| 3,215,704 | |||
| Insurance - 6.8% | |||
| Brighthouse Financial Global Funding U.S. Secured Overnight Fin. Rate (SOFR) Index + 0.760% 5.9994% 4/12/24 (b)(c)(d) | 300,000 | 297,936 | |
| MassMutual Global Funding II: | |||
| U.S. Secured Overnight Fin. Rate (SOFR) Index + 0.360% 5.5994% 4/12/24 (b)(c)(d) | 1,800,000 | 1,799,582 | |
| U.S. Secured Overnight Fin. Rate (SOFR) Index + 0.870% 6.0669% 3/21/25 (b)(c)(d) | 1,200,000 | 1,201,979 | |
| U.S. Secured Overnight Fin. Rate (SOFR) Index + 0.980% 6.2428% 7/10/26 (b)(c)(d) | 200,000 | 200,166 | |
| Metropolitan Life Global Funding I: | |||
| U.S. Secured Overnight Fin. Rate (SOFR) Averages Index + 0.910% 6.1069% 3/21/25 (b)(c)(d) | 400,000 | 401,842 | |
| U.S. Secured Overnight Fin. Rate (SOFR) Index + 0.320% 5.5471% 1/7/24 (b)(c)(d) | 1,964,000 | 1,964,045 | |
| New York Life Global Funding: | |||
| U.S. Secured Overnight Fin. Rate (SOFR) Averages Index + 0.330% 5.5751% 1/14/25 (b)(c)(d) | 1,970,000 | 1,967,152 | |
| U.S. Secured Overnight Fin. Rate (SOFR) Averages Index + 0.360% 5.6307% 10/21/23 (b)(c)(d) | 870,000 | 870,270 | |
| U.S. Secured Overnight Fin. Rate (SOFR) Averages Index + 0.610% 5.8807% 4/21/25 (b)(c)(d) | 600,000 | 600,308 | |
| U.S. Secured Overnight Fin. Rate (SOFR) Averages Index + 0.930% 6.145% 4/2/26 (b)(c)(d) | 600,000 | 601,089 | |
| U.S. Secured Overnight Fin. Rate (SOFR) Index + 0.310% 5.6056% 4/26/24 (b)(c)(d) | 880,000 | 880,256 | |
| U.S. Secured Overnight Fin. Rate (SOFR) Index + 0.480% 5.6676% 6/9/26 (b)(c)(d) | 200,000 | 197,595 | |
| U.S. Secured Overnight Fin. Rate (SOFR) Index + 0.650% 5.9621% 5/2/25 (b)(c)(d) | 500,000 | 500,630 | |
| Northwestern Mutual Global Funding U.S. Secured Overnight Fin. Rate (SOFR) Index + 0.330% 5.5329% 3/25/24 (b)(c)(d) | 424,000 | 423,951 | |
| Pacific Life Global Funding II: | |||
| U.S. Secured Overnight Fin. Rate (SOFR) Averages Index + 0.860% 6.0547% 6/16/25 (b)(c)(d) | 1,000,000 | 1,002,220 | |
| U.S. Secured Overnight Fin. Rate (SOFR) Index + 0.620% 5.7997% 6/4/26 (b)(c)(d) | 1,360,000 | 1,341,731 | |
| Principal Life Global Funding II U.S. Secured Overnight Fin. Rate (SOFR) Index + 0.450% 5.6894% 4/12/24 (b)(c)(d) | 650,000 | 650,007 | |
| Protective Life Global Funding: | |||
| U.S. Secured Overnight Fin. Rate (SOFR) Index + 0.980% 6.1915% 3/28/25 (b)(c)(d) | 200,000 | 200,752 | |
| U.S. Secured Overnight Fin. Rate (SOFR) Index + 1.050% 6.2385% 12/11/24 (b)(c)(d) | 800,000 | 803,164 | |
| 15,904,675 | |||
TOTAL FINANCIALS | 164,380,908 | ||
| HEALTH CARE - 1.3% | |||
| Health Care Equipment & Supplies - 0.1% | |||
| Baxter International, Inc. U.S. Secured Overnight Fin. Rate (SOFR) Averages Index + 0.260% 5.4387% 12/1/23 (b)(c) | 300,000 | 299,595 | |
| Pharmaceuticals - 1.2% | |||
| Bayer U.S. Finance II LLC 3 month U.S. LIBOR + 1.010% 6.562% 12/15/23 (b)(c)(d) | 1,072,000 | 1,072,631 | |
| Pfizer, Inc. 3 month U.S. LIBOR + 0.330% 5.882% 9/15/23 (b)(c) | 180,000 | 180,009 | |
| Roche Holdings, Inc. U.S. Secured Overnight Fin. Rate (SOFR) Index + 0.560% 5.7485% 3/10/25 (b)(c)(d) | 1,400,000 | 1,407,780 | |
| 2,660,420 | |||
TOTAL HEALTH CARE | 2,960,015 | ||
| INDUSTRIALS - 2.4% | |||
| Industrial Conglomerates - 0.6% | |||
| 3M Co. CME Term SOFR 3 Month Index + 0.560% 5.9308% 2/14/24 (b)(c) | 200,000 | 200,006 | |
| General Electric Co. CME Term SOFR 3 Month Index + 0.640% 6.0115% 5/5/26 (b)(c) | 1,200,000 | 1,199,353 | |
| 1,399,359 | |||
| Machinery - 1.8% | |||
| Caterpillar Financial Services Corp.: | |||
| U.S. Secured Overnight Fin. Rate (SOFR) Index + 0.270% 5.4595% 9/13/24 (b)(c) | 1,890,000 | 1,888,471 | |
| U.S. Secured Overnight Fin. Rate (SOFR) Index + 0.520% 5.7169% 6/13/25 (b)(c) | 500,000 | 500,945 | |
| 5.7629% 8/11/25 (b) | 300,000 | 300,354 | |
| Daimler Trucks Finance North America LLC: | |||
| U.S. Secured Overnight Fin. Rate (SOFR) Index + 0.600% 5.8047% 12/14/23 (b)(c)(d) | 600,000 | 600,207 | |
| U.S. Secured Overnight Fin. Rate (SOFR) Index + 0.750% 5.9536% 12/13/24 (b)(c)(d) | 1,000,000 | 998,426 | |
| 4,288,403 | |||
TOTAL INDUSTRIALS | 5,687,762 | ||
| INFORMATION TECHNOLOGY - 0.9% | |||
| Communications Equipment - 0.6% | |||
| Bank of America NA U.S. Secured Overnight Fin. Rate (SOFR) Index + 1.020% 6.3252% 8/18/26 (b)(c) | 1,500,000 | 1,504,590 | |
| Semiconductors & Semiconductor Equipment - 0.3% | |||
| Analog Devices, Inc. U.S. Secured Overnight Fin. Rate (SOFR) Index + 0.250% 5.4668% 10/1/24 (b)(c) | 600,000 | 599,677 | |
TOTAL INFORMATION TECHNOLOGY | 2,104,267 | ||
| MATERIALS - 0.1% | |||
| Chemicals - 0.1% | |||
| DuPont de Nemours, Inc. CME Term SOFR 3 Month Index + 1.370% 6.7362% 11/15/23 (b)(c) | 252,000 | 252,398 | |
| UTILITIES - 3.1% | |||
| Electric Utilities - 2.2% | |||
| Florida Power & Light Co. U.S. Secured Overnight Fin. Rate (SOFR) Averages Index + 0.380% 5.6194% 1/12/24 (b)(c) | 600,000 | 600,007 | |
| NextEra Energy Capital Holdings, Inc. U.S. Secured Overnight Fin. Rate (SOFR) Averages Index + 0.400% 5.7113% 11/3/23 (b)(c) | 4,050,000 | 4,051,380 | |
| Southern California Edison Co. U.S. Secured Overnight Fin. Rate (SOFR) Averages Index + 0.830% 6.0468% 4/1/24 (b)(c) | 400,000 | 400,019 | |
| 5,051,406 | |||
| Multi-Utilities - 0.9% | |||
| CenterPoint Energy, Inc. U.S. Secured Overnight Fin. Rate (SOFR) Averages Index + 0.650% 5.9575% 5/13/24 (b)(c) | 1,000,000 | 999,747 | |
| Dominion Energy, Inc. 3 month U.S. LIBOR + 0.530% 6.082% 9/15/23 (b)(c) | 1,230,000 | 1,229,999 | |
| 2,229,746 | |||
TOTAL UTILITIES | 7,281,152 | ||
| TOTAL NONCONVERTIBLE BONDS (Cost $202,026,908) | 202,169,353 | ||
| U.S. Treasury Obligations - 11.8% | |||
Principal Amount (a) | Value ($) | ||
| U.S. Treasury Bonds 5.375% 2/15/31 | 1,100,000 | 1,184,949 | |
| U.S. Treasury Notes: | |||
| 0.875% 11/15/30 | 1,730,000 | 1,384,811 | |
| 1.125% 2/15/31 | 3,758,000 | 3,053,228 | |
| 1.25% 8/15/31 | 940,000 | 759,050 | |
| 1.375% 11/15/31 | 4,790,000 | 3,881,958 | |
| 1.625% 5/15/31 | 3,260,000 | 2,730,632 | |
| 1.875% 2/15/32 | 1,900,000 | 1,596,600 | |
| 2.75% 8/15/32 | 2,950,000 | 2,647,971 | |
| 2.875% 5/15/32 | 3,100,000 | 2,817,246 | |
| 3.375% 5/15/33 | 3,600,000 | 3,391,313 | |
| 3.5% 2/15/33 | 2,700,000 | 2,571,328 | |
| 3.875% 8/15/33 | 400,000 | 392,875 | |
| 4.125% 11/15/32 | 1,300,000 | 1,299,391 | |
| TOTAL U.S. TREASURY OBLIGATIONS (Cost $30,066,514) | 27,711,352 | ||
| Money Market Funds - 5.1% | |||
| Shares | Value ($) | ||
Fidelity Cash Central Fund 5.43% (e) (Cost $12,007,431) | 12,005,030 | 12,007,431 | |
| TOTAL INVESTMENT IN SECURITIES - 103.1% (Cost $244,100,853) | 241,888,136 |
NET OTHER ASSETS (LIABILITIES) - (3.1)% | (7,173,966) |
| NET ASSETS - 100.0% | 234,714,170 |
| (a) | Amount is stated in United States dollars unless otherwise noted. |
| (b) | Coupon rates for floating and adjustable rate securities reflect the rates in effect at period end. |
| (c) | Coupon is indexed to a floating interest rate which may be multiplied by a specified factor and/or subject to caps or floors. |
| (d) | Security exempt from registration under Rule 144A of the Securities Act of 1933. These securities may be resold in transactions exempt from registration, normally to qualified institutional buyers. At the end of the period, the value of these securities amounted to $59,541,652 or 25.4% of net assets. |
| (e) | Affiliated fund that is generally available only to investment companies and other accounts managed by Fidelity Investments. The rate quoted is the annualized seven-day yield of the fund at period end. A complete unaudited listing of the fund's holdings as of its most recent quarter end is available upon request. In addition, each Fidelity Central Fund's financial statements, which are not covered by the Fund's Report of Independent Registered Public Accounting Firm, are available on the SEC's website or upon request. |
| Affiliate | Value, beginning of period ($) | Purchases ($) | Sales Proceeds ($) | Dividend Income ($) | Realized Gain (loss) ($) | Change in Unrealized appreciation (depreciation) ($) | Value, end of period ($) | % ownership, end of period |
| Fidelity Cash Central Fund 5.43% | 309,001 | 100,708,688 | 89,010,258 | 264,894 | - | - | 12,007,431 | 0.0% |
| Total | 309,001 | 100,708,688 | 89,010,258 | 264,894 | - | - | 12,007,431 | |
| Valuation Inputs at Reporting Date: | ||||
| Description | Total ($) | Level 1 ($) | Level 2 ($) | Level 3 ($) |
Investments in Securities: | ||||
| Corporate Bonds | 202,169,353 | - | 202,169,353 | - |
| U.S. Government and Government Agency Obligations | 27,711,352 | - | 27,711,352 | - |
| Money Market Funds | 12,007,431 | 12,007,431 | - | - |
| Total Investments in Securities: | 241,888,136 | 12,007,431 | 229,880,705 | - |
| Statement of Assets and Liabilities | ||||
| August 31, 2023 | ||||
| Assets | ||||
| Investment in securities, at value - See accompanying schedule: | ||||
Unaffiliated issuers (cost $232,093,422) | $ | 229,880,705 | ||
Fidelity Central Funds (cost $12,007,431) | 12,007,431 | |||
| Total Investment in Securities (cost $244,100,853) | $ | 241,888,136 | ||
| Cash | 133,294 | |||
| Receivable for investments sold | 1,901,663 | |||
| Interest receivable | 1,742,375 | |||
| Distributions receivable from Fidelity Central Funds | 37,592 | |||
| Receivable from investment adviser for expense reductions | 679 | |||
Total assets | 245,703,739 | |||
| Liabilities | ||||
| Payable for investments purchased | $ | 9,834,182 | ||
| Distributions payable | 1,119,825 | |||
| Accrued management fee | 28,606 | |||
| Other payables and accrued expenses | 6,956 | |||
| Total Liabilities | 10,989,569 | |||
| Net Assets | $ | 234,714,170 | ||
| Net Assets consist of: | ||||
| Paid in capital | $ | 239,941,845 | ||
| Total accumulated earnings (loss) | (5,227,675) | |||
| Net Assets | $ | 234,714,170 | ||
Net Asset Value, offering price and redemption price per share ($234,714,170 ÷ 4,725,000 shares) | $ | 49.67 | ||
| Statement of Operations | ||||
Year ended August 31, 2023 | ||||
| Investment Income | ||||
| Interest | $ | 9,929,392 | ||
| Income from Fidelity Central Funds | 264,894 | |||
| Total Income | 10,194,286 | |||
| Expenses | ||||
| Management fee | $ | 313,479 | ||
| Independent trustees' fees and expenses | 701 | |||
| Miscellaneous | 6,955 | |||
| Total expenses before reductions | 321,135 | |||
| Expense reductions | (3,441) | |||
| Total expenses after reductions | 317,694 | |||
| Net Investment income (loss) | 9,876,592 | |||
| Realized and Unrealized Gain (Loss) | ||||
| Net realized gain (loss) on: | ||||
| Investment Securities: | ||||
| Unaffiliated issuers | (1,462,909) | |||
| Total net realized gain (loss) | (1,462,909) | |||
| Change in net unrealized appreciation (depreciation) on: | ||||
| Investment Securities: | ||||
| Unaffiliated issuers | 1,524,109 | |||
| Assets and liabilities in foreign currencies | (1) | |||
| Total change in net unrealized appreciation (depreciation) | 1,524,108 | |||
| Net gain (loss) | 61,199 | |||
| Net increase (decrease) in net assets resulting from operations | $ | 9,937,791 | ||
| Statement of Changes in Net Assets | ||||
Year ended August 31, 2023 | Year ended August 31, 2022 | |||
| Increase (Decrease) in Net Assets | ||||
| Operations | ||||
| Net investment income (loss) | $ | 9,876,592 | $ | 2,238,959 |
| Net realized gain (loss) | (1,462,909) | (1,292,347) | ||
| Change in net unrealized appreciation (depreciation) | 1,524,108 | (4,482,075) | ||
| Net increase (decrease) in net assets resulting from operations | 9,937,791 | (3,535,463) | ||
| Distributions to shareholders | (9,884,875) | (2,181,925) | ||
| Share transactions | ||||
| Proceeds from sales of shares | 34,828,301 | 23,710,915 | ||
| Cost of shares redeemed | (7,418,736) | (46,184,173) | ||
Net increase (decrease) in net assets resulting from share transactions | 27,409,565 | (22,473,258) | ||
| Total increase (decrease) in net assets | 27,462,481 | (28,190,646) | ||
| Net Assets | ||||
| Beginning of period | 207,251,689 | 235,442,335 | ||
| End of period | $ | 234,714,170 | $ | 207,251,689 |
| Other Information | ||||
| Shares | ||||
| Sold | 700,000 | 475,000 | ||
| Redeemed | (150,000) | (925,000) | ||
| Net increase (decrease) | 550,000 | (450,000) | ||
| Fidelity® Low Duration Bond Factor ETF |
| Years ended August 31, | 2023 | 2022 | 2021 | 2020 | 2019 | |||||
Selected Per-Share Data | ||||||||||
| Net asset value, beginning of period | $ | 49.64 | $ | 50.91 | $ | 50.99 | $ | 50.71 | $ | 50.10 |
| Income from Investment Operations | ||||||||||
Net investment income (loss) A,B | 2.344 | .495 | .275 | .913 | 1.479 | |||||
| Net realized and unrealized gain (loss) | .015 | (1.278) | (.085) | .325 | .469 | |||||
| Total from investment operations | 2.359 | (.783) | .190 | 1.238 | 1.948 | |||||
| Distributions from net investment income | (2.329) | (.487) | (.270) | (.958) | (1.338) | |||||
| Total distributions | (2.329) | (.487) | (.270) | (.958) | (1.338) | |||||
| Net asset value, end of period | $ | 49.67 | $ | 49.64 | $ | 50.91 | $ | 50.99 | $ | 50.71 |
Total Return C,D | 4.87% | (1.53)% | .36% | 2.48% | 3.95% | |||||
Ratios to Average Net Assets B,E,F | ||||||||||
| Expenses before reductions | .15% | .15% | .15% | .15% | .15% | |||||
| Expenses net of fee waivers, if any | .15% | .15% | .15% | .15% | .15% | |||||
| Expenses net of all reductions | .15% | .15% | .15% | .15% | .15% | |||||
| Net investment income (loss) | 4.72% | .99% | .54% | 1.81% | 2.90% | |||||
| Supplemental Data | ||||||||||
| Net assets, end of period (000 omitted) | $ | 234,714 | $ | 207,252 | $ | 235,442 | $ | 191,216 | $ | 109,024 |
Portfolio turnover rate G | 47% | 45% | 40% | 43% H | 14% |
| $10,000 Over Life of Fund |
Let's say hypothetically that $10,000 was invested in Fidelity® Tactical Bond ETF - NAV, on January 24, 2023, when the fund started. The chart shows how the value of your investment would have changed, and also shows how the Bloomberg U.S. Aggregate Bond Index performed over the same period. |
 |
Quality Diversification (% of Fund's net assets) |
 |
| We have used ratings from Moody's Investors Service, Inc. Where Moody's® ratings are not available, we have used S&P® ratings. All ratings are as of the date indicated and do not reflect subsequent changes. |
Asset Allocation (% of Fund's net assets) |
 |
Futures - 1.5% |
Forward foreign currency contracts - (8.6)% |
Geographic Diversification (% of Fund's net assets) |
 |
* Includes Short-Term investments and Net Other Assets (Liabilities). Percentages are adjusted for the effect of derivatives, if applicable. |
| Corporate Bonds - 40.6% | |||
Principal Amount (a) | Value ($) | ||
| Convertible Bonds - 0.2% | |||
| COMMUNICATION SERVICES - 0.2% | |||
| Media - 0.2% | |||
| DISH Network Corp.: | |||
| 2.375% 3/15/24 | 5,000 | 4,725 | |
| 3.375% 8/15/26 | 25,000 | 15,125 | |
| 19,850 | |||
| REAL ESTATE - 0.0% | |||
| Real Estate Management & Development - 0.0% | |||
| Redfin Corp. 0.5% 4/1/27 | 7,000 | 4,445 | |
| TOTAL CONVERTIBLE BONDS | 24,295 | ||
| Nonconvertible Bonds - 40.4% | |||
| COMMUNICATION SERVICES - 4.3% | |||
| Diversified Telecommunication Services - 0.7% | |||
| Altice France SA: | |||
| 5.125% 7/15/29(b) | 20,000 | 14,138 | |
| 5.5% 1/15/28(b) | 15,000 | 11,241 | |
| C&W Senior Financing Designated Activity Co. 6.875% 9/15/27 (b) | 13,000 | 11,960 | |
| Cogent Communications Group, Inc. 7% 6/15/27 (b) | 8,000 | 7,766 | |
| Frontier Communications Holdings LLC 6% 1/15/30 (b) | 3,000 | 2,216 | |
| Level 3 Financing, Inc.: | |||
| 4.625% 9/15/27(b) | 21,000 | 15,793 | |
| 10.5% 5/15/30(b) | 1,000 | 1,016 | |
| Northwest Fiber LLC/Northwest Fiber Finance Sub, Inc. 10.75% 6/1/28 (b) | 9,000 | 8,341 | |
| Telecom Italia SpA 5.303% 5/30/24 (b) | 16,000 | 15,792 | |
| Windstream Escrow LLC 7.75% 8/15/28 (b) | 5,000 | 4,054 | |
| Zayo Group Holdings, Inc. 4% 3/1/27 (b) | 14,000 | 10,492 | |
| 102,809 | |||
| Entertainment - 0.0% | |||
| Roblox Corp. 3.875% 5/1/30 (b) | 3,000 | 2,475 | |
| Media - 2.4% | |||
| Altice Financing SA 5.75% 8/15/29 (b) | 10,000 | 7,922 | |
| Altice France Holding SA 6% 2/15/28 (b) | 12,000 | 5,250 | |
| Cable One, Inc. 4% 11/15/30 (b) | 6,000 | 4,680 | |
| CCO Holdings LLC/CCO Holdings Capital Corp. 4.5% 8/15/30 (b) | 12,000 | 10,094 | |
| Charter Communications Operating LLC/Charter Communications Operating Capital Corp. 3.7% 4/1/51 | 220,000 | 136,714 | |
| Clear Channel Outdoor Holdings, Inc.: | |||
| 5.125% 8/15/27(b) | 16,000 | 14,330 | |
| 7.5% 6/1/29(b) | 3,000 | 2,236 | |
| CSC Holdings LLC 5.5% 4/15/27 (b) | 16,000 | 13,814 | |
| DISH DBS Corp. 5.75% 12/1/28 (b) | 6,000 | 4,658 | |
| DISH Network Corp. 11.75% 11/15/27 (b) | 10,000 | 10,146 | |
| Radiate Holdco LLC/Radiate Financial Service Ltd.: | |||
| 4.5% 9/15/26(b) | 16,000 | 12,470 | |
| 6.5% 9/15/28(b) | 3,000 | 1,620 | |
| Sirius XM Radio, Inc.: | |||
| 4.125% 7/1/30(b) | 90,000 | 73,371 | |
| 5% 8/1/27(b) | 10,000 | 9,246 | |
| TEGNA, Inc. 4.75% 3/15/26 (b) | 9,000 | 8,575 | |
| Univision Communications, Inc.: | |||
| 4.5% 5/1/29(b) | 12,000 | 10,329 | |
| 8% 8/15/28(b) | 5,000 | 4,997 | |
| Virgin Media Secured Finance PLC 4.5% 8/15/30 (b) | 17,000 | 14,354 | |
| 344,806 | |||
| Wireless Telecommunication Services - 1.2% | |||
| Millicom International Cellular SA 4.5% 4/27/31 (b) | 210,000 | 164,921 | |
TOTAL COMMUNICATION SERVICES | 615,011 | ||
| CONSUMER DISCRETIONARY - 4.5% | |||
| Automobile Components - 0.8% | |||
| Clarios Global LP / Clarios U.S. Finance Co. 6.75% 5/15/28 (b) | 5,000 | 4,987 | |
| Hertz Corp. 5% 12/1/29 (b) | 1,000 | 822 | |
| Macquarie AirFinance Holdings 8.375% 5/1/28 (b) | 5,000 | 5,105 | |
| PECF USS Intermediate Holding III Corp. 8% 11/15/29 (b) | 5,000 | 3,189 | |
| ZF Finance GmbH 2% 5/6/27 (Reg. S) | EUR | 100,000 | 96,101 |
| ZF North America Capital, Inc. 7.125% 4/14/30 (b) | 5,000 | 5,065 | |
| 115,269 | |||
| Automobiles - 0.1% | |||
| Ford Motor Co. 5.291% 12/8/46 | 10,000 | 7,853 | |
| Rivian Holdco & Rivian LLC & Rivian Automotive LLC 6 month U.S. LIBOR + 5.620% 10.9311% 10/15/26 (b)(c)(d) | 2,000 | 1,993 | |
| 9,846 | |||
| Broadline Retail - 0.1% | |||
| Cmg Media Corp. 8.875% 12/15/27 (b) | 8,000 | 6,284 | |
| Match Group Holdings II LLC 3.625% 10/1/31 (b) | 10,000 | 8,152 | |
| 14,436 | |||
| Distributors - 0.0% | |||
| Windsor Holdings III, LLC 8.5% 6/15/30 (b) | 5,000 | 5,022 | |
| Diversified Consumer Services - 0.3% | |||
| GEMS MENASA Cayman Ltd. 7.125% 7/31/26 (b) | 31,000 | 30,046 | |
| Service Corp. International 5.125% 6/1/29 | 16,000 | 15,060 | |
| WASH Multifamily Acquisition, Inc. 5.75% 4/15/26 (b) | 5,000 | 4,637 | |
| 49,743 | |||
| Hotels, Restaurants & Leisure - 1.6% | |||
| 1011778 BC Unlimited Liability Co./New Red Finance, Inc. 4% 10/15/30 (b) | 18,000 | 15,249 | |
| Aramark Services, Inc. 5% 2/1/28 (b) | 12,000 | 11,195 | |
| Boyd Gaming Corp. 4.75% 6/15/31 (b) | 12,000 | 10,569 | |
| Caesars Entertainment, Inc. 8.125% 7/1/27 (b) | 16,000 | 16,245 | |
| Carnival Corp. 10.5% 6/1/30 (b) | 12,000 | 12,782 | |
| Constellation Merger Sub, Inc. 8.5% 9/15/25 (b) | 5,000 | 4,175 | |
| Fertitta Entertainment LLC / Fertitta Entertainment Finance Co., Inc. 4.625% 1/15/29 (b) | 17,000 | 14,706 | |
| Golden Entertainment, Inc. 7.625% 4/15/26 (b) | 15,000 | 14,888 | |
| Hilton Domestic Operating Co., Inc. 3.625% 2/15/32 (b) | 8,000 | 6,690 | |
| Life Time, Inc. 8% 4/15/26 (b) | 5,000 | 4,963 | |
| Lindblad Expeditions LLC 6.75% 2/15/27 (b) | 1,000 | 966 | |
| MajorDrive Holdings IV LLC 6.375% 6/1/29 (b) | 6,000 | 4,944 | |
| Melco Resorts Finance Ltd. 5.375% 12/4/29 (b) | 7,000 | 5,846 | |
| MGM Resorts International 4.75% 10/15/28 | 17,000 | 15,428 | |
| NCL Corp. Ltd. 5.875% 2/15/27 (b) | 26,000 | 25,186 | |
| Royal Caribbean Cruises Ltd.: | |||
| 5.375% 7/15/27(b) | 18,000 | 16,938 | |
| 7.25% 1/15/30(b) | 5,000 | 5,076 | |
| Scientific Games Corp. 7.5% 9/1/31 (b) | 5,000 | 5,070 | |
| Station Casinos LLC 4.5% 2/15/28 (b) | 9,000 | 8,055 | |
| Viking Cruises Ltd. 9.125% 7/15/31 (b) | 5,000 | 5,166 | |
| Wynn Las Vegas LLC/Wynn Las Vegas Capital Corp. 5.25% 5/15/27 (b) | 16,000 | 15,144 | |
| Yum! Brands, Inc.: | |||
| 3.625% 3/15/31 | 9,000 | 7,632 | |
| 4.625% 1/31/32 | 5,000 | 4,474 | |
| 231,387 | |||
| Household Durables - 1.1% | |||
| Newell Brands, Inc. 5.875% 4/1/36 (e) | 5,000 | 4,444 | |
| Tempur Sealy International, Inc. 4% 4/15/29 (b) | 5,000 | 4,295 | |
| Toll Brothers Finance Corp. 4.875% 3/15/27 | 150,000 | 145,605 | |
| 154,344 | |||
| Leisure Products - 0.0% | |||
| Mattel, Inc. 5.45% 11/1/41 | 5,000 | 4,304 | |
| Specialty Retail - 0.3% | |||
| Bath & Body Works, Inc. 6.625% 10/1/30 (b) | 15,000 | 14,630 | |
| Carvana Co. 4.875% 9/1/29 (b) | 21,000 | 12,533 | |
| LBM Acquisition LLC 6.25% 1/15/29 (b) | 7,000 | 6,108 | |
| LCM Investments Holdings 8.25% 8/1/31 (b) | 5,000 | 5,003 | |
| Michaels Companies, Inc. 7.875% 5/1/29 (b) | 7,000 | 4,852 | |
| Victoria's Secret & Co. 4.625% 7/15/29 (b) | 3,000 | 2,172 | |
| 45,298 | |||
| Textiles, Apparel & Luxury Goods - 0.2% | |||
| Crocs, Inc. 4.125% 8/15/31 (b) | 9,000 | 7,133 | |
| Tapestry, Inc. 3.05% 3/15/32 | 10,000 | 7,693 | |
| The William Carter Co. 5.625% 3/15/27 (b) | 5,000 | 4,847 | |
| Wolverine World Wide, Inc. 4% 8/15/29 (b) | 7,000 | 5,243 | |
| 24,916 | |||
TOTAL CONSUMER DISCRETIONARY | 654,565 | ||
| CONSUMER STAPLES - 0.6% | |||
| Beverages - 0.1% | |||
| Triton Water Holdings, Inc. 6.25% 4/1/29 (b) | 14,000 | 11,901 | |
| Consumer Staples Distribution & Retail - 0.3% | |||
| Albertsons Companies LLC/Safeway, Inc./New Albertson's, Inc./Albertson's LLC 3.5% 3/15/29 (b) | 17,000 | 14,705 | |
| C&S Group Enterprises LLC 5% 12/15/28 (b) | 14,000 | 10,803 | |
| Performance Food Group, Inc. 5.5% 10/15/27 (b) | 16,000 | 15,407 | |
| 40,915 | |||
| Food Products - 0.2% | |||
| Darling Ingredients, Inc. 6% 6/15/30 (b) | 8,000 | 7,819 | |
| Lamb Weston Holdings, Inc. 4.375% 1/31/32 (b) | 5,000 | 4,340 | |
| Post Holdings, Inc. 4.625% 4/15/30 (b) | 17,000 | 15,062 | |
| TreeHouse Foods, Inc. 4% 9/1/28 | 13,000 | 11,127 | |
| 38,348 | |||
TOTAL CONSUMER STAPLES | 91,164 | ||
| ENERGY - 7.0% | |||
| Energy Equipment & Services - 0.2% | |||
| CGG SA 8.75% 4/1/27 (b) | 7,000 | 6,024 | |
| Seadrill Finance Ltd. 8.375% 8/1/30 (b) | 5,000 | 5,125 | |
| Transocean Poseidon Ltd. 6.875% 2/1/27 (b) | 16,500 | 16,398 | |
| Transocean, Inc. 8% 2/1/27 (b) | 5,000 | 4,878 | |
| Valaris Ltd. 8.375% 4/30/30 (b) | 5,000 | 5,093 | |
| 37,518 | |||
| Oil, Gas & Consumable Fuels - 6.8% | |||
| Buckeye Partners LP 3.95% 12/1/26 | 12,000 | 11,068 | |
| Calumet Specialty Products Partners LP/Calumet Finance Corp. 9.75% 7/15/28 (b) | 5,000 | 4,970 | |
| Centennial Resource Production LLC 5.875% 7/1/29 (b) | 7,000 | 6,720 | |
| Citgo Petroleum Corp. 6.375% 6/15/26 (b) | 6,000 | 5,859 | |
| Columbia Pipelines Operating Co. LLC: | |||
| 5.927% 8/15/30(b) | 2,000 | 2,017 | |
| 6.036% 11/15/33(b) | 6,000 | 6,062 | |
| 6.497% 8/15/43(b) | 2,000 | 2,027 | |
| 6.544% 11/15/53(b) | 2,000 | 2,044 | |
| 6.714% 8/15/63(b) | 2,000 | 2,044 | |
| Comstock Resources, Inc. 6.75% 3/1/29 (b) | 12,000 | 11,228 | |
| Crestwood Midstream Partners LP/Crestwood Midstream Finance Corp. 6% 2/1/29 (b) | 38,000 | 37,305 | |
| CVR Energy, Inc. 5.75% 2/15/28 (b) | 16,000 | 14,565 | |
| Delek Logistics Partners LP 7.125% 6/1/28 (b) | 9,000 | 8,366 | |
| EG Global Finance PLC: | |||
| 6.75% 2/7/25(b) | 26,000 | 25,618 | |
| 8.5% 10/30/25(b) | 5,000 | 4,950 | |
| EnLink Midstream LLC 6.5% 9/1/30 (b) | 10,000 | 10,026 | |
| EQM Midstream Partners LP 6.5% 7/1/27 (b) | 5,000 | 4,968 | |
| Global Partners LP/GLP Finance Corp. 6.875% 1/15/29 | 18,000 | 17,010 | |
| Golar LNG Ltd. 7% 10/20/25 (b) | 5,000 | 4,920 | |
| Harvest Midstream I LP 7.5% 9/1/28 (b) | 10,000 | 10,022 | |
| Hess Midstream Partners LP 4.25% 2/15/30 (b) | 17,000 | 14,945 | |
| Hilcorp Energy I LP/Hilcorp Finance Co. 6% 4/15/30 (b) | 12,000 | 11,156 | |
| Holly Energy Partners LP/Holly Energy Finance Corp. 5% 2/1/28 (b) | 5,000 | 4,690 | |
| Howard Midstream Energy Partners LLC 8.875% 7/15/28 (b) | 7,000 | 7,249 | |
| Kinder Morgan, Inc. 3.6% 2/15/51 | 200,000 | 134,406 | |
| MEG Energy Corp. 7.125% 2/1/27 (b) | 15,000 | 15,189 | |
| MPLX LP: | |||
| 5% 3/1/33 | 50,000 | 47,196 | |
| 5.65% 3/1/53 | 50,000 | 45,304 | |
| New Fortress Energy, Inc. 6.5% 9/30/26 (b) | 60,000 | 55,771 | |
| NGL Energy Operating LLC/NGL Energy Finance Corp. 7.5% 2/1/26 (b) | 12,000 | 11,947 | |
| Northern Oil & Gas, Inc. 8.75% 6/15/31 (b) | 5,000 | 5,108 | |
| Occidental Petroleum Corp. 8.875% 7/15/30 | 27,000 | 30,954 | |
| Parkland Corp.: | |||
| 4.5% 10/1/29(b) | 2,000 | 1,762 | |
| 4.625% 5/1/30(b) | 10,000 | 8,816 | |
| PBF Holding Co. LLC/PBF Finance Corp.: | |||
| 6% 2/15/28 | 4,000 | 3,784 | |
| 7.875% 9/15/30(b) | 8,000 | 7,960 | |
| Petroleos Mexicanos 7.69% 1/23/50 | 200,000 | 133,160 | |
| Range Resources Corp. 4.875% 5/15/25 | 15,000 | 14,663 | |
| SM Energy Co. 6.625% 1/15/27 | 15,000 | 14,813 | |
| Southwestern Energy Co. 4.75% 2/1/32 | 20,000 | 17,717 | |
| Sunoco LP/Sunoco Finance Corp. 4.5% 5/15/29 | 17,000 | 15,374 | |
| Tallgrass Energy Partners LP / Tallgrass Energy Finance Corp.: | |||
| 6% 12/31/30(b) | 26,000 | 23,259 | |
| 6% 9/1/31(b) | 15,000 | 13,322 | |
| Targa Resources Corp. 4.2% 2/1/33 | 160,000 | 141,081 | |
| Western Gas Partners LP 5.3% 3/1/48 | 9,000 | 7,377 | |
| 978,792 | |||
TOTAL ENERGY | 1,016,310 | ||
| FINANCIALS - 10.1% | |||
| Banks - 5.2% | |||
| AIB Group PLC 2.875% 5/30/31 (Reg. S) (c) | EUR | 100,000 | 100,369 |
| Bank of America Corp. 2.299% 7/21/32 (c) | 90,000 | 70,979 | |
| BNP Paribas SA 0.5% 1/19/30 (Reg. S) (c) | EUR | 100,000 | 87,998 |
| BPCE SA 1.5% 1/13/42 (Reg. S) (c) | EUR | 200,000 | 188,227 |
| HSBC Holdings PLC 3% 7/22/28 (c) | GBP | 100,000 | 111,660 |
| Intesa Sanpaolo SpA 5.71% 1/15/26 (b) | 200,000 | 191,861 | |
| Western Alliance Bancorp. 3% 6/15/31 (c) | 3,000 | 2,373 | |
| 753,467 | |||
| Capital Markets - 0.9% | |||
| Coinbase Global, Inc. 3.625% 10/1/31 (b) | 6,000 | 4,039 | |
| Hightower Holding LLC 6.75% 4/15/29 (b) | 8,000 | 6,963 | |
| MSCI, Inc. 4% 11/15/29 (b) | 9,000 | 8,097 | |
| UBS Group AG 2.125% 11/15/29 (Reg. S) (c) | GBP | 100,000 | 104,234 |
| VistaJet Malta Finance PLC / XO Management Holding, Inc. 6.375% 2/1/30 (b) | 9,000 | 7,380 | |
| 130,713 | |||
| Consumer Finance - 1.9% | |||
| Capital One Financial Corp.: | |||
| 5.468% 2/1/29(c) | 9,000 | 8,731 | |
| 5.817% 2/1/34(c) | 15,000 | 14,248 | |
| Ford Motor Credit Co. LLC: | |||
| 3.375% 11/13/25 | 200,000 | 186,457 | |
| 4% 11/13/30 | 52,000 | 44,000 | |
| OneMain Finance Corp. 6.875% 3/15/25 | 22,000 | 21,889 | |
| 275,325 | |||
| Financial Services - 1.0% | |||
| Altus Midstream LP 5.875% 6/15/30 (b) | 5,000 | 4,843 | |
| Blackstone Private Credit Fund 4.7% 3/24/25 | 80,000 | 77,762 | |
| Block, Inc. 3.5% 6/1/31 | 10,000 | 8,200 | |
| GGAM Finance Ltd.: | |||
| 7.75% 5/15/26(b) | 10,000 | 10,000 | |
| 8% 6/15/28(b) | 1,000 | 1,014 | |
| Icahn Enterprises LP/Icahn Enterprises Finance Corp. 5.25% 5/15/27 | 40,000 | 35,100 | |
| Scientific Games Holdings LP/Scientific Games U.S. Finco, Inc. 6.625% 3/1/30 (b) | 2,000 | 1,763 | |
| 138,682 | |||
| Insurance - 1.1% | |||
| Acrisure LLC / Acrisure Finance, Inc. 6% 8/1/29 (b) | 18,000 | 15,637 | |
| Alliant Holdings Intermediate LLC: | |||
| 4.25% 10/15/27(b) | 16,000 | 14,527 | |
| 6.75% 10/15/27(b) | 12,000 | 11,343 | |
| Demeter Investments BV 2.75% 2/19/49 (Reg. S) (c) | EUR | 100,000 | 96,268 |
| HUB International Ltd. 7% 5/1/26 (b) | 15,000 | 14,972 | |
| USI, Inc. 6.875% 5/1/25 (b) | 12,000 | 11,981 | |
| 164,728 | |||
TOTAL FINANCIALS | 1,462,915 | ||
| HEALTH CARE - 2.1% | |||
| Biotechnology - 0.1% | |||
| Emergent BioSolutions, Inc. 3.875% 8/15/28 (b) | 11,000 | 5,280 | |
| Grifols SA 4.75% 10/15/28 (b) | 5,000 | 4,387 | |
| 9,667 | |||
| Health Care Equipment & Supplies - 0.0% | |||
| Avantor Funding, Inc. 4.625% 7/15/28 (b) | 9,000 | 8,355 | |
| Health Care Providers & Services - 1.7% | |||
| Cano Health, Inc. 6.25% 10/1/28 (b) | 3,000 | 1,020 | |
| Centene Corp.: | |||
| 3.375% 2/15/30 | 17,000 | 14,549 | |
| 4.625% 12/15/29 | 80,000 | 73,560 | |
| Community Health Systems, Inc.: | |||
| 4.75% 2/15/31(b) | 46,000 | 34,270 | |
| 6.125% 4/1/30(b) | 29,000 | 16,688 | |
| 6.875% 4/15/29(b) | 5,000 | 3,067 | |
| DaVita HealthCare Partners, Inc. 4.625% 6/1/30 (b) | 18,000 | 15,440 | |
| HCA Holdings, Inc. 3.5% 9/1/30 | 17,000 | 14,848 | |
| Molina Healthcare, Inc. 3.875% 11/15/30 (b) | 9,000 | 7,679 | |
| Pediatrix Medical Group, Inc. 5.375% 2/15/30 (b) | 5,000 | 4,560 | |
| Regionalcare Hospital Partners 9.75% 12/1/26 (b) | 2,000 | 1,870 | |
| RegionalCare Hospital Partners Holdings, Inc. 5.375% 1/15/29 (b) | 4,000 | 2,765 | |
| RP Escrow Issuer LLC 5.25% 12/15/25 (b) | 7,000 | 5,392 | |
| Surgery Center Holdings, Inc. 6.75% 7/1/25 (b) | 11,000 | 10,945 | |
| Tenet Healthcare Corp. 4.875% 1/1/26 | 37,000 | 35,867 | |
| 242,520 | |||
| Health Care Technology - 0.1% | |||
| Athenahealth Group, Inc. 6.5% 2/15/30 (b) | 16,000 | 13,896 | |
| Pharmaceuticals - 0.2% | |||
| 1375209 BC Ltd. 9% 1/30/28 (b) | 5,000 | 5,006 | |
| Bausch Health Companies, Inc.: | |||
| 5.5% 11/1/25(b) | 5,000 | 4,506 | |
| 9% 12/15/25(b) | 1,000 | 915 | |
| Organon & Co. / Organon Foreign Debt Co-Issuer BV 4.125% 4/30/28 (b) | 16,000 | 14,479 | |
| 24,906 | |||
TOTAL HEALTH CARE | 299,344 | ||
| INDUSTRIALS - 3.9% | |||
| Aerospace & Defense - 0.5% | |||
| Bombardier, Inc. 7.125% 6/15/26 (b) | 15,000 | 14,748 | |
| Howmet Aerospace, Inc. 5.95% 2/1/37 | 11,000 | 10,829 | |
| Moog, Inc. 4.25% 12/15/27 (b) | 5,000 | 4,550 | |
| TransDigm, Inc. 7.5% 3/15/27 | 35,000 | 35,068 | |
| 65,195 | |||
| Air Freight & Logistics - 0.2% | |||
| Aercap Global Aviation Trust 6.5% 6/15/45 (b)(c) | 5,000 | 4,930 | |
| Cargo Aircraft Management, Inc. 4.75% 2/1/28 (b) | 7,000 | 6,300 | |
| Rand Parent LLC 8.5% 2/15/30 (b) | 13,000 | 12,376 | |
| 23,606 | |||
| Building Products - 0.1% | |||
| Advanced Drain Systems, Inc. 6.375% 6/15/30 (b) | 11,000 | 10,835 | |
| Oscar Acquisition Co. LLC / Oscar Finance, Inc. 9.5% 4/15/30 (b) | 3,000 | 2,808 | |
| 13,643 | |||
| Commercial Services & Supplies - 0.7% | |||
| ADT Corp. 4.125% 8/1/29 (b) | 17,000 | 14,838 | |
| Allied Universal Holdco LLC / Allied Universal Finance Corp. 9.75% 7/15/27 (b) | 13,000 | 11,940 | |
| APX Group, Inc. 6.75% 2/15/27 (b) | 6,000 | 5,830 | |
| Brand Energy & Infrastructure Services, Inc. 10.375% 8/1/30 (b) | 10,000 | 10,313 | |
| Cimpress PLC 7% 6/15/26 | 1,000 | 938 | |
| CoreCivic, Inc. 8.25% 4/15/26 | 15,000 | 15,060 | |
| Covanta Holding Corp. 4.875% 12/1/29 (b) | 5,000 | 4,300 | |
| Madison IAQ LLC 4.125% 6/30/28 (b) | 17,000 | 15,040 | |
| Neptune BidCo U.S., Inc. 9.29% 4/15/29 (b) | 5,000 | 4,669 | |
| PowerTeam Services LLC 9.033% 12/4/25 (b) | 7,000 | 6,513 | |
| Stericycle, Inc. 3.875% 1/15/29 (b) | 7,000 | 6,095 | |
| The GEO Group, Inc. 6% 4/15/26 | 8,000 | 7,240 | |
| 102,776 | |||
| Construction & Engineering - 0.3% | |||
| AECOM 5.125% 3/15/27 | 23,000 | 22,067 | |
| Pike Corp. 5.5% 9/1/28 (b) | 7,000 | 6,299 | |
| Railworks Holdings LP 8.25% 11/15/28 (b) | 7,000 | 6,685 | |
| SRS Distribution, Inc. 4.625% 7/1/28 (b) | 7,000 | 6,230 | |
| 41,281 | |||
| Electrical Equipment - 0.1% | |||
| GrafTech Global Enterprises, Inc. 9.875% 12/15/28 (b) | 5,000 | 4,875 | |
| Regal Rexnord Corp. 6.3% 2/15/30 (b) | 5,000 | 4,978 | |
| Sensata Technologies BV 4% 4/15/29 (b) | 5,000 | 4,391 | |
| 14,244 | |||
| Ground Transportation - 0.9% | |||
| Mobico Group PLC 2.375% 11/20/28 (Reg. S) | GBP | 100,000 | 105,301 |
| Uber Technologies, Inc. 4.5% 8/15/29 (b) | 27,000 | 24,722 | |
| XPO, Inc. 6.25% 6/1/28 (b) | 5,000 | 4,899 | |
| 134,922 | |||
| Machinery - 0.1% | |||
| Vertical Holdco GmbH 7.625% 7/15/28 (b) | 5,000 | 4,634 | |
| Vertical U.S. Newco, Inc. 5.25% 7/15/27 (b) | 5,000 | 4,687 | |
| 9,321 | |||
| Marine Transportation - 0.1% | |||
| Navios South American Logistics, Inc./Navios Logistics Finance U.S., Inc. 10.75% 7/1/25 (b) | 6,000 | 5,801 | |
| Seaspan Corp. 5.5% 8/1/29 (b) | 12,000 | 9,327 | |
| 15,128 | |||
| Passenger Airlines - 0.0% | |||
| American Airlines, Inc. 7.25% 2/15/28 (b) | 5,000 | 4,912 | |
| Professional Services - 0.2% | |||
| ASGN, Inc. 4.625% 5/15/28 (b) | 11,000 | 9,886 | |
| CoreLogic, Inc. 4.5% 5/1/28 (b) | 10,000 | 8,175 | |
| TriNet Group, Inc. 7.125% 8/15/31 (b) | 5,000 | 5,028 | |
| 23,089 | |||
| Trading Companies & Distributors - 0.0% | |||
| Beacon Roofing Supply, Inc. 6.5% 8/1/30 (b) | 5,000 | 4,939 | |
| Transportation Infrastructure - 0.7% | |||
| Heathrow Funding Ltd. 2.625% 3/16/28 (Reg. S) | GBP | 100,000 | 105,836 |
TOTAL INDUSTRIALS | 558,892 | ||
| INFORMATION TECHNOLOGY - 1.7% | |||
| Communications Equipment - 0.1% | |||
| CommScope, Inc. 4.75% 9/1/29 (b) | 13,000 | 9,661 | |
| HTA Group Ltd. 7% 12/18/25 (b) | 10,000 | 9,450 | |
| IHS Netherlands Holdco BV 8% 9/18/27 (b) | 2,000 | 1,787 | |
| 20,898 | |||
| Electronic Equipment, Instruments & Components - 0.1% | |||
| Coherent Corp. 5% 12/15/29 (b) | 16,000 | 14,211 | |
| TTM Technologies, Inc. 4% 3/1/29 (b) | 5,000 | 4,343 | |
| 18,554 | |||
| IT Services - 0.1% | |||
| Acuris Finance U.S. 5% 5/1/28 (b) | 5,000 | 4,050 | |
| Virtusa Corp. 7.125% 12/15/28 (b) | 3,000 | 2,456 | |
| 6,506 | |||
| Semiconductors & Semiconductor Equipment - 0.1% | |||
| Entegris, Inc. 4.375% 4/15/28 (b) | 17,000 | 15,499 | |
| Software - 1.2% | |||
| Black Knight InfoServ LLC 3.625% 9/1/28 (b) | 20,000 | 18,400 | |
| Clarivate Science Holdings Corp. 4.875% 7/1/29 (b) | 17,000 | 14,825 | |
| Cloud Software Group, Inc. 9% 9/30/29 (b) | 15,000 | 13,408 | |
| CNT PRNT/CDK GLO II/FIN 8% 6/15/29 (b) | 5,000 | 5,033 | |
| Fair Isaac Corp. 4% 6/15/28 (b) | 5,000 | 4,572 | |
| McAfee Corp. 7.375% 2/15/30 (b) | 3,000 | 2,625 | |
| MicroStrategy, Inc. 6.125% 6/15/28 (b) | 4,000 | 3,581 | |
| Open Text Corp. 3.875% 12/1/29 (b) | 24,000 | 20,353 | |
| Oracle Corp. 3.85% 4/1/60 | 100,000 | 67,962 | |
| SS&C Technologies, Inc. 5.5% 9/30/27 (b) | 16,000 | 15,403 | |
| 166,162 | |||
| Technology Hardware, Storage & Peripherals - 0.1% | |||
| Seagate HDD Cayman: | |||
| 5.75% 12/1/34 | 5,000 | 4,428 | |
| 8.25% 12/15/29(b) | 5,000 | 5,245 | |
| 9,673 | |||
TOTAL INFORMATION TECHNOLOGY | 237,292 | ||
| MATERIALS - 2.4% | |||
| Chemicals - 0.9% | |||
| Axalta Coating Systems/Dutch Holding BV 4.75% 6/15/27 (b) | 6,000 | 5,647 | |
| Kobe U.S. Midco 2, Inc. 9.25% 11/1/26 pay-in-kind (b)(c) | 5,000 | 3,650 | |
| LSB Industries, Inc. 6.25% 10/15/28 (b) | 10,000 | 9,146 | |
| Methanex Corp. 5.125% 10/15/27 | 16,000 | 15,008 | |
| NOVA Chemicals Corp. 5.25% 6/1/27 (b) | 12,000 | 10,669 | |
| Nufarm Australia Ltd. 5% 1/27/30 (b) | 9,000 | 8,005 | |
| Olin Corp. 5% 2/1/30 | 16,000 | 14,651 | |
| Olympus Water U.S. Holding Corp.: | |||
| 4.25% 10/1/28(b) | 18,000 | 14,778 | |
| 6.25% 10/1/29(b) | 6,000 | 4,830 | |
| 9.75% 11/15/28(b) | 2,000 | 2,015 | |
| SCIH Salt Holdings, Inc.: | |||
| 4.875% 5/1/28(b) | 2,000 | 1,800 | |
| 6.625% 5/1/29(b) | 6,000 | 5,295 | |
| SCIL IV LLC / SCIL U.S.A. Holdings LLC 5.375% 11/1/26 (b) | 4,000 | 3,744 | |
| The Chemours Co. LLC 5.75% 11/15/28 (b) | 19,000 | 17,068 | |
| W.R. Grace Holding LLC: | |||
| 4.875% 6/15/27(b) | 6,000 | 5,596 | |
| 7.375% 3/1/31(b) | 5,000 | 4,924 | |
| 126,826 | |||
| Construction Materials - 0.0% | |||
| Eco Material Technologies, Inc. 7.875% 1/31/27 (b) | 5,000 | 4,875 | |
| Containers & Packaging - 0.8% | |||
| ARD Finance SA 6.5% 6/30/27 pay-in-kind (b)(c) | 8,000 | 6,430 | |
| Ardagh Metal Packaging Finance U.S.A. LLC/Ardagh Metal Packaging Finance PLC: | |||
| 4% 9/1/29(b) | 2,000 | 1,626 | |
| 6% 6/15/27(b) | 2,000 | 1,950 | |
| Ardagh Packaging Finance PLC/Ardagh MP Holdings U.S.A., Inc.: | |||
| 4.125% 8/15/26(b) | 6,000 | 5,605 | |
| 5.25% 8/15/27(b) | 2,000 | 1,701 | |
| 5.25% 8/15/27(b) | 9,000 | 7,656 | |
| Ball Corp. 6% 6/15/29 | 5,000 | 4,926 | |
| BWAY Holding Co. 7.875% 8/15/26 (b) | 5,000 | 4,924 | |
| Clydesdale Acquisition Holdings, Inc.: | |||
| 6.625% 4/15/29(b) | 35,000 | 33,304 | |
| 8.75% 4/15/30(b) | 5,000 | 4,522 | |
| Crown Americas LLC/Crown Americas Capital Corp. IV 4.75% 2/1/26 | 8,000 | 7,714 | |
| Graham Packaging Co., Inc. 7.125% 8/15/28 (b) | 2,000 | 1,744 | |
| Owens-Brockway Glass Container, Inc. 7.25% 5/15/31 (b) | 5,000 | 5,045 | |
| Sealed Air Corp./Sealed Air Cor 6.125% 2/1/28 (b) | 5,000 | 4,913 | |
| Trivium Packaging Finance BV: | |||
| 5.5% 8/15/26(b) | 16,000 | 15,092 | |
| 8.5% 8/15/27(b) | 11,000 | 10,434 | |
| 117,586 | |||
| Metals & Mining - 0.6% | |||
| Arsenal AIC Parent LLC 8% 10/1/30 (b) | 5,000 | 5,106 | |
| ATI, Inc. 7.25% 8/15/30 | 5,000 | 5,051 | |
| ERO Copper Corp. 6.5% 2/15/30 (b) | 9,000 | 7,817 | |
| First Quantum Minerals Ltd. 6.875% 3/1/26 (b) | 24,000 | 23,452 | |
| FMG Resources Pty Ltd. 4.5% 9/15/27 (b) | 13,000 | 11,994 | |
| Kaiser Aluminum Corp. 4.5% 6/1/31 (b) | 5,000 | 4,040 | |
| Mineral Resources Ltd. 8% 11/1/27 (b) | 14,000 | 13,951 | |
| Novelis Corp. 3.875% 8/15/31 (b) | 18,000 | 14,903 | |
| PMHC II, Inc. 9% 2/15/30 (b) | 5,000 | 4,124 | |
| 90,438 | |||
| Paper & Forest Products - 0.1% | |||
| LABL, Inc. 10.5% 7/15/27 (b) | 7,000 | 6,700 | |
| SPA Holdings 3 OY 4.875% 2/4/28 (b) | 5,000 | 4,152 | |
| 10,852 | |||
TOTAL MATERIALS | 350,577 | ||
| REAL ESTATE - 1.7% | |||
| Equity Real Estate Investment Trusts (REITs) - 1.1% | |||
| MPT Operating Partnership LP/MPT Finance Corp.: | |||
| 3.5% 3/15/31 | 42,000 | 27,274 | |
| 5% 10/15/27 | 12,000 | 9,480 | |
| 5.25% 8/1/26 | 1,000 | 850 | |
| Omega Healthcare Investors, Inc. 3.25% 4/15/33 | 4,000 | 2,985 | |
| Piedmont Operating Partnership LP 9.25% 7/20/28 | 15,000 | 15,342 | |
| SBA Communications Corp. 3.875% 2/15/27 | 25,000 | 23,114 | |
| Service Properties Trust 4.95% 2/15/27 | 10,000 | 8,655 | |
| Uniti Group LP / Uniti Group Finance, Inc. 4.75% 4/15/28 (b) | 44,000 | 37,089 | |
| VICI Properties LP / VICI Note Co. 4.125% 8/15/30 (b) | 33,000 | 28,894 | |
| 153,683 | |||
| Real Estate Management & Development - 0.6% | |||
| Blackstone Property Partners Europe LP 1% 5/4/28 (Reg. S) | EUR | 100,000 | 84,954 |
| Greystar Real Estate Partners 7.75% 9/1/30 (b) | 5,000 | 5,050 | |
| Howard Hughes Corp. 4.375% 2/1/31 (b) | 6,000 | 4,782 | |
| 94,786 | |||
TOTAL REAL ESTATE | 248,469 | ||
| UTILITIES - 2.1% | |||
| Electric Utilities - 2.1% | |||
| DPL, Inc. 4.35% 4/15/29 | 160,000 | 137,801 | |
| EnBW Energie Baden-Wuerttemberg AG 1.375% 8/31/81 (Reg. S) (c) | EUR | 100,000 | 87,426 |
| FirstEnergy Corp. 4.15% 7/15/27 | 5,000 | 4,716 | |
| NRG Energy, Inc. 5.25% 6/15/29 (b) | 17,000 | 15,302 | |
| PG&E Corp.: | |||
| 5% 7/1/28 | 38,000 | 34,956 | |
| 5.25% 7/1/30 | 5,000 | 4,442 | |
| Vistra Operations Co. LLC 5% 7/31/27 (b) | 16,000 | 15,048 | |
| 299,691 | |||
| Independent Power and Renewable Electricity Producers - 0.0% | |||
| Atlantica Sustainable Infrastructure PLC 4.125% 6/15/28 (b) | 5,000 | 4,458 | |
| Sunnova Energy Corp. 5.875% 9/1/26 (b) | 5,000 | 4,400 | |
| 8,858 | |||
TOTAL UTILITIES | 308,549 | ||
| TOTAL NONCONVERTIBLE BONDS | 5,843,088 | ||
| TOTAL CORPORATE BONDS (Cost $6,017,884) | 5,867,383 | ||
| U.S. Treasury Obligations - 40.6% | |||
Principal Amount (a) | Value ($) | ||
| U.S. Treasury Bonds: | |||
| 3.625% 2/15/53 | 1,882,000 | 1,695,564 | |
| 4.375% 2/15/38 | 195,000 | 199,631 | |
| U.S. Treasury Notes: | |||
| 3.5% 1/31/30 | 700,000 | 671,480 | |
| 3.5% 2/15/33 | 200,000 | 190,469 | |
| 3.625% 3/31/28 | 540,000 | 524,939 | |
| 3.625% 3/31/30 | 610,000 | 589,222 | |
| 4.125% 11/15/32 | 2,010,000 | 2,009,055 | |
| TOTAL U.S. TREASURY OBLIGATIONS (Cost $6,187,536) | 5,880,360 | ||
| Asset-Backed Securities - 0.7% | |||
Principal Amount (a) | Value ($) | ||
DB Master Finance LLC Series 2017-1A Class A2II, 4.03% 11/20/47 (b) (Cost $111,671) | 118,125 | 108,738 | |
| Commercial Mortgage Securities - 1.2% | |||
Principal Amount (a) | Value ($) | ||
| BX Trust floater Series 2022-IND Class C, CME Term SOFR 1 Month Index + 2.290% 7.6005% 4/15/37 (b)(c)(d) | 96,256 | 93,609 | |
| VLS Commercial Mortgage Trust sequential payer Series 2020-LAB Class A, 2.13% 10/10/42 (b) | 100,000 | 78,023 | |
| TOTAL COMMERCIAL MORTGAGE SECURITIES (Cost $175,188) | 171,632 | ||
| Foreign Government and Government Agency Obligations - 5.8% | |||
Principal Amount (a) | Value ($) | ||
| Brazilian Federative Republic: | |||
| 5.625% 2/21/47 | 200,000 | 166,974 | |
| 10% 1/1/27 | BRL | 400,000 | 79,747 |
| 10% 1/1/33 | BRL | 400,000 | 75,621 |
| Dominican Republic 6% 2/22/33 (b) | 240,000 | 221,261 | |
| German Federal Republic 1% 5/15/38(Reg. S) | EUR | 5,000 | 4,367 |
| Japan Government 0.6% 12/20/23 | JPY | 20,000,000 | 137,760 |
| United Mexican States: | |||
| 7.75% 5/29/31 | MXN | 1,405,000 | 75,076 |
| 7.75% 11/13/42 | MXN | 1,492,000 | 74,557 |
| TOTAL FOREIGN GOVERNMENT AND GOVERNMENT AGENCY OBLIGATIONS (Cost $841,468) | 835,363 | ||
| Bank Loan Obligations - 0.8% | |||
Principal Amount (a) | Value ($) | ||
| CONSUMER DISCRETIONARY - 0.4% | |||
| Broadline Retail - 0.0% | |||
| Bass Pro Group LLC Tranche B 1LN, term loan 1 month U.S. LIBOR + 3.750% 9.1955% 3/5/28 (c)(d)(f) | 4,987 | 4,967 | |
| Diversified Consumer Services - 0.1% | |||
| Spin Holdco, Inc. Tranche B 1LN, term loan 3 month U.S. LIBOR + 4.000% 9.2303% 3/4/28 (c)(d)(f) | 10,987 | 9,174 | |
| Hotels, Restaurants & Leisure - 0.2% | |||
| City Football Group Ltd. Tranche B 1LN, term loan 1 month U.S. LIBOR + 3.000% 8.4285% 7/21/28 (c)(d)(f) | 11,970 | 11,865 | |
| ClubCorp Holdings, Inc. Tranche B 1LN, term loan 3 month U.S. LIBOR + 2.750% 8.2879% 9/18/24 (c)(d)(f) | 8,981 | 8,852 | |
| Ontario Gaming GTA LP Tranche B 1LN, term loan CME Term SOFR 1 Month Index + 4.250% 8/1/30 (d)(f)(g) | 5,000 | 5,009 | |
| 25,726 | |||
| Household Durables - 0.0% | |||
| Mattress Firm, Inc. Tranche B 1LN, term loan 6 month U.S. LIBOR + 4.250% 9.95% 9/24/28 (c)(d)(f) | 4,987 | 4,937 | |
| Specialty Retail - 0.1% | |||
| LBM Acquisition LLC Tranche B 1LN, term loan CME Term SOFR 1 Month Index + 3.750% 9.1811% 12/18/27 (c)(d)(f) | 9,975 | 9,692 | |
TOTAL CONSUMER DISCRETIONARY | 54,496 | ||
| HEALTH CARE - 0.0% | |||
| Health Care Providers & Services - 0.0% | |||
| Cano Health, Inc. Tranche B 1LN, term loan CME Term SOFR 1 Month Index + 4.000% 9.4311% 11/23/27 (c)(d)(f) | 9,975 | 6,234 | |
| INDUSTRIALS - 0.2% | |||
| Building Products - 0.1% | |||
| Acproducts Holdings, Inc. Tranche B 1LN, term loan 1 month U.S. LIBOR + 4.250% 9.7535% 5/17/28 (c)(d)(f) | 9,987 | 8,527 | |
| Commercial Services & Supplies - 0.0% | |||
| ABG Intermediate Holdings 2 LLC: | |||
| Tranche B2 1LN, term loan CME Term SOFR 1 Month Index + 4.000% 9.4187% 12/21/28 (c)(d)(f) | 753 | 753 | |
| Tranche DD 1LN, term loan CME Term SOFR 1 Month Index + 4.000% 5.9018% 12/21/28 (c)(d)(f)(h) | 247 | 247 | |
| Brand Energy & Infrastructure Services, Inc. Tranche B 1LN, term loan CME Term SOFR 1 Month Index + 5.500% 10.8719% 8/1/30 (c)(d)(f) | 5,000 | 4,824 | |
| 5,824 | |||
| Construction & Engineering - 0.1% | |||
| Breakwater Energy Partners LLC Tranche B 1LN, term loan 11.25% 9/1/26 (c)(f)(i) | 8,710 | 8,416 | |
TOTAL INDUSTRIALS | 22,767 | ||
| INFORMATION TECHNOLOGY - 0.2% | |||
| Software - 0.2% | |||
| Ascend Learning LLC: | |||
| 2LN, term loan CME Term SOFR 1 Month Index + 5.750% 11.1811% 12/10/29 (c)(d)(f) | 5,000 | 4,265 | |
| Tranche B 1LN, term loan CME Term SOFR 1 Month Index + 3.500% 8.9311% 12/10/28 (c)(d)(f) | 4,987 | 4,790 | |
| Finastra U.S.A., Inc.: | |||
| Tranche 2LN, term loan 3 month U.S. LIBOR + 7.250% 12.981% 6/13/25 (c)(d)(f) | 8,000 | 7,988 | |
| Tranche B 1LN, term loan CME TERM SOFR 6 MONTH INDEX + 3.500% 9.231% 6/13/24 (c)(d)(f) | 8,975 | 8,963 | |
| Ultimate Software Group, Inc.: | |||
| 1LN, term loan 1 month U.S. LIBOR + 3.250% 8.6184% 5/3/26 (c)(d)(f) | 4,987 | 4,982 | |
| 2LN, term loan CME Term SOFR 3 Month Index + 5.250% 10.6184% 5/3/27 (c)(d)(f) | 2,000 | 1,986 | |
| 32,974 | |||
| MATERIALS - 0.0% | |||
| Chemicals - 0.0% | |||
| Olympus Water U.S. Holding Corp. Tranche B 1LN, term loan CME Term SOFR 3 Month Index + 3.750% 9.2535% 11/9/28 (c)(d)(f) | 2,000 | 1,969 | |
| TOTAL BANK LOAN OBLIGATIONS (Cost $117,957) | 118,440 | ||
| Preferred Securities - 1.4% | |||
Principal Amount (a) | Value ($) | ||
| ENERGY - 0.1% | |||
| Oil, Gas & Consumable Fuels - 0.1% | |||
| Energy Transfer LP 3 month U.S. LIBOR + 4.020% 9.6542% (c)(d)(j) | 13,000 | 12,019 | |
| EnLink Midstream Partners LP 3 month U.S. LIBOR + 4.110% 9.6184% (c)(d)(j) | 5,000 | 4,541 | |
| Plains All American Pipeline LP CME Term SOFR 3 Month Index + 4.110% 9.7362% (c)(d)(j) | 5,000 | 4,610 | |
| 21,170 | |||
| FINANCIALS - 1.2% | |||
| Banks - 1.1% | |||
| Bank of America Corp. 5.875% (c)(j) | 5,000 | 4,750 | |
| Bank of Nova Scotia 4.9% (c)(j) | 150,000 | 140,119 | |
| JPMorgan Chase & Co. 4.6% (c)(j) | 5,000 | 4,710 | |
| Wells Fargo & Co. 5.9% (c)(j) | 4,000 | 4,009 | |
| 153,588 | |||
| Capital Markets - 0.1% | |||
| Charles Schwab Corp. 5.375% (c)(j) | 10,000 | 9,784 | |
| Consumer Finance - 0.0% | |||
| Ally Financial, Inc. 4.7% (c)(j) | 12,000 | 8,455 | |
TOTAL FINANCIALS | 171,827 | ||
| INDUSTRIALS - 0.1% | |||
| Trading Companies & Distributors - 0.1% | |||
| AerCap Holdings NV 5.875% 10/10/79 (c) | 7,000 | 6,920 | |
| Air Lease Corp. 4.125% (c)(j) | 2,000 | 1,459 | |
| Aircastle Ltd. 5.25% (b)(c)(j) | 4,000 | 3,197 | |
| 11,576 | |||
| TOTAL PREFERRED SECURITIES (Cost $211,850) | 204,573 | ||
| Money Market Funds - 7.7% | |||
| Shares | Value ($) | ||
Fidelity Cash Central Fund 5.43% (k) (Cost $1,113,145) | 1,112,923 | 1,113,145 | |
| TOTAL INVESTMENT IN SECURITIES - 98.8% (Cost $14,776,699) | 14,299,634 |
NET OTHER ASSETS (LIABILITIES) - 1.2% | 169,190 |
| NET ASSETS - 100.0% | 14,468,824 |
| Futures Contracts | |||||
Number of contracts | Expiration Date | Notional Amount ($) | Value ($) | Unrealized Appreciation/ (Depreciation) ($) | |
| Purchased | |||||
| Bond Index Contracts | |||||
| Eurex Euro-Schatz Contracts (Germany) | 1 | Dec 2023 | 114,377 | 298 | 298 |
| Treasury Contracts | |||||
| CBOT 5-Year U.S. Treasury Note Contracts (United States) | 1 | Dec 2023 | 106,922 | 741 | 741 |
| CBOT Long Term U.S. Treasury Bond Contracts (United States) | 1 | Dec 2023 | 121,688 | 1,732 | 1,732 |
| TOTAL TREASURY CONTRACTS | 2,473 | ||||
| TOTAL PURCHASED | 2,771 | ||||
| Sold | |||||
| Bond Index Contracts | |||||
| ICE Long Gilt Contracts (United Kingdom) | 1 | Dec 2023 | 121,068 | (2,421) | (2,421) |
| TOTAL FUTURES CONTRACTS | 350 | ||||
| The notional amount of futures purchased as a percentage of Net Assets is 2.3% | |||||
| The notional amount of futures sold as a percentage of Net Assets is 0.8% | |||||
| Forward Foreign Currency Contracts | ||||||
Currency Purchased | Currency Sold | Counterparty | Settlement Date | Unrealized Appreciation/ (Depreciation) ($) | ||
| EUR | 4,000 | USD | 4,380 | BNP Paribas S.A. | 9/15/23 | (41) |
| EUR | 3,000 | USD | 3,300 | Bank of America, N.A. | 9/15/23 | (46) |
| EUR | 4,000 | USD | 4,344 | Brown Brothers Harriman & Co | 9/15/23 | (5) |
| EUR | 3,000 | USD | 3,282 | Canadian Imperial Bk. of Comm. | 9/15/23 | (28) |
| GBP | 2,000 | USD | 2,522 | Brown Brothers Harriman & Co | 9/15/23 | 12 |
| GBP | 2,000 | USD | 2,546 | JPMorgan Chase Bank, N.A. | 9/15/23 | (12) |
| GBP | 2,000 | USD | 2,551 | Royal Bank of Canada | 9/15/23 | (17) |
| USD | 775,084 | EUR | 705,000 | Bank of America, N.A. | 9/15/23 | 10,249 |
| USD | 3,375 | EUR | 3,000 | Bank of America, N.A. | 9/15/23 | 120 |
| USD | 2,215 | EUR | 2,000 | Canadian Imperial Bk. of Comm. | 9/15/23 | 45 |
| USD | 3,314 | EUR | 3,000 | Canadian Imperial Bk. of Comm. | 9/15/23 | 60 |
| USD | 3,278 | EUR | 3,000 | Citibank, N. A. | 9/15/23 | 23 |
| USD | 2,172 | EUR | 2,000 | JPMorgan Chase Bank, N.A. | 9/15/23 | 3 |
| USD | 3,316 | EUR | 3,000 | JPMorgan Chase Bank, N.A. | 9/15/23 | 61 |
| USD | 4,379 | EUR | 4,000 | JPMorgan Chase Bank, N.A. | 9/15/23 | 40 |
| USD | 468,153 | GBP | 365,000 | BNP Paribas S.A. | 9/15/23 | 5,749 |
| USD | 2,622 | GBP | 2,000 | BNP Paribas S.A. | 9/15/23 | 88 |
| USD | 2,550 | GBP | 2,000 | BNP Paribas S.A. | 9/15/23 | 16 |
| USD | 3,933 | GBP | 3,000 | Bank of America, N.A. | 9/15/23 | 132 |
| USD | 3,817 | GBP | 3,000 | JPMorgan Chase Bank, N.A. | 9/15/23 | 16 |
| TOTAL FORWARD FOREIGN CURRENCY CONTRACTS | 16,465 | |||||
| Unrealized Appreciation | 16,614 | |||||
| Unrealized Depreciation | (149) | |||||
| BRL | - | Brazilian real |
| EUR | - | European Monetary Unit |
| GBP | - | British pound sterling |
| JPY | - | Japanese yen |
| MXN | - | Mexican peso |
| USD | - | U.S. dollar |
| (a) | Amount is stated in United States dollars unless otherwise noted. |
| (b) | Security exempt from registration under Rule 144A of the Securities Act of 1933. These securities may be resold in transactions exempt from registration, normally to qualified institutional buyers. At the end of the period, the value of these securities amounted to $3,096,181 or 21.4% of net assets. |
| (c) | Coupon rates for floating and adjustable rate securities reflect the rates in effect at period end. |
| (d) | Coupon is indexed to a floating interest rate which may be multiplied by a specified factor and/or subject to caps or floors. |
| (e) | Security initially issued at one coupon which converts to a higher coupon at a specified date. The rate shown is the rate at period end. |
| (f) | Remaining maturities of bank loan obligations may be less than the stated maturities shown as a result of contractual or optional prepayments by the borrower. Such prepayments cannot be predicted with certainty. |
| (g) | The coupon rate will be determined upon settlement of the loan after period end. |
| (h) | Position or a portion of the position represents an unfunded loan commitment. At period end, the total principal amount and market value of unfunded commitments totaled $160 and $161, respectively. |
| (i) | Level 3 security |
| (j) | Security is perpetual in nature with no stated maturity date. |
| (k) | Affiliated fund that is generally available only to investment companies and other accounts managed by Fidelity Investments. The rate quoted is the annualized seven-day yield of the fund at period end. A complete unaudited listing of the fund's holdings as of its most recent quarter end is available upon request. In addition, each Fidelity Central Fund's financial statements, which are not covered by the Fund's Report of Independent Registered Public Accounting Firm, are available on the SEC's website or upon request. |
| Affiliate | Value, beginning of period ($) | Purchases ($) | Sales Proceeds ($) | Dividend Income ($) | Realized Gain (loss) ($) | Change in Unrealized appreciation (depreciation) ($) | Value, end of period ($) | % ownership, end of period |
| Fidelity Cash Central Fund 5.43% | - | 5,214,836 | 4,101,691 | 53,071 | - | - | 1,113,145 | 0.0% |
| Total | - | 5,214,836 | 4,101,691 | 53,071 | - | - | 1,113,145 | |
| Valuation Inputs at Reporting Date: | ||||
| Description | Total ($) | Level 1 ($) | Level 2 ($) | Level 3 ($) |
Investments in Securities: | ||||
| Corporate Bonds | 5,867,383 | - | 5,867,383 | - |
| U.S. Government and Government Agency Obligations | 5,880,360 | - | 5,880,360 | - |
| Asset-Backed Securities | 108,738 | - | 108,738 | - |
| Commercial Mortgage Securities | 171,632 | - | 171,632 | - |
| Foreign Government and Government Agency Obligations | 835,363 | - | 835,363 | - |
| Bank Loan Obligations | 118,440 | - | 110,024 | 8,416 |
| Preferred Securities | 204,573 | - | 204,573 | - |
| Money Market Funds | 1,113,145 | 1,113,145 | - | - |
| Total Investments in Securities: | 14,299,634 | 1,113,145 | 13,178,073 | 8,416 |
Derivative Instruments: | ||||
| Assets | ||||
Futures Contracts | 2,771 | 2,771 | - | - |
Forward Foreign Currency Contracts | 16,614 | - | 16,614 | - |
| Total Assets | 19,385 | 2,771 | 16,614 | - |
| Liabilities | ||||
Futures Contracts | (2,421) | (2,421) | - | - |
Forward Foreign Currency Contracts | (149) | - | (149) | - |
| Total Liabilities | (2,570) | (2,421) | (149) | - |
| Total Derivative Instruments: | 16,815 | 350 | 16,465 | - |
Primary Risk Exposure / Derivative Type | Value | |
| Asset ($) | Liability ($) | |
| Foreign Exchange Risk | ||
Forward Foreign Currency Contracts (a) | 16,614 | (149) |
| Total Foreign Exchange Risk | 16,614 | (149) |
| Interest Rate Risk | ||
Futures Contracts (b) | 2,771 | (2,421) |
| Total Interest Rate Risk | 2,771 | (2,421) |
| Total Value of Derivatives | 19,385 | (2,570) |
| Statement of Assets and Liabilities | ||||
| August 31, 2023 | ||||
| Assets | ||||
| Investment in securities, at value - See accompanying schedule: | ||||
Unaffiliated issuers (cost $13,663,554) | $ | 13,186,489 | ||
Fidelity Central Funds (cost $1,113,145) | 1,113,145 | |||
| Total Investment in Securities (cost $14,776,699) | $ | 14,299,634 | ||
| Segregated cash with brokers for derivative instruments | 12,847 | |||
| Cash | 8,189 | |||
| Foreign currency held at value (cost $55,369) | 54,853 | |||
| Receivable for investments sold | 36,894 | |||
| Unrealized appreciation on forward foreign currency contracts | 16,614 | |||
| Interest receivable | 140,140 | |||
| Distributions receivable from Fidelity Central Funds | 5,234 | |||
Total assets | 14,574,405 | |||
| Liabilities | ||||
| Payable for investments purchased | $ | 38,706 | ||
| Unrealized depreciation on forward foreign currency contracts | 149 | |||
| Distributions payable | 58,500 | |||
| Accrued management fee | 6,611 | |||
| Payable for daily variation margin on futures contracts | 1,487 | |||
| Other payables and accrued expenses | 128 | |||
| Total Liabilities | 105,581 | |||
| Net Assets | $ | 14,468,824 | ||
| Net Assets consist of: | ||||
| Paid in capital | $ | 15,043,762 | ||
| Total accumulated earnings (loss) | (574,938) | |||
| Net Assets | $ | 14,468,824 | ||
Net Asset Value, offering price and redemption price per share ($14,468,824 ÷ 300,000 shares) | $ | 48.23 | ||
| Statement of Operations | ||||
| For the period January 24, 2023 (commencement of operations) through August 31, 2023 | ||||
| Investment Income | ||||
| Dividends | $ | 4,778 | ||
| Interest | 401,518 | |||
| Income from Fidelity Central Funds | 53,071 | |||
| Total Income | 459,367 | |||
| Expenses | ||||
| Management fee | $ | 49,264 | ||
| Independent trustees' fees and expenses | 25 | |||
| Total expenses before reductions | 49,289 | |||
| Expense reductions | (1,700) | |||
| Total expenses after reductions | 47,589 | |||
| Net Investment income (loss) | 411,778 | |||
| Realized and Unrealized Gain (Loss) | ||||
| Net realized gain (loss) on: | ||||
| Investment Securities: | ||||
| Unaffiliated issuers | (99,843) | |||
| Forward foreign currency contracts | (15,379) | |||
| Foreign currency transactions | 5,574 | |||
| Futures contracts | (8,007) | |||
| Total net realized gain (loss) | (117,655) | |||
| Change in net unrealized appreciation (depreciation) on: | ||||
| Investment Securities: | ||||
| Unaffiliated issuers | (477,065) | |||
| Forward foreign currency contracts | 16,465 | |||
| Assets and liabilities in foreign currencies | (511) | |||
| Futures contracts | 350 | |||
| Total change in net unrealized appreciation (depreciation) | (460,761) | |||
| Net gain (loss) | (578,416) | |||
| Net increase (decrease) in net assets resulting from operations | $ | (166,638) | ||
| Statement of Changes in Net Assets | ||
| For the period January 24, 2023 (commencement of operations) through August 31, 2023 | ||
| Increase (Decrease) in Net Assets | ||
| Operations | ||
| Net investment income (loss) | $ | 411,778 |
| Net realized gain (loss) | (117,655) | |
| Change in net unrealized appreciation (depreciation) | (460,761) | |
| Net increase (decrease) in net assets resulting from operations | (166,638) | |
| Distributions to shareholders | (408,300) | |
| Share transactions | ||
| Proceeds from sales of shares | 15,043,762 | |
Net increase (decrease) in net assets resulting from share transactions | 15,043,762 | |
| Total increase (decrease) in net assets | 14,468,824 | |
| Net Assets | ||
| Beginning of period | - | |
| End of period | $ | 14,468,824 |
| Other Information | ||
| Shares | ||
| Sold | 300,000 | |
| Net increase (decrease) | 300,000 | |
| Fidelity® Tactical Bond ETF |
| Years ended August 31, | 2023 A | |
Selected Per-Share Data | ||
| Net asset value, beginning of period | $ | 50.00 |
| Income from Investment Operations | ||
Net investment income (loss) B,C | 1.373 | |
| Net realized and unrealized gain (loss) | (1.782) | |
| Total from investment operations | (.409) | |
| Distributions from net investment income | (1.361) | |
| Total distributions | (1.361) | |
| Net asset value, end of period | $ | 48.23 |
Total Return D,E,F | (.82)% | |
Ratios to Average Net Assets C,G,H | ||
| Expenses before reductions | .55% I | |
| Expenses net of fee waivers, if any | .55% I | |
| Expenses net of all reductions | .54% I | |
| Net investment income (loss) | 4.64% I | |
| Supplemental Data | ||
| Net assets, end of period (000 omitted) | $ | 14,469 |
Portfolio turnover rate J | 46% I |
| Average Annual Total Returns | |||
Periods ended August 31, 2023 | Past 1 year | Past 5 years | Life of Fund |
Fidelity® Total Bond ETF - NAV A | 0.20% | 1.44% | 1.80% |
Fidelity® Total Bond ETF - Market Price B | 0.49% | 1.44% | 1.75% |
Bloomberg U.S. Aggregate Bond Index A | -1.19% | 0.49% | 1.06% |
Bloomberg U.S. Universal Bond Index A | -0.39% | 0.74% | 1.33% |
| $10,000 Over Life of Fund |
Let's say hypothetically that $10,000 was invested in Fidelity® Total Bond ETF - NAV, on October 6, 2014, when the fund started. The chart shows how the value of your investment would have changed, and also shows how the Bloomberg U.S. Aggregate Bond Index performed over the same period. |
 |
Quality Diversification (% of Fund's net assets) |
 |
Short-Term Investments and Net Other Assets (Liabilities) - (2.7)%* |
Percentages shown as 0.0% may reflect amounts less than 0.05%. |
| We have used ratings from Moody's Investors Service, Inc. Where Moody's® ratings are not available, we have used S&P® ratings. All ratings are as of the date indicated and do not reflect subsequent changes. |
Asset Allocation (% of Fund's net assets) |
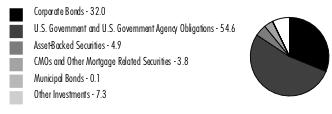 |
Short-Term Investments and Net Other Assets (Liabilities) - (2.7)% |
Futures and Swaps - 2.7% |
Forward foreign currency contracts - (1.1)% |
Percentages in the above tables are adjusted for the effect of TBA Sale Commitments. |
Geographic Diversification (% of Fund's net assets) |
 |
* Includes Short-Term investments and Net Other Assets (Liabilities). Percentages are adjusted for the effect of derivatives, if applicable. |
| Corporate Bonds - 32.0% | |||
Principal Amount (a) | Value ($) | ||
| Convertible Bonds - 0.1% | |||
| COMMUNICATION SERVICES - 0.1% | |||
| Media - 0.1% | |||
| DISH Network Corp.: | |||
| 2.375% 3/15/24 | 400,000 | 378,000 | |
| 3.375% 8/15/26 | 2,828,000 | 1,710,940 | |
| 2,088,940 | |||
| REAL ESTATE - 0.0% | |||
| Real Estate Management & Development - 0.0% | |||
| Redfin Corp. 0.5% 4/1/27 | 623,000 | 395,605 | |
| TOTAL CONVERTIBLE BONDS | 2,484,545 | ||
| Nonconvertible Bonds - 31.9% | |||
| COMMUNICATION SERVICES - 3.0% | |||
| Diversified Telecommunication Services - 0.7% | |||
| Altice France SA: | |||
| 5.125% 1/15/29(b) | 515,000 | 366,925 | |
| 5.125% 7/15/29(b) | 855,000 | 604,383 | |
| 5.5% 1/15/28(b) | 1,840,000 | 1,378,887 | |
| 5.5% 10/15/29(b) | 500,000 | 359,759 | |
| AT&T, Inc.: | |||
| 2.55% 12/1/33 | 4,162,000 | 3,175,715 | |
| 3.8% 12/1/57 | 3,772,000 | 2,543,837 | |
| 4.3% 2/15/30 | 315,000 | 293,695 | |
| 4.5% 3/9/48 | 10,000 | 7,982 | |
| 5.15% 11/15/46 | 500,000 | 439,318 | |
| C&W Senior Financing Designated Activity Co. 6.875% 9/15/27 (b) | 453,000 | 416,760 | |
| Cablevision Lightpath LLC: | |||
| 3.875% 9/15/27(b) | 85,000 | 70,964 | |
| 5.625% 9/15/28(b) | 70,000 | 53,769 | |
| Cogent Communications Group, Inc. 7% 6/15/27 (b) | 505,000 | 490,204 | |
| Frontier Communications Holdings LLC: | |||
| 5% 5/1/28(b) | 770,000 | 659,777 | |
| 5.875% 10/15/27(b) | 580,000 | 528,265 | |
| 6.75% 5/1/29(b) | 890,000 | 690,698 | |
| 8.75% 5/15/30(b) | 235,000 | 228,404 | |
| IHS Holding Ltd. 5.625% 11/29/26 (b) | 210,000 | 180,487 | |
| Level 3 Financing, Inc.: | |||
| 3.625% 1/15/29(b) | 65,000 | 38,708 | |
| 4.25% 7/1/28(b) | 390,000 | 255,706 | |
| 4.625% 9/15/27(b) | 1,000,000 | 752,035 | |
| 10.5% 5/15/30(b) | 614,000 | 623,695 | |
| Liquid Telecommunications Financing PLC 5.5% 9/4/26 (b) | 300,000 | 187,248 | |
| Northwest Fiber LLC/Northwest Fiber Finance Sub, Inc. 10.75% 6/1/28 (b) | 1,080,000 | 1,000,926 | |
| Qtel International Finance Ltd. 2.625% 4/8/31 (b) | 300,000 | 254,439 | |
| Sable International Finance Ltd. 5.75% 9/7/27 (b) | 1,300,000 | 1,203,137 | |
| Telecom Italia Capital SA 6% 9/30/34 | 693,000 | 575,300 | |
| Telecom Italia SpA 5.303% 5/30/24 (b) | 210,000 | 207,273 | |
| Telefonica Celular del Paraguay SA 5.875% 4/15/27 (b) | 235,000 | 219,514 | |
| Telefonica Emisiones S.A.U. 5.375% 2/2/26 | GBP | 335,000 | 418,810 |
| Telenet Finance Luxembourg Notes SARL 5.5% 3/1/28 (b) | 200,000 | 182,600 | |
| Verizon Communications, Inc.: | |||
| 2.1% 3/22/28 | 1,241,000 | 1,084,499 | |
| 2.55% 3/21/31 | 14,065,000 | 11,578,127 | |
| 2.987% 10/30/56 | 1,624,000 | 970,449 | |
| 3% 3/22/27 | 221,000 | 205,422 | |
| 4.862% 8/21/46 | 875,000 | 770,028 | |
| 5.012% 4/15/49 | 38,000 | 34,081 | |
| Virgin Media Finance PLC 5% 7/15/30 (b) | 405,000 | 328,580 | |
| Windstream Escrow LLC 7.75% 8/15/28 (b) | 1,860,000 | 1,507,925 | |
| Zayo Group Holdings, Inc.: | |||
| 4% 3/1/27(b) | 205,000 | 153,635 | |
| 6.125% 3/1/28(b) | 275,000 | 178,750 | |
| 35,220,716 | |||
| Entertainment - 0.1% | |||
| Allen Media LLC 10.5% 2/15/28 (b) | 400,000 | 229,000 | |
| Roblox Corp. 3.875% 5/1/30 (b) | 1,027,000 | 847,279 | |
| The Walt Disney Co.: | |||
| 3.8% 3/22/30 | 1,824,000 | 1,707,999 | |
| 4.7% 3/23/50 | 1,346,000 | 1,228,714 | |
| Universal Music Group NV 4% 6/13/31 (Reg. S) | EUR | 200,000 | 215,872 |
| 4,228,864 | |||
| Interactive Media & Services - 0.0% | |||
| Baidu, Inc. 1.72% 4/9/26 | 375,000 | 339,278 | |
| Tencent Holdings Ltd. 1.81% 1/26/26 (b) | 250,000 | 229,680 | |
| 568,958 | |||
| Media - 1.7% | |||
| Advantage Sales & Marketing, Inc. 6.5% 11/15/28 (b) | 639,000 | 557,055 | |
| Altice Financing SA: | |||
| 5% 1/15/28(b) | 2,600,000 | 2,114,085 | |
| 5.75% 8/15/29(b) | 880,000 | 697,107 | |
| Altice France Holding SA 6% 2/15/28 (b) | 975,000 | 426,563 | |
| Cable Onda SA 4.5% 1/30/30 (b) | 340,000 | 287,932 | |
| Cable One, Inc. 4% 11/15/30 (b) | 200,000 | 155,994 | |
| CCO Holdings LLC/CCO Holdings Capital Corp.: | |||
| 4.5% 5/1/32 | 460,000 | 372,920 | |
| 4.75% 3/1/30(b) | 3,439,000 | 2,956,827 | |
| 5% 2/1/28(b) | 1,000,000 | 921,496 | |
| 5.125% 5/1/27(b) | 370,000 | 347,833 | |
| 5.375% 6/1/29(b) | 2,064,000 | 1,878,547 | |
| 5.5% 5/1/26(b) | 100,000 | 97,667 | |
| Charter Communications Operating LLC/Charter Communications Operating Capital Corp.: | |||
| 2.25% 1/15/29 | 6,000,000 | 4,984,277 | |
| 4.4% 4/1/33 | 14,790,000 | 13,022,624 | |
| 5.25% 4/1/53 | 7,305,000 | 5,782,358 | |
| 5.375% 5/1/47 | 3,681,000 | 2,941,391 | |
| 5.5% 4/1/63 | 2,636,000 | 2,070,826 | |
| 5.75% 4/1/48 | 1,936,000 | 1,631,048 | |
| 6.484% 10/23/45 | 197,000 | 181,230 | |
| Clear Channel Outdoor Holdings, Inc.: | |||
| 5.125% 8/15/27(b) | 1,115,000 | 998,641 | |
| 7.5% 6/1/29(b) | 280,000 | 208,681 | |
| Comcast Corp.: | |||
| 3.9% 3/1/38 | 71,000 | 60,574 | |
| 4.65% 7/15/42 | 162,000 | 144,652 | |
| CSC Holdings LLC: | |||
| 4.125% 12/1/30(b) | 325,000 | 231,749 | |
| 5.375% 2/1/28(b) | 1,295,000 | 1,061,599 | |
| 5.5% 4/15/27(b) | 600,000 | 518,028 | |
| Discovery Communications LLC: | |||
| 3.625% 5/15/30 | 5,565,000 | 4,887,629 | |
| 4.65% 5/15/50 | 1,770,000 | 1,319,316 | |
| DISH DBS Corp. 5.75% 12/1/28 (b) | 549,000 | 426,172 | |
| DISH Network Corp. 11.75% 11/15/27 (b) | 3,342,000 | 3,390,930 | |
| Fox Corp.: | |||
| 4.03% 1/25/24 | 101,000 | 100,200 | |
| 4.709% 1/25/29 | 145,000 | 139,879 | |
| 5.476% 1/25/39 | 143,000 | 129,779 | |
| 5.576% 1/25/49 | 95,000 | 84,855 | |
| Lagardere S.C.A. 2.125% 10/16/26 (Reg. S) | EUR | 300,000 | 319,423 |
| LCPR Senior Secured Financing DAC 5.125% 7/15/29 (b) | 200,000 | 168,600 | |
| Magallanes, Inc.: | |||
| 3.755% 3/15/27 | 1,175,000 | 1,102,053 | |
| 4.054% 3/15/29 | 407,000 | 374,276 | |
| 4.279% 3/15/32 | 12,493,000 | 11,024,317 | |
| 5.05% 3/15/42 | 847,000 | 696,261 | |
| 5.141% 3/15/52 | 6,181,000 | 4,926,934 | |
| Radiate Holdco LLC/Radiate Financial Service Ltd.: | |||
| 4.5% 9/15/26(b) | 1,180,000 | 919,671 | |
| 6.5% 9/15/28(b) | 265,000 | 143,110 | |
| Sirius XM Radio, Inc.: | |||
| 3.875% 9/1/31(b) | 2,100,000 | 1,634,451 | |
| 4.125% 7/1/30(b) | 635,000 | 517,671 | |
| TEGNA, Inc. 4.75% 3/15/26 (b) | 600,000 | 571,698 | |
| Time Warner Cable LLC: | |||
| 5.5% 9/1/41 | 16,000 | 13,145 | |
| 5.875% 11/15/40 | 1,356,000 | 1,179,838 | |
| 6.55% 5/1/37 | 157,000 | 149,179 | |
| 6.75% 6/15/39 | 674,000 | 651,983 | |
| 7.3% 7/1/38 | 211,000 | 213,753 | |
| Univision Communications, Inc.: | |||
| 4.5% 5/1/29(b) | 1,500,000 | 1,291,105 | |
| 6.625% 6/1/27(b) | 165,000 | 159,739 | |
| 8% 8/15/28(b) | 205,000 | 204,887 | |
| Virgin Media Secured Finance PLC 4.5% 8/15/30 (b) | 410,000 | 346,187 | |
| Ziggo Bond Co. BV 6% 1/15/27 (b) | 400,000 | 372,150 | |
| 82,110,895 | |||
| Wireless Telecommunication Services - 0.5% | |||
| AXIAN Telecom 7.375% 2/16/27 (b) | 200,000 | 181,250 | |
| CT Trust 5.125% 2/3/32 (b) | 350,000 | 287,000 | |
| Intelsat Jackson Holdings SA 6.5% 3/15/30 (b) | 1,365,000 | 1,251,585 | |
| Millicom International Cellular SA: | |||
| 4.5% 4/27/31(b) | 1,263,000 | 991,884 | |
| 6.25% 3/25/29(b) | 630,000 | 575,127 | |
| MTN (Mauritius) Investments Ltd. 4.755% 11/11/24 (b) | 225,000 | 218,340 | |
| Rogers Communications, Inc.: | |||
| 3.2% 3/15/27 | 1,271,000 | 1,174,939 | |
| 3.8% 3/15/32 | 1,109,000 | 948,499 | |
| Sprint Corp.: | |||
| 7.125% 6/15/24 | 200,000 | 201,586 | |
| 7.875% 9/15/23 | 519,000 | 519,223 | |
| T-Mobile U.S.A., Inc.: | |||
| 3.875% 4/15/30 | 14,705,000 | 13,421,624 | |
| 4.375% 4/15/40 | 207,000 | 177,894 | |
| 4.5% 4/15/50 | 407,000 | 336,189 | |
| Vodafone Group PLC 4.875% 10/3/78 (Reg. S) (c) | GBP | 385,000 | 456,060 |
| VTR Comunicaciones SpA 5.125% 1/15/28 (b) | 575,000 | 353,841 | |
| 21,095,041 | |||
TOTAL COMMUNICATION SERVICES | 143,224,474 | ||
| CONSUMER DISCRETIONARY - 1.3% | |||
| Automobile Components - 0.0% | |||
| Clarios Global LP / Clarios U.S. Finance Co. 6.75% 5/15/28 (b) | 255,000 | 254,327 | |
| Hertz Corp. 5% 12/1/29 (b) | 69,000 | 56,731 | |
| Macquarie AirFinance Holdings 8.375% 5/1/28 (b) | 295,000 | 301,201 | |
| Metalsa SA de CV 3.75% 5/4/31 (b) | 225,000 | 174,627 | |
| PECF USS Intermediate Holding III Corp. 8% 11/15/29 (b) | 240,000 | 153,063 | |
| Robert Bosch GmbH 4.375% 6/2/43 (Reg. S) | EUR | 100,000 | 108,649 |
| ZF Europe Finance BV 2% 2/23/26 (Reg. S) | EUR | 600,000 | 597,748 |
| ZF North America Capital, Inc. 6.875% 4/14/28 (b) | 365,000 | 363,823 | |
| 2,010,169 | |||
| Automobiles - 0.1% | |||
| Ford Motor Co. 3.25% 2/12/32 | 400,000 | 312,218 | |
| General Motors Financial Co., Inc.: | |||
| 2.25% 9/6/24 (Reg. S) | GBP | 350,000 | 425,847 |
| 4.35% 4/9/25 | 3,810,000 | 3,715,907 | |
| 5.15% 8/15/26 (Reg. S) | GBP | 110,000 | 135,442 |
| Rivian Holdco & Rivian LLC & Rivian Automotive LLC 6 month U.S. LIBOR + 5.620% 10.9311% 10/15/26 (b)(c)(d) | 1,563,000 | 1,557,832 | |
| 6,147,246 | |||
| Broadline Retail - 0.1% | |||
| Cmg Media Corp. 8.875% 12/15/27 (b) | 397,000 | 311,820 | |
| JD.com, Inc. 3.375% 1/14/30 | 255,000 | 224,099 | |
| John Lewis PLC 6.125% 1/21/25 | GBP | 1,335,000 | 1,646,916 |
| Marks & Spencer PLC 3.75% 5/19/26 (Reg. S) | GBP | 100,000 | 117,432 |
| Match Group Holdings II LLC: | |||
| 3.625% 10/1/31(b) | 921,000 | 750,808 | |
| 4.125% 8/1/30(b) | 85,000 | 72,898 | |
| Prosus NV: | |||
| 3.061% 7/13/31(b) | 140,000 | 106,095 | |
| 4.193% 1/19/32(b) | 400,000 | 325,250 | |
| 3,555,318 | |||
| Distributors - 0.0% | |||
| Inchcape PLC 6.5% 6/9/28 (Reg. S) | GBP | 300,000 | 379,201 |
| Windsor Holdings III, LLC 8.5% 6/15/30 (b) | 305,000 | 306,330 | |
| 685,531 | |||
| Diversified Consumer Services - 0.1% | |||
| GEMS MENASA Cayman Ltd. 7.125% 7/31/26 (b) | 1,670,000 | 1,618,614 | |
| Service Corp. International 5.125% 6/1/29 | 615,000 | 578,869 | |
| WASH Multifamily Acquisition, Inc. 5.75% 4/15/26 (b) | 995,000 | 922,757 | |
| 3,120,240 | |||
| Hotels, Restaurants & Leisure - 0.6% | |||
| 1011778 BC Unlimited Liability Co./New Red Finance, Inc.: | |||
| 4% 10/15/30(b) | 955,000 | 809,029 | |
| 4.375% 1/15/28(b) | 600,000 | 550,712 | |
| 5.75% 4/15/25(b) | 130,000 | 129,039 | |
| Aramark Services, Inc.: | |||
| 5% 4/1/25(b) | 275,000 | 271,640 | |
| 5% 2/1/28(b) | 1,496,000 | 1,395,642 | |
| Boyd Gaming Corp.: | |||
| 4.75% 12/1/27 | 380,000 | 355,756 | |
| 4.75% 6/15/31(b) | 400,000 | 352,314 | |
| Caesars Entertainment, Inc.: | |||
| 4.625% 10/15/29(b) | 600,000 | 525,200 | |
| 6.25% 7/1/25(b) | 595,000 | 590,381 | |
| 7% 2/15/30(b) | 120,000 | 120,459 | |
| 8.125% 7/1/27(b) | 1,190,000 | 1,208,245 | |
| Carnival Corp.: | |||
| 7% 8/15/29(b) | 150,000 | 152,196 | |
| 7.625% 3/1/26(b) | 1,955,000 | 1,949,064 | |
| 10.5% 6/1/30(b) | 1,530,000 | 1,629,649 | |
| Constellation Merger Sub, Inc. 8.5% 9/15/25 (b) | 75,000 | 62,625 | |
| Fertitta Entertainment LLC / Fertitta Entertainment Finance Co., Inc.: | |||
| 4.625% 1/15/29(b) | 400,000 | 346,028 | |
| 6.75% 1/15/30(b) | 820,000 | 677,136 | |
| Garden SpinCo Corp. 8.625% 7/20/30 (b) | 90,000 | 96,086 | |
| GENM Capital Labuan Ltd. 3.882% 4/19/31 (b) | 300,000 | 239,160 | |
| Golden Entertainment, Inc. 7.625% 4/15/26 (b) | 580,000 | 575,650 | |
| Hilton Domestic Operating Co., Inc.: | |||
| 3.625% 2/15/32(b) | 950,000 | 794,481 | |
| 4% 5/1/31(b) | 600,000 | 521,524 | |
| Life Time, Inc. 8% 4/15/26 (b) | 365,000 | 362,263 | |
| Lindblad Expeditions LLC 6.75% 2/15/27 (b) | 69,000 | 66,641 | |
| MajorDrive Holdings IV LLC 6.375% 6/1/29 (b) | 449,000 | 370,003 | |
| McDonald's Corp.: | |||
| 3.5% 7/1/27 | 269,000 | 255,325 | |
| 4.2% 4/1/50 | 1,792,000 | 1,487,876 | |
| Meituan: | |||
| 2.125% 10/28/25(b) | 400,000 | 367,584 | |
| 3.05% 10/28/30(b) | 200,000 | 157,514 | |
| Melco Resorts Finance Ltd.: | |||
| 5.375% 12/4/29(b) | 200,000 | 167,034 | |
| 5.75% 7/21/28(b) | 220,000 | 193,741 | |
| MGM Resorts International 4.75% 10/15/28 | 860,000 | 780,467 | |
| NagaCorp Ltd. 7.95% 7/6/24 (Reg. S) | 250,000 | 238,738 | |
| NCL Corp. Ltd. 8.375% 2/1/28 (b) | 420,000 | 432,907 | |
| NCL Finance Ltd. 6.125% 3/15/28 (b) | 1,300,000 | 1,172,080 | |
| Ontario Gaming GTA LP 8% 8/1/30 (b) | 15,000 | 15,162 | |
| Royal Caribbean Cruises Ltd.: | |||
| 5.375% 7/15/27(b) | 1,400,000 | 1,317,422 | |
| 5.5% 8/31/26(b) | 1,000,000 | 958,217 | |
| 7.25% 1/15/30(b) | 200,000 | 203,039 | |
| 11.5% 6/1/25(b) | 54,043 | 57,015 | |
| 11.625% 8/15/27(b) | 60,000 | 65,348 | |
| Scientific Games Corp. 7.5% 9/1/31 (b) | 215,000 | 218,003 | |
| Station Casinos LLC 4.5% 2/15/28 (b) | 610,000 | 545,950 | |
| Viking Cruises Ltd.: | |||
| 6.25% 5/15/25(b) | 500,000 | 492,500 | |
| 9.125% 7/15/31(b) | 275,000 | 284,113 | |
| Whitbread PLC 2.375% 5/31/27 (Reg. S) | GBP | 100,000 | 108,298 |
| Wynn Las Vegas LLC/Wynn Las Vegas Capital Corp.: | |||
| 5.25% 5/15/27(b) | 340,000 | 321,817 | |
| 5.5% 3/1/25(b) | 300,000 | 296,365 | |
| Wynn Macau Ltd.: | |||
| 4.875% 10/1/24(b) | 325,000 | 315,942 | |
| 5.5% 10/1/27(b) | 100,000 | 89,794 | |
| Yum! Brands, Inc.: | |||
| 3.625% 3/15/31 | 400,000 | 339,210 | |
| 4.625% 1/31/32 | 1,030,000 | 921,599 | |
| 25,953,983 | |||
| Household Durables - 0.0% | |||
| Newell Brands, Inc. 5.875% 4/1/36 (e) | 460,000 | 408,863 | |
| Tempur Sealy International, Inc. 4% 4/15/29 (b) | 565,000 | 485,324 | |
| The Berkeley Group PLC 2.5% 8/11/31 (Reg. S) | GBP | 355,000 | 301,643 |
| 1,195,830 | |||
| Leisure Products - 0.0% | |||
| Mattel, Inc.: | |||
| 5.45% 11/1/41 | 980,000 | 843,578 | |
| 5.875% 12/15/27(b) | 15,000 | 14,712 | |
| 6.2% 10/1/40 | 380,000 | 355,189 | |
| 1,213,479 | |||
| Specialty Retail - 0.4% | |||
| AutoNation, Inc. 4.75% 6/1/30 | 127,000 | 118,284 | |
| AutoZone, Inc. 4% 4/15/30 | 4,155,000 | 3,844,616 | |
| Bath & Body Works, Inc. 6.625% 10/1/30 (b) | 1,000,000 | 975,322 | |
| Carvana Co.: | |||
| 4.875% 9/1/29(b) | 875,000 | 522,204 | |
| 5.875% 10/1/28(b) | 650,000 | 399,750 | |
| LBM Acquisition LLC 6.25% 1/15/29 (b) | 1,670,000 | 1,457,211 | |
| LCM Investments Holdings 8.25% 8/1/31 (b) | 135,000 | 135,086 | |
| Lowe's Companies, Inc.: | |||
| 3.35% 4/1/27 | 191,000 | 179,747 | |
| 3.75% 4/1/32 | 4,696,000 | 4,207,482 | |
| 4.25% 4/1/52 | 2,401,000 | 1,899,403 | |
| 4.45% 4/1/62 | 2,460,000 | 1,918,515 | |
| 4.5% 4/15/30 | 176,000 | 169,588 | |
| Michaels Companies, Inc. 7.875% 5/1/29 (b) | 500,000 | 346,600 | |
| O'Reilly Automotive, Inc. 4.2% 4/1/30 | 188,000 | 176,278 | |
| Sally Holdings LLC 5.625% 12/1/25 | 15,000 | 14,899 | |
| TJX Companies, Inc. 3.875% 4/15/30 | 4,000 | 3,773 | |
| Valvoline, Inc.: | |||
| 3.625% 6/15/31(b) | 700,000 | 558,817 | |
| 4.25% 2/15/30(b) | 85,000 | 83,549 | |
| VIA Outlets 1.75% 11/15/28 (Reg. S) | EUR | 290,000 | 264,925 |
| Victoria's Secret & Co. 4.625% 7/15/29 (b) | 247,000 | 178,836 | |
| 17,454,885 | |||
| Textiles, Apparel & Luxury Goods - 0.0% | |||
| Crocs, Inc. 4.125% 8/15/31 (b) | 600,000 | 475,500 | |
| Kering SA 3.875% 9/5/35 (Reg. S) | EUR | 200,000 | 216,540 |
| The William Carter Co. 5.625% 3/15/27 (b) | 105,000 | 101,791 | |
| Wolverine World Wide, Inc. 4% 8/15/29 (b) | 400,000 | 299,604 | |
| 1,093,435 | |||
TOTAL CONSUMER DISCRETIONARY | 62,430,116 | ||
| CONSUMER STAPLES - 1.6% | |||
| Beverages - 0.6% | |||
| Anheuser-Busch InBev Finance, Inc. 4.9% 2/1/46 | 11,174,000 | 10,394,602 | |
| Anheuser-Busch InBev SA NV 9.75% 7/30/24 | GBP | 75,000 | 98,242 |
| Anheuser-Busch InBev Worldwide, Inc.: | |||
| 4.35% 6/1/40 | 624,000 | 558,234 | |
| 4.5% 6/1/50 | 6,964,000 | 6,214,447 | |
| 4.6% 6/1/60 | 670,000 | 584,187 | |
| 4.75% 4/15/58 | 350,000 | 313,294 | |
| 5.45% 1/23/39 | 377,000 | 382,699 | |
| 5.55% 1/23/49 | 2,806,000 | 2,874,205 | |
| 5.8% 1/23/59 (Reg. S) | 1,068,000 | 1,119,897 | |
| Central American Bottling Corp. 5.25% 4/27/29 (b) | 200,000 | 182,000 | |
| Molson Coors Beverage Co. 3% 7/15/26 | 4,389,000 | 4,112,479 | |
| The Coca-Cola Co.: | |||
| 3.375% 3/25/27 | 1,134,000 | 1,086,449 | |
| 3.45% 3/25/30 | 562,000 | 522,677 | |
| Triton Water Holdings, Inc. 6.25% 4/1/29 (b) | 1,311,000 | 1,114,421 | |
| 29,557,833 | |||
| Consumer Staples Distribution & Retail - 0.2% | |||
| Albertsons Companies LLC/Safeway, Inc./New Albertson's, Inc./Albertson's LLC: | |||
| 4.875% 2/15/30(b) | 1,200,000 | 1,101,011 | |
| 6.5% 2/15/28(b) | 445,000 | 442,944 | |
| Dollar Tree, Inc. 4% 5/15/25 | 2,307,000 | 2,238,143 | |
| NBM U.S. Holdings, Inc. 6.625% 8/6/29 (b) | 210,000 | 195,812 | |
| Performance Food Group, Inc.: | |||
| 5.5% 10/15/27(b) | 740,000 | 712,552 | |
| 6.875% 5/1/25(b) | 415,000 | 415,614 | |
| Sysco Corp.: | |||
| 5.95% 4/1/30 | 948,000 | 981,811 | |
| 6.6% 4/1/50 | 530,000 | 584,361 | |
| Tesco Corporate Treasury Services PLC 5.5% 2/27/35 (Reg. S) | GBP | 550,000 | 649,587 |
| U.S. Foods, Inc.: | |||
| 4.75% 2/15/29(b) | 1,400,000 | 1,277,810 | |
| 6.25% 4/15/25(b) | 270,000 | 270,707 | |
| 8,870,352 | |||
| Food Products - 0.5% | |||
| Adecoagro SA 6% 9/21/27 (b) | 180,000 | 170,183 | |
| Camposol SA 6% 2/3/27 (b) | 150,000 | 103,260 | |
| Darling Ingredients, Inc.: | |||
| 5.25% 4/15/27(b) | 381,000 | 370,456 | |
| 6% 6/15/30(b) | 130,000 | 127,054 | |
| JBS U.S.A. Food Co. 3.625% 1/15/32 (b) | 80,000 | 65,655 | |
| JBS U.S.A. Lux SA / JBS Food Co.: | |||
| 2.5% 1/15/27 | 2,610,000 | 2,346,116 | |
| 3% 5/15/32 | 2,405,000 | 1,899,213 | |
| 5.125% 2/1/28 | 910,000 | 884,415 | |
| 5.5% 1/15/30 | 9,432,000 | 9,132,482 | |
| 5.75% 4/1/33 | 4,103,000 | 3,904,966 | |
| 5.75% 4/1/33(b) | 24,000 | 22,842 | |
| Lamb Weston Holdings, Inc. 4.375% 1/31/32 (b) | 960,000 | 833,208 | |
| MARB BondCo PLC 3.95% 1/29/31 (b) | 125,000 | 97,031 | |
| Pilgrim's Pride Corp. 4.25% 4/15/31 | 640,000 | 553,675 | |
| Post Holdings, Inc.: | |||
| 4.5% 9/15/31(b) | 51,000 | 43,936 | |
| 4.625% 4/15/30(b) | 180,000 | 159,477 | |
| 5.5% 12/15/29(b) | 635,000 | 587,409 | |
| 5.625% 1/15/28(b) | 130,000 | 124,655 | |
| 5.75% 3/1/27(b) | 196,000 | 191,551 | |
| TreeHouse Foods, Inc. 4% 9/1/28 | 670,000 | 573,473 | |
| 22,191,057 | |||
| Personal Care Products - 0.0% | |||
| BellRing Brands, Inc. 7% 3/15/30 (b) | 220,000 | 220,092 | |
| Natura Cosmeticos SA 4.125% 5/3/28 (b) | 60,000 | 52,167 | |
| 272,259 | |||
| Tobacco - 0.3% | |||
| Altria Group, Inc.: | |||
| 3.875% 9/16/46 | 703,000 | 484,082 | |
| 4.25% 8/9/42 | 448,000 | 339,366 | |
| 4.5% 5/2/43 | 289,000 | 225,224 | |
| 4.8% 2/14/29 | 86,000 | 83,328 | |
| 5.375% 1/31/44 | 532,000 | 493,976 | |
| 5.95% 2/14/49 | 300,000 | 279,334 | |
| BAT Capital Corp.: | |||
| 4.7% 4/2/27 | 3,039,000 | 2,947,367 | |
| 4.906% 4/2/30 | 5,220,000 | 4,915,905 | |
| 5.282% 4/2/50 | 1,336,000 | 1,070,394 | |
| Imperial Tobacco Finance PLC: | |||
| 4.25% 7/21/25(b) | 450,000 | 435,173 | |
| 6.125% 7/27/27(b) | 3,927,000 | 3,969,990 | |
| 8.125% 3/15/24 | GBP | 335,000 | 428,299 |
| Reynolds American, Inc.: | |||
| 4.45% 6/12/25 | 33,000 | 32,285 | |
| 4.85% 9/15/23 | 220,000 | 219,925 | |
| 5.7% 8/15/35 | 28,000 | 25,898 | |
| 5.85% 8/15/45 | 180,000 | 156,360 | |
| 16,106,906 | |||
TOTAL CONSUMER STAPLES | 76,998,407 | ||
| ENERGY - 4.2% | |||
| Energy Equipment & Services - 0.1% | |||
| CGG SA 8.75% 4/1/27 (b) | 540,000 | 464,720 | |
| Guara Norte SARL 5.198% 6/15/34 (b) | 176,852 | 154,746 | |
| Halliburton Co.: | |||
| 3.8% 11/15/25 | 2,000 | 1,950 | |
| 4.85% 11/15/35 | 55,000 | 51,567 | |
| Jonah Energy Parent LLC 12% 11/5/25 (f)(g) | 59,607 | 60,799 | |
| Seadrill Finance Ltd. 8.375% 8/1/30 (b) | 125,000 | 128,125 | |
| Southern Gas Corridor CJSC 6.875% 3/24/26 (b) | 580,000 | 585,098 | |
| Technip Energies NV 1.125% 5/28/28 | EUR | 270,000 | 254,036 |
| The Oil and Gas Holding Co. 7.5% 10/25/27 (b) | 200,000 | 202,920 | |
| Transocean Poseidon Ltd. 6.875% 2/1/27 (b) | 675,000 | 670,815 | |
| Transocean, Inc.: | |||
| 8% 2/1/27(b) | 600,000 | 585,312 | |
| 8.75% 2/15/30(b) | 266,000 | 272,122 | |
| Valaris Ltd. 8.375% 4/30/30 (b) | 425,000 | 432,884 | |
| 3,865,094 | |||
| Oil, Gas & Consumable Fuels - 4.1% | |||
| Calumet Specialty Products Partners LP/Calumet Finance Corp. 9.75% 7/15/28 (b) | 190,000 | 188,867 | |
| Canadian Natural Resources Ltd.: | |||
| 2.05% 7/15/25 | 5,600,000 | 5,246,184 | |
| 3.85% 6/1/27 | 2,800,000 | 2,648,877 | |
| 5.85% 2/1/35 | 1,246,000 | 1,210,955 | |
| Cenovus Energy, Inc.: | |||
| 2.65% 1/15/32 | 634,000 | 510,337 | |
| 3.75% 2/15/52 | 210,000 | 147,379 | |
| 5.25% 6/15/37 | 3,423,000 | 3,121,044 | |
| 5.4% 6/15/47 | 282,000 | 253,490 | |
| 6.75% 11/15/39 | 895,000 | 927,977 | |
| Centennial Resource Production LLC 5.875% 7/1/29 (b) | 563,000 | 540,480 | |
| Citgo Petroleum Corp. 6.375% 6/15/26 (b) | 600,000 | 585,936 | |
| CNX Resources Corp. 6% 1/15/29 (b) | 95,000 | 90,475 | |
| Columbia Pipelines Operating Co. LLC: | |||
| 5.927% 8/15/30(b) | 525,000 | 529,587 | |
| 6.036% 11/15/33(b) | 1,415,000 | 1,429,504 | |
| 6.497% 8/15/43(b) | 423,000 | 428,750 | |
| 6.544% 11/15/53(b) | 762,000 | 778,920 | |
| 6.714% 8/15/63(b) | 456,000 | 466,125 | |
| Comstock Resources, Inc. 6.75% 3/1/29 (b) | 800,000 | 748,542 | |
| Continental Resources, Inc. 5.75% 1/15/31 (b) | 305,000 | 291,520 | |
| Crestwood Midstream Partners LP/Crestwood Midstream Finance Corp.: | |||
| 5.625% 5/1/27(b) | 2,332,000 | 2,262,040 | |
| 7.375% 2/1/31(b) | 225,000 | 231,786 | |
| CVR Energy, Inc.: | |||
| 5.25% 2/15/25(b) | 400,000 | 388,018 | |
| 5.75% 2/15/28(b) | 1,710,000 | 1,556,647 | |
| DCP Midstream Operating LP: | |||
| 5.125% 5/15/29 | 1,035,000 | 1,009,228 | |
| 5.375% 7/15/25 | 1,139,000 | 1,127,627 | |
| 5.625% 7/15/27 | 390,000 | 390,416 | |
| Delek Logistics Partners LP 7.125% 6/1/28 (b) | 865,000 | 804,087 | |
| Delek Overriding Royalty Levia 7.494% 12/30/23 (Reg. S) (b) | 320,000 | 317,600 | |
| Ecopetrol SA: | |||
| 4.625% 11/2/31 | 110,000 | 86,411 | |
| 8.875% 1/13/33 | 185,000 | 187,040 | |
| EG Global Finance PLC: | |||
| 6.75% 2/7/25(b) | 1,128,000 | 1,111,441 | |
| 8.5% 10/30/25(b) | 1,485,000 | 1,470,158 | |
| EIG Pearl Holdings SARL 3.545% 8/31/36 (b) | 465,000 | 385,815 | |
| Enbridge, Inc. 4% 10/1/23 | 283,000 | 282,522 | |
| Endeavor Energy Resources LP/EER Finance, Inc. 5.75% 1/30/28 (b) | 285,000 | 278,787 | |
| Energean Israel Finance Ltd. 4.875% 3/30/26 (Reg. S) (b) | 200,000 | 187,530 | |
| Energean PLC 6.5% 4/30/27 (b) | 300,000 | 273,630 | |
| Energy Transfer LP: | |||
| 3.75% 5/15/30 | 20,176,000 | 18,019,718 | |
| 4.2% 9/15/23 | 72,000 | 71,964 | |
| 4.95% 6/15/28 | 246,000 | 238,249 | |
| 5% 5/15/50 | 1,080,000 | 888,985 | |
| 5.25% 4/15/29 | 1,892,000 | 1,848,540 | |
| 5.4% 10/1/47 | 577,000 | 496,998 | |
| 5.8% 6/15/38 | 137,000 | 129,863 | |
| 6% 6/15/48 | 1,869,000 | 1,727,677 | |
| 6.25% 4/15/49 | 109,000 | 104,346 | |
| EnLink Midstream LLC: | |||
| 5.625% 1/15/28(b) | 600,000 | 580,422 | |
| 6.5% 9/1/30(b) | 585,000 | 586,495 | |
| Enterprise Products Operating LP 3.7% 2/15/26 | 5,310,000 | 5,120,915 | |
| EQM Midstream Partners LP: | |||
| 6.5% 7/1/27(b) | 195,000 | 193,766 | |
| 7.5% 6/1/27(b) | 425,000 | 428,959 | |
| EQT Corp. 5% 1/15/29 | 800,000 | 758,893 | |
| Exxon Mobil Corp. 3.482% 3/19/30 | 2,903,000 | 2,684,541 | |
| FEL Energy VI SARL 5.75% 12/1/40 (b) | 182,793 | 154,278 | |
| Galaxy Pipeline Assets BidCo Ltd.: | |||
| 2.16% 3/31/34(b) | 102,017 | 85,985 | |
| 2.625% 3/31/36(b) | 440,000 | 347,442 | |
| GeoPark Ltd. 5.5% 1/17/27 (b) | 200,000 | 170,800 | |
| Global Partners LP/GLP Finance Corp.: | |||
| 6.875% 1/15/29 | 720,000 | 680,400 | |
| 7% 8/1/27 | 422,000 | 415,670 | |
| Golar LNG Ltd. 7% 10/20/25 (b) | 405,000 | 398,484 | |
| Harvest Midstream I LP 7.5% 9/1/28 (b) | 610,000 | 611,337 | |
| Hess Corp.: | |||
| 5.6% 2/15/41 | 5,035,000 | 4,733,887 | |
| 5.8% 4/1/47 | 360,000 | 343,568 | |
| 7.125% 3/15/33 | 110,000 | 119,875 | |
| 7.3% 8/15/31 | 2,372,000 | 2,589,581 | |
| 7.875% 10/1/29 | 303,000 | 334,850 | |
| Hess Midstream Partners LP: | |||
| 5.125% 6/15/28(b) | 1,495,000 | 1,402,342 | |
| 5.625% 2/15/26(b) | 505,000 | 494,158 | |
| Holly Energy Partners LP/Holly Energy Finance Corp.: | |||
| 5% 2/1/28(b) | 600,000 | 562,840 | |
| 6.375% 4/15/27(b) | 180,000 | 179,058 | |
| Howard Midstream Energy Partners LLC 8.875% 7/15/28 (b) | 560,000 | 579,930 | |
| KazMunaiGaz National Co.: | |||
| 3.5% 4/14/33(b) | 185,000 | 138,900 | |
| 5.375% 4/24/30(b) | 85,000 | 77,302 | |
| Kinder Morgan Energy Partners LP: | |||
| 5.5% 3/1/44 | 287,000 | 256,034 | |
| 6.55% 9/15/40 | 13,000 | 12,916 | |
| Kinder Morgan, Inc.: | |||
| 5.05% 2/15/46 | 34,000 | 28,647 | |
| 5.55% 6/1/45 | 193,000 | 174,424 | |
| Kosmos Energy Ltd. 7.125% 4/4/26 (b) | 425,000 | 389,972 | |
| Leviathan Bond Ltd. 6.125% 6/30/25 (Reg. S) (b) | 250,000 | 244,170 | |
| MC Brazil Downstream Trading SARL 7.25% 6/30/31 (b) | 343,019 | 226,822 | |
| Medco Oak Tree Pte Ltd. 7.375% 5/14/26 (b) | 375,000 | 367,084 | |
| MEG Energy Corp. 7.125% 2/1/27 (b) | 910,000 | 921,480 | |
| Mesquite Energy, Inc. 7.25% (b)(g)(h) | 269,000 | 0 | |
| MPLX LP: | |||
| 4.8% 2/15/29 | 83,000 | 79,975 | |
| 4.875% 12/1/24 | 160,000 | 157,917 | |
| 4.95% 9/1/32 | 4,161,000 | 3,930,973 | |
| 5.5% 2/15/49 | 249,000 | 221,863 | |
| New Fortress Energy, Inc.: | |||
| 6.5% 9/30/26(b) | 6,791,000 | 6,312,388 | |
| 6.75% 9/15/25(b) | 197,000 | 190,397 | |
| NGL Energy Operating LLC/NGL Energy Finance Corp. 7.5% 2/1/26 (b) | 400,000 | 398,230 | |
| Northern Oil & Gas, Inc. 8.75% 6/15/31 (b) | 395,000 | 403,500 | |
| Occidental Petroleum Corp.: | |||
| 4.2% 3/15/48 | 210,000 | 154,175 | |
| 4.3% 8/15/39 | 105,000 | 80,194 | |
| 4.4% 4/15/46 | 410,000 | 314,601 | |
| 4.4% 8/15/49 | 255,000 | 181,711 | |
| 5.55% 3/15/26 | 1,088,000 | 1,078,839 | |
| 6.2% 3/15/40 | 250,000 | 246,930 | |
| 6.45% 9/15/36 | 858,000 | 877,335 | |
| 6.6% 3/15/46 | 216,000 | 222,301 | |
| 7.5% 5/1/31 | 12,471,000 | 13,512,347 | |
| 7.875% 9/15/31 | 65,000 | 71,992 | |
| Ovintiv, Inc.: | |||
| 5.15% 11/15/41 | 1,386,000 | 1,133,628 | |
| 6.625% 8/15/37 | 1,341,000 | 1,335,949 | |
| 7.375% 11/1/31 | 290,000 | 311,017 | |
| 8.125% 9/15/30 | 652,000 | 723,681 | |
| Parkland Corp.: | |||
| 4.5% 10/1/29(b) | 160,000 | 140,979 | |
| 4.625% 5/1/30(b) | 730,000 | 643,546 | |
| PBF Holding Co. LLC/PBF Finance Corp.: | |||
| 6% 2/15/28 | 300,000 | 283,773 | |
| 7.875% 9/15/30(b) | 715,000 | 711,461 | |
| Petroleos Mexicanos: | |||
| 4.5% 1/23/26 | 907,000 | 796,800 | |
| 5.95% 1/28/31 | 22,605,000 | 16,328,496 | |
| 6.35% 2/12/48 | 11,201,000 | 6,692,878 | |
| 6.49% 1/23/27 | 435,000 | 379,381 | |
| 6.5% 3/13/27 | 1,894,000 | 1,653,604 | |
| 6.625% 6/15/35 | 500,000 | 341,563 | |
| 6.7% 2/16/32 | 750,000 | 564,188 | |
| 6.75% 9/21/47 | 1,870,000 | 1,147,974 | |
| 6.84% 1/23/30 | 1,668,000 | 1,313,383 | |
| 6.95% 1/28/60 | 2,435,000 | 1,492,046 | |
| 7.69% 1/23/50 | 11,845,000 | 7,886,401 | |
| Petronas Capital Ltd. 3.404% 4/28/61 (b) | 155,000 | 104,189 | |
| Phillips 66 Co. 3.85% 4/9/25 | 98,000 | 95,356 | |
| Plains All American Pipeline LP/PAA Finance Corp.: | |||
| 3.55% 12/15/29 | 3,078,000 | 2,705,997 | |
| 3.6% 11/1/24 | 139,000 | 135,322 | |
| PT Adaro Indonesia 4.25% 10/31/24 (b) | 300,000 | 288,972 | |
| PT Pertamina Persero 4.175% 1/21/50 (b) | 75,000 | 56,786 | |
| Qatar Petroleum: | |||
| 1.375% 9/12/26(b) | 400,000 | 358,036 | |
| 2.25% 7/12/31(b) | 400,000 | 328,900 | |
| 3.125% 7/12/41(b) | 240,000 | 175,793 | |
| 3.3% 7/12/51(b) | 520,000 | 364,296 | |
| Range Resources Corp. 4.875% 5/15/25 | 400,000 | 391,000 | |
| Sabine Pass Liquefaction LLC 4.5% 5/15/30 | 1,431,000 | 1,346,647 | |
| Saudi Arabian Oil Co.: | |||
| 2.25% 11/24/30(b) | 745,000 | 611,302 | |
| 3.25% 11/24/50(b) | 145,000 | 95,816 | |
| 3.5% 4/16/29(b) | 455,000 | 415,929 | |
| 3.5% 11/24/70(b) | 95,000 | 59,606 | |
| 4.25% 4/16/39(b) | 615,000 | 521,920 | |
| 4.375% 4/16/49(b) | 45,000 | 36,637 | |
| SM Energy Co. 6.75% 9/15/26 | 600,000 | 597,480 | |
| Sunoco LP/Sunoco Finance Corp.: | |||
| 4.5% 5/15/29 | 490,000 | 443,131 | |
| 5.875% 3/15/28 | 610,000 | 592,494 | |
| 6% 4/15/27 | 10,000 | 9,895 | |
| Tallgrass Energy Partners LP / Tallgrass Energy Finance Corp. 6% 12/31/30 (b) | 5,490,000 | 4,911,322 | |
| Tengizchevroil Finance Co. International Ltd. 3.25% 8/15/30 (b) | 275,000 | 209,968 | |
| The Williams Companies, Inc.: | |||
| 3.5% 11/15/30 | 18,455,000 | 16,346,194 | |
| 3.9% 1/15/25 | 521,000 | 508,103 | |
| 4% 9/15/25 | 180,000 | 174,319 | |
| 4.5% 11/15/23 | 51,000 | 50,839 | |
| 4.65% 8/15/32 | 1,793,000 | 1,683,687 | |
| 5.3% 8/15/52 | 406,000 | 365,557 | |
| 5.4% 3/2/26 | 1,365,000 | 1,362,826 | |
| Transcontinental Gas Pipe Line Co. LLC: | |||
| 3.25% 5/15/30 | 167,000 | 147,193 | |
| 3.95% 5/15/50 | 542,000 | 404,880 | |
| Tullow Oil PLC 10.25% 5/15/26 (b) | 311,000 | 257,353 | |
| Venture Global Calcasieu Pass LLC: | |||
| 3.875% 11/1/33(b) | 400,000 | 324,996 | |
| 6.25% 1/15/30(b) | 1,960,000 | 1,909,355 | |
| Western Gas Partners LP: | |||
| 3.1% 2/1/25 | 255,000 | 244,202 | |
| 3.95% 6/1/25 | 70,000 | 67,548 | |
| 4.5% 3/1/28 | 300,000 | 282,303 | |
| 4.65% 7/1/26 | 156,000 | 150,876 | |
| 4.75% 8/15/28 | 80,000 | 75,732 | |
| 5.25% 2/1/50 | 50,000 | 40,466 | |
| 5.3% 3/1/48 | 150,000 | 122,951 | |
| 195,110,889 | |||
TOTAL ENERGY | 198,975,983 | ||
| FINANCIALS - 12.7% | |||
| Banks - 6.0% | |||
| Access Bank PLC 6.125% 9/21/26 (b) | 285,000 | 242,193 | |
| AIB Group PLC 2.25% 4/4/28 (Reg. S) (c) | EUR | 1,575,000 | 1,573,454 |
| Alpha Bank SA 4.25% 2/13/30 (Reg. S) (c) | EUR | 265,000 | 258,156 |
| Bank of America Corp.: | |||
| 2.299% 7/21/32(c) | 2,050,000 | 1,616,738 | |
| 2.3% 7/25/25 (Reg. S) | GBP | 355,000 | 419,542 |
| 3.419% 12/20/28(c) | 41,396,000 | 37,960,389 | |
| 3.95% 4/21/25 | 144,000 | 139,384 | |
| 4.2% 8/26/24 | 160,000 | 157,151 | |
| 4.25% 10/22/26 | 2,667,000 | 2,561,276 | |
| 5.015% 7/22/33(c) | 17,517,000 | 16,859,352 | |
| Bank of Ireland Group PLC: | |||
| 1.375% 8/11/31 (Reg. S)(c) | EUR | 950,000 | 914,964 |
| 2.029% 9/30/27(b)(c) | 955,000 | 840,228 | |
| Barclays PLC: | |||
| 2.279% 11/24/27(c) | 8,400,000 | 7,459,518 | |
| 2.645% 6/24/31(c) | 5,000,000 | 3,989,602 | |
| 2.852% 5/7/26(c) | 2,917,000 | 2,756,921 | |
| 4.375% 1/12/26 | 200,000 | 192,791 | |
| 5.262% 1/29/34 (Reg. S)(c) | EUR | 220,000 | 238,862 |
| 5.746% 8/9/33(c) | 870,000 | 833,654 | |
| 5.829% 5/9/27(c) | 3,190,000 | 3,160,751 | |
| 6.224% 5/9/34(c) | 2,720,000 | 2,686,271 | |
| 7.437% 11/2/33(c) | 200,000 | 214,053 | |
| 8.407% 11/14/32 (Reg. S)(c) | GBP | 200,000 | 256,182 |
| BNP Paribas SA: | |||
| 2.159% 9/15/29(b)(c) | 1,350,000 | 1,129,433 | |
| 2.219% 6/9/26(b)(c) | 4,250,000 | 3,970,512 | |
| 2.5% 3/31/32 (Reg. S)(c) | EUR | 300,000 | 292,944 |
| 4.125% 5/24/33 (Reg. S) | EUR | 400,000 | 435,594 |
| BPCE SA 1.5% 1/13/42 (Reg. S) (c) | EUR | 600,000 | 564,680 |
| Citigroup, Inc.: | |||
| 2.75% 1/24/24 | GBP | 280,000 | 350,354 |
| 3.352% 4/24/25(c) | 572,000 | 561,401 | |
| 3.875% 3/26/25 | 2,657,000 | 2,573,805 | |
| 4.3% 11/20/26 | 5,255,000 | 5,048,721 | |
| 4.4% 6/10/25 | 976,000 | 951,699 | |
| 4.412% 3/31/31(c) | 6,594,000 | 6,122,625 | |
| 4.45% 9/29/27 | 728,000 | 695,867 | |
| 4.658% 5/24/28(c) | 18,442,000 | 17,959,122 | |
| 4.91% 5/24/33(c) | 6,705,000 | 6,373,592 | |
| 5.875% 7/1/24 (Reg. S) | GBP | 425,000 | 535,151 |
| Commerzbank AG 8.625% 2/28/33 (Reg. S) (c) | GBP | 100,000 | 124,982 |
| Commonwealth Bank of Australia 3.61% 9/12/34 (b)(c) | 297,000 | 251,863 | |
| Credit Agricole SA: | |||
| UK Government Bonds 1 Year + 2.180% 6.375% 6/14/31 (Reg. S)(c)(d) | GBP | 400,000 | 506,623 |
| 1.25% 10/2/24 (Reg. S) | GBP | 500,000 | 601,950 |
| 4.875% 10/23/29 (Reg. S) | GBP | 100,000 | 119,487 |
| Danske Bank A/S: | |||
| 2.25% 1/14/28 (Reg. S)(c) | GBP | 620,000 | 677,217 |
| 4.625% 4/13/27 (Reg. S)(c) | GBP | 100,000 | 121,615 |
| 4.75% 6/21/30 (Reg. S)(c) | EUR | 700,000 | 766,487 |
| First Citizens Bank & Trust Co. 6.125% 3/9/28 | 174,000 | 174,788 | |
| HSBC Holdings PLC: | |||
| 4.856% 5/23/33 (Reg. S)(c) | EUR | 300,000 | 327,554 |
| 4.95% 3/31/30 | 227,000 | 218,403 | |
| 6.254% 3/9/34(c) | 500,000 | 505,439 | |
| 7.39% 11/3/28(c) | 200,000 | 210,125 | |
| 8.201% 11/16/34 (Reg. S)(c) | GBP | 400,000 | 521,370 |
| ING Groep NV 3% 2/18/26 (Reg. S) | GBP | 400,000 | 470,978 |
| Intesa Sanpaolo SpA: | |||
| 4.198% 6/1/32(b)(c) | 263,000 | 200,434 | |
| 5.017% 6/26/24(b) | 200,000 | 195,555 | |
| 5.71% 1/15/26(b) | 3,790,000 | 3,635,765 | |
| JPMorgan Chase & Co.: | |||
| 2.739% 10/15/30(c) | 2,883,000 | 2,471,445 | |
| 2.956% 5/13/31(c) | 701,000 | 595,864 | |
| 3.875% 9/10/24 | 190,000 | 186,281 | |
| 4.125% 12/15/26 | 145,000 | 139,548 | |
| 4.452% 12/5/29(c) | 29,957,000 | 28,556,889 | |
| 4.493% 3/24/31(c) | 12,651,000 | 11,991,973 | |
| 4.586% 4/26/33(c) | 5,144,000 | 4,810,396 | |
| 4.912% 7/25/33(c) | 8,706,000 | 8,372,924 | |
| 5.299% 7/24/29(c) | 4,000,000 | 3,977,151 | |
| 5.717% 9/14/33(c) | 6,900,000 | 6,896,059 | |
| Jyske Bank A/S 5% 10/26/28 (c) | EUR | 175,000 | 190,265 |
| Lloyds Bank Corporate Markets PLC 1.75% 7/11/24 (Reg. S) | GBP | 300,000 | 366,289 |
| Lloyds Banking Group PLC: | |||
| 1.985% 12/15/31(c) | GBP | 140,000 | 150,580 |
| 4.5% 1/11/29 (Reg. S)(c) | EUR | 100,000 | 108,208 |
| 4.976% 8/11/33(c) | 825,000 | 763,643 | |
| Magyar Export-Import Bank 6.125% 12/4/27 (b) | 200,000 | 198,562 | |
| NatWest Group PLC: | |||
| 2.105% 11/28/31 (Reg. S)(c) | GBP | 445,000 | 475,722 |
| 3.073% 5/22/28(c) | 775,000 | 698,775 | |
| 3.619% 3/29/29 (Reg. S)(c) | GBP | 495,000 | 552,533 |
| 4.771% 2/16/29 (Reg. S)(c) | EUR | 300,000 | 326,314 |
| 5.847% 3/2/27(c) | 5,629,000 | 5,595,582 | |
| 7.416% 6/6/33 (Reg. S)(c) | GBP | 100,000 | 124,797 |
| NatWest Markets PLC 0.125% 11/12/25 (Reg. S) | EUR | 165,000 | 164,144 |
| Nordea Bank Abp 4.125% 5/5/28 (Reg. S) | EUR | 500,000 | 542,687 |
| Rabobank Nederland 4% 1/10/30 (Reg. S) | EUR | 200,000 | 214,346 |
| Santander UK Group Holdings PLC 3.625% 1/14/26 (Reg. S) | GBP | 358,000 | 422,218 |
| Societe Generale: | |||
| 1.038% 6/18/25(b)(c) | 4,000,000 | 3,825,400 | |
| 1.488% 12/14/26(b)(c) | 11,855,000 | 10,623,079 | |
| 4.75% 11/24/25(b) | 200,000 | 192,421 | |
| 6.691% 1/10/34(b)(c) | 400,000 | 407,419 | |
| Synchrony Bank: | |||
| 5.4% 8/22/25 | 1,668,000 | 1,612,279 | |
| 5.625% 8/23/27 | 1,510,000 | 1,428,283 | |
| UniCredit SpA: | |||
| 2.731% 1/15/32 (Reg. S)(c) | EUR | 395,000 | 380,007 |
| 5.861% 6/19/32(b)(c) | 565,000 | 520,002 | |
| Virgin Money UK PLC: | |||
| 5.125% 12/11/30 (Reg. S)(c) | GBP | 150,000 | 176,035 |
| 7.625% 8/23/29 (Reg. S)(c) | GBP | 400,000 | 510,150 |
| Wells Fargo & Co.: | |||
| 2.125% 12/20/23 (Reg. S) | GBP | 280,000 | 350,455 |
| 3.526% 3/24/28(c) | 19,976,000 | 18,586,125 | |
| 4.478% 4/4/31(c) | 9,036,000 | 8,453,665 | |
| 4.897% 7/25/33(c) | 9,553,000 | 8,988,771 | |
| 5.013% 4/4/51(c) | 3,790,000 | 3,422,277 | |
| 5.574% 7/25/29(c) | 4,000,000 | 3,983,434 | |
| Western Alliance Bancorp. 3% 6/15/31 (c) | 37,000 | 29,262 | |
| Westpac Banking Corp. 4.11% 7/24/34 (c) | 405,000 | 354,806 | |
| 285,264,632 | |||
| Capital Markets - 3.0% | |||
| Affiliated Managers Group, Inc. 3.5% 8/1/25 | 81,000 | 77,374 | |
| Ares Capital Corp.: | |||
| 2.15% 7/15/26 | 7,000,000 | 6,151,638 | |
| 3.875% 1/15/26 | 2,302,000 | 2,153,192 | |
| Coinbase Global, Inc.: | |||
| 3.375% 10/1/28(b) | 235,000 | 172,869 | |
| 3.625% 10/1/31(b) | 105,000 | 70,690 | |
| Deutsche Bank AG: | |||
| 3.25% 5/24/28 (Reg. S)(c) | EUR | 600,000 | 609,287 |
| 4% 6/24/32 (Reg. S)(c) | EUR | 200,000 | 194,534 |
| 4.5% 4/1/25 | 2,787,000 | 2,685,223 | |
| 6.125% 12/12/30 (Reg. S)(c) | GBP | 600,000 | 706,639 |
| Deutsche Bank AG New York Branch: | |||
| 3.729% 1/14/32(c) | 3,000,000 | 2,322,048 | |
| 5.882% 7/8/31(c) | 5,000,000 | 4,535,874 | |
| 6.72% 1/18/29(c) | 1,460,000 | 1,478,187 | |
| Goldman Sachs Group, Inc.: | |||
| 2.383% 7/21/32(c) | 2,140,000 | 1,691,563 | |
| 3.102% 2/24/33(c) | 5,872,000 | 4,883,983 | |
| 3.691% 6/5/28(c) | 28,361,000 | 26,550,256 | |
| 3.75% 5/22/25 | 200,000 | 193,318 | |
| 3.8% 3/15/30 | 3,352,000 | 3,049,091 | |
| 3.814% 4/23/29(c) | 1,341,000 | 1,240,834 | |
| 4.25% 10/21/25 | 554,000 | 537,588 | |
| 6.75% 10/1/37 | 6,606,000 | 7,003,407 | |
| Hightower Holding LLC 6.75% 4/15/29 (b) | 4,590,000 | 3,995,190 | |
| Moody's Corp.: | |||
| 3.25% 1/15/28 | 108,000 | 100,713 | |
| 3.75% 3/24/25 | 822,000 | 799,952 | |
| 4.875% 2/15/24 | 61,000 | 61,000 | |
| Morgan Stanley: | |||
| 3.125% 7/27/26 | 4,453,000 | 4,167,064 | |
| 3.622% 4/1/31(c) | 1,770,000 | 1,572,871 | |
| 4.35% 9/8/26 | 2,767,000 | 2,664,489 | |
| 4.431% 1/23/30(c) | 25,159,000 | 23,892,312 | |
| 4.656% 3/2/29(c) | EUR | 200,000 | 219,409 |
| 4.889% 7/20/33(c) | 10,578,000 | 10,020,525 | |
| 5% 11/24/25 | 5,193,000 | 5,114,358 | |
| 5.449% 7/20/29(c) | 2,267,000 | 2,253,694 | |
| MSCI, Inc.: | |||
| 3.25% 8/15/33(b) | 1,100,000 | 884,991 | |
| 4% 11/15/29(b) | 600,000 | 539,781 | |
| UBS Group AG: | |||
| 1.494% 8/10/27(b)(c) | 1,344,000 | 1,181,830 | |
| 2.193% 6/5/26(b)(c) | 3,100,000 | 2,887,486 | |
| 2.593% 9/11/25(b)(c) | 1,207,000 | 1,163,806 | |
| 3.75% 3/26/25 | 250,000 | 241,507 | |
| 3.869% 1/12/29(b)(c) | 250,000 | 229,828 | |
| 4.125% 9/24/25(b) | 200,000 | 192,948 | |
| 4.194% 4/1/31(b)(c) | 1,509,000 | 1,358,745 | |
| 4.55% 4/17/26 | 250,000 | 241,944 | |
| 4.988% 8/5/33 (Reg. S)(c) | 815,000 | 759,516 | |
| 6.537% 8/12/33(b)(c) | 8,600,000 | 8,931,675 | |
| 7.375% 9/7/33 (Reg. S)(c) | GBP | 551,000 | 760,769 |
| VistaJet Malta Finance PLC / XO Management Holding, Inc.: | |||
| 6.375% 2/1/30(b) | 460,000 | 377,192 | |
| 7.875% 5/1/27(b) | 395,000 | 357,475 | |
| 141,278,665 | |||
| Consumer Finance - 2.0% | |||
| AerCap Ireland Capital Ltd./AerCap Global Aviation Trust: | |||
| 1.65% 10/29/24 | 2,615,000 | 2,486,127 | |
| 2.45% 10/29/26 | 954,000 | 858,358 | |
| 2.875% 8/14/24 | 666,000 | 645,724 | |
| 3% 10/29/28 | 1,000,000 | 866,562 | |
| 3.3% 1/30/32 | 1,069,000 | 868,708 | |
| 4.45% 4/3/26 | 276,000 | 265,884 | |
| 5.75% 6/6/28 | 12,000,000 | 11,895,210 | |
| 6.5% 7/15/25 | 603,000 | 605,871 | |
| Ally Financial, Inc.: | |||
| 1.45% 10/2/23 | 402,000 | 399,972 | |
| 4.75% 6/9/27 | 2,500,000 | 2,343,383 | |
| 5.75% 11/20/25 | 4,607,000 | 4,468,647 | |
| 5.8% 5/1/25 | 832,000 | 819,518 | |
| 7.1% 11/15/27 | 10,234,000 | 10,368,202 | |
| 8% 11/1/31 | 2,683,000 | 2,774,159 | |
| Capital One Financial Corp.: | |||
| 2.636% 3/3/26(c) | 1,228,000 | 1,160,595 | |
| 3.273% 3/1/30(c) | 1,571,000 | 1,348,235 | |
| 3.65% 5/11/27 | 5,794,000 | 5,388,399 | |
| 3.8% 1/31/28 | 519,000 | 475,900 | |
| 4.927% 5/10/28(c) | 2,886,000 | 2,776,233 | |
| 4.985% 7/24/26(c) | 1,758,000 | 1,718,324 | |
| 5.247% 7/26/30(c) | 12,084,000 | 11,495,354 | |
| Discover Financial Services: | |||
| 3.75% 3/4/25 | 586,000 | 561,801 | |
| 4.1% 2/9/27 | 197,000 | 182,757 | |
| 4.5% 1/30/26 | 5,267,000 | 5,059,536 | |
| 6.7% 11/29/32 | 500,000 | 497,629 | |
| Ford Motor Credit Co. LLC: | |||
| 4.063% 11/1/24 | 2,533,000 | 2,454,203 | |
| 4.125% 8/17/27 | 6,530,000 | 5,925,119 | |
| 4.687% 6/9/25 | 275,000 | 264,716 | |
| 5.113% 5/3/29 | 325,000 | 298,939 | |
| 5.125% 6/16/25 | 205,000 | 199,570 | |
| 5.584% 3/18/24 | 1,528,000 | 1,519,717 | |
| 6.86% 6/5/26 | GBP | 370,000 | 456,665 |
| Navient Corp. 7.25% 9/25/23 | 234,000 | 234,000 | |
| OneMain Finance Corp.: | |||
| 4% 9/15/30 | 900,000 | 700,776 | |
| 6.875% 3/15/25 | 515,000 | 512,413 | |
| 9% 1/15/29 | 1,375,000 | 1,393,906 | |
| Shriram Transport Finance Co. Ltd. 4.15% 7/18/25 (b) | 300,000 | 281,910 | |
| Synchrony Financial: | |||
| 3.95% 12/1/27 | 1,916,000 | 1,711,828 | |
| 4.375% 3/19/24 | 2,272,000 | 2,244,570 | |
| 5.15% 3/19/29 | 3,443,000 | 3,157,810 | |
| 91,687,230 | |||
| Financial Services - 1.1% | |||
| AGPS BondCo PLC 4.625% 1/14/26 (Reg. S) (c) | EUR | 600,000 | 216,328 |
| Altus Midstream LP 5.875% 6/15/30 (b) | 205,000 | 198,545 | |
| Azul Secured Finance LLP: | |||
| 10.875% 5/28/30(b) | 70,000 | 59,533 | |
| 11.5% 5/28/29(b) | 203,847 | 183,462 | |
| Blackstone Private Credit Fund: | |||
| 4.7% 3/24/25 | 4,307,000 | 4,186,491 | |
| 4.875% 4/14/26 | GBP | 505,000 | 577,896 |
| 7.05% 9/29/25 | 6,813,000 | 6,860,141 | |
| Block, Inc. 3.5% 6/1/31 | 980,000 | 803,566 | |
| Brixmor Operating Partnership LP: | |||
| 3.85% 2/1/25 | 3,770,000 | 3,636,597 | |
| 4.05% 7/1/30 | 890,000 | 804,036 | |
| 4.125% 6/15/26 | 833,000 | 790,523 | |
| 4.125% 5/15/29 | 2,196,000 | 1,997,553 | |
| Corebridge Financial, Inc.: | |||
| 3.5% 4/4/25 | 575,000 | 552,554 | |
| 3.65% 4/5/27 | 1,926,000 | 1,811,770 | |
| 3.85% 4/5/29 | 6,967,000 | 6,375,856 | |
| 3.9% 4/5/32 | 2,988,000 | 2,612,676 | |
| 4.35% 4/5/42 | 218,000 | 172,467 | |
| 4.4% 4/5/52 | 644,000 | 498,117 | |
| Emerald Debt Merger Sub LLC 6.625% 12/15/30 (b) | 600,000 | 590,652 | |
| Equitable Holdings, Inc. 4.35% 4/20/28 | 5,256,000 | 4,973,011 | |
| GACI First Investment 5.25% 10/13/32 (Reg. S) | 200,000 | 199,792 | |
| GGAM Finance Ltd.: | |||
| 7.75% 5/15/26(b) | 670,000 | 669,989 | |
| 8% 6/15/28(b) | 130,000 | 131,840 | |
| Icahn Enterprises LP/Icahn Enterprises Finance Corp.: | |||
| 5.25% 5/15/27 | 1,011,000 | 887,153 | |
| 6.25% 5/15/26 | 2,059,000 | 1,909,394 | |
| 6.375% 12/15/25 | 1,364,000 | 1,300,443 | |
| Jackson Financial, Inc.: | |||
| 3.125% 11/23/31 | 408,000 | 320,694 | |
| 5.17% 6/8/27 | 818,000 | 801,775 | |
| 5.67% 6/8/32 | 1,733,000 | 1,650,637 | |
| KfW: | |||
| 0% 9/17/30 (Reg. S) | EUR | 500,000 | 440,746 |
| 2.875% 5/29/26 (Reg. S) | EUR | 600,000 | 645,728 |
| 2.875% 6/7/33 (Reg. S) | EUR | 350,000 | 375,367 |
| Leighton Finance U.S.A. Pty Ltd. 1.5% 5/28/29 (Reg. S) | EUR | 545,000 | 466,412 |
| Liberty Costa Rica SR SF 10.875% 1/15/31 (b) | 200,000 | 200,420 | |
| MDGH GMTN RSC Ltd.: | |||
| 2.875% 11/7/29(b) | 300,000 | 266,760 | |
| 4.375% 11/22/33(b) | 200,000 | 188,600 | |
| 5.084% 5/22/53(b) | 200,000 | 188,750 | |
| 5.5% 4/28/33(b) | 200,000 | 205,378 | |
| Nationwide Building Society: | |||
| 3% 5/6/26 (Reg. S) | GBP | 250,000 | 293,616 |
| 6.178% 12/7/27 (Reg. S)(c) | GBP | 300,000 | 374,311 |
| Pine Street Trust I 4.572% 2/15/29 (b) | 514,000 | 471,094 | |
| Pine Street Trust II 5.568% 2/15/49 (b) | 800,000 | 700,378 | |
| PTT Treasury Center Co. Ltd. 3.7% 7/16/70 (b) | 75,000 | 49,208 | |
| Scientific Games Holdings LP/Scientific Games U.S. Finco, Inc. 6.625% 3/1/30 (b) | 160,000 | 141,042 | |
| VMED O2 UK Financing I PLC 4.25% 1/31/31 (b) | 840,000 | 687,207 | |
| 51,468,508 | |||
| Insurance - 0.6% | |||
| Acrisure LLC / Acrisure Finance, Inc.: | |||
| 4.25% 2/15/29(b) | 600,000 | 518,866 | |
| 6% 8/1/29(b) | 600,000 | 521,218 | |
| Admiral Group PLC 8.5% 1/6/34 (Reg. S) | GBP | 100,000 | 128,958 |
| AIA Group Ltd. 3.2% 9/16/40 (b) | 625,000 | 451,523 | |
| Alliant Holdings Intermediate LLC: | |||
| 6.75% 10/15/27(b) | 1,795,000 | 1,696,670 | |
| 6.75% 4/15/28(b) | 260,000 | 256,156 | |
| American International Group, Inc.: | |||
| 2.5% 6/30/25 | 1,653,000 | 1,564,691 | |
| 3.4% 6/30/30 | 2,180,000 | 1,919,762 | |
| Cloverie PLC 4.5% 9/11/44 (Reg. S) (c) | 340,000 | 324,782 | |
| Demeter Investments BV 5.625% 8/15/52 (Reg. S) (c) | 1,375,000 | 1,292,500 | |
| Fidelidade-Companhia de Seguros SA 4.25% 9/4/31 (Reg. S) (c) | EUR | 200,000 | 186,680 |
| Five Corners Funding Trust II 2.85% 5/15/30 (b) | 5,993,000 | 5,130,699 | |
| Hartford Financial Services Group, Inc. 4.3% 4/15/43 | 604,000 | 477,848 | |
| HUB International Ltd.: | |||
| 7% 5/1/26(b) | 675,000 | 673,735 | |
| 7.25% 6/15/30(b) | 385,000 | 391,888 | |
| Liberty Mutual Group, Inc.: | |||
| 4.569% 2/1/29(b) | 130,000 | 125,475 | |
| 7.8% 3/7/87(b) | 200,000 | 205,749 | |
| Marsh & McLennan Companies, Inc.: | |||
| 4.375% 3/15/29 | 2,310,000 | 2,236,454 | |
| 4.75% 3/15/39 | 142,000 | 131,383 | |
| Pacific LifeCorp 5.125% 1/30/43 (b) | 554,000 | 505,379 | |
| Prudential Funding Asia PLC 2.95% 11/3/33 (Reg. S) (c) | 975,000 | 814,694 | |
| QBE Insurance Group Ltd. 2.5% 9/13/38 (Reg. S) (c) | GBP | 415,000 | 413,114 |
| Swiss Re Finance Luxembourg SA 5% 4/2/49 (b)(c) | 200,000 | 189,000 | |
| Teachers Insurance & Annuity Association of America 4.9% 9/15/44 (b) | 1,852,000 | 1,662,884 | |
| TIAA Asset Management Finance LLC 4.125% 11/1/24 (b) | 3,501,000 | 3,418,963 | |
| Unum Group: | |||
| 3.875% 11/5/25 | 349,000 | 333,212 | |
| 4% 6/15/29 | 2,474,000 | 2,267,687 | |
| USI, Inc. 6.875% 5/1/25 (b) | 1,072,000 | 1,070,263 | |
| Zurich Finance (Ireland) DAC 3.5% 5/2/52 (Reg. S) (c) | 820,000 | 642,675 | |
| 29,552,908 | |||
| Mortgage Real Estate Investment Trusts - 0.0% | |||
| Starwood Property Trust, Inc. 4.75% 3/15/25 | 35,000 | 33,836 | |
TOTAL FINANCIALS | 599,285,779 | ||
| HEALTH CARE - 1.8% | |||
| Biotechnology - 0.3% | |||
| Amgen, Inc.: | |||
| 5.25% 3/2/30 | 8,813,000 | 8,825,201 | |
| 5.25% 3/2/33 | 1,507,000 | 1,499,164 | |
| 5.6% 3/2/43 | 1,432,000 | 1,405,108 | |
| 5.65% 3/2/53 | 712,000 | 705,838 | |
| 5.75% 3/2/63 | 1,297,000 | 1,280,845 | |
| Emergent BioSolutions, Inc. 3.875% 8/15/28 (b) | 561,000 | 269,280 | |
| Grifols SA 4.75% 10/15/28 (b) | 495,000 | 434,278 | |
| 14,419,714 | |||
| Health Care Equipment & Supplies - 0.1% | |||
| Avantor Funding, Inc. 4.625% 7/15/28 (b) | 510,000 | 473,425 | |
| Hologic, Inc.: | |||
| 3.25% 2/15/29(b) | 525,000 | 456,007 | |
| 4.625% 2/1/28(b) | 500,000 | 467,778 | |
| Teleflex, Inc. 4.25% 6/1/28 (b) | 95,000 | 87,269 | |
| Werfenlife SA 4.625% 6/6/28 (Reg. S) | EUR | 200,000 | 215,760 |
| 1,700,239 | |||
| Health Care Providers & Services - 1.0% | |||
| 180 Medical, Inc. 3.875% 10/15/29 (b) | 625,000 | 543,500 | |
| Cano Health, Inc. 6.25% 10/1/28 (b) | 282,000 | 95,880 | |
| Centene Corp.: | |||
| 2.45% 7/15/28 | 7,705,000 | 6,596,114 | |
| 2.5% 3/1/31 | 2,680,000 | 2,134,484 | |
| 2.625% 8/1/31 | 1,045,000 | 831,327 | |
| 3.375% 2/15/30 | 1,016,000 | 869,489 | |
| 4.25% 12/15/27 | 1,563,000 | 1,462,043 | |
| 4.625% 12/15/29 | 5,285,000 | 4,859,558 | |
| Cigna Group: | |||
| 3.05% 10/15/27 | 300,000 | 276,513 | |
| 4.8% 8/15/38 | 268,000 | 247,047 | |
| 4.9% 12/15/48 | 268,000 | 238,983 | |
| Community Health Systems, Inc.: | |||
| 4.75% 2/15/31(b) | 905,000 | 674,225 | |
| 5.625% 3/15/27(b) | 1,700,000 | 1,495,905 | |
| 6.125% 4/1/30(b) | 620,000 | 356,779 | |
| 6.875% 4/15/29(b) | 2,435,000 | 1,493,434 | |
| 8% 3/15/26(b) | 1,317,000 | 1,285,598 | |
| CVS Health Corp.: | |||
| 3% 8/15/26 | 69,000 | 64,638 | |
| 3.625% 4/1/27 | 281,000 | 265,972 | |
| 4.3% 3/25/28 | 5,991,000 | 5,754,119 | |
| 4.78% 3/25/38 | 1,295,000 | 1,159,747 | |
| 5% 1/30/29 | 1,451,000 | 1,429,524 | |
| 5.25% 1/30/31 | 595,000 | 587,953 | |
| DaVita HealthCare Partners, Inc. 4.625% 6/1/30 (b) | 1,120,000 | 960,684 | |
| HCA Holdings, Inc.: | |||
| 3.5% 9/1/30 | 1,247,000 | 1,089,162 | |
| 3.625% 3/15/32 | 232,000 | 199,537 | |
| 5.375% 2/1/25 | 926,000 | 919,809 | |
| 5.625% 9/1/28 | 1,062,000 | 1,059,713 | |
| 5.875% 2/15/26 | 300,000 | 300,409 | |
| 5.875% 2/1/29 | 1,172,000 | 1,179,227 | |
| Humana, Inc. 3.7% 3/23/29 | 748,000 | 692,532 | |
| Molina Healthcare, Inc.: | |||
| 3.875% 11/15/30(b) | 185,000 | 157,853 | |
| 3.875% 5/15/32(b) | 400,000 | 331,888 | |
| Pediatrix Medical Group, Inc. 5.375% 2/15/30 (b) | 180,000 | 164,151 | |
| Regionalcare Hospital Partners 9.75% 12/1/26 (b) | 269,000 | 251,478 | |
| RegionalCare Hospital Partners Holdings, Inc.: | |||
| 5.375% 1/15/29(b) | 236,000 | 163,155 | |
| 9.875% 8/15/30(b) | 315,000 | 311,063 | |
| RP Escrow Issuer LLC 5.25% 12/15/25 (b) | 645,000 | 496,792 | |
| Sabra Health Care LP 3.2% 12/1/31 | 2,237,000 | 1,708,615 | |
| Surgery Center Holdings, Inc. 6.75% 7/1/25 (b) | 210,000 | 208,950 | |
| Tenet Healthcare Corp.: | |||
| 4.625% 6/15/28 | 115,000 | 105,894 | |
| 4.875% 1/1/26 | 195,000 | 189,030 | |
| 6.125% 10/1/28 | 4,595,000 | 4,425,582 | |
| 6.25% 2/1/27 | 240,000 | 236,325 | |
| Toledo Hospital 5.325% 11/15/28 | 154,000 | 123,154 | |
| 47,997,835 | |||
| Health Care Technology - 0.0% | |||
| Athenahealth Group, Inc. 6.5% 2/15/30 (b) | 670,000 | 581,876 | |
| IQVIA, Inc.: | |||
| 5% 10/15/26(b) | 400,000 | 386,370 | |
| 5% 5/15/27(b) | 530,000 | 510,171 | |
| 1,478,417 | |||
| Life Sciences Tools & Services - 0.0% | |||
| Charles River Laboratories International, Inc. 4.25% 5/1/28 (b) | 30,000 | 27,539 | |
| Pharmaceuticals - 0.4% | |||
| 1375209 BC Ltd. 9% 1/30/28 (b) | 514,000 | 514,617 | |
| Bausch Health Companies, Inc.: | |||
| 5.5% 11/1/25(b) | 480,000 | 432,600 | |
| 9% 12/15/25(b) | 74,000 | 67,713 | |
| Bayer AG 4.625% 5/26/33 (Reg. S) | EUR | 250,000 | 274,951 |
| Bayer U.S. Finance II LLC 4.25% 12/15/25 (b) | 1,700,000 | 1,646,419 | |
| Catalent Pharma Solutions 3.5% 4/1/30 (b) | 380,000 | 319,552 | |
| Elanco Animal Health, Inc. 6.65% 8/28/28 (c) | 92,000 | 90,735 | |
| Mylan NV 4.55% 4/15/28 | 5,150,000 | 4,848,641 | |
| Organon & Co. / Organon Foreign Debt Co-Issuer BV 5.125% 4/30/31 (b) | 1,225,000 | 1,043,704 | |
| Teva Pharmaceutical Finance Netherlands III BV 7.875% 9/15/29 | 200,000 | 208,332 | |
| Utah Acquisition Sub, Inc. 3.95% 6/15/26 | 90,000 | 85,069 | |
| Viatris, Inc.: | |||
| 2.7% 6/22/30 | 9,221,000 | 7,488,670 | |
| 3.85% 6/22/40 | 359,000 | 251,266 | |
| 4% 6/22/50 | 620,000 | 410,690 | |
| 17,682,959 | |||
TOTAL HEALTH CARE | 83,306,703 | ||
| INDUSTRIALS - 1.7% | |||
| Aerospace & Defense - 0.5% | |||
| Bombardier, Inc.: | |||
| 6% 2/15/28(b) | 400,000 | 373,851 | |
| 7.45% 5/1/34(b) | 200,000 | 228,466 | |
| 7.875% 4/15/27(b) | 1,155,000 | 1,152,841 | |
| BWX Technologies, Inc. 4.125% 6/30/28 (b) | 1,100,000 | 1,000,962 | |
| DAE Funding LLC 1.55% 8/1/24 (b) | 300,000 | 286,170 | |
| Embraer Netherlands Finance BV: | |||
| 5.4% 2/1/27 | 115,000 | 112,729 | |
| 6.95% 1/17/28(b) | 95,000 | 96,639 | |
| 7% 7/28/30(b) | 140,000 | 141,428 | |
| Howmet Aerospace, Inc.: | |||
| 5.9% 2/1/27 | 1,000,000 | 992,955 | |
| 5.95% 2/1/37 | 390,000 | 383,955 | |
| Moog, Inc. 4.25% 12/15/27 (b) | 205,000 | 186,551 | |
| Rolls-Royce PLC 3.375% 6/18/26 | GBP | 435,000 | 499,854 |
| The Boeing Co.: | |||
| 5.04% 5/1/27 | 130,000 | 128,569 | |
| 5.15% 5/1/30 | 11,366,000 | 11,182,263 | |
| 5.705% 5/1/40 | 550,000 | 534,702 | |
| 5.805% 5/1/50 | 500,000 | 486,443 | |
| 5.93% 5/1/60 | 2,180,000 | 2,104,305 | |
| TransDigm UK Holdings PLC 6.875% 5/15/26 | 120,000 | 121,914 | |
| TransDigm, Inc.: | |||
| 6.25% 3/15/26(b) | 495,000 | 490,282 | |
| 6.75% 8/15/28(b) | 4,427,000 | 4,442,519 | |
| 7.5% 3/15/27 | 125,000 | 125,241 | |
| 25,072,639 | |||
| Air Freight & Logistics - 0.0% | |||
| Aercap Global Aviation Trust 6.5% 6/15/45 (b)(c) | 155,000 | 152,837 | |
| Aeropuerto Internacional de Tocumen SA 4% 8/11/41 (b) | 300,000 | 237,066 | |
| Cargo Aircraft Management, Inc. 4.75% 2/1/28 (b) | 400,000 | 360,000 | |
| Rand Parent LLC 8.5% 2/15/30 (b) | 1,195,000 | 1,137,648 | |
| 1,887,551 | |||
| Building Products - 0.0% | |||
| Advanced Drain Systems, Inc. 5% 9/30/27 (b) | 1,160,000 | 1,107,800 | |
| Oscar Acquisition Co. LLC / Oscar Finance, Inc. 9.5% 4/15/30 (b) | 305,000 | 285,482 | |
| 1,393,282 | |||
| Commercial Services & Supplies - 0.2% | |||
| Allied Universal Holdco LLC / Allied Universal Finance Corp. 9.75% 7/15/27 (b) | 1,255,000 | 1,152,647 | |
| APX Group, Inc. 6.75% 2/15/27 (b) | 365,000 | 354,671 | |
| Brand Energy & Infrastructure Services, Inc. 10.375% 8/1/30 (b) | 1,425,000 | 1,469,574 | |
| Cimpress PLC 7% 6/15/26 | 69,000 | 64,688 | |
| Clean Harbors, Inc. 6.375% 2/1/31 (b) | 90,000 | 89,499 | |
| CoreCivic, Inc.: | |||
| 4.75% 10/15/27 | 50,000 | 44,583 | |
| 8.25% 4/15/26 | 1,535,000 | 1,541,091 | |
| Covanta Holding Corp. 4.875% 12/1/29 (b) | 375,000 | 322,500 | |
| Madison IAQ LLC: | |||
| 4.125% 6/30/28(b) | 800,000 | 707,786 | |
| 5.875% 6/30/29(b) | 500,000 | 420,999 | |
| Neptune BidCo U.S., Inc. 9.29% 4/15/29 (b) | 430,000 | 401,541 | |
| PowerTeam Services LLC 9.033% 12/4/25 (b) | 645,000 | 600,087 | |
| Stericycle, Inc. 3.875% 1/15/29 (b) | 1,070,000 | 931,629 | |
| The Bidvest Group UK PLC 3.625% 9/23/26 (b) | 225,000 | 199,460 | |
| The GEO Group, Inc.: | |||
| 6% 4/15/26 | 200,000 | 181,000 | |
| 9.5% 12/31/28(b) | 320,000 | 313,600 | |
| 10.5% 6/30/28 | 77,000 | 77,023 | |
| 8,872,378 | |||
| Construction & Engineering - 0.1% | |||
| AECOM 5.125% 3/15/27 | 1,354,000 | 1,299,076 | |
| Greensaif Pipelines Bidco SARL: | |||
| 6.129% 2/23/38(b) | 305,000 | 305,555 | |
| 6.51% 2/23/42(b) | 200,000 | 201,946 | |
| Pike Corp. 5.5% 9/1/28 (b) | 1,418,000 | 1,276,068 | |
| Railworks Holdings LP 8.25% 11/15/28 (b) | 625,000 | 596,866 | |
| SRS Distribution, Inc. 4.625% 7/1/28 (b) | 400,000 | 356,009 | |
| 4,035,520 | |||
| Electrical Equipment - 0.1% | |||
| GrafTech Global Enterprises, Inc. 9.875% 12/15/28 (b) | 165,000 | 160,875 | |
| Regal Rexnord Corp. 6.3% 2/15/30 (b) | 1,365,000 | 1,358,985 | |
| Sensata Technologies BV 4% 4/15/29 (b) | 2,000,000 | 1,756,218 | |
| 3,276,078 | |||
| Ground Transportation - 0.1% | |||
| Uber Technologies, Inc. 4.5% 8/15/29 (b) | 2,415,000 | 2,211,205 | |
| XPO, Inc.: | |||
| 6.25% 5/1/25(b) | 72,000 | 70,856 | |
| 6.25% 6/1/28(b) | 450,000 | 440,944 | |
| 2,723,005 | |||
| Industrial Conglomerates - 0.0% | |||
| Turkiye Sise ve Cam Fabrikalari A/S 6.95% 3/14/26 (b) | 175,000 | 170,902 | |
| Machinery - 0.0% | |||
| Vertical U.S. Newco, Inc. 5.25% 7/15/27 (b) | 1,485,000 | 1,392,040 | |
| Marine Transportation - 0.0% | |||
| MISC Capital Two (Labuan) Ltd. 3.75% 4/6/27 (b) | 200,000 | 186,834 | |
| Navios South American Logistics, Inc./Navios Logistics Finance U.S., Inc. 10.75% 7/1/25 (b) | 575,000 | 555,916 | |
| Seaspan Corp. 5.5% 8/1/29 (b) | 600,000 | 466,356 | |
| 1,209,106 | |||
| Passenger Airlines - 0.0% | |||
| American Airlines, Inc. 7.25% 2/15/28 (b) | 1,030,000 | 1,011,788 | |
| Professional Services - 0.1% | |||
| ASGN, Inc. 4.625% 5/15/28 (b) | 360,000 | 323,525 | |
| Booz Allen Hamilton, Inc. 3.875% 9/1/28 (b) | 530,000 | 481,235 | |
| CoreLogic, Inc. 4.5% 5/1/28 (b) | 1,159,000 | 947,483 | |
| TriNet Group, Inc. 7.125% 8/15/31 (b) | 580,000 | 583,260 | |
| 2,335,503 | |||
| Trading Companies & Distributors - 0.1% | |||
| Air Lease Corp. 3.375% 7/1/25 | 1,164,000 | 1,108,981 | |
| Beacon Roofing Supply, Inc. 6.5% 8/1/30 (b) | 270,000 | 266,717 | |
| Travis Perkins PLC 3.75% 2/17/26 (Reg. S) | GBP | 463,000 | 526,693 |
| 1,902,391 | |||
| Transportation Infrastructure - 0.5% | |||
| Avolon Holdings Funding Ltd.: | |||
| 2.875% 2/15/25(b) | 10,863,000 | 10,249,765 | |
| 3.95% 7/1/24(b) | 196,000 | 191,183 | |
| 4.25% 4/15/26(b) | 8,671,000 | 8,177,265 | |
| 4.375% 5/1/26(b) | 2,716,000 | 2,560,362 | |
| 6.375% 5/4/28(b) | 2,964,000 | 2,940,161 | |
| DP World Crescent Ltd. 3.7495% 1/30/30 (b) | 250,000 | 230,250 | |
| DP World Ltd. 5.625% 9/25/48 (b) | 75,000 | 69,203 | |
| Heathrow Funding Ltd.: | |||
| 2.625% 3/16/28 (Reg. S) | GBP | 400,000 | 423,342 |
| 7.125% 2/14/24 | GBP | 100,000 | 126,926 |
| 24,968,457 | |||
TOTAL INDUSTRIALS | 80,250,640 | ||
| INFORMATION TECHNOLOGY - 1.4% | |||
| Communications Equipment - 0.1% | |||
| CommScope, Inc.: | |||
| 4.75% 9/1/29(b) | 600,000 | 445,883 | |
| 6% 3/1/26(b) | 665,000 | 604,329 | |
| HTA Group Ltd. 7% 12/18/25 (b) | 1,045,000 | 987,546 | |
| IHS Netherlands Holdco BV 8% 9/18/27 (b) | 298,000 | 266,311 | |
| Nokia Corp. 6.625% 5/15/39 | 355,000 | 338,075 | |
| 2,642,144 | |||
| Electronic Equipment, Instruments & Components - 0.2% | |||
| Coherent Corp. 5% 12/15/29 (b) | 3,270,000 | 2,904,414 | |
| Dell International LLC/EMC Corp.: | |||
| 5.3% 10/1/29 | 2,000,000 | 1,974,647 | |
| 6.1% 7/15/27 | 245,000 | 250,483 | |
| 6.2% 7/15/30 | 324,000 | 333,430 | |
| TTM Technologies, Inc. 4% 3/1/29 (b) | 1,331,000 | 1,156,107 | |
| 6,619,081 | |||
| IT Services - 0.0% | |||
| Acuris Finance U.S. 5% 5/1/28 (b) | 365,000 | 295,650 | |
| CA Magnum Holdings 5.375% 10/31/26 (b) | 350,000 | 312,004 | |
| Camelot Finance SA 4.5% 11/1/26 (b) | 250,000 | 234,109 | |
| Gartner, Inc.: | |||
| 3.75% 10/1/30(b) | 180,000 | 155,440 | |
| 4.5% 7/1/28(b) | 260,000 | 242,460 | |
| Go Daddy Operating Co. LLC / GD Finance Co., Inc. 5.25% 12/1/27 (b) | 550,000 | 526,625 | |
| Virtusa Corp. 7.125% 12/15/28 (b) | 135,000 | 110,531 | |
| 1,876,819 | |||
| Semiconductors & Semiconductor Equipment - 0.5% | |||
| Broadcom, Inc.: | |||
| 1.95% 2/15/28(b) | 340,000 | 294,852 | |
| 2.45% 2/15/31(b) | 9,138,000 | 7,366,996 | |
| 2.6% 2/15/33(b) | 14,788,000 | 11,433,076 | |
| 3.5% 2/15/41(b) | 2,339,000 | 1,713,495 | |
| 3.75% 2/15/51(b) | 1,098,000 | 787,432 | |
| Entegris, Inc.: | |||
| 3.625% 5/1/29(b) | 2,325,000 | 1,998,291 | |
| 4.375% 4/15/28(b) | 300,000 | 273,512 | |
| ON Semiconductor Corp. 3.875% 9/1/28 (b) | 205,000 | 182,487 | |
| Qorvo, Inc. 4.375% 10/15/29 | 610,000 | 552,669 | |
| 24,602,810 | |||
| Software - 0.6% | |||
| Black Knight InfoServ LLC 3.625% 9/1/28 (b) | 865,000 | 795,800 | |
| Boxer Parent Co., Inc. 7.125% 10/2/25 (b) | 135,000 | 135,169 | |
| Central Parent, Inc./Central Merger Sub, Inc. 7.25% 6/15/29 (b) | 270,000 | 266,292 | |
| Clarivate Science Holdings Corp. 4.875% 7/1/29 (b) | 900,000 | 784,852 | |
| Cloud Software Group, Inc. 9% 9/30/29 (b) | 2,570,000 | 2,297,266 | |
| CNT PRNT/CDK GLO II/FIN 8% 6/15/29 (b) | 445,000 | 447,893 | |
| Fair Isaac Corp.: | |||
| 4% 6/15/28(b) | 345,000 | 315,485 | |
| 5.25% 5/15/26(b) | 110,000 | 106,700 | |
| Gen Digital, Inc. 5% 4/15/25 (b) | 867,000 | 849,911 | |
| McAfee Corp. 7.375% 2/15/30 (b) | 240,000 | 209,978 | |
| MicroStrategy, Inc. 6.125% 6/15/28 (b) | 395,000 | 353,614 | |
| Open Text Corp.: | |||
| 3.875% 2/15/28(b) | 215,000 | 191,333 | |
| 3.875% 12/1/29(b) | 1,250,000 | 1,060,027 | |
| Open Text Holdings, Inc. 4.125% 12/1/31 (b) | 110,000 | 91,309 | |
| Oracle Corp.: | |||
| 1.65% 3/25/26 | 1,381,000 | 1,258,458 | |
| 2.3% 3/25/28 | 2,182,000 | 1,920,112 | |
| 2.8% 4/1/27 | 1,191,000 | 1,093,964 | |
| 2.875% 3/25/31 | 18,630,000 | 15,740,008 | |
| 3.6% 4/1/40 | 1,192,000 | 902,097 | |
| 3.6% 4/1/50 | 6,000 | 4,147 | |
| 3.85% 4/1/60 | 6,000 | 4,078 | |
| SS&C Technologies, Inc. 5.5% 9/30/27 (b) | 590,000 | 567,993 | |
| 29,396,486 | |||
| Technology Hardware, Storage & Peripherals - 0.0% | |||
| Lenovo Group Ltd. 3.421% 11/2/30 (b) | 300,000 | 249,855 | |
| Seagate HDD Cayman: | |||
| 5.75% 12/1/34 | 610,000 | 540,234 | |
| 8.25% 12/15/29(b) | 250,000 | 262,250 | |
| 1,052,339 | |||
TOTAL INFORMATION TECHNOLOGY | 66,189,679 | ||
| MATERIALS - 0.8% | |||
| Chemicals - 0.4% | |||
| Axalta Coating Systems/Dutch Holding BV 4.75% 6/15/27 (b) | 365,000 | 343,519 | |
| Braskem Idesa SAPI 6.99% 2/20/32 (b) | 180,000 | 107,257 | |
| Celanese U.S. Holdings LLC: | |||
| 6.35% 11/15/28 | 1,910,000 | 1,914,923 | |
| 6.55% 11/15/30 | 1,930,000 | 1,930,951 | |
| 6.7% 11/15/33 | 1,127,000 | 1,131,739 | |
| CF Industries Holdings, Inc. 4.95% 6/1/43 | 5,000 | 4,226 | |
| ENN Clean Energy International Investment Ltd. 3.375% 5/12/26 (b) | 375,000 | 343,883 | |
| INEOS Finance PLC 6.75% 5/15/28 (b) | 445,000 | 426,043 | |
| Kobe U.S. Midco 2, Inc. 9.25% 11/1/26 pay-in-kind (b)(c) | 340,000 | 248,200 | |
| LSB Industries, Inc. 6.25% 10/15/28 (b) | 1,000,000 | 914,552 | |
| Meglobal BV 4.25% 11/3/26 (b) | 70,000 | 66,942 | |
| MEGlobal Canada, Inc. 5% 5/18/25 (b) | 200,000 | 195,970 | |
| Methanex Corp.: | |||
| 5.125% 10/15/27 | 1,645,000 | 1,543,041 | |
| 5.65% 12/1/44 | 181,000 | 148,042 | |
| NOVA Chemicals Corp.: | |||
| 4.25% 5/15/29(b) | 200,000 | 162,181 | |
| 5.25% 6/1/27(b) | 1,575,000 | 1,400,264 | |
| Nufarm Australia Ltd. 5% 1/27/30 (b) | 600,000 | 533,697 | |
| OCP SA: | |||
| 3.75% 6/23/31(b) | 600,000 | 495,162 | |
| 5.625% 4/25/24(b) | 150,000 | 148,863 | |
| Olin Corp.: | |||
| 5% 2/1/30 | 370,000 | 338,798 | |
| 5.625% 8/1/29 | 505,000 | 483,362 | |
| Olympus Water U.S. Holding Corp.: | |||
| 4.25% 10/1/28(b) | 1,800,000 | 1,477,762 | |
| 6.25% 10/1/29(b) | 560,000 | 450,839 | |
| 9.75% 11/15/28(b) | 610,000 | 614,469 | |
| Orbia Advance Corp. S.A.B. de CV: | |||
| 1.875% 5/11/26(b) | 200,000 | 177,912 | |
| 2.875% 5/11/31(b) | 100,000 | 78,775 | |
| Sasol Financing U.S.A. LLC: | |||
| 4.375% 9/18/26 | 355,000 | 316,767 | |
| 5.5% 3/18/31 | 55,000 | 44,020 | |
| 5.875% 3/27/24 | 105,000 | 103,576 | |
| SCIH Salt Holdings, Inc.: | |||
| 4.875% 5/1/28(b) | 70,000 | 62,988 | |
| 6.625% 5/1/29(b) | 935,000 | 825,076 | |
| SCIL IV LLC / SCIL U.S.A. Holdings LLC 5.375% 11/1/26 (b) | 391,000 | 366,006 | |
| The Chemours Co. LLC: | |||
| 5.375% 5/15/27 | 819,000 | 770,974 | |
| 5.75% 11/15/28(b) | 1,090,000 | 979,168 | |
| W.R. Grace Holding LLC: | |||
| 4.875% 6/15/27(b) | 195,000 | 181,865 | |
| 5.625% 8/15/29(b) | 1,500,000 | 1,268,550 | |
| 7.375% 3/1/31(b) | 80,000 | 78,781 | |
| 20,679,143 | |||
| Construction Materials - 0.0% | |||
| CEMEX S.A.B. de CV 3.875% 7/11/31 (b) | 200,000 | 171,498 | |
| Eco Material Technologies, Inc. 7.875% 1/31/27 (b) | 180,000 | 175,498 | |
| 346,996 | |||
| Containers & Packaging - 0.2% | |||
| ARD Finance SA 6.5% 6/30/27 pay-in-kind (b)(c) | 700,000 | 562,606 | |
| Ardagh Metal Packaging Finance U.S.A. LLC/Ardagh Metal Packaging Finance PLC: | |||
| 4% 9/1/29(b) | 183,000 | 148,769 | |
| 6% 6/15/27(b) | 183,000 | 178,446 | |
| Ardagh Packaging Finance PLC/Ardagh MP Holdings U.S.A., Inc.: | |||
| 4.125% 8/15/26(b) | 595,000 | 555,824 | |
| 5.25% 8/15/27(b) | 560,000 | 476,399 | |
| 5.25% 8/15/27(b) | 600,000 | 510,427 | |
| Ball Corp. 6% 6/15/29 | 405,000 | 398,968 | |
| Berry Global, Inc. 4.875% 7/15/26 (b) | 170,000 | 164,082 | |
| BWAY Holding Co. 7.875% 8/15/26 (b) | 915,000 | 901,042 | |
| Clydesdale Acquisition Holdings, Inc.: | |||
| 6.625% 4/15/29(b) | 110,000 | 104,671 | |
| 8.75% 4/15/30(b) | 365,000 | 330,083 | |
| Crown Americas LLC/Crown Americas Capital Corp. IV 4.75% 2/1/26 | 525,000 | 506,240 | |
| Crown Cork & Seal, Inc. 7.375% 12/15/26 | 35,000 | 36,374 | |
| Graham Packaging Co., Inc. 7.125% 8/15/28 (b) | 35,000 | 30,522 | |
| Intelligent Packaging Ltd. Finco, Inc. 6% 9/15/28 (b) | 65,000 | 58,509 | |
| Owens-Brockway Glass Container, Inc. 7.25% 5/15/31 (b) | 395,000 | 398,535 | |
| Sealed Air Corp./Sealed Air Cor 6.125% 2/1/28 (b) | 225,000 | 221,080 | |
| Trivium Packaging Finance BV: | |||
| 5.5% 8/15/26(b) | 350,000 | 330,142 | |
| 8.5% 8/15/27(b) | 1,465,000 | 1,389,620 | |
| 7,302,339 | |||
| Metals & Mining - 0.2% | |||
| Antofagasta PLC 2.375% 10/14/30 (b) | 300,000 | 239,325 | |
| Arsenal AIC Parent LLC 8% 10/1/30 (b) | 190,000 | 194,036 | |
| ATI, Inc.: | |||
| 5.875% 12/1/27 | 625,000 | 607,813 | |
| 7.25% 8/15/30 | 145,000 | 146,479 | |
| Compania de Minas Buenaventura SAA 5.5% 7/23/26 (b) | 80,000 | 70,303 | |
| Corporacion Nacional del Cobre de Chile (Codelco): | |||
| 3.7% 1/30/50(b) | 200,000 | 140,360 | |
| 4.5% 8/1/47(b) | 80,000 | 64,298 | |
| 5.125% 2/2/33(b) | 200,000 | 191,516 | |
| CSN Islands XI Corp. 6.75% 1/28/28 (b) | 255,000 | 238,848 | |
| CSN Resources SA 5.875% 4/8/32 (b) | 120,000 | 96,600 | |
| Endeavour Mining PLC 5% 10/14/26 (b) | 210,000 | 183,481 | |
| ERO Copper Corp. 6.5% 2/15/30 (b) | 1,810,000 | 1,572,094 | |
| First Quantum Minerals Ltd. 6.875% 3/1/26 (b) | 1,455,000 | 1,421,768 | |
| FMG Resources Pty Ltd. 4.5% 9/15/27 (b) | 5,000 | 4,613 | |
| Fresnillo PLC 4.25% 10/2/50 (b) | 200,000 | 146,064 | |
| Gcm Mining Corp. 6.875% 8/9/26 (b) | 220,000 | 175,038 | |
| Kaiser Aluminum Corp. 4.625% 3/1/28 (b) | 875,000 | 773,786 | |
| Mineral Resources Ltd. 8% 11/1/27 (b) | 540,000 | 538,113 | |
| Novelis Corp. 3.875% 8/15/31 (b) | 1,000,000 | 827,962 | |
| PMHC II, Inc. 9% 2/15/30 (b) | 435,000 | 358,791 | |
| POSCO 5.875% 1/17/33 (b) | 200,000 | 206,242 | |
| PT Freeport Indonesia: | |||
| 4.763% 4/14/27(b) | 200,000 | 192,010 | |
| 6.2% 4/14/52(b) | 200,000 | 177,750 | |
| PT Indonesia Asahan Aluminium 5.45% 5/15/30 (b) | 200,000 | 192,068 | |
| Stillwater Mining Co.: | |||
| 4% 11/16/26(b) | 175,000 | 153,778 | |
| 4.5% 11/16/29(b) | 80,000 | 62,958 | |
| VM Holding SA 6.5% 1/18/28 (b) | 200,000 | 191,176 | |
| Volcan Compania Minera SAA 4.375% 2/11/26 (b) | 90,000 | 58,579 | |
| 9,225,849 | |||
| Paper & Forest Products - 0.0% | |||
| LABL, Inc. 10.5% 7/15/27 (b) | 615,000 | 588,626 | |
| SPA Holdings 3 OY 4.875% 2/4/28 (b) | 180,000 | 149,474 | |
| 738,100 | |||
TOTAL MATERIALS | 38,292,427 | ||
| REAL ESTATE - 1.9% | |||
| Equity Real Estate Investment Trusts (REITs) - 1.7% | |||
| Alexandria Real Estate Equities, Inc. 4.9% 12/15/30 | 666,000 | 644,640 | |
| American Homes 4 Rent LP: | |||
| 2.375% 7/15/31 | 166,000 | 131,443 | |
| 3.625% 4/15/32 | 881,000 | 754,775 | |
| Boston Properties, Inc.: | |||
| 3.25% 1/30/31 | 5,966,000 | 4,856,746 | |
| 4.5% 12/1/28 | 295,000 | 272,213 | |
| 6.75% 12/1/27 | 1,463,000 | 1,494,217 | |
| Corporate Office Properties LP: | |||
| 2.25% 3/15/26 | 300,000 | 270,947 | |
| 2.75% 4/15/31 | 252,000 | 194,225 | |
| GLP Capital LP/GLP Financing II, Inc. 5.25% 6/1/25 | 155,000 | 152,144 | |
| Healthcare Trust of America Holdings LP: | |||
| 3.1% 2/15/30 | 149,000 | 126,924 | |
| 3.5% 8/1/26 | 155,000 | 144,697 | |
| Healthpeak OP, LLC: | |||
| 3.25% 7/15/26 | 59,000 | 55,803 | |
| 3.5% 7/15/29 | 68,000 | 61,067 | |
| Hudson Pacific Properties LP 4.65% 4/1/29 | 1,622,000 | 1,235,941 | |
| Invitation Homes Operating Partnership LP 4.15% 4/15/32 | 1,320,000 | 1,174,798 | |
| Kite Realty Group Trust 4.75% 9/15/30 | 68,000 | 62,246 | |
| LXP Industrial Trust (REIT): | |||
| 2.7% 9/15/30 | 350,000 | 277,345 | |
| 4.4% 6/15/24 | 458,000 | 448,917 | |
| MPT Operating Partnership LP/MPT Finance Corp.: | |||
| 2.5% 3/24/26 | GBP | 170,000 | 168,311 |
| 3.5% 3/15/31 | 2,105,000 | 1,366,930 | |
| 5% 10/15/27 | 2,375,000 | 1,876,196 | |
| 5.25% 8/1/26 | 515,000 | 437,523 | |
| Omega Healthcare Investors, Inc.: | |||
| 3.25% 4/15/33 | 23,780,000 | 17,748,634 | |
| 3.375% 2/1/31 | 646,000 | 521,780 | |
| 3.625% 10/1/29 | 1,605,000 | 1,359,973 | |
| 4.5% 1/15/25 | 549,000 | 535,332 | |
| 4.5% 4/1/27 | 1,899,000 | 1,796,208 | |
| 4.75% 1/15/28 | 283,000 | 265,761 | |
| 4.95% 4/1/24 | 600,000 | 596,739 | |
| Piedmont Operating Partnership LP 2.75% 4/1/32 | 343,000 | 231,669 | |
| Realty Income Corp.: | |||
| 2.2% 6/15/28 | 160,000 | 138,860 | |
| 2.85% 12/15/32 | 197,000 | 159,664 | |
| 3.25% 1/15/31 | 172,000 | 148,733 | |
| 3.4% 1/15/28 | 271,000 | 251,344 | |
| Retail Opportunity Investments Partnership LP 4% 12/15/24 | 11,000 | 10,678 | |
| SBA Communications Corp. 3.125% 2/1/29 | 1,245,000 | 1,065,956 | |
| Service Properties Trust: | |||
| 4.375% 2/15/30 | 385,000 | 292,287 | |
| 4.95% 2/15/27 | 50,000 | 43,276 | |
| 4.95% 10/1/29 | 20,000 | 15,766 | |
| 5.5% 12/15/27 | 185,000 | 163,742 | |
| Simon Property Group LP 2.45% 9/13/29 | 262,000 | 221,753 | |
| SITE Centers Corp.: | |||
| 3.625% 2/1/25 | 39,000 | 37,106 | |
| 4.25% 2/1/26 | 287,000 | 268,708 | |
| Store Capital Corp.: | |||
| 2.75% 11/18/30 | 5,212,000 | 3,823,586 | |
| 4.625% 3/15/29 | 149,000 | 128,245 | |
| Sun Communities Operating LP: | |||
| 2.3% 11/1/28 | 392,000 | 329,559 | |
| 2.7% 7/15/31 | 956,000 | 759,049 | |
| Uniti Group LP / Uniti Group Finance, Inc.: | |||
| 6.5% 2/15/29(b) | 3,170,000 | 2,163,527 | |
| 10.5% 2/15/28(b) | 300,000 | 299,290 | |
| Uniti Group, Inc. 6% 1/15/30 (b) | 700,000 | 462,399 | |
| Ventas Realty LP: | |||
| 3% 1/15/30 | 1,026,000 | 874,144 | |
| 3.5% 2/1/25 | 573,000 | 551,132 | |
| 3.75% 5/1/24 | 201,000 | 197,973 | |
| 4% 3/1/28 | 4,720,000 | 4,384,684 | |
| 4.125% 1/15/26 | 34,000 | 32,698 | |
| 4.75% 11/15/30 | 6,487,000 | 6,083,557 | |
| VICI Properties LP: | |||
| 4.375% 5/15/25 | 219,000 | 212,914 | |
| 4.75% 2/15/28 | 5,694,000 | 5,414,636 | |
| 4.95% 2/15/30 | 2,243,000 | 2,109,766 | |
| 5.125% 5/15/32 | 588,000 | 544,970 | |
| VICI Properties LP / VICI Note Co.: | |||
| 3.5% 2/15/25(b) | 155,000 | 148,482 | |
| 4.125% 8/15/30(b) | 400,000 | 350,234 | |
| 4.25% 12/1/26(b) | 505,000 | 475,747 | |
| 4.5% 9/1/26(b) | 826,000 | 781,826 | |
| 4.625% 6/15/25(b) | 95,000 | 91,944 | |
| 4.625% 12/1/29(b) | 305,000 | 275,522 | |
| 5.625% 5/1/24(b) | 400,000 | 396,872 | |
| 5.75% 2/1/27(b) | 60,000 | 58,803 | |
| Vornado Realty LP 2.15% 6/1/26 | 407,000 | 351,804 | |
| WP Carey, Inc.: | |||
| 2.4% 2/1/31 | 3,912,000 | 3,126,733 | |
| 3.85% 7/15/29 | 129,000 | 116,138 | |
| 4% 2/1/25 | 147,000 | 143,113 | |
| 4.6% 4/1/24 | 653,000 | 647,870 | |
| 77,419,234 | |||
| Real Estate Management & Development - 0.2% | |||
| Anywhere Real Estate Group LLC 7% 4/15/30 (b) | 18,400 | 16,583 | |
| Blackstone Property Partners Europe LP 1% 5/4/28 (Reg. S) | EUR | 2,095,000 | 1,779,796 |
| Brandywine Operating Partnership LP: | |||
| 3.95% 11/15/27 | 247,000 | 203,317 | |
| 4.1% 10/1/24 | 1,434,000 | 1,369,148 | |
| 4.55% 10/1/29 | 151,000 | 117,992 | |
| 7.55% 3/15/28 | 2,185,000 | 2,048,784 | |
| CBRE Group, Inc. 2.5% 4/1/31 | 1,155,000 | 927,639 | |
| Greystar Real Estate Partners 7.75% 9/1/30 (b) | 135,000 | 136,357 | |
| GTC Aurora Luxembourg SA 2.25% 6/23/26 (Reg. S) | EUR | 525,000 | 409,884 |
| Heimstaden AB 4.375% 3/6/27 (Reg. S) | EUR | 500,000 | 281,823 |
| Howard Hughes Corp. 4.375% 2/1/31 (b) | 594,000 | 473,388 | |
| Realogy Group LLC/Realogy Co-Issuer Corp. 5.75% 1/15/29 (b) | 2,000 | 1,430 | |
| Samhallsbyggnadsbolaget I Norden AB 2.25% 8/12/27 (Reg. S) | EUR | 570,000 | 367,671 |
| Sirius Real Estate Ltd. 1.125% 6/22/26 (Reg. S) | EUR | 100,000 | 92,977 |
| Tanger Properties LP: | |||
| 2.75% 9/1/31 | 1,012,000 | 752,835 | |
| 3.125% 9/1/26 | 1,289,000 | 1,169,732 | |
| Tritax EuroBox PLC 0.95% 6/2/26 (Reg. S) | EUR | 190,000 | 178,993 |
| Vonovia SE 5% 11/23/30 (Reg. S) | EUR | 200,000 | 212,464 |
| �� | 10,540,813 | ||
TOTAL REAL ESTATE | 87,960,047 | ||
| UTILITIES - 1.5% | |||
| Electric Utilities - 0.8% | |||
| Alabama Power Co. 3.05% 3/15/32 | 1,713,000 | 1,469,919 | |
| AusNet Services Holdings Pty Ltd. 1.625% 3/11/81 (Reg. S) (c) | EUR | 165,000 | 155,159 |
| Chile Electricity LUX MPC SARL 6.01% 1/20/33 (b) | 200,000 | 201,960 | |
| Clearway Energy Operating LLC 4.75% 3/15/28 (b) | 845,000 | 781,326 | |
| Cleco Corporate Holdings LLC: | |||
| 3.375% 9/15/29 | 2,762,000 | 2,339,751 | |
| 3.743% 5/1/26 | 4,110,000 | 3,859,723 | |
| Cleveland Electric Illuminating Co. 5.95% 12/15/36 | 146,000 | 144,290 | |
| Duke Energy Corp.: | |||
| 2.45% 6/1/30 | 464,000 | 385,968 | |
| 3.85% 6/15/34 | EUR | 350,000 | 347,602 |
| Duquesne Light Holdings, Inc.: | |||
| 2.532% 10/1/30(b) | 241,000 | 192,069 | |
| 2.775% 1/7/32(b) | 998,000 | 770,048 | |
| Edison International 5.75% 6/15/27 | 1,616,000 | 1,619,418 | |
| Electricite de France SA: | |||
| 5.5% 1/25/35 (Reg. S) | GBP | 500,000 | 579,374 |
| 5.7% 5/23/28(b) | 250,000 | 250,244 | |
| 6.25% 5/23/33(b) | 250,000 | 257,240 | |
| EnBW Energie Baden-Wuerttemberg AG 1.375% 8/31/81 (Reg. S) (c) | EUR | 500,000 | 437,132 |
| Enel SpA 3.375% (Reg. S) (c)(i) | EUR | 245,000 | 246,405 |
| Entergy Corp. 2.8% 6/15/30 | 476,000 | 401,372 | |
| Eskom Holdings SOC Ltd.: | |||
| 6.35% 8/10/28(b) | 175,000 | 163,648 | |
| 7.125% 2/11/25(b) | 280,000 | 275,890 | |
| 8.45% 8/10/28(b) | 70,000 | 67,795 | |
| Exelon Corp.: | |||
| 3.35% 3/15/32 | 460,000 | 395,232 | |
| 4.05% 4/15/30 | 12,774,000 | 11,803,098 | |
| 4.1% 3/15/52 | 341,000 | 263,842 | |
| 4.7% 4/15/50 | 122,000 | 103,509 | |
| FirstEnergy Corp. 4.15% 7/15/27 | 485,000 | 457,480 | |
| Iberdrola Finanzas SAU 7.375% 1/29/24 | GBP | 250,000 | 318,384 |
| IPALCO Enterprises, Inc. 3.7% 9/1/24 | 100,000 | 97,305 | |
| Israel Electric Corp. Ltd. 3.75% 2/22/32 (Reg. S) (b) | 200,000 | 169,208 | |
| Lamar Funding Ltd. 3.958% 5/7/25 (b) | 200,000 | 190,778 | |
| Mong Duong Finance Holdings BV 5.125% 5/7/29 (b) | 200,000 | 180,512 | |
| NextEra Energy Partners LP 4.25% 9/15/24 (b) | 26,000 | 24,895 | |
| NGG Finance PLC 2.125% 9/5/82 (Reg. S) (c) | EUR | 610,000 | 575,532 |
| NRG Energy, Inc.: | |||
| 3.375% 2/15/29(b) | 90,000 | 74,184 | |
| 3.625% 2/15/31(b) | 175,000 | 136,575 | |
| 3.875% 2/15/32(b) | 300,000 | 231,835 | |
| 5.25% 6/15/29(b) | 155,000 | 139,516 | |
| 5.75% 1/15/28 | 235,000 | 222,328 | |
| NSG Holdings II LLC/NSG Holdings, Inc. 7.75% 12/15/25 (b) | 33,775 | 33,606 | |
| Pacific Gas & Electric Co. 4.95% 7/1/50 | 975,000 | 753,895 | |
| Pattern Energy Operations LP 4.5% 8/15/28 (b) | 145,000 | 132,009 | |
| PG&E Corp.: | |||
| 5% 7/1/28 | 3,712,000 | 3,414,697 | |
| 5.25% 7/1/30 | 515,000 | 457,537 | |
| Southern Co. 1.875% 9/15/81 (c) | EUR | 680,000 | 581,127 |
| Topaz Solar Farms LLC 5.75% 9/30/39 (b) | 117,929 | 111,510 | |
| Vistra Operations Co. LLC: | |||
| 5% 7/31/27(b) | 605,000 | 569,008 | |
| 5.5% 9/1/26(b) | 851,000 | 820,846 | |
| 5.625% 2/15/27(b) | 275,000 | 264,745 | |
| Western Power Distribution PLC 3.625% 11/6/23 (Reg. S) | GBP | 275,000 | 346,716 |
| 37,816,242 | |||
| Independent Power and Renewable Electricity Producers - 0.4% | |||
| Atlantica Sustainable Infrastructure PLC 4.125% 6/15/28 (b) | 565,000 | 503,808 | |
| Aydem Yenilenebilir Enerji A/S 7.75% 2/2/27 (b) | 200,000 | 176,340 | |
| Emera U.S. Finance LP 3.55% 6/15/26 | 57,000 | 53,927 | |
| EnfraGen Energia Sur SA 5.375% 12/30/30 (b) | 400,000 | 293,500 | |
| Investment Energy Resources Ltd. 6.25% 4/26/29 (b) | 350,000 | 324,664 | |
| Sunnova Energy Corp. 5.875% 9/1/26 (b) | 365,000 | 321,184 | |
| Termocandelaria Power Ltd. 7.875% 1/30/29 (b) | 155,000 | 144,508 | |
| TerraForm Power Operating LLC 5% 1/31/28 (b) | 35,000 | 31,785 | |
| The AES Corp.: | |||
| 2.45% 1/15/31 | 17,557,000 | 13,940,796 | |
| 3.3% 7/15/25(b) | 1,621,000 | 1,541,360 | |
| 3.95% 7/15/30(b) | 2,563,000 | 2,278,129 | |
| 19,610,001 | |||
| Multi-Utilities - 0.3% | |||
| Abu Dhabi National Energy Co. PJSC: | |||
| 4% 10/3/49(b) | 150,000 | 122,508 | |
| 4.696% 4/24/33(b) | 200,000 | 195,750 | |
| 4.875% 4/23/30(b) | 30,000 | 30,022 | |
| Berkshire Hathaway Energy Co. 4.05% 4/15/25 | 2,281,000 | 2,231,742 | |
| Engie SA 4.25% 9/6/34 (Reg. S) | EUR | 200,000 | 218,648 |
| NiSource, Inc.: | |||
| 2.95% 9/1/29 | 1,066,000 | 938,024 | |
| 3.6% 5/1/30 | 6,994,000 | 6,268,168 | |
| Puget Energy, Inc.: | |||
| 4.1% 6/15/30 | 560,000 | 500,869 | |
| 4.224% 3/15/32 | 4,134,000 | 3,642,683 | |
| Sempra 6% 10/15/39 | 106,000 | 105,985 | |
| 14,254,399 | |||
| Water Utilities - 0.0% | |||
| Anglian Water (Osprey) Financing PLC 2% 7/31/28 (Reg. S) | GBP | 180,000 | 172,325 |
| Severn Trent Utilities Finance PLC: | |||
| 4.625% 11/30/34 (Reg. S) | GBP | 100,000 | 113,448 |
| 6.125% 2/26/24 | GBP | 145,000 | 183,686 |
| Southern Water Services Finance Ltd. 1.625% 3/30/27 (Reg. S) | GBP | 165,000 | 174,410 |
| Thames Water Utility Finance PLC: | |||
| 1.875% 1/24/24 (Reg. S) | GBP | 290,000 | 357,648 |
| 4% 6/19/25 (Reg. S) | GBP | 340,000 | 401,962 |
| 1,403,479 | |||
TOTAL UTILITIES | 73,084,121 | ||
| TOTAL NONCONVERTIBLE BONDS | 1,509,998,376 | ||
| TOTAL CORPORATE BONDS (Cost $1,607,794,418) | 1,512,482,921 | ||
| U.S. Treasury Obligations - 36.7% | |||
Principal Amount (a) | Value ($) | ||
| U.S. Treasury Bonds: | |||
| 1.125% 5/15/40 | 451,600 | 279,692 | |
| 1.75% 8/15/41 | 12,905,000 | 8,671,051 | |
| 1.875% 11/15/51 | 26,946,000 | 16,557,054 | |
| 2% 11/15/41 | 13,900,000 | 9,726,199 | |
| 2% 8/15/51 | 63,895,000 | 40,565,837 | |
| 2.25% 2/15/52 | 29,700,000 | 20,035,899 | |
| 2.375% 2/15/42 | 9,300,000 | 6,913,954 | |
| 2.875% 5/15/49 | 38,253,600 | 29,651,023 | |
| 2.875% 5/15/52 | 4,491,000 | 3,486,314 | |
| 3% 2/15/47 | 19,862,700 | 15,790,071 | |
| 3% 8/15/52 | 56,140,000 | 44,738,755 | |
| 3.25% 5/15/42 | 11,778,000 | 10,057,768 | |
| 3.625% 2/15/53 | 164,429,000 | 148,140,252 | |
| 3.625% 5/15/53 | 7,727,000 | 6,968,788 | |
| 3.875% 5/15/43 (j) | 4,000,000 | 3,719,193 | |
| 4.125% 8/15/53 | 43,569,000 | 42,983,542 | |
| U.S. Treasury Notes: | |||
| 1.375% 11/15/31 | 240,000 | 194,503 | |
| 1.75% 1/31/29 | 15,000,000 | 13,189,453 | |
| 2.625% 7/31/29 | 30,000,000 | 27,475,781 | |
| 2.75% 8/15/32 | 54,222,000 | 48,670,599 | |
| 2.875% 5/15/32 | 31,868,000 | 28,961,290 | |
| 3.375% 5/15/33 | 73,800,000 | 69,521,906 | |
| 3.5% 1/31/30 | 85,698,000 | 82,206,476 | |
| 3.5% 4/30/30 | 126,964,000 | 121,726,735 | |
| 3.5% 2/15/33 | 101,614,000 | 96,771,458 | |
| 3.625% 3/31/28 | 4,900,000 | 4,763,336 | |
| 3.625% 5/31/28 | 178,200,000 | 173,313,361 | |
| 3.625% 3/31/30 | 189,000 | 182,562 | |
| 3.875% 3/31/25 (j) | 4,000,000 | 3,927,656 | |
| 3.875% 1/15/26 | 4,380,000 | 4,297,191 | |
| 3.875% 9/30/29 | 62,670,000 | 61,414,152 | |
| 3.875% 12/31/29 | 157,420,000 | 154,253,152 | |
| 3.875% 8/15/33 (j) | 5,254,000 | 5,160,413 | |
| 4% 2/15/26 | 1,820,000 | 1,791,278 | |
| 4% 2/29/28 | 30,300,000 | 29,927,168 | |
| 4% 6/30/28 | 66,740,000 | 65,942,249 | |
| 4% 10/31/29 | 45,000,000 | 44,397,070 | |
| 4% 2/28/30 | 168,000 | 165,861 | |
| 4.125% 7/31/28 | 127,000,000 | 126,255,859 | |
| 4.125% 11/15/32 | 160,450,000 | 160,374,789 | |
| 4.375% 10/31/24 | 1,000,000 | 989,648 | |
| 4.625% 3/15/26 | 3,620,000 | 3,617,313 | |
| TOTAL U.S. TREASURY OBLIGATIONS (Cost $1,855,081,105) | 1,737,776,651 | ||
| U.S. Government Agency - Mortgage Securities - 18.6% | |||
Principal Amount (a) | Value ($) | ||
| Fannie Mae - 5.5% | |||
| 1% 12/1/36 | 2,694,034 | 2,212,579 | |
| 1.5% 9/1/35 to 4/1/52 (k) | 24,393,936 | 19,458,285 | |
| 2% 2/1/28 to 3/1/52 (k) | 50,323,164 | 41,763,445 | |
| 2.5% 1/1/28 to 1/1/52 | 92,580,125 | 78,648,266 | |
| 3% 2/1/31 to 5/1/52 | 42,248,077 | 37,797,823 | |
| 3.5% 8/1/34 to 4/1/52 (j) | 15,053,331 | 13,846,672 | |
| 4% 1/1/42 to 6/1/52 | 15,514,759 | 14,478,589 | |
| 4.5% to 4.5% 8/1/33 to 12/1/52 | 18,318,358 | 17,489,487 | |
| 5% 5/1/41 to 4/1/53 | 7,223,716 | 7,058,396 | |
| 5.5% 9/1/52 to 8/1/53 | 23,976,876 | 23,772,142 | |
| 6% 11/1/52 to 6/1/53 | 4,937,521 | 4,982,940 | |
TOTAL FANNIE MAE | 261,508,624 | ||
| Freddie Mac - 3.6% | |||
| 1.5% 8/1/35 to 4/1/51 | 18,374,848 | 14,520,514 | |
| 2% 6/1/35 to 4/1/52 | 48,954,988 | 41,840,053 | |
| 2.5% 1/1/28 to 3/1/52 | 42,302,409 | 35,902,239 | |
| 3% 12/1/30 to 3/1/52 (j) | 19,644,560 | 17,208,839 | |
| 3.5% 3/1/32 to 5/1/52 (j)(l) | 8,546,005 | 7,817,404 | |
| 3.5% 9/1/47 | 53,684 | 49,048 | |
| 4% 5/1/37 to 10/1/52 | 1,912,279 | 1,798,437 | |
| 4.5% 11/1/40 to 9/1/52 | 7,834,836 | 7,558,328 | |
| 5% 9/1/52 to 8/1/53 (k) | 18,387,157 | 17,880,684 | |
| 5.5% 10/1/52 to 8/1/53 (k) | 17,530,332 | 17,420,035 | |
| 6% 3/1/53 to 7/1/53 | 5,733,768 | 5,817,557 | |
| 6.5% 1/1/53 | 747,780 | 760,341 | |
TOTAL FREDDIE MAC | 168,573,479 | ||
| Freddie Mac Multi-family Structured pass-thru certificates - 0.0% | |||
| 3% 10/1/31 | 24,206 | 22,895 | |
| Ginnie Mae - 4.0% | |||
| 2% 11/20/50 to 4/20/51 | 14,129,844 | 11,695,742 | |
| 2% 9/1/53 (m) | 10,250,000 | 8,456,254 | |
| 2% 9/1/53 (m) | 13,700,000 | 11,302,505 | |
| 2% 9/1/53 (m) | 2,350,000 | 1,938,751 | |
| 2% 9/1/53 (m) | 3,250,000 | 2,681,251 | |
| 2% 9/1/53 (m) | 5,150,000 | 4,248,752 | |
| 2% 9/1/53 (m) | 4,700,000 | 3,877,502 | |
| 2% 10/1/53 (m) | 1,350,000 | 1,114,911 | |
| 2% 10/1/53 (m) | 16,950,000 | 13,998,322 | |
| 2.5% 6/20/51 to 12/20/51 | 6,320,016 | 5,385,712 | |
| 2.5% 9/1/53 (m) | 6,050,000 | 5,149,600 | |
| 2.5% 9/1/53 (m) | 6,050,000 | 5,149,600 | |
| 2.5% 9/1/53 (m) | 6,300,000 | 5,362,394 | |
| 2.5% 9/1/53 (m) | 4,850,000 | 4,128,192 | |
| 2.5% 9/1/53 (m) | 3,350,000 | 2,851,432 | |
| 2.5% 9/1/53 (m) | 4,900,000 | 4,170,751 | |
| 2.5% 10/1/53 (m) | 3,450,000 | 2,939,379 | |
| 3% 12/20/42 to 10/20/50 | 976,807 | 867,348 | |
| 3% 9/1/53 (m) | 7,650,000 | 6,726,597 | |
| 3% 9/1/53 (m) | 5,100,000 | 4,484,398 | |
| 3% 9/1/53 (m) | 5,250,000 | 4,616,292 | |
| 3% 9/1/53 (m) | 1,950,000 | 1,714,623 | |
| 3% 9/1/53 (m) | 250,000 | 219,823 | |
| 3% 9/1/53 (m) | 4,200,000 | 3,693,034 | |
| 3% 10/1/53 (m) | 9,000,000 | 7,918,917 | |
| 3.5% 12/20/41 to 2/20/50 | 519,061 | 479,059 | |
| 3.5% 9/1/53 (m) | 6,150,000 | 5,583,920 | |
| 3.5% 9/1/53 (m) | 400,000 | 363,182 | |
| 3.5% 9/1/53 (m) | 1,775,000 | 1,611,619 | |
| 3.5% 9/1/53 (m) | 4,800,000 | 4,358,182 | |
| 3.5% 9/1/53 (m) | 3,550,000 | 3,223,238 | |
| 3.5% 9/1/53 (m) | 3,700,000 | 3,359,432 | |
| 3.5% 9/1/53 (m) | 3,750,000 | 3,404,829 | |
| 3.5% 10/1/53 (m) | 3,200,000 | 2,906,080 | |
| 4% 10/20/40 to 4/20/48 | 1,644,180 | 1,561,958 | |
| 4% 9/1/53 (m) | 6,350,000 | 5,917,495 | |
| 4% 9/1/53 (m) | 4,950,000 | 4,612,850 | |
| 4.5% 4/20/35 to 12/20/48 | 335,015 | 325,881 | |
| 4.5% 9/1/53 (m) | 7,500,000 | 7,147,370 | |
| 4.5% 9/1/53 (m) | 2,800,000 | 2,668,352 | |
| 5% 4/20/48 | 273,246 | 272,447 | |
| 5% 9/1/53 (m) | 9,450,000 | 9,195,773 | |
| 5% 9/1/53 (m) | 850,000 | 827,133 | |
| 5.5% 9/1/53 (m) | 3,600,000 | 3,564,562 | |
| 5.5% 9/1/53 (m) | 3,500,000 | 3,465,547 | |
TOTAL GINNIE MAE | 189,540,991 | ||
| Uniform Mortgage Backed Securities - 5.5% | |||
| 1.5% 9/1/53 (m) | 4,575,000 | 3,448,954 | |
| 1.5% 9/1/53 (m) | 3,825,000 | 2,883,552 | |
| 2% 9/1/53 (m) | 20,200,000 | 16,080,503 | |
| 2% 9/1/53 (m) | 13,350,000 | 10,627,461 | |
| 2% 9/1/53 (m) | 33,150,000 | 26,389,538 | |
| 2% 9/1/53 (m) | 3,200,000 | 2,547,406 | |
| 2% 9/1/53 (m) | 1,000,000 | 796,065 | |
| 2% 9/1/53 (m) | 950,000 | 756,261 | |
| 2% 9/1/53 (m) | 15,725,000 | 12,518,114 | |
| 2% 9/1/53 (m) | 11,100,000 | 8,836,316 | |
| 2% 9/1/53 (m) | 7,050,000 | 5,612,255 | |
| 2% 9/1/53 (m) | 5,350,000 | 4,258,945 | |
| 2% 9/1/53 (m) | 2,850,000 | 2,268,784 | |
| 2% 9/1/53 (m) | 2,025,000 | 1,612,031 | |
| 2% 9/1/53 (m) | 4,000,000 | 3,184,258 | |
| 2% 9/1/53 (m) | 18,650,000 | 14,846,603 | |
| 2% 9/1/53 (m) | 1,300,000 | 1,034,884 | |
| 2% 10/1/53 (m) | 29,100,000 | 23,198,441 | |
| 2% 10/1/53 (m) | 11,650,000 | 9,287,349 | |
| 2% 10/1/53 (m) | 11,650,000 | 9,287,349 | |
| 2% 10/1/53 (m) | 17,450,000 | 13,911,093 | |
| 2.5% 9/1/53 (m) | 4,350,000 | 3,605,233 | |
| 2.5% 9/1/53 (m) | 3,050,000 | 2,527,807 | |
| 2.5% 9/1/53 (m) | 1,900,000 | 1,574,699 | |
| 2.5% 9/1/53 (m) | 525,000 | 435,114 | |
| 3% 9/1/53 (m) | 5,800,000 | 4,996,836 | |
| 3% 9/1/53 (m) | 11,600,000 | 9,993,671 | |
| 3% 9/1/53 (m) | 1,875,000 | 1,615,356 | |
| 3.5% 9/1/53 (m) | 23,175,000 | 20,708,130 | |
| 4% 9/1/53 (m) | 9,050,000 | 8,354,281 | |
| 4% 9/1/53 (m) | 5,050,000 | 4,661,781 | |
| 4% 9/1/53 (m) | 3,975,000 | 3,669,422 | |
| 5% 9/1/38 (m) | 4,600,000 | 4,543,578 | |
| 5% 9/1/38 (m) | 5,350,000 | 5,284,379 | |
| 5.5% 9/1/53 (m) | 8,900,000 | 8,791,531 | |
| 5.5% 9/1/53 (m) | 3,950,000 | 3,901,859 | |
| 5.5% 9/1/53 (m) | 2,175,000 | 2,148,492 | |
| 5.5% 9/1/53 (m) | 300,000 | 296,344 | |
TOTAL UNIFORM MORTGAGE BACKED SECURITIES | 260,494,675 | ||
| TOTAL U.S. GOVERNMENT AGENCY - MORTGAGE SECURITIES (Cost $907,727,532) | 880,140,664 | ||
| Asset-Backed Securities - 4.9% | |||
Principal Amount (a) | Value ($) | ||
| AASET Trust: | |||
| Series 2018-1A Class A, 3.844% 1/16/38 (b) | 232,226 | 143,980 | |
| Series 2019-1 Class A, 3.844% 5/15/39 (b) | 159,937 | 111,956 | |
| Series 2019-2: | |||
Class A, 3.376% 10/16/39 (b) | 490,393 | 411,381 | |
Class B, 4.458% 10/16/39 (b) | 220,258 | 83,995 | |
| Series 2021-1A Class A, 2.95% 11/16/41 (b) | 1,207,836 | 1,064,127 | |
| Series 2021-2A Class A, 2.798% 1/15/47 (b) | 2,316,190 | 2,001,119 | |
| AASET, Ltd. Series 2022-1A Class A, 6% 5/16/47 (b) | 8,960,585 | 8,602,251 | |
| Aimco Series 2018-BA Class AR, CME Term SOFR 3 Month Index + 1.360% 6.6696% 1/15/32 (b)(c)(d) | 409,000 | 407,715 | |
| AIMCO CLO Series 2021-AA Class AR2, CME Term SOFR 3 Month Index + 1.400% 6.7096% 10/17/34 (b)(c)(d) | 3,255,000 | 3,225,295 | |
| AIMCO CLO Ltd. Series 2021-11A Class AR, CME Term SOFR 3 Month Index + 1.390% 6.6996% 10/17/34 (b)(c)(d) | 5,734,000 | 5,695,697 | |
| AIMCO CLO Ltd. / AIMCO CLO LLC Series 2021-14A Class A, CME Term SOFR 3 Month Index + 1.250% 6.5778% 4/20/34 (b)(c)(d) | 2,407,000 | 2,377,813 | |
| Allegro CLO XIV, Ltd. Series 2021-2A Class A1, CME Term SOFR 3 Month Index + 1.420% 6.7296% 10/15/34 (b)(c)(d) | 5,069,000 | 5,019,197 | |
| Allegro CLO XV, Ltd. / Allegro CLO VX LLC Series 2022-1A Class A, CME Term SOFR 3 Month Index + 1.500% 6.8261% 7/20/35 (b)(c)(d) | 1,450,000 | 1,434,196 | |
| Allegro CLO, Ltd. Series 2021-1A Class A, CME Term SOFR 3 Month Index + 1.400% 6.7278% 7/20/34 (b)(c)(d) | 1,078,000 | 1,065,783 | |
| American Money Management Corp. Series 2012-11A Class A1R2, CME Term SOFR 3 Month Index + 1.270% 6.6407% 4/30/31 (b)(c)(d) | 2,240,849 | 2,227,760 | |
| Apollo Aviation Securitization Equity Trust Series 2020-1A: | |||
| Class A, 3.351% 1/16/40 (b) | 233,851 | 196,203 | |
| Class B, 4.335% 1/16/40 (b) | 138,939 | 71,556 | |
| Apollo Aviation Securitization Trust Series 2017-1A Class A, 3.967% 5/16/42 (b)(g) | 139,327 | 117,734 | |
| Ares CLO Series 2019-54A Class A, CME Term SOFR 3 Month Index + 1.580% 6.8896% 10/15/32 (b)(c)(d) | 674,000 | 673,002 | |
| Ares LIX CLO Ltd. Series 2021-59A Class A, CME Term SOFR 3 Month Index + 1.290% 6.6428% 4/25/34 (b)(c)(d) | 1,292,000 | 1,275,336 | |
| Ares LV CLO Ltd. Series 2021-55A Class A1R, CME Term SOFR 3 Month Index + 1.390% 6.6996% 7/15/34 (b)(c)(d) | 1,381,000 | 1,371,742 | |
| Ares LVIII CLO LLC Series 2022-58A Class AR, CME Term SOFR 3 Month Index + 1.330% 6.638% 1/15/35 (b)(c)(d) | 2,223,000 | 2,193,937 | |
| Ares XLI CLO Ltd. / Ares XLI CLO LLC Series 2021-41A Class AR2, CME Term SOFR 3 Month Index + 1.330% 6.6396% 4/15/34 (b)(c)(d) | 5,656,000 | 5,599,400 | |
| Ares XXXIV CLO Ltd. Series 2020-2A Class AR2, CME Term SOFR 3 Month Index + 1.510% 6.8196% 4/17/33 (b)(c)(d) | 369,000 | 368,053 | |
| Babson CLO Ltd. Series 2021-1A Class AR, CME Term SOFR 3 Month Index + 1.410% 6.7196% 10/15/36 (b)(c)(d) | 987,000 | 978,492 | |
| Bank of America Credit Card Master Trust Series 2023-A1 Class A1, 4.79% 5/15/28 | 2,100,000 | 2,082,212 | |
| Barings CLO Ltd.: | |||
| Series 2021-1A Class A, CME Term SOFR 3 Month Index + 1.280% 6.6328% 4/25/34 (b)(c)(d) | 1,547,000 | 1,527,132 | |
| Series 2021-4A Class A, CME Term SOFR 3 Month Index + 1.480% 6.8078% 1/20/32 (b)(c)(d) | 1,550,000 | 1,546,111 | |
| Beechwood Park CLO Ltd. Series 2022-1A Class A1R, CME Term SOFR 3 Month Index + 1.300% 6.608% 1/17/35 (b)(c)(d) | 20,400,000 | 20,189,574 | |
| BETHP Series 2021-1A Class A, CME Term SOFR 3 Month Index + 1.390% 6.6996% 1/15/35 (b)(c)(d) | 1,493,000 | 1,478,077 | |
| Blackbird Capital Aircraft: | |||
| Series 2016-1A Class A, 4.213% 12/16/41 (b) | 234,599 | 215,972 | |
| Series 2021-1A Class A, 2.443% 7/15/46 (b) | 1,968,566 | 1,692,455 | |
| Bristol Park CLO, Ltd. Series 2020-1A Class AR, CME Term SOFR 3 Month Index + 1.250% 6.5596% 4/15/29 (b)(c)(d) | 1,890,286 | 1,883,626 | |
| Capital One Multi-Asset Execution Trust Series 2023-A1 Class A, 4.42% 5/15/28 | 1,600,000 | 1,571,269 | |
| Castlelake Aircraft Securitization Trust Series 2019-1A: | |||
| Class A, 3.967% 4/15/39 (b) | 983,026 | 874,166 | |
| Class B, 5.095% 4/15/39 (b) | 186,315 | 119,245 | |
| Castlelake Aircraft Structured Trust: | |||
| Series 2018-1 Class A, 4.125% 6/15/43 (b) | 127,619 | 116,024 | |
| Series 2021-1A Class A, 3.474% 1/15/46 (b) | 293,473 | 270,738 | |
| Cedar Funding Ltd.: | |||
| Series 2021-10A Class AR, CME Term SOFR 3 Month Index + 1.360% 6.6878% 10/20/32 (b)(c)(d) | 1,192,000 | 1,187,094 | |
| Series 2022-15A Class A, CME Term SOFR 3 Month Index + 1.320% 6.6461% 4/20/35 (b)(c)(d) | 1,985,000 | 1,959,078 | |
| Cedar Funding XII CLO Ltd. / Cedar Funding XII CLO LLC Series 2021-12A Class A1R, CME Term SOFR 3 Month Index + 1.390% 6.7428% 10/25/34 (b)(c)(d) | 1,571,000 | 1,548,144 | |
| Cedar Funding Xvii Clo Ltd. Series 2023-17A Class A, CME Term SOFR 3 Month Index + 1.850% 7.2758% 7/20/36 (b)(c)(d) | 2,472,000 | 2,471,637 | |
| CEDF Series 2021-6A Class ARR, CME Term SOFR 3 Month Index + 1.310% 6.6378% 4/20/34 (b)(c)(d) | 12,418,000 | 12,224,813 | |
| Cent CLO Ltd. / Cent CLO Series 2021-29A Class AR, CME Term SOFR 3 Month Index + 1.430% 6.7578% 10/20/34 (b)(c)(d) | 1,501,000 | 1,477,825 | |
| CFMT LLC Series 2023 HB12 Class A, 4.25% 4/25/33 (b) | 1,163,925 | 1,114,171 | |
| Columbia Cent CLO 31 Ltd. Series 2021-31A Class A1, CME Term SOFR 3 Month Index + 1.460% 6.7878% 4/20/34 (b)(c)(d) | 2,765,000 | 2,721,180 | |
| Columbia Cent Clo 32 Ltd. / Coliseum Series 2022-32A Class A1, CME Term SOFR 3 Month Index + 1.700% 7.0456% 7/24/34 (b)(c)(d) | 2,111,000 | 2,100,975 | |
| Columbia Cent CLO Ltd. / Columbia Cent CLO Corp. Series 2021-30A Class A1, CME Term SOFR 3 Month Index + 1.570% 6.8978% 1/20/34 (b)(c)(d) | 2,090,000 | 2,072,465 | |
| DB Master Finance LLC Series 2017-1A Class A2II, 4.03% 11/20/47 (b) | 275,940 | 254,012 | |
| Discover Card Execution Note Trust Series 2023-A2 Class A, 4.93% 6/15/28 | 1,300,000 | 1,292,674 | |
| Dllaa 2023-1A Series 2023-1A: | |||
| Class A2, 5.93% 7/20/26 (b) | 964,000 | 964,776 | |
| Class A3, 5.64% 2/22/28 (b) | 733,000 | 735,958 | |
| Dryden 98 CLO Ltd. Series 2022-98A Class A, CME Term SOFR 3 Month Index + 1.300% 6.6261% 4/20/35 (b)(c)(d) | 3,389,000 | 3,340,971 | |
| Dryden CLO, Ltd.: | |||
| Series 2021-76A Class A1R, CME Term SOFR 3 Month Index + 1.410% 6.7378% 10/20/34 (b)(c)(d) | 2,508,000 | 2,488,944 | |
| Series 2021-83A Class A, CME Term SOFR 3 Month Index + 1.480% 6.7915% 1/18/32 (b)(c)(d) | 1,277,000 | 1,273,847 | |
| Dryden Senior Loan Fund: | |||
| Series 2020-78A Class A, CME Term SOFR 3 Month Index + 1.440% 6.7496% 4/17/33 (b)(c)(d) | 2,400,000 | 2,390,561 | |
| Series 2021-85A Class AR, CME Term SOFR 3 Month Index + 1.410% 6.7196% 10/15/35 (b)(c)(d) | 3,895,000 | 3,859,034 | |
| Series 2021-90A Class A1A, CME Term SOFR 3 Month Index + 1.390% 6.7714% 2/20/35 (b)(c)(d) | 2,292,000 | 2,265,690 | |
| Eaton Vance CLO, Ltd.: | |||
| Series 2021-1A Class AR, CME Term SOFR 3 Month Index + 1.360% 6.6696% 4/15/31 (b)(c)(d) | 684,000 | 679,878 | |
| Series 2021-2A Class AR, CME Term SOFR 3 Month Index + 1.410% 6.7196% 1/15/35 (b)(c)(d) | 1,782,000 | 1,767,423 | |
| Eaton Vance CLO, Ltd. / Eaton Vance CLO LLC Series 2021-1A Class A13R, CME Term SOFR 3 Month Index + 1.510% 6.8196% 1/15/34 (b)(c)(d) | 330,000 | 327,633 | |
| Flatiron CLO Ltd. Series 2021-1A: | |||
| Class A1, 3 month U.S. LIBOR + 1.110% 6.6917% 7/19/34 (b)(c)(d) | 3,076,000 | 3,056,572 | |
| Class AR, CME Term SOFR 3 Month Index + 1.340% 6.7134% 11/16/34 (b)(c)(d) | 1,500,000 | 1,487,903 | |
| Flatiron CLO Ltd. / Flatiron CLO LLC Series 2020-1A Class A, CME Term SOFR 3 Month Index + 1.560% 6.9414% 11/20/33 (b)(c)(d) | 1,833,000 | 1,830,802 | |
| Ford Credit Floorplan Master Owner Trust Series 2023-1 Class A1, 4.92% 5/15/28 (b) | 1,500,000 | 1,482,035 | |
| GM Financial Automobile Leasing Series 2023-2 Class A2A, 5.44% 10/20/25 | 884,000 | 881,302 | |
| Gm Financial Consumer Automobile Re Series 2023-3 Class A3, 5.45% 6/16/28 | 1,490,000 | 1,497,964 | |
| GM Financial Consumer Automobile Receivables Trust: | |||
| Series 2022-2 Class A3, 3.1% 2/16/27 | 2,800,000 | 2,717,468 | |
| Series 2022-4 Class A3, 4.82% 8/16/27 | 3,291,000 | 3,259,041 | |
| Gm Financial Leasing Trust 202 Series 2023-3 Class A3, 5.38% 11/20/26 | 772,000 | 771,617 | |
| Honda Auto Receivables 2023-3 Series 2023-3 Class A3, 5.41% 2/18/28 | 800,000 | 801,917 | |
| Horizon Aircraft Finance I Ltd. Series 2018-1 Class A, 4.458% 12/15/38 (b) | 190,645 | 163,249 | |
| Horizon Aircraft Finance Ltd. Series 2019-1 Class A, 3.721% 7/15/39 (b) | 2,050,125 | 1,746,973 | |
| Hyundai Auto Lease Securitizat Series 2023-B Class A2A, 5.47% 9/15/25 (b) | 2,000,000 | 1,994,524 | |
| Invesco CLO Ltd. Series 2021-3A Class A, CME Term SOFR 3 Month Index + 1.390% 6.7372% 10/22/34 (b)(c)(d) | 1,056,000 | 1,049,267 | |
| KKR CLO Ltd. Series 2022-41A Class A1, CME Term SOFR 3 Month Index + 1.330% 6.638% 4/15/35 (b)(c)(d) | 2,473,000 | 2,430,890 | |
| Lucali CLO Ltd. Series 2021-1A Class A, CME Term SOFR 3 Month Index + 1.470% 6.7796% 1/15/33 (b)(c)(d) | 760,000 | 758,966 | |
| Madison Park Funding Series 2020-19A Class A1R2, CME Term SOFR 3 Month Index + 1.180% 6.5272% 1/22/28 (b)(c)(d) | 1,618,908 | 1,612,386 | |
| Madison Park Funding L Ltd. / Madison Park Funding L LLC Series 2021-50A Class A, CME Term SOFR 3 Month Index + 1.400% 6.7217% 4/19/34 (b)(c)(d) | 2,200,000 | 2,186,004 | |
| Madison Park Funding LII Ltd. / Madison Park Funding LII LLC Series 2021-52A Class A, CME Term SOFR 3 Month Index + 1.360% 6.7072% 1/22/35 (b)(c)(d) | 1,719,000 | 1,696,038 | |
| Madison Park Funding XLV Ltd./Madison Park Funding XLV LLC Series 2021-45A Class AR, CME Term SOFR 3 Month Index + 1.380% 6.6896% 7/15/34 (b)(c)(d) | 2,347,000 | 2,328,015 | |
| Madison Park Funding XXXII, Ltd. / Madison Park Funding XXXII LLC Series 2021-32A Class A2R, CME Term SOFR 3 Month Index + 1.460% 6.8072% 1/22/31 (b)(c)(d) | 390,000 | 385,747 | |
| Magnetite CLO LTD Series 2023-36A Class A, CME Term SOFR 3 Month Index + 1.800% 6.9585% 4/22/36 (b)(c)(d) | 1,513,000 | 1,516,465 | |
| Magnetite CLO Ltd. Series 2021-27A Class AR, CME Term SOFR 3 Month Index + 1.400% 6.7278% 10/20/34 (b)(c)(d) | 348,000 | 345,377 | |
| Magnetite IX, Ltd. / Magnetite IX LLC Series 2021-30A Class A, CME Term SOFR 3 Month Index + 1.390% 6.7428% 10/25/34 (b)(c)(d) | 1,800,000 | 1,787,794 | |
| Magnetite XXI Ltd. Series 2021-21A Class AR, CME Term SOFR 3 Month Index + 1.280% 6.6078% 4/20/34 (b)(c)(d) | 1,238,000 | 1,223,950 | |
| Magnetite XXIII, Ltd. Series 2021-23A Class AR, CME Term SOFR 3 Month Index + 1.390% 6.7428% 1/25/35 (b)(c)(d) | 1,275,000 | 1,269,120 | |
| Magnetite XXIX, Ltd. / Magnetite XXIX LLC Series 2021-29A Class A, CME Term SOFR 3 Month Index + 1.250% 6.5596% 1/15/34 (b)(c)(d) | 1,460,000 | 1,449,072 | |
| Marlette Funding Trust Series 2022-1A Class A, 1.36% 4/15/32 (b) | 17,367 | 17,334 | |
| Marlette Funding Trust 2023-3 Series 2023-3A Class A, 6.49% 9/15/33 (b) | 2,068,000 | 2,067,040 | |
| Milos CLO, Ltd. Series 2020-1A Class AR, CME Term SOFR 3 Month Index + 1.330% 6.6578% 10/20/30 (b)(c)(d) | 1,377,918 | 1,376,233 | |
| Peace Park CLO, Ltd. Series 2021-1A Class A, 3 month U.S. LIBOR + 1.130% 6.7178% 10/20/34 (b)(c)(d) | 1,494,000 | 1,482,299 | |
| Planet Fitness Master Issuer LLC: | |||
| Series 2018-1A Class A2II, 4.666% 9/5/48 (b) | 1,571,625 | 1,508,879 | |
| Series 2019-1A Class A2, 3.858% 12/5/49 (b) | 2,279,330 | 1,929,154 | |
| Series 2022-1A: | |||
Class A2I, 3.251% 12/5/51 (b) | 1,299,550 | 1,166,255 | |
Class A2II, 4.008% 12/5/51 (b) | 1,162,288 | 958,413 | |
| Project Silver Series 2019-1 Class A, 3.967% 7/15/44 (b) | 415,077 | 351,877 | |
| Rockland Park CLO Ltd. Series 2021-1A Class A, CME Term SOFR 3 Month Index + 1.380% 6.7078% 4/20/34 (b)(c)(d) | 1,839,000 | 1,825,974 | |
| RR 7 Ltd. Series 2022-7A Class A1AB, CME Term SOFR 3 Month Index + 1.340% 6.648% 1/15/37 (b)(c)(d) | 2,290,000 | 2,259,962 | |
| Sapphire Aviation Finance Series 2020-1A: | |||
| Class A, 3.228% 3/15/40 (b) | 703,149 | 594,962 | |
| Class B, 4.335% 3/15/40 (b) | 228,997 | 163,742 | |
| SBA Tower Trust: | |||
| Series 2019, 2.836% 1/15/50 (b) | 699,000 | 666,875 | |
| 1.884% 7/15/50 (b) | 403,000 | 363,843 | |
| 2.328% 7/15/52 (b) | 308,000 | 264,799 | |
| Stratus CLO, Ltd. Series 2022-1A Class A, CME Term SOFR 3 Month Index + 1.750% 7.0761% 7/20/30 (b)(c)(d) | 298,633 | 298,663 | |
| SYMP Series 2022-32A Class A1, CME Term SOFR 3 Month Index + 1.320% 6.6656% 4/23/35 (b)(c)(d) | 6,927,000 | 6,839,900 | |
| Symphony CLO Ltd. Series 2020-22A Class A1A, CME Term SOFR 3 Month Index + 1.550% 6.8615% 4/18/33 (b)(c)(d) | 2,900,000 | 2,890,471 | |
| Symphony CLO XIX, Ltd. / Symphony CLO XIX LLC Series 2018-19A Class A, CME Term SOFR 3 Month Index + 1.220% 6.5296% 4/16/31 (b)(c)(d) | 903,844 | 898,070 | |
| Symphony CLO XXI, Ltd. Series 2021-21A Class AR, CME Term SOFR 3 Month Index + 1.320% 6.6296% 7/15/32 (b)(c)(d) | 250,000 | 248,524 | |
| Symphony CLO XXV Ltd. / Symphony CLO XXV LLC Series 2021-25A Class A, CME Term SOFR 3 Month Index + 1.240% 6.5617% 4/19/34 (b)(c)(d) | 1,566,000 | 1,541,635 | |
| Symphony CLO XXVI Ltd. / Symphony CLO XXVI LLC Series 2021-26A Class AR, CME Term SOFR 3 Month Index + 1.340% 6.6678% 4/20/33 (b)(c)(d) | 1,720,000 | 1,709,582 | |
| Tesla Auto Lease Trust 23-A Series 2023-A Class A3, 5.89% 6/22/26 (b) | 1,743,000 | 1,738,503 | |
| Thunderbolt Aircraft Lease Ltd.: | |||
| Series 2017-A Class A, 4.212% 5/17/32 (b) | 96,956 | 87,661 | |
| Series 2018-A Class A, 4.147% 9/15/38 (b)(c) | 4,169,881 | 3,544,483 | |
| Thunderbolt III Aircraft Lease Ltd. Series 2019-1 Class A, 3.671% 11/15/39 (b) | 832,116 | 690,706 | |
| Toyota Auto Receivables Owner Trust Series 2022-C Class A3, 3.76% 4/15/27 | 3,750,000 | 3,655,346 | |
| Toyota Lease Owner Trust Series 2023 A: | |||
| Class A2, 5.3% 8/20/25 (b) | 1,771,000 | 1,762,997 | |
| Class A3, 4.93% 4/20/26 (b) | 1,472,000 | 1,456,760 | |
| Valley Stream Park Clo Ltd. / Vy Series 2022-1A Class A, CME Term SOFR 3 Month Index + 2.400% 7.7261% 10/20/34 (b)(c)(d) | 2,041,000 | 2,042,872 | |
| Vcat 2021-Npl5 LLC Series 2021-NPL5 Class A1, 1.8677% 8/25/51 (b)(c) | 710,097 | 675,807 | |
| Verizon Master Trust Series 2023 2 Class A, 4.89% 4/13/28 | 800,000 | 792,256 | |
| Voya CLO Ltd. Series 2019-2A Class A, CME Term SOFR 3 Month Index + 1.530% 6.8578% 7/20/32 (b)(c)(d) | 679,000 | 677,969 | |
| Voya CLO Ltd./Voya CLO LLC: | |||
| Series 2021-2A Class A1R, CME Term SOFR 3 Month Index + 1.420% 6.7417% 7/19/34 (b)(c)(d) | 960,000 | 953,240 | |
| Series 2021-3A Class AR, CME Term SOFR 3 Month Index + 1.410% 6.7378% 10/20/34 (b)(c)(d) | 1,995,000 | 1,980,059 | |
| Voya CLO, Ltd. Series 2021-1A Class AR, 3 month U.S. LIBOR + 1.150% 6.7196% 7/16/34 (b)(c)(d) | 2,549,000 | 2,525,039 | |
| World Omni Auto Receivables Trust: | |||
| Series 2023 B: | |||
Class A2A, 5.25% 11/16/26 | 849,000 | 844,903 | |
Class A3, 4.66% 5/15/28 | 1,559,000 | 1,537,027 | |
| Series 2023-C Class A3, 5.15% 11/15/28 | 949,000 | 947,452 | |
| World Omni Automobile Lease Series 2023-A Class A2A, 5.47% 11/17/25 | 1,740,000 | 1,733,998 | |
| TOTAL ASSET-BACKED SECURITIES (Cost $235,776,972) | 231,605,126 | ||
| Collateralized Mortgage Obligations - 1.3% | |||
Principal Amount (a) | Value ($) | ||
| Private Sponsor - 0.1% | |||
| Binom Securitization Trust 202 Series 2022-RPL1 Class A1, 3% 2/25/61 (b) | 1,136,615 | 1,015,881 | |
| Cascade Funding Mortgage Trust Series 2021-HB6 Class A, 0.8983% 6/25/36 (b) | 611,460 | 591,323 | |
| Finance of America HECM Buyout sequential payer Series 2022-HB1 Class A, 2.6948% 2/25/32 (b)(c) | 1,284,801 | 1,209,932 | |
| MFA Trust sequential payer Series 2022-RPL1 Class A1, 3.3% 8/25/61 (b) | 1,983,885 | 1,794,196 | |
| NYMT Loan Trust sequential payer Series 2021-CP1 Class A1, 2.0424% 7/25/61 (b) | 417,956 | 371,206 | |
| Ocwen Ln Investment Trust 2023-Hb1 Series 2023-HB1 Class A, 3% 6/25/36 (b) | 615,613 | 580,342 | |
| RMF Buyout Issuance Trust sequential payer Series 2022-HB1 Class A, 4.272% 4/25/32 (b) | 374,668 | 353,418 | |
| Towd Point Mortgage Trust sequential payer Series 2022-K147 Class A2, 3.75% 7/25/62 (b) | 1,481,785 | 1,350,888 | |
TOTAL PRIVATE SPONSOR | 7,267,186 | ||
| U.S. Government Agency - 1.2% | |||
| Fannie Mae: | |||
| planned amortization class Series 2021-69 Class JK, 1.5% 10/25/51 | 402,183 | 322,513 | |
| sequential payer: | |||
Series 2020-101 Class BA, 1.5% 9/25/45 | 567,809 | 474,041 | |
Series 2020-43 Class MA, 2% 1/25/45 | 1,580,639 | 1,384,236 | |
Series 2020-49 Class JA, 2% 8/25/44 | 335,070 | 297,531 | |
Series 2020-80 Class BA, 1.5% 3/25/45 | 844,227 | 708,387 | |
Series 2021-68 Class A, 2% 7/25/49 | 662,452 | 531,287 | |
Series 2021-85 Class L, 2.5% 8/25/48 | 362,102 | 312,365 | |
Series 2021-95: | |||
Class 0, 2.5% 9/25/48 | 1,131,759 | 971,890 | |
Class BA, 2.5% 6/25/49 | 1,694,443 | 1,457,009 | |
Series 2021-96 Class HA, 2.5% 2/25/50 | 597,297 | 518,498 | |
Series 2022-1 Class KA, 3% 5/25/48 | 364,464 | 324,010 | |
Series 2022-11 Class B, 3% 6/25/49 | 479,350 | 430,117 | |
Series 2022-13: | |||
Class HA, 3% 8/25/46 | 404,154 | 368,826 | |
Class JA, 3% 5/25/48 | 756,513 | 675,260 | |
Class MA, 3% 5/25/44 | 6,678,079 | 6,158,416 | |
Series 2022-3: | |||
Class D, 2% 2/25/48 | 1,753,612 | 1,503,568 | |
Class N, 2% 10/25/47 | 4,282,951 | 3,581,072 | |
Series 2022-30 Class E, 4.5% 7/25/48 | 922,679 | 886,715 | |
Series 2022-35 Class CK, 4% 3/25/47 | 3,125,803 | 2,934,453 | |
Series 2022-4 Class B, 2.5% 5/25/49 | 436,244 | 374,497 | |
Series 2022-49 Class TC, 4% 12/25/48 | 302,854 | 289,300 | |
Series 2022-7: | |||
Class A, 3% 5/25/48 | 519,039 | 461,483 | |
Class E, 2.5% 11/25/47 | 1,682,131 | 1,473,237 | |
Series 2022-9 Class BA, 3% 5/25/48 | 608,499 | 542,528 | |
| Series 2020-45 Class JL, 3% 7/25/40 | 37,113 | 33,414 | |
| Series 2021-59 Class H, 2% 6/25/48 | 375,622 | 306,202 | |
| Series 2021-66: | |||
Class DA, 2% 1/25/48 | 405,771 | 331,861 | |
Class DM, 2% 1/25/48 | 431,218 | 352,673 | |
| Series 2022-28 Class A, 2.5% 2/25/52 | 1,414,337 | 1,278,144 | |
| Series 2023-13 Class CK, 1.5% 11/25/50 | 2,495,104 | 1,952,755 | |
| Freddie Mac: | |||
| planned amortization class: | |||
Series 2021-5141 Class JM, 1.5% 4/25/51 | 294,221 | 235,525 | |
Series 2021-5148: | |||
Class AD, 1.5% 10/25/51 | 396,524 | 318,684 | |
Class PC, 1.5% 10/25/51 | 396,426 | 315,158 | |
| sequential payer: | |||
Series 2020-4993 Class LA, 2% 8/25/44 | 1,514,687 | 1,338,195 | |
Series 2020-5018: | |||
Class LC, 3% 10/25/40 | 249,161 | 224,359 | |
Class LY, 3% 10/25/40 | 188,792 | 170,034 | |
Series 2020-5058 Class BE, 3% 11/25/50 | 937,752 | 804,608 | |
Series 2021-5169 Class BA, 2.5% 5/25/49 | 1,036,223 | 891,877 | |
Series 2021-5175 Class CB, 2.5% 4/25/50 | 2,134,460 | 1,827,865 | |
Series 2021-5178 Class TP, 2.5% 4/25/49 | 869,309 | 747,031 | |
Series 2021-5180 Class KA, 2.5% 10/25/47 | 431,025 | 377,873 | |
Series 2022-5189: | |||
Class DA, 2.5% 5/25/49 | 265,544 | 227,046 | |
Class TP, 2.5% 5/25/49 | 626,536 | 541,586 | |
Series 2022-5190: | |||
Class BA, 2.5% 11/25/47 | 265,434 | 229,270 | |
Class CA, 2.5% 5/25/49 | 523,976 | 447,661 | |
Series 2022-5191 Class CA, 2.5% 4/25/50 | 507,436 | 435,304 | |
Series 2022-5197: | |||
Class A, 2.5% 6/25/49 | 523,977 | 452,801 | |
Class DA, 2.5% 11/25/47 | 201,595 | 174,173 | |
Series 2022-5198 Class BA, 2.5% 11/25/47 | 859,781 | 752,108 | |
Series 2022-5202: | |||
Class AG, 3% 1/25/49 | 306,507 | 272,989 | |
Class BC, 3% 5/25/48 | 1,096,486 | 980,893 | |
Class LB, 2.5% 10/25/47 | 215,237 | 185,506 | |
Class UA, 3% 4/25/50 | 349,650 | 310,029 | |
| Series 2020-5000 Class BA, 2% 4/25/45 | 1,114,107 | 973,469 | |
| Series 2020-5041 Class LB, 3% 11/25/40 | 423,528 | 381,271 | |
| Series 2021-5083 Class VA, 1% 8/15/38 | 1,195,532 | 1,104,196 | |
| Series 2021-5176 Class AG, 2% 1/25/47 | 1,620,952 | 1,381,424 | |
| Series 2021-5182 Class A, 2.5% 10/25/48 | 2,792,060 | 2,395,482 | |
| Series 2022-5210 Class AB, 3% 1/25/42 | 719,668 | 651,318 | |
| Series 2022-5213 Class AH, 2.25% 4/25/37 | 1,169,914 | 1,065,964 | |
| Series 2022-5214 Class CB, 3.25% 4/25/52 | 1,745,318 | 1,587,869 | |
| Series 2022-5236 Class P, 5% 4/25/48 | 465,748 | 457,703 | |
| Series 2022-5266 Class CD, 4.5% 10/25/44 | 1,075,712 | 1,043,034 | |
| Freddie Mac Multi-family Structured pass-thru certificates: | |||
| planned amortization class Series 20XX-5165 Class PC, 1.5% 11/25/51 | 504,797 | 407,216 | |
| sequential payer Series 2021-5159 Class GC, 2% 11/25/47 | 346,127 | 295,951 | |
TOTAL U.S. GOVERNMENT AGENCY | 55,241,760 | ||
| TOTAL COLLATERALIZED MORTGAGE OBLIGATIONS (Cost $63,674,548) | 62,508,946 | ||
| Commercial Mortgage Securities - 4.2% | |||
Principal Amount (a) | Value ($) | ||
| BAMLL Commercial Mortgage Securities Trust: | |||
| floater Series 2022-DKLX: | |||
Class A, CME Term SOFR 1 Month Index + 1.150% 6.461% 1/15/39 (b)(c)(d) | 1,235,000 | 1,201,403 | |
Class B, CME Term SOFR 1 Month Index + 1.550% 6.861% 1/15/39 (b)(c)(d) | 311,000 | 300,895 | |
Class C, CME Term SOFR 1 Month Index + 2.150% 7.461% 1/15/39 (b)(c)(d) | 167,000 | 160,624 | |
| sequential payer Series 2019-BPR Class ANM, 3.112% 11/5/32 (b) | 496,000 | 451,784 | |
| Series 2019-BPR Class BNM, 3.465% 11/5/32 (b) | 111,000 | 90,588 | |
| BANK: | |||
| sequential payer: | |||
Series 2017-BNK9 Class A4, 3.538% 11/15/54 | 3,300,000 | 3,033,982 | |
Series 2018-BN10 Class A5, 3.688% 2/15/61 | 2,900,000 | 2,679,784 | |
Series 2018-BN14: | |||
| Class A4, 4.231% 9/15/60 | 1,600,000 | 1,505,127 | |
| Class ASB, 4.185% 9/15/60 | 321,000 | 309,958 | |
Series 2019-BN21 Class A5, 2.851% 10/17/52 | 112,000 | 96,442 | |
Series 2022-BNK44, Class A5, 5.9371% 11/15/55 (c) | 7,185,000 | 7,336,333 | |
Series 2023-5YR1: | |||
| Class A2, 5.779% 4/15/56 | 1,300,000 | 1,297,017 | |
| Class A3, 6.26% 4/15/56 | 1,900,000 | 1,930,322 | |
| Series 2020-BN30 Class MCDE, 3.0155% 12/15/53 (c) | 5,208,000 | 3,040,915 | |
| Series 2021-BN33 Class XA, 1.1682% 5/15/64 (c)(n) | 9,649,325 | 521,567 | |
| BANK Trust sequential payer Series 2017-BNK5 Class A5, 3.39% 6/15/60 | 1,700,000 | 1,567,014 | |
| Benchmark 2023-V3 Mtg Trust sequential payer Series 2023-V3 Class A3, 6.3629% 7/15/56 | 1,000,000 | 1,024,907 | |
| Benchmark Mortgage Trust: | |||
| sequential payer: | |||
Series 2018-B4 Class A5, 4.121% 7/15/51 | 127,000 | 118,184 | |
Series 2019-B10 Class ASB, 3.615% 3/15/62 | 500,000 | 468,634 | |
Series 2019-B9 Class AAB, 3.9325% 3/15/52 | 1,000,000 | 938,388 | |
| Series 2021-B27 Class XA, 1.3791% 7/15/54 (c)(n) | 4,167,041 | 280,174 | |
| BFLD Trust floater sequential payer Series 2020-OBRK Class A, CME Term SOFR 1 Month Index + 2.160% 7.4745% 11/15/28 (b)(c)(d) | 701,000 | 698,982 | |
| Bmo 2023-5C1 Mtg Trust sequential payer Series 2023-5C1 Class A3, 6.534% 8/15/56 | 700,000 | 720,464 | |
| BPR Trust floater Series 2022-OANA: | |||
| Class A, CME Term SOFR 1 Month Index + 1.890% 7.2085% 4/15/37 (b)(c)(d) | 7,887,000 | 7,744,498 | |
| Class B, CME Term SOFR 1 Month Index + 2.440% 7.7575% 4/15/37 (b)(c)(d) | 1,165,000 | 1,135,058 | |
| BX Commercial Mortgage Trust: | |||
| floater: | |||
Series 2021-PAC: | |||
| Class A, CME Term SOFR 1 Month Index + 0.800% 6.1136% 10/15/36 (b)(c)(d) | 2,043,000 | 1,995,570 | |
| Class B, CME Term SOFR 1 Month Index + 1.010% 6.3233% 10/15/36 (b)(c)(d) | 306,000 | 296,592 | |
| Class C, CME Term SOFR 1 Month Index + 1.210% 6.5231% 10/15/36 (b)(c)(d) | 5,034,000 | 4,863,518 | |
| Class D, CME Term SOFR 1 Month Index + 1.410% 6.7228% 10/15/36 (b)(c)(d) | 1,147,000 | 1,098,806 | |
| Class E, CME Term SOFR 1 Month Index + 2.060% 7.372% 10/15/36 (b)(c)(d) | 1,381,000 | 1,326,416 | |
Series 2022-LP2: | |||
| Class A, CME Term SOFR 1 Month Index + 1.010% 6.3234% 2/15/39 (b)(c)(d) | 1,940,116 | 1,886,578 | |
| Class B, CME Term SOFR 1 Month Index + 1.310% 6.6228% 2/15/39 (b)(c)(d) | 685,319 | 665,275 | |
| Class C, CME Term SOFR 1 Month Index + 1.560% 6.8722% 2/15/39 (b)(c)(d) | 1,495,388 | 1,429,261 | |
| Class D, CME Term SOFR 1 Month Index + 1.960% 7.2713% 2/15/39 (b)(c)(d) | 685,319 | 653,084 | |
| floater sequential payer Series 2019-CALM Class A, CME Term SOFR 1 Month Index + 0.990% 6.3005% 11/15/32 (b)(c)(d) | 420,361 | 417,838 | |
| Bx Commercial Mortgage Trust 2: | |||
| floater Series 2019-IMC: | |||
Class B, CME Term SOFR 1 Month Index + 1.410% 6.7245% 4/15/34 (b)(c)(d) | 1,917,000 | 1,906,301 | |
Class C, CME Term SOFR 1 Month Index + 1.710% 7.0245% 4/15/34 (b)(c)(d) | 210,000 | 208,571 | |
Class D, CME Term SOFR 1 Month Index + 2.010% 7.3245% 4/15/34 (b)(c)(d) | 220,000 | 218,034 | |
| floater sequential payer Series 2019-IMC Class A, CME Term SOFR 1 Month Index + 1.110% 6.4245% 4/15/34 (b)(c)(d) | 500,000 | 498,043 | |
| BX Trust: | |||
| floater: | |||
Series 2019-XL: | |||
| Class B, CME Term SOFR 1 Month Index + 1.190% 6.505% 10/15/36 (b)(c)(d) | 1,159,400 | 1,152,067 | |
| Class C, CME Term SOFR 1 Month Index + 1.360% 6.675% 10/15/36 (b)(c)(d) | 708,050 | 702,676 | |
| Class D, CME Term SOFR 1 Month Index + 1.560% 6.875% 10/15/36 (b)(c)(d) | 1,244,400 | 1,233,382 | |
| Class E, CME Term SOFR 1 Month Index + 1.910% 7.225% 10/15/36 (b)(c)(d) | 3,324,350 | 3,290,712 | |
Series 2021-SOAR Class G, CME Term SOFR 1 Month Index + 2.910% 8.2255% 6/15/38 (b)(c)(d) | 208,891 | 199,451 | |
Series 2022-GPA Class A, CME Term SOFR 1 Month Index + 2.160% 7.4755% 8/15/39 (b)(c)(d) | 1,156,000 | 1,155,999 | |
Series 2022-IND: | |||
| Class A, CME Term SOFR 1 Month Index + 1.490% 6.8015% 4/15/37 (b)(c)(d) | 2,697,585 | 2,684,896 | |
| Class B, CME Term SOFR 1 Month Index + 1.940% 7.2505% 4/15/37 (b)(c)(d) | 965,772 | 949,728 | |
| Class C, CME Term SOFR 1 Month Index + 2.290% 7.6005% 4/15/37 (b)(c)(d) | 218,181 | 212,181 | |
| Class D, CME Term SOFR 1 Month Index + 2.830% 8.1495% 4/15/37 (b)(c)(d) | 182,887 | 176,754 | |
| floater sequential payer: | |||
Series 2019-XL Class A, CME Term SOFR 1 Month Index + 1.030% 6.345% 10/15/36 (b)(c)(d) | 4,506,427 | 4,495,024 | |
Series 2021-SOAR Class A, CME Term SOFR 1 Month Index + 0.780% 6.0955% 6/15/38 (b)(c)(d) | 284,092 | 278,563 | |
| CAMB Commercial Mortgage Trust floater Series 2019-LIFE Class A, CME Term SOFR 1 Month Index + 1.180% 6.4955% 12/15/37 (b)(c)(d) | 700,000 | 696,459 | |
| CF Hippolyta Issuer LLC sequential payer Series 2021-1A Class A1, 1.53% 3/15/61 (b) | 1,974,428 | 1,734,392 | |
| CFCRE Commercial Mortgage Trust sequential payer Series 2017-C8 Class A3, 3.3048% 6/15/50 | 2,041,770 | 1,888,935 | |
| Citigroup Commercial Mortgage Trust sequential payer Series 2019-C7 Class A4, 3.102% 12/15/72 | 1,212,628 | 1,048,492 | |
| COMM Mortgage Trust sequential payer: | |||
| Series 2014-CR18 Class A5, 3.828% 7/15/47 | 215,000 | 210,702 | |
| Series 2015-CR24 Class A5, 3.696% 8/10/48 | 1,090,000 | 1,042,980 | |
| Series 2015-DC1 Class A4, 3.078% 2/10/48 | 2,400,000 | 2,334,044 | |
| Series 2020-SBX Class A, 1.67% 1/10/38 (b) | 3,174,000 | 2,747,572 | |
| Credit Suisse Mortgage Trust: | |||
| floater Series 2019-ICE4: | |||
Class A, CME Term SOFR 1 Month Index + 1.020% 6.338% 5/15/36 (b)(c)(d) | 5,849,447 | 5,842,746 | |
Class B, CME Term SOFR 1 Month Index + 1.270% 6.588% 5/15/36 (b)(c)(d) | 5,442,460 | 5,426,751 | |
Class C, CME Term SOFR 1 Month Index + 1.470% 6.788% 5/15/36 (b)(c)(d) | 127,682 | 126,788 | |
| sequential payer Series 2020-NET Class A, 2.2569% 8/15/37 (b) | 339,741 | 306,144 | |
| Series 2018-SITE: | |||
Class A, 4.284% 4/15/36 (b) | 287,000 | 278,671 | |
Class B, 4.5349% 4/15/36 (b) | 100,000 | 96,400 | |
Class C, 4.9414% 4/15/36 (b)(c) | 100,000 | 96,209 | |
Class D, 4.9414% 4/15/36 (b)(c) | 118,000 | 112,563 | |
| CSMC Trust Series 2017-PFHP Class D, CME Term SOFR 1 Month Index + 2.290% 7.608% 12/15/30 (b)(c)(d) | 809,000 | 755,108 | |
| ELP Commercial Mortgage Trust floater Series 2021-ELP: | |||
| Class A, CME Term SOFR 1 Month Index + 0.810% 6.1265% 11/15/38 (b)(c)(d) | 10,075,000 | 9,860,088 | |
| Class B, CME Term SOFR 1 Month Index + 1.230% 6.5457% 11/15/38 (b)(c)(d) | 2,037,000 | 1,990,994 | |
| Class F, CME Term SOFR 1 Month Index + 2.780% 8.0925% 11/15/38 (b)(c)(d) | 284,000 | 272,599 | |
| Extended Stay America Trust floater Series 2021-ESH: | |||
| Class A, CME Term SOFR 1 Month Index + 1.190% 6.5045% 7/15/38 (b)(c)(d) | 827,386 | 819,412 | |
| Class B, CME Term SOFR 1 Month Index + 1.490% 6.8045% 7/15/38 (b)(c)(d) | 1,492,539 | 1,471,927 | |
| Class C, CME Term SOFR 1 Month Index + 1.810% 7.1245% 7/15/38 (b)(c)(d) | 347,368 | 342,135 | |
| Class D, CME Term SOFR 1 Month Index + 2.360% 7.6745% 7/15/38 (b)(c)(d) | 1,664,314 | 1,637,153 | |
| Freddie Mac: | |||
| sequential payer: | |||
Series 2015-K043 Class A2, 3.062% 12/25/24 | 5,661,000 | 5,485,117 | |
Series 2015-K049 Class A2, 3.01% 7/25/25 | 255,000 | 244,700 | |
Series 2015-K051 Class A2, 3.308% 9/25/25 | 403,000 | 387,884 | |
Series 2020-K117 Class A2, 1.406% 8/25/30 | 600,000 | 480,258 | |
Series 2021-K126 Class A2, 2.074% 1/25/31 | 700,000 | 581,923 | |
Series 2022-K143 Class A2, 2.35% 3/25/32 | 1,300,000 | 1,077,552 | |
Series 2022-K149 Class A2, 3.53% 8/25/32 | 2,000,000 | 1,815,441 | |
Series 2022-K750 Class A2, 3% 9/25/29 | 1,400,000 | 1,271,075 | |
Series 2023-154 Class A2, 4.35% 1/25/33 | 530,000 | 511,522 | |
Series 2023-155 Class A2, 4.25% 4/25/33 | 350,000 | 335,136 | |
Series 2023-157 Class A2, 4.2% 5/25/33 | 1,470,000 | 1,404,826 | |
Series 2023-K-153 Class A2, 3.82% 12/25/32 | 2,070,000 | 1,916,966 | |
Series 2023-K751 Class A2, 4.412% 3/25/30 | 589,000 | 574,555 | |
| Series 2017-K727 Class A2, 2.946% 7/25/24 | 1,977,520 | 1,934,373 | |
| Series 2021-K134 Class A2, 2.243% 10/25/31 | 1,232,000 | 1,020,218 | |
| Series 2022 K748 Class A2, 2.26% 1/25/29 | 2,855,000 | 2,512,665 | |
| Series K063 Class A2, 3.43% 1/25/27 | 900,000 | 856,955 | |
| Freddie Mac Multi-family Structured pass-thru certificates sequential payer Series 2015 K045 Class A2, 3.023% 1/25/25 | 1,148,076 | 1,109,861 | |
| GS Mortgage Securities Trust: | |||
| floater Series 2021-IP: | |||
Class A, CME Term SOFR 1 Month Index + 1.060% 6.3755% 10/15/36 (b)(c)(d) | 1,191,000 | 1,132,741 | |
Class B, CME Term SOFR 1 Month Index + 1.260% 6.5755% 10/15/36 (b)(c)(d) | 184,000 | 171,308 | |
Class C, CME Term SOFR 1 Month Index + 1.660% 6.9755% 10/15/36 (b)(c)(d) | 152,000 | 140,003 | |
| sequential payer: | |||
Series 2015-GC30 Class A4, 3.382% 5/10/50 | 1,143,000 | 1,087,601 | |
Series 2017-GS6 Class A2, 3.164% 5/10/50 | 190,518 | 175,797 | |
Series 2018-GS9 Class A4, 3.992% 3/10/51 | 3,400,000 | 3,154,645 | |
| Hilton U.S.A. Trust Series 2016-HHV Class E, 4.3333% 11/5/38 (b)(c) | 165,000 | 148,316 | |
| Intown Mortgage Trust floater sequential payer Series 2022-STAY Class A, CME Term SOFR 1 Month Index + 2.480% 7.7986% 8/15/39 (b)(c)(d) | 3,384,000 | 3,386,116 | |
| JPMorgan Chase Commercial Mortgage Securities Trust Series 2018-WPT: | |||
| Class AFX, 4.2475% 7/5/33 (b) | 385,000 | 348,109 | |
| Class CFX, 4.9498% 7/5/33 (b) | 50,000 | 41,785 | |
| Class DFX, 5.3503% 7/5/33 (b) | 76,000 | 61,993 | |
| Class EFX, 5.3635% 7/5/33 (b)(c) | 105,000 | 84,073 | |
| Life Financial Services Trust floater Series 2022-BMR2: | |||
| Class A1, CME Term SOFR 1 Month Index + 1.290% 6.6057% 5/15/39 (b)(c)(d) | 7,860,000 | 7,722,352 | |
| Class B, CME Term SOFR 1 Month Index + 1.790% 7.1044% 5/15/39 (b)(c)(d) | 1,986,000 | 1,943,051 | |
| Class C, CME Term SOFR 1 Month Index + 2.090% 7.4036% 5/15/39 (b)(c)(d) | 1,113,000 | 1,082,296 | |
| Class D, CME Term SOFR 1 Month Index + 2.540% 7.8524% 5/15/39 (b)(c)(d) | 1,354,000 | 1,291,609 | |
| LIFE Mortgage Trust floater Series 2021-BMR: | |||
| Class A, CME Term SOFR 1 Month Index + 0.810% 6.1245% 3/15/38 (b)(c)(d) | 1,488,217 | 1,458,305 | |
| Class B, CME Term SOFR 1 Month Index + 0.990% 6.3045% 3/15/38 (b)(c)(d) | 358,784 | 350,221 | |
| Class C, CME Term SOFR 1 Month Index + 1.210% 6.5245% 3/15/38 (b)(c)(d) | 226,083 | 219,551 | |
| Class D, CME Term SOFR 1 Month Index + 1.510% 6.8245% 3/15/38 (b)(c)(d) | 314,550 | 304,278 | |
| Class E, CME Term SOFR 1 Month Index + 1.860% 7.1745% 3/15/38 (b)(c)(d) | 274,249 | 263,915 | |
| Merit floater Series 2021-STOR Class F, CME Term SOFR 1 Month Index + 2.310% 7.6255% 7/15/38 (b)(c)(d) | 434,000 | 414,394 | |
| Morgan Stanley BAML Trust sequential payer Series 2014 C14 Class A5, 4.064% 2/15/47 | 1,696,873 | 1,682,324 | |
| Morgan Stanley Capital I Trust: | |||
| floater Series 2018-BOP: | |||
Class B, CME Term SOFR 1 Month Index + 1.290% 6.608% 8/15/33 (b)(c)(d) | 239,200 | 189,514 | |
Class C, CME Term SOFR 1 Month Index + 1.540% 6.858% 8/15/33 (b)(c)(d) | 576,800 | 411,408 | |
| sequential payer: | |||
Series 2017-H1 Class A4, 3.259% 6/15/50 | 1,500,000 | 1,375,232 | |
Series 2019-L2 Class A3, 3.806% 3/15/52 | 1,600,000 | 1,469,927 | |
Series 2019-MEAD Class A, 3.17% 11/10/36 (b) | 1,076,000 | 984,298 | |
| Series 2018-H4 Class A4, 4.31% 12/15/51 | 185,000 | 172,693 | |
| Series 2019-MEAD: | |||
Class B, 3.283% 11/10/36 (b)(c) | 155,000 | 136,645 | |
Class C, 3.283% 11/10/36 (b)(c) | 149,000 | 127,272 | |
| MSCCG Trust floater Series 2018-SELF Class A, CME Term SOFR 1 Month Index + 0.940% 6.258% 10/15/37 (b)(c)(d) | 1,124,062 | 1,118,731 | |
| Natixis Commercial Mortgage Securities Trust Series 2020-2PAC Class AMZ1, 3.6167% 1/15/37 (b)(c) | 2,266,000 | 1,998,990 | |
| OPG Trust floater Series 2021-PORT Class A, CME Term SOFR 1 Month Index + 0.590% 5.9095% 10/15/36 (b)(c)(d) | 2,530,202 | 2,465,111 | |
| Prima Capital Ltd.: | |||
| floater Series 2021-9A Class B, CME Term SOFR 1 Month Index + 1.910% 7.2285% 12/15/37 (b)(c)(d) | 499,000 | 486,319 | |
| floater sequential payer Series 2021-9A Class A, CME Term SOFR 1 Month Index + 1.560% 6.8191% 12/15/37 (b)(c)(d)(g) | 95,305 | 95,009 | |
| SPGN Mortgage Trust floater Series 2022-TFLM: | |||
| Class B, CME Term SOFR 1 Month Index + 2.000% 7.3105% 2/15/39 (b)(c)(d) | 501,000 | 471,784 | |
| Class C, CME Term SOFR 1 Month Index + 2.650% 7.9605% 2/15/39 (b)(c)(d) | 261,000 | 243,520 | |
| SREIT Trust floater Series 2021-MFP: | |||
| Class A, CME Term SOFR 1 Month Index + 0.840% 6.1558% 11/15/38 (b)(c)(d) | 2,410,000 | 2,361,616 | |
| Class B, CME Term SOFR 1 Month Index + 1.190% 6.5048% 11/15/38 (b)(c)(d) | 6,963,000 | 6,830,936 | |
| Class C, CME Term SOFR 1 Month Index + 1.440% 6.754% 11/15/38 (b)(c)(d) | 679,000 | 662,387 | |
| Class D, CME Term SOFR 1 Month Index + 1.690% 7.0032% 11/15/38 (b)(c)(d) | 3,601,000 | 3,501,336 | |
| VLS Commercial Mortgage Trust: | |||
| sequential payer Series 2020-LAB Class A, 2.13% 10/10/42 (b) | 1,569,000 | 1,224,183 | |
| Series 2020-LAB Class B, 2.453% 10/10/42 (b) | 80,000 | 61,751 | |
| Wells Fargo Commercial Mortgage Trust: | |||
| floater Series 2021-FCMT Class A, CME Term SOFR 1 Month Index + 1.310% 6.6255% 5/15/31 (b)(c)(d) | 1,021,000 | 977,224 | |
| sequential payer: | |||
Series 2015-C26 Class A4, 3.166% 2/15/48 | 624,000 | 596,706 | |
Series 2019-C49 Class ASB, 3.933% 3/15/52 | 500,000 | 478,550 | |
| Series 2018-C48 Class A5, 4.302% 1/15/52 | 215,000 | 201,504 | |
| Wells Fargo Commercial Mtg Trust sequential payer Series 2016-C37, Class A4, 3.525% 12/15/49 | 3,300,000 | 3,110,027 | |
| WF-RBS Commercial Mortgage Trust sequential payer Series 2014 C19 Class A5, 4.101% 3/15/47 | 1,930,000 | 1,906,602 | |
| TOTAL COMMERCIAL MORTGAGE SECURITIES (Cost $203,528,529) | 197,632,713 | ||
| Municipal Securities - 0.1% | |||
Principal Amount (a) | Value ($) | ||
| Illinois Gen. Oblig. Series 2003, 5.1% 6/1/33 | 1,670,000 | 1,620,400 | |
| New Jersey Econ. Dev. Auth. State Pension Fdg. Rev. Series 1997, 7.425% 2/15/29 (Nat'l. Pub. Fin. Guarantee Corp. Insured) | 1,032,000 | 1,104,951 | |
| Toledo Hosp. 6.015% 11/15/48 | 190,000 | 129,865 | |
| TOTAL MUNICIPAL SECURITIES (Cost $2,992,633) | 2,855,216 | ||
| Foreign Government and Government Agency Obligations - 0.9% | |||
Principal Amount (a) | Value ($) | ||
| Angola Republic: | |||
| 8.25% 5/9/28 (b) | 235,000 | 205,085 | |
| 8.75% 4/14/32 (b) | 100,000 | 82,003 | |
| 9.375% 5/8/48 (b) | 35,000 | 26,666 | |
| 9.5% 11/12/25 (b) | 230,000 | 225,830 | |
| Arab Republic of Egypt: | |||
| 7.5% 1/31/27 (b) | 225,000 | 161,332 | |
| 7.5% 2/16/61 (b) | 290,000 | 145,212 | |
| 7.6003% 3/1/29 (b) | 160,000 | 102,618 | |
| 7.903% 2/21/48 (b) | 20,000 | 10,105 | |
| 8.7002% 3/1/49 (b) | 380,000 | 200,192 | |
| Argentine Republic: | |||
| 0.75% 7/9/30 (e) | 3,105,589 | 1,042,826 | |
| 1% 7/9/29 | 95,826 | 30,976 | |
| 3.5% 7/9/41 (e) | 350,000 | 107,345 | |
| 3.625% 7/9/35 (e) | 2,598,239 | 763,207 | |
| 4.25% 1/9/38 (e) | 680,000 | 237,463 | |
| Bahamian Republic 6% 11/21/28 (b) | 95,000 | 77,564 | |
| Bahrain Kingdom 5.625% 5/18/34 (b) | 65,000 | 57,026 | |
| Bank Gospodarstwa Krajowego 5.375% 5/22/33 (b) | 200,000 | 195,500 | |
| Barbados Government 6.5% 10/1/29 (b) | 175,000 | 162,974 | |
| Bermuda Government 2.375% 8/20/30 (b) | 425,000 | 347,909 | |
| Brazilian Federative Republic: | |||
| 3.875% 6/12/30 | 270,000 | 238,961 | |
| 7.125% 1/20/37 | 175,000 | 182,999 | |
| 8.25% 1/20/34 | 325,000 | 365,583 | |
| Buenos Aires Province 5.25% 9/1/37 (b)(e) | 205,000 | 77,900 | |
| Cameroon Republic 9.5% 11/19/25 (b) | 135,000 | 130,129 | |
| Chilean Republic: | |||
| 2.45% 1/31/31 | 460,000 | 390,499 | |
| 3.1% 1/22/61 | 225,000 | 141,721 | |
| 4% 1/31/52 | 275,000 | 217,256 | |
| 5.33% 1/5/54 | 200,000 | 192,700 | |
| Colombian Republic: | |||
| 3% 1/30/30 | 560,000 | 444,332 | |
| 3.125% 4/15/31 | 200,000 | 154,000 | |
| 5% 6/15/45 | 450,000 | 316,278 | |
| 5.2% 5/15/49 | 140,000 | 98,433 | |
| 7.5% 2/2/34 | 70,000 | 69,432 | |
| 8% 4/20/33 | 65,000 | 67,198 | |
| Costa Rican Republic: | |||
| 5.625% 4/30/43 (b) | 125,000 | 108,326 | |
| 6.125% 2/19/31 (b) | 70,000 | 69,710 | |
| 6.55% 4/3/34 (b) | 100,000 | 100,594 | |
| 7% 4/4/44 (b) | 25,000 | 24,703 | |
| Democratic Socialist Republic of Sri Lanka: | |||
| 6.2% (b)(h) | 60,000 | 26,944 | |
| 6.825% (b)(h) | 70,000 | 32,709 | |
| 7.55% (b)(h) | 20,000 | 8,955 | |
| 7.85% (b)(h) | 250,000 | 112,163 | |
| Dominican Republic: | |||
| 5.3% 1/21/41 (b) | 200,000 | 156,282 | |
| 5.5% 1/27/25 | 400,000 | 395,164 | |
| 5.875% 1/30/60 (b) | 400,000 | 306,684 | |
| 5.95% 1/25/27 (b) | 1,900,000 | 1,856,357 | |
| 6% 7/19/28 (b) | 2,400,000 | 2,315,928 | |
| 6.85% 1/27/45 (b) | 75,000 | 67,031 | |
| 6.875% 1/29/26 (b) | 70,000 | 70,281 | |
| 7.05% 2/3/31 (b) | 150,000 | 148,808 | |
| Ecuador Republic: | |||
| 3.5% 7/31/35 (b)(e) | 225,000 | 82,352 | |
| 6% 7/31/30 (b)(e) | 400,000 | 194,752 | |
| El Salvador Republic 7.1246% 1/20/50 (b) | 175,000 | 115,960 | |
| Emirate of Abu Dhabi: | |||
| 3% 9/15/51 (b) | 140,000 | 94,868 | |
| 3.125% 9/30/49 (b) | 620,000 | 432,425 | |
| 3.875% 4/16/50 (b) | 1,260,000 | 1,011,238 | |
| Emirate of Dubai: | |||
| 3.9% 9/9/50 (Reg. S) | 200,000 | 141,686 | |
| 5.25% 1/30/43 (Reg. S) | 200,000 | 181,656 | |
| Gabonese Republic: | |||
| 6.95% 6/16/25 (b) | 200,000 | 165,972 | |
| 7% 11/24/31 (b) | 50,000 | 36,055 | |
| Georgia Republic 2.75% 4/22/26 (b) | 300,000 | 268,737 | |
| German Federal Republic: | |||
| 0% 8/15/31 | EUR | 2,900,000 | 2,609,735 |
| 1% 5/15/38(Reg. S) | EUR | 550,000 | 480,380 |
| 2.1% 11/15/29(Reg. S) | EUR | 100,000 | 106,394 |
| Ghana Republic: | |||
| 7.75% (b)(h) | 300,000 | 128,541 | |
| 8.627% (b)(h) | 120,000 | 49,568 | |
| 10.75% 10/14/30 (b) | 80,000 | 54,340 | |
| Guatemalan Republic 5.375% 4/24/32 (b) | 255,000 | 242,372 | |
| Hungarian Republic: | |||
| 2.125% 9/22/31 (b) | 300,000 | 230,598 | |
| 3.125% 9/21/51 (b) | 110,000 | 66,298 | |
| Indonesian Republic: | |||
| 3.5% 2/14/50 | 245,000 | 180,702 | |
| 4.1% 4/24/28 | 145,000 | 138,462 | |
| 4.2% 10/15/50 | 1,500,000 | 1,245,510 | |
| 4.4% 6/6/27 (b) | 200,000 | 194,850 | |
| 5.95% 1/8/46 (b) | 325,000 | 342,365 | |
| 7.75% 1/17/38 (b) | 225,000 | 275,643 | |
| 8.5% 10/12/35 (b) | 500,000 | 635,010 | |
| Islamic Republic of Pakistan 6% 4/8/26 (b) | 265,000 | 136,356 | |
| Israeli State 3.375% 1/15/50 | 290,000 | 204,875 | |
| Ivory Coast: | |||
| 6.125% 6/15/33 (b) | 300,000 | 255,576 | |
| 6.375% 3/3/28 (b) | 200,000 | 188,330 | |
| Jamaican Government 6.75% 4/28/28 | 200,000 | 206,360 | |
| Jordanian Kingdom: | |||
| 4.95% 7/7/25 (b) | 300,000 | 291,354 | |
| 7.375% 10/10/47 (b) | 45,000 | 39,249 | |
| Kingdom of Saudi Arabia: | |||
| 2.25% 2/2/33 (b) | 300,000 | 237,432 | |
| 3.25% 10/22/30 (b) | 500,000 | 448,780 | |
| 3.45% 2/2/61 (b) | 350,000 | 231,504 | |
| 3.75% 1/21/55 (b) | 65,000 | 46,417 | |
| 4.5% 10/26/46 (b) | 65,000 | 54,742 | |
| 4.5% 4/22/60 (b) | 390,000 | 321,056 | |
| 4.625% 10/4/47 (b) | 250,000 | 211,835 | |
| 5% 1/18/53 (b) | 200,000 | 177,452 | |
| Lebanese Republic 6.375% (h) | 350,000 | 27,493 | |
| Moroccan Kingdom 6.5% 9/8/33 (b) | 200,000 | 200,462 | |
| Panamanian Republic: | |||
| 2.252% 9/29/32 | 400,000 | 303,364 | |
| 3.87% 7/23/60 | 235,000 | 150,283 | |
| 4.5% 5/15/47 | 150,000 | 115,062 | |
| 6.4% 2/14/35 | 200,000 | 205,142 | |
| 6.853% 3/28/54 | 200,000 | 204,378 | |
| Peruvian Republic: | |||
| 2.783% 1/23/31 | 225,000 | 190,539 | |
| 3% 1/15/34 | 125,000 | 101,471 | |
| 3.3% 3/11/41 | 125,000 | 92,776 | |
| Philippine Republic: | |||
| 2.65% 12/10/45 | 105,000 | 67,975 | |
| 2.95% 5/5/45 | 50,000 | 34,469 | |
| 3.556% 9/29/32 | 200,000 | 178,532 | |
| 5.5% 1/17/48 | 200,000 | 201,346 | |
| 5.95% 10/13/47 | 200,000 | 211,538 | |
| Polish Government: | |||
| 5.5% 4/4/53 | 70,000 | 68,001 | |
| 5.75% 11/16/32 | 135,000 | 140,242 | |
| Provincia de Cordoba 6.875% 12/10/25 (b) | 283,336 | 235,169 | |
| Republic of Armenia 3.6% 2/2/31 (b) | 170,000 | 133,698 | |
| Republic of Kenya: | |||
| 6.3% 1/23/34 (b) | 45,000 | 32,458 | |
| 6.875% 6/24/24 (b) | 65,000 | 61,450 | |
| 7% 5/22/27 (b) | 120,000 | 106,205 | |
| 7.25% 2/28/28 (b) | 35,000 | 29,623 | |
| 8% 5/22/32 (b) | 40,000 | 33,028 | |
| Republic of Nigeria: | |||
| 6.125% 9/28/28 (b) | 535,000 | 441,188 | |
| 6.5% 11/28/27 (b) | 105,000 | 89,966 | |
| 7.625% 11/21/25 (b) | 205,000 | 194,619 | |
| 7.696% 2/23/38 (b) | 85,000 | 61,588 | |
| Republic of Paraguay: | |||
| 2.739% 1/29/33 (b) | 300,000 | 235,896 | |
| 4.95% 4/28/31 (b) | 200,000 | 188,778 | |
| Republic of Senegal 6.25% 5/23/33 (b) | 110,000 | 89,816 | |
| Republic of Serbia 2.125% 12/1/30 (b) | 330,000 | 250,322 | |
| Republic of Uzbekistan 3.7% 11/25/30 (b) | 300,000 | 240,951 | |
| Republic of Zambia 8.97% (b)(h) | 115,000 | 59,652 | |
| Romanian Republic: | |||
| 3% 2/27/27 (b) | 250,000 | 228,785 | |
| 3% 2/14/31 (b) | 85,000 | 70,071 | |
| 3.625% 3/27/32 (b) | 300,000 | 251,130 | |
| 4% 2/14/51 (b) | 125,000 | 85,263 | |
| Rwanda Republic 5.5% 8/9/31 (b) | 200,000 | 153,810 | |
| South African Republic: | |||
| 4.85% 9/27/27 | 85,000 | 79,404 | |
| 4.85% 9/30/29 | 225,000 | 197,998 | |
| 5% 10/12/46 | 125,000 | 82,418 | |
| 5.65% 9/27/47 | 60,000 | 42,551 | |
| 5.75% 9/30/49 | 195,000 | 137,801 | |
| 5.875% 4/20/32 | 85,000 | 75,062 | |
| State of Qatar: | |||
| 3.75% 4/16/30 (b) | 625,000 | 590,838 | |
| 4.4% 4/16/50 (b) | 2,015,000 | 1,771,749 | |
| 4.625% 6/2/46 (b) | 235,000 | 215,309 | |
| 5.103% 4/23/48 (b) | 80,000 | 76,692 | |
| Sultanate of Oman: | |||
| 5.375% 3/8/27 (b) | 500,000 | 491,280 | |
| 5.625% 1/17/28 (b) | 540,000 | 533,120 | |
| 6.25% 1/25/31 (b) | 200,000 | 202,166 | |
| 6.5% 3/8/47 (b) | 40,000 | 37,476 | |
| 6.75% 1/17/48 (b) | 200,000 | 193,052 | |
| 7% 1/25/51 (b) | 35,000 | 34,670 | |
| Turkish Republic: | |||
| 4.25% 4/14/26 | 375,000 | 345,090 | |
| 4.875% 10/9/26 | 500,000 | 460,680 | |
| 4.875% 4/16/43 | 210,000 | 139,148 | |
| 5.125% 2/17/28 | 250,000 | 224,725 | |
| 5.75% 5/11/47 | 110,000 | 78,012 | |
| 6% 1/14/41 | 90,000 | 69,147 | |
| 6.625% 2/17/45 | 110,000 | 88,091 | |
| 9.125% 7/13/30 | 130,000 | 132,365 | |
| 9.375% 3/14/29 | 200,000 | 207,210 | |
| 9.375% 1/19/33 | 510,000 | 530,966 | |
| 9.875% 1/15/28 | 210,000 | 221,846 | |
| Ukraine Government: | |||
| 7.253% 3/15/35 (b) | 300,000 | 79,482 | |
| 7.75% 9/1/24 (b) | 290,000 | 96,570 | |
| 7.75% 9/1/25 (b) | 525,000 | 168,000 | |
| 7.75% 9/1/26 (b) | 400,000 | 115,000 | |
| 7.75% 9/1/29 (b) | 100,000 | 28,500 | |
| 7.75% 8/1/41 (b)(c) | 100,000 | 45,500 | |
| United Mexican States: | |||
| 3.25% 4/16/30 | 500,000 | 442,645 | |
| 3.5% 2/12/34 | 185,000 | 153,376 | |
| 3.75% 1/11/28 | 200,000 | 189,212 | |
| 3.771% 5/24/61 | 280,000 | 183,736 | |
| 5.75% 10/12/2110 | 450,000 | 393,561 | |
| 6.35% 2/9/35 | 200,000 | 206,904 | |
| Uruguay Republic 5.1% 6/18/50 | 225,000 | 216,992 | |
| TOTAL FOREIGN GOVERNMENT AND GOVERNMENT AGENCY OBLIGATIONS (Cost $46,301,106) | 41,172,563 | ||
| Supranational Obligations - 0.0% | |||
Principal Amount (a) | Value ($) | ||
| European Union: | |||
| 0% 10/4/28 (Reg. S) | EUR | 125,000 | 116,522 |
| 2.75% 10/5/26 (Reg. S) | EUR | 500,000 | 535,881 |
| TOTAL SUPRANATIONAL OBLIGATIONS (Cost $652,978) | 652,403 | ||
| Common Stocks - 0.0% | |||
| Shares | Value ($) | ||
| ENERGY - 0.0% | |||
| Oil, Gas & Consumable Fuels - 0.0% | |||
| California Resources Corp. | 1,296 | 72,369 | |
| California Resources Corp. warrants 10/27/24 (o) | 225 | 4,770 | |
| Mesquite Energy, Inc. (g)(o) | 3,883 | 331,609 | |
| 408,748 | |||
| FINANCIALS - 0.0% | |||
| Banks - 0.0% | |||
| First Republic Bank | 3,000 | 390 | |
| Financial Services - 0.0% | |||
| Carnelian Point Holdings LP warrants (g)(o) | 350 | 1,022 | |
TOTAL FINANCIALS | 1,412 | ||
| UTILITIES - 0.0% | |||
| Independent Power and Renewable Electricity Producers - 0.0% | |||
| Talen Energy Corp. | 494 | 27,294 | |
| TOTAL COMMON STOCKS (Cost $490,960) | 437,454 | ||
| Bank Loan Obligations - 6.0% | |||
Principal Amount (a) | Value ($) | ||
| COMMUNICATION SERVICES - 0.6% | |||
| Diversified Telecommunication Services - 0.2% | |||
| Altice France SA Tranche B14 1LN, term loan CME Term SOFR 1 Month Index + 5.500% 10.808% 8/15/28 (c)(d)(p) | 1,983,056 | 1,731,466 | |
| Aventiv Technologies LLC Tranche B, term loan 3 month U.S. LIBOR + 4.500% 10.0379% 11/1/24 (c)(d)(p) | 984,375 | 861,328 | |
| Consolidated Communications, Inc. Tranche B 1LN, term loan CME Term SOFR 1 Month Index + 3.500% 8.9455% 10/2/27 (c)(d)(p) | 250,000 | 215,625 | |
| Frontier Communications Holdings LLC Tranche B 1LN, term loan CME Term SOFR 1 Month Index + 3.750% 9.1831% 5/1/28 (c)(d)(p) | 2,193,666 | 2,129,677 | |
| Level 3 Financing, Inc. Tranche B 1LN, term loan CME Term SOFR 1 Month Index + 1.750% 7.1955% 3/1/27 (c)(d)(p) | 200,000 | 189,282 | |
| Lumen Technologies, Inc. Tranche A 1LN, term loan CME Term SOFR 1 Month Index + 2.000% 7.4455% 1/31/25 (c)(d)(p) | 652,537 | 591,975 | |
| Northwest Fiber LLC Tranche B 1LN, term loan CME Term SOFR 1 Month Index + 3.750% 9.1798% 4/30/27 (c)(d)(p) | 1,231,108 | 1,193,658 | |
| Patagonia Holdco LLC Tranche B 1LN, term loan CME Term SOFR 3 Month Index + 5.750% 11.1174% 8/1/29 (c)(d)(p) | 856,542 | 734,057 | |
| Windstream Services LLC Tranche B 1LN, term loan CME Term SOFR 1 Month Index + 6.250% 11.6811% 9/21/27 (c)(d)(p) | 497,392 | 473,145 | |
| Zayo Group Holdings, Inc. 1LN, term loan CME Term SOFR 1 Month Index + 3.000% 8.4455% 3/9/27 (c)(d)(p) | 2,500,000 | 1,994,925 | |
| 10,115,138 | |||
| Entertainment - 0.0% | |||
| AP Core Holdings II LLC Tranche B2 1LN, term loan CME Term SOFR 1 Month Index + 5.500% 10.9455% 9/1/27 (c)(d)(p) | 280,000 | 271,600 | |
| ECL Entertainment LLC Tranche B 1LN, term loan CME Term SOFR 1 Month Index + 4.750% 8/16/30 (d)(p)(q) | 195,000 | 195,488 | |
| Sweetwater Borrower LLC Tranche B 1LN, term loan CME Term SOFR 1 Month Index + 4.250% 9.6955% 8/5/28 (c)(d)(p) | 468,516 | 455,632 | |
| 922,720 | |||
| Media - 0.3% | |||
| Advantage Sales & Marketing, Inc. Tranche B 1LN, term loan CME Term SOFR 1 Month Index + 4.500% 10.0382% 10/28/27 (c)(d)(p) | 400,880 | 383,270 | |
| Altice Financing SA Tranche B 1LN, term loan CME Term SOFR 1 Month Index + 5.000% 10.308% 10/31/27 (c)(d)(p) | 104,475 | 98,468 | |
| Charter Communication Operating LLC Tranche B2 1LN, term loan CME Term SOFR 1 Month Index + 1.750% 7.1155% 2/1/27 (c)(d)(p) | 1,333,748 | 1,326,919 | |
| Coral-U.S. Co.-Borrower LLC Tranche B, term loan 1 month U.S. LIBOR + 2.250% 7.675% 1/31/28 (c)(d)(p) | 1,750,000 | 1,711,728 | |
| CSC Holdings LLC: | |||
| Tranche B 5LN, term loan CME Term SOFR 1 Month Index + 2.500% 7.925% 4/15/27 (c)(d)(p) | 1,477,041 | 1,334,876 | |
| Tranche B6 LN, term loan CME Term SOFR 1 Month Index + 4.500% 9.8105% 1/18/28 (c)(d)(p) | 483,784 | 455,565 | |
| Diamond Sports Group LLC 2LN, term loan CME Term SOFR 1 Month Index + 3.250% 10.6625% 8/24/26 (c)(d)(h)(p) | 722,700 | 17,424 | |
| DIRECTV Financing LLC 1LN, term loan 1 month U.S. LIBOR + 5.000% 10.4455% 8/2/27 (c)(d)(p) | 261,795 | 258,462 | |
| Dotdash Meredith, Inc. Tranche B 1LN, term loan CME Term SOFR 1 Month Index + 4.000% 9.4181% 12/1/28 (c)(d)(p) | 1,043,557 | 1,003,119 | |
| LCPR Loan Financing LLC 1LN, term loan 1 month U.S. LIBOR + 3.750% 9.175% 9/25/28 (c)(d)(p) | 225,000 | 220,725 | |
| MJH Healthcare Holdings LLC Tranche B 1LN, term loan CME Term SOFR 1 Month Index + 3.500% 8.9311% 1/28/29 (c)(d)(p) | 249,369 | 248,122 | |
| Nexstar Media, Inc. Tranche B, term loan CME Term SOFR 1 Month Index + 2.500% 7.9455% 9/19/26 (c)(d)(p) | 590,437 | 591,228 | |
| Sinclair Television Group, Inc. Tranche B4 1LN, term loan CME Term SOFR 1 Month Index + 2.750% 9.1811% 4/21/29 (c)(d)(p) | 133,575 | 96,007 | |
| Springer Nature Deutschland GmbH Tranche B18 1LN, term loan CME Term SOFR 3 Month Index + 3.000% 8.5035% 8/14/26 (c)(d)(p) | 225,000 | 224,953 | |
| Univision Communications, Inc. Tranche B 1LN, term loan 1 month U.S. LIBOR + 3.250% 8.6955% 3/24/26 (c)(d)(p) | 2,432,514 | 2,432,514 | |
| Virgin Media Bristol LLC: | |||
| Tranche N, term loan 1 month U.S. LIBOR + 2.500% 7.925% 1/31/28 (c)(d)(p) | 500,000 | 485,750 | |
| Tranche Y 1LN, term loan CME Term SOFR 1 Month Index + 3.250% 8.3106% 3/6/31 (c)(d)(p) | 245,000 | 241,893 | |
| 11,131,023 | |||
| Wireless Telecommunication Services - 0.1% | |||
| Crown Subsea Communications Holding, Inc. 1LN, term loan CME Term SOFR 1 Month Index + 5.250% 10.6826% 4/27/27 (c)(d)(p) | 585,000 | 585,977 | |
| Intelsat Jackson Holdings SA 1LN, term loan CME TERM SOFR 6 MONTH INDEX + 4.250% 9.7719% 2/1/29 (c)(d)(p) | 3,591,014 | 3,589,039 | |
| 4,175,016 | |||
TOTAL COMMUNICATION SERVICES | 26,343,897 | ||
| CONSUMER DISCRETIONARY - 1.4% | |||
| Automobile Components - 0.0% | |||
| American Trailer World Corp. Tranche B 1LN, term loan CME Term SOFR 1 Month Index + 3.750% 9.1811% 3/5/28 (c)(d)(p) | 133,015 | 125,467 | |
| Clarios Global LP Tranche B 1LN, term loan CME Term SOFR 1 Month Index + 3.750% 9.0811% 4/20/30 (c)(d)(p) | 540,000 | 538,483 | |
| Novae LLC 1LN, term loan CME Term SOFR 3 Month Index + 5.000% 10.3383% 12/22/28 (c)(d)(p) | 222,188 | 199,969 | |
| PECF USS Intermediate Holding III Corp. Tranche B 1LN, term loan CME Term SOFR 1 Month Index + 4.250% 9.8803% 12/17/28 (c)(d)(p) | 295,500 | 233,980 | |
| Truck Hero, Inc. Tranche B 1LN, term loan CME Term SOFR 1 Month Index + 3.750% 9.1955% 1/29/28 (c)(d)(p) | 746,183 | 721,522 | |
| 1,819,421 | |||
| Automobiles - 0.1% | |||
| Bombardier Recreational Products, Inc. Tranche B 1LN, term loan CME Term SOFR 1 Month Index + 3.500% 8.8311% 12/13/29 (c)(d)(p) | 816,344 | 816,515 | |
| CWGS Group LLC Tranche B 1LN, term loan 1 month U.S. LIBOR + 2.500% 7.9295% 6/3/28 (c)(d)(p) | 1,907,648 | 1,799,274 | |
| 2,615,789 | |||
| Broadline Retail - 0.2% | |||
| Bass Pro Group LLC Tranche B 1LN, term loan 1 month U.S. LIBOR + 3.750% 9.1955% 3/5/28 (c)(d)(p) | 8,379,935 | 8,345,912 | |
| Cmg Media Corp. Tranche B 1LN, term loan 1 month U.S. LIBOR + 3.500% 8.8419% 12/17/26 (c)(d)(p) | 1,279,961 | 1,186,370 | |
| CNT Holdings I Corp. Tranche B 1LN, term loan CME Term SOFR 1 Month Index + 3.500% 8.7995% 11/8/27 (c)(d)(p) | 746,183 | 744,586 | |
| Red Ventures LLC Tranche B 1LN, term loan CME Term SOFR 1 Month Index + 3.000% 8.3311% 3/3/30 (c)(d)(p) | 396,565 | 394,832 | |
| 10,671,700 | |||
| Distributors - 0.1% | |||
| Aip Rd Buyer Corp.: | |||
| 1LN, term loan CME Term SOFR 1 Month Index + 4.250% 9.5811% 12/22/28 (c)(d)(p) | 174,558 | 171,358 | |
| Tranche B 1LN, term loan CME Term SOFR 1 Month Index + 5.000% 10.3311% 12/23/28 (c)(d)(p) | 465,000 | 462,094 | |
| BCPE Empire Holdings, Inc. Tranche B 1LN, term loan CME Term SOFR 1 Month Index + 4.750% 10.0811% 12/10/28 (c)(d)(p) | 1,007,389 | 1,006,684 | |
| Windsor Holdings III, LLC Tranche B 1LN, term loan CME Term SOFR 3 Month Index + 4.500% 9.8181% 8/1/30 (c)(d)(p) | 540,000 | 537,640 | |
| 2,177,776 | |||
| Diversified Consumer Services - 0.2% | |||
| Adtalem Global Education, Inc. Tranche B 1LN, term loan CME Term SOFR 1 Month Index + 4.000% 9.4455% 8/12/28 (c)(d)(p) | 275,923 | 275,838 | |
| AI Aqua Merger Sub, Inc. Tranche B 1LN, term loan 1 month U.S. LIBOR + 3.750% 9.0625% 7/30/28 (c)(d)(p) | 976,357 | 972,344 | |
| GEMS MENASA Cayman Ltd. Tranche B 1LN, term loan 6 month U.S. LIBOR + 5.000% 10.4341% 7/30/26 (c)(d)(p) | 865,406 | 868,651 | |
| KUEHG Corp. 1LN, term loan CME Term SOFR 1 Month Index + 5.000% 10.2419% 6/12/30 (c)(d)(p) | 1,070,000 | 1,070,193 | |
| Learning Care Group (U.S.) No 2, Inc. Tranche B 1LN, term loan CME Term SOFR 1 Month Index + 4.750% 10.1303% 8/11/28 (c)(d)(p) | 315,000 | 314,345 | |
| Sotheby's Tranche B 1LN, term loan CME Term SOFR 1 Month Index + 4.500% 9.9224% 1/15/27 (c)(d)(p) | 230,000 | 223,578 | |
| Spin Holdco, Inc. Tranche B 1LN, term loan 3 month U.S. LIBOR + 4.000% 9.2303% 3/4/28 (c)(d)(p) | 3,464,054 | 2,892,485 | |
| 6,617,434 | |||
| Hotels, Restaurants & Leisure - 0.7% | |||
| 19Th Holdings Golf LLC Tranche B 1LN, term loan CME Term SOFR 1 Month Index + 3.250% 8.6664% 2/7/29 (c)(d)(p) | 582,650 | 569,540 | |
| Alterra Mountain Co. Tranche B 1LN, term loan 1 month U.S. LIBOR + 3.500% 8.9455% 8/17/28 (c)(d)(p) | 497,468 | 497,782 | |
| Aramark Services, Inc. Tranche B-4 1LN, term loan CME Term SOFR 1 Month Index + 1.750% 7.1955% 1/15/27 (c)(d)(p) | 500,000 | 498,440 | |
| Arcis Golf LLC: | |||
| Tranche B 1LN, term loan CME Term SOFR 1 Month Index + 4.250% 9.6955% 11/24/28 (c)(d)(p) | 223,434 | 222,876 | |
| Tranche DD 1LN, term loan CME Term SOFR 1 Month Index + 4.250% 11/24/28 (d)(p)(q) | 56,000 | 55,860 | |
| Bally's Corp. Tranche B 1LN, term loan CME Term SOFR 3 Month Index + 3.250% 8.8378% 10/1/28 (c)(d)(p) | 358,407 | 347,902 | |
| Burger King Worldwide, Inc. Tranche B 1LN, term loan 1 month U.S. LIBOR + 1.750% 7.1955% 11/19/26 (c)(d)(p) | 497,423 | 493,971 | |
| Caesars Entertainment, Inc. Tranche B 1LN, term loan CME Term SOFR 1 Month Index + 3.250% 8.6811% 1/26/30 (c)(d)(p) | 2,867,813 | 2,867,468 | |
| Carnival Finance LLC Tranche B 1LN, term loan 6 month U.S. LIBOR + 3.250% 8.6955% 10/18/28 (c)(d)(p) | 2,150,791 | 2,144,747 | |
| City Football Group Ltd. Tranche B 1LN, term loan 1 month U.S. LIBOR + 3.000% 8.4285% 7/21/28 (c)(d)(p) | 3,086,973 | 3,059,962 | |
| ClubCorp Holdings, Inc. Tranche B 1LN, term loan 3 month U.S. LIBOR + 2.750% 8.2879% 9/18/24 (c)(d)(p) | 1,142,659 | 1,126,136 | |
| Dave & Buster's, Inc. Tranche B 1LN, term loan CME Term SOFR 1 Month Index + 3.750% 9.1875% 6/29/29 (c)(d)(p) | 428,950 | 428,843 | |
| Delta 2 SARL Tranche B 1LN, term loan CME Term SOFR 1 Month Index + 3.000% 8.3311% 1/15/30 (c)(d)(p) | 850,000 | 852,125 | |
| Equinox Holdings, Inc. Tranche B-1, term loan 3 month U.S. LIBOR + 3.000% 8.7305% 3/8/24 (c)(d)(p) | 738,251 | 710,109 | |
| Fertitta Entertainment LLC NV Tranche B 1LN, term loan CME Term SOFR 1 Month Index + 4.000% 9.3311% 1/27/29 (c)(d)(p) | 4,193,445 | 4,148,617 | |
| Flutter Financing B.V. Tranche B 1LN, term loan CME Term SOFR 1 Month Index + 3.250% 8.7535% 7/4/28 (c)(d)(p) | 349,121 | 349,100 | |
| Four Seasons Hotels Ltd. Tranche B 1LN, term loan CME Term SOFR 1 Month Index + 2.500% 7.9311% 11/30/29 (c)(d)(p) | 892,527 | 892,902 | |
| Golden Entertainment, Inc. Tranche B 1LN, term loan CME Term SOFR 1 Month Index + 2.750% 8.1702% 5/26/30 (c)(d)(p) | 1,510,000 | 1,506,225 | |
| GVC Holdings Gibraltar Ltd. Tranche B2 1LN, term loan CME TERM SOFR 6 MONTH INDEX + 3.500% 8.5843% 10/31/29 (c)(d)(p) | 687,811 | 688,671 | |
| Hilton Grand Vacations Borrower LLC Tranche B 1LN, term loan CME Term SOFR 1 Month Index + 3.000% 8.4455% 8/2/28 (c)(d)(p) | 1,896,378 | 1,896,378 | |
| J&J Ventures Gaming LLC: | |||
| Tranche B 1LN, term loan CME Term SOFR 1 Month Index + 3.000% 4/26/28 (d)(p)(q) | 233,571 | 225,396 | |
| Tranche DD2 1LN, term loan CME Term SOFR 1 Month Index + 4.250% 4/26/28 (d)(p)(q) | 420,429 | 405,714 | |
| Marriott Ownership Resorts, Inc. Tranche B 1LN, term loan CME Term SOFR 1 Month Index + 1.750% 7.1811% 8/31/25 (c)(d)(p) | 500,000 | 498,125 | |
| Ontario Gaming GTA LP Tranche B 1LN, term loan CME Term SOFR 1 Month Index + 4.250% 8/1/30 (d)(p)(q) | 265,000 | 265,498 | |
| Pacific Bells LLC Tranche B 1LN, term loan CME Term SOFR 3 Month Index + 4.500% 10.0035% 10/20/28 (c)(d)(p) | 300,000 | 293,814 | |
| Penn Entertainment, Inc. Tranche B 1LN, term loan CME Term SOFR 1 Month Index + 2.750% 8.1811% 5/3/29 (c)(d)(p) | 199,496 | 199,454 | |
| Playa Resorts Holding BV Tranche B 1LN, term loan CME Term SOFR 1 Month Index + 4.250% 9.5638% 1/5/29 (c)(d)(p) | 259,175 | 258,823 | |
| Restaurant Technologies, Inc. Tranche B 1LN, term loan CME Term SOFR 3 Month Index + 4.250% 9.4919% 4/1/29 (c)(d)(p) | 497,374 | 480,693 | |
| Scientific Games Corp. 1LN, term loan CME Term SOFR 1 Month Index + 3.000% 8.4125% 4/14/29 (c)(d)(p) | 756,141 | 755,331 | |
| Scientific Games Holdings LP term loan CME Term SOFR 3 Month Index + 3.500% 8.7684% 4/4/29 (c)(d)(p) | 1,006,194 | 1,000,217 | |
| Stars Group Holdings BV Tranche B 1LN, term loan CME Term SOFR 3 Month Index + 2.250% 7.7535% 7/21/26 (c)(d)(p) | 984,962 | 984,125 | |
| Station Casinos LLC Tranche B 1LN, term loan CME Term SOFR 1 Month Index + 2.250% 7.6811% 2/7/27 (c)(d)(p) | 1,710,753 | 1,704,731 | |
| United PF Holdings LLC 1LN, term loan CME Term SOFR 1 Month Index + 4.000% 9.6307% 12/30/26 (c)(d)(p) | 497,430 | 394,462 | |
| Whatabrands LLC Tranche B 1LN, term loan CME Term SOFR 1 Month Index + 3.250% 8.4455% 8/3/28 (c)(d)(p) | 754,837 | 753,991 | |
| 31,578,028 | |||
| Household Durables - 0.0% | |||
| Mattress Firm, Inc. Tranche B 1LN, term loan 6 month U.S. LIBOR + 4.250% 9.95% 9/24/28 (c)(d)(p) | 797,239 | 789,266 | |
| Runner Buyer, Inc. Tranche B 1LN, term loan 3 month U.S. LIBOR + 5.500% 11.0369% 10/21/28 (c)(d)(p) | 153,063 | 116,136 | |
| Weber-Stephen Products LLC Tranche B 1LN, term loan CME Term SOFR 1 Month Index + 4.250% 9.6811% 10/30/27 (c)(d)(p) | 182,688 | 164,190 | |
| 1,069,592 | |||
| Leisure Products - 0.0% | |||
| Topgolf Callaway Brands Corp. Tranche B 1LN, term loan CME Term SOFR 1 Month Index + 3.500% 8.9311% 3/9/30 (c)(d)(p) | 842,888 | 841,986 | |
| Specialty Retail - 0.1% | |||
| Academy Ltd. Tranche B 1LN, term loan 1 month U.S. LIBOR + 3.750% 9.1826% 11/6/27 (c)(d)(p) | 228,068 | 228,353 | |
| Belron Finance U.S. LLC Tranche B 1LN, term loan CME Term SOFR 1 Month Index + 2.750% 8.1599% 4/18/29 (c)(d)(p) | 105,000 | 105,000 | |
| Franchise Group, Inc. Tranche B 1LN, term loan: | |||
| CME Term SOFR 3 Month Index + 4.750% 10.3111% 3/10/26 (c)(d)(p) | 955,491 | 855,165 | |
| CME Term SOFR 3 Month Index + 4.750% 10.3769% 3/10/26 (c)(d)(p) | 144,638 | 128,727 | |
| Harbor Freight Tools U.S.A., Inc. Tranche B 1LN, term loan CME Term SOFR 1 Month Index + 2.750% 8.1955% 10/19/27 (c)(d)(p) | 190,717 | 189,660 | |
| Jo-Ann Stores LLC Tranche B 1LN, term loan 3 month U.S. LIBOR + 4.750% 10.3623% 7/7/28 (c)(d)(p) | 167,437 | 61,533 | |
| LBM Acquisition LLC Tranche B 1LN, term loan CME Term SOFR 1 Month Index + 3.750% 9.1811% 12/18/27 (c)(d)(p) | 1,067,492 | 1,037,282 | |
| Ls Group Opco Acquistion LLC Tranche B 1LN, term loan CME Term SOFR 1 Month Index + 3.250% 8.6824% 11/2/27 (c)(d)(p) | 295,455 | 294,471 | |
| Michaels Companies, Inc. 1LN, term loan CME Term SOFR 3 Month Index + 4.250% 9.7535% 4/15/28 (c)(d)(p) | 787,908 | 729,083 | |
| New SK Holdco Sub LLC 1LN, term loan CME Term SOFR 1 Month Index + 8.350% 13.664% 6/30/27 (c)(d)(p) | 350,459 | 329,431 | |
| Petco Health & Wellness Co., Inc. Tranche B 1LN, term loan CME Term SOFR 3 Month Index + 3.250% 8.7535% 3/4/28 (c)(d)(p) | 198,137 | 196,825 | |
| RH: | |||
| Tranche B 1LN, term loan 1 month U.S. LIBOR + 2.500% 7.9455% 10/20/28 (c)(d)(p) | 209,767 | 202,763 | |
| Tranche B2 1LN, term loan CME Term SOFR 1 Month Index + 3.250% 8.6811% 10/20/28 (c)(d)(p) | 466,475 | 453,064 | |
| RVR Dealership Holdings LLC Tranche B 1LN, term loan 1 month U.S. LIBOR + 4.000% 9.2456% 2/8/28 (c)(d)(p) | 94,045 | 85,229 | |
| Tory Burch LLC Tranche B 1LN, term loan CME Term SOFR 1 Month Index + 3.500% 8.6955% 4/16/28 (c)(d)(p) | 637,462 | 628,595 | |
| 5,525,181 | |||
| Textiles, Apparel & Luxury Goods - 0.0% | |||
| Crocs, Inc. Tranche B 1LN, term loan CME Term SOFR 1 Month Index + 3.000% 8.4311% 2/19/29 (c)(d)(p) | 855,000 | 857,043 | |
| Hanesbrands, Inc. Tranche B 1LN, term loan CME Term SOFR 1 Month Index + 3.750% 9.0811% 3/8/30 (c)(d)(p) | 139,650 | 139,475 | |
| 996,518 | |||
TOTAL CONSUMER DISCRETIONARY | 63,913,425 | ||
| CONSUMER STAPLES - 0.2% | |||
| Beverages - 0.1% | |||
| Bengal Debt Merger Sub LLC: | |||
| 1LN, term loan CME Term SOFR 3 Month Index + 3.250% 8.5921% 1/24/29 (c)(d)(p) | 990,000 | 936,788 | |
| 2LN, term loan CME Term SOFR 3 Month Index + 6.000% 11.3419% 1/24/30 (c)(d)(p) | 1,000,000 | 802,140 | |
| Triton Water Holdings, Inc. Tranche B 1LN, term loan CME Term SOFR 1 Month Index + 3.250% 8.7535% 3/31/28 (c)(d)(p) | 2,472,314 | 2,427,342 | |
| 4,166,270 | |||
| Consumer Staples Distribution & Retail - 0.1% | |||
| BJ's Wholesale Club, Inc. Tranche B 1LN, term loan CME Term SOFR 1 Month Index + 2.750% 8.0664% 2/3/27 (c)(d)(p) | 145,000 | 145,102 | |
| Cardenas Merger Sub, LLC 1LN, term loan CME TERM SOFR 6 MONTH INDEX + 6.750% 12.0919% 8/1/29 (c)(d)(p) | 598,421 | 595,579 | |
| Froneri U.S., Inc. Tranche B 1LN, term loan CME Term SOFR 1 Month Index + 2.250% 7.6811% 1/29/27 (c)(d)(p) | 497,436 | 494,586 | |
| Shearer's Foods, Inc. Tranche B 1LN, term loan CME Term SOFR 1 Month Index + 3.500% 8.9455% 9/23/27 (c)(d)(p) | 746,173 | 745,450 | |
| Upfield U.S.A. Corp. Tranche B 1LN, term loan CME Term SOFR 1 Month Index + 4.750% 1/31/28 (d)(p)(q) | 285,000 | 277,875 | |
| 2,258,592 | |||
| Food Products - 0.0% | |||
| Chobani LLC Tranche B 1LN, term loan CME Term SOFR 1 Month Index + 3.500% 8.9455% 10/23/27 (c)(d)(p) | 746,164 | 745,231 | |
| Del Monte Foods, Inc. Tranche B 1LN, term loan CME Term SOFR 1 Month Index + 4.250% 9.6702% 5/16/29 (c)(d)(p) | 989,817 | 965,072 | |
| 1,710,303 | |||
| Household Products - 0.0% | |||
| Kronos Acquisition Holdings, Inc. Tranche B 1LN, term loan 3 month U.S. LIBOR + 3.750% 9.2535% 12/22/26 (c)(d)(p) | 984,849 | 971,169 | |
TOTAL CONSUMER STAPLES | 9,106,334 | ||
| ENERGY - 0.1% | |||
| Energy Equipment & Services - 0.0% | |||
| Bison Midstream Holdings LLC Tranche B 1LN, term loan CME Term SOFR 1 Month Index + 3.750% 9.0625% 2/9/30 (c)(d)(p) | 299,250 | 295,722 | |
| Oil, Gas & Consumable Fuels - 0.1% | |||
| BW Gas & Convenience Holdings LLC Tranche B 1LN, term loan 3 month U.S. LIBOR + 3.500% 8.9455% 3/17/28 (c)(d)(p) | 300,000 | 294,876 | |
| CQP Holdco LP / BIP-V Chinook Holdco LLC Tranche B 1LN, term loan 1 month U.S. LIBOR + 3.500% 8.9311% 6/4/28 (c)(d)(p) | 1,578,021 | 1,579,457 | |
| Delek U.S. Holdings, Inc. Tranche B 1LN, term loan CME Term SOFR 1 Month Index + 3.500% 8.9311% 11/19/29 (c)(d)(p) | 592,599 | 586,507 | |
| EG America LLC: | |||
| term loan CME Term SOFR 1 Month Index + 5.500% 9.1645% 2/7/28 (c)(d)(g)(p) | 850,358 | 807,840 | |
| Tranche B 1LN, term loan CME Term SOFR 1 Month Index + 5.500% 9.4145% 2/7/28 (c)(d)(p) | 200,000 | 192,000 | |
| Tranche BB 1LN, term loan CME Term SOFR 1 Month Index + 4.000% 9.1645% 2/5/25 (c)(d)(p) | 402,393 | 400,884 | |
| GIP II Blue Holding LP Tranche B 1LN, term loan CME Term SOFR 1 Month Index + 4.500% 9.9455% 9/29/28 (c)(d)(p) | 1,474,685 | 1,477,546 | |
| GIP III Stetson I LP Tranche B, term loan CME Term SOFR 1 Month Index + 4.250% 9.6811% 7/18/25 (c)(d)(p) | 196,673 | 196,632 | |
| Mesquite Energy, Inc.: | |||
| 1LN, term loan 3 month U.S. LIBOR + 8.000% 0% (d)(g)(h)(p) | 71,751 | 0 | |
| term loan 3 month U.S. LIBOR + 0.000% 0% (d)(g)(h)(p) | 31,000 | 0 | |
| Par Petroleum LLC Tranche B 1LN, term loan CME Term SOFR 1 Month Index + 4.250% 9.7725% 2/14/30 (c)(d)(p) | 309,588 | 307,396 | |
| 5,843,138 | |||
TOTAL ENERGY | 6,138,860 | ||
| FINANCIALS - 0.6% | |||
| Capital Markets - 0.1% | |||
| AssuredPartners, Inc. Tranche B 1LN, term loan CME Term SOFR 1 Month Index + 3.500% 8.9455% 2/13/27 (c)(d)(p) | 746,134 | 743,336 | |
| Broadstreet Partners, Inc. Tranche B3 1LN, term loan CME Term SOFR 1 Month Index + 4.000% 9.3311% 5/1/30 (c)(d)(p) | 400,000 | 399,584 | |
| Citadel Securities LP Tranche B 1LN, term loan CME Term SOFR 1 Month Index + 2.500% 7.9455% 7/25/30 (c)(d)(p) | 2,229,160 | 2,218,014 | |
| Hightower Holding LLC Tranche B 1LN, term loan 3 month U.S. LIBOR + 4.000% 9.6123% 4/21/28 (c)(d)(p) | 248,734 | 245,210 | |
| 3,606,144 | |||
| Financial Services - 0.2% | |||
| FinCo I LLC Tranche B 1LN, term loan CME Term SOFR 1 Month Index + 3.000% 8.3694% 6/27/29 (c)(d)(p) | 205,000 | 204,914 | |
| Focus Financial Partners LLC: | |||
| Tranche B 1LN, term loan CME Term SOFR 1 Month Index + 2.500% 7.8311% 6/24/28 (c)(d)(p) | 497,462 | 495,472 | |
| Tranche B5 1LN, term loan CME Term SOFR 1 Month Index + 3.250% 8.5811% 6/30/28 (c)(d)(p) | 984,739 | 981,381 | |
| Fugue Finance LLC Tranche B 1LN, term loan CME Term SOFR 1 Month Index + 4.500% 9.9225% 1/25/28 (c)(d)(p) | 428,922 | 429,102 | |
| LSF11 Trinity Bidco, Inc. Tranche B 1LN, term loan CME Term SOFR 1 Month Index + 4.500% 9.8126% 6/15/30 (c)(d)(p) | 90,000 | 90,000 | |
| Nexus Buyer LLC: | |||
| 2LN, term loan CME Term SOFR 1 Month Index + 6.250% 11.6811% 11/1/29 (c)(d)(p) | 55,000 | 50,394 | |
| Tranche B 1LN, term loan CME Term SOFR 1 Month Index + 3.750% 9.1811% 11/8/26 (c)(d)(p) | 720,264 | 709,820 | |
| Recess Holdings, Inc. 1LN, term loan CME Term SOFR 1 Month Index + 4.000% 3/17/27 (d)(p)(q) | 180,000 | 179,550 | |
| TransUnion LLC: | |||
| Tranche B5 1LN, term loan CME Term SOFR 1 Month Index + 1.750% 7.1811% 11/16/26 (c)(d)(p) | 1,917,049 | 1,913,464 | |
| Tranche B6 1LN, term loan CME Term SOFR 1 Month Index + 2.250% 7.6955% 12/1/28 (c)(d)(p) | 912,718 | 911,832 | |
| UFC Holdings LLC Tranche B 1LN, term loan CME Term SOFR 1 Month Index + 2.750% 8.369% 4/29/26 (c)(d)(p) | 994,384 | 994,175 | |
| WH Borrower LLC Tranche B 1LN, term loan: | |||
| CME Term SOFR 1 Month Index + 5.500% 10.808% 2/9/27 (c)(d)(p) | 267,300 | 265,464 | |
| CME Term SOFR 1 Month Index + 5.500% 10.808% 2/15/27 (c)(d)(p) | 498,750 | 495,009 | |
| 7,720,577 | |||
| Insurance - 0.3% | |||
| Acrisure LLC Tranche B 1LN, term loan: | |||
| 1 month U.S. LIBOR + 3.500% 8.9455% 2/15/27 (c)(d)(p) | 2,471,958 | 2,420,319 | |
| 1 month U.S. LIBOR + 4.250% 9.6955% 2/15/27 (c)(d)(p) | 623,418 | 620,301 | |
| CME Term SOFR 1 Month Index + 5.750% 11.1206% 2/15/27 (c)(d)(p) | 513,011 | 513,011 | |
| Alliant Holdings Intermediate LLC Tranche B3 1LN, term loan 1 month U.S. LIBOR + 3.500% 8.9347% 11/12/27 (c)(d)(p) | 1,234,328 | 1,233,118 | |
| AmWINS Group, Inc. Tranche B 1LN, term loan: | |||
| 1 month U.S. LIBOR + 2.250% 7.6955% 2/19/28 (c)(d)(p) | 746,176 | 745,243 | |
| CME Term SOFR 1 Month Index + 2.750% 8.1955% 2/19/28 (c)(d)(p) | 124,375 | 124,167 | |
| Amynta Agency Borrower, Inc. Tranche B 1LN, term loan CME Term SOFR 1 Month Index + 5.000% 10.4311% 2/28/28 (c)(d)(p) | 350,000 | 349,251 | |
| Asurion LLC: | |||
| Tranche B11 1LN, term loan CME Term SOFR 1 Month Index + 4.250% 9.6811% 8/19/28 (c)(d)(p) | 257,738 | 248,596 | |
| Tranche B4 2LN, term loan CME Term SOFR 1 Month Index + 5.250% 10.6955% 1/20/29 (c)(d)(p) | 3,625,000 | 3,168,866 | |
| Tranche B8 1LN, term loan 1 month U.S. LIBOR + 3.250% 8.7879% 12/23/26 (c)(d)(p) | 994,898 | 966,295 | |
| Tranche B9 1LN, term loan 1 month U.S. LIBOR + 3.250% 8.7879% 7/31/27 (c)(d)(p) | 1,723,552 | 1,655,954 | |
| HUB International Ltd. Tranche B 1LN, term loan: | |||
| CME Term SOFR 1 Month Index + 4.250% 9.5835% 6/8/30 (c)(d)(p) | 1,958,858 | 1,964,166 | |
| CME Term SOFR 3 Month Index + 4.000% 9.3653% 11/10/29 (c)(d)(p) | 717,896 | 718,865 | |
| Jones DesLauriers Insurance Management, Inc. Tranche B 1LN, term loan CME Term SOFR 1 Month Index + 4.250% 3/16/30 (d)(p)(q) | 265,000 | 265,167 | |
| USI, Inc. 1LN, term loan: | |||
| 1 month U.S. LIBOR + 3.250% 8.7879% 12/2/26 (c)(d)(p) | 1,477,078 | 1,477,078 | |
| CME Term SOFR 1 Month Index + 3.750% 8.9919% 11/22/29 (c)(d)(p) | 193,538 | 193,586 | |
| 16,663,983 | |||
TOTAL FINANCIALS | 27,990,704 | ||
| HEALTH CARE - 0.3% | |||
| Health Care Equipment & Supplies - 0.0% | |||
| Avantor Funding, Inc. Tranche B5 1LN, term loan CME Term SOFR 1 Month Index + 2.250% 7.6811% 11/6/27 (c)(d)(p) | 315,104 | 315,158 | |
| Embecta Corp. Tranche B 1LN, term loan CME Term SOFR 1 Month Index + 3.000% 8.3367% 3/31/29 (c)(d)(p) | 183,546 | 182,056 | |
| Insulet Corp. Tranche B 1LN, term loan CME Term SOFR 1 Month Index + 3.250% 8.6955% 5/4/28 (c)(d)(p) | 854,464 | 854,892 | |
| Maravai Intermediate Holdings LLC Tranche B 1LN, term loan CME Term SOFR 3 Month Index + 3.000% 8.3201% 10/19/27 (c)(d)(p) | 291,212 | 279,564 | |
| Mozart Borrower LP Tranche B 1LN, term loan CME Term SOFR 1 Month Index + 3.250% 8.6955% 10/23/28 (c)(d)(p) | 574,876 | 574,215 | |
| Pathway Vet Alliance LLC Tranche B 1LN, term loan 3 month U.S. LIBOR + 3.750% 9.1955% 3/31/27 (c)(d)(p) | 396,452 | 365,727 | |
| 2,571,612 | |||
| Health Care Providers & Services - 0.2% | |||
| Accelerated Health Systems LLC Tranche B1 LN, term loan CME Term SOFR 3 Month Index + 4.250% 9.6419% 2/15/29 (c)(d)(p) | 193,050 | 157,336 | |
| AHP Health Partners, Inc. Tranche B 1LN, term loan 1 month U.S. LIBOR + 3.500% 8.9455% 8/24/28 (c)(d)(p) | 369,061 | 369,245 | |
| Cano Health, Inc. Tranche B 1LN, term loan CME Term SOFR 1 Month Index + 4.000% 9.4311% 11/23/27 (c)(d)(p) | 767,018 | 479,386 | |
| Charlotte Buyer, Inc. Tranche B 1LN, term loan CME Term SOFR 3 Month Index + 5.250% 10.5625% 2/12/28 (c)(d)(p) | 104,475 | 102,882 | |
| Da Vinci Purchaser Corp. Tranche B 1LN, term loan CME Term SOFR 1 Month Index + 4.000% 9.4455% 1/8/27 (c)(d)(p) | 313,233 | 310,022 | |
| Gainwell Acquisition Corp. Tranche B 1LN, term loan CME Term SOFR 3 Month Index + 4.000% 9.3419% 10/1/27 (c)(d)(p) | 2,625,205 | 2,581,731 | |
| HAH Group Holding Co. LLC 1LN, term loan CME Term SOFR 3 Month Index + 5.000% 10.44% 10/29/27 (c)(d)(p) | 124,808 | 122,311 | |
| Icon Luxembourg Sarl Tranche B 1LN, term loan CME Term SOFR 3 Month Index + 2.250% 7.7535% 7/3/28 (c)(d)(p) | 760,575 | 760,659 | |
| MED ParentCo LP 1LN, term loan CME Term SOFR 1 Month Index + 4.250% 9.6955% 8/31/26 (c)(d)(p) | 497,416 | 474,754 | |
| Phoenix Newco, Inc. Tranche B 1LN, term loan CME Term SOFR 1 Month Index + 3.250% 8.6955% 11/15/28 (c)(d)(p) | 1,730,619 | 1,724,354 | |
| Surgery Center Holdings, Inc. 1LN, term loan 1 month U.S. LIBOR + 3.750% 9.1785% 8/31/26 (c)(d)(p) | 782,884 | 783,808 | |
| U.S. Anesthesia Partners, Inc. Tranche B 1LN, term loan CME Term SOFR 1 Month Index + 4.250% 9.6826% 10/1/28 (c)(d)(p) | 103,103 | 96,143 | |
| 7,962,631 | |||
| Health Care Technology - 0.1% | |||
| Athenahealth Group, Inc. Tranche B 1LN, term loan CME Term SOFR 1 Month Index + 3.500% 8.8202% 2/15/29 (c)(d)(p) | 1,821,866 | 1,798,327 | |
| Imprivata, Inc. Tranche B 1LN, term loan CME Term SOFR 1 Month Index + 4.250% 9.5811% 12/1/27 (c)(d)(p) | 143,550 | 142,832 | |
| Virgin Pulse, Inc. Tranche B 1LN, term loan CME Term SOFR 1 Month Index + 4.000% 9.1955% 4/6/28 (c)(d)(p) | 469,545 | 437,851 | |
| Zelis Payments Buyer, Inc. Tranche B 1LN, term loan 1 month U.S. LIBOR + 3.500% 8.9455% 9/30/26 (c)(d)(p) | 1,297,328 | 1,297,457 | |
| 3,676,467 | |||
| Life Sciences Tools & Services - 0.0% | |||
| PRA Health Sciences, Inc. Tranche B 1LN, term loan CME Term SOFR 3 Month Index + 2.250% 7.7535% 7/3/28 (c)(d)(p) | 189,498 | 189,519 | |
| Pharmaceuticals - 0.0% | |||
| Elanco Animal Health, Inc. Tranche B 1LN, term loan CME Term SOFR 1 Month Index + 1.750% 7.1681% 8/1/27 (c)(d)(p) | 660,990 | 654,175 | |
| Jazz Financing Lux SARL Tranche B 1LN, term loan CME Term SOFR 1 Month Index + 3.500% 8.9455% 5/5/28 (c)(d)(p) | 854,549 | 854,549 | |
| Organon & Co. Tranche B 1LN, term loan CME Term SOFR 3 Month Index + 3.000% 8.4309% 6/2/28 (c)(d)(p) | 674,141 | 674,774 | |
| 2,183,498 | |||
TOTAL HEALTH CARE | 16,583,727 | ||
| INDUSTRIALS - 1.1% | |||
| Aerospace & Defense - 0.1% | |||
| TransDigm, Inc.: | |||
| 1LN, term loan CME Term SOFR 1 Month Index + 3.250% 8.4919% 8/24/28 (c)(d)(p) | 846,508 | 846,889 | |
| Tranche H 1LN, term loan CME Term SOFR 1 Month Index + 3.250% 8.4919% 2/22/27 (c)(d)(p) | 1,684,667 | 1,688,357 | |
| 2,535,246 | |||
| Air Freight & Logistics - 0.0% | |||
| Echo Global Logistics, Inc. 1LN, term loan CME Term SOFR 1 Month Index + 3.500% 8.9311% 11/23/28 (c)(d)(p) | 1,120,275 | 1,089,467 | |
| Rand Parent LLC Tranche B 1LN, term loan CME Term SOFR 1 Month Index + 4.250% 9.4919% 3/17/30 (c)(d)(p) | 84,788 | 81,990 | |
| STG Logistics, Inc. 1LN, term loan CME Term SOFR 1 Month Index + 6.000% 11.3919% 3/24/28 (c)(d)(g)(p) | 133,313 | 128,580 | |
| 1,300,037 | |||
| Building Products - 0.2% | |||
| Acproducts Holdings, Inc. Tranche B 1LN, term loan 1 month U.S. LIBOR + 4.250% 9.7535% 5/17/28 (c)(d)(p) | 1,823,032 | 1,556,414 | |
| APi Group DE, Inc. Tranche B 1LN, term loan CME Term SOFR 1 Month Index + 2.750% 8.1955% 12/16/28 (c)(d)(p) | 895,430 | 897,293 | |
| AZZ, Inc. Tranche B 1LN, term loan CME Term SOFR 1 Month Index + 4.250% 9.0811% 5/13/29 (c)(d)(p) | 448,125 | 448,797 | |
| Emerson Climate Technologies Tranche B 1LN, term loan CME Term SOFR 1 Month Index + 3.000% 8.3311% 5/31/30 (c)(d)(p) | 559,358 | 559,710 | |
| Foley Products Co. LLC 1LN, term loan CME Term SOFR 3 Month Index + 4.750% 10.1419% 12/29/28 (c)(d)(p) | 134,238 | 132,645 | |
| Griffon Corp. Tranche B 1LN, term loan CME Term SOFR 1 Month Index + 2.750% 7.6387% 1/24/29 (c)(d)(p) | 612,500 | 610,393 | |
| Hunter Douglas, Inc. Tranche B 1LN, term loan CME Term SOFR 3 Month Index + 3.500% 8.8911% 2/25/29 (c)(d)(p) | 2,304,842 | 2,237,149 | |
| Oscar AcquisitionCo LLC 1LN, term loan CME Term SOFR 3 Month Index + 4.500% 9.8419% 4/29/29 (c)(d)(p) | 1,203,014 | 1,197,733 | |
| 7,640,134 | |||
| Commercial Services & Supplies - 0.4% | |||
| ABG Intermediate Holdings 2 LLC: | |||
| Tranche B 2LN, term loan CME Term SOFR 1 Month Index + 6.000% 11.4311% 12/20/29 (c)(d)(p) | 400,000 | 402,000 | |
| Tranche B1 LN, term loan CME Term SOFR 1 Month Index + 3.500% 8.9311% 12/21/28 (c)(d)(p) | 1,485,000 | 1,484,079 | |
| Tranche B2 1LN, term loan CME Term SOFR 1 Month Index + 4.000% 9.4187% 12/21/28 (c)(d)(p) | 832,160 | 832,310 | |
| Tranche DD 1LN, term loan CME Term SOFR 1 Month Index + 4.000% 5.9018% 12/21/28 (c)(d)(p)(r) | 272,840 | 272,889 | |
| ADS Tactical, Inc. Tranche B 1LN, term loan 1 month U.S. LIBOR + 5.750% 11.1955% 3/19/26 (c)(d)(p) | 486,301 | 472,928 | |
| All-Star Bidco AB Tranche B1 1LN, term loan CME Term SOFR 3 Month Index + 3.500% 8.45% 11/16/28 (c)(d)(p) | 746,212 | 739,914 | |
| Allied Universal Holdco LLC Tranche B 1LN, term loan: | |||
| 1 month U.S. LIBOR + 3.750% 9.1811% 5/14/28 (c)(d)(p) | 984,962 | 956,339 | |
| CME Term SOFR 1 Month Index + 4.750% 9.8805% 5/14/28 (c)(d)(p) | 240,000 | 237,120 | |
| APX Group, Inc. Tranche B 1LN, term loan CME Term SOFR 1 Month Index + 3.250% 8.679% 7/9/28 (c)(d)(p) | 771,770 | 771,408 | |
| Archkey Holdings, Inc. Tranche B 1LN, term loan CME Term SOFR 1 Month Index + 5.250% 10.836% 6/30/28 (c)(d)(p) | 83,932 | 83,460 | |
| AVSC Holding Corp. Tranche B2 1LN, term loan 3 month U.S. LIBOR + 5.500% 10.9311% 10/15/26 (c)(d)(p) | 500,789 | 484,514 | |
| Brand Energy & Infrastructure Services, Inc. Tranche B 1LN, term loan CME Term SOFR 1 Month Index + 5.500% 10.8719% 8/1/30 (c)(d)(p) | 1,170,000 | 1,128,839 | |
| Congruex Group LLC Tranche B 1LN, term loan CME Term SOFR 3 Month Index + 5.750% 11.2691% 5/3/29 (c)(d)(p) | 198,000 | 194,535 | |
| Covanta Holding Corp.: | |||
| Tranche B 1LN, term loan: | |||
| CME Term SOFR 1 Month Index + 2.500% 7.8311% 11/30/28 (c)(d)(p) | 216,832 | 215,885 | |
| CME Term SOFR 1 Month Index + 3.000% 8.3125% 11/30/28 (c)(d)(p) | 125,581 | 125,477 | |
| Tranche C 1LN, term loan: | |||
| CME Term SOFR 1 Month Index + 2.500% 7.8311% 11/30/28 (c)(d)(p) | 16,448 | 16,376 | |
| CME Term SOFR 1 Month Index + 3.000% 8.3125% 11/30/28 (c)(d)(p) | 9,419 | 9,411 | |
| Ensemble RCM LLC 1LN, term loan CME Term SOFR 1 Month Index + 3.750% 9.2191% 8/1/26 (c)(d)(p) | 591,464 | 591,783 | |
| Filtration Group Corp. Tranche B 1LN, term loan CME Term SOFR 1 Month Index + 3.500% 8.9455% 10/21/28 (c)(d)(p) | 746,203 | 741,852 | |
| KNS Acquisitions, Inc. Tranche B 1LN, term loan CME Term SOFR 1 Month Index + 6.250% 11.6955% 4/21/27 (c)(d)(p) | 259,770 | 219,506 | |
| Madison IAQ LLC Tranche B 1LN, term loan 3 month U.S. LIBOR + 3.250% 8.3023% 6/21/28 (c)(d)(p) | 732,417 | 727,839 | |
| Maverick Purchaser Sub LLC Tranche B 1LN, term loan CME Term SOFR 1 Month Index + 4.000% 9.3138% 2/15/29 (c)(d)(p) | 1,715,605 | 1,675,580 | |
| Neptune BidCo U.S., Inc.: | |||
| term loan CME Term SOFR 1 Month Index + 4.750% 10.1485% 10/11/28 (c)(d)(p) | 418,950 | 376,795 | |
| Tranche B 1LN, term loan CME Term SOFR 1 Month Index + 5.000% 10.3985% 4/11/29 (c)(d)(p) | 2,394,000 | 2,177,535 | |
| Omnia Partners LLC: | |||
| 1LN, term loan CME Term SOFR 1 Month Index + 4.250% 9.6012% 7/25/30 (c)(d)(p) | 493,629 | 494,557 | |
| Tranche DD 1LN, term loan CME Term SOFR 1 Month Index + 4.250% 7/19/30 (d)(p)(r) | 46,371 | 46,458 | |
| Optiv Security, Inc. Tranche B 1LN, term loan CME Term SOFR 1 Month Index + 5.250% 10.3384% 8/14/26 (c)(d)(p) | 205,000 | 196,800 | |
| Pilot Travel Centers LLC Tranche B 1LN, term loan CME Term SOFR 1 Month Index + 2.000% 7.4311% 8/4/28 (c)(d)(p) | 942,904 | 939,538 | |
| PowerTeam Services LLC Tranche B 1LN, term loan CME Term SOFR 3 Month Index + 3.500% 8.8419% 3/6/25 (c)(d)(p) | 497,462 | 462,018 | |
| Sabert Corp. Tranche B 1LN, term loan CME Term SOFR 1 Month Index + 4.500% 9.9455% 12/10/26 (c)(d)(p) | 643,882 | 643,882 | |
| The Brickman Group, Ltd. Tranche B 1LN, term loan CME Term SOFR 1 Month Index + 3.250% 8.6191% 4/22/29 (c)(d)(p) | 138,375 | 137,741 | |
| WMB Holdings, Inc. Tranche B 1LN, term loan CME Term SOFR 1 Month Index + 3.250% 8.6811% 11/3/29 (c)(d)(p) | 128,925 | 128,952 | |
| 17,988,320 | |||
| Construction & Engineering - 0.1% | |||
| Breakwater Energy Partners LLC Tranche B 1LN, term loan 11.25% 9/1/26 (c)(g)(p) | 1,123,537 | 1,085,674 | |
| Fluidra Finco SL Tranche B 1LN, term loan CME Term SOFR 1 Month Index + 2.000% 7.3561% 1/27/29 (c)(d)(p) | 248,737 | 247,260 | |
| Pike Corp. Tranche B 1LN, term loan CME Term SOFR 1 Month Index + 3.500% 8.8311% 1/21/28 (c)(d)(p) | 797,367 | 798,363 | |
| Rockwood Service Corp. Tranche B 1LN, term loan CME Term SOFR 1 Month Index + 4.000% 9.4455% 1/23/27 (c)(d)(p) | 204,000 | 204,341 | |
| SRS Distribution, Inc. Tranche B 1LN, term loan 1 month U.S. LIBOR + 3.500% 8.9455% 6/4/28 (c)(d)(p) | 2,472,311 | 2,436,784 | |
| 4,772,422 | |||
| Electrical Equipment - 0.1% | |||
| Alliance Laundry Systems LLC Tranche B 1LN, term loan CME Term SOFR 3 Month Index + 3.500% 8.9013% 10/8/27 (c)(d)(p) | 248,710 | 248,902 | |
| Array Technologies, Inc. Tranche B 1LN, term loan CME Term SOFR 3 Month Index + 3.250% 8.6823% 10/14/27 (c)(d)(p) | 820,500 | 816,742 | |
| Vertiv Group Corp. Tranche B 1LN, term loan CME Term SOFR 1 Month Index + 2.750% 8.1823% 3/2/27 (c)(d)(p) | 1,979,746 | 1,977,826 | |
| 3,043,470 | |||
| Ground Transportation - 0.0% | |||
| Avis Budget Group, Inc. 1LN, term loan CME Term SOFR 1 Month Index + 3.500% 8.9311% 3/16/29 (c)(d)(p) | 113,563 | 113,385 | |
| Genesee & Wyoming, Inc. 1LN, term loan CME Term SOFR 3 Month Index + 2.000% 7.3419% 12/30/26 (c)(d)(p) | 497,429 | 497,340 | |
| Uber Technologies, Inc. Tranche B 1LN, term loan CME Term SOFR 1 Month Index + 3.000% 8.0183% 3/3/30 (c)(d)(p) | 1,123,355 | 1,124,568 | |
| 1,735,293 | |||
| Machinery - 0.0% | |||
| Ali Group North America Corp. Tranche B 1LN, term loan CME Term SOFR 1 Month Index + 2.000% 7.4455% 7/22/29 (c)(d)(p) | 917,975 | 918,057 | |
| Chart Industries, Inc. 1LN, term loan CME Term SOFR 1 Month Index + 3.750% 9.164% 3/17/30 (c)(d)(p) | 689,450 | 688,588 | |
| Vertical U.S. Newco, Inc. Tranche B 1LN, term loan 6 month U.S. LIBOR + 3.500% 9.3811% 7/31/27 (c)(d)(p) | 289,275 | 288,714 | |
| 1,895,359 | |||
| Passenger Airlines - 0.1% | |||
| AAdvantage Loyalty IP Ltd. Tranche B 1LN, term loan CME Term SOFR 1 Month Index + 4.750% 10.3378% 4/20/28 (c)(d)(p) | 636,500 | 660,471 | |
| Mileage Plus Holdings LLC Tranche B 1LN, term loan 3 month U.S. LIBOR + 5.250% 10.7637% 7/2/27 (c)(d)(p) | 976,209 | 1,016,917 | |
| SkyMiles IP Ltd. Tranche B 1LN, term loan CME Term SOFR 1 Month Index + 3.750% 9.0761% 10/20/27 (c)(d)(p) | 306,000 | 318,203 | |
| United Airlines, Inc. Tranche B 1LN, term loan 3 month U.S. LIBOR + 3.750% 9.2919% 4/21/28 (c)(d)(p) | 395,934 | 396,429 | |
| 2,392,020 | |||
| Professional Services - 0.1% | |||
| Cast & Crew Payroll LLC Tranche B 1LN, term loan 1 month U.S. LIBOR + 3.500% 8.9455% 2/7/26 (c)(d)(p) | 1,129,198 | 1,104,266 | |
| Ceridian HCM Holding, Inc. Tranche B, term loan CME Term SOFR 1 Month Index + 2.500% 7.9455% 4/30/25 (c)(d)(p) | 836,055 | 834,834 | |
| CHG Healthcare Services, Inc. 1LN, term loan 1 month U.S. LIBOR + 3.250% 8.6955% 9/30/28 (c)(d)(p) | 776,051 | 770,719 | |
| CoreLogic, Inc. Tranche B 1LN, term loan 1 month U.S. LIBOR + 3.500% 8.9455% 6/2/28 (c)(d)(p) | 984,962 | 916,370 | |
| EmployBridge LLC Tranche B 1LN, term loan 3 month U.S. LIBOR + 4.750% 10.2584% 7/19/28 (c)(d)(p) | 984,962 | 819,981 | |
| Galaxy U.S. Opco, Inc. 1LN, term loan CME Term SOFR 1 Month Index + 4.750% 10.0811% 4/29/29 (c)(d)(p) | 158,800 | 150,463 | |
| Sedgwick Claims Management Services, Inc. Tranche B 1LN, term loan CME Term SOFR 1 Month Index + 3.750% 9.0811% 2/24/28 (c)(d)(p) | 164,700 | 164,847 | |
| Sitel Worldwide Corp. Tranche B 1LN, term loan 1 month U.S. LIBOR + 3.750% 9.1955% 8/27/28 (c)(d)(p) | 334,150 | 329,806 | |
| Verscend Holding Corp. Tranche B 1LN, term loan CME Term SOFR 1 Month Index + 4.000% 9.4455% 8/27/25 (c)(d)(p) | 746,193 | 745,260 | |
| 5,836,546 | |||
| Transportation Infrastructure - 0.0% | |||
| AIT Worldwide Logistics Holdings, Inc. 1LN, term loan 3 month U.S. LIBOR + 4.750% 10.1624% 4/6/28 (c)(d)(p) | 382,252 | 376,678 | |
| ASP LS Acquisition Corp. Tranche B 1LN, term loan 6 month U.S. LIBOR + 4.500% 10.1307% 5/7/28 (c)(d)(p) | 423,921 | 367,752 | |
| Wwex Unified Topco Holdings LLC 1LN, term loan CME Term SOFR 1 Month Index + 4.250% 9.5035% 7/26/28 (c)(d)(p) | 497,475 | 481,824 | |
| 1,226,254 | |||
TOTAL INDUSTRIALS | 50,365,101 | ||
| INFORMATION TECHNOLOGY - 1.1% | |||
| Communications Equipment - 0.1% | |||
| Anastasia Parent LLC Tranche B, term loan CME Term SOFR 3 Month Index + 3.750% 9.2535% 8/10/25 (c)(d)(p) | 1,230,620 | 918,350 | |
| Ciena Corp. Tranche B 1LN, term loan CME Term SOFR 1 Month Index + 2.500% 7.814% 1/18/30 (c)(d)(p) | 79,600 | 79,600 | |
| CommScope, Inc. Tranche B 1LN, term loan CME Term SOFR 1 Month Index + 3.250% 8.6955% 4/4/26 (c)(d)(p) | 1,476,982 | 1,354,393 | |
| Eos U.S. Finco LLC 1LN, term loan CME Term SOFR 3 Month Index + 6.000% 11.2684% 10/6/29 (c)(d)(p) | 391,615 | 383,458 | |
| Radiate Holdco LLC Tranche B 1LN, term loan 1 month U.S. LIBOR + 3.250% 8.6955% 9/25/26 (c)(d)(p) | 2,472,450 | 2,019,324 | |
| 4,755,125 | |||
| Electronic Equipment, Instruments & Components - 0.0% | |||
| Coherent Corp. Tranche B 1LN, term loan CME Term SOFR 1 Month Index + 2.750% 8.1955% 7/1/29 (c)(d)(p) | 916,652 | 913,444 | |
| DG Investment Intermediate Holdings, Inc. Tranche B 1LN, term loan: | |||
| CME Term SOFR 1 Month Index + 3.750% 9.1955% 3/31/28 (c)(d)(p) | 300,000 | 294,162 | |
| CME Term SOFR 1 Month Index + 4.750% 10.0811% 3/31/28 (c)(d)(p) | 153,838 | 152,491 | |
| Go Daddy Operating Co. LLC Tranche B 1LN, term loan CME Term SOFR 1 Month Index + 2.000% 7.4455% 8/10/27 (c)(d)(p) | 984,772 | 984,279 | |
| 2,344,376 | |||
| IT Services - 0.2% | |||
| Acuris Finance U.S., Inc. 1LN, term loan CME Term SOFR 3 Month Index + 4.000% 9.3919% 2/16/28 (c)(d)(p) | 175,000 | 173,551 | |
| Arches Buyer, Inc. Tranche B 1LN, term loan CME Term SOFR 1 Month Index + 3.250% 8.6811% 12/4/27 (c)(d)(p) | 173,657 | 168,637 | |
| Camelot Finance SA Tranche B, term loan CME Term SOFR 1 Month Index + 3.000% 8.4455% 10/31/26 (c)(d)(p) | 1,748,174 | 1,747,737 | |
| Constant Contact, Inc. Tranche B 1LN, term loan 1 month U.S. LIBOR + 4.000% 9.5611% 2/10/28 (c)(d)(p) | 249,003 | 238,669 | |
| Hunter U.S. Bidco, Inc. Tranche B 1LN, term loan CME Term SOFR 3 Month Index + 4.250% 9.5919% 8/19/28 (c)(d)(p) | 370,000 | 369,316 | |
| Ion Trading Finance Ltd. Tranche B 1LN, term loan CME Term SOFR 3 Month Index + 4.750% 10.0919% 3/26/28 (c)(d)(p) | 944,925 | 924,448 | |
| Park Place Technologies LLC 1LN, term loan CME Term SOFR 1 Month Index + 5.000% 10.4311% 11/10/27 (c)(d)(p) | 870,864 | 849,310 | |
| Peraton Corp. Tranche B 1LN, term loan CME Term SOFR 1 Month Index + 3.750% 9.1811% 2/1/28 (c)(d)(p) | 2,326,408 | 2,301,330 | |
| Tempo Acquisition LLC 1LN, term loan U.S. Secured Overnight Fin. Rate (SOFR) Index + 3.000% 8.3311% 8/31/28 (c)(d)(p) | 1,117,476 | 1,118,873 | |
| VFH Parent LLC Tranche B 1LN, term loan CME Term SOFR 1 Month Index + 3.000% 8.4202% 1/13/29 (c)(d)(p) | 867,500 | 860,560 | |
| 8,752,431 | |||
| Semiconductors & Semiconductor Equipment - 0.0% | |||
| Entegris, Inc. Tranche B 1LN, term loan CME Term SOFR 1 Month Index + 2.750% 8.0176% 7/6/29 (c)(d)(p) | 348,026 | 348,461 | |
| MKS Instruments, Inc. Tranche B 1LN, term loan CME Term SOFR 1 Month Index + 2.750% 8.1788% 8/17/29 (c)(d)(p) | 1,085,316 | 1,083,732 | |
| 1,432,193 | |||
| Software - 0.8% | |||
| A&V Holdings Midco LLC Tranche B 1LN, term loan 3 month U.S. LIBOR + 5.370% 10.2611% 3/10/27 (c)(d)(p) | 139,583 | 136,792 | |
| Applied Systems, Inc. Tranche B 1LN, term loan CME Term SOFR 3 Month Index + 4.500% 9.7419% 9/19/26 (c)(d)(p) | 468,825 | 470,353 | |
| AppLovin Corp. Tranche B 1LN, term loan CME Term SOFR 1 Month Index + 3.100% 8.412% 8/14/30 (c)(d)(p) | 1,255,805 | 1,251,410 | |
| Aptean, Inc. 1LN, term loan CME Term SOFR 1 Month Index + 4.250% 9.6811% 4/23/26 (c)(d)(p) | 746,102 | 738,641 | |
| Ascend Learning LLC: | |||
| 2LN, term loan CME Term SOFR 1 Month Index + 5.750% 11.1811% 12/10/29 (c)(d)(p) | 130,000 | 110,880 | |
| Tranche B 1LN, term loan CME Term SOFR 1 Month Index + 3.500% 8.9311% 12/10/28 (c)(d)(p) | 2,418,861 | 2,322,977 | |
| Byju's Alpha, Inc. Tranche B 1LN, term loan 3 month U.S. LIBOR + 8.000% 15.4885% 11/24/26 (c)(d)(p) | 258,438 | 131,803 | |
| Central Parent, Inc. 1LN, term loan CME Term SOFR 3 Month Index + 4.250% 9.4919% 7/6/29 (c)(d)(p) | 706,487 | 706,657 | |
| Cloud Software Group, Inc. Tranche B 1LN, term loan CME Term SOFR 3 Month Index + 4.500% 9.8419% 3/30/29 (c)(d)(p) | 1,319,622 | 1,269,146 | |
| ConnectWise LLC Tranche B 1LN, term loan 3 month U.S. LIBOR + 3.500% 8.9455% 9/30/28 (c)(d)(p) | 497,475 | 488,147 | |
| DCert Buyer, Inc.: | |||
| 1LN, term loan CME Term SOFR 1 Month Index + 4.000% 9.3311% 10/16/26 (c)(d)(p) | 1,230,916 | 1,225,512 | |
| Tranche B 2LN, term loan 1 month U.S. LIBOR + 7.000% 12.3311% 2/19/29 (c)(d)(p) | 500,000 | 465,835 | |
| Epicor Software Corp.: | |||
| 1LN, term loan CME Term SOFR 1 Month Index + 3.750% 7/31/27 (d)(p)(q) | 250,000 | 250,158 | |
| Tranche B 1LN, term loan CME Term SOFR 1 Month Index + 3.250% 8.6955% 7/31/27 (c)(d)(p) | 497,442 | 496,448 | |
| Finastra U.S.A., Inc.: | |||
| Tranche 2LN, term loan 3 month U.S. LIBOR + 7.250% 12.981% 6/13/25 (c)(d)(p) | 439,000 | 438,359 | |
| Tranche B 1LN, term loan CME TERM SOFR 6 MONTH INDEX + 3.500% 9.231% 6/13/24 (c)(d)(p) | 2,679,346 | 2,675,729 | |
| Flexera Software LLC Tranche B 1LN, term loan 1 month U.S. LIBOR + 3.750% 9.1955% 3/3/28 (c)(d)(p) | 188,147 | 185,913 | |
| Gen Digital, Inc. Tranche B 1LN, term loan CME Term SOFR 1 Month Index + 2.000% 7.4311% 9/12/29 (c)(d)(p) | 1,504,392 | 1,501,383 | |
| Greeneden U.S. Holdings II LLC Tranche B 1LN, term loan 1 month U.S. LIBOR + 4.000% 9.4455% 12/1/27 (c)(d)(p) | 1,290,352 | 1,289,552 | |
| Helios Software Holdings, Inc. Tranche B 1LN, term loan CME Term SOFR 1 Month Index + 4.250% 9.6599% 7/14/30 (c)(d)(p) | 115,000 | 113,814 | |
| McAfee Corp. Tranche B 1LN, term loan CME Term SOFR 1 Month Index + 3.750% 9.1681% 3/1/29 (c)(d)(p) | 1,080,386 | 1,058,778 | |
| MH Sub I LLC: | |||
| Tranche B 1LN, term loan CME Term SOFR 1 Month Index + 4.250% 9.5811% 5/3/28 (c)(d)(p) | 3,228,404 | 3,099,978 | |
| Tranche B 2LN, term loan CME Term SOFR 1 Month Index + 6.250% 11.5811% 2/23/29 (c)(d)(p) | 750,000 | 651,188 | |
| Open Text Corp. Tranche B 1LN, term loan CME Term SOFR 1 Month Index + 2.750% 8.1811% 1/31/30 (c)(d)(p) | 1,173,275 | 1,173,932 | |
| Polaris Newco LLC Tranche B 1LN, term loan 3 month U.S. LIBOR + 4.000% 9.5379% 6/2/28 (c)(d)(p) | 1,853,782 | 1,797,019 | |
| Proofpoint, Inc. Tranche B 1LN, term loan 3 month U.S. LIBOR + 3.250% 8.6955% 8/31/28 (c)(d)(p) | 1,477,500 | 1,461,573 | |
| Rackspace Technology Global, Inc. Tranche B 1LN, term loan CME Term SOFR 1 Month Index + 2.750% 8.1769% 2/15/28 (c)(d)(p) | 984,887 | 437,043 | |
| RealPage, Inc. Tranche B 1LN, term loan CME Term SOFR 1 Month Index + 3.000% 8.4455% 4/22/28 (c)(d)(p) | 596,937 | 589,678 | |
| Renaissance Holdings Corp. 1LN, term loan CME Term SOFR 1 Month Index + 4.750% 9.9919% 4/7/30 (c)(d)(p) | 915,000 | 915,430 | |
| Roper Industrial Products Investment Co. Tranche B 1LN, term loan CME Term SOFR 1 Month Index + 4.250% 9.7419% 11/22/29 (c)(d)(p) | 239,400 | 239,568 | |
| Sophia LP Tranche B 1LN, term loan 3 month U.S. LIBOR + 3.500% 9.0379% 10/7/27 (c)(d)(p) | 497,468 | 496,329 | |
| Sovos Compliance LLC Tranche B 1LN, term loan 1 month U.S. LIBOR + 4.500% 9.9455% 8/11/28 (c)(d)(p) | 299,593 | 291,261 | |
| SS&C Technologies, Inc.: | |||
| Tranche B 5LN, term loan CME Term SOFR 1 Month Index + 1.750% 7.1955% 4/16/25 (c)(d)(p) | 924,834 | 924,446 | |
| Tranche B6 1LN, term loan CME Term SOFR 1 Month Index + 2.250% 7.6811% 3/22/29 (c)(d)(p) | 397,811 | 397,528 | |
| Tranche B7 1LN, term loan CME Term SOFR 1 Month Index + 2.250% 7.6811% 3/22/29 (c)(d)(p) | 599,578 | 599,152 | |
| UKG, Inc. 1LN, term loan CME Term SOFR 3 Month Index + 3.750% 9.2191% 5/4/26 (c)(d)(p) | 997,409 | 996,990 | |
| Ultimate Software Group, Inc.: | |||
| 1LN, term loan: | |||
| 1 month U.S. LIBOR + 3.250% 8.6184% 5/3/26 (c)(d)(p) | 1,766,440 | 1,764,409 | |
| CME Term SOFR 1 Month Index + 4.500% 10.0225% 5/4/26 (c)(d)(p) | 250,000 | 250,520 | |
| 2LN, term loan CME Term SOFR 3 Month Index + 5.250% 10.6184% 5/3/27 (c)(d)(p) | 1,145,000 | 1,137,031 | |
| Veritas U.S., Inc. Tranche B 1LN, term loan 3 month U.S. LIBOR + 5.000% 10.4455% 9/1/25 (c)(d)(p) | 956,680 | 804,539 | |
| VS Buyer LLC Tranche B 1LN, term loan CME Term SOFR 1 Month Index + 3.000% 8.6811% 2/28/27 (c)(d)(p) | 433,879 | 428,455 | |
| 35,784,356 | |||
TOTAL INFORMATION TECHNOLOGY | 53,068,481 | ||
| MATERIALS - 0.5% | |||
| Chemicals - 0.2% | |||
| ARC Falcon I, Inc. Tranche B 1LN, term loan CME Term SOFR 1 Month Index + 3.750% 9.1811% 9/30/28 (c)(d)(p) | 1,109,367 | 1,083,197 | |
| Aruba Investment Holdings LLC: | |||
| 1LN, term loan CME Term SOFR 1 Month Index + 4.750% 10.0811% 11/24/27 (c)(d)(p) | 124,375 | 120,022 | |
| 2LN, term loan 1 month U.S. LIBOR + 7.750% 13.1811% 11/24/28 (c)(d)(p) | 110,000 | 99,916 | |
| Tranche B 1LN, term loan 1 month U.S. LIBOR + 4.000% 9.4311% 11/24/27 (c)(d)(p) | 994,937 | 964,472 | |
| Avient Corp. Tranche B7 1LN, term loan CME Term SOFR 1 Month Index + 2.500% 7.8718% 8/29/29 (c)(d)(p) | 66,860 | 66,944 | |
| Bakelite U.S. Holding Ltd. 1LN, term loan CME Term SOFR 3 Month Index + 4.000% 9.3919% 5/27/29 (c)(d)(p) | 193,050 | 191,000 | |
| Consolidated Energy Finance SA Tranche B, term loan 3 month U.S. LIBOR + 2.500% 8.0379% 5/7/25 (c)(d)(p) | 282,382 | 277,582 | |
| Cyanco Intermediate 2 Corp. Tranche B 1LN, term loan CME Term SOFR 1 Month Index + 4.750% 10.0811% 7/7/28 (c)(d)(p) | 140,000 | 140,263 | |
| Discovery Purchaser Corp. 1LN, term loan CME Term SOFR 3 Month Index + 4.370% 9.6169% 10/4/29 (c)(d)(p) | 1,154,699 | 1,106,352 | |
| Herens U.S. Holdco Corp. Tranche B 1LN, term loan CME Term SOFR 3 Month Index + 3.920% 9.2669% 7/3/28 (c)(d)(p) | 69,129 | 60,463 | |
| Hexion Holdings Corp. 1LN, term loan CME Term SOFR 3 Month Index + 4.500% 10.0332% 3/15/29 (c)(d)(p) | 920,129 | 875,125 | |
| Hexion, Inc. 2LN, term loan CME Term SOFR 1 Month Index + 7.430% 12.8577% 3/15/30 (c)(d)(p) | 95,000 | 76,772 | |
| INEOS U.S. Finance LLC Tranche B 1LN, term loan CME Term SOFR 1 Month Index + 3.500% 8.9311% 2/10/30 (c)(d)(p) | 120,000 | 119,070 | |
| INEOS U.S. Petrochem LLC: | |||
| 1LN, term loan CME Term SOFR 1 Month Index + 3.750% 9.1811% 3/1/30 (c)(d)(p) | 150,000 | 149,063 | |
| Tranche B 1LN, term loan CME Term SOFR 1 Month Index + 2.750% 8.1955% 1/20/26 (c)(d)(p) | 815,988 | 809,868 | |
| Manchester Acquisition Sub LLC Tranche B 1LN, term loan CME Term SOFR 3 Month Index + 5.750% 11.1767% 12/1/26 (c)(d)(p) | 106,153 | 97,661 | |
| Olympus Water U.S. Holding Corp. Tranche B 1LN, term loan: | |||
| CME Term SOFR 1 Month Index + 5.000% 10.2684% 11/9/28 (c)(d)(p) | 360,000 | 359,849 | |
| CME Term SOFR 3 Month Index + 3.750% 9.2535% 11/9/28 (c)(d)(p) | 1,512,430 | 1,488,805 | |
| Starfruit U.S. Holdco LLC Tranche B 1LN, term loan: | |||
| CME Term SOFR 1 Month Index + 4.000% 9.3181% 4/3/28 (c)(d)(p) | 636,809 | 633,625 | |
| CME Term SOFR 1 Month Index + 4.000% 9.3467% 4/3/28 (c)(d)(p) | 115,000 | 114,520 | |
| The Chemours Co. LLC Tranche B2 1LN, term loan CME Term SOFR 1 Month Index + 3.500% 8.8311% 8/10/28 (c)(d)(p) | 875,595 | 861,367 | |
| U.S. Coatings Acquisition, Inc. term loan CME Term SOFR 1 Month Index + 2.500% 7.812% 12/20/29 (c)(d)(p) | 78,413 | 78,535 | |
| W.R. Grace Holding LLC Tranche B 1LN, term loan 3 month U.S. LIBOR + 3.750% 9.3125% 9/22/28 (c)(d)(p) | 190,000 | 189,565 | |
| 9,964,036 | |||
| Construction Materials - 0.1% | |||
| Janus International Group LLC Tranche B 1LN, term loan CME Term SOFR 1 Month Index + 3.250% 8.668% 8/3/30 (c)(d)(p) | 105,000 | 104,869 | |
| Smyrna Ready Mix LLC Tranche B 1lN, term loan CME Term SOFR 1 Month Index + 4.250% 9.6811% 4/1/29 (c)(d)(p) | 477,190 | 478,383 | |
| VM Consolidated, Inc. Tranche B 1LN, term loan CME Term SOFR 1 Month Index + 3.250% 8.6955% 3/27/28 (c)(d)(p) | 792,176 | 791,186 | |
| White Capital Buyer LLC Tranche B 1LN, term loan 1 month U.S. LIBOR + 4.000% 9.0811% 10/19/27 (c)(d)(p) | 744,332 | 743,089 | |
| 2,117,527 | |||
| Containers & Packaging - 0.2% | |||
| AOT Packaging Products AcquisitionCo LLC 1LN, term loan CME Term SOFR 1 Month Index + 3.250% 8.6955% 3/3/28 (c)(d)(p) | 746,193 | 726,605 | |
| Berlin Packaging, LLC Tranche B 1LN, term loan 1 month U.S. LIBOR + 3.250% 8.5735% 3/11/28 (c)(d)(p) | 984,877 | 963,949 | |
| Berry Global, Inc. Tranche Z 1LN, term loan 1 month U.S. LIBOR + 1.750% 7.2925% 7/1/26 (c)(d)(p) | 455,757 | 455,561 | |
| Charter NEX U.S., Inc. 1LN, term loan CME Term SOFR 1 Month Index + 3.750% 9.1955% 12/1/27 (c)(d)(p) | 470,000 | 466,400 | |
| Clydesdale Acquisition Holdings, Inc. 1LN, term loan CME Term SOFR 1 Month Index + 4.170% 9.6061% 4/13/29 (c)(d)(p) | 2,772,242 | 2,751,450 | |
| Graham Packaging Co., Inc. Tranche B 1LN, term loan CME Term SOFR 1 Month Index + 3.000% 8.4455% 8/4/27 (c)(d)(p) | 1,182,577 | 1,179,183 | |
| Kloeckner Pentaplast of America, Inc. Tranche B 1LN, term loan CME TERM SOFR 6 MONTH INDEX + 4.750% 10.476% 2/9/26 (c)(d)(p) | 453,839 | 424,058 | |
| Reynolds Consumer Products LLC Tranche B 1LN, term loan CME Term SOFR 1 Month Index + 1.750% 7.1811% 1/30/27 (c)(d)(p) | 473,332 | 472,849 | |
| Reynolds Group Holdings, Inc. Tranche B 1LN, term loan CME Term SOFR 1 Month Index + 3.250% 8.6955% 9/24/28 (c)(d)(p) | 1,728,671 | 1,727,513 | |
| 9,167,568 | |||
| Metals & Mining - 0.0% | |||
| Arsenal AIC Parent LLC Tranche B 1LN, term loan CME Term SOFR 1 Month Index + 4.500% 9.8792% 7/27/30 (c)(d)(p) | 410,000 | 410,205 | |
| U.S. Silica Co. Tranche B 1LN, term loan CME Term SOFR 1 Month Index + 4.750% 10.1811% 3/23/30 (c)(d)(p) | 237,940 | 237,940 | |
| 648,145 | |||
| Paper & Forest Products - 0.0% | |||
| Ahlstrom-Munksjo OYJ 1LN, term loan 3 month U.S. LIBOR + 3.750% 9.2879% 2/4/28 (c)(d)(p) | 248,752 | 239,423 | |
TOTAL MATERIALS | 22,136,699 | ||
| REAL ESTATE - 0.0% | |||
| Real Estate Management & Development - 0.0% | |||
| DTZ U.S. Borrower LLC Tranche B 1LN, term loan: | |||
| CME Term SOFR 1 Month Index + 2.750% 8.1955% 8/21/25 (c)(d)(p) | 142,828 | 142,471 | |
| CME Term SOFR 1 Month Index + 3.250% 8.6811% 1/31/30 (c)(d)(p) | 464,204 | 457,241 | |
| CME Term SOFR 1 Month Index + 4.000% 9.3311% 1/31/30 (c)(d)(p) | 190,000 | 189,050 | |
| Greystar Real Estate Partners 1LN, term loan CME Term SOFR 1 Month Index + 3.750% 9.064% 8/7/30 (c)(d)(p) | 240,000 | 239,400 | |
| 1,028,162 | |||
| UTILITIES - 0.1% | |||
| Electric Utilities - 0.1% | |||
| Brookfield WEC Holdings, Inc.: | |||
| 1LN, term loan CME Term SOFR 1 Month Index + 3.750% 9.0811% 8/1/25 (c)(d)(p) | 193,538 | 193,659 | |
| Tranche B 1LN, term loan CME Term SOFR 1 Month Index + 2.750% 8.1955% 8/1/25 (c)(d)(p) | 1,979,746 | 1,976,638 | |
| Generation Bridge Northeast LLC Tranche B 1LN, term loan CME Term SOFR 1 Month Index + 4.250% 9.5643% 8/7/29 (c)(d)(p) | 285,000 | 284,288 | |
| PG&E Corp. Tranche B 1LN, term loan CME Term SOFR 1 Month Index + 3.000% 8.4455% 6/23/25 (c)(d)(p) | 846,536 | 844,894 | |
| Vistra Operations Co. LLC Tranche B 3LN, term loan CME Term SOFR 1 Month Index + 1.750% 7.1955% 12/31/25 (c)(d)(p) | 497,168 | 496,556 | |
| 3,796,035 | |||
| Independent Power and Renewable Electricity Producers - 0.0% | |||
| Calpine Construction Finance Co. LP Tranche B 1LN, term loan CME Term SOFR 1 Month Index + 2.250% 7.5811% 7/20/30 (c)(d)(p) | 185,000 | 183,613 | |
| Esdec Solar Group BV Tranche B 1LN, term loan 6 month U.S. LIBOR + 4.750% 9.9596% 8/27/28 (c)(d)(p) | 148,558 | 148,558 | |
| Talen Energy Supply LLC 1LN, term loan CME Term SOFR 1 Month Index + 4.500% 9.8765% 5/17/30 (c)(d)(p) | 520,000 | 520,650 | |
| Win Waste Innovations Holdings Tranche B 1LN, term loan CME Term SOFR 1 Month Index + 2.750% 8.0811% 3/25/28 (c)(d)(p) | 248,731 | 213,839 | |
| 1,066,660 | |||
TOTAL UTILITIES | 4,862,695 | ||
| TOTAL BANK LOAN OBLIGATIONS (Cost $284,374,179) | 281,538,085 | ||
| Bank Notes - 0.0% | |||
Principal Amount (a) | Value ($) | ||
Discover Bank 5.974% 8/9/28 (c) (Cost $1,750,000) | 1,750,000 | 1,614,706 | |
| Preferred Securities - 0.4% | |||
Principal Amount (a) | Value ($) | ||
| COMMUNICATION SERVICES - 0.0% | |||
| Diversified Telecommunication Services - 0.0% | |||
| CAS Capital No 1 Ltd. 4% (Reg. S) (c)(i) | 200,000 | 163,209 | |
| CONSUMER DISCRETIONARY - 0.1% | |||
| Automobiles - 0.1% | |||
| Volkswagen International Finance NV 3.875% (Reg. S) (c)(i) | EUR | 2,300,000 | 2,096,382 |
| CONSUMER STAPLES - 0.0% | |||
| Tobacco - 0.0% | |||
| British American Tobacco PLC 3% (Reg. S) (c)(i) | EUR | 1,150,000 | 1,069,783 |
| ENERGY - 0.1% | |||
| Oil, Gas & Consumable Fuels - 0.1% | |||
| Energy Transfer LP 3 month U.S. LIBOR + 4.020% 9.6542% (c)(d)(i) | 2,120,000 | 1,960,065 | |
| EnLink Midstream Partners LP 3 month U.S. LIBOR + 4.110% 9.6184% (c)(d)(i) | 90,000 | 81,747 | |
| Plains All American Pipeline LP CME Term SOFR 3 Month Index + 4.110% 9.7362% (c)(d)(i) | 540,000 | 497,930 | |
| 2,539,742 | |||
| FINANCIALS - 0.2% | |||
| Banks - 0.1% | |||
| AIB Group PLC 6.25% (Reg. S) (c)(i) | EUR | 275,000 | 287,405 |
| Banco Bilbao Vizcaya Argentaria SA 5.875% (Reg. S) (c)(i) | EUR | 200,000 | 219,325 |
| Banco Do Brasil SA 6.25% (b)(c)(i) | 200,000 | 193,587 | |
| Banco Mercantil del Norte SA: | |||
| 6.75% (b)(c)(i) | 370,000 | 366,476 | |
| 7.625% (b)(c)(i) | 120,000 | 113,321 | |
| Bank of America Corp.: | |||
| 5.875% (c)(i) | 565,000 | 536,773 | |
| 6.25% (c)(i) | 330,000 | 338,381 | |
| Barclays PLC 7.125% (c)(i) | GBP | 310,000 | 367,271 |
| BBVA Bancomer SA Texas Branch 8.45% 6/29/38 (b)(c) | 200,000 | 203,059 | |
| BNP Paribas SA 6.625% (Reg. S) (c)(i) | 335,000 | 340,339 | |
| JPMorgan Chase & Co.: | |||
| 4.6% (c)(i) | 1,190,000 | 1,121,069 | |
| 6.1% (c)(i) | 135,000 | 137,767 | |
| NBK Tier 1 Financing 2 Ltd. 4.5% (b)(c)(i) | 400,000 | 372,196 | |
| Societe Generale 7.875% (Reg. S) (c)(i) | 200,000 | 202,354 | |
| Wells Fargo & Co. 5.9% (c)(i) | 300,000 | 300,667 | |
| 5,099,990 | |||
| Capital Markets - 0.0% | |||
| Charles Schwab Corp.: | |||
| 4% (c)(i) | 500,000 | 382,520 | |
| 5.375% (c)(i) | 240,000 | 234,825 | |
| Credit Suisse Group AG 7.5% (Reg. S) (c)(h)(i) | 995,000 | 49,750 | |
| UBS Group AG 7% (Reg. S) (c)(i) | 200,000 | 201,864 | |
| 868,959 | |||
| Consumer Finance - 0.1% | |||
| Ally Financial, Inc.: | |||
| 4.7% (c)(i) | 420,000 | 295,942 | |
| 4.7% (c)(i) | 1,340,000 | 865,461 | |
| 1,161,403 | |||
| Insurance - 0.0% | |||
| QBE Insurance Group Ltd. 5.25% (Reg. S) (c)(i) | 690,000 | 649,006 | |
TOTAL FINANCIALS | 7,779,358 | ||
| INDUSTRIALS - 0.0% | |||
| Ground Transportation - 0.0% | |||
| Mobico Group PLC 4.25% (Reg. S) (c)(i) | GBP | 165,000 | 185,941 |
| Marine Transportation - 0.0% | |||
| DP World Salaam 6% (Reg. S) (c)(i) | 200,000 | 200,326 | |
| Trading Companies & Distributors - 0.0% | |||
| AerCap Holdings NV 5.875% 10/10/79 (c) | 910,000 | 899,645 | |
| Air Lease Corp. 4.125% (c)(i) | 210,000 | 153,235 | |
| Aircastle Ltd. 5.25% (b)(c)(i) | 340,000 | 271,746 | |
| 1,324,626 | |||
TOTAL INDUSTRIALS | 1,710,893 | ||
| INFORMATION TECHNOLOGY - 0.0% | |||
| IT Services - 0.0% | |||
| Network i2i Ltd. 3.975% (b)(c)(i) | 200,000 | 184,943 | |
| MATERIALS - 0.0% | |||
| Construction Materials - 0.0% | |||
| CEMEX S.A.B. de CV: | |||
| 5.125% (b)(c)(i) | 430,000 | 409,156 | |
| 9.125% (b)(c)(i) | 200,000 | 212,024 | |
| 621,180 | |||
| REAL ESTATE - 0.0% | |||
| Real Estate Management & Development - 0.0% | |||
| Aroundtown SA 3.375% (Reg. S) (c)(i) | EUR | 700,000 | 330,793 |
| Citycon Oyj 4.496% (Reg. S) (c)(i) | EUR | 215,000 | 161,862 |
| CPI Property Group SA 3.75% (Reg. S) (c)(i) | EUR | 415,000 | 127,454 |
| Heimstaden Bostad AB 3.625% (Reg. S) (c)(i) | EUR | 875,000 | 449,508 |
| Samhallsbyggnadsbolaget I Norden AB 2.624% (Reg. S) (c)(i) | EUR | 385,000 | 42,834 |
| 1,112,451 | |||
| UTILITIES - 0.0% | |||
| Electric Utilities - 0.0% | |||
| Electricite de France SA 5.625% (Reg. S) (c)(i) | 345,000 | 342,744 | |
| SSE PLC 3.74% (Reg. S) (c)(i) | GBP | 100,000 | 116,644 |
| 459,388 | |||
| Multi-Utilities - 0.0% | |||
| Veolia Environnement SA 2% (Reg. S) (c)(i) | EUR | 300,000 | 277,599 |
TOTAL UTILITIES | 736,987 | ||
| TOTAL PREFERRED SECURITIES (Cost $18,812,270) | 18,014,928 | ||
| Money Market Funds - 3.6% | |||
| Shares | Value ($) | ||
Fidelity Cash Central Fund 5.43% (s) (Cost $171,775,801) | 171,741,452 | 171,775,801 | |
| Purchased Swaptions - 0.0% | ||||
Expiration Date | Notional Amount (a) | Value ($) | ||
| Put Options - 0.0% | ||||
| Option on an interest rate swap with JPMorgan Chase Bank N.A. to pay annually a fixed rate of 3.07% and receive annually a floating rate based on the U.S. Secured Overnight Fin. Rate (SOFR) Index, expiring April 2033 | 4/21/28 | 13,700,000 | 655,927 | |
| Option on an interest rate swap with JPMorgan Chase Bank N.A. to pay annually a fixed rate of 3.2575% and receive annually a floating rate based on the U.S. Secured Overnight Fin. Rate (SOFR) Index, expiring June 2033 | 6/08/28 | 6,800,000 | 301,422 | |
| Option on an interest rate swap with JPMorgan Chase Bank N.A. to pay annually a fixed rate of 3.305% and receive annually a floating rate based on the U.S. Secured Overnight Fin. Rate (SOFR) Index, expiring May 2033 | 5/22/28 | 2,600,000 | 113,190 | |
| TOTAL PUT OPTIONS | 1,070,539 | |||
| Call Options - 0.0% | ||||
| Option on an interest rate swap with JPMorgan Chase Bank N.A. to receive annually a fixed rate of 3.07% and pay annually a floating rate based on the U.S. Secured Overnight Fin. Rate (SOFR) Index, expiring April 2033 | 4/21/28 | 13,700,000 | 452,805 | |
| Option on an interest rate swap with JPMorgan Chase Bank N.A. to receive annually a fixed rate of 3.2575% and pay annually a floating rate based on the U.S. Secured Overnight Fin. Rate (SOFR) Index, expiring June 2033 | 6/08/28 | 6,800,000 | 248,042 | |
| Option on an interest rate swap with JPMorgan Chase Bank N.A. to receive annually a fixed rate of 3.305% and pay annually a floating rate based on the U.S. Secured Overnight Fin. Rate (SOFR) Index, expiring May 2033 | 5/22/28 | 2,600,000 | 97,634 | |
| TOTAL CALL OPTIONS | 798,481 | |||
TOTAL PURCHASED SWAPTIONS (Cost $1,886,490) | 1,869,020 | |||
| TOTAL INVESTMENT IN SECURITIES - 108.7% (Cost $5,402,619,521) | 5,142,077,197 |
NET OTHER ASSETS (LIABILITIES) - (8.7)% | (410,910,670) |
| NET ASSETS - 100.0% | 4,731,166,527 |
| TBA Sale Commitments | ||
Principal Amount (a) | Value ($) | |
| Ginnie Mae | ||
| 2% 9/1/53 | (1,350,000) | (1,113,751) |
| 2% 9/1/53 | (16,950,000) | (13,983,757) |
| 2% 9/1/53 | (1,400,000) | (1,155,001) |
| 2.5% 9/1/53 | (3,450,000) | (2,936,549) |
| 3% 9/1/53 | (9,000,000) | (7,913,643) |
| 3.5% 9/1/53 | (3,200,000) | (2,905,454) |
| TOTAL GINNIE MAE | (30,008,155) | |
| Uniform Mortgage Backed Securities | ||
| 1.5% 9/1/53 | (4,000,000) | (3,015,479) |
| 2% 9/1/53 | (2,300,000) | (1,830,948) |
| 2% 9/1/53 | (700,000) | (557,245) |
| 2% 9/1/53 | (29,100,000) | (23,165,477) |
| 2% 9/1/53 | (11,650,000) | (9,274,151) |
| 2% 9/1/53 | (11,650,000) | (9,274,151) |
| 2% 9/1/53 | (18,650,000) | (14,846,603) |
| 2% 9/1/53 | (17,450,000) | (13,891,326) |
| 2.5% 9/1/53 | (900,000) | (745,910) |
| 2.5% 9/1/53 | (4,400,000) | (3,646,672) |
| 2.5% 9/1/53 | (2,500,000) | (2,071,973) |
| 2.5% 9/1/53 | (1,500,000) | (1,243,184) |
| 2.5% 9/1/53 | (800,000) | (663,031) |
| 2.5% 9/1/53 | (1,600,000) | (1,326,063) |
| 3% 9/1/53 | (300,000) | (258,457) |
| 3% 9/1/53 | (500,000) | (430,762) |
| 5.5% 9/1/53 | (900,000) | (889,031) |
| TOTAL UNIFORM MORTGAGE BACKED SECURITIES | (87,130,463) | |
TOTAL TBA SALE COMMITMENTS (Proceeds $115,795,473) | (117,138,618) | |
| Futures Contracts | |||||
Number of contracts | Expiration Date | Notional Amount ($) | Value ($) | Unrealized Appreciation/ (Depreciation) ($) | |
| Purchased | |||||
| Bond Index Contracts | |||||
| Eurex Euro-Bund Contracts (Germany) | 14 | Dec 2023 | 2,013,443 | 18,396 | 18,396 |
| Eurex Euro-Buxl 30 Year Bond Contracts (Germany) | 10 | Dec 2023 | 1,450,427 | 22,157 | 22,157 |
| Eurex Euro-Schatz Contracts (Germany) | 27 | Dec 2023 | 3,088,185 | 8,047 | 8,047 |
| TME 10 Year Canadian Note Contracts (Canada) | 29 | Dec 2023 | 2,560,679 | 22,910 | 22,910 |
| TOTAL BOND INDEX CONTRACTS | 71,510 | ||||
| Treasury Contracts | |||||
| ASX 10 Year Treasury Bond Index Contracts (Australia) | 7 | Sep 2023 | 526,917 | (2,592) | (2,592) |
| CBOT 2-Year U.S. Treasury Note Contracts (United States) | 59 | Dec 2023 | 12,024,477 | 34,915 | 34,915 |
| CBOT 5-Year U.S. Treasury Note Contracts (United States) | 1,906 | Dec 2023 | 203,793,094 | 122,809 | 122,809 |
| CBOT Long Term U.S. Treasury Bond Contracts (United States) | 13 | Dec 2023 | 1,581,938 | 19,301 | 19,301 |
| TOTAL TREASURY CONTRACTS | 174,433 | ||||
| TOTAL PURCHASED | 245,943 | ||||
| Sold | |||||
| Bond Index Contracts | |||||
| ICE Long Gilt Contracts (United Kingdom) | 24 | Dec 2023 | 2,905,634 | (58,112) | (58,112) |
| Treasury Contracts | |||||
| CBOT 10-Year U.S. Treasury Note Contracts (United States) | 354 | Dec 2023 | 39,305,063 | (382,333) | (382,333) |
| CBOT 5-Year U.S. Treasury Note Contracts (United States) | 488 | Dec 2023 | 52,177,875 | (363,485) | (363,485) |
| CBOT Long Term U.S. Treasury Bond Contracts (United States) | 5 | Dec 2023 | 608,438 | (8,683) | (8,683) |
| CBOT Ultra Long Term U.S. Treasury Bond Contracts (United States) | 9 | Dec 2023 | 1,165,219 | (18,513) | (18,513) |
| TOTAL TREASURY CONTRACTS | (773,014) | ||||
| TOTAL SOLD | (831,126) | ||||
| TOTAL FUTURES CONTRACTS | (585,183) | ||||
| The notional amount of futures purchased as a percentage of Net Assets is 4.8% | |||||
| The notional amount of futures sold as a percentage of Net Assets is 2.0% | |||||
| Forward Foreign Currency Contracts | ||||||
Currency Purchased | Currency Sold | Counterparty | Settlement Date | Unrealized Appreciation/ (Depreciation) ($) | ||
| CAD | 63,000 | USD | 47,661 | Bank of America, N.A. | 9/15/23 | (1,028) |
| CAD | 62,000 | USD | 47,127 | JPMorgan Chase Bank, N.A. | 9/15/23 | (1,235) |
| EUR | 229,000 | USD | 250,763 | BNP Paribas S.A. | 9/15/23 | (2,327) |
| EUR | 55,000 | USD | 61,456 | BNP Paribas S.A. | 9/15/23 | (1,788) |
| EUR | 261,000 | USD | 292,986 | Bank of America, N.A. | 9/15/23 | (9,834) |
| EUR | 20,000 | USD | 21,757 | Bank of America, N.A. | 9/15/23 | (60) |
| EUR | 102,000 | USD | 112,360 | Brown Brothers Harriman & Co | 9/15/23 | (1,703) |
| EUR | 437,000 | USD | 480,607 | Brown Brothers Harriman & Co | 9/15/23 | (6,518) |
| EUR | 109,000 | USD | 122,647 | Brown Brothers Harriman & Co | 9/15/23 | (4,396) |
| EUR | 193,000 | USD | 209,604 | Brown Brothers Harriman & Co | 9/15/23 | (223) |
| EUR | 210,000 | USD | 232,911 | Brown Brothers Harriman & Co | 9/15/23 | (5,088) |
| EUR | 26,000 | USD | 28,677 | Canadian Imperial Bk. of Comm. | 9/15/23 | (471) |
| EUR | 642,000 | USD | 709,333 | Canadian Imperial Bk. of Comm. | 9/15/23 | (12,845) |
| EUR | 110,000 | USD | 121,397 | JPMorgan Chase Bank, N.A. | 9/15/23 | (2,061) |
| EUR | 55,000 | USD | 59,498 | JPMorgan Chase Bank, N.A. | 9/15/23 | 170 |
| EUR | 544,000 | USD | 593,256 | Royal Bank of Canada | 9/15/23 | (3,086) |
| GBP | 222,000 | USD | 282,977 | BNP Paribas S.A. | 9/15/23 | (1,734) |
| GBP | 312,000 | USD | 392,729 | BNP Paribas S.A. | 9/15/23 | 2,531 |
| GBP | 25,000 | USD | 31,830 | Brown Brothers Harriman & Co | 9/15/23 | (159) |
| GBP | 77,000 | USD | 97,980 | Brown Brothers Harriman & Co | 9/15/23 | (432) |
| GBP | 45,000 | USD | 56,735 | Brown Brothers Harriman & Co | 9/15/23 | 273 |
| GBP | 49,000 | USD | 62,050 | Brown Brothers Harriman & Co | 9/15/23 | 26 |
| GBP | 20,000 | USD | 25,502 | Brown Brothers Harriman & Co | 9/15/23 | (165) |
| GBP | 205,000 | USD | 261,046 | State Street Bank and Trust Co | 9/15/23 | (1,339) |
| USD | 77,213 | AUD | 112,000 | Bank of America, N.A. | 9/15/23 | 4,616 |
| USD | 41,878 | CAD | 56,000 | Bank of America, N.A. | 9/15/23 | 427 |
| USD | 46,715 | CAD | 62,000 | Brown Brothers Harriman & Co | 9/15/23 | 823 |
| USD | 105,318 | CAD | 139,000 | Royal Bank of Canada | 9/15/23 | 2,431 |
| USD | 56,223 | EUR | 51,000 | BNP Paribas S.A. | 9/15/23 | 895 |
| USD | 132,726 | EUR | 119,000 | BNP Paribas S.A. | 9/15/23 | 3,626 |
| USD | 84,585 | EUR | 77,000 | BNP Paribas S.A. | 9/15/23 | 1,050 |
| USD | 359,859 | EUR | 329,000 | BNP Paribas S.A. | 9/15/23 | 2,936 |
| USD | 161,112 | EUR | 148,000 | BNP Paribas S.A. | 9/15/23 | 551 |
| USD | 30,846,146 | EUR | 28,057,000 | Bank of America, N.A. | 9/15/23 | 407,883 |
| USD | 50,535 | EUR | 46,000 | Brown Brothers Harriman & Co | 9/15/23 | 630 |
| USD | 67,392 | EUR | 61,000 | Canadian Imperial Bk. of Comm. | 9/15/23 | 1,214 |
| USD | 71,840 | EUR | 65,000 | JPMorgan Chase Bank, N.A. | 9/15/23 | 1,324 |
| USD | 49,265 | EUR | 45,000 | JPMorgan Chase Bank, N.A. | 9/15/23 | 446 |
| USD | 23,301,176 | GBP | 18,167,000 | BNP Paribas S.A. | 9/15/23 | 286,142 |
| USD | 76,112 | GBP | 59,000 | BNP Paribas S.A. | 9/15/23 | 1,367 |
| USD | 115,356 | GBP | 88,000 | BNP Paribas S.A. | 9/15/23 | 3,872 |
| USD | 92,655 | GBP | 72,000 | Bank of America, N.A. | 9/15/23 | 1,441 |
| USD | 74,550 | GBP | 58,000 | Canadian Imperial Bk. of Comm. | 9/15/23 | 1,072 |
| USD | 223,094 | GBP | 176,000 | Canadian Imperial Bk. of Comm. | 9/15/23 | 127 |
| TOTAL FORWARD FOREIGN CURRENCY CONTRACTS | 669,381 | |||||
| Unrealized Appreciation | 725,873 | |||||
| Unrealized Depreciation | (56,492) | |||||
| Credit Default Swaps | ||||||||||
| Underlying Reference | Rating(1) | Maturity Date | Clearinghouse / Counterparty | Fixed Payment Received/ (Paid) | Payment Frequency | Notional Amount(2)(3) | Value ($)(1) | Upfront Premium Received/ (Paid) ($) | Unrealized Appreciation/ (Depreciation) ($) | |
| Buy Protection | ||||||||||
| CMBX N.A. AAA Index Series 13 | Dec 2072 | Morgan Stanley Capital Services LLC | (0.5%) | Monthly | 20,000 | 347 | (325) | 22 | ||
| CMBX N.A. BBB- Index Series 13 | Dec 2072 | Goldman Sachs & Co. LLC | (3%) | Monthly | 330,000 | 88,046 | (88,822) | (776) | ||
| CMBX N.A. BBB- Index Series 16 | Apr 2065 | Citigroup Global Markets Ltd. | (3%) | Monthly | 180,000 | 43,295 | (44,827) | (1,532) | ||
| CMBX N.A. BBB- Index Series 16 | Apr 2065 | Citigroup Global Markets Ltd. | (3%) | Monthly | 330,000 | 79,375 | (81,876) | (2,501) | ||
| CMBX N.A. BBB- Index Series 16 | Apr 2065 | Citigroup Global Markets Ltd. | (3%) | Monthly | 280,000 | 67,348 | (75,042) | (7,694) | ||
| CMBX N.A. BBB- Index Series 16 | Apr 2065 | Citigroup Global Markets Ltd. | (3%) | Monthly | 450,000 | 108,238 | (138,165) | (29,927) | ||
| CMBX N.A. BBB- Index Series 16 | Apr 2065 | Citigroup Global Markets Ltd. | (3%) | Monthly | 130,000 | 31,269 | (37,845) | (6,576) | ||
| CMBX N.A. BBB- Index Series 16 | Apr 2065 | Goldman Sachs & Co. LLC | (3%) | Monthly | 590,000 | 141,912 | (147,094) | (5,182) | ||
| CMBX N.A. BBB- Index Series 16 | Apr 2065 | Goldman Sachs & Co. LLC | (3%) | Monthly | 30,000 | 7,216 | (8,036) | (820) | ||
| CMBX N.A. BBB- Index Series 16 | Apr 2065 | Goldman Sachs & Co. LLC | (3%) | Monthly | 370,000 | 88,996 | (108,861) | (19,865) | ||
| CMBX N.A. BBB- Index Series 16 | Apr 2065 | Goldman Sachs & Co. LLC | (3%) | Monthly | 600,000 | 144,317 | (181,828) | (37,511) | ||
| CMBX N.A. BBB- Index Series 16 | Apr 2065 | Goldman Sachs & Co. LLC | (3%) | Monthly | 950,000 | 228,502 | (283,638) | (55,136) | ||
| CMBX N.A. BBB- Index Series 16 | Apr 2065 | JPMorgan Securities LLC | (3%) | Monthly | 180,000 | 43,295 | (52,425) | (9,130) | ||
| CMBX N.A. BBB- Index Series 16 | Apr 2065 | JPMorgan Securities LLC | (3%) | Monthly | 110,000 | 26,458 | (33,922) | (7,464) | ||
| CMBX N.A. BBB- Index Series 16 | Apr 2065 | Morgan Stanley Capital Services LLC | (3%) | Monthly | 120,000 | 28,863 | (29,299) | (436) | ||
| CMBX N.A. BBB- Index Series 16 | Apr 2065 | Morgan Stanley Capital Services LLC | (3%) | Monthly | 300,000 | 72,159 | (77,302) | (5,143) | ||
| Intesa Sanpaolo SpA | Jun 2028 | JPMorgan Chase Bank, N.A. | (1%) | Quarterly | EUR | 770,000 | (3,191) | 1,071 | (2,120) | |
| TOTAL BUY PROTECTION | 1,196,445 | (1,388,236) | (191,791) | |||||||
| Sell Protection | ||||||||||
| CMBX N.A. AAA Index Series 13 | NR | Dec 2072 | Morgan Stanley Capital Services LLC | 0.5% | Monthly | 20,000 | (347) | 473 | 126 | |
| TOTAL CREDIT DEFAULT SWAPS | 1,196,098 | (1,387,763) | (191,665) | |||||||
| Interest Rate Swaps | ||||||||||
| Payment Received | Payment Frequency | Payment Paid | Payment Frequency | Clearinghouse / Counterparty(1) | Maturity Date | Notional Amount(2) | Value ($) | Upfront Premium Received/ (Paid) ($)(3) | Unrealized Appreciation/ (Depreciation) ($) | |
| 3.75% | Annual | U.S. Secured Overnight Fin. Rate (SOFR) Index(4) | Annual | LCH | Sep 2028 | 1,747,000 | (31,969) | 0 | (31,969) | |
| 3.5% | Annual | U.S. Secured Overnight Fin. Rate (SOFR) Index(4) | Annual | LCH | Sep 2030 | 512,000 | (11,481) | 0 | (11,481) | |
| TOTAL INTEREST RATE SWAPS | (43,450) | 0 | (43,450) | |||||||
| AUD | - | Australian dollar |
| CAD | - | Canadian dollar |
| EUR | - | European Monetary Unit |
| GBP | - | British pound sterling |
| USD | - | U.S. dollar |
| (a) | Amount is stated in United States dollars unless otherwise noted. |
| (b) | Security exempt from registration under Rule 144A of the Securities Act of 1933. These securities may be resold in transactions exempt from registration, normally to qualified institutional buyers. At the end of the period, the value of these securities amounted to $735,706,144 or 15.6% of net assets. |
| (c) | Coupon rates for floating and adjustable rate securities reflect the rates in effect at period end. |
| (d) | Coupon is indexed to a floating interest rate which may be multiplied by a specified factor and/or subject to caps or floors. |
| (e) | Security initially issued at one coupon which converts to a higher coupon at a specified date. The rate shown is the rate at period end. |
| (f) | Restricted securities (including private placements) - Investment in securities not registered under the Securities Act of 1933 (excluding 144A issues). At the end of the period, the value of restricted securities (excluding 144A issues) amounted to $60,799 or 0.0% of net assets. |
| (g) | Level 3 security |
| (h) | Non-income producing - Security is in default. |
| (i) | Security is perpetual in nature with no stated maturity date. |
| (j) | Security or a portion of the security was pledged to cover margin requirements for futures contracts. At period end, the value of securities pledged amounted to $3,325,724. |
| (k) | Security or a portion of the security has been segregated as collateral for mortgage-backed or asset-backed securities purchased on a delayed delivery or when-issued basis. At period end, the value of securities pledged amounted to $2,690,152. |
| (l) | Security or a portion of the security was pledged to cover margin requirements for centrally cleared OTC swaps. At period end, the value of securities pledged amounted to $104,330. |
| (m) | Security or a portion of the security purchased on a delayed delivery or when-issued basis. |
| (n) | Interest Only (IO) security represents the right to receive only monthly interest payments on an underlying pool of mortgages or assets. Principal shown is the outstanding par amount of the pool as of the end of the period. |
| (o) | Non-income producing |
| (p) | Remaining maturities of bank loan obligations may be less than the stated maturities shown as a result of contractual or optional prepayments by the borrower. Such prepayments cannot be predicted with certainty. |
| (q) | The coupon rate will be determined upon settlement of the loan after period end. |
| (r) | Position or a portion of the position represents an unfunded loan commitment. At period end, the total principal amount and market value of unfunded commitments totaled $223,717 and $223,836, respectively. |
| (s) | Affiliated fund that is generally available only to investment companies and other accounts managed by Fidelity Investments. The rate quoted is the annualized seven-day yield of the fund at period end. A complete unaudited listing of the fund's holdings as of its most recent quarter end is available upon request. In addition, each Fidelity Central Fund's financial statements, which are not covered by the Fund's Report of Independent Registered Public Accounting Firm, are available on the SEC's website or upon request. |
| Additional information on each restricted holding is as follows: | ||
| Security | Acquisition Date | Acquisition Cost ($) |
| Jonah Energy Parent LLC 12% 11/5/25 | 5/05/23 | 58,549 |
| Mesquite Energy, Inc. 15% 7/15/23 | 7/10/20 - 1/19/22 | 29,565 |
| Mesquite Energy, Inc. 15% 7/15/23 | 11/05/20 - 1/19/22 | 50,977 |
| Affiliate | Value, beginning of period ($) | Purchases ($) | Sales Proceeds ($) | Dividend Income ($) | Realized Gain (loss) ($) | Change in Unrealized appreciation (depreciation) ($) | Value, end of period ($) | % ownership, end of period |
| Fidelity Cash Central Fund 5.43% | - | 2,466,600,142 | 2,294,824,341 | 10,598,429 | - | - | 171,775,801 | 0.4% |
| Total | - | 2,466,600,142 | 2,294,824,341 | 10,598,429 | - | - | 171,775,801 | |
| Affiliate | Value, beginning of period ($) | Purchases ($) | Sales Proceeds ($) | Dividend Income ($) | Realized Gain (loss) ($) | Change in Unrealized appreciation (depreciation) ($) | Value, end of period ($) |
| Fidelity Investments Money Market Government Portfolio Class I 5.21% | 137,284,236 | 221,822 | 137,506,058 | 38,903 | - | - | - |
| 137,284,236 | 221,822 | 137,506,058 | 38,903 | - | - | - |
| Valuation Inputs at Reporting Date: | ||||
| Description | Total ($) | Level 1 ($) | Level 2 ($) | Level 3 ($) |
Investments in Securities: | ||||
| Equities: | ||||
Energy | 408,748 | 77,139 | - | 331,609 |
Financials | 1,412 | 390 | - | 1,022 |
Utilities | 27,294 | 27,294 | - | - |
| Corporate Bonds | 1,512,482,921 | - | 1,512,422,122 | 60,799 |
| U.S. Government and Government Agency Obligations | 1,737,776,651 | - | 1,737,776,651 | - |
| U.S. Government Agency - Mortgage Securities | 880,140,664 | - | 880,140,664 | - |
| Asset-Backed Securities | 231,605,126 | - | 231,487,392 | 117,734 |
| Collateralized Mortgage Obligations | 62,508,946 | - | 62,508,946 | - |
| Commercial Mortgage Securities | 197,632,713 | - | 197,537,704 | 95,009 |
| Municipal Securities | 2,855,216 | - | 2,855,216 | - |
| Foreign Government and Government Agency Obligations | 41,172,563 | - | 41,172,563 | - |
| Supranational Obligations | 652,403 | - | 652,403 | - |
| Bank Loan Obligations | 281,538,085 | - | 279,515,991 | 2,022,094 |
| Bank Notes | 1,614,706 | - | 1,614,706 | - |
| Preferred Securities | 18,014,928 | - | 18,014,928 | - |
| Money Market Funds | 171,775,801 | 171,775,801 | - | - |
| Purchased Swaptions | 1,869,020 | - | 1,869,020 | - |
| Total Investments in Securities: | 5,142,077,197 | 171,880,624 | 4,967,568,306 | 2,628,267 |
Derivative Instruments: | ||||
| Assets | ||||
Futures Contracts | 248,535 | 248,535 | - | - |
Forward Foreign Currency Contracts | 725,873 | - | 725,873 | - |
Swaps | 1,199,636 | - | 1,199,636 | - |
| Total Assets | 2,174,044 | 248,535 | 1,925,509 | - |
| Liabilities | ||||
Futures Contracts | (833,718) | (833,718) | - | - |
Forward Foreign Currency Contracts | (56,492) | - | (56,492) | - |
Swaps | (46,988) | - | (46,988) | - |
| Total Liabilities | (937,198) | (833,718) | (103,480) | - |
| Total Derivative Instruments: | 1,236,846 | (585,183) | 1,822,029 | - |
Other Financial Instruments: | ||||
| TBA Sale Commitments | (117,138,618) | - | (117,138,618) | - |
| Total Other Financial Instruments: | (117,138,618) | - | (117,138,618) | - |
Primary Risk Exposure / Derivative Type | Value | |
| Asset ($) | Liability ($) | |
| Credit Risk | ||
Swaps (a) | 1,199,636 | (3,538) |
| Total Credit Risk | 1,199,636 | (3,538) |
| Foreign Exchange Risk | ||
Forward Foreign Currency Contracts (b) | 725,873 | (56,492) |
| Total Foreign Exchange Risk | 725,873 | (56,492) |
| Interest Rate Risk | ||
Futures Contracts (c) | 248,535 | (833,718) |
Purchased Swaptions (d) | 1,869,020 | 0 |
Swaps (e) | 0 | (43,450) |
| Total Interest Rate Risk | 2,117,555 | (877,168) |
| Total Value of Derivatives | 4,043,064 | (937,198) |
| Statement of Assets and Liabilities | ||||
| August 31, 2023 | ||||
| Assets | ||||
| Investment in securities, at value - See accompanying schedule: | ||||
Unaffiliated issuers (cost $5,230,843,720) | $ | 4,970,301,396 | ||
Fidelity Central Funds (cost $171,775,801) | 171,775,801 | |||
| Total Investment in Securities (cost $5,402,619,521) | $ | 5,142,077,197 | ||
| Cash | 2,262,725 | |||
| Foreign currency held at value (cost $753,557) | 752,001 | |||
| Receivable for investments sold | 916,509 | |||
| Receivable for TBA sale commitments | 115,795,473 | |||
| Unrealized appreciation on forward foreign currency contracts | 725,873 | |||
| Receivable for fund shares sold | 40,281,799 | |||
| Dividends receivable | 1,455 | |||
| Interest receivable | 38,924,767 | |||
| Distributions receivable from Fidelity Central Funds | 826,958 | |||
| Receivable for daily variation margin on futures contracts | 64,009 | |||
| Receivable for daily variation margin on centrally cleared OTC swaps | 138,819 | |||
| Bi-lateral OTC swaps, at value | 1,199,636 | |||
| Other receivables | 43 | |||
Total assets | 5,343,967,264 | |||
| Liabilities | ||||
| Payable for investments purchased | ||||
Regular delivery | $ | 45,576,724 | ||
Delayed delivery | 430,848,051 | |||
| TBA sale commitments, at value | 117,138,618 | |||
| Unrealized depreciation on forward foreign currency contracts | 56,492 | |||
| Distributions payable | 17,635,488 | |||
| Bi-lateral OTC swaps, at value | 3,538 | |||
| Accrued management fee | 1,352,257 | |||
| Other payables and accrued expenses | 189,569 | |||
| Total Liabilities | 612,800,737 | |||
| Net Assets | $ | 4,731,166,527 | ||
| Net Assets consist of: | ||||
| Paid in capital | $ | 5,135,070,133 | ||
| Total accumulated earnings (loss) | (403,903,606) | |||
| Net Assets | $ | 4,731,166,527 | ||
Net Asset Value, offering price and redemption price per share ($4,731,166,527 ÷ 105,802,000 shares) | $ | 44.72 | ||
| Statement of Operations | ||||
Year ended August 31, 2023 | ||||
| Investment Income | ||||
| Dividends: | ||||
| Unaffiliated issuers | $ | 799,728 | ||
| Affiliated issuers | 38,903 | |||
| Interest | 141,554,851 | |||
| Income from Fidelity Central Funds | 10,598,429 | |||
| Total Income | 152,991,911 | |||
| Expenses | ||||
| Management fee | $ | 11,813,423 | ||
| Independent trustees' fees and expenses | 10,593 | |||
| Legal | 13,211 | |||
| Total expenses before reductions | 11,837,227 | |||
| Expense reductions | (19,455) | |||
| Total expenses after reductions | 11,817,772 | |||
| Net Investment income (loss) | 141,174,139 | |||
| Realized and Unrealized Gain (Loss) | ||||
| Net realized gain (loss) on: | ||||
| Investment Securities: | ||||
| Unaffiliated issuers | (97,746,630) | |||
| Redemptions in-kind | (396,396) | |||
| Forward foreign currency contracts | (4,630,823) | |||
| Foreign currency transactions | 846,245 | |||
| Futures contracts | 3,790,539 | |||
| Swaps | (140,943) | |||
| Total net realized gain (loss) | (98,278,008) | |||
| Change in net unrealized appreciation (depreciation) on: | ||||
| Investment Securities: | ||||
| Unaffiliated issuers | (25,889,092) | |||
| Forward foreign currency contracts | 669,381 | |||
| Assets and liabilities in foreign currencies | 6,941 | |||
| Futures contracts | (825,546) | |||
| Swaps | (247,136) | |||
| TBA Sale commitments | (1,343,145) | |||
| Total change in net unrealized appreciation (depreciation) | (27,628,597) | |||
| Net gain (loss) | (125,906,605) | |||
| Net increase (decrease) in net assets resulting from operations | $ | 15,267,534 | ||
| Statement of Changes in Net Assets | ||||
Year ended August 31, 2023 | Year ended August 31, 2022 | |||
| Increase (Decrease) in Net Assets | ||||
| Operations | ||||
| Net investment income (loss) | $ | 141,174,139 | $ | 50,410,867 |
| Net realized gain (loss) | (98,278,008) | (41,089,100) | ||
| Change in net unrealized appreciation (depreciation) | (27,628,597) | (293,034,673) | ||
| Net increase (decrease) in net assets resulting from operations | 15,267,534 | (283,712,906) | ||
| Distributions to shareholders | (139,587,694) | (51,534,146) | ||
| Share transactions | ||||
| Proceeds from sales of shares | 2,617,454,518 | 873,899,280 | ||
| Cost of shares redeemed | (51,626,404) | (297,639,324) | ||
Net increase (decrease) in net assets resulting from share transactions | 2,565,828,114 | 576,259,956 | ||
| Total increase (decrease) in net assets | 2,441,507,954 | 241,012,904 | ||
| Net Assets | ||||
| Beginning of period | 2,289,658,573 | 2,048,645,669 | ||
| End of period | $ | 4,731,166,527 | $ | 2,289,658,573 |
| Other Information | ||||
| Shares | ||||
| Sold | 57,700,000 | 17,300,000 | ||
| Redeemed | (1,150,000) | (6,250,000) | ||
| Net increase (decrease) | 56,550,000 | 11,050,000 | ||
| Fidelity® Total Bond ETF |
| Years ended August 31, | 2023 | 2022 | 2021 | 2020 | 2019 | |||||
Selected Per-Share Data | ||||||||||
| Net asset value, beginning of period | $ | 46.49 | $ | 53.63 | $ | 54.71 | $ | 51.95 | $ | 48.80 |
| Income from Investment Operations | ||||||||||
Net investment income (loss) A,B | 1.935 | 1.120 | .988 | 1.323 | 1.502 | |||||
| Net realized and unrealized gain (loss) | (1.858) | (7.137) | .023 | 2.812 | 3.147 | |||||
| Total from investment operations | .077 | (6.017) | 1.011 | 4.135 | 4.649 | |||||
| Distributions from net investment income | (1.847) | (1.123) | (.951) C | (1.375) | (1.499) | |||||
| Distributions from net realized gain | - | - | (1.143) C | - | - | |||||
| Total distributions | (1.847) | (1.123) | (2.094) | (1.375) | (1.499) | |||||
| Net asset value, end of period | $ | 44.72 | $ | 46.49 | $ | 53.63 | $ | 54.71 | $ | 51.95 |
Total Return D,E | .20% | (11.32)% | 1.90% | 8.10% | 9.73% | |||||
Ratios to Average Net Assets B,F,G | ||||||||||
| Expenses before reductions | .36% | .36% | .36% | .36% | .36% | |||||
| Expenses net of fee waivers, if any | .36% | .36% | .36% | .36% | .36% | |||||
| Expenses net of all reductions | .36% | .36% | .36% | .36% | .36% | |||||
| Net investment income (loss) | 4.29% | 2.24% | 1.84% | 2.51% | 3.01% | |||||
| Supplemental Data | ||||||||||
| Net assets, end of period (000 omitted) | $ | 4,731,167 | $ | 2,289,659 | $ | 2,048,646 | $ | 1,365,222 | $ | 761,195 |
Portfolio turnover rate H,I | 233% | 48% | 117% | 112% | 150% |
| Fidelity Central Fund | Investment Manager | Investment Objective | Investment Practices | Expense RatioA |
| Fidelity Money Market Central Funds | Fidelity Management & Research Company LLC (FMR) | Each fund seeks to obtain a high level of current income consistent with the preservation of capital and liquidity. | Short-term Investments | Less than .005% |
| Tax cost | Gross unrealized appreciation | Gross unrealized depreciation | Net unrealized appreciation (depreciation) | |
| Fidelity Corporate Bond ETF | $193,172,504 | $265,244 | $ (22,916,500) | $ (22,651,256) |
| Fidelity Investment Grade Bond ETF | 33,039,832 | 44,379 | (1,229,854) | (1,185,475) |
Fidelity Investment Grade Securitized ETF | 5,234,622 | 10,936 | (241,369) | (230,433) |
| Fidelity Limited Term Bond ETF | 184,478,707 | 115,938 | (7,746,509) | (7,630,571) |
| Fidelity Low Duration Bond Factor ETF | 244,109,259 | 471,426 | (2,692,549) | (2,221,123) |
| Fidelity Tactical Bond ETF | 14,776,714 | 51,989 | (545,496) | (493,507) |
| Fidelity Total Bond ETF | 5,405,099,512 | 18,102,086 | (283,734,398) | (265,632,312) |
| Undistributed ordinary income | Capital loss carryforward | Net unrealized appreciation (depreciation) on securities and other investments | |
| Fidelity Corporate Bond ETF | $398 | $ (9,446,406) | $ (22,651,256) |
| Fidelity Investment Grade Bond ETF | - | (388,866) | (1,185,475) |
Fidelity Investment Grade Securitized ETF | - | (616,013) | (230,447) |
| Fidelity Limited Term Bond ETF | - | (6,418,286) | (7,630,571) |
| Fidelity Low Duration Bond Factor ETF | 70,365 | (3,076,915) | (2,221,123) |
| Fidelity Tactical Bond ETF | 26,215 | (107,135) | (494,018) |
| Fidelity Total Bond ETF | - | (134,036,097) | (267,263,032) |
| Short-term | Long-term | Total capital loss carryforward | |
| Fidelity Corporate Bond ETF | $ (4,300,879) | $ (5,145,527) | $ (9,446,406) |
| Fidelity Investment Grade Bond ETF | (204,570) | (184,296) | (388,866) |
Fidelity Investment Grade Securitized ETF | (583,277) | (32,736) | (616,013) |
| Fidelity Limited Term Bond ETF | (2,127,435) | (4,290,851) | (6,418,286) |
| Fidelity Low Duration Bond Factor ETF | (1,013,183) | (2,063,732) | (3,076,915) |
| Fidelity Tactical Bond ETF | (102,541) | (4,594) | (107,135) |
| Fidelity Total Bond ETF | (78,134,141) | (55,901,956) | (134,036,097) |
| August 31, 2023 | |||||
| Ordinary Income | Total | ||||
| Fidelity Corporate Bond ETF | $5,667,200 | $5,667,200 | |||
| Fidelity Investment Grade Bond ETF | 532,050 | 532,050 | |||
Fidelity Investment Grade Securitized ETF | 103,575 | 103,575 | |||
| Fidelity Limited Term Bond ETF | 6,097,800 | 6,097,800 | |||
| Fidelity Low Duration Bond Factor ETF | 9,884,875 | 9,884,875 | |||
| Fidelity Tactical Bond ETF | 408,300 | 408,300 | |||
| Fidelity Total Bond ETF | 139,587,694 | 139,587,694 | |||
| August 31, 2022 | |||||
| Ordinary Income | Tax Return of Capital | Total | |||
| Fidelity Corporate Bond ETF | $6,112,550 | $- | $6,112,550 | ||
| Fidelity Investment Grade Bond ETF | 144,300 | - | 144,300 | ||
Fidelity Investment Grade Securitized ETF | 37,844 | 56,681 | 94,525 | ||
| Fidelity Limited Term Bond ETF | 2,935,700 | - | 2,935,700 | ||
| Fidelity Low Duration Bond Factor ETF | 2,181,925 | - | 2,181,925 | ||
| Fidelity Total Bond ETF | 51,534,146 | - | 51,534,146 | ||
| Credit Risk | Credit risk relates to the ability of the issuer of a financial instrument to make further principal or interest payments on an obligation or commitment that it has to a fund. |
| Foreign Exchange Risk | Foreign exchange rate risk relates to fluctuations in the value of an asset or liability due to changes in currency exchange rates. |
| Interest Rate Risk | Interest rate risk relates to the fluctuations in the value of interest-bearing securities due to changes in the prevailing levels of market interest rates. |
| Primary Risk Exposure / Derivative Type | Net Realized Gain (Loss)($) | Change in Net Unrealized Appreciation (Depreciation)($) |
| Fidelity Investment Grade Securitized ETF | ||
| Credit Risk | ||
| Swaps | 712 | (1,128) |
| Total Credit Risk | 712 | (1,128) |
| Interest Rate Risk | ||
| Futures Contracts | 61,196 | (14,503) |
| Swaps | (13,256) | (1,331) |
| Total Interest Rate Risk | 47,940 | (15,834) |
| Totals | 48,652 | (16,962) |
| Fidelity Limited Term Bond ETF | ||
| Interest Rate Risk | ||
| Futures Contracts | (1,225,377) | 237,112 |
| Total Interest Rate Risk | (1,225,377) | 237,112 |
| Totals | (1,225,377) | 237,112 |
| Fidelity Tactical Bond ETF | ||
| Foreign Exchange Risk | ||
| Forward Foreign Currency Contracts | (15,379) | 16,465 |
| Total Foreign Exchange Risk | (15,379) | 16,465 |
| Interest Rate Risk | ||
| Futures Contracts | (8,007) | 350 |
| Total Interest Rate Risk | (8,007) | 350 |
| Totals | (23,386) | 16,815 |
| Fidelity Total Bond ETF | ||
| Credit Risk | ||
| Purchased Options | (328,362) | - |
| Swaps | 444 | (232,790) |
| Total Credit Risk | (327,918) | (232,790) |
| Foreign Exchange Risk | ||
| Forward Foreign Currency Contracts | (4,630,823) | 669,381 |
| Total Foreign Exchange Risk | (4,630,823) | 669,381 |
| Interest Rate Risk | ||
| Futures Contracts | 3,790,539 | (825,546) |
| Purchased Options | (14,500) | (17,470) |
| Swaps | (141,387) | (14,346) |
| Total Interest Rate Risk | 3,634,652 | (857,362) |
| Totals | (1,324,089) | (420,771) |
| Purchases ($) | Sales ($) | |
| Fidelity Corporate Bond ETF | 12,676,591 | 28,776,227 |
| Fidelity Investment Grade Bond ETF | 19,665,805 | 16,327,179 |
| Fidelity Investment Grade Securitized ETF | 25,872,343 | 25,319,030 |
| Fidelity Limited Term Bond ETF | 83,408,435 | 32,129,831 |
| Fidelity Low Duration Bond Factor ETF | 91,083,303 | 82,570,736 |
| Fidelity Tactical Bond ETF | 8,904,100 | 1,606,042 |
| Fidelity Total Bond ETF | 5,444,225,168 | 4,778,772,229 |
| In-Kind Subscriptions ($) | In-Kind Redemptions ($) | |
| Fidelity Corporate Bond ETF | 39,149,738 | 15,281,590 |
| Fidelity Investment Grade Bond ETF | 12,245,666 | - |
| Fidelity Limited Term Bond ETF | 8,466,414 | 155,982,466 |
| Fidelity Total Bond ETF | 1,036,341,584 | 23,650,244 |
| Fee Rate | |
| Fidelity Corporate Bond ETF | .36% |
| Fidelity Investment Grade Bond ETF | .36% |
| Fidelity Investment Grade Securitized ETF | .36% |
| Fidelity Limited Term Bond ETF | .32% |
| Fidelity Low Duration Bond Factor ETF | .15% |
| Fidelity Tactical Bond ETF | .55% |
| Fidelity Total Bond ETF | .36% |
| Amount | |
| Fidelity Total Bond ETF | $12 |
| Purchases ($) | Sales ($) | Realized Gain (Loss) ($) | |
| Fidelity Corporate Bond ETF | - | - | - |
| Fidelity Investment Grade Bond ETF | - | - | - |
| Fidelity Investment Grade Securitized ETF | - | - | - |
| Fidelity Limited Term Bond ETF | - | - | - |
| Fidelity Low Duration Bond Factor ETF | - | - | - |
| Fidelity Tactical Bond ETF | - | - | - |
| Fidelity Total Bond ETF | - | 29,461 | 18,550 |
| Amount ($) | |
| Fidelity Total Bond ETF | 4,877 |
| Reimbursement | |
| Fidelity Investment Grade Bond ETF | $230 |
| Fidelity Investment Grade Securitized ETF | $134 |
| Fidelity Low Duration Bond Factor ETF | $679 |
Custodian credits | |
| Fidelity Corporate Bond ETF | $540 |
| Fidelity Investment Grade Bond ETF | 771 |
Fidelity Investment Grade Securitized ETF | 186 |
| Fidelity Limited Term Bond ETF | 2,021 |
Fidelity Low Duration Bond Factor ETF | 2,762 |
| Fidelity Tactical Bond ETF | 1,700 |
| Fidelity Total Bond ETF | 19,455 |
| The Example is based on an investment of $1,000 invested at the beginning of the period and held for the entire period (March 1, 2023 to August 31, 2023). |
Annualized Expense Ratio- A | Beginning Account Value March 1, 2023 | Ending Account Value August 31, 2023 | Expenses Paid During Period- C March 1, 2023 to August 31, 2023 | |||||||
| Fidelity® Corporate Bond ETF | .36% | |||||||||
| Actual | $ 1,000 | $ 1,018.20 | $ 1.83 | |||||||
Hypothetical-B | $ 1,000 | $ 1,023.39 | $ 1.84 | |||||||
| Fidelity® Investment Grade Bond ETF | .36% | |||||||||
| Actual | $ 1,000 | $ 1,011.00 | $ 1.82 | |||||||
Hypothetical-B | $ 1,000 | $ 1,023.39 | $ 1.84 | |||||||
| Fidelity® Investment Grade Securitized ETF | .36% | |||||||||
| Actual | $ 1,000 | $ 1,004.60 | $ 1.82 | |||||||
Hypothetical-B | $ 1,000 | $ 1,023.39 | $ 1.84 | |||||||
| Fidelity® Limited Term Bond ETF | .27% | |||||||||
| Actual | $ 1,000 | $ 1,021.00 | $ 1.38 | |||||||
Hypothetical-B | $ 1,000 | $ 1,023.84 | $ 1.38 | |||||||
| Fidelity® Low Duration Bond Factor ETF | .15% | |||||||||
| Actual | $ 1,000 | $ 1,026.00 | $ .77 | |||||||
Hypothetical-B | $ 1,000 | $ 1,024.45 | $ .77 | |||||||
| Fidelity® Tactical Bond ETF | .55% | |||||||||
| Actual | $ 1,000 | $ 991.80 | $ 2.76 | |||||||
Hypothetical-B | $ 1,000 | $ 1,022.43 | $ 2.80 | |||||||
| Fidelity® Total Bond ETF | .36% | |||||||||
| Actual | $ 1,000 | $ 1,014.30 | $ 1.83 | |||||||
Hypothetical-B | $ 1,000 | $ 1,023.39 | $ 1.84 | |||||||
| Fidelity Corporate Bond ETF | 7.21% |
| Fidelity Limited Term Bond ETF | 24.23% |
| Fidelity Total Bond ETF | 23.70% |
| Fidelity Low Duration Bond Factor ETF | 6.27% |
| Fidelity Investment Grade Bond ETF | 33.52% |
| Fidelity Investment Grade Securitized ETF | 14.25% |
| Fidelity Tactical Bond ETF | 26.57% |
| Fidelity Corporate Bond ETF | $3,857,863 |
| Fidelity Limited Term Bond ETF | $ 2,523,781 |
| Fidelity Total Bond ETF | $ 46,785,493 |
| Fidelity Low Duration Bond Factor ETF | $ 2,571,178 |
| Fidelity Investment Grade Bond ETF | $ 128,934 |
| Fidelity Investment Grade Securitized ETF | $ 54,183 |
| Fidelity Corporate Bond ETF | $5,240,560 |
| Fidelity Limited Term Bond ETF | $6,006,927 |
| Fidelity Total Bond ETF | $136,677,243 |
| Fidelity Low Duration Bond Factor ETF | $9,391,582 |
| Fidelity Investment Grade Bond ETF | $530,028 |
| Fidelity Investment Grade Securitized ETF | $101,274 |
| Fidelity Tactical Bond ETF | $402,975 |
 |
Item 2.
Code of Ethics
As of the end of the period, August 31, 2023, Fidelity Merrimack Street Trust (the trust) has adopted a code of ethics, as defined in Item 2 of Form N-CSR, that applies to its President and Treasurer and its Chief Financial Officer. A copy of the code of ethics is filed as an exhibit to this Form N-CSR.
Item 3.
Audit Committee Financial Expert
The Board of Trustees of the trust has determined that Elizabeth S. Acton is an audit committee financial expert, as defined in Item 3 of Form N-CSR. Ms. Acton is independent for purposes of Item 3 of Form N-CSR.
Item 4.
Principal Accountant Fees and Services
Fees and Services
The following table presents fees billed by Deloitte & Touche LLP, the member firms of Deloitte Touche Tohmatsu, and their respective affiliates (collectively, “Deloitte Entities”) in each of the last two fiscal years for services rendered to Fidelity Sustainable Core Plus Bond ETF, Fidelity Sustainable Low Duration Bond ETF, and Fidelity Tactical Bond ETF (the “Funds”):
Services Billed by Deloitte Entities
August 31, 2023 FeesA,C
Audit Fees | Audit-Related Fees | Tax Fees | All Other Fees | |
Fidelity Sustainable Core Plus Bond ETF | $38,800 | $- | $4,700 | $900 |
Fidelity Sustainable Low Duration Bond ETF | $36,300 | $- | $4,700 | $800 |
Fidelity Tactical Bond ETF | $49,100 | $- | $8,400 | $700 |
August 31, 2022 FeesA,B,C
Audit Fees | Audit-Related Fees | Tax Fees | All Other Fees | |
Fidelity Sustainable Core Plus Bond ETF | $32,800 | $- | $3,600 | $200 |
Fidelity Sustainable Low Duration Bond ETF | $30,600 | $- | $3,600 | $200 |
Fidelity Tactical Bond ETF | $- | $- | $- | $- |
A Amounts may reflect rounding.
B Fidelity Sustainable Core Plus Bond ETF and Fidelity Sustainable Low Duration Bond ETF commenced operations on April 19, 2022.
C Fidelity Tactical Bond ETF commenced operations on January 24, 2023.
The following table presents fees billed by PricewaterhouseCoopers LLP (“PwC”) in each of the last two fiscal years for services rendered to Fidelity Corporate Bond ETF, Fidelity Investment Grade Bond ETF, Fidelity Investment Grade Securitized ETF, Fidelity Limited Term Bond ETF, Fidelity Low Duration Bond Factor ETF, and Fidelity Total Bond ETF (the “Funds”):
Services Billed by PwC
August 31, 2023 FeesA
Audit Fees | Audit-Related Fees | Tax Fees | All Other Fees | |
Fidelity Corporate Bond ETF | $35,700 | $- | $7,100 | $1,300 |
Fidelity Investment Grade Bond ETF | $37,900 | $- | $7,500 | $1,400 |
Fidelity Investment Grade Securitized ETF | $38,800 | $- | $7,800 | $1,400 |
Fidelity Limited Term Bond ETF | $37,600 | $- | $7,500 | $1,400 |
Fidelity Low Duration Bond Factor ETF | $37,900 | $- | $7,600 | $1,400 |
Fidelity Total Bond ETF | $40,600 | $- | $8,000 | $1,500 |
August 31, 2022 FeesA
Audit Fees | Audit-Related Fees | Tax Fees | All Other Fees | |
Fidelity Corporate Bond ETF | $34,300 | $- | $7,000 | $1,300 |
Fidelity Investment Grade Bond ETF | $36,100 | $- | $7,300 | $1,300 |
Fidelity Investment Grade Securitized ETF | $37,200 | $- | $7,600 | $1,400 |
Fidelity Limited Term Bond ETF | $36,100 | $- | $7,300 | $1,400 |
Fidelity Low Duration Bond Factor ETF | $36,300 | $- | $7,400 | $1,400 |
Fidelity Total Bond ETF | $38,800 | $- | $7,800 | $1,500 |
A Amounts may reflect rounding.
The following table(s) present(s) fees billed by Deloitte Entities and PwC that were required to be approved by the Audit Committee for services that relate directly to the operations and financial reporting of the Fund(s) and that are rendered on behalf of Fidelity Management & Research Company LLC ("FMR") and entities controlling, controlled by, or under common control with FMR (not including any sub-adviser whose role is primarily portfolio management and is subcontracted with or overseen by another investment adviser) that provide ongoing services to the Fund(s) (“Fund Service Providers”):
Services Billed by Deloitte Entities
August 31, 2023A,C | August 31, 2022A,B,C | |
Audit-Related Fees | $- | $- |
Tax Fees | $- | $- |
All Other Fees | $- | $- |
A Amounts may reflect rounding.
B May include amounts billed prior to Fidelity Sustainable Core Plus Bond ETF and Fidelity Sustainable Low Duration Bond ETF’s commencement of operations.
C May contain amounts billed prior to Fidelity Tactical Bond ETF’s commencement of operations
Services Billed by PwC
August 31, 2023A | August 31, 2022A | ||
Audit-Related Fees | $8,284,200 | $7,914,600 | |
Tax Fees | $1,000 | $353,200 | |
All Other Fees | $- | $- |
A Amounts may reflect rounding.
“Audit-Related Fees” represent fees billed for assurance and related services that are reasonably related to the performance of the fund audit or the review of the fund's financial statements and that are not reported under Audit Fees.
“Tax Fees” represent fees billed for tax compliance, tax advice or tax planning that relate directly to the operations and financial reporting of the fund.
“All Other Fees” represent fees billed for services provided to the fund or Fund Service Provider, a significant portion of which are assurance related, that relate directly to the operations and financial reporting of the fund, excluding those services that are reported under Audit Fees, Audit-Related Fees or Tax Fees.
Assurance services must be performed by an independent public accountant.
* * *
The aggregate non-audit fees billed by Deloitte Entities and PwC for services rendered to the Fund(s), FMR (not including any sub-adviser whose role is primarily portfolio management and is subcontracted with or overseen by another investment adviser), and any Fund Service Provider for each of the last two fiscal years of the Fund(s) are as follows:
Billed By | August 31, 2023A,C | August 31, 2022A,B,C | ||
Deloitte Entities | $262,800 | $465,200 | ||
PwC | $13,641,700 | $13,287,900 | ||
A Amounts may reflect rounding. .
B May contain amounts billed prior to Fidelity Sustainable Core Plus Bond ETF and Fidelity Sustainable Low Duration Bond ETF’s commencement of operations.
C May contain amounts billed prior to Fidelity Tactical Bond ETF’s commencement of operations.
The trust's Audit Committee has considered non-audit services that were not pre-approved that were provided by Deloitte Entities and PwC to Fund Service Providers to be compatible with maintaining the independence of Deloitte Entities and PwC in its(their) audit of the Fund(s), taking into account representations from Deloitte Entities and PwC, in accordance with Public Company Accounting Oversight Board rules, regarding its independence from the Fund(s) and its(their) related entities and FMR’s review of the appropriateness and permissibility under applicable law of such non-audit services prior to their provision to the Fund(s) Service Providers.
Audit Committee Pre-Approval Policies and Procedures
The trust’s Audit Committee must pre-approve all audit and non-audit services provided by a fund’s independent registered public accounting firm relating to the operations or financial reporting of the fund. Prior to the commencement of any audit or non-audit services to a fund, the Audit Committee reviews the services to determine whether they are appropriate and permissible under applicable law.
The Audit Committee has adopted policies and procedures to, among other purposes, provide a framework for the Committee’s consideration of non-audit services by the audit firms that audit the Fidelity funds. The policies and procedures require that any non-audit service provided by a fund audit firm to a Fidelity fund and any non-audit service provided by a fund auditor to a Fund Service Provider that relates directly to the operations and financial reporting of a Fidelity fund (“Covered Service”) are subject to approval by the Audit Committee before such service is provided.
All Covered Services must be approved in advance of provision of the service either: (i) by formal resolution of the Audit Committee, or (ii) by oral or written approval of the service by the Chair of the Audit Committee (or if the Chair is unavailable, such other member of the Audit Committee as may be designated by the Chair to act in the Chair’s absence). The approval contemplated by (ii) above is permitted where the Treasurer determines that action on such an engagement is necessary before the next meeting of the Audit Committee.
Non-audit services provided by a fund audit firm to a Fund Service Provider that do not relate directly to the operations and financial reporting of a Fidelity fund are reported to the Audit Committee periodically.
Non-Audit Services Approved Pursuant to Rule 2-01(c)(7)(i)(C) and (ii) of Regulation S-X (“De Minimis Exception”)
There were no non-audit services approved or required to be approved by the Audit Committee pursuant to the De Minimis Exception during the Fund’s(s’) last two fiscal years relating to services provided to (i) the Fund(s) or (ii) any Fund Service Provider that relate directly to the operations and financial reporting of the Fund(s).
The Registrant has not retained, for the preparation of the audit report on the financial statements included in the Form N-CSR, a registered public accounting firm that has a branch or office that is located in a foreign jurisdiction and that the Public Company Accounting Oversight Board (the “PCAOB”) has determined that the PCAOB is unable to inspect or investigate completely because of a position taken by an authority in the foreign jurisdiction.
The Registrant is not a “foreign issuer,” as defined in 17 CFR 240.3b-4.
Item 5.
Audit Committee of Listed Registrants
The Audit Committee is a separately-designated standing audit committee in accordance with Section 3(a)(58)(A) of the Securities Exchange Act of 1934. As of August 31, 2023, the members of the Audit Committee were Elizabeth S. Acton, Ann E. Dunwoody, John Engler, Robert F. Gartland, Arthur E. Johnson, Michael E. Kenneally, and Mark A. Murray.
Item 6.
Investments
(a)
Not applicable.
(b)
Not applicable.
Item 7.
Disclosure of Proxy Voting Policies and Procedures for Closed-End Management Investment Companies
Not applicable.
Item 8.
Portfolio Managers of Closed-End Management Investment Companies
Not applicable.
Item 9.
Purchase of Equity Securities by Closed-End Management Investment Company and Affiliated Purchasers
Not applicable.
Item 10.
Submission of Matters to a Vote of Security Holders
There were no material changes to the procedures by which shareholders may recommend nominees to the trust’s Board of Trustees.
Item 11.
Controls and Procedures
(a)(i) The President and Treasurer and the Chief Financial Officer have concluded that the trust’s disclosure controls and procedures (as defined in Rule 30a-3(c) under the Investment Company Act) provide reasonable assurances that material information relating to the trust is made known to them by the appropriate persons, based on their evaluation of these controls and procedures as of a date within 90 days of the filing date of this report.
(a)(ii) There was no change in the trust’s internal control over financial reporting (as defined in Rule 30a-3(d) under the Investment Company Act) that occurred during the period covered by this report that has materially affected, or is reasonably likely to materially affect, the trust’s internal control over financial reporting.
Item 12.
Disclosure of Securities Lending Activities for Closed-End Management
Investment Companies
Not applicable.
Item 13.
Exhibits
(a) | (1) | Code of Ethics pursuant to Item 2 of Form N-CSR is filed and attached hereto as EX-99.CODE ETH. |
(a) | (2) | |
(a) | (3) | Not applicable. |
(b) |
SIGNATURES
Pursuant to the requirements of the Securities Exchange Act of 1934 and the Investment Company Act of 1940, the registrant has duly caused this report to be signed on its behalf by the undersigned, thereunto duly authorized.
Fidelity Merrimack Street Trust
By: | /s/Laura M. Del Prato |
Laura M. Del Prato | |
President and Treasurer | |
Date: | October 23, 2023 |
Pursuant to the requirements of the Securities Exchange Act of 1934 and the Investment Company Act of 1940, this report has been signed below by the following persons on behalf of the registrant and in the capacities and on the dates indicated.
By: | /s/Laura M. Del Prato |
Laura M. Del Prato | |
President and Treasurer | |
Date: | October 23, 2023 |
By: | /s/John J. Burke III |
John J. Burke III | |
Chief Financial Officer | |
Date: | October 23, 2023 |