Filed Pursuant to Rule 433
Registration No. 333-276157

Growth potential, guaranteed income
Zone Income Annuity
TruStage™ Zone Income Annuities are issued by
MEMBERS LIFE INSURANCE COMPANY

Helping take the risk out of retirement

The retirement landscape: financial markets
For most of us, the retirement landscape looks a lot different than the one our grandparents expected.
We’re faced with new risks and new realities.
S&P 500 Price Index1
6000
5000 Dec 29, 2023
Jan 3, 2022
-25%
4000 Feb19, 2020 +33%
Oct 12, 2022
3000 +401% +114%
Mar 24, 2000 Oct 9, 2007 -34%
2000 +266% Mar 23, 2020
-49% +101% -57%
Dec 31, 1991
1000 Oct 9, 2002
Mar 8, 2009
0
1991 1992 1993 1994 1995 1996 1997 1998 1999 2000 2001 2002 2003 2004 2005 2006 2007 2008 2009 2010 2011 2012 2013 2014 2015 2016 2017 2018 2019 2020 2021 2022
Over time, the markets go in cycles — sometimes up, sometimes down. There are both day-to-day fluctuations and long-term trends.
1Data derived by MEMBERS Life Insurance Company, 2024. The S&P 500 Index is a product of S&P Dow Jones Indices LLC (“SPDJI”) and has been licensed for use by CMFG Life Insurance Company (CMFG Life), the parent company of MEMBERS Life Insurance Company (MEMBERS Life). Standard & Poor’s®, S&P® and S&P 500® are registered trademarks of Standard & Poor’s Financial Services LLC (“S&P”), and these trademarks have been licensed for use by SPDJI and sublicensed for certain purposes by CMFG Life. This product is not sponsored, endorsed, sold or promoted by SPDJI, S&P, their respective affiliates, and none of such parties make any representation regarding the advisability of investing in this product nor do they have any liability for any errors, omissions or interruptions of the S&P 500 Index. The S&P 500 Index does not include dividends paid by the underlying companies.
Zone Income Annuity 1

The retirement landscape: personal factors
Growth with risk control and access to income are key components to achieving a comfortable, confident retirement.
Longevity Rising costs
Most of us are living longer and active lives — without the pension plans of the past.
Inflation steadily reduces the purchasing power of a retirement nest egg.
Longevity requires more health care savings
7 in 10
Adults turning 65 today in the U.S. will require long-term care during their lives.1
21%
Of retirees citing health problems as the reason for retiring earlier than planned.2
Longevity is one of the biggest risks faced by those planning retirement. How much money do you need and for how long?
Price data 2003-20233
Jan-03 Jan-23
Gasoline, price per gallon, unleaded $1.47 $3.45
Milk, per gallon $2.69 $4.20
Ground beef, per pound $2.13 $4.64
Eggs, per dozen $1.18 $4.82
White bread $1.04 $1.89
1LongTermCare.gov, longtermcare.acl.gov, “The Basics, How Much Care Will You Need,” October 28, 2020.
22022 Spending in Retirement Survey: Understanding the Pandemic's Impact, https://www.ebri.org/docs/default-source/ebri-issue-brief/ebri_ib_572_spendinginret-6oct22.pdf, October 6, 2022. 3Bureau of Labor Statistics, Average Price Data (in U.S. Dollars), https://www.bls.gov/charts/consumer-price-index/consumer-price-index-average-price-data.htm, January 2023.
2 Zone Income Annuity

A new way to
plan for retirement
Traditional investment diversification doesn’t offer protection. Avoiding risk altogether offers no chance for growth, and many growth-oriented investments don’t offer the opportunity for income.
But there’s a new way. TruStage™ Zone Income Annuity provides an innovative approach to market-linked risk control combined with income for life.
With Zone Income, you can set your downside limit — called a floor — along with a corresponding cap on the upside. Once the floor is set, you can’t lose more than that, no matter what happens in the markets, while still enjoying the potential for attractive market growth. Plus, Zone Income adds powerful protection against living longer than your assets.
Zone Income lets you enjoy growth opportunities, without the worry of catastrophic loss. With Zone Income, you’re in control.
Risk control
Zone
Income
Income
for life
Zone Income Annuity 3

Set your comfort zone with an income guarantee
The Zone Income Annuity is an insurance contract that offers index-linked returns, a limit on market losses and lifetime income options.
Your investment allocation
When you purchase Zone Income, you decide how much of your payment to allocate to the annuity’s allocation options. Four options link performance to a market index and one invests at a declared rate. For allocations linked to an index, you then choose how much to place into two risk control accounts,
each with its own range of possible investment performance. Your risk control allocations are not an investment in any underlying fund portfolio. Instead, interest and guarantees are based on your contract with MEMBERS Life Insurance Company and its claims-paying ability.
∙ The Secure Account has a declared rate cap and a 0% floor. These dollars are safe from market downturns and receive modest growth potential.
∙ The Growth Account has a higher declared cap and a -10% floor. These dollars can experience limited losses if the market is down, but when it’s up they have more room to grow.
In addition to blending your allocation between allocation options, you set a risk/reward zone for each index by allocating between the Secure and Growth Accounts — your upside potential and the level of protection you’re comfortable with on the downside. These upside and downside limits are connected. Greater possible rewards mean greater possible risk. Nerves of steel? Widen your zone. Want to play it safe? Narrow it. The decision is yours.
Plus, you can reallocate between allocation options and risk control accounts each year, to adjust as needs change.
Risk Control
Zone
Wide
Narrow
Secure Upside
potential
0%
Downside
protection
4 Zone Income Annuity

Index-linked performance, with limits on loss
Your annuity receives interest linked to the performance of one or more market indexes or a declared rate account. Dollars allocated to receive a declared rate earn that rate on each contract anniversary. For dollars linked to an index, earnings lock in based on the annual point-to-point change in the index, from one contract anniversary to the next, while still allowing you to participate in the market's upside. The goal isn't to eliminate bumps on the road to retirement, it's to smooth them out, allowing you to get where you want to go with greater confidence.
Allocation option Details
This equity index tracks changes in market value for
S&P 500 Index 500 large U.S. companies and generally represents the
performance of the U.S. stock market as a whole.
This index provides exposure to small cap value stocks in
Dimensional US the U.S., a higher expected return segment of the market
based on decades of research. Within the segment, the
Small Cap Value
index systematically excludes the lowest expected return
Systematic Index
stocks, such as companies with low profitability and high
asset growth.
Barclays Risk This index allocates between 50 U.S. low volatility stocks
and fixed income using the principles of Modern Portfolio
Balanced Index
Theory, targeting 10% volatility.
MSCI EAFE This international equity index measures the performance
of developed markets outside the U.S. and Canada,
Index
including those in Europe, Australia and Southeast Asia.
Declared Rate This account is credited with an annual declared rate of
interest.
Zone Income Annuity 5
The power of risk control
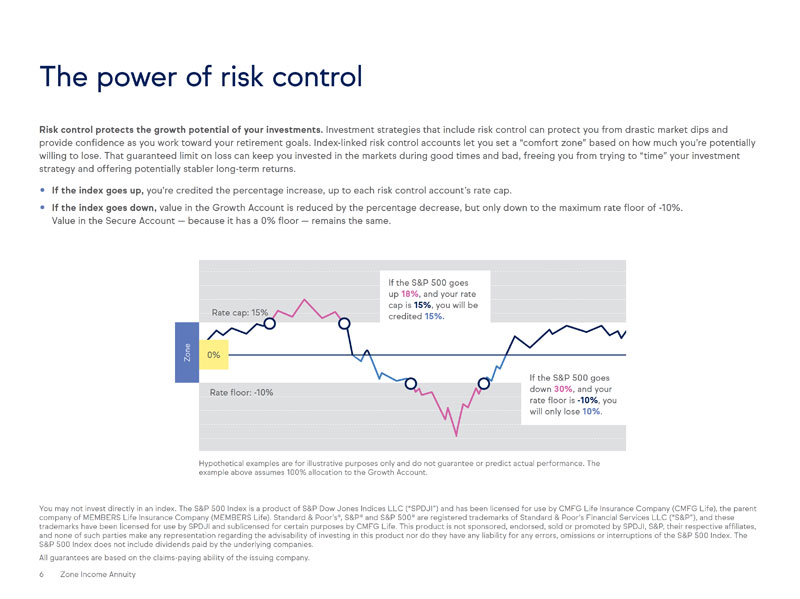
Risk control protects the growth potential of your investments. Investment strategies that include risk control can protect you from drastic market dips and provide confi dence as you work toward your retirement goals. Index-linked risk control accounts let you set a “comfort zone” based on how much you’re potentially willing to lose. That guaranteed limit on loss can keep you invested in the markets during good times and bad, freeing you from trying to “time” your investment strategy and offering potentially stabler long-term returns.
∙ If the index goes up, you’re credited the percentage increase, up to each risk control account’s rate cap.
∙ If the index goes down, value in the Growth Account is reduced by the percentage decrease, but only down to the maximum rate fl oor of -10%. Value in the Secure Account — because it has a 0% fl oor — remains the same.
Zone
If the S&P 500 goes
up 18%, and your rate
Rate cap: 15% cap is 15%, you will be
credited 15%.
0%
If the S&P 500 goes
Rate fl oor: -10% down 30%, and your rate fl oor is -10%, you
will only lose 10%.
Hypothetical examples are for illustrative purposes only and do not guarantee or predict actual performance. The example above assumes 100% allocation to the Growth Account.
You may not invest directly in an index. The S&P 500 Index is a product of S&P Dow Jones Indices LLC (“SPDJI”) and has been licensed for use by CMFG Life Insurance Company (CMFG Life), the parent company of MEMBERS Life Insurance Company (MEMBERS Life). Standard & Poor’s®, S&P® and S&P 500® are registered trademarks of Standard & Poor’s Financial Services LLC (“S&P”), and these trademarks have been licensed for use by SPDJI and sublicensed for certain purposes by CMFG Life. This product is not sponsored, endorsed, sold or promoted by SPDJI, S&P, their respective affi liates, and none of such parties make any representation regarding the advisability of investing in this product nor do they have any liability for any errors, omissions or interruptions of the S&P 500 Index. The S&P 500 Index does not include dividends paid by the underlying companies.
All guarantees are based on the claims-paying ability of the issuing company.
6 Zone Income Annuity

Using history as a guide
Looking at past market returns can help to understand when floors would have offered protection during downturns while offering growth potential in up markets.
Rolling monthly S&P 500 Index returns for
December 1991 through December 2023:
S&P 500 Price Index
77% 1-Year returns
● 77% Gains
● 23% Losses
Gains
Number of gains: 288
Number of losses: 85
S&P 500 Price Index
86% 6-Year returns
● 86% Gains
● 14% Losses
Gains Number of gains: 270
Number of losses: 43
The bottom line is, floors offer a measure of protection against downturns while still allowing you to participate in the market's upside. The goal isn't to eliminate bumps on the road to retirement, it's to smooth them out, allowing you to get where you want to go with greater confidence.
Data derived by MEMBERS Life Insurance Company, 2023. All periods shown are rolling monthly periods. Past performance is not indicative nor does it guarantee future results. This data does not represent the performance of any specific investment.
Zone Income Annuity 7

Lock in the gain, lock out the loss
See how your choice of zone and the performance of an index determine interest credited for a given year. In these two scenarios, rate caps are 5% for the S&P 500 Secure Account and 15% for the S&P 500 Growth Account. A 50/50 allocation means a blended comfort zone with 10% upside potential
A | Market gain
S&P 500 Index returns 8%
Zone Income purchase payment of $100,000 grows to $106,500
50%/$50,000 50%/$50,000 Index interest
Allocated to + Allocated to = Your blended
Secure Account Growth Account zone calculation
Your Cap Your Cap Your
Cap return 15% return return
10%
5% 5% 8% 6.5%
8%
0%
Floor -5%
Floor
-10%
Floor
and -5% downside protection. In scenario A, the index is up 8% for the year. In scenario B, it’s down 8%. Hypothetical values show how it all comes together to help you lock in gains when times are good and lock out losses outside your comfort zone when times are bad.
B | Market loss
S&P 500 Index returns -8%
Zone Income purchase payment of $100,000 is protected at $96,000
50%/$50,000 50%/$50,000 Index interest
Allocated to + Allocated to = Your blended
Secure Account Growth Account zone calculation
Cap
15% Cap
Your Your 10% Your
Cap return return return
5% 0% -8% -4%
0%
Floor
-8% -5%
Floor
-10%
Floor
You may not invest directly in an index. Hypothetical examples do not represent any specific annuity and may not be used to project or predict investment results. Rate caps are declared based on current market conditions and are subject to change. Rate caps vary by index and can be adjusted annually on contract anniversary, subject to a minimum of 1% and a bailout provision. If the rate cap is set below an account’s bailout rate, you may withdraw value from that account without surrender charge or market value adjustment during the 30 days following anniversary.
8 Zone Income Annuity

Guaranteed income with growth potential
Americans are living longer than ever — good news, but a long life can amplify all of the other risks you face in retirement. Longevity requires more savings for expenses like health care and to protect you against inflation. Having a nest egg you can count on is essential both to your financial security and confidence in retirement.
Your Zone Income allows you to combine risk-controlled, market-based growth opportunities with lifetime income options you can count on.
Your lifetime income is calculated based on a benefit base and a withdrawal rate, both of which have the potential to grow to increase your income.
This is referred to as Guaranteed Lifetime Withdrawal Benefit (GLWB) or lifetime income payment. The benefit base is initially equal to your purchase payment and will increase to your contract value every anniversary that the contract value is greater than the current benefit base. Additionally, the withdrawal rate increases 0.4% every year you hold your contract before starting income, up to a maximum of 10 years.
Your lifetime income payment will never decline1 — it only has the potential to increase, even after you’ve started taking income.
1 An excess withdrawal impacts your income benefit base and lifetime income payment amount. Please see Zone Income prospectus for further information about excess withdrawals and how they impact your benefits.
Zone Income Annuity 9

Put time on your side
Save today and build income for tomorrow. With Zone Income, getting a head start can result in a larger income stream down the road. The longer you wait to take income, the more time your annuity’s contract value has to grow and the larger your potential annual withdrawal rate will be.
Each year, your benefit base may be adjusted based on your contract value. If your contract value has gone up, your benefit base could rise, too.
But your benefit base will never decrease1, even if your contract value declines. Plus, your withdrawal rate — which determines your income — receives a deferral bonus of 0.4% each year you wait to take income, up to a maximum of 10 years.
So patience pays off, letting you reap the potential long-term benefits of market-driven growth plus an annual deferral bonus.
Issue age2 At issue Yr 1 Yr 2 Yr 3 Yr 4 Yr 5 Yr 6 Yr 7 Yr 8 Yr 9 Yr 10 +
21–44 2.50% 2.90% 3.30% 3.70% 4.10% 4.50% 4.90% 5.30% 5.70% 6.10% 6.50%
45 3.50% 3.90% 4.30% 4.70% 5.10% 5.50% 5.90% 6.30% 6.70% 7.10% 7.50% If elected at
50 4.25% 4.65% 5.05% 5.45% 5.85% 6.25% 6.65% 7.05% 7.45% 7.85% 8.25%
age 60, but
55 5.00% 5.40% 5.80% 6.20% 6.60% 7.00% 7.40% 7.80% 8.20% 8.60% 9.00% you waited
10 years before
58 5.30% 5.70% 6.10% 6.50% 6.90% 7.30% 7.70% 8.10% 8.50% 8.90% 9.30%
taking income,
60 1 5.50% 2 5.90% 6.30% 6.70% 7.10% 3 7.50% 7.90% 8.30% 8.70% 9.10% 4 9.50% your withdrawal
% rises from
63 5.95% 6.35% 6.75% 7.15% 7.55% 7.95% 8.35% 8.75% 9.15% 9.55% 9.95%
5.50% to 9.50%, a
65 6.25% 6.65% 7.05% 7.45% 7.85% 8.25% 8.65% 9.05% 9.45% 9.85% 10.25% 73% increase
to the lifetime
70 6.50% 6.90% 7.30% 7.70% 8.10% 8.50% 8.90% 9.30% 9.70% 10.10% 10.50%
income payment.
75 7.00% 7.40% 7.80% 8.20% 8.60% 9.00% 9.40% 9.80% 10.20% 10.60% 11.00%
80+ 7.25% 7.65% 8.05% 8.45% 8.85% 9.25% 9.65% 10.05% 10.45% 10.85% 11.25%
1. Base percentage at purchase (joint life base withdrawal percentage is 0.5% lower)
2. Withdrawal percentage increases 0.4% each year income is deferred up to a maximum of 10 years
3. Five-year wait to take income results in a 2.0% higher withdrawal percentage; this translates to a 36% higher lifetime income payment
4. Ten-year wait to take income results in a 4.0% higher withdrawal percentage; this translates to a 73% higher lifetime income payment
1 An excess withdrawal impacts your income benefit base and income payment amount. Please see Zone Income prospectus for further information about excess withdrawals and how they impact your benefits.
2 Initial Withdrawal Rates are established based on the age of the younger covered person as of the issue date. Initial Withdrawal Rates increases 0.15% for each age between ages 45–55 and 60–65 (i.e. for single life, 5.95% is the withdrawal % for age 63). Initial Withdrawal Rates increases 0.10% for each age between ages 55–60 and 70–75 (i.e. for single life, 5.30% is the withdrawal % for age 58). Initial Withdrawal Rates increases 0.05% for each age between ages 65–70 and 75–80 (i.e. for single life, 6.35% is the withdrawal % for age 67).
10 Zone Income Annuity
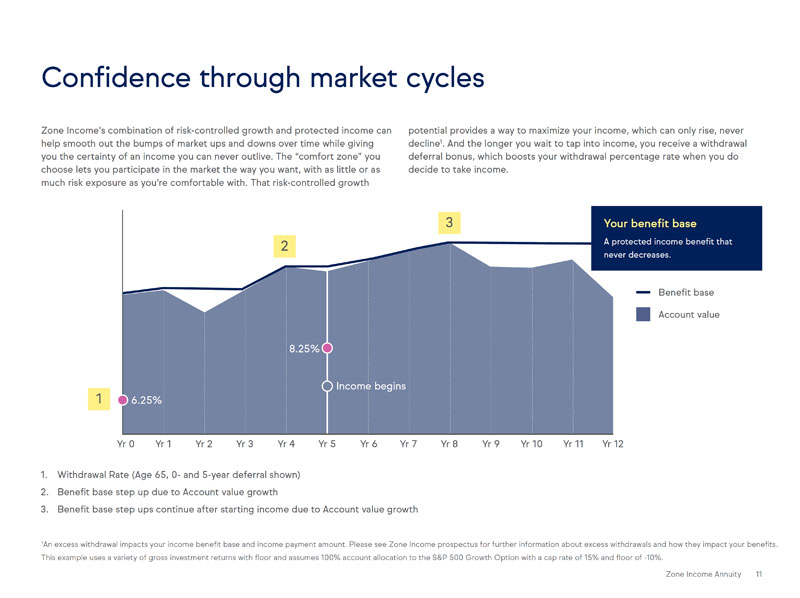
Confidence through market cycles
Zone Income’s combination of risk-controlled growth and protected income can help smooth out the bumps of market ups and downs over time while giving you the certainty of an income you can never outlive. The “comfort zone” you choose lets you participate in the market the way you want, with as little or as much risk exposure as you’re comfortable with. That risk-controlled growth
potential provides a way to maximize your income, which can only rise, never decline1. And the longer you wait to tap into income, you receive a withdrawal deferral bonus, which boosts your withdrawal percentage rate when you do decide to take income.
3 Your benefit base
2 A protected income benefit that
never decreases.
Benefit base
Account value
8.25%
1 Income begins
6.25%
Yr 0 Yr 1 Yr 2 Yr 3 Yr 4 Yr 5 Yr 6 Yr 7 Yr 8 Yr 9 Yr 10 Yr 11 Yr 12
1. Withdrawal Rate (Age 65, 0- and 5-year deferral shown)
2. Benefit base step up due to Account value growth
3. Benefit base step ups continue after starting income due to Account value growth
1An excess withdrawal impacts your income benefit base and income payment amount. Please see Zone Income prospectus for further information about excess withdrawals and how they impact your benefits. This example uses a variety of gross investment returns with floor and assumes 100% account allocation to the S&P 500 Growth Option with a cap rate of 15% and floor of -10%.
Zone Income Annuity 11

Performance driven income growth
How do potential market growth and a deferral bonus impact your future income? The chart below shows how hypothetical market performance and
deferring the start of income can significantly impact the lifetime income payment you’ll receive, even over six years. In this scenario, your lifetime income payment amount would more than double over that period.
$10,000
$8,000
$6,000
$4,000
$2,000
$0
Yr 0 Yr 1 Yr 2 Yr 3 Yr 4 Yr 5 Yr 6
Stock index annual return 29.60% 11.39% -0.73% 9.54% 19.42% -6.24%
Net investment return 13.25% 9.64% -2.48% 7.76% 13.25% -7.99%
Lifetime income payment growth $-- $828 $1,554 $1,554 $2,025 $3,382 $3,382
due to benefit base growth
Lifetime income payment growth $-- $453 $950 $1,446 $1,968 $2,559 $3,151
Due to deferral bonus increase
Lifetime income payment start value $6,250 $6,250 $6,250 $6,250 $6,250 $6,250 $6,250
Total Lifetime income payment $6,250 $7,531 $8,754 $9,250 $10,243 $12,192 $12,783
Ending lifetime income payment $12,783
Performance driven income
105% increase to the lifetime income payment
Assume no withdrawals and lifetime income payments have not begun. Hypothetical situation example does not reflect actual history. This example uses a variety of gross investment returns with 100% allocation to Growth Account and hypothetical cap rates of 15%. Account value includes contract and GLWB fee deductions. Cap rates are assumed flat throughout the period.
12 Zone Income Annuity
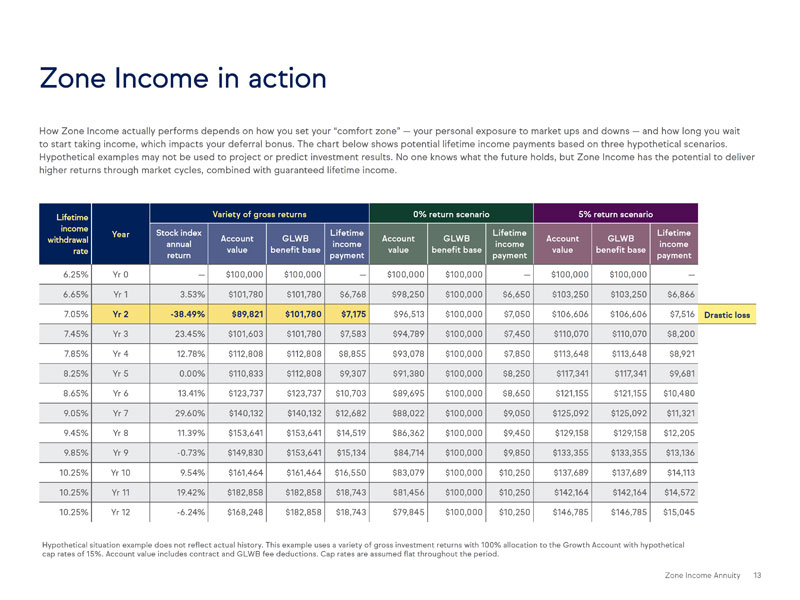
Zone Income in action
How Zone Income actually performs depends on how you set your “comfort zone” — your personal exposure to market ups and downs — and how long you wait to start taking income, which impacts your deferral bonus. The chart below shows potential lifetime income payments based on three hypothetical scenarios.
Hypothetical examples may not be used to project or predict investment results. No one knows what the future holds, but Zone Income has the potential to deliver higher returns through market cycles, combined with guaranteed lifetime income.
Lifetime Variety of gross returns 0% return scenario 5% return scenario
income Year Stock index Account GLWB Lifetime Account GLWB Lifetime Account GLWB Lifetime
withdrawal
annual income income income
rate value benefit base value benefit base value benefit base
return payment payment payment
6.25% Yr 0 — $100,000 $100,000 — $100,000 $100,000 — $100,000 $100,000 —
6.65% Yr 1 3.53% $101,780 $101,780 $6,768 $98,250 $100,000 $6,650 $103,250 $103,250 $6,866
7.05% Yr 2 -38.49% $89,821 $101,780 $7,175 $96,513 $100,000 $7,050 $106,606 $106,606 $7,516 Drastic loss
7.45% Yr 3 23.45% $101,603 $101,780 $7,583 $94,789 $100,000 $7,450 $110,070 $110,070 $8,200
7.85% Yr 4 12.78% $112,808 $112,808 $8,855 $93,078 $100,000 $7,850 $113,648 $113,648 $8,921
8.25% Yr 5 0.00% $110,833 $112,808 $9,307 $91,380 $100,000 $8,250 $117,341 $117,341 $9,681
8.65% Yr 6 13.41% $123,737 $123,737 $10,703 $89,695 $100,000 $8,650 $121,155 $121,155 $10,480
9.05% Yr 7 29.60% $140,132 $140,132 $12,682 $88,022 $100,000 $9,050 $125,092 $125,092 $11,321
9.45% Yr 8 11.39% $153,641 $153,641 $14,519 $86,362 $100,000 $9,450 $129,158 $129,158 $12,205
9.85% Yr 9 -0.73% $149,830 $153,641 $15,134 $84,714 $100,000 $9,850 $133,355 $133,355 $13,136
10.25% Yr 10 9.54% $161,464 $161,464 $16,550 $83,079 $100,000 $10,250 $137,689 $137,689 $14,113
10.25% Yr 11 19.42% $182,858 $182,858 $18,743 $81,456 $100,000 $10,250 $142,164 $142,164 $14,572
10.25% Yr 12 -6.24% $168,248 $182,858 $18,743 $79,845 $100,000 $10,250 $146,785 $146,785 $15,045
Hypothetical situation example does not reflect actual history. This example uses a variety of gross investment returns with 100% allocation to the Growth Account with hypothetical cap rates of 15%. Account value includes contract and GLWB fee deductions. Cap rates are assumed flat throughout the period.
Zone Income Annuity 13
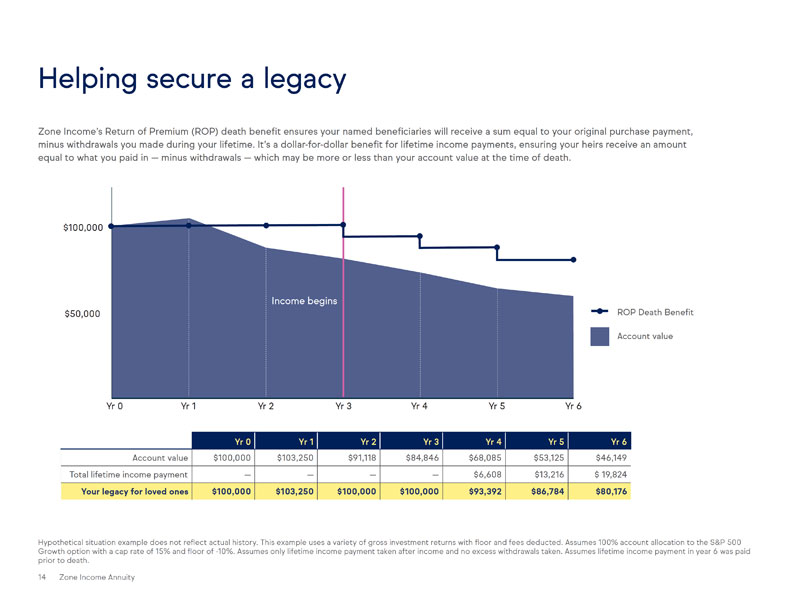
Helping secure a legacy
Zone Income’s Return of Premium (ROP) death benefi t ensures your named benefi ciaries will receive a sum equal to your original purchase payment, minus withdrawals you made during your lifetime. It’s a dollar-for-dollar benefi t for lifetime income payments, ensuring your heirs receive an amount equal to what you paid in — minus withdrawals — which may be more or less than your account value at the time of death.
$100,000
Income begins
$50,000
Yr 0 Yr 1 r 2 Yr 3 Yr 4 Yr 5 Yr 6
ROP Death Benefi t
Account value
Yr 0 Yr 1 Yr 2 Yr 3 Yr 4 Yr 5 Yr 6
Account value $100,000 $103,250 $91,118 $84,846 $68,085 $53,125 $46,149
Total lifetime income payment — — — — $6,608 $13,216 $ 19,824
Your legacy for loved ones $100,000 $103,250 $100,000 $100,000 $93,392 $86,784 $80,176
Hypothetical situation example does not refl ect actual history. This example uses a variety of gross investment returns with fl oor and fees deducted. Assumes 100% account allocation to the S&P 500 Growth option with a cap rate of 15% and fl oor of -10%. Assumes only lifetime income payment taken after income and no excess withdrawals taken. Assumes lifetime income payment in year 6 was paid prior to death.
14 Zone Income Annuity
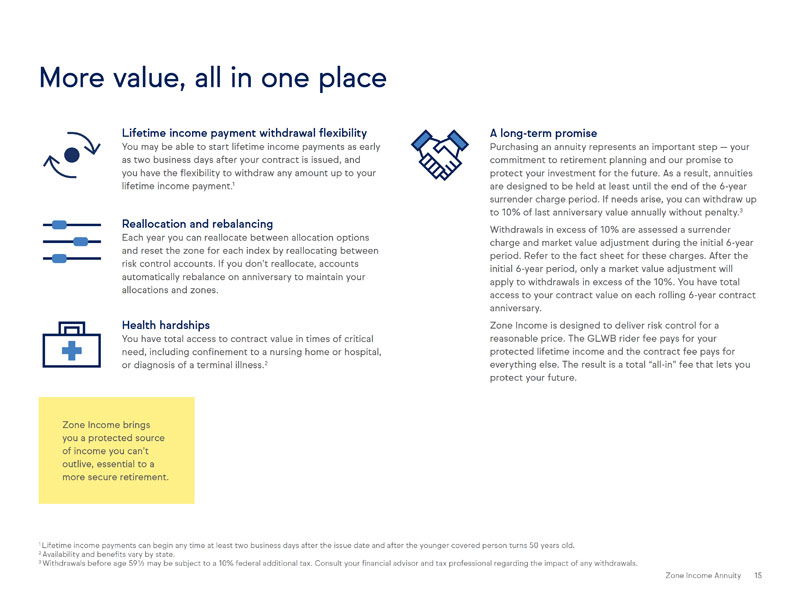
More value, all in one place
Lifetime income payment withdrawal flexibility
You may be able to start lifetime income payments as early as two business days after your contract is issued, and you have the flexibility to withdraw any amount up to your lifetime income payment.1
Reallocation and rebalancing
Each year you can reallocate between allocation options and reset the zone for each index by reallocating between risk control accounts. If you don’t reallocate, accounts automatically rebalance on anniversary to maintain your allocations and zones.
Health hardships
You have total access to contract value in times of critical need, including confinement to a nursing home or hospital, or diagnosis of a terminal illness.2
Zone Income brings you a protected source of income you can’t outlive, essential to a more secure retirement.
A long-term promise
Purchasing an annuity represents an important step — your commitment to retirement planning and our promise to protect your investment for the future. As a result, annuities are designed to be held at least until the end of the 6-year surrender charge period. If needs arise, you can withdraw up to 10% of last anniversary value annually without penalty.3
Withdrawals in excess of 10% are assessed a surrender charge and market value adjustment during the initial 6-year period. Refer to the fact sheet for these charges. After the initial 6-year period, only a market value adjustment will apply to withdrawals in excess of the 10%. You have total access to your contract value on each rolling 6-year contract anniversary.
Zone Income is designed to deliver risk control for a reasonable price. The GLWB rider fee pays for your protected lifetime income and the contract fee pays for everything else. The result is a total “all-in” fee that lets you protect your future.
1 Lifetime income payments can begin any time at least two business days after the issue date and after the younger covered person turns 50 years old.
2 Availability and benefits vary by state.
3 Withdrawals before age 59½ may be subject to a 10% federal additional tax. Consult your financial advisor and tax professional regarding the impact of any withdrawals.
Zone Income Annuity 15
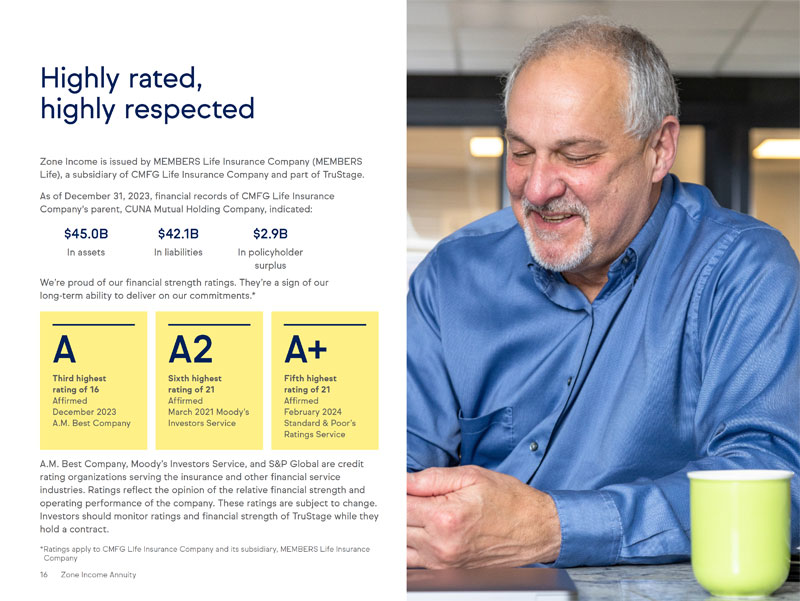
Highly rated, highly respected
Zone Income is issued by MEMBERS Life Insurance Company (MEMBERS Life), a subsidiary of CMFG Life Insurance Company and part of TruStage.
As of December 31, 2023, financial records of CMFG Life Insurance Company's parent, CUNA Mutual Holding Company, indicated:
$45.0B $42.1B $2.9B
In assets In liabilities In policyholder
surplus
We’re proud of our financial strength ratings. They’re a sign of our long-term ability to deliver on our commitments.*
A A2 A+
Third highest Sixth highest Fifth highest
rating of 16 rating of 21 rating of 21
Affirmed Affirmed Affirmed
December 2023 March 2021 Moody’s February 2024
A.M. Best Company Investors Service Standard & Poor’s
Ratings Service
A.M. Best Company, Moody’s Investors Service, and S&P Global are credit rating organizations serving the insurance and other financial service industries. Ratings reflect the opinion of the relative financial strength and operating performance of the company. These ratings are subject to change. Investors should monitor ratings and financial strength of TruStage while they hold a contract.
*Ratings apply to CMFG LIfe Insurance Company and its subsidiary, MEMBERS Life Insurance Company
16 Zone Income Annuity

To view the TruStage™ Zone Income Annuity prospectus please visit www.trustage.com/zone-income-pro

Not a deposit • Not guaranteed by any bank or credit union • May lose value • Not FDIC/NCUA insured • Not insured by any federal government agency
This brochure must be preceded or accompanied by a current prospectus and product brochure. Before investing, you should consider the annuity’s investment objectives, risks, charges and expenses. The prospectus contains this and other information. Please read it carefully. To obtain a prospectus, contact your advisor, log on to trustage.com/annuities, or call 888.888.3940.
Annuities are long-term insurance products designed for retirement purposes. Many registered annuities offer four main features: (1) a selection of investment options, (2) tax-deferred earnings accumulation, (3) guaranteed lifetime payout options, and (4) death benefit options.
This material is informational only and is not investment advice. If you need advice regarding your financial goals and investment needs, contact a financial advisor. All guarantees are backed by the claims-paying ability of MEMBERS Life Insurance Company (MEMBERS Life) and do not extend to the performance of the underlying accounts, which can fluctuate with changes in market conditions.
Annuity contract values, death benefits and other values fluctuate based on the performance of the investment options and may be worth more or less than your total purchase payment when surrendered. Withdrawals may be subject to surrender charges and may also be subject to a market value adjustment (MVA). The range of fees and charges includes a contract fee of 0.75%, GLWB rider fee of 1.00% and surrender charges which range from 0% to 8% during the initial 6-year period.
Hypothetical examples do not represent any specific annuity contract and may not be used to project or predict investment results. You may not invest directly in an index. Rate caps vary by index and by risk control account and can be adjusted annually on risk control account anniversary, subject to a minimum rate cap of 1% and a bailout provision. A bailout rate is set for each risk control account. If the rate cap for a given year is declared below that rate, you may withdraw value from that risk control account without surrender charge or MVA. You’ll have 30 days after your risk control account anniversary to make this withdrawal.
You may not invest directly in an index. Rate caps vary by index and by risk control account and can be adjusted annually on contract anniversary, subject to a minimum rate cap of 1% and a bailout provision. A bailout rate is set for each risk control account. If the rate cap for a given year is declared below that rate, you may withdraw value from that risk control account without surrender charge or MVA. You’ll have 30 days following contract anniversary to make this withdrawal.
There is no guarantee that the current indexes will be available during the entire time you own your contract. We reserve the right to add, delete or substitute an index. If we substitute an index, the performance of the new index may differ from the original index. This, in turn, may affect the performance of your risk control accounts. We will not substitute an index until approved by the insurance department in your state. We reserve the right to add or substitute a risk control account. We will notify you of any change in a risk control account or index in advance. Notification will be in your annual report unless timing of any such change would cause us to send notification prior to your contract anniversary.
Withdrawals of taxable amounts are subject to ordinary income tax, and if taken before age 59½ may be subject to a 10% federal additional tax. If you are considering purchasing an annuity as an IRA or other tax-qualified plan, you should consider benefits other than tax deferral since those plans already provide tax-deferred status. MEMBERS Life does not provide tax or legal advice. Contact a licensed professional.
The S&P 500 Index is a product of S&P Dow Jones Indices LLC (“SPDJI”) and has been licensed for use by CMFG Life Insurance Company (CMFG Life), the parent company of MEMBERS Life. Standard & Poor’s®, S&P® and S&P 500® are registered trademarks of Standard & Poor’s Financial Services LLC (“S&P”), and these trademarks have been licensed for use by SPDJI and sublicensed for certain purposes by CMFG Life. This product is not sponsored, endorsed, sold or promoted by SPDJI, S&P,
their respective affiliates, and none of such parties make any representation regarding the advisability of investing in this product nor do they have any liability for any errors, omissions or interruptions of the S&P 500 Index. The S&P 500 Index does not include dividends paid by the underlying companies.
This product is not sponsored, endorsed, issued, sold or promoted by MSCI, and MSCI bears no liability with respect to this product or any index on which it is based. The prospectus contains a more detailed description of the limited relationship MSCI has with TruStage and any related products.
Neither Barclays Bank PLC (“BB PLC”) nor any of its affiliates (collectively “Barclays”) is the issuer or producer of ZoneChoice and Barclays has no responsibilities, obligations or duties to investors in
ZoneChoice. The Barclays Risk Balanced Index (the “Index”), together with any Barclays indices that are components of the Index, is a trademark owned by Barclays and, together with any component indices and index data, is licensed for use by MEMBERS Life Insurance Company as the issuer or producer of ZoneChoice (the “Issuer”).
Barclays’ only relationship with the Issuer in respect of the Index is the licensing of the Index, which is administered, compiled and published by BB PLC in its role as the index sponsor (the “Index Sponsor”) without regard to the Issuer or the ZoneChoice or investors in the ZoneChoice. Additionally, MEMBERS Life Insurance Company as issuer or producer of ZoneChoice may for itself execute transaction(s) with Barclays in or relating to the Index in connection with ZoneChoice. Investors acquire ZoneChoice from MEMBERS Life Insurance Company and investors neither acquire any interest in the Index nor enter into any relationship of any kind whatsoever with Barclays upon making an investment in ZoneChoice. The ZoneChoice is not sponsored, endorsed, sold or promoted by Barclays and Barclays makes no representation regarding the advisability of the ZoneChoice or use of the Index or any data included therein. Barclays shall not be liable in any way to the Issuer, investors or to other third parties in respect of the use or accuracy of the Index or any data included therein.
The Dimensional US Small Cap Value Systematic Index (the “Index”) is sponsored and published by Dimensional Fund Advisors LP (“Dimensional”). References to Dimensional include its respective directors, officers, employees, representatives, delegates or agents. The use of “Dimensional” in the name of the Index and the related stylized mark(s) are service marks of Dimensional and have been licensed for use
by CMFG Life Insurance Company (“CMFG Life”). CMFG Life has entered into a license agreement with Dimensional providing for the right to use the Index and related trademarks in connection with the
TruStage™ ZoneChoiceAnnuity (the “Financial Product”). The Financial Product is not sponsored, endorsed, sold or promoted by Dimensional, and Dimensional makes no representation regarding the advisability of investing in such Financial Product. Dimensional has no responsibilities, obligations or duties to purchasers of the Financial Product, nor does Dimensional make any express or implied warranties, including, but
not limited to, any warranties of merchantability or fitness for a particular purpose or use with respect to the Index. Dimensional does not guarantee the accuracy, timeliness or completeness of the Index, or any data included therein or the calculation thereof or any communications with respect thereto. Dimensional has no liability for any errors, omissions or interruptions of the Index or in connection with its use. In no event shall Dimensional have any liability of whatever nature for any losses, damages, costs, claims and expenses (including any special, punitive, direct, indirect or consequential damages (including lost profits)) arising out of matters relating to the use of the Index, even if notified of the possibility of such damages. Dimensional has provided CMFG Life with all material information related to the Index methodology and the maintenance, operation and calculation of the Index. Dimensional makes no representation with respect to the completeness of information related to the Index provided by CMFG Life in connection with the offer or sale of any Financial Product. Dimensional has not published or approved this document, nor does Dimensional accept any responsibility for its contents or use.
TruStageTM Zone Income Annuity is issued by MEMBERS Life Insurance Company (MEMBERS Life) and distributed by their affiliate, CUNA Brokerage Services, Inc., member FINRA/SIPC, a registered broker/dealer. 2000 Heritage Way, Waverly, IA, 50677. Investment and insurance products are not federally insured, may involve investment risk, may lose value and are not obligations of or guaranteed by any depository or lending institution. All contracts and forms may vary by state and may not be available in all states or through all broker/dealers. ©TruStage
Base Policy Form: 2018-RILA, 2018-RILA-GLWBRDR, 2018-RILA(ID), 2023-RILA-GLWBRDR,
and 2023-RILA-DRAEND CZIA-3327331.10-1223-0126