UNITED STATES
SECURITIES AND EXCHANGE COMMISSION
Washington, D.C. 20549
FORM 10-K
(Mark One)
| x | ANNUAL REPORT PURSUANT TO SECTION 13 OR 15(d) OF THE SECURITIES EXCHANGE ACT OF 1934 |
For the fiscal year ended December 31, 2013
or
| ¨ | TRANSITION REPORT PURSUANT TO SECTION 13 OR 15(d) OF THE SECURITIES EXCHANGE ACT OF 1934 |
For the transition period from to ..
Commission File No. 001-36024
____________________________________
LIQUID HOLDINGS GROUP, INC.
(Exact Name of Registrant as Specified in its Charter)
| Delaware | | 46-3252142 |
(State or Other Jurisdiction of Incorporation or Organization) | | (I.R.S. Employer Identification No.) |
800 Third Avenue, 38th Floor
New York, New York 10022
(212) 293-1836
(Address and telephone number, including area code, of registrant’s principal executive offices)
Securities registered pursuant to Section 12(b) of the Act:
| Title of Each Class | | Name of Each Exchange on Which Registered |
| Common Stock, par value $.0001 per share | | The Nasdaq Stock Market LLC |
Securities registered pursuant to Section 12(g) of the Act:
None
____________________________________
Indicate by check mark if the registrant is a well-known seasoned issuer, as defined in Rule 405 of the Securities Act. Yes ¨ No x
Indicate by check mark if the registrant is not required to file reports pursuant to Section 13 or Section 15(d) of the Exchange Act. Yes ¨ No x
Indicate by check mark whether the registrant (1) has filed all reports required to be filed by Section 13 or 15(d) of the Securities Exchange Act of 1934 during the preceding 12 months (or for such shorter period that the registrant was required to file such reports), and (2) has been subject to such filing requirements for the past 90 days. Yes x No ¨
Indicate by check mark whether the registrant has submitted electronically and posted on its corporate Web site, if any, every Interactive Data File required to be submitted and posted pursuant to Rule 405 of Regulation S-T during the preceding 12 months (or for such shorter period that the registrant was required to submit and post such files). Yes x No ¨
Indicate by check mark if disclosure of delinquent filers pursuant to Item 405 of Regulation S-K is not contained herein, and will not be contained, to the best of registrant’s knowledge, in definitive proxy or information statements incorporated by reference in Part III of this Form 10-K or any amendment to this Form 10-K. ¨
Indicate by check mark whether the registrant is a large accelerated filer, an accelerated filer, a non-accelerated filer, or a smaller reporting company. See definitions of “large accelerated filer,” “accelerated filer” and “smaller reporting company” in Rule 12b-2 of the Exchange Act.
| Large accelerated filer | | ¨ | Accelerated filer | | ¨ |
| Non-accelerated filer | | ¨ (Do not check if a smaller reporting company) | Smaller reporting company | | x |
Indicate by check mark whether the registrant is a shell company (as defined in Rule 12b-2 of the Exchange Act). Yes ¨ No x
The aggregate market value of voting stock held by non-affiliates of the registrant on July 26, 2013 (including shares issued in connection with the registrant’s initial public offering), based on the closing price of $7.64 for shares of the registrant’s common stock on that date as reported by the NASDAQ Global Market, was approximately $55,833,594. The registrant has elected to use July 26, 2013, which was the initial trading date of the registrant’s common stock on the NASDAQ Global Market, as the calculation date because on June 30, 2013 (the last business day of the registrant’s most recently completed second fiscal quarter), the registrant was a privately-held company. In determining this figure, the registrant has assumed solely for this purpose that all of its directors, executive officers and persons beneficially owning 10% or more of the outstanding common stock may be considered to be affiliates. This assumption shall not be deemed conclusive as to affiliate status for this or any other purpose.
| Number of shares of common stock outstanding as of March 25, 2014 | 24,771,828 | |
Liquid Holdings Group, Inc.
Form 10-K
For the Fiscal Year Ended December 31, 2013
Table of Contents
| Part I | | |
| Item 1. | Business | 3 |
| Item 1A. | Risk Factors | 19 |
| Item 1B. | Unresolved Staff Comments | 42 |
| Item 2. | Properties | 42 |
| Item 3. | Legal Proceedings | 42 |
| Item 4. | Mine Safety Disclosure | 43 |
| | | |
| Part II | | |
| Item 5. | Market for the Registrant’s Common Equity, Related Stockholder Matters and Issuer Purchases of Equity Securities | 44 |
| Item 6. | Selected Financial Data | 49 |
| Item 7. | Management’s Discussion and Analysis of Financial Condition and Results of Operations | 51 |
| Item 7A. | Quantitative and Qualitative Disclosures About Market Risk | 72 |
| Item 8. | Financial Statements and Supplementary Data | 74 |
| Item 9. | Changes in and Disagreements with Accountants on Accounting and Financial Disclosure | 74 |
| Item 9A. | Controls and Procedures | 74 |
| Item 9B. | Other Information | 75 |
| | | |
| Part III | | |
| Item 10. | Directors, Executive Officers and Corporate Governance | 76 |
| Item 11. | Executive Compensation | 85 |
| Item 12. | Security Ownership of Certain Beneficial Owners and Management and Related Stockholder Matters | 88 |
| Item 13. | Certain Relationships and Related Party Transactions, and Director Independence | 91 |
| Item 14. | Principal Accountant Fees and Services | 95 |
| | | |
| Part IV | | |
| Item 15. | Exhibits, Financial Statement Schedules | 96 |
| Signatures | | 100 |
SPECIAL NOTE REGARDING FORWARD-LOOKING STATEMENTS
This Annual Report on Form 10-K contains forward-looking statements within the meaning of the federal securities laws. Statements that are not historical facts, including statements about our beliefs and expectations, are forward-looking statements. Forward-looking statements include statements preceded by, followed by or that include the words “will,” “may,” “could,” “would,” “should,” “believe,” “expect,” “anticipate,” “plan,” “estimate,” “target,” “project,” “intend,” “continue,” “potential,” and similar expressions. These statements include, among others, statements regarding our expected business outlook, anticipated financial and operating results, our business strategy and means to implement the strategy, our objectives, the amount and timing of investments by us in our business and capital expenditures, the likelihood of our success in expanding our business, financing plans, budgets, working capital needs and sources of liquidity, annual contract value and annual contract value per customer.
Forward-looking statements are not guarantees of performance. These statements are based on our beliefs and assumptions, which in turn are based on currently available information. Important assumptions relating to the forward-looking statements include, among others, assumptions regarding demand for and our ability to market our products and services, the expansion of product offerings through new applications or geographically, the timing and cost of investments by us in our business and planned capital expenditures, competitive conditions and general economic conditions. These assumptions could prove inaccurate. Forward-looking statements also involve known and unknown risks and uncertainties, which could cause actual results that differ materially from those contained in any forward-looking statement. Many of these factors are beyond our ability to control or predict. Such factors include, but are not limited to, the following:
| · | market acceptance and performance of our products and services; |
| · | our ability to obtain the capital necessary to expand our operations and invest in new products and services; |
| · | general economic conditions in the markets where we operate; |
| · | competition from firms with greater financial, technical and marketing resources than us and related competitive pressures; |
| · | failure to protect or enforce our intellectual property rights in our proprietary technology; |
| · | intellectual property claims and challenges; |
| · | defects and errors in our products or services; |
| · | growth and maintenance of our customer base and customer contracts; |
| · | credit quality and payment history of our customers; |
| · | changes in the market demand for our products and services; |
| · | our ability to keep up with rapid technological change; |
| · | system failures and disruptions; |
| · | non-performance of third-party vendors; |
| · | the loss of key executives and failure to recruit and retain qualified personnel; |
| · | the risks associated with the expansion of our business; |
| · | our possible inability to integrate any businesses we acquire; |
| · | compliance with laws and regulations, including those relating to the securities industry; |
| · | our ability to generate revenues by fulfilling customer contracts; and |
| · | other factors discussed in the section titled “Risk Factors” or elsewhere in this Annual Report on Form 10-K. |
We discuss these risks in greater detail in the section entitled “Risk Factors” and elsewhere in this Annual Report onForm 10-K.
Part I
Unless otherwise expressly stated or the context otherwise requires, the terms “we,” “us,” “our,” “Liquid Holdings Group,” and “Company,” refer to Liquid Holdings Group, Inc., in each case including its subsidiaries and predecessor and acquired entities.
Overview
Liquid Holdings Group, Inc. provides a next-generation proprietary cloud-based trading and portfolio management solution that seamlessly integrates order and execution management with real-time risk management, reporting, shadow accounting and managed services in a single platform for the financial services community. Our current and prospective customers include small to mid-sized hedge fund managers, asset managers, wealth management offices, family offices and financial institutions.
We deliver our technology efficiently, quickly and securely as a Software-as-a-Service, or “SaaS”, solution. The advanced feature set of our platform includes customizable and rapidly deployable multi-asset class trading software coupled with real-time risk management, shadow accounting and reporting capabilities.We believe that our platform’s comprehensive and integrated real-time approach provides a distinctive offering to our customers. We believe our approach creates efficiencies for our customers by reducing the number of service provider relationships the customer needs to manage and maintain and reducing the level of IT personnel necessary to support and integrate those multiple applications.
Liquid Holdings Group was founded to develop and provide a seamless securities trading and portfolio technology solution to meet a demonstrated need in the financial services community for real-time global market access, risk management and portfolio accounting and reporting services. During the financial crisis, with high rates of asset management redemptions and the unpredictable nature of financing markets, it was clear to the founders of our company that superior technology was needed to enable more informed decision making, manage risk better and provide broad access to liquidity in real-time. In addition, as a result of the Dodd-Frank Wall Street Reform and Consumer Protection Act, or Dodd-Frank Act, many financial institutions have exited or plan to exit proprietary trading, which has caused many traders to leave institutions to establish small to mid-sized funds. All of these funds require a cost effective technological solution to meet their trade execution, risk management and shadow accounting and reporting needs.
The acquisition of a controlling equity interest in Green Mountain Analytics, LLC (or “GMA”, now known as Liquid Technology Services, LLC) by Brian Ferdinand, the Vice Chairman of the Company’s Board of Directors and Head of Corporate Strategy and one of our founders, and Robert Keller, another one of our founders and a former member of our Board of Directors, provided the key element of our development as a technology company by establishing our trading technology and developing our shadow accounting, reporting and administration technologies. The acquisition of our risk management technology and its integration with our trading, shadow accounting, reporting and administration technologies gave us a comprehensive platform for our target market. Our cloud-based software platform utilizes a core technology framework shared among all of its components, which allows us to deliver an integrated, scalable and customizable subscription-based solution to participants in the financial services community.
We have been able to attract a seasoned executive management team and a Board of Directors with extensive industry experience. With our technology architecture and ability to scale to serve larger financial institutions, we believe Liquid Holdings Group has created the technology standard for trading, global risk management, and account management in terms of features, security, reliability, and cost for participants in the financial services community.
Our platform offers the following features and capabilities:
| · | A Single, Real-Time Consolidated Portfolio View. We offer a single trade, order and position management solution for multiple asset classes such as equities, options, futures, fixed income securities and foreign exchange markets (“FX”). Our customers can aggregate positions, exposures and risk metrics across all of their portfolios and asset classes on a single screen in real-time. With our platform there is no need to purchase or integrate several external programs to consolidate risk management, shadow accounting and reporting functions across asset classes; |
| · | Real-Time Portfolio Risk Management and Scenario Analysis. Our platform’s architecture enables our customers to perform highly complex computations of risk and project probabilistic scenarios using data feeds in real-time. This allows our customers to quantify the probability of portfolio risk based on variables that they input to simulate a macro or micro event based on historical market events. It also enables users to calculate theoretical values instantly for over a dozen historic market events and crashes to simulate portfolio performance in times of market volatility. Our platform automatically routes trade data to our risk management system for real-time analysis. We believe most of our competitors offer this type of analysis only on an end-of-day or as-requested basis; |
| · | Real-Time Shadow Accounting and Reporting Management, Fee Management, and Transaction Cost Analysis. Our shadow accounting and reporting database was designed to reconcile a vast number of trades and their associated fees and transaction costs, giving traders and managers a clear and concise view of their portfolio accounting, including exchange/ECN fees, “soft dollar” arrangements, and brokerage and accounting adjustments in real-time. Our flexible and scalable architecture allows traders, operations personnel and senior management to view customized reports on an individual, group or enterprise wide basis; |
| · | Broker, Execution and Clearing Firm Agnostic. We provide our customers with the independence to select their preferred broker execution venues and clearing relationships. Our technology is able to connect our customers seamlessly to multiple prime brokers and over 100 liquidity destinations, including broker-dealers, private alternative trading systems/platforms, or dark pools, and other electronic communication networks, or ECNs. We do not monetize, sell or take the opposing side of our customers’ order flow, nor do we act as a market maker. Our technology allows our customers to be “broker neutral” in their choice of where a trade is executed, how the trade is sent to the market and which broker executes and clears the trade. We have established connectivity with some of the most recognized prime brokers and banking platforms in the world, offering our customers the ability to access these relationships for capital introduction and execution services globally; and |
| · | Managed Services. We provide managed services supportfor all customers which includes comprehensive trade reconciliation, corporate actions and dividend processing as well as start of day/end of day file processing and delivery between third parties and their clients as part of our overall solution. We believe that these services reduce our customers’ need to hire operations staff. |
We have branded our trading platform as LiquidTradeSM, our risk metrics platform as LiquidMetrics®and our shadow accounting platform as LiquidViewSM, together constituting the Liquid platform.
We offer our cloud-based platform in two ways: through our direct sales force and through our strategic partner relationships. Direct sales are primarily focused on hedge funds and other asset managers who seek more effective and cost efficient trading and risk management solutions, robust technology and access to prime brokerage services. Institutional sales is focused on financial institutions seeking to reduce their technology, infrastructure, and support expenditure. Direct customer revenue is earned through subscription fees. Institutional revenue is earned through subscription fees, integration and customization fees, and hosting and gateway fees.
We believe that asset managers need a comprehensive, real-time and cost effective way to manage their portfolios, trading activity and investor relations and reporting needs. The economics for hedge funds and other asset managers who currently use perpetual licensed and disparate technology offerings create a market opportunity for us. We believe that the costs to license, maintain, and integrate technology for all but the largest funds are daunting due to complexity and interconnectivity of marketplaces, the increasing mix of asset classes to trade, the demand from investors for increased transparency, and ever-changing regulatory requirements.
Larger institutions are facing similar economic and regulatory pressures. Many large institutions are suffering from a decrease in trading volume, compressed commission margins, and technology sprawl due to new regulations and the need to connect and trade multiple asset classes. At the same time, we believe that technology budgets at large institutions are under pressure and many technology managers are being charged with reducing costs and headcount.
Because our platform can be securely delivered as a SaaS offering, the need for costly investment in infrastructure and connectivity can be significantly reduced or eliminated for both of these customer groups. In addition, our platform, by its already integrated nature, can obviate the need for additional support personnel, and the cadre of developers, project managers, and testers required for complex development and maintenance of integration software to tie together disparate technology offerings.
For the year ended December 31, 2013, we generated revenue of $4.8 million (of which $1.9 million related to over-the-counter brokerage operations which we ceased on June 1, 2013). As of December 31, 2013, we had 77 customers under contract (48 of which were generating GAAP revenue and the remainder of which had not yet generated GAAP revenue because the product had not yet been deployed) including proprietary traders, small to mid-sized hedge funds and risk managers utilizing an aggregate 656 units of our software product offerings (517 of which were for customers generating GAAP revenue). At that time, we had Annual Contract Value (“ACV”), representing the estimated value of subscription payments payable to us during the next twelve months (or, in the case of subscription contracts where the remaining contract term is less than twelve months, assuming no renewal of these contracts, then for the lesser remaining term of such contracts) pursuant to subscription contracts existing at December 31, 2013, of $4.520 million. See “Management’s Discussion and Analysis of Financial Condition and Results of Operations—Key Operating Metrics” for additional information regarding ACV. For the year ended December 31, 2013, we incurred a net loss of $46.6 million
Our Strengths
Our strengths include:
| · | State of the Art Technology. Our technology platform utilizes a state of the art flexible and scalable framework-based technology architecture that integrates order, trade, execution, real-time risk and portfolio management functions as well as shadow accounting and reporting software for multiple asset classes on a single cloud-based platform. We are in the process of phasing our platform onto MongoDB, a non-relational database. Our platform is highly customizable, allowing our customers to deploy our technology offerings individually or in any combination to match the use of our platform with their specific business processes and workflows, such as investment transparency. Additionally, we are in the process of optimizing our platform for the mobile environment; |
| · | Cross-Asset, Multi-Currency, Broker, Execution and Clearing Firm Agnostic Platform. We have designed a cross-asset, multi-currency, broker, execution and clearing firm agnostic platform providing our customers with access to over 100 sources of liquidity, including connectivity to top-tier investment banks and prime brokers. Using industry standard protocols, our platform has the ability, following basic certification procedures, to connect to any prime broker, exchange, dark pool or institution globally. We are able to efficiently integrate and interconnect our platform with the existing infrastructure of these institutions; |
| · | SaaS Delivery. We deliver our solution to customers using a SaaS delivery model. Our SaaS delivery model increases efficiency, reduces customer infrastructure costs and accelerates deployment. This enables our customers to deploy our platform to their end-users within days or even hours of our completing the sales cycle. Our SaaS delivery model enables us to realize and provide efficiencies and economies of scale in deploying and supporting our software.We use industry standard security and encryption and host our core software in secure, industry standard data centers. |
| · | Deep Domain Experience and Strong Development Team. Our development team has been together since inception and has an average tenure of 15 years in their respective disciplines. Liquid’s product management team average tenure is 10 years and has been involved in the development of applications for the buy-side as well as sell-side applications. |
| · | Strong and Experienced Management and Board of Directors. Our seasoned management team has decades of collective experience in delivering innovative technology platforms and offerings as well as working in the financial services community. Our senior management team includes the former Chairman and Chief Executive Officer of UBS Global Asset Management (Americas) Inc. and Marsh Inc., a former Partner and Managing Director of ECHOtrade, a high volume, 400-manager proprietary algorithmic trading firm and the Chairman of our Board of Directors is the former Global Head of the Principal Strategic Investments Group at Goldman Sachs; and |
| · | Continued Innovation Through Collaborative Product Development. The majority of the features in our platform have been designed in collaboration with existing and prospective customers based on their specific functionality requests. Recent examples of this collaborative development effort include the implementation of a new-order generation and modification toolset that improves the efficiency of aggressive order flow models and a complex volatility-surface algorithm engine used to power “Greek” inputs. |
Our Strategy
We position ourselves as a provider of cloud-based software solutions that integrate trading, real-time risk management, shadow accounting, reporting and administration tools for multiple asset classes on a single platform. We believe our unique software architecture allows us to deliver a comprehensive suite of products and services at a price point that is lower than that currently offered by our competitors for comparable products and services. The following are key elements of our strategy:
| · | Bringing a combination of an integrated technology platform, competitive pricing and efficient product delivery that is disruptive to the current marketplace; |
| · | Providing a superior product and an economical solution to underserved segments of the financial services community such as small to mid-sized hedge fund managers, asset managers, wealth management offices and family offices; |
| · | Teaming up with strategic partners such as Global Prime Partners and ConvergEx, as well as through our relationship with QuantX Management, LLP, f/k/a Liquid Trading Int’l LLP (collectively with its affiliates, “QuantX”), a related party as a result of certain past or present relationships with Brian Ferdinand, Robert Keller, Richard Schaeffer (one of our founders and a former Executive Chairman of our Board of Directors), Douglas J. Von Allmen (a holder of more than 5% of our common stock) and Michael Tew (a former consultant of the company), to augment the efforts of our internal sales team in distributing our technology; |
| · | Providing larger financial institutions with an attractive, cost-effective and integrated solution for internal use and use by their clients; |
| · | Growing our market share through internal development and selective acquisitions; |
| · | Extending our global reach by teaming with strategic partners to enter into additional international and developing markets in which we believe there will be demand for our products and services; and |
| · | Leveraging relationships with asset allocators to accelerate the distribution of our technology. |
Our Products and Services
Our proprietary cloud-based technology platform offers professionals in the financial services community a comprehensive, interactive solution for seamlessly integrating trading, real-time risk management, shadow accounting, reporting and administration tools. This platform allows our customers to automate and coordinate front-office trading functions, middle-office risk management and reporting functions, and back-office accounting functions. We believe our platform enables our customers to focus on core operations, to better monitor and manage investment performance and risk, to improve operating efficiency and to make more informed decisions and reduce operating costs. Our platform’s SaaS delivery allows our customers to deploy products to their employees and other end-users anywhere, anytime, which creates flexibility in how, when and where our technology can be used. Our product also offers a fully customizable interface that enables users to tailor the execution system to the local user environment.
Trading Technology. Our proprietary trading technology, LiquidTradeSM, is a cross-asset, multi-currency anonymous execution trading solution. It has connectivity to over 100 sources of liquidity, venues where buyers meet sellers, where bids and offers are provided and where trades are executed. This includes current connectivity with multiple prime brokers, multiple dark pools and market makers. Our trading technology enables a single trade, order, and position management solution for multiple asset classes such as equities, options, futures, fixed income securities and FX. It is designed to be broker, execution, and clearing firm agnostic, which allows our customers to choose any broker-dealer to execute and/or clear their trades.
Our trading technology provides extensive functionality and is accessible through a user-friendly and fully customizable interface. This customizable trader interface features dynamic window tabbing, custom visual filter alerts, user-created lists and symbol groups, window linking, extensive color and font selections, data refresh rate settings, alerts regarding securities that are difficult to borrow and multi sorting capabilities. Using a core framework for profiles and layouts, our trading technology provides traders the unique ability to access their saved elements from anywhere. Our proprietary sharing mechanism also enables instant circulation of trader-based objects across multiple users.
The trading technology’s blotter window, the screen a trader uses to manage positions, is a powerful tool with custom grouping, filtering and subtotaling capabilities for accurate real-time profit and loss (P&L), monitoring and risk management across multiple accounts and users. The blotter window enables our customers to review all positions and risk metrics in a combined format. There is no need for filters, add-ons, or external programs to consolidate risk or P&L positions. By allowing our customers to set custom grouping characteristics, both traders and managers can accurately gauge their true cumulative market exposure in real-time. In addition, traders can enter, view, and modify live orders across multiple accounts directly from the blotter window, providing them an efficient, centralized trade management mechanism. Our trading solution can be used on a standalone basis or as part of our fully integrated platform which includes our shadow accounting, reporting and risk management tools.
Risk Management Technology. Our proprietary risk management technology, LiquidMetrics®, was built and designed for continuous, on-demand risk management calculations. While most of our competitors’ solutions generally only offer this type of analysis on an end-of-day or as-requested basis, our technology is designed to perform highly complex computations of risk and project probabilistic scenarios in real-time. Our risk management solution’s capabilities include end-to-end risk, portfolio, and volatility management as well as value-at-risk stress and scenario tests. This technology enables users to calculate theoretical values instantly for over a dozen historic market shocks and crashes in order to simulate portfolio performance in times of market volatility. It also allows our customers to quantify the probability of portfolio risk based on variables that they input to simulate a macro or micro event based on historical market events. Our risk management technology can be used on a standalone basis or as part of our fully integrated platform which includes our trading, shadow accounting, reporting and administration tools.
Shadow Accounting and Reporting Technology. Our proprietary shadow accounting, reporting, fee management and transaction cost analysis database, LiquidViewSM, is designed to reconcile vast amounts of trades and their associated fees in real-time. The database gives traders and managers a transparent and concise view of their portfolio accounting, including exchange/ECN fees, “soft dollar” arrangements, brokerage and accounting adjustments. Its multi-platform delivery capability to platforms such as Windows, Mac, iPad, iPhone, and Android provides our customers with significant flexibility. Our shadow accounting and reporting technology can be used on a standalone basis or as part of our fully integrated platform which includes our trading and risk management tools.
Customer Support. We offer full-time multi-tier support services to all of our customers to assist in the successful implementation of our platform and to optimize our customers’ use of our platform during the terms of their subscription contracts. Our internal logging system tracks requests for support from the time they are reported through their resolution, ensuring quality and consistency of service. We utilize remote access, system diagnostic and network traffic analyzing tools to quickly pinpoint and resolve support requests allowing our staff to diagnose issues remotely and economically. On an ongoing and as-needed basis, we plan to expand and update our technical support documentation using manuals, online videos and FAQ/Wiki pages. Typical methods of communication from and to customers include: traditional voice (telephone) as well as instant messaging (IM), email, text (SMS) messages, and broadcast messages within the software. Once we are notified of a support issue, it is logged into our tracking system and assigned a severity level. Efficient resolution is accomplished by routing workflow through “tiers” of support. If a timely resolution to an issue cannot be reached, it is escalated to the next Tier. Tier 1 Support Staff constantly monitor phone, email and IM for any incoming requests. Upon discovery or notification, all incidents and bugs are entered into our internal management tracking tool and routed to the correct department for resolution. If a support issue cannot be resolved within the Tier 1 parameters, it will be escalated to Tier 2 or Tier 3 to more experienced and senior staff for notification and resolution. Once a particular trader’s operation is impacted to a greater level of severity, an escalation process is implemented and senior management at the Company are immediately notified and kept informed regarding problems and time-to-resolution estimates.
Broker-dealers and Independent Introducing Broker. Liquid Prime Services Inc. (“LPS”), our U.S. broker dealer and independent introducing broker, and Liquid Trading Institutional, our U.K. brokerage company, enable us to facilitate ancillary execution services for our customers as a derivative of our technology business, which may allow us to leverage our institutional relationships by providing agency or introductory brokerage services in order to pass on savings for execution services through lower commission rates to our customers. These entities do not handle customer funds or provide clearing services. They do not risk our capital or participate in any proprietary trading ventures. They are, however, generally required to indemnify the clearing firms and prime brokers for certain liabilities arising from our customers’ failure to satisfy their obligations to the clearing firms and prime brokers, where we have made the introduction.
On June 1, 2013 we ceased over-the-counter brokerage operations for LPS and Liquid Futures, LLC (“Futures”) (the entity that then operated as an independent introducing broker and which has since been merged with and into LPS). Going forward, LPS will continue to be a component of our business strategy by facilitating the introduction of customer assets to custody banking relationships. LPS will remain a regulated entity with oversight from the Financial Industry Regulatory Authority, Inc. (“FINRA”), the U.S. Securities and Exchange Commission (the “SEC”), the National Futures Association (the “NFA”), and the U.S. Commodity Futures Trading Commission (the “CFTC”). We do not expect the cessation of the over-the-counter brokerage operations of LPS to impact our ability to facilitate the introduction of customer assets to custody banking relationships. As a complementary service provider to our technology platform customers, LPS will no longer generate any significant transaction or other revenue, but will continue to incur salary, regulatory, accounting, legal and administrative expenses.
Our Technology
We believe that our cloud-based platform provides a real-time intuitive and customizable solution that facilitates high levels of adoption with limited need for training. Our technology platform is developed in a proprietary manner, with its core written in Java, a widely used programming language.We are in the process of phasing our platform onto a non-relational database called MongoDB.We have designed our cloud-based platform with a thin-client architecture, which does not require our customers to install large, complex software on their own computers and is accessible via a standard web browser, providing powerful and secure capabilities in an enterprise solution. Our proprietary technology platform stores all of our customers’ trading information for analytics. Our infrastructure is sound, with several layers of redundancy built into both the software and our network. By utilizing Equinix, a carrier neutral data center, we believe that we provide our customers with low latency and optimized connectivity. We use industry standard security and encryption and host our core software in secure, industry standard data centers. These data centers are the principal data centers for a very large percentage of the financial institutions and vendors serving the financial services sector. All connectivity between data centers and offices has multiple geographically diverse pathways provided by different carriers to reduce specific vendor risk.
Trading. The core technology of our trading platform, LiquidTradeSM, is comprised of a framework that offers an application programming interface, or API, for accessing components and services. Strong adherence to modern programming paradigms and use of patterns make the framework very flexible and provide a host of deployment options. Most of the services can reside on different machines. Our trading technology also offers a unique and flexible architecture built around loosely coupled services and set on an easily expandable core infrastructure. Since our trading technology is data provider neutral, the interface exposed by the services allows applications to request specific data regardless of the provider. An example of such a service is our Quote Management System, which can be powered by a number of plug-ins for different data vendors at the same time.
Our trading technology can also accept order generation via automated trading strategies through its exposed API, and is capable of receiving reports for executions done on another venue. This feature allows traders the ability to both automate their order flow, and also monitor, manage, and exit their positions with all the benefits of a “screen based” platform. These features are especially useful for a growing segment in the marketplace where the speed and sophistication of automation is essential, but powerful tools for portfolio and position management are also critical.
Some of the application features include:
| · | multiple brokers and multiple accounts capabilities; |
| · | real-time analytics and P&L with various filtering and grouping displays; |
| · | advanced order types and simulated order types; |
| · | basket trading and symbol grouping; |
| · | powerful user management with levels of access, subordination and cross-accounts monitoring; and |
| · | profile management system with sharing capabilities. |
Risk Management. Our risk management platform, LiquidMetrics®, extrapolates data from the core database and channels that data into our risk management mechanism which provides real-time income statement, fund performance, stress testing and risk analysis in a user-friendly format. These reports are calculated on a five second time delay, and output is generated in a portable document. The intuitive interface and output mechanism make this additional layer of risk management a useful tool for our customers, particularly due to its intuitive interface and output mechanism. These reports can be distributed several ways, including automated email attachment, mobile (iPad, iPhone and Android devices) and web-based HTML5 format.
Shadow Accounting and Reporting. The integrated database of our shadow accounting and reporting platform, LiquidViewSM, incorporates a proprietary solution for monitoring trade data, reconciling accounts, trades, and income statement management. This administrative technology aggregates trade data across brokers, clearing firms and accounts into a reporting format for administration and shadow accounting, in real-time. These reports can also be distributed several ways, including automated email attachment, mobile (iPad, iPhone and Android devices) and web-based HTML5 format.
Research and Development
The responsibilities of our research and development department include product management, product development, quality assurance and technology operations. Our research and development department is located primarily in our Aventura, Florida office, supported by developers operating on a contract basis located in Romania, India, the United States and the United Kingdom.
Parts of our core software technology were developed by entities which we acquired. Our team has integrated these technologies into one integrated, cloud-based platform, creating a differentiated solution for our customers. To achieve optimal performance from our systems, we are continuously rewriting and upgrading our software. Use of the latest technology not only improves our performance but also helps us attract and retain talented developers. We are continuously refining our automated and integrated, real-time systems for trading, risk management, shadow accounting, reporting and administration. In addition, we supplement our own research and development by using third-party service providers to perform certain research and development projects. We retain all intellectual property rights to any technology developed by our third-party service providers. The standards and policies of our research and development department set firm guidelines for build development, and ensure not only high reliability and performance, but also future scalability. As of December 31, 2013, we had five full-time employees in research and development, supported by 24 third-party contractors. During the year ended December 31, 2013 and the period from April 24, 2012 to December 31, 2012, we spent approximately $1,750,000 and $319,000, respectively, on company-sponsored research and development activities.We rely significantly on approximately 20 contractors located in Romania under an exclusive arrangement for programming for new product builds and we intend to expand this relationship in the future.
Customers
Our current and prospective customers are primarily small to mid-sized hedge fund managers, asset managers, wealth management offices, family offices and financial institutions. Our technology platform is available to our customers via subscription as an integrated platform or customers can subscribe to individual products. As of December 31, 2013, we had 77 customers under contract (48 of which were generating GAAP revenue and the remainder of which had not yet generated GAAP revenue because the product had not yet been deployed) including proprietary traders, small to mid-sized hedge funds and risk managers utilizing an aggregate 656 units of our software product offerings (517 of which were for customers generating GAAP revenue). Each unit represents an individual element of the Liquid platform such as LiquidMetrics®, LiquidTradeSM or LiquidViewSM. While our initial customers contracted on a month-to-month basis, our typical customer contract now has a one-year term, billed monthly and renewing automatically for successive one-year terms, unless notice of termination is given at least 60 days prior to the contract’s expiration date. Our customers are, based on their respective billing addresses, located in the United States and Europe, with U.S. customers representing 53% of our total revenue and customers outside of the United States (primarily QuantX) representing 47% of our total revenue for the year ended December 31, 2013. During this same period, a single customer, QuantX, a related party as a result of certain past or present relationships with Messrs. Ferdinand, Keller, Schaeffer, Von Allmen and Tew, represented 44% of our total revenues and 72% of our software services revenues. In addition, for the year ended December 31, 2013, all related parties, including QuantX, represented 51% of total revenues and 83% of our software services revenues.
Sales and Marketing
We offer our platform through our direct sales force primarily to hedge fund managers, asset managers, and wealth management offices, who generally seek more effective and cost efficient trading, risk management, shadow accounting and reporting solutions with robust execution and access to prime brokerage services. We also offer to hedge funds and larger broker-dealers seeking to reduce their technology and infrastructure costs by outsourcing software development related to trade execution, risk management, and shadow accounting and reporting both internally and to their customers.
We also seek to develop strategic partner relationships to expand our ability to reach our target markets. We have initiated two such relationships, one with Global Prime Partners, Ltd., a London-based prime broker; the other with ConvergEx Prime Services, LLC, a New York-based prime broker. We plan to deepen these relationships as part of our sales efforts, as well as enter into additional strategic partnerships as the opportunity presents itself.
We develop sales pipelines and enhance brand awareness through our marketing initiatives. Our marketing programs target industry executives, technology professionals and senior business leaders. Our principal marketing initiatives include: lead identification, conference attendance and networking events, direct sales through industry contacts, partnerships, joint marketing efforts, white papers and leveraging our strong relationships with third party asset allocators.
As of December 31, 2013, we had thirteen employees in sales and marketing. We intend to continue to invest in our sales and marketing function to drive long-term growth. Our sales team is organized with staff in our New York office and remotely in California, Massachusetts and Texas. Our senior management contributes significantly to the sales effort because of their knowledge of the Company’s product and services offerings and their extensive network in the target customer bases.
Competition
The software and services market for asset management and financial institutions software is a fragmented, highly competitive and rapidly evolving space. This market is subject to changing technology, shifting customer needs and frequent introductions of new products and services. Competitors vary in size, scope of services offered and geographic presence.
There are three categories where we face significant competition:
| · | Trading Technology: Since we support multiple asset classes, we compete with numerous technology vendors who provide order and execution management software. These include The Abernathy MacGregor Group, Bloomberg L.P., The Bank of New York Mellon Corporation, or BNY Mellon, Charles River Systems, Inc., Eze Castle Software, Inc., Fidessa Group PLC, ION Trading, Inc., Investment Technology Group, Inc., or ITG, LineData Services S.A., Orc Software Inc., RealTick LLC, RediPlus, NeoVest, Inc., SunGard Data Systems Inc., or SunGard, and Trading Technologies International, Inc. |
| · | Accounting and Administration: Due to the comprehensive nature of our post-trade services, we compete with several major and small administrators that provide accounting and administration software and services, including BNY Mellon, The Citco Group Limited, Cogency Software, Inc., Northern Trust Corp., SEI Investments Co., SS&C Technologies Holdings, Inc., or SS&C, State Street Corporation, Fortis Bank NV/SA and BAML Capital Access Funds. |
| · | Risk and Portfolio Management Solutions: There are numerous risk management solutions software providers in the market. We compete with Calypso Technology, Inc., ConceptONE LLC, Investor Analytics LLC, Imagine Software Inc., Numerix LLC, OminHedge (a product of Delta Hedge Systems), Statpro Group plc, Risk Metrics and Barra (products of MSCI Inc.), Thomson Reuters and a number of smaller consulting firms providing risk management and risk monitoring services. |
In addition to technology companies, we also compete against certain broker-dealers who provide trading software similar to ours. These competitors include BTIG LLC, Goldman, Sachs & Co., Interactive Brokers LLC, Jones Trading Institutional Services LLC, Lightspeed Financial, Inc. through its Lightspeed Trader platform and Wells Fargo Securities, Inc. through its Merlin Securities business. We also compete with full services (suite) providers such as Advent Software, Inc., Agio International Company, LTD, Athena Investment Systems LLC, Asset Control Systems Inc., Hazel Tree Fund Services, LLC, MIK Group, Misys-Sophis, Nirvana Financial Solutions, Investcloud LLC, Paladyne Systems Inc., Saxis Group, LLC and Sungard through its Hedge360 service, SS&C.
We believe we compete favorably in each of these areas based on our cloud-based platform, comprehensive approach, ease of use, scalability and flexibility, integration, security, reliability, liquidity available through the platform, speed of execution, asset class coverage and risk management capabilities. We also believe our broker, execution and clearing firm neutrality is attractive to many prospective customers. We believe our ability to offer customers a single integrated platform to access all the above mentioned services desired by participants in the financial services community is an important competitive advantage. Our competitive position is also bolstered by the breadth of workflow functionalities we offer across the entire transaction lifecycle, including pre-trade, trade and post-trade services.
Intellectual Property
To protect our integrated technology platform and our products, we rely primarily on patent, trademark, copyright and trade secret law. We have filed an omnibus utility patent application with the U.S. Patent and Trademark Office, or USPTO, directed to our integrated technology platform with trade execution, risk management, shadow accounting and reporting capabilities. To date, no patent has issued under this application and it is being pursued by us in the USPTO. We have not been issued any other patents covering our technology platform or filed other patent applications that are currently pending. We have registered Liquid Holdings Group®, LiquidMetrics® and LiquidViewSM as service marks with the USPTO and are pursuing additional service mark opportunities. We have developed and own proprietary software to operate our integrated technology platform that is protected under copyright law and trade secret law and have also licensed certain commercially available software.
As part of our strategy to protect our proprietary technologies and products and our intellectual property rights from unauthorized parties that may attempt to copy aspects of our products or obtain and use our trade secrets or other confidential information, we generally enter into confidentiality agreements with our employees, consultants and end-user customers, and generally limit access to and the right to use and distribute our proprietary information and proprietary technology.
“LiquidTrade,” “LiquidMetrics” and “LiquidView” are trademarks and service marks of Liquid Holdings Group, Inc. This reports also contains trademarks, service marks and tradenames of other companies.
Regulation
Our securities and futures businesses are subject to substantial regulation by U.S. federal and state regulatory agencies and derivatives, futures and securities exchanges and self-regulatory organizations, which can result in, among other things, substantial compliance costs. There are a number of proposals pending before federal, state, and foreign legislative and regulatory bodies (including changes in interpretation or enforcement) that could subject some or all of our businesses to increased regulation and/or additional regulatory and/or compliance costs.
These existing and proposed laws and regulations can be costly to comply with and can increase our operating costs, require significant management time and attention, and subject us to claims or other remedies, including fines or demands that we modify or cease existing business practices. Additionally, their constant fluctuation also presents us with certain uncertainties as to whether we may be exempted or may otherwise seek certain safe harbors from these regulations. As a global service provider to participants in the financial markets, to the extent that different regulatory regimes impose inconsistent or iterative requirements on the conduct of our business, we will face complexity and additional costs in our compliance efforts.
With respect to our technology business, we provide passive communication technology to our customers, such as money managers, hedge funds, and broker-dealers (who, in the instance of a broker-dealer, include the customers of the broker-dealer that are the ultimate end user). The technology provides these customers with the independence to select their preferred broker execution venues, prime broker and clearing relationships on a trade-by-trade basis. Our technology has the ability to connect our customers to multiple prime brokers and liquidity destinations via broker-dealers, including broker-dealers, private alternative trading systems/platforms, or dark pools, and other electronic communication networks, or ECNs.
Our passive communication technology allows our customers to be “broker neutral” in their choice of where a trade is executed, how it is sent to a market center, who executes and clears the trade, and who provides financing for a trade (if applicable), as well as who carries the position for the customer after a trade has settled. Consequently, while our technology permits customers to transmit trade specifics to broker-dealers, the technology does not have any part, or role, in the structure or execution of securities transactions/trades, nor does our technology regulate the manner in which customers select whom to enter into such transactions with or any of the terms of those transactions. Thus, our passive communication technology does not perform any brokerage functions for customers, but merely provides a platform or forum for third party broker-dealers and customers to communicate with each other, at their sole discretion and initiation, regarding potential securities transactions between the parties.
In this regard, our passive communication technology is not involved in the taking of orders for opening, closing, administration or other maintenance of brokerage accounts, the solicitation, processing or facilitation of securities transactions, the purchase or sale of securities, the matching of bids to purchase and sell securities, or otherwise effecting securities transactions in securities or route orders among broker-dealers through the establishment of system priorities and we do not otherwise automate order flow among broker-dealers. Our passive communication technology does not enable us to provide or arrange credit/financing to customers. Our technology does not permit us to participate or oversee the sale or purchase of securities nor does it permit us to establish the parameters for any such transaction or trade. In addition, our passive communication technology does not cause us to have access to or handle customer funds or securities, recommend or endorse specific securities or otherwise, directly or indirectly, make any statement about, or endorsement or recommendation of any kind of, any broker-dealer to any customer, or otherwise become involved (other than by routing or communicating messages) with the financial services offered by broker-dealers.
Moreover, we do not receive compensation for the operation of our passive communication technology that is based, directly or indirectly, on the size, value, or occurrence of securities transactions (nor does our compensation for the operation of our technology vary depending on whether an order results in an executed trade), and our technology does not facilitate the sharing or splitting of commissions by participating broker-dealers, nor does it acquire, store, or report information with respect to such activity. While we have broker-dealer subsidiaries that use our passive communication technology, we do not conduct our passive communication technology business in or through our regulated broker-dealers.
Overview of U.S. Regulation
Our wholly owned subsidiary LPS is subject to the rules and regulations of the Securities and Exchange Act of 1934 and rules promulgated there under by the SEC, as well as the laws, rules and regulations of certain states. As an independent introducing broker, LPS is also subject to the Commodity Exchange Act (the “CEA”) and rules promulgated thereunder by the CFTC. Additionally, LPS is subject to the requirements of FINRA and the NFA as self-regulatory organizations with respect to its broker-dealer and introducing broker activities, respectively. Our foreign subsidiary Liquid Trading Institutional LLP is similarly regulated under the laws and institutional framework of the United Kingdom.
U.S. broker-dealers and introducing brokers are generally subject to laws, rules and regulations that cover all aspects of the securities and derivatives business, including:
| · | Sales methods and trade practices; |
| · | Use and safekeeping of customers’ funds and securities; |
| · | Capital structure and use of margin; |
| · | Privacy of confidential customer information; |
| · | Financing of customers’ purchases; |
| · | Conduct of directors, officers, and other employees; and |
| · | Periodic audits of brokerage firms for adherence to the foregoing. |
In addition, the businesses that we may conduct are limited by our agreements with FINRA and NFA. These self-regulatory organizations examine their members’ entry into new businesses, and each requires advance notice and, in most circumstances, an application to be filed and approved before the Company’s business operations can be expanded. This process can be time-consuming, costly, and may not be successful. Likewise, participation in new business lines, including trading of new products or participation on new exchanges or in new countries often requires governmental and/or exchange approvals, which may take significant time and resources. As a result, we may be prevented from entering new businesses that may be profitable in a timely manner, or at all.
Broker-Dealer Regulation
LPS is registered as a broker-dealer with the SEC and in the states of California, Connecticut, Illinois, Massachusetts and New York and is a member of FINRA (CRD # 127818), with FINRA serving as its designated examining authority, or DEA. Broker-dealers are subject to regulations covering all aspects of the securities business, including sales and trading practices, public offerings, publication of research reports, use of customers’ funds and securities, capital structure, record keeping and the conduct of directors, managers, officers and employees, and are also regulated by securities administrators in those states where they do business. Violations of regulations governing a broker-dealer’s actions could result in censure, fine, the issuance of cease-and-desist orders, the suspension or expulsion from the securities industry of a broker-dealer or its officers or employees, or other similar consequences.
LPS is also subject to FINRA approval with respect to changes in the broker-dealer’s equity ownership that results in one person or entity, directly or indirectly, owning or controlling 25% or more of such equity ownership. Such FINRA approval would be triggered upon a change in the indirect ownership at the 25% or greater level occurring with respect to LPS whether or not there is a change in beneficial ownership or control, such as through the imposition of a new intermediate holding company of the broker-dealer. As a result of these regulations, our future efforts to sell shares or raise additional capital may be delayed or prohibited by FINRA. FINRA approval would also be required with respect to the direct or indirect acquisitions or transfers of 25% or more in the aggregate of the broker-dealer’s assets or any asset, business or line of operations that generates revenues comprising 25% or more in the aggregate of the broker-dealer’s earnings measured on a rolling 36-month basis. In addition, FINRA approval would be required in respect of any “material change in business operations” by LPS, including but not limited to, acting as an underwriter or market maker, or engaging in a new business activity that would require LPS to maintain a higher minimum level of net capital under the SEC’s net capital rule. In addition, increasing the number of offices or registered personnel in any one-year period could constitute a “material change in operations” that could require FINRA approval.
LPS is subject to “early warning” notifications to the SEC, FINRA and certain states in the event that its net capital falls below certain levels, or it fails to maintain required books and records, or it becomes subject to a material inadequacy or weakness in its financial reporting, among other things. In addition, LPS could become subject to risk assessment reporting to the SEC that would require it to disclose certain ownership positions and other information with respect to certain of its affiliates.
The foregoing is not intended to represent an exhaustive discussion of the extensive broker-dealer regulation to which LPS is subject, but rather is intended to highlight certain regulatory issues that could, or would, impact LPS.
The Dodd-Frank Act
The enactment of the Dodd-Frank Act also introduced regulatory uncertainty that may impact LPS’s business and result in additional regulation by the CFTC, the SEC, FINRA, NFA, and other regulatory organizations. The legislation calls for the imposition of expanded standards of care by market participants in dealing with clients and customers, including providing the SEC with authority to adopt rules establishing fiduciary duties for broker-dealers and directing the SEC to examine and improve sales practices and disclosure by broker-dealers. The Dodd-Frank Act also contains provisions designed to increase transparency in over-the-counter derivatives markets, including requiring the registration of all swap dealers and security-based swap dealers, and the clearing and execution of swaps through regulated facilities (subject to limited exceptions, including swaps with non-financial end-users and swaps that are not cleared by a clearing agency), in accordance with CFTC and SEC rulemaking.
The implications of the Dodd-Frank Act on our businesses will depend to a large extent on the final rules that will be adopted by the Federal Reserve Board, the Federal Deposit Insurance Corporation, the SEC, the CFTC and other agencies to implement the legislation, as well as the development of market practices and structures under the regime established by the legislation and the implementing rules. Similar reforms are being considered by other regulators and policy makers worldwide. LPS does not currently trade in swaps or security swaps to an extent that would require further registration and regulation under the Dodd-Frank Act. Although the implications of the Dodd-Frank Act on us are currently limited, we will continue to assess our business, risk management, and compliance practices to conform to developments in the regulatory environment.
Sarbanes Oxley Act of 2002
As a public company, we are subject to the requirements of the Sarbanes-Oxley Act. We expect that we will need to incur significant expenditures in the near term to continue to develop systems and hire and train personnel to comply with the requirements associated with the Sarbanes-Oxley Act.
Foreign Regulation
Our international subsidiaries are subject to regulation in the various jurisdictions where they have operations. The most significant of our international subsidiaries is Liquid Trading Institutional LLP, registered to do business in the U.K. as a brokerage company. As with those U.S. subsidiaries subject to applicable rules, the ability of Liquid Trading Institutional, which is regulated by the U.K. Financial Conduct Authority (the “FCA”), to pay dividends or make capital distributions may be impaired due to applicable capital requirements. Liquid Trading Institutional is also subject to regulations regarding changes in control. Under the rules and regulations of the FCA, regulated entities must obtain prior approval for any transaction resulting in a change in control of a regulated entity, with control being broadly defined by the FCA as a 10% interest in the regulated entity or its parent or otherwise exercising significant influence over the management of the regulated entity. As a result of these regulations, our future efforts to sell shares or raise additional capital may be delayed or prohibited by the FCA.
Over-the-Counter Derivatives, Central Counterparties and Trade Repositories
In September 2010, the European Commission adopted new rules relating to over-the-counter derivatives, central counterparties and trade repositories. The new rules introduce a reporting obligation for over-the-counter derivatives, a clearing obligation for eligible over-the-counter derivatives, measures to reduce counterparty credit and operation risk for bilateral over-the-counter derivatives, common rules for central counterparties, and for trade repositories, and rules on the establishment of interoperability between central counterparties.
Formation and Form of Organization
Liquid Holdings Group, Inc. was formed as a Delaware limited liability company, Liquid Holdings Group, LLC, on January 17, 2012. In connection with our initial public offering, we converted to a Delaware corporation on July 24, 2013.
Employees
As of December 31, 2013, we had a total of 48 full-time employees supported by 24 full-time developers at our third-party service providers. None of our employees are covered by collective bargaining agreements. We consider our employee relations to be good.
Certain factors may have a material adverse effect on our business, financial condition and results of operations. Investors should carefully consider the risks and uncertainties described below, together with all of the other information contained in this Annual Report on Form 10-K and other reports we file with the Securities and Exchange Commission pursuant to the Securities Exchange Act of 1934, as amended, including our historical and condensed consolidated financial statements and related notes. The risks and uncertainties described below are not the only ones we face. Additional risks and uncertainties that we are unaware of, or that we currently believe are not material, may also become important factors that adversely affect our business. If any of the following risks or uncertainties actually occurs, our business, financial condition, results of operations, liquidity, cash flows and prospects could be materially and adversely affected. As a result, the price of our common stock could decline significantly and an investor could lose all or part of its investment in our common stock. The risks discussed below include forward-looking statements, and our actual results may differ substantially from those discussed in these forward-looking statements.
Risk Related to Our Business and Our Industry
We have a very limited operating history, which makes it difficult to evaluate our current business and future prospects, and may substantially increase the risk of an investment in our common stock.
We were formed on January 17, 2012 and commenced operations on April 24, 2012. We have a very limited history of selling our products and services to third parties. Our limited operating history makes it difficult to evaluate our business and future prospects. This difficulty may be further exacerbated by the limited historical financial information and other financial and operating data available with respect to our business. Among other things, our historical financial statements primarily reflect our start-up operations, and may not be reflective of our business going forward. We have encountered and will continue to encounter risks and difficulties frequently experienced by new and rapidly growing companies in evolving industries, including the risks described in this Annual Report on Form 10-K and in other reports we file with the Securities and Exchange Commission pursuant to the Securities Exchange Act of 1934, as amended. If we do not address and manage these risks successfully, our business could be materially and adversely affected and our stock price could decline significantly.
We have generated very little revenue and have experienced significant net losses and negative cash flows from operations to date, and may not be able to generate meaningful revenue, operate profitably or generate positive cash flows on a consistent basis or at all.
We have generated very little revenue to date. From April 24, 2012, the date on which we commenced operations, through December 31, 2012, we generated revenue of $2.3 million (of which $1.3 million related to the over-the-counter brokerage operations of certain of our subsidiaries which we ceased on June 1, 2013 and only $1.0 million related to software subscription fees, which included revenue of $365,606 related to messaging services which we terminated on December 31, 2012), incurred a net loss of $38.2 million and had negative cash flows from operations of $6.4 million. For the year ended December 31, 2013, we generated revenue of $4.8 million (of which $1.9 million related to over-the-counter brokerage operations), incurred a net loss of $46.6 million and had negative cash flows from operations of $13.9 million. Our total revenues decreased from approximately $1.4 million in the second quarter of 2013 to approximately $0.7 million in the third quarter of 2013. We had revenues of approximately $0.9 million in the fourth quarter of 2013. During the second quarter of 2013, we exited the over-the-counter brokerage business and, as a result, recognized no brokerage revenue during the six months ended December 31, 2013. We incurred a net loss of approximately $7.6 million for the fourth quarter of 2013We anticipate that our operating expenses will increase for the foreseeable future as we continue to enhance our product and service offerings, broaden our customer base, expand our operations, hire additional employees, continue to develop our technology and operate as a publicly traded company. Our expenses may be greater than we currently anticipate, and we may not succeed in generating sufficient revenues to offset these higher expenses. We incurred non-cash expense charges of approximately $21.1 million for the year ended December 31, 2013, related to transactions in our equity. Our revenue growth may slow or our revenue could decline for a number of reasons, including less demand for our products or services than we anticipate, competition, our failure to capitalize on growth opportunities or other factors. If we are unable to meaningfully increase our revenue, we may not be able to operate profitably or generate positive cash flows on a consistent basis, or at all. If we are unable to effectively address these risks and challenges as we encounter them, we could be materially and adversely affected and our stock price could decline significantly.
Our actual operating results may differ significantly from any guidance or estimates we may provide.
From time to time, we may release guidance estimates in our quarterly and annual earnings releases, quarterly and annual earnings conference calls, or otherwise, regarding our future performance that represents our management’s estimates as of the date of release. Although we believe that any such guidance or estimates would provide investors and analysts with a better understanding of management’s expectations for the future and could be useful to our stockholders and potential stockholders, such guidance or estimates would consist of forward-looking statements subject to the risks and uncertainties described in this report and in our other public filings and public statements. Guidance and estimates are necessarily speculative in nature, and it can be expected that some or all of the assumptions underlying the guidance or estimates may not materialize or may vary significantly from actual results. Our actual results may not always be in line with or exceed any guidance or estimates we may provide, especially in times of economic uncertainty. If our financial results for a particular period do not meet our guidance or estimates or the expectations of investors or research analysts, or if we reduce our guidance or estimates for future periods, the market price of our common stock may decline. In light of the foregoing, investors are urged not to unduly rely upon any guidance or estimates in making an investment decision regarding our common stock.
Our failure to obtain the capital necessary to expand our operations and invest in new products and services could reduce our ability to compete, which could materially and adversely affect us and cause our stock price to decline significantly.
Although we expect that our existing cash and cash equivalents, which includes the net proceeds from our initial public offering completed in July 2013, together with cash generated from our operations, savings generated by reductions in expenses and credit lines in the aggregate amount of $7.5 million that were made available to us in February 2014 by two of our large stockholders, will be sufficient to meet our anticipated operating cash needs for at least the next twelve months, we cannot assure investors that we will not need to raise additional funds to finance the growth of our business, make acquisitions or for other reasons. We may not be able to obtain additional equity or debt financing on favorable terms, if at all. If we raise additional equity financing, our stockholders may experience significant dilution of their ownership interests and the per share value of our common stock could decline. Furthermore, if we engage in debt financing, our leverage would increase and the holders of debt would have priority in the event of our bankruptcy or liquidation over the holders of our common stock. Furthermore, we may become subject to covenants that restrict our ability to incur additional indebtedness or operate our business in the manner we desire. We may also be required to take or become subject to other actions that are in the interests of the debt holders and to the detriment of the holders of our common stock, such as a foreclosure pursuant to secured debt or a requirement that we maintain specified liquidity or satisfy other financial ratios or covenants. Any of these restrictions or requirements could prevent us from expanding our operations and investing in new products and services, which could reduce our ability to compete, materially and adversely affect us and cause our stock price to decline significantly.
We face significant competition for customers from other providers of technology solutions to participants in the financial services community. If prospective customers are reluctant to switch from their existing service providers and adopt our products and services, our sales will not grow or may decline, we could be materially and adversely affected and our stock price could decline significantly.
Many of our potential customers have invested substantial personnel and financial resources to design and operate their existing trading, risk management, accounting, reporting and administration systems and technologies, and have established relationships with other providers. This may make them reluctant to add new components to their networks, particularly from other vendors such as us. We have only recently started selling our products and services to third parties and marketplace acceptance of our products and services is uncertain. Potential customers that use legacy products and services for their trading, risk management, accounting, reporting and administration needs may believe that these products and services sufficiently achieve their purpose. In addition, an organization’s existing vendors or new vendors with broad product and service offerings may be able to offer concessions to our potential customers that we are not able to match. Accordingly, organizations may continue allocating their resources and information technology budgets for legacy products and services and may not switch to our products and services. If our products and services do not find widespread marketplace acceptance, then our sales may not grow or may decline, which could materially and adversely affect us and cause our stock price to decline significantly.
We face significant competition for the types of products and services that we offer and may be unable to compete effectively for market share.
Our success depends significantly upon our ability to increase our market share, to increase our revenues from new and existing customers and to sell additional products and product enhancements to new and existing customers. The market for the types of products and services that we offer is intensely competitive. Our current and potential future competition principally comes from:
| · | software development firms and vendors who create global trading networks and risk management, accounting, reporting and administrative tools and make them available to brokers, hedge funds, and other investment management customers and financial institutions; |
| · | fund administrators who provide accounting and administration software and services to brokers, hedge funds and other investment management customers and financial institutions; and |
| · | broker-dealers who, in an effort to satisfy the demands of their customers for hands-on electronic trading facilities, universal access to markets, smart routing, better trading tools and lower commissions and financing rates, provide such facilities and product enhancements to their hedge fund and other investment management customers. |
Our competitors may develop products that are superior to our platform in terms of quality, ease of use, security, reliability or cost or may achieve greater market acceptance. Our competitors or potential competitors may have significantly greater financial, technical and marketing resources and access to capital than we do. As a result, they may be able to respond more quickly to new or emerging technologies and to changes in customer demands, or to devote greater resources to the development, promotion and sale of their products and services than we can. We may be unable to compete successfully against current or future competitors, which could materially and adversely affect us and cause our stock price to decline significantly.
If functionality similar or superior to that offered by our products and services is developed by competitors, it could materially and adversely affect us and cause our stock price to decline significantly.
Large, well-established providers of trading, risk management, accounting, reporting and administration technologies may introduce features that compete with our platform, either in stand-alone products or as additional features to their existing technologies. In addition, other companies may emerge that offer products and services that compete with those we offer. The introduction by competitors of products and services, or the announcement of an intent to offer products and services, that include functionality perceived to be similar or superior to that offered by our platform may adversely affect our ability to market and sell our products and services, which could materially and adversely affect us and cause our stock price to decline significantly. Furthermore, even if the functionality offered by these providers is more limited than our products and services, a significant number of organizations may nevertheless subscribe to such limited functionality offered by other providers instead of our products and services, whether because they do not wish to add an additional vendor such as us, for cost reasons, for relationship reasons or otherwise.
We depend on our proprietary technology. Any inability by us to maintain a technological advantage over our competitors could materially and adversely affect us and cause our stock price to decline significantly.
Our success depends on our proprietary technology, which has taken several years to develop and which we believe provides us with a competitive advantage. If our technology becomes more widely adopted in the marketplace, competitors may seek to develop similar or competing technologies, which could adversely affect our business. We have filed an omnibus utility patent application with the U.S. Patent and Trademark Office, or USPTO, containing claims directed to our integrated technology platform, which application is currently being pursued by us in the USPTO. To date, no patent has issued under this application, and we cannot assure you that a patent will ever issue. Adoption or development by competitors of similar or more advanced technologies may require that we devote substantial resources to the development of more advanced or different technology to remain competitive. The markets in which we compete are characterized by rapidly changing technology, evolving industry standards and changing trading systems, practices and techniques. Although we believe we are at the forefront of these developments, we may not be able to keep up with changes in the future, develop new technology, realize a return on amounts invested in developing new technologies or remain competitive in the future, any of which could materially and adversely affect us and cause our stock price to decline significantly.
If we do not accurately predict, prepare for and respond promptly to rapidly evolving technological and market developments and changing customer needs, our business and prospects may be negatively impacted, potentially materially.
We expect the market for our products and services to continue to evolve rapidly. As a result, our success will continue to depend upon our ability to develop new products or product enhancements that address the needs of our customers and to respond to changing market standards and practices. The process of developing new technology is complex and uncertain, and if we fail to accurately predict customers’ changing needs and emerging technological trends, our business and prospects could be negatively impacted, potentially materially. We may be required to commit significant resources to developing new products and services before knowing whether our investments will result in products or services that will achieve marketplace acceptance.
The success of new products and services depends on several factors, including appropriate new product definition, timely completion and introduction of these products and services, differentiation of new products from those of our competitors, and marketplace acceptance of these products and services. There can be no assurance that we will successfully identify new sales opportunities, develop and bring new products and services to market in a timely manner, or achieve marketplace acceptance of our products and services, or that products, services and technologies developed by others will not render our products, services or technologies obsolete or noncompetitive.
We currently have a limited number of customers, most of which to date have been generated as a result of pre-existing relationships of these customers with our founders and entities affiliated with them. We may not be successful in attracting new customers. In addition, the loss of or events affecting one or more of our customers could materially and adversely affect us and cause our stock price to decline significantly.
Because we are a new company, our current customer base is relatively small. For the period from April 24, 2012, the date we commenced operations, through December 31, 2012, a single customer, QuantX, a multi-strategy principal-only trading firm that is a related party as a result of certain past or present relationships with Messrs. Ferdinand, Keller, Schaeffer, Von Allmen and Tew, represented 34% of our total revenues and 75% of our software services revenues. In addition, for the period from April 24, 2012 through December 31, 2012, all related parties, including QuantX, represented 38% of total revenues and 86% of our software services revenues. For the fiscal year ended December 31, 2013, QuantX represented 44% of our total revenues and 72% of our software services revenues. In addition, all related parties, including QuantX, represented 51% of total revenues and 83% of our software services revenues for the fiscal year ended December 31, 2013. To date, most of our customers have been sourced through relationships with our founders and their respective affiliated or acquired entities. We cannot assure you that we will be successful in developing a material customer base that is sourced from other channels such as our sales force or strategic partnerships. Furthermore, our customers operate in the volatile global financial markets and are influenced by a number of factors outside of their control, including rising interest rates, inflation, the availability of credit, issues with sovereign and large institutional obligors, changes in laws and regulations, terrorism and political unrest or uncertainty, among others. As a result, any one of our customers may go out of business unexpectedly. In addition, these customers may decide to no longer use our products and services for other reasons which may be out of our control. The loss of or events affecting any one or more of these customers could materially and adversely affect us and cause our stock price to decline significantly.
A systemic or systematic market event that impacts the various market participants with whom we interact could materially and adversely affect us and cause our stock price to decline significantly.
There has been significant disruption and volatility in the global financial markets over the last several years, and many countries, including the United States, have experienced an economic slowdown during this time. Increased risk aversion brought about by the financial crisis of 2008 and the resulting global recession, ongoing concerns over sovereign debt levels and the U.S. “flash crash” in May 2010 resulted in the curtailing of trading activity. The global market and economic climate may remain stagnant or continue to deteriorate because of the aforementioned factors as well as other factors beyond our control, including rising interest rates, inflation, a lack of credit, credit issues with sovereign and large institutional obligors, changes in laws or regulations, terrorism or political unrest or uncertainty. In the event of deteriorating or stagnant market conditions, there could be a reduction in the types of financial instruments traded or a reduction in trading volumes of financial instruments globally. These factors could cause revenues from our customers to decrease, which could adversely affect our business and operating results, potentially materially. Our profitability may also be adversely affected by our fixed costs and the possibility that we may be unable to reduce other costs within a time frame sufficient to match any decreases in revenue relating to deteriorating conditions. Accordingly, deteriorating or stagnant market conditions could materially and adversely affect us and cause our stock price to decline significantly.
If we fail to remediate our material weaknesses and deficiencies in our internal control over financial reporting or we are unable to implement and maintain effective internal control over financial reporting in the future, the accuracy and timeliness of our financial reporting may be adversely affected, our reputation could be harmed and our stock price could decline significantly.
In connection with the preparation of our audited consolidated financial statements for the period from April 24, 2012 to December 31, 2012 as well as the year ended December 31, 2013, our independent registered public accounting firm identified and communicated three material weaknesses in our internal controls over financial reporting to our Board of Directors. A material weakness is a deficiency, or a combination of deficiencies, that creates a reasonable possibility that a material misstatement of a company’s annual or interim financial statements will not be prevented or detected on a timely basis. The three material weaknesses related to our lack of: (i) internal controls and sufficient personnel to identify, analyze, record and report the accounting effects of the terms of agreements and contracts in accordance with accounting principles generally accepted in the United States, or U.S. GAAP; (ii) internal controls to safeguard and archive records to support amounts recorded in the financial statements; and (iii) policies, procedures and controls to identify, authorize, approve, monitor and account for and disclose related party transactions and arrangements, including those transactions outside the normal course of business, in the financial statements in accordance with U.S. GAAP. These material weaknesses resulted in adjustments to our financial statements that were identified by our independent registered public accounting firm.
We have begun taking steps and plan to take additional steps to remediate the underlying causes of our material weaknesses, primarily through the development and implementation of formal policies, improved processes, upgraded financial accounting systems and documented procedures, as well as the hiring of additional finance personnel. We hired a Chief Financial Officer in September 2012, an accounting manager and a General Counsel in March 2013, and a controller in April 2013, with appropriate knowledge, experience and ability to fulfill our obligations to comply with the accounting, reporting and other requirements applicable to public companies. In addition, we are in the process of implementing a new general ledger system that we expect will become operational in 2014, which we believe will enhance our internal controls and reporting capabilities once fully utilized. Although we plan to complete this remediation process as quickly as possible, we cannot at this time estimate how long it will take, and our initiatives may not prove to be successful in remediating these material weaknesses.
In light of the identified material weaknesses discussed above and the fact that these identified material weaknesses are still in the process of being remediated, our Chief Executive Officer and Chief Financial Officer concluded that our disclosure controls and procedures were not effective as of December 31, 2013 to provide reasonable assurance that information we are required to disclose in reports that we file or submit under the Exchange Act is recorded, processed, summarized and reported within the time periods specified in SEC rules and forms, and that such information is accumulated and communicated to our management, including our Chief Executive Officer and Chief Financial Officer, as appropriate, to allow timely decisions regarding required disclosure.
If we fail to effectively remediate the current deficiencies in our control environment or are unable to implement and maintain effective internal control over financial reporting to meet the demands to which we are subject as a public company, including the requirements of the Sarbanes-Oxley Act of 2002, or the Sarbanes-Oxley Act, we may be unable to accurately report our financial results or report them within the timeframes required by law or exchange regulations.
Even if we are able to report our financial statements accurately and in a timely manner, the existence of material weaknesses or the continued disclosure of material weaknesses in our future filings with the SEC could cause our reputation to be harmed and our stock price to decline significantly.
We have not performed an evaluation of our internal control over financial reporting, as required by Section 404 of the Sarbanes-Oxley Act, nor have we engaged our independent registered public accounting firm to perform an audit of our internal control over financial reporting as of any balance sheet date reported in our financial statements. Had we performed such an evaluation or had our independent registered public accounting firm performed an audit of our internal control over financial reporting, additional control deficiencies, including additional material weaknesses and significant deficiencies, may have been identified. In addition, the JOBS Act provides that, so long as we qualify as an “emerging growth company,” we will be exempt from the provisions of Section 404(b) of the Sarbanes-Oxley Act requiring that our independent registered public accounting firm provide an attestation report on the effectiveness of our internal control over financial reporting. We may take advantage of this exemption so long as we qualify as an “emerging growth company.”
If we do not manage our growth effectively, our operating results may be materially and adversely affected and our stock price could decline significantly.
The growth and expansion of our business and product and service offerings have placed and will continue to place a significant strain on our management, operational and financial resources. To manage our growth effectively, we will need to continue to increase our staffing levels and continue to expand and improve our infrastructure, our operating, accounting, financial and administrative systems and our procedures, controls and processes, including, without limitation:
| · | significantly enhancing our internal controls to ensure timely and accurate reporting of all of our operations and financial results, and hiring additional personnel in areas such as accounting, finance, regulatory compliance and other important areas; |
| · | expanding and improving our key business applications, processes and IT infrastructure, including without limitation those relating to accounting and financial reporting, to support our business needs; |
| · | enhancing information and communication systems to ensure that our employees and officers are well-coordinated and can effectively communicate with each other and our growing customer base; and |
| · | appropriately documenting our IT systems and our business processes. |
These improvements may require significant capital expenditures and allocation of valuable management and employee resources. Our failure to make these improvements or hire any additional necessary personnel, or the failure of our systems, procedures, controls and processes to operate in the intended manner, may result in our inability: to manage our expected growth, which could materially and adversely affect our operating results; to accurately report or forecast our revenue, expenses and earnings; or to prevent certain losses.
Failures in our compliance systems could subject us to significant legal and regulatory costs. Furthermore, if our risk management methods are not effective, our business, reputation and financial results may be adversely affected.
Our ability to comply with all applicable laws and regulations is largely dependent on our establishment and maintenance of compliance, audit and reporting systems and procedures, as well as our ability to attract and retain qualified compliance, audit and risk management personnel. These systems and procedures may not be fully effective. We face the risk of intervention by regulatory authorities, including extensive examination and surveillance activity. In the case of actual or alleged non-compliance with regulations, we could be subject to investigations and judicial or administrative proceedings that may result in penalties or civil lawsuits for damages, which can be substantial. Any failure to comply with applicable laws and regulations could adversely affect our business, reputation, financial condition and operating results and, in extreme cases, our ability to conduct our business or portions thereof.
Our sales cycle can be long and unpredictable, which may result in increased costs and delays in generating revenue from new customers.
The timing of our sales is difficult to predict. Our sales efforts involve educating prospective customers about the use, technical capabilities and benefits of our products and services. Prospective customers often undertake a prolonged product-evaluation process. We may face significant costs, long sales cycles and inherent unpredictability in completing customer sales. A prospective customer’s decision to purchase our products and services may be an enterprise-wide decision and, if so, may require us to educate a significant number of people within the prospective customer’s organization regarding the use and benefits of our products and services. In addition, prospective customers may require customized features and functions unique to their business process and may require acceptance testing related to those unique features. As a result of these factors, we may be required to devote greater sales support and professional services resources to a number of individual prospective customers, increasing costs and time required to complete sales and diverting our sales and professional services resources to a smaller number of customers, while delaying revenues from other potential new customers until the sales cycle has been completed and the criteria for revenue recognition have been met.
We depend on our senior management team and the loss of one or more key employees, the failure of new executive officers to integrate with our management team or our failure to attract and retain other highly qualified personnel in the future, could have a negative impact on our business.
Our success depends largely on the efforts and abilities of the key members of our senior management team, including our Chief Executive Officer, Brian Storms; the Vice Chairman of the Company’s Board of Directors and Head of Corporate Strategy, Brian Ferdinand; and our Chief Financial Officer, Kenneth Shifrin, as well as our Chairman of the Board, Victor Simone, Jr. Because each member of our senior management team has a different area of specialization, the departure of any one of these individuals could create a deficiency in one of the core aspects of our business. Any failure of our management team to successfully integrate could also have a negative impact on our business. We are also dependent on the efforts of our team of technology professionals, and on our ability to recruit and retain highly skilled and often specialized personnel, particularly in light of the rapid pace of technological advances. The level of competition in the technology industry for individuals with this level of experience or these skills is intense. Significant losses of key personnel, particularly to competitors, could make it difficult for us to compete successfully. In addition, we may be unable to attract and retain qualified management and personnel in the future, including in relation to any diversification of our product and service offerings into new asset classes and/or new geographic locations.
We use third-party service providers located in Romania, India and the United Kingdom to perform certain research and development. If these service providers do not perform effectively, if there is misconduct by our service providers or if other risks inherent in foreign operations occur, our business may be negatively impacted.
We use third-party service providers located in Romania, India and the United Kingdom to perform certain technology research and development in order to achieve cost savings and efficiencies. Managing research and development operations that are remote from our U.S. headquarters is difficult and we may not be able to manage these remote third-party service providers successfully. If these service providers do not perform effectively, we may not be able to achieve any cost savings or efficiencies. Additionally, while we believe our contracts with these providers protect our intellectual property rights, misconduct by our service providers could result in infringement or misappropriation of our intellectual property. Further, using foreign service providers increases our exposure to fluctuations in currency exchange rates, difficulties in foreign regulatory compliance and exposure to economic, security and political conditions in the foreign countries where our service providers are located. Any of these difficulties, risks or exposures could adversely affect our business, financial condition, liquidity and results of operations.
Our financial and other operating results may vary significantly from period to period and may be unpredictable, which could cause our stock price to decline significantly.
Our financial and other operating results may vary significantly from period to period as a result of a number of factors, many of which are outside of our control and may be difficult to predict, including:
| · | our ability to attract and retain new customers and the time it takes to onboard these customers and realize revenue from them; |
| · | the budgeting cycles and purchasing practices of our existing and potential customers; |
| · | changes in customer requirements or market needs; |
| · | a general market volume contraction that leads to decreased activity; |
| · | changes in the growth rate of the market for technology service solutions supporting the financial services industry; |
| · | the timing and success of new product and service introductions by us or our competitors or any other change in the competitive landscape of our industry, including consolidation among our competitors or customers; |
| · | our ability to successfully expand our business domestically and internationally; |
| · | decisions by potential customers to purchase technology service solutions from larger, more established trading, risk management, accounting, reporting and administration technology vendors; |
| · | customer attrition and changes in renewal rates for our products and services; |
| · | the cost and potential outcomes of current or future litigation, which could materially and adversely affect us and cause our stock price to decline significantly; |
| · | future accounting pronouncements, changes in our accounting policies, the failure to remediate all material weakness and deficiencies in a timely manner or the occurrence or perception of accounting irregularities; and |
| · | general economic conditions, both domestically and internationally. |
Any one of the factors above or the cumulative effect of some of the factors referred to above may result in significant volatility in our financial and other operating results. This variability and unpredictability could result in our failure to meet our revenue or other operating results expectations or those of securities analysts or investors for a particular period. If we fail to meet or exceed such expectations for these or any other reasons, our stock price could decline significantly and we could face costly lawsuits, including securities class action suits.
We rely on revenue from subscription fees. Because we will recognize revenue from subscription fees over the term of the relevant service period, downturns or upturns in sales may impact our future operating results.
For the years ended December 31, 2012 and December 31, 2013, 56% and39%, respectively, of our revenues were attributable to commissions and fees from broker-dealer operations, while 44% and61%, respectively, came from subscription fees, primarily from QuantX, an entity with which Messrs. Ferdinand, Schaeffer and Keller are affiliated. Prospectively, however, we expect to be more dependent on subscription fees in light of the nature of our business and in light of our cessation of the over-the-counter brokerage operations of LPS and Futures on June 1, 2013. Sales of new or renewal subscription contracts may decline and fluctuate as a result of a number of factors, including customer satisfaction with our products and services, the price of our products and services, the quality, ease of use and prices of products and services offered by our competitors and reductions in our customers’ spending levels. Furthermore, our customers generally have no contractual obligation to renew their contracts after the initial contract term. We have limited historical data with respect to rates of customer renewals, so we may not be able to accurately predict future renewal trends. If our sales of new or renewal subscription contracts decline, our future revenue and revenue growth may decline and our business may suffer.
Additional impairment of goodwill or intangible assets in our financial statements could adversely affect our financial position and results of operations.
As of December 31, 2012 and December 31, 2013, we had goodwill of $13.2 million as of both dates and intangible assets of $18.7 million and $11.5million, respectively, which together represented 76% and68%, respectively, of our total assets as of such date. We do not amortize goodwill and intangible assets with indefinite useful lives; rather, such assets are required to be tested for impairment at least annually or sooner whenever events or changes in circumstances indicate that the assets may be impaired. During the period ended December 31, 2012, we recognized $1.6 million of goodwill and intangible asset impairments as a result of valuations to determine the fair value of Liquid Partners. With respect to the LiquidTradeSM software, certain negative events could occur which could result in an impairment loss. Such potential negative events could relate to: (1) revenue generated and the acceptance of the software in the marketplace, (2) the research and development expenses required to maintain and develop future versions of the software, (3) the life cycle of the software becoming shorter or longer than anticipated based on changing market and competitive conditions, and (4) changes to the expected cash flow due to macroeconomic and industry factors. Significant revenue growth resulting in a significant increase in cash flows will be necessary to support the recoverability of the carrying value of the LiquidTradeSM software. If there is not a significant increase in cash flows related to the LiquidTradeSM software, an impairment charge is reasonably likely. In the future, we may be required to take additional charges to our operating results if we experience further impairments, which would adversely affect our financial position and our results of operations. Since our growth strategy will likely involve the acquisition of other businesses, assets or technologies, we may record additional goodwill and intangible assets in the future. The possible write-off of this goodwill and intangible assets could harm our financial position and results of operations.
Defects, errors or vulnerabilities in our products or services or the failure of our products or services to perform could materially and adversely affect us and cause our stock price to decline significantly.
Because our products and services are complex, they may contain design defects or errors, such as defects related to performance and scalability, which may not be detected until after their commercial release and deployment to our customers. Our platform may experience technical failures and delays or may fail to meet the requirements of our customers, either of which could temporarily or permanently disrupt our customers’ operations and could cause them significant financial and reputational harm.
Any defects, errors or vulnerabilities in our products and services could result in:
| · | expenditure of significant financial and product development resources in efforts to analyze, correct, eliminate or work around defects or errors or to address and eliminate vulnerabilities; |
| · | loss of existing or potential customers; |
| · | delayed or lost revenue; |
| · | delay or failure to attain market acceptance; |
| · | negative publicity and reputational harm to us. |
Any of the foregoing could materially and adversely affect us and cause our stock price to decline significantly.
We rely on a third-party service provider, Equinix, to host some of our platform and any interruptions or delays in services from this third party could interrupt the delivery of our products and services and negatively impact our business.
We currently outsource our data center hosting services to Equinix, a third-party service provider. We do not control the operation of the third-party service provider’s facilities. These facilities may be vulnerable to damage or interruption from natural disasters, fires, power loss, telecommunications failures and similar events. They may also be subject to cyber-terrorism, human error, break-ins, computer viruses, sabotage, intentional acts of vandalism and other misconduct. The occurrence of any of these events, a decision by our third-party service provider to close one or more of its facilities without adequate notice to us or other unanticipated events which may be out of our control could result in lengthy interruptions in our service and could negatively impact our business.
Our customers’ inability to access the Internet or connect with a prime broker or liquidity destination, network or software failures, security breaches and other interruptions in technology could impair the delivery of our products and services and negatively impact our business.
The availability of our platform and our customers’ ability to execute transactions could be interrupted by a number of factors, including our customers’ inability to access the Internet or inability to connect with a prime broker or liquidity destination, the failure of our network or software systems due to human or other error, security breaches or ability of the infrastructure to handle spikes in customer usage. Furthermore, our ability to collect and report data may be interrupted by a number of other factors, including our ability to access the Internet, the failure of our network or software systems or variability in user traffic on customer websites. In addition, cyber-terrorism, break-ins, computer viruses, sabotage, intentional acts of vandalism and other misconduct may negatively impact our platform or cause us to lose data, and any of these occurrences could expose us to system disruptions, negative publicity, reputational harm or litigation, which could negatively affect our business. If we are required to indemnify or are otherwise liable to customers or third parties for damages that may occur resulting from these events, we could be materially and adversely affected and our stock price could decline significantly.
If our security measures are breached or unauthorized access to customer data is otherwise obtained, our products and services may be perceived as not being secure, we may lose sales and customers and we may incur significant liabilities.
Our products and services involve the storage and transmission of our customers’ proprietary information and security breaches could expose us to a risk of loss or unauthorized disclosure of this information, litigation and possible liability, as well as damage to our relationships with our customers. If our security measures are breached as a result of third-party action, employee error, malfeasance or otherwise, during the transfer of data to additional data centers or at any other time, and, as a result, someone obtains unauthorized access to our data or our customers’ data, our reputation could be damaged, our business may suffer and we could incur significant liability.
Techniques used to obtain unauthorized access or to sabotage technology systems change frequently and generally are not discovered or recognized until a security breach has occurred. As a result, we may be unable to anticipate these threats or to implement adequate preventative measures. If an actual or perceived security breach occurs, the market perception of our security measures could be damaged and our business could be negatively impacted. Any violations of data privacy could result in the loss of business, litigation and regulatory investigations and penalties that could damage our reputation and adversely affect us. Moreover, if a security breach occurs with respect to one of our competitors, our customers and potential customers may lose trust in the security of the SaaS business model generally, which could adversely impact our ability to retain existing customers or attract new customers.
Additionally, third parties may attempt to fraudulently induce employees or customers into disclosing sensitive information such as user names, passwords or other information in order to gain access to our data or our customers’ data, which could result in significant legal and financial exposure and a loss of confidence in the security of our service and could ultimately negatively impact our business and future business prospects. A party who is able to compromise the security of our facilities could misappropriate either our proprietary information or the personal or proprietary information of our customers, or cause interruptions or malfunctions in our operations. We may be required to expend significant capital and financial resources to protect against such threats or to alleviate problems caused by breaches in security. Litigation brought against us regarding security breaches or unauthorized access to customer information could be costly, could divert management’s attention and may result in significant liability.
Our employees may engage in misconduct or other improper activities which could materially and adversely affect us and cause our stock price to decline significantly.
We are exposed to the risk of employee fraud or other misconduct. Misconduct by employees could include the misappropriation of funds, intellectual property, or our customers’ proprietary information. Employee misconduct is not always possible to deter or prevent, and any precautions we may take to prevent and detect this activity may not be effective in all cases. We may incur negative publicity and reputational harm as a result of any improper activities by our employees. In addition, any employee fraud or misconduct may give rise to litigation, which could be time-consuming to our management team, costly and could have a material adverse effect on us and cause our stock price to decline significantly.
Our business is subject to the risks of warranty claims, service credits, product liability, product defects and network defects.
Despite testing prior to their release, software products frequently contain undetected errors, defects or security vulnerabilities, especially when initially introduced or when new versions are released. Errors in our platform could affect the ability of our platform to work with other hardware or software products, impact functionality and delay the development or release of new software or new versions of software and adversely affect market acceptance of our platform. Any such errors or delays in releasing new products or new versions of products, or allegations of unsatisfactory performance, could cause us to lose revenue or market share, increase our service costs through service credits, cause us to incur substantial costs in redesigning our products and services, cause us to lose significant customers, subject us to liability for damages and divert our resources from other tasks, any one of which could materially and adversely affect us. To work effectively, our platform must successfully interoperate with products and services from other vendors. As a result, when problems occur in a network, it may be difficult to identify the sources of these problems. The occurrence of any such problems could materially and adversely affect us and cause our stock price to decline significantly.
Although we have limitation of liability provisions in our standard form of customer contract, such provisions may not fully or effectively protect us from warranty claims as a result of federal, state or local laws or ordinances, or unfavorable judicial decisions in the United States or other countries. The sale and support of our products and services also entail the risk of product liability claims. We maintain insurance to protect against certain claims associated with the use of our products and services, but our insurance coverage may not adequately cover any claim asserted against us. In addition, even claims that ultimately are unsuccessful could result in our expenditure of funds in litigation, divert management’s time and other resources and harm our reputation.
We may be unable to obtain patent rights that effectively protect our integrated technology platform and our other intellectual property rights may not be sufficient to effectively protect our products and technology, which could subject us to increased competition that could negatively impact our business.
We rely, and expect to continue to rely, on a combination of confidentiality and license agreements with our employees, consultants, and third parties with whom we have relationships, as well as trademark, copyright, patent and trade secret protection laws, to protect our products and technology. We have filed and are currently pursuing a utility patent application with the USPTO containing claims that covers certain aspects of our integrated technology platform, and we will continue to evaluate our technology to identify patentable inventions and, if appropriate, file patent applications to cover such inventions. To date, we have not been issued any patents in respect of our technology platform. We cannot assure investors that a valid patent will issue from our pending application, and the claims allowed on any patent that does issue on our pending application may not be sufficiently broad to effectively protect our technology platform. Any patent that issues on our pending application and any other issued patents that we may obtain may be challenged, invalidated or circumvented, and any rights granted under any patent we may obtain may not actually provide adequate defensive protection or competitive advantages to us. Patent applications in the United States are typically not published until 18 months after filing, or, in some cases, not at all, and publications of discoveries in industry-related literature lag behind actual discoveries. The USPTO has informed us of two prior art claims, and although we believe they are distinguishable, we cannot be certain that we were the first to make the inventions claimed in our pending patent application or that we were the first to file for patent protection. If we are unable to show that we were the first to make the inventions claimed in our pending patent application or that we were the first to file for patent protection, a patent may not issue on our pending patent application or any patent that does issue may be invalidated following issuance. Additionally, the process of obtaining patent protection is expensive and time-consuming, and we may not be able to continue pursuing our pending patent application (or any future patent applications that we may file) at a reasonable cost or in a timely manner. In addition, recent changes to the patent laws in the United States may bring into question the validity of certain categories of software patents. As a result, we may not be able to obtain adequate patent protection for our software or effectively enforce any patents that issue in the future that cover our software.
In addition to seeking patent protection for certain aspects of our integrated technology platform, we also rely on trade secrets, including unpatented know-how, technology and other proprietary information, to maintain our competitive position. Despite our efforts to protect our proprietary rights, unauthorized parties may attempt to copy aspects of our products or obtain and use information that we regard as proprietary. We generally enter into confidentiality or license agreements with our employees, consultants, vendors, and customers, and generally limit access to, and use or distribution of, our proprietary information. However, we cannot assure investors that we have entered into such agreements with all parties who may have or have had access to our confidential information or that the agreements we have entered into will not be breached or, if breached, we will be able secure effective remedies for the breach. We also cannot assure investors that any of the measures we have taken will prevent misappropriation or infringement of our technology. In addition, the intellectual property laws of some foreign countries are less protective than those of the United States, and we may be unable to effectively enforce any intellectual property rights we may have in many foreign countries.
Attempts to enforce our rights against third parties could also provoke these third parties to assert their own intellectual property or other rights against us. If we obtain any issued patents in the future, this could result in a holding by the USPTO or any foreign patent agency that invalidates or narrows the scope of these issued patents, in whole or in part. If we are unable to obtain intellectual property rights that effectively protect our integrated technology platform and our products (including intellectual property other than patent rights), we may find ourselves at a competitive disadvantage to others who need not incur the additional expense, time, and effort required to create our innovative products and services. Any of these events, individually or in the aggregate, could materially and adversely affect us and cause our stock price to decline significantly.
If we infringe the intellectual property rights of others, we may incur additional costs or be prevented from providing certain products and services to our customers, which could materially and adversely affect us and cause our stock price to decline significantly.
We cannot be certain that our products or services do not infringe the intellectual property rights of others and we may be subject to litigation and claims, including claims of misappropriation of trade secrets or infringement of patents, copyrights and other intellectual property rights of third parties. If any of these claims were to be brought, they would be time-consuming and costly to resolve and may lead to unfavorable judgments or settlements. If we were to discover that our products or services infringe the intellectual property rights of third parties, we could be required to make substantial changes to our products or services or obtain licenses from such third parties. We may not be able to obtain such licenses on favorable terms or at all, and we may be unable to change our products or services so that they provide the required functionality without infringing the third party’s intellectual property rights or to make the requisite changes in a timely or cost-effective manner. Failure to resolve an infringement matter successfully or in a timely manner may damage our reputation and force us to incur significant costs, including payment of damages to the owner of the intellectual property rights that are infringed, costs of developing modified or replacement technology or products, and diversion of management’s attention, as well as prevent us from providing certain products or services, which could materially and adversely affect us and cause our stock price to decline significantly.
We may become involved in lawsuits to protect or enforce any patents we obtain or other intellectual property rights, which could be expensive and time-consuming.
Competitors may infringe on our intellectual property. From time to time, we may need to take legal action to enforce our intellectual property rights, to protect our trade secrets, to determine the validity and scope of the proprietary rights of others or to defend against claims of infringement or invalidity. This can be expensive, particularly for a company of our size, and time-consuming. In addition, if we obtain a patent in the future and bring an action against an infringer of the patent, the court in the action may decide that the patent is not valid or is unenforceable, or may refuse to stop the other party from using the patent at issue on the grounds that our patent claims do not cover the other party’s technology or products. An adverse determination in any litigation or defense proceedings could put one or more of any future patents we may obtain at risk of being invalidated or interpreted narrowly and could put our patent application at risk of not issuing. Proceedings brought before the USPTO may be necessary to determine the priority of inventions with respect to our pending patent application. The results of infringement litigation or interference proceedings may be adverse and, even if successful, the litigation or proceedings may result in substantial costs to our business and distraction to our management. We may not be able to prevent misappropriation of our proprietary rights, particularly in countries where the laws may not protect such rights as fully as the laws of the United States. Furthermore, because of the substantial amount of discovery required in connection with intellectual property litigation, there is a risk that some of our confidential information could be compromised by disclosure during this type of litigation. In addition, during the course of this type of litigation, there could be public announcements of the results of hearings, motions or other interim proceedings or developments. If investors perceive these results to be negative, our stock price could decline.
Our current research and development efforts may not produce successful products and services or features that result in significant revenue, cost savings or other benefits in the near future, if at all, which could materially and adversely affect us and cause our stock price to decline significantly.
Developing our products and services and related enhancements is expensive. Our investments in research and development may not result in significant design improvements, marketable products and services or features or may result in products and services that are more expensive than anticipated. Additionally, we may not achieve the cost savings or the anticipated performance improvements we expect, and we may take longer to generate revenue, or generate less revenue, than we anticipate. Our future plans include significant investments in research and development and related product opportunities. We believe that we must continue to dedicate a significant amount of resources to our research and development efforts to maintain our competitive position. However, we may not receive significant revenue, cost savings or other benefits from these investments in the near future, if at all, which could materially and adversely affect us and cause our stock price to decline significantly.
Our ability to sell our products is dependent in part on the quality of our technical support services, and our inability to offer high quality technical support services could adversely affect our customers’ satisfaction with our products and services and could materially and adversely affect us and cause our stock price to decline significantly.
Our customers depend on our technical support services to resolve issues relating to our service offerings. If we do not effectively onboard our customers, succeed in helping our customers quickly resolve post-onboarding issues and provide effective ongoing support, our ability to sell additional products and services to existing customers would be adversely affected and our reputation with potential new customers could be damaged. If we fail to meet the requirements of our customers, it may be more difficult to execute on our strategy to retain these customers. Our failure to maintain quality technical support services could materially and adversely affect us and cause our stock price to decline significantly.
We may acquire other businesses, assets or technologies, which could require significant management attention, disrupt our business, dilute the value of our common stock and adversely affect our operating results.
As part of our business strategy, we have historically made a number of acquisitions and may continue to acquire or make investments in other companies, assets or technologies which we believe are complementary to our business. We may not be able to find suitable acquisition candidates, and we may not be able to complete such acquisitions on favorable terms, if at all. If we do complete acquisitions, we may not ultimately strengthen our competitive position or achieve our goals, and any acquisitions we complete could be viewed negatively by our customers, investors and securities analysts. We may not have sufficient management, financial and other resources to integrate any such future acquisitions or to successfully operate new businesses and we may be unable to profitably operate our expanded company. We may have to pay cash, incur debt or issue equity securities to pay for any such acquisition or investment, and we cannot assure investors that we will have sufficient liquidity to fund such transaction from internal funds or have access to sufficient capital on favorable terms, if at all. Any such funding could adversely affect our financial condition and liquidity or the value of our common stock. The sale of equity securities or incurrence of debt to finance any such acquisitions or investments could result in dilution to our stockholders or increase our leverage, as the case may be. The incurrence of indebtedness would result in increased fixed obligations and could also include covenants or other restrictions that would impede our ability to manage our operations and may require collateral that would be subject to foreclosure upon any default.
We are subject to litigation risk, which could adversely affect our reputation, and could materially and adversely affect us and cause our stock price to decline significantly.
Many aspects of our business involve risks that expose us to liability under U.S. federal and state laws, as well as the rules and enforcement efforts of our regulators and self-regulatory organizations worldwide. These risks include, among others, disputes over trade terms with customers and other market participants, customer losses resulting from system delay or failure, customer claims that we or our employees executed unauthorized transactions or made materially false or misleading statements and claims by employees against us. For more information, including information regarding certain settled and asserted claims against us, see the section titled “Item 3. Legal Proceedings” in this Annual Report on Form 10-K. We may also be subject to regulatory investigation and enforcement actions seeking to impose significant fines or other sanctions, which in turn could trigger civil litigation for our operations that may be deemed to have violated applicable rules and regulations in various jurisdictions.
The volume of claims and the amount of damages and fines claimed in litigation and regulatory proceedings against financial services firms have been increasing, particularly in the current environment of heightened scrutiny of financial institutions. Dissatisfied customers may make claims against us regarding the quality of trade execution, improperly settled trades, mismanagement or even fraud, and the number or likelihood of claims may increase as our business expands.
Even if we prevail in any litigation or regulatory proceedings against us, we could incur significant legal expenses defending against such claims, even those without merit. Moreover, because even claims without merit can damage our reputation or raise concerns among our existing customers or potential customers, we may feel compelled to settle claims at a significant cost. The initiation of any claim, proceeding or investigation against us, or an adverse resolution of any such claim, proceeding or investigation, could adversely affect our reputation and materially and adversely affect us and cause our stock price to decline significantly.
Failure to comply with governmental laws and regulations could harm our business, materially and adversely affect us and cause our stock price to decline significantly.
Our business is subject to regulation by various federal, state, local and foreign governmental agencies, including agencies responsible for monitoring and enforcing employment and labor laws, workplace safety, product safety, environmental laws, consumer protection laws, anti-bribery laws, import/export controls, federal securities laws and tax laws and regulations. In certain jurisdictions, these regulatory requirements may be more stringent than those in the United States. Noncompliance with applicable regulations or requirements could subject us to investigations, sanctions, revocation of required licenses, enforcement actions, disgorgement of profits, fines, damages, civil and criminal penalties or injunctions. If any governmental sanctions are imposed, or if we do not prevail in any possible civil or criminal litigation, we could be materially and adversely affected. In addition, responding to any action will likely result in a significant diversion of management’s attention and resources and an increase in legal and professional costs and expenses. We provide passive communication technology to institutional investors, such as money managers and hedge funds, that enables such investors to communicate with executing brokers, prime brokers and clearing firms with respect to securities orders that such investors may place with third party brokers through our platform. We do not conduct our technology business in or through our broker-dealers. As such, we must ensure that our technology activities and our compensation structure therefor would not result in our acting as an unregistered broker-dealer or investment adviser that could subject us to, among other things, regulatory enforcement actions, monetary fines, restrictions on the conduct of our technology business and rescission/damages claims by customers who use our technology. Our failure to comply with any laws or regulations, or the costs associated with defending any action alleging our noncompliance with any laws or regulations, could materially and adversely affect us and cause our stock price to decline significantly.
Extensive regulation of certain of our subsidiaries results in our exposure to the potential for penalties and fines and our failure to comply with such regulation could materially and adversely affect us and cause our stock price to decline significantly.
Companies in the financial services industry, including certain of our businesses, have experienced increased scrutiny in recent years and penalties and fines sought by regulatory authorities, including the SEC, FINRA, CFTC, NFA, state securities commissions, state attorneys general and the FCA, have increased accordingly. This regulatory and enforcement environment may create uncertainty.
Certain of our subsidiaries are subject to regulation by governmental and self-regulatory organizations in the jurisdictions in which they operate. Many of these regulators, including U.S. and non-U.S. government agencies and self-regulatory organizations, as well as state securities commissions in the United States, are empowered to conduct administrative proceedings that can result in censure, fines, the issuance of cease-and-desist orders or suspension or expulsion. In addition, we are subject to control person liability with respect to our regulated subsidiaries, which could impose liability on us for certain violations of those subsidiaries. “Associated persons” of ours may, in the future, be subject to investigations that may result in disciplinary actions by the SEC, self-regulatory organizations and state securities administrators. Self-regulatory organizations such as FINRA and the NFA, along with statutory bodies such as the SEC and the FCA, require strict compliance with their rules and regulations. The requirements imposed by regulators are designed to ensure the integrity of the financial markets and to protect customers and other third parties who deal with us and our regulated subsidiaries.
Future legislation and/or regulation, and uncertainties resulting from the possibility of legislation and/or regulation, could adversely impact our business. Failure to comply with any of these laws, rules or regulations could result in fines, limitations on business activity, or suspension or expulsion from the industry, any of which could materially and adversely affect us and cause our stock price to decline significantly.
We are required to maintain mandated levels of capital, which could constrain our growth and subject us to regulatory sanctions.
The SEC, CFTC, NFA, FINRA, FCA and other U.S. and non-U.S. regulators have stringent rules requiring that we maintain specific minimum levels of regulatory capital in our broker-dealer and independent introducing broker subsidiaries. As of December 31, 2013, on a separate company basis, we were required to maintain minimum net capital in the aggregate across all jurisdictions of approximately $214,000. Regulators continue to evaluate and modify minimum capital requirements from time to time in response to market events and to improve the stability of the international financial system. For example, the FCA recently increased capital requirements in the United Kingdom and may do so again in the future. Additional revisions to this framework or new capital adequacy rules applicable to us may be proposed and ultimately adopted, which could further increase our minimum capital requirements in the future.
Even if regulators do not change existing regulations or adopt new ones, our minimum capital requirements will generally increase in proportion to the size of our business conducted by our regulated subsidiaries. As a result, we will need to increase our regulatory capital in order to expand our operations and increase our revenue, and our inability to increase our capital on a cost-efficient basis could constrain our growth. In addition, in many cases, we are not permitted to withdraw regulatory capital maintained by our subsidiaries without prior regulatory approval or notice, which could constrain our ability to allocate our capital resources most efficiently throughout our operations. In particular, these restrictions could limit our ability to pay dividends or make other distributions on our common stock if our Board of Directors determines, in its sole discretion, to declare and pay dividends on our common stock in the future and, in some cases, could adversely affect our ability to withdraw funds needed to satisfy our ongoing operating expenses, debt service and other cash needs.
Regulators monitor our levels of capital closely. We are required to report the amount of regulatory capital we maintain to our regulators on a regular basis, and to report any deficiencies or material declines promptly. While we expect that our current amount of regulatory capital will be sufficient to meet anticipated short-term increases in requirements, any failure to maintain the required levels of regulatory capital or to report any capital deficiencies or material declines in capital could result in severe sanctions, including fines.
If our estimates or judgments relating to our critical accounting policies are based on assumptions that change or prove to be incorrect, our operating results could fall below expectations of securities analysts and investors, which could result in a significant decline in our stock price.
The preparation of financial statements in conformity with U.S. GAAP requires management to make estimates and assumptions that affect the amounts reported in the consolidated financial statements and accompanying notes. We base our estimates on historical experience and on various other assumptions that we believe to be reasonable under the circumstances, as provided in the section titled “Management’s Discussion and Analysis of Financial Condition and Results of Operations—Critical Accounting Policies and Estimates,” the results of which form the basis for making judgments about the carrying values of assets, liabilities, equity, revenue and expenses that are not readily apparent from other sources. Significant assumptions and estimates used in preparing our consolidated financial statements include those related to share-based compensation, business combinations and recoverability of intangible assets. Our operating results may be adversely affected if our assumptions change or if actual circumstances differ from those in our assumptions, which could cause our operating results to fall below the expectations of securities analysts and investors and result in a significant decline in our stock price.
We currently conduct a portion of our business outside of the United States and our long-term success depends, in part, on our ability to expand our sales to customers outside the United States. As a result, our business is susceptible to risks associated with international operations.
Our customer base is primarily in the United States and Europe. As we continue to expand the sale of our products and services to customers located outside the United States, our business will be increasingly susceptible to risks associated with international operations. Our ability to manage our business and conduct our operations internationally requires considerable management attention and resources and is subject to particular challenges of supporting a rapidly growing business in an environment of diverse cultures, languages, customs, business practices, legal systems, alternate dispute systems and regulatory systems. The risks and challenges associated with international expansion include:
| · | continued localization of our products and services, including translation into foreign languages and associated expenses; |
| · | laws and business practices favoring local competitors; |
| · | compliance with multiple, conflicting and changing governmental laws and regulations, including employment, tax, privacy and data protection laws and regulations; |
| · | compliance with anti-bribery laws, including compliance with the Foreign Corrupt Practices Act; |
| · | regional data privacy laws that apply to the transmission of our customers’ data across international borders; |
| · | ability to provide local data hosting services; |
| · | different pricing environments, including invoicing and collecting payment in foreign currencies and associated foreign currency exposure; |
| · | exposure to adverse movements in foreign currency exchange rates; |
| · | difficulties in staffing and managing foreign operations and the increased travel, infrastructure and legal and compliance costs associated with international operations; |
| · | different or lesser protection of our intellectual property rights; |
| · | difficulties in enforcing contracts and collecting accounts receivable, longer payment cycles and other collection difficulties; and |
| · | regional economic and political conditions. |
If we are unable to successfully manage the challenges of international operations and expansion, our growth could be limited, and we could be materially and adversely affected.
Our insurance coverage may be inadequate to cover all potential liability which could materially and adversely affect us and cause our stock price to decline significantly.
We maintain a number of insurance policies, including with respect to director and officer liability; technology errors and omissions; and information security and privacy, but such insurance may be inadequate or may not be available in the future on acceptable terms, or at all. If we do not have adequate insurance to cover our liability, we could be materially and adversely affected and our stock price could decline significantly.
Being a public company has made it more expensive for us to obtain director and officer liability insurance. These factors could also make it more difficult for us to attract and retain qualified members of our Board of Directors, particularly to serve on our audit committee and human resources and compensation committee, and qualified executive officers.
Risks Related to Ownership of Our Common Stock and Our Organizational Structure
The price of our common stock may be volatile and the value of an investor’s investment could decline.
Technology stocks have historically experienced high levels of volatility. The trading price of our stock price has been, and is likely to continue to be, volatile. After shares of our common stock were sold in our initial public offering in July 2013 at a price of $9.00 per share, the sales price of our stock has ranged from a high of $10.30 to a low of $3.68 through March 25, 2013. In addition to the factors discussed in this Annual Report on Form 10-K, the trading price of our common stock may fluctuate significantly in response to numerous factors, many of which are beyond our control, including:
| · | changes in financial markets or general economic conditions; |
| · | market acceptance and performance of our products and services; |
| · | defects and errors in our products or services; |
| · | system failures and disruptions; |
| · | the loss of executives or other key employees and our failure to recruit and retain qualified personnel; |
| · | failure to protect or enforce our intellectual property rights in our proprietary technology; |
| · | competition from firms with greater financial, technical and marketing resources and access to capital than we have and related competitive pressures; |
| · | issuances or sales of common stock by us or members of our management team or our Board of Directors or our other significant stockholders; |
| · | securities analyst recommendations or earnings estimates, and changes in securities analyst recommendations or estimates, regarding our common stock, other comparable companies or our industry generally; |
| · | actual or anticipated fluctuations in our operating results or future prospects; |
| · | strategic actions by us or our competitors, such as acquisitions or restructurings; |
| · | new laws or regulations or new interpretations of existing laws or regulations applicable to our business; |
| · | significant customer or contract losses; and |
| · | our ability to raise additional capital as needed and the terms on which such capital may be raised. |
Issuances or sales of substantial amounts of our common stock in the public markets, or the perception that additional issuances or sales of our common stock might occur, could reduce the price of our common stock and may dilute an investor’s voting power and its ownership interest in us.
Any future issuances or sales of a substantial number of shares of our common stock in the public market, or the perception that these issuances or sales could occur, could adversely affect our stock price and may make it more difficult for an investor to sell common stock at a time and price that such investor deems appropriate. As of March 25, 2014, we had 24,771,828 outstanding shares of common stock.
Affiliates beneficially own 14,008,425, or approximately 57%, of the outstanding shares of our common stock as of March 25, 2014. Under registration rights agreements with these affiliates (assuming any affiliate not already a party to such an agreement would be allowed to enter into one if so requested), they have the right, subject to some conditions, to require us to file registration statements covering the sale of their shares or to include their shares in registration statements that we may file for ourselves or other stockholders. All shares of our common stock held by our stockholders at the time of our initial public offering were “restricted securities” as defined in Rule 144. These restricted securities were issued and sold by us in reliance on exemptions from the registration requirements of the Securities Act. At this time, we estimate that all of these shares (other than any that might have been transferred in a manner whereby the recipient received restricted securities) may be sold in the public market pursuant to an exemption from registration, such as Rule 144 or Rule 701 under the Securities Act, subject in certain cases to our continuing compliance with the current public information requirements of Rule 144 and, in the case of our affiliates, subject to volume limitations, manner of sale restrictions and other limitations applicable to such sales. We have also registered the offer and sale of the shares of common stock that we may issue under our equity compensation plans on a registration statement on Form S-8, and we plan to register the resale of certain of those shares on an additional registration statement on Form S-8.
Insiders have substantial control over us, which could limit an investor’s ability to influence the outcome of key transactions, including a change of control.
Our directors, executive officers and each of our stockholders who own greater than 5% of our outstanding common stock and their affiliates, in the aggregate, own approximately 72% of the outstanding shares of our common stock. As a result, these stockholders are able to influence or control matters requiring approval by our stockholders, including the election of directors and the approval of mergers, acquisitions or other extraordinary transactions. They may also have interests that differ from other investors and may vote in a way with which other investors disagree and which may be adverse to the interests of other investors. This concentration of ownership may have the effect of delaying, preventing or deterring a change of control of our company, could deprive our stockholders of an opportunity to receive a premium for their common stock as part of a sale of our company and might ultimately adversely affect the market price of our common stock.
We cannot assure investors that an active or liquid trading market will develop or be sustained for our common stock or the market price at which our common stock will trade.
Although our common stock is listed on the NASDAQ Global Market, we cannot assure investors that an active or liquid trading market for our common stock will develop on that exchange or elsewhere or, if developed, that any market will be sustained. Since our initial public offering in July 2013, the volume of trading in our common stock has been very limited. We cannot predict the prices at which our common stock will trade or the liquidity of the market for our common stock.
We have broad discretion in the use of the net proceeds that we received from our initial public offering.
We have broad discretion in the application of the net proceeds of our initial public offering in July 2013. Stockholders may not agree with such uses and the net proceeds may be used for corporate purposes that do not increase our operating results or market value. Until the net proceeds are used, they may be placed in investments that do not produce income or that may lose value. Our failure to apply the net proceeds effectively could affect our ability to continue to develop and sell our products and services and grow our business, which could cause our stock price to decline.
The requirements of being a public company place significant demands on our resources and management’s attention.
As a public company, we are subject to the reporting requirements of the Securities Exchange Act of 1934, as amended, or the Exchange Act, the listing requirements of the NASDAQ Global Market and other applicable securities rules and regulations. Compliance with these rules and regulations increases our legal and financial compliance costs, makes some activities more difficult, time-consuming or costly, and increases demand on our systems and resources, which effects will become more significant after we no longer qualify as an “emerging growth company” as defined in the Jumpstart Our Business Startups Act of 2012, or the JOBS Act. Among other things, the Exchange Act requires that we file annual, quarterly and current reports with respect to our business and operating results and maintain effective disclosure controls and procedures and internal control over financial reporting. In order to maintain and improve our disclosure controls and procedures and internal control over financial reporting to meet this standard, significant resources and management oversight will be required. As a result, management’s attention may be diverted from other business concerns, which could harm our business and operating results.
In addition, changing laws, regulations and standards relating to corporate governance and public disclosure are creating uncertainty for public companies, increasing legal and financial compliance costs and making some activities more time consuming. These laws, regulations and standards are subject to varying interpretations, in many cases due to their lack of specificity, and, as a result, their application in practice may evolve over time as new guidance is provided by regulatory and governing bodies. This could result in continuing uncertainty regarding compliance matters and higher costs necessitated by ongoing revisions to disclosure and governance practices. We intend to invest resources to comply with evolving laws, regulations and standards, and this investment may result in increased general and administrative expense and a diversion of management’s time and attention from revenue-generating activities to compliance activities. If our efforts to comply with new laws, regulations and standards differ from the activities intended by regulatory or governing bodies, regulatory authorities may initiate legal proceedings against us and our business and operating results may be harmed.
The JOBS Act allows us to postpone the date by which we must comply with certain laws and regulations intended to protect investors and to reduce the amount of information we provide in our reports filed with the SEC.
The JOBS Act is intended to reduce the regulatory burden on “emerging growth companies.” As defined in the JOBS Act, a public company whose initial public offering of common equity securities occurred after December 8, 2011 and whose annual gross revenue is less than $1.0 billion will, in general, qualify as an “emerging growth company” until the earliest of:
| · | the last day of its fiscal year following the fifth anniversary of the date of its initial public offering of common equity securities; |
| · | the last day of its fiscal year in which it has annual gross revenue of $1.0 billion or more; |
| · | the date on which it has, during the previous three-year period, issued more than $1.0 billion in non-convertible debt; and |
| · | the date on which it is deemed to be a “large accelerated filer,” which will occur at the time the company (a) has an aggregate worldwide market value of common equity securities held by non-affiliates of $700 million or more as of the last business day of its most recently completed second fiscal quarter, (b) has been required to file annual and quarterly reports under the Exchange Act for a period of at least 12 months and (c) has filed at least one annual report pursuant to the Exchange Act. |
Under this definition, we are an “emerging growth company” and we could remain an emerging growth company until as late as December 31, 2018.
The JOBS Act provides that, so long as a company qualifies as an “emerging growth company,” it will, among other things:
| · | be exempt from the provisions ofSection 404(b) of the Sarbanes-Oxley Act requiring that its independent registered public accounting firm provide an attestation report on the effectiveness of its internal control over financial reporting; |
| · | be exempt from the “say on pay” provisions (requiring a non-binding stockholder vote to approve compensation of certain executive officers), the “say on golden parachute” provisions (requiring a non-binding stockholder vote to approve golden parachute arrangements for certain executive officers in connection with mergers and certain other business combinations) of the Dodd-Frank Act and certain disclosure requirements of the Dodd-Frank Act relating to compensation of its chief executive officer; |
| · | be permitted to omit the detailed compensation discussion and analysis from proxy statements and reports filed under the Exchange Act and instead provide a reduced level of disclosure concerning executive compensation; |
| · | be permitted to delay compliance with new or revised financial accounting standards available underSection 102(b) of the JOBS Act; and |
| · | be exempt from any rules that may be adopted by the Public Company Accounting Oversight Board requiring mandatory audit firm rotation or a supplement to the auditor’s report on the financial statements. |
We currently intend to take advantage of some or all of the reduced regulatory and reporting requirements that will be available to us so long as we qualify as an “emerging growth company,” except that we have irrevocably elected not to take advantage of the extension of time to comply with new or revised financial accounting standards available under Section 102(b) of the JOBS Act.
Our qualification as an “emerging growth company” means that our independent registered public accounting firm will not be required to provide an attestation report on the effectiveness of our internal control over financial reporting, which may increase the risk that weaknesses or deficiencies in our internal control over financial reporting go undetected. Likewise, so long as we qualify as an “emerging growth company,” we may elect not to provide investors with certain information, including certain financial information and certain information regarding compensation of our executive officers, that we would otherwise have been required to provide in filings we make with the SEC, which may make it more difficult for investors and securities analysts to evaluate our company. As a result, investor confidence in our company and the market price of our stock price may be adversely affected.
As a public reporting company, we are subject to rules and regulations established from time to time by the SEC and NASDAQ regarding our internal control over financial reporting. We may not complete needed improvements to our internal control over financial reporting in a timely manner, or our internal control over financial reporting may not be determined to be effective, which may adversely affect investor confidence in our company and, as a result, the value of our common stock.
We are a public reporting company subject to the rules and regulations established from time to time by the SEC and NASDAQ. These rules and regulations require, among other things, that we establish and periodically evaluate procedures with respect to our internal control over financial reporting. As of December 31, 2013, material weaknesses existed in our internal control over financial reporting. A material weakness is a deficiency, or a combination of deficiencies, that creates a reasonable possibility that a material misstatement of a company’s annual or interim financial statements will not be prevented or detected on a timely basis. See the information under the heading “—If we fail to remediate our material weaknesses and deficiencies in our internal control over financial reporting or we are unable to implement and maintain effective internal control over financial reporting in the future, the accuracy and timeliness of our financial reporting may be adversely affected, our reputation could be harmed and our stock price could decline significantly.”
Reporting obligations as a public company are likely to continue placing a considerable strain on our financial and management systems, processes and controls, as well as on our personnel. In addition, as a public company we are required to document and test our internal control over financial reporting pursuant to Section 404 of the Sarbanes-Oxley Act so that our management can certify as to the effectiveness of our internal controls over financial reporting by the time our annual report for the year ending December 31, 2014 is due and thereafter, which is requiring us to document and make significant changes to our internal control over financial reporting. Likewise, our independent registered public accounting firm will be required to provide an attestation report on the effectiveness of our internal control over financial reporting at such time that we cease to be an “emerging growth company,” as defined in the JOBS Act, although, as described in the preceding risk factor, we could potentially qualify as an “emerging growth company” until December 31, 2018. As a result, we will be required to improve our financial and managerial controls, reporting systems and procedures, to incur substantial expenses to test our systems and to make such improvements and to hire additional personnel. If our management is unable to certify the effectiveness of our internal control over financial reporting or if our independent registered public accounting firm cannot deliver (at such time as it is required to do so) a report attesting to the effectiveness of our internal control over financial reporting, or if we identify or fail to remediate material weaknesses in our internal control over financial reporting, we could be subject to regulatory scrutiny and a loss of public confidence, which could harm our reputation and the market price of our common stock. In addition, if we do not maintain adequate financial and management personnel, processes and controls, we may not be able to manage our business effectively or accurately report our financial performance on a timely basis, which could materially and adversely affect us and cause our stock price to decline significantly.
If securities or industry analysts do not publish research or reports about us, or publish inaccurate or unfavorable research or reports about us, our stock price and trading volume could decline.
The trading market for our common stock depends, to some extent, on the research and reports that securities or industry analysts publish about us or our business. We do not have any control over these analysts. If research analysts do not publish research or reports about us, or if one or more of the analysts who cover us should downgrade our stock or change their opinion of our stock, our stock price would likely decline. If one or more of these analysts should cease coverage of our company or fail to regularly publish reports on us, we could lose visibility in the financial markets, which could also cause our stock price or trading volume to decline.
We do not anticipate paying any cash dividends on our common stock for the foreseeable future.
We have not declared or paid any cash dividends since our formation and do not anticipate paying any cash dividends on our common stock for the foreseeable future. Because we do not intend to pay any dividends for the foreseeable future, an investor may need to sell its shares of common stock to realize a return on its investment, and an investor may not be able to sell its shares at or above the price the investor paid for them. Any determination to pay dividends in the future will be at the sole discretion of our Board of Directors. Accordingly, we may never pay dividends on the shares of our common stock. In addition, our ability to pay any dividends to our stockholders depends in part on the performance of our subsidiaries and their ability to distribute cash to us through distributions and dividends. The ability of our subsidiaries to make distributions to us may be restricted by, among other things, our and our subsidiaries’ strategic plans, financial results and conditions, liquidity, contractual, legal, financial and regulatory prohibitions and other restrictions on distribution and dividends, capital requirements and business prospects and such other factors as considered to be relevant to such determination.
Our organizational documents and Delaware law could discourage takeover attempts and lead to management entrenchment.
Our certificate of incorporation and bylaws contain provisions that could prevent, delay or deter a change in control of our company. These provisions could also make it difficult for stockholders to elect directors that are not nominated by the current members of our Board of Directors or take other corporate actions, including effecting changes in our management. These provisions include:
| · | a classified Board of Directors with three-year staggered terms and directors can only be removed for cause, which could delay the ability of stockholders to change the membership of a majority of our Board of Directors; |
| · | the ability of our Board of Directors to issue shares of preferred stock and to determine the price and other terms of those shares, including preferences and voting rights, without stockholder approval, which could be used to significantly dilute the ownership of a hostile acquirer; |
| · | the exclusive right of our Board of Directors to elect a director to fill a vacancy created by the expansion of our Board of Directors or the resignation, death or removal of a director, which prevents stockholders from being able to fill vacancies on our Board of Directors; |
| · | a prohibition on stockholder action by written consent, which forces stockholder action to be taken at an annual or special meeting of our stockholders; |
| · | the requirement that a special meeting of stockholders may be called only by the Chairman of the Board, the Vice Chairman of the Company’s Board of Directors, our Chief Executive Officer, or a majority vote of our Board of Directors, which could delay the ability of our stockholders to force consideration of a proposal or to take action, including the removal of directors; |
| · | the requirement for the affirmative vote of holders of at least 662/3% of the voting power of all of the then outstanding shares of the voting stock, voting together as a single class, to amend certain provisions of our certificate of incorporation and bylaws, which may inhibit the ability of an acquiror to effect such amendments to facilitate an unsolicited takeover attempt; and |
| · | a provision that certain litigation against us can only be brought in the Court of Chancery of the State of Delaware. |
In addition, as a Delaware corporation, we have not opted out of Section 203 of the Delaware General Corporation Law. These provisions may prohibit large stockholders, in particular those owning 15% or more of our outstanding voting stock, from merging or combining with us for a certain period of time.
| Item 1B. | Unresolved Staff Comments |
Not applicable.
Our company headquarters are located in New York, NY, with other U.S. offices in Aventura, Florida and Hoboken, NJ. Outside the United States, we have a small office in London. We lease each of these facilities and do not own any real property. We believe we have adequate office space or will be able to find additional space on reasonable commercial terms to meet our expected growth.
We may from time to time be involved in litigation and claims incidental to the conduct of our business, including but not limited to intellectual property claims, and other legal proceedings.
In November 2012, a former employee of the Company filed a complaint in the United States District Court for the Southern District of New York against the Company, Brian Ferdinand, Richard Schaeffer and entities controlled by Mr. Schaeffer. Among other claims, the complaint alleged breach of contract, breach of fiduciary duty and workplace violations. On April 30, 2013, a Settlement Agreement and Release (the “Settlement Agreement”) was executed between all parties. Pursuant to the terms of the Settlement Agreement, the Company and Mr. Schaeffer paid the plaintiff $250,000 and $750,000, respectively.
The Company is a defendant in an action filed on July 23, 2013 in the Supreme Court of The State of New York by two individuals (the “OTC Parties”) who were involved in the establishment and operation of the over-the-counter brokerage operations of LPS and Futures (the “OTC Operations”), which ceased on June 1, 2013. Also named as defendants are one of the Company’s subsidiaries and Mr. Ferdinand (collectively with the Company, the “Liquid Defendants”). The complaint alleges fraudulent inducement, breach of contract and unjust enrichment and seeks specified damages of up to $3.0 million and other compensatory and punitive damages in an amount to be determined at trial, as well as such other further relief as the court deems just, proper and equitable under the circumstances. On September 13, 2013, the Liquid Defendants filed a motion to dismiss the complaint against all of the defendants on a number of grounds. Oral argument on the motion was held on March 5, 2014 and a decision is pending. On October 3, 2013, the Company filed suit against the OTC Parties on the grounds that that their use of the name “LPS Partners Inc.” for their new company is improper and will confuse LPS’s customers. The OTC Parties have denied the allegations set forth in the complaint.
The Company believes that the claims alleged by the OTC Parties are without merit and intends to defend such claims vigorously. At this point, the Company is unable to develop a meaningful estimate of reasonably possible loss in connection with these claims due to a number of factors, including (i) the early stage of the matter, (ii) the uncertainty as to the outcome of the pending motion to dismiss, and (iii) the presence of significant factual issues that would need to be resolved. Legal proceedings are inherently uncertain, and we cannot assure you that an adverse decision in this dispute would not have a material adverse effect on the Company’s business, financial condition, liquidity or results of operations. Furthermore, we do not expect the Company’s directors’ and officers’ insurance carrier to compensate the Company for losses relating to this dispute.
On March 11, 2014, the Company received a letter from counsel for a former employee claiming that the Company and certain other parties were responsible for paying the former employee stock compensation in the amount of $500,000 in consideration for services provided to one of the Company’s subsidiaries, Liquid Partners, LLC (then known as Centurion Capital Group, LLC). The time period when these purported services were provided is prior to both the Company’s acquisition of Liquid Partners, LLC as well as the actual period of the former employee’s employment by the Company. The Company believes that the claims alleged by this former employee are without merit and intends to defend such claims vigorously. In addition, the Company believes that it would be entitled to indemnification from the parties from whom the Company acquired its interests in Liquid Partners, LLC for any losses with respect to such former employee’s claims.
The Company is not currently subject to any other pending or, to its knowledge, threatened legal proceedings that it expects could have a material adverse impact on its consolidated financial statements, liquidity or results of operations.
| Item 4. | Mine Safety Disclosure |
Not applicable.
Part II
| Item 5. | Market for the Registrant’s Common Equity, Related Stockholder Matters and Issuer Purchases of Equity Securities |
Securities
Our common stock has been listed on the NASDAQ Global Market under the symbol “LIQD” since July 26, 2013. Prior to that date, there was no public trading market for our common stock. The following table sets forth for the periods indicated the high and low sales prices per share of our common stock as reported on the NASDAQ Global Market:
| | | High | | | Low | |
| Third Quarter 2013 | | $ | 10.30 | | | $ | 6.16 | |
| Fourth Quarter 2013 | | $ | 9.05 | | | $ | 6.21 | |
On March 25, 2014, the last reported sale price of our common stock on the NASDAQ Global Market was $3.95 per share.
As of March 25, 2014, we had 70 holders of record of our common stock. The actual number of stockholders is greater than these numbers of record holders, and includes stockholders who are beneficial owners, but whose shares are held in street name by brokers and other nominees. This number of holders of record also does not include stockholders whose shares may be held in trust by other entities.
We have never declared or paid, and do not anticipate declaring or paying, any cash dividends on our capital stock. Any future determination as to the declaration and payment of dividends, if any, will be at the discretion of our Board of Directors and will depend on then existing conditions, including our financial condition, operating results, contractual restrictions, capital requirements, business prospects and other factors our Board of Directors may deem relevant.
Performance Graph
This performance graph shall not be deemed “soliciting material” or to be “filed” with the Securities and Exchange Commission for purposes ofSection 18 of the Securities Exchange Act of 1934, as amended (“Exchange Act”) or otherwise subject to the liabilities under that Section, and shall not be deemed to be incorporated by reference into any filing of the company under the Securities Act of 1933, as amended (“Securities Act”) or the Exchange Act.
The graph below matches Liquid Holdings Group Inc.’s cumulative 5-Month total stockholder return on common stock with the cumulative total returns of the NASDAQ Composite index and the NASDAQ Computer & Data Processing index. The graph tracks the performance of a $100 investment in our common stock and in each index (with the reinvestment of all dividends) from July 26, 2013 (the date our common stock commenced trading on the NASDAQ) through December 31, 2013. Such returns are based on historical results and are not indicative of, nor intended to forecast, the future performance of our stock.
COMPARISON OF CUMULATIVE TOTAL RETURN*
Among Liquid Holdings Group Inc., the NASDAQ Composite Index,
and the NASDAQ Computer & Data Processing Index
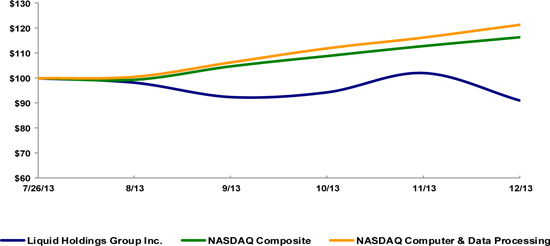
*$100 invested on 7/26/13 in stock and 7/31/13 in index, including reinvestments of dividends. Fiscal year ending December 31.
| | | 7/26/13 | | | 8/31/13 | | | 9/31/13 | | | 10/31/13 | | | 11/31/13 | | | 12/31/13 | |
| Liquid Holdings Group Inc. | | | 100.00 | | | | 98.17 | | | | 92.28 | | | | 94.23 | | | | 102.13 | | | | 90.84 | |
| NASDAQ Composite | | | 100.00 | | | | 99.32 | | | | 104.69 | | | | 108.82 | | | | 112.79 | | | | 116.26 | |
| NASDAQ Computer & Data Processing | | | 100.00 | | | | 100.56 | | | | 106.30 | | | | 111.94 | | | | 116.28 | | | | 121.36 | |
Unregistered Sales of Equity Securities and Use of Proceeds
On July 31, 2013, we closed our initial public offering of 3,175,000 shares of our common stock sold by us. The offer and sale of all of the shares in the initial public offering were registered under the Securities Act pursuant to a registration statement on Form S-1 (File No. 333-187859), which was declared effective by the SEC on July 25, 2014. Upon the closing of the initial public offering, all common units of the Company outstanding automatically converted into shares of common stock. The offering did not terminate until after the sale of all of the shares registered on the registration statement. Sandler O’Neill & Partners, L.P. acted as the underwriter. The public offering price of the shares sold in the offering was $9.00 per share. We received net proceeds in the initial public offering of approximately $17.3 million after deducting underwriting discounts and commissions of approximately $ 2.6 million and offering related expenses of approximately $8.7 million. No payments for such expenses were made directly or indirectly to (i) any of our officers or directors or their associates, (ii) any persons owning 10% or more of any class of our equity securities, or (iii) any of our affiliates. There has been no material change in the planned use of proceeds from our initial public offering as described in our final prospectus filed with the SEC on July 26, 2013 pursuant to Rule 424(b) of the Securities Act.
Since January 17, 2012, we have made the following sales of unregistered securities:
Acquisition-Related Issuances
On April 24, 2012, we issued 2,984,229 common shares to SHAF Holdings LLC and Schaeffer Holdings LLC, entities controlled by Richard Schaeffer, as consideration for our acquisition of 90% of the outstanding shares of Liquid Futures, LLC.
On April 24, 2012, we issued 3,714,450 common shares to Ferdinand Holdings, LLC, an entity controlled by Brian Ferdinand, as consideration for our acquisition of 10% of the outstanding shares of Liquid Futures, LLC, all of the outstanding shares of Liquid Prime Holdings LLC and 48.75% of the outstanding shares of Liquid Trading Institutional LLP.
On April 24, 2012, we issued 3,280,645 common shares to CMK Keller Holdings, LLC, an entity controlled by Robert Keller, as consideration for our acquisition of 48.75% of the outstanding shares of Liquid Trading Institutional LLP.
On April 27, 2012, we issued 868,338 common shares to Samuel Gaer as consideration for our acquisition of the Tragara Alpha Partners LLC intellectual property assets.
On June 5, 2012, we issued 169,453 common shares to an accredited investor as consideration for our acquisition of all the remaining outstanding shares of Liquid Trading Institutional LLP.
On July 21, 2012, we issued 951,432 common shares to a total of four accredited investors as consideration for our acquisition of all the outstanding shares of Liquid Partners, LLC.
On August 27, 2012, we issued 2,038,857 common shares to a total of nineteen accredited investors as consideration for our acquisition of all of the outstanding shares of Green Mountain Analytics, LLC.
On September 30, 2012, we issued 495,821 common shares to a total of eight accredited investors as consideration for our acquisition of all the outstanding shares of LTI, LLC. In connection with this acquisition, we paid a finder’s fee of $425,000 to Centurion Consulting Partners, Inc.
On July 31, 2013, we issued 245,632 shares of common stock to former equity holders of Fundsolve Ltd. (“Fundsolve”) pursuant to our share purchase agreement in respect of our acquisition of Fundsolve, equivalent to 1% of the number of our common shares to be outstanding upon completion of our initial public offering.
Capital Awards-Related Issuances
On April 25, 2012, we granted to our directors, officers, employees, consultants and other service providers an aggregate of 1,623,546 common shares pursuant to the terms of our Amended and Restated 2012 Equity Plan in exchange for services rendered by such directors, officers, employees or consultants.
On September 30, 2012, the board authorized the grant of units to Brian Ferdinand, the Vice Chairman of the Company’s Board of Directors and Head of Corporate Strategy, representing 2% of the aggregate issued and outstanding common units of the Company, upon the initial confidential submission of this registration statement with the SEC. On December 18, 2012, the Board authorized the grant of incentive units to Brian Ferdinand representing 4% of the aggregate issued and outstanding units of the Company, after such grant, as of the date of grant.
On December 10, 2012, we granted to Richard Schaeffer, one of our founders and a member of our Board of Directors, incentive units representing 3.4% of the aggregate issued and outstanding units of the Company, after such grant, as of the date of grant pursuant to the terms of our Amended and Restated 2012 Equity Plan.
On December 10, 2012, we granted to Brian Storms, our Chief Executive Officer and a Director, restricted stock units equal to 4% of the outstanding common units of the Company, after such grant, as of December 1, 2012, pursuant to an employment agreement and the terms of our 2012 Stock Incentive Plan. Approximately one-third of these units vested January 1, 2013, approximately one-third vested December 1, 2013 and approximately one-third will vest December 1, 2014. Upon termination, Mr. Storms will retain all unvested restricted stock units unless terminated for cause (as defined in the agreement) in which case all unvested restricted stock units will be forfeited.
On March 1, 2013, we granted to Robert O’Boyle, our Executive Vice President, Director of Sales and Marketing, restricted stock units equal to 0.25% of the outstanding common units of the Company as of the date of the grant. One-third of these RSUs vested on March 1, 2014, one-third will vest on March 1, 2015 and one-third will vest on March 1, 2016. Upon termination, all unvested RSUs will immediately and automatically be terminated and forfeited back to the Company, unless Mr. O’Boyle is terminated without cause, in which case all unvested RSUs scheduled to vest through the end of the year of termination will automatically vest.
On March 13, 2013, we granted to Jose Ibietatorremendia, our General Counsel, restricted stock units equal to 0.25% of the outstanding common units of the Company as of the date of the grant. One-third of these RSUs vest on March 13, 2014, one-third will vest on March 13, 2015 and one-third will vest on March 13, 2016. Upon termination, all unvested RSUs will immediately and automatically be terminated and forfeited back to the Company, unless Mr. Ibietatorremendia is terminated without cause, in which case all unvested RSUs scheduled to vest through the end of the year of termination will automatically vest.
On May 3, 2013, we granted to Kenneth Shifrin, our Chief Financial Officer, 96,288 RSUs. One-third of these RSUs vested on September 18, 2013, one-third will vest on September 18, 2014 and one-third will vest on September 18, 2015. Upon termination, all unvested RSUs will immediately and automatically be terminated and forfeited back to the Company, unless Mr. Shifrin is terminated without cause, in which case all unvested RSUs scheduled to vest through the end of the year of termination will automatically vest.
On May 15, 2013, we granted to Mr. Ferdinand 341,274 RSUs. One-half of these RSUs will vest on May 15, 2014 and one-half will vest on May 15, 2015. Upon termination, all unvested RSUs will be retained by Mr. Ferdinand, unless Mr. Ferdinand is terminated for cause, in which case all unvested RSUs scheduled to vest through the end of the year of termination will be automatically forfeited.
In addition to the grants set forth above, from January 9, 2013 to May 3, 2013, we granted to our employees an aggregate of 179,626 RSUs under our 2012 Amended and Restated Stock Incentive Plan.
Other Issuances
On July 21, 2012, we sold 1,239,986 common shares to an entity controlled by Douglas J. Von Allmen, a holder of more than 5% of our common stock, and we have issued an additional 242,020 common shares issued prior to December 25, 2012, for a purchase price of $12,500,000 pursuant to a cash subscription agreement. In connection with this sale, we paid a finder’s fee of $1,250,000 to Centurion Consulting Partners, Inc.
On January 18, 2013, we sold 52,655 common shares to an accredited investor for an aggregate purchase price of $500,000.
On January 18, 2013, we sold 59,918 common shares to Victor R. Simone, Jr., one of our directors, for an aggregate purchase price of $500,000.
On February 8, 2013, we sold 36,387 common shares to an accredited investor for an aggregate purchase price of $300,000.
On March 5, 2013, we sold 183,773 common shares to Jay Bernstein, one of our directors, for an aggregate purchase price of $1,500,000.
On March 12, 2013, we sold 46,096 common shares to an accredited investor for an aggregate purchase price of $250,000. The holder of these shares was entitled to anti-dilution protection for the period beginning March 23, 2013 and ending on the earlier of the consummation of our initial public offering or May 15, 2013.
On March 12, 2013, we sold 15,265 common shares to an accredited investor for an aggregate purchase price of $125,000. The holder of these shares was entitled to anti-dilution protection for the period beginning March 23, 2013 and ending on the earlier of the consummation of our initial public offering or May 15, 2013.
On April 5, 2013, we issued 720,498 common shares to an entity controlled by Mr. Von Allmen.
On July 31, 2013, contemporaneously with our initial public offering, entities controlled by Mr. Von Allmen purchased 1,722,100 shares of our common stock from us directly at $9.00 per share. No underwriting discount was paid on such shares; however, we paid a fee of $0.585 per share to the underwriters of our initial public offering, which fee was equal to the underwriting discount for our initial public offering.
On July 31, 2013, contemporaneously with our initial public offering, an entity controlled by Mr. Ferdinand purchased 80,079 shares of our common stock from us directly at $9.00 per share. No underwriting discount was paid on such shares; however, we paid a fee of $0.585 per share to the underwriters of our initial public offering, which fee was equal to the underwriting discount for our initial public offering.
On July 31, 2013, we issued 142,524 shares of common stock to Mr. Ferdinand pursuant to the anti-dilution terms of the incentive units granted to him on December 18, 2012, representing 4% of the aggregate issued and outstanding units of the Company as of the date of such grant, after giving effect to such grant, which specified that Mr. Ferdinand was entitled to an additional grant of common equity interests immediately following the consummation of our initial public offering in order to preclude the dilution of the 4% grant.
None of the foregoing transactions involved any underwriters, underwriting discounts or commissions, or any public offering. We believe these transactions were exempt from registration under the Securities Act in reliance upon Section 4(a)(2) of the Securities Act as transactions by an issuer not involving any public offering. The recipients of the securities in each of these transactions represented their intentions to acquire the securities for investment only and not with a view to or for sale in connection with any distribution thereof. All recipients had adequate access, through their relationships with us, to information about our company.
| Item 6. | Selected Financial Data |
You should read the following selected financial data together with the section titled “Management’s Discussion and Analysis of Financial Condition and Results of Operations,” the consolidated financial statements and the accompanying notes of Liquid Holdings Group, Inc.
We have presented the condensed consolidated balance sheet data as of December 31, 2013 and 2012 and the condensed consolidated statement of operations and comprehensive loss data for the year ended December 31, 2013 and for the period from April 24, 2012 to December 31, 2012 on a historical basis based on the consolidated financial statements and the accompanying notes of Liquid Holdings Group, Inc. included in this Annual Report on Form 10-K. We have presented the condensed consolidated balance sheet data as of April 24, 2012 and the condensed consolidated statement of operations and comprehensive loss data for the period from January 1, 2012 to April 24, 2012 based on the combined financial statements of the “Liquid Predecessor Companies” (collectively, the “Predecessor Company”) as described in Note 1 to the consolidated financial statements.
| | | Liquid Holdings Group, Inc. | | | Predecessor
Company | |
| | | For the Fiscal
Year Ended
December 31,
2013 | | | From Inception
(April 24, 2012)
to December 31,
2012 | | | Period From
January 1, 2012
to April 24, 2012 | |
| Condensed Consolidated Statement of Operations and Comprehensive | | | | | | | | | | | | |
| Loss Data: | | | | | | | | | | | | |
| Revenues: | | | | | | | | | | | | |
| Software services | | $ | 2,925,650 | | | $ | 1,032,534 | | | $ | — | |
| Brokerage activities | | | 1,872,647 | | | | 1,295,248 | | | | — | |
| Total revenues | | | 4,798,297 | | | | 2,327,782 | | | | — | |
| Cost of revenues (exclusive of items shown separately below): | | | | | | | | | | | | |
| Software services | | | 1,452,801 | | | | 388,860 | | | | — | |
| Brokerage activities | | | 1,248,192 | | | | 817,559 | | | | — | |
| Total cost of revenues | | | 2,700,993 | | | | 1,206,419 | | | | — | |
| Gross margin | | | 2,097,304 | | | | 1,121,363 | | | | — | |
| Operating expenses: | | | | | | | | | | | | |
| Compensation | | | 18,885,418 | | | | 28,285,420 | | | | 73,494 | |
| Consulting fees | | | 12,727,112 | | | | 3,081,002 | | | | — | |
| Depreciation and amortization | | | 7,407,062 | | | | 2,761,703 | | | | 6,912 | |
| Other | | | 9,797,831 | | | | 3,485,427 | | | | 284,333 | |
| Impairment of goodwill and intangible assets | | | — | | | | 1,550,652 | | | | 3,300,000 | |
| Total operating expenses | | | 48,817,423 | | | | 39,164,204 | | | | 3,664,739 | |
| Loss from operations | | | (46,720,119 | ) | | | (38,042,841 | ) | | | (3,664,739 | ) |
| Non-operating income (expenses): | | | | | | | | | | | | |
| Registration rights penalty expense | | | — | | | | (1,674,704 | ) | | | — | |
| Unrealized gain (loss) on contingent consideration payable | | | — | | | | 129,000 | | | | — | |
| Gain (loss) on settlement of contingent consideration payable | | | (649,688 | ) | | | 1,545,000 | | | | 3,300,000 | |
| Interest and other, net | | | 60,500 | | | | (306,659 | ) | | | — | |
| Total non-operating expenses, net | | | (589,188 | ) | | | (307,363 | ) | | | 3,300,000 | |
| Loss before income taxes | | | (47,309,307 | ) | | | (38,350,204 | ) | | | (364,739 | ) |
| Income tax benefit | | | (697,260 | ) | | | (104,340 | ) | | | — | |
| Net loss | | | (46,612,047 | ) | | | (38,245,864 | ) | | | (364,739 | ) |
| Other comprehensive losses: | | | | | | | | | | | | |
| Foreign currency translation | | | (92,648 | ) | | | (18,073 | ) | | | — | |
| Total comprehensive loss | | $ | (46,704,695 | ) | | $ | (38,263,937 | ) | | $ | (364,379 | ) |
| | | | | | | | | | | | | |
| Basic and diluted loss per common share: | | $ | (2.10 | ) | | $ | (2.46 | ) | | $ | — | |
| Weighted average common shares outstanding during the period, basic and diluted | | | 22,230,943 | | | | 15,517,444 | | | | — | |
| | | At December 31,
2013 | | | At December 31,
2012 | | | Predecessor
Company at
April 24, 2012 | |
| Condensed Consolidated Balance Sheet Data: | | | | | | | | | | | | |
| Assets: | | | | | | | | | | | | |
| Cash and cash equivalents | | $ | 8,473,847 | | | $ | 1,380,078 | | | $ | 121,550 | |
| Note receivable from related party—QuantX | | | — | | | | 2,250,000 | | | | — | |
| Other intangible assets, net of amortization | | | 11,505,853 | | | | 18,740,125 | | | | 2,108,000 | |
| Goodwill | | | 13,182,936 | | | | 13,182,936 | | | | 8,392,402 | |
| Other assets | | | 2,881,249 | | | | 6,395,492 | | | | 784,324 | |
| Total assets | | $ | 36,043,885 | | | $ | 41,948,631 | | | $ | 11,406,276 | |
| Liabilities and equity: | | | | | | | | | | | | |
| Accounts payable and accrued expenses | | $ | 3,503,590 | | | $ | 3,199,869 | | | $ | 117,765 | |
| Contingent consideration payable | | | — | | | | 1,561,000 | | | | 1,973,000 | |
| Future obligation with IPO | | | — | | | | — | | | | 8,327,000 | |
| Other liabilities | | | 24,886 | | | | 4,012,402 | | | | 1,079,180 | |
| Total liabilities | | | 3,528,476 | | | | 5,573,402 | | | | 11,496,945 | |
| Equity | | | 32,515,409 | | | | 36,375,229 | | | | (90,669 | ) |
| Total liabilities and equity | | $ | 36,043,885 | | | $ | 41,948,631 | | | $ | 11,406,276 | |
| Item 7. | Management’s Discussion and Analysis of Financial Condition and Results of Operations |
You should read the following discussion and analysis of our financial condition and results of operations together with “Item 6. Selected Financial Data” and the financial statements and related notes included elsewhere in this Annual Report on Form 10-K. This discussion contains forward-looking statements and involves numerous risks and uncertainties including, but not limited to, those described in the section titled “Risk Factors.” Actual results may differ materially from those contained in any forward-looking statements. You should read the sections titled “Special Note Regarding Forward-Looking Statements” and “Risk Factors.”
Overview
Liquid Holdings Group, Inc. provides a next-generation proprietary cloud-based trading and portfolio management solution that seamlessly integrates order and execution management with real-time risk management, reporting, shadow accounting and managed services in a single platform for the financial services community. Our current and prospective customers include small to mid-sized hedge fund managers, asset managers, wealth management offices, family offices and financial institutions.
We deliver our technology efficiently, quickly and securely as a SaaS, solution. The advanced feature set of our platform includes customizable and rapidly deployable multi-asset class trading software coupled with real-time risk management, shadow accounting and reporting capabilities.We believe that our platform’s comprehensive and integrated real-time approach provides a distinctive offering to our customers. We believe our approach creates efficiencies for our customers by reducing the number of service provider relationships the customer needs to manage and maintain and reducing the level of IT personnel necessary to support and integrate those multiple applications.
Our platform offers the following features and capabilities:
| · | A Single, Real-Time Consolidated Portfolio View. We offer a single trade, order and position management solution for multiple asset classes such as equities, options, futures, fixed income securities and FX. Our customers can aggregate positions, exposures and risk metrics across all of their portfolios and asset classes on a single screen in real-time. With our platform there is no need to purchase or integrate several external programs to consolidate risk management, shadow accounting and reporting functions across asset classes; |
| · | Real-Time Portfolio Risk Management and Scenario Analysis. Our platform’s architecture enables our customers to perform highly complex computations of risk and project probabilistic scenarios using data feeds in real-time. This allows our customers to quantify the probability of portfolio risk based on variables that they input to simulate a macro or micro event based on historical market events. It also enables users to calculate theoretical values instantly for over a dozen historic market events and crashes to simulate portfolio performance in times of market volatility. Our platform automatically routes trade data to our risk management system for real-time analysis. We believe most of our competitors offer this type of analysis only on an end-of-day or as-requested basis; |
| · | Real-Time Shadow Accounting and Reporting Management, Fee Management, and Transaction Cost Analysis. Our shadow accounting and reporting database was designed to reconcile a vast number of trades and their associated fees and transaction costs, giving traders and managers a clear and concise view of their portfolio accounting, including exchange/ECN fees, “soft dollar” arrangements, and brokerage and accounting adjustments in real-time. Our flexible and scalable architecture allows traders, operations personnel and senior management to view customized reports on an individual, group or enterprise wide basis; |
| · | Broker, Execution and Clearing Firm Agnostic. We provide our customers with the independence to select their preferred broker execution venues and clearing relationships. Our technology is able to connect our customers seamlessly to multiple prime brokers and over 100 liquidity destinations, including broker-dealers, private alternative trading systems/platforms, or dark pools, and other electronic communication networks, or ECNs. We do not monetize, sell or take the opposing side of our customers’ order flow, nor do we act as a market maker. Our technology allows our customers to be “broker neutral” in their choice of where a trade is executed, how the trade is sent to the market and which broker executes and clears the trade. We have established connectivity with some of the most recognized prime brokers and banking platforms in the world, offering our customers the ability to access these relationships for capital introduction and execution services globally; and |
| · | Managed Services. We provide managed services supportfor all customers which includes comprehensive trade reconciliation, corporate actions and dividend processing as well as start of day/end of day file processing and delivery between third parties and their clients as part of our overall solution. We believe that these services reduce our customers’ need to hire operations staff. |
We have branded our trading platform as LiquidTradeSM, our risk metrics platform as LiquidMetrics® and our shadow accounting platform as LiquidViewSM, together constituting the Liquid platform.
Key Operating Metrics
In addition to the U.S. GAAP metrics that we regularly monitor, we also monitor the following metrics to evaluate our business, measure our performance, identify trends affecting our business and make strategic decisions:
| | | (1) | | | (1) | | | | | | | | | | |
| | | As of | | | As of | | | As of | | | As of | | | As of | |
| Key Operating Metric | | December 31, 2012 | | | March 31, 2013 | | | June 30, 2013 | | | September 30, 2013 | | | December 31, 2013 | |
| | | | | | | | | | | | | | | | |
| Contracts - Contributing to Current Revenue | | | | | | | | | | | | | | | | | | | | |
| Number of Customers | | | 20 | | | | 25 | | | | 23 | | | | 27 | | | | 48 | |
| Number of Units | | | 327 | | | | 351 | | | | 385 | | | | 455 | | | | 517 | |
| Number of Units - QuantX(2) | | | 274 | | | | 290 | | | | 304 | | | | 378 | | | | 421 | |
| | | | | | | | | | | | | | | | | | | | | |
| Contracts - Expected to Contribute to Future Revenue(3) | | | | | | | | | | | | | | | | | | | | |
| Number of Customers | | | N/A | | | | N/A | | | | 7 | | | | 21 | | | | 29 | |
| Number of Units | | | N/A | | | | N/A | | | | 35 | | | | 110 | | | | 139 | |
| Number of Units - QuantX(2) | | | N/A | | | | N/A | | | | 8 | | | | 13 | | | | 14 | |
| | | | | | | | | | | | | | | | | | | | | |
| Contracts – Total | | | | | | | | | | | | | | | | | | | | |
| Number of Customers | | | 20 | | | | 25 | | | | 30 | | | | 48 | | | | 77 | |
| Number of Units | | | 327 | | | | 351 | | | | 420 | | | | 565 | | | | 656 | |
| Number of Units - QuantX(2) | | | 274 | | | | 290 | | | | 312 | | | | 391 | | | | 435 | |
| | | | | | | | | | | | | | | | | | | | | |
| Annual Contract Value (in millions) | | | N/A | | | | N/A | | | $ | 1.707 | | | $ | 3.158 | | | $ | 4.520 | |
| (1) | As of December 31, 2012 and March 31, 2013, our customers were contracted on a month-to-month subscription basis. As such, we did not have customers or units relating to contracts expected to contribute to future revenue, nor Annual Contract Value, as key operating metrics for these periods. |
| (2) | Represents units, included in “Number of Units,” that are being used by QuantX, a related party as a result of certain past or present relationships with Messrs. Ferdinand, Keller, Schaeffer, Von Allmen and Tew, or paid for by QuantX on behalf of their own customers. QuantX is an entity with which the founders of the Company are affiliated. |
| (3) | Represents contracts that have been signed but are not yet generating revenue because our product has not yet been deployed to the customer. |
Number of Customers.We believe that our ability to expand our customer base is an indicator of our market penetration and the growth of our business as we continue to invest in our direct sales and marketing teams.
Number of Units.Since our customers generally pay fees based on the number of units of our platform being used within their organizations, we believe the total number of units is an indicator of the growth of the business. Each unit represents an individual element of the Liquid platform such as LiquidMetrics®, LiquidTradeSM or LiquidViewSM.
Annual Contract Value.ACV represents, as of the end of any quarter for which ACV is reported, the estimated value of subscription payments payable to us during the next twelve months (or, in the case of subscription contracts where the remaining contract term is less than twelve months, assuming no renewal of these contracts, then for the lesser remaining term of such contracts) pursuant to subscription contracts existing at the end of the quarter for which Annual Contract Value is reported, including contracts pursuant to which we are currently generating no revenue because our product has not yet been deployed to the customer. Most of our revenues are generated from subscription contracts, which are paid monthly and typically have a minimum term of one year, with revenues recognized ratably over the term of the subscription contract.
ACV and ACVC are not financial measures calculated and presented in accordance with U.S GAAP and should not be considered as alternatives to revenue or any other financial measures so calculated. Management uses this information as a basis for planning and forecasting core business activity for future periods and believes it is a helpful indicator of potential future revenue. However, we caution investors that our presentations of these measures may not be comparable to similar measures as disclosed by other issuers, because other companies may calculate these measures differently. Additionally, our actual revenue may be lower or higher than ACV. ACV and ACVC are forward-looking estimates. See “Special Note Regarding Forward-Looking Statements.”
Factors Affecting Our Performance
The Pace of Financial Services Innovation.The financial services industry has faced substantial pressure to innovate over the last decade. Following the implementation of decimalization in financial market pricing in 2001, new technologies were needed to accommodate the need to execute, value and evaluate risk for securities trading. Today, the industry innovates rapidly as technology adapts to the demands of both regulatory changes and changes in investor preferences. We believe our products and services compete favorably, and that our flexible architecture will allow us to innovate and scale new product releases quickly. However, we may not be able to keep up with evolving industry standards and changing trading systems, practices and techniques. Continued demand for advanced technology resources in the financial services industry is important to future demand for our products.
Revenue Growth. We believe the key driver to improve our financial performance will be revenue growth. We believe demand for our products will increase as key industry trends drive innovation. We plan to add resources in an effort to gain market share and increase revenue from existing and new customers. While revenue growth may fail to increase or may decline for a number of reasons, including significant competition and lack of market acceptance of our technology and platform, we seek to generate revenue growth from, among other things, the execution of institutional customer contracts as we increasingly penetrate the marketplace. Our ability to achieve sufficient revenue to generate net income and to fully fund operations will require continued significant near-term investments in technology development, marketing and customer support personnel. We expect these investments to negatively impact current net income and cash balances, but also to set the framework for improving financial performance in the near-and long-term as we scale up our business.
The hedge fund industry has continued to grow and stabilize since the market correction of 2008. Current forecasts indicate continued growth through 2014 and 2015, with continued new fund start-ups and spinoffs. Institutional investors look to enhance and diversify their investment portfolios, through alternative asset managers and emerging mandates from large investors, in order to continue to show health and growth. Emerging hedge funds, those with assets under management of $100 million to $500 million, with three- year track records are investing in technology to manage increased activity and required regulatory and operational oversight. This market segment, once penetrated, could have a positive impact to our future revenues. Additionally, the focus and emphasis on risk analytics as a mission critical application, and market acceptance of LiquidMetrics® as a best of breed risk system, could have a significant impact to our revenues along with the broad acceptance of LiquidMetrics® as a compelling risk tool for sell side and managed accounts. Traditional registered investment advisors and high net worth investment manager segments are also looking to offer alternative investments and can benefit from the Liquid platform. The ability to advertise hedge funds may generate more interest than is currently anticipated and would further drive focus on technology for investor reporting distribution.
Potential negative impacts could come in the form of unexpected market corrections that dramatically reduce available asset flows into hedge funds, as well as closure of hedge funds or decline in the opening of new hedge funds. Additionally, a retraction of the broad adoption of “cloud deployment” would require Liquid to modify its distribution method and could slow growth.
Delivery of New Product Releases. Customer demands in the financial services industry are becoming increasingly complex. If we fail to accurately predict customers’ changing needs and emerging technology trends, our business could be negatively affected. It is important for us to have a robust development pipeline and to deliver new releases on time and within budget. We believe our flexible platform allows us the ability to develop and deliver customized solutions for particular customer needs. Members of our core technology development team have worked together for over a decade, first at Web Quote SRL, then at GMA from 2002 until we acquired GMA in 2012. As a result, we are able to develop new modules in a flexible and continuous manner. We believe the maintenance of our core development team’s continuity and its ability to produce new product versions on time is important to the future growth of our company.
Organizational Resources. We plan to expand our sales force to support anticipated growth in customers and demand for our products. While we intend to increase personnel, funding and capital expenditures devoted to the research and development of new and advanced technologies, if we fail to hire additional necessary personnel or to improve our key business applications, processes and IT infrastructure, we may not be able to achieve or manage our expected growth. These plans will require a significant investment in managerial talent, human resources, information systems, processes and controls to ensure maintenance of efficient and economic operations. These investments are critical to our ability to increase revenue, to generate net income and to fully fund operations.
International Expansion. Our future growth will depend, in part, on our ability to continue to increase sales of our platform internationally. Historically, a significant portion of our revenues and billings have been generated from outside the United States, with the substantial portion of this revenue coming from QuantX, our largest customer and a related party as a result of certain past or present relationships with Messrs. Ferdinand, Keller, Schaeffer, Von Allmen and Tew. We intend to pursue new customers internationally which may increase operating expenses in the near term and may not result in revenues until future periods, if at all. International expansion may also increase the risk associated with our business.
Financial Overview
Revenues
Our revenues consist of the following:
Software services. We offer our software through our direct sales force and through our strategic partner relationships. Direct customer revenue sales are generated through subscription fees. Institutional revenue is generated through subscription fees, integration and customization fees and hosting and gateway fees. In addition, on December 1, 2013, we started charging customers for market data services. Market data is trade-related data for a financial instrument reported by a trading venue, such as a stock exchange, which allows traders and investors to know the latest price and see historical trends for that financial instrument. We are not charging a profit on market data, but rather we are passing on the cost we incur from the market data provider, which has contracted with us to provide such data, to the customer. These pass-through charges for market data services are included in our software services revenues. Prior to December 31, 2012, our software services revenues also included messaging fees. Messaging fees are an additional technology fee of a fixed cost per message to those who utilize our infrastructure. Each time an order is created, sent or cancelled a message must be sent to a counterparty who will in kind return a message of confirmation. These fees were exclusively charged to our customer QuantX, but ceased for periods after December 31, 2012 and, therefore, messaging fees are no longer included in our software services revenues. We generally recognize software services revenue at the time the software is made available to the customer, provided all other revenue recognition criteria have been met. To date, the majority of our software services revenue has been attributable to related parties, including QuantX. We expect our software services revenue to increase in absolute dollars as we continue to add new hedge funds, other asset managers and financial institutions to our customer base.
Brokerage activities. Until June 1, 2013, we generated a portion of our revenue through commissions generated by brokers executing transactions on behalf of our customers and by the mark-up generated by brokers executing transactions on a riskless principal basis. On June 1, 2013, we ceased over-the-counter brokerage operations by LPS and Futures. Effective February 12, 2014, we received regulatory approval to consolidate LPS and Futures, with LPS remaining as the surviving entity. This consolidation will enable LPS and Futures to streamline their regulatory costs and consolidate their net capital, permit our customers to sign a single account agreement to conduct both futures and securities trading and permit the consolidated entity to enter into a single clearing agreement to facilitate both futures and securities trades. Going forward, LPS will continue to be a component of our business strategy by facilitating the introduction of our customers’ assets to custody banking relationships. LPS will remain a regulated entity with oversight from FINRA, the SEC, the NFA and CFTC. We do not expect the cessation of the over-the-counter brokerage operations of LPS and Futures to negatively and significantly affect our ability to facilitate the introduction of our customers’ assets to custody banking relationships. As complementary service providers to our technology platform customers, LPS and Futures will no longer generate any significant transaction or other revenue, but will continue to incur, at decreased levels, salary, regulatory, accounting, legal and administrative expenses.
Cost of Revenues
Our cost of revenues in connection with software services includes all direct costs to distribute and support our software, including data center and support personnel, salaries and benefits. These costs also include market data fees we incur on behalf of our customers and pass on to them.
Our cost of revenues associated with brokerage activities included payments to brokers who received a percentage of commissions generated by brokers executing transactions on behalf of customers and the mark-up generated by brokers executing transactions on a riskless principal basis. Regulatory fees are also included in cost of revenues associated with brokerage activities. We expect our cost of revenues associated with brokerage activities to decline in future periods. Since we ceased over-the-counter brokerage operations for LPS and Futures on June 1, 2013, we have not received revenues associated with brokerage activities.
We expect that our cost of revenues will increase in the future as we grow our business, add new customers and increase services to existing customers, and need to support the implementation, hosting and support of those new customers and increased services. We also expect that our cost of revenues as a percentage of total revenues could fluctuate from period to period depending on the growth of our business and any associated costs relating to the delivery of services, and the timing of significant expenditures. We intend to continue to invest additional resources in expanding the delivery capability of our software and other services. The timing of these additional expenses could affect our cost of revenues, both in terms of absolute dollars and as a percentage of total revenues, in any particular quarterly or annual period.
Operating Expenses
Compensation. Compensation expense consists of wages and benefits for our employees as well as share-based compensation. Wages and benefits are expensed in the period in which they are earned. Share-based compensation is measured at fair value on the grant date of each award, based on the estimated number of awards that are expected to vest, resulting in a charge to operations over the requisite service period. For awards with graded vesting, we recognize share-based compensation on a straight-line basis over the service period for each separately vesting portion of the award. We expect total compensation expense to decrease in 2014 because a significant portion of this expense in 2013 was for share-based compensation awarded to our founders and our board members as consideration for agreeing to serve on our board, and other transactions in our equity prior to or in connection with our initial public offering (“IPO”), which closed on July 31, 2013. We expect compensation expense, excluding share-based compensation, to increase as we increase our headcount in an effort to grow our business and comply with the rules and regulations applicable to public companies.
Consulting fees. Consulting fees consist of services we are currently outsourcing such as market research, investor/public relations and human resources functions. Consulting fees are expensed in the period in which they are incurred. The majority of our consulting fees, from inception to date, have been for share-based compensation relating to equity transactions with consultants, in which the consideration paid to the consultants was below the fair value of the equity they received The amount by which the consideration is below fair market value is considered share-based compensation. In addition, the sale of our stock to strategic partners and consultants at below fair value also resulted in charges to share-based compensation.
Professional fees. Professional fees consist primarily of legal, accounting and tax services. Professional fees are expensed in the period in which they are earned. The majority of our professional fees from inception to date have been for legal fees related to the start up of our business as well as certain litigation we have been a part of as disclosed in the notes to the accompanying condensed consolidated financial statements. We anticipate that we will continue to incur professional fees as we grow our business. Whereas certain legal fees pertaining to the start up of our business will cease, other costs such as audit fees, recorded prior to our IPO as a deferred offering cost, will continue and be recorded in professional fees on our consolidated statements of operations. As noted in “Item 1A. Risk Factors -The requirements of being a public company places significant demands on our resources and management’s attention,” compliance with the rules and regulations applicable to public companies is increasing our legal and financial compliance costs.
Computer related and software development. Computer related and software development costs consist primarily of research and development costs. Research and development costs are expensed in the period in which they are incurred. Research and development costs include product management, product development, quality assurance and technology operations all with the goal of continuously refining and enhancing our automated and integrated, real-time systems for trading, risk management, accounting, reporting and administration.
Other. Other expenses consist primarily of travel and entertainment, advertising and communication costs. These costs are expensed in the period in which they are earned. We anticipate that we will continue to incur these costs, at an increased level, due to travel and advertising in our efforts to increase and broaden our customer base.
Gain (Loss) on Settlement of Contingency Consideration Payable
The gain (loss) on settlement of contingent consideration payable represents the gain or loss realized in connection with acquisitions we made in which a contingent consideration payable was recorded upon acquisition. The details of these transactions can be found in Note 10 of our consolidated financial statements.
Income Taxes
On July 24, 2013, the Company reorganized as a Delaware corporation from a limited liability company. The change in tax status required us to revalue our deferred tax assets and liabilities at the current corporate federal and state income tax rates. As a result, we recorded a change in our deferred tax assets and liabilities to income tax provision.
Prior to July 24, 2013, the Company, as a limited liability company, was treated as a partnership for federal and state income tax purposes. Accordingly, no provision was made for federal and state income taxes during that period since all items of income or loss were required to be reported on the income tax returns of the members, who were responsible for any taxes thereon. The Company was, however, subject to the New York City Unincorporated Business Tax of 4%. We may be subject to state taxes in certain states that may assess capital taxes or taxes based on gross receipts. We also have subsidiaries in foreign jurisdictions, which are subject to local income taxes.
Results of Operations
We were formed on January 17, 2012. We commenced operations on April 24, 2012, and we had no operations during any period prior to that date. As a result, we are not able to present financial results for any periods prior to April 24, 2012. The audited combined historical financial statements of the Predecessor Company are summarized in “Item 6. Selected Financial Data”and are discussed further below. However, the Predecessor Company is not comparable to our current business or our business as conducted in the period from our commencement of operations on April 24, 2012 to December 31, 2012. Because any direct comparison of our financial results to the financial results of the Predecessor Company would not be meaningful, we have not presented a comparison of our results to the financial results of the Predecessor Company in this Management’s Discussion and Analysis of Financial Condition and Results of Operations. Further, because the discussion of our results below for the period from April 24, 2012 to December 31, 2012 reflects our operations during the period in which we were starting up our operations and includes the results of acquired businesses only from the respective dates of acquisition, they should not be considered indicative of our anticipated results of operations on a going forward basis.
Successor Company
Year Ended December 31, 2013 compared to the Period from April 24, 2012 to December 31, 2012
| | | Year Ended
December 31, 2013 | | | Period from
April 24, 2012 to
December 31, 2012 | | | Change | |
| Revenues: | | | | | | | | | | | | |
| Software services | | $ | 2,925,650 | | | $ | 1,032,534 | | | $ | 1,893,116 | |
| Brokerage activities | | | 1,872,647 | | | | 1,295,248 | | | | 577,399 | |
| | | | 4,798,297 | | | | 2,327,782 | | | | 2,470,515 | |
| Cost of revenues (exclusive of items shown below): | | | | | | | | | | | | |
| Software services | | | 1,452,801 | | | | 388,860 | | | | 1,063,941 | |
| Brokerage activities | | | 1,248,192 | | | | 817,559 | | | | 430,633 | |
| | | | 2,700,993 | | | | 1,206,419 | | | | 1,494,574 | |
| Gross profit: | | | | | | | | | | | | |
| Software services | | | 1,472,849 | | | | 643,674 | | | | 829,175 | |
| Brokerage activities | | | 624,455 | | | | 477,689 | | | | 146,766 | |
| | | | 2,097,304 | | | | 1,121,363 | | | | 975,941 | |
| Operating expenses: | | | | | | | | | | | | |
| Compensation(1) | | | 18,885,418 | | | | 28,285,420 | | | | (9,400,002 | ) |
| Consulting fees(2) | | | 12,727,112 | | | | 3,081,002 | | | | 9,646,110 | |
| Depreciation and amortization | | | 7,407,062 | | | | 2,761,703 | | | | 4,645,359 | |
| Professional fees | | | 3,676,863 | | | | 1,651,232 | | | | 2,025,631 | |
| Rent | | | 1,211,693 | | | | 629,400 | | | | 582,293 | |
| Computer related and software development | | | 2,472,539 | | | | 414,048 | | | | 2,058,491 | |
| Other | | | 2,436,736 | | | | 790,747 | | | | 1,645,989 | |
| Impairment of goodwill and intangible assets | | | - | | | | 1,550,652 | | | | (1,550,652 | ) |
| Total operating expenses | | | 48,817,423 | | | | 39,164,204 | | | | 9,653,219 | |
| Loss from operations | | | (46,720,119 | ) | | | (38,042,841 | ) | | | (8,677,278 | ) |
| | | | | | | | | | | | | |
| Non-operating income (expense): | | | | | | | | | | | | |
| Registration rights penalty | | | - | | | | (1,674,704 | ) | | | 1,674,704 | |
| Unrealized gain on contingent consideration payable | | | - | | | | 129,000 | | | | (129,000 | ) |
| Gain (loss) on settlement of contingent consideration payable | | | (649,688 | ) | | | 1,545,000 | | | | (2,194,688 | ) |
| Interest and other, net | | | 60,500 | | | | (306,659 | ) | | | 367,159 | |
| Total non-operating income (expense) | | | (589,188 | ) | | | (307,363 | ) | | | (281,825 | ) |
| Loss before income taxes | | | (47,309,307 | ) | | | (38,350,204 | ) | | | (8,959,103 | |
| Income tax benefit | | | (697,260 | ) | | | (104,340 | ) | | | (592,920 | ) |
| Net loss | | $ | (46,612,047 | ) | | $ | (38,245,864 | ) | | $ | (8,336,183 | ) |
| | | | | | | | | | | | | |
| (1) Share-based compensation included in compensation | | $ | 9,425,684 | | | $ | 26,974,828 | | | | 17,549,144 | |
| (2) Share-based compensation included in consulting fees | | $ | 11,649,693 | | | $ | 2,404,992 | | | | 9,244,701 | |
Revenues
Software services revenue was $2.9 million during 2013, an increase of $1.9 million from $1.0 million in the prior period. The increase was due to primarily to an increase in the number of customers and units during 2013. Customers and units contributing to software services totaled 48 and 517, respectively, at December 31, 2013 compared to 20 and 327, respectively, at December 31, 2012. For the year ended December 31, 2013, QuantX and our affiliated customers accounted for 82% of our software services revenue, and as of December 31, 2013, QuantX and our affiliated customers accounted for 10% of our customers and 83% of our units. During the fourth quarter of 2013, we entered into a $1.0 million annual contract with QuantX for an enhanced version of our LiquidMetrics® platform, and we started charging customers for their use of market data services, both of which added to the increase in software services revenue during 2013. In addition, 2013 included a full-year of revenue compared to approximately eight months in the prior year.
Brokerage activities revenue was $1.9 million during 2013, an increase of $0.6 million from $1.3 million in the prior period. The increase was due primarily to an increase in customer transactions for which commissions were earned. On June 1, 2013, the Company ceased the over-the-counter brokerage operations of LPS and Futures. As a result, we are not currently generating brokerage revenue.
Cost of Revenues, Gross Profit and Gross Margin
Cost of revenues for software services was $1.5 million during 2013, an increase of $1.1 million from $0.4 million in the prior period. The increase was directly attributable to the increase in our revenue, as the need to grow our company in order to support the implementation of new customers and the continued support of existing customers led to increases in payroll and consulting costs. Additionally, costs related to market data, a service that we started charging customers for in the fourth quarter of 2013, contributed to the overall increase in cost of revenues for software services but were offset in full by recognition of software services revenue in the same amount. Gross profit and gross margin related to software services revenue during 2013 was $1.5 million and 50.3%, respectively, compared to $0.6 million and 62.3%, respectively, in the prior period.
Cost of revenues for brokerage activities was $1.2 million during 2013, an increase of $0.4 million from $0.8 million in the prior period. The increase is directly related to the increase in brokerage activity revenue as payments to brokers were based on increased customer transactions during 2013. The gross profit and gross margin related to brokerage activities during 2013 was $0.6 million and 33.3%, respectively, compared to $0.5 million and 36.9%, respectively, in the prior period.
Operating Expenses
Total operating expenses were $48.8 million during 2013, an increase of $9.6 million from $39.2 in the prior period. The increase was due primarily to increases in consulting fees, depreciation and amortization, professional fees and computer related and software development costs offset, in part, by a decrease in compensation and an impairment charge that occurred in the prior period.
Compensation expense was $18.9 million during 2013, a decrease of $9.4 million from $28.3 million in the prior period. Excluding share-based compensation, compensation expense was $9.5 million, an increase of $8.2 million from $1.3 million in the prior period. The increase was due primarily to 2013 having a full-year of expenses compared to approximately eight months in the prior period, the increase in overall headcount from the prior period, and $1.1 million in payments made to our founders in 2013 that were contingent upon the completion of our IPO. Share-based compensation included in compensation expense was $9.4 million during 2013 compared to $27.0 million in the prior period. The prior period amount was comprised predominantly of share-based compensation awarded to our founders, our board members as consideration for agreeing to serve as a member of our board, and other transactions in our equity prior to our IPO.
Consulting fees were $12.7 million during 2013, an increase of $9.6 million from $3.1 million in the prior period. Excluding share-based compensation, consulting fees were $1.1 million, an increase $0.4 million from $0.7 million in the prior period. The increase was due primarily to 2013 having a full-year of expenses compared to approximately eight months in the prior period. Share-based compensation included in consulting fees was $11.6 million during 2013 compared to $2.4 million in the prior period. Share-based compensation for both 2013 and the prior period was for equity we granted to consultants as payment for services rendered to us. In addition, the sale of our stock to strategic partners and consultants at below fair value also resulted in charges to share-based compensation. The Company does not expect to incur, nor has it incurred, any share-based compensation to consultants after the date of its IPO. We also anticipate an eventual decline in our use of consulting services as we hire employees to handle these functions internally.
Depreciation and amortization was $7.4 million during 2013, an increase of $4.6 million from $2.8 million in the prior period. The increase was due primarily to the acquisition of Green Mountain Analytics, LLC on August 27, 2012, which resulted in $16.3 million of acquired intangible assets that are being amortized over 36 months. Our results of operations for 2013 include a full-year of amortization on this intangible asset compared to only four months of amortization in the prior period.
Professional fees were $3.7 million during 2013, an increase of $2.0 million from $1.7 million in the prior period. The increase was due primarily to costs incurred in connection with our company being publicly traded as of July 2013, costs incurred in strengthening our infrastructure, and marketing fees to enhance our brand recognition. Additionally, 2013 included a full-year of expenses compared to approximately eight months in the prior year.
Rent expense was $1.2 million during 2013, an increase of $0.6 million from $0.6 million in the prior period. 2013 included a full-year of expenses compared to approximately eight months in the prior period. Additionally, effective October 1, 2013, the Company has been sub-leasing additional space for certain back office operations that also contributed to the 2013 increase.
Computer related and software development costs were $2.5 million during 2013, an increase of $2.1 million from $0.4 million in the prior period. The increase was due primarily to research and development costs for our software which totaled $1.8 million during 2013 compared to $0.3 million in the prior period. Additionally, 2013 included a full-year of expenses compared to approximately eight months in the prior period.
Other expenses were $2.4 million during 2013, an increase of $1.6 million from $0.8 million in the prior period. The increase was due to higher travel and advertising costs incurred by our sales and marketing team in an effort to increase our customer base. Additionally, 2013 included a full-year of expenses compared to approximately eight months in the prior period.
During the prior year period, we performed an analysis to determine the fair value of Liquid Partners, LLC and concluded that the carrying amount of goodwill exceeded its fair value and, as a result, recognized an impairment charge of $1.5 million.
Non-Operating Income (Expense)
Total non-operating expense was $0.6 million during 2013 compared to an expense of $0.3 million in the prior period. 2013 includes a loss of $0.6 million related to the settlement of a contingent consideration payable on our July 31, 2012 acquisition of Fundsolve. The prior period included a $1.5 million gain related to the remeasurement of a contingent consideration payable on our May 11, 2012 acquisition of Liquid Partners, LLC offset by a $1.7 million registration rights penalty the Company paid to a significant stockholder as a result of our IPO not occurring prior to December 24, 2012.
Income Tax Benefit
The income tax benefit during 2013 was $0.7 million compared to a benefit of $0.1 million in the prior period. As previously noted, on July 24, 2013, we reorganized as a corporation from a limited liability company and are now subject to federal and state taxes. During the prior period, and up to the date of reorganization, we were only subject to the New York City Unincorporated Business Tax.
Predecessor Company
The results discussed below reflect the revenue and expenses of the Predecessor Company for the period from January 1, 2012 to April 24, 2012. The individual entities that comprised the Predecessor Company during this period were LPS, Liquid Prime Holdings, LLC (“LPH”), Liquid Trading Holdings Limited (“Guernsey”) and Centurion Capital Group, LLC (“Centurion”).
The following discussion does not incorporate the financial results of certain subsidiaries, including Futures, Liquid Trading Institutional LLP (“Institutional”), Fundsolve, LHG Technology Services Ltd. (“Technology”), Green Mountain Analytics, LLC (“GMA”) or LTI, LLC (“LTI”). Further, all significant intercompany accounts and transactions have been eliminated in the historical financial statements of the Predecessor Company for the period from January 1, 2012 to April 24, 2012. For these and other reasons, the results of operations of the Predecessor Company are not comparable to our results of operations for the period from April 24, 2012 through December 31, 2012 or any other period, nor should they be considered indicative of our results on a going forward basis.
Period from January 1, 2012 to April 24, 2012
Revenues and Cost of Revenues
The Predecessor Company generated no revenue and had no cost of revenues during the period from January 1, 2012 to April 24, 2012 as it was not engaged in any brokerage activity. At such time, the Predecessor Company’s efforts were focused on developing future business strategies.
Operating Expenses
Operating expenses were $3,664,739 during the period from January 1, 2012 through April 24, 2012, which included an impairment of goodwill and intangibles charge of $3,300,000 in connection with the acquisition of Centurion. In addition, operating expenses included professional fees of $33,756, rent expense of $153,081, depreciation and amortization of $6,912, compensation of $73,494 and other expenses of $97,496. These fees and expenses related to the support of existing operations and the pursuit of ongoing business opportunities.
Non-Operating Income (Expense)
In May 2012, Guernsey assigned and transferred the interest and all of its rights and obligations under a membership purchase agreement, for its purchase of Centurion, to the Company. As a result of this assignment, Guernsey eliminated prior liabilities due to the selling members of Centurion and recorded a gain on the settlement of contingent consideration payable in the amount of $3.3 million.
Net Loss
During the period from January 1, 2012 through April 24, 2012, the Predecessor Company incurred a net loss of $364,739.
Liquidity and Capital Resources
Overview
At December 31, 2013 and 2012, our cash and cash equivalents of approximately $8.5 million and $1.4 million, respectively, were held for working capital purposes. Our operations have historically been financed through private sales of our equity securities and, more recently, proceeds from our IPO.On July 31, 2013, we closed our IPO in which we sold 3,175,000 shares of our common stock at a public offering price of $9.00 per share. We received net proceeds in the IPO of approximately $17.3 million after deducting underwriting discounts and commissions of approximately $2.6 million and offering related expenses of approximately $8.7 million.
We have had significant operating losses during the period from our inception on April 24, 2012, through the year ended December 31, 2013. We have financed our operations during this time primarily through capital markets transactions. We anticipate that our existing capital resources, including availability under our $3.75 million Revolving Promissory Notes from Brian Ferdinand, one of the founders of the Company, the Vice Chairman of our Board of Directors and the Company’s Head of Corporate Strategy and Douglas J. Von Allmen, a significant stockholder in the Company ($7.5 million in the aggregate), cash flows from operations, and cost reduction initiatives will be adequate to satisfy our liquidity requirements through March 2015. However, our future liquidity requirements will depend on many factors, including our growth rate, the timing and extent of spending to support development efforts, the expansion of sales and marketing activities, the introduction of new and enhanced products and services offerings, and the continuing market acceptance of our software. If available liquidity is not sufficient to meet our obligations as they come due and execute our business strategy, management’s plans include pursuing alternative financing arrangements or further reducing expenditures as necessary to meet the Company’s cash requirements throughout March 2015. There is, however, no assurance that, if required, we will be able to raise additional capital, obtain additional alternative financing, or reduce discretionary spending to provide the required liquidity for us to meet our obligations and execute our business strategy. If we are unable to raise additional capital, obtain additional alternative financing, or reduce discretionary spending when desired or needed, our business, operating results, liquidity and financial condition would likely be materially and adversely affected.
The following table sets forth a summary of our cash flows for the year ended December 31, 2013 and the period from April 24, 2012 to December 31, 2012:
| | | Year Ended
December 31, 2013 | | | Period from
April 24, 2012 to
December 31, 2012 | |
| Net cash used in operating activities | | $ | (13,916,751 | ) | | $ | (6,420,083 | ) |
| Net cash provided by (used in) investing activities | | | 1,511,367 | | | | (3,539,494 | ) |
| Net cash provided by financing activities | | | 19,558,810 | | | | 11,340,645 | |
| Effect of exchange rate changes on cash and cash equivalents | | | (59,657 | ) | | | (990 | ) |
| Net increase in cash and cash equivalents | | $ | 7,093,769 | | | $ | 1,380,078 | |
Cash Flows from Operating Activities
Net cash used in operating activities totaled $13.9 million during the year ended December 31, 2013. The net cash used resulted from our net loss of $46.6 million offset, in part, by non-cash charges of $28.4 million and a positive net change in our operating assets and liabilities of $4.3 million. The net loss was the result of significant expenses we continued to incur as a startup business and in our preparation of becoming a public company which occurred in July 2013. Included in non-cash charges was $21.1 million in share-based compensation expense and equity grants to consultants, of which $15.7 million was from the sale or transfer of common shares by the Company, its founders and certain employees that were below fair value or for no monetary consideration and which are non-recurring due to us now being a publicly traded company. The net change in our operating assets and liabilities was due primarily to $3.5 million of direct costs for the year ended December 31, 2013 relating to our IPO that were charged to stockholders’ equity from deferred offering costs upon the completion of our IPO. The increase in net cash used in operating activities was due primarily to an increased spend in compensation (excluding non-cash, share-based compensation), professional fees, and research and development costs. Partially offsetting the increase was a decrease in consulting fees during 2013, as the ramp up in our headcount reduced the need for certain consulting services.
Net cash used in operating activities totaled $6.4 million during the period from April 24, 2012 to December 31, 2012. The net cash used resulted from our net loss of $38.2 million and a negative net change in our operating assets and liabilities of $1.8 million offset, in part, by non-cash charges of $33.6 million. The net loss was the result of significant expenses we incurred as a startup business and in our preparation of becoming a public company. Included in non-cash charges was $29.4 million in share-based compensation expense and equity grants to consultants, all of which were from the sale or transfer of common shares by the Company, its founders and certain employees that were below fair value or for no monetary consideration. The net change in our operating assets and liabilities was comprised primarily of $3.5 million in direct offering costs for the period from April 24, 2012 to December 31, 2012 relating to our IPO and a $1.1 million increase in prepaid expenses and other current assets offset, in part, by an increase of $2.8 million in accounts payable and accrued expenses incurred in support of start-up activity, which included general operating expenses and costs incurred in the pursuit of ongoing business opportunities.
Cash Flows from Investing Activities
Net cash provided by investing activities totaled $1.5 million during the year ended December 31, 2013 and was due to the repayment of the principal balance of $2.2 million on a note due from QuantX offset, in part, by the purchase of property and equipment of $0.7 million.
Net cash used in investing activities totaled $3.5 million during the period from April 24, 2012 to December 31, 2012 and was the result of $1.5 million used to purchase intangible assets, primarily consisting of developed technology used in our platform, net cash used for a loan to QuantX in the amount of $2.2 million and contributions made in advance of regulatory approval in the amount of $2.2 million. This was offset, in part, by cash received in connection with acquisitions of $2.4 million.
Cash Flows from Financing Activities
Net cash provided by financing activities totaled $19.6 million during the year ended December 31, 2013 and was due primarily to $26.0 million of net proceeds from our IPO less direct costs of $8.7 million. Additionally, $3.3 million of proceeds were received from the private sales of our common shares. Lastly, we used $1.0 million to purchase shares of our stock that are now held as treasury stock.
Net cash provided by financing activities totaled $11.3 million during the period from April 24, 2012 to December 31, 2012 and was the result of proceeds from the private sale of our equity securities.
Regulatory Capital
The SEC, CFTC, NFA, FINRA, Financial Conduct Authority (“FCA”) and other U.S. and non-U.S. regulators have stringent rules requiring that we maintain specific minimum levels of regulatory capital in our broker-dealer subsidiaries; limit certain types of indebtedness; finance operations only with certain “qualifying” debt if to be counted as acceptable capital; and, in certain instances, restrict, limit or otherwise prohibit the ability of owners of broker-dealers to withdraw capital from a broker-dealer, or for a broker-dealer to pay a dividend or make an unsecured advance or loan to a parent, affiliate or stockholder, or to effect any similar distribution or transaction, or to transfer or sell assets or transfer business lines/revenue streams to an affiliate.
SEC Rule 15c3-1 requires that certain SEC registered broker-dealers who do not hold funds or securities for, or owe money or securities to, customers but who engage in dealer activities maintain a net capital of at least $100,000. The $100,000 net capital requirement is only a minimum or floor and LPS will generally be required to maintain net capital in excess of $100,000. Determining the amount of net capital that LPS must maintain involves, in part, a leverage/ratio limit of the broker-dealer’s “aggregate indebtedness” (total money liabilities arising from securities transactions, subject to certain exceptions) to ensure that aggregate indebtedness does not exceed 15 times the broker-dealer’s net capital. Certain broker-dealers are subject to net capital requirements imposed by FINRA that are higher than those required under SEC Rule 15c3-1. With the foregoing in mind, LPS, our SEC registered broker-dealer subsidiary, which does not hold funds or securities for customers, is required to maintain a net capital of at least $100,000. As of December 31, 2013 and 2012, LPS maintained a net capital of approximately $292,000 and $799,000, respectively.
CFTC Regulation 1.17 requires independent introducing brokers and FCMs to maintain an adjusted net capital of at least $45,000 and $1,000,000, respectively, or some greater amount as determined under CFTC Regulation 1.17(a)(1)(i), respectively. Prior to March 26, 2013, Futures operated as a non-clearing FCM and was required to maintain at least $1,000,000 of net capital. Futures is now an independent introducing broker and is required to maintain $45,000 of net capital. As of December 31, 2013 and 2012, Futures maintained a net capital of approximately $85,000 and $1.1 million, respectively. Effective February 12, 2014, Futures was merged into LPS, with LPS remaining as the surviving entity and, as a result, Futures is no longer subject to minimum net capital requirements.
FCA regulations require broker-dealers to maintain minimum regulatory capital of €50,000. As an FCA regulated broker-dealer, Institutional, our U.K. subsidiary, is required to maintain €50,000 of minimum regulatory capital, which is reported to the FCA in British Pounds. As of December 31, 2013 and 2012, Institutional maintained regulatory capital of approximately $204,000 and $200,000, respectively (or approximately €148,000 and €153,000, respectively).
With respect to capital contributions, our broker-dealer subsidiaries are permitted, subject to FINRA approval, to finance operations and satisfy regulatory capital requirements by using the proceeds from loans subject to agreements in accordance with SEC Rule 15c3-1d by which, among other things, the lenders subordinate their claims for repayment of the loan to the claims of the broker-dealer and other creditors of the broker-dealer (a subordinated loan agreement). The proceeds for such loans are cash or, in the case of a secured demand note, are collateralized by either cash and/or securities that are freely transferable and may be publicly offered and sold without registration under the Securities Act. If a broker-dealer subsidiary enters into such a satisfactory subordination loan agreement in accordance with SEC Rule 15c3-1d (with respect to LPS) and CFTC Regulation 1.17(h) (with respect to Futures), the broker-dealer may be restricted or limited in its ability to repay any such subordinated loan. Subordinated loans must generally remain outstanding (and, thus, not be repaid) for at least one year from the time of borrowing, and in certain cases require the approval of FINRA to be repaid prior to maturity, which FINRA may withhold. In addition, broker-dealers are generally limited in the amount of their capital that may be financed through satisfactory subordinated loans.
With respect to capital withdrawals, regulations (including, but not limited to, SEC Rule 15c3-1 for SEC registered broker-dealers, CFTC Regulation 1.17 (g) for CFTC registered brokers and FINRA Rule 4110 for FINRA member broker-dealers, such as LPS) are in place which limit or, in some cases, prohibit the ability of owners of broker-dealers to withdraw capital from a broker-dealer or for a broker-dealer to pay a dividend or make an unsecured advance or loan to a parent, affiliate or stockholder or to effect any similar distribution or transaction.
The SEC, FINRA, CFTC and certain state securities regulators have adopted an “early warning” notification system to help detect broker-dealers that may be in financial difficulty. Therefore, a broker-dealer whose net capital falls below certain levels, which may be above its regulatory minimum requirement, as described above, is subject to “early warning” to such regulators. Early warning reporting by a broker-dealer may have further implications. For example, under FINRA rules, a broker-dealer whose net capital falls below, or whose aggregate indebtedness exceeds, certain levels may be required to restrict business expansions and/or may be required to reduce its current business activities.
Pursuant to Section 15(i)(1) of the Exchange Act, the various state securities regulators are not permitted to impose, among other things, capital requirements that differ from, or are in addition to, the requirements established under SEC Rule 15c3-1 for SEC registered broker-dealers. Section 2(a) of the Commodity Exchange Act, or CEA, gives the CFTC “exclusive jurisdiction” over most of the activities it regulates thereby restricting state securities regulators from imposing capital requirements on CFTC registrants.
Regulators continue to evaluate and modify minimum capital requirements from time to time in response to market events and to improve the stability of the international financial system. Consequently, the net capital requirements of our subsidiaries are subject to change.
Contractual Obligations and Commitments
Primary contractual obligations at December 31, 2013 are payments under operating leases and a consulting agreement. The following summarizes our material contractual obligations and commitments at December 31, 2013 (in thousands):
| | | Payments Due By Period | |
| | | Total | | | Less Than 1
Year | | | Years 1-3 | | | Years 4-5 | | | More Than 5
Years | |
| Operating leases(1) | | $ | 12,057 | | | $ | 1,141 | | | $ | 2,339 | | | $ | 2,486 | | | $ | 6,091 | |
| Consulting agreement(2) | | | 63 | | | | 63 | | | | — | | | | — | | | | — | |
| | | $ | 12,120 | | | $ | 1,204 | | | $ | 2,339 | | | $ | 2,486 | | | $ | 6,091 | |
| (1) | Consists of contractual obligations from non-cancellable office space under operating leases. In March 2014, we entered into a five-year lease for office space located in Hoboken, New Jersey with an effective commencement date of February 1, 2014. The future minimum rent payments under this lease total $1.4 million. As long as we have no instances of default under the terms of this lease, the base rent will be waived for the period from February 1, 2014 to June 30, 2014. The future minimum rental commitments under this lease are not included in the above table as the lease had not commenced as of December 31, 2013. |
| (2) | Represents a twelve-month consulting agreement with Mr. Richard Schaeffer, effective June 3, 2013, whereby Mr. Schaeffer will provide relationship management and sales and marketing services to us. |
Clearing Agreement
On October 8, 2013, LPS entered into a Clearing Agreement with Goldman Sachs Execution & Clearing, L.P. (“GSEC”). Under this agreement, GSEC will execute and settle transactions for accounts of LPS and of the customers introduced by LPS to GSEC. In addition, GSEC will provide transaction execution and clearing services and related carrying services on a fully disclosed basis for these accounts. On or before the establishment of any such accounts, LPS will deposit cash, securities, or a combination of both, having a market value of $1.0 million with GSEC. As of the date of this Annual Report on Form 10-K, no accounts have been established at GSEC and, therefore, LPS has not been required to make the $1.0 million deposit.
Revolving Promissory Notes
On February 26, 2014, we executed a Revolving Promissory Note with each of our two largest stockholders, Brian Ferdinand (also one of our founders and the Vice Chairman of our Board of Directors) and Douglas J. Von Allmen (each, a “Note” and, collectively, the “Notes��). Under each Note, we may borrow, and the lender has committed to lend, up to a principal amount of $3,750,000 on a revolving basis ($7,500,000 in the aggregate under the Notes), with interest payable quarterly on any amounts borrowed at a rate of 4% per annum. Any amounts borrowed under the Notes are repayable at maturity on April 30, 2015 and are optionally repayable at any time without the payment of any premium or penalty. We agreed to pay a commitment fee on any undrawn amounts at a rate per annum equal to 0.50%, payable quarterly. The Notes contain certain customary covenants, including covenants relating to our ability to incur indebtedness and make restricted payments, and provide for certain customary events of default. We may terminate the commitment under the Notes at any time.
On March 6, 2014, Douglas J. Von Allmen executed a Personal Guaranty Agreement (the “Personal Guaranty”) with us whereby Mr. Von Allmen will guarantee the funding of loans pursuant to the $3,750,000 Note entered into between Brian Ferdinand and us (see above). If Mr. Ferdinand fails to fund any obligation when due, Mr. Von Allmen agrees to promptly pay the unpaid obligation to us based on the terms and conditions of the Note. In turn, Mr. Von Allmen shall take by subrogation all of Mr. Ferdinand’s rights under the Note with respect to any amounts funded by Mr. Von Allmen. As consideration for the Personal Guaranty, we agreed to pay Mr. Von Allmen a fee equal to 0.50% per annum on the guaranteed amount of $3,750,000.
Loans Payable – Related Parties
On June 13, 2013, Richard Schaeffer, one of our founders and then a member of our Board of Directors, loaned us $250,000 to be payable in full on December 13, 2013. The loan bore interest on the unpaid principal balance at a rate of 4% per annum until the earlier of payment in full or December 13, 2013. The proceeds of the loan were used for our general working capital requirements. On August 1, 2013, we repaid the principal balance of the loan in full. The amount of interest paid on the loan totaled $1,370.
On July 1, 2013, Ferdinand Holdings, LLC, a Delaware limited liability company of which Brian Ferdinand, one of our founders, the Vice Chairman of our Board of Directors and the Company’s Head of Corporate Strategy, is the managing member, loaned us $250,000 to be payable in full on December 31, 2013. The loan bore interest on the unpaid principal balance at a rate of 4% per annum until the earlier of payment in full or December 31, 2013. The proceeds of the loan were used for our general working capital requirements. On August 1, 2013, we repaid the principal balance of the loan in full. The amount of interest paid on the loan totaled $877.
On July 11, 2013, Thomas Ross, a member of our Board of Directors, loaned us $250,000 to be payable in full on January 10, 2014. The loan bore interest on the unpaid principal balance at a rate of 4% per annum until the earlier of payment in full or January 10, 2014. The proceeds of the loan were used for our general working capital requirements. On August 1, 2013, we repaid the principal balance of the loan in full. The amount of interest paid on the loan totaled $603.
Employment Agreements
We have entered into employment agreements with certain executive officers as follows:
On February 26, 2013, we entered into an offer letter with Robert O’Boyle, providing that he will serve as our Executive Vice President, Director of Sales and Marketing. The agreement provides for a base salary of $350,000, a one-time cash bonus of $82,000 payable in June 2013 and a guaranteed bonus of $150,000 for the first full year of employment. We have agreed to a guaranteed bonus of $100,000 for the second full year of employment. The offer letter provides for an award of a 0.5% interest in the Company in the form of stock options in accordance with the 2012 Amended Incentive Plan. Additionally, the offer letter provides for restricted stock units (“RSUs”) equivalent to 0.25% of the common shares outstanding and another 0.25% upon the Company reaching a market capitalization of $300 million following the IPO. On June 17, 2013, we entered into a letter agreement amending Mr. O’Boyle’s offer letter. Pursuant to that letter agreement, the award of RSUs following the IPO is amended to include a time-based maintenance requirement. Under the amended provision, the RSUs will be granted upon the Company reaching a market capitalization of $300 million or more over a consecutive sixty (60) day period.
On March 13, 2013, we entered into an offer letter with Jose Ibietatorremendia, providing that he will serve as our General Counsel. The agreement provides for a base salary of $300,000, a one- time cash bonus of $30,000 payable on June 1, 2013 and a guaranteed bonus of $100,000 payable at the end of the first full year of employment. In addition, the offer letter provides for RSUs equivalent to 0.25% of common shares outstanding and 0.25% in the form of stock options in accordance with the 2012 Amended Incentive Plan.
On April 9, 2013, we entered into an offer letter with James Lee, providing that he will serve as our Chief Administrative Officer. The agreement provides for a base salary of $300,000 and a guaranteed cash bonus of $100,000 payable for Mr. Lee’s first full year of employment, payable in three equal installments. In addition, the offer letter provides for stock options with a grant date Black-Scholes value of $500,000 in accordance with the 2012 Amended Incentive Plan.
On May 1, 2013, we entered into a separation agreement with Robert Keller, one of our founders, to end Mr. Keller’s employment agreement. Pursuant to this agreement, we paid Mr. Keller a one-time cash bonus upon the completion of our IPO totaling $254,247 on August 1, 2013.
On May 15, 2013, we entered into an amended employment agreement with Brian Storms, providing that he continue to serve as our Chief Executive Officer. This amended agreement provides for a base salary of $600,000. Mr. Storms’ previous employment agreement with us was effective from December 1, 2012 until May 15, 2013. The previous employment agreement provided for an initial base salary of $250,000 that would increase to $500,000 upon the earlier of (a) the completion of our IPO and (b) April 1, 2013, eligibility to receive an annual performance bonus and participation in any equity-based compensation plans and benefits as are generally provided to our other executives. Additionally, under the previous employment agreement, Mr. Storms received a grant of 760,033 RSUs of which 253,346 vested on January 1, 2013 with the remaining 506,687 RSUs vesting equally on December 1, 2013 and December 1, 2014. Mr. Storms also serves as a member of our Board of Directors.
On June 3, 2013, we entered into a separation agreement with Mr. Schaeffer to terminate Mr. Schaeffer’s employment agreement. Pursuant to this agreement, we paid Mr. Schaeffer a one-time cash bonus upon the completion of our IPO totaling $410,502 on August 1, 2013. In addition, under this agreement, we have agreed to pay Mr. Schaeffer additional amounts to cover the cost of continuing his health care benefits until the earlier of November 30, 2014 and the date that he enrolls in a different group health coverage plan. We also entered into a consulting agreement with Mr. Schaeffer, effective as of June 3, 2013, whereby Mr. Schaeffer will provide relationship management and sales and marketing services on a consultancy basis to us for a twelve-month term. The consulting agreement provides for $12,500 per month as compensation for his services. In addition to the fees provided under the June 3, 2013 consulting agreement, Mr. Schaeffer was entitled to receive any fees for his service as a director of the Company. On December 23, 2013, Mr. Schaeffer resigned as a member of our Board of Directors.
On June 11, 2013, we entered into an employment agreement with Brian Ferdinand, providing that he will serve as the Vice Chairman of the Company’s Board of Directors and Head of Corporate Strategy. The agreement provided for a base salary of $450,000 and a one-time cash bonus upon the completion of our IPO, which totaled $417,551 and was paid on August 1, 2013. Mr. Ferdinand is also eligible to receive an annual performance bonus and participate in any equity-based compensation plans and benefits as are generally provided to our other executives. In addition, the agreement also provided a grant of 341,274 RSUs, one-half of which will vest on May 15, 2104 and one-half of which will vest on May 15, 2015.
Other
We agreed to purchase 105,000 shares of our common stock from Mr. Storms at a price of $8.415 per share in connection with the consummation of our IPO. On August 2, 2013, we purchased the 105,000 shares from Mr. Storms at a total cost of $883,575. The price per share paid by us in respect of these shares was equal to the public offering price per share received by us in the IPO, less an amount equal to the underwriting discount payable per share to the underwriter in the IPO.
Critical Accounting Policies
Our consolidated financial statements have been prepared in accordance with U.S. GAAP. The preparation of these consolidated financial statements requires us to make estimates and assumptions that affect the reported amounts of assets, liabilities, revenue, expenses and related disclosure of contingent liabilities at the date of our financial statements. We base our estimates on historical experience and on various other assumptions that we believe are reasonable under the circumstances. We evaluate our estimates and assumptions on an ongoing basis.
Actual results may differ from these estimates. To the extent that there are material differences between these estimates and our actual results, our future financial statements will be affected.
As a result of the factors described below, our revenues and earnings are subject to substantial fluctuation from period to period based on a variety of circumstances, many of which are beyond our control. Accordingly, results for any historical period are not necessarily indicative of similar results for any future period.
Our significant accounting policies are presented in the notes to our audited consolidated financial statements for the year ended December 31, 2013. The significant accounting policies that are most critical and aid in fully understanding and evaluating the reported financial results include the following:
Revenue Recognition
Software Services
We derive revenue from providing software-as-a-service for an online trading platform. There is no downloadable software, distribution or technology delivered to customers. Software is provided under a hosting arrangement. Revenue is accounted for as software-as-a-service arrangement since the customer does not have the contractual right to take possession of the software at any time during the hosting period. We recognize revenue for these software subscriptions when the following criteria have been met: (1) persuasive evidence of an arrangement exists; (2) delivery of the product has occurred; (3) the fee is fixed or determinable; and (4) collection is probable.
Brokerage Activities
On June 1, 2013, we ceased the over-the-counter brokerage operations of LPS and Futures. LPS will continue to be a component of our business strategy by facilitating the introduction of customer assets to custody banking relationships.
Prior to June 1, 2013, transactions in securities, commissions and fees, and related expenses were recorded on a trade date basis. Commissions and fees were derived primarily from facilitating securities transactions on behalf of customers. LPS derived revenue from (1) the mark-up generated by brokers executing fixed income and equity transactions on a riskless principal basis and (2) commissions generated by brokers executing equity trades on behalf of customers, which were settled with the customer’s clearing firm. Futures derived revenue from commissions generated by (1) facilitating over-the-counter agency transactions on behalf of customers and (2) by brokers executing exchange traded futures and options transactions on behalf of customers.
Business Combinations
Assets acquired and liabilities assumed are recorded at their fair values on the date of acquisition. The cost to be allocated in a business combination includes consideration paid to the sellers, including cash and the fair values of assets acquired and liabilities assumed. Both direct (e.g., legal and professional fees) and indirect costs of the business combination are expensed as incurred. Certain agreements to acquire entities include potential additional consideration that is payable, contingent on the acquired company maintaining or achieving specified earnings levels in future periods. The fair value of any contingent consideration would be recognized on the acquisition date with subsequent changes in that fair value reflected in income. The consolidated financial statements and results of operations reflect an acquired business from the date of acquisition.
The judgments that are made in determining the estimated fair value assigned to each class of assets acquired and liabilities assumed, as well as asset lives, can materially impact net income in periods following a business combination. Traditional approaches used to determine fair value include the income, cost and market approaches. The income approach presumes that the value of an asset can be estimated by the net economic benefit to be received over the life of the asset, discounted to present value. The cost approach presumes that an investor would pay no more for an asset than its replacement or reproduction cost. The market approach estimates value based on what other participants in the market have paid for reasonably similar assets. Although each valuation approach is considered in valuing the assets acquired, the approach or combination of approaches ultimately selected is based on the characteristics of the asset and the availability of information.
Goodwill and Other Intangibles
Goodwill is the excess of the purchase price paid over identified intangible and tangible net assets acquired in a business combination. Intangible assets consist of trademarks, intellectual property, non-compete agreements, customer relationships and acquired technology.
Goodwill is an asset representing the future economic benefits arising from other assets acquired in a business combination that are not individually identified and separately recognized. Goodwill is reviewed for impairment at least annually, on July 31, or whenever events or changes in circumstances indicate the fair value of a reporting unit is less than its carrying amount.In evaluating goodwill for impairment, we first perform a qualitative assessment to determine whether it is more likely than not that the fair value of the reporting unit is less than its carrying amount. If it is determined through the qualitative assessment that a reporting unit's fair value is more likely than not greater than its carrying value, the remaining impairment steps would not be necessary. If however it is determined through the qualitative assessment that a reporting unit's fair value is more likely than not less than its carrying value, we will perform a quantitative assessment and compare the fair value of the reporting unit to its carrying value.The quantitative assessment of goodwill impairment is a two-step test. Under the first step, the fair value of the reporting unit is compared with its carrying value (including goodwill). If the fair value of the reporting unit is less than its carrying value, an indication of goodwill impairment exists for the reporting unit and the entity must perform step two of the impairment test (measurement). Under step two, an impairment loss is recognized for any excess of the carrying amount of the reporting unit’s goodwill over the implied fair value of that goodwill. The implied fair value of goodwill is determined by allocating the fair value of the reporting unit in a manner similar to a purchase price allocation and the residual fair value after this allocation is the implied fair value of the reporting unit goodwill. Fair value of the reporting unit is determined using a discounted cash flow analysis. If the fair value of the reporting unit exceeds its carrying value, step two does not need to be performed.
An intangible asset is recognized as an asset apart from goodwill if it arises from contractual or other legal rights or if it is separable (i.e., capable of being separated or divided from the acquired entity and sold, transferred, licensed, rented or exchanged).Other intangible assets with definitelives are amortized over their expected useful lives. Other intangible assets with indefinite lives are assessed at least annually for impairment. In evaluating indefinite-lived intangible assets for impairment, we first perform a qualitative assessment to determine whether it is more likely than not that the fair value of the asset is less than its carrying amount. If it is determined through the qualitative assessment that an asset is impaired, then a quantitative impairment test is required to be performed. An impairment loss is calculated as the amount by which the carrying value of the intangible asset exceeds its estimated fair value.
Share-based Compensation
We account for share-based compensation in accordance with ASC Topic 718,Compensation—Stock Compensation(“ASC 718”). Under ASC 718, awards result in a cost that is measured at fair value on the awards’ grant date, based on the estimated number of awards that are expected to vest resulting in a charge to operations over the requisite service period. For awards with graded vesting, we recognize stock-based compensation expense on a straight-line basis over the service period for each separately vesting portion of the award as if the award was, in substance, multiple awards.
We accounted for equity-based transactions with nonemployees in accordance with ASC Subtopic 505-50,Equity—Equity-Based Payments to Non-Employees. All transactions with nonemployees in which goods or services were received in exchange for equity-based instruments were accounted for based on the fair value of the consideration received or the fair value of the equity-based instruments issued, whichever was more reliably measurable. We generally based the fair value on the equity-based instruments issued. We measured the fair value of the equity-based instruments issued in exchange for goods or services at the earlier of the date on which the counterparty completed the performance obligation or the date on which a performance commitment was reached. A performance commitment existed at the date of grant if it was probable that the counterparty would perform under the contract because the counterparty was subject to disincentives in the event of nonperformance that were sufficiently large to make performance probable at that date.
Prior to our common stock being publicly traded, the fair values of the common stock were estimated by our management, with consideration given in certain cases to valuation analyses performed by an unrelated third party specialist. We believe that our management had the relevant experience and expertise to determine the fair value of our common stock. Given the absence of a public trading market for our common stock and in accordance with the American Institute of Certified Public Accountants’ Practice Guide,Valuation of Privately-Held-Company Equity Securities Issued as Compensation, at certain dates we considered various objective and subjective factors to determine the best estimate of the fair value of our common stock including:
| · | lack of marketability of our common stock; |
| · | sales of common stock in arm’s-length transactions; |
| · | acquisitions needed for the development of our trading platform; |
| · | likelihood of achieving a liquidity event, such as an initial public offering or a merger or acquisition given prevailing market conditions. |
We valued the arm’s length transactions at a value equal to the consideration paid by the relevant third party in the transaction. For these transactions, we used this valuation approach because it was not possible to utilize other valuation approaches. It was not possible to use other valuation approaches because there were no reliable projections as of the different valuation dates. Thus, an income approach methodology was not possible and we had little revenue and no earnings to use as the basis of a guideline public company methodology. Therefore, it was not possible for an unrelated third party valuation specialist to value our enterprise as a whole using these approaches. With respect to the fair values of the other transactions that were determined not to be arm’s length, we used the values of the arm’s length transactions as signposts and then applied straight-line interpolation to arrive at the fair values. The value determined by this approach was discounted for lack of marketability based on the estimated time remaining to the projected liquidity event.
We did not apply any alternative valuation methodologies or use any weightings in our analysis.
Impairment of Long-Lived Assets
Long-lived assets to be held and used are reviewed for impairment whenever events or changes in circumstances indicate that the carrying amount of such assets may not be recoverable. Determination of recoverability is generally based on an estimate of undiscounted future cash flows resulting from the use of the asset and its eventual disposition, as well as specific appraisal in certain instances. Measurement of an impairment loss for long-lived assets that management expects to hold and use is based on the fair value of the asset as estimated using a cash flow model. Long-lived assets to be disposed of are reported at the lower of carrying amount or fair value less costs to sell.
GMA Software
Over the life of the GMA software, certain events will be monitored to identify any impairment. We will monitor revenue generated and the acceptance of the software in the marketplace. To date, our revenues have been substantially dependent on related parties. Our management believes there is a high degree of uncertainty associated with this factor. We will also monitor the research and development expenses required to maintain and develop future versions of the software. Our management believes there is a moderate degree of uncertainty associated with this factor. The life cycle of the software can become shorter or longer than anticipated based on changing market and competitive conditions. Our management believes there is a low degree of uncertainty associated with this factor. Changes to the expected cash flow due to macroeconomic and industry factors will also be monitored. Our management believes there is a moderate degree of uncertainty associated with this factor. Circumstances that could reasonably be expected to negatively affect the key assumptions include, but are not limited to:
| · | a decrease in the acceptance of the software in the marketplace; |
| · | increased costs to maintain the software; |
| · | obsolescence of the software; |
| · | increase in competition; and |
| · | decline in the markets we participate in, including the financial services industry. |
Significant revenue growth resulting in a significant increase in cash flows will be necessary to support the recoverability of the carrying value of the GMA software. If cash flows do not significantly increase, an impairment charge is reasonably likely. In addition, to the extent that one of the four events described above occurs and causes a negative event, we will assess the recoverability of the software as prescribed in ASC Topic 360, which could result in an impairment charge.
JOBS Act
In April 2012, the JOBS Act was enacted. Section 107 of the JOBS Act provides that an emerging growth company can take advantage of the extended transition period provided in Section 7(a)(2)(B) of the Securities Act for complying with new or revised accounting standards. Thus, an emerging growth company can delay the adoption of certain accounting standards until those standards would otherwise apply to private companies. We have irrevocably elected not to avail ourselves of this extended transition period and, as a result, we will adopt new or revised accounting standards on the relevant dates on which adoption of such standards is required for other companies.
Recently Issued Accounting Pronouncements
In February 2013, the Financial Accounting Standards Board (“FASB”) issued Accounting Standards Update No. 2013-02, Comprehensive Income (Topic 220):Reporting of Amounts Reclassified Out of Accumulated Other Comprehensive Income (“ASU 2013-02”), which is effective prospectively for public companies for reporting periods beginning after December 15, 2012. This new accounting standard improves the reporting of reclassifications out of accumulated other comprehensive income (“AOCI”) by requiring an entity to report the effect of significant reclassifications out of AOCI on the respective line items in net income if the amount being reclassified is required under GAAP to be reclassified in its entirety to net income. For other amounts that are not required under GAAP to be reclassified in their entirety to net income in the same reporting period, an entity is required to cross-reference other disclosures required under GAAP that provide additional detail about those amounts. The adoption of this new guidance did not have a material impact on the Company’s consolidated financial statements.
In July 2013, the FASB issued Accounting Standards Update No. 2013-11, Income Taxes (Topic 740):Presentation of an Unrecognized Tax Benefit When a Net Operating Loss Carryforward, a Similar Tax Loss, or a Tax Credit Carryforward Exists (“ASU 2013-11”). ASU 2013-11 requires an entity to present an unrecognized tax benefit and an NOL carryforward, a similar tax loss, or a tax credit carryforward on a net basis as part of a deferred tax asset, unless the unrecognized tax benefit is not available to reduce the deferred tax asset component or would not be utilized for that purpose, in which case a liability would be recognized. ASU 2013-11 will be effective for fiscal periods beginning after December 15, 2013, with early adoption permitted. The Company has evaluated the impact of the adoption of this pronouncement and determined that it will not have a material impact on its consolidated financial statements.
Transactions with Related and Certain Other Parties
Investment by Douglas J. Von Allmen. On April 5, 2013, we issued an additional 720,498 common shares to an entity controlled by Mr. Von Allmen pursuant to a subscription agreement into which we entered with him on that date. On May 14, 2013, an entity controlled by Mr. Keller; Mr. Storms and three employees transferred a total of 104,431 shares to an entity controlled by Mr. Von Allmen pursuant to share transfer agreements. On May 15, 2013, an entity controlled by Mr. Schaeffer sold 191,616 shares to an entity controlled by Mr. Von Allmen pursuant to a share transfer agreement.
Legal Representation. We retain the law firm of Fish & Richardson, of which David Francescani, one of our directors, is a principal, to perform legal services from time to time. We have paid Fish & Richardson $83,703 for legal services rendered during 2013, and as of March 28, 2014 have no unpaid balance.
Transactions with QuantX. QuantX, a related party as a result of certain past or present relationships with Messrs. Ferdinand, Keller, Schaeffer, Von Allmen and Tew, which is not a part of and is not consolidated under Liquid Holdings Group, operates as a principal-only trading firm domiciled in the United Kingdom trading solely for its own account. QuantX is a customer of our technology platform, which it then markets to its own members, thereby providing us with a source of customer referrals. As of December 31, 2013, a total of $2,119,720 in software services revenues were recognized by us from QuantX.
Transactions with Directors. In 2013, we and/or certain of our founders sold common stock to certain of our directors at prices below fair value; as such we have recorded these sales as share-based payments. We have described below the sale of shares in which the difference between the purchase price and the fair value of the shares is in excess of $120,000. We note that this information has been reported as director compensation for 2013.
On January 15, 2013, SHAF Holdings, LLC, of which Mr. Schaeffer is the managing member, sold to our director Tom Ross a 0.5% ownership interest for an aggregate purchase price of $375,000. We estimated the fair value of the shares sold at $702,622. As a result of this sale below fair value, we recorded a 2013 share-based compensation expense of $327,622.
On May 10, 2013, CMK Keller Holdings, LLC, of which our former director Mr. Keller is the managing member, transferred to Mr. Ferdinand 191,616 shares for no monetary consideration. We estimated the fair value of the shares transferred at $1,445,000. As a result of this transfer below fair value, we recorded a share-based compensation expense in the second quarter of 2013.
On May 14, 2013, CMK Keller Holdings, LLC sold Mr. Storms 766,466 shares for $5,000,000. We estimated the fair value of the shares sold at $5,780,000. As a result of this sale below fair value, we recorded a 2013 share-based compensation expense in the second quarter of 2013.
On June 20, 2013, CMK Keller Holdings, LLC, of which our former director Mr. Keller is the managing member, transferred to LT World Limited LLC, an entity controlled by Mr. Ferdinand, 191,558 shares for no monetary consideration. We estimated the fair value of the shares transferred at $1,445,000. As a result of this transfer below fair value, we recorded a share-based compensation expense in the second quarter of 2013.
On June 3, 2013, we entered into a consulting agreement with Mr. Schaeffer, one of our founders and a member of our Board of Directors, pursuant to which Mr. Schaeffer will provide relationship management and sales and marketing consulting services to the Company for a twelve-month term. The consulting agreement provides for $12,500 per month as compensation for his services. In addition to the fees provided under the June 3, 3013 consulting agreement, Mr. Schaeffer received fees for his service as a director of the Company.
On June 13, 2013, Mr. Schaeffer loaned us $250,000 to be payable in full on December 13, 2013. The loan bears interest on the unpaid principal balance at a rate of 4% per annum until the earlier of payment in full or December 13, 2013, after which time any amount of unpaid principal or interest will bear interest at a rate of 6% per annum. The proceeds of the loan were used for general working capital requirements of the company. On August 1, 2013, we repaid the principal balance of the loan in full. The amount of interest paid on the loan totaled $1,370.
On July 1, 2013, Ferdinand Holdings, LLC loaned us $250,000 to be payable in full on December 31, 2013. The loan bears interest on the unpaid balance at a rate of 4% per annum until the earlier of payment in full or December 31, 2013, after which any amount of unpaid principal or interest will bear interest at a rate of 6% per annum. The proceeds of the loan were used for general working capital requirements of the company. On August 1, 2013, we repaid the principal balance of the loan in full. The amount of interest paid on the loan totaled $877.
On July 11, 2013, Mr. Ross loaned us $250,000 to be payable in full on January 10, 2014. The loan bears interest on the unpaid principal balance at a rate of 4% per annum until the earlier of payment in full or January 10, 2014, after which any amount of unpaid principal or interest will bear interest at a rate of 6% per annum. The proceeds of the loan were used for general working capital requirements of the company. On August 1, 2013, we repaid the principal balance of the loan in full. The amount of interest paid on the loan totaled $603.
We purchased 105,000 shares of our common stock from Mr. Storms, our CEO and a Director at a price of $8.415 per share in connection with the consummation of our initial public offering. The price per share equaled the public offering price per share received by us in the offering, less an amount equal to the underwriting discount paid per share to the underwriter in the offering.
Transaction with David Solimine. On May 1, 2013, entities controlled by Messrs. Ferdinand, Keller, Schaeffer and David Solimine entered into an agreement to transfer Mr. Solimine 2.75% of our common shares outstanding as of the date of the agreement. Pursuant to an anti-dilution provision to maintain Mr. Solimine’s 2.75% ownership interest in the Company, that agreement provides that Messrs. Ferdinand, Keller and Schaeffer may owe Mr. Solimine common shares if we issue additional shares during the period beginning May 1, 2013 and ending on the earliest of immediately prior to the consummation of our initial public offering and January 1, 2015. We have agreed that if any of Messrs. Ferdinand, Keller and Schaeffer do not deliver those shares, the Company will be obligated to issue anti-dilution shares to Mr. Solimine.
Bonus to Robert Keller. On May 1, 2013, we entered into a letter agreement with Mr. Keller ending his employment as senior managing director with the Company. Pursuant to that agreement, we agreed that if our initial public offering were consummated prior to December 1, 2014, we would pay Mr. Keller a cash bonus equal to the difference between (i) $275,000 times the number of days between May 15, 2012 and the date of the consummation of our initial public offering divided by 365 and (ii) $75,000. Pursuant to this agreement, we paid to Mr. Keller $254,247 on August 1, 2013.
Transaction with Solomon Yakoby. On June 24, 2013, entities controlled by Messrs. Ferdinand, Schaeffer and Solomon Yakoby entered into an agreement to transfer to Mr. Yakoby 67,035 common shares.
Participation in Initial Public Offering. Brian Ferdinand, one of our founders, and Douglas Von Allmen, a beneficial owner of more than 10% of our common stock, purchased an aggregate of $16.2 million of shares of our common stock in our initial public offering at the initial public offering price per share. The shares purchased by Mr. Ferdinand were purchased from us directly at $9 per share, and not from the underwriter, and no underwriting discount was payable by us or by Mr. Ferdinand on such shares. We did, however, pay a fee on such shares to the underwriter, which fee was in the same amount as the underwriting discount. The shares purchased by Mr. Ferdinand reduced the aggregate number of shares offered to investors generally in the underwritten offering.
Sub-lease of Hoboken Office from APX, Inc. On October 1, 2013, we entered into a four-month sublease agreement (the “Hoboken Sublease”) at a monthly rate of $23,247 for approximately 7,200 square feet of office space in Hoboken, New Jersey to be used for certain back-office operations. The Hoboken Sublease included a transfer to the company of the existing equipment located in the space and an agreement to allow the sublessor to use a portion of the space not being used by us for up to nine months. It was entered into with APX, Inc., an entity in which Mr. Storms and Mr. Ibietatorremendia have an interest in and on the board of which they serve as members. In March 2014 we entered into a new five-year lease for the same office space.
Entry into Lock-up Agreements. In connection with sales of 954,085 shares in the aggregate of our common stock by certain of our stockholders, including Messrs. Keller and Schaeffer, each of which owns more than 5% of our issued and outstanding common stock, entered into lock-up agreements with us in respect of their remaining shares of common stock. Pursuant to the terms of the lock-up agreements, the selling stockholders have agreed with the Company that, without the prior written consent of the Company and in each case subject to certain exceptions: (i) during the period beginning on January 30, 2014 through and including July 30, 2014, certain of the selling stockholders will not sell 714,770 shares of common stock or securities convertible into or exchangeable or exercisable for common stock; (ii) during the period beginning on January 30, 2014 through and including October 30, 2014, Mr. Keller will not sell 2,081,351 shares of common stock or securities convertible into or exchangeable or exercisable for common stock; and (iii) during the period beginning on January 30, 2014 through and including January 30, 2015, Mr. Schaeffer will not sell 2,161,739 shares of common stock or securities convertible into or exchangeable or exercisable for common stock.
Von Allmen & Ferdinand Promissory Notes and Guaranty. On February 26, 2014, we executed a Revolving Promissory Note with each of our two largest stockholders, Brian Ferdinand (who is also a director and officer of the company) and Douglas J. Von Allmen (each, a “Note” and, collectively, the “Notes”). Under each Note, we are able to borrow, and the lender has committed to lend, up to a principal amount of $3,750,000 on a revolving basis ($7,500,000 in the aggregate under the Notes), with interest payable quarterly on any amounts borrowed at a rate of 4% per annum. Any amounts borrowed under the Notes are repayable at maturity on April 30, 2015 and are optionally repayable at any time without the payment of any premium or penalty. We will pay a commitment fee on any undrawn amounts at a rate per annum equal to 0.50%, payable quarterly. The Notes contain certain customary covenants, including covenants relating to our ability to incur indebtedness and make restricted payments, and provide for certain customary events of default. The company may terminate the commitment under the Notes at any time. Subsequent to the execution of the Notes, Mr. Von Allmen delivered a personal guaranty (the “Von Allmen Guaranty”) of Mr. Ferdinand’s funding obligations under the Note entered into by him and the company. We will pay Mr. Von Allmen a guaranty fee equal to the commitment fee paid to Mr. Ferdinand in respect of his Note.
Stock Transfers to Douglas J. Von Allmen and Others. In late February of 2014, entities controlled by two of our founders, Brian Ferdinand and Robert Keller, transferred 732,292 shares of our common stock to an entity controlled by Douglas J. Von Allmen and certain other pre-IPO stockholders without the payment of any cash consideration.
| Item 7A. | Quantitative and Qualitative Disclosures About Market Risk |
We are exposed to market risks in the ordinary course of our business. These risks primarily include risk related to interest rates, foreign currency exchange rates and inflation.
Interest Rate Risk
We had cash and cash equivalents of approximately $8.5 million and $1.4 million as of December 31, 2013 and 2012, respectively. This amount was held primarily in cash deposits and money market funds and is held for working capital purposes. Our primary exposure to market risk is interest rate sensitivity, which is affected by changes in the general level of the interest rates in the United States. Due to the short-term nature of these instruments, a sudden change in market interest rates would not be expected to have a material impact on our financial condition, liquidity or our results of operations.
Foreign Currency Exchange Rate Risk
Our sales contracts are primarily denominated in U.S. dollars. A portion of our operating expenses are incurred outside the United States and are denominated in foreign currencies and are subject to fluctuations due to changes in foreign currency exchange rates, particularly changes in the British pound. Additionally, fluctuations in foreign currency exchange rates may cause us to recognize transaction gains and losses in our consolidated statements of operations. To date, foreign currency transaction gains and losses have not been material to our consolidated financial statements, and we have not engaged in any foreign currency hedging transactions. As a result, we believe we currently have limited exposure to foreign currency exchange rates and, therefore, we currently do not intend to enter into foreign currency hedging transactions. If our foreign operations increase, our exposure to foreign currency exchange rate fluctuations may increase and we could, if we deemed appropriate, enter into foreign currency hedging transactions to help mitigate such exposure.
Inflation
We do not believe that inflation has had a material effect on our business, financial condition, liquidity or results of operations to date. Nonetheless, if our costs were to become subject to significant inflationary pressures, we may not be able to fully offset such higher costs through price increases. Our inability or failure to do so could harm our business, financial condition, liquidity and results of operations.
| Item 8. | Financial Statements and Supplementary Data |
LIQUID HOLDINGS GROUP, INC.
INDEX TO CONSOLIDATED FINANCIAL STATEMENTS
| | Page |
| | |
| Report of Independent Registered Public Accounting Firm | F-1 |
| Consolidated Balance Sheets | F-2 |
| Consolidated Statements of Operations and Comprehensive Income (Loss) | F-3 |
| Consolidated Statements of Stockholders’ Equity (Deficit) | F-4 |
| Consolidated Statements of Cash Flows | F-8 |
| Notes to Consolidated Financial Statements | F-10 |
| Item 9. | Changes in and Disagreements with Accountants on Accounting and Financial Disclosure |
Not applicable.
| Item 9A. | Controls and Procedures |
Evaluation of Disclosure Controls and Procedures
Prior to our IPO, which closed on July 31, 2013, we were a private company with limited accounting personnel to adequately execute our accounting processes and limited other supervisory resources with which to address our internal control over financial reporting. In connection with the preparation of our audited financial statements for the period from April 24, 2012 through December 31, 2012 as well as the year ended December 31, 2013, our independent registered public accounting firm identified and communicated three material weaknesses in our internal controls over financial reporting to our Board of Directors. A material weakness is a deficiency, or a combination of deficiencies, that creates a reasonable possibility that a material misstatement of a company’s annual or interim financial statements will not be prevented or detected on a timely basis. The three material weaknesses related to our lack of: (i) internal controls and sufficient personnel to identify, analyze, record and report the accounting effects of the terms of agreements and contracts in accordance with U.S. GAAP; (ii) internal controls to safeguard and archive records to support amounts recorded in the financial statements; and (iii) policies, procedures and controls to identify, authorize, approve, monitor and account for and disclose related party transactions and arrangements, including those transactions outside the normal course of business, in the financial statements in accordance with U.S. GAAP. These material weaknesses resulted in audit adjustments to our financial statements that were identified by our independent registered public accounting firm.
We have begun taking steps and plan to take additional steps to remediate the underlying causes of our material weaknesses, primarily through the development and implementation of formal policies, improved processes, upgraded financial accounting systems and documented procedures, as well as the hiring of additional finance personnel. We hired a Chief Financial Officer in September 2012, an Accounting Manager and a General Counsel in March 2013, and a Controller in April 2013, with the appropriate knowledge, experience and ability to fulfill our obligations to comply with the accounting, reporting and other requirements applicable to public companies. In addition, we are in the process of implementing a new general ledger system that we expect will become operational in 2014, which we believe will enhance our internal controls and reporting capabilities once fully utilized. Although we plan to complete this remediation process as quickly as possible, we cannot at this time estimate how long it will take, and our initiatives may not prove to be successful in remediating these material weaknesses.
Our management, with the participation of our Chief Executive Officer and Chief Financial Officer, evaluated the effectiveness of our disclosure controls and procedures pursuant to Rule 13a-15 under the Securities Exchange Act of 1934, as amended (the “Exchange Act”), as of December 31, 2013. In designing and evaluating the disclosure controls and procedures, management recognized that any controls and procedures, no matter how well designed and operated, can provide only reasonable assurance of achieving the desired control objectives. In addition, the design of disclosure controls and procedures must necessarily reflect the fact that there are resource constraints and that management is required to apply its judgment in evaluating the benefits of possible controls and procedures relative to their costs.
Based on the foregoing evaluation, and in light of the identified material weaknesses discussed above and the fact that these identified material weaknesses are still in the process of being remediated, our Chief Executive Officer and Chief Financial Officer concluded that our disclosure controls and procedures were not effective as of December 31, 2013 to provide reasonable assurance that information we are required to disclose in reports that we file or submit under the Exchange Act is recorded, processed, summarized and reported within the time periods specified in SEC rules and forms, and that such information is accumulated and communicated to our management, including our Chief Executive Officer and Chief Financial Officer, as appropriate, to allow timely decisions regarding required disclosure.
We have not engaged an independent registered accounting firm to perform an audit of our internal control over financial reporting as of any balance sheet date or for any period reported in our financial statements. Our management is not presently required to perform an annual assessment of the effectiveness of our internal control over financial reporting. This requirement will first apply to our Annual Report on Form 10-K for the year ending December 31, 2014. We are an “emerging growth company” under the Jumpstart Our Business Startups (JOBS) Act. Our independent public registered accounting firm will not be required to attest to the effectiveness of our internal control over financial reporting for our Annual Report on Form 10-K for so long as we are an “emerging growth company.”
Changes in Internal Control over Financial Reporting
Except for the ongoing implementation of steps to remediate the material weaknesses identified above, there were no other changes in our internal control over financial reporting (as defined in Rule 13a-15(f) of the Exchange Act) that occurred during the twelve months ended December 31, 2013 that have materially affected, or are reasonably likely to materially affect, our internal control over financial reporting.
Management Report on Internal Control Over Financial Reporting
This Annual Report on Form 10-K does not include a report of management’s assessment regarding internal control over financial reporting or an attestation report of our registered public accounting firm due to a transition period established by the rules of the SEC for newly public companies.
Inherent Limitations on Effectiveness of Controls
Our management, including the Chief Executive Officer and Chief Financial Officer, does not expect that our disclosure controls or our internal control over financial reporting will prevent or detect all errors and all fraud. A control system, no matter how well designed and operated, can provide only reasonable, not absolute, assurance that the control system’s objectives will be met. The design of a control system must reflect the fact that there are resource constraints, and the benefits of controls must be considered relative to their costs. Further, because of the inherent limitations in all control systems, no evaluation of controls can provide absolute assurance that misstatements due to error or fraud will not occur or that all control issues and instances of fraud, if any, have been detected. The design of any system of controls is based in part on certain assumptions about the likelihood of future events, and we cannot assure you that any design will succeed in achieving its stated goals under all potential future conditions. Projections of any evaluation of the effectiveness of controls to future periods are subject to risks. Over time, controls may become inadequate because of changes in conditions or deterioration in the degree of compliance with policies or procedures.
| Item 9B. | Other Information |
None.
Part III
| Item 10. | Directors, Executive Officers and Corporate Governance |
MANAGEMENT
The following table provides information regarding our executive officers and directors as of March 28, 2014:
Name | | Age | | Position(s) Held |
| Victor Simone, Jr. | | 58 | | Chairman of the Board |
| Brian Ferdinand | | 36 | | Vice Chairman of the Board and Head of Corporate Strategy |
| Brian Storms | | 58 | | Chief Executive Officer and Director |
| Kenneth Shifrin | | 56 | | Chief Financial Officer |
| Robert O’Boyle | | 46 | | Executive Vice President and Head of Sales and Marketing |
| Jose Ibietatorremendia | | 45 | | General Counsel and Secretary |
| James Lee | | 44 | | Chief Administrative Officer |
| Jay Bernstein | | 65 | | Director |
| Darren Davy | | 46 | | Director |
| David Francescani | | 70 | | Director |
| Walter Raquet | | 68 | | Director |
| Thomas Ross | | 56 | | Director |
| Dennis Suskind | | 70 | | Director |
| Allan Zavarro | | 68 | | Director |
Set forth below is a description of the backgrounds of our directors and executive officers.
Victor Simone, Jr.has served as a director of our company since March 2013 and as Chairman of the Board since December 2013. From 2006 until his retirement in 2009, Mr. Simone served as Global Head of the Principal Strategic Investments Group at Goldman Sachs. During his tenure at Goldman Sachs, Mr. Simone led the firm’s Global eBusiness Group, its Institutional Client Services Group, its Private Client Services Fixed Income Group, and also served as Chairman of the firm’s Innovation Committee and the Fixed Income Industry Groups. He joined Goldman Sachs in 1981 after working in the corporate banking department of the Chase Bank, and he was named a managing director at Goldman Sachs in 1997. He has served as chairman of the Boards of a number of financial technology companies, including Tradeweb Markets LLC, as well as in a variety of other board positions. He served as a director of Interactive Data Corporation from 2009 to 2010, served on the GETCO Advisory Board from 2010 to 2011, and served as a senior industry executive of Welsh, Carson, Anderson & Stowe from 2011 to 2012. He is currently a director of the Boston College Wall Street Executive Council, the Boston College Financial Advisory Board and the New York Fellowship. Mr. Simone received his bachelor’s degree from Boston College and his Masters of Business Administration from New York University.
Mr. Simone was selected to serve on our Board of Directors due to his extensive capital markets experience as a result of nearly three decades of senior management roles at Goldman Sachs.
Brian Ferdinandserved as President of our company from April 2012 until March 2013 and has served as Vice Chairman of the Board and Head of Corporate Strategy since then. Mr. Ferdinand is one of the founders of Liquid Holdings Group, LLC. Prior to founding Liquid Holdings Group, Mr. Ferdinand founded Liquid Futures and Liquid Prime Services in 2011 and served as the managing member of those entities until those entities were acquired by Liquid Holdings Group in 2012. From 2003-2010, Mr. Ferdinand was a Partner and Managing Director of ECHOtrade, a U.S. based broker-dealer. Mr. Ferdinand grew ECHOtrade from a single person to over 400 traders directly under his management with offices in New York, Boston, Philadelphia, Boca Raton, Miami, New Jersey and Chicago. He was responsible for ECHOtrade’s direct market access on NYSE, becoming the first client of Merrill Lynch & Co., Inc. to do so.
Mr. Ferdinand was selected to serve on our Board of Directors due to his extensive knowledge of our company and significant experience working with early-stage technology companies.
Brian Stormshas served as Chief Executive Officer of our company since December 2012, as a director of our company since November 2012 and as Chairman of the Board from July 2013 until December 2013. He was previously Chairman and Chief Executive Officer of NYSE Blue, a company that formed through the 2011 merger of APX, Inc., or APX, and BlueNext, S.A., or BlueNext. Prior to the merger, since 2007 Mr. Storms was the Chairman and Chief Executive Officer of APX. Mr. Storms has served on the board of directors of APX since 2007. Mr. Storms is the former Chairman and Chief Executive Officer of Marsh Inc., Mercer Human Resource Consulting S.A., and UBS Global Asset Management (Americas) Inc. Mr. Storms has previously held positions including President and Chief Operating Officer of Mitchell Hutchins Asset Management Inc.; President of the Prudential Investments mutual fund and annuity complex; Managing Director of the International Retirement Group of Fidelity Investments Institutional Services Company, Inc., or Fidelity; Senior Vice President and Director of Fidelity’s Banking Division; Chief Executive Officer and President of Financial Services Advisors, Inc., a subsidiary of J.K. Schofield & Co.; and Senior Vice President for IFSA Corporation. Mr. Storms received his bachelor’s degree from the State University of New York at Stony Brook.
Mr. Storms was selected to serve on our Board of Directors due to his extensive experience in the financial services industry and in the development and implementation of companies’ growth strategies.
Kenneth Shifrinhas served as Chief Financial Officer of our company since September 2012. Prior to joining our company, Mr. Shifrin was the President of Essex Financial Services, Inc. from November 2008 until September 2012. Mr. Shifrin served as Chief Financial Officer of NYMEX, from 2006 to 2008. During his tenure at NYMEX Mr. Shifrin also served as Senior Vice President in 2006 and as Vice President and Controller from 2004 to 2005. Prior to his time at NYMEX, Mr. Shifrin served as Global Controller of Electronic Broking Systems. Mr. Shifrin has held several senior financial roles, including Chief Financial Officer of Gateway Logistics, Corp., and Chief Financial Officer and Vice President of Finance for Hirsch International, Corp. Mr. Shifrin received his bachelor’s degree in economics from Stony Brook University, his Masters of Business Administration from Adelphi University and is a Certified Public Accountant.
Robert O’Boylehas served as Executive Vice President and Director of Sales and Marketing of our company since March 2013. Mr. O’Boyle brings over twenty years of business development and marketing leadership experience in the financial services industry. From 2002 until joining our company, he held several senior roles at Advent Software, Inc., including Vice President of Solutions Marketing, Business Development and Sales for Advent’s Asset Management Group. As Vice President of Product Marketing and Product Management of Advent’s Global Accounts Division, Mr. O’Boyle oversaw product strategy and positioning of Advent’s global asset management and hedge fund accounting system. Previously, he led software and service development at Transcentive, Inc. (now known as Solium Transcentive LLC). Mr. O’Boyle received his bachelor’s degree from the University of Connecticut.
Jose Ibietatorremendiahas served as General Counsel and Secretary of our company since March 2013. From 2009 until joining our company, Mr. Ibietatorremendia served as Managing Director, General Counsel and Chief Compliance Officer of NYSE Blue and APX and continues to serve as Secretary of APX. He has also served on the board of directors of APX since May 2013 and he served as a director of BlueNext from 2011 to 2012. He served in senior legal positions at Goldman, Sachs & Co. from 2006 to 2009 and at GE Capital prior to 2006. Mr. Ibietatorremendia began his career in private practice in 1994 at the law firm of Sullivan & Cromwell, which he joined after serving as a law clerk to the Hon. Eduardo C. Robreno of the U.S. District Court for the Eastern District of Pennsylvania. Mr. Ibietatorremendia received his bachelor’s degree from the Wharton School, University of Pennsylvania, and his law degree from the University of Pennsylvania Law School.
James Leehas served as Chief Administrative Officer of our company since May 2013. Prior to joining our company, Mr. Lee was Chief Information Officer of Endurance Specialty Insurance from 2012 to 2013 and with Marsh & McLennan Companies from 2006 to 2011. From 2001 to 2006, he was Executive Director, Chief Information Officer—Americas and Head of Managed Accounts Operations—Americas for UBS Global Asset Management. Mr. Lee started his career in management consulting with the IBM Business Consulting Services division. Mr. Lee received his bachelor’s degree from Adelphi University.
Jay Bernsteinhas served as a director of our company since November 2012. Since 1988, Mr. Bernstein has been Chairman and Chief Executive Officer of NIC Holding Corp, a privately owned company principally engaged in the business of trading petroleum on futures exchanges and spot markets in the Atlantic basin. He has also served as the President of Petroterminal de Panama S.A., a private company in Panama City, Panama. Mr. Bernstein is a member of the Chairman’s Council for the Long Island Philharmonic and the National Council for the Aspen Art Museum. He is a board member of Island Harvest and the Israel Museum in Jerusalem and serves on the Board of Trustees of the Washington Institute for Near East Policy. He received his bachelor’s degree from the University of Pennsylvania and graduate degrees from the American University Washington College of Law and Harvard Law School.
Mr. Bernstein was selected to serve on our Board of Directors due to his extensive experience and knowledge of futures trading and his extensive investment career.
Darren Davyhas served as a director of our company since November 2012. Mr. Davy is currently the Chief Executive Officer of Davy Capital Management LLC, a position he has held since 2009. Mr. Davy has managed money for Brevan Howard Asset Management LLP from 2008 to 2009 and Omega Partners from 2006 to 2007. From 1999 to 2006 Mr. Davy ran Nexus Capital Limited, an affiliate of Soros Fund Management, managing the macro book for the Quantum Funds and Quota Funds. Mr. Davy has acted as a member of the investment committee at Omega Advisors, Inc. from 1995 to 1997 and was responsible for managing the Omega G10 Macro Group. Mr. Davy has also held positions as an executive arbitrageur for the Ross Group in Bermuda from 1991 to 1993, as senior arbitrage trader at BNP Capital Markets Ltd. in London in 1991, and as proprietary trader with Gerrard & National Holdings PLC in London from 1987 to 1991. Mr. Davy’s investment career has spanned over 25 years.
Mr. Davy was selected to serve on our Board of Directors due to his extensive investment career and demonstrated experience making investments in financial services companies.
David Francescanihas served as a director of our company since November 2012. Mr. Francescani is a principal in the New York office of Fish & Richardson, a leading intellectual property law firm in the U.S. Mr. Francescani served as Managing Principal of the New York office from 2004 to 2012 and served on the firm’s Compensation Committee from 2002 to 2006. Mr. Francescani joined Fish & Richardson in 2001. Prior to that, Mr. Francescani was a partner at Darby & Darby, another intellectual property law firm from 1969 to 1986 and 1992 to 1998. From 1986 to 1992, Mr. Francescani was General Counsel and an Executive Vice President at J.J. Kenny Co., Inc., a financial services company specializing in municipal bonds. His legal practice involves intellectual property litigation in the fields of computers, software, telecommunications, financial exchanges and proprietary trading systems. He has practiced in the field of intellectual property law for over 45 years and is registered to practice before the USPTO. Mr. Francescani received his bachelor’s degree from the University of Notre Dame and his law degree from the Notre Dame School of Law.
Mr. Francescani was selected to serve on our Board of Directors due to his extensive experience and knowledge of intellectual property law.
Walter Raquethas served as a director of our company since May 2013. Mr. Raquet is currently Chairman of Bolton LLC, an investment management company, which position he has held since 2012. Since 2012 he has served on the board of directors of Green Earth Technologies, Inc. From 2004 to 2011 he was Chairman of WR Platform Advisors LP, a technology platform and service provider of managed accounts for hedge fund investments. Mr. Raquet was a co-founder of Knight Capital Group, Inc., or Knight, where he served as Chief Operating Officer from its inception in 1995 until 2000 and as its Executive Vice President from 1998 through 2002. During that period he also served as a member of Knight’s board of directors. Prior to 2002, Mr. Raquet was a Senior Vice President with Spear, Leeds & Kellogg L.P./Troster Singer Corporation and a Partner at Herzog Heine & Geduld, LLC, where he directed the firm’s technology and marketing efforts. Mr. Raquet has also served previously as Corporate Controller for PaineWebber Group Inc., Executive Vice President of Cantor Fitzgerald, L.P. and Controller for Weeden & Co. L.P. Mr. Raquet is a certified public accountant and practiced at the accounting firm of PriceWaterhouseCoopers LLP. Mr. Raquet received his bachelor’s degree in accounting from New York University.
Mr. Raquet was selected to serve on our Board of Directors due to his extensive background and experience in the financial services industry and with corporate finance matters.
Thomas Rosshas served as a director of our company since November 2012. Mr. Ross is an energy trading professional and the former head of trading at BP North America. With over 30 years of experience in trading and risk management, his career spans London, New York and Chicago. Since 2009, Mr. Ross has been the owner of Carradale Partners LLC, an energy consulting firm. From 2006 to 2009, Mr. Ross oversaw British Petroleum’s North American trading operations, including offices in Calgary, Long Beach, Houston and Chicago with activities in exploration and production, refining and entrepreneurial trading in North and South America. He has been a member of the ICE Board of Directors and an active member of the NYMEX advisory committee.
Mr. Ross was selected to serve on our Board of Directors because he brings more than 30 years of background in trading and risk management.
Dennis Suskindhas served as a director of our company since November 2012. Mr. Suskind held the title of general partner of Goldman Sachs until his retirement in 1991. Mr. Suskind currently serves on the board of the Chicago Mercantile Exchange, a position he has held since 2008. He also serves on the board of the Bridgehampton National Bank where he is Vice Chairman. Mr. Suskind was among those elected as an inaugural member to the Futures Industry Association’s Hall of Fame in 2005. He previously served as Vice Chairman of NYMEX, Vice Chairman of COMEX, a member of the board of directors the Futures Industry Association, a member of the board of International Precious Metals Institute, and a member of the boards of the Gold and Silver Institutes in Washington, D.C. Mr. Suskind was President of the board of directors of the Arthur Ashe Institute for Urban Health at its inception and has served as a Member of the President’s Council of the Peconic Land Trust, President of Brown University’s Parents’ Council, Founding Member of Mt. Sinai’s Hospital Associates, the board of directors of the Nature Conservancy, and as a board member of the Collegiate School. From 2001 to 2004, Mr. Suskind held a Town Council seat in the Town of Southampton, New York. The Preservation League of New York State presented Mr. Suskind with its 2005 Pillar of New York Award.
Mr. Suskind was selected to serve on our Board of Directors due to his extensive knowledge of the industry and his significant corporate governance experience as a result of his service on the Board of Directors of numerous mercantile exchanges and industry groups.
Allan Zavarrohas served as a director of our company since March 2013. Mr. Zavarro is currently the president of A. Zavarro and Co. Inc., a position he has held since 2006. From 1997 to 2006 he was Chief Executive Officer of the Global Futures business at ABN AMRO. From 1992 until joining ABN AMRO, Mr. Zavarro worked for Citicorp as President and Chief Executive Officer of Citicorp Futures Corporation. Mr. Zavarro served as Account Executive, Branch Manager, Marketing Manager and Chief Executive of Merrill Lynch’s wholesale securities business, Broadcort Capital Corp., and Chief Executive of Merrill Lynch Futures Inc. He has served on the boards of Merrill Lynch Futures Inc., Broadcort Capital Corp., Citicorp Futures Corp., Citicorp Commodities Corp., Citicorp Global Asset Management, CM Capital Markets and the Futures Industry Association and has been a member of the NYSE, Chicago Mercantile Exchange, Chicago Board of Trade, and the NYMEX. Mr. Zavarro attended Southern Illinois University and the New York Institute of Finance and completed the Merrill Lynch Advanced Management Program in 1988.
Mr. Zavarro was selected to serve on our Board of Directors due to his extensive knowledge of the futures trading industry and his significant corporate governance experience due to service on many boards of directors.
Board Composition
Our Board of Directors consists of ten directors, including our Chief Executive Officer. Our certificate of incorporation provides that our Board of Directors consists of such number of directors as determined from time to time by resolution adopted by a majority of the directors then in office, with any additional directorships resulting from an increase in the authorized number of directors or other vacancies filled by the directors then in office. Until Mr. Schaeffer’s resignation from the Board in December 2013, the Board had consisted of eleven directors. Subsequent to Mr. Schaeffer’s resignation, the nominating and governance committee of the Board recommended that the size of the Board be reduced to ten, a recommendation that the full Board adopted.
Our Board of Directors is divided into three classes, with each director serving a three-year term, and one class being elected at each year’s annual meeting of stockholders. Messrs. Ross, Simone and Storms are Class I directors with an initial term expiring in 2014. Messrs. Bernstein, Ferdinand, Francescani and Zavarro are Class II directors with an initial term expiring in 2015. Messrs. Davy, Raquet and Suskind are Class III directors with an initial term expiring in 2016. Any change in the number of directorships resulting from an increase or decrease in the number of directors will be distributed among the three classes so that, as nearly as possible, each class will consist of one-third of the total number of directors.
The division of our Board of Directors into three classes with staggered three-year terms may have the effect of delaying, deterring or preventing a change of our management or a change in control of us.
Board Meetings
During fiscal 2013, the Board of Directors of Liquid Holdings Group, Inc. held six meetings. During fiscal 2013, each director attended at least 75% of the aggregate of the total number of meetings of the Board of Directors of Liquid Holdings Group, Inc. and the total number of meetings held by any of the committees of the Board of Directors of Liquid Holdings Group, Inc. on which such director served. Directors are also expected to attend annual meetings of the stockholders of Liquid Holdings Group absent an unavoidable and irreconcilable conflict. We did not hold an Annual Meeting of Stockholders in fiscal 2013.
The non-management members of the Board of Directors also meet in regularly scheduled executive sessions without management present.
Director Independence
Based upon the listing standards of the NASDAQ Global Market and SEC regulations, our Board of Directors has determined that Messrs. Bernstein, Davy, Francescani, Raquet, Ross, Simone, Suskind and Zavarro are “independent” under the standards of the NASDAQ Global Market.
Corporate Governance and Committees of the Board of Directors
We and our Board of Directors regularly review and evaluate our corporate governance practices. The Board of Directors has adopted corporate governance principles that address the composition of and policies applicable to the Board of Directors. Our corporate governance principles, set forth as Corporate Governance Guidelines, are available on our website at http://ir.liquidholdings.com/governance.cfm.
Our Board of Directors has established executive, audit, human resources and compensation, and nominating and governance committees. The composition, duties and responsibilities of these committees are set forth below.
Executive Committee
Our Board of Directors has established an executive committee which is responsible for exercising all of the powers of our Board of Directors during intervals between meetings, except for those powers delegated to other committees of our Board of Directors and powers which may not be delegated to a committee of our Board of Directors under Delaware law, NASDAQ rules and regulations, or our certificate of incorporation or bylaws. Our Board of Directors has adopted a written charter for the executive committee, which is available on our website.
Our executive committee consists of Messrs. Ferdinand, Ross, Simone and Storms, with Mr. Storms serving as chairman.
Audit Committee
Our Board of Directors has established an audit committee which is responsible for, among other matters:(1) appointing, compensating, retaining, evaluating, terminating and overseeing our independent registered public accounting firm; (2) discussing with our independent registered public accounting firm their independence from us; (3) reviewing with our independent registered public accounting firm the matters required to be reviewed by applicable auditing requirements; (4) approving all audit and permissible non-audit services to be performed by our independent registered public accounting firm; (5) overseeing the financial reporting process and discussing with management and our independent registered public accounting firm the interim and annual financial statements that we file with the SEC; (6) reviewing and monitoring our internal controls, disclosure controls and procedures and compliance with legal and regulatory requirements; and (7) establishing procedures for the confidential anonymous submission of concerns regarding questionable accounting, internal controls, auditing and federal securities law matters.
Our audit committee consists of Messrs. Raquet, Suskind and Zavarro, with Mr. Zavarro serving as chairman. Rule 10A-3 of the Exchange Act and NASDAQ Global Market rules require us to have one independent audit committee member upon the listing of our common stock on the NASDAQ Market, a majority of independent directors within 90 days of the date of that date and all independent audit committee members within one year of that date. Our Board of Directors has affirmatively determined that each of Messrs. Raquet, Suskind and Zavarro meets the definition of an “independent director” for purposes of serving on an audit committee under Rule 10A-3 and NASDAQ Global Market rules, and we intend to comply with the other independence requirements within the time periods specified. In addition, our Board of Directors has determined that each of Messrs. Raquet, Suskind and Zavarro qualifies as an “audit committee financial expert,” as such term is defined in Item 407(d)(5) of Regulation S-K under the Securities Act of 1933, as amended. Our Board of Directors has adopted a written charter for the audit committee, which is available on our website athttp://ir.liquidholdings.com/governance.cfm.
Human Resources and Compensation Committee
Our Board of Directors has established a human resources and compensation committee which is responsible for, among other matters: (1) reviewing officer and executive compensation goals, policies, plans and programs; (2) reviewing and approving or recommending to the Board or the independent directors, as applicable, the compensation of our directors, Chief Executive Officer and other executive officers; (3) reviewing and approving employment agreements and other similar arrangements between us and our officers and other key executives; and (4) appointing and overseeing any compensation consultants.
Our human resources and compensation committee consists of Messrs. Bernstein, Ross and Simone, with Mr. Ross serving as chairman. The composition of our human resources and compensation committee meets the requirements for independence under current rules and regulations of the SEC and NASDAQ Global Market. Each member of the human resources and compensation committee is also a non-employee director, as defined pursuant to Rule 16b-3 promulgated under the Exchange Act, and an outside director, as defined pursuant to Section 162(m) of the Internal Revenue Code, as amended, or the Code. Our Board of Directors has adopted a written charter for the human resources and compensation committee, which is available on our website at http://ir.liquidholdings.com/governance.cfm.
Nominating and Governance Committee
Our Board of Directors has established a nominating and governance committee which is responsible for, among other matters: (1) identifying individuals qualified to become members of our Board of Directors, consistent with criteria approved by our Board of Directors; (2) overseeing the organization of our Board of Directors to discharge the board’s duties and responsibilities properly and efficiently; (3) developing and recommending to our Board of Directors a set of corporate governance guidelines and principles; and (4) reviewing and approving related person transactions.
Our nominating and governance committee consists of Messrs. Francescani, Raquet and Simone, with Mr. Francescani serving as chairman. The composition of our nominating and governance committee meets the requirements for independence under current rules and regulations of the SEC and NASDAQ Global Market. Our Board of Directors has adopted a written charter for the nominating and governance committee, which is available on our website athttp://ir.liquidholdings.com/governance.cfm.
Our nominating and governance committee uses a variety of methods for identifying and evaluating director nominees. The committee regularly assesses the appropriate size, composition and needs of the Board of Directors and its respective committees and the qualifications of candidates in light of these needs. In fulfilling its responsibility to identify and evaluate director nominees, the nominating and governance committee evaluates such nominees against the criteria it deems appropriate as well as the qualifications set out in our principles of corporate governance and determined by the Board. These criteria include the following:
| 1. | Directors should be of the highest ethical character and share the Company’s values reflected in the Company’s Code of Business Conduct. |
| 2. | Directors should have reputations, both personal and professional, consistent with the image and reputation of the Company. |
| 3. | Directors should be highly accomplished in their respective fields, with superior credentials and recognition. |
| 4. | Each Director should have relevant expertise and experience, as well as a commitment to representing the long-term interests of the stockholders, and be able to offer advice and guidance to the Chief Executive Officer based on that expertise, experience and commitment. |
| 5. | All outside Directors on the Board should be and remain “independent,” not only as that term may be legally defined in relevant SEC and NASDAQ rules and regulations, but also without the appearance of any conflict in serving as a Director. In addition, Directors should be independent of any particular constituency and be able to represent all stockholders of the Company. |
| 6. | Each Director should have the ability to exercise sound business judgment, with the willingness to take appropriate risks. |
| 7. | Each Director should have the time required for preparation, participation and attendance at meetings of the Board of Directors and, if relevant, the Board’s committees. |
| 8. | Consideration should be given to developing a Board of Directors that is a diverse body, with diversity reflecting gender, ethnic background and professional experience. |
Candidates may come to the attention of our nominating and corporate governance committee through directors, stockholders (as described below) or management. If the nominating and governance committee believes that the Board of Directors requires additional candidates for nomination, the nominating and governance committee may engage, as appropriate, a third party search firm to assist in identifying qualified candidates. The evaluation of these candidates may be based solely upon information provided to the nominating and governance committee or may also include discussions with persons familiar with the candidate, an interview of the candidate or other actions the nominating and governance committee deems appropriate, including the use of third parties to review candidates.
Stockholders may propose director candidates for general consideration by our nominating and governance committee. Stockholders must provide timely notice of their proposal in writing to the corporate secretary consistent with the notice and other requirements set forth in our Bylaws, a copy of which can be found on our website at http://ir.liquidholdings.com/governance.cfm. Recommendations must include:
| 1. | The name and address of the stockholder making the recommendation; |
| 2. | A representation that the stockholder is a holder of the company’s common stock; |
| 3. | Sufficient biographical information about the individual recommended in order to allow the committee to assess such individual’s qualifications and independence; and |
| 4. | Any other information the stockholder believes would be helpful to the committee in evaluating the individual recommended. |
The nominating and governance committee will evaluate any candidates recommended by stockholders against the same criteria and pursuant to the same policies and procedures applicable to the evaluation of candidates proposed by directors or management.
Director Compensation
The following table sets forth the total cash and equity compensation paid to our non-employee directors for their service on the Board of Directors and committees of the Board of Directors during fiscal 2013:
Name(1) | | Fees Earned or
Paid in Cash
($)(2) | | | Stock Awards ($)(3) | | | All Other
Compensation
($)(4) | | | Total
($) | |
| Jay Bernstein | | | 33,982 | | | | 95,943 | | | | — | | | | 129,925 | |
| Darren Davy | | | 62,328 | | | | 95,943 | | | | — | | | | 158,271 | |
| David Francescani | | | 48,520 | | | | 95,943 | | | | — | | | | 144,463 | |
| Walter Raquet | | | 36,525 | | | | 95,943 | | | | — | | | | 132,468 | |
| Tom Ross | | | 75,414 | | | | 95,943 | | | | 327,622 | | | | 498,979 | |
| Richard Schaeffer(5) | | | 20,347 | | | | 95,943 | | | | — | | | | 116,290 | |
| Victor R. Simone, Jr. | | | 37,255 | | | | 95,943 | | | | — | | | | 133,198 | |
| Dennis Suskind | | | 50,702 | | | | 95,943 | | | | 48,750 | | | | 195,395 | |
| Allan Zavarro | | | 44,885 | | | | 95,943 | | | | 40,250 | | | | 181,078 | |
| (1) | Former directors Edward Feigeles, Robert Keller and Nigel Kneafsey did not receive any compensation for service as a member of the Board of Directors in 2013. |
| (2) | In lieu of receiving a cash retainer with respect to service during the fourth quarter of 2013, each director other than Mr. Schaeffer will receive restricted stock units in 2014 with a grant date fair value equal to $10,000. This column also includes RSUs granted on October 4, 2013 in lieu of a cash retainer with respect to service during the period up to and including September 30, 2013, which RSUs will vest on the earlier of (a) one year from the grant date and (b) the day before the next annual meeting of our stockholders. Each restricted stock unit represents a right to receive one common share as of the date of vesting. The shares of common stock underlying the restricted stock units will be delivered to the person on the date that is six months following his separation from service as a member of the Board of Directors. |
| (3) | This column includes the value of RSU awards awarded to certain directors during 2013 and which vested immediately, based upon the grant date fair value, as determined in accordance with Financial Accounting Standards Board Accounting Standards Codification Topic 718 (“FASB Topic 718”). The assumptions used to calculate the valuation of the awards for fiscal 2013 are set forth in Note 8 to the Notes to Liquid Holdings Group Consolidated Financial Statements in this 10-K for the period ended December 31, 2013. The shares of common stock underlying the restricted stock units will be delivered to the person on the date that is six months following his separation from service as a member of the Board of Directors. As of December 31, 2013, the following number of director stock awards were outstanding: 15,277 shares for Mr. Bernstein, 18,888 shares for Mr. Davy, 17,129 shares for Mr. Francescani, 15,601 shares for Mr. Raquet, 20,555 shares for Mr. Ross, 14,814 shares for Mr. Schaeffer, 15,694 shares for Mr. Simone, 17,407 shares for Mr. Suskind and 16,666 shares for Mr. Zavarro. As of December 31, 2013, no director stock options were outstanding. |
| (4) | This column includes sales of shares by our founders to certain of our directors at prices below fair value. |
| (5) | Mr. Schaeffer resigned from the Board of Directors on December 23, 2013. |
Narrative to Director Compensation Table
We did not pay any compensation to our directors in 2013 other than the stock awards described above, including the restricted stock units awards given in October 2013 in lieu of a cash retainer with respect to the service of the directors during 2012 and 2013 and the restricted stock unit awards earned but not yet paid with respect to the service of the directors during the fourth quarter of 2013. We believe that attracting and retaining qualified non-employee directors is critical to our future growth. Our non-employee directors receive compensation that is commensurate with the compensation that is offered to directors of companies that are similar to ours. We have not compensated, and do not expect to compensate, directors that are our employees for their service on our Board of Directors. Our policy is to reimburse our directors for reasonable out-of-pocket expenses that they incur in connection with their service as directors, in accordance with our general expense reimbursement policies.
Compensation Committee Interlocks and Insider Participation
None of our executive officers currently serves, or in the past year has served, as a member of the board of directors or compensation committee of any entity that has one or more executive officers serving on our Board of Directors or compensation committee. We are a party to certain transactions with certain of our Directors and Executive Officers. See the section titled “Certain Relationships and Related Party Transactions.”
Section 16(a) Beneficial Ownership Reporting Compliance
Section 16(a) of the Securities Exchange Act of 1934, as amended, requires our directors and executive officers, among others, to file with the SEC and NASDAQ an initial report of ownership of our stock on Form 3 and reports of changes in ownership on Form 4 or Form 5. Persons subject to Section 16 are required by SEC regulations to furnish us with copies of all Section 16(a) forms that they file. As a matter of practice, we assist our executive officers and directors in preparing initial ownership reports and reporting ownership changes, and typically file those reports on their behalf. Based solely on a review of the copies of such forms in our possession, we believe that during fiscal year 2013 all of our executive officers and directors filed the required reports on a timely basis under Section 16(a), except that a Form 4 filed by Mr. Shifrin reporting shares of our common stock withheld by us to cover taxes associated with settlement of restricted stock units that vested was inadvertently filed late.
Code of Business Conduct
Our Board of Directors has adopted a code of business conduct applicable to our employees, directors and officers, including our principal executive, financial and accounting officers, or persons performing similar functions, in accordance with applicable U.S. federal securities laws and the corporate governance rules of the NASDAQ Global Market. The full text of our code is published on our corporate governance website located at http://ir.liquidholdings.com/governance.cfm. We intend to disclose future amendments to certain provisions of our code, or waivers of such provisions granted by our Board of Directors to executive officers and directors, on the website within four business days following the date of such amendment or waiver.
| Item 11. | Executive Compensation |
2013 Summary Compensation Table
The following table summarizes information regarding the compensation awarded to, earned by or paid to our principal executive officer, our two most highly compensated executive officers other than our principal executive officer and two additional individuals who would have qualified under one of the foregoing designations but were not employees as of December 31, 2013.
| Name and Principal Position | | Year | | Salary
($) | | Bonus
($) | | | Stock
Awards
($)(1) | | | Option Awards
($) | | | Non-Equity Incentive Plan Compensation
($) | | | Nonqualified Deferred Compensation Earnings ($) | | | All Other Compensation
($) | | Total
($) |
Brian Storms
Chief Executive Officer | | 2013
2012 | | 510,663
20,833 | | | —
— | | | | —
5,731,873 | | | | —
— | | | | —
— | | | | —
— | | | —
318,397 | | 510,663
6,071,103 |
Brian Ferdinand
Vice Chairman and Head of Corporate Strategy(2) | | 2013
2012 | | 291,666
135,833 | | | 417,551
— | | | | 2,528,750 8,598,593 | | | | —
— | | | | —
— | | | | —
— | | | 38,377
250,000 | | 3,276,344
8,984,426 |
Kenneth Shifrin
Chief Financial Officer | | 2013
| | 291,961 | | | — | | | | 722,500 | | | | — | | | | — | | | | — | | | — | | 1,014,461 |
| (1) | This column includes the value of common units, incentive units and restricted stock units, or RSUs, awarded to our named executive officers based upon the grant date fair value, as determined in accordance with Financial Accounting Standards Board Accounting Standards Codification Topic 718 (“FASB Topic 718”). The assumptions used to calculate the valuation of the awards for fiscal 2013 are set forth in Note 8 to the Notes to Consolidated Financial Statements in this 10-K for the period ended December 31, 2013. |
| (2) | Mr. Ferdinand’s position changed on April 5, 2013 to Vice Chairman and Head of Corporate Strategy. |
Employment Agreements
We entered into employment agreements with certain of our executive officers in 2012 and 2013. The terms of these agreements are described below.
Brian Storms. Under his employment agreement as amended and currently in effect, Mr. Storms is serving as our Chief Executive Officer for a two-year term that began on May 15, 2013 which will be automatically renewable for successive one-year terms unless either we or Mr. Storms provides written notice not less than sixty days prior to the expiration of such term. Under this agreement, Mr. Storms will receive a base annual salary of $600,000. In the event that Mr. Storms is terminated by us without cause or terminates his employment with us for good reason, each as defined in the agreement, upon the execution of a general release, he will be entitled to continuation of his base salary and continuation of the other benefits generally provided to other executives for the greater of one year from the date of the termination or the remainder of the initial term of employment.
Mr. Storms’ previous employment agreement with the Company was effective from December 1, 2012 until May 15, 2013. Under the previous employment agreement, he served as our Chief Executive Officer and a member of the Board of Directors and executive committee for a two year initial term of employment that was automatically renewable for successive one-year terms unless either party provided written notice not less than sixty days prior to the expiration of any such term. The previous employment agreement provided for an initial base salary of $250,000, increasing to $500,000 upon the earlier of (a) the completion of our initial public offering and (b) April 1, 2013, eligibility to receive an annual performance bonus and participation in any equity-based compensation plans and benefits as are generally provided to our other executives. Additionally, under the previous employment agreement, Mr. Storms received a grant of RSUs as described below under the heading “Equity Awards—Restricted Stock Units.” The previous employment agreement provided that in the event Mr. Storms was terminated due to death or disability, he would be entitled to continuation of his base salary for two months. The previous employment agreement provided that in the event Mr. Storms was terminated by us without cause or he terminated his employment with us for good reason, each as defined in the previous agreement, upon the execution of a general release, he would be entitled to continuation of his base salary and continuation of the other benefits generally provided to other executives for sixty days.
Brian Ferdinand. Mr. Ferdinand’s current employment agreement with the Company, effective as of May 15, 2013, provides that he will serve as Vice Chairman and Head of Corporate Strategy and a member of the Board of Directors for the term of the agreement. The employment agreement provides for a two-year initial term that began on May 15, 2013 that is automatically renewable for successive one-year terms unless either party provides written notice not less than sixty days prior to the expiration of such term. The employment agreement provides for an initial base annual salary of $450,000 and a one-time cash bonus upon the completion of our initial public offering that will equal the difference between any salary received from us for the period of time between May 15, 2012 and the date of our initial public offering and an effective annual salary of $500,000 for the period of time between May 15, 2012 and the date of our initial public offering. Mr. Ferdinand received $417,551 in respect of that one-time bonus. Mr. Ferdinand is eligible to receive an annual performance bonus and participate in any equity-based compensation plans and benefits as are generally provided to our other executives. The employment agreement also provides for a grant of 341,274 RSUs, one-half of which will vest on May 15, 2014 and one-half of which will vest on May 15, 2015. Mr. Ferdinand will retain unvested RSUs upon his termination of employment, unless he is terminated for cause, as defined in the employment agreement. In the event Mr. Ferdinand is terminated due to death or disability, he will be entitled to continuation of his base salary for two months. In the event Mr. Ferdinand is terminated by us without cause or terminates his employment with us for good reason, each as defined in the agreement, upon the execution of a general release, he will be entitled to continuation of his base salary and continuation of the other benefits generally provided to other executives for the greater of one year from the date of the termination or the remainder of the initial term of employment.
Mr. Ferdinand’s previous employment agreement with the Company was effective from December 1, 2012 until May 15, 2013. Under the previous employment agreement, he served as our President and a member of the Board of Directors for a one year term of employment that was automatically renewable for successive one year terms unless either party provided written notice not less than sixty days prior to the expiration of any such term. The previous employment agreement provided for an initial base salary of $250,000 increasing to $500,000 upon the completion of our initial public offering, eligibility to receive an annual performance bonus and participation in any equity-based compensation plans and benefits as are generally provided to our other executives. Additionally, under the previous employment agreement, Mr. Ferdinand was entitled to a cash bonus upon the completion of our initial public offering equal to the difference between his initial base salary and an effective base salary of $500,000, prorated for the amount of time between May 15, 2012 and the date of our initial public offering. The previous employment agreement provided that in the event Mr. Ferdinand was terminated due to death or disability, he would be entitled to continuation of his base salary for two months. The previous employment agreement provided that in the event Mr. Ferdinand was terminated by us without cause or he terminated his employment with us for good reason, each as defined in the previous agreement, upon the execution of a general release, he would be entitled to continuation of his base salary and continuation of the other benefits generally provided to other executives for six months.
Kenneth Shifrin. We entered into an offer letter with Kenneth Shifrin dated as of August 23, 2012. Pursuant to the terms of the letter, Mr. Shifrin serves as our Chief Financial Officer and received an initial base salary of $250,000 that increased to $350,000 upon the completion of our initial public offering. The letter also provided for a one time signing bonus of $50,000. Mr. Shifrin is eligible to participate in any bonus and equity-based compensation programs and receive benefits as are generally provided to our other executives. If Mr. Shifrin’s employment is terminated during his first year of employment for reasons other than “for cause” (as defined in the letter), he will receive a cash payment of $150,000. After his first year of employment, he will only be entitled to payments upon a termination in accordance with the severance policies, if any, maintained by the Company.
Equity Incentive Plans
We believe that our ability to grant equity-based awards is a valuable and necessary compensation tool that aligns the long-term interests of our employees and directors with the financial interest of our stockholders. In addition, we believe that our ability to grant options and other equity-based awards helps us to attract, retain and motivate qualified employees. We currently maintain the 2012 Amended and Restated Stock Incentive Plan (the “2012 Plan”) pursuant to which we may grant equity compensation awards to employees (including our named executive officers), directors and advisors of the Company.
The terms of the equity grants we have made to our named executive officers are described below.
Pursuant to the terms of his employment agreement, we issued to Mr. Storms an award under our 2012 Plan of 760,033 RSUs on December 1, 2012 which was equal to 4% of the outstanding common units of the Company as of the date of the grant, immediately after giving effect to such grant. Approximately one-third of these RSUs vested on January 1, 2013, approximately one-third vested on December 1, 2013 and approximately one-third will vest on December 1, 2014. Upon termination, Mr. Storms will retain all unvested RSUs unless terminated for cause (as defined in his employment agreement), in which case all unvested RSUs will be forfeited.
We issued Mr. Shifrin an award under our 2012 Plan and a Restricted Stock Unit Agreement of 96,288 RSUs on May 3, 2013. One-third of these RSUs vested on September 18, 2013, one-third will vest on each of September 18, 2014 and September 18, 2015. Upon termination, all unvested RSUs will immediately and automatically be terminated and forfeited back to the Company, unless Mr. Shifrin is terminated without cause, in which case all unvested RSUs scheduled to vest through the end of the year of termination will automatically vest.
We issued Mr. Ferdinand an award under our 2012 Plan and a Restricted Stock Unit Agreement of 341,274 RSUs on May 15, 2013. One-half of these RSUs will vest on each of May 15, 2014 and May 15, 2015. Upon termination, Mr. Ferdinand will retain all unvested RSUs, unless Mr. Ferdinand is terminated for cause, in which case all unvested RSUs will be automatically forfeited.
Outstanding Equity Awards at 2013 Fiscal Year-End
The following table provides information on the current holdings of equity awards of each named executive officer as of December 31, 2013.
| Name | | Number of Shares or Units of Stock that have Not Vested(1) | | | Market Value of Shares or Units of Stock That Have Not Vested ($)(2) | |
| Brian Ferdinand | | | 341,274 | | | $ | 2,368,442 | |
| Brian Storms | | | 253,343 | | | $ | 1,758,200 | |
| Kenneth Shifrin | | | 64,192 | | | $ | 445,492 | |
| (1) | The vesting schedule for each outstanding award appears in the discussion above under the title “Equity Incentive Plans.” |
| (2) | Calculated using the December 31, 2013 closing price on the NASDAQ Global Market of $6.94. |
| Item 12. | Security Ownership of Certain Beneficial Owners and Management and Related Stockholder Matters |
The following tables set forth certain information with respect to the beneficial ownership of our capital stock as of March 25, 2014 by:
| · | each stockholder known by us to be the beneficial owner of more than 5% of any class of our outstanding voting stock; |
| · | each of our named executive officers; |
| · | each of our directors; and |
| · | all of our directors and executive officers as a group. |
We have determined beneficial ownership in accordance with the rules of the SEC and the information is not necessarily indicative of beneficial ownership for any other purpose. Except as indicated in the footnotes below, based on information supplied to us by or on behalf of the stockholders, the persons and entities named in the table below have sole voting and sole investment power with respect to all shares of common stock that they beneficially own, subject to applicable community property laws.
Applicable percentage ownership is based on 24,771,828 common shares outstanding as of March 25, 2014. Unless otherwise indicated in the footnotes to the table, the address of each beneficial owner listed in the table below is c/o Liquid Holdings Group, Inc., 800 Third Avenue, 38th Floor, New York, NY 10022.
| Name of Beneficial Owner | | Number of
Shares
Beneficially
Owned | | | Percentage
of Shares
Beneficially
Owned | |
| Executive Officers and Directors: | | | | | | |
| Brian Storms(1) | | | 1,268,202 | | | | 5.12 | % |
| Brian Ferdinand(1)(2) | | | 5,214,647 | | | | 21.05 | % |
| Kenneth Shifrin(1) | | | * | | | | — | |
| Robert O’Boyle(3) | | | * | | | | — | |
| Jose Ibietatorremendia(1)(4) | | | * | | | | — | |
| James Lee(5) | | | * | | | | — | |
| Jay Bernstein(1)(6) | | | 444,274 | | | | 1.79 | % |
| Darren Davy(1) | | | 271,920 | | | | 1.09 | % |
| David Francescani(1) | | | * | | | | * | |
| Walter Raquet(1) | | | * | | | | — | |
| Thomas Ross(1)(7) | | | 316,507 | | | | 1.28 | % |
| Victor R. Simone, Jr.(1) | | | * | | | | * | |
| Dennis Suskind(1) | | | * | | | | * | |
| Allan Zavarro(1) | | | * | | | | * | |
| All Directors and Executive Officers as a Group | | | 7,993,117 | | | | 32.02 | % |
| Other 5% Stockholders: | | | | | | | | |
| Douglas J. Von Allmen(8) | | | 6,015,308 | | | | 24.28 | % |
| Robert Keller(9) | | | 1,588,889 | | | | 6.41 | % |
| Richard Schaeffer(1)(10) | | | 2,161,739 | | | | 8.73 | % |
* Less than 1%.
| (1) | These individuals hold restricted stock units in the following amounts, each RSU representing a right to receive one common share subject to vesting or other delivery conditions not expected to occur within 60 days of March 25, 2014: Mr. Bernstein – 15,277 RSUs; Mr. Davy – 18,888 RSUs; Mr. Ferdinand – 170,637 RSUs; Mr. Francescani – 17,129 RSUs; Mr. Ibietatorremendia – 30,802 RSUs; Mr. Raquet – 15,601 RSUs; Mr. Ross – 20,555 RSUs; Mr. Schaeffer – 14,814 RSUs; Mr. Shifrin – 64,192 RSUs; Mr. Simone – 15,694 RSUs; Mr. Storms – 253,343 RSUs; Mr. Suskind – 17,407 RSUs; Mr. Zavarro – 16,666 RSUs. Such RSUs are not reflected in the above table. |
| (2) | Consists of (a) 2,963,652 common shares held by Ferdinand Holdings, LLC, a Delaware limited liability company of which Mr. Ferdinand is the managing member, (b) 654,943 common shares held by Ferdinand Trading II LLC, a Delaware limited liability company of which Mr. Ferdinand is the managing member, (c) 259,953 common shares held by LT World Limited LLC, a Delaware limited liability company of which Mr. Ferdinand is the managing member, (d) 1,012,049 common shares held by Mr. Ferdinand directly, (e) 153,413 common shares held by LT World Partners LLC, a Delaware limited liability company of which Mr. Ferdinand is the managing member and (f) 170,637 RSUs held by Mr. Ferdinand directly. |
| (3) | Mr. O’Boyle has been granted 30,377 RSUs and options to acquire 60,946 shares of common stock, which RSUs and options are subject to vesting conditions not expected to occur within 60 days of March 25, 2014. Such RSUs and the shares of common stock underlying the options are not reflected in the above table. In addition, the table does not reflect the 45,566 RSUs that would be granted and immediately vest in the event that our market capitalization reached $300 million or more over a consecutive sixty (60) day period. |
| (4) | Mr. Ibietatorremendia has been granted options to acquire 30,802 shares of common stock, which options are subject to vesting conditions not expected to occur within 60 days of March 25, 2014. The shares of common stock underlying the options are not reflected in the above table. |
| (5) | Mr. Lee has been granted options to acquire 76,000 shares of common stock, which options are subject to vesting conditions not expected to occur within 60 days of March 25, 2014. Such options are not reflected in the above table. |
| (6) | Consists of (a) 270,607 common shares held by Mr. Bernstein and (b) 173,667 common shares held by a trust for which Mr. Bernstein’s spouse shares voting and investment power. Mr. Bernstein disclaims beneficial ownership of the shares held by the trust. |
| (7) | Consists of (a) 222,743 common shares held by the Thomas R. Ross Irrevocable Trust dated December 20, 2012 and (b) 93,764 common shares held by Mr. Ross. Mr. Ross disclaims beneficial ownership of the shares held by the trust. |
| (8) | Consists of (a) 4,994,994 common shares held by D&L Partners, L.P., (b) 219,556 common shares held by Von Allmen Partners, L.P., (c) 110,258 common shares held by NGNG, Inc. and (d) 690,500 common shares held by Von Allmen Dynasty Trust. The address of D&L Partners, L.P. is 9 Isla Bahia Drive, Ft. Lauderdale, FL 33316. The address of NGNG, Inc. is 9 Isla Bahia Drive, Ft. Lauderdale, FL 33316. The address of Von Allmen Partners, L.P. is 9 Isla Bahia Drive, Ft. Lauderdale, FL 33316. The address of Von Allmen Dynasty Trust is 9 Isla Bahia Drive, Fr. Lauderdale, FL 33316. |
| (9) | Consists of (a) 933,946 common shares held by CMK Keller Holdings, LLC, a Delaware limited liability company of which Mr. Keller is the managing member and (b) 654,943 common shares held by Ferris Ventures, LLC, a Delaware limited liability company of which Mr. Keller is the managing member. |
| (10) | Consists of (a) 1,238,846 common shares held by Mr. Schaeffer directly, (b) 296,085 common shares held by Schaeffer Holdings LLC, a Delaware limited liability company of which Mr. Schaeffer is the managing member and (c) 626,808 common shares held by Schaeffer Group LLC, a Delaware limited liability company of which Mr. Schaeffer is the managing member. |
Securities authorized for issuance under equity compensation plans
Equity compensation plan information as of December 31, 2013 follows:
| | | Number of Securities to
be Issued Upon Exercise
of Outstanding Options,
Warrants and Rights
(a) | | | Weighted-Average
Exercise Price of
Outstanding Options,
Warrants and Rights
(b) | | | Number of Securities
Remaining Available for
Future Issuance under
Equity Compensation
Plans (Excluding
Securities Reflected in
Column (a))
(c) | |
| Equity compensation plans approved by security holders:(1) | | | | | | | | | | | | |
| Options | | | 420,505 | (2) | | $ | 9.00 | | | | | |
| Restricted Stock Units (RSUs) | | | 1,837,593 | | | | N/A | | | | | |
| TOTAL | | | | | | | | | | | 1,078,667 | |
| Equity compensation plans not approved by security holders: | | | | | | | | | | | | |
| NONE | | | | | | | | | | | | |
| (1) | The Liquid 2012 Amended and Restated Stock Incentive Plan (the “2012 Plan”), provides for awards of incentive stock options, non-qualified incentive stock options, stock appreciation rights, restricted stock awards, restricted stock unit awards and incentive bonuses key employees, officers, directors and consultants, which are subject to certain vesting and forfeiture provisions. All options are granted with an exercise price equal to or greater than the fair market value of the common stock at the time of grant. The vesting schedule and term are set by the Human Resources and Compensation Committee of the Board of Directors. All securities remaining available for future issuance under equity compensation plans approved by security holders in column (c) are available under this plan. |
| (2) | The table does not reflect the 48,015 options that would vest in three equal annual increments commencing on the date that our market capitalization reached $300 million or more over a consecutive one hundred twenty (120) day period at the then-current market price. |
| (3) | The table does not reflect the 45,566 RSUs that would be granted and immediately vest in the event that our market capitalization reached $300 million or more over a consecutive sixty (60) day period. |
| Item 13. | Certain Relationships And Related Party Transactions, and Director Independence |
In addition to the compensation arrangements discussed above in the section titled “Executive Compensation,” the following is a description of each transaction since January 1, 2013 and each currently proposed transaction in which:
| · | the amount involved exceeds $120,000; and |
| · | any of our directors, executive officers or holders of more than 5% of our capital stock, or an affiliate or immediate family member thereof, had or will have a direct or indirect material interest. |
LLC Reorganization
On July 24, 2013, we effected a reorganization pursuant to which each holder of our outstanding common units contributed to us all of the right, title and interest in and to such outstanding common units in exchange for a proportionate number of shares of our common stock. Unless otherwise indicated, or the context otherwise requires, all information is presented giving effect to this reorganization and the related conversion of our common units into shares of our common stock at a ratio of 10,606.81 shares of common stock for each common unit.
Related Party Transactions
Investment by Douglas J. Von Allmen. On April 5, 2013, we issued an additional 720,498 common shares to an entity controlled by Mr. Von Allmen pursuant to a subscription agreement into which we entered with him on that date. On May 14, 2013, an entity controlled by Mr. Keller; Mr. Storms and three employees transferred a total of 104,431 shares to an entity controlled by Mr. Von Allmen pursuant to share transfer agreements. On May 15, 2013, an entity controlled by Mr. Schaeffer sold 191,616 shares to an entity controlled by Mr. Von Allmen pursuant to a share transfer agreement.
Legal Representation. We retain the law firm of Fish & Richardson, of which David Francescani, one of our directors, is a principal, to perform legal services from time to time. We have paid Fish & Richardson $83,703 for legal services rendered during 2013, and as of March 28, 2014 have no unpaid balance.
Transactions with QuantX. QuantX, a related party as a result of certain past or present relationships with Messrs. Ferdinand, Keller, Schaeffer, Von Allmen and Tew, which is not a part of and is not consolidated under Liquid Holdings Group, operates as a principal-only trading firm domiciled in the United Kingdom trading solely for its own account. QuantX is a customer of our technology platform, which it then markets to its own members, thereby providing us with a source of customer referrals. As of December 31, 2013, a total of $2,119,720 in software services revenues were recognized by us from QuantX.
Transactions with Directors. In 2013, we and/or certain of our founders sold common stock to certain of our directors at prices below fair value; as such we have recorded these sales as share-based payments. We have described below the sale of shares in which the difference between the purchase price and the fair value of the shares is in excess of $120,000. We note that this information has been reported as director compensation for 2013.
On January 15, 2013, SHAF Holdings LLC, of which Mr. Schaeffer is the managing member, sold to our director Tom Ross a 0.5% ownership interest for an aggregate purchase price of $375,000. We estimated the fair value of the shares sold at $702,622. As a result of this sale below fair value, we recorded a 2013 share-based compensation expense of $327,622.
On May 10, 2013, CMK Keller Holdings, LLC, of which our former director Mr. Keller is the managing member, transferred to Mr. Ferdinand 191,616 shares for no monetary consideration. We estimated the fair value of the shares transferred at $1,445,000. As a result of this transfer below fair value, we recorded a share-based compensation expense in the second quarter of 2013.
On May 14, 2013, CMK Keller Holdings, LLC sold Mr. Storms 766,466 shares for $5,000,000. We estimated the fair value of the shares sold at $5,780,000. As a result of this sale below fair value, we recorded a 2013 share-based compensation expense in the second quarter of 2013.
On June 20, 2013, CMK Keller Holdings, LLC, of which our former director Mr. Keller is the managing member, transferred to LT World Limited LLC, an entity controlled by Mr. Ferdinand, 191,558 shares for no monetary consideration. We estimated the fair value of the shares transferred at $1,445,000. As a result of this transfer below fair value, we recorded a share-based compensation expense in the second quarter of 2013.
On June 3, 2013, we entered into a consulting agreement with Mr. Schaeffer, one of our founders and a member of our Board of Directors, pursuant to which Mr. Schaeffer will provide relationship management and sales and marketing consulting services to the Company for a twelve-month term. The consulting agreement provides for $12,500 per month as compensation for his services. In addition to the fees provided under the June 3, 3013 consulting agreement, Mr. Schaeffer received fees for his service as a director of the Company.
On June 13, 2013, Mr. Schaeffer loaned us $250,000 to be payable in full on December 13, 2013. The loan bears interest on the unpaid principal balance at a rate of 4% per annum until the earlier of payment in full or December 13, 2013, after which time any amount of unpaid principal or interest will bear interest at a rate of 6% per annum. The proceeds of the loan were used for general working capital requirements of the company. On August 1, 2013, we repaid the principal balance of the loan in full. The amount of interest paid on the loan totaled $1,370.
On July 1, 2013, Ferdinand Holdings, LLC loaned us $250,000 to be payable in full on December 31, 2013. The loan bears interest on the unpaid balance at a rate of 4% per annum until the earlier of payment in full or December 31, 2013, after which any amount of unpaid principal or interest will bear interest at a rate of 6% per annum. The proceeds of the loan were used for general working capital requirements of the company. On August 1, 2013, we repaid the principal balance of the loan in full. The amount of interest paid on the loan totaled $877.
On July 11, 2013, Mr. Ross loaned us $250,000 to be payable in full on January 10, 2014. The loan bears interest on the unpaid principal balance at a rate of 4% per annum until the earlier of payment in full or January 10, 2014, after which any amount of unpaid principal or interest will bear interest at a rate of 6% per annum. The proceeds of the loan were used for general working capital requirements of the company. On August 1, 2013, we repaid the principal balance of the loan in full. The amount of interest paid on the loan totaled $603.
We purchased 105,000 shares of our common stock from Mr. Storms, our CEO and a Director, at a price of $8.415 per share in connection with the consummation of our initial public offering. The price per share equaled the public offering price per share received by us in the offering, less an amount equal to the underwriting discount paid per share to the underwriter in the offering.
Transaction with David Solimine. On May 1, 2013, entities controlled by Messrs. Ferdinand, Keller, Schaeffer and David Solimine entered into an agreement to transfer Mr. Solimine 2.75% of our common shares outstanding as of the date of the agreement. Pursuant to an anti-dilution provision to maintain Mr. Solimine’s 2.75% ownership interest in the Company, that agreement provides that Messrs. Ferdinand, Keller and Schaeffer may owe Mr. Solimine common shares if we issue additional shares during the period beginning May 1, 2013 and ending on the earliest of immediately prior to the consummation of our initial public offering and January 1, 2015. We have agreed that if any of Messrs. Ferdinand, Keller and Schaeffer do not deliver those shares, the Company will be obligated to issue anti-dilution shares to Mr. Solimine.
Bonus to Robert Keller. On May 1, 2013, we entered into a letter agreement with Mr. Keller ending his employment as senior managing director with the Company. Pursuant to that agreement, we agreed that if our initial public offering were consummated prior to December 1, 2014, we would pay Mr. Keller a cash bonus equal to the difference between (i) $275,000 times the number of days between May 15, 2012 and the date of the consummation of our initial public offering divided by 365 and (ii) $75,000. Pursuant to this agreement, we paid to Mr. Keller $254,247 on August 1, 2013.
Transaction with Solomon Yakoby. On June 24, 2013, entities controlled by Messrs. Ferdinand, Schaeffer and Solomon Yakoby entered into an agreement to transfer to Mr. Yakoby 67,035 common shares.
Participation in Initial Public Offering. Brian Ferdinand, one of our founders, and Douglas Von Allmen, a beneficial owner of more than 10% of our common stock, purchased an aggregate of $16.2 million of shares of our common stock in our initial public offering at the initial public offering price per share. The shares purchased by Mr. Ferdinand were purchased from us directly at $9 per share, and not from the underwriter, and no underwriting discount was payable by us or by Mr. Ferdinand on such shares. We did, however, pay a fee on such shares to the underwriter, which fee was in the same amount as the underwriting discount. The shares purchased by Mr. Ferdinand reduced the aggregate number of shares offered to investors generally in the underwritten offering.
Sub-lease of Hoboken Office from APX, Inc. On October 1, 2013, we entered into a four-month sublease agreement (the “Hoboken Sublease”) at a monthly rate of $23,247 for approximately 7,200 square feet of office space in Hoboken, New Jersey to be used for certain back-office operations. The Hoboken Sublease included a transfer to the company of the existing equipment located in the space and an agreement to allow the sublessor to use a portion of the space not being used by us for up to nine months. It was entered into with APX, Inc., an entity in which Mr. Storms and Mr. Ibietatorremendia have an interest in and on the board of which they serve as members. In March 2014 we entered into a new five-year lease for the same office space.
Entry into Lock-up Agreements. In connection with sales of 954,085 shares in the aggregate of our common stock by certain of our stockholders, including Messrs. Keller and Schaeffer, each of which owns more than 5% of our issued and outstanding common stock, entered into lock-up agreements with us in respect of their remaining shares of common stock. Pursuant to the terms of the lock-up agreements, the selling stockholders have agreed with the Company that, without the prior written consent of the Company and in each case subject to certain exceptions: (i) during the period beginning on January 30, 2014 through and including July 30, 2014, certain of the selling stockholders will not sell 714,770 shares of common stock or securities convertible into or exchangeable or exercisable for common stock; (ii) during the period beginning on January 30, 2014 through and including October 30, 2014, Mr. Keller will not sell 2,081,351 shares of common stock or securities convertible into or exchangeable or exercisable for common stock; and (iii) during the period beginning on January 30, 2014 through and including January 30, 2015, Mr. Schaeffer will not sell 2,161,739 shares of common stock or securities convertible into or exchangeable or exercisable for common stock.
Von Allmen & Ferdinand Promissory Notes and Guaranty. On February 26, 2014, we executed a Revolving Promissory Note with each of our two largest stockholders, Brian Ferdinand (who is also a director and officer of the company) and Douglas J. Von Allmen (each, a “Note” and, collectively, the “Notes”). Under each Note, we are able to borrow, and the lender has committed to lend, up to a principal amount of $3,750,000 on a revolving basis ($7,500,000 in the aggregate under the Notes), with interest payable quarterly on any amounts borrowed at a rate of 4% per annum. Any amounts borrowed under the Notes are repayable at maturity on April 30, 2015 and are optionally repayable at any time without the payment of any premium or penalty. We will pay a commitment fee on any undrawn amounts at a rate per annum equal to 0.50%, payable quarterly. The Notes contain certain customary covenants, including covenants relating to our ability to incur indebtedness and make restricted payments, and provide for certain customary events of default. The company may terminate the commitment under the Notes at any time. Subsequent to the execution of the Notes, Mr. Von Allmen delivered a personal guaranty (the “Von Allmen Guaranty”) of Mr. Ferdinand’s funding obligations under the Note entered into by him and the company. We will pay Mr. Von Allmen a guaranty fee equal to the commitment fee paid to Mr. Ferdinand in respect of his Note.
Stock Transfers to Douglas J. Von Allmen and Others. In late February of 2014, entities controlled by two of our founders, Brian Ferdinand and Robert Keller, transferred 732,292 shares of our common stock to an entity controlled by Douglas J. Von Allmen and certain other pre-IPO stockholders without the payment of any cash consideration.
Registration Rights
We have entered into a registration rights agreement with certain of our existing stockholders pursuant to which we granted them, their affiliates and certain of their transferees the right, under certain circumstances and subject to certain restrictions, to require us to register under the Securities Act shares of our common stock (and other securities convertible into or exchangeable or exercisable for shares of our common stock) otherwise held by them.
Review, Approval or Ratification of Transactions with Related Persons
Our Board of Directors has adopted a written related person transaction policy, setting forth the policies and procedures for the review and approval or ratification of related person transactions. This policy covers, with certain exceptions, any transaction, arrangement or relationship, or any series of similar transactions, arrangements or relationships in which we were or are to be a participant, where the amount involved exceeds $100,000 and a related person had or will have a direct or indirect interest, including, without limitation, purchases of goods or services by or from the related person or entities in which the related person has a material interest, indebtedness, guarantees of indebtedness and employment by us of a related person. In reviewing and approving any such transactions, our nominating and governance committee will be tasked to consider all relevant facts and circumstances, including, but not limited to, whether the transaction is on terms no less favorable than terms generally available to an unaffiliated third-party under the same or similar circumstances and the extent of the related person’s interest in the transaction. The Hoboken Sublease and the Von Allmen Guaranty were approved in accordance with the related person transaction policy and each of the other transactions described in this section either (i) occurred prior to the adoption of this policy, (ii) did not meet the thresholds of the policy or (iii) were approved by the full Board of Directors.
| Item 14. | Principal Accountant Fees and Services |
Audit and Non-Audit Fees
The following sets forth information relating to fees billed or incurred by KPMG LLP for professional services rendered to us for the year ended December 31, 2013 and for the period from April 24, 2012 to December 31, 2012:
| · | Audit Fees. The total fees billed by KPMG LLP for professional services for the audit of the our consolidated financial statements for the year ended December 31, 2013 and for the period from April 24, 2012 to December 31, 2012, the audit of our internal control over financial reporting and the reviews of our consolidated financial statements included in our Quarterly Reports on Form 10-Q during 2013 and 2012, were $945,000 and $813,900, respectively. |
| · | Audit-Related Fees. In 2013 and 2012, there were $150,000 and $0, respectively. |
| · | Tax Fees. In 2013 and 2012, there were no fees billed by KPMG LLP for tax compliance services. |
| · | All Other Fees. During 2013 and 2012, there were $304,000 and no fees billed, respectively, for other services. |
None of the services described above were approved by the Audit Committee under thede minimis exception provided by Rule 2-01(c)(7)(i)(C) under Regulation S-X.
Pre-Approval of Audit and Non-Audit Services
All audit and non-audit services provided by our independent registered public accounting firm to the Company must be pre-approved by the Audit Committee. The Audit Committee will use the following procedures in pre-approving all audit and non-audit services provided by our independent registered public accounting firm. At or before the first meeting of the Audit Committee each year, the Audit Committee will be presented with a detailed listing of the individual audit and non-audit services and fees (separately describing audit-related services, tax services and other services) expected to be provided by our independent registered public accounting firm during the year. On a quarterly basis, the Audit Committee is presented with an update of any new audit and non-audit services to be provided. The Audit Committee reviews the Company’s update and approves the services outlined therein if such services are acceptable to the Audit Committee.
To ensure prompt handling of unexpected matters, the Audit Committee delegates to the chair of the Audit Committee the authority to amend or modify the list of audit and non-audit services and fees in amounts up to $500,000 for (1) each engagement, (2) each additional category of services, or (3) services exceeding the pre-approved budgeted fee levels for the specified service. However, approval of such additional or amended services is not permitted if it would affect the independence of our registered public accounting firm under applicable SEC rules. The chair of the Audit Committee reports any such action taken to the Audit Committee at the next Audit Committee meeting.
All KPMG LLP services and fees in fiscal 2013 were approved in advance by the Audit Committee.
Part IV
| Item 15. | Exhibits, Financial Statement Schedules |
| (a) | The following consolidated financial statements of Liquid Holdings Group, Inc. and subsidiaries are included in Item 8, Financial Statements and Supplementary Data and are filed herewith: |
| | |
| | Consolidated Balance Sheets as of December 31, 2013 and 2012. |
| | |
| | Consolidated Statements of Operations and Comprehensive Income (Loss) for the Years Ended December 31, 2013, 2012 and 2011. |
| | |
| | Consolidated Statements of Cash Flows for the Years Ended December 31, 2013, 2012 and 2011. |
| | |
| | Notes to Consolidated Financial Statements |
| | |
| (b) | Exhibits – The following listed documents are filed as exhibits to this report: |
| | |
| 2.1 | Contribution Agreement of Liquid Prime Holdings LLC, dated April 24, 2012, among Liquid Holdings Group, LLC, Ferdinand Holdings, LLC and Brian Ferdinand (incorporated herein by reference to Exhibit 2.1 to the Registrant’s Form S-1 filed on April 11, 2013). |
| | |
| 2.2 | Contribution Agreement, dated April 24, 2012, among Liquid Holdings Group, LLC, SHAF Holdings LLC and Richard Schaeffer (incorporated herein by reference to Exhibit 2.2 to the Registrant’s Form S-1 filed on April 11, 2013). |
| | |
| 2.3 | Stock Purchase Agreement, dated October 27, 2011, between Liquid Prime Holdings LLC and Edward Davis (incorporated herein by reference to Exhibit 2.3 to the Registrant’s Form S-1 filed on April 11, 2013). |
| | |
| 2.4 | Contribution Agreement of Liquid Futures, LLC, dated April 24, 2012, among Liquid Holdings Group, LLC, Ferdinand Holdings, LLC and Brian Ferdinand (incorporated herein by reference to Exhibit 2.4 to the Registrant’s Form S-1 filed on April 11, 2013). |
| | |
| 2.5 | Membership Interest Purchase Agreement dated December 30, 2011, between Liquid Holdings Group, LLC and the members thereto (incorporated herein by reference to Exhibit 2.5 to the Registrant’s Form S-1 filed on April 11, 2013). |
| | |
| 2.6 | Transfer Agreement dated May 11, 2012, between Liquid Holdings Group, LLC and Liquid Trading Holdings Limited (incorporated herein by reference to Exhibit 2.6 to the Registrant’s Form S-1 filed on April 11, 2013). |
| | |
| 2.7 | First Amendment to Membership Interest Purchase Agreement, dated July 21, 2012 between Liquid Holdings Group, LLC and the members thereto (incorporated herein by reference to Exhibit 2.7 to the Registrant’s Form S-1 filed on April 11, 2013). |
| | |
| 2.8 | Contribution Agreement, dated April 24, 2012, among Liquid Holdings Group, LLC, CMK Keller Holdings, LLC and Liquid Trading Holdings LLC (incorporated herein by reference to Exhibit 2.8 to the Registrant’s Form S-1 filed on April 11, 2013). |
| | |
| 2.9 | Contribution Agreement, dated April 24, 2012, among Liquid Holdings Group, LLC, Ferdinand Holdings, LLC and LT World Limited LLC (incorporated herein by reference to Exhibit 2.9 to the Registrant’s Form S-1 filed on April 11, 2013). |
| | |
| 2.10 | Contribution Agreement, dated June 5, 2012, among Liquid Holdings Group, LLC, Solomon Yakoby and Liquid Trading Holdings II LLC (incorporated herein by reference to Exhibit 2.10 to the Registrant’s Form S-1 filed on April 11, 2013). |
| | |
| 2.11 | Share Purchase Agreement, dated April 23, 2012, among Darren Davy and Nicholas Bell, Bellsolve Limited and Liquid Holdings Group, LLC (incorporated herein by reference to Exhibit 2.11 to the Registrant’s Form S-1 filed on April 11, 2013). |
| | |
| 2.12 | Contribution Agreement, dated April 27, 2012, between Tragara Alpha Partners LLC and Liquid Holdings Group, LLC (incorporated herein by reference to Exhibit 2.12 to the Registrant’s Form S-1 filed on April 11, 2013). |
| 2.13 | Amendment No. 1 to the Contribution Agreement, dated as of April 27, 2012, between Tragara Alpha Partners LLC and Liquid Holdings Group, LLC (incorporated herein by reference to Exhibit 2.13 to the Registrant’s Form S-1 filed on April 11, 2013). |
| | |
| 2.14 | Assignment Agreement, dated July 30, 2012, among Ferdinand Trading, LLC, Brian Ferdinand, Ferris Ventures, LLC, Robert Keller and Liquid Holdings Group, LLC (incorporated herein by reference to Exhibit 2.14 to the Registrant’s Form S-1 filed on April 11, 2013). |
| | |
| 2.15 | Contribution and Exchange Agreement, dated as of August 27, 2012, among Liquid Holdings Group, LLC, Green Mountain Analytics, LLC, and the members thereto (incorporated herein by reference to Exhibit 2.15 to the Registrant’s Form S-1 filed on April 11, 2013). |
| | |
| 2.16 | Contribution Agreement, dated as of September 30, 2012, among Liquid Holdings Group, LLC, LTI, LLC, QuantX Management, LLP (f/k/a Liquid Trading Int’l LLP), and the other members thereto (incorporated herein by reference to Exhibit 2.16 to the Registrant’s Form S-1 filed on April 11, 2013). |
| | |
| 3.1 | Certificate of Incorporation of Liquid Holdings Group, Inc., dated July 24, 2013 (incorporated herein by reference to Exhibit 3.1 to the Registrant’s Form S-1/A filed on July 24, 2013). |
| | |
| 3.2 | Bylaws of Liquid Holdings Group, Inc., dated July 24, 2013 (incorporated herein by reference to Exhibit 3.2 to the Registrant’s Form S-1/A filed on July 24, 2013). |
| | |
| 4.1 | Specimen Common Stock Certificate of the Registrant (incorporated herein by reference to Exhibit 4.1 to the Registrant’s Form S-1/A filed on July 24, 2013). |
| | |
| 10.1 | Subscription Agreement dated June 28, 2012, between HA Investment III, L.L.C. and Liquid Holdings Group, LLC (incorporated herein by reference to Exhibit 10.1 to the Registrant’s Form S-1 filed on April 11, 2013). |
| | |
| 10.2 | Amended and Restated 2012 Equity Plan (incorporated herein by reference to Exhibit 10.2 to the Registrant’s Form S-1 filed on April 11, 2013). |
| | |
| 10.3 | Employment Agreement between Liquid Holdings Group, LLC and Richard Schaeffer dated as of November 27, 2012 (incorporated herein by reference to Exhibit 10.4 to the Registrant’s Form S-1 filed on April 11, 2013). |
| | |
| 10.4 | Employment Agreement between Liquid Holdings Group, LLC and Brian Ferdinand dated as of November 27, 2012 (incorporated herein by reference to Exhibit 10.5 to the Registrant’s Form S-1 filed on April 11, 2013). |
| | |
| 10.5 | Employment Agreement between Liquid Holdings Group, LLC and Brian Storms dated as of December 6, 2012 (incorporated herein by reference to Exhibit 10.6 to the Registrant’s Form S-1 filed on April 11, 2013). |
| | |
| 10.6 | Employment Offer Letter between Liquid Holdings Group, LLC and Kenneth Shifrin dated as of August 23, 2012 (incorporated herein by reference to Exhibit 10.7 to the Registrant’s Form S-1 filed on April 11, 2013). |
| | |
| 10.7 | Lease between Green Mountain Analytics, LLC and ACC/GP Development LLC, dated September 5, 2012 (incorporated herein by reference to Exhibit 10.8 to the Registrant’s Form S-1 filed on April 11, 2013). |
| | |
| 10.8 | Lease between Liquid Holdings Group, LLC and 800 Third Avenue Associates, LLC, dated May 1, 2012 (incorporated herein by reference to Exhibit 10.9 to the Registrant’s Form S-1 filed on April 11, 2013). |
| | |
| 10.9 | Lease between Liquid Holdings Group, LLC and 800 Third Avenue Associates, LLC, dated July 24th, 2012 (incorporated herein by reference to Exhibit 10.10 to the Registrant’s Form S-1 filed on April 11, 2013). |
| | |
| 10.10 | Lease between Liquid Prime Services Inc. and 800 Third Avenue Associates, LLC, dated May 1, 2012 (incorporated herein by reference to Exhibit 10.11 to the Registrant’s Form S-1 filed on April 11, 2013). |
| | |
| 10.11 | Employment Offer Letter between Liquid Holdings Group, LLC and Robert O’Boyle dated as of February 26, 2013 (incorporated herein by reference to Exhibit 10.12 to the Registrant’s Form S-1 filed on April 11, 2013). |
| 10.12 | Employment Offer Letter between Liquid Holdings Group, LLC and Jose Ibietatorremendia dated as of March 13, 2013 (incorporated herein by reference to Exhibit 10.13 to the Registrant’s Form S-1 filed on April 11, 2013). |
| | |
| 10.13 | Share Issuance Agreement dated April 5, 2013 between D&L Partners, L.P. and Liquid Holdings Group, LLC (incorporated herein by reference to Exhibit 10.14 to the Registrant’s Form S-1 filed on April 11, 2013). |
| | |
| 10.14 | Promissory Note dated June 11, 2012, by and between Liquid Holdings Group, LLC and QuantX Management, LLP (f/k/a Liquid Trading Int’l, LLP) (incorporated herein by reference to Exhibit 10.15 to the Registrant’s Form S-1 filed on April 11, 2013). |
| | |
| 10.15 | Consultation Services Agreement, dated January 2, 2012, between LTI, LLC and Liquid Trading Management LLC (incorporated herein by reference to Exhibit 10.17 to the Registrant’s Form S-1/A filed on May 13, 2013). |
| | |
| 10.16 | Term Note dated June 13, 2013, between Liquid Holdings Group, LLC and Richard Schaeffer (incorporated herein by reference to Exhibit 10.19 to the Registrant’s Form S-1/A filed on June 19, 2013). |
| | |
| 10.17 | Amendment to Employment Offer Letter between Liquid Holdings Group, LLC and Robert O’Boyle dated as of June 17, 2013 (incorporated herein by reference to Exhibit 10.20 to the Registrant’s Form S-1/A filed on June 19, 2013). |
| | |
| 10.18 | Amended and Restated Executive Employment Agreement between Brian Storms and Liquid Holdings Group, LLC. |
| | |
| 10.19 | Amended and Restated Executive Employment Agreement between Brian Ferdinand and Liquid Holdings Group, LLC. |
| | |
| 10.20 | Termination of Employment Agreement and Confirmation of Additional One-Time Bonus, dated June 3, 2013, between Liquid Holdings Group, LLC and Richard Schaeffer (incorporated herein by reference to Exhibit 10.23 to the Registrant’s Form S-1/A filed on June 19, 2013). |
| | |
| 10.21 | Consulting Agreement, dated June 3, 2013, between Liquid Holdings Group, LLC and Richard Schaeffer (incorporated herein by reference to Exhibit 10.24 to the Registrant’s Form S-1/A filed on June 19, 2013). |
| | |
| | |
| 10.22 | Registration Rights Agreement (filed herewith). |
| | |
| 10.23 | Use of Proceeds Agreement dated January 10, 2012, between LTI, LLC and Liquid Trading Int’l, LLP (incorporated herein by reference to Exhibit 10.26 to the Registrant’s Form S-1/A filed on July 5, 2013). |
| | |
| 10.24 | Amended and Restated Limited Liability Company Operating Agreement of LTI, LLC, dated as of September 20, 2011 (incorporated herein by reference to Exhibit 10.27 to the Registrant’s Form S-1/A filed on July 5, 2013). |
| | |
| 10.25 | Employment Offer Letter between Liquid Holdings Group, LLC and James Lee dated as of April 9, 2013 (incorporated herein by reference to Exhibit 10.28 to the Registrant’s Form S-1/A filed on July 5, 2013). |
| | |
| 10.26 | Term Note dated July 1, 2013, between Liquid Holdings Group, LLC and Ferdinand Holdings, LLC (incorporated herein by reference to Exhibit 10.29 to the Registrant’s Form S-1/A filed on July 5, 2013). |
| | |
| 10.27 | Term Note dated July 11, 2013, between Liquid Holdings Group, LLC and Thomas Ross (incorporated herein by reference to Exhibit 10.30 to the Registrant’s Form S-1/A filed on July 24, 2013). |
| | |
| 10.28 | Lease agreement, dated August 12, 2013, between Liquid Holdings Group, Inc. and 800 Third Avenue Associates, LLC (incorporated herein by reference to Exhibit 10.1 to the Registrant’s Quarterly Report on Form 10-Q filed on September 9, 2013). |
| | |
| 10.29 | 2012 Amended and Restated Stock Incentive Plan (incorporated herein by reference to Exhibit 10.2 to the Registrant’s Quarterly Report on Form 10-Q filed on September 9, 2013). |
| 10.30 | Lease, dated February 1, 2014, between Liquid Holdings Group, Inc. and HUB Properties Trust (filed herewith) |
| | |
| 10.31 | Revolving Promissory Note, dated February 26, 2014, between Liquid Holdings Group, Inc. and Brian Ferdinand (incorporated herein by reference to Exhibit 10.1 to the Registrant’s Current Report on Form 8-K filed on February 27, 2014) |
| | |
| 10.32 | Revolving Promissory Note, dated February 26, 2014, between Liquid Holdings Group, Inc. and Douglas J. Von Allmen (incorporated herein by reference to Exhibit 10.2 to the Registrant’s Current Report on Form 8-K filed on February 27, 2014) |
| | |
| 10.33 | Personal Guaranty, dated as of March 6, 2014, between Liquid Holdings Group, Inc. and Douglas J. Von Allmen (filed herewith) |
| | |
| 21.1 | List of Subsidiaries of the Registrant (filed herewith). |
| | |
| 23.1 | Consent of KPMG LLP, independent registered public accounting firm (filed herewith). |
| | |
| 31.1 | Certification of the Chief Executive Officer pursuant to Rule 13a-14(a) of the Securities Exchange Act of 1934, as amended (filed herewith). |
| | |
| 31.2 | Certification of the Chief Financial Officer pursuant to Rule 13a-14(a) of the Securities Exchange Act of 1934, as amended (filed herewith). |
| | |
| 32.1 | Certification of the Chief Executive Officer pursuant to Rule 13a-14(b) of the Securities Exchange Act of 1934, as amended, and 18 U.S.C. Section 1350, as adopted pursuant to Section 906 of the Sarbanes-Oxley Act of 2002 (filed herewith). |
| | |
| 32.2 | Certification of the Chief Financial Officer pursuant to Rule 13a-14(b) of the Securities Exchange Act of 1934, as amended, and 18 U.S.C. Section 1350, as adopted pursuant to Section 906 of the Sarbanes-Oxley Act of 2002 (filed herewith). |
| | |
| 101.INS | XBRL Instance Document (filed herewith). |
| | |
| 101.SCH | XBRL Taxonomy Extension Schema Document (filed herewith). |
| | |
| 101.CAL | XBRL Taxonomy Extension Calculation Linkbase Document (filed herewith). |
| | |
| 101.DEF | XBRL Taxonomy Extension Definition Linkbase Document (filed herewith). |
| | |
| 101.LAB | XBRL Taxonomy Extension Label Linkbase Document (filed herewith). |
| | |
| 101.PRE | XBRL Taxonomy Extension Presentation Linkbase Document (filed herewith). |
Signatures
Pursuant to the requirements of Section 13 or 15(d) of the Securities Exchange Act of 1934, the registrant has duly caused this report to be signed by the undersigned, thereunto duly authorized.
| | Liquid Holdings Group, Inc. |
| | (Registrant) |
| | |
| Dated: March 28, 2014 | By: | /s/ Brian Storms |
| | | Brian Storms |
| | | (Chief Executive Officer and Director) |
Pursuant to the registration statement of the Securities Exchange Act of 1934, this report has been signed below by the following persons on behalf of the registrant and in the capacities and on the dated indicated.
| Signature | | Title | | Date |
| /s/ Brian Storms | | Chief Executive Officer and Director | | March 28, 2014 |
| Brian Storms | | (Principal Executive Officer) | | |
| | | | | |
| /s/ Kenneth Shifrin | | Chief Financial Officer | | March 28, 2014 |
| Kenneth Shifrin | | (Principal Financial and Accounting Officer) | | |
| | | | | |
| /s/ Victor Simone, Jr. | | Chairman of the Board | | March 28, 2014 |
| Victor Simone, Jr. | | | | |
| | | | | |
| /s/ Brian Ferdinand | | Vice Chairman of the Board | | March 28, 2014 |
| Brian Ferdinand | | | | |
| | | | | |
| /s/ Jay Bernstein | | Director | | March 28, 2014 |
| Jay Bernstein | | | | |
| | | | | |
| /s/ Darren Davy | | Director | | March 28, 2014 |
| Darren Davy | | | | |
| | | | | |
| /s/ David Francescani | | Director | | March 28, 2014 |
| David Francescani | | | | |
| | | | | |
| /s/ Walter Raquet | | Director | | March 28, 2014 |
| Walter Raquet | | | | |
| | | | | |
| /s/ Thomas Ross | | Director | | March 28, 2014 |
| Thomas Ross | | | | |
| | | | | |
| /s/ Dennis Suskind | | Director | | March 28, 2014 |
| Dennis Suskind | | | | |
| | | | | |
| /s/ Allan Zavarro | | Director | | March 28, 2014 |
| Allan Zavarro | | | | |
Report of Independent Registered Public Accounting Firm
The Board of Directors and Stockholders
Liquid Holdings Group, Inc.:
We have audited the accompanying consolidated balance sheets of Liquid Holdings Group, Inc. and subsidiaries as of December 31, 2013 and 2012, and the related consolidated statements of operations and comprehensive loss, stockholders’ equity, and cash flows for the year ended December 31, 2013 and for the period from April 24, 2012 (commencement of operations) to December 31, 2012, and the statements of operations and comprehensive loss, stockholder’s equity, and cash flows for the period from January 1, 2012 to April 24, 2012 of Liquid Predecessor Companies. These consolidated financial statements are the responsibility of the Company’s management. Our responsibility is to express an opinion on these consolidated financial statements based on our audits.
We conducted our audits in accordance with the standards of the Public Company Accounting Oversight Board (United States). Those standards require that we plan and perform the audit to obtain reasonable assurance about whether the financial statements are free of material misstatement. An audit includes examining, on a test basis, evidence supporting the amounts and disclosures in the financial statements. An audit also includes assessing the accounting principles used and significant estimates made by management, as well as evaluating the overall financial statement presentation. We believe that our audits provide a reasonable basis for our opinion.
In our opinion, the consolidated financial statements referred to above present fairly, in all material respects, the financial position of Liquid Holdings Group, Inc. and subsidiaries as of December 31, 2013 and 2012, and the results of their operations and their cash flows for the year ended December 31, 2013 and for the period from April 24, 2012 (commencement of operations) to December 31, 2012, and the results of operations and cash flows for the period from January 1, 2012 to April 24, 2012 of Liquid Predecessor Companies, in conformity with U.S. generally accepted accounting principles.
/s/ KPMG LLP
New York, New York
March 28, 2014
LIQUID HOLDINGS GROUP, INC. AND SUBSIDIARIES
CONSOLIDATED BALANCE SHEETS
| | | Successor Company | |
| | | December 31, 2013 | | | December 31, 2012 | |
| ASSETS | | | | | | | |
| Current assets: | | | | | | | | |
| Cash and cash equivalents | | $ | 8,473,847 | | | $ | 1,380,078 | |
| Note receivable from related party - QuantX Management, LLP | | | - | | | | 2,250,000 | |
| Deferred offering costs | | | - | | | | 3,476,427 | |
| Accounts receivable, net of allowance for doubtful accounts of $5,814 and $0 | | | 425,196 | | | | 467,507 | |
| Prepaid expenses and other current assets | | | 388,612 | | | | 1,288,985 | |
| Total current assets | | | 9,287,655 | | | | 8,862,997 | |
| | | | | | | | | |
| Property and equipment, net | | | 867,758 | | | | 325,285 | |
| | | | | | | | | |
| Other assets: | | | | | | | | |
| Due from related parties | | | 659,030 | | | | 359,030 | |
| Deposits | | | 540,653 | | | | 478,258 | |
| Other intangible assets, net of amortization of $9,976,790 and $2,742,518 | | | 11,505,853 | | | | 18,740,125 | |
| Goodwill | | | 13,182,936 | | | | 13,182,936 | |
| Total other assets | | | 25,888,472 | | | | 32,760,349 | |
| | | | | | | | | |
| TOTAL ASSETS | | $ | 36,043,885 | | | $ | 41,948,631 | |
| | | | | | | | | |
| LIABILITIES AND STOCKHOLDERS' EQUITY | | | | | | | | |
| Current liabilities: | | | | | | | | |
| Accounts payable and accrued expenses | | $ | 3,503,590 | | | $ | 3,199,869 | |
| Due to related parties | | | - | | | | 61,873 | |
| Deferred income | | | 4,350 | | | | 2,062 | |
| Deferred tax liability, net | | | - | | | | 268,160 | |
| Total current liabilities | | | 3,507,940 | | | | 3,531,964 | |
| | | | | | | | | |
| Long-term liabilities: | | | | | | | | |
| Deferred rent | | | 20,536 | | | | 51,338 | |
| Contingent consideration payable on Fundsolve acquisition | | | - | | | | 1,561,000 | |
| Deferred tax liability, net | | | - | | | | 429,100 | |
| | | | | | | | | |
| Total liabilities | | | 3,528,476 | | | | 5,573,402 | |
| | | | | | | | | |
| Commitments and contingencies (Note 7) | | | | | | | | |
| | | | | | | | | |
| Stockholders' equity: | | | | | | | | |
| Preferred stock, $0.0001 par value, 10,000,000 shares authorized; none issued or outstanding | | | - | | | | - | |
| Common stock, $0.0001 par value, 200,000,000 shares authorized; 24,486,388 and 17,791,284 shares issued and outstanding as of December 31, 2013 and December 31, 2012, respectively) | | | 2,448 | | | | 1,779 | |
| Additional paid-in capital | | | 118,510,671 | | | | 74,637,387 | |
| Accumulated deficit | | | (84,857,911 | ) | | | (38,245,864 | ) |
| Treasury stock, at cost, 121,674 shares at December 31, 2013 | | | (1,029,078 | ) | | | - | |
| Accumulated other comprehensive loss | | | (110,721 | ) | | | (18,073 | ) |
| Total stockholders’ equity | | | 32,515,409 | | | | 36,375,229 | |
| | | | | | | | | |
| TOTAL LIABILITIES AND STOCKHOLDERS’ EQUITY | | $ | 36,043,885 | | | $ | 41,948,631 | |
See accompanying notes to consolidated financial statements.
LIQUID HOLDINGS GROUP, INC. AND SUBSIDIARIES
CONSOLIDATED STATEMENTS OF OPERATIONS AND COMPREHENSIVE LOSS
| | | | | | | | | Predecessor | |
| | | Successor Company | | | Company | |
| | | | | | Period from | | | Period from | |
| | | Year Ended | | | April 24, 2012 to | | | January 1, 2012 to | |
| | | December 31, 2013 | | | December 31, 2012 | | | April 24, 2012 | |
| Revenues: | | | | | | | | | | | | |
| Software services | | $ | 2,925,650 | | | $ | 1,032,534 | | | $ | - | |
| Brokerage activities | | | 1,872,647 | | | | 1,295,248 | | | | - | |
| | | | 4,798,297 | | | | 2,327,782 | | | | - | |
| | | | | | | | | | | | | |
| Cost of revenues (exclusive of items shown separately below): | | | | | | | | | | | | |
| Software services | | | 1,452,801 | | | | 388,860 | | | | - | |
| Brokerage activities | | | 1,248,192 | | | | 817,559 | | | | - | |
| | | | 2,700,993 | | | | 1,206,419 | | | | - | |
| Gross profit | | | 2,097,304 | | | | 1,121,363 | | | | - | |
| | | | | | | | | | | | | |
| Operating expenses: | | | | | | | | | | | | |
| Compensation | | | 18,885,418 | | | | 28,285,420 | | | | 73,494 | |
| Consulting fees | | | 12,727,112 | | | | 3,081,002 | | | | - | |
| Depreciation and amortization | | | 7,407,062 | | | | 2,761,703 | | | | 6,912 | |
| Professional fees | | | 3,676,863 | | | | 1,651,232 | | | | 33,756 | |
| Rent | | | 1,211,693 | | | | 629,400 | | | | 153,081 | |
| Computer related and software development | | | 2,472,539 | | | | 414,048 | | | | - | |
| Other | | | 2,436,736 | | | | 790,747 | | | | 97,496 | |
| Impairment of goodwill and intangible assets | | | - | | | | 1,550,652 | | | | 3,300,000 | |
| Total operating expenses | | | 48,817,423 | | | | 39,164,204 | | | | 3,664,739 | |
| Loss from operations | | | (46,720,119 | ) | | | (38,042,841 | ) | | | (3,664,739 | ) |
| | | | | | | | | | | | | |
| Non-operating income (expense): | | | | | | | | | | | | |
| Registration rights penalty | | | - | | | | (1,674,704 | ) | | | - | |
| Unrealized gain on contingent consideration payable | | | - | | | | 129,000 | | | | - | |
| Gain (loss) on settlement of contingent consideration payable | | | (649,688 | ) | | | 1,545,000 | | | | 3,300,000 | |
| Interest and other, net | | | 60,500 | | | | (306,659 | ) | | | - | |
| Total non-operating income (expense) | | | (589,188 | ) | | | (307,363 | ) | | | 3,300,000 | |
| Loss before income taxes | | | (47,309,307 | ) | | | (38,350,204 | ) | | | (364,739 | ) |
| Income tax benefit | | | (697,260 | ) | | | (104,340 | ) | | | - | |
| Net loss | | | (46,612,047 | ) | | | (38,245,864 | ) | | | (364,739 | ) |
| Other comprehensive loss: | | | | | | | | | | | | |
| Foreign currency translation | | | (92,648 | ) | | | (18,073 | ) | | | - | |
| Total comprehensive loss | | $ | (46,704,695 | ) | | $ | (38,263,937 | ) | | $ | (364,739 | ) |
| | | | | | | | | | | | | |
| Basic and diluted loss per share | | $ | (2.10 | ) | | $ | (2.46 | ) | | $ | - | |
| | | | | | | | | | | | | |
| Weighted average number of common shares outstanding during the period - basic and diluted | | | 22,230,943 | | | | 15,517,444 | | | | - | |
| | | | | | | | | | | | | |
| Supplemental Information to the Consolidated Statements of Operations and Comprehensive Loss | | | | | | | | | | | | |
| Software services revenues from related parties | | $ | 2,387,825 | | | $ | 890,432 | | | $ | - | |
| | | | | | | | | | | | | |
| Software services cost of revenues to related parties | | $ | 270,561 | | | $ | 154,900 | | | $ | - | |
| | | | | | | | | | | | | |
| Share-based compensation included in compensation | | $ | 9,425,684 | | | $ | 26,974,828 | | | $ | - | |
| | | | | | | | | | | | | |
| Share-based compensation included in consulting fees | | $ | 11,649,693 | | | $ | 2,404,992 | | | $ | - | |
See accompanying notes to consolidated financial statements.
LIQUID HOLDINGS GROUP, INC. AND SUBSIDIARIES
CONSOLIDATED STATEMENTS OF STOCKHOLDERS’ EQUITY
FOR THE PERIOD FROM APRIL 24, 2012 (COMMENCEMENT OF OPERATIONS) TO DECEMBER 31, 2012
| | | | | | | | | | | | | | | | | | Accumulated | | | | | | | |
| | | | | | | | | Additional | | | | | | | | | Other | | | | | | | |
| | | Common Stock | | | Paid-in | | | Subscription | | | Accumulated | | | Comprehensive | | | Treasury | | | | |
| Successor Company | | Shares | | | Amount | | | Capital | | | Receivable | | | Deficit | | | Loss | | | Stock | | | Total | |
| | | | | | | | | | | | | | | | | | | | | | | | | |
| Balance at January 17, 2012 (inception) | | | - | | | $ | | | | $ | - | | | $ | - | | | $ | - | | | $ | - | | | $ | - | | | $ | - | |
| | | | | | | | | | | | | | | | | | | | | | | | | | | | | | | | | |
| Issuance of common units to Founders, April 2012 | | | 9,979,324 | | | | 998 | | | | 2,002,470 | | | | (2,003,468 | ) | | | - | | | | - | | | | - | | | | - | |
| | | | | | | | | | | | | | | | | | | | | | | | | | | | | | | | | |
| Issuance of common units in accordance with 2012 Equity Plan for consulting services and share-based compensation, April 2012 | | | 1,623,546 | | | | 162 | | | | 10,347,974 | | | | - | | | | - | | | | - | | | | - | | | | 10,348,136 | |
| | | | | | | | | | | | | | | | | | | | | | | | | | | | | | | | | |
| Capital contribution by Founder for sale of common units to director below market in connection with share-based compensation, April 2012 | | | - | | | | | | | | 178,744 | | | | - | | | | - | | | | - | | | | - | | | | 178,744 | |
| | | | | | | | | | | | | | | | | | | | | | | | | | | | | | | | | |
| Issuance of common units for the purchase of proprietary software, April 2012 | | | 868,338 | | | | 87 | | | | (87 | ) | | | - | | | | - | | | | - | | | | - | | | | - | |
| | | | | | | | | | | | | | | | | | | | | | | | | | | | | | | | | |
| Founders contribution of Futures for satisfaction of subscription receivable in May 2012 | | | - | | | | | | | | (6,623 | ) | | | 1,385,330 | | | | - | | | | - | | | | - | | | | 1,378,707 | |
| | | | | | | | | | | | | | | | | | | | | | | | | | | | | | | | | |
| Issuance of common units for the contribution of 2.5% interest of Liquid Trading Institutional, LLP, June 2012 | | | 169,453 | | | | 17 | | | | 408 | | | | - | | | | - | | | | - | | | | - | | | | 425 | |
| | | | | | | | | | | | | | | | | | | | | | | | | | | | | | | | | |
| Founders contribution of Liquid Trading Institutional, LLP 97.5% interest for satisfaction of subscription receivable in July 2012 | | | - | | | | | | | | - | | | | 16,575 | | | | - | | | | - | | | | - | | | | 16,575 | |
| | | | | | | | | | | | | | | | | | | | | | | | | | | | | | | | | |
| Issuance of common units in connection with the acquisition of Liquid Partners, LLC, July 2012 | | | 951,432 | | | | 95 | | | | 8,754,905 | | | | - | | | | - | | | | - | | | | - | | | | 8,755,000 | |
| | | | | | | | | | | | | | | | | | | | | | | | | | | | | | | | | |
| Issuance of common units in connection with the unit sale, net of issuance cost of $1,250,000 , July 2012 | | | 1,239,986 | | | | 124 | | | | 11,249,876 | | | | - | | | | - | | | | - | | | | - | | | | 11,250,000 | |
| | | | | | | | | | | | | | | | | | | | | | | | | | | | | | | | | |
| Issuance of common units in connection with the acquisition of Green Mountain Analytics in August 2012 | | | 2,038,857 | | | | 204 | | | | 19,973,170 | | | | - | | | | - | | | | - | | | | - | | | | 19,973,374 | |
| | | | | | | | | | | | | | | | | | | | | | | | | | | | | | | | | |
| Issuance of common units in connection with the acquisition of LTI, LLC in September 2012 | | | 495,821 | | | | 50 | | | | 5,078,538 | | | | - | | | | - | | | | - | | | | - | | | | 5,078,588 | |
| | | | | | | | | | | | | | | | | | | | | | | | | | | | | | | | | |
| Founders advances due to LTI, LLC, utilized in capital of Futures and Prime, deemed dividend distributions to Founders in October 2012 | | | - | | | | - | | | | (2,395,000 | ) | | | - | | | | - | | | | - | | | | - | | | | (2,395,000 | ) |
| | | | | | | | | | | | | | | | | | | | | | | | | | | | | | | | | |
| Founders advances due to LTI, LLC, utilized for predecessor Guernsey, deemed dividend distributions to Founders in October 2012 | | | - | | | | - | | | | (589,713 | ) | | | - | | | | - | | | | - | | | | - | | | | (589,713 | ) |
| | | | | | | | | | | | | | | | | | | | | | | | | | | | | | | | | |
| Founders contribution of Liquid Prime Holdings, LLC for satisfaction of subscription receivable in October2012 | | | - | | | | - | | | | (484,876 | ) | | | 601,563 | | | | - | | | | - | | | | - | | | | 116,687 | |
| | | | | | | | | | | | | | | | | | | | | | | | | | | | | | | | | |
| Capital contribution by Founder for sale of common units to directors below market in connection with share-based compensation, October 2012 | | | - | | | | - | | | | 648,683 | | | | - | | | | - | | | | - | | | | - | | | | 648,683 | |
| | | | | | | | | | | | | | | | | | | | | | | | | | | | | | | | | |
| Capital contribution of common units by Founder, October 2012 | | | (173,667 | ) | | | (17 | ) | | | 1,399,985 | | | | - | | | | - | | | | - | | | | (1,399,968 | ) | | | - | |
| | | | | | | | | | | | | | | | | | | | | | | | | | | | | | | | | |
| Issuance of common units in accordance with 2012 Equity Plan for share-based compensation, October 2012 | | | 612,911 | | | | 61 | | | | 4,759,939 | | | | - | | | | - | | | | - | | | | - | | | | 4,760,000 | |
| | | | | | | | | | | | | | | | | | | | | | | | | | | | | | | | | |
| Issuance of incentive units in accordance with 2012 Equity Plan for share-based compensation, October 2012 | | | - | | | | - | | | | 2,484,274 | | | | - | | | | - | | | | - | | | | - | | | | 2,484,274 | |
| See accompanying notes to consolidated financial statements. | (Continued) |
LIQUID HOLDINGS GROUP, INC. AND SUBSIDIARIES
CONSOLIDATED STATEMENTS OF STOCKHOLDERS’ EQUITY
FOR THE PERIOD FROM APRIL 24, 2012 (COMMENCEMENT OF OPERATIONS) TO DECEMBER 31, 2012
| | | | | | | | | | | | | | | | | | Accumulated | | | | | | | |
| | | | | | | | | Additional | | | | | | | | | Other | | | | | | | |
| | | Common Stock | | | Paid-in | | | Subscription | | | Accumulated | | | Comprehensive | | | Treasury | | | | |
| Successor Company | | Shares | | | Amount | | | Capital | | | Receivable | | | Deficit | | | Loss | | | Stock | | | Total | |
| | | | | | | | | | | | | | | | | | | | | | | | | |
| Capital contribution by Founder for sale of common units to consultant below market in connection with share-based compensation, November 2012 | | | - | | | | - | | | | 132,368 | | | | - | | | | - | | | | - | | | | - | | | | 132,368 | |
| | | | | | | | | | | | | | | | | | | | | | | | | | | | | | | | | |
| Issuance of common units in accordance with 2012 Equity Plan for share-based compensation, December 2012 | | | 356,174 | | | | 36 | | | | 1,424,740 | | | | - | | | | - | | | | - | | | | 1,399,968 | | | | 2,824,744 | |
| | | | | | | | | | | | | | | | | | | | | | | | | | | | | | | | | |
| Capital contribution by Founders for sale of common units to officer below market in connection with share-based compensation, December 2012 | | | - | | | | - | | | | 318,397 | | | | - | | | | - | | | | - | | | | - | | | | 318,397 | |
| | | | | | | | | | | | | | | | | | | | | | | | | | | | | | | | | |
| Cancellation of common units received in equity grant for Incentive Common Units, December 2012 | | | (612,911 | ) | | | (61 | ) | | | 61 | | | | - | | | | - | | | | - | | | | - | | | | - | |
| | | | | | | | | | | | | | | | | | | | | | | | | | | | | | | | | |
| Restricted common units award accrued in accordance with 2012 Incentive Plan for share-based compensation, December 2012 | | | - | | | | - | | | | 1,910,624 | | | | - | | | | - | | | | - | | | | - | | | | 1,910,624 | |
| | | | | | | | | | | | | | | | | | | | | | | | | | | | | | | | | |
| Issuance of common units for registration rights penalty, October to December 2012 | | | 242,020 | | | | 24 | | | | 1,674,680 | | | | - | | | | - | | | | - | | | | - | | | | 1,674,704 | |
| | | | | | | | | | | | | | | | | | | | | | | | | | | | | | | | | |
| Issuance of incentive units in accordance with 2012 Equity Plan for share-based compensation, December 2012 | | | - | | | | - | | | | 5,773,849 | | | | - | | | | - | | | | - | | | | - | | | | 5,773,849 | |
| | | | | | | | | | | | | | | | | | | | | | | | | | | | | | | | | |
| Foreign currency translation | | | - | | | | - | | | | - | | | | - | | | | - | | | | (18,073 | ) | | | - | | | | (18,073 | ) |
| | | | | | | | | | | | | | | | | | | | | | | | | | | | | | | | | |
| Net loss | | | - | | | | - | | | | - | | | | - | | | | (38,245,864 | ) | | | - | | | | - | | | | (38,245,864 | ) |
| | | | | | | | | | | | | | | | | | | | | | | | | | | | | | | | | |
| Balance at December 31, 2012 | | | 17,791,284 | | | $ | 1,779 | | | $ | 74,637,387 | | | $ | - | | | $ | (38,245,864 | ) | | $ | (18,073 | ) | | $ | - | | | $ | 36,375,229 | |
See accompanying notes to consolidated financial statements.
LIQUID HOLDINGS GROUP, INC. AND SUBSIDIARIES
CONSOLIDATED STATEMENTS OF STOCKHOLDERS’ EQUITY
FOR THE YEAR ENDED DECEMBER 31, 2013
| | | | | | | | | | | | | | | | | Accumulated | | | | | | | |
| | | | | | | | | Additional | | | | | | | | | Other | | | | | | | |
| | | Common Stock | | | Paid-in | | | Subscription | | | Accumulated | | | Comprehensive | | | Treasury | | | | |
| Successor Company | | Shares | | | Amount | | | Capital | | | Receivable | | | Deficit | | | Loss | | | Stock | | | Total | |
| | | | | | | | | | | | | | | | | | | | | | | | | |
| Balance at December 31, 2012 | | | 17,791,284 | | | $ | 1,779 | | | $ | 74,637,387 | | | $ | - | | | $ | (38,245,864 | ) | | $ | (18,073 | ) | | $ | - | | | $ | 36,375,229 | |
| | | | | | | | | | | | | | | | | | | | | | | | | | | | | | | | | |
| Capital contribution by Founder for sale of common shares to consultant below market in connection with share-based compensation, January 2013 | | | - | | | | - | | | | 38,102 | | | | - | | | | - | | | | - | | | | - | | | | 38,102 | |
| | | | | | | | | | | | | | | | | | | | | | | | | | | | | | | | | |
| Capital contribution by Founder for sale of common shares to director below market in connection with share-based compensation, January 2013 | | | - | | | | - | | | | 327,622 | | | | - | | | | - | | | | - | | | | - | | | | 327,622 | |
| | | | | | | | | | | | | | | | | | | | | | | | | | | | | | | | | |
| Issuance of common shares in connection with sales by the Company, January 2013 | | | 112,574 | | | | 11 | | | | 999,989 | | | | - | | | | - | | | | - | | | | - | | | | 1,000,000 | |
| | | | | | | | | | | | | | | | | | | | | | | | | | | | | | | | | |
| Issuance of common shares in connection with sales by the Company, February 2013 | | | 36,387 | | | | 4 | | | | 299,996 | | | | - | | | | - | | | | - | | | | - | | | | 300,000 | |
| | | | | | | | | | | | | | | | | | | | | | | | | | | | | | | | | |
| Capital contribution by Founders for sale of common shares to director below market in connection with share-based compensation, February 2013 | | | - | | | | - | | | | 40,250 | | | | - | | | | - | | | | - | | | | - | | | | 40,250 | |
| | | | | | | | | | | | | | | | | | | | | | | | | | | | | | | | | |
| Issuance of common shares in connection with sales by the Company, March 2013 | | | 245,136 | | | | 25 | | | | 1,999,975 | | | | - | | | | - | | | | - | | | | - | | | | 2,000,000 | |
| | | | | | | | | | | | | | | | | | | | | | | | | | | | | | | | | |
| Capital contribution by Founders for sale of common shares to consultant below market in connection with share-based compensation, March 2013 | | | - | | | | - | | | | 100,626 | | | | - | | | | - | | | | - | | | | - | | | | 100,626 | |
| | | | | | | | | | | | | | | | | | | | | | | | | | | | | | | | | |
| Capital contribution by Company for sale of common shares to consultant below market in connection with share-based compensation, April 2013 | | | 720,498 | | | | 72 | | | | 5,273,468 | | | | - | | | | - | | | | - | | | | - | | | | 5,273,540 | |
| | | | | | | | | | | | | | | | | | | | | | | | | | | | | | | | | |
| Issuance of common shares in accordance with anti-dilution provisions for certain March 2013 sales | | | 2,402 | | | | - | | | | - | | | | - | | | | - | | | | - | | | | - | | | | - | |
| | | | | | | | | | | | | | | | | | | | | | | | | | | | | | | | | |
| Capital contribution by Founders for sale of common shares to consultants below market in connection with share-based compensation, May 2013 | | | - | | | | - | | | | 5,221,800 | | | | - | | | | - | | | | - | | | | - | | | | 5,221,800 | |
| | | | | | | | | | | | | | | | | | | | | | | | | | | | | | | | | |
| Capital contribution by Founder for sale of common shares to Founder below market in connection with share-based compensation, May 2013 | | | - | | | | - | | | | 1,445,000 | | | | - | | | | - | | | | - | | | | - | | | | 1,445,000 | |
| | | | | | | | | | | | | | | | | | | | | | | | | | | | | | | | | |
| Capital contribution by CEO and Employees for sale of common shares to consultant below market in connection with share-based compensation, May 2013 | | | - | | | | - | | | | 469,625 | | | | - | | | | - | | | | - | | | | - | | | | 469,625 | |
| | | | | | | | | | | | | | | | | | | | | | | | | | | | | | | | | |
| Capital contribution by Founder for sale of common shares to CEO below market in connection with share-based compensation, May 2013 | | | - | | | | - | | | | 780,000 | | | | - | | | | - | | | | - | | | | - | | | | 780,000 | |
| | | | | | | | | | | | | | | | | | | | | | | | | | | | | | | | | |
| Capital contribution by Founder for sale of common shares to director below market in connection with share-based compensation, May 2013 | | | - | | | | - | | | | 48,750 | | | | - | | | | - | | | | - | | | | - | | | | 48,750 | |
| | | | | | | | | | | | | | | | | | | | | | | | | | | | | | | | | |
| Capital contribution by Founder for sale of common shares to Founder below market in connection with share-based compensation, June 2013 | | | - | | | | - | | | | 1,445,000 | | | | - | | | | - | | | | - | | | | - | | | | 1,445,000 | |
| | | | | | | | | | | | | | | | | | | | | | | | | | | | | | | | | |
| Capital contribution by Founders for sale of common shares to consultant below market in connection with share-based compensation, June 2013 | | | - | | | | - | | | | 505,750 | | | | - | | | | - | | | | - | | | | - | | | | 505,750 | |
| See accompanying notes to consolidated financial statements. | (Continued) |
LIQUID HOLDINGS GROUP, INC. AND SUBSIDIARIES
CONSOLIDATED STATEMENTS OF STOCKHOLDERS’ EQUITY
FOR THE YEAR ENDED DECEMBER 31, 2013
| | | | | | | | | | | | | | | | | Accumulated | | | | | | | |
| | | | | | | | | Additional | | | | | | | | | Other | | | | | | | |
| | | Common Stock | | | Paid-in | | | Subscription | | | Accumulated | | | Comprehensive | | | Treasury | | | | |
| Successor Company | | Shares | | | Amount | | | Capital | | | Receivable | | | Deficit | | | Loss | | | Stock | | | Total | |
| | | | | | | | | | | | | | | | | | | | | | | | | |
| Issuance of common shares in accordance with 2012 Equity Plan for share-based compensation, June 2013 | | | 1,838,385 | | | | 184 | | | | (184 | ) | | | - | | | | - | | | | - | | | | - | | | | - | |
| | | | | | | | | | | | | | | | | | | | | | | | | | | | | | | | | |
| Issuance of common shares upon initial public offering, net of underwriting discount, July 2013 | | | 3,175,000 | | | | 318 | | | | 26,017,308 | | | | - | | | | - | | | | - | | | | - | | | | 26,017,625 | |
| | | | | | | | | | | | | | | | | | | | | | | | | | | | | | | | | |
| Issuance of common shares to Founder in accordance with anti-dilution provision | | | 142,524 | | | | 14 | | | | (14 | ) | | | - | | | | - | | | | - | | | | - | | | | - | |
| | | | | | | | | | | | | | | | | | | | | | | | | | | | | | | | | |
| Issuance of common shares in connection with satisfaction of contingent consideration payable on Fundsolve acquisition, July 2013 | | | 245,632 | | | | 25 | | | | 2,210,663 | | | | - | | | | - | | | | - | | | | - | | | | 2,210,688 | |
| | | | | | | | | | | | | | | | | | | | | | | | | | | | | | | | | |
| Direct costs of initial public offering | | | - | | | | - | | | | (8,729,737 | ) | | | - | | | | - | | | | - | | | | - | | | | (8,729,737 | ) |
| | | | | | | | | | | | | | | | | | | | | | | | | | | | | | | | | |
| Treasury stock acquired | | | (121,674 | ) | | | (12 | ) | | | 12 | | | | - | | | | - | | | | - | | | | (1,029,078 | ) | | | (1,029,078 | ) |
| | | | | | | | | | | | | | | | | | | | | | | | | | | | | | | | | |
| Issuance of common shares upon vesting of restricted stock units | | | 298,240 | | | | 30 | | | | (30 | ) | | | - | | | | - | | | | - | | | | - | | | | - | |
| | | | | | | | | | | | | | | | | | | | | | | | | | | | | | | | | |
| Share-based compensation | | | - | | | | - | | | | 5,379,312 | | | | - | | | | - | | | | - | | | | - | | | | 5,379,312 | |
| | | | | | | | | | | | | | | | | | | | | | | | | | | | | | | | | |
| Foreign currency translation | | | - | | | | - | | | | - | | | | - | | | | - | | | | (92,648 | ) | | | - | | | | (92,648 | ) |
| | | | | | | | | | | | | | | | | | | | | | | | | | | | | | | | | |
| Net loss | | | - | | | | - | | | | - | | | | - | | | | (46,612,047 | ) | | | - | | | | - | | | | (46,612,047 | ) |
| | | | | | | | | | | | | | | | | | | | | | | | | | | | | | | | | |
| Balance at December 31, 2013 | | | 24,486,388 | | | $ | 2,448 | | | $ | 118,510,671 | | | $ | - | | | $ | (84,857,911 | ) | | $ | (110,721 | ) | | $ | (1,029,078 | ) | | $ | 32,515,409 | |
CONSOLIDATED STATEMENTS OF STOCKHOLDER’S EQUITY
FOR THE PERIOD FROM JANUARY 1, 2012 TO APRIL 24, 2012
| | | | | | | | | | | | | | | | | | Accumulated | | | | | | | |
| | | | | | | | | Additional | | | | | | | | | Other | | | | | | | |
| | | Common Stock | | | Paid-in | | | Subscription | | | Accumulated | | | Comprehensive | | | Treasury | | | | |
| Predecessor Company | | Shares | | | Amount | | | Capital | | | Receivable | | | Deficit | | | Loss | | | Stock | | | Total | |
| Balance at December 31, 2011 | | | - | | | $ | | | | $ | 620,100 | | | $ | - | | | $ | (696,030 | ) | | $ | - | | | $ | - | | | $ | (75,930 | ) |
| | | | | | | | | | | | | | | | | | | | | | | | | | | | | | | | | |
| Owner's contributions | | | - | | | | | | | | 350,000 | | | | - | | | | - | | | | - | | | | - | | | | 350,000 | |
| | | | | | | | | | | | | | | | | | | | | | | | | | | | | | | | | |
| Net loss | | | - | | | | | | | | - | | | | - | | | | (364,739 | ) | | | - | | | | - | | | | (364,739 | ) |
| | | | | | | | | | | | | | | | | | | | | | | | | | | | | | | | | |
| Balance at April 24, 2012 | | | - | | | $ | - | | | $ | 970,100 | | | $ | - | | | $ | (1,060,769 | ) | | $ | - | | | $ | - | | | $ | (90,669 | ) |
See accompanying notes to consolidated financial statements.
LIQUID HOLDINGS GROUP, INC. AND SUBSIDIARIES
CONSOLIDATED STATEMENTS OF CASH FLOWS
| | | | | | | | | Predecessor | |
| | | Successor Company | | | Company | |
| | | | | | Period from | | | Period from | |
| | | Year Ended | | | April 24, 2012 to | | | January 1, 2012 to | |
| | | December 31, 2013 | | | December 31, 2012 | | | April 24, 2012 | |
| CASH FLOWS FROM OPERATING ACTIVITIES | | | | | | | | | | | | |
| Net loss | | $ | (46,612,047 | ) | | $ | (38,245,864 | ) | | $ | (364,739 | ) |
| Adjustments to reconcile net loss to net cash used in operating activities: | | | | | | | | | | | | |
| Registration rights penalty | | | - | | | | 1,674,704 | | | | - | |
| Impairment of goodwill and intangible assets | | | - | | | | 1,550,652 | | | | 3,300,000 | |
| Unrealized (gain) loss on contingent consideration payable | | | - | | | | (129,000 | ) | | | - | |
| (Gain) loss on settlement of contingent consideration payable | | | 649,688 | | | | (1,545,000 | ) | | | (3,300,000 | ) |
| Depreciation and amortization expense | | | 7,407,062 | | | | 2,761,703 | | | | 6,912 | |
| Share-based compensation | | | 9,425,684 | | | | 26,974,828 | | | | - | |
| Share-based payments for consulting services | | | 11,649,693 | | | | 2,404,992 | | | | - | |
| Other | | | (40,423 | ) | | | (169,538 | ) | | | - | |
| Deferred taxes | | | (697,260 | ) | | | 104,340 | | | | - | |
| Changes in operating assets and liabilities: | | | | | | | | | | | | |
| Accounts receivable | | | 42,311 | | | | 497,848 | | | | - | |
| Deferred offering costs | | | 3,476,427 | | | | (3,476,427 | ) | | | - | |
| Prepaid expense and other current assets | | | 900,373 | | | | (1,137,946 | ) | | | - | |
| Due from related parties | | | (300,000 | ) | | | - | | | | - | |
| Security deposit | | | (62,395 | ) | | | (363,644 | ) | | | - | |
| Deposit with clearing organization | | | - | | | | - | | | | (250,000 | ) |
| Accounts payable and accrued expenses | | | 303,721 | | | | 2,816,055 | | | | 84,590 | |
| Due to related parties | | | (61,873 | ) | | | (139,810 | ) | | | - | |
| Other current liabilities | | | 2,288 | | | | 2,024 | | | | - | |
| NET CASH USED IN OPERATING ACTIVITIES | | | (13,916,751 | ) | | | (6,420,083 | ) | | | (523,237 | ) |
| | | | | | | | | | | | | |
| CASH FLOWS FROM INVESTING ACTIVITIES | | | | | | | | | | | | |
| Purchase of property and equipment | | | (738,633 | ) | | | (89,399 | ) | | | (241,236 | ) |
| Aquisition of intangible assets | | | - | | | | (1,536,544 | ) | | | - | |
| Cash acquired in acquisitions | | | - | | | | 2,424,347 | | | | - | |
| Capital contributions in acquisitions in advance of regulatory approval | | | - | | | | (2,150,000 | ) | | | - | |
| Advances to related parties | | | - | | | | 143,802 | | | | - | |
| Note and interest receivable from related party - QuantX Management, LLP | | | - | | | | (5,000,000 | ) | | | - | |
| Repayment of note from related party - QuantX Management, LLP | | | 2,250,000 | | | | 2,750,000 | | | | - | |
| Repayment of loan - related party | | | - | | | | (81,700 | ) | | | - | |
| NET CASH PROVIDED BY (USED IN) INVESTING ACTIVITIES | | | 1,511,367 | | | | (3,539,494 | ) | | | (241,236 | ) |
| | | | | | | | | | | | | |
| CASH FLOWS FROM FINANCING ACTIVITIES | | | | | | | | | | | | |
| Advance from QuantX Management, LLP | | | - | | | | 44,791 | | | | - | |
| Advance from EchoTrade, LLC | | | - | | | | 45,854 | | | | - | |
| Proceeds from initial public offering of common stock, net of underwriting discount | | | 26,017,625 | | | | - | | | | - | |
| Direct costs of initial public offering | | | (8,729,737 | ) | | | - | | | | - | |
| Purchase of treasury stock | | | (1,029,078 | ) | | | - | | | | - | |
| Proceeds from sales of common shares, net of offering costs | | | 3,300,000 | | | | 11,250,000 | | | | - | |
| Proceeds from loans from related parties | | | 750,000 | | | | - | | | | - | |
| Repayment of loans from related parties | | | (750,000 | ) | | | - | | | | - | |
| Due to related parties | | | - | | | | - | | | | 107,766 | |
| Owner's capital contributions | | | - | | | | - | | | | 350,000 | |
| NET CASH PROVIDED BY FINANCING ACTIVITIES | | | 19,558,810 | | | | 11,340,645 | | | | 457,766 | |
| Effect of exchange rate changes on cash | | | (59,657 | ) | | | (990 | ) | | | - | |
| NET INCREASE (DECREASE) IN CASH AND CASH EQUIVALENTS | | | 7,093,769 | | | | 1,380,078 | | | | (306,707 | ) |
| CASH AND CASH EQUIVALENTS - Beginning | | | 1,380,078 | | | | - | | | | 428,257 | |
| CASH AND CASH EQUIVALENTS - Ending | | $ | 8,473,847 | | | $ | 1,380,078 | | | $ | 121,550 | |
See accompanying notes to consolidated financial statements.
LIQUID HOLDINGS GROUP, INC. AND SUBSIDIARIES
CONSOLIDATED STATEMENTS OF CASH FLOWS
| | | | | | | | | Predecessor | |
| | | Successor Company | | | Company | |
| | | | | | Period from | | | Period from | |
| | | Year Ended | | | April 24, 2012 to | | | January 1, 2012 to | |
| | | December 31, 2013 | | | December 31, 2012 | | | April 24, 2012 | |
| | | | | | | | | | |
| SUPPLEMENTAL DISCLOSURES OF CASH FLOW INFORMATION: | | | | | | | | | | | | |
| Interest paid | | $ | 4,068 | | | $ | 2,810 | | | $ | - | |
| | | | | | | | | | | | | |
| Income taxes paid | | $ | - | | | $ | - | | | $ | - | |
| | | | | | | | | | | | | |
| NON-CASH INVESTING AND FINANCING ACTIVITIES: | | | | | | | | | | | | |
| Settlement of contingent consideration on Fundsolve acquisition | | $ | 2,210,688 | | | $ | - | | | $ | - | |
| | | | | | | | | | | | | |
| Founders contribution of Liquid Futures, LLC, May 2012 | | $ | - | | | $ | 1,378,708 | | | $ | - | |
| | | | | | | | | | | | | |
| Issuance of common shares for the contribution of Liquid Trading Institutional LLP, June 2012 | | $ | - | | | $ | 17,000 | | | $ | - | |
| | | | | | | | | | | | | |
| Capital contribution by Founders | | $ | - | | | $ | 1,511,969 | | | $ | - | |
| Issuance of common shares in connection with the acquisition of Liquid Partners LLC, July 2012 | | $ | - | | | $ | 8,755,000 | | | $ | - | |
| Issuance of common shares in connection with the acquisition of Green Mountain Analytics, LLC, August 2012 | | $ | - | | | $ | 19,973,374 | | | $ | - | |
| Issuance of common shares in connection with the acquisition of LTI, LLC, September 2012 | | $ | - | | | $ | 5,078,588 | | | $ | - | |
| | | | | | | | | | | | | |
| Contingent consideration on Fundsolve acquisition | | $ | - | | | $ | 1,561,000 | | | $ | - | |
| | | | | | | | | | | | | |
| Founders distribution for Liquid Futures, LLC | | $ | - | | | $ | 1,425,000 | | | $ | - | |
| | | | | | | | | | | | | |
| Founders distribution for Liquid Trading Holdings Limited | | $ | - | | | $ | 589,713 | | | $ | - | |
| Issuance of common shares for the future contribution of Liquid Prime Services, Inc. | | $ | - | | | $ | 116,687 | | | $ | - | |
| | | | | | | | | | | | | |
| Founders distribution for Liquid Prime Services, Inc. | | $ | - | | | $ | 970,000 | | | $ | - | |
See accompanying notes to consolidated financial statements.
LIQUID HOLDINGS GROUP, INC. AND SUBSIDIARIES
NOTES TO CONSOLIDATED FINANCIAL STATEMENTS
(1) Organization
Organization
Liquid Holdings Group, Inc. (“LHG,” the “Company” or the “Successor Company”) was originally formed on January 17, 2012 as a Delaware limited liability company under the name Liquid Holdings Group, LLC with the intention of being the holding company to acquire and own a group of companies and ultimately pursue an initial public offering (“IPO”) in the United States. On July 24, 2013, the Company reorganized as a Delaware corporation and changed its name to Liquid Holdings Group, Inc. In connection with this reorganization, all of the outstanding common units of the Company were converted into shares of common stock of Liquid Holdings Group, Inc. at a ratio of 10,606.81 shares of common stock for each common unit. The accompanying financial statements have been revised to reflect the conversion of all common units and per unit amounts as if the conversion had occurred at the beginning of the periods presented. The Company’s Registration Statement, as filed with the Securities and Exchange Commission (“SEC”) on Form S-1, as amended (File No. 333-187859), became effective on July 25, 2013. On July 26, 2013, the Company’s common stock began trading on the NASDAQ Global Market under the ticker symbol “LIQD” in which 3,175,000 shares of its common stock were sold at a public offering price of $9.00 per share. The Company received net proceeds in the IPO of approximately $17.3 million after deducting underwriting discounts and commissions of approximately $2.6 million and offering related expenses of approximately $8.7 million.
The Company is the successor control entity of the Liquid Predecessor Companies (collectively, the “Predecessor Company”), which was not a legal entity, but rather a combination of certain entities and operations formed to continue and expand the Liquid organization in developing and operating a proprietary next generation technology platform that streamlines and unifies the entire trade and risk management process for the financial services community. The individual entities that comprise the Predecessor Company include:
| § | Liquid Prime Holdings, LLC (“LPH”) |
| § | Liquid Prime Services, Inc. (“LPS”) |
| § | Liquid Trading Holdings Limited (“Guernsey”) |
| § | Centurion Capital Group, LLC (“Centurion”) |
The Company’s subsidiaries that are included in the consolidation are:
| § | Liquid Futures, LLC (“Futures”) |
| § | Liquid Trading Institutional LLP (“Institutional”) |
| § | Liquid Partners, LLC formerly known as Centurion Capital Group, LLC and Centurion Trading Partners, LLC (collectively “Centurion”) |
| § | Fundsolve Ltd. (“Fundsolve”) |
| § | LHG Technology Services Ltd. (“Technology”) |
| § | Liquid Prime Holdings, LLC (“LPH”) |
| § | Liquid Technology Services, LLC (“LTS”) formerly known as Green Mountain Analytics, LLC (“GMA”) |
The Company commenced operations on April 24, 2012, the date the founders signed a limited liability agreement of the Company and agreed to contribute certain entities owned or controlled by them to the Company.
The Company has had significant operating losses during the period from its inception on April 24, 2012, through the year ended December 31, 2013. The Company has managed its liquidity during this time through cost reduction initiatives and capital markets transactions. The Company anticipates that its existing capital resources, including availability under its $3.75 million Revolving Promissory Notes (see Note 16) from Brian Ferdinand, a director and one of the founders of the Company, and Douglas J. Von Allmen, a significant stockholder in the Company ($7.5 million in the aggregate), cash flows from operations, and cost reduction initiatives, will be adequate to satisfy its liquidity requirements through March 2015. If available liquidity is not sufficient to meet the Company’s operating obligations as they come due, management’s plans include pursuing alternative financing arrangements or further reducing expenditures as necessary to meet the Company’s cash requirements throughout March 2015. There is, however, no assurance that, if required, the Company will be able to raise additional capital, obtain additional alternative financing or reduce discretionary spending to provide the required liquidity.
LIQUID HOLDINGS GROUP, INC. AND SUBSIDIARIES
NOTES TO CONSOLIDATED FINANCIAL STATEMENTS
(2) Summary of Significant Accounting Policies
Basis of Presentation
The consolidated financial statements include the accounts of the Company and its subsidiaries and have been prepared in accordance with accounting principles generally accepted in the U.S. (“U.S. GAAP”). All material intercompany accounts and transactions have been eliminated in consolidation.
Use of Estimates
The preparation of financial statements in conformity with U.S. GAAP requires management to make estimates and assumptions that affect the reported amounts of assets, liabilities, revenues and expenses and the disclosure of contingent assets, liabilities, revenues and expenses. These significant estimates and assumptions include estimates of fair value of goodwill and intangibles with indefinite lives for purposes of impairment testing, estimates of useful lives of assets, estimates of impairment of long-lived assets, estimates of fair values of share-based payment arrangements, estimates of valuation allowances related to deferred tax assets, and estimates of contingent liabilities related to business acquisitions. Due to the inherent uncertainty involved with estimates, actual results may differ.
Cash and Cash Equivalents
The Company considers all highly liquid investments with original maturities of three months or less to be cash equivalents.
Fair Value of Financial Instruments
The Company uses a three-level classification hierarchy of fair value measurements that establishes the quality of inputs used to measure fair value. The fair value of a financial instrument is the amount that would be received to sell an asset or paid to transfer a liability in an orderly transaction between market participants at the measurement date. The fair value of financial instruments is determined using various techniques that involve some level of estimation and judgment, the degree of which is dependent on the price transparency and the complexity of the instruments.
Concentration of Credit Risk
Financial instruments, which potentially expose the Company to concentrations of credit risk, consist primarily of cash and cash equivalents. The Company maintains its cash accounts with high quality financial institutions. Although the Company currently believes that the financial institutions, with which it does business, will be able to fulfill their commitments to it, there is no assurance that those institutions will be able to continue to do so.
Property and Equipment
Property and equipment are carried at cost and are depreciated using the straight-line method over the estimated useful lives of the assets (generally three to seven years). Leasehold improvements are carried at cost and are depreciated over the remaining term of the respective lease to which they relate.
Goodwill and Other Intangible Assets
Goodwill is the excess of the purchase price paid over identified intangible and tangible net assets acquired in a business combination. Intangible assets consist of trademarks, intellectual property, non-compete agreements, client relationships and acquired technology.
The Company uses either the income, cost or market approach to aid in its conclusions of such fair values and asset lives. The income approach presumes that the value of an asset can be estimated by the net economic benefit to be received over the life of the asset, discounted to present value. The cost approach presumes that an investor would pay no more for an asset than its replacement or reproduction cost. The market approach estimates value based on what other participants in the market have paid for reasonably similar assets. Although each valuation approach is considered in valuing the assets acquired, the approach ultimately selected is based on the characteristics of the asset and the availability of information.
LIQUID HOLDINGS GROUP, INC. AND SUBSIDIARIES
NOTES TO CONSOLIDATED FINANCIAL STATEMENTS
Goodwill is an asset representing the future economic benefits arising from other assets acquired in a business combination that are not individually identified and separately recognized. Goodwill is reviewed for impairment at least annually, on July 31, or whenever events or changes in circumstances indicate the fair value of a reporting unit is less than its carrying amount.In evaluating goodwill for impairment, the Company first performs a qualitative assessment to determine whether it is more likely than not that the fair value of the reporting unit is less than its carrying amount. If it is determined through the qualitative assessment that a reporting unit's fair value is more likely than not greater than its carrying value, the remaining impairment steps would not be necessary. If however it is determined through the qualitative assessment that a reporting unit's fair value is more likely than not less than its carrying value, the Company will perform a quantitative assessment and compare the fair value of the reporting unit to its carrying value.The quantitative assessment of goodwill impairment is a two-step test. Under the first step, the fair value of the reporting unit is compared with its carrying value (including goodwill). If the fair value of the reporting unit is less than its carrying value, an indication of goodwill impairment exists for the reporting unit and the entity must perform step two of the impairment test (measurement). Under step two, an impairment loss is recognized for any excess of the carrying amount of the reporting unit’s goodwill over the implied fair value of that goodwill. The implied fair value of goodwill is determined by allocating the fair value of the reporting unit in a manner similar to a purchase price allocation and the residual fair value after this allocation is the implied fair value of the reporting unit goodwill. Fair value of the reporting unit is determined using a discounted cash flow analysis. If the fair value of the reporting unit exceeds its carrying value, step two does not need to be performed.
An intangible asset is recognized as an asset apart from goodwill if it arises from contractual or other legal rights or if it is separable (i.e., capable of being separated or divided from the acquired entity and sold, transferred, licensed, rented or exchanged).Other intangible assets with definitelives are amortized over their expected useful lives. Other intangible assets with indefinite lives are assessed at least annually for impairment. In evaluating indefinite-lived intangible assets for impairment, the Company first performs a qualitative assessment to determine whether it is more likely than not that the fair value of the asset is less than its carrying amount. If it is determined through the qualitative assessment that an asset is impaired, then a quantitative impairment test is required to be performed. An impairment loss is calculated as the amount by which the carrying value of the intangible asset exceeds its estimated fair value.
Business Combinations
Assets acquired and liabilities assumed are recorded at their fair values on the date of acquisition. The cost to be allocated in a business combination includes consideration paid to the sellers, including cash and the fair values of assets acquired and liabilities assumed. Both direct (e.g., legal and professional fees) and indirect costs of the business combination are expensed as incurred. Certain agreements to acquire entities may include potential additional consideration that is payable, contingent on the acquired company maintaining or achieving specified earnings levels in future periods. The fair value of any contingent consideration would be recognized on the acquisition date with subsequent changes in that fair value reflected in income. The consolidated financial statements and results of operations reflect an acquired business from the date of acquisition.
Deferred Offering Costs
Deferred offering costs consist principally of legal and accounting fees incurred through the balance sheet date that were directly related to the Company’s IPO. Upon the successful completion of the IPO, all deferred offering costs were charged to stockholders’ equity.
Revenue Recognition
Software Revenues
The Company derives revenue from providing software as a service for an online trading platform. There is no downloadable software, distribution or technology delivered to customers. Software is provided under a hosting arrangement. Revenue is accounted for as software as a service arrangement since the customer does not have the contractual right to take possession of the software at any time during the hosting period. The Company recognizes revenue for these software subscriptions when the following criteria have been met: (1) persuasive evidence of an arrangement exists; (2) delivery of the product has occurred; (3) the fee is fixed or determinable; and (4) collection is probable.
LIQUID HOLDINGS GROUP, INC. AND SUBSIDIARIES
NOTES TO CONSOLIDATED FINANCIAL STATEMENTS
In addition, on December 1, 2013, the Company started charging customers for market data services. Market data is trade-related data for a financial instrument reported by a trading venue, such as a stock exchange, which allows traders and investors to know the latest price and see historical trends for that financial instrument. The Company is not charging a profit on market data, rather it is passing on the cost it incurs from the market data provider, that it has contracted with to provide such data, to the customer.
Brokerage Revenues
On June 1, 2013, the Company ceased the over-the-counter brokerage operations of LPS and Futures. LPS and Futures will continue to be a component of the Company’s business strategy by facilitating the introduction of client assets to custody banking relationships.
Prior to June 1, 2013, brokerage revenues were derived from LPS and Futures. LPS derived revenue from (1) the mark-up generated by brokers executing fixed income and equity transactions on a riskless principle basis, and (2) commissions generated by brokers executing equity trades on behalf of clients, which were settled with the client’s clearing firm. Futures derived revenue from commissions generated by (1) facilitating over-the-counter agency transactions on behalf of clients and (2) by broker’s executing exchange traded futures and options transactions on behalf of clients.
The Company has received regulatory approval to combine LPS and Futures into a single entity (see Note 16).
Share-Based Compensation
The Company accounts for share-based compensation in accordance with ASC Topic 718, Compensation—Stock Compensation (“ASC 718”). Under ASC 718, awards result in a cost that is measured at fair value on the awards’ grant date, based on the estimated number of awards that are expected to vest resulting in a charge to operations over the requisite service period. For awards with graded vesting, the Company recognizes share-based compensation expense on a straight-line basis over the service period for each separately vesting portion of the award as if the award was, in substance, multiple awards.
Income Taxes
The Company is treated as a corporation for tax purposes. The Company accounts for income taxes under ASC Topic 740, Income Taxes (“ASC 740”). ASC 740 requires the recognition of deferred tax assets and liabilities for the difference between the financial statement carrying value and tax basis of assets and liabilities. Deferred tax assets and liabilities are measured using enacted tax rates expected to apply on taxable income in the years in which those temporary differences are expected to be recovered or settled. The effect on deferred tax assets and liabilities of a change in tax rate is recognized in income in the period that includes the enactment date. ASC 740 additionally requires a valuation allowance to be established when it is more likely than not that all or a portion of deferred tax assets will not be realized. A tax position that fails to meet a more-likely-than-not recognition threshold will result in either reduction of current or deferred tax assets and/or recording of current or deferred tax liabilities. Interest and penalties related to income taxes are recorded as income tax expense.
Foreign Currency Translation
Assets and liabilities denominated in non-U.S. currencies are translated at rates of exchange prevailing at the balance sheet date, and revenues and expenses are translated at average rates of exchange during the fiscal year. Gains or losses on translation of the financial statements of a foreign operation, where the functional currency is other than the U.S. dollar, together with the after-tax effect of exchange rate changes on intercompany transactions of a long-term investment nature, are reflected as a component of accumulated other comprehensive loss within stockholders’ equity. Gains or losses on foreign currency transactions are included in other general and administrative expenses in the consolidated statements of operations and comprehensive loss.
LIQUID HOLDINGS GROUP, INC. AND SUBSIDIARIES
NOTES TO CONSOLIDATED FINANCIAL STATEMENTS
Revisions
Effective September 30, 2013, the Company corrected the presentation of certain expenses in its consolidated statements of operations and comprehensive loss. After analyzing costs related to its software services business, it was determined that certain of these costs originally reported inCost of revenues,should have been reported in other expense line items for the period from April 24, 2012 to December 31, 2012. These revisions were retroactively applied as indicated in the table below:
| | | Period from April 24, 2012 to December 31, 2012 | |
| | | As Reported | | | Adjustments | | | As Adjusted | |
| | | | | | | | | | |
| Cost of revenues, software services | | $ | 690,190 | | | $ | (301,330 | ) | | $ | 388,860 | |
| Compensation | | | 28,333,420 | | | | (48,000 | ) | | | 28,285,420 | |
| Professional fees | | | 1,644,483 | | | | 6,749 | | | | 1,651,232 | |
| Computer related and software development | | | 71,467 | | | | 342,581 | | | | 414,048 | |
Effective September 30, 2013, the Company corrected the presentation of certain current assets in its consolidated balance sheets. Formerly, amounts for customer accounts receivable and short-term deposits were recorded in one account,Other receivable. The current classification records amounts for customer accounts receivable to a new account,Accounts receivable, while amounts for short-term deposits are recorded toPrepaid expenses and other current assets. This reclassification was retroactively applied to December 31, 2012 as indicated in the table below:
| | | December 31, 2012 | |
| | | As Reported | | | Adjustments | | | As Adjusted | |
| | | | | | | | | | |
| Other receivable | | $ | 1,637,075 | | | $ | (1,637,075 | ) | | $ | - | |
| Accounts receivable, net | | | - | | | | 467,507 | | | | 467,507 | |
| Prepaid expenses and other current assets | | | 119,417 | | | | 1,169,568 | | | | 1,288,985 | |
Management believes that the current presentation is more transparent for the reader of its financial statements. Management does not believe that these revisions are material to the consolidated financial statements taken as a whole.
Recently Issued Accounting Pronouncements
In February 2013, the Financial Accounting Standards Board (“FASB”) issued Accounting Standards Update No. 2013-02, Comprehensive Income (Topic 220):Reporting of Amounts Reclassified Out of Accumulated Other Comprehensive Income (“ASU 2013-02”), which is effective prospectively for public companies for reporting periods beginning after December 15, 2012. This new accounting standard improves the reporting of reclassifications out of accumulated other comprehensive income (“AOCI”) by requiring an entity to report the effect of significant reclassifications out of AOCI on the respective line items in net income if the amount being reclassified is required under GAAP to be reclassified in its entirety to net income. For other amounts that are not required under GAAP to be reclassified in their entirety to net income in the same reporting period, an entity is required to cross-reference other disclosures required under GAAP that provide additional detail about those amounts. The adoption of this new guidance did not have a material impact on the Company’s consolidated financial statements.
In July 2013, the FASB issued Accounting Standards Update No. 2013-11, Income Taxes (Topic 740):Presentation of an Unrecognized Tax Benefit When a Net Operating Loss Carryforward, a Similar Tax Loss, or a Tax Credit Carryforward Exists (“ASU 2013-11”). ASU 2013-11 requires an entity to present an unrecognized tax benefit and an NOL carryforward, a similar tax loss, or a tax credit carryforward on a net basis as part of a deferred tax asset, unless the unrecognized tax benefit is not available to reduce the deferred tax asset component or would not be utilized for that purpose, in which case a liability would be recognized. ASU 2013-11 will be effective for fiscal periods beginning after December 15, 2013, with early adoption permitted. The Company has evaluated the impact of the adoption of this pronouncement and determined that it will not have a material impact on its consolidated financial statements.
LIQUID HOLDINGS GROUP, INC. AND SUBSIDIARIES
NOTES TO CONSOLIDATED FINANCIAL STATEMENTS
The Company has assessed the potential impact of other recently issued, but not yet effective, accounting standards and determined that the provisions are either not applicable to the Company, or are not anticipated to have a material impact on its consolidated financial statements.
(3) Fair Value Measurements
Fair Value Hierarchy
The Company determines fair value based on assumptions that market participants would use in pricing an asset or liability in the principal or most advantageous market. When considering market participant assumptions in fair value measurements, the following fair value hierarchy distinguishes between observable and unobservable inputs, which are categorized in one of the following levels:
| · | Level 1 Inputs: Unadjusted quoted prices for identical assets or liabilities in active markets accessible to the Company at the measurement date. |
| · | Level 2 Inputs: Other than quoted prices included in Level 1, inputs that are observable for the asset or liability, either directly or indirectly, for substantially the full term of the asset or liability. |
| · | Level 3 Inputs: Unobservable inputs for the asset or liability used to measure fair value to the extent that observable inputs are not available, thereby allowing for situations in which there is little, if any, market activity for the asset or liability at the measurement date. |
The fair value measurement level of an asset or liability within the fair value hierarchy is based on the lowest level of any input that is significant to the fair value measurement. The Company uses valuation techniques that maximize the use of observable inputs and minimize the use of unobservable inputs. Transfers between levels of the fair value hierarchy are deemed to have occurred at the end of the reporting period.
Determination of Fair Value
The categorization of an asset or liability within the fair value hierarchy is based on the inputs described above and does not necessarily correspond to the Company’s management’s perceived risk of that asset or liability. Moreover, the methods used by management may produce a fair value calculation that may not be indicative of net realizable value or reflective of future fair values. Furthermore, although the Company believes its valuation methods are appropriate and consistent with other market participants, the use of different methodologies or assumptions to determine the fair value of certain financial instruments and nonfinancial assets and liabilities could result in a different fair value measurement at the reporting date. Descriptions of the valuation methodologies, including the valuation techniques and the input(s) used in the fair measurements for assets and liabilities on a recurring and nonrecurring basis are itemized below.
Contingent Consideration Payable
The Company’s contingent consideration is classified as a liability, and was initially measured at fair value in accordance with FASB Accounting Standards Codification (“ASC”) Topic 805—Business Combinations Paragraph 30-25-5. The contingent consideration was remeasured at fair value at the end of each reporting period until the contingency was resolved, which occurred upon the Company’s IPO, with any changes in fair value recognized in earnings. The Company utilized a market approach to determine fair value and relied on Level 3 inputs prior to the IPO. These fair value measurements were, therefore, considered Level 3 measurements. Unobservable inputs, prior to the IPO, consisted of valuations based upon transactions in the Company’s common units, the discount for lack of marketability, the cost of equity and estimates of the probability of an IPO occurring by a certain date. Subsequent to the IPO, the contingent consideration was valued using Level 1 measurements up to the date the liability was settled.
LIQUID HOLDINGS GROUP, INC. AND SUBSIDIARIES
NOTES TO CONSOLIDATED FINANCIAL STATEMENTS
Intangible Assets
Intangible assets and long-lived assets held and used are measured at fair value in accordance with ASC Subtopic 360-10,Property, Plant, and Equipment—Overall, if a step 2 test is required. To estimate the fair value of long-lived assets held and used, the income, market, and cost approaches to value are considered. The selected approach(es) is (are) based on the specific attributes of the long-lived asset. Property, plant, and equipment is typically valued using a cost approach, while intangible assets are usually valued with an income approach. Although Level 1 and 2 inputs may be available for certain inputs to the valuation approach, reliance on Level 3 inputs is generally required and the fair value measurements are, therefore, considered Level 3 measurements. Unobservable inputs usually consist of discount rates, customer attrition rates, growth rates, royalty rates, contributory asset charges and profitability assumptions.
Goodwill
Goodwill is tested annually for impairment each July in accordance with ASC Topic 350—Intangibles-Goodwill and Other. Step 1 entails a comparison of the fair value of the recoverable amount of each reporting unit to its carrying amount. An income approach is used to derive the fair value of each reporting unit. Under the income approach, fair value is determined based on the present value of estimated future cash flows, discounted at an appropriate risk-adjusted rate. Unobservable inputs include discount rates, growth rates and prospective financial information.
Recurring Fair Value Measurements
The following table presents, for each level within the fair value hierarchy, the Company’s recurring fair value measurements for assets and liabilities:
| | | | | | Fair Value Measurement Using | |
| | | December 31, 2012 | | | Level 1 | | | Level 2 | | | Level 3 | |
| Contingent consideration payable | | $ | 1,561,000 | | | $ | - | | | $ | - | | | $ | 1,561,000 | |
The Company had no recurring fair value measurements at December 31, 2013.
Non-Recurring Fair Value Measurements
The following table presents, for each level within the fair value hierarchy, the Company’s non-recurring fair value measurements:
| | | | | | Fair Value Measurement Using | |
| | | December 31, 2012 | | | Level 1 | | | Level 2 | | | Level 3 | |
| Other intangible assets | | $ | 18,740,125 | | | $ | - | | | $ | - | | | $ | 18,740,125 | |
| Goodwill | | | 13,182,936 | | | | - | | | | - | | | | 13,182,936 | |
| | | $ | 31,923,061 | | | $ | - | | | $ | - | | | $ | 31,923,061 | |
The Company had no non-recurring fair value measurements at December 31, 2013.
Transfers between Level 1 and Level 2
There were no transfers of financial assets or liabilities between Level 1 and Level 2, or between Level 2 and Level 3 during the years ended December 31, 2013 and 2012.
Reconciliation of Recurring Fair Value Measurements within Level 3
The following table presents a summary of changes in the fair value of the Company’s Level 3 liabilities:
LIQUID HOLDINGS GROUP, INC. AND SUBSIDIARIES
NOTES TO CONSOLIDATED FINANCIAL STATEMENTS
| | | Contingent Consideration Payable | |
| | | December 31, 2013 | | | December 31, 2012 | |
| Opening Balance | | $ | 1,561,000 | | | $ | - | |
| Transfers into Level 3 | | | - | | | | - | |
| Transfers out of Level 3 | | | - | | | | - | |
| Total gains or losses for the period included in earnings: | | | | | | | | |
| Realized (gains) losses | | | 649,688 | | | | (1,545,000 | ) |
| Unrealized (gains) losses | | | - | | | | (129,000 | ) |
| Purchases, issues, sales and settlements: | | | | | | | | |
| Purchases | | | - | | | | - | |
| Issues | | | - | | | | 11,990,000 | |
| Sales | | | - | | | | - | |
| Settlements | | | (2,210,688 | ) | | | (8,755,000 | ) |
| Closing balance | | $ | - | | | $ | 1,561,000 | |
| Change in unrealized gains and losses for the period included in earnings at period end | | $ | - | | | | | |
Financial Assets and Financial Liabilities not Measured at Fair Value
The following table summarizes the carrying amount and estimated fair value of the Company’s financial assets that are not measured at fair value either on a recurring or nonrecurring basis:
| | | | | | Estimated Fair Value | |
| December 31, 2013 | | Carrying Amount | | | Level 1 | | | Level 2 | | | Level 3 | | | Total | |
| Cash and cash equivalents | | $ | 8,473,847 | | | $ | 8,473,847 | | | $ | - | | | $ | - | | | $ | 8,473,847 | |
| | | | | | Estimated Fair Value | |
| December 31, 2012 | | Carrying Amount | | | Level 1 | | | Level 2 | | | Level 3 | | | Total | |
| Cash and cash equivalents | | $ | 1,380,078 | | | $ | 1,380,078 | | | $ | - | | | $ | - | | | $ | 1,380,078 | |
| Note receivable from related party | | $ | 2,250,000 | | | $ | - | | | $ | - | | | $ | 2,255,000 | | | $ | 2,255,000 | |
The following is a description of the principal valuation methods used by the Company for those financial assets that are not measured at fair value either on a recurring or non-recurring basis:
Cash and Cash Equivalents
The carrying amount of cash and cash equivalents approximates fair value.
Note Receivable from Related Party
In estimating the fair value of the note receivable from a related party, the Company used a discounted cash flow model. Fair value is estimated by discounting the anticipated cash flows from the loans, assuming future prepayments and using market interest rates for new loans with comparable credit risk.
(4) Property and Equipment
The following is a summary of property and equipment:
| | | December 31, 2013 | | | December 31, 2012 | |
| Computer equipment and software | | $ | 255,814 | | | $ | 11,198 | |
| Furniture and fixtures | | | 229,618 | | | | 276,416 | |
| Leasehold improvements | | | 662,638 | | | | 121,823 | |
| | | | 1,148,070 | | | | 409,437 | |
| Less: accumulated depreciation and amortization | | | (280,312 | ) | | | (84,152 | ) |
| Total | | $ | 867,758 | | | $ | 325,285 | |
LIQUID HOLDINGS GROUP, INC. AND SUBSIDIARIES
NOTES TO CONSOLIDATED FINANCIAL STATEMENTS
Depreciation expense was $205,171 for the year ended December 31, 2013 and $19,185 for the period from April 24, 2012 to December 31, 2012. Depreciation expense of the Predecessor Company was $6,912 for the period from January 1, 2012 to April 24, 2012.
(5) Goodwill and Other Intangible Assets
Acquired Intangible Assets
| | | | | December 31, 2013 | | | December 31, 2012 | |
| | | Amortization
period | | Gross
Carrying
Amount | | | Accumulated
Amortization | | | Net Carrying
Amount | | | Gross
Carrying
Amount | | | Accumulated
Amortization | | | Net Carrying
Amount | |
| Amortizable Intangible Assets: | | | | | | | | | | | | | | | | | | | | | | | | | | |
| Software and trading platform | | 3 years | | $ | 19,374,098 | | | $ | (8,735,318 | ) | | $ | 10,638,780 | | | $ | 19,374,098 | | | $ | (2,244,378 | ) | | $ | 17,129,720 | |
| Customer relationships(1) | | 3 years | | | 1,261,000 | | | | (595,472 | ) | | | 665,528 | | | | 1,261,000 | | | | (175,140 | ) | | | 1,085,860 | |
| Non-compete agreements(1) | | Life of agreement, 24 months | | | 646,000 | | | | (646,000 | ) | | | - | | | | 646,000 | | | | (323,000 | ) | | | 323,000 | |
| Total | | | | $ | 21,281,098 | | | $ | (9,976,790 | ) | | $ | 11,304,308 | | | $ | 21,281,098 | | | $ | (2,742,518 | ) | | $ | 18,538,580 | |
| Indefinite-Lived Intangible Assets: | | | | | | | | | | | | | | | | | | | | | | | | | | |
| Broker licenses | | N/A | | $ | 163,000 | | | $ | - | | | $ | 163,000 | | | $ | 163,000 | | | $ | - | | | $ | 163,000 | |
| Patents pending | | N/A | | | 36,545 | | | | - | | | | 36,545 | | | | 36,545 | | | | - | | | | 36,545 | |
| Trade names | | N/A | | | 2,000 | | | | - | | | | 2,000 | | | | 2,000 | | | | - | | | | 2,000 | |
| Total | | | | $ | 201,545 | | | $ | - | | | $ | 201,545 | | | $ | 201,545 | | | $ | - | | | $ | 201,545 | |
| (1) | Gross and net carrying amounts were reduced by $86,000 in total due to impairment during the period from April 24, 2012 to December 31, 2012. |
Total amortization expense for intangible assets was $7,201,891 for the year ended December 31, 2013 and $2,742,518 for the period from April 24, 2012 to December 31, 2012. As of December 31, 2013, the future estimated amortization expense related to amortizable intangible assets is expected to be as follows:
| 2014 | | | 6,866,252 | |
| 2015 | | | 4,438,056 | |
| | | $ | 11,304,308 | |
There was no amortization expense of the Predecessor Company for the period from January 1, 2012 to April 24, 2012.
Goodwill
The Company performed its annual goodwill impairment test in July 2013. The Company performed a qualitative assessment of each reporting unit and determined that is was not more-likely-than-not that the fair value of each reporting unit was less than its carrying amount. As a result, the two-step goodwill impairment test was not required.
During the period from April 24, 2012 to December 31, 2012, the Company determined that it was necessary to evaluate the goodwill and related identifiable intangible assets of Partners, acquired on May 12, 2012, for impairment as a result of the decrease in the contingent consideration payable. The Company performed an analysis to determine the fair value of Partners in July 2012 and concluded that the carrying amount of goodwill exceeded its fair value and recognized an impairment charge of $1,464,652 in the consolidated statements of operations and comprehensive loss.
The changes in the carrying amount of goodwill for the year ended December 31, 2013 and the period ended December 31, 2012 are as follows:
| | | 2013 | | | 2012 | |
| Balances as of January 1: | | | | | | | | |
| Gross goodwill | | $ | 14,647,588 | | | $ | - | |
| Accumulated impairment losses | | | (1,464,652 | ) | | | - | |
| Net goodwill as of January 1 | | | 13,182,936 | | | | - | |
| | | | | | | | | |
| Goodwill acquired during the year | | | - | | | | 14,647,588 | |
| Impairment loss | | | - | | | | (1,464,652 | ) |
| | | | | | | | | |
| Balances as of December 31: | | | | | | | | |
| Gross goodwill | | | 14,647,588 | | | | 14,647,588 | |
| Accumulated impairment losses | | | (1,464,652 | ) | | | (1,464,652 | ) |
| Net goodwill as of December 31 | | $ | 13,182,936 | | | $ | 13,182,936 | |
LIQUID HOLDINGS GROUP, INC. AND SUBSIDIARIES
NOTES TO CONSOLIDATED FINANCIAL STATEMENTS
(6) Certain Relationships and Related Party Transactions
Amounts recognized from transactions with related parties in the accompanying consolidated balance sheets are as follows:
| | | December 31, 2013 | | | December 31, 2012 | |
| Assets: | | | | | | | | |
| Note receivable from QuantX Management, LLP | | $ | - | | | $ | 2,250,000 | |
| | | | | | | | | |
| Due from QuantX Management, LLP | | $ | 243,030 | | | $ | 243,030 | |
| Due from Ferdinand Capital | | | 116,000 | | | | 116,000 | |
| Due from shareholder | | | 300,000 | | | | - | |
| Total due from related parties | | $ | 659,030 | | | $ | 359,030 | |
| | | | | | | | | |
| Liabilities: | | | | | | | | |
| Due to related parties | | $ | - | | | $ | 61,873 | |
| Total due to related parties | | $ | - | | | $ | 61,873 | |
Note Receivable from QuantX Management, LLP
In June 2012, the Company entered into a demand promissory note with Liquid Trading Int’l LLP, which changed its name to QuantX Management, LLP (“QuantX”) effective January 22, 2013. The note, in the principal amount of $5,000,000, was payable upon demand, but in no event no later than May 15, 2013. The note bore interest at a rate of 3% per annum which was payable upon demand. At December 31, 2013 and 2012, there was no accrued interest receivable included inPrepaid expenses and other current assets in the accompanying consolidated balance sheets. QuantX repaid an aggregate of $2,750,000 of principal during the period from April 24, 2012 to December 31, 2012, with the remaining principal balance of $2,250,000 repaid during the first quarter of 2013. Total interest received over the life of the loan was $74,416. QuantX is a multi-strategy principal-only trading firm with which the founders of the Company are affiliated.
Due from QuantX Management, LLP
During 2012, the Company provided payments to GMA on behalf of QuantX in relation to the development of LiquidView, a software tool which forms a component of the Company’s accounting technology platform. In addition, Partners received payments from QuantX to facilitate the payment of operating expenses. LTI also advanced funds to QuantX for various expenses prior to being acquired by the Company. These payments netted to a total of $243,030, and are included inDue from related parties in the accompanying consolidated balance sheets at December 31, 2013 and 2012.
On March 15, 2014, the Company executed a three-year term note with QuantX Management, LLP in the principal amount of $243,030. The note bears interest at the rate of 4% per annum, with monthly payments of principal and interest totaling $7,175. The note shall be payable in full on March 15, 2017.
Due from Ferdinand Capital
LTI advanced $116,000 to Ferdinand Capital during 2011. This amount is included inDue from related parties in the accompanying consolidated balance sheets at December 31, 2013 and 2012. Ferdinand Capital is an entity owned by one of the founders of the Company.
On March 15, 2014, the Company executed a one-year term note with Ferdinand Capital in the principal amount of $116,000. The note bears interest at the rate of 4% per annum, with monthly payments of principal and interest totaling $9,877. The note shall be payable in full on March 15, 2015.
LIQUID HOLDINGS GROUP, INC. AND SUBSIDIARIES
NOTES TO CONSOLIDATED FINANCIAL STATEMENTS
Due from Stockholder
A security deposit for office space that was leased by one of the entities acquired by the Company was inadvertently refunded to a stockholder of the Company who was also a principal of the acquired entity. The security deposit should have been refunded to the Company and, as such, a receivable has been recorded from the stockholder.
On March 15, 2014, the Company executed a five-year term note with the stockholder in the principal amount of $300,000. The note bears interest at the rate of 3% per annum, with monthly payments of principal and interest totaling $5,390. The note shall be payable in full on March 15, 2019.
Due to Related Parties
Partners and LHG incurred expenses that were paid by entities owned by one of the founders. These payments, net of any amounts repaid by the Company, totaled $0 and $61,873 at December 31, 2013 and 2012, respectively, and are included inDue to related parties in the accompanying consolidated balance sheets.
Loans Payable to Founders
On June 13, 2013, Richard Schaeffer, one of the founders and a former member of the Company’s Board of Directors, loaned the Company $250,000 to be payable in full on December 13, 2013. The loan bore interest on the unpaid principal balance at a rate of 4% per annum until the earlier of payment in full or December 13, 2013. The proceeds of the loan were used for general working capital requirements of the Company. On August 1, 2013, the Company repaid the principal balance of the loan in full. The amount of interest paid on the loan totaled $1,370.
On July 1, 2013, Ferdinand Holdings, LLC, a Delaware limited liability company of which Mr. Ferdinand is the managing member, loaned the Company $250,000 to be payable in full on December 31, 2013. The loan bore interest on the unpaid principal balance at a rate of 4% per annum until the earlier of payment in full or December 31, 2013. The proceeds of the loan were used for general working capital requirements of the Company. On August 1, 2013, the Company repaid the principal balance of the loan in full. The amount of interest paid on the loan totaled $877.
Other Related Party Relationships
Certain officers and directors of the Company were also officers and directors of certain entities acquired by the Company or entities with which the Company has business relationships.
On July 11, 2013, Thomas Ross, a member of the Company’s Board of Directors, loaned the Company $250,000 to be payable in full on January 10, 2014. The loan bore interest on the unpaid principal balance at a rate of 4% per annum until the earlier of payment in full or January 10, 2014. The proceeds of the loan were used for general working capital requirements of the Company. On August 1, 2013, the Company repaid the principal balance of the loan in full. The amount of interest paid on the loan totaled $603.
On October 1, 2013, the Company entered into a four-month sublease agreement for office space in Hoboken, New Jersey which was subsequently converted to a five-year lease agreement, effective February 1, 2014. The sublease and lease agreements were entered into with an entity that the Company’s Chief Executive Officer and General Counsel have an interest in, and are members of that entity’s board of directors (see Note 7).
(7) Commitments and Contingencies
Legal Matters
The Company may periodically be involved in litigation and various legal matters, including proceedings relating to regulatory matters. Such matters are subject to many uncertainties and outcomes that are not predictable.
LIQUID HOLDINGS GROUP, INC. AND SUBSIDIARIES
NOTES TO CONSOLIDATED FINANCIAL STATEMENTS
In November 2012, a former employee of the Company filed a complaint in the United States District Court for the Southern District of New York against the Company, Richard Schaeffer (a founder of the Company), Brian Ferdinand (a founder of the Company) and entities controlled by Mr. Schaeffer. Among other claims, the complaint alleged breach of contract, breach of fiduciary duty and workplace violations. On April 30, 2013, a Settlement Agreement and Release (the “Settlement Agreement”) was executed among all parties. The Settlement Agreement called for consideration in the amount of $1 million to be paid as follows: $250,000 at the time of execution of the Settlement Agreement and the remaining $750,000 paid within 90 days from said execution. On April 30, 2013, the Company paid $250,000, its apportionment of the settlement amount. On July 26, 2013, Mr. Schaeffer paid the remaining $750,000 in accordance with the Settlement Agreement.
The Company is a defendant in an action filed on July 23, 2013 in the Supreme Court of The State of New York by two individuals (the “OTC Parties”) who were involved in the establishment and operation of the over-the-counter brokerage operations of LPS and Futures, which ceased operating on June 1, 2013. Also named as defendants are one of the Company’s subsidiaries, LPH, and the Company’s Vice Chairman and Head of Corporate Strategy, Brian Ferdinand (together with the Company and LPH, the “Liquid Defendants”). The complaint alleges fraudulent inducement, breach of contract and unjust enrichment and seeks specified damages of up to $3 million and other compensatory and punitive damages in an amount to be determined at trial, as well as such other further relief as the court deems just, proper and equitable under the circumstances. On September 13, 2013, the Liquid Defendants filed a motion to dismiss the complaint against all of the defendants on a number of grounds. Oral argument on the motion is scheduled for March 2014. On October 3, 2013, the Company filed suit against the OTC Parties on the grounds that that their use of the name “LPS Partners Inc.” for their new company is improper and will confuse LPS’s customers. The OTC Parties have answered the complaint and denied the allegations.
The Company believes that the claims alleged by the OTC Parties are without merit, and intends to defend any such claims vigorously. At this point, the Company is unable to develop a meaningful estimate of reasonably possible loss in connection with these claims due to a number of factors, including (i) the early stage of the matter, (ii) the uncertainty as to the outcome of the pending motion to dismiss, and (iii) the presence of significant factual issues that would need to be resolved. Legal proceedings are inherently uncertain, and we cannot assure you that an adverse decision in this dispute would not have a material adverse effect on the Company’s business, financial condition, liquidity or results of operations. Furthermore, the Company does not expect its directors’ and officers’ insurance carrier to compensate the Company for losses relating to this dispute.
The Company is not currently subject to any other pending or, to its knowledge, threatened legal proceedings that it expects could have a material impact on its consolidated financial statements.
Lease Commitments
The Company has entered into lease and sublease agreements with third parties for certain offices and equipment, which expire at various dates through December 2023. Rent expense of the Successor Company for the year ended December 31, 2013 and period from April 24, 2012 to December 31, 2012 was $1,211,693 and $629,400, respectively. Rent expense of the Predecessor Company for the period from January 1, 2012 to April 24, 2012 was $153,081. These amounts are recorded asRent in the accompanying consolidated statements of operations.
The Company recognizes rent expense for escalation clauses, rent holidays, leasehold improvement incentives and other concessions using the straight-line method over the minimum lease term.
At December 31, 2013, minimum future rental commitments under non-cancellable operating leases are as follows:
| Year Ending December 31, | | | |
| | | | |
| 2014 | | $ | 1,141,353 | |
| 2015 | | | 1,152,144 | |
| 2016 | | | 1,186,939 | |
| 2017 | | | 1,222,782 | |
| 2018 | | | 1,263,047 | |
| Thereafter | | | 6,090,443 | |
| Total | | $ | 12,056,708 | |
LIQUID HOLDINGS GROUP, INC. AND SUBSIDIARIES
NOTES TO CONSOLIDATED FINANCIAL STATEMENTS
On August 12, 2013, the Company, entered into a lease agreement (the “Lease”), effective December 6, 2013, for approximately 13,200 rentable square feet of office space located in New York. The Company is using a portion of the leased premises as its new corporate headquarters (the “HQ Space”), replacing the Company’s existing headquarters in the same building, and the remainder (the “BD/IB Space”) as offices for Prime and Futures, the Company’s broker dealer and introducing broker subsidiaries, respectively. The initial base rent under the Lease will be $85,364 per month, increasing at 3% per annum. In addition to the base rent, the Company will be responsible for certain costs and charges identified in the Lease, including certain utility expenses, real estate taxes, insurance and operating costs. The term of the Lease for the HQ Space and the BD/IB Space will end ten and six years after the effective date of the Lease, respectively.
On October 1, 2013, the Company entered into a four-month sublease agreement (the “Sublease”) at a monthly rate of $23,247 for approximately 7,200 square feet of office space in Hoboken, New Jersey to be used for certain back-office operations. The Sublease included a transfer to the Company of the existing equipment located in the space and an agreement to allow the sublessor to use a portion of the space not being used by the Company for up to nine months. The Sublease was entered into with an entity that the Company’s Chief Executive Officer and General Counsel have an interest in, and are members of that entity’s board of directors. In March 2014, the Company entered into a new, five-year lease (the “Hoboken Lease”) for the same space with an effective commencement date of February 1, 2014. The initial base rent under the Hoboken Lease will be $23,550 per month increasing to $24,153 per month on August 1, 2016. In addition to the base rent, the Company will be responsible for certain costs and charges identified in the Hoboken Lease, including certain utility expenses, real estate taxes, insurance and operating costs. As long the Company has no instances of default under the terms of the Hoboken Lease, the base rent will be waived for the period from February 1, 2014 to June 30, 2014. The future minimum rental commitments under the Hoboken Lease are not included in the above table as the lease had not commenced as of December 31, 2013.
(8) Share-Based Compensation
On April 5, 2013, the Company’s Board of Directors approved the 2012 Amended and Restated Stock Incentive Plan (“2012 Amended Incentive Plan”). Subject to adjustment for certain dilutive or related events, the maximum number of shares that may be issued under this amended plan shall not exceed the number of shares equal to 15% of the total number of common shares of the Company outstanding as of April 5, 2013.
The Company currently intends to use authorized and unissued shares to satisfy share award exercises.
At December 31, 2013, there were 1,078,667 additional shares available for the Company to grant under the 2012 Amended Incentive Plan.
Restricted Stock Units
The Company recognizes compensation expense on restricted stock units (“RSUs”) based on the grant date fair value per share over the applicable vesting period. The Company determines the fair value of RSUs granted based on the closing market price of the shares underlying the awards on the grant date. Prior to the Company’s IPO, fair value was determined with consideration given to valuation analyses performed by an unrelated third party valuation specialist retrospectively, utilizing a market approach based on third party purchases of the Company’s shares.
The following table summarizes the activity of non-vested RSUs granted under the 2012 Amended Incentive Plan:
| | | | | | | | | Period from | |
| | | Year Ended December 31, 2013 | | | April 24, 2012 to December 31, 2012 | |
| | | | | | Weighted Average | | | | | | Weighted Average | |
| | | | | | Grant Date | | | | | | Grant Date | |
| Non-vested shares | | Shares | | | Fair Value | | | Shares | | | Fair Value | |
| Balance at beginning of period | | | 760,033 | | | $ | 7.54 | | | | - | | | $ | - | |
| Granted | | | 1,077,560 | | | | 7.82 | | | | 760,033 | | | | 7.54 | |
| Vested | | | (605,839 | ) | | | 7.57 | | | | - | | | | - | |
| Forfeited | | | - | | | | - | | | | - | | | | - | |
| Balance at end of period | | | 1,231,754 | | | $ | 7.77 | | | | 760,033 | | | $ | 7.54 | |
LIQUID HOLDINGS GROUP, INC. AND SUBSIDIARIES
NOTES TO CONSOLIDATED FINANCIAL STATEMENTS
At December 31, 2013, there was $7,288,219 of total unrecognized compensation costs related to non-vested RSUs granted under the 2012 Amended Incentive Plan. This cost is expected to be recognized during 2014 through 2016. The total fair value of shares vested during the year ended December 31, 2013 was $4,584,314.
Non-Qualified Stock Options
The Company recognizes compensation expense on non-qualified stock options (“NQSOs”) based on the grant date fair value per share over the applicable vesting period. The Company determines the fair value of NQSOs granted using the Black-Scholes valuation model measured at the grant date.
The Black-Scholes fair value of each NQSO grant was calculated using the following assumptions:
| Dividend yield | | | 0 | % |
| Expected volatility | | | 50 | % |
| Risk-free interest rate | | | 1.7 | % |
| Expected term (years) | | | 6.0 | |
The following table summarizes the activity of NQSOs granted under the 2012 Amended Incentive Plan:
| | | Year Ended December 31, 2013 | |
| | | | | | Weighted Average | |
| | | Shares | | | Exercise Price | |
| Balance at beginning of period | | | - | | | $ | - | |
| Granted | | | 420,505 | | | | 9.00 | |
| Exercised | | | - | | | | - | |
| Forfeited | | | - | | | | - | |
| Balance at end of period | | | 420,505 | | | $ | 9.00 | |
| | | | | | | | | |
| Exercisable at end of period | | | 12,798 | | | $ | 9.00 | |
| | | | | | | | | |
| Remaining weighted average contractual life of exercisable options (years) | | | | | | | 9.6 | |
| | | | | | | | | |
| Aggregate intrinsic value | | | | | | $ | - | |
At December 31, 2013, there was $1,425,110 of total unrecognized compensation costs related to NQSOs granted under the 2012 Amended Incentive Plan. This cost is expected to be recognized during 2014 through 2016. The total fair value of shares vested during the year ended December 31, 2013 was $56,094.
(9) Registration Rights Penalty
On July 21, 2012, HA Investment, an entity controlled by Douglas J. Von Allmen, executed a subscription agreement in the amount of $12,500,000 in exchange for 1,239,986 common shares equal to 7.14% of the aggregate issued and outstanding common shares of the Company at such date. HA Investment wired the funds to the Company on April 24, 2012 (the “Wire Date”). The Company paid a finder’s fee associated with this capital contribution of 10% or $1,250,000, which was recorded as a reduction in capital contributed.
Pursuant to the agreement, in the event that an IPO of the Company’s shares had not been consummated prior to October 24, 2012, (the 6-month anniversary of the Wire Date), HA Investment was entitled to additional shares equal to 8.06%, 8.23% and 8.33% of the aggregate issued and outstanding common shares of the Company on October 24, November 24 and December 24, 2012, respectively. As a result of the IPO not occurring prior to December 24, 2012, the Company reflected the issuance of 242,020 additional common shares valued at $1,674,704 in the accompanying consolidated statements of stockholders’ equity at December 31, 2012 and a related charge to registration rights penalty in the accompanying consolidated statements of operations and comprehensive income (loss) for the period from April 24, 2012 to December 31, 2012.
LIQUID HOLDINGS GROUP, INC. AND SUBSIDIARIES
NOTES TO CONSOLIDATED FINANCIAL STATEMENTS
(10) Gain (Loss) on Settlement of Contingent Consideration Payable
In connection with the July 2012 acquisition of Fundsolve, the sellers of Fundsolve were to receive an aggregate of 1% of the issued equity capital of the Company upon (i) the IPO or admission to trading on any stock exchange of the Company or (ii) January 1, 2014. The Company recorded a contingent consideration payable in the amount of $1,690,000 representing the fair value of Fundsolve’s assets and liabilities on the acquisition date. At December 31, 2012, the contingent consideration payable was remeasured and, as a result, the Company recorded an unrealized gain of $129,000 in the accompanying consolidated statements of operations and comprehensive loss for the period from April 24, 2012 to December 31, 2012. Upon the IPO, the Company issued 245,632 common shares, valued at $2,210,688, to the sellers of Fundsolve as satisfaction of the contingent consideration payable and, as a result, recorded a realized loss of $649,688 in the accompanying consolidated statements of operations and comprehensive loss for the year ended December 31, 2013.
Upon the acquisition of Liquid Partners, LLC, the Company recorded an obligation to the former members of Centurion in the amount of $8,331,000 for the future obligation payable upon IPO and $1,969,000 of contingent common shares payable, resulting in an aggregate liability of $10,300,000. On July 21, 2012, the acquisition agreement was amended to accelerate the share issuance contemplated in the original agreement. As a result, the Company issued 951,432 shares of common stock, equivalent to 7.60% of its aggregate issued and outstanding common stock at such date, to the selling members of Centurion for the purchase price and eliminated all prior purchase price measurements and the contingent consideration. The Company determined the fair value of the 951,432 common shares issued to be $8,775,000. As a result of this amendment, the Company eliminated the prior liabilities due to the selling members and recorded a gain on settlement of the contingent consideration payable of $1,545,000 in the accompanying consolidated statements of operations during the period from April 24, 2012 through December 31, 2012.
(11) Income Taxes
The Company is subject to federal, New York State, New York City and other state tax jurisdictions. The Company’s initial corporate tax returns will be filed for the year ended December 31, 2013.
As discussed in Note 1, on July 24, 2013 the Company reorganized as a Delaware corporation from a limited liability company in connection with its IPO. The change in tax status required the Company to revalue its deferred tax assets and liabilities at current corporate federal and state income tax rates. Prior to July 24, 2013, the Company, as a limited liability company, was treated as a partnership for federal and state income tax purposes. Accordingly, no provision had been made for Federal and state income taxes during this period, since all items of income or loss were required to be reported on the income tax returns of the members, who are responsible for any taxes thereon. The Company was, however, subject to the New York City Unincorporated Business Tax of 4%.
The loss before income taxes is as follows:
| | | | | | Period from | |
| | | Year Ended | | | April 12, 2012 to | |
| | | December 31, 2013 | | | December 31, 2012 | |
| | | | | | | | | |
| Loss before income taxes | | $ | (47,309,307 | ) | | $ | (38,350,204 | ) |
LIQUID HOLDINGS GROUP, INC. AND SUBSIDIARIES
NOTES TO CONSOLIDATED FINANCIAL STATEMENTS
The provision for current and deferred income taxes consists of the following:
| | | | | | | |
| | | | | | Period from | |
| | | Year Ended | | | April 12, 2012 to | |
| | | December 31, 2013 | | | December 31, 2012 | |
| Income tax provision: | | | | | | | | |
| Current: | | | | | | | | |
| U.S. federal | | $ | - | | | $ | - | |
| U.S. state and local | | | - | | | | - | |
| Total current income taxes | | | - | | | | - | |
| | | | | | | | | |
| Deferred: | | | | | | | | |
| U.S. federal | | | (555,317 | ) | | | - | |
| U.S. state and local | | | (141,943 | ) | | | (104,340 | ) |
| Total deferred income taxes | | | (697,260 | ) | | | (104,340 | ) |
| | | | | | | | | |
| Total provision for income taxes | | $ | (697,260 | ) | | $ | (104,340 | ) |
A reconciliation of the statutory U.S. federal tax rate to the Company’s effective tax rate is as follows:
| | | | | | Period from | |
| | | Year Ended | | | April 12, 2012 to | |
| | | December 31, 2013 | | | December 31, 2012 | |
| Statutory U.S. federal tax rate | | | 35.00 | % | | | 35.00 | % |
| Change in tax status | | | -26.29 | % | | | -35.00 | % |
| State and local taxes, net of U.S. federal tax effect | | | 0.20 | % | | | 4.00 | % |
| Permanent differences | | | -0.40 | % | | | -3.06 | % |
| Valuation allowance | | | -7.03 | % | | | -0.70 | % |
| Other, net | | | -0.01 | % | | | 0.03 | % |
| | | | | | | | | |
| Effective tax rate | | | 1.47 | % | | | 0.27 | % |
LIQUID HOLDINGS GROUP, INC. AND SUBSIDIARIES
NOTES TO CONSOLIDATED FINANCIAL STATEMENTS
The effects of temporary differences that gave rise to the Company’s deferred tax assets and liabilities were as follows:
| | | December 31, 2013 | | | December 31, 2012 | |
| Current deferred tax assets: | | | | | | | | |
| Property and equipment | | $ | 87,970 | | | $ | - | |
| Share-based compensation | | | 1,315,836 | | | | - | |
| Deferred compensation | | | 335,562 | | | | - | |
| Deferred rent | | | 9,040 | | | | - | |
| Net operating loss carryforwards | | | 1,057,135 | | | | 267,000 | |
| Total current deferred tax assets | | | 2,805,543 | | | | 267,000 | |
| Less: Valuation allowance | | | (2,489 | ) | | | (267,000 | ) |
| Net current deferred tax assets | | | 2,803,054 | | | | - | |
| | | | | | | | | |
| Current deferred tax liabilities: | | | | | | | | |
| Intangible amortization | | | (2,803,054 | ) | | | (268,160 | ) |
| Net current deferred tax liabilities | | | (2,803,054 | ) | | | (268,160 | ) |
| | | | | | | | | |
| Net current deferred tax assets (liabilities) | | $ | - | | | $ | (268,160 | ) |
| | | | | | | | | |
| Non-current deferred tax assets: | | | | | | | | |
| Property and equipment | | $ | 16,224 | | | $ | - | |
| Share-based compensation | | | 875,891 | | | | - | |
| Net operating loss carryforwards | | | 4,514,400 | | | | - | |
| Total non-current deferred tax assets | | | 5,406,515 | | | | - | |
| Less: Valuation allowance | | | (3,589,656 | ) | | | - | |
| Net non-current deferred tax assets | | | 1,816,859 | | | | - | |
| | | | | | | | | |
| Non-current deferred tax liabilities: | | | | | | | | |
| Intangible amortization | | | (1,816,859 | ) | | | (420,323 | ) |
| Property and equipment | | | - | | | | (8,777 | ) |
| Net non-current deferred tax liabilities | | | (1,816,859 | ) | | | (429,100 | ) |
| | | | | | | | | |
| Net non-current deferred tax assets (liabilities) | | $ | - | | | $ | (429,100 | ) |
The Company analyzed the recoverability of recorded deferred tax assets and established a valuation allowance of approximately $3.6 million. This represents a change in the valuation allowance of approximately $3.3 million.
As of December 31, 2013, the Company has a federal net operating loss carryover (“NOL”) of approximately $12.6 million. This NOL will expire in 2033.
The Company does not have any current income taxes payable or receivable and there have been no cash payments for income taxes.
Management believes there are no tax positions requiring recognition or disclosure under ASC Topic 740-10—Accounting for Uncertainty in Income Taxes.
The Company’s policy for recording interest and penalties associated with audits is to record such expenses as a component of income tax expense. There were no amounts accrued for interest or penalties for the year ended December 31, 2013 and the period from April 12, 2012 to December 31, 2012. Management is currently unaware of any issues under review that could result in significant payments, accruals or material deviations from its position.
LIQUID HOLDINGS GROUP, INC. AND SUBSIDIARIES
NOTES TO CONSOLIDATED FINANCIAL STATEMENTS
(12) Computation of Loss per Share
Basic loss per share (“LPS”) is computed by dividing net loss by the weighted average number of shares outstanding during the period. Diluted LPS is computed using the same method as basic LPS, however, the computation reflects the potential dilution that would occur if outstanding in-the-money share awards were exercised and converted into common shares.
| | | | | | Period from | |
| | | Year Ended | | | April 24, 2012 to | |
| | | December 31, 2013 | | | December 31, 2013 | |
| Net loss | | $ | (46,612,047 | ) | | $ | (38,245,864 | ) |
| Loss applicable to common shares | | $ | (46,612,047 | ) | | $ | (38,245,864 | ) |
| Weighted average common shares outstanding | | | 22,230,943 | | | | 15,517,444 | |
| Basic and diluted loss per common share | | $ | (2.10 | ) | | $ | (2.46 | ) |
The calculation of diluted LPS excludes the effect of RSUs and NQSOs because they were determined to be anti-dilutive and, therefore, diluted LPS is the same as basic LPS.
(13) Stockholders’ Equity
Expenses Paid by Founders and Employees
On January 9, 2013, one of the founders of the Company sold 43,577 common shares to a strategic partner of the Company for a purchase price of $300,000. The Company estimated the fair value of the common shares sold utilizing the market approach, which amounted to $338,102.
On January 15, 2013, one of the founders of the Company sold 90,786 common shares to a member of the Company’s Board of Directors for a purchase price of $375,000. The Company estimated the fair value of the common shares sold utilizing the market approach, which amounted to $702,622.
On February 28, 2013, two of the founders of the Company sold 18,193 common shares to a consultant for a purchase price of $100,000. The Company estimated the fair value of the common shares sold utilizing the market approach, which amounted to $140,250.
On March 12, 2013, two of the founders of the Company sold 46,096 common shares to a consultant for a purchase price of $250,000. The Company estimated the fair value of the common shares sold utilizing the market approach, which amounted to $350,626.
On May 1, 2013, the founders of the Company transferred 541,901 common shares to David Solimine and Orca Trading LLC as consideration for his previous commitment to the development and growth of the Company. The Company estimated the fair value of the common shares transferred utilizing the market approach, which amounted to $3,973,750.
On May 10, 2013, a founder of the Company transferred 191,616 common shares to another founder of the Company for no monetary consideration. The Company estimated the fair value of the common shares transferred utilizing the market approach, which amounted to $1,445,000.
On May 13, 2013, a founder of the Company sold 61,317 common shares to a consultant for a purchase price of $400,000. The Company estimated the fair value of the common shares sold utilizing the market approach, which amounted to $462,400.
LIQUID HOLDINGS GROUP, INC. AND SUBSIDIARIES
NOTES TO CONSOLIDATED FINANCIAL STATEMENTS
On May 14, 2013, a founder of the Company sold 766,466 common shares to Brian Storms, the Company’s CEO, for a purchase price of $5,000,000. The Company estimated the fair value of the common shares sold utilizing the market approach, which amounted to $5,780,000.
On May 14, 2013, a founder of the Company sold 47,904 common shares to a member of the Company’s Board of Directors for a purchase price of $312,500. The Company estimated the fair value of the common shares sold utilizing the market approach, which amounted to $361,250.
On May 14, 2013, a founder of the Company, Mr. Storms and three employees transferred 104,431 common shares to D&L Partners for no monetary consideration. The Company estimated the fair value of the common shares transferred utilizing the market approach, which amounted to $787,525.
On May 14, 2013, a founder of the Company sold 70,898 common shares to a consultant for a purchase price of $500,000. The Company estimated the fair value of the common shares sold utilizing the market approach, which amounted to $534,650.
On May 15, 2013, a founder of the Company sold 191,616 common shares to D&L Partners for a purchase price of $1,350,000. The Company estimated the fair value of the common shares sold utilizing the market approach, which amounted to $1,445,000.
On May 16, 2013, a founder of the Company sold 15,329 common shares to a consultant for a purchase price of $100,000. The Company estimated the fair value of the common shares sold utilizing the market approach, which amounted to $115,600.
On May 29, 2013, two of the founders of the Company transferred 95,808 common shares to a consultant for no monetary consideration. The Company estimated the fair value of the common shares transferred utilizing the market approach, which amounted to $722,500.
On June 20, 2013, a founder of the Company transferred 191,558 common shares to another founder of the Company for no monetary consideration. The Company estimated the fair value of the common shares transferred utilizing the market approach, which amounted to $1,445,000.
On June 24, 2013, two of the founders of the Company transferred 67,035 shares to a consultant for no monetary consideration. The Company estimated the fair value of the common shares transferred utilizing the market approach, which amounted to $505,750.
As a result of these below market sales, the Company recorded share-based compensation expense of approximately $10.4 million during the year ended December 31, 2013, representing the difference between the aggregate fair value and the purchase price.
The foregoing transactions were accounted for in accordance with ASC Paragraph 225-10-S99-4,Presentation, Income Statement—Accounting for Expenses or Liabilities Paid by Principal Stockholder(s) and ASC Paragraph 718-10-15-4, Compensation—Stock Compensation. This guidance provides that share-based payments awarded to an employee of the reporting entity by a related party or other holder of an economic interest in the entity as compensation for services provided to the entity are share-based payment transactions unless the transfer is clearly for a purpose other than compensation for services to the reporting entity. The substance of such a transaction is that the economic interest holder makes a capital contribution to the reporting entity, and the reporting entity makes a share-based payment to its employee in exchange for services rendered. As such, the value of the shares transferred by the founders and employees were reflected as an expense in the Company’s consolidated statements of operations and comprehensive loss with a corresponding credit to contributed capital.
Private Placements
During the year ended December 31, 2013, the Company executed subscription agreements with private investors in the aggregate amount of $3,300,000 in exchange for 394,098 common shares of the Company. The capital raised is being used for operations and to fund the Company’s working capital.
LIQUID HOLDINGS GROUP, INC. AND SUBSIDIARIES
NOTES TO CONSOLIDATED FINANCIAL STATEMENTS
On April 5, 2013, the Company issued to D&L Partners, LP (“D&L Partners”), an entity controlled by Douglas Von Allen, an additional 720,498 common shares of the Company in consideration of D&L Partners’ continued financial support and commitment to the development and growth of the Company. The Company estimated the fair value of the common shares issued utilizing the market approach, which amounted to approximately $5.3 million. The Company recorded a share-based payment charge of approximately $5.3 million during the year ended December 31, 2013 as a result of this transaction.
(14) Net Capital Requirement
Effective March 26, 2013, Futures changed its regulatory status from a non-clearing FCM to an introducing broker. This status change reduced the regulatory capital that Futures is required to maintain from $1,000,000 to $45,000.
Institutional must maintain regulatory net capital of at least €50,000 in accordance with Financial Conduct Authority regulations.
LPS is required to maintain a net capital of at least $100,000.
In the aggregate, the Company was required to maintain at least approximately $214,000 in net capital across all jurisdictions. Dividends or withdrawals of capital cannot be made if capital is needed to comply with regulatory minimum capital requirements.
Net capital balances and the amounts in excess of required net capital at December 31, 2013 and 2012 are as follows:
| | | December 31, 2013 | | | December 31, 2012 | |
| | | Net Capital | | | Excess Net
Capital | | | Net Capital | | | Excess Net
Capital | |
| Futures | | $ | 84,771 | | | $ | 39,771 | | | $ | 1,139,663 | | | $ | 139,663 | |
| Institutional | | $ | 204,451 | | | $ | 135,621 | | | $ | 200,297 | | | $ | 134,222 | |
| Prime | | $ | 291,791 | | | $ | 191,791 | | | $ | 798,941 | | | $ | 698,941 | |
(15) Supplementary Financial Information (Unaudited)
Effective September 30, 2013, the Company corrected the presentation of certain expenses in its consolidated statements of operations. After analyzing costs related to its software services business, it was determined that certain of these costs originally reported inCost of revenues,should have been reported in other expense line items.
These revisions were retroactively applied to the periods presented in the table below, which shows the individual line items as originally reported, the adjustments that were made, and their revised amounts:
LIQUID HOLDINGS GROUP, INC. AND SUBSIDIARIES
NOTES TO CONSOLIDATED FINANCIAL STATEMENTS
| | | Year Ended December 31, 2013 | |
| | | First | | | | | | First | | | Second | | | | | | Second | | | | | | | |
| | | Quarter | | | | | | Quarter | | | Quarter | | | | | | Quarter | | | Third | | | Fourth | |
| | | (as reported) | | | Adjustments | | | (as adjusted) | | | (as reported) | | | Adjustments | | | (as adjusted) | | | Quarter | | | Quarter | |
| | | | | | | | | | | | | | | | | | | | | | | | | |
| Cost of revenues, software services | | | 577,160 | | | | (293,120 | ) | | | 284,040 | | | | 648,307 | | | | (336,771 | ) | | | 311,536 | | | | 398,121 | | | | 459,104 | |
| Compensation | | | 2,087,456 | | | | (34,000 | ) | | | 2,053,456 | | | | 6,851,735 | | | | (42,000 | ) | | | 6,809,735 | | | | 6,065,772 | | | | 3,956,455 | |
| Consulting fees | | | 324,732 | | | | (503 | ) | | | 324,229 | | | | 11,630,299 | | | | 6,556 | | | | 11,636,855 | | | | 221,333 | | | | 544,695 | |
| Computer related and software development | | | 108,029 | | | | 327,623 | | | | 435,652 | | | | 223,293 | | | | 372,215 | | | | 595,508 | | | | 608,175 | | | | 833,204 | |
| | | Period from April 24, 2012 to December 31, 2012 | |
| | | | | | | | | Third | | | | | | Third | | | Fourth | | | | | | Fourth | |
| | | First | | | Second | | | Quarter | | | | | | Quarter | | | Quarter | | | | | | Quarter | |
| | | Quarter | | | Quarter | | | (as reported) | | | Adjustments | | | (as adjusted) | | | (as reported) | | | Adjustments | | | (as adjusted) | |
| | | | | | | | | | | | | | | | | | | | | | | | | |
| Cost of revenues, software services | | | - | | | | - | | | | 190,476 | | | | (75,182 | ) | | | 115,294 | | | | 499,714 | | | | (226,148 | ) | | | 273,566 | |
| Compensation | | | - | | | | 8,262,374 | | | | 352,665 | | | | (24,000 | ) | | | 328,665 | | | | 19,718,381 | | | | (24,000 | ) | | | 19,694,381 | |
| Professional fees | | | - | | | | 1,127,876 | | | | 218,185 | | | | - | | | | 218,185 | | | | 298,422 | | | | 6,749 | | | | 305,171 | |
| Computer related and software development | | | - | | | | 47,914 | | | | 25,408 | | | | 99,182 | | | | 124,590 | | | | (1,855 | ) | | | 243,399 | | | | 241,544 | |
The following table sets forth certain unaudited financial data for the Company’s quarterly operations in 2013 and 2012. The following information has been prepared on the same basis as the annual information presented elsewhere in this report and, in the opinion of management, includes all adjustments, consisting only of normal recurring adjustments, necessary for a fair presentation of the information for the quarterly periods presented. The operating results for any quarter are not necessarily indicative of results for any future period.
| | | Year Ended December 31, 2013 | |
| | | First | | | Second | | | Third | | | Fourth | | | Year to | |
| | | Quarter | | | Quarter | | | Quarter | | | Quarter | | | Date | |
| | | | | | | | | | | | | | | | |
| Total revenues | | $ | 1,762,464 | | | $ | 1,393,954 | | | $ | 732,388 | | | $ | 909,491 | | | $ | 4,798,297 | |
| Cost of revenues | | | 1,031,287 | | | | 812,481 | | | | 398,121 | | | | 459,104 | | | | 2,700,993 | |
| Gross profit | | | 731,177 | | | | 581,473 | | | | 334,267 | | | | 450,387 | | | | 2,097,304 | |
| Total operating expenses | | | 5,887,725 | | | | 22,350,995 | | | | 10,794,878 | | | | 9,783,825 | | | | 48,817,423 | |
| Loss from operations | | | (5,156,548 | ) | | | (21,769,522 | ) | | | (10,460,611 | ) | | | (9,333,438 | ) | | | (46,720,119 | ) |
| Total non-operating income (expense) | | | (24,742 | ) | | | (9,898 | ) | | | (478,650 | ) | | | (75,898 | ) | | | (589,188 | ) |
| Loss before income taxes | | | (5,181,290 | ) | | | (21,779,420 | ) | | | (10,939,261 | ) | | | (9,409,336 | ) | | | (47,309,307 | ) |
| Income tax expense (benefit) | | | (71,975 | ) | | | (112,231 | ) | | | 1,309,903 | | | | (1,822,957 | ) | | | (697,260 | ) |
| Net loss | | $ | (5,109,315 | ) | | $ | (21,667,189 | ) | | $ | (12,249,164 | ) | | $ | (7,586,379 | ) | | $ | (46,612,047 | ) |
| | | | | | | | | | | | | | | | | | | | | |
| Basic and diluted loss per share(1) | | $ | (0.26 | ) | | $ | (1.04 | ) | | $ | (0.52 | ) | | $ | (0.31 | ) | | $ | (2.10 | ) |
| | | Period from April 24, 2012 to December 31, 2012 | |
| | | First | | | Second | | | Third | | | Fourth | | | Year to | |
| | | Quarter | | | Quarter | | | Quarter | | | Quarter | | | Date | |
| | | | | | | | | | | | | | | | |
| Total revenues | | $ | - | | | $ | 163,551 | | | $ | 675,946 | | | $ | 1,488,285 | | | $ | 2,327,782 | |
| Cost of revenues | | | - | | | | 82,887 | | | | 267,283 | | | | 856,249 | | | | 1,206,419 | |
| Gross profit | | | - | | | | 80,664 | | | | 408,663 | | | | 632,036 | | | | 1,121,363 | |
| Total operating expenses | | | - | | | | 12,786,951 | | | | 3,537,042 | | | | 22,840,211 | | | | 39,164,204 | |
| Loss from operations | | | - | | | | (12,706,287 | ) | | | (3,128,379 | ) | | | (22,208,175 | ) | | | (38,042,841 | ) |
| Total non-operating income (expense) | | | - | | | | 10,719 | | | | 1,497,203 | | | | (1,815,285 | ) | | | (307,363 | ) |
| Loss before income taxes | | | - | | | | (12,695,568 | ) | | | (1,631,176 | ) | | | (24,023,460 | ) | | | (38,350,204 | ) |
| Income tax expense (benefit) | | | - | | | | (34,278 | ) | | | (4,404 | ) | | | (65,658 | ) | | | (104,340 | ) |
| Net loss | | $ | - | | | $ | (12,661,290 | ) | | $ | (1,626,772 | ) | | $ | (23,957,802 | ) | | $ | (38,245,864 | ) |
| | | | | | | | | | | | | | | | | | | | | |
| Basic and diluted loss per share(1) | | | | | | $ | (1.01 | ) | | $ | (0.11 | ) | | $ | (1.32 | ) | | $ | (2.46 | ) |
| (1) | Basic and diluted loss per share are computed independently for each of the quarters presented, therefore, the sum of quarterly basic and diluted loss per share information may not equal annual basic and diluted loss per share. |
LIQUID HOLDINGS GROUP, INC. AND SUBSIDIARIES
NOTES TO CONSOLIDATED FINANCIAL STATEMENTS
(16) Subsequent Events
The Company has evaluated subsequent events through the date the consolidated financial statements were issued and has determined that there are no subsequent events that require disclosure except for the following and those that have been disclosed elsewhere in these notes to the consolidated financial statements:
Merger of Liquid Prime Services, Inc. and Liquid Futures, LLC
On February 6, 2014, LPS and Futures entered into an Agreement and Plan of Merger to consolidate LPS and Futures into a single entity, with LPS remaining as the surviving entity. Regulatory approval was approved and the merger was effective February 12, 2014. This consolidation will enable LPS and Futures to streamline their regulatory costs and consolidate their net capital, permit its customers to sign a single account agreement to conduct both futures and securities trading and permit the consolidated entity to enter into a single clearing agreement to facilitate both futures and securities trades.
Revolving Promissory Notes
On February 26, 2014, the Company executed a Revolving Promissory Note with each of its two largest stockholders, Brian Ferdinand and Douglas J. Von Allmen (each, a “Note” and, collectively, the “Notes”). Under each Note, the Company is able to borrow, and the lender has committed to lend, up to a principal amount of $3,750,000 on a revolving basis ($7,500,000 in the aggregate under the Notes), with interest payable quarterly on any amounts borrowed at a rate of 4% per annum. Any amounts borrowed under the Notes are repayable at maturity on April 30, 2015 and are optionally repayable at any time without the payment of any premium or penalty. The Company will pay a commitment fee on any undrawn amounts at a rate per annum equal to 0.50%, payable quarterly. The Notes contain certain customary covenants, including covenants relating to the Company’s ability to incur indebtedness and make restricted payments, and provide for certain customary events of default. The Company may terminate the commitment under the Notes at any time.
Personal Guaranty Agreement
On March 6, 2014, Douglas J. Von Allmen executed a Personal Guaranty Agreement (the “Personal Guaranty”) with the Company whereby Mr. Von Allmen will guarantee the funding of loans pursuant to the $3,750,000 Note entered into between Brian Ferdinand and the Company (see above). If Mr. Ferdinand fails to pay any obligation when due, Mr. Von Allmen agrees to promptly pay the unpaid obligation to the Company based on the terms and conditions of the Note. In turn, Mr. Von Allmen shall take by subrogation all of Mr. Ferdinand’s rights under the Note with respect to any amounts funded by Mr. Von Allmen. As consideration for the Personal Guaranty, the Company agrees to pay Mr. Von Allmen a fee equal to 0.50% per annum on the guaranteed amount of $3,750,000.
Legal Matters
On March 11, 2014, the Company received a letter from counsel for a former employee claiming that the Company and certain other parties were responsible for paying the former employee stock compensation in the amount of $500,000 in consideration for services provided to one of the Company’s subsidiaries, Liquid Partners, LLC (then known as Centurion Capital Group, LLC). The time period when these purported services were provided is prior to both the Company’s acquisition of Liquid Partners, LLC as well as the actual period of the former employee’s employment by the Company. The Company believes that the claims alleged by this former employee are without merit and intends to defend such claims vigorously. In addition, the Company believes that it would be entitled to indemnification from the parties from whom the Company acquired its interests in Liquid Partners, LLC for any losses with respect to such former employee’s claims.