UNITED STATES
SECURITIES AND EXCHANGE COMMISSION
WASHINGTON, D.C. 20549
FORM N-CSR
CERTIFIED SHAREHOLDER REPORT OF REGISTERED MANAGEMENT
INVESTMENT COMPANIES
Investment Company Act file number 811-22771
Oppenheimer Global Real Estate Fund
(Exact name of registrant as specified in charter)
6803 South Tucson Way, Centennial, Colorado 80112-3924
(Address of principal executive offices) (Zip code)
Arthur S. Gabinet
OFI Global Asset Management, Inc.
225 Liberty Street, New York, New York 10281-1008
(Name and address of agent for service)
Registrant’s telephone number, including area code: (303) 768-3200
Date of fiscal year end: April 30
Date of reporting period: 4/30/2015
Item 1. Reports to Stockholders.

Oppenheimer
Global Real Estate
Fund
Table of Contents
Class A Shares
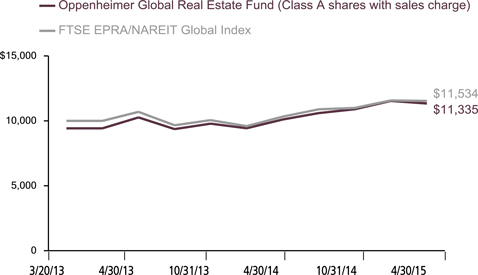
AVERAGE ANNUAL TOTAL RETURNS AT 4/30/15
| | | | | | |
| | | Class A Shares of the Fund | | |
| | | Without Sales Charge | | With Sales Charge | | FTSE EPRA/NAREIT
Global Index |
| | | |
1-Year | | 12.18% | | 5.73% | | 10.91% |
Since Inception (3/20/13) | | 9.13 | | 6.12 | | 7.07 |
Performance data quoted represents past performance, which does not guarantee future results. The investment return and principal value of an investment in the Fund will fluctuate so that an investor’s shares, when redeemed, may be worth more or less than their original cost. Fund returns include changes in share price, reinvested distributions, and a 5.75% maximum applicable sales charge except where “without sales charge” is indicated. Current performance may be lower or higher than the performance quoted. Returns do not consider capital gains or income taxes on an individual’s investment. For performance data current to the most recent month-end, visit oppenheimerfunds.com or call 1.800.CALL OPP (225.5677).
2 OPPENHEIMER GLOBAL REAL ESTATE FUND
Fund Performance Discussion
The Fund’s Class A shares (without sales charges) produced a 12.18% total return, with the Fund continuing to post solid gains across most real estate market sectors in an improving global economic environment. We attribute the Fund’s positive absolute performance to a period of strong growth and recovery in the U.S. and the U.K., which were supported by macroeconomic factors and the capital markets as well as a “lower for longer” theme regarding global interest rates.
We are pleased that the Fund’s Class A shares (without sales charge) outperformed its benchmark, the FTSE EPRA/NAREIT Global Index (“the Index”), which produced a 10.91% return for the same period. On a country basis, the Fund’s relative outperformance can be attributed to its weightings in the U.S., Japan and by its limited exposure to Latin American emerging markets. On a sector basis, the Fund’s strongest relative gains stemmed from our superior stock selection within the apartment, storage and lodging sectors, and a lack of exposure to the underperforming free-standing, triple net lease area in the U.S.
COMPARISON OF CHANGE IN VALUE OF $10,000 HYPOTHETICAL INVESTMENTS IN:
3 OPPENHEIMER GLOBAL REAL ESTATE FUND
MARKET OVERVIEW
When the reporting period began, the U.S. economy was in what is commonly referred to as a “Goldilocks” period, where solid, cyclical growth is accompanied by low interest rates and low inflation. Throughout the reporting period, the U.S. economy continued to grow in excess of 2% on average, pointing to a slow, but steady recovery.
However, early on, the reporting period was marked by a fair amount of volatility, as severe weather patterns began to wreak havoc in the U.S. The difficult winters – both in 2014 and 2015 – halted construction activities, which, in turn, dampened the building of new homes. Individuals were less likely to shop for single-family homes or condominiums in such treacherous weather conditions. A multitude of areas within the real estate industry were impacted during this time, including realtors, mortgage brokers and retail furniture sales. Fortunately, the pent-up demand during the winter months was eased as the weather improved and the real estate market returned to its more normal state.
One of the highlights of the reporting period was the fact that employment growth in the U.S. remained strong. This helped create demand for housing, with clear increases in household formations and a surge in demand within the apartment sector, most notably from the age cohorts who have the largest propensity to rent – the 20 to 35 year-old population. These positive employment figures also helped drive demand for autos and retail merchandise, all encouraging factors for the Fund.
In Europe, the U.K. continued its path toward economic recovery, with improving overall fundamentals, a strong real estate cycle, particularly in London, and an overall recovery story that was similar to the U.S. One of the major events of the reporting period has been the announcement of quantitative easing (“QE”) in Europe by the European Central Bank (the “ECB”) led by president Mario Draghi. This easing package has been incredibly supportive for the real estate market, pushing down interest rates.
Another major event this reporting period was enacted by the Swiss National Bank, which, in essence, reduced the spread between the Swiss franc and the euro, resulting in volatility for the currency markets. The end result has been that the volatility in currencies has positively influenced Fund performance, much more so than in previous years.
In Asia, which has struggled for some time now, particularly Japan, there is still hand-wringing over whether the “Abenomics” measures under the leadership of Prime Minister Shinzo Abe will ultimately prove futile. However, a bright note has been that the quantitative easing program has depreciated the yen, which, in turn, has spurred an increase in tourism from China. We were able to capitalize on this trend
4 OPPENHEIMER GLOBAL REAL ESTATE FUND
based on increased hotel occupancy and retail tourism spending.
FUND REVIEW
The Fund’s strongest gains for the 12-month reporting period were achieved from our holdings in the U.S. Here, we attempted to capitalize on the “growth theme” occurring in the U.S, with the recovering economy, continued economic expansion and low interest rates – all factors that helped spur real estate investment trust (“REIT”) stocks within the U.S. sleeve of the portfolio. Within that theme, and employing our top-down approach, we identified markets that we believed possessed the most favorable drivers and invested there. Accordingly, the Fund benefited most from its U.S. holdings in the apartment and storage sectors, while the lodging sector produced more mixed results. We also gained traction from our underweight to the free-standing, triple net lease sector, primarily by avoiding American Realty Capital, which encountered difficulties during the reporting period.
Within the apartment sector, holdings with a West Coast exposure scored especially strong gains, particularly those within the San Francisco area where we’ve witnessed an increase in household formations, a limited supply, and its inhabitants are highly compensated individuals. We continue to see a strong job market in the West Coast area, particularly for recent college graduates entering the technology industry. In these high-barrier regions, the spread
between the price of renting and the price of owning is significant. Besides, many young people prefer to rent because it allows them the flexibility to move should their employer offer them a relocation option. The Fund’s best performer within this area was Essex Property Trust, Inc.
The self-storage sector, which often benefits from its natural correlation with the apartment sector, also enjoyed solid gains from its West Coast exposure. In addition, performance was driven by favorable supply and demand dynamics and the ability to implement a new pricing structure based on such strong demand. For some time now, the self-storage sector has had a restrained supply of new facilities, largely because development rights and construction financing are difficult to obtain. At the same time, demand for self-storage has remained strong, especially in the urban metro areas – particularly those located in parts of the country that are near the technology industries. These individuals are favoring housing that is closer to their jobs, restaurants and night life. In many cases, the square footage of these newer, trendy developments is reduced, further fueling the need for storage space. The limited supply of new development coupled with the strong demand has resulted in a very positive market environment for self-storage companies. With such strong demand, many self-storage companies may be able to insist on longer-term contracts, which would enhance their ability to raise rents, augment their occupancies and result in more predictable streams of income. The Fund’s strongest
5 OPPENHEIMER GLOBAL REAL ESTATE FUND
gains in this area were achieved by Extra Space Storage, Inc. and CubeSmart. In both cases, the companies have expanded their existing portfolios through acquisitions.
Returns within the lodging sector were positive, albeit less stellar than the apartment and storage sectors. Here, Chesapeake Lodging Trust and FelCor Lodging Trust, Inc. benefited from short-term overnight leases and occupancy gains in an expanding economic environment.
After the U.S., Japan was the next largest driver of Fund performance during the reporting period, where a large chunk of those gains stemmed from one large holding, Invincible Investment Corp., a residential and office holding. The stock benefited from the yen depreciation, which has spurred tourism in Japan, particularly from China. Otherwise in Japan, the Fund scored successes from a basketful of names, including Mitsubishi Estate Co. Ltd., Daiwa House Industry Co. Ltd., Fujita Kanko, Inc, and Mitsui Fudosan Co. Ltd.
In the emerging markets, the Fund was able to benefit from its limited exposure to Latin America, most notably Brazil and Mexico, where the property markets did not perform well for the totality of the year.
In continental Europe, we focused on value stories, companies that had strong rentals, with modest amounts of growth and attractive valuations. In fact, we chose to avoid most sectors and instead
maintained a concentration within the high-quality retail sector, a true testament to our superior stock selection strategy. Unibail-Rodamco SE and Klépierre, two French holdings, benefited greatly following the QE announcement by ECB President Draghi. By contrast, in the U.K. we were looking for unique growth opportunities, particularly in London, a traditional stronghold for investors and where we focused on the office sector, including Great Portland Estates plc. In addition, we were able to generate excess return from our exposure to Unite Group plc, a student housing company in the U.K.
On the other hand, detractors to the Fund included an underweight to China, which performed well toward the end of the reporting period and our stock selection in Hong Kong, where a handful of retail and office companies witnessed a fairly quick erosion of their strong fundamentals. In Germany, we favored office stocks early in the reporting period but switched to residential companies based on their favorable underlying fundamentals. Our minimal exposure to residential companies prior to increasing our exposure there detracted from performance, as they performed well.
STRATEGY & OUTLOOK
As of the end of the reporting period, we are positioning the Fund for accelerating economic growth in the second half of 2015. In our view, despite the somewhat weak start earlier in the year, we believe the U.S. economy may be poised to benefit from
6 OPPENHEIMER GLOBAL REAL ESTATE FUND
projected GDP growth at around 3%, continued job growth, and a possible rising interest rate environment. We are hopeful that this projected economic growth will be accompanied by meaningful wage growth as well.
Based on these views, as of April 30, 2015, we remain overweight in the apartment, self-storage, office and lodging sectors. By contrast, we remain underweight in those areas that we consider more defensive, sectors that typically lag during periods of accelerating economic growth and also tend to encounter heightened sensitivity in a rising interest rate environment. Accordingly, we remain underweight in the net lease and health care sectors.
| | |
 | | 
David Wharmby, CFA Portfolio Manager |
In other parts of the world, we are considering increasing our growth exposure in Europe, under certain conditions, specifically if the momentum in continental Europe continues. In Hong Kong, we have rotated our exposures to acquire a larger presence in the office sector. We plan to maintain our weighting in Japan and seek to generate excess return through pure stock selection there. Given the policy-driven differences in economies throughout large parts of Asia, we believe a focus on stock selection and a less aggressive effort at maintaining country weights makes more prudent investment sense.
| | |

| | 
Henry Burgers, CFA Portfolio Manager |
The Portfolio Managers are employed by the Fund’s Sub-Sub-Adviser, Cornerstone Real Estate Advisers LLC. The opinions of the Portfolio Managers do not necessarily reflect the opinions of OppenheimerFunds.
7 OPPENHEIMER GLOBAL REAL ESTATE FUND
Top Holdings and Allocations
| | | | |
TOP TEN COMMON STOCK HOLDINGS | | | | |
| Simon Property Group, Inc. | | | 5 .7 | % |
| Equity Residential | | | 4 .3 | |
| Mitsui Fudosan Co. Ltd. | | | 4 .1 | |
| Westfield Corp. | | | 3 .6 | |
| Essex Property Trust, Inc. | | | 3 .4 | |
| Health Care REIT, Inc. | | | 3 .2 | |
| Unibail-Rodamco SE | | | 2 .9 | |
| AvalonBay Communities, Inc. | | | 2 .8 | |
| Extra Space Storage, Inc. | | | 2 .6 | |
| Ventas, Inc. | | | 2 .6 | |
Portfolio holdings and allocations are subject to change. Percentages are as of April 30, 2015, and are based on net assets. For more current Fund holdings, please visit oppenheimerfunds.com.
| | | | |
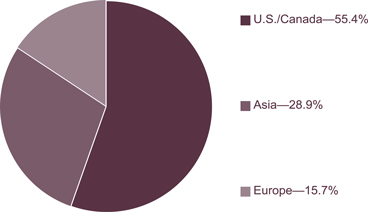
TOP TEN GEOGRAPHICAL HOLDINGS | | | | |
| United States | | | 54 .4 | % |
| Japan | | | 12 .6 | |
| United Kingdom | | | 8 .6 | |
| Hong Kong | | | 6 .6 | |
| Australia | | | 5 .7 | |
| France | | | 4 .3 | |
| Singapore | | | 3 .9 | |
| Netherlands | | | 1 .3 | |
| Canada | | | 1 .0 | |
| Germany | | | 0 .9 | |
Portfolio holdings and allocation are subject to change. Percentages are as of April 30, 2015, and are based on total market value of investments.
REGIONAL ALLOCATION
Portfolio holdings and allocations are subject to change. Percentages are as of April 30, 2015, and are based on the total market value of investments.
8 OPPENHEIMER GLOBAL REAL ESTATE FUND
Share Class Performance
AVERAGE ANNUAL TOTAL RETURNS WITHOUT SALES CHARGE AS OF 4/30/15
| | | | | | | | | | |
| | | Inception Date | | | 1-Year | | | Since Inception |
Class A (OGRAX) | | | 3/20/13 | | | | 12.18% | | | 9.13% |
Class C (OGRCX) | | | 3/20/13 | | | | 11.32% | | | 8.26% |
Class I (OIRGX) | | | 3/20/13 | | | | 12.68% | | | 9.58% |
Class R (OGRNX) | | | 3/20/13 | | | | 11.87% | | | 8.80% |
Class Y (OGRYX) | | | 3/20/13 | | | | 12.62% | | | 9.52% |
AVERAGE ANNUAL TOTAL RETURNS WITH SALES CHARGE AS OF 4/30/15
| | | | | | | | | | |
| | | Inception Date | | | 1-Year | | | Since Inception |
Class A (OGRAX) | | | 3/20/13 | | | | 5.73% | | | 6.12% |
Class C (OGRCX) | | | 3/20/13 | | | | 10.32% | | | 8.26% |
Class I (OIRGX) | | | 3/20/13 | | | | 12.68% | | | 9.58% |
Class R (OGRNX) | | | 3/20/13 | | | | 10.87% | | | 8.80% |
Class Y (OGRYX) | | | 3/20/13 | | | | 12.62% | | | 9.52% |
Performance data quoted represents past performance, which does not guarantee future results. The investment return and principal value of an investment in the Fund will fluctuate so that an investor’s shares, when redeemed, may be worth more or less than their original cost. Current performance may be lower or higher than the performance quoted. Returns do not consider capital gains or income taxes on an individual’s investment. For performance data current to the most recent month-end, visit oppenheimerfunds.com or call 1.800.CALL OPP (225.5677). Fund returns include changes in share price, reinvested distributions, and the applicable sales charge: for Class A shares, the current maximum initial sales charge of 5.75% and for Class C shares, the contingent deferred sales charge (“CDSC”) of 1% for the 1-year period. Prior to 7/1/14, Class R shares were named Class N shares. Beginning 7/1/14, new purchases of Class R shares will no longer be subject to a CDSC upon redemption (any CDSC will remain in effect for purchases prior to 7/1/14). There is no sales charge for Class I and Y shares.
The Fund’s performance is compared to the performance of the FTSE EPRA/NAREIT Global Index. The FTSE EPRA/NAREIT Global Real Estate Index is a stock market index managed by the European Public Real Estate Association and the National Association of Real Estate Investment Trusts and maintained by the Financial Times Index Group (FTSE). It is composed of property company constituents that trade on several global exchanges and designed to represent general trends in eligible listed real estate stocks worldwide. The Index is unmanaged and cannot be purchased directly by investors. While index comparisons may be useful to provide a benchmark for the Fund’s performance, it must be noted that the Fund’s investments are not limited to the investments comprising the Index. Index performance includes reinvestment of income, but does not reflect transaction costs, fees, expenses or taxes. Index performance is shown for illustrative purposes only as a benchmark for the Fund’s performance, and does not predict or depict performance of the Fund. The Fund’s performance reflects the effects of the Fund’s business and operating expenses.
9 OPPENHEIMER GLOBAL REAL ESTATE FUND
The Fund’s investment strategy and focus can change over time. The mention of specific fund holdings does not constitute a recommendation by OppenheimerFunds, Inc. or its affiliates.
Before investing in any of the Oppenheimer funds, investors should carefully consider a fund’s investment objectives, risks, charges and expenses. Fund prospectuses and summary prospectuses contain this and other information about the funds, and may be obtained by asking your financial advisor, visiting oppenheimerfunds.com, or calling 1.800.CALL OPP (225.5677). Read prospectuses and summary prospectuses carefully before investing.
Shares of Oppenheimer funds are not deposits or obligations of any bank, are not guaranteed by any bank, are not insured by the FDIC or any other agency, and involve investment risks, including the possible loss of the principal amount invested.
10 OPPENHEIMER GLOBAL REAL ESTATE FUND
Fund Expenses
Fund Expenses. As a shareholder of the Fund, you incur two types of costs: (1) transaction costs, which may include sales charges (loads) on purchase payments and/or contingent deferred sales charges on redemptions; and (2) ongoing costs, including management fees; distribution and service fees; and other Fund expenses. These examples are intended to help you understand your ongoing costs (in dollars) of investing in the Fund and to compare these costs with the ongoing costs of investing in other mutual funds.
The examples are based on an investment of $1,000.00 invested at the beginning of the period and held for the entire 6-month period ended April 30, 2015.
Actual Expenses. The first section of the table provides information about actual account values and actual expenses. You may use the information in this section for the class of shares you hold, together with the amount you invested, to estimate the expense that you paid over the period. Simply divide your account value by $1,000.00 (for example, an $8,600.00 account value divided by $1,000.00 = 8.60), then multiply the result by the number in the first section under the heading entitled “Expenses Paid During 6 Months Ended April 30, 2015” to estimate the expenses you paid on your account during this period.
Hypothetical Example for Comparison Purposes. The second section of the table provides information about hypothetical account values and hypothetical expenses based on the Fund’s actual expense ratio for each class of shares, and an assumed rate of return of 5% per year for each class before expenses, which is not the Fund’s actual return. The hypothetical account values and expenses may not be used to estimate the actual ending account balance or expenses you paid for the period. You may use this information to compare the ongoing costs of investing in the Fund and other funds. To do so, compare this 5% hypothetical example for the class of shares you hold with the 5% hypothetical examples that appear in the shareholder reports of the other funds.
Please note that the expenses shown in the table are meant to highlight your ongoing costs only and do not reflect any transactional costs, such as front-end or contingent deferred sales charges (loads). Therefore, the “hypothetical” section of the table is useful in comparing ongoing costs only, and will not help you determine the relative total costs of owning different funds. In addition, if these transactional costs were included, your costs would have been higher.
11 OPPENHEIMER GLOBAL REAL ESTATE FUND
| | | | | | | | | | | | |
| Actual | | Beginning
Account Value
November 1, 2014 | | Ending
Account Value
April 30, 2015 | | Expenses
Paid During
6 Months Ended
April 30, 2015 |
Class A | | $ | | 1,000.00 | | $ | | 1,040.50 | | $ | | 7.31 |
Class C | | | | 1,000.00 | | | | 1,035.60 | | | | 11.32 |
Class I | | | | 1,000.00 | | | | 1,042.30 | | | | 5.28 |
Class R | | | | 1,000.00 | | | | 1,038.40 | | | | 8.78 |
Class Y | | | | 1,000.00 | | | | 1,042.00 | | | | 5.53 |
| | | | | | |
| Hypothetical | | | | | | | | | | | | |
(5% return before expenses) | | | | | | | | | | | | |
Class A | | | | 1,000.00 | | | | 1,017.65 | | | | 7.23 |
Class C | | | | 1,000.00 | | | | 1,013.74 | | | | 11.20 |
Class I | | | | 1,000.00 | | | | 1,019.64 | | | | 5.22 |
Class R | | | | 1,000.00 | | | | 1,016.22 | | | | 8.69 |
Class Y | | | | 1,000.00 | | | | 1,019.39 | | | | 5.47 |
Expenses are equal to the Fund’s annualized expense ratio for that class, multiplied by the average account value over the period, multiplied by 181/365 (to reflect the one-half year period). Those annualized expense ratios, excluding indirect expenses from affiliated funds, based on the 6-month period ended April 30, 2015 are as follows:
| | | | |
| Class | | Expense Ratios | |
Class A | | | 1.44 | % |
Class C | | | 2.23 | |
Class I | | | 1.04 | |
Class R | | | 1.73 | |
Class Y | | | 1.09 | |
The expense ratios reflect voluntary and/or contractual waivers and/or reimbursements of expenses by the Fund’s Manager and Transfer Agent. Some of these undertakings may be modified or terminated at any time, as indicated in the Fund’s prospectus. The “Financial Highlights” tables in the Fund’s financial statements, included in this report, also show the gross expense ratios, without such waivers or reimbursements and reduction to custodian expenses, if applicable.
12 OPPENHEIMER GLOBAL REAL ESTATE FUND
STATEMENT OF INVESTMENTS April 30, 2015
| | | | | | | | | | |
| | | |
| | | Shares | | | Value | | | |
Common Stocks—98.5% | | | | | | | | | | |
| Consumer Discretionary—0.9% | | | | | | | | | | |
Hotels, Restaurants &
Leisure—0.9% | | | | | | | | | | |
| Fujita Kanko, Inc. | | | 429,000 | $ | | | 1,690,521 | | | |
| Financials—97.6% | | | | | | | | | | |
| Real Estate Investment Trusts (REITs)—75.6% | | | | | | | | | | |
| Diversified REITs—2.4% | | | | | | | | | | |
| Canadian Real Estate Investment Trust | | | 27,207 | | | | 1,028,521 | | | |
| Land Securities Group plc | | | 175,570 | | | | 3,358,434 | | | |
| | | | | | | | 4,386,955 | | | |
| Health Care REITs—7.1% | | | | | | | | | | |
| Health Care REIT, Inc. | | | 81,200 | | | | 5,848,024 | | | |
| Physicians Realty Trust | | | 82,970 | | | | 1,377,302 | | | |
| Sabra Health Care REIT, Inc. | | | 31,270 | | | | 934,348 | | | |
| Ventas, Inc. | | | 69,210 | | | | 4,768,569 | | | |
| | | | | | | | 12,928,243 | | | |
| Hotel & Resort REITs—5.5% | | | | | | | | | | |
| Chatham Lodging Trust | | | 42,830 | | | | 1,183,821 | | | |
| Chesapeake Lodging Trust | | | 95,940 | | | | 3,046,095 | | | |
| FelCor Lodging Trust, Inc. | | | 255,380 | | | | 2,837,272 | | | |
| Host Hotels & Resorts, Inc. | | | 57,121 | | | | 1,150,417 | | | |
| LaSalle Hotel Properties | | | 53,300 | | | | 1,955,577 | | | |
| | | | | | | | 10,173,182 | | | |
| Industrial REITs—3.8% | | | | | | | | | | |
| First Industrial Realty Trust, Inc. | | | 83,040 | | | | 1,638,379 | | | |
| Goodman Group | | | 411,400 | | | | 2,026,160 | | | |
| Prologis, Inc. | | | 80,340 | | | | 3,229,668 | | | |
| | | | | | | | 6,894,207 | | | |
| Office REITs—14.0% | | | | | | | | | | |
| Alexandria Real Estate Equities, Inc. | | | 15,930 | | | | 1,471,614 | | | |
| Boston Properties, Inc. | | | 33,000 | | | | 4,366,230 | | | |
| Derwent London plc | | | 49,890 | | | | 2,629,513 | | | |
| Dexus Property Group | | | 293,500 | | | | 1,707,485 | | | |
| Gramercy Property Trust, Inc. | | | 68,792 | | | | 1,880,773 | | | |
| Great Portland Estates plc | | | 217,610 | | | | 2,660,554 | | | |
| Highwoods Properties, Inc. | | | 71,280 | | | | 3,067,891 | | | |
| Kilroy Realty Corp. | | | 43,010 | | | | 3,053,280 | | | |
| | | | | | | | |
| | |
| | | Shares | | | Value | |
| Office REITs (Continued) | | | | | | | | |
| Paramount Group, Inc. | | | 72,610 | $ | | | 1,330,215 | |
| Vornado Realty Trust | | | 33,280 | | | | 3,444,147 | |
| | | | | | | | 25,611,702 | |
| Residential REITs—11.4% | | | | | | | | |
| AvalonBay Communities, Inc. | | | 31,156 | | | | 5,120,177 | |
| Equity Residential | | | 106,080 | | | | 7,835,069 | |
| Essex Property Trust, Inc. | | | 28,120 | | | | 6,241,234 | |
| Invincible Investment Corp. | | | 3,386 | | | | 1,767,414 | |
| | | | | | | | 20,963,894 | |
| Retail REITs—27.2% | | | | | | | | |
| Acadia Realty Trust | | | 96,230 | | | | 2,973,507 | |
| CapitaMall Trust | | | 841,000 | | | | 1,388,193 | |
| Eurocommercial Properties NV | | | 28,667 | | | | 1,306,184 | |
| Fortune Real Estate Investment Trust | | | 1,156,000 | | | | 1,190,535 | |
| General Growth Properties, Inc. | | | 115,350 | | | | 3,160,590 | |
| Hammerson plc | | | 220,530 | | | | 2,260,962 | |
| Japan Retail Fund Investment Corp. | | | 712 | | | | 1,513,182 | |
| Klepierre | | | 50,470 | | | | 2,448,656 | |
| Link REIT (The) | | | 209,000 | | | | 1,296,316 | |
| Morguard Real Estate Investment Trust | | | 58,289 | | | | 836,772 | |
| National Retail Properties, Inc. | | | 27,410 | | | | 1,052,544 | |
| Ramco-Gershenson Properties Trust | | | 84,230 | | | | 1,472,340 | |
| Regency Centers Corp. | | | 56,390 | | | | 3,540,164 | |
| Simon Property Group, Inc. | | | 57,150 | | | | 10,372,154 | |
| Tanger Factory Outlet Centers, Inc. | | | 61,950 | | | | 2,080,281 | |
| Unibail-Rodamco SE | | | 19,390 | | | | 5,325,633 | |
| Vastned Retail NV | | | 19,376 | | | | 946,649 | |
| Westfield Corp. | | | 883,861 | | | | 6,576,136 | |
| | | | | | | | 49,740,798 | |
| Specialized REITs—4.2% | | | | | | | | |
| CubeSmart | | | 121,200 | | | | 2,796,084 | |
| Extra Space Storage, Inc. | | | 73,520 | | | | 4,847,174 | |
| | | | | | | 7,643,258 | |
| | | | | | | 138,342,239 | |
13 OPPENHEIMER GLOBAL REAL ESTATE FUND
STATEMENTOFINVESTMENTS Continued
| | | | | | | | | | |
| | | |
| | | Shares | | | Value | | | |
| Real Estate Management & Development—22.0% | | | |
| Diversified Real Estate Activities—15.3% | | | |
| CapitaLand Ltd. | | | 965,000 | $ | | | 2,685,934 | | | |
| Daiwa House Industry Co. Ltd. | | | 119,000 | | | | 2,649,203 | | | |
| Hang Lung Properties Ltd. | | | 629,000 | | | | 2,122,001 | | | |
| Mitsubishi Estate Co. Ltd. | | | 162,300 | | | | 3,815,371 | | | |
| Mitsui Fudosan Co. Ltd. | | | 253,000 | | | | 7,494,898 | | | |
| Sumitomo Realty & Development Co. Ltd. | | | 99,700 | | | | 3,850,922 | | | |
| Sun Hung Kai Properties Ltd. | | | 273,000 | | | | 4,545,545 | | | |
| Wharf Holdings Ltd. (The) | | | 102,000 | | | | 738,527 | | | |
| | | | | | | 27,902,401 | | | |
| Real Estate Development—1.5% | | | |
| Helical Bar plc | | | 225,401 | | | | 1,348,870 | | | |
| St. Modwen Properties plc | | | 218,970 | | | | 1,461,006 | | | |
| | | | | | | | | | |
| | | | | | | 2,809,876 | | | |
| | | | | | | | |
| | |
| | | Shares | | | Value | |
| Real Estate Operating Companies—5.2% | |
| Deutsche Annington Immobilien SE | | | 46,415 | $ | | | 1,570,462 | |
| Global Logistic Properties Ltd. | | | 1,462,000 | | | | 3,025,678 | |
| Hufvudstaden AB, Cl. A | | | 84,061 | | | | 1,164,335 | |
| Swire Properties Ltd. | | | 586,600 | | | | 2,018,395 | |
| Unite Group plc (The) | | | 192,990 | | | | 1,771,397 | |
| | | | | | | 9,550,267 | |
| | | | | | | 40,262,544 | |
| Total Investments, at Value | | | | | | | | |
| (Cost $162,411,436) | | | 98.5% | | | | 180,295,304 | |
| Net Other Assets | | | | | | | | |
| (Liabilities) | | | 1.5 | | | | 2,788,865 | |
| Net Assets | | | 100.0% | $ | | | 183,084,169 | |
| | | | | | | | |
Footnotes to Statement of Investments
Distribution of investments representing geographic holdings, as a percentage of total investments at value, is as follows:
| | | | | | | | | | |
| Geographic Holdings | | Value | | | Percent | | | |
United States | | $ | 98,074,939 | | | | 54.4 | % | | |
Japan | | | 22,781,513 | | | | 12.6 | | | |
United Kingdom | | | 15,490,734 | | | | 8.6 | | | |
Hong Kong | | | 11,911,319 | | | | 6.6 | | | |
Australia | | | 10,309,781 | | | | 5.7 | | | |
France | | | 7,774,289 | | | | 4.3 | | | |
Singapore | | | 7,099,805 | | | | 3.9 | | | |
Netherlands | | | 2,252,833 | | | | 1.3 | | | |
Canada | | | 1,865,294 | | | | 1.0 | | | |
Germany | | | 1,570,462 | | | | 0.9 | | | |
Sweden | | | 1,164,335 | | | | 0.7 | | | |
| | | |
Total | | $ | 180,295,304 | | | | 100.0 | % | | |
| | | |
See accompanying Notes to Financial Statements.
14 OPPENHEIMER GLOBAL REAL ESTATE FUND
STATEMENT OF ASSETS AND LIABILITIES April 30, 2015
| | | | |
Assets | | | | |
Investments, at value (cost $162,411,436)—see accompanying statement of investments | | $ | 180,295,304 | |
Cash | | | 1,908,141 | |
| Receivables and other assets: | | | | |
| Investments sold | | | 1,091,803 | |
| Dividends | | | 276,869 | |
| Shares of beneficial interest sold | | | 230,118 | |
| Other | | | 7,424 | |
| | | | |
| Total assets | | | 183,809,659 | |
| | | | | |
Liabilities | | | | |
| Payables and other liabilities: | | | | |
| Investments purchased | | | 500,485 | |
| Shares of beneficial interest redeemed | | | 184,034 | |
| Distribution and service plan fees | | | 3,890 | |
| Shareholder communications | | | 3,129 | |
| Trustees’ compensation | | | 1,701 | |
| Other | | | 32,251 | |
| | | | |
| Total liabilities | | | 725,490 | |
| | | | |
Net Assets | | $ | 183,084,169 | |
| | | | |
| | | | |
| | | | |
Composition of Net Assets | | | | |
Par value of shares of beneficial interest | | $ | 16,124 | |
Additional paid-in capital | | | 165,606,992 | |
Accumulated net investment income | | | 295,710 | |
Accumulated net realized loss on investments and foreign currency transactions | | | (718,816) | |
| Net unrealized appreciation on investments and translation of assets and liabilities denominated in foreign currencies | | | 17,884,159 | |
| | | | |
Net Assets | | $ | 183,084,169 | |
| | | | |
| | | | |
15 OPPENHEIMER GLOBAL REAL ESTATE FUND
STATEMENT OF ASSETS AND LIABILITIES Continued
| | | | |
Net Asset Value Per Share | | | | |
Class A Shares: | | | | |
Net asset value and redemption price per share (based on net assets of $15,026,813 and 1,324,810 shares of beneficial interest outstanding) | | $ | 11.34 | |
Maximum offering price per share (net asset value plus sales charge of 5.75% of offering price) | | $ | 12.03 | |
Class C Shares: | | | | |
Net asset value, redemption price (excludes applicable contingent deferred sales charge) and offering price per share (based on net assets of $4,187,898 and 370,868 shares of beneficial interest outstanding) | | $ | 11.29 | |
Class I Shares: | | | | |
Net asset value, redemption price and offering price per share (based on net assets of $162,492,918 and 14,306,782 shares of beneficial interest outstanding) | | $ | 11.36 | |
Class R Shares: | | | | |
Net asset value, redemption price (excludes applicable contingent deferred sales charge) and offering price per share (based on net assets of $907,212 and 80,143 shares of beneficial interest outstanding) | | $ | 11.32 | |
Class Y Shares: | | | | |
Net asset value, redemption price and offering price per share (based on net assets of $469,328 and 41,312 shares of beneficial interest outstanding) | | $ | 11.36 | |
See accompanying Notes to Financial Statements.
16 OPPENHEIMER GLOBAL REAL ESTATE FUND
STATEMENT OF OPERATIONS For the Year Ended April 30, 2015
| | | | |
Investment Income | | | | |
Dividends (net of foreign withholding taxes of $169,909) | | $ | 4,187,110 | |
Expenses | | | | |
Management fees | | | 1,656,885 | |
| Distribution and service plan fees: | | | | |
| Class A | | | 20,832 | |
| Class C | | | 21,470 | |
Class R | | | 2,082 | |
| Transfer and shareholder servicing agent fees: | | | | |
| Class A | | | 18,901 | |
| Class C | | | 4,728 | |
| Class I | | | 46,187 | |
| Class R1 | | | 931 | |
Class Y | | | 1,248 | |
| Shareholder communications: | | | | |
| Class A | | | 13,620 | |
| Class C | | | 5,818 | |
| Class I | | | 303 | |
| Class R1 | | | 1,283 | |
Class Y | | | 788 | |
Custodian fees and expenses | | | 9,438 | |
Trustees’ compensation | | | 2,555 | |
| Other | | | 55,406 | |
| Total expenses | | | 1,862,475 | |
| Less waivers and reimbursements of expenses | | | (59,343) | |
Net expenses | | | 1,803,132 | |
Net Investment Income | | | 2,383,978 | |
| Realized and Unrealized Gain (Loss) | | | | |
| Net realized gain on: | | | | |
| Investments | | | 7,085,737 | |
| Foreign currency transactions | | | 560 | |
Net realized gain | | | 7,086,297 | |
| Net change in unrealized appreciation/depreciation on: | | | | |
| Investments | | | 15,739,863 | |
| Translation of assets and liabilities denominated in foreign currencies | | | (6,112,499) | |
Net change in unrealized appreciation/depreciation | | | 9,627,364 | |
Net Increase in Net Assets Resulting from Operations | | $ | 19,097,639 | |
| | | | |
1. Effective July 1, 2014, Class N shares were renamed Class R. See Note 1 of the accompanying Notes.
See accompanying Notes to Financial Statements.
17 OPPENHEIMER GLOBAL REAL ESTATE FUND
STATEMENTS OF CHANGES IN NET ASSETS
| | | | | | | | | | |
| | | Year Ended
April 30, 2015 | | | | | Year Ended
April 30, 2014 | |
Operations | | | | | | | | | | |
Net investment income | | $ | 2,383,978 | | | | | $ | 1,662,045 | |
Net realized gain (loss) | | | 7,086,297 | | | | | | (2,177,550 | ) |
| Net change in unrealized appreciation/depreciation | | | 9,627,364 | | | | | | 1,492,156 | |
Net increase in net assets resulting from operations | | | 19,097,639 | | | | | | 976,651 | |
Dividends and/or Distributions to Shareholders | | | | | | | | | | |
| Dividends from net investment income: | | | | | | | | | | |
| Class A | | | (337,973 | ) | | | | | (41,359 | ) |
| Class C | | | (78,377 | ) | | | | | (6,703 | ) |
| Class I | | | (6,798,334 | ) | | | | | (2,320,053 | ) |
| Class R1 | | | (19,258 | ) | | | | | (1,471 | ) |
| Class Y | | | (25,286 | ) | | | | | (1,766 | ) |
| | | | (7,259,228 | ) | | | | | (2,371,352 | ) |
Beneficial Interest Transactions | | | | | | | | | | |
| Net increase in net assets resulting from beneficial interest transactions: | | | | | | | | | | |
| Class A | | | 10,138,553 | | | | | | 4,037,104 | |
| Class C | | | 3,222,781 | | | | | | 772,479 | |
| Class I | | | 15,975,851 | | | | | | 40,069,909 | |
| Class R1 | | | 786,207 | | | | | | 75,718 | |
| Class Y | | | 248,551 | | | | | | 163,209 | |
| | | | 30,371,943 | | | | | | 45,118,419 | |
Net Assets | | | | | | | | | | |
Total increase | | | 42,210,354 | | | | | | 43,723,718 | |
| Beginning of period | | | 140,873,815 | | | | | | 97,150,097 | |
| End of period (including accumulated net investment income (loss) of $295,710 and $(469,333), respectively) | | $ | 183,084,169 | | | | | $ | 140,873,815 | |
| | | | | | | | | |
1. Effective July 1, 2014, Class N shares were renamed Class R. See Note 1 of the accompanying Notes.
See accompanying Notes to Financial Statements.
18 OPPENHEIMER GLOBAL REAL ESTATE FUND
FINANCIAL HIGHLIGHTS
| | | | | | | | | | | | |
| | | Year Ended
April 30, | | | Year Ended
April 30, | | | Period Ended
April 30, | |
| Class A | | 2015 | | | 2014 | | | 20131 | |
Per Share Operating Data | | | | | | | | | | | | |
Net asset value, beginning of period | | $ | 10 .52 | | | $ | 10 .89 | | | $ | 10.00 | |
| Income (loss) from investment operations: | | | | | | | | | | | | |
| Net investment income2 | | | 0 .07 | | | | 0 .08 | | | | 0 .01 | |
| Net realized and unrealized gain (loss) | | | 1 .19 | | | | (0 .26 | ) | | | 0 .88 | |
| | | | |
Total from investment operations | | | 1 .26 | | | | (0 .18 | ) | | | 0 .89 | |
| Dividends and/or distributions to shareholders: | | | | | | | | | | | | |
Dividends from net investment income | | | (0 .44 | ) | | | (0 .19 | ) | | | 0 .00 | |
| Net asset value, end of period | | $ | 11 .34 | | | $ | 10.52 | | | $ | 10.89 | |
| | | | | | | | | | | | |
| | | | | | | | | | | | |
| Total Return, at Net Asset Value3 | | | 12.18 | % | | | (1.56 | )% | | | 8.90 | % |
| | | | | | | | | | | | | |
| Ratios/Supplemental Data | | | | | | | | | | | | |
Net assets, end of period (in thousands) | | $ | 15,027 | | | $ | 4,486 | | | $ | 309 | |
Average net assets (in thousands) | | $ | 8,639 | | | $ | 2,349 | | | $ | 125 | |
| Ratios to average net assets:4 | | | | | | | | | | | | |
| Net investment income | | | 0 .63 | % | | | 0.83 | % | | | 1.26 | % |
| Total expenses | | | 1 .66 | % | | | 2.04 | % | | | 1.66 | % |
Expenses after payments, waivers and/or reimbursements and reduction to custodian expenses | | | 1 .44 | % | | | 1.44 | % | | | 1.42 | % |
| Portfolio turnover rate | | | 55 | % | | | 100 | % | | | 2 | % |
1. For the period from March 20, 2013 (commencement of operations) to April 30, 2013.
2. Per share amounts calculated based on the average shares outstanding during the period.
3. Assumes an initial investment on the business day before the first day of the fiscal period, with all dividends and distributions reinvested in additional shares on the reinvestment date, and redemption at the net asset value calculated on the last business day of the fiscal period. Sales charges are not reflected in the total returns. Total returns are not annualized for periods less than one full year. Returns do not reflect the deduction of taxes that a shareholder would pay on fund distributions or the redemption of fund shares. The returns do not include adjustments in accordance with generally accepted accounting principles required at the period end for financial reporting purposes.
4. Annualized for periods less than one full year.
See accompanying Notes to Financial Statements.
19 OPPENHEIMER GLOBAL REAL ESTATE FUND
FINANCIAL HIGHLIGHTS (Continued)
| | | | | | | | | | | | |
| | | Year Ended
April 30, | | | Year Ended
April 30, | | | Period Ended
April 30, | |
| Class C | | 2015 | | | 2014 | | | 20131 | |
Per Share Operating Data | | | | | | | | | | | | |
Net asset value, beginning of period | | $ | 10.49 | | | $ | 10.88 | | | $ | 10.00 | |
| Income (loss) from investment operations: | | | | | | | | | | | | |
| Net investment income2 | | | 0 .00 | 3 | | | 0 .02 | | | | 0 .00 | 3 |
| Net realized and unrealized gain (loss) | | | 1 .17 | | | | (0 .29 | ) | | | 0 .88 | |
Total from investment operations | | | 1 .17 | | | | (0 .27 | ) | | | 0 .88 | |
| Dividends and/or distributions to shareholders: | | | | | | | | | | | | |
Dividends from net investment income | | | (0 .37 | ) | | | (0 .12 | ) | | | 0 .00 | |
| Net asset value, end of period | | $ | 11.29 | | | $ | 10.49 | | | $ | 10.88 | |
| | | | | | | | | | | | |
| | | | | | | | | | | | |
| Total Return, at Net Asset Value4 | | | 11.32 | % | | | (2.37 | )% | | | 8.80 | % |
| | | | | | | | | | | | | |
Ratios/Supplemental Data | | | | | | | | | | | | |
Net assets, end of period (in thousands) | | $ | 4,188 | | | $ | 889 | | | $ | 108 | |
Average net assets (in thousands) | | $ | 2,162 | | | $ | 594 | | | $ | 52 | |
| Ratios to average net assets:5 | | | | | | | | | | | | |
| Net investment income | | | 0.00 | %6 | | | 0.16 | % | | | 0.49 | % |
| Total expenses | | | 2.52 | % | | | 3.31 | % | | | 2.51 | % |
Expenses after payments, waivers and/or reimbursements and reduction to custodian expenses | | | 2.24 | % | | | 2.24 | % | | | 2.22 | % |
| Portfolio turnover rate | | | 55 | % | | | 100 | % | | | 2 | % |
1. For the period from March 20, 2013 (commencement of operations) to April 30, 2013.
2. Per share amounts calculated based on the average shares outstanding during the period.
3. Less than $0.005.
4. Assumes an initial investment on the business day before the first day of the fiscal period, with all dividends and distributions reinvested in additional shares on the reinvestment date, and redemption at the net asset value calculated on the last business day of the fiscal period. Sales charges are not reflected in the total returns. Total returns are not annualized for periods less than one full year. Returns do not reflect the deduction of taxes that a shareholder would pay on fund distributions or the redemption of fund shares. The returns do not include adjustments in accordance with generally accepted accounting principles required at the period end for financial reporting purposes.
5. Annualized for periods less than one full year.
6. Less than 0.005%.
See accompanying Notes to Financial Statements.
20 OPPENHEIMER GLOBAL REAL ESTATE FUND
| | | | | | | | | | | | |
| Class I | | Year Ended
April 30,
2015 | | | Year Ended
April 30,
2014 | | | Period Ended
April 30,
20131 | |
Per Share Operating Data | | | | | | | | | | | | |
Net asset value, beginning of period | | $ | 10 .53 | | | $ | 10 .89 | | | $ | 10 .00 | |
| Income (loss) from investment operations: | | | | | | | | | | | | |
| Net investment income2 | | | 0 .17 | | | | 0 .15 | | | | 0 .02 | |
| Net realized and unrealized gain (loss) | | | 1 .14 | | | | (0 .29 | ) | | | 0 .87 | |
| | | | | | | | | | | | |
Total from investment operations | | | 1 .31 | | | | (0 .14 | ) | | | 0 .89 | |
| Dividends and/or distributions to shareholders: | | | | | | | | | | | | |
Dividends from net investment income | | | (0 .48 | ) | | | (0 .22 | ) | | | 0 .00 | |
| Net asset value, end of period | | $ | 11.36 | | | $ | 10.53 | | | $ | 10.89 | |
| | | | | | | | | | | | |
| | | | | | | | | | | | |
| | | | | | | | | | | | |
| | | | | | | | | | | | |
Total Return, at Net Asset Value3 | | | 12 .68 | % | | | (1 .14 | )% | | | 8 .90 | % |
Ratios/Supplemental Data | | | | | | | | | | | | |
Net assets, end of period (in thousands) | | $ | 162,493 | | | $ | 135,185 | | | $ | 96,650 | |
Average net assets (in thousands) | | $ | 154,104 | | | $ | 107,043 | | | $ | 79,748 | |
| Ratios to average net assets:4 | | | | | | | | | | | | |
| Net investment income | | | 1 .50 | % | | | 1 .53 | % | | | 2 .05 | % |
| Total expenses | | | 1 .07 | % | | | 1 .11 | % | | | 1 .39 | % |
Expenses after payments, waivers and/or reimbursements and reduction to custodian expenses | | | 1 .05 | % | | | 1 .05 | % | | | 1 .05 | % |
| Portfolio turnover rate | | | 55 | % | | | 100 | % | | | 2 | % |
1. For the period from March 20, 2013 (commencement of operations) to April 30, 2013.
2. Per share amounts calculated based on the average shares outstanding during the period.
3. Assumes an initial investment on the business day before the first day of the fiscal period, with all dividends and distributions reinvested in additional shares on the reinvestment date, and redemption at the net asset value calculated on the last business day of the fiscal period. Sales charges are not reflected in the total returns. Total returns are not annualized for periods less than one full year. Returns do not reflect the deduction of taxes that a shareholder would pay on fund distributions or the redemption of fund shares. The returns do not include adjustments in accordance with generally accepted accounting principles required at the period end for financial reporting purposes.
4. Annualized for periods less than one full year.
See accompanying Notes to Financial Statements.
21 OPPENHEIMER GLOBAL REAL ESTATE FUND
FINANCIAL HIGHLIGHTS Continued
| | | | | | | | | | | | | | | | | | |
| Class R | | Year Ended
April 30, 2015 | | Year Ended
April 30, 2014 | | Period Ended
April 30, 20131 |
Per Share Operating Data | | | | | | | | | | | | | | | | | | |
Net asset value, beginning of period | | $ | 10.51 | | | | | $ | 10.89 | | | | | $ | 10.00 | | | |
| Income (loss) from investment operations: | | | | | | | | | | | | | | | | | | |
| Net investment income2 | | | 0.08 | | | | | | 0.08 | | | | | | 0.01 | | | |
| Net realized and unrealized gain (loss) | | | 1.15 | | | | | | (0.30 | ) | | | | | 0.88 | | | |
Total from investment operations | | | 1.23 | | | | | | (0.22 | ) | | | | | 0.89 | | | |
| Dividends and/or distributions to shareholders: | | | | | | | | | | | | | | | | | | |
Dividends from net investment income | | | (0.42 | ) | | | | | (0.16 | ) | | | | | 0.00 | | | |
| Net asset value, end of period | | $ | 11.32 | | | | | $ | 10.51 | | | | | $ | 10.89 | | | |
| | | |
| | | | | | | | | | | | | | | | | | | |
Total Return, at Net Asset Value3 | | | 11.87 | % | | | | | (1.91 | )% | | | | | 8.90 | % | | |
Ratios/Supplemental Data | | | | | | | | | | | | | | | | | | |
Net assets, end of period (in thousands) | | $ | 907 | | | | | $ | 106 | | | | | $ | 31 | | | |
Average net assets (in thousands) | | $ | 427 | | | | | $ | 86 | | | | | $ | 17 | | | |
| Ratios to average net assets:4 | | | | | | | | | | | | | | | | | | |
| Net investment income | | | 0.73 | % | | | | | 0.79 | % | | | | | 1.14 | % | | |
| Total expenses | | | 2.05 | % | | | | | 2.89 | % | | | | | 1.84 | % | | |
Expenses after payments, waivers and/or reimbursements and reduction to custodian expenses | | | 1.74 | % | | | | | 1.74 | % | | | | | 1.72 | % | | |
| Portfolio turnover rate | | | 55 | % | | | | | 100 | % | | | | | 2 | % | | |
1. For the period from March 20, 2013 (commencement of operations) to April 30, 2013.
2. Per share amounts calculated based on the average shares outstanding during the period.
3. Assumes an initial investment on the business day before the first day of the fiscal period, with all dividends and distributions reinvested in additional shares on the reinvestment date, and redemption at the net asset value calculated on the last business day of the fiscal period. Sales charges are not reflected in the total returns. Total returns are not annualized for periods less than one full year. Returns do not reflect the deduction of taxes that a shareholder would pay on fund distributions or the redemption of fund shares. The returns do not include adjustments in accordance with generally accepted accounting principles required at the period end for financial reporting purposes.
4. Annualized for periods less than one full year.
See accompanying Notes to Financial Statements.
22 OPPENHEIMER GLOBAL REAL ESTATE FUND
| | | | | | | | | | | | |
Class Y | | Year Ended
April 30,
2015 | | | Year Ended
April 30,
2014 | | | Period Ended
April 30,
20131 | |
Per Share Operating Data | | | | | | | | | | | | |
Net asset value, beginning of period | | $ | 10.53 | | | $ | 10.89 | | | $ | 10.00 | |
| Income (loss) from investment operations: | | | | | | | | | | | | |
| Net investment income2 | | | 0.13 | | | | 0.11 | | | | 0.02 | |
| Net realized and unrealized gain (loss) | | | 1.18 | | | | (0.26 | ) | | | 0.87 | |
Total from investment operations | | | 1.31 | | | | (0.15 | ) | | | 0.89 | |
Dividends and/or distributions to shareholders: | | | | | | | | | | | | |
Dividends from net investment income | | | (0.48 | ) | | | (0 .21 | ) | | | 0.00 | |
| Net asset value, end of period | | $ | 11.36 | | | $ | 10.53 | | | $ | 10.89 | |
| | | | | | | | | | | | |
| | | | | | | | | | | | |
| | | | | | | | | | | | |
Total Return, at Net Asset Value3 | | | 12 .62 | % | | | (1 .21 | )% | | | 8 .90% | |
| | | | | | | | | | | | | |
Ratios/Supplemental Data | | | | | | | | | | | | |
Net assets, end of period (in thousands) | | $ | 469 | | | $ | 208 | | | $ | 52 | |
Average net assets (in thousands) | | $ | 569 | | | $ | 111 | | | $ | 41 | |
| Ratios to average net assets:4 | | | | | | | | | | | | |
| Net investment income | | | 1.20 | % | | | 1.06 | % | | | 1.54% | |
| Total expenses | | | 1.40 | % | | | 1.81 | % | | | 1.78% | |
Expenses after payments, waivers and/or reimbursements and reduction to custodian expenses | | | 1.10 | % | | | 1.09 | % | | | 1.10% | |
| Portfolio turnover rate | | | 55 | % | | | 100 | % | | | 2% | |
1. For the period from March 20, 2013 (commencement of operations) to April 30, 2013.
2. Per share amounts calculated based on the average shares outstanding during the period.
3. Assumes an initial investment on the business day before the first day of the fiscal period, with all dividends and distributions reinvested in additional shares on the reinvestment date, and redemption at the net asset value calculated on the last business day of the fiscal period. Sales charges are not reflected in the total returns. Total returns are not annualized for periods less than one full year. Returns do not reflect the deduction of taxes that a shareholder would pay on fund distributions or the redemption of fund shares. The returns do not include adjustments in accordance with generally accepted accounting principles required at the period end for financial reporting purposes.
4. Annualized for periods less than one full year.
See accompanying Notes to Financial Statements.
23 OPPENHEIMER GLOBAL REAL ESTATE FUND
NOTES TO FINANCIAL STATEMENTS APRIL 30, 2015
1. Organization
Oppenheimer Global Real Estate Fund (the “Fund”) is registered under the Investment Company Act of 1940 (“1940 Act”), as amended, as a non-diversified open-end management investment company. The Fund’s investment objective is to seek total return. The Fund’s investment adviser is OFI Global Asset Management, Inc. (“OFI Global” or the “Manager”), a wholly-owned subsidiary of OppenheimerFunds, Inc. (“OFI” or the “Sub-Adviser”). The Manager has entered into a sub-advisory agreement with OFI. The Sub-Advisor has entered into a sub-sub-advisory agreement with Cornerstone Real Estate Advisers LLC (the “Sub-Sub-Adviser”), an indirect, wholly-owned subsidiary of Massachusetts Mutual Life Insurance Company, the parent of OFI.
The Fund offers Class A, Class C, Class I, Class R and Class Y shares. As of July 1, 2014, Class N shares were renamed Class R shares. Class N shares subject to a contingent deferred sales charge (“CDSC”) on July 1, 2014, will continue to be subject to a CDSC after the shares are renamed. Purchases of Class R shares occurring on or after July 1, 2014, will not be subject to a CDSC upon redemption. Class A shares are sold at their offering price, which is normally net asset value plus a front-end sales charge. Class C and Class R shares are sold without a front-end sales charge but may be subject to a contingent deferred sales charge (“CDSC”). Class R shares are sold only through retirement plans. Retirement plans that offer Class R shares may impose charges on those accounts. Class I and Class Y shares are sold to certain institutional investors or intermediaries without either a front-end sales charge or a CDSC, however, the intermediaries may impose charges on their accountholders who beneficially own Class I and Class Y shares. All classes of shares have identical rights and voting privileges with respect to the Fund in general and exclusive voting rights on matters that affect that class alone. Earnings, net assets and net asset value per share may differ due to each class having its own expenses, such as transfer and shareholder servicing agent fees and shareholder communications, directly attributable to that class. Class A, C and R shares have separate distribution and/or service plans under which they pay fees. Class I and Class Y shares do not pay such fees.
The following is a summary of significant accounting policies followed in the Fund’s preparation of financial statements in accordance with accounting principles generally accepted in the United States (“U.S. GAAP”).
2. Significant Accounting Policies
Security Valuation. All investments in securities are recorded at their estimated fair value, as described in Note 3.
Foreign Currency Translation. The Fund’s accounting records are maintained in U.S. dollars. The values of securities denominated in foreign currencies and amounts related to the purchase and sale of foreign securities and foreign investment income are translated into U.S. dollars as of the close of the New York Stock Exchange (the “Exchange”), normally 4:00 P.M. Eastern time, on each day the Exchange is open for trading. Foreign exchange rates may be valued primarily using a reliable bank, dealer or service authorized by the Board of Trustees.
24 OPPENHEIMER GLOBAL REAL ESTATE FUND
2. Significant Accounting Policies (Continued)
Reported net realized gains and losses from foreign currency transactions arise from sales of portfolio securities, sales and maturities of short-term securities, sales of foreign currencies, exchange rate fluctuations between the trade and settlement dates on securities transactions, and the difference between the amounts of dividends, interest, and foreign withholding taxes recorded on the Fund’s books and the U.S. dollar equivalent of the amounts actually received or paid. Net unrealized appreciation and depreciation on the translation of assets and liabilities denominated in foreign currencies arise from changes in the values of assets and liabilities, including investments in securities at fiscal period end, resulting from changes in exchange rates.
The effect of changes in foreign currency exchange rates on investments is separately identified from the fluctuations arising from changes in market values of securities held and reported with all other foreign currency gains and losses in the Fund’s Statement of Operations.
Allocation of Income, Expenses, Gains and Losses. Income, expenses (other than those attributable to a specific class), gains and losses are allocated on a daily basis to each class of shares based upon the relative proportion of net assets represented by such class. Operating expenses directly attributable to a specific class are charged against the operations of that class.
Dividends and Distributions to Shareholders. Dividends and distributions to shareholders, which are determined in accordance with income tax regulations and may differ from U.S. generally accepted accounting principles, are recorded on the ex-dividend date. Income distributions, if any, are declared and paid quarterly. Capital gain distributions, if any, are declared and paid annually.
Investment Income. Dividend income is recorded on the ex-dividend date or upon ex-dividend notification in the case of certain foreign dividends where the ex-dividend date may have passed. Upon receipt of notification from the issuer, subsequent to the ex-dividend date, some of the dividend income originally recorded from a real estate investment trust (“REIT”) may be reclassified as a reduction of the cost of the related investment and/or realized gain. Non-cash dividends included in dividend income, if any, are recorded at the fair market value of the securities received. Interest income is recognized on an accrual basis. Discount and premium, which are included in interest income on the Statement of Operations, are amortized or accreted daily.
Custodian Fees. “Custodian fees and expenses” in the Statement of Operations may include interest expense incurred by the Fund on any cash overdrafts of its custodian account during the period. Such cash overdrafts may result from the effects of failed trades in portfolio securities and from cash outflows resulting from unanticipated shareholder redemption activity. The Fund pays interest to its custodian on such cash overdrafts, to the extent they are not offset by positive cash balances maintained by the Fund, at a rate equal to the Federal Funds Rate plus 0.50%. The “Reduction to custodian expenses” line item, if applicable,
25 OPPENHEIMER GLOBAL REAL ESTATE FUND
NOTES TO FINANCIAL STATEMENTS Continued
2. Significant Accounting Policies (Continued)
represents earnings on cash balances maintained by the Fund during the period. Such interest expense and other custodian fees may be paid with these earnings.
Security Transactions. Security transactions are recorded on the trade date. Realized gains and losses on securities sold are determined on the basis of identified cost.
Indemnifications. The Fund’s organizational documents provide current and former Trustees and officers with a limited indemnification against liabilities arising in connection with the performance of their duties to the Fund. In the normal course of business, the Fund may also enter into contracts that provide general indemnifications. The Fund’s maximum exposure under these arrangements is unknown as this would be dependent on future claims that may be made against the Fund. The risk of material loss from such claims is considered remote.
Federal Taxes. The Fund intends to comply with provisions of the Internal Revenue Code applicable to regulated investment companies and to distribute substantially all of its investment company taxable income, including any net realized gain on investments not offset by capital loss carryforwards, if any, to shareholders. Therefore, no federal income or excise tax provision is required. The Fund files income tax returns in U.S. federal and applicable state jurisdictions. The statute of limitations on the Fund’s tax return filings generally remain open for the three preceding fiscal reporting period ends.
The tax components of capital shown in the following table represent distribution requirements the Fund must satisfy under the income tax regulations, losses the Fund may be able to offset against income and gains realized in future years and unrealized appreciation or depreciation of securities and other investments for federal income tax purposes.
| | | | | | | | | | | | |
Undistributed Net Investment Income | | Undistributed
Long-Term
Gain | | | Accumulated
Loss
Carryforward1,2,3 | | | Net Unrealized
Appreciation
Based on cost of
Securities and
Other Investments
for Federal Income
Tax Purposes | |
| $1,944,797 | | $ | — | | | $ | 519,573 | | | $ | 16,061,065 | |
1. As of April 30, 2015, the Fund had $519,573 of net capital loss carryforward available to offset future realized capital gains, if any, and thereby reduce future taxable gain distributions. Details of the capital loss carryforwards are included in the table below. Capital loss carryovers with no expiration, if any, must be utilized prior to those with expiration dates.
| | | | |
| Expiring | | | |
| No expiration | | $ | 519,573 | |
2. During the fiscal year ended April 30, 2015, the Fund utilized $1,338,611 of capital loss carryforward to offset capital gains realized in that fiscal year.
3. During the fiscal year ended April 30, 2014, the Fund did not utilize any capital loss carryforward.
26 OPPENHEIMER GLOBAL REAL ESTATE FUND
2. Significant Accounting Policies (Continued)
Net investment income (loss) and net realized gain (loss) may differ for financial statement and tax purposes. The character of dividends and distributions made during the fiscal year from net investment income or net realized gains are determined in accordance with federal income tax requirements, which may differ from the character of net investment income or net realized gains presented in those financial statements in accordance with GAAP. Also, due to timing of dividends and distributions, the fiscal year in which amounts are distributed may differ from the fiscal year in which the income or net realized gain was recorded by the Fund.
In addition, distributions paid by the Fund’s investments in real estate investment trusts (“REITS”) often include a “return of capital” which is recorded by the Fund as a reduction of the cost basis of securities held. The Internal Revenue Code requires a REIT to distribute at least 95% of its taxable income to investors. In many cases, however, because of “non-cash” expenses such as property depreciation, an equity REIT’s cash flows will exceed its taxable income. The REIT may distribute this excess cash to offer a more competitive yield. This portion of the distribution is deemed a return of capital, and is generally not taxable to shareholders.
Accordingly, the following amounts have been reclassified for April 30, 2015. Net assets of the Fund were unaffected by the reclassifications.
| | | | |
Reduction to Accumulated Net Investment Loss | | Reduction
to Accumulated Net
Realized Gain
on Investments | |
| $5,640,293 | | $ | 5,640,293 | |
The tax character of distributions paid during the years ended April 30, 2015 and April 30, 2014 was as follows:
| | | | | | | | |
| | | Year Ended
April 30, 2015 | | | Year Ended
April 30, 2014 | |
| Distributions paid from: | | | | | | | | |
| Ordinary income | | $ | 7,259,228 | | | $ | 2,371,352 | |
The aggregate cost of securities and other investments and the composition of unrealized appreciation and depreciation of securities and other investments for federal income tax purposes as of April 30, 2015 are noted in the following table. The primary difference between book and tax appreciation or depreciation of securities and other investments, if applicable, is attributable to the tax deferral of losses or tax realization of financial statement unrealized gain or loss.
| | | | |
| Federal tax cost of securities | | $ | 164,234,530 | |
| | | | |
| Gross unrealized appreciation | | $ | 23,371,299 | |
| Gross unrealized depreciation | | | (7,310,234 | ) |
| | | | |
| Net unrealized appreciation | | $ | 16,061,065 | |
| | | | |
.
27 OPPENHEIMER GLOBAL REAL ESTATE FUND
NOTES TO FINANCIAL STATEMENTS Continued
2. Significant Accounting Policies (Continued)
Use of Estimates. The preparation of financial statements in conformity with accounting principles generally accepted in the United States of America requires management to make estimates and assumptions that affect the reported amounts of assets and liabilities and disclosure of contingent assets and liabilities at the date of the financial statements and the reported amounts of increases and decreases in net assets from operations during the reporting period. Actual results could differ from those estimates.
3. Securities Valuation
The Fund calculates the net asset value of its shares as of the close of the New York Stock Exchange (the “Exchange”), normally 4:00 P.M. Eastern time, on each day the Exchange is open for trading.
The Fund’s Board has adopted procedures for the valuation of the Fund’s securities and has delegated the day-to-day responsibility for valuation determinations under those procedures to the Manager. The Manager has established a Valuation Committee which is responsible for determining a “fair valuation” for any security for which market quotations are not “readily available.” The Valuation Committee’s fair valuation determinations are subject to review, approval and ratification by the Fund’s Board at its next regularly scheduled meeting covering the calendar quarter in which the fair valuation was determined.
Valuation Methods and Inputs
Securities are valued using unadjusted quoted market prices, when available, as supplied primarily by third party pricing services or dealers.
The following methodologies are used to determine the market value or the fair value of the types of securities described below:
Securities traded on a registered U.S. securities exchange (including exchange-traded derivatives other than futures and futures options) are valued based on the last sale price of the security reported on the principal exchange on which it is traded, prior to the time when the Fund’s assets are valued. In the absence of a sale, the security is valued at the last sale price on the prior trading day, if it is within the spread of the current day’s closing “bid” and “asked” prices, and if not, at the current day’s closing bid price. A security of a foreign issuer traded on a foreign exchange, but not listed on a registered U.S. securities exchange, is valued based on the last sale price on the principal exchange on which the security is traded, as identified by the third party pricing service used by the Manager, prior to the time when the Fund’s assets are valued. If the last sale price is unavailable, the security is valued at the most recent official closing price on the principal exchange on which it is traded. If the last sales price or official closing price for a foreign security is not available, the security is valued at the mean between the bid and asked price per the exchange or, if not available from the exchange, obtained from two dealers. If bid and asked prices are not available from either the exchange or two dealers, the security is valued by using one of the following methodologies (listed in order of priority): (1) using a bid from the exchange, (2) the mean between the bid and asked price as provided by a single dealer, or (3) a bid from a single dealer.
Shares of a registered investment company that are not traded on an exchange are valued at that investment company’s net asset value per share.
28 OPPENHEIMER GLOBAL REAL ESTATE FUND
3. Securities Valuation (Continued)
Corporate and government debt securities (of U.S. or foreign issuers) and municipal debt securities, event-linked bonds, loans, mortgage-backed securities, collateralized mortgage obligations, and asset-backed securities are valued at the mean between the “bid” and “asked” prices utilizing evaluated prices obtained from third party pricing services or broker-dealers who may use matrix pricing methods to determine the evaluated prices.
Short-term money market type debt securities with a remaining maturity of sixty days or less are valued at cost adjusted by the amortization of discount or premium to maturity (amortized cost), which approximates market value. Short-term debt securities with a remaining maturity in excess of sixty days are valued at the mean between the “bid” and “asked” prices utilizing evaluated prices obtained from third party pricing services or broker-dealers.
A description of the standard inputs that may generally be considered by the third party pricing vendors in determining their evaluated prices is provided below.
| | |
| Security Type | | Standard inputs generally considered by third-party pricing vendors |
| Corporate debt, government debt, municipal, mortgage-backed and asset-backed securities | | Reported trade data, broker-dealer price quotations, benchmark yields, issuer spreads on comparable securities, the credit quality, yield, maturity, and other appropriate factors. |
| Loans | | Information obtained from market participants regarding reported trade data and broker-dealer price quotations. |
| Event-linked bonds | | Information obtained from market participants regarding reported trade data and broker-dealer price quotations. |
If a market value or price cannot be determined for a security using the methodologies described above, or if, in the “good faith” opinion of the Manager, the market value or price obtained does not constitute a “readily available market quotation,” or a significant event has occurred that would materially affect the value of the security, the security is fair valued either (i) by a standardized fair valuation methodology applicable to the security type or the significant event as previously approved by the Valuation Committee and the Fund’s Board or (ii) as determined in good faith by the Manager’s Valuation Committee. The Valuation Committee considers all relevant facts that are reasonably available, through either public information or information available to the Manager, when determining the fair value of a security. Fair value determinations by the Manager are subject to review, approval and ratification by the Fund’s Board at its next regularly scheduled meeting covering the calendar quarter in which the fair valuation was determined. Those fair valuation standardized methodologies include, but are not limited to, valuing securities at the last sale price or initially at cost and subsequently adjusting the value based on: changes in company specific fundamentals, changes in an appropriate securities index, or changes in the value of similar securities which may be further adjusted for any discounts related to security-specific resale restrictions. When possible, such methodologies use observable market inputs such as unadjusted quoted prices of similar securities, observable interest rates, currency rates and yield curves. The methodologies used for valuing securities are not necessarily an indication of the risks associated with investing in those securities nor can it be assured that the Fund can obtain the fair value assigned to a security if it were to sell the security.
29 OPPENHEIMER GLOBAL REAL ESTATE FUND
NOTES TO FINANCIAL STATEMENTS Continued
3. Securities Valuation (Continued)
To assess the continuing appropriateness of security valuations, the Manager, or its third party service provider who is subject to oversight by the Manager, regularly compares prior day prices, prices on comparable securities, and sale prices to the current day prices and challenges those prices exceeding certain tolerance levels with the third party pricing service or broker source. For those securities valued by fair valuations, whether through a standardized fair valuation methodology or a fair valuation determination, the Valuation Committee reviews and affirms the reasonableness of the valuations based on such methodologies and fair valuation determinations on a regular basis after considering all relevant information that is reasonably available.
Classifications
Each investment asset or liability of the Fund is assigned a level at measurement date based on the significance and source of the inputs to its valuation. Various data inputs are used in determining the value of each of the Fund’s investments as of the reporting period end. These data inputs are categorized in the following hierarchy under applicable financial accounting standards:
1) Level 1-unadjusted quoted prices in active markets for identical assets or liabilities (including securities actively traded on a securities exchange)
2) Level 2-inputs other than unadjusted quoted prices that are observable for the asset or liability (such as unadjusted quoted prices for similar assets and market corroborated inputs such as interest rates, prepayment speeds, credit risks, etc.)
3) Level 3-significant unobservable inputs (including the Manager’s own judgments about assumptions that market participants would use in pricing the asset or liability).
The inputs used for valuing securities are not necessarily an indication of the risks associated with investing in those securities.
The table below categorizes amounts that are included in the Fund’s Statement of Assets and Liabilities as of April 30, 2015 based on valuation input level:
| | | | | | | | | | | | | | | | |
| | | Level 1—
Unadjusted
Quoted
Prices | | | Level 2—
Other Significant
Observable Inputs | | | Level 3—
Significant
Unobservable
Inputs | | | Value | |
Assets Table | | | | | | | | | | | | | | | | |
Investments, at Value: | | | | | | | | | | | | | | | | |
| Common Stocks | | | | | | | | | | | | | | | | |
Consumer Discretionary | | $ | — | | | $ | 1,690,521 | | | $ | — | | | $ | 1,690,521 | |
Financials | | | 99,940,233 | | | | 78,664,550 | | | | — | | | | 178,604,783 | |
| | | | |
| Total Assets | | $ | 99,940,233 | | | $ | 80,355,071 | | | $ | — | | | $ | 180,295,304 | |
| | | | |
Forward currency exchange contracts and futures contracts, if any, are reported at their unrealized appreciation/depreciation at measurement date, which represents the change in the contract’s value from trade date. All additional assets and liabilities included in the above table are reported at their market value at measurement date.
30 OPPENHEIMER GLOBAL REAL ESTATE FUND
4. Investments and Risks
Equity Security Risk. Stocks and other equity securities fluctuate in price. The value of the Fund’s portfolio may be affected by changes in the equity markets generally. Equity markets may experience significant short-term volatility and may fall sharply at times. Different markets may behave differently from each other and U.S. equity markets may move in the opposite direction from one or more foreign stock markets. Adverse events in any part of the equity or fixed-income markets may have unexpected negative effects on other market segments.
The prices of individual equity securities generally do not all move in the same direction at the same time and a variety of factors can affect the price of a particular company’s securities. These factors may include, but are not limited to, poor earnings reports, a loss of customers, litigation against the company, general unfavorable performance of the company’s sector or industry, or changes in government regulations affecting the company or its industry.
Concentration Risk. Concentration risk is the risk that the Fund’s investments in securities of companies in one industry may cause it to be more exposed to changes in that industry or market sector as compared to a more broadly diversified fund.
The Fund invests primarily in the real estate industry.
5. Shares of Beneficial Interest
The Fund has authorized an unlimited number of $0.001 par value shares of beneficial interest of each class. Transactions in shares of beneficial interest were as follows:
| | | | | | | | | | | | | | | | | | |
| | | Year Ended April 30, 2015 | | | Year Ended April 30, 2014 | | | |
| | | Shares | | | Amount | | | Shares | | | Amount | | | |
Class A | | | | | | | | | | | | | | | | | | |
| Sold | | | 1,078,358 | | | $ | 12,177,951 | | | | 455,621 | | | $ | 4,615,910 | | | |
| Dividends and/or distributions reinvested | | | 30,361 | | | | 333,386 | | | | 4,056 | | | | 40,008 | | | |
| Redeemed | | | (210,448 | ) | | | (2,372,784 | ) | | | (61,532 | ) | | | (618,814 | ) | | |
| | | |
| Net increase | | | 898,271 | | | $ | 10,138,553 | | | | 398,145 | | | $ | 4,037,104 | | | |
| | | |
| | | | | |
| | | | | | | | | | | | | | | | | | | |
Class C | | | | | | | | | | | | | | | | | | |
| Sold | | | 315,378 | | | $ | 3,553,439 | | | | 105,333 | | | $ | 1,074,442 | | | |
Dividends and/or distributions reinvested | | | 7,082 | | | | 77,501 | | | | 670 | | | | 6,580 | | | |
| Redeemed | | | (36,316 | ) | | | (408,159 | ) | | | (31,171 | ) | | | (308,543 | ) | | |
| | | |
| Net increase | | | 286,144 | | | $ | 3,222,781 | | | | 74,832 | | | $ | 772,479 | | | |
| | | |
31 OPPENHEIMER GLOBAL REAL ESTATE FUND
NOTES TO FINANCIAL STATEMENTS Continued
5. Shares of Beneficial Interest (Continued)
| | | | | | | | | | | | | | | | |
| | | Year Ended April 30,
2015 | | | Year Ended April 30,
2014 | |
| | | Shares | | | Amount | | | Shares | | | Amount | |
Class I | | | | | | | | | | | | | | | | |
| Sold | | | 2,644,726 | | | $ | 29,508,130 | | | | 4,739,975 | | | $ | 47,899,925 | |
| Dividends and/or distributions reinvested | | | 618,936 | | | | 6,797,850 | | | | 234,699 | | | | 2,319,834 | |
| Redeemed | | | (1,797,139 | ) | | | (20,330,129 | ) | | | (1,006,690 | ) | | | (10,149,850 | ) |
| | | | | | | | | | | | | | | | |
| Net increase | | | 1,466,523 | | | $ | 15,975,851 | | | | 3,967,984 | | | $ | 40,069,909 | |
| | | | | | | | | | | | | | | | |
| | | | | | | | | | | | | | | | |
| | | | | | | | | | | | | | | | | |
Class R1 | | | | | | | | | | | | | | | | |
| Sold | | | 79,213 | | | $ | 889,644 | | | | 12,725 | | | $ | 130,513 | |
| Dividends and/or distributions reinvested | | | 1,719 | | | | 18,837 | | | | 133 | | | | 1,311 | |
| Redeemed | | | (10,854 | ) | | | (122,274 | ) | | | (5,600 | ) | | | (56,106 | ) |
| | | | | | | | | | | | | | | | |
| Net increase | | | 70,078 | | | $ | 786,207 | | | | 7,258 | | | $ | 75,718 | |
| | | | | | | | | | | | | | | | |
| | | | | | | | | | | | | | | | |
| | | | | | | | | | | | | | | | | |
Class Y | | | | | | | | | | | | | | | | |
| Sold | | | 81,794 | | | $ | 896,654 | | | | 30,082 | | | $ | 312,029 | |
| Dividends and/or distributions reinvested | | | 2,263 | | | | 24,808 | | | | 157 | | | | 1,553 | |
| Redeemed | | | (62,509 | ) | | | (672,911 | ) | | | (15,268 | ) | | | (150,373 | ) |
| | | | | | | | | | | | | | | | |
| Net increase | | | 21,548 | | | $ | 248,551 | | | | 14,971 | | | $ | 163,209 | |
| | | | | | | | | | | | | | | | |
| | | | | | | | | | | | | | | | |
1. Effective July 1, 2014, Class N shares were renamed Class R.
6. Purchases and Sales of Securities
The aggregate cost of purchases and proceeds from sales of securities, other than short-term obligations, for the year ended April 30, 2015 were as follows:
| | | | | | | | |
| | | Purchases | | | Sales | |
| Investment securities | | | $116,003,457 | | | | $90,158,517 | |
7. Fees and Other Transactions with Affiliates
Management Fees. Under the investment advisory agreement, the Fund pays the Manager a management fee based on the daily net assets of the Fund at an annual rate as shown in the following table:
| | | | |
| Fee Schedule | | | |
| Up to $1.0 billion | | | 1.00 | % |
| Over $1 billion | | | 0.80 | |
The Fund’s effective management fee for the fiscal year ended April 30, 2015 was 1.00% of average annual net assets before any applicable waivers.
Sub-Adviser Fees. The Manager has retained the Sub-Adviser to provide the day-to-day portfolio management of the Fund. Under the Sub-Advisory Agreement, the Manager pays the Sub-Adviser an annual fee in monthly installments, equal to a percentage of the
32 OPPENHEIMER GLOBAL REAL ESTATE FUND
7. Fees and Other Transactions with Affiliates (Continued)
investment management fee collected by the Manager from the Fund, which shall be calculated after any investment management fee waivers. The fee paid to the Sub-Adviser is paid by the Manager, not by the Fund.
Sub-Sub-Adviser Fees. The Sub-Adviser retains the Sub-Sub-Adviser to provide the day-to-day portfolio management of the Fund. Under the Sub-Sub-Advisory Agreement, the Sub-Adviser pays the Sub-Sub-Adviser an annual fee in monthly installments, based on the average daily net assets of the Fund. The fee paid to the Sub-Sub-Adviser under the Sub-Sub-Advisory Agreement is paid by the Sub-Adviser, not by the Fund.
Trustees’ Compensation. The Fund’s Board of Trustees (“Board”) has adopted a compensation deferral plan for Independent Trustees that enables Trustees to elect to defer receipt of all or a portion of the annual compensation they are entitled to receive from the Fund. For purposes of determining the amount owed to the Trustee under the plan, deferred amounts are treated as though equal dollar amounts had been invested in shares of the Fund or in other Oppenheimer funds selected by the Trustee. The Fund purchases shares of the funds selected for deferral by the Trustee in amounts equal to his or her deemed investment, resulting in a Fund asset equal to the deferred compensation liability. Such assets are included as a component of “Other” within the asset section of the Statement of Assets and Liabilities. Deferral of Trustees’ fees under the plan will not affect the net assets of the Fund and will not materially affect the Fund’s assets, liabilities or net investment income per share. Amounts will be deferred until distributed in accordance with the compensation deferral plan.
Transfer Agent Fees. OFI Global (the “Transfer Agent”) serves as the transfer and shareholder servicing agent for the Fund. The Fund pays the Transfer Agent a fee based on annual net assets. Fees incurred and average net assets for each class with respect to these services are detailed in the Statement of Operations and Financial Highlights, respectively.
Sub-Transfer Agent Fees. The Transfer Agent has retained Shareholder Services, Inc., a wholly-owned subsidiary of OFI (the “Sub-Transfer Agent”), to provide the day-to-day transfer agent and shareholder servicing of the Fund. Under the Sub-Transfer Agency Agreement, the Transfer Agent pays the Sub-Transfer Agent an annual fee in monthly installments, equal to a percentage of the transfer agent fee collected by the Transfer Agent from the Fund, which shall be calculated after any applicable fee waivers. The fee paid to the Sub-Transfer Agent is paid by the Transfer Agent, not by the Fund.
Distribution and Service Plan (12b-1) Fees. Under its General Distributor’s Agreement with the Fund, OppenheimerFunds Distributor, Inc. (the “Distributor”) acts as the Fund’s principal underwriter in the continuous public offering of the Fund’s classes of shares.
Service Plan for Class A Shares. The Fund has adopted a Service Plan (the “Plan”) for Class A shares pursuant to Rule 12b-1 under the 1940 Act. Under the Plan, the Fund reimburses the Distributor for a portion of its costs incurred for services provided to accounts
33 OPPENHEIMER GLOBAL REAL ESTATE FUND
NOTES TO FINANCIAL STATEMENTS Continued
7. Fees and Other Transactions with Affiliates (Continued)
that hold Class A shares. Reimbursement is made periodically at an annual rate of up to 0.25% of the daily net assets of Class A shares of the Fund. The Distributor currently uses all of those fees to pay dealers, brokers, banks and other financial institutions periodically for providing personal service and maintenance of accounts of their customers that hold Class A shares. Any unreimbursed expenses the Distributor incurs with respect to Class A shares in any fiscal year cannot be recovered in subsequent periods. Fees incurred by the Fund under the Plan are detailed in the Statement of Operations.
Distribution and Service Plans for Class C and Class R Shares. The Fund has adopted Distribution and Service Plans (the “Plans”) for Class C and Class R shares pursuant to Rule 12b-1 under the 1940 Act to compensate the Distributor for distributing those share classes, maintaining accounts and providing shareholder services. Under the Plans, the Fund pays the Distributor an annual asset-based sales charge of 0.75% on Class C shares daily net assets and 0.25% on Class R shares daily net assets. The Fund also pays a service fee under the Plans at an annual rate of 0.25% of daily net assets. The Plans continue in effect from year to year only if the Fund’s Board of Trustees vote annually to approve its continuance at an in person meeting called for that purpose. Fees incurred by the Fund under the Plans are detailed in the Statement of Operations.
Sales Charges. Front-end sales charges and CDSC do not represent expenses of the Fund. They are deducted from the proceeds of sales of Fund shares prior to investment or from redemption proceeds prior to remittance, as applicable. The sales charges retained by the Distributor from the sale of shares and the CDSC retained by the Distributor on the redemption of shares is shown in the following table for the period indicated.
| | | | | | | | | | | | | | | | |
| Year Ended | | Class A
Front-End
Sales Charges
Retained by
Distributor | | | Class A
Contingent
Deferred Sales
Charges
Retained by
Distributor | | | Class C
Contingent
Deferred Sales
Charges
Retained by
Distributor | | | Class R
Contingent
Deferred Sales
Charges
Retained by
Distributor | |
| April 30, 2015 | | | $26,096 | | | | $39 | | | | $504 | | | | $39 | |
Waivers and Reimbursements of Expenses. The Manager has contractually agreed to waive fees and/or reimburse certain expenses so that “Expenses after payments, waivers and/or reimbursements and reduction to custodian expenses”, excluding expenses incurred directly or indirectly by the Fund as a result of investments in other investment companies, wholly-owned subsidiaries and pooled investment vehicles; will not exceed 1.45% for Class A shares, 2.25% for Class C shares, 1.05% for Class I shares, 1.75% for Class R shares and 1.10% for Class Y shares. During the year ended April 30, 2015, the Manager waived $18,573, $6,128, $31,612, $1,326 and $1,631 for Class A, Class C, Class I, Class R and Class Y shares, respectively.
34 OPPENHEIMER GLOBAL REAL ESTATE FUND
7. Fees and Other Transactions with Affiliates (Continued)
The Transfer Agent has contractually agreed to limit transfer and shareholder servicing agent fees for Classes C, R and Y shares to 0.35% of average annual net assets per class and for Class A shares to 0.30% of average annual net assets of the class. The limit was removed on August 28, 2014.
During the year ended April 30, 2015, the Transfer Agent waived transfer and shareholder servicing agent fees as follows:
Waivers and/or reimbursements may be modified or terminated as set forth according to the terms in the prospectus.
8. Pending Litigation
In 2009, seven class action lawsuits were filed in the U.S. District Court for the District of Colorado against OppenheimerFunds, Inc. (“OFI”), OppenheimerFunds Distributor, Inc., the Fund’s principal underwriter and distributor (the “Distributor”), and certain funds (but not including the Fund) advised by OFI Global Asset Management, Inc. and distributed by the Distributor (the “Defendant Funds”). The lawsuits also named as defendants certain officers and current and former trustees of the respective Defendant Funds. The lawsuits raised claims under federal securities laws and alleged, among other things, that the disclosure documents of the respective Defendant Funds contained misrepresentations and omissions and that the respective Defendant Funds’ investment policies were not followed. The plaintiffs in these actions sought unspecified damages, equitable relief and awards of attorneys’ fees and litigation expenses. The Defendant Funds’ Boards of Trustees also engaged counsel to represent the Funds and the present and former Independent Trustees named in those suits. In March 2014, the parties in six of these lawsuits executed stipulations and agreements of settlement resolving those actions. In July 2014, the court entered an order and final judgment approving the settlements as fair, reasonable and adequate. The settlements do not resolve a seventh outstanding lawsuit relating to Oppenheimer Rochester California Municipal Fund (the “California Fund Suit”). OFI believes the California Fund Suit is without legal merit and is defending the suit vigorously. While it is premature to render any opinion as to the outcome in the California Fund Suit, or whether any costs that OFI may bear in defending the California Fund Suit might not be reimbursed by insurance, OFI believes the California Fund Suit should not impair the ability of OFI or the Distributor to perform their respective duties to the Fund, and that the outcome of the California Fund Suit should not have any material effect on the operations of any of the Oppenheimer funds.
35 OPPENHEIMER GLOBAL REAL ESTATE FUND
REPORT OF INDEPENDENT REGISTERED PUBLIC ACCOUNTING FIRM
The Board of Trustees and Shareholders of Oppenheimer Global Real Estate Fund:
We have audited the accompanying statement of assets and liabilities of Oppenheimer Global Real Estate Fund, including the statement of investments, as of April 30, 2015, and the related statement of operations for the year then ended, the statement of changes in net assets for each of the years in the two-year period then ended, and the financial highlights for each of the years or periods in the three-year period then ended. These financial statements and financial highlights are the responsibility of the Fund’s management. Our responsibility is to express an opinion on these financial statements and financial highlights based on our audits.
We conducted our audits in accordance with the standards of the Public Company Accounting Oversight Board (United States). Those standards require that we plan and perform the audits to obtain reasonable assurance about whether the financial statements and financial highlights are free of material misstatement. An audit includes examining, on a test basis, evidence supporting the amounts and disclosures in the financial statements. Our procedures included confirmation of securities owned as of April 30, 2015, by correspondence with the custodian, transfer agent and brokers, or by other appropriate auditing procedures where replies from brokers were not received. An audit also includes assessing the accounting principles used and significant estimates made by management, as well as evaluating the overall financial statement presentation. We believe that our audits provide a reasonable basis for our opinion.
In our opinion, the financial statements and financial highlights referred to above present fairly, in all material respects, the financial position of Oppenheimer Global Real Estate Fund as of April 30, 2015, the results of its operations for the year then ended, the changes in its net assets for each of the years in the two-year period then ended, and the financial highlights for each of the years or periods in the three-year period then ended, in conformity with U.S. generally accepted accounting principles.
KPMG LLP
Denver, Colorado
June 29, 2015
36 OPPENHEIMER GLOBAL REAL ESTATE FUND
FEDERAL INCOME TAX INFORMATION Unaudited
In early 2015, if applicable, shareholders of record received information regarding all dividends and distributions paid to them by the Fund during calendar year 2014.
None of the dividends paid by the Fund during the fiscal year ended April 30, 2015 are eligible for the corporate dividend-received deduction.
A portion, if any, of the dividends paid by the Fund during the fiscal year ended April 30, 2015 which are not designated as capital gain distributions are eligible for lower individual income tax rates to the extent that the Fund has received qualified dividend income as stipulated by recent tax legislation. The maximum amount allowable but not less than $43,802 of the Fund’s fiscal year taxable income may be eligible for the lower individual income tax rates. In early 2015, shareholders of record received information regarding the percentage of distributions that are eligible for lower individual income tax rates.
The foregoing information is presented to assist shareholders in reporting distributions received from the Fund to the Internal Revenue Service. Because of the complexity of the federal regulations which may affect your individual tax return and the many variations in state and local tax regulations, we recommend that you consult your tax advisor for specific guidance.
37 OPPENHEIMER GLOBAL REAL ESTATE FUND
PORTFOLIO PROXY VOTING POLICIES AND PROCEDURES;
UPDATES TO STATEMENTS OF INVESTMENTS Unaudited
The Fund has adopted Portfolio Proxy Voting Policies and Procedures under which the Fund votes proxies relating to securities (“portfolio proxies”) held by the Fund. A description of the Fund’s Portfolio Proxy Voting Policies and Procedures is available (i) without charge, upon request, by calling the Fund toll-free at 1.800.CALL OPP (225.5677), (ii) on the Fund’s website at www.oppenheimerfunds.com, and (iii) on the SEC’s website at www.sec.gov. In addition, the Fund is required to file Form N-PX, with its complete proxy voting record for the 12 months ended June 30th, no later than August 31st of each year. The Fund’s voting record is available (i) without charge, upon request, by calling the Fund toll-free at 1.800.CALL OPP (225.5677), and (ii) in the Form N-PX filing on the SEC’s website at www.sec.gov.
The Fund files its complete schedule of portfolio holdings with the SEC for the first quarter and the third quarter of each fiscal year on Form N-Q. The Fund’s Form N-Q filings are available on the SEC’s website at www.sec.gov. Those forms may be reviewed and copied at the SEC’s Public Reference Room in Washington, D.C. Information on the operation of the Public Reference Room may be obtained by calling 1-800-SEC-0330.
Householding—Delivery of Shareholder Documents
This is to inform you about OppenheimerFunds’ “householding” policy. If more than one member of your household maintains an account in a particular fund, OppenheimerFunds will mail only one copy of the fund’s prospectus (or, if available, the fund’s summary prospectus), annual and semiannual report and privacy policy. The consolidation of these mailings, called householding, benefits your fund through reduced mailing expense, and benefits you by reducing the volume of mail you receive from OppenheimerFunds. Householding does not affect the delivery of your account statements.
Please note that we will continue to household these mailings for as long as you remain an OppenheimerFunds shareholder, unless you request otherwise. If you prefer to receive multiple copies of these materials, please call us at 1.800.CALL-OPP (225-5677). You may also notify us in writing or via email. We will begin sending you individual copies of the prospectus (or, if available, the summary prospectus), reports and privacy policy within 30 days of receiving your request to stop householding.
38 OPPENHEIMER GLOBAL REAL ESTATE FUND
TRUSTEES AND OFFICERS Unaudited
| | |
Name, Position(s) Held with the Fund, Length of Service, Year of Birth | | Principal Occupation(s) During the Past 5 Years; Other Trusteeships/Directorships Held; Number of Portfolios in the Fund Complex Currently Overseen |
| |
| INDEPENDENT TRUSTEES | | The address of each Trustee in the chart below is 6803 S. Tucson Way, Centennial, Colorado 80112-3924. Each Trustee serves for an indefinite term, or until his or her resignation, retirement, death or removal. |
| |
Brian F. Wruble, Chairman of the Board of Trustees and Trustee (since 2013) Year of Birth: 1943 | | Director and Vice Chairman of Community Foundation of the Florida Keys (non-profit) (since July 2012); Trustee of the Board of Trustees, The Jackson Laboratory (non-profit) (1991-2011 and since May 2014); Chairman Emeritus (since August 2011) of The Jackson Laboratory (non-profit); Director of Special Value Opportunities Fund, LLC (registered investment company) (affiliate of the Sub-Adviser’s parent company) (since September 2004); Member of Zurich Insurance Group’s Investment Management Advisory Council (insurance) (since 2004); Treasurer (since 2007) and Trustee of the Institute for Advanced Study (non-profit educational institute) (since May 1992); General Partner of Odyssey Partners, L.P. (hedge fund) (September 1995-December 2007); Special Limited Partner of Odyssey Investment Partners, LLC (private equity investment) (January 1999-September 2004). Oversees 53 portfolios in the OppenheimerFunds complex. Mr. Wruble has served on the Boards of certain Oppenheimer funds since April 2001, during which time he has become familiar with the Fund’s (and other Oppenheimer funds’) financial, accounting, regulatory and investment matters and has contributed to the Boards’ deliberations. |
| |
David K. Downes, Trustee (since 2013) Year of Birth: 1940 | | Director of THL Credit Inc. (since June 2009); Chief Executive Officer and Board Member of Community Capital Management (investment management company) (since January 2004); President of The Community Reinvestment Act Qualified Investment Fund (investment management company) (since 2004); Director of Actua Corporation (information technology company) (since October 2003); formerly, Independent Chairman GSK Employee Benefit Trust (April 2006-June 2013); Director of Correctnet (January 2006-2007); Independent Chairman of the Board of Trustees of Quaker Investment Trust (registered investment company) (2004-2007); Chief Operating Officer and Chief Financial Officer of Lincoln National Investment Companies, Inc. (subsidiary of Lincoln National Corporation, a publicly traded company) and Delaware Investments U.S., Inc. (investment management subsidiary of Lincoln National Corporation) (1993-2003); President, Chief Executive Officer and Trustee of Delaware Investment Family of Funds (1993-2003); President and Board Member of Lincoln National Convertible Securities Funds, Inc. and the Lincoln National Income Funds, TDC (1993-2003); Chairman and Chief Executive Officer of Retirement Financial Services, Inc. (registered transfer agent and investment adviser and subsidiary of Delaware Investments U.S., Inc.) (1993-2003); President and Chief Executive Officer of Delaware Service Company, Inc. (1995-2003); Chief Administrative Officer, Chief Financial Officer, Vice Chairman and Director of Equitable Capital Management Corporation (investment subsidiary of Equitable Life Assurance Society) (1985-1992); Corporate Controller of Merrill Lynch Company (financial services holding company) (1977-1985); held the following positions at the Colonial Penn Group, Inc. (insurance company): Corporate Budget Director (1974-1977), Assistant Treasurer (1972-1974) and Director of Corporate Taxes (1969-1972); held the following positions at Price Waterhouse Company (financial services firm): Tax Manager (1967-1969), Tax Senior (1965-1967) and Staff Accountant (1963-1965); United States Marine Corps (1957-1959). |
39 OPPENHEIMER GLOBAL REAL ESTATE FUND
TRUSTEES AND OFFICERS Unaudited / Continued
| | |
David K. Downes, Continued | | Oversees 53 portfolios in the OppenheimerFunds complex. Mr. Downes has served on the Boards of certain Oppenheimer funds since December 2005, during which time he has become familiar with the Fund’s (and other Oppenheimer funds’) financial, accounting, regulatory and investment matters and has contributed to the Boards’ deliberations. |
| |
Matthew P. Fink, Trustee (since 2013) Year of Birth: 1941 | | Trustee of the Committee for Economic Development (policy research foundation) (2005-2011); Director of ICI Education Foundation (education foundation) (October 1991-August 2006); President of the Investment Company Institute (trade association) (October 1991-June 2004); Director of ICI Mutual Insurance Company (insurance company) (October 1991-June 2004); Author of The Rise of Mutual Funds: An Insider’s View published by Oxford University Press (second edition 2010). Oversees 53 portfolios in the OppenheimerFunds complex. Mr. Fink has served on the Boards of certain Oppenheimer funds since January 2005, during which time he has become familiar with the Fund’s (and other Oppenheimer funds’) financial, accounting, regulatory and investment matters and has contributed to the Boards’ deliberations. |
| |
Edmund P. Giambastiani, Jr., Trustee (since 2013) Year of Birth: 1948 | | Advisory Board Member of the Maxwell School of Citizenship and Public Affairs of Syracuse University (since April 2012); Director of Mercury Defense Systems Inc. (information technology) (August 2011-February 2013); Trustee of the U.S. Naval Academy Foundation (since November 2010); Advisory Board Member of the Massachusetts Institute of Technology Lincoln Laboratory (federally-funded research development center) (since May 2010); Director of The Boeing Company (aerospace and defense) (since October 2009); Trustee of MITRE Corporation (federally-funded research development center) (since September 2008); Independent Director of QinetiQ Group Plc (defense technology and security) (February 2008-August 2011); Director of Monster Worldwide, Inc. (on-line career services) (since January 2008, Lead Director since June 2011); Chairman of Alenia North America, Inc. (military and defense products) (January 2008-October 2009); Director of SRA International, Inc. (information technology and services) (January 2008-July 2011); President of Giambastiani Group LLC (national security and energy consulting) (since October 2007); United States Navy, career nuclear submarine officer (June 1970-October 2007), Vice Chairman of the Joint Chiefs of Staff (2005-October 2007), Supreme Allied Commander of NATO Commander Transformation (2003-2005), Commander, U.S. Joint Forces Command (2002-2005). Since his retirement from the U.S. Navy in October 2007, Admiral Giambastiani has also served on numerous U.S. Government advisory boards, investigations and task forces for the Secretaries of Defense, State and Interior and the Central Intelligence Agency. Oversees 53 portfolios in the OppenheimerFunds complex. Admiral Giambastiani has served on the Boards of certain Oppenheimer funds since February 2013, including as an Advisory Board Member for certain Oppenheimer funds, during which time he has become familiar with the Fund’s (and other Oppenheimer funds’) financial, accounting, regulatory and investment matters and has contributed to the Boards’ deliberations. For purposes of this report, Admiral Giambastiani is identified as a Trustee. |
| |
Elizabeth Krentzman, Trustee (since 2014) Year of Birth: 1959 | | Advisory Board Member of the Securities and Exchange Commission Historical Society (since 2007); held the following positions at Deloitte & Touche LLP: Principal and Chief Regulatory Advisor for Asset Management Services (2007 - 2014) and U.S. Mutual Fund Leader (2011 - 2014); General Counsel of the Investment Company Institute (trade association) (June 2004 - April 2007); held |
40 OPPENHEIMER GLOBAL REAL ESTATE FUND
| | |
| |
Elizabeth Krentzman, Continued | | the following positions at Deloitte & Touche LLP: National Director of the Investment Management Regulatory Consulting Practice (1997 - 2004), Principal (2003 - 2004), Director (1998 - 2003) and Senior Manager (1997 - 1998); Assistant Director of the Division of Investment Management - Office of Disclosure and Investment Adviser Regulation (1996 - 1997) and various positions with the Division of Investment Management – Office of Regulatory Policy (1991 - 1996) of the U.S. Securities and Exchange Commission; Associate at Ropes & Gray (1987 - 1991); former Chair of the Investment Management Subcommittee of the Washington, D.C. Bar. Oversees 53 portfolios in the OppenheimerFunds complex. Ms. Krentzman has served on the Boards of certain Oppenheimer funds since August 2014, during which time she has become familiar with the Fund’s (and other Oppenheimer funds’) financial, accounting, regulatory and investment matters and has contributed to the Boards’ deliberations. |
| |
Mary F. Miller, Trustee (since 2013) Year of Birth: 1942 | | Trustee of International House (not-for-profit) (since June 2007); Trustee of the American Symphony Orchestra (not-for-profit) (October 1998-November 2011); and Senior Vice President and General Auditor of American Express Company (financial services company) (July 1998-February 2003). Oversees 53 portfolios in the OppenheimerFunds complex. Ms. Miller has served on the Boards of certain Oppenheimer funds since August 2004, during which time she has become familiar with the Fund’s (and other Oppenheimer funds’) financial, accounting, regulatory and investment matters and has contributed to the Boards’ deliberations. |
| |
Joel W. Motley, Trustee (since 2013) Year of Birth: 1952 | | Director of Greenwall Foundation (since October 2013); Member of the Vestry of Trinity Wall Street (since April 2012); Director of Southern Africa Legal Services Foundation (since March 2012); Board Member of Pulitzer Center for Crisis Reporting (non-profit journalism) (since March 2011); Managing Director of Public Capital Advisors, LLC (privately-held financial advisor) (since January 2006); Managing Director of Carmona Motley, Inc. (privately-held financial advisor) (since January 2002); Director of Columbia Equity Financial Corp. (privately-held financial advisor) (2002-2007); Managing Director of Carmona Motley Hoffman Inc. (privately-held financial advisor) (January 1998-December 2001); Member of the Finance and Budget Committee of the Council on Foreign Relations, Member of the Investment Committee and Board of Human Rights Watch (since July 2000) and Member of the Investment Committee and Board of Historic Hudson Valley (since February 2010). Oversees 53 portfolios in the OppenheimerFunds complex. Mr. Motley has served on the Boards of certain Oppenheimer funds since October 2002, during which time he has become familiar with the Fund’s (and other Oppenheimer funds’) financial, accounting, regulatory and investment matters and has contributed to the Boards’ deliberations. |
| |
Joanne Pace, Trustee (since 2013) Year of Birth: 1958 | | Board Director of Horizon Blue Cross Blue Shield of New Jersey (since November 2012); Advisory Board Director of The Alberleen Group LLC (since March, 2012); Advisory Council Member of 100 Women in Hedge Funds (non-profit) (since December, 2012); Advisory Council Member of Morgan Stanley Children’s Hospital (non-profit) (since May, 2012); Board Director of The Komera Project (non-profit) (since April, 2012); Advisory Board Director of The Agile Trading Group LLC (2012-2013); New York Advisory Board Director of Peace First (non-profit) (2010-2013); Senior Advisor of SECOR Asset Management, LP (2010-2011); Managing Director and Chief Operating Officer of Morgan Stanley |
41 OPPENHEIMER GLOBAL REAL ESTATE FUND
TRUSTEES AND OFFICERS Unaudited / Continued
| | |
| |
Joanne Pace, Continued | | Investment Management (2006-2010); Partner and Chief Operating Officer of FrontPoint Partners, LLC (hedge fund) (2005-2006); held the following positions at Credit Suisse: Managing Director (2003-2005); Global Head of Human Resources and member of Executive Board and Operating Committee (2004-2005), Global Head of Operations and Product Control (2003-2004); held the following positions at Morgan Stanley: Managing Director (1997-2003), Controller and Principal Accounting Officer (1999-2003); Chief Financial Officer (temporary assignment) for the Oversight Committee, Long Term Capital Management (1998-1999). Lead Independent Director and Chair of the Audit and Nominating Committee of The Global Chartist Fund, LLC of Oppenheimer Asset Management (2011-2012); Board Director of Managed Funds Association (2008-2010); Board Director of Morgan Stanley Foundation (2007-2010) and Investment Committee Chair (2008-2010). Oversees 53 portfolios in the OppenheimerFunds complex. Ms. Pace has served on the Boards of certain Oppenheimer funds since November 2012, including as an Advisory Board Member for certain Oppenheimer funds, during which time she has become familiar with the Fund’s (and other Oppenheimer funds’) financial, accounting, regulatory and investment matters and has contributed to the Board’s deliberations. For purposes of this report, Ms. Pace is identified as a Trustee. |
| |
Daniel Vandivort, Trustee (since 2014) Year of Birth: 1954 | | Chairman and Lead Independent Director/Trustee (March 2010-September 2014), Chairman of the Audit Committee (March 2009-September 2014) and Director/Trustee (December 2008-September 2014) of the Board of Directors/Trustees of Value Line Funds; Trustee, Board of Trustees of Huntington Disease Foundation of America (June 2007-December 2013): Trustee, Board of Trustees, RIM Retirement Savings Plan (2005-2007); President and Chief Investment Officer, Robeco Investment Management, formerly known as Weiss Peck and Greer (January 2005-June 2007); Member, Management Committee of Robeco Investment Management (2001-2007); Chairman and Trustee of the Board of Trustees of Weiss, Peck and Greer Funds (2004-2005); Managing Director and Head of Fixed Income, Weiss, Peck and Greer (November 1994-January 2005); Managing Director and Head of Fixed Income, CS First Boston Investment Management (January 1992-November 1994); Director, Global Product Development, First Boston Asset Management (November 1989-January 1992); Vice President, Fixed Income Sales, First Boston Corp. (May 1984-November 1989). Oversees 53 portfolios in the OppenheimerFunds complex. Mr. Vandivort has served on the Boards of certain Oppenheimer funds since 2014, during which time he has become familiar with the Fund’s (and other Oppenheimer funds’) financial, accounting, regulatory and investment matters and has contributed to the Boards’ deliberations. |
| | |
| INTERESTED TRUSTEES | | Mr. Glavin is an “Interested Trustee” because he is affiliated with the Manager and the Sub-Adviser by virtue of his positions as director of the Sub-Adviser, and as a shareholder of the Sub-Adviser’s parent company. As a Trustee, he serves for an indefinite term, or until his resignation, retirement, death or removal. Mr. Glavin’s address is 225 Liberty Street, New York, New York 10281-1008. |
42 OPPENHEIMER GLOBAL REAL ESTATE FUND
| | |
INTERESTED TRUSTEES Continued | | Mr. Steinmetz is an “Interested Trustee” because he is affiliated with the Manager and the Sub-Adviser by virtue of his positions as Chairman of the Sub-Adviser and officer and director of the Manager. Both as a Trustee and as an officer, Mr. Steinmetz serves for an indefinite term, or until his resignation, retirement, death or removal. Mr. Steinmetz’s address is 225 Liberty Street, New York, New York 10281-1008. |
| |
William F. Glavin, Jr., Trustee (since 2013) Year of Birth: 1958 | | Chairman of the Sub-Adviser (July 2014 -December 2014 and December 2009-December 2012) and Director of the Sub-Adviser (since January 2009); Chairman, Director and Chief Executive Officer (January 2013-June 2014) of the Manager; President of the Manager (January 2013-May 2013); Chief Executive Officer (January 2009-December 2012); President of the Sub-Adviser (May 2009-December 2012); Management Director (June 2009-June 2014), President (December 2009-June 2014) and Chief Executive Officer (January 2011-June 2014) of Oppenheimer Acquisition Corp. (“OAC”) (the Sub-Adviser’s parent holding company); Director of Oppenheimer Real Asset Management, Inc. (March 2010-June 2014); Executive Vice President (March 2006-February 2009) and Chief Operating Officer (July 2007-February 2009) of Massachusetts Mutual Life Insurance Company (OAC’s parent company); Director (May 2004-March 2006) and Chief Operating Officer and Chief Compliance Officer (May 2004-January 2005), President (January 2005-March 2006) and Chief Executive Officer (June 2005-March 2006) of Babson Capital Management LLC; Director (March 2005-March 2006), President (May 2003-March 2006) and Chief Compliance Officer (July 2005-March 2006) of Babson Capital Securities, Inc. (a broker-dealer); President (May 2003-March 2006) of Babson Investment Company, Inc.; Director (May 2004-August 2006) of Babson Capital Europe Limited; Director (May 2004-October 2006) of Babson Capital Guernsey Limited; Director (May 2004-March 2006) of Babson Capital Management LLC; Non-Executive Director (March 2005-March 2007) of Baring Asset Management Limited; Director (February 2005-June 2006) Baring Pension Trustees Limited; Director and Treasurer (December 2003-November 2006) of Charter Oak Capital Management, Inc.; Director (May 2006-September 2006) of C.M. Benefit Insurance Company; Director (May 2008-June 2009) and Executive Vice President (June 2007-July 2009) of C.M. Life Insurance Company; President (March 2006-May 2007) of MassMutual Assignment Company; Director (January 2005-December 2006), Deputy Chairman (March 2005-December 2006) and President (February 2005-March 2005) of MassMutual Holdings (Bermuda) Limited; Director (May 2008-June 2009) and Executive Vice President (June 2007-July 2009) of MML Bay State Life Insurance Company; Chief Executive Officer and President (April 2007-January 2009) of MML Distributors, LLC; and Chairman (March 2006-December 2008) and Chief Executive Officer (May 2007-December 2008) of MML Investors Services, Inc. An officer of 91 portfolios in the OppenheimerFunds complex. Mr. Glavin has served on the Boards of certain Oppenheimer funds since December 2009, during which time he has become familiar with the Fund’s (and other Oppenheimer funds’) financial, accounting, regulatory and investment matters and has contributed to the Boards’ deliberations. |
| |
Arthur P. Steinmetz, Trustee (since 2015), President and Principal Executive Officer (since 2014) Year of Birth: 1958 | | Chairman of the Sub-Adviser (since January 2015); CEO and Chairman of the Manager (since July 2014), President of the Manager (since May 2013), a Director of the Manager (since January 2013), Director of the Sub-Adviser (since July 2014), President, Management Director and CEO of Oppenheimer Acquisition Corp. (the Sub-Adviser’s parent holding company) (since July 2014), |
43 OPPENHEIMER GLOBAL REAL ESTATE FUND
TRUSTEES AND OFFICERS Unaudited / Continued
| | |
| |
Arthur P. Steinmetz, Continued | | and President and Director of OFI SteelPath, Inc. (since January 2013). Chief Investment Officer of the OppenheimerFunds advisory entities from (January 2013-December 2013); Executive Vice President of the Manager (January 2013-May 2013); Chief Investment Officer of the Sub-Adviser (October 2010-December 2012); Chief Investment Officer, Fixed-Income, of the Sub-Adviser (April 2009-October 2010); Executive Vice President of the Sub-Adviser (October 2009-December 2012); Director of Fixed Income of the Sub-Adviser (January 2009-April 2009); and a Senior Vice President of the Sub-Adviser (March 1993-September 2009). An officer of 91 portfolios in the OppenheimerFunds complex. |
| | |
OTHER OFFICERS OF THE FUND | | The addresses of the Officers in the chart below are as follows: for Mr. Gabinet, Mss. Sexton and Picciotto, 225 Liberty Street, New York, New York 10281-1008, for Mr. Wixted, 6803 S. Tucson Way, Centennial, Colorado 80112-3924. Each Officer serves for an indefinite term or until his or her resignation, retirement, death or removal. |
| |
Arthur S. Gabinet, Secretary and Chief Legal Officer (since 2013) Year of Birth: 1958 | | Executive Vice President, Secretary and General Counsel of the Manager (since January 2013); General Counsel OFI SteelPath, Inc. (since January 2013); Executive Vice President (May 2010-December 2012) and General Counsel (since January 2011) of the Sub-Adviser; General Counsel of the Distributor (since January 2011); General Counsel of Centennial Asset Management Corporation (January 2011-December 2012); Executive Vice President (January 2011-December 2012) and General Counsel of HarbourView Asset Management Corporation (since January 2011); Assistant Secretary (since January 2011) and Director (since January 2011) of OppenheimerFunds International Ltd. and OppenheimerFunds plc; Director of Oppenheimer Real Asset Management, Inc. (January 2011-December 2012) and General Counsel (since January 2011); Executive Vice President (January 2011-December 2011) and General Counsel of Shareholder Financial Services, Inc. and Shareholder Services, Inc. (since January 2011); Executive Vice President (January 2011-December 2012) and General Counsel of OFI Private Investments Inc. (since January 2011); Vice President of OppenheimerFunds Legacy Program (January 2011-December 2011); Executive Vice President (January 2011-December 2012) and General Counsel of OFI Institutional Asset Management, Inc. (since January 2011); General Counsel, Asset Management of the Sub-Adviser (May 2010-December 2010); Principal, The Vanguard Group (November 2005-April 2010); District Administrator, U.S. Securities and Exchange Commission (January 2003-October 2005). An officer of 91 portfolios in the OppenheimerFunds complex. |
| |
Jennifer Sexton, Vice President and Chief Business Officer (since 2014) Year of Birth: 1969 | | Senior Vice President of OppenheimerFunds Distributor, Inc. (since June 2014); Vice President of OppenheimerFunds Distributor, Inc. (April 2006-June 2014); Vice President of the Sub-Adviser (January 1998-March 2006); Assistant Vice President of the Sub-Adviser (October 1991-December 1998). An officer of 91 portfolios in the OppenheimerFunds complex. |
| |
Mary Ann Picciotto, Chief Compliance Officer and Chief Anti-Money Laundering Officer (since 2014) Year of Birth: 1973 | | Senior Vice President and Chief Compliance Officer of the Manager (since March 2014); Chief Compliance Officer of the Sub-Adviser, OFI SteelPath, Inc., OFI Global Trust Company, OFI Global Institutional, Inc., Oppenheimer Real Asset Management, Inc., OFI Private Investments, Inc., Harborview Asset Management Corporation, Trinity Investment Management Corporation, and Shareholder Services, Inc. (since March 2014); Managing Director of Morgan Stanley Investment Management Inc. and certain of its various affiliated entities; Chief Compliance Officer of various Morgan Stanley Funds (May 2010-January 2014); |
44 OPPENHEIMER GLOBAL REAL ESTATE FUND
| | |
Mary Ann Picciotto, Continued | | Chief Compliance Officer of Morgan Stanley Investment Management Inc. (April 2007-January 2014). An officer of 91 portfolios in the OppenheimerFunds complex. |
| |
Brian W. Wixted, Treasurer and Principal Financial & Accounting Officer (since 2013) Year of Birth: 1959 | | Senior Vice President of the Manager (since January 2013); Treasurer of the Sub-Adviser, HarbourView Asset Management Corporation, Shareholder Financial Services, Inc., Shareholder Services, Inc., and Oppenheimer Real Asset Management, Inc. (March 1999-June 2008), OFI Private Investments, Inc. (March 2000-June 2008), OppenheimerFunds International Ltd. and OppenheimerFunds plc (since May 2000), OFI Institutional Asset Management, Inc. (November 2000-June 2008), and OppenheimerFunds Legacy Program (charitable trust program established by the Sub-Adviser) (June 2003-December 2011); Treasurer and Chief Financial Officer of OFI Trust Company (since May 2000); Assistant Treasurer of Oppenheimer Acquisition Corporation (March 1999-June 2008). An officer of 91 portfolios in the OppenheimerFunds complex. |
The Fund’s Statement of Additional Information contains additional information about the Fund’s Trustees and Officers and is available without charge upon request, by calling 1.800.CALL OPP (225.5677).
45 OPPENHEIMER GLOBAL REAL ESTATE FUND
OPPENHEIMERGLOBAL REAL ESTATE FUND
| | |
Manager | | OFI Global Asset Management, Inc. |
| |
Sub-Adviser | | OppenheimerFunds, Inc. |
| |
Sub-Sub-Adviser | | Cornerstone Real Estate Advisers LLC |
| |
Distributor | | OppenheimerFunds Distributor, Inc. |
| |
Transfer and Shareholder Servicing Agent | | OFI Global Asset Management, Inc. |
| |
Sub-Transfer Agent | | Shareholder Services, Inc. DBA OppenheimerFunds Services |
| |
Independent Registered Public Accounting Firm | | KPMG LLP |
| |
Legal Counsel | | Kramer Levin Naftalis & Frankel LLP |
© 2015 OppenheimerFunds, Inc. All rights reserved.
46 OPPENHEIMER GLOBAL REAL ESTATE FUND
PRIVACY POLICY NOTICE
As an Oppenheimer fund shareholder, you are entitled to know how we protect your personal information and how we limit its disclosure.
Information Sources
We obtain nonpublic personal information about our shareholders from the following sources:
| — | | Applications or other forms |
| — | | When you create a user ID and password for online account access |
| — | | When you enroll in eDocs Direct, our electronic document delivery service |
| — | | Your transactions with us, our affiliates or others |
| — | | A software program on our website, often referred to as a “cookie,” which indicates which parts of our site you’ve visited |
| — | | When you set up challenge questions to reset your password online |
If you visit oppenheimerfunds.com and do not log on to the secure account information areas, we do not obtain any personal information about you. When you do log on to a secure area, we do obtain your user ID and password to identify you. We also use this information to provide you with products and services you have requested, to inform you about products and services that you may be interested in and assist you in other ways.
We do not collect personal information through our website unless you willingly provide it to us, either directly by email or in those areas of the website that request information. In order to update your personal information (including your mailing address, email address and phone number) you must first log on and visit your user profile.
If you have set your browser to warn you before accepting cookies, you will receive the warning message with each cookie. You can refuse cookies by turning them off in your browser. However, doing so may limit your access to certain sections of our website.
We use cookies to help us improve and manage our website. For example, cookies help us recognize new versus repeat visitors to the site, track the pages visited, and enable some special features on the website. This data helps us provide a better service for our website visitors.
Protection of Information
We do not disclose any non-public personal information (such as names on a customer list) about current or former customers to anyone, except as permitted by law.
Disclosure of Information
Copies of confirmations, account statements and other documents reporting activity in your fund accounts are made available to your financial advisor (as designated by you). We may also use details about you and your investments to help us, our financial service affiliates, or firms that jointly market their financial products and services with ours, to better serve your investment needs or suggest financial services or educational material that may be of interest to you. If this requires us to provide you with an opportunity to “opt in” or “opt out” of such information sharing with a firm not affiliated with us, you will receive notification on how to do so, before any such sharing takes place.
Right of Refusal
We will not disclose your personal information to unaffiliated third parties (except as permitted by law), unless we first offer you a reasonable opportunity to refuse or “opt out” of such disclosure.
47 OPPENHEIMER GLOBAL REAL ESTATE FUND
PRIVACY POLICY NOTICE Continued
Internet Security and Encryption
In general, the email services provided by our website are encrypted and provide a secure and private means of communication with us. To protect your own privacy, confidential and/or personal information should only be communicated via email when you are advised that you are using a secure website.
As a security measure, we do not include personal or account information in non-secure emails, and we advise you not to send such information to us in non-secure emails. Instead, you may take advantage of the secure features of our website to encrypt your email correspondence. To do this, you will need to use a browser that supports Secure Sockets Layer (SSL) protocol.
We do not guarantee or warrant that any part of our website, including files available for download, are free of viruses or other harmful code. It is your responsibility to take appropriate precautions, such as use of an anti-virus software package, to protect your computer hardware and software.
| — | | All transactions, including redemptions, exchanges and purchases, are secured by SSL and 256-bit encryption. SSL is used to establish a secure connection between your PC and OppenheimerFunds’ server. It transmits information in an encrypted and scrambled format. |
| — | | Encryption is achieved through an electronic scrambling technology that uses a “key” to code and then decode the data. Encryption acts like the cable converter box you may have on your television set. It scrambles data with a secret code so that no one can make sense of it while it is being transmitted. When the data reaches its destination, the same software unscrambles the data. |
| — | | You can exit the secure area by either closing your browser, or for added security, you can use the Log Out button before you close your browser. |
Other Security Measures
We maintain physical, electronic and procedural safeguards to protect your personal account information. Our employees and agents have access to that information only so that they may offer you products or provide services, for example, when responding to your account questions.
How You Can Help
You can also do your part to keep your account information private and to prevent unauthorized transactions. If you obtain a user ID and password for your account, do not allow it to be used by anyone else. Also, take special precautions when accessing your account on a computer used by others.
Who We Are
This joint notice describes the privacy policies of the Oppenheimer funds, OppenheimerFunds, Inc., each of its investment adviser subsidiaries, OppenheimerFunds Distributor, Inc. and OFI Global Trust Co. It applies to all Oppenheimer fund accounts you presently have, or may open in the future, using your Social Security number—whether or not you remain a shareholder of our funds. This notice was last updated March 2015. In the event it is updated or changed, we will post an updated notice on our website at oppenheimerfunds.com. If you have any questions about this privacy policy, write to us at P.O. Box 5270, Denver, CO 80217-5270, email us by clicking on the Contact Us section of our website at oppenheimerfunds.com or call us at 1.800.CALL OPP (225.5677).
48 OPPENHEIMER GLOBAL REAL ESTATE FUND
| | | | |
| |  | | |
| | |
| | Visit us at oppenheimerfunds.com for 24-hr access to account information and transactions or call us at 800 CALL OPP (800 225 5677) for 24-hr automated information and automated transactions. Representatives also available Mon–Fri 8am–8pm ET. | | |
| | | | |
| | | | |
| | | | |
| | | | |
| | | | |
| | | | |
| | | | |
| | | | |
| Visit Us | | | | |
| | |
| oppenheimerfunds.com | | | | |
| | |
| Call Us | | | | |
| | |
| 800 225 5677 | | | | |
| | |
Follow Us | | | | |
| | |
 | | Oppenheimer funds are distributed by OppenheimerFunds Distributor, Inc. | | |
| | 225 Liberty Street, New York, NY 10281-1008 | | |
| | © 2015 OppenheimerFunds Distributor, Inc. All rights reserved. | | |
| | RA1379.001.0415 June 25, 2015 | | |
Item 2. Code of Ethics.
The registrant has adopted a code of ethics that applies to the registrant’s principal executive officer, principal financial officer, principal accounting officer or controller or persons performing similar functions.
Item 3. Audit Committee Financial Expert.
The Board of Trustees of the registrant has determined that David Downes, the Board’s Audit Committee Chairman, is an audit committee financial expert and that Mr. Downes is “independent” for purposes of this Item 3.
Item 4. Principal Accountant Fees and Services.
The principal accountant for the audit of the registrant’s annual financial statements billed $35,000 in fiscal 2015 and $34,200 in fiscal 2014.
The principal accountant for the audit of the registrant’s annual financial statements billed no such fees in fiscal 2015 and no such fees in fiscal 2014.
The principal accountant for the audit of the registrant’s annual financial statements billed $888,588 in fiscal 2015 and $883,775 in fiscal 2014 to the registrant’s investment adviser or any entity controlling, controlled by, or under common control with the adviser that provides ongoing services to the registrant.
Such services include: Internal control reviews, GIPS attestation procedures, company reorganization, and system conversion testing
The principal accountant for the audit of the registrant’s annual financial statements billed no such fees in fiscal 2015 and no such fees in fiscal 2014.
The principal accountant for the audit of the registrant’s annual financial statements billed $550,189 in fiscal 2015 and $343,117 in fiscal 2014 to the registrant’s investment adviser or any entity controlling, controlled by, or under common control with the adviser that provides ongoing services to the registrant.
Such services include: tax compliance, tax planning and tax advice. Tax compliance generally involves preparation of original and amended tax returns, claims for a refund and tax payment-planning services. Tax planning and tax advice includes assistance with tax audits and appeals, tax advice related to mergers and acquisitions and requests for rulings or technical advice from taxing authorities.
The principal accountant for the audit of the registrant’s annual financial statements billed no such fees in fiscal 2015 and no such fees in fiscal 2014.
The principal accountant for the audit of the registrant’s annual financial statements billed no such fees in fiscal 2015 and no such fees in fiscal 2014 to the registrant’s investment adviser or any entity controlling, controlled by, or under common control with the adviser that provides ongoing services to the registrant.
Such fees would include the cost to the principal accountant of attending audit committee meetings and consultations regarding the registrant’s retirement plan with respect to its Trustees.
| (e) | (1) During its regularly scheduled periodic meetings, the registrant’s audit committee will pre-approve all audit, audit-related, tax and other services to be provided by the principal accountants of the registrant. |
The audit committee has delegated pre-approval authority to its Chairman for any subsequent new engagements that arise between regularly scheduled meeting dates provided that any fees such pre-approved are presented to the audit committee at its next regularly scheduled meeting.
Under applicable laws, pre-approval of non-audit services may be waived provided that: 1) the aggregate amount of all such services provided constitutes no more than five percent of the total amount of fees paid by the registrant to its principal accountant during the fiscal year in which services are provided 2) such services were not recognized by the registrant at the time of engagement as non-audit services and 3) such services are promptly brought to the attention of the audit committee of the registrant and approved prior to the completion of the audit.
(2) 0%
| (f) | Not applicable as less than 50%. |
| (g) | The principal accountant for the audit of the registrant’s annual financial statements billed $1,438,777 in fiscal 2015 and $1,226,892 in fiscal 2014 to the registrant and the registrant’s investment adviser or any entity controlling, controlled by, or under common control with the adviser that provides ongoing services to the registrant related to non-audit fees. Those billings did not include any prohibited non-audit services as defined by the Securities Exchange Act of 1934. |
| (h) | The registrant’s audit committee of the board of Trustees has considered whether the provision of non-audit services that were rendered to the registrant’s investment adviser, |
| | and any entity controlling, controlled by, or under common control with the investment adviser that provides ongoing services to the registrant that were not pre-approved pursuant to paragraph (c)(7)(ii) of Rule 2-01 of Regulation S-X is compatible with maintaining the principal accountant’s independence. No such services were rendered. |
Item 5. Audit Committee of Listed Registrants
Not applicable.
Item 6. Schedule of Investments.
a) Not applicable. The complete schedule of investments is included in Item 1 of this Form N-CSR.
b) Not applicable.
Item 7. Disclosure of Proxy Voting Policies and Procedures for Closed-End Management Investment Companies.
Not applicable.
Item 8. Portfolio Managers of Closed-End Management Investment Companies.
Not applicable.
Item 9. Purchases of Equity Securities by Closed-End Management Investment Company and Affiliated Purchasers.
Not applicable.
Item 10. Submission of Matters to a Vote of Security Holders.
The Fund’s Governance Committee Provisions with Respect to Nominations of Directors/Trustees to the Respective Boards
None
Item 11. Controls and Procedures.
Based on their evaluation of the registrant’s disclosure controls and procedures (as defined in rule 30a-3(c) under the Investment Company Act of 1940 (17 CFR 270.30a-3(c)) as of 4/30/2015, the registrant’s principal executive officer and principal financial officer found the registrant’s disclosure controls and procedures to provide reasonable assurances that information required to be disclosed by the registrant in the reports that it files under the Securities Exchange Act of 1934 (a) is accumulated and communicated to registrant’s management, including its principal executive officer and principal financial officer, to allow timely decisions regarding required disclosure, and (b) is recorded, processed, summarized and reported, within the time periods specified in the rules and forms adopted by the U.S. Securities and Exchange Commission.
There have been no changes in the registrant’s internal controls over financial reporting that occurred during the registrant’s second fiscal quarter of the period covered by this report that have materially affected, or are reasonably likely to materially affect, the registrant’s internal control over financial reporting.
Item 12. Exhibits.
| (a) | (1) Exhibit attached hereto. |
(2) Exhibits attached hereto.
(3) Not applicable.
| (b) | Exhibit attached hereto. |
SIGNATURES
Pursuant to the requirements of the Securities Exchange Act of 1934 and the Investment Company Act of 1940, the registrant has duly caused this report to be signed on its behalf by the undersigned, thereunto duly authorized.
Oppenheimer Global Real Estate Fund
| | |
| By: | | /s/ Arthur P. Steinmetz |
| | Arthur P. Steinmetz |
| | Principal Executive Officer |
| Date: | | 6/11/2015 |
Pursuant to the requirements of the Securities Exchange Act of 1934 and the Investment Company Act of 1940, this report has been signed below by the following persons on behalf of the registrant and in the capacities and on the dates indicated.
| | |
| By: | | /s/ Arthur P. Steinmetz |
| | Arthur P. Steinmetz |
| | Principal Executive Officer |
| Date: | | 6/11/2015 |
| |
| By: | | /s/ Brian W. Wixted |
| | Brian W. Wixted |
| | Principal Financial Officer |
| Date: | | 6/11/2015 |