Exhibit 99.2
Third Quarter 2017 Earnings Call October 26, 2017
Forward-looking statements Certain statements contained in this presentation may constitute forward-looking statements within the meaning of the Private Securities Litigation Reform Act of 1995. This presentation may contain “forward looking statements” with respect to our business, results of operations and financial condition, and our expectations or beliefs concerning future events and conditions. You can identify forward-looking statements because they contain words such as, but not limited to, “believes,” “expects,” “may,” “should,” “approximately,” “anticipates,” “estimates,” “intends,” “plans,” “targets,” likely,” “will,” “would,” “could” and similar expressions (or the negative of these terminologies or expressions). All forward-looking statements involve risks and uncertainties. Many risks and uncertainties are inherent in our industry and markets. Others are more specific to our business and operations. These risks and uncertainties include, but are not limited to, the ability of Constellium and Wise Metals to achieve expected synergies and the timing thereof, Constellium’s increased levels of indebtedness which could limit Constellium’s operating flexibility and opportunities; the potential failure to retain key employees, the loss of customers, suppliers and other business relationships; disruptions to business operations; slower or lower than expected growth in the North American market for Body-in-White aluminium rolled products, and other risk factors set forth under the heading “Risk Factors” in our Annual Report on Form 20-F, and as described from time to time in subsequent reports filed with the U.S. Securities and Exchange Commission. The occurrence of the events described and the achievement of the expected results depend on many events, some or all of which are not predictable or within our control. Consequently, actual results may differ materially from the forward-looking statements contained in this presentation. We undertake no obligation to update or revise any forward-looking statement as a result of new information, future events or otherwise, except as required by law. Third Quarter 2017 – Earnings Call 2
Non-GAAP measures This presentation includes information regarding certain non-GAAP financial measures, including Adjusted EBITDA, Adjusted EBITDA per metric ton, Free Cash Flow and Net Debt. These measures are presented because management uses this information to monitor and evaluate financial results and trends and believes this information to also be useful for investors. Adjusted EBITDA measures are frequently used by securities analysts, investors and other interested parties in their evaluation of Constellium and in comparison to other companies, many of which present an adjusted EBITDA-related performance measure when reporting their results. Adjusted EBITDA, Adjusted EBITDA per Metric Ton, Free Cash Flow and Net Debt are not presentations made in accordance with IFRS and may not be comparable to similarly titled measures of other companies. These non-GAAP financial measures supplement our IFRS disclosures and should not be considered an alternative to the IFRS measures. This presentation provides a reconciliation of non-GAAP financial measures to the most directly comparable GAAP financial measures. We are not able to provide a reconciliation of Adjusted EBITDA guidance to net income, the comparable GAAP measure, because certain items that are excluded from adjusted EBITDA cannot be reasonably predicted or are not in our control. In particular, we are unable to forecast the timing or magnitude of realized and unrealized gains and losses on derivative instruments, metal lag, impairment or restructuring charges, or taxes without unreasonable efforts, and these items could significantly impact, either individually or in the aggregate, our net income in the future. Third Quarter 2017 – Earnings Call 3
Jean-Marc Germain Chief Executive Officer
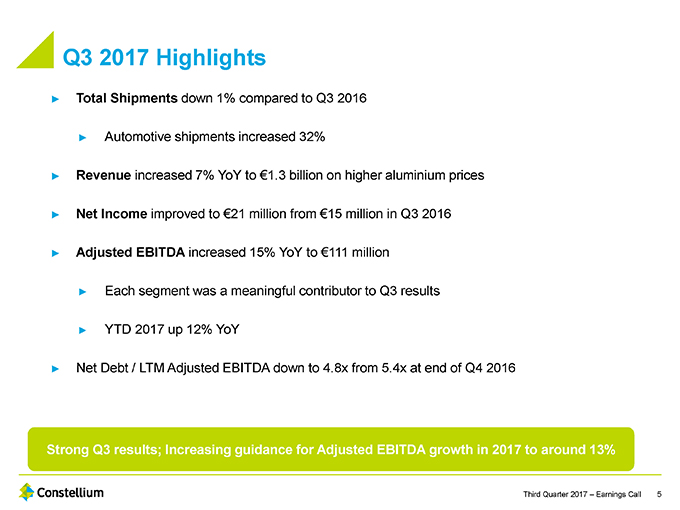
Q3 2017 Highlights Total Shipments down 1% compared to Q3 2016 Automotive shipments increased 32% Revenue increased 7% YoY to 1.3 billion on higher aluminium prices Net Income improved to 21 million from 15 million in Q3 2016 Adjusted EBITDA increased 15% YoY to 111 million Each segment was a meaningful contributor to Q3 results YTD 2017 up 12% YoY Net Debt / LTM Adjusted EBITDA down to 4.8x from 5.4x at end of Q4 2016 Strong Q3 results; Increasing guidance for Adjusted EBITDA growth in 2017 to around 13% Third Quarter 2017 ? Earnings Call 5
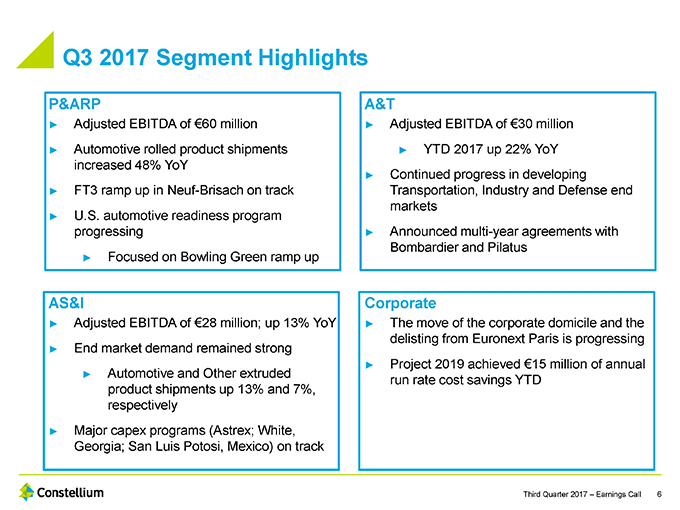
Q3 2017 Segment Highlights P&ARP A&T Adjusted EBITDA of €60 million Adjusted EBITDA of €30 million Automotive rolled product shipments YTD 2017 up 22% YoY increased 48% YoY Continued progress in developing FT3 ramp up in Neuf-Brisach on track Transportation, Industry and Defense end markets U.S. automotive readiness program progressing Announced multi-year agreements with Bombardier and Pilatus Focused on Bowling Green ramp up AS&I Corporate Adjusted EBITDA of €28 million; up 13% YoY The move of the corporate domicile and the delisting from Euronext Paris is progressing End market demand remained strong Project 2019 achieved €15 million of annual Automotive and Other extruded run rate cost savings YTD product shipments up 13% and 7%, respectively Major capex programs (Astrex; White, Georgia; San Luis Potosi, Mexico) on track Third Quarter 2017 – Earnings Call 6
Peter Matt Chief Financial Officer
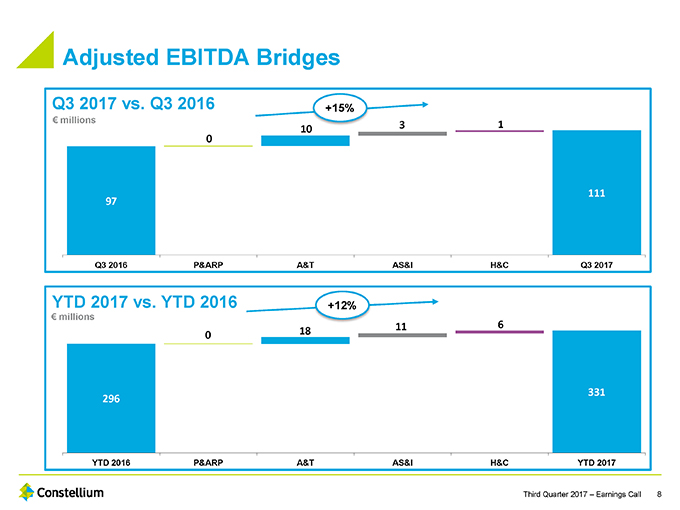
Adjusted EBITDA Bridges Q3 2017 vs. Q3 2016 +15% € millions 3 1 10 0 97 111 Q3 2016 P&ARP A&T AS&I H&C Q3 2017 YTD 2017 vs. YTD 2016 +12% € millions 6 11 0 18 331 296 YTD 2016 P&ARP A&T AS&I H&C YTD 2017 Third Quarter 2017 – Earnings Call 8
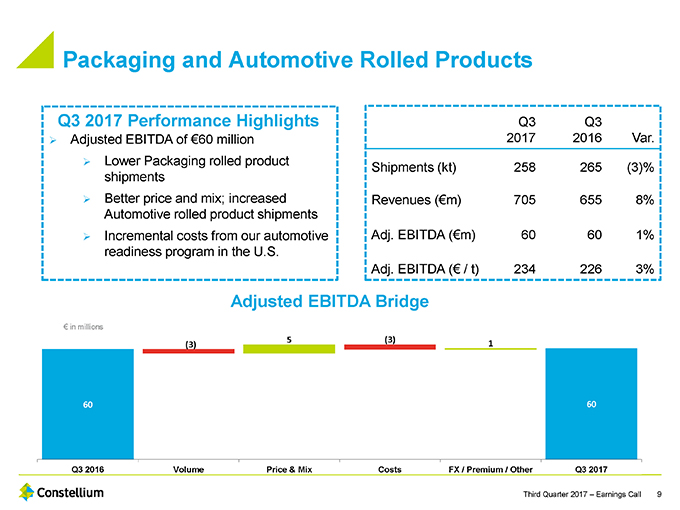
Packaging and Automotive Rolled Products Q3 2017 Performance Highlights Q3 Q3 Adjusted EBITDA of €60 million 2017 2016 Var. Lower Packaging rolled product Shipments (kt) 258 265 (3)% shipments Better price and mix; increased Revenues (€m) 705 655 8% Automotive rolled product shipments Incremental costs from our automotive Adj. EBITDA (€m) 60 60 1% readiness program in the U.S. Adj. EBITDA (€ / t) 234 226 3% Adjusted EBITDA Bridge € in millions 5 (3) (3) 1 60 60 Q3 2016 Volume Price & Mix Costs FX / Premium / Other Q3 2017 Third Quarter 2017 – Earnings Call 9
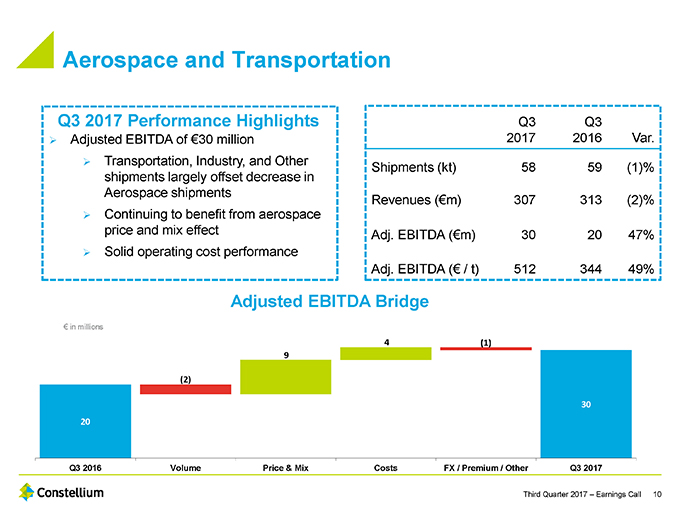
Aerospace and Transportation Q3 2017 Performance Highlights Q3 Q3 Adjusted EBITDA of €30 million 2017 2016 Var. Transportation, Industry, and Other Shipments (kt) 58 59 (1)% shipments largely offset decrease in Aerospace shipments Revenues (€m) 307 313 (2)% Continuing to benefit from aerospace price and mix effect Adj. EBITDA (€m) 30 20 47% Solid operating cost performance Adj. EBITDA (€ / t) 512 344 49% Adjusted EBITDA Bridge € in millions 4 (1) 9 (2) 30 20 Q3 2016 Volume Price & Mix Costs FX / Premium / Other Q3 2017 Third Quarter 2017 – Earnings Call 10
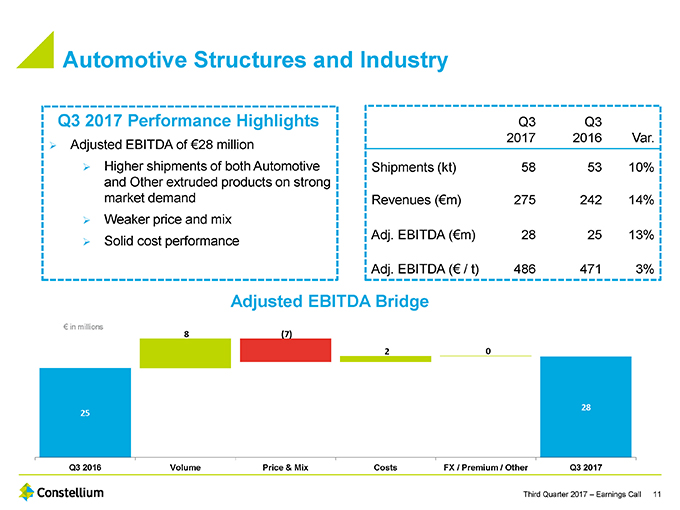
Automotive Structures and Industry Q3 2017 Performance Highlights Q3 Q3 2017 2016 Var. Adjusted EBITDA of €28 million Higher shipments of both Automotive Shipments (kt) 58 53 10% and Other extruded products on strong market demand Revenues (€m) 275 242 14% Weaker price and mix Adj. EBITDA (€m) 28 25 13% Solid cost performance Adj. EBITDA (€ / t) 486 471 3% Adjusted EBITDA Bridge € in millions 8 (7) 2 0 28 25 Q3 2016 Volume Price & Mix Costs FX / Premium / Other Q3 2017 Third Quarter 2017 – Earnings Call 11
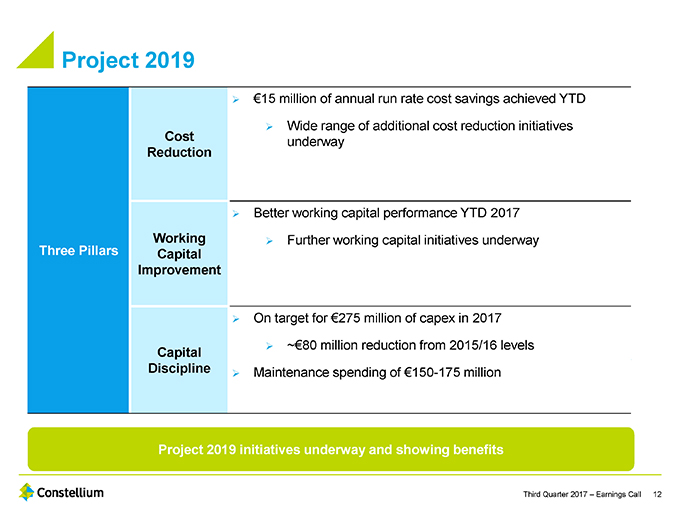
Project 2019 €15 million of annual run rate cost savings achieved YTD Wide range of additional cost reduction initiatives Cost underway Reduction Better working capital performance YTD 2017 Working Further working capital initiatives underway Three Pillars Capital Improvement On target for €275 million of capex in 2017 ~€80 million reduction from 2015/16 levels Capital Discipline Maintenance spending of €150-175 million Project 2019 initiatives underway and showing benefits Third Quarter 2017 – Earnings Call 12
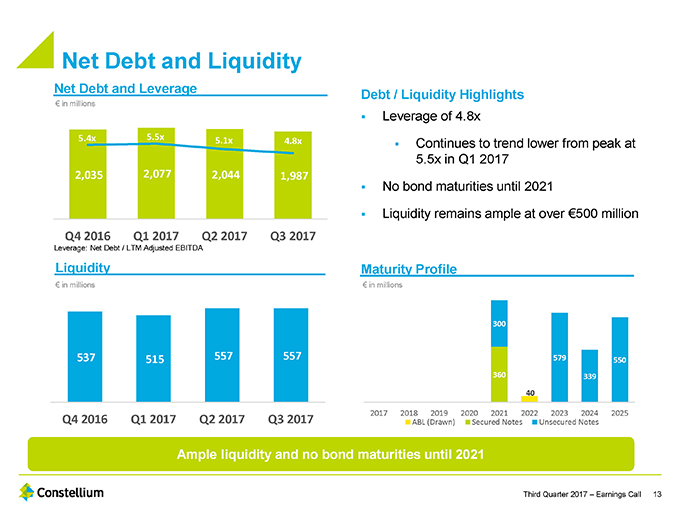
Net Debt and Liquidity Net Debt and Leverage Debt / Liquidity Highlights € in millions 2,500 8.x ? Leverage of 4.8x 7.x 2,000 5.4x 5.5x 6.x 5.1x 4.8x? Continues to trend lower from peak at 1,500 5.x 4.x 5.5x in Q1 2017 1,000 2,035 2,077 2,044 1,987 3.x ? No bond maturities until 2021 2.x 500 1.x ? Liquidity remains ample at over €500 million —.x Q4 2016 Q1 2017 Q2 2017 Q3 2017 Leverage: Net Debt / LTM Adjusted EBITDA Liquidity Maturity Profile € in millions € in millions 300 537 557 557 579 515 550 360 339 40 2017 2018 2019 2020 2021 2022 2023 2024 2025 Q4 2016 Q1 2017 Q2 2017 Q3 2017 ABL (Drawn) Secured Notes Unsecured Notes Ample liquidity and no bond maturities until 2021 Third Quarter 2017 – Earnings Call 13

Jean-Marc Germain Chief Executive Officer
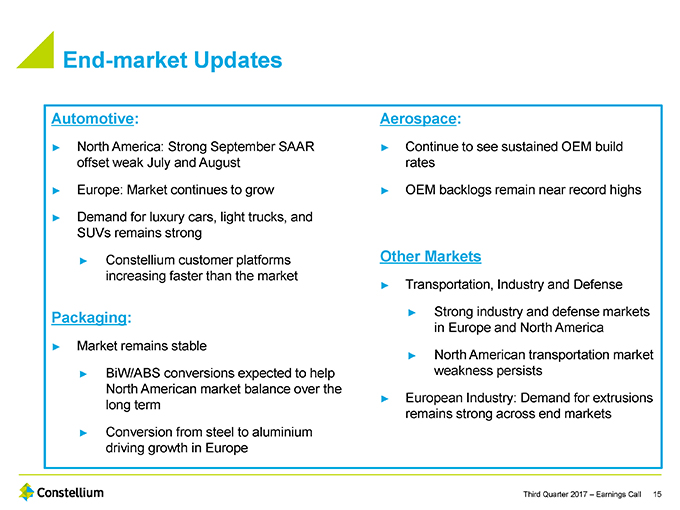
End-market Updates Automotive: Aerospace: North America: Strong September SAAR Continue to see sustained OEM build offset weak July and August rates Europe: Market continues to grow OEM backlogs remain near record highs Demand for luxury cars, light trucks, and SUVs remains strong Constellium customer platforms Other Markets increasing faster than the market Transportation, Industry and Defense Packaging: Strong industry and defense markets in Europe and North America Market remains stable North American transportation market BiW/ABS conversions expected to help weakness persists North American market balance over the European Industry: Demand for extrusions long term remains strong across end markets Conversion from steel to aluminium driving growth in Europe Third Quarter 2017 – Earnings Call 15
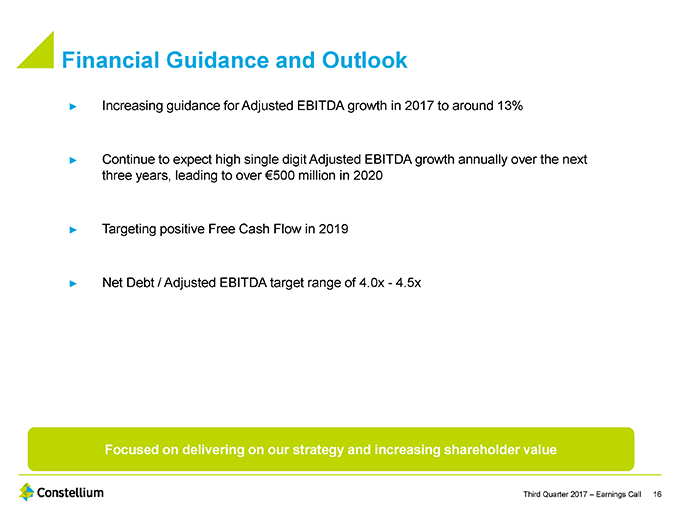
Financial Guidance and Outlook Increasing guidance for Adjusted EBITDA growth in 2017 to around 13% Continue to expect high single digit Adjusted EBITDA growth annually over the next three years, leading to over €500 million in 2020 Targeting positive Free Cash Flow in 2019 Net Debt / Adjusted EBITDA target range of 4.0x—4.5x Focused on delivering on our strategy and increasing shareholder value Third Quarter 2017 – Earnings Call 16

Q&A Third Quarter 2017 – Earnings Call 17

Appendix Third Quarter 2017 – Earnings Call 18
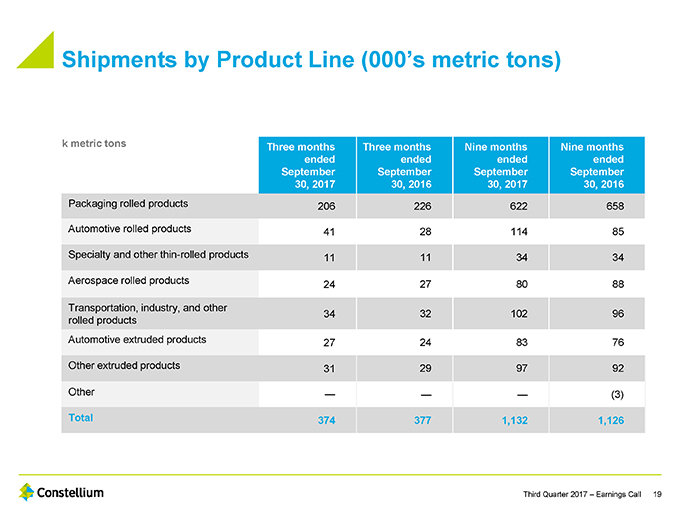
Shipments by Product Line (000’s metric tons) k metric tons Three months Three months Nine months Nine months ended ended ended ended September September September September 30, 2017 30, 2016 30, 2017 30, 2016 Packaging rolled products 206 226 622 658 Automotive rolled products 41 28 114 85 Specialty and other thin-rolled products 11 11 34 34 Aerospace rolled products 24 27 80 88 Transportation, industry, and other 34 32 102 96 rolled products Automotive extruded products 27 24 83 76 Other extruded products 31 29 97 92 Other — — — (3) Total 374 377 1,132 1,126 Third Quarter 2017 – Earnings Call 19
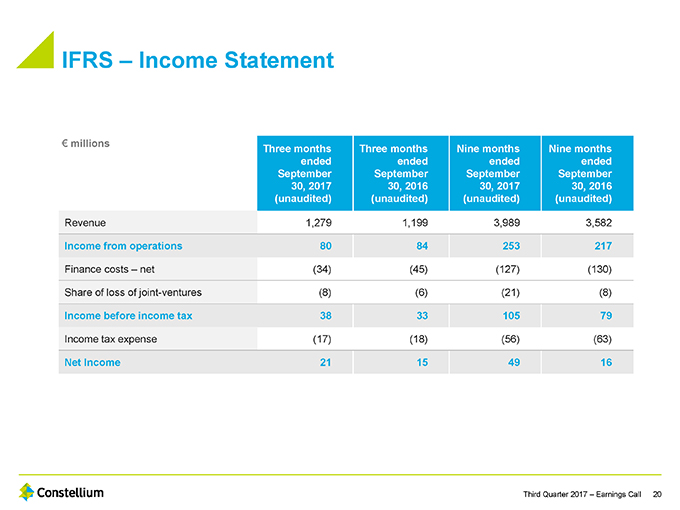
IFRS – Income Statement € millions Three months Three months Nine months Nine months ended ended ended ended September September September September 30, 2017 30, 2016 30, 2017 30, 2016 (unaudited) (unaudited) (unaudited) (unaudited) Revenue 1,279 1,199 3,989 3,582 Income from operations 80 84 253 217 Finance costs – net (34) (45) (127) (130) Share of loss of joint-ventures (8) (6) (21) (8) Income before income tax 38 33 105 79 Income tax expense (17) (18) (56) (63) Net Income 21 15 49 16 Third Quarter 2017 – Earnings Call 20
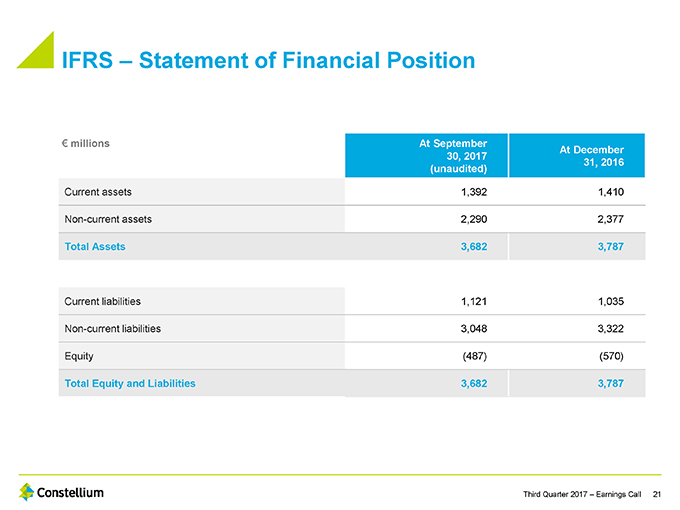
IFRS – Statement of Financial Position € millions At September At December 30, 2017 31, 2016 (unaudited) Current assets 1,392 1,410 Non-current assets 2,290 2,377 Total Assets 3,682 3,787 Current liabilities 1,121 1,035 Non-current liabilities 3,048 3,322 Equity (487) (570) Total Equity and Liabilities 3,682 3,787 Third Quarter 2017 – Earnings Call 21
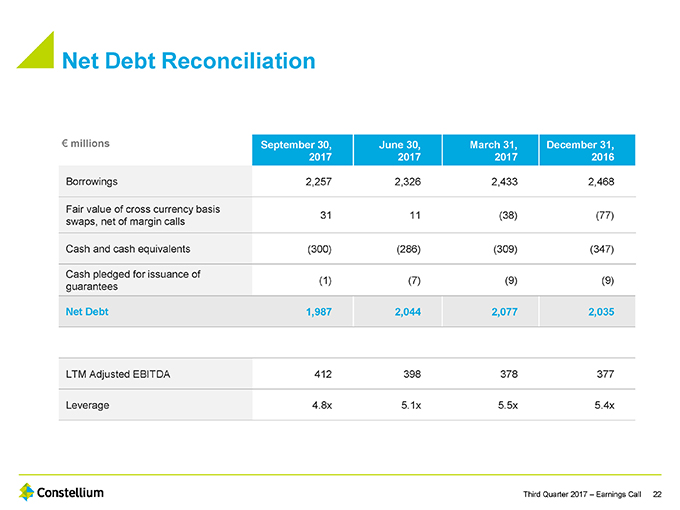
Net Debt Reconciliation € millions September 30, June 30, March 31, December 31, 2017 2017 2017 2016 Borrowings 2,257 2,326 2,433 2,468 Fair value of cross currency basis 31 11 (38) (77) swaps, net of margin calls Cash and cash equivalents (300) (286) (309) (347) Cash pledged for issuance of (1) (7) (9) (9) guarantees Net Debt 1,987 2,044 2,077 2,035 LTM Adjusted EBITDA 412 398 378 377 Leverage 4.8x 5.1x 5.5x 5.4x Third Quarter 2017 – Earnings Call 22
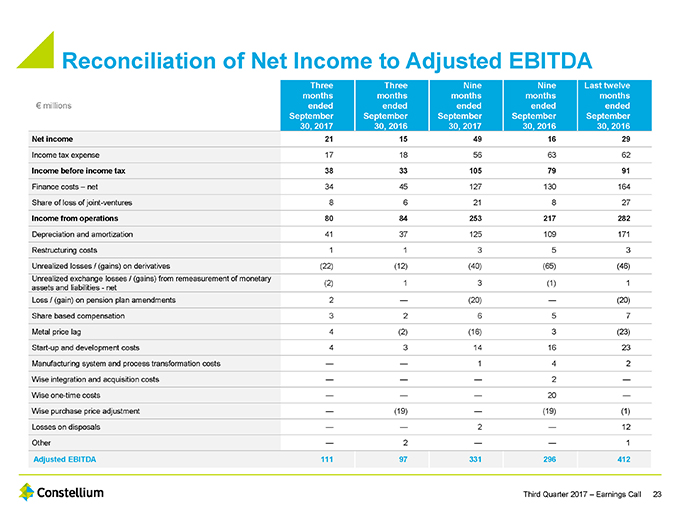
Reconciliation of Net Income to Adjusted EBITDA Three Three Nine Nine Last twelve months months months months months € millions ended ended ended ended ended September September September September September 30, 2017 30, 2016 30, 2017 30, 2016 30, 2016 Net income 21 15 49 16 29 Income tax expense 17 18 56 63 62 Income before income tax 38 33 105 79 91 Finance costs – net 34 45 127 130 164 Share of loss of joint-ventures 8 6 21 8 27 Income from operations 80 84 253 217 282 Depreciation and amortization 41 37 125 109 171 Restructuring costs 1 1 3 5 3 Unrealized losses / (gains) on derivatives (22) (12) (40) (65) (46) Unrealized exchange losses / (gains) from remeasurement of monetary (2) 1 3 (1) 1 assets and liabilities—net Loss / (gain) on pension plan amendments 2 — (20) — (20) Share based compensation 3 2 6 5 7 Metal price lag 4 (2) (16) 3 (23) Start-up and development costs 4 3 14 16 23 Manufacturing system and process transformation costs — — 1 4 2 Wise integration and acquisition costs — — — 2 —Wise one-time costs — — — 20 —Wise purchase price adjustment — (19) — (19) (1) Losses on disposals — — 2 — 12 Other — 2 — — 1 Adjusted EBITDA 111 97 331 296 412 Third Quarter 2017 – Earnings Call 23
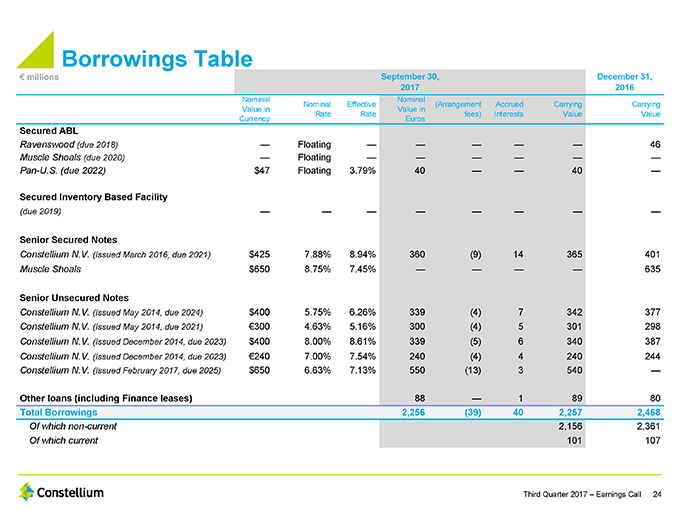
Borrowings Table
€ millions September 30, December 31, 2017 2016
Nominal Nominal Nominal Effective (Arrangement Accrued Carrying Carrying Value in Value in Rate Rate fees) Interests Value Value Currency Euros Secured ABL Ravenswood (due 2018) — Floating — — — — — 46 Muscle Shoals (due 2020) — Floating — — — — — — Pan-U.S. (due 2022) $47 Floating 3.79% 40 — — 40 — Secured Inventory Based Facility (due 2019) — — — — — — — — Senior Secured Notes Constellium N.V. (Issued March 2016, due 2021) $425 7.88% 8.94% 360 (9) 14 365 401 Muscle Shoals $650 8.75% 7.45% — — — — 635 Senior Unsecured Notes Constellium N.V. (Issued May 2014, due 2024) $400 5.75% 6.26% 339 (4) 7 342 377 Constellium N.V. (Issued May 2014, due 2021) €300 4.63% 5.16% 300 (4) 5 301 298 Constellium N.V. (Issued December 2014, due 2023) $400 8.00% 8.61% 339 (5) 6 340 387 Constellium N.V. (Issued December 2014, due 2023) €240 7.00% 7.54% 240 (4) 4 240 244 Constellium N.V. (Issued February 2017, due 2025) $650 6.63% 7.13% 550 (13) 3 540 — Other loans (including Finance leases) 88 — 1 89 80 Total Borrowings 2,256 (39) 40 2,257 2,468 Of which non-current 2,156 2,361 Of which current 101 107 Third Quarter 2017 – Earnings Call 24