UNITED STATES
SECURITIES AND EXCHANGE COMMISSION
Washington, D.C. 20549
Form N-CSR
CERTIFIED SHAREHOLDER REPORT OF REGISTERED
MANAGEMENT INVESTMENT COMPANIES
Investment Company Act File Number: 811-22777
Eaton Vance Municipal Income 2028 Term Trust
(Exact Name of Registrant as Specified in Charter)
Two International Place, Boston, Massachusetts 02110
(Address of Principal Executive Offices)
Deidre E. Walsh
Two International Place, Boston, Massachusetts 02110
(Name and Address of Agent for Services)
(617) 482-8260
(Registrant’s Telephone Number)
January 31
Date of Fiscal Year End
July 31, 2022
Date of Reporting Period
Item 1. Reports to Stockholders


| % Average Annual Total Returns1,2 | Inception Date | Six Months | One Year | Five Years | Since Inception |
| Fund at NAV | 03/28/2013 | (3.49)% | (6.28)% | 3.01% | 4.75% |
| Fund at Market Price | — | 1.70 | (8.60) | 3.99 | 5.17 |
| Bloomberg 7 Year Municipal Bond Index | — | (1.90)% | (5.18)% | 1.72% | 2.21% |
| Bloomberg 10 Year Municipal Bond Index | — | (2.76) | (6.09) | 2.05 | 2.66 |
| % Premium/Discount to NAV3 | |
| 3.81% |
| Distributions 4 | |
| Total Distributions per share for the period | $0.425 |
| Distribution Rate at NAV | 4.33% |
| Taxable-Equivalent Distribution Rate at NAV | 7.31 |
| Distribution Rate at Market Price | 4.17 |
| Taxable-Equivalent Distribution Rate at Market Price | 7.04 |
| % Total Leverage5 | |
| Residual Interest Bond (RIB) Financing | 35.03% |
| Credit Quality (% of total investments)*,** |
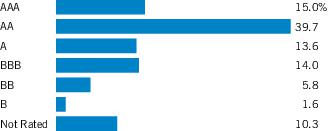
| * | For purposes of the Fund’s rating restrictions, ratings are based on Moody’s Investors Service, Inc. (“Moody’s”), S&P Global Ratings (“S&P”) or Fitch Ratings (“Fitch”), as applicable. If securities are rated differently by the ratings agencies, the highest rating is applied. Ratings, which are subject to change, apply to the creditworthiness of the issuers of the underlying securities and not to the Fund or its shares. Credit ratings measure the quality of a bond based on the issuer’s creditworthiness, with ratings ranging from AAA, being the highest, to D, being the lowest based on S&P’s measures. Ratings of BBB or higher by S&P or Fitch (Baa or higher by Moody’s) are considered to be investment-grade quality. Credit ratings are based largely on the ratings agency’s analysis at the time of rating. The rating assigned to any particular security is not necessarily a reflection of the issuer’s current financial condition and does not necessarily reflect its assessment of the volatility of a security’s market value or of the liquidity of an investment in the security. Holdings designated as “Not Rated” (if any) are not rated by the national ratings agencies stated above. |
| ** | The chart includes the municipal bonds held by a trust that issues residual interest bonds, consistent with the Portfolio of Investments. |
| 1 | Bloomberg 7 Year Municipal Bond Index is an unmanaged index of municipal bonds traded in the U.S. with maturities ranging from 6-8 years. Bloomberg 10 Year Municipal Bond Index is an unmanaged index of municipal bonds traded in the U.S. with maturities ranging from 8-12 years. Unless otherwise stated, index returns do not reflect the effect of any applicable sales charges, commissions, expenses, taxes or leverage, as applicable. It is not possible to invest directly in an index. |
| 2 | Performance results reflect the effects of leverage. Performance since inception for an index, if presented, is the performance since the Fund’s or oldest share class’ inception, as applicable. |
| 3 | The shares of the Fund often trade at a discount or premium to their net asset value. The discount or premium may vary over time and may be higher or lower than what is quoted in this report. For up-to-date premium/discount information, please refer to https://funds.eatonvance.com/closed-end-fund-prices.php. |
| 4 | The Distribution Rate is based on the Fund’s last regular distribution per share in the period (annualized) divided by the Fund’s NAV or market price at the end of the period. The Fund’s distributions may be comprised of amounts characterized for federal income tax purposes as tax-exempt income, qualified and non-qualified ordinary dividends, capital gains and nondividend distributions, also known as return of capital. The Fund will determine the federal income tax character of distributions paid to a shareholder after the end of the calendar year. This is reported on the IRS form 1099-DIV and provided to the shareholder shortly after each year-end. For information about the tax character of distributions made in prior calendar years, please refer to Performance-Tax Character of Distributions on the Fund’s webpage available at eatonvance.com. The Fund’s distributions are determined by the investment adviser based on its current assessment of the Fund’s long-term return potential. Fund distributions may be affected by numerous factors including changes in Fund performance, the cost of financing for leverage, portfolio holdings, realized and projected returns, and other factors. As portfolio and market conditions change, the rate of distributions paid by the Fund could change. Taxable-equivalent performance is based on the highest combined federal and state income tax rates, where applicable. Lower tax rates would result in lower tax-equivalent performance. Actual tax rates will vary depending on your income, exemptions and deductions. Rates do not include local taxes. |
| 5 | Fund employs RIB financing. The leverage created by RIB investments provides an opportunity for increased income but, at the same time, creates special risks (including the likelihood of greater price volatility). The cost of leverage rises and falls with changes in short-term interest rates. See “Floating Rate Notes Issued in Conjunction with Securities Held” in the notes to the financial statements for more information about RIB financing. RIB leverage represents the amount of Floating Rate Notes outstanding at period end as a percentage of Fund net assets plus Floating Rate Notes. |
| Fund profile subject to change due to active management. | |
| Important Notice to Shareholders | |
| Effective December 31, 2021, the Fund changed its primary benchmark to the Bloomberg 7 Year Municipal Bond Index because the investment adviser believes it is more closely aligned with the Fund’s investment objective and strategies. |
| Corporate Bonds — 1.1% |
| Security | Principal Amount (000's omitted) | Value | |
| Education — 1.1% | |||
| Grand Canyon University, 4.125%, 10/1/24 | $ | 2,500 | $ 2,394,500 |
| Total Corporate Bonds (identified cost $2,477,500) | $ 2,394,500 | ||
| Tax-Exempt Municipal Obligations — 149.0% |
| Security | Principal Amount (000's omitted) | Value | |
| Bond Bank — 0.6% | |||
| Rickenbacker Port Authority, OH, (OASBO Expanded Asset Pooled Financing Program), 5.375%, 1/1/32 | $ | 1,200 | $ 1,413,408 |
| $ 1,413,408 | |||
| Education — 1.3% | |||
| Capital Trust Agency, FL, (Florida Charter Educational Foundation, Inc.), 4.50%, 6/15/28(1) | $ | 510 | $ 514,570 |
| Capital Trust Agency, FL, (Liza Jackson Preparatory School, Inc.), 4.00%, 8/1/30 | 400 | 407,828 | |
| District of Columbia, (Rocketship DC Obligated Group), 5.00%, 6/1/29(1) | 465 | 482,675 | |
| Florida Development Finance Corp., (River City Science Academy): | |||
| 4.00%, 7/1/28 | 150 | 152,134 | |
| 4.00%, 7/1/29 | 155 | 156,348 | |
| 4.00%, 7/1/30 | 215 | 215,544 | |
| Florida Higher Educational Facilities Financing Authority, (Jacksonville University), 4.50%, 6/1/33(1) | 265 | 263,299 | |
| Pinellas County Educational Facilities Authority, FL, (Pinellas Academy of Math and Science), 4.125%, 12/15/28(1) | 505 | 515,327 | |
| $ 2,707,725 | |||
| Escrowed/Prerefunded — 41.4% | |||
| Clovis Unified School District, CA, (Election of 2012): | |||
| Prerefunded to 8/1/24, 0.00%, 8/1/28 | $ | 1,000 | $ 821,710 |
| Prerefunded to 8/1/24, 0.00%, 8/1/29 | 2,395 | 1,877,728 | |
| Prerefunded to 8/1/24, 0.00%, 8/1/30 | 2,575 | 1,922,495 | |
| Delaware Health Facilities Authority, (Nanticoke Memorial Hospital), Prerefunded to 7/1/23, 5.00%, 7/1/28 | 2,500 | 2,578,100 | |
| Fresno Unified School District, CA, (Election of 2010): | |||
| Prerefunded to 8/1/24, 0.00%, 8/1/30 | 800 | 586,856 | |
| Security | Principal Amount (000's omitted) | Value | |
| Escrowed/Prerefunded (continued) | |||
| Fresno Unified School District, CA, (Election of 2010): (continued) | |||
| Prerefunded to 8/1/24, 0.00%, 8/1/31 | $ | 955 | $ 666,342 |
| Hawaii: | |||
| Prerefunded to 11/1/22, 5.00%, 11/1/28(2) | 5,400 | 5,448,222 | |
| Prerefunded to 11/1/22, 5.00%, 11/1/28(2) | 185 | 186,652 | |
| Prerefunded to 11/1/22, 5.00%, 11/1/28(2) | 2,415 | 2,436,566 | |
| Illinois Finance Authority, (Plymouth Place, Inc.), Prerefunded to 5/15/25, 5.00%, 5/15/30 | 2,750 | 2,979,598 | |
| Lancaster Industrial Development Authority, PA, (Garden Spot Village), Prerefunded to 5/1/23, 5.375%, 5/1/28 | 600 | 617,130 | |
| Northeast Ohio Regional Sewer District, Prerefunded to 5/15/23, 4.00%, 11/15/33(2) | 7,500 | 7,646,175 | |
| Oregon Department of Administrative Services, Lottery Revenue, Prerefunded to 4/1/23, 4.00%, 4/1/29(2) | 10,000 | 10,165,700 | |
| Portland Community College District, OR, Prerefunded to 6/15/23, 3.25%, 6/15/32(2) | 10,250 | 10,400,777 | |
| Riverside County Community College District, CA, (Election of 2004): | |||
| Prerefunded to 2/1/25, 0.00%, 8/1/29 | 1,500 | 1,177,485 | |
| Prerefunded to 2/1/25, 0.00%, 8/1/30 | 1,250 | 932,538 | |
| Rutgers State University, NJ, Prerefunded to 5/1/23, 4.00%, 5/1/30(2) | 8,425 | 8,577,914 | |
| San Bernardino Community College District, CA, Prerefunded to 8/1/23, 4.00%, 8/1/30(2) | 10,000 | 10,249,200 | |
| Savannah Economic Development Authority, GA, (Marshes of Skidaway Island), Escrowed to Maturity, 6.00%, 1/1/24 | 165 | 171,621 | |
| Scottsdale Municipal Property Corp., AZ, Excise Tax Revenue: | |||
| Prerefunded to 7/1/25, 4.00%, 7/1/30(2) | 2,000 | 2,115,540 | |
| Prerefunded to 7/1/25, 4.00%, 7/1/31(2) | 5,680 | 6,008,134 | |
| Prerefunded to 7/1/25, 4.00%, 7/1/32(2) | 2,120 | 2,242,472 | |
| Tempe Union High School District No. 213, AZ: | |||
| Prerefunded to 7/1/23, 4.00%, 7/1/29(2) | 4,200 | 4,294,038 | |
| Prerefunded to 7/1/23, 4.00%, 7/1/30(2) | 4,350 | 4,447,396 | |
| $ 88,550,389 | |||
| General Obligations — 22.4% | |||
| Chicago Board of Education, IL: | |||
| 5.00%, 12/1/26 | $ | 3,000 | $ 3,202,500 |
| 5.00%, 12/1/27 | 500 | 538,700 | |
| Clackamas Community College District, OR: | |||
| 0.00%, 6/15/28 | 1,830 | 1,501,295 | |
| 0.00%, 6/15/29 | 1,000 | 782,400 | |
| Detroit, MI, 5.00%, 4/1/27 | 1,700 | 1,849,073 | |
| Security | Principal Amount (000's omitted) | Value | |
| General Obligations (continued) | |||
| Illinois: | |||
| 5.00%, 11/1/29 | $ | 1,500 | $ 1,631,025 |
| 5.00%, 5/1/33 | 3,200 | 3,274,592 | |
| 5.00%, 5/1/39 | 1,165 | 1,188,347 | |
| Leander Independent School District, TX, (PSF Guaranteed), 0.00%, 8/15/31 | 5,000 | 3,444,100 | |
| Pennsylvania, 4.00%, 4/1/29(2) | 10,000 | 10,120,300 | |
| Texas, (Texas Transportation Commission), 4.00%, 10/1/31(2) | 10,000 | 10,274,300 | |
| Washington, 4.00%, 7/1/29(2) | 10,000 | 10,173,300 | |
| $ 47,979,932 | |||
| Hospital — 14.2% | |||
| Bucks County Industrial Development Authority, PA, (Grand View Hospital), 5.00%, 7/1/29 | $ | 550 | $ 600,479 |
| California Health Facilities Financing Authority, (Providence Health & Services), 4.00%, 10/1/28(2) | 10,000 | 10,297,400 | |
| Colorado Health Facilities Authority, (Intermountain Healthcare), 5.00% to 8/15/28 (Put Date), 5/15/62(3) | 2,000 | 2,278,940 | |
| Illinois Finance Authority, (Presence Health Network), 5.00%, 2/15/29 | 2,635 | 2,940,923 | |
| New York Dormitory Authority, (Orange Regional Medical Center): | |||
| 5.00%, 12/1/29(1) | 450 | 472,104 | |
| 5.00%, 12/1/30(1) | 1,000 | 1,046,500 | |
| Southeastern Ohio Port Authority, (Memorial Health System Obligated Group), 5.50%, 12/1/29 | 985 | 1,022,174 | |
| Tarrant County Cultural Education Facilities Finance Corp., TX, (Baylor Health Care System), Prerefunded to 5/15/23, 4.00%, 11/15/32(2) | 10,000 | 10,190,900 | |
| Yavapai County Industrial Development Authority, AZ, (Yavapai Regional Medical Center), 5.00%, 8/1/28 | 1,500 | 1,547,925 | |
| $ 30,397,345 | |||
| Industrial Development Revenue — 11.4% | |||
| Boone County, KY, (Duke Energy Kentucky, Inc.), 3.70%, 8/1/27 | $ | 750 | $ 771,045 |
| Iowa Finance Authority, (Iowa Fertilizer Co.), 4.00% to 12/1/32 (Put Date), 12/1/50 | 1,000 | 1,035,080 | |
| Louisiana Public Facilities Authority, (Cleco Power LLC), 4.25%, 12/1/38 | 2,395 | 2,400,078 | |
| Matagorda County Navigation District No. 1, TX, (AEP Texas Central Co.): | |||
| Series 2008-1, 4.00%, 6/1/30 | 540 | 542,743 | |
| Series 2008-2, 4.00%, 6/1/30 | 3,000 | 3,015,240 | |
| Security | Principal Amount (000's omitted) | Value | |
| Industrial Development Revenue (continued) | |||
| National Finance Authority, NH, (Covanta), (AMT), 4.00%, 11/1/27(1) | $ | 2,500 | $ 2,500,150 |
| New Jersey Economic Development Authority, (Continental Airlines), (AMT), 5.625%, 11/15/30 | 1,355 | 1,400,094 | |
| New York Transportation Development Corp., (Delta Air Lines, Inc. - LaGuardia Airport Terminals C&D Redevelopment): | |||
| (AMT), 4.00%, 10/1/30 | 3,000 | 3,023,190 | |
| (AMT), 5.00%, 1/1/31 | 1,025 | 1,073,872 | |
| Ohio Air Quality Development Authority, (Duke Energy Corp.), 4.00% to 6/1/27 (Put Date), 9/1/30 | 1,000 | 1,030,090 | |
| Ohio Air Quality Development Authority, (Pratt Paper, LLC), (AMT), 3.75%, 1/15/28(1) | 855 | 884,147 | |
| Public Finance Authority, WI, (Celanese Corp.), 4.05%, 11/1/30 | 3,000 | 3,057,330 | |
| Vermont Economic Development Authority, (Casella Waste Systems, Inc.): | |||
| (AMT), 4.625% to 4/3/28 (Put Date), 4/1/36(1) | 105 | 104,916 | |
| (AMT), 5.00% to 6/1/27 (Put Date), 6/1/52(1) | 1,500 | 1,522,005 | |
| West Virginia Economic Development Authority, (Appalachian Power Co.), 3.75% to 6/1/25 (Put Date), 12/1/42 | 2,000 | 2,014,680 | |
| $ 24,374,660 | |||
| Insured - Electric Utilities — 2.6% | |||
| Puerto Rico Electric Power Authority: | |||
| (NPFG), 5.25%, 7/1/29 | $ | 500 | $ 511,755 |
| (NPFG), 5.25%, 7/1/30 | 5,000 | 5,065,950 | |
| $ 5,577,705 | |||
| Insured - General Obligations — 3.2% | |||
| Chicago Board of Education, IL, (AGM), 5.00%, 12/1/28 | $ | 250 | $ 279,060 |
| Grossmont Union High School District, CA, (Election of 2008), (AGM), 0.00%, 8/1/29 | 4,000 | 3,072,000 | |
| Luzerne County, PA, (AGM), 5.00%, 11/15/29 | 2,000 | 2,172,880 | |
| McHenry County Community Unit School District No. 12, IL, (AGM), 4.25%, 1/1/29 | 1,230 | 1,268,905 | |
| $ 6,792,845 | |||
| Insured - Transportation — 4.6% | |||
| Foothill/Eastern Transportation Corridor Agency, CA, (AGM), 5.625%, (0.00% until 1/15/24), 1/15/32 | $ | 795 | $ 884,938 |
| Security | Principal Amount (000's omitted) | Value | |
| Insured - Transportation (continued) | |||
| New Jersey Economic Development Authority, (The Goethals Bridge Replacement), (AGM), (AMT), 5.00%, 1/1/31 | $ | 1,340 | $ 1,373,956 |
| New Jersey Transportation Trust Fund Authority, (Transportation System), (AMBAC), 0.00%, 12/15/28 | 9,095 | 7,573,497 | |
| $ 9,832,391 | |||
| Insured - Water and Sewer — 2.5% | |||
| Jefferson County, AL, Sewer Revenue: | |||
| (AGM), 0.00%, 10/1/27 | $ | 875 | $ 704,559 |
| (AGM), 0.00%, 10/1/29 | 1,225 | 863,123 | |
| (AGM), 0.00%, 10/1/30 | 1,045 | 686,272 | |
| (AGM), 0.00%, 10/1/33 | 5,870 | 3,151,720 | |
| $ 5,405,674 | |||
| Lease Revenue/Certificates of Participation — 2.6% | |||
| Michigan Strategic Fund, (Facility for Rare Isotope Beams), 4.00%, 3/1/31 | $ | 1,000 | $ 1,023,720 |
| New Jersey Economic Development Authority, (School Facilities Construction): | |||
| 5.00%, 6/15/28 | 3,000 | 3,354,270 | |
| 5.00%, 6/15/30 | 1,000 | 1,112,140 | |
| $ 5,490,130 | |||
| Other Revenue — 2.4% | |||
| Buckeye Tobacco Settlement Financing Authority, OH, 5.00%, 6/1/31 | $ | 2,000 | $ 2,224,600 |
| Kalispel Tribe of Indians, WA, Series A, 5.00%, 1/1/32(1) | 700 | 759,129 | |
| Main Street Natural Gas, Inc., GA, Gas Supply Revenue, 5.00% to 6/1/29 (Put Date), 12/1/52(3) | 2,000 | 2,143,560 | |
| $ 5,127,289 | |||
| Senior Living/Life Care — 9.4% | |||
| Bexar County Health Facilities Development Corp., TX, (Army Retirement Residence Foundation), 5.00%, 7/15/28 | $ | 225 | $ 233,429 |
| Buffalo and Erie County Industrial Land Development Corp., NY, (Orchard Park CCRC, Inc.), 5.00%, 11/15/28 | 1,360 | 1,431,373 | |
| Colorado Health Facilities Authority, (Frasier Meadows Retirement Community): | |||
| 5.25%, 5/15/28 | 250 | 261,368 | |
| Prerefunded to 5/15/23, 5.00%, 5/15/30 | 410 | 420,463 | |
| Franklin County Industrial Development Authority, PA, (Menno-Haven, Inc.): | |||
| 5.00%, 12/1/27 | 250 | 256,923 | |
| 5.00%, 12/1/28 | 250 | 256,665 | |
| Security | Principal Amount (000's omitted) | Value | |
| Senior Living/Life Care (continued) | |||
| Harris County Cultural Education Facilities Finance Corp., TX, (Brazos Presbyterian Homes, Inc.), 5.75%, 1/1/28 | $ | 140 | $ 141,072 |
| Illinois Finance Authority, (Smith Crossing), 4.00%, 10/15/30 | 725 | 704,200 | |
| Lancaster County Hospital Authority, PA, (Brethren Village), 5.00%, 7/1/30 | 1,025 | 1,039,206 | |
| Massachusetts Development Finance Agency, (Linden Ponds, Inc.), 5.00%, 11/15/28(1) | 300 | 327,012 | |
| Montgomery County Industrial Development Authority, PA, (Whitemarsh Continuing Care Retirement Community), 4.25%, 1/1/28 | 2,300 | 2,308,165 | |
| Multnomah County Hospital Facilities Authority, OR, (Mirabella at South Waterfront), 5.125%, 10/1/34 | 1,500 | 1,527,390 | |
| New Hope Cultural Education Facilities Finance Corp., TX, (Longhorn Village), 5.00%, 1/1/28 | 1,145 | 1,185,705 | |
| North Carolina Medical Care Commission, (Galloway Ridge), 5.00%, 1/1/29 | 560 | 570,735 | |
| Palm Beach County Health Facilities Authority, FL, (Toby & Leon Cooperman Sinai Residences of Boca Raton), 4.00%, 6/1/31 | 1,250 | 1,181,225 | |
| Public Finance Authority, WI, (Church Home of Hartford, Inc.), 5.00%, 9/1/25(1) | 980 | 990,721 | |
| Rockville, MD, (Ingleside at King Farm), 5.00%, 11/1/29 | 1,100 | 1,130,030 | |
| St. Louis County Industrial Development Authority, MO, (Friendship Village St. Louis Obligated Group), 5.00%, 9/1/28 | 635 | 647,973 | |
| Tarrant County Cultural Education Facilities Finance Corp., TX, (MRC Stevenson Oaks), 6.25%, 11/15/31 | 540 | 572,141 | |
| Tarrant County Cultural Education Facilities Finance Corp., TX, (Trinity Terrace), 5.00%, 10/1/29 | 1,045 | 1,083,853 | |
| Tempe Industrial Development Authority, AZ, (Mirabella at ASU), 5.50%, 10/1/27(1) | 900 | 900,810 | |
| Tulsa County Industrial Authority, OK, (Montereau, Inc.), 5.00%, 11/15/26 | 345 | 365,410 | |
| Vermont Economic Development Authority, (Wake Robin Corp.): | |||
| 5.00%, 5/1/27 | 500 | 519,200 | |
| 5.00%, 5/1/28 | 750 | 775,530 | |
| Warren County, OH, (Otterbein Homes Obligated Group), 5.00%, 7/1/28 | 1,200 | 1,235,820 | |
| $ 20,066,419 | |||
| Special Tax Revenue — 12.5% | |||
| Bullhead, AZ, Excise Taxes Revenue, 1.30%, 7/1/28 | $ | 485 | $ 441,961 |
| Lakewood Ranch Stewardship District, FL, (Villages of Lakewood Ranch), 4.25%, 5/1/26 | 1,005 | 1,018,035 | |
| Metropolitan Development and Housing Agency, TN, (Fifth + Broadway Development), 4.50%, 6/1/28(1) | 705 | 724,162 | |
| Security | Principal Amount (000's omitted) | Value | |
| Special Tax Revenue (continued) | |||
| Michigan Finance Authority, Detroit Financial Recovery Income Tax Revenue, 4.50%, 10/1/29 | $ | 895 | $ 914,475 |
| New York Dormitory Authority, Sales Tax Revenue, 4.00%, 3/15/30(2) | 10,000 | 10,086,100 | |
| New York State Urban Development Corp., Personal Income Tax Revenue, 5.00%, 3/15/30(2) | 12,000 | 12,589,681 | |
| Sparks, NV, (Legends at Sparks Marina), 2.75%, 6/15/28(1) | 1,000 | 919,090 | |
| $ 26,693,504 | |||
| Student Loan — 1.9% | |||
| Massachusetts Educational Financing Authority, (AMT), 5.00%, 1/1/27 | $ | 3,000 | $ 3,157,080 |
| New Jersey Higher Education Student Assistance Authority: | |||
| Series 2013-1A, (AMT), 4.00%, 12/1/28 | 360 | 361,185 | |
| Series 2015-1A, (AMT), 4.00%, 12/1/28 | 585 | 594,348 | |
| $ 4,112,613 | |||
| Transportation — 13.6% | |||
| Foothill/Eastern Transportation Corridor Agency, CA, 5.90%, (0.00% until 1/15/24), 1/15/27 | $ | 2,000 | $ 2,075,160 |
| Grand Parkway Transportation Corp., TX: | |||
| 4.95%, (0.00% until 10/1/23), 10/1/29 | 800 | 876,671 | |
| 5.05%, (0.00% until 10/1/23), 10/1/30 | 1,500 | 1,640,835 | |
| 5.20%, (0.00% until 10/1/23), 10/1/31 | 2,000 | 2,189,540 | |
| Houston, TX, (United Airlines, Inc.), (AMT), 5.00%, 7/1/29 | 1,470 | 1,499,018 | |
| Kentucky Public Transportation Infrastructure Authority, (Downtown Crossing Project), Prerefunded to 7/1/23, 0.00%, 7/1/28 | 1,240 | 896,160 | |
| Maryland Economic Development Corp., (Purple Line Light Rail), Green Bonds, (AMT), 5.00%, 11/12/28 | 1,000 | 1,080,940 | |
| Metropolitan Transportation Authority, NY, 5.00% to 5/15/30 (Put Date), 11/15/45 | 2,250 | 2,531,700 | |
| New York Transportation Development Corp., (LaGuardia Airport Terminal B Redevelopment), (AMT), 5.00%, 7/1/34 | 4,000 | 4,150,160 | |
| New York Transportation Development Corp., (Terminal 4 John F. Kennedy International Airport), (AMT), 5.00%, 12/1/29 | 2,000 | 2,211,440 | |
| Port Authority of New York and New Jersey, (AMT), 4.00%, 7/15/36(2) | 10,000 | 10,014,400 | |
| $ 29,166,024 | |||
| Security | Principal Amount (000's omitted) | Value | |
| Water and Sewer — 2.4% | |||
| Michigan Finance Authority, (Detroit Water and Sewerage Department), 5.00%, 7/1/30 | $ | 5,000 | $ 5,257,950 |
| $ 5,257,950 | |||
| Total Tax-Exempt Municipal Obligations (identified cost $309,428,314) | $ 318,946,003 | ||
| Taxable Municipal Obligations — 4.4% |
| Security | Principal Amount (000's omitted) | Value | |
| General Obligations — 2.7% | |||
| Atlantic City, NJ, 7.00%, 3/1/28 | $ | 2,405 | $ 2,601,873 |
| Chicago, IL: | |||
| 7.375%, 1/1/33 | 1,000 | 1,123,250 | |
| 7.781%, 1/1/35 | 1,675 | 1,941,493 | |
| $ 5,666,616 | |||
| Insured - Transportation — 1.7% | |||
| Alameda Corridor Transportation Authority, CA, (AMBAC), 0.00%, 10/1/31 | $ | 5,805 | $ 3,734,879 |
| $ 3,734,879 | |||
| Total Taxable Municipal Obligations (identified cost $8,941,328) | $ 9,401,495 | ||
| Total Investments — 154.5% (identified cost $320,847,142) | $ 330,741,998 | ||
| Other Assets, Less Liabilities — (54.5)% | $ (116,686,138) | ||
| Net Assets — 100.0% | $ 214,055,860 | ||
| The percentage shown for each investment category in the Portfolio of Investments is based on net assets. | |
| (1) | Security exempt from registration under Rule 144A of the Securities Act of 1933, as amended. These securities may be sold in certain transactions in reliance on an exemption from registration (normally to qualified institutional buyers). At July 31, 2022, the aggregate value of these securities is $12,926,617 or 6.0% of the Trust's net assets. |
| (2) | Security represents the municipal bond held by a trust that issues residual interest bonds (see Note 1G). |
| (3) | When-issued security. |
| At July 31, 2022, the concentration of the Trust’s investments in the various states and territories, determined as a percentage of total investments, is as follows: |
| New York | 14.7% |
| California | 11.6% |
| Texas | 11.2% |
| Others, representing less than 10% individually | 61.8% |
| The Trust invests primarily in debt securities issued by municipalities. The ability of the issuers of the debt securities to meet their obligations may be affected by economic developments in a specific industry or municipality. At July 31, 2022, 9.5% of total investments are backed by bond insurance of various financial institutions and financial guaranty assurance agencies. The aggregate percentage insured by an individual financial institution or financial guaranty assurance agency ranged from 1.7% to 4.4% of total investments. |
| Abbreviations: | |
| AGM | – Assured Guaranty Municipal Corp. |
| AMBAC | – AMBAC Financial Group, Inc. |
| AMT | – Interest earned from these securities may be considered a tax preference item for purposes of the Federal Alternative Minimum Tax. |
| NPFG | – National Public Finance Guarantee Corp. |
| PSF | – Permanent School Fund |
| July 31, 2022 | |
| Assets | |
| Investments, at value (identified cost $320,847,142) | $ 330,741,998 |
| Cash | 977,250 |
| Interest receivable | 2,705,981 |
| Receivable for investments sold | 100,667 |
| Receivable from the transfer agent | 32,947 |
| Total assets | $334,558,843 |
| Liabilities | |
| Payable for floating rate notes issued | $ 115,486,970 |
| Payable for when-issued securities | 4,375,300 |
| Payable to affiliate: | |
| Investment adviser and administration fee | 167,155 |
| Interest expense and fees payable | 378,377 |
| Accrued expenses | 95,181 |
| Total liabilities | $120,502,983 |
| Net Assets | $214,055,860 |
| Sources of Net Assets | |
| Common shares, $0.01 par value, unlimited number of shares authorized | $ 108,798 |
| Additional paid-in capital | 207,741,277 |
| Distributable earnings | 6,205,785 |
| Net Assets | $214,055,860 |
| Common Shares Issued and Outstanding | 10,879,837 |
| Net Asset Value Per Common Share | |
| Net assets ÷ common shares issued and outstanding | $ 19.67 |
| Six Months Ended | |
| July 31, 2022 | |
| Investment Income | |
| Interest income | $ 6,211,668 |
| Total investment income | $ 6,211,668 |
| Expenses | |
| Investment adviser and administration fee | $ 1,002,740 |
| Trustees’ fees and expenses | 12,348 |
| Custodian fee | 26,608 |
| Transfer and dividend disbursing agent fees | 9,894 |
| Legal and accounting services | 33,848 |
| Printing and postage | 531 |
| Interest expense and fees | 699,141 |
| Miscellaneous | 19,483 |
| Total expenses | $ 1,804,593 |
| Net investment income | $ 4,407,075 |
| Realized and Unrealized Gain (Loss) | |
| Net realized gain (loss): | |
| Investment transactions | $ (900,676) |
| Net realized loss | $ (900,676) |
| Change in unrealized appreciation (depreciation): | |
| Investments | $ (11,313,184) |
| Net change in unrealized appreciation (depreciation) | $(11,313,184) |
| Net realized and unrealized loss | $(12,213,860) |
| Net decrease in net assets from operations | $ (7,806,785) |
| Six Months Ended July 31, 2022 (Unaudited) | Year Ended January 31, 2022 | |
| Increase (Decrease) in Net Assets | ||
| From operations: | ||
| Net investment income | $ 4,407,075 | $ 9,451,773 |
| Net realized gain (loss) | (900,676) | 722,043 |
| Net change in unrealized appreciation (depreciation) | (11,313,184) | (13,385,838) |
| Net decrease in net assets from operations | $ (7,806,785) | $ (3,212,022) |
| Distributions to shareholders | $ (4,625,774) | $ (9,240,905) |
| Capital share transactions: | ||
| Reinvestment of distributions | $ 201,407 | $ 376,356 |
| Net increase in net assets from capital share transactions | $ 201,407 | $ 376,356 |
| Net decrease in net assets | $ (12,231,152) | $ (12,076,571) |
| Net Assets | ||
| At beginning of period | $ 226,287,012 | $ 238,363,583 |
| At end of period | $214,055,860 | $226,287,012 |
| Six Months Ended | |
| July 31, 2022 | |
| Cash Flows From Operating Activities | |
| Net decrease in net assets from operations | $ (7,806,785) |
| Adjustments to reconcile net decrease in net assets from operations to net cash provided by operating activities: | |
| Investments purchased | (35,523,337) |
| Investments sold | 33,175,920 |
| Net amortization/accretion of premium (discount) | (51,171) |
| Increase in interest receivable | (4,918) |
| Increase in receivable from the transfer agent | (32,947) |
| Decrease in payable to affiliate for investment adviser fee | (13,000) |
| Increase in interest expense and fees payable | 187,816 |
| Increase in accrued expenses | 515 |
| Net change in unrealized (appreciation) depreciation from investments | 11,313,184 |
| Net realized loss from investments | 900,676 |
| Net cash provided by operating activities | $ 2,145,953 |
| Cash Flows From Financing Activities | |
| Cash distributions paid | $ (4,424,367) |
| Repayment of secured borrowings | (8,000,000) |
| Net cash used in financing activities | $(12,424,367) |
| Net decrease in cash | $(10,278,414) |
| Cash at beginning of period | $ 11,255,664 |
| Cash at end of period | $ 977,250 |
| Supplemental disclosure of cash flow information: | |
| Noncash financing activities not included herein consist of: | |
| Reinvestment of dividends and distributions | $ 201,407 |
| Cash paid for interest and fees on borrowings | 511,325 |
| Six Months Ended July 31, 2022 (Unaudited) | Year Ended January 31, | |||||
| 2022 | 2021 | 2020 | 2019 | 2018 | ||
| Net asset value — Beginning of period | $ 20.820 | $ 21.960 | $ 21.880 | $ 20.440 | $ 20.440 | $ 19.980 |
| Income (Loss) From Operations | ||||||
| Net investment income(1) | $ 0.405 | $ 0.870 | $ 0.876 | $ 0.763 | $ 0.775 | $ 0.829 |
| Net realized and unrealized gain (loss) | (1.130) | (1.159) | 0.048 | 1.528 | 0.076 | 0.482 |
| Total income (loss) from operations | $ (0.725) | $ (0.289) | $ 0.924 | $ 2.291 | $ 0.851 | $ 1.311 |
| Less Distributions | ||||||
| From net investment income | $ (0.425) | $ (0.851) | $ (0.844) | $ (0.851) | $ (0.851) | $ (0.851) |
| Total distributions | $ (0.425) | $ (0.851) | $ (0.844) | $ (0.851) | $ (0.851) | $ (0.851) |
| Net asset value — End of period | $ 19.670 | $ 20.820 | $ 21.960 | $ 21.880 | $ 20.440 | $ 20.440 |
| Market value — End of period | $ 20.420 | $ 20.510 | $ 22.950 | $ 21.370 | $ 19.590 | $ 19.690 |
| Total Investment Return on Net Asset Value(2) | (3.49)% (3) | (1.39)% | 4.45% | 11.46% | 4.46% | 6.69% |
| Total Investment Return on Market Value(2) | 1.70% (3) | (7.03)% | 11.74% | 13.58% | 3.93% | 4.88% |
| Ratios/Supplemental Data | ||||||
| Net assets, end of period (000’s omitted) | $214,056 | $226,287 | $238,364 | $237,212 | $221,444 | $221,476 |
| Ratios (as a percentage of average daily net assets): | ||||||
| Expenses excluding interest and fees | 1.03% (4) | 1.03% | 1.04% | 1.04% | 1.08% | 1.07% |
| Interest and fee expense(5) | 0.65% (4) | 0.33% | 0.63% | 1.16% | 1.22% | 0.91% |
| Total expenses | 1.68% (4) | 1.36% | 1.67% | 2.20% | 2.30% | 1.98% |
| Net investment income | 4.11% (4) | 4.02% | 4.10% | 3.58% | 3.84% | 4.01% |
| Portfolio Turnover | 10% (3) | 2% | 3% | 1% | 10% | 8% |
| (1) | Computed using average shares outstanding. |
| (2) | Returns are historical and are calculated by determining the percentage change in net asset value or market value with all distributions reinvested. Distributions are assumed to be reinvested at prices obtained under the Trust’s dividend reinvestment plan. |
| (3) | Not annualized. |
| (4) | Annualized. |
| (5) | Interest and fee expense relates to the liability for floating rate notes issued in conjunction with residual interest bond transactions (see Note 1G). |
| Aggregate cost | $204,834,384 |
| Gross unrealized appreciation | $ 11,030,144 |
| Gross unrealized depreciation | (609,500) |
| Net unrealized appreciation | $ 10,420,644 |
| • | Level 1 – quoted prices in active markets for identical investments |
| • | Level 2 – other significant observable inputs (including quoted prices for similar investments, interest rates, prepayment speeds, credit risk, etc.) |
| • | Level 3 – significant unobservable inputs (including a fund's own assumptions in determining the fair value of investments) |
| Asset Description | Level 1 | Level 2 | Level 3 | Total |
| Corporate Bonds | $ — | $ 2,394,500 | $ — | $ 2,394,500 |
| Tax-Exempt Municipal Obligations | — | 318,946,003 | — | 318,946,003 |
| Taxable Municipal Obligations | — | 9,401,495 | — | 9,401,495 |
| Total Investments | $ — | $330,741,998 | $ — | $330,741,998 |
| Officers | |
| Eric A. Stein President | Jill R. Damon Secretary |
| Deidre E. Walsh Vice President and Chief Legal Officer | Richard F. Froio Chief Compliance Officer |
| James F. Kirchner Treasurer | |
| Trustees |
| George J. Gorman Chairperson | |
| Thomas E. Faust Jr.* | |
| Mark R. Fetting | |
| Cynthia E. Frost | |
| Valerie A. Mosley |
| Keith Quinton | |
| Marcus L. Smith | |
| Susan J. Sutherland | |
| Scott E. Wennerholm | |
| Nancy A. Wiser** |
| * | Interested Trustee |
| ** | Ms. Wiser began serving as a Trustee effective April 4, 2022. |
| Privacy Notice | April 2021 |
| FACTS | WHAT DOES EATON VANCE DO WITH YOUR PERSONAL INFORMATION? |
| Why? | Financial companies choose how they share your personal information. Federal law gives consumers the right to limit some but not all sharing. Federal law also requires us to tell you how we collect, share, and protect your personal information. Please read this notice carefully to understand what we do. |
| What? | The types of personal information we collect and share depend on the product or service you have with us. This information can include:■ Social Security number and income ■ investment experience and risk tolerance ■ checking account number and wire transfer instructions |
| How? | All financial companies need to share customers’ personal information to run their everyday business. In the section below, we list the reasons financial companies can share their customers’ personal information; the reasons Eaton Vance chooses to share; and whether you can limit this sharing. |
| Reasons we can share your personal information | Does Eaton Vance share? | Can you limit this sharing? |
| For our everyday business purposes — such as to process your transactions, maintain your account(s), respond to court orders and legal investigations, or report to credit bureaus | Yes | No |
| For our marketing purposes — to offer our products and services to you | Yes | No |
| For joint marketing with other financial companies | No | We don’t share |
| For our investment management affiliates’ everyday business purposes — information about your transactions, experiences, and creditworthiness | Yes | Yes |
| For our affiliates’ everyday business purposes — information about your transactions and experiences | Yes | No |
| For our affiliates’ everyday business purposes — information about your creditworthiness | No | We don’t share |
| For our investment management affiliates to market to you | Yes | Yes |
| For our affiliates to market to you | No | We don’t share |
| For nonaffiliates to market to you | No | We don’t share |
| To limit our sharing | Call toll-free 1-800-262-1122 or email: EVPrivacy@eatonvance.comPlease note:If you are a new customer, we can begin sharing your information 30 days from the date we sent this notice. When you are no longer our customer, we continue to share your information as described in this notice. However, you can contact us at any time to limit our sharing. |
| Questions? | Call toll-free 1-800-262-1122 or email: EVPrivacy@eatonvance.com |
| Privacy Notice — continued | April 2021 |
| Who we are | |
| Who is providing this notice? | Eaton Vance Management, Eaton Vance Distributors, Inc., Eaton Vance Trust Company, Eaton Vance Management (International) Limited, Eaton Vance Advisers International Ltd., Eaton Vance Global Advisors Limited, Eaton Vance Management’s Real Estate Investment Group, Boston Management and Research, Calvert Research and Management, Eaton Vance and Calvert Fund Families and our investment advisory affiliates (“Eaton Vance”) (see Investment Management Affiliates definition below) |
| What we do | |
| How does Eaton Vance protect my personal information? | To protect your personal information from unauthorized access and use, we use security measures that comply with federal law. These measures include computer safeguards and secured files and buildings. We have policies governing the proper handling of customer information by personnel and requiring third parties that provide support to adhere to appropriate security standards with respect to such information. |
| How does Eaton Vance collect my personal information? | We collect your personal information, for example, when you■ open an account or make deposits or withdrawals from your account ■ buy securities from us or make a wire transfer ■ give us your contact informationWe also collect your personal information from others, such as credit bureaus, affiliates, or other companies. |
| Why can’t I limit all sharing? | Federal law gives you the right to limit only■ sharing for affiliates’ everyday business purposes — information about your creditworthiness ■ affiliates from using your information to market to you ■ sharing for nonaffiliates to market to youState laws and individual companies may give you additional rights to limit sharing. See below for more on your rights under state law. |
| Definitions | |
| Investment Management Affiliates | Eaton Vance Investment Management Affiliates include registered investment advisers, registered broker- dealers, and registered and unregistered funds. Investment Management Affiliates does not include entities associated with Morgan Stanley Wealth Management, such as Morgan Stanley Smith Barney LLC and Morgan Stanley & Co. |
| Affiliates | Companies related by common ownership or control. They can be financial and nonfinancial companies.■ Our affiliates include companies with a Morgan Stanley name and financial companies such as Morgan Stanley Smith Barney LLC and Morgan Stanley & Co. |
| Nonaffiliates | Companies not related by common ownership or control. They can be financial and nonfinancial companies.■ Eaton Vance does not share with nonaffiliates so they can market to you. |
| Joint marketing | A formal agreement between nonaffiliated financial companies that together market financial products or services to you.■ Eaton Vance doesn’t jointly market. |
| Other important information | |
| Vermont: Except as permitted by law, we will not share personal information we collect about Vermont residents with Nonaffiliates unless you provide us with your written consent to share such information.California: Except as permitted by law, we will not share personal information we collect about California residents with Nonaffiliates and we will limit sharing such personal information with our Affiliates to comply with California privacy laws that apply to us. | |
Two International Place
Boston, MA 02110
State Street Financial Center, One Lincoln Street
Boston, MA 02111
6201 15th Avenue
Brooklyn, NY 11219
Boston, MA 02110
Item 2. Code of Ethics
Not required in this filing.
Item 3. Audit Committee Financial Expert
Not required in this filing.
Item 4. Principal Accountant Fees and Services
Not required in this filing.
Item 5. Audit Committee of Listed Registrants
Not required in this filing.
Item 6. Schedule of Investments
Please see schedule of investments contained in the Report to Stockholders included under Item 1 of this Form N-CSR.
Item 7. Disclosure of Proxy Voting Policies and Procedures for Closed-End Management Investment Companies
Not required in this filing.
Item 8. Portfolio Managers of Closed-End Management Investment Companies
Not required in this filing.
Item 9. Purchases of Equity Securities by Closed-End Management Investment Company and Affiliated Purchasers
No such purchases this period.
Item 10. Submission of Matters to a Vote of Security Holders
No material changes.
Item 11. Controls and Procedures
(a) It is the conclusion of the registrant’s principal executive officer and principal financial officer that the effectiveness of the registrant’s current disclosure controls and procedures (such disclosure controls and procedures having been evaluated within 90 days of the date of this filing) provide reasonable assurance that the information required to be disclosed by the registrant has been recorded, processed, summarized and reported within the time period specified in the Commission’s rules and forms and that the information required to be disclosed by the registrant has been accumulated and communicated to the registrant’s principal executive officer and principal financial officer in order to allow timely decisions regarding required disclosure.
(b) There have been no changes in the registrant’s internal controls over financial reporting during the period covered by this report that has materially affected, or is reasonably likely to materially affect, the registrant’s internal control over financial reporting.
Item 12. Disclosure of Securities Lending Activities for Closed-End Management Investment Companies
No activity to report for the registrant’s most recent fiscal year end.
Item 13. Exhibits
| (a)(1) | Registrant’s Code of Ethics – Not applicable (please see Item 2). | |
| (a)(2)(i) | Treasurer’s Section 302 certification. | |
| (a)(2)(ii) | President’s Section 302 certification. | |
| (b) | Combined Section 906 certification. | |
Signatures
Pursuant to the requirements of the Securities Exchange Act of 1934 and the Investment Company Act of 1940, the registrant has duly caused this report to be signed on its behalf by the undersigned, thereunto duly authorized.
| Eaton Vance Municipal Income 2028 Term Trust | ||
| By: | /s/ Eric A. Stein | |
| Eric A. Stein | ||
| President | ||
Date: September 16, 2022
Pursuant to the requirements of the Securities Exchange Act of 1934 and the Investment Company Act of 1940, this report has been signed below by the following persons on behalf of the registrant and in the capacities and on the dates indicated.
| By: | /s/ James F. Kirchner | |
| James F. Kirchner | ||
| Treasurer |
Date: September 16, 2022
| By: | /s/ Eric A. Stein | |
| Eric A. Stein | ||
| President | ||
| Date: September 16, 2022 | ||