
Covisint Corporation: Third Quarter Fiscal 2014 Results January 23, 2014
Forward Looking Information This presentation contains “forward-looking” statements that involve risks, uncertainties and assumptions. If the risks or uncertainties ever materialize or the assumptions prove incorrect, our results may differ materially from those expressed or implied by such forward-looking statements. All statements other than statements of historical fact could be deemed forward-looking, including, but not limited to, any projections of financial information; any statements about historical results that may suggest trends for our business and results of operations; any statements of the plans, strategies and objectives of management for future operations; any statements of expectation or belief regarding future events, potential markets or market size, technology developments, or enforceability of our intellectual property rights; and any statements of assumptions underlying any of the foregoing. These statements are based on estimates and information available to us at the time of this presentation and are not guarantees of future performance. Actual results could differ materially from our current expectations as a result of many factors, including but not limited to: quarterly fluctuations in our business and results of operations; our ability to address market needs and sell our applications and services successfully; the general market conditions of the industry; and the effects of competition. These and other risks and uncertainties associated with our business are described in the prospectus for our IPO. We assume no obligation and do not intend to update these forward-looking statements. In addition to U.S. GAAP financials, this presentation includes certain non-GAAP financial measures. These historical and forward-looking non-GAAP measures are in addition to, not a substitute for or superior to, measures of financial performance prepared in accordance with GAAP. A reconciliation between GAAP and non-GAAP measures is included in the appendix to this presentation. Covisint is a registered trademark of Covisint Corporation. This presentation also contains additional trademarks and service marks of ours and of other companies. We do not intend our use or display of other companies’ trademarks or service marks to imply a relationship with, or endorsement or sponsorship of us by, these other companies. 2

Business Highlights for FY14 Q3 • 21% Y/Y Q3 subscription revenue growth • 21 signed agreements with new customers; 21 agreements with existing customers • Continued progress on acquiring the people, process and products needed for optimal full spin from CPWR • Finalized key initiatives around Cisco partnership • Released platform innovations around mobile support, self- administration and APIs 3

$0.0 $10.0 $20.0 $30.0 $40.0 $50.0 $60.0 FY'11 FY'12 FY'13 9 Mos. FY'13 9 Mos. FY'14 Subscription – Revenue Growth 4 $41.2 $57.0 $49.2 $45.0 ($MM) • Subscription revenue growth rate for Q3 was 21% • For the nine months ended December 31, 2013, growth rate at 20% $49.7 Nine Months Comparison
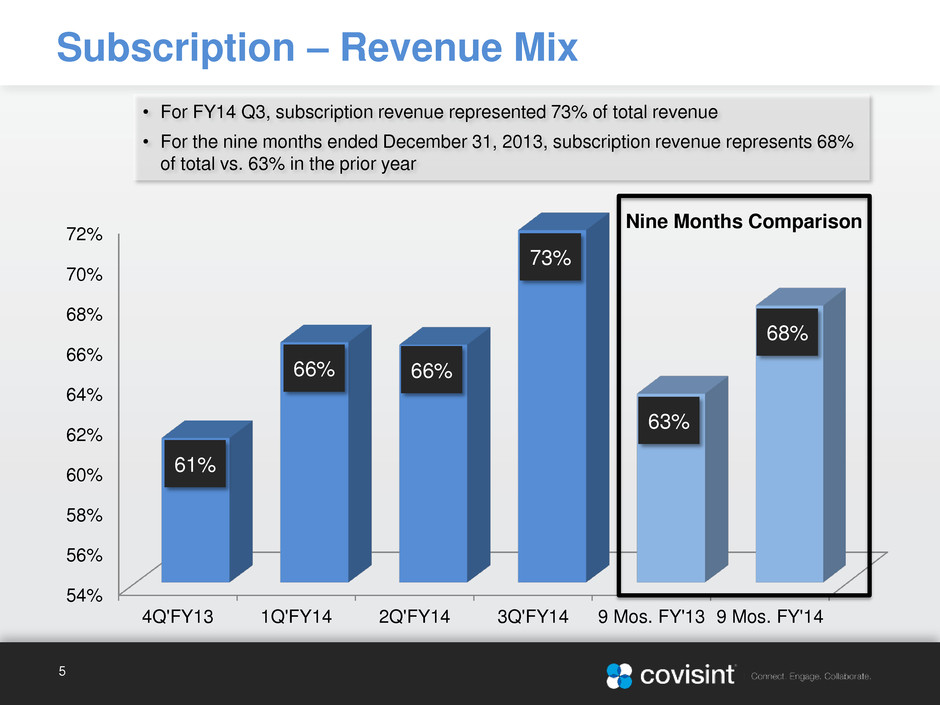
54% 56% 58% 60% 62% 64% 66% 68% 70% 72% 4Q'FY13 1Q'FY14 2Q'FY14 3Q'FY14 9 Mos. FY'13 9 Mos. FY'14 Subscription – Revenue Mix 5 66% 66% 61% • For FY14 Q3, subscription revenue represented 73% of total revenue • For the nine months ended December 31, 2013, subscription revenue represents 68% of total vs. 63% in the prior year 73% 63% 68% Nine Months Comparison
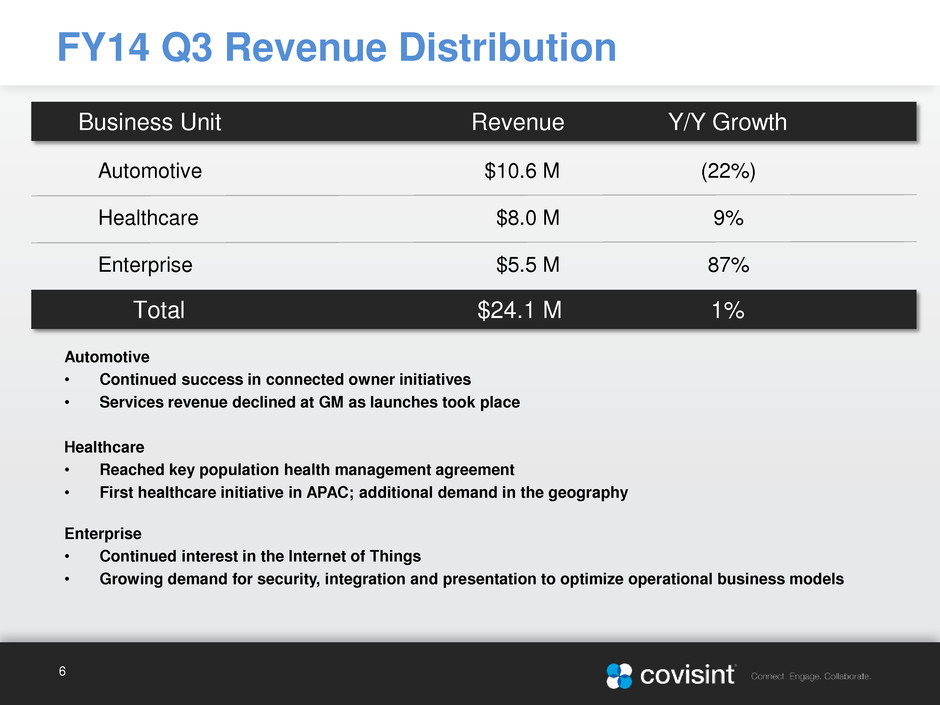
FY14 Q3 Revenue Distribution 6 Business Unit Revenue Y/Y Growth Automotive $10.6 M (22%) Healthcare $8.0 M 9% Enterprise $5.5 M 87% Total $24.1 M 1% Automotive • Continued success in connected owner initiatives • Services revenue declined at GM as launches took place Healthcare • Reached key population health management agreement • First healthcare initiative in APAC; additional demand in the geography Enterprise • Continued interest in the Internet of Things • Growing demand for security, integration and presentation to optimize operational business models

Non-GAAP* Income Statement ($ in thousands) FY14 Q3 Non-GAAP Financial Overview Highlights • Subscription revenue increased 21% Y/Y • Services decreased 30% Y/Y • Gross margin consistent with recent quarters Guidance Summary 7 Y/Y Q/Q REVENUE Subscription 17,586 21% 9% Services 6,523 (30%) (22%) Total revenue 24,109 1% (2%) COST OF REVENUE 11,812 8% (1%) GROSS PROFIT 12,297 (5%) (3%) Gross margin 51% OPERATING EXPENSES Research and development 4,391 (7%) 5% Sales and marketing 7,289 14% 8% Administrative and general 4,229 (4%) 4% Total operating expenses 15,909 Income (loss) before tax (3,612) Income tax provision 22 NET INCOME (LOSS) (3,634) Diluted EPS (0.10) *Excludes the impact of stock option compensation and the expensing of certain R&D costs (rather than capitalizing such costs). FY14 Q4 FY14 Subscription Revenue** 18-20% 18-20% Services Revenue** (11)-(9%) (5)-0% Total Revenue** 6-8% 10-12% Net Income ($15 M) – ($12 M) Total Shares 37.5 M **Y/Y growth

Appendix
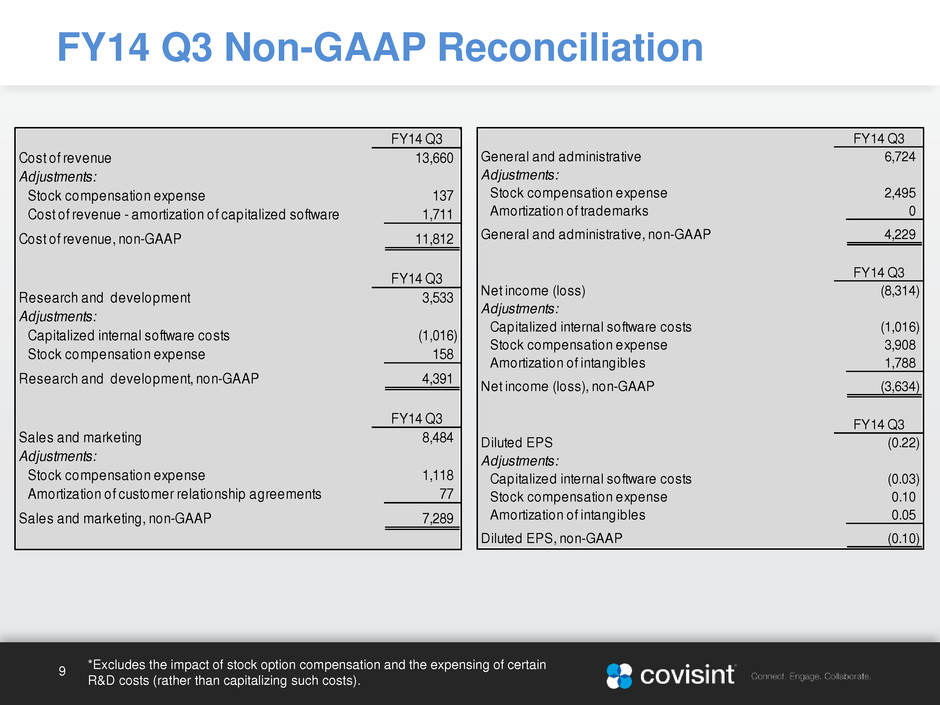
FY14 Q3 Non-GAAP Reconciliation 9 General and administrative 6,724 Adjustments: Stock compensation expense 2,495 Amortization of trademarks 0 General and administrative, non-GAAP 4,229 Net income (loss) (8,314) Adjustments: Capitalized internal software costs (1,016) Stock compensation expense 3,908 Amortization of intangibles 1,788 Net income (loss), non-GAAP (3,634) Diluted EPS (0.22) Adjustments: Capitalized internal software costs (0.03) Stock compensation expense 0.10 Amortization of intangibles 0.05 Diluted EPS, non-GAAP (0.10) FY14 Q3 FY14 Q3 FY14 Q3 Cost of revenue 13,660 Adjustments: Stock compensation expense 137 Cost of revenue - amortization of capitalized software 1,711 Cost of revenue, non-GAAP 11,812 Research and development 3,533 Adjustments: Capitalized internal software co ts (1,016) Stock compensation expense 158 Research and development, non-GAAP 4,391 Sales and marketing 8,484 Adjustments: Stock compensation expense 1,118 Amortization of cust mer relationship agre m nts 77 Sales and marketing, non-GAAP 7,289 FY14 Q3 FY14 Q3 FY14 Q3 *Excludes the impact of stock option compensation and the expensing of certain R&D costs (rather than capitalizing such costs).


