8/6/2015 1 Covisint Corporation First Quarter Fiscal 2016 Results August 6, 2015
This presentation contains “forward-looking” statements that involve risks, uncertainties and assumptions. If the risks or uncertainties ever materialize or the assumptions prove incorrect, our results may differ materially from those expressed or implied by such forward-looking statements. All statements other than statements of historical fact could be deemed forward-looking, including, but not limited to, any projections of financial information; any statements about historical results that may suggest trends for our business and results of operations; any statements of the plans, strategies and objectives of management for future operations; any statements of expectation or belief regarding future events, potential markets or market size, technology developments, or enforceability of our intellectual property rights; and any statements of assumptions underlying any of the foregoing. These statements are based on estimates and information available to us at the time of this presentation and are not guarantees of future performance. Actual results could differ materially from our current expectations as a result of many factors, including but not limited to: our ability to attract new customers; the extent to which customers renew their contracts for our solutions; the extent we are able to maintain pricing with our customers at renewal; the seasonality of our business; our ability to manage our growth; the continued growth of the market for our solutions; the success of our channel partner and certified partner strategies; competition from current competitors and new market entrants; our ability to penetrate new vertical markets; unpredictable macro-economic conditions; the loss of any of our key employees; the length of the sales and implementation cycles for our solutions; increased demands on our infrastructure and costs associated with operating as a public company; and failure to protect our intellectual property. These and other risks and uncertainties associated with our business are described in our Annual Report on Form 10-K for the fiscal year ended March 31, 2015. We assume no obligation and do not intend to update these forward-looking statements. In addition to U.S. GAAP financials, this presentation includes certain non-GAAP financial measures. These historical and forward-looking non-GAAP measures are in addition to, not a substitute for or superior to, measures of financial performance prepared in accordance with GAAP. A reconciliation between GAAP and non-GAAP measures is included in the appendix to this presentation. Covisint is a registered trademark of Covisint Corporation. This presentation also contains additional trademarks and service marks of ours and of other companies. We do not intend our use or display of other companies’ trademarks or service marks to imply a relationship with, or endorsement or sponsorship of us by, these other companies. Forward Looking Statements
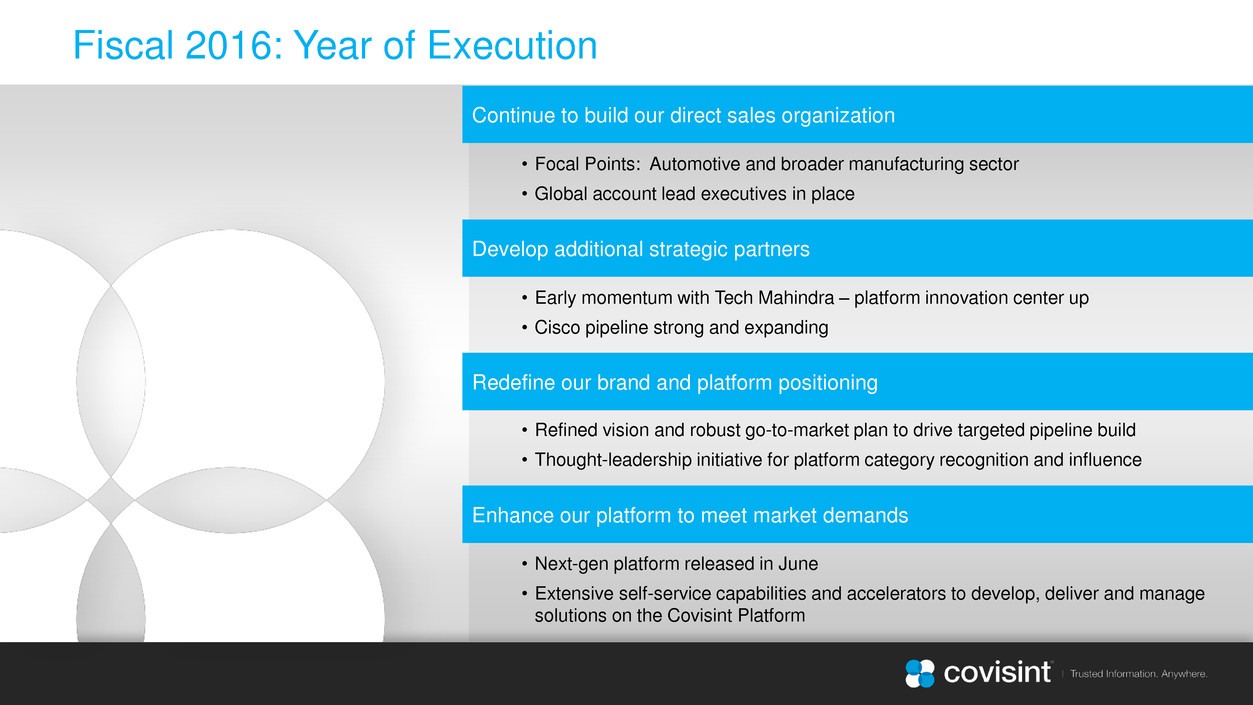
• Next-gen platform released in June • Extensive self-service capabilities and accelerators to develop, deliver and manage solutions on the Covisint Platform • Focal Points: Automotive and broader manufacturing sector • Global account lead executives in place • Early momentum with Tech Mahindra – platform innovation center up • Cisco pipeline strong and expanding • Refined vision and robust go-to-market plan to drive targeted pipeline build • Thought-leadership initiative for platform category recognition and influence Fiscal 2016: Year of Execution Continue to build our direct sales organization Develop additional strategic partners Redefine our brand and platform positioning Enhance our platform to meet market demands
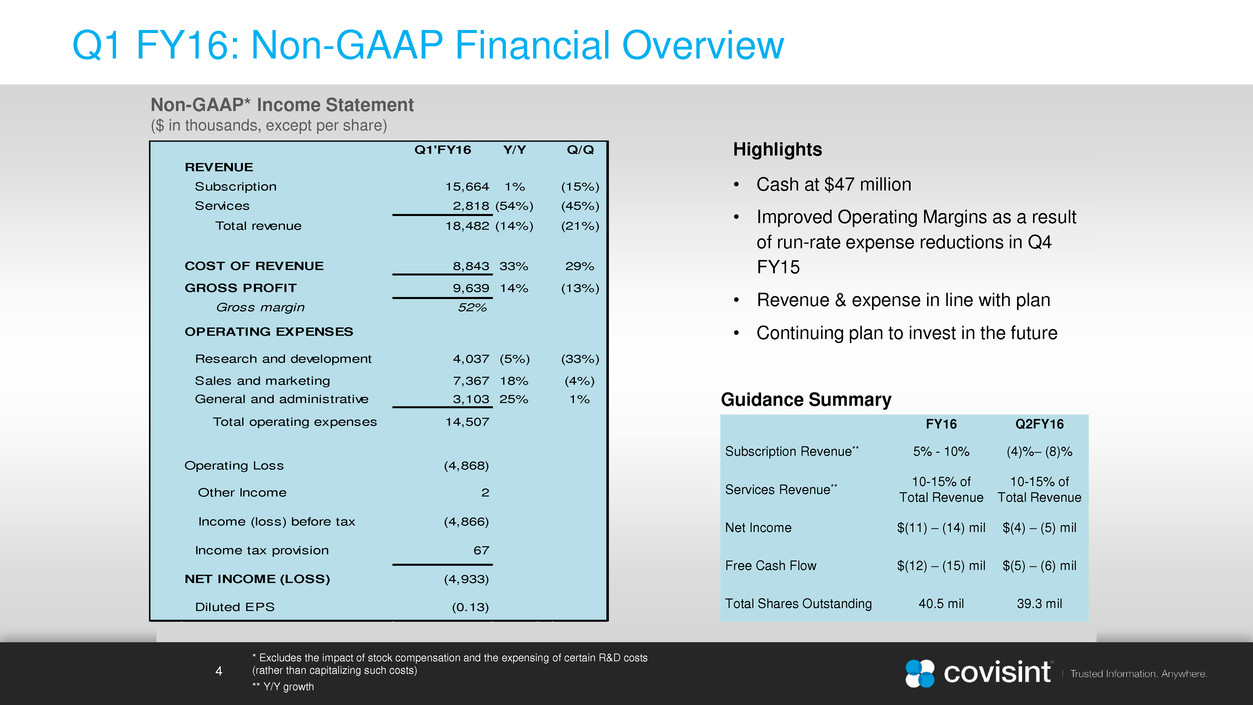
4 Q1 FY16: Non-GAAP Financial Overview Non-GAAP* Income Statement ($ in thousands, except per share) Guidance Summary FY16 Q2FY16 Subscription Revenue** 5% - 10% (4)%– (8)% Services Revenue** 10-15% of Total Revenue 10-15% of Total Revenue Net Income $(11) – (14) mil $(4) – (5) mil Free Cash Flow $(12) – (15) mil $(5) – (6) mil Total Shares Outstanding 40.5 mil 39.3 mil * Excludes the impact of stock compensation and the expensing of certain R&D costs (rather than capitalizing such costs) ** Y/Y growth Highlights • Cash at $47 million • Improved Operating Margins as a result of run-rate expense reductions in Q4 FY15 • Revenue & expense in line with plan • Continuing plan to invest in the future Q1'FY16 Y/Y Q/Q REVENUE Subscription 15,664 1% (15%) Services 2,818 (54%) (45%) Total revenue 18,482 (14%) (21%) COST OF REVENUE 8,843 33% 29% GROSS PROFIT 9,639 14% (13%) Gross margin 52% OPERATING EXPENSES Research and development 4,037 (5%) (33%) Sales and marketing 7,367 18% (4%) General and administrative 3,103 25% 1% Total operating expenses 14,507 Operating Loss (4,868) Other Income 2 Income (loss) before tax (4,866) Income tax provision 67 NET INCOME (LO S) (4,933) Diluted EPS (0.13)

Appendix
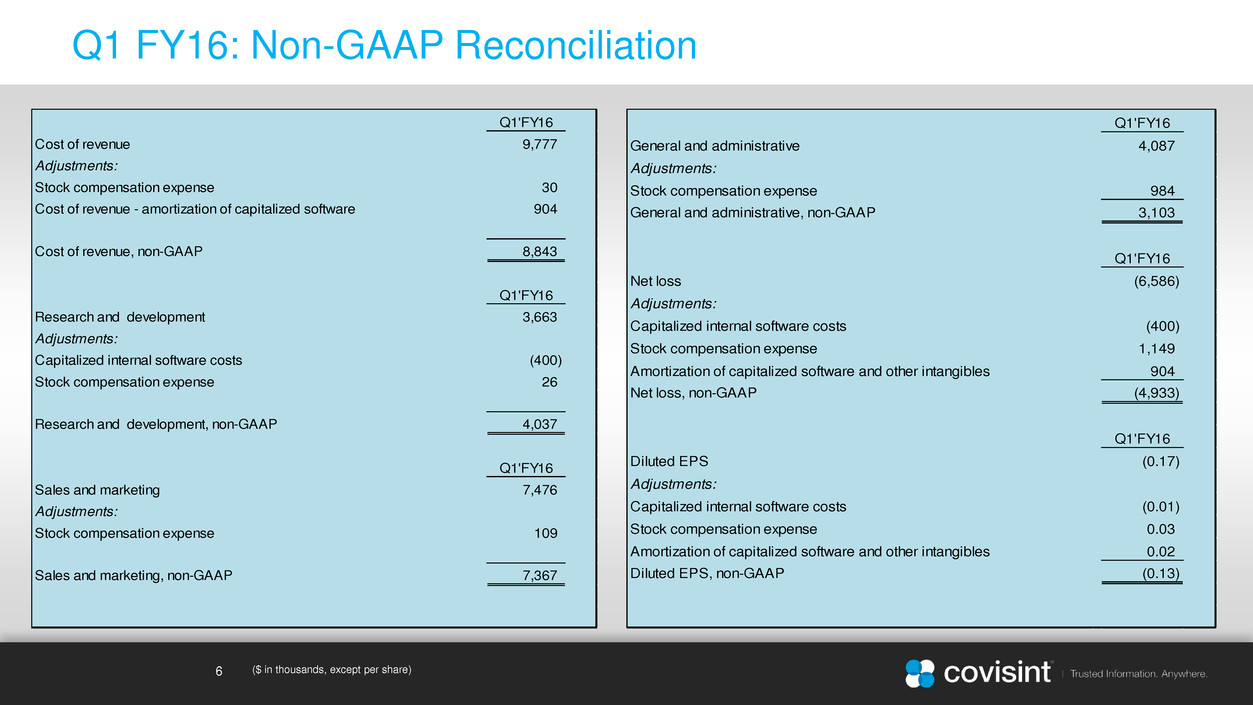
6 Q1 FY16: Non-GAAP Reconciliation ($ in thousands, except per share) Q1'FY16 Cost of revenue 9,777 Adjustments: Stock compensation expense 30 Cost of revenue - amortization of capitalized software 904 Cost of revenue, non-GAAP 8,843 Q1'FY16 Research and development 3,663 Adjustments: Capitalized internal software costs (400) Stock compensation expense 26 Research and development, non-GAAP 4,037 Q1'FY16 Sales and marketing 7,476 Adjustments: Stock compensation expense 109 Sales and marketing, non-GAAP 7,367 Q1'FY16 General and administrative 4,087 Adjustment : Stock compe sation expense 984 General and administrative, non-GAAP 3,103 Q1'FY16 Net loss (6,586) Adjustments: Capitalized internal software costs (400) Stock comp nsation expense 1,149 Am rtization of capitalized software and other intangibles 904 Net loss, non-GAAP (4,933) Q1'FY16 Diluted EPS (0.17) Adjustments: Capitalized internal software costs (0.01) Stock compensation expense 0.03 Amortization of capitalized software and other intangibles 0.02 Diluted EPS, non-GAAP (0.13)


