UNITED STATES
SECURITIES AND EXCHANGE COMMISSION
Washington, DC 20549
FORM 10-K
(Mark One)
☒ ANNUAL REPORT PURSUANT TO SECTION 13 OR 15(d) OF THE SECURITIES EXCHANGE ACT OF 1934
For the fiscal year ended December 31, 2021
OR
☐ TRANSITION REPORT PURSUANT TO SECTION 13 OR 15(d) OF THE SECURITIES EXCHANGE ACT OF 1934
Commission file number: 000-55610
GREENBACKER RENEWABLE ENERGY COMPANY LLC
(Exact Name of Registrant as Specified in Its Charter)
| | | | | | | | |
| Delaware | | 80-0872648 |
| (State or Other Jurisdiction of | | (I.R.S. Employer |
| Incorporation or Organization) | | Identification No.) |
230 Park Avenue, Suite 1560
New York, NY 10169
Tel (646) 720-9463
(Address, including zip code and telephone number, including area code, of registrant's Principal Executive Office)
Charles Wheeler
c/o Greenbacker Capital Management LLC
30 Danforth Street, Suite 206
Portland, ME 04101
Tel (646) 237-7884
(Name, address, including zip code, and telephone number, including area code, of agent for service)
Securities registered pursuant to Section 12(b) of the Act:
| | | | | | | | | | | | | | |
| Title of each class | | Trading symbol(s) | | Name of each exchange on which registered |
| Limited liability company interest | | N/A | | N/A |
Securities registered pursuant to section 12(g) of the Act:
Indicate by check mark if the registrant is a well-known seasoned issuer, as defined in Rule 405 of the Securities Act of 1933. Yes ☐ No ☒
Indicate by check mark if the registrant is not required to file reports pursuant to Section 13 or Section 15(d) of the Securities Exchange Act of 1934. Yes ☐ No ☒
Indicate by check mark whether the registrant: (1) has filed all reports required to be filed by Section 13 or 15(d) of the Securities Exchange Act of 1934 during the preceding 12 months (or for such shorter period that the registrant was required to file such reports), and (2) has been subject to such filing requirements for the past 90 days. Yes ☒ No ☐
Indicate by check mark whether the registrant has submitted electronically and posted on its corporate Web site, if any, every Interactive Data File required to be submitted and posted pursuant to Rule 405 of Regulation S-T (§232.405 of this chapter) during the preceding 12 months (or for such shorter period that the registrant was required to submit and post such files). Yes ☒ No ☐
Indicate by check mark if disclosure of delinquent filers pursuant to Item 405 of Regulation S-K (§229.405 of this chapter) is not contained herein, and will not be contained, to the best of the registrant’s knowledge, in definitive proxy or information statements incorporated by reference in Part III of this Form 10-K or any amendment to this Form 10-K. Yes ☒ No ☐
Indicate by check mark whether the registrant is a large accelerated filer, an accelerated filer, a non-accelerated filer or a smaller reporting company. See the definitions of “large accelerated filer,” “accelerated filer” and “smaller reporting company” in Rule 12b-2 of the Exchange Act (check one):
| | | | | | | | | | | |
| Large accelerated filer | ☐ | Accelerated filer | ☐ |
| Non-accelerated filer | ☐ | Smaller reporting company | ☐ |
| Emerging growth company | ☒ | | |
If an emerging growth company, indicate by check mark if the registrant has elected not to use the extended transition period for complying with any new or revised financial accounting standards provided pursuant to Section 13(a) of the Exchange Act. ☐
Indicate by check mark whether the registrant is a shell company (as defined in Rule 12b-2 of the Exchange Act). Yes ☐ No ☒
As of March 17, 2022, the registrant had 177,680,543 shares of common interests, $0.001 par value, outstanding.
TABLE OF CONTENTS
GLOSSARY OF KEY TERMS
In this annual report on Form 10-K, except as otherwise indicated, the terms:
•The “Advisor” and “GCM” refer to Greenbacker Capital Management LLC, our Advisor;
•“COD” — Commercial Operations Date;
•“DRP” — Distribution Reinvestment Plan;
•“EEC” — Energy Efficiency Certificate;
•“GREC” refers to Greenbacker Renewable Energy Corporation, a Maryland corporation;
•“GREC HoldCo” refers to GREC Entity HoldCo LLC, a wholly owned subsidiary of GREC;
•“Greenbacker Administration” and “Administrator” refer to Greenbacker Administration, LLC, our Administrator;
•“Greenbacker Group LLC” refers to a sponsor of the Company and the parent of GCM;
•“GW” — Gigawatts;
•“ITC” — Investment Tax Credit;
•“kW” — Kilowatts;
•“kWh” — Kilowatt Hours;
•“LLC” refers to Greenbacker Renewable Energy Company LLC;
•“MIPA” — Membership Interest Purchase Agreement;
•“MW” — Megawatts: (DC) for all solar assets and (AC) for wind assets;
•“MWh” — Megawatt Hours;
•“N/A” — Not Applicable;
•“PPA” — Power Purchase Agreement;
•“PTC” — Production Tax Credit;
•“PV” — Photovoltaic;
•“REC” — Renewable Energy Credit;
•“RPS” — Renewable Portfolio Standard;
•The terms “SC Distributors” and “former dealer manager” refer to SC Distributors, LLC, a Delaware limited liability company, the LLC’s former dealer manager;
•The term “special unit” refers to the special unit of the limited liability company interest in the LLC entitling the Special Unitholder to a performance participation fee;
•The term “Special Unitholder” refers to GREC Advisors, LLC, a Delaware limited liability company, which is a subsidiary of our Advisor;
•“SREC” — Solar Renewable Energy Credit; and
•“we,” “us,” “our” and the “Company” refer, collectively, to Greenbacker Renewable Energy Company LLC, Greenbacker Renewable Energy Corporation, GREC Entity HoldCo LLC, GREC Administration LLC and Danforth Shared Services LLC.
PART I
ITEM 1. BUSINESS
Formation of Our Company
Greenbacker Renewable Energy Company LLC (the “LLC”), a Delaware limited liability company formed in December 2012, is an externally managed energy company that acquires and manages income-generating renewable energy and energy efficiency projects, and other energy-related businesses, as well as finances the construction and/or operation of these and other sustainable development projects and businesses. The LLC conducts substantially all of its operations through its wholly-owned subsidiary, Greenbacker Renewable Energy Corporation (“GREC”).
GREC is a Maryland corporation formed in November 2011, and the LLC currently holds all of the outstanding shares of capital stock of GREC. GREC Entity HoldCo LLC (“GREC HoldCo”), a wholly owned subsidiary of GREC, was formed in Delaware in June 2016. GREC Administration LLC and Danforth Shared Services LLC, both wholly owned subsidiaries of GREC, were formed in Delaware in January 2020 and May 2019, respectively. The use of “we”, “us”, “our” and the “Company” refer, collectively, to the LLC, GREC, GREC HoldCo, GREC Administration LLC and Danforth Shared Services LLC. We are externally managed and advised by our Advisor, Greenbacker Capital Management LLC (the “Advisor” or “GCM”), a renewable energy, energy efficiency and sustainability-related project acquisition, consulting and development company that is registered as an investment advisor under the Investment Advisers Act of 1940, as amended (“Advisers Act”). The LLC’s fiscal year-end is December 31.
Pursuant to an initial Registration Statement filed in December 2011 (File No. 333-178786-01) and a second Registration Statement filed in February 2017 (File No. 333-211571), the Company offered up to $1,000,000,000 in shares of limited liability company interests, or the shares, including up to $200,000,000 of shares pursuant to the Company’s distribution reinvestment plan (the "DRP"). As of March 29, 2019, the Company terminated its public offering of the shares, as well as its privately offered Class P-A shares. The Company publicly offered three classes of shares: Class A, C and I. The share classes had different selling commissions and dealer manager fees, and there is an ongoing distribution fee with respect to Class C shares. The Company adopted the DRP pursuant to which a shareholder owning publicly offered share classes may elect to have the full amount of cash distributions reinvested in additional shares. Following the termination of the Company’s public offering of shares, the DRP and the share repurchase plan continue to be available to existing investors. As of June 4, 2019, pursuant to our Registration Statement on Form S-3 (File No. 333-231960), we were offering a maximum of $10,000,000 in shares to our existing shareholders pursuant to the DRP. As of November 30, 2020, pursuant to our Registration Statement on Form S-3 (File No. 333-251021), the Company is offering up to $20,000,000 in shares to our existing shareholders pursuant to the DRP. As of December 31, 2020, Class A, C and I shares were offered pursuant to the DRP.
As of October 18, 2020, the Company was privately offering Classes P-A, P-I, P-D, P-T and, P-S shares on a continuous basis. The DRP was amended as of February 1, 2021, to include all of the Company's privately offered share classes.
As of March 17, 2022, the Company is closed to new equity capital and is no longer offering shares except pursuant to the DRP.
Each quarter, our Advisor, utilizing the services of an independent valuation firm, when necessary, reviews and approves the net asset value for each class of shares, subject to the oversight of the Company’s Board of Directors. For each month, we determine our Monthly Share Value for each class of our shares. To the extent that our Monthly Share Value per share per class on the most recent valuation date increases above or decreases below our prior Monthly Share Value per share per class, we will adjust the offering prices of each class of shares as appropriate.
Overview of Our Business
Our business objective is to generate attractive risk-adjusted returns for our members, consisting of both current income and long-term capital appreciation, by acquiring and financing the construction and/or operation of income-generating renewable energy, energy efficiency and sustainable development projects, primarily within North America. We expect the size of our investments to generally range between approximately $5 million and $100 million. We will seek to maximize our risk-adjusted returns by: (1) capitalizing on market opportunities; (2) focusing on hard assets that produce dependable cash flows; (3) efficiently utilizing government incentives where available; (4) employing creative deal structuring to optimize capital and ownership structures; (5) partnering with experienced financial, legal, engineering and other professional firms; (6) employing sound due diligence and risk mitigation processes; and (7) monitoring and managing our portfolio of assets on an ongoing basis. We may change our investment policies and strategies without prior notice or member approval.
Our goal is to assemble a diversified portfolio of renewable energy, energy efficiency and other sustainability-related projects and businesses. Renewable energy projects generally earn revenue through the sale of generated electricity as well as frequently through the sale of other commodities such as RECs and EECs. We initially focused on solar, wind and energy projects. We believe solar energy projects generally offer more predictable power generation characteristics, due to the relative predictability of sunlight over the course of time, compared to other renewable energy technologies, and therefore we expect them to provide more stable income streams. However, technological advances in wind turbines and other energy-generation technologies, as well as government incentives, also make wind energy and other types of projects attractive.
Solar energy projects provide maximum energy production during daylight hours in the summer months when days are longer and nights shorter. Solar energy projects tend to have minimal environmental impact, enabling such projects to be developed close to areas of dense population where electricity demand is highest. Solar technology is scalable and well-established, and is a relatively simple to integrate new acquisitions and projects into our portfolio.
Over time, we have broadened our strategy to include other types of renewable energy projects and energy efficiency projects and businesses, which may include wind farms, hydropower assets, geothermal plants, biomass and biofuel assets, combined heat and power technology assets, fuel cell assets and other energy efficiency assets, among others, and to the extent we deem the opportunity attractive, other energy and sustainability-related assets and businesses.
Our preferred investment strategy is to acquire controlling equity stakes in our target assets or to be named the managing member of a limited liability company in order to oversee and supervise its operations. We define controlling equity stakes as companies in which we own 25% or more of the voting securities of such company or have greater than 50% representation on such company’s board of directors, or as the managing member of a limited liability company. However, we will also provide financing to projects owned by others, including through the provision of secured loans, which may or may not include some form of equity participation.
We may also provide projects with senior unsecured debt, subordinated secured debt, subordinated unsecured debt, mezzanine debt, convertible debt, convertible preferred equity and preferred equity, and make minority equity investments. We may also participate in projects by acquiring contractual payment rights or rights to receive a proportional interest in the operating cash flow or net income of a project. We may also make equity investments in or loans to parties financing the supply of renewable energy and energy efficiency to residential and commercial customers or adopting strategies that encourage energy conservation to reduce the consumption of energy by those customers. Our ongoing strategy will be tailored to balance long-term cash flow certainty, which we can achieve through long-term agreements for our projects, with shorter-term arrangements that allow us to potentially generate higher risk-adjusted returns.
We expect to supplement our equity capital and increase potential returns to our members through the use of prudent levels of borrowings both at the corporate level and the project level. In addition to any corporate credit facility or other secured and unsecured borrowings, we expect to use other financing methods at the project level as necessary, including but not limited to joint venture structures, construction loans, property mortgages, letters of credit, sale and leaseback transactions, other lease transactions and other arrangements, any of which may be unsecured or may be secured by mortgages or other interests in our assets. In addition, we may issue publicly or privately placed debt instruments. When appropriate, we will seek to replace short-term sources of capital with long-term financing.
During the year ended December 31, 2021, we either closed on the acquisition or contracted for the acquisition of 150 renewable energy projects: 145 solar and five wind assets. During the year ended December 31, 2021, we had one project disposal. Refer to the Portfolio and Investment Activity section for further discussion. As our access to capital has increased, the average size of our projects increased from 3.6 MW per project as of December 31, 2020, to 6.5 MW per project as of December 31, 2021.
Our renewable energy projects generate revenue primarily by selling (1) generated electric energy and/or capacity to local utilities and high-quality utility, municipal, corporate and individual residential counterparties; and (2) in some cases, RECs, EECs and other commodities associated with renewable generation or related incentives. We seek to acquire or finance projects that contain transmission infrastructures and access to power grids or networks that will enable the generated power to be sold. We generally expect our projects will have PPAs with one or more counterparties, including local utilities or other high-credit-quality counterparties, who agree to purchase the electricity generated from the project. We refer to these PPAs as “must-take contracts,” and we refer to these other counterparties as “offtakers.” These must-take contracts in general are output-based and guarantee that all electricity generated by each project will be purchased.
Although we intend to work primarily with high-credit-quality counterparties, if an offtaker cannot fulfill its contractual obligation to purchase the power, we generally can sell the power to the local utility or other replacement counterparty, which
would potentially ensure that revenue is generated for all solar electricity generation. We may also generate revenue from the receipt of interest, fees, capital gains and distributions from investments in our target assets.
Our PPAs, when structured with utilities and other large commercial users of electricity, are generally long-term in nature, tied to 100% of the output of the specific generating asset, and priced at a rate established pursuant to a formula set by the contract. The formula is often dependent upon the type of subsidies, if any, offered by the local and state governments for project development. Although we focus on projects with long-term contracts that ensure price certainty, we may also look for projects with shorter-term arrangements that will allow us to participate in market rate changes, which may lead to higher current income.
A number of the PPAs for our projects are structured as “behind the meter” agreements with residential, commercial or government entities. Under these agreements, all electricity generated by a project will be purchased by the offtaker at an agreed-upon rate that may be set at a slight discount to the retail electric tariff rate for the offtaker. These agreements also typically provide for annual rate increases over the term of the agreement, although that is not a necessary requirement. The behind the meter agreement is generally long-term in nature, and further typically provides that, should the offtaker fail to fulfill its contractual obligation, any electricity that is not purchased by the offtaker may be sold to the local utility, usually at an equivalent wholesale spot electric rate.
The table below sets forth the Company’s investments in alternative energy generation portfolios as of December 31, 2021.
| | | | | | | | | | | | | | | | | | | | | | | | | | | | | | | | | | | | | | | | | | | | | | | | |
| Transaction Close Date | | Industry | | Location(s) | | Form of Investment*** | | Cost**/Principal
Amount* | | Assets | | Generation
Capacity in (MW)* | | | | | | | |
| Pacifica Portfolio | Q2 2020 - Q3 2020 | | Battery Storage | | California | | 100% Ownership | | $ | 11,288,841 | | | Operating and to-be-constructed battery energy storage facilities | | 14.3 | | | | | | | | |
| Eagle Valley Biomass Portfolio | Q2 2019 | | Biomass | | Colorado | | 100% Ownership | | $ | 24,533,222 | | | Operating biomass facility | | 12.0 | | | | | | | | |
| Celadon Portfolio | Q1 2019 - Q4 2021 | | Commercial Solar | | California, Colorado, Washington D.C., Illinois, Massachusetts, Minnesota, Nevada, New Jersey, New York, North Carolina, Ohio, Pennsylvania, Utah, Vermont, Washington, and Wisconsin | | 100% Ownership or Managing Member, Equity Owner | | $ | 165,129,450 | | | Commercial ground, rooftop-mounted photovoltaic systems and carport system | | 175.0 | | | | | | | |
| GEH Portfolio | Q1 2015 - Q2 2021 | | Commercial Solar | | Arizona, California, Colorado, Connecticut, Florida, Hawaii, Indiana, Massachusetts, Maryland, New Jersey, New York, North Carolina, Tennessee, and Vermont | | 100% Ownership or Managing Member, Equity Owner | | $ | 150,463,205 | | | Commercial and residential ground, rooftop-mounted solar photovoltaic systems and carport system | | 100.3 | | | | | | | |
| Ponderosa Portfolio | Q4 2020 - Q3 2021**** | | Commercial Solar | | Michigan, Montana, South Dakota, and Wyoming | | 100% Ownership | | $ | 49,514,975 | | | Commercial ground and rooftop-mounted photovoltaic systems | | 267.3 | | | | | | | |
| | | | | | | | | | | | | | | | | | | | | | | | | | | | | | | | | | | | | | | | | | | | | | | | |
| Transaction Close Date | | Industry | | Location(s) | | Form of Investment*** | | Cost**/Principal
Amount* | | Assets | | Generation
Capacity in (MW)* | | | | | | | |
| Sego Lily - Solar Portfolio | Q4 2020 - Q1 2021 | | Commercial Solar | | California and Utah | | 100% Ownership or Managing Member, Equity Owner | | $ | 107,621,275 | | | Commercial ground and rooftop-mounted photovoltaic systems | | 119.9 | | | | | | | | |
| Trillium Portfolio | Q4 2018 - Q4 2020 | | Commercial Solar | | Arkansas, California, Colorado, Maryland, Massachusetts, New Jersey, Oregon, Pennsylvania, Vermont, and Washington D.C. | | Managing Member, Equity Owner | | $ | 74,764,309 | | | Commercial and residential ground, rooftop-mounted solar photovoltaic systems and carport system | | 84.7 | | | | | | | | |
| Other Commercial Solar Portfolios | Q3 2014 - Q4 2021 | | Commercial Solar | | Ontario, Canada, California, Colorado, Illinois, Maine, Maryland, Massachusetts, Michigan, Minnesota, Nevada, New Jersey, New York, North Carolina, Rhode Island, South Dakota, and Vermont | | 100% Ownership or Managing Member, Equity Owner, or Equity Owner | | $ | 250,865,362 | | | Commercial and residential ground and rooftop-mounted solar photovoltaic systems | | 1,470.6 | | | | | | | |
| Sego Lily - Wind Portfolio | Q1 2020 - Q2 2021 | | Wind | | California and Maine | | Managing Member, Equity Owner | | $ | 117,410,390 | | | Operating wind power facilities | | 72.8 | | | | | | | | |
| Greenbacker Wind Holdings II Portfolio | Q4 2015 - Q4 2020 | | Wind | | Iowa, Massachusetts, and Montana | | 100% Ownership or Managing Member, Equity Owner | | $ | 62,787,210 | | | Operating wind power facilities | | 90.0 | | | | | | | | |
| Greenbacker Wind - HoldCo Portfolio | Q2 2017 - Q4 2019 | | Wind | | Idaho, Iowa, Minnesota, Vermont | | 100% Ownership | | $ | 84,674,188 | | | Operating wind power facilities | | 131.3 | | | | | | | | |
| Other Wind Investments Portfolios | Q4 2017 - Q3 2021 | | Wind | | California, Minnesota, and New York | | 100% Ownership | | $ | 56,638,076 | | | Operating wind power facilities | | 92.0 | | | | | | | | |
| Other Portfolios | Q4 2015 | | Other | | Delaware, North Carolina, and Vermont | | 100% Ownership or Equity Owner | | $ | 35,034,396 | | | Commercial ground and rooftop-mounted photovoltaic systems | | N/A | | | | | | | |
| Other Energy Efficiency Portfolios | Q3 2015 - Q4 2015 | | Energy Efficiency | | Pennsylvania, Puerto Rico | | Secured Loan, Capital Lease | | $ | 668,736 | | | Energy efficiency LED lighting | | N/A | | | | | | | |
| Chaberton Loan | Q3 2021 | | Secured Loan | | Maryland | | Secured Loan | | $ | 2,247,962 | | | Loan | | N/A | | | | | | | |
| | | | | | | | | | | | | | | | | | | | | | | | | | | | | | | | | | | | | | | | | | | | | | | | |
| Transaction Close Date | | Industry | | Location(s) | | Form of Investment*** | | Cost**/Principal
Amount* | | Assets | | Generation
Capacity in (MW)* | | | | | | | |
| Encore Loan | Q4 2019 | | Secured Loan | | Vermont | | Secured Loan | | $ | 3,058,527 | | | Loan | | N/A | | | | | | | |
| Hudson Loan | Q2 2019 | | Secured Loan | | New York | | Secured Loan | | $ | 4,984,650 | | | Loan | | N/A | | | | | | | |
| Hudson II Loan | Q4 2019 | | Secured Loan | | New York | | Secured Loan | | $ | 4,227,098 | | | Loan | | N/A | | | | | | | |
| New Market Loan | Q4 2019 | | Secured Loan | | North Carolina | | Secured Loan | | $ | 5,008,070 | | | Loan | | N/A | | | | | | | |
| Shepherd's Run Loan | Q4 2020 | | Secured Loan | | New York | | Secured Loan | | $ | 8,751,528 | | | Loan | | N/A | | | | | | | |
| SE Solar Loan | Q1 2019 | | Secured Loan | | North Carolina | | Secured Loan | | $ | 5,008,304 | | | Loan | | N/A | | | | | | | |
| Allspring Treasury Plus Money Market Fund - Institutional Class | Q4 2021 | | Money Market Funds | | N/A | | Money Market Funds | | $ | 16,823,110 | | | Money Market Funds | | N/A | | | | | | | |
| Fidelity Government Portfolio - Class I | Q1 2020 | | Money Market Funds | | N/A | | Money Market Funds | | $ | 16,873,111 | | | Money Market Funds | | N/A | | | | | | | |
| First American Government Obligations Fund - Class X | Q2 2021 | | Money Market Funds | | N/A | | Money Market Funds | | $ | 16,823,111 | | | Money Market Funds | | N/A | | | | | | | |
| First American Government Obligations Fund - Class Z | Q4 2021 | | Money Market Funds | | N/A | | Money Market Funds | | $ | 50,000 | | | Money Market Funds | | N/A | | | | | | | |
| JPMorgan US Government Money Market Fund - Class L | Q1 2021 | | Money Market Funds | | N/A | | Money Market Funds | | $ | 16,823,111 | | | Money Market Funds | | N/A | | | | | | | |
| Total | | | | | | | | | $ | 1,292,072,217 | | | | | 2,630.2 | | | | | | | | |
* Approximate
** Does not include assumed project-level debt
*** 100% equity ownership (>50%), equity owner (<50%), managing member of the limited liability company, secured loan, money market funds or a capital lease
**** This portfolio includes assets with a transaction close date prior to the period in which they were transferred to the Ponderosa Portfolio
Of the total capacity of 2,630.2 MW, 1,062.6 MW is associated with operating assets and 1,567.6 MW is associated with pre-operational assets, including certain projects where we have contracted for the acquisition of the project pursuant to membership interest purchase agreements. Refer to the Portfolio and Investment Activity section for further discussion.
During the first quarter of 2021, the Company modified the presentation of the Consolidated Schedule of Investments to consolidate certain underlying portfolios. Certain portfolios that had been separately presented on the Consolidated Schedule of Investments have been aggregated with other portfolios in the same industry to be presented in a consolidated manner on the Consolidated Schedule of Investments. These consolidation efforts have no impact on the underlying portfolios or their individual cost or fair values but rather represent the aggregation of several similar investments. Certain portfolios, including those determined to be individually significant, remain presented separately. Management believes that the consolidation of our portfolios results in a presentation that better reflects the way in which we view our overall portfolio of investments and will enhance the information reported to the users of our financial statements.
Management has recast the Schedule of Investments as of December 31, 2020 to conform with current year presentation based upon the methodology as outlined above.
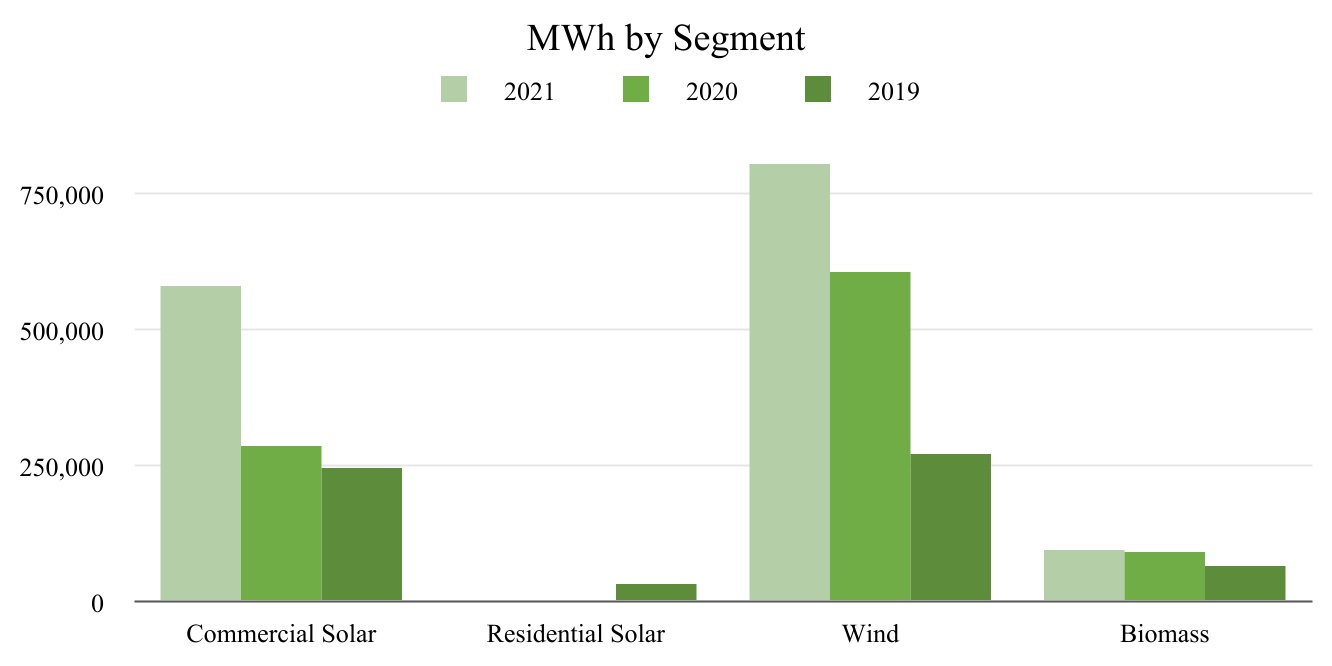
The investments described above have allowed us to execute on our strategy of constructing a portfolio of projects offering predictable power-generation characteristics and generally stable income streams, which include seasonal solar-generation income (generally stronger in the summer months), wind-generation income (generally stronger in the winter months), biomass-generation income, battery storage income, and energy efficiency lighting investments.
The LLC conducts a significant portion of its operations through GREC, of which the LLC is the sole shareholder. We intend to continue to operate our business in a manner permitting us to not be required to register under the Investment Company Act of 1940, as amended (the “Investment Company Act”).
Pursuant to the now-terminated Registration Statement on Form S-1 (File No. 333-211571), we offered on a continuous basis up to $1,000,000,000 in shares of our limited liability company interests. The primary offering was terminated on March 29, 2019. The LLC's initial offering pursuant to a Registration Statement on Form S-1 (File No. 333-178786-01) terminated on February 7, 2017. As of June 4, 2019, pursuant to our Registration Statement on Form S-3D (File No. 333-231960), we were offering a maximum of $10,000,000 in shares to our existing shareholders pursuant to the DRP. As of November 30, 2020, pursuant to our Registration Statement on Form S-3D (File No. 333-251021), the LLC is offering up to an additional $20,000,000 in Class A, C and I shares to our existing shareholders pursuant to the DRP. Shares of the LLC's limited liability company interests issued pursuant to the DRP through the period ending September 30, 2020 were being offered at the price equal to the then current offering price per each class of shares less selling commissions and dealer manager fees. Effective October 1, 2020, DRP shares began being offered at a price equal to our Monthly Share Value for each class of our shares. As of February 1, 2021, the DRP was amended to include all of the LLC’s privately offered share classes.
Pursuant to private placement memoranda, the LLC was offering Class P-A, P-I, P-S, P-T, and P-D shares. After the finalization of the December 31, 2021 NAV and Monthly Share Value, the offering price of the Class P-A, P-I, P-S, P-T, and P-D shares was $9.32, $8.80, $8.86, $9.40 and $9.07 per share, respectively. To the extent that our Monthly Share Value per share per class on the most recent valuation date increases above or decreases below our prior Monthly Share Value per share per class, we will adjust the offering prices of each class of shares as appropriate.
As of December 31, 2021, through initial purchases of shares and participation in the DRP, our Advisor owned 23,601 Class A shares and through initial purchases of shares, our Advisor owned 2,776 Class P-D shares. As of December 31, 2020, through initial purchases of shares and participation in the DRP, our Advisor owned 23,601 Class A shares and nil Class P-D shares.
As of December 31, 2021, we had received subscriptions for and issued 172,189,009 of our shares (including shares issued under the DRP) for gross proceeds of $1,558,357,569 (before dealer manager fees of $4,578,174 and selling commissions of $14,601,378 for net proceeds of $1,539,178,017). As of December 31, 2020, we had received subscriptions for and issued 67,133,640 of our shares (including shares issued under the DRP) for gross proceeds of $617,098,806 (before dealer manager fees of $4,308,949 and selling commissions of $14,198,029 for net proceeds of $598,591,828).
OUR ADVISOR
GCM, a private firm that is registered as an investment advisor under the Investment Advisers Act of 1940, as amended (the “Advisers Act”), serves as our Advisor. Under the direction of our Board of Directors, GCM manages our day-to-day operations and provides advisory and management services to us.
Led by its Chief Executive Officer, David Sher, who has over 10 years of experience in the energy infrastructure and project finance sector and in excess of 25 years of experience in the financial services sector; its President, Charles Wheeler (who also serves as our CEO, President and Board of Directors member), who has more than 30 years of experience in the energy infrastructure and project finance sector as well as the financial services sector; and its Chief Investment Officer, Mehul Mehta, who brings over 10 years of experience in energy finance, its Chief Financial Officer, Richard C. Butt, who has over 10 years of experience in the energy infrastructure and project finance sector and over 35 years of experience in the financial services sector; and its Executive Vice President, Spencer Mash, who has 10 years of experience in energy infrastructure and over 10 years of experience in the financial services sector, GCM’s management team has in excess of 50 years of experience in the energy, infrastructure, and project finance sectors and over 90 years of experience in the financial services sector. Over this time, the team has developed significant commercial relationships across multiple industries that we believe will benefit us as we implement our business plan. GCM maintains comprehensive renewable energy, project finance and capital markets databases, and has developed proprietary analytical tools and due diligence processes that will enable it to identify prospective
projects and to structure transactions quickly and effectively on our behalf. Neither GCM, Greenbacker Group LLC nor our senior management team have previously sponsored any other programs, either public or non-public, with similar investment objectives to ours.
We will continue to capitalize on the significant investing experience of our Advisor’s management team, including the 30+ years of investment banking and renewable energy expertise of Charles Wheeler, our Chief Executive Officer and President, and the President of GCM. Mr. Wheeler has held various senior positions with Macquarie Group, including Head of Financial Products for North America and Head of Renewables for North America. While serving as Head of Renewables for North America, Mr. Wheeler’s experience included evaluating wind project developers, solar asset acquisitions, assisting in the development of wind and solar greenfield projects, and assisting in the preparation of investment analyses for a biomass facility. Before moving to the United States to serve as Head of Financial Products for Macquarie Group in North America, Mr. Wheeler was a Director of the Financial Products Group in Australia, with responsibility for the development, distribution and ongoing management of a wide variety of retail financial products, including Real Estate Investment Trusts ("REITs"), infrastructure bonds, international investment trusts and diversified domestic investment trusts. Mr. Wheeler brings his extensive background in renewable energy and project and structured finance to help us effectively execute our strategy.
GCM’s Chief Executive Officer, David Sher, has extensive experience in the financial services and capital markets industries as well as significant successful entrepreneurial experience. Mr. Sher was previously a senior advisor at Prospect Capital Corporation, a mezzanine debt and private equity firm that manages a publicly traded, closed-end, dividend-focused business development company. Prior to joining Prospect, Mr. Sher was a serial entrepreneur, founding a number of ventures in the financial services and brokerage industry. Mr. Sher was also a founder and Managing Director of ESP Technologies, a leading provider of financial software and services to institutional asset managers and hedge funds. Prior to ESP, Mr. Sher was a founder and CEO of an online brokerage company, ElephantX dot com Inc. He was also co-founder of Lafayette Capital Management LLC, a statistical arbitrage hedge fund, and spent six years at Bear Stearns and Company, Inc., where he developed trading ideas and strategies for institutional and brokerage correspondent clearing customers.
Chief Investment Officer, Mehul Mehta, who is responsible for investment origination, has extensive experience in structuring, modeling and performing diligence for energy finance. He joined GCM in June 2016, bringing with him 10 years of experience within energy finance, working in a wide variety of roles and functions over that period. From 2015 to 2016, Mr. Mehta worked at BlackRock Infrastructure Investment Group as an Associate within the Global Renewable Power team, helping structure and execute investments in the North American renewable power space. Prior to this role, he worked at UBS within the equity research department helping cover alternative energy and semiconductor capital equipment companies, working on a team consistently ranked as a top research team by Institutional Investor. From 2012 to 2014 he was at Recurrent Energy, a leading solar developer, where he worked in Business Planning and Analysis, helping the company COO oversee the development, construction and operations of solar assets, and in the Originations group, helping to analyze deals for bidding and executing PPAs. Mr. Mehta began his career as a power and natural gas options trader, first at Bank of America Merrill Lynch from 2006 to 2009 and later from 2009 to 2010 at Hess Energy Trading Company (now Hartree, a part of Oaktree Investments). Mr. Mehta received his bachelor's degree in Mathematics and Economics from New York University and his MBA from Yale University.
Chief Financial Officer, Richard C. Butt, is an integral part of GCM’s management team, with extensive experience in the investment management industry. Over the course of his 35+ year career, Mr. Butt has held a variety of senior management positions for global investment and financial institutions. Most recently, from July 2012 to August 2013, he served as President and Chief Executive Officer of P3 Global Management LLC, a firm focused on investing in municipal infrastructure assets. From August 2006 to January 2011, he served as President of Macquarie Capital Investment Management LLC, with offices in New York and Sydney, Australia, responsible for administration, operations, finance, compliance, treasury, marketing, business operations and FX/cash management for portfolios domiciled in North America, Australia, Asia, Europe and the Caribbean. In addition, Mr. Butt served as Chief Financial and Accounting Officer for Macquarie Global Infrastructure Fund, a New York Stock Exchange-listed closed-end fund (NYSE: MGU). Prior to joining Macquarie, Mr. Butt served as President of Refco Alternative Investments LLC and Refco Fund Holdings LLC, the commodity pool businesses associated with Refco, Inc., from January 2003 to August 2006. In this capacity, Mr. Butt was responsible for the initial development and ongoing operations of numerous public and private commodity pools. During the period from 1990 through 2003, he served in various operational and financial capacities with multiple mutual/hedge fund third-party administration firms. Earlier in his career, he served as Vice President at Fidelity Investments, where he was responsible for fund accounting and financial reporting for all equity and global mutual funds. Mr. Butt is a Certified Public Accountant (inactive), previously working at major accounting firms such as PricewaterhouseCoopers LLP, from July 1978 to July 1984, where he was an Audit Manager, and KPMG from December 1994 to October 1996, where he was a Director in its financial services consulting practice. Mr. Butt holds a bachelor’s degree in Management Science from Duke University.
Executive Vice President, Spencer Mash, who is responsible for analyzing all potential asset acquisitions, has extensive experience in structuring, modeling, performing diligence for, and executing transactions such as mergers and acquisitions, investments in private debt securities and bankruptcy restructurings. Prior to joining GCM, from 2010 to 2011 Mr. Mash was employed by boutique investment bank TM Capital Corp., where he focused on sell-side mergers and acquisitions assignments and bankruptcy restructurings. From 2008 to 2009, Mr. Mash was an investment analyst at Gandhara Capital LTD, a long/short hedge fund investing in global large-cap public equity. From 2005 to 2008, Mr. Mash was employed by Deerfield Capital Management in its Leveraged Finance Group. Mr. Mash’s duties included performing in-depth due diligence and financial analyses, negotiating loan documentation and monitoring over 20 investments in private middle market first lien, second lien, mezzanine and one-stop senior secured debt. From 2003 to 2005, Mr. Mash was an analyst at Bank of America Merrill Lynch, where he analyzed, structured and marketed financial sponsor-related and mergers and acquisitions-related leveraged loan and high-yield securities.
Investment Committee of Our Advisor
Our Advisor utilizes an internal investment committee to oversee the implementation of our investment strategy and to govern multiple aspects of our portfolio. The Investment Committee, among other things:
•oversees the composition of our portfolio, the nature and timing of the changes to our portfolio and the manner of implementing such changes;
•supervises the identification, evaluation and negotiation of the structure of the investments we make (including performing due diligence on our prospective projects); and
•approves the terms of each investment and monitors the investments we make.
The Investment Committee is composed of Charles Wheeler, who also serves as President and Chief Executive Officer of the Company and is a member of our Board of Directors; David Sher, who serves as Chief Executive Officer of our Advisor and is a member of our Board of Directors; and Robert Brennan, who is a Director of the Company, and also serves as Co-Chairman of Greenbacker Group LLC. All investments are required to be unanimously approved by the GCM Investment Committee prior to consideration and approval by the Company.
Overview of Significant Government Incentives
The renewable energy and energy efficiency sector attracts significant U.S. federal, state and local government support and incentives to address technical barriers to the deployment of renewable energy and energy efficiency technologies and to promote the use of renewable energy and energy-saving strategies. These U.S. federal, state and local government incentives have historically functioned to increase (1) the revenue generated by, and (2) the equity returns available from, renewable energy projects. Energy efficiency projects are also eligible to receive government incentives at the U.S. federal, state and local levels that can be applied to offset project development costs. Governments in other jurisdictions also provide several types of incentives.
Corporate entities are eligible to receive benefits through tax credits, such as PTCs, ITCs, tax deductions, accelerated depreciation and U.S. federal grants and loan guarantees (from the U.S. Department of Energy, for instance), as described below.
The following is a description of certain U.S. federal and state government incentives, which we may utilize in executing our business strategy.
U.S. Federal Incentives
The impacts of the Tax Cuts and Jobs Act of 2017 (the “TCJA”) that were effective for tax years beginning January 1, 2018 include updates concerning depreciation that have been assessed by our Advisor’s management team and are highlighted in the sections below.
Corporate Depreciation: Modified Accelerated Cost Recovery System (“MACRS”)
Under MACRS, owners of renewable energy and some energy efficiency projects can recover capital invested through accelerated depreciation, which reduces the payment of corporate tax. Bonus depreciation under Section 168(k) of the Internal Revenue Code of 1986, as amended (the “Internal Revenue Code”) is extended and modified. Businesses can now immediately
deduct 100% of the cost of eligible property in the year it is placed in service, through 2022. Also, the TCJA eliminated the rule that made bonus depreciation available only for new property. The changes in the TCJA provide more flexibility than the current bonus depreciation rules in that they permit a taxpayer to depreciate an asset that is not new; however, the asset must be acquired from a third party in an arm’s-length sale.
Production Tax Credits ("PTCs")
PTCs are provided to owners of certain renewable energy projects that produce electricity for sale to unrelated persons. This credit is applicable for a 10-year period from the time a project is placed into service and benefits owners with tax liabilities against which to claim the tax credit. Under current law, for wind projects that began construction prior to January 1, 2021, there is a 1.5 cent per kilowatt hour PTC.
Investment Tax Credits ("ITCs")
ITCs provide that eligible systems, such as solar systems and fuel cell systems, receive a credit of 26% of the eligible cost-basis with no maximum limit. This credit is currently structured as a tax credit, whereby the owners of a qualifying renewable energy or energy efficient project can elect to receive the tax credit once the project is placed into service. The ITC for solar energy will decrease to 22% in the case of any property the construction of which begins after December 31, 2022 and before January 1, 2024, and will remain at 10% permanently for construction beginning on or after January 1, 2024.
State Incentives
Renewable Portfolio Standards ("RPS")
RPS, while varying based on jurisdiction, specify that a portion of the power utilized by local utilities must be derived from renewable energy sources. Currently, according to the Annual Energy Outlook 2021 from the U.S. Energy Information Administration (“EIA”), renewable electricity generating technologies account for almost 60% of the approximately 1,000 GW of cumulative capacity additions projected from 2020 to 2050 as part of the report. Under the RPS programs, utilities can (1) build or own renewable energy generation facilities; (2) purchase energy or RECs generated from renewable energy generation facilities; or (3) pay a penalty for any shortfalls in meeting the RPS.
Renewable Energy Certificates ("RECs")
RECs (or EECs) are used in conjunction with compliance with an RPS program or as tradable certificates that represent a certain number of kilowatt hours of energy that have been generated by a renewable source or that have been saved by an energy efficiency project, which provide further support to renewable energy initiatives. RECs are produced in conjunction with the generation of renewable energy and can be used for state RPS compliance, traded or sold to load-serving entities or to third parties, brokers and other market makers for investment purposes. Many states have specific compliance carve-outs for different types of renewable generation.
Feed-In Tariffs ("FITs")
Certain U.S. states and Canadian provinces have implemented FITs that entitle the renewable energy producer to enter into long-term contracts pursuant to which payment is based on the cost of generation for the diverse types of renewable energy projects. In addition to differences based on the type of project, FITs vary based on the locations of projects (such as rooftops or ground-mounted for solar PV projects), their sizes, and their geographic regions. FITs are available to anyone, including homeowners, business owners and farmers, as well as private investors. The tariffs are typically designed to ratchet downward over time to both track and encourage technological change.
Tax Reform
The TCJA was enacted on December 22, 2017. The major provisions under the TCJA and their impacts are discussed below.
Corporate Tax Rate
The TCJA reduced the corporate tax rate to 21%, effective December 22, 2017. A company must remeasure its deferred tax assets and liabilities to reflect the effects of the enacted changes in tax laws or rates at the date of enactment (i.e., the date the President signed the law), even though the changes may not be effective until future periods.
Repatriation of Existing Earnings and Profits
Under the TCJA, a company’s foreign earnings and profits ("E&P") accumulated in controlled foreign corporations ("CFCs") under legacy tax laws are deemed repatriated for the last taxable year of a CFC that began before January 1, 2018. E&P are determined as the higher of the balance as of November 2, 2017 or December 31, 2017. The tax on those deemed repatriated earnings is no longer indefinitely deferred, but may be paid over eight years, with no interest charged:
— 8% in each of Years 1 to 5;
— 15% in Year 6;
— 20% in Year 7; and
— 25% in Year 8.
The Company has one Canadian CFC. This CFC has negative E&P at the end of December 31, 2021. As such, no mandatory repatriation is required.
Cost Recovery
Under the TCJA, a company can expense 100% of investments in depreciable property other than real property or certain utility property and certain businesses with floor plan indebtedness. The new rules apply to original or used property. The new rules apply to investments after September 27, 2017 and before January 1, 2023, and will phase out beginning January 1, 2023 through December 31, 2026.
The Company opted out of the 100% deduction on its eligible assets acquired in 2019, 2020 and 2021.
Interest Expense Limitation
Under the TCJA, effective January 1, 2018, a company can only deduct interest expense up to the amount of business interest income plus 30% of “adjusted taxable income.” For taxable years beginning after December 31, 2017 and before January 1, 2022, the definition of adjusted taxable income is computed without regard to the deduction for depreciation, amortization, or depletion. Beginning in 2022, depreciation, amortization and depletion must be considered when calculating adjusted taxable income. The disallowed interest expense can be carried forward indefinitely.
Net Operating Losses ("NOL")
Under the TCJA, NOL generated after December 31, 2017 can only offset up to 80% of taxable income. Unused NOL can be carried forward indefinitely. NOL generated before January 1, 2018 remain subject to the old rules (i.e., 100% utilization and 20-year expiration). When scheduling out NOL utilization for the valuation reserve analysis, the Company applied the currently in force NOL limitation rules.
The Company expects to generate adequate future net income within the 20-year carryforward period to utilize all pre-2017 federal NOLs and all post-2018 federal NOLs with an indefinite carryforward period, as well as use all current state NOL carryforwards except for Montana and Vermont.
Environmental Regulation
Various U.S. federal, state and local permits are required to construct renewable energy and energy efficiency projects. The projects in which we invest must conform to all applicable environmental regulations and codes, including those relating to the discharge of materials into the air, water and ground, which will vary from place to place and time to time, as well as be based on the type of renewable energy asset involved in the project.
We seek to purchase, finance or otherwise invest in projects that are at least “shovel ready,” meaning that all, or substantially all, planning, engineering and permitting, including all major permits and approvals from local and state regulatory agencies, are in place and construction can begin immediately or upon receipt of certain final permits that must be obtained immediately prior to construction. However, the projects in which we invest may incur significant costs in the ordinary course of business related to operations, maintenance and continued compliance with laws, regulations and permit requirements.
Failure to comply with these laws, regulations and permit requirements may result in administrative, civil and criminal penalties, imposition of investigatory, clean-up and site restoration costs and liens, denial or revocation of permits or other
authorizations and issuance of injunctions to limit or cease operations. In addition, claims for damages to persons or property have been brought and may in the future result from environmental and other impacts of the activities of our projects.
Competition
Although we believe there is currently a capital shortage in the renewable energy sector, we will still compete for projects with other energy corporations, including investment funds (such as private equity funds and mezzanine funds) and traditional financial services companies (such as commercial banks and other sources of funding), as well as utilities and other producers of electricity. Moreover, alternative investment vehicles also make investments in renewable energy projects. Our competitors may be substantially larger and have considerably greater financial, technical and marketing resources than we do.
Staffing
We do not have any employees. Our day-to-day investment operations are managed by GCM. In addition, pursuant to an administration agreement with Greenbacker Administration, it provides us with administrative services including accounting, compliance, construction management and asset management services for all our investments. As of the date hereof, Greenbacker Administration has delegated certain of its accounting-related administrative functions to U.S. Bank Global Fund Services. Greenbacker Administration may enter into similar arrangements with other third-party administrators as necessary in the future. While Greenbacker Administration performs the majority of construction management, asset management, accounting and oversight services for the Company’s investments, it is anticipated that Greenbacker Administration will continue to delegate certain administrative functions to third parties for the LLC and GREC to recognize certain operational efficiencies for the benefit of the Company.
Advisory Agreement
Advisory Services
GCM, a private firm that is registered as an investment adviser under the Advisers Act, serves as our Advisor. Under the direction of our Board of Directors, GCM manages our day-to-day operations and provides us advisory and management services. Under the terms of our advisory agreement, GCM will, among other things:
•oversee the composition of our portfolio, the nature and timing of the changes to our portfolio, and the manner of implementing such changes;
•supervise the identification, evaluation and negotiation of the structure of the investments we make (including performing due diligence on our prospective projects); and
•approve the terms of each investment and monitor the investments we make.
Our Advisor and its officers and employees currently spend a significant portion of their time and resources on us. Pursuant to our advisory agreement, officers and personnel of the Advisor who provide services to us must comply with our code of business conduct and ethics, including the conflict of interest policy included in the code of business conduct and ethics. However, GCM’s services under the advisory agreement are not exclusive, and it, and its members and affiliates, are free to furnish similar services to other entities so long as its services to us are not impaired. The Advisor and its affiliates may face conflicts in the allocation of investment opportunities to us and others. In order to address these conflicts, the Company has instituted an investment allocation policy that addresses the allocation of investment opportunities.
The advisory agreement was initially approved by our Board of Directors and became effective on April 25, 2014. Unless earlier terminated, the advisory agreement will remain in effect for successive one-year periods if approved annually by a majority of our independent directors. The advisory agreement was amended and restated, and approved by the Board of Directors in May 2021 with an effective date of July 1, 2021 through April 30, 2022.
We may terminate the advisory agreement, without penalty, upon 60 days’ written notice. The decision to terminate the agreement may be made by a majority of our independent directors. In addition, GCM may terminate the advisory agreement with us upon 120 days’ written notice. If the advisory agreement is terminated or not renewed, we will pay our Advisor accrued and unpaid fees and expense reimbursements, including any payment of subordinated fees, earned prior to termination or non renewal of the advisory agreement. Furthermore, if the advisory agreement is terminated or not renewed, GCM will have no further obligation to incur offering expenses on behalf of the Company and we will not have any further obligation to reimburse GCM for operating or offering expenses not reimbursed as of the date of the termination.
Pursuant to the advisory agreement, GCM is authorized to retain one or more sub-advisors with expertise in our target assets to assist GCM in fulfilling its responsibilities under the advisory agreement. However, GCM will be required to monitor any sub-advisor to ensure that material information discussed by management of any sub-advisor is communicated to our Board of Directors, as appropriate. If GCM retains any sub-advisor, our Advisor will pay such sub-advisor a portion of the fees that it receives from us. We will not pay any additional fees to a sub-advisor. While our Advisor will oversee the performance of any sub-advisor, our Advisor will remain primarily liable to us to perform all of its duties under the advisory agreement, including those delegated to any sub-advisor. As of December 31, 2021, no sub-advisors have been retained by GCM to assist it in performing its responsibilities under the advisory agreement.
Management Fee and Performance Participation Fee
Pursuant to the advisory agreement, we pay GCM a base management fee for advisory and management services. The base management fee was calculated at a monthly rate of 0.167% (2.00% annually) of our gross assets (as defined under the advisory agreement) up to $800,000,000 (including certain amounts borrowed). The base management fee monthly rate was 0.14583% (1.75% annually) for gross assets between $800,000,001 and $1,500,000,000; and 0.125% (1.50% annually) for gross assets greater than $1,500,000,000. The base management fee shall be payable periodically in arrears, provided that the base management fee shall be payable at least monthly, but not more frequently than weekly. In May 2019, GCM agreed to cap the amount of corporate leverage included in the calculation of gross assets at no more than $50,000,000. GCM also agreed to permanently waive any fees currently earned in excess of this leverage cap. Through June 30, 2021, the base management fee was calculated based on the average of the values of our gross assets for each day in the calculation period. Base management fees for any partial period are appropriately pro-rated.
On July 1, 2021, the Company entered into the Fourth Amended and Restated Advisory Agreement with the Advisor. Effective July 1, 2021, the base management fee payable to GCM is calculated at a monthly rate of 0.167% (2.00% annually) of the net assets until the net asset value exceeds $800,000,000. The base management fee monthly rate will decrease to 0.14583% (1.75% annually) for net assets between $800,000,001 to $1,500,000,000 and to 0.125% (1.50% annually) for net assets greater than $1,500,000,000.
In addition, the Special Unitholder, an entity affiliated with our Advisor, will hold the special unit in our Company entitling it to a performance participation fee as well as a liquidation performance participation fee payable upon a listing or a liquidation. The fees paid to the Special Unitholder as outlined in the LLC's Fourth Amended and Restated Limited Liability Company Operating Agreement (the "Operating Agreement"), which were effective for periods subsequent to March 31, 2020, are as follows:
(a) When special units are outstanding, the Special Unitholder will be entitled to receive a payment of a performance participation fee ("Performance Participation Fee") with respect to the most recently completed fiscal quarter, calculated and payable quarterly in arrears, as follows:
(i) First, if the Company's total return for such period (as determined in accordance with the Operating Agreement) exceeds the sum of (x) the hurdle amount for such period (as set forth in the Operating Agreement) and (y) the loss carryforward amount for such period (as set forth in the Operating Agreement) (any such excess, “Excess Profits”), 100% of distributable cash until the total amount paid to the Special Unitholder pursuant to this clause equals 12.5% of the sum of (x) the hurdle amount for such period and (y) any amount payable to the Special Unitholder pursuant to this clause (this is commonly referred to as a “Catch-Up Amount”). For the avoidance of doubt, notwithstanding the total amount of the Catch-Up Amount calculated and payable for each period, the portion of the Catch-Up Amount paid in cash for such period shall not exceed the amount of Excess Profits for such period.
(ii) Second, to the extent there are remaining Excess Profits, 100% of such remaining Excess Profits until the total amount paid to the Special Unitholder pursuant to this clause equals the amount of the fee carryforward amount for such period (as set forth in the Operating Agreement); and
(iii) Third, to the extent there are any remaining Excess Profits, 12.5% of such remaining Excess Profits.
For the avoidance of doubt, the aggregate amount paid to the Special Unitholder pursuant to clauses (i) and (ii) above for any quarterly period shall not be in excess of the amount of Excess Profits, if any, for such period. For purposes of calculating the foregoing, all quarterly valuations will be determined by the Company in accordance with the Company’s valuation procedures. The Special Unitholder shall not be obligated to return any portion of the performance participation fee previously paid due to the subsequent performance of the Company.
(b) A Liquidation Performance Participation Fee (“Liquidation Performance Participation Fee”), payable upon a national securities exchange listing or the liquidation of the Company, calculated as follows: 20.0% of the net proceeds from the liquidation of the Company remaining after investors have received distributions of net proceeds from the liquidation of the Company equal to Adjusted Capital, defined as the Company's net asset value immediately prior to the time of a liquidation or a listing, as calculated immediately prior to liquidation. In the event of a listing, the Liquidation Performance Participation Fee will equal 20.0% of the listing premium, if any. Any listing premium, and related Liquidation Performance Participation Fee, will be determined and payable in arrears 30 days after the commencement of trading of shares following such listing.
The liquidation incentive distribution is payable in cash or shares, or in any combination thereof.
Upon the occurrence of (1) non-renewal of the advisory agreement upon the expiration of its then current term; (2) termination of the advisory agreement for any reason under circumstances where an affiliate of Greenbacker Group LLC does not serve as the Advisor under any replacement advisory agreement; or (3) resignation of GCM under the advisory agreement, which we refer to as a “trigger event,” we will have the right, but not the obligation, to repurchase the special unit, at the fair market value of the special unit on the date of termination, as determined by an independent appraiser. In such event, the purchase price will be paid in cash or shares of limited liability company interests, at the option of the Special Unitholder. We must purchase any such interests within 120 days after giving the Special Unitholder written notice of our desire to repurchase the special unit. If the advisory agreement is terminated or not renewed, we will pay our Advisor accrued and unpaid fees and expense reimbursements, including any payment of subordinated fees, earned prior to termination or non-renewal of the advisory agreement.
The following are calculation examples of the Performance Participation Fee:
| | | | | | | | | | | |
| Example #1 — Performance Participation Fee with Loss Carryforward | | |
| | | |
| FIRST QUARTER | Rate | Amount |
| | | |
| Assumptions | | |
| A | Total Capital Invested at End of Quarter | | $ 650,000,000 |
| B | Hurdle Amount | | $ 9,750,000 |
| C | Loss Carryforward (a) (Prior Quarters) | | $ 250,000 |
| D | Fee Carryforward Amount (b) (Prior Quarters) | | $ - |
| E | Net Proceeds from New Share Issuance | | $ 35,000,000 |
| F | Distributions Paid during the Quarter | | $ 10,725,000 |
| G | Actual Change in NAV | | $ 1,225,000 |
| H | Total Return for the Quarter (Distributions Plus Change in NAV) (F+G) | | $ 11,950,000 |
| I | Excess Proceeds (H-(B+C)) | | $ 1,950,000 |
| | | |
| Performance Participation Fee Calculation | | |
| | | |
| Total Return for the Quarter | | $ 11,950,000 |
| Loss Carryforward Amount (if Any) | | $ 250,000 |
| Net Return for the Quarter | | $ 11,700,000 |
| | | |
| Performance Participation Fee for Current Quarter | 12.50% | $ 1,462,500 |
| Fee Carryforward Amount | | $ - |
| Total Performance Participation Fee to Be Paid (c) | | $ 1,462,500 |
| | | |
| | | |
| (a) | Net negative return from all prior quarters | | |
| | | | | | | | | | | |
| (b) | Performance Participation Fee amounts due from prior quarters but not paid to ensure investors receive a 6% annual IRR |
| (c) | If the maximum payable in any quarter equals Excess Profits, any excess would be carried over to the next quarter |
| | | |
| Example #2 — Performance Participation Fee with Fee Carryforward | | |
| | | |
| | | |
| SECOND QUARTER | Rate | Amount |
| | | |
| Assumptions | | |
| A | Total Capital Invested at end of Quarter | | $ 672,688,146 |
| B | Hurdle Amount | | $ 10,090,322 |
| C | Loss Carryforward (a) (Prior Quarters) | | $ - |
| D | Fee Carryforward Amount (b) (Prior Quarters) | | $ - |
| E | Net Proceeds from New Share Issuance | | $ 35,000,000 |
| F | Distributions Paid during the Quarter | | $ 11,099,354 |
| G | Actual change in NAV | | $ 250,000 |
| H | Total Return for the Quarter (distributions plus change in NAV) (F+G) | | $ 11,349,354 |
| I | Excess proceeds (H-(B+C)) | | $ 1,259,032 |
| | | |
| Performance Participation Fee Calculation | | |
| | | |
| Total Return for the Quarter | | $ 11,349,354 |
| Loss Carryforward amount (if Any) | | $ - |
| Net Return for the Quarter | | $ 11,349,354 |
| | | |
| Performance Participation Fee for Current Quarter | 12.50% | $ 1,418,669 |
| Fee Carryforward Amount | | $ (159,637) |
| Total Performance Participation Fee to be Paid (c) | | $ 1,259,032 |
| | | |
| | | |
| (a) | Net negative return from all prior quarters | | |
| (b) | Performance Participation Fee amounts due from prior quarters but not paid to ensure investors receive a 6% annual IRR |
| (c) | If the maximum payable in any quarter equals Excess Profits, any excess would be carried over to the next quarter |
| | | |
| Example #3 — Performance Participation Fee with Fee Carryforward Utilized | | |
| | | |
| | | |
| THIRD QUARTER | Rate | Amount |
| | | |
| Assumptions | | |
| A | Total Capital Invested at End of Quarter | | $ 696,782,208 |
| B | Hurdle Amount | | $ 10,451,733 |
| C | Loss Carryforward (a) (Prior Quarters) | | $ - |
| D | Fee Carryforward Amount (b) (Prior Quarters) | | $ 159,637 |
| E | Net Proceeds from New Share Issuance | | $ 35,000,000 |
| | | | | | | | | | | |
| F | Distributions Paid during the Quarter | | $ 11,496,906 |
| G | Actual Change in NAV | | $ 1,850,000 |
| H | Total Return for the Quarter (Distributions Plus Change in NAV) (F+G) | | $ 13,346,906 |
| I | Excess Proceeds (H-(B+C)) | | $ 2,895,173 |
| | | |
| Performance Participation Fee Calculation | | |
| | | |
| Total Return for the Quarter | | $ 13,346,906 |
| Loss Carryforward amount (if Any) | | $ - |
| Net Return for the Quarter | | $ 13,346,906 |
| | | |
| Performance Participation Fee for Current Quarter | 12.50% | $ 1,668,363 |
| Fee Carryforward Amount | | $ 159,637 |
| Total Performance Participation Fee to Be Paid (c) | | $ 1,828,000 |
| | | |
| | | |
| (a) | Net negative return from all prior quarters | | |
| (b) | Performance Participation Fee amounts due from prior quarters but not paid to ensure investors receive a 6% annual IRR |
| (c) | If the maximum payable in any quarter equals Excess Profits, any excess would be carried over to the next quarter |
| | | |
The returns shown are for illustrative purposes only. There is no guarantee that positive returns will be realized, and actual returns may vary from those shown in the examples above.
Pursuant to the LLC's Third Amended and Restated Limited Liability Company Agreement ("3rd LLC Agreement"), which was effective through the quarter ending March 31, 2020, the incentive allocation and distribution, or incentive distribution, was composed of three parts, as follows: The first part, the income incentive distribution, is calculated and payable quarterly in arrears based on our pre-incentive distribution net investment income for the immediately preceding fiscal quarter. For this purpose, pre-incentive distribution net investment income means (1) interest income; (2) dividend income from equity investments (but excluding that portion of distributions that are treated as a return of capital); and (3) any other income (including any other fees, such as commitment, origination, structuring, diligence and consulting fees, or other fees that we receive, but excluding any fees for providing managerial assistance) accrued during the fiscal quarter, minus our operating expenses for the fiscal quarter (including the base management fee, expenses payable under the administration agreement with our Administrator, and any interest expense and distributions paid on any issued and outstanding indebtedness and preferred units of limited liability company interest, but excluding the incentive distribution). Pre-incentive distribution net investment income includes, in the case of investments with a deferred interest feature (such as original issue discount, debt instruments with pay-in-kind interest and zero-coupon securities), accrued income that we have not yet received in cash. If interest income is accrued but never paid, our Board of Directors would decide to write off the accrual in the fiscal quarter when the accrual is determined to be uncollectible in accordance with U.S. generally accepted accounting principles. The write-off would cause a decrease in interest income for the fiscal quarter equal to the amount of the prior accrual. Pre-incentive distribution net investment income does not include any realized capital gains, realized capital losses, unrealized capital appreciation or depreciation or any accrued income taxes and other taxes including, but not limited to, franchise, property and sales taxes. Pre-incentive distribution net investment income, expressed as a rate of return on the value of our average adjusted capital at the end of the fiscal quarter, will be compared to a “hurdle rate” of 1.75% per fiscal quarter (7.00% annualized). Our net investment income used to calculate this part of the incentive distribution is also included in the amount of our gross assets used to calculate the 2.00% annualized base management fee.
Under the 3rd LLC Agreement, which was effective through the quarter ending March 31, 2020, the Special Unitholder was entitled to receive an incentive distribution with respect to our pre-incentive distribution net investment income in each fiscal quarter, as follows:
•no incentive distribution in any fiscal quarter in which our pre-incentive distribution net investment income did not exceed the “hurdle rate” of 1.75%;
•100% of our pre-incentive distribution net investment income with respect to that portion of such pre-incentive distribution net investment income, if any, that exceeded the hurdle but was less than 2.1875% in any fiscal quarter (8.75% annualized with a 7% annualized hurdle rate). We refer to this portion of our pre-incentive distribution net investment income (which exceeds the hurdle but is less than 2.1875%) as the “catch-up.” The “catch-up” was meant to provide the Special Unitholder with 20% of our pre-incentive distribution net investment income as if a hurdle did not apply if this net investment income exceeded 2.1875% in any fiscal quarter; and
•20% of the amount of our pre-incentive distribution net investment income, if any, that exceeded 2.1875% in any fiscal quarter (8.75% annualized with a 7% annualized hurdle rate) was distributed to the Special Unitholder (once the hurdle was reached and the catch-up was achieved, 20% of all pre-incentive distribution investment income thereafter was allocated to the Special Unitholder).
The second part of the incentive distribution under the 3rd LLC Agreement, the capital gains incentive distribution, was determined and payable in arrears as of the end of each fiscal quarter (or upon termination of the advisory agreement, as of the termination date) and was equal to 20.0% of our realized capital gains, if any, on a cumulative basis from inception through the end of each fiscal quarter, computed net of all realized capital losses and unrealized capital depreciation on a cumulative basis, less the aggregate amount of any previously paid capital gains incentive distributions. For purposes of calculating the foregoing: (1) the calculation of the incentive distribution included any capital gains that resulted from cash distributions that were treated as a return of capital; (2) any such return of capital was treated as a decrease in our cost basis of an investment; and (3) all quarterly valuations were determined by us in accordance with our valuation procedures. In determining the capital gains incentive distribution to which the Special Unitholder was entitled, we calculated the aggregate realized capital gains, aggregate realized capital losses and aggregate unrealized capital depreciation, as applicable, with respect to each of our assets. For this purpose, aggregate realized capital gains, if any, were equal to the sum of the differences between the net sales price of each investment, when sold or otherwise disposed, and the aggregate cost basis of such investment reduced by cash distributions that are treated as returns of capital. Aggregate realized capital losses were equal to the sum of the amounts by which the net sales price of each investment, when sold or otherwise disposed, is less than the aggregate cost basis of such investment reduced by cash distributions that are treated as returns of capital. Aggregate unrealized capital depreciation equaled the sum of the difference, if negative, between the valuation of each investment as of the applicable date and the aggregate cost basis of such investment reduced by cash distributions that are treated as returns of capital. At the end of the applicable period, the amount of capital gains that serves as the basis for our calculation of the capital gains incentive distribution equaled the aggregate realized capital gains, excluding any accrued income taxes and other taxes including, but not limited to, franchise, property, and sales taxes associated with the sale or disposal of the asset, less aggregate realized capital losses and less aggregate unrealized capital depreciation with respect to our assets. If this number is positive at the end of such period, then the capital gains incentive distribution for such period would equal 20% of such amount, less the aggregate amount of any capital gains incentive distributions paid in all prior periods.
GCM may elect to defer or waive all or a portion of the fees that would otherwise be paid to it in its sole discretion. Any portion of a deferred fee not taken as to any period will be deferred without interest and may be taken in any other period prior to the occurrence of a liquidity event as GCM may determine in its sole discretion.
Payment of Our Expenses
Our primary operating expenses are the payment of advisory fees and other expenses under the advisory agreement, and other expenses necessary for our operations. Our advisory fee compensates GCM for its work in identifying, evaluating, negotiating, executing and monitoring our investments. We also pay fees and expenses on a direct cost basis to Greenbacker Administration or others engaged by Greenbacker Administration for the administrative services they provide directly or indirectly under the administration agreement.
We will bear all other expenses of our operations and transactions, including (without limitation) fees and expenses relating to:
•corporate and organizational expenses relating to offerings of our shares, subject to limitations included in the advisory agreement;
•the cost of effectuating sales and repurchase of units;
•the cost of calculating our net asset value, including the related fees and cost of retaining third-party valuation services;
•investment advisory fees;
•fees payable to third parties relating to, or associated with, our financial and legal affairs, making investments, and valuing investments, including fees and expenses associated with performing due diligence reviews of prospective investments and sub-advisors;
•certain transfer agent and custodial fees and expenses;
•Federal, state and local taxes and registration fees;
•costs of board meetings, unitholders’ reports and notices, proxy statements and directors’ fees and expenses;
•fidelity bond insurance, directors and officers/errors and omissions liability insurance and other insurance premiums;
•direct costs, including those relating to the printing of unitholder reports and advertising or sales materials, mailing, telephone and staff;
•fees and expenses associated with independent audits and outside legal costs, including compliance with the Sarbanes-Oxley Act of 2002 and applicable federal and state securities laws;
•costs associated with our reporting and compliance obligations under applicable federal and state securities laws;
•brokerage commissions, origination fees and any investment banking fees related to our investments;
•all other expenses incurred by GCM in performing its obligations subject to the limitations included in the advisory agreement; and
•all other expenses incurred by either the Administrator, its delegates or us in connection with administering our business, including payments for the administrative services the Administrator provides under the administration agreement that will be based upon our allocable portion (subject to the review and approval of our Board of Directors) of the Administrator’s overhead and other expenses.
Organization and Offering Expenses
We reimbursed our Advisor and its affiliates for organization and offering expenses it incurred on our behalf under the terminated public offering of shares, but only to the extent that the reimbursement would not cause the selling commissions, including trail fees, the dealer manager fee and the other organization and offering expenses borne by us to exceed 15.0% of gross offering proceeds as of the date of the reimbursement. Commencing in the fourth quarter of 2020, certain offering costs incurred by our Advisor under the private offering of Class P-A, P-S, P-T and P-D shares will be reimbursed up to an amount no greater than 0.50% (50 basis points) of the total offering proceeds of these share classes. The organization and offering expenses included all expenses reimbursed under both the public and private offering of shares, including all expenses (other than selling commissions and the dealer manager fee) paid by us relating to the offering, including but not limited to:
•our legal, accounting, printing, mailing and filing fees;
•reimbursement of bona fide due diligence expenses of broker-dealers;
•reimbursement of our Advisor for costs relating to preparing sales materials, the cost of bona fide training and education meetings held by us (primarily the travel, meal and lodging costs of registered representatives of broker-dealers), attendance and sponsorship fees and cost reimbursement for employees of our affiliates to attend retail seminars conducted by broker-dealers;
•reimbursement to our managing broker dealer, through our Advisor, for sales commissions earned and paid to registered representatives related to the offering of our shares as well as bona fide travel and entertainment expenses; and
•reimbursement to participating broker-dealers for technology costs associated with the offering, costs and expenses related to such technology costs, and costs and expenses associated with the facilitation of the marketing of shares and the ownership of shares by such broker-dealers’ customers, which will be included in underwriting compensation.
Organization and offering costs were calculated and borne by the Company with respect to each public offering pursuant to a separate Registration Statement. For the offering pursuant to the Registration Statement on Form S-1 (File No. 333-178786-01), which was declared effective on August 7, 2013 and was terminated on February 7, 2017, total organization and offering costs borne by the Company were approximately $7,556,000, or 4.8% of gross offering proceeds. For the offering pursuant to the Registration Statement on Form S-1 (File No. 333-211571), which commenced on February 8, 2017 and which primary offering terminated as of March 29, 2019, total organization and offering costs borne by the Company were approximately $2,266,000. As of December 31, 2021, total organization and offering costs incurred by the Company for the private offering of Class P-A, P-S, P-T and P-D shares pursuant to our private placement memorandum, which commenced in October 2020, were $607,610. As of December 31, 2020, total organization and offering costs incurred by the Company for the private offering of Class P-A, P-S, P-T and P-D shares pursuant to our private placement memorandum, which commenced in October 2020, were $1,751.
Other Operating Expenses
We will reimburse the expenses incurred by GCM, Greenbacker Administration or their affiliates relating to their provision of services to us, including the investigation and monitoring of our investments, oversight of third-party service providers including accounting and administration entities, accounting services for any of our investments and any costs incurred in connection with GCM’s valuation methodologies or the effectuating of sales and repurchases of our shares and other securities. We will not reimburse our Advisor, Greenbacker Administration or their affiliates for (i) rent or depreciation, utilities, capital equipment and other administrative items; (ii) salaries, fringe benefits and other comparable items incurred or allocated to any controlling person of GCM; (iii) the salaries and benefits paid to any executive officer or board member of GCM; or (iv) any services for which GCM receives a separate fee.
Indemnification
The advisory agreement provides that, absent willful misfeasance, bad faith or negligence in the performance of its duties or by reason of the reckless disregard of its duties and obligations, GCM and its officers, managers, partners, agents, employees, controlling persons, members and any other person or entity affiliated with it are entitled to indemnification from us for any damages, liabilities, costs and expenses (including reasonable attorneys’ fees and amounts reasonably paid in settlement) arising from the rendering of GCM’s services under the advisory agreement or otherwise as Advisor of the Company. Notwithstanding the above, our Operating Agreement provides that we shall not hold harmless our Advisor or any of its affiliates for any loss or liability suffered by us unless all of the following conditions are met:
•the party seeking exculpation or indemnification has determined in good faith that the course of action leading to the loss or liability was in our best interests;
•the party seeking exculpation or indemnification was acting on our behalf or providing services to us;
•the loss or liability was not the result of negligence or misconduct; and
•the indemnification is recoverable only out of net assets and not from our members.
Organization of GCM
GCM is a Delaware limited liability company. The principal executive offices of GCM are located at 30 Danforth Street, Suite 206, Portland, Maine 04101.
Valuation Process and Determination of Net Asset Value
Relevance of Our Net Asset Value
Our net asset value is calculated and published on a quarterly basis. For most of our current investments, market quotations are not available and are valued at fair value as determined in good faith by our Advisor and reviewed by an independent valuation firm, currently Alvarez & Marsal Valuation Services, LLC, subject to the review and approval of the Board of Directors.
Our net asset value will:
•be disclosed in our quarterly and annual consolidated financial statements;
•be an input in the computation of fees earned by our Advisor and the Special Unitholder whose fees and distributions are linked, directly or indirectly, in whole or in part to the value of our net assets;
•be an input in the computation of our Monthly Share Value, as discussed further in the "Net Asset Value and Monthly Share Value Determinations in Connection with Our Offerings" section below; and
•be evaluated alongside the net proceeds per share to us from the current offering to ensure that the net offering price per share is not above or below our Monthly Share Value per share, which is based upon net asset value.
Determination of Our Net Asset Value
We calculate our net asset value per share by subtracting all liabilities from the total carrying amount of our assets, which includes the fair value of our investments, and dividing the result by the total number of outstanding shares on the date of valuation. For the purposes of calculating net asset value, we expect to carry all liabilities at cost.
We have adopted Accounting Standards Codification Topic 820, Fair Value Measurement (“ASC Topic 820”), which defines fair value, establishes a framework for measuring fair value in accordance with generally accepted accounting principles, and expands disclosures about fair value measurements.
ASC Topic 820 defines fair value as “the price that would be received to sell an asset or paid to transfer a liability in an orderly transaction between market participants at the measurement date” other than a forced sale or liquidation. The transaction to sell the asset or transfer the liability is a hypothetical transaction at the measurement date, considered from the perspective of a market participant that holds the asset or owes the liability. ASC Topic 820 provides a consistent definition of fair value that focuses on exit price and prioritizes, within a measurement of fair value, the use of market-based inputs over entity-specific inputs. In addition, ASC Topic 820 provides a framework for measuring fair value and establishes a three-level hierarchy for fair value measurements based upon the transparency of inputs to the valuation of an asset or liability as of the measurement date. The three levels of valuation hierarchy established by ASC Topic 820 are defined as follows:
Level 1: Unadjusted quoted prices for identical assets or liabilities in active markets.
Level 2: Other significant observable inputs that are sourced either directly or indirectly from publications or pricing services, including dealer or broker markets, for identical or comparable assets or liabilities. Generally, these inputs should be widely accepted and public, non-proprietary and sourced from an independent third party.
Level 3: Inputs derived from a significant amount of unobservable market data and derived primarily through the use of internal valuation methodologies.
In all cases, the level in the fair value hierarchy within which the fair value measurement in its entirety falls will be determined based on the lowest level of input that is significant to the fair value measurement. Our assessment of the significance of a particular input to the fair value measurement in its entirety requires judgment and considers factors specific to each investment.
Our Board of Directors will have the ability to review our Advisor’s valuation methodologies each quarter regarding GCM’s presentation of its valuation recommendations to the Audit Committee. If during the period between quarterly Board of Directors’ meetings, GCM determines that significant changes have occurred since the prior meeting of the Board of Directors at which it presented its recommendations on the valuation methodology, then GCM will also prepare and present recommendations to the Audit Committee of the Board of Directors of its proposed changes to the current valuation methodology. Any such changes to our valuation methodologies will require the approval of our Board of Directors, including a majority of our independent directors. We will disclose any material change in our valuation methodologies or any material change in our investment criteria or strategies that would constitute a fundamental change in a registration statement amendment prior to its implementation.
Our Board of Directors has approved the selection of an independent valuation firm to review our Advisor’s valuation methodology and to work with our Advisor and officers to provide additional inputs for consideration by our Audit Committee and to work directly with our full Board of Directors, at the Board of Directors’ request, with respect to the fair value of investments. Generally, one quarter of our investments are reviewed by an independent valuation firm each quarter, on a rotating quarterly basis. Accordingly, each such investment would be evaluated by an independent valuation firm at least once per year.
The determination of the fair value of our investments requires judgment, especially with respect to investments for which market quotations are not available. For most of our investments, market quotations will not be available. Due to the inherent uncertainty of determining the fair value of investments that do not have a readily available market value, the fair value of the investments may differ significantly from the values that would have been used had a readily available market value existed for such investments, and the differences could be material. Because the calculation of our net asset value is based, in part, on the fair value of our investments as determined by our Advisor, who is affiliated with us, our calculation of net asset value is to a degree, subjective and could be adversely affected if the determinations regarding the fair value of our investments were materially higher than the values that we ultimately realize upon the disposal of such investments.
Net Asset Value and Monthly Share Value Determinations in Connection with Our Offerings
Since commencing operations on April 25, 2014, the Company has sold shares on a continuous basis at offering prices that were based upon NAV (through September 30, 2020) and a Monthly Share Value, effective October 1, 2020.
As described above, we determine our NAV for presentation in our financial statements. In addition, we have adopted a model, as explained below, that adjusts the value of our assets and liabilities from GAAP-based fair value to a Monthly Share Value (“Monthly Share Value”) for the purpose of establishing a purchase and repurchase price for our shares.
We calculate our Monthly Share Value per share in accordance with the valuation guidelines that have been approved by our Board of Directors. As a general rule we will continue to monitor the valuation of the Company’s entire investment portfolio on a daily basis and make adjustments to the offering price as necessary as soon as is practical thereafter to reflect any changes in market conditions that materially impact the value of our net assets. On the last business day of every month following the valuation date, the GCM Investment Committee will meet to consider the appropriateness of the Monthly Share Value. As part of that consideration, it will consider the current market values of our liquid and illiquid investment portfolios. The GCM Investment Committee will then set new offering prices based upon the Monthly Share Value, taking into account any movements in the valuation of our liquid portfolio and any material changes in the valuation of our illiquid portfolio due to changed market conditions. The new offering prices will be announced following that determination and take effect on the first business day of the following month.
Monthly Share Value is the basis for (1) determining the offering price for each class of our shares and the price per share that is paid to shareholder participants in our share repurchase program; and (2) the value of an investment in our shares, as shown on each shareholder’s periodic customer account statement. The Monthly Share Value for each class of shares is evaluated alongside the net proceeds per share to us from this offering to ensure that the net offering price per share was not above or below our Monthly Share Value per share. While we believe our Monthly Share Value calculation methodologies are consistent with standard industry practices, there is no rule or regulation that requires we calculate Monthly Share Value in a certain way. Monthly Share Value should not be considered equivalent to members’ equity or any other GAAP measure.
Our Monthly Share Value per share does not represent the amount of our assets less our liabilities in accordance with GAAP. We do not represent, warrant or guarantee that:
•a shareholder would be able to realize the Monthly Share Value per share for the class of shares a shareholder owns if the shareholder attempts to sell its shares;
•a shareholder would ultimately realize distributions per share equal to the Monthly Share Value per share for the class of shares it owns upon liquidation of our assets and settlement of our liabilities or upon a sale of our Company;
•shares of our limited liability company interests would trade at their Monthly Share Value per share on a national securities exchange;
•a third-party would offer the Monthly Share Value per share for each class of shares in an arm’s-length transaction to purchase all or substantially all of our shares; or
•the Monthly Share Value per share would equate to a market price of an open-ended renewable energy fund.
The following details the adjustments to reconcile members’ equity under GAAP to our Monthly Share Value:
•The accrued shareholder servicing fee represents the accrual for the full cost of the shareholder servicing fee for Class P-S and Class P-T shares. Under GAAP, we accrued the full cost of the shareholder servicing fee payable over the life of each share (assuming such share remains outstanding the length of time required to pay the maximum shareholder
servicing fee) as an offering cost at the time we sold the Class P-S and Class P-T shares. For purposes of our Monthly Share Value, we recognize the shareholder servicing fee as a reduction of Monthly Share Value on a monthly basis as such fee is paid.
•The Advisor will advance certain organizational and offering expenses on our behalf through December 31, 2022. Under GAAP, organization costs are expensed as incurred and offering costs are charged to equity as such amounts are incurred. For Monthly Share Value, such costs will be recognized as a reduction to Monthly Share Value as they are charged to equity ratably over 60 months.
The Company's shares had been offered at the following prices, based on the then current net asset value determination through the period ending September 2020. Commencing as of October 1, 2020, the offering prices were determined monthly, as opposed to quarterly, and were based upon the Monthly Share Value determination.
| | | | | | | | | | | | | | | | | | | | | | | | | | | | | | | | | | | | | | | | | | | | | | | | | | | | | | | | |
| Period | | Class |
| From | | To | | A | | C | | I | | P-A | | P-I | | P-S | | P-T | | P-D |
| 25-Apr-14 | | 4-Nov-15 | | $ | 10.00 | | | $ | 9.58 | | | $ | 9.19 | | | N/A | | N/A | | N/A | | N/A | | N/A |
| 5-Nov-15 | | 4-Feb-16 | | $ | 10.02 | | | $ | 9.60 | | | $ | 9.21 | | | N/A | | N/A | | N/A | | N/A | | N/A |
| 5-Feb-16 | | 5-May-16 | | $ | 10.05 | | | $ | 9.62 | | | $ | 9.23 | | | N/A | | N/A | | N/A | | N/A | | N/A |
| 6-May-16 | | 3-Aug-16 | | $ | 10.07 | | | $ | 9.64 | | | $ | 9.25 | | | $ | 9.59 | | | $ | 8.81 | | | N/A | | N/A | | N/A |
| 4-Aug-16 | | 6-Nov-16 | | $ | 10.23 | | | $ | 9.79 | | | $ | 9.39 | | | $ | 9.79 | | | $ | 8.95 | | | N/A | | N/A | | N/A |
| 7-Nov-16 | | 7-Feb-17 | | $ | 10.28 | | | $ | 9.58 | | | $ | 9.45 | | | $ | 9.78 | | | $ | 8.83 | | | N/A | | N/A | | N/A |
| 8-Feb-17 | | 4-May-17 | | $ | 10.22 | | | $ | 9.53 | | | $ | 9.39 | | | $ | 9.70 | | | $ | 8.76 | | | N/A | | N/A | | N/A |
| 5-May-17 | | 17-May-17 | | $ | 10.17 | | | $ | 9.48 | | | $ | 9.34 | | | $ | 9.70 | | | $ | 8.69 | | | N/A | | N/A | | N/A |
| 18-May-17 | | 3-Aug-17 | | $ | 9.74 | | | $ | 9.07 | | | $ | 8.94 | | | $ | 9.70 | | | $ | 8.69 | | | N/A | | N/A | | N/A |
| 4-Aug-17 | | 2-Nov-17 | | $ | 9.72 | | | $ | 9.08 | | | $ | 8.93 | | | N/A | | $ | 8.73 | | | N/A | | N/A | | N/A |
| 3-Nov-17 | | 5-Feb-18 | | $ | 9.74 | | | $ | 9.09 | | | $ | 8.94 | | | N/A | | $ | 8.75 | | | N/A | | N/A | | N/A |
| 6-Feb-18 | | 6-May-18 | | $ | 9.78 | | | $ | 9.09 | | | $ | 8.98 | | | $ | 9.65 | | * | $ | 8.81 | | | N/A | | N/A | | N/A |
| 7-May-18 | | 2-Aug-18 | | $ | 9.80 | | | $ | 9.12 | | | $ | 9.01 | | | $ | 9.68 | | | $ | 8.84 | | | N/A | | N/A | | N/A |
| 3-Aug-18 | | 31-Oct-18 | | $ | 9.83 | | | $ | 9.17 | | | $ | 9.03 | | | $ | 9.69 | | | $ | 8.90 | | | N/A | | N/A | | N/A |
| 1-Nov-18 | | 6-Feb-19 | | $ | 9.79 | | | $ | 9.15 | | | $ | 8.99 | | | $ | 9.68 | | | $ | 8.89 | | | N/A | | N/A | | N/A |
| 7-Feb-19 | | 6-May-19 | | $ | 9.63 | | | $ | 9.01 | | | $ | 8.84 | | | $ | 9.50 | | ** | $ | 8.76 | | | N/A | | N/A | | N/A |
| 7-May-19 | | 1-Aug-19 | | N/A | | N/A | | N/A | | N/A | | $ | 8.76 | | | N/A | | N/A | | N/A |
| 2-Aug-19 | | 8-Nov-19 | | N/A | | N/A | | N/A | | N/A | | $ | 8.77 | | | N/A | | N/A | | N/A |
| 9-Nov-19 | | 19-Mar-20 | | N/A | | N/A | | N/A | | N/A | | $ | 8.93 | | | N/A | | N/A | | N/A |
| 20-Mar-20 | | 18-May-20 | | N/A | | N/A | | N/A | | N/A | | $ | 8.90 | | | N/A | | N/A | | N/A |
| 19-May-20 | | 20-Aug-20 | | N/A | | N/A | | N/A | | N/A | | $ | 8.95 | | | N/A | | N/A | | N/A |
| 21-Aug-20 | | 1-Nov-20 | | N/A | | N/A | | N/A | | N/A | | $ | 9.02 | | | N/A | | N/A | | N/A |
| 2-Nov-20 | | 31-Jan-21 | | N/A | | N/A | | N/A | | $ | 9.42 | | ** | $ | 9.02 | | | $ | 9.57 | | | $ | 9.60 | | | $ | 9.30 | |
| 1-Feb-21 | | 26-Feb-21 | | N/A | | N/A | | N/A | | $ | 9.38 | | | $ | 8.96 | | | $ | 9.00 | | | $ | 9.53 | | | $ | 9.24 | |
| 1-Mar-21 | | 31-Mar-21 | | N/A | | N/A | | N/A | | $ | 9.44 | | | $ | 9.02 | | | $ | 9.00 | | | $ | 9.53 | | | $ | 9.24 | |
| 1-Apr-21 | | 30-Apr-21 | | N/A | | N/A | | N/A | | $ | 9.47 | | | $ | 9.02 | | | $ | 9.01 | | | $ | 9.53 | | | $ | 9.24 | |
| 3-May-21 | | 31-May-21 | | N/A | | N/A | | N/A | | $ | 9.39 | | | $ | 8.92 | | | $ | 8.99 | | | $ | 9.50 | | | $ | 9.20 | |
| 1-Jun-21 | | 30-Jun-21 | | N/A | | N/A | | N/A | | $ | 9.39 | | | $ | 8.92 | | | $ | 8.99 | | | $ | 9.50 | | | $ | 9.20 | |
| 1-Jul-21 | | 1-Aug-21 | | N/A | | N/A | | N/A | | $ | 9.39 | | | $ | 8.92 | | | $ | 8.99 | | | $ | 9.50 | | | $ | 9.20 | |
| 2-Aug-21 | | 31-Aug-21 | | N/A | | N/A | | N/A | | $ | 9.44 | | | $ | 8.91 | | | $ | 8.97 | | | $ | 9.54 | | | $ | 9.19 | |
| 1-Sep-21 | | 30-Sep-21 | | N/A | | N/A | | N/A | | $ | 9.44 | | | $ | 8.91 | | | $ | 8.97 | | | $ | 9.54 | | | $ | 9.19 | |
| 1-Oct-21 | | 31-Oct-21 | | N/A | | N/A | | N/A | | $ | 9.44 | | | $ | 8.91 | | | $ | 8.97 | | | $ | 9.54 | | | $ | 9.19 | |
| 1-Nov-21 | | 30-Nov-21 | | N/A | | N/A | | N/A | | $ | 9.33 | | | $ | 8.80 | | | $ | 8.85 | | | $ | 9.41 | | | $ | 9.09 | |
| 1-Dec-21 | | 31-Dec-21 | | N/A | | N/A | | N/A | | $ | 9.33 | | | $ | 8.80 | | | $ | 8.85 | | | $ | 9.41 | | | $ | 9.09 | |
| 3-Jan-22 | | 31-Jan-22 | | N/A | | N/A | | N/A | | $ | 9.33 | | | $ | 8.80 | | | $ | 8.85 | | | $ | 9.41 | | | $ | 9.09 | |
| 1-Feb-22 | | 28-Feb-22 | | N/A | | N/A | | N/A | | $ | 9.32 | | | $ | 8.80 | | | $ | 8.86 | | | $ | 9.40 | | | $ | 9.07 | |
| 1-Mar-22 | | — | | N/A | | N/A | | N/A | | $ | 9.32 | | | $ | 8.80 | | | $ | 8.86 | | | $ | 9.40 | | | $ | 9.07 | |
*Effective April 16, 2018
** Ceased February 8, 2019 and recommenced as of November 2, 2020
Our Advisor, in conjunction with an independent valuation firm, subject to the review and approval of the Board of Directors, determines our net asset value for each class of our shares at each quarter end. The determination of Monthly Share Value, which is approved by the Board of Directors, is based upon the most recently determined quarterly net asset value, with necessary consideration to subsequent events or circumstances that could have a material impact on net asset value. To the extent that our Monthly Share Value per share on the most recent valuation date increases above or decreases below our net proceeds per share as stated in this annual report, the Company will adjust the offering prices of all classes of shares. The adjustments to the per share offering prices will ensure that after the effective date of the new offering prices, the offering prices per share, after deduction of selling commissions, dealer manager fees and organization and offering expenses, are not above or below our Monthly Share Value per share as of such valuation date.
The purchase price per share to be paid by each investor will be equal to the price that is in effect on the date such investor submitted his or her completed subscription agreement to our transfer agent.
ITEM 1A. RISK FACTORS
Investing in the shares involves several significant risks. In addition to the other information contained herein, you should consider carefully the following information before making an investment decision regarding the shares. If any of the following events occur, our business, financial condition and results of operations could be materially and adversely affected. In such case, the value of the shares could decline, and you may lose part or all of your investment.
Risks Related to Our Business and Structure
Our ability to achieve our investment objectives depends on GCM’s ability to manage and support our investment process. If GCM were to lose certain key members of its senior management team, our ability to achieve our investment objectives could be significantly harmed.
We have no internal management capacity or employees other than our appointed executive officers, and are dependent on the diligence, skill and network of business contacts of GCM’s senior management team to achieve our investment objective. We also depend, to a significant extent, on GCM’s access to its investment professionals and the information and deal flow generated by these investment professionals. GCM’s senior management team will evaluate, negotiate, structure, close and monitor our assets. Our success will depend to a significant extent on the continued service of GCM’s senior management team, particularly David Sher, Charles Wheeler, Mehul Mehta, Spencer Mash and Richard Butt. The departure of any of GCM’s senior management team could have a material adverse effect on our ability to achieve our investment objectives.
Because our business model depends to a significant extent upon relationships with renewable energy developers, utilities, energy companies, investment banks, commercial banks, individual and institutional investors, consultants, engineering, procurement and construction ("EPC") companies, contractors, and renewable energy technology manufacturers (such as panel manufacturers), the inability of GCM to maintain relationships, or the failure of these relationships to generate business opportunities, could adversely affect our business.
We rely to a significant extent on GCM’s relationships with renewable energy developers, energy consultants, retail energy providers, utilities; energy companies, investment banks, commercial banks, individual and institutional investors, consultants, EPC companies, contractors, and renewable energy technology manufacturers (such as panel manufacturers), among others, as a source of potential investment opportunities. If GCM fails to maintain its relationships with other sponsors or sources of business opportunities, we will not be able to grow our portfolio, or will grow it at a slower rate. In addition, individuals with whom GCM’s professionals have relationships are not obligated to provide us with business opportunities, and, therefore, there is no assurance that such relationships will generate business opportunities for us.
Our business is subject to the risk of a potential public health crisis.
A public health crisis, pandemic, epidemic or outbreak of a contagious disease, such as the recent global outbreak of a disease caused by a novel and highly contagious form of coronavirus (COVID-19), could have an adverse impact on global, national and local economies, which in turn could negatively impact us. An outbreak such as COVID-19, and the reactions to such an outbreak, are expected to adversely affect the performance of the U.S. and global economies, including due to market volatility, market and business uncertainty and closures, supply chain and travel interruptions, the need for employees to work at external locations and extensive medical absences among the workforce. Disruptions to commercial activity relating to the imposition of quarantines, stay-at-home orders or travel restrictions (or more generally, a failure of containment efforts) may adversely impact our investments, including by causing supply chain disruptions or by causing staffing shortages, which may negatively impact construction timelines for certain of our to-be-constructed investments. In addition, such restrictions may significantly impair the ability of GCM’s personnel to travel in connection with potential or existing investments of ours or to GCM’s offices, which could negatively impact the ability of GCM to effectively identify, monitor, operate and dispose of investments.
Also, the outbreak of COVID-19 has contributed to, and may continue to contribute to, volatility in financial markets, including changes in interest rates. A continued outbreak may reduce the availability of debt financing to us and potential purchasers of our investments, which could have material and adverse impact on our returns.
As a reaction to such an outbreak, it is possible that governmental fiscal and economic measures will lead to an increase in spending and other forms of financial stimuli, and it is difficult to predict what effect such measures will have on our business. The market for electricity generation and consumption projects is influenced by U.S. federal, state and local government regulations and policies concerning the electric utility industry, and it is unclear the extent to which any new governmental measures in response to the COVID-19 outbreak will address the risks faced by the renewable energy industry.
The impact of a public health crisis such as COVID-19 (or any future pandemic, epidemic or outbreak of a contagious disease) is difficult to predict, which presents material uncertainty and risk with respect to our performance.
The amount of any distributions we may pay is uncertain. We may not be able to sustain the payment of distributions, and our distributions may not grow over time.
Subject to our Board of Directors’ discretion, based upon management’s recommendations, and applicable legal restrictions, we authorize and declare distributions quarterly and pay distributions monthly. However, while we intend to pay these distributions to our members out of assets legally available for distribution, we cannot assure that we will achieve investment results that will allow us to make a targeted level of cash distributions or year-to-year increases in cash distributions. Our ability to pay distributions might be adversely affected by, among other things, the impact of the risks described herein. All distributions will be paid at the discretion of our Board of Directors, based on management’s recommendations, and will depend on our earnings, our financial condition, compliance with applicable regulations and such other factors as our Board of Directors may deem relevant from time to time. We cannot assure that we will pay distributions to our members in the future. In the event that we encounter delays in locating suitable business opportunities, we may pay all or a substantial portion of our distributions from borrowings, the proceeds of our offering and other sources, without limitation. If we fund distributions from financings, then such financings will need to be repaid, and if we fund distributions from offering proceeds, then we will have fewer funds available for investments in renewable energy and energy efficiency projects, which may affect our ability to generate future cash flows from operations and, therefore, reduce overall return. Accordingly, members who receive the payment of a dividend or other distribution from us should not assume that such dividend or other distribution is the result of a net profit earned by us.
We are not required to comply with certain reporting requirements, including those relating to auditor’s attestation reports on the effectiveness of our system of internal control over financial reporting, accounting standards and disclosure about our executive compensation, that apply to other public companies.
As an emerging growth company, we are exempt from compliance with the auditor attestation requirements of Section 404 of the Sarbanes-Oxley Act. In addition, so long as we are externally managed by the Advisor and we do not directly compensate our executive officers, or reimburse the Advisor or its affiliates for salaries, bonuses, benefits and severance payments for persons who also serve as one of our executive officers or as an executive officer of the Advisor, we do not have any executive compensation.
Investment return may be reduced if we are required to register as an investment company under the Investment Company Act.
We conduct our operations directly and through wholly or majority-owned subsidiaries, so that the Company and each of its subsidiaries do not fall within, or are excluded from, the definition of an “investment company” under the Investment Company Act of 1940, as amended (the “Investment Company Act”). Under Section 3(a)(1)(A) of the Investment Company Act, a company is deemed to be an “investment company” if it is, or holds itself out as being, engaged primarily, or proposes to engage primarily, in the business of investing, reinvesting or trading in securities. Under Section 3(a)(1)(C) of the Investment Company Act, a company is deemed to be an “investment company” if it is engaged, or proposes to engage, in the business of investing, reinvesting, owning, holding or trading in securities, and owns or proposes to acquire “investment securities” having a value exceeding 40% of the value of its total assets (exclusive of U.S. Government securities and cash items) on an unconsolidated basis, which we refer to as the “40% test.” Excluded from the term “investment securities,” among other instruments, are U.S. Government securities and securities issued by majority-owned subsidiaries that are not themselves investment companies and are not relying on the exception from the definition of "investment company" set forth in Section 3(c)(1) or Section 3(c)(7) of the Investment Company Act.
We conduct our operations so that the Company is not required to register as an investment company. The Company is organized as a holding company that conducts its business primarily through its subsidiaries. The Company conducts operations so that it and most of its subsidiaries comply with the 40% test. We will monitor our holdings on an ongoing basis and determine compliance with this test in connection with new acquisitions. We expect most, if not all, of our wholly-owned and majority-owned subsidiaries to be outside the definitions of "investment company" under Section 3(a)(1)(A) and Section 3(a)(1)(C), or to rely on an exception from the definition of "investment company" other than the exceptions under Section 3(c)(1) and Section 3(c)(7) of the Investment Company Act. Consequently, interests in these subsidiaries (which constitute most, if not all, of our assets) generally will not constitute “investment securities.” Accordingly, we believe the Company will not be considered an investment company under Section 3(a)(1)(C) of the Investment Company Act. because it does not engage primarily or hold itself out as being engaged primarily in the business of investing, reinvesting or trading in securities. Rather, through the Company’s wholly owned or majority-owned subsidiaries, the Company is primarily engaged in the non-investment company businesses of these subsidiaries, namely, the business of acquiring and financing renewable energy and energy efficiency projects.
We make the determination of whether an entity is a majority-owned subsidiary of the Company. The Investment Company Act defines a "majority-owned subsidiary" of a person as a company that represents 50% or more of the outstanding voting securities owned by such person, or by another company which is a majority-owned subsidiary of such person. The Investment Company Act further defines voting securities as any security presently entitling the owner or holder thereof to vote for the election of directors of a company. We treat companies in which we own at least a majority of the outstanding voting securities as majority-owned subsidiaries for purposes of the 40% test. We have not requested the SEC to approve our treatment of any company as a majority-owned subsidiary and the SEC has not done so. If the SEC were to disagree with our treatment of one of more companies as majority-owned subsidiaries, we would need to adjust our strategy and our assets in order to continue to pass the 40% test. Any such adjustment in our strategy could have a material adverse effect on us.
Some of our majority-owned subsidiaries may also rely on the exceptions from the definition of investment company under Section 3(c)(5)(A) or (B) of the Investment Company Act, which except from the definition of investment company," respectively, (i) any person who is primarily engaged in the business of purchasing or otherwise acquiring notes, drafts, acceptances, open accounts receivable and other obligations representing part or all of the sales price of merchandise, insurance and services; or (ii) any person who is primarily engaged in the business of making loans to manufacturers, wholesalers and retailers of, and to prospective purchasers of, specified merchandise, insurance and services. The SEC has issued no-action letters interpreting Section 3(c)(5)(A) and (B) pursuant to which it has taken the position that these exceptions are available to a company with at least 55% of its assets consisting of eligible loans and receivables of the type specified in Section 3(c)(5)(A) and (B). We believe that most of the loans that we provide to finance renewable energy and energy efficiency projects relate to the purchase price of specific equipment or the cost to engage contractors to install equipment for such projects. Accordingly, we believe that most of these loans are eligible loans that qualify for this 55% test. However, no assurance can be given that the SEC will concur with this position. In addition, the SEC may, in the future, issue further guidance that may require us to reclassify our assets for purposes of qualifying with this exemption. A change in the value of our assets could cause us or one or more of our wholly or majority-owned subsidiaries, including those relying on Section 3(c)(5)(A) or (B), to fall within the definition of “investment company,” and negatively affect our ability to maintain our exemption from regulation under the Investment Company Act. To avoid being required to register the Company or any of its subsidiaries as an investment company under the Investment Company Act, we may be unable to sell assets we would otherwise want to sell and may need to sell assets we would otherwise wish to retain. In addition, we may have to acquire additional income- or loss-generating assets that we might not otherwise have acquired, or may have to forgo opportunities to acquire interests in companies that we would otherwise want to acquire and that would be important to our investment strategy.
If we become obligated to register the Company or any of its subsidiaries as an investment company, the registered entity would have to comply with a variety of substantive requirements under the Investment Company Act, imposing, among other things:
•limitations on capital structure;
•restrictions on specified investments;
•prohibitions on transactions with affiliates; and
•compliance with reporting, record keeping, voting, proxy disclosure and other rules and regulations that would significantly change our operations.
If we were required to register the Company as an investment company but failed to do so, we would be prohibited from engaging in our business, and criminal and civil actions could be brought against us. In addition, our contracts would be unenforceable unless a court required enforcement, and a court could appoint a receiver to take control of us and liquidate our business.
Monthly Share Value calculations are not governed by governmental or independent securities, financial or accounting rules or standards.
The methods we use to calculate our Monthly Share Value, which is the basis for the offering price for our shares offered and the investment value published in customer account statements for our investors, is not prescribed by the rules of the SEC or any other regulatory agency. Further, there are no accounting rules or standards that prescribe which components should be used in calculating Monthly Share Value, and our Monthly Share Value is not audited by our independent registered public accounting firm. We calculate and publish Monthly Share Value solely for purposes of establishing the price at which we sell and repurchase our shares, and for publishing the value of each shareholder's investment in us on such investor’s customer account statement, and our Monthly Share Value should not be viewed as a measure of our historical or future financial
condition or performance. The components and methodology used in calculating our Monthly Share Value may differ from those used by other companies now or in the future. Errors may occur in calculating our Monthly Share Value, which could impact the price at which we sell and repurchase our shares.
Cybersecurity risks could result in the loss of data, interruptions in our business and damage to our reputation, and subject us to regulatory actions, increased costs and financial losses, each of which could have a material adverse effect on our business and results of operations.
Our operations are highly dependent on our information systems and technology, and we rely heavily on our financial, accounting, treasury, communications, asset management and other data-processing systems. Such systems may fail to operate properly or become disabled as a result of tampering or a breach of the network security systems or otherwise. In addition, such systems are from time to time subject to cyberattacks, which may continue to increase in sophistication and frequency in the future. Cybersecurity incidents and cyberattacks have been occurring globally at a more frequent and severe level, and will likely continue to increase in frequency in the future. Our information and technology systems, as well as those of other related parties, such as service providers, may be vulnerable to damage or interruption from cybersecurity breaches, computer viruses or other malicious code, “phishing” attempts and other forms of social engineering, network failures, computer and telecommunication failures, infiltration by unauthorized persons and other security breaches, usage errors by their respective professionals or service providers, power, communications or other service outages, and catastrophic events such as fires, tornadoes, floods, hurricanes and earthquakes. Cyberattacks and other security threats could originate from a wide variety of external sources, including cyber criminals, nation-state hackers, hacktivists and other outside parties. Cyberattacks and other security threats could also originate from malicious or accidental acts of insiders, such as employees, or third-party agents and consultants. There can be no assurance that measures the Advisor takes to ensure the integrity of its systems will provide protection, especially because cyberattack techniques change frequently or are not recognized until successful.
The costs related to cyber or other security threats or disruptions may not be fully insured or indemnified by other means. In addition, we could also suffer losses in connection with updates to, or the failure to timely update, our information systems and technology. In addition, we have become increasingly reliant on third-party service providers for certain aspects of our business. These third-party service providers could also face ongoing cybersecurity threats and compromises of their systems, and as a result, unauthorized individuals could gain access to certain confidential data.
Cybersecurity has become a top priority for regulators around the world. Many jurisdictions in which we operate have laws and regulations relating to data privacy, cybersecurity and protection of personal information, including, for example, the California Consumer Privacy Act that went into effect in January 2020. Some jurisdictions have also enacted laws requiring companies to notify individuals and government agencies of data security breaches involving certain types of personal data. Breaches in security, whether malicious in nature or through inadvertent transmittal or other loss of data, could potentially jeopardize our, our employees’ or our investors’ or counterparties’ confidential, proprietary and other information processed and stored in, and transmitted through, our computer systems and networks, or otherwise cause interruptions or malfunctions in our, our employees’, our investors’, our counterparties’ or third parties’ business and operations, which could result in significant financial losses, increased costs, liability to our investors and other counterparties, regulatory intervention and reputational damage. Furthermore, if our Advisor fails to comply with the relevant laws and regulations or fail to provide the appropriate regulatory or other notifications of breach in a timely manner, it could result in regulatory investigations and penalties.
Risks Related to Our Advisor and Its Affiliates
Our Advisor and its affiliates, including our officers and some of our directors, may face conflicts of interest, including conflicts that may result from compensation arrangements with us and our affiliates, which could result in actions that are not in the best interests of our members.
Our Advisor and its affiliates receive substantial fees from us in return for their services, and these fees could influence the advice provided to us. Among other matters, the compensation arrangements could affect their judgment with respect to our public equity offerings, which allow GCM to earn increased management fees. The performance participation fee that the Special Unitholder, an affiliate of our Advisor, may be entitled to receive from us may create an incentive for our Advisor to oversee and supervise renewable energy or energy efficiency projects or make investments on our behalf that are risky or more speculative than would be the case in the absence of such compensation arrangement. The way in which the incentive distribution to which the Special Unitholder may be entitled is determined may encourage our Advisor to use leverage to increase the return on our portfolio. Our Operating Agreement does not impose limitations on the amount of leverage we may employ. At such time when the net proceeds from this offering have been fully invested, we expect that we will generally target
a leverage ratio of up to $2 of debt for every $1 of equity on our overall portfolio, with individual allocations of leverage based on the mix of asset types and obligors; however, we will in no event exceed a leverage ratio of $3 of debt for every $1 of equity, unless any excess is approved by a majority of our independent directors. Furthermore, GCM is primarily responsible for calculating the net asset value of our portfolio and a higher net asset value of our portfolio would result in a higher base management fee to our Advisor. Under certain circumstances, the use of leverage may increase the likelihood of default, which could adversely affect our results of operations. Such a practice could result in us making more speculative investments than would otherwise be the case, which could result in higher losses, particularly during cyclical economic downturns.
The Advisor may face conflicts of interest from managing other investment entities that make the same or similar types of investments that we target.
We currently expect the Advisor and its officers and employees to spend a significant portion of their time and resources on us. However, the Advisor and its officers and employees are not required to do so. Moreover, neither the Advisor nor its affiliates are prohibited from managing other investment entities that make the same or similar types of investments as those we target. Currently, the Advisor manages other such investment entities. Accordingly, the Advisor has obligations to the other entities it manages, and may have additional obligations to entities it manages in the future, the fulfillment of which might not be in our or our members' best interests, or that may require the Advisor to devote time to services for other entities, which could interfere with the time available to provide services to us. In addition, we may compete with any such investment entity for the same investors and investment opportunities.
Our Advisor can resign on 120 days’ notice, and we may not be able to find a suitable replacement within that time, resulting in a disruption in our operations that could adversely affect our financial condition, business and results of operations.
Our Advisor has the right, under the advisory agreement, to resign at any time on 120 days’ written notice, whether we have found a replacement or not. If our Advisor resigns, we may not be able to contract with a new advisor or hire internal management with similar expertise and ability to provide the same or equivalent services on acceptable terms within 120 days, or at all, in which case our operations are likely to experience a disruption, and our financial condition, business and results of operations, as well as our ability to pay distributions, are likely to be adversely affected. In addition, the coordination of our internal management, acquisition activities and supervision of our businesses is likely to suffer if we are unable to identify and reach an agreement with a single institution or group of executives that has the expertise of our Advisor and its affiliates. Even if we are able to retain comparable management, whether internal or external, the integration of such management and its lack of familiarity with our businesses may result in additional costs and time delays that may adversely affect our financial condition, business and results of operations.
Exercising our right to repurchase the special unit or the special preferred stock upon certain termination events could be prohibitively expensive and could deter us from terminating the advisory agreement.
The occurrence of a trigger event would give us the right, but not the obligation, to repurchase the special unit or the special preferred stock, as applicable, at the fair market value of the special unit or the special preferred stock on the date of termination, as determined by an independent appraiser. This repurchase could be prohibitively expensive, could require us to have to sell assets to raise sufficient funds to complete the repurchase and could discourage or deter us from terminating the advisory agreement. Alternatively, if we do not exercise our repurchase right, we might be unable to find another entity that would be willing to act as our advisor while an affiliate of GCM owns the special unit or the special preferred stock. If we do find another entity to act as our advisor, we may be subject to higher fees than the fees charged by GCM.
Risks Related to Our Investments and Industry Focus
Our strategic focus is on the renewable energy, energy efficiency and related sectors, which subjects us to more risks than if we were broadly diversified.
Because we are specifically focused on the renewable energy, energy efficiency and related sectors, investments in our shares may present more risks than if we were broadly diversified over more sectors of the economy. Therefore, a downturn in the renewable energy or energy efficiency sectors would have a greater impact on us than on a company that is not concentrated in limited segments of the economy. For example, biofuel companies operating in the renewable energy sector can be significantly affected by the supply of and demand for specific products and services, especially biomass such as corn or soybean oil, the supply and demand for energy commodities, the price of capital expenditures, government regulation, world and regional events and economic conditions. Companies that produce renewable energy can be negatively affected by lower
energy output resulting from variable inputs, mechanical breakdowns, faulty technology, competitive electricity markets or changing laws that mandate the use of renewable energy sources by electric utilities.
In addition, companies that engage in energy efficiency projects may be unable to protect their intellectual property, or face declines in the demand for their services due to changing governmental policies or budgets. At times, the returns from investments in the renewable energy and energy efficiency sectors may lag the returns of other sectors or the broader market.
Furthermore, with respect to the construction and operation of individual renewable energy and energy efficiency projects, there are several additional risks, including (i) substantial construction risk, including the risk of delay, that may arise due to inclement weather or labor disruptions; (ii) the risk of entering into markets where we have limited experience; (iii) the need for substantially more capital to complete than initially budgeted and exposure to liabilities as a result of unforeseen environmental, construction, technological or other complications; (iv) a decrease in the availability, pricing and timeliness of delivery of raw materials and components necessary for the projects to function; (v) the continued good standing of permits, authorizations and consents from local city, county, state and U.S. federal governments as well as local and U.S. federal governmental organizations; and (vi) the consent and authorization of local utilities or other energy development offtakers to ensure successful interconnection to energy grids to enable power sales.
Existing regulations and policies and changes to these regulations and policies may present technical, regulatory and economic barriers to the purchase and use of energy generation and consumption projects, including solar and wind energy projects, which may significantly reduce our ability to meet our investment objectives.
The market for electricity generation and consumption projects is influenced by U.S. federal, state and local government regulations and policies concerning the electric utility industry, as well as policies promulgated by electric utilities. Similar governmental influences apply in the other jurisdictions in which we may invest. These regulations and policies often relate to electricity pricing and technical interconnection of customer-owned electricity generation. In the United States and in several other countries, these regulations and policies are being modified and may continue to be modified. Customer purchases of, or further investment in the research and development of, alternative energy sources, including solar energy technology, could be deterred by these regulations and policies, which could result in a significant reduction in the potential demand for renewable energy and energy efficiency project development and investments. For example, without certain major incentive programs and/or the regulatory mandated exception for renewable energy or energy efficiency systems, utility customers are often charged interconnection or standby fees for putting distributed power generation on the electric utility network. These fees could increase the cost to our customers of using our renewable energy and energy efficiency projects and make them less desirable, thereby harming our business, prospects, results of operations and financial condition.
We anticipate that our renewable energy and energy efficiency projects will be subject to oversight and regulation in accordance with national and local ordinances relating to building codes, safety, environmental protection, utility interconnection and metering and related matters. It is difficult to track the requirements of individual states and design equipment to comply with the varying standards. Any new government regulations or utility policies pertaining to our renewable energy or energy efficiency projects may result in significant additional expenses or related development costs and, as a result, could cause a significant reduction in demand for our investments.
The profitability of our projects may be adversely affected if they are subject to regulation under the Federal Power Act (“FPA”), or state or local public utility laws and regulations that regulate the sale of electricity.
Companies owning or operating electric generation projects may be subject to regulatory requirements under the FPA or state or local public utility laws. The FPA grants the U.S. Federal Energy Regulatory Commission (“FERC”) jurisdiction over the sale of electric power for resale (i.e., sales at wholesale) in interstate commerce. Jurisdiction over retail sales (i.e., the sale of power to end users) is left to the states. Rates and charges for wholesale sales of electric power are subject to FERC’s supervision. Upon an appropriate showing, FERC will authorize an entity to engage in wholesale sales of electricity at negotiated rates based on market conditions (i.e., market-based rates) rather than at cost-based rates pre-approved by FERC. FERC continues to have jurisdiction over entities granted market-based rate authority and retains the authority to remove the authorization to sell at market-based rates and otherwise impose additional conditions.
On the state level, public utility regulatory commissions have jurisdiction over retail electric sales and regulate the rates and other terms and conditions of “public utilities” as defined by relevant state law.
Certain of our future projects will be Qualifying Facilities (“QFs”) and/or Exempt Wholesale Generators (“EWGs”). Depending on their production capacity, certain QFs are exempt from regulation (i) under most of the Federal Power Act (“FPA”) (including the need to obtain market-based rate authority); (ii) under the Public Utility Holding Company Act of 2005 (“PUHCA”); and (iii) under state law as to rates and financial and organizational regulation of electric utilities. EWGs are
generally exempt from FERC regulation under PUHCA, but remain subject to general FERC regulation under the FPA (including the requirement to obtain market-based authority).
If any of our portfolio companies are deemed to have violated the FPA, we may be subject to potential disgorgement of profits associated with the violation and/or suspension or revocation of our market-based rate authority, as well as potential penalties.
Certain projects, depending on their production capacity and configuration, may be subject to the reliability standards of the North American Electric Reliability Corporation. If we fail to comply with the mandatory reliability standards, we could be subject to sanctions, including monetary penalties and additional compliance obligations.
Although the sale of electric energy has been to some extent deregulated, the industry remains subject to extensive regulation. We cannot predict the future design of wholesale power markets or the ultimate effect ongoing regulatory changes will have on our business, or certain market changes that could impact our financial condition and adversely affect our operations.
Our projects may rely on electric transmission lines and other transmission facilities that are owned and operated by third parties. In these situations, our projects will be exposed to transmission facility curtailment risk, including but not limited to curtailment caused by breakdown of the power grid system, which may delay and increase the costs of our projects or reduce the return to us on those investments.
Our projects may rely on electric transmission lines and other transmission facilities owned and operated by third parties to deliver the electricity our projects generate. We expect some of our projects will have limited access to interconnection and transmission capacity because there are many parties seeking access to the limited capacity that is available. We may not be able to secure access to this limited interconnection or transmission capacity at reasonable prices or at all. Moreover, a failure in the operation by third parties of these transmission facilities could result in our losing revenues, because such a failure could limit the amount of electricity we deliver. In addition, our production of electricity may be curtailed due to third-party transmission limitations or limitations on the grid’s ability to accommodate intermittent energy sources, reducing our revenues and impairing our ability to capitalize fully on a project’s potential. Such a failure or curtailment at levels significantly above which we expect could have a material adverse effect on our business, financial condition and results of operations.
Liability relating to environmental matters may impact the value of properties that we may acquire or the properties underlying our projects.
Under various U.S. federal, state and local laws, an owner or operator of a project may become liable for the costs of removal of certain hazardous substances released from the project of any underlying real property. These laws often impose liability without regard to whether the owner or operator knew of, or was responsible for, the release of such hazardous substances.
The presence of hazardous substances may adversely affect an owner’s ability to sell a contaminated project or borrow using the project as collateral. To the extent that a project owner becomes liable for removal costs, the ability of the owner to make payments to us may be reduced.
We typically have title to projects or their underlying real estate assets underlying our equity investments, or, in the course of our business, we may take title to a project or its underlying real estate assets relating to one of our debt investments, and, in either case, we could be subject to environmental liabilities with respect to these assets. To the extent that we become liable for the removal costs, our results of operation and financial condition may be adversely affected. The presence of hazardous substances, if any, may adversely affect our ability to sell the affected project, and we may incur substantial remediation costs, thus harming our financial condition.
We may invest in tax equity partnerships, which creates additional risk because, among other things, we cannot exercise sole decision-making power and our partners may have different economic interests than we have.
We currently invest in tax equity partnerships with third parties. There are additional risks involved in such transactions. As a co-investor in a tax equity partnership, we may not always be in a position to exercise sole decision-making authority relating to the project or asset. As a result, the operations of a project may be subject to the risk that the tax equity partners may make business, financial or management decisions with which we do not agree, or the management of the project may take risks or otherwise act in a manner that does not serve our interests. Because we may not have the ability to exercise sole control over such operations, we may not be able to realize some or all the benefits that we believe will be created from our involvement. In
addition, there is the potential of our tax equity partner becoming bankrupt and the possibility of diverging or inconsistent economic or business interests between us and our partner. These diverging interests could, among other things, expose us to liabilities of the partnership in excess of our proportionate share of these liabilities. If any of the foregoing were to occur, our business, financial condition and results of operations could suffer as a result.
Risks Related to Investments in the Solar, Wind Power and Other Renewable Energy Industries
If the solar power industry experiences a shortage of key inputs, such as polysilicon, the profitability of solar power-producing projects may decrease, which may result in slower growth in the solar power market than we anticipate.
Solar power companies depend on certain technologies and key inputs, such as polysilicon. If the solar power industry experiences shortages of these technologies and key inputs, the profitability of the solar businesses in which we invest may be negatively impacted due to the resulting increase in prices of these technologies and key inputs. In addition, increases in polysilicon prices have in the past increased manufacturing costs for solar power producers and may impact manufacturing costs and net income or cause a shortage of polysilicon in the future. Polysilicon is also used in the semiconductor industry generally, and any increase in demand from that sector may cause a shortage. To the extent a shortage results in these types of technologies and key inputs due to price increases, the solar power market may experience slower growth than we anticipate.
The operating results of the projects in which we invest that produce solar power may be negatively affected by a number of factors.
In addition to shortages in technologies and key inputs and changes in governmental policies, the results of the projects in which we invest that produce solar power can be affected by a variety of factors, including the following:
•the average selling price of solar cells, solar panels and solar power systems;
•a decrease in the availability, pricing and timeliness of delivery of raw materials and components, particularly solar panels and components, including steel, necessary for solar power systems to function;
•the rate and cost at which solar power producers are able to expand their manufacturing and product assembly capacity to meet customer demand, including costs and timing of adding personnel;
•construction cost overruns, including those associated with the introduction of new products;
•the impact of seasonal variations in demand and/or revenue recognition linked to construction cycles and weather conditions;
•unplanned additional expenses such as manufacturing failures, defects or downtime;
•the impact of seasonal variations in sunlight on energy production;
•the impact of weather variations on energy production;
•acquisition and investment-related costs;
•the loss of one or more key customers or the significant reduction or postponement of orders from these customers;
•changes in manufacturing costs;
•the availability, pricing and timeliness of delivery of products necessary for solar power products to operate;
•changes in electric rates due to changes in fossil fuel prices;
•the lack of a viable secondary market for positions in solar energy projects; and
•the ability of a solar energy project to generate cash and pay yield substantially depends on power generation, which depends on the continuing productive capability of the solar energy hardware, including proper operations and maintenance of the solar energy hardware and fair sunlight for the life of the investment.
If wind conditions are unfavorable or below our estimates on any of our wind projects, the electricity production on such project and therefore, our income, may be substantially below our estimates.
The financial performance of our projects that produce wind energy will be dependent upon the availability of wind resources. The strength and consistency of wind resources at wind projects will vary. Weather patterns could change, or the historical data could prove to be an inaccurate reflection of the strength and consistency of the wind in the future. If wind resources are insufficient, the assumptions underlying the economic feasibility about the amount of electricity to be generated by wind projects will not be met, and the project’s income and cash flows will be adversely impacted. Wind-producing projects and our evaluations of wind projects will be based on assumptions about certain conditions that may exist and events that may occur in the future. A number of additional factors may cause the wind resource and energy capture at wind projects to differ, possibly materially, from those initially assumed by the project’s management, including: (1) the limited time period over which the site-specific wind data were collected; (2) the potential lack of close correlation between site-specific wind data and the longer-term regional wind data; (3) inaccurate assumptions related to wake losses and wind shear; (4) the limitations in the accuracy with which anemometers measure wind speed; (5) the inherent variability of wind speeds; (6) the lack of independent verification of the turbine power curve provided by the manufacturer; (7) the potential impact of global warming and other climatic factors, including icing and soiling of wind turbines; (8) the potential impact of topographical variations, turbine placement and local conditions, including vegetation; (9) the power delivery schedule being subject to uncertainty; (10) the inherent uncertainty associated with the use of models, in particular future-oriented models; and (11) the potential for electricity losses to occur before delivery.
Furthermore, a project’s wind resources may be insufficient for it to become and remain profitable. Wind is naturally variable. The level of electricity production at any of our wind projects, therefore, will also be variable. If there are insufficient wind resources at a project site due to variability, the assumptions underlying our belief about the amount of electricity to be generated by the wind project will not be met. Accordingly, there is no assurance that a project’s wind resources will be sufficient for it to become or remain profitable.
If our wind energy production assessments turn out to be wrong, our wind energy projects could suffer several material adverse consequences, including (i) our wind energy production and sales for the project may be significantly lower than we predict; (ii) our hedging arrangements may be ineffective or more costly; (iii) we may not produce sufficient energy to meet our commitments to sell electricity or RECs and, as a result, we may have to buy electricity or RECs on the open market to cover our obligations or pay damages; and (iv) our projects may not generate sufficient cash flow to make payments of principal and interest as they become due on the debt we provided on the project, and we may have difficulty refinancing such debt.
Our investments in biomass facilities may be negatively affected by our inability to maintain stockpiles of the products on which such facilities operate and/or to source the necessary personnel to operate such facilities.
The production of biomass facilities can be significantly affected by the supply of and demand for specific products and services, especially biomass such as corn, wood chips or soybean oil, the supply and demand for energy commodities, the price of capital expenditures, government regulation, world and regional events and economic conditions. Generally, we will need to maintain a sufficient stockpile of the specific products on which biomass facilities operate. Our investments in such facilities may be negatively affected by any such supply and/or demand shortages.
In addition, investments in biomass facilities require a team of experienced personnel to manage such facilities and are, therefore, more susceptible than our other investments to shortages in experienced personnel. Moreover, the COVID-19 pandemic is more likely to have an impact on the operations of a biomass facility than our other types of investments.
Our investments in energy storage facilities may be negatively affected by a number of factors, including increases in storage costs, risk of fire and decreases in retail peak electricity pricing.
Energy storage is a segment of the energy markets that has experienced significant growth in recent years as storage costs have fallen. The continued growth of the energy storage industry depends on a number of uncertain factors, including continued decreases in storage costs. Our investments in energy storage facilities may be negatively affected by increases in storage costs and/or decreases in procurement of energy storage. Energy storage technologies are immature and, thus, the performance of such technologies is uncertain. To the extent we invest in lithium-ion battery storage systems, such systems may be subject to risk of fire due to the fire risk associated with lithium-ion batteries.
In addition, our investments in energy storage systems may require us to guarantee an electricity customer’s utility bill cost savings by providing offsetting load during peak electricity consumption hours. If we are required to guarantee such cost savings and a customer’s cost savings decrease below the guaranteed amount, due to a decrease in retail peak electricity pricing
or otherwise, we would be required to pay an amount equal to the difference between the customer’s actual cost savings and the guaranteed amount.
In our due diligence review of potential investments, we may rely on third-party consultants and advisors and representations made by sellers of potential portfolio projects, and we may not identify all relevant facts that may be necessary or helpful in evaluating potential investments.
Before making investments, due diligence will typically be conducted in a manner that we deem reasonable and appropriate based on the facts and circumstances applicable to each investment. Due diligence may entail evaluation of important and complex business, financial, tax, accounting, environmental and legal issues. Outside consultants, legal advisors, appraisers, accountants, independent engineers, investment banks and other third parties may be involved in the due diligence process to varying degrees depending on the type of investment, the costs of which will be borne by us. Such involvement of third-party advisors or consultants may present a number of risks primarily relating to the Advisor’s reduced control of the functions that are outsourced. In addition, if the Advisor is unable to timely engage third-party providers, the ability to evaluate and acquire more complex targets could be adversely affected. In the due diligence process and in making an assessment regarding a potential investment, the Advisor will rely on the resources available to it, including information provided by the target of the investment and, in some circumstances, third-party investigations. The due diligence investigation carried out with respect to any investment opportunity may not reveal or highlight all relevant facts that may be necessary or helpful in evaluating such investment opportunity, particularly for large portfolio investments. Moreover, such an investigation will not necessarily result in the investment being successful. There can be no assurance that attempts to provide downside protection with respect to investments, including pursuant to the risk management procedures described in this annual report, will achieve their desired effect, and potential investors should regard an investment in us as being speculative and having a high degree of risk.
Risks Related to Debt Financing and Lending
We may need to incur financial leverage to be able to achieve our investment objectives. We cannot guarantee the availability of such financings.
To achieve our investment objectives, we may be required to utilize financial leverage. We may borrow money to make investments, for working capital, and to make distributions to our members. No portion of the net worth of GCM, our sponsor, and its affiliates will be available to us to satisfy our liabilities or other obligations. Accordingly, we are subject to the risk that we are unable to obtain financing at all or on commercial terms that are acceptable to us. Moreover, if we are able to obtain financing, we will be subject to the risk that our cash flow will not be sufficient to cover the required debt service payments and, to the extent that we cannot meet our financing obligations, we risk the loss of some or all of our assets to liquidation or sale, at significantly depressed prices in some cases due to market conditions or otherwise, to satisfy the obligations. Furthermore, any amounts that we use to service our indebtedness will not be available for distributions to our members.
If we borrow money, the potential for gain or loss on the amounts invested in us will be magnified, and may increase the risk of investing in us. Borrowed money may also adversely affect the return on our assets, reduce cash available for distribution to our members, and result in losses.
We currently use leverage to finance certain of our investments. We generally target a leverage ratio of up to $2 of debt for every $1 of equity on our overall portfolio, with individual allocations of leverage based on the mix of asset types and obligors; however, we will in no event exceed a leverage ratio of $3 of debt for every $1 of equity, unless any excess is approved by a majority of our independent directors. The amount of leverage that we employ will depend on the Advisor’s assessment of market and other factors at the time of any proposed borrowing. The Operating Agreement does not impose limits on the amount of leverage we may employ. There can be no assurance that leveraged financing will be available to us on attractive terms or at all. The use of leverage increases the volatility of investments by magnifying the potential for gain or loss on invested equity capital. If we use leverage to partially finance our investments, through borrowing from banks and other lenders, there will be an increased risk of investing in our shares. If the value of our assets decreases, leveraging would cause such value to decline more sharply than it otherwise would have had we not leveraged. Similarly, any decrease in our income would cause net income to decline more sharply than it would have had we not borrowed. Such a decline could negatively affect our ability to make distributions to our members.
We will be exposed to risks associated with changes in interest rates.
To the extent we borrow to finance our investments, we will be subject to financial market risks, including changes in interest rates. An increase in interest rates would make it more expensive to use debt for our financing needs. When we borrow, our net investment income will depend, in part, upon the difference between the rate at which we borrow funds and the rate at which we employ those funds. As a result, we can offer no assurance that a meaningful change in market interest rates will not
have a material adverse effect on our net investment income. In periods of rising interest rates when we have debt outstanding, our cost of funds may increase, which could reduce our net investment income. We expect that our long-term fixed-rate investments will be financed primarily with equity and long-term debt. We may use interest rate risk management techniques to limit our exposure to interest rate fluctuations. These techniques may include borrowing at fixed rates or various interest rate hedging activities. These activities may limit our ability to participate in the benefits of lower interest rates with respect to the hedged portfolio. Adverse developments resulting from changes in interest rates or hedging transactions could have a material adverse effect on our business, financial condition and results of operations.
Changes to, or the elimination of, the London Interbank Offered Rate (“LIBOR”) may adversely affect interest expense related to our borrowings.
In connection with our borrowings to finance our investments, we pay interest, based on LIBOR. On July 27, 2017, the United Kingdom’s Financial Conduct Authority (the "FCA"), which regulates LIBOR, announced that it intended to stop encouraging or compelling banks to submit rates for the calibration of LIBOR by the end of 2021. On March 5, 2021, the ICE Benchmark Administration, the administrator of LIBOR, with the support of the United States Federal Reserve and the FCA, announced that it planned to consult on ceasing publication of LIBOR on December 31, 2021 for only the one week and two month LIBOR tenors (for which publication has now ceased), and on June 30, 2023 for all other LIBOR tenors. While this announcement extends the transition period to June 2023, the United States Federal Reserve concurrently issued a statement advising banks to stop new LIBOR issuances by the end of 2021. In light of these recent announcements, the future of LIBOR at this time is uncertain and any changes in the methods by which LIBOR is determined or regulatory activity related to LIBOR's phaseout could cause LIBOR to perform differently than in the past or cease to exist. In June 2017, the Alternative Reference Rates Committee selected the Secured Overnight Financing Rate (“SOFR”), a new index calculated by reference to short-term repurchase agreements backed by Treasury securities, as its preferred replacement for U.S. dollar LIBOR. Whether or not SOFR attains market acceptance as a LIBOR replacement tool remains in question. As such, the future of LIBOR and the potential alternatives at this time is uncertain. If the method for calculation of LIBOR changes, if LIBOR is no longer available after June 2023 or if lenders have increased costs due to the phase-out of LIBOR or changes in law, we may suffer from potential increases.
The potential effect of any such event on our cost of capital cannot yet be determined, and any changes to benchmark interest rates could increase our financing costs, which could impact our results of operations, cash flows and the values of our investments.
Risks Related to Offering and Our Shares
The shares that were sold in our security offerings will not be listed on an exchange or quoted through a quotation system for the foreseeable future, if ever. Therefore, when purchasing any class of shares, investors have limited liquidity and may not receive a full return of their invested capital if they sell their shares.
The shares offered by us are illiquid assets for which there is not expected to be any secondary market, nor is it expected that any will develop in the future. Investors' ability to transfer shares is limited. Pursuant to the Operating Agreement, we have the discretion under certain circumstances to prohibit transfers of shares, or to refuse to consent to the admission of a transferee as a member. Moreover, our share repurchase program should not be relied on as a method to sell shares promptly, because our share repurchase program includes numerous restrictions that limit investors' ability to sell their shares to us, and we may amend, suspend or terminate our share repurchase program at any time without advance notice. In particular, the share repurchase program provides that we may make repurchase offers only to members that have held their shares for a minimum of one year, which one-year holding period will be waived in the event of the departure of certain of our key personnel. In addition, commencing with the quarter ending September 30, 2021, we will limit repurchases (i) during any 12-month period, to 20% of our weighted average number of outstanding shares; and (ii) during any fiscal quarter, to 5.00% of the weighted average number of shares outstanding in the prior four fiscal quarters. For the fiscal quarters prior to the quarter ending September 30, 2021, the share repurchase limits are lower, ranging from 1.25% of the weighted average number of shares outstanding in the prior four fiscal quarters to 3.75% of the weighted average number of shares outstanding in the prior four fiscal quarters.
Our ability to repurchase shares is subject to and may be limited by the Company’s available funds. Therefore, it will be difficult for investors to sell their shares promptly or at all. In addition, we have no present intention to consummate a liquidity event for the LLC, and the price received for any shares sold prior to any such liquidity event is likely to be less than the proportionate value of our assets. The shares should be purchased as a long-term investment only.
Investors' interest in us will be diluted if we issue additional shares, which could reduce the overall value of their investment.
Investors in this offering do not have preemptive rights to any shares we may issue in the future. Our Operating Agreement authorizes us to issue up to 400,000,000 shares. Pursuant to our Operating Agreement, a majority of our entire Board of Directors may amend our Operating Agreement from time to time to increase or decrease the aggregate number of authorized shares or the number of authorized shares of any class or series without member approval. After an investor's purchase in this offering, we may elect to sell additional shares in future public offerings, issue equity interests in private offerings, or issue share-based awards to our independent directors, GCM and/or employees of GCM. To the extent we issue additional equity interests after an investor's purchase in this offering, that investor's percentage ownership interest in us will be diluted. In addition, depending upon the terms and pricing of any additional offerings and the value of our investments, investors may also experience dilution in the value of their shares.
Risks Related to Tax
Members may realize taxable income without cash distributions, and may have to use funds from other sources to fund tax liabilities.
Because we are taxed as a partnership for U.S. federal income tax purposes, members may realize taxable income in excess of cash distributions by us. There can be no assurance that we will pay distributions at a specific rate or at all. As a result, members may have to use funds from other sources to pay their tax liability.
In addition, the payment of any distribution fees over time with respect to certain classes of shares will be deemed to be paid from cash distributions that would otherwise be distributable to the holders of such classes of shares. Accordingly, the holders of such classes of shares will receive a lower cash distribution to the extent of such holders’ obligation to pay such fees. Because the payment of such fees is not a deductible expense for tax purposes, the taxable income of the Company allocable to the holders of such classes of shares may, therefore, exceed the amount of cash distributions made to such holders.
The U.S. Internal Revenue Service (“IRS”) could adjust or reallocate items of income, gain, deduction, loss and credit with respect to the shares if the IRS does not accept the assumptions or conventions we utilize.
U.S. federal income tax rules applicable to partnerships are complex, and their application is not always clear. Moreover, the rules generally were not written for, and in some respects are difficult to apply to, publicly traded interests in partnerships. We apply certain assumptions and conventions intended to comply with the intent of the rules and to report income, gain, deduction, loss and credit to members in a manner that reflects members’ economic gains and losses, but these assumptions and conventions require judgment in application with the applicable Treasury regulations. It is possible therefore that the IRS will successfully assert that these assumptions or conventions do not satisfy the technical requirements of the Internal Revenue Code of 1986 (the “Internal Revenue Code”), and will require that items of income, gain, deduction, loss and credit be adjusted or reallocated in a manner that could be adverse to investors.
If we were to become taxable as a corporation for U.S. federal income tax purposes, we would be required to pay income tax at corporate rates on our net income, and distributions by us to members would constitute dividend income taxable to such members, to the extent of our earnings and profits.
While we plan to continue to operate so that we will qualify to be treated for U.S. federal income tax purposes as a partnership, and not as an association or a publicly traded partnership taxable as a corporation, given the highly complex nature of the rules governing partnerships, the ongoing importance of factual determinations, the lack of direct guidance with respect to the application of tax laws to the activities we are undertaking and the possibility of future changes in its circumstances, it is possible that we will not so qualify for any particular year. Our taxation as a partnership will depend on our ability to meet, on a continuing basis, through actual operating results, the “qualifying income exception.” We expect to satisfy this exception by ensuring that most of our investments that do not generate “qualifying income” are held through taxable corporate subsidiaries. However, we may not properly identify income as “qualifying.” Accordingly, no assurance can be given that the actual results of our operations for any taxable year will satisfy the qualifying income exception.
If, for any reason, we become taxable as a corporation for U.S. federal income tax purposes, our items of income and deduction would not pass through to our members, and our members would be treated for U.S. federal income tax purposes as shareholders in a corporation. We would be required to pay income tax at corporate rates on our net income. Distributions by us to members would constitute dividend income taxable to such members, to the extent of our earnings and profits, and the payment of these distributions would not be deductible by us. These consequences would have a material adverse effect on us, our members and the value of the shares.
While it is expected that we will operate so that we will qualify to be treated for U.S. federal income tax purposes as a partnership, we expect that a significant portion of our investments will not generate “qualifying income,” and that we will
conduct a significant portion of our operations through GREC, our wholly owned subsidiary treated as a C-corporation for U.S. federal income tax purposes and subject to U.S. federal income tax on its net income. Conducting our operations through GREC will allow us to effectively utilize tax incentives generated from projects in which we hold controlling equity stakes to reduce the taxable income generated by our other investments through tax incentives that are better utilized by C-corporations than other forms of entities. Because a significant portion of our investments will be held through GREC, the tax benefit of our being a partnership for U.S. federal income tax purposes will be limited to the income generated by the investments that we directly hold.
ITEM 1B. UNRESOLVED STAFF COMMENTS
None.
ITEM 2. PROPERTIES
Our executive offices are located at 230 Park Avenue, Suite 1560, New York, NY 10169. We believe that our office facilities are suitable and adequate for our business as it is contemplated to be conducted.
ITEM 3. LEGAL PROCEEDINGS
None of us, GCM, or the Administrator, is currently subject to any material legal proceedings, nor, to our knowledge, is any material legal proceeding threatened against us, or against GCM or the Administrator.
ITEM 4. MINE SAFETY DISCLOSURES
Not applicable.
PART II
ITEM 5. MARKET FOR REGISTRANT’S COMMON EQUITY, RELATED MEMBER MATTERS AND ISSUER PURCHASES OF EQUITY SECURITIES
Price Range of Common Equity
The Company’s shares are not listed or traded on any recognized securities exchange. Since the initial closing, the Company sold shares on a continuous basis at the following prices:
| | | | | | | | | | | | | | | | | | | | | | | | | | | | | | | | | | | | | | | | | | | | | | | | | | | | | | | | |
| Period | | Class |
| From | | To | | A | | C | | I | | P-A | | P-I | | P-S | | P-T | | P-D |
| 25-Apr-14 | | 4-Nov-15 | | $ | 10.00 | | | $ | 9.58 | | | $ | 9.19 | | | N/A | | N/A | | N/A | | N/A | | N/A |
| 5-Nov-15 | | 4-Feb-16 | | $ | 10.02 | | | $ | 9.60 | | | $ | 9.21 | | | N/A | | N/A | | N/A | | N/A | | N/A |
| 5-Feb-16 | | 5-May-16 | | $ | 10.05 | | | $ | 9.62 | | | $ | 9.23 | | | N/A | | N/A | | N/A | | N/A | | N/A |
| 6-May-16 | | 3-Aug-16 | | $ | 10.07 | | | $ | 9.64 | | | $ | 9.25 | | | $ | 9.59 | | | $ | 8.81 | | | N/A | | N/A | | N/A |
| 4-Aug-16 | | 6-Nov-16 | | $ | 10.23 | | | $ | 9.79 | | | $ | 9.39 | | | $ | 9.79 | | | $ | 8.95 | | | N/A | | N/A | | N/A |
| 7-Nov-16 | | 7-Feb-17 | | $ | 10.28 | | | $ | 9.58 | | | $ | 9.45 | | | $ | 9.78 | | | $ | 8.83 | | | N/A | | N/A | | N/A |
| 8-Feb-17 | | 4-May-17 | | $ | 10.22 | | | $ | 9.53 | | | $ | 9.39 | | | $ | 9.70 | | | $ | 8.76 | | | N/A | | N/A | | N/A |
| 5-May-17 | | 17-May-17 | | $ | 10.17 | | | $ | 9.48 | | | $ | 9.34 | | | $ | 9.70 | | | $ | 8.69 | | | N/A | | N/A | | N/A |
| 18-May-17 | | 3-Aug-17 | | $ | 9.74 | | | $ | 9.07 | | | $ | 8.94 | | | $ | 9.70 | | | $ | 8.69 | | | N/A | | N/A | | N/A |
| 4-Aug-17 | | 2-Nov-17 | | $ | 9.72 | | | $ | 9.08 | | | $ | 8.93 | | | N/A | | $ | 8.73 | | | N/A | | N/A | | N/A |
| 3-Nov-17 | | 5-Feb-18 | | $ | 9.74 | | | $ | 9.09 | | | $ | 8.94 | | | N/A | | $ | 8.75 | | | N/A | | N/A | | N/A |
| 6-Feb-18 | | 6-May-18 | | $ | 9.78 | | | $ | 9.09 | | | $ | 8.98 | | | $ | 9.65 | | * | $ | 8.81 | | | N/A | | N/A | | N/A |
| 7-May-18 | | 2-Aug-18 | | $ | 9.80 | | | $ | 9.12 | | | $ | 9.01 | | | $ | 9.68 | | | $ | 8.84 | | | N/A | | N/A | | N/A |
| 3-Aug-18 | | 31-Oct-18 | | $ | 9.83 | | | $ | 9.17 | | | $ | 9.03 | | | $ | 9.69 | | | $ | 8.90 | | | N/A | | N/A | | N/A |
| 1-Nov-18 | | 6-Feb-19 | | $ | 9.79 | | | $ | 9.15 | | | $ | 8.99 | | | $ | 9.68 | | | $ | 8.89 | | | N/A | | N/A | | N/A |
| 7-Feb-19 | | 6-May-19 | | $ | 9.63 | | | $ | 9.01 | | | $ | 8.84 | | | $ | 9.50 | | ** | $ | 8.76 | | | N/A | | N/A | | N/A |
| 7-May-19 | | 1-Aug-19 | | N/A | | N/A | | N/A | | N/A | | $ | 8.76 | | | N/A | | N/A | | N/A |
| 2-Aug-19 | | 8-Nov-19 | | N/A | | N/A | | N/A | | N/A | | $ | 8.77 | | | N/A | | N/A | | N/A |
| 9-Nov-19 | | 19-Mar-20 | | N/A | | N/A | | N/A | | N/A | | $ | 8.93 | | | N/A | | N/A | | N/A |
| 20-Mar-20 | | 18-May-20 | | N/A | | N/A | | N/A | | N/A | | $ | 8.90 | | | N/A | | N/A | | N/A |
| 19-May-20 | | 20-Aug-20 | | N/A | | N/A | | N/A | | N/A | | $ | 8.95 | | | N/A | | N/A | | N/A |
| 21-Aug-20 | | 1-Nov-20 | | N/A | | N/A | | N/A | | N/A | | $ | 9.02 | | | N/A | | N/A | | N/A |
| 2-Nov-20 | | 31-Jan-21 | | N/A | | N/A | | N/A | | $ | 9.42 | | ** | $ | 9.02 | | | $ | 9.57 | | | $ | 9.60 | | | $ | 9.30 | |
| 1-Feb-21 | | 26-Feb-21 | | N/A | | N/A | | N/A | | $ | 9.38 | | | $ | 8.96 | | | $ | 9.00 | | | $ | 9.53 | | | $ | 9.24 | |
| 1-Mar-21 | | 31-Mar-21 | | N/A | | N/A | | N/A | | $ | 9.44 | | | $ | 9.02 | | | $ | 9.00 | | | $ | 9.53 | | | $ | 9.24 | |
| 1-Apr-21 | | 30-Apr-21 | | N/A | | N/A | | N/A | | $ | 9.47 | | | $ | 9.02 | | | $ | 9.01 | | | $ | 9.53 | | | $ | 9.24 | |
| 3-May-21 | | 31-May-21 | | N/A | | N/A | | N/A | | $ | 9.39 | | | $ | 8.92 | | | $ | 8.99 | | | $ | 9.50 | | | $ | 9.20 | |
| 1-Jun-21 | | 30-Jun-21 | | N/A | | N/A | | N/A | | $ | 9.39 | | | $ | 8.92 | | | $ | 8.99 | | | $ | 9.50 | | | $ | 9.20 | |
| 1-Jul-21 | | 1-Aug-21 | | N/A | | N/A | | N/A | | $ | 9.39 | | | $ | 8.92 | | | $ | 8.99 | | | $ | 9.50 | | | $ | 9.20 | |
| 2-Aug-21 | | 31-Aug-21 | | N/A | | N/A | | N/A | | $ | 9.44 | | | $ | 8.91 | | | $ | 8.97 | | | $ | 9.54 | | | $ | 9.19 | |
| 1-Sep-21 | | 30-Sep-21 | | N/A | | N/A | | N/A | | $ | 9.44 | | | $ | 8.91 | | | $ | 8.97 | | | $ | 9.54 | | | $ | 9.19 | |
| 1-Oct-21 | | 31-Oct-21 | | N/A | | N/A | | N/A | | $ | 9.44 | | | $ | 8.91 | | | $ | 8.97 | | | $ | 9.54 | | | $ | 9.19 | |
| 1-Nov-21 | | 30-Nov-21 | | N/A | | N/A | | N/A | | $ | 9.33 | | | $ | 8.80 | | | $ | 8.85 | | | $ | 9.41 | | | $ | 9.09 | |
| 1-Dec-21 | | 31-Dec-21 | | N/A | | N/A | | N/A | | $ | 9.33 | | | $ | 8.80 | | | $ | 8.85 | | | $ | 9.41 | | | $ | 9.09 | |
| 3-Jan-22 | | 31-Jan-22 | | N/A | | N/A | | N/A | | $ | 9.33 | | | $ | 8.80 | | | $ | 8.85 | | | $ | 9.41 | | | $ | 9.09 | |
| 1-Feb-22 | | 28-Feb-22 | | N/A | | N/A | | N/A | | $ | 9.32 | | | $ | 8.80 | | | $ | 8.86 | | | $ | 9.40 | | | $ | 9.07 | |
| 1-Mar-22 | | — | | N/A | | N/A | | N/A | | $ | 9.32 | | | $ | 8.80 | | | $ | 8.86 | | | $ | 9.40 | | | $ | 9.07 | |
* Effective April 16, 2018
** Ceased February 8, 2019 and recommenced on November 2, 2020
HOLDERS
As of December 31, 2021, the Company has issued 16,580,558 Class A shares (including 23,601 to GCM), 2,741,963 Class C shares, 6,449,493 Class I shares, 783,593 Class P-A shares, 92,069,013 Class P-I shares, 46,324,757 Class P-S shares, 239,594 Class P-T shares and 198,548 Class P-D shares (including 2,776 to GCM).
DISTRIBUTIONS
The following table reflects the distributions declared during the year ended December 31, 2021:
| | | | | | | | | | | | | | | | | | | | |
| Pay Date | | Paid in Cash | | Values of Shares Issued under DRP | | Total |
| February 1, 2021 | | $ | 2,555,800 | | | $ | 538,241 | | | $ | 3,094,041 | |
| March 4, 2021 | | 3,063,308 | | | 487,868 | | | 3,551,176 | |
| April 1, 2021 | | 4,783,092 | | | 523,715 | | | 5,306,807 | |
| May 3, 2021 | | 4,733,419 | | | 565,208 | | | 5,298,627 | |
| June 1, 2021 | | 4,762,355 | | | 886,124 | | | 5,648,479 | |
| July 1, 2021 | | 4,709,348 | | | 960,096 | | | 5,669,444 | |
| August 2, 2021 | | 5,217,796 | | | 1,071,227 | | | 6,289,023 | |
| September 1, 2021 | | 5,423,345 | | | 1,145,375 | | | 6,568,720 | |
| October 1, 2021 | | 5,516,811 | | | 1,229,494 | | | 6,746,305 | |
| November 1, 2021 | | 5,946,262 | | | 1,463,710 | | | 7,409,972 | |
| December 1, 2021 | | 5,938,698 | | | 1,662,579 | | | 7,601,277 | |
| January 3, 2022 | | 6,174,878 | | | 1,755,921 | | | 7,930,799 | |
| Total | | $ | 58,825,112 | | | $ | 12,289,558 | | | $ | 71,114,670 | |
The following table reflects the distributions declared during the year ended December 31, 2020:
| | | | | | | | | | | | | | | | | | | | |
| Pay Date | | Paid in Cash | | Value of Shares Issued under DRP | | Total |
| February 3, 2020 | | $ | 1,788,542 | | | $ | 603,697 | | | $ | 2,392,239 | |
| March 2, 2020 | | 1,733,243 | | | 561,984 | | | 2,295,227 | |
| April 2, 2020 | | 1,890,493 | | | 593,200 | | | 2,483,693 | |
| May 1, 2020 | | 1,838,747 | | | 578,258 | | | 2,417,005 | |
| June 1, 2020 | | 1,829,752 | | | 551,563 | | | 2,381,315 | |
| July 1, 2020 | | 1,827,301 | | | 532,220 | | | 2,359,521 | |
| August 3, 2020 | | 2,133,835 | | | 548,210 | | | 2,682,045 | |
| September 1, 2020 | | 2,157,292 | | | 546,746 | | | 2,704,038 | |
| October 1, 2020 | | 2,178,934 | | | 529,183 | | | 2,708,117 | |
| November 2, 2020 | | 2,285,549 | | | 539,435 | | | 2,824,984 | |
| December 1, 2020 | | 2,281,547 | | | 524,274 | | | 2,805,821 | |
| January 1, 2021 | | 2,447,041 | | | 537,476 | | | 2,984,517 | |
| Total | | $ | 24,392,276 | | | $ | 6,646,246 | | | $ | 31,038,522 | |
The following table reflects the distributions declared during the year ended December 31, 2019:
| | | | | | | | | | | | | | | | | | | | |
| Pay Date | | Paid in Cash | | Value of Shares Issued under DRP | | Total |
| February 1, 2019 | | $ | 1,317,325 | | | $ | 583,571 | | | $ | 1,900,896 | |
| March 1, 2019 | | 1,247,614 | | | 552,615 | | | 1,800,229 | |
| April 1, 2019 | | 1,452,785 | | | 611,200 | | | 2,063,985 | |
| May 1, 2019 | | 1,438,057 | | | 600,614 | | | 2,038,671 | |
| June 3, 2019 | | 1,553,801 | | | 622,584 | | | 2,176,385 | |
| July 1, 2019 | | 1,764,525 | | | 383,627 | | | 2,148,152 | |
| August 1, 2019 | | 1,850,929 | | | 393,237 | | | 2,244,166 | |
| September 2, 2019 | | 1,664,451 | | | 613,333 | | | 2,277,784 | |
| October 1, 2019 | | 1,647,967 | | | 589,581 | | | 2,237,548 | |
| November 1, 2019 | | 1,716,132 | | | 609,283 | | | 2,325,415 | |
| December 2, 2019 | | 1,693,670 | | | 587,119 | | | 2,280,789 | |
| January 1, 2020 | | 1,784,956 | | | 605,129 | | | 2,390,085 | |
| Total | | $ | 19,132,212 | | | $ | 6,751,893 | | | $ | 25,884,105 | |
PERFORMANCE GRAPH
Not applicable.
Sales of Unregistered Securities
During the year ended December 31, 2021, the Company sold 711,897 Class P-A shares, 56,416,202 Class P-I, 197,405 Class P-D, 237,124 Class P-T and 46,075,796 Class P-S shares under a private placement memorandum. During the year ended December 31, 2020, the Company sold 37,155 Class P-A shares and 16,112,855 Class P-I shares under a private placement memorandum. During the year ended December 31, 2019, the Company sold 2,631 Class P-A shares and 9,631,640 Class P-I shares under a private placement memorandum.
Issuer Purchases of Equity Securities
For the year ended December 31, 2021, the Company repurchased 661,926 Class A shares, 85,828 Class C shares, 296,575 Class I shares and 1,493,868 Class P-I shares at a total purchase price of $5,625,311, $706,382, $2,596,803 and $13,275,958, respectively, pursuant to the Company’s share repurchase program. For the year ended December 31, 2020, the Company repurchased 815,199 Class A shares, 66,086 Class C shares, 429,396 Class I shares and 651,619 Class P-I shares at a total purchase price of $7,019,041, $554,021, $3,696,134 and $5,869,806, respectively, pursuant to the Company’s share repurchase program. For the year ended December 31, 2019, the Company repurchased 558,579 Class A shares, 16,929 Class C shares, 185,871 Class I shares and 223,681 Class P-I shares at a total purchase price of $4,807,693, $142,110, $1,596,905 and $1,975,682, respectively, pursuant to the Company’s share repurchase program.
The table below provides information concerning the Company’s repurchase of shares during the years ended December 31, 2021, 2020 and 2019 pursuant to the Company’s share repurchase program.
| | | | | | | | | | | | | | | | | | | | |
| Period | | Total
Number of
Shares
Repurchased | | Average
Price Paid
per Share | | Maximum
Number of Repurchase
Shares
Offered |
| January 1 to March 31, 2021 | | 490,835 | | | $ | 8.76 | | | 1,742,360 | |
| April 1 to June 30, 2021 | | 734,959 | | | 8.81 | | | 3,309,562 | |
| July 1 to September 30, 2021 | | 452,514 | | | 8.60 | | | 5,126,281 | |
| October 1 to December 31, 2021 | | 859,889 | | | 8.76 | | | 5,990,988 | |
| Total - 2021 | | 2,538,197 | | $ | 8.75 | | | 16,169,191 | |
| | | | | | |
| January 1 to March 31, 2020 | | 214,035 | | | $ | 8.63 | | | 604,463 | |
| April 1 to June 30, 2020 | | 393,042 | | | 8.64 | | | 624,513 | |
| July 1 to September 30, 2020 | | 676,734 | | | 8.79 | | | 676,734 | |
| October 1 to December 31, 2020 | | 678,489 | | | 8.77 | | | 1,020,558 | |
| Total - 2020 | | 1,962,300 | | $ | 8.73 | | | 2,926,268 |
| | | | | | |
| January 1 to March 31, 2019 | | 141,933 | | | $ | 8.69 | | | 320,849 | |
| April 1 to June 30, 2019 | | 292,954 | | | 8.65 | | | 333,950 | |
| July 1 to September 30, 2019 | | 297,932 | | | 8.79 | | | 333,396 | |
| October 1 to December 31, 2019 | | 252,241 | | | 8.60 | | | 333,188 | |
| Total - 2019 | | 985,060 | | $ | 8.70 | | | 1,321,383 |
Commencing with the quarter ending September 30, 2021, we will limit repurchases (i) during any 12-month period, to 20% of our weighted average number of outstanding shares; and (ii) during any fiscal quarter, to 5.00% of the weighted average number of shares outstanding in the prior four fiscal quarters. For the fiscal quarters prior to the quarter ending September 30, 2021, the share repurchase limits are lower, ranging from 1.25% of the weighted average number of shares outstanding in the prior four fiscal quarters to 3.75% of the weighted average number of shares outstanding in the prior four fiscal quarters.
ITEM 6. SELECTED CONSOLIDATED FINANCIAL DATA
The following selected financial data of the Company as of December 31, 2021, 2020 and 2019 and for the years ended December 31, 2021, 2020 and 2019 are derived from our consolidated financial statements that have been audited by KPMG, our independent registered public accounting firm. This financial data should be read in conjunction with our consolidated financial statements and related notes thereto, and Item 7. Management’s Discussion and Analysis of Financial Condition and Results of Operations, included elsewhere in this report:
| | | | | | | | | | | | | | | | | | | | | | | | |
| | As of
December 31, 2021 | | As of
December 31,
2020 | | As of
December 31,
2019 | | | | |
| Statements of Assets and Liabilities data at period end | | | | | | | | | | |
| Investments in controlled/affiliated and non-controlled/non-affiliated portfolios, at fair value | $ | 1,368,349,558 | | | $ | 648,809,997 | | | $ | 475,175,871 | | | | | |
| Investments in money markets, at fair value | | 67,392,443 | | | 11,172,727 | | | 4,984,621 | | | | | |
| Swap contracts, at fair value | — | | | — | | | 21,223 | | | | | |
| Cash and cash equivalents | 92,179,779 | | | 4,675,836 | | | 3,652,218 | | | | | |
| Restricted cash | 29,683,613 | | | — | | | 429,252 | | | | | |
| Other assets | | 24,953,727 | | | 23,717,901 | | | 23,895,897 | | | | | |
| Total assets | | $ | 1,582,559,120 | | | $ | 688,376,461 | | | $ | 508,159,082 | | | | | |
| Swap contracts, at fair value | | 7,501,983 | | | 9,750,909 | | | 4,899,566 | | | | | |
| Payable for investments purchased | | 1,037,461 | | | 4,451,570 | | | 7,502,267 | | | | | |
| Term note payable, net of financing costs | | 79,413,622 | | | 86,501,654 | | | 68,886,785 | | | | | |
| Other liabilities | | 55,295,422 | | | 32,120,469 | | | 11,233,004 | | | | | |
| Total liabilities | | 143,248,488 | | | 132,824,602 | | | 92,521,622 | | | | | |
| Total members’ equity (net assets) | | $ | 1,439,310,632 | | | $ | 555,551,859 | | | $ | 415,637,460 | | | | | |
| | | | | | | | | | | | | | | | | | | | | | | | |
| | For the year
ended
December 31,
2021 | | For the year
ended
December 31,
2020 | | For the year
ended
December 31,
2019 | | | | |
| Statement of operations data | | | | | | | | | | |
| Total investment income | | $ | 32,551,137 | | | $ | 24,429,902 | | | $ | 18,762,705 | | | | | |
| Management fee expense | | 21,940,099 | | | 10,364,635 | | | 8,461,616 | | | | | |
| All other expenses | | 16,844,661 | | | 12,419,411 | | | 6,087,286 | | | | | |
| Net investment (loss) income before taxes | | (6,233,623) | | | 1,645,856 | | | 4,213,803 | | | | | |
| (Benefit from) income taxes | | (9,050,004) | | | (7,161,831) | | | (3,188,431) | | | | | |
| Franchise tax expense | | 160,572 | | | — | | | 125,143 | | | | | |
| Net investment income | | 2,655,809 | | | 8,807,687 | | | 7,277,091 | | | | | |
| Net realized (loss) gain on investments | | (29,182) | | | 7,830,550 | | | 12,915,738 | | | | | |
| Net change in unrealized appreciation on investments | | 56,023,470 | | | 51,377,370 | | | 27,296,880 | | | | | |
| Net change in unrealized appreciation on foreign currency translation | | 10,727 | | | 92,019 | | | 7,589 | | | | | |
| Net change in unrealized appreciation (depreciation) on swap contracts | | 2,248,926 | | | (4,872,567) | | | (5,002,305) | | | | | |
| (Provision for) income taxes on realized and unrealized gain (loss) on investments, foreign currency translation and swap contracts | | (17,888,961) | | | (18,529,344) | | | (10,461,973) | | | | | |
| Net increase in net assets resulting from operations | | $ | 43,020,789 | | | $ | 44,705,715 | | | $ | 32,033,020 | | | | | |
| Per share data (Basic and Diluted) (1) | | | | | | | | | | |
| Net asset value (Class A) | | $ | 8.32 | | | $ | 8.61 | | | $ | 8.40 | | | | | |
| Net asset value (Class C) | | $ | 8.13 | | | $ | 8.35 | | | $ | 8.23 | | | | | |
| Net asset value (Class I) | | $ | 8.32 | | | $ | 8.61 | | | $ | 8.40 | | | | | |
| Net asset value (Class P-A) | | $ | 8.58 | | | $ | 8.70 | | | $ | 8.44 | | | | | |
| Net asset value (Class P-I) | | $ | 8.80 | | | $ | 9.02 | | | $ | 8.73 | | | | | |
| Net asset value (Class P-D) | | $ | 8.80 | | | $ | — | | | $ | — | | | | | |
| Net asset value (Class P-S) | | $ | 8.74 | | | $ | — | | | $ | — | | | | | |
| Net asset value (Class P-T) | | $ | 8.52 | | | $ | — | | | $ | — | | | | | |
| Net investment income | | $ | 0.02 | | | $ | 0.16 | | | $ | 0.17 | | | | | |
| Net realized gain on investments | | $ | — | | | $ | 0.14 | | | $ | 0.29 | | | | | |
| | | | | | | | | | | | | | | | | | | | | | | | |
| Net change in unrealized appreciation on investments, net of incentive allocation to Special Unitholder | | $ | 0.46 | | | $ | 0.50 | | | $ | 0.15 | | | | | |
| (Provision for) income taxes on realized and unrealized (loss) on investments, foreign currency translation and swap contracts | | $ | (0.14) | | | $ | (0.34) | | | $ | (0.24) | | | | | |
| Net increase in net assets attributed to common members | | $ | 0.34 | | | $ | 0.81 | | | $ | 0.61 | | | | | |
| Distributions declared (Class A) | | $ | 0.56 | | | $ | 0.57 | | | $ | 0.61 | | | | | |
| Distributions declared (Class C) | | $ | 0.54 | | | $ | 0.56 | | | $ | 0.53 | | | | | |
| Distributions declared (Class I) | | $ | 0.56 | | | $ | 0.57 | | | $ | 0.61 | | | | | |
| Distributions declared (Class P-A) | | $ | 0.56 | | | $ | 0.57 | | | $ | 0.60 | | | | | |
| Distributions declared (Class P-I) | | $ | 0.58 | | | $ | 0.58 | | | $ | 0.58 | | | | | |
| Distributions declared (Class P-D) | | $ | 0.53 | | | $ | — | | | $ | — | | | | | |
| Distributions declared (Class P-S) | | $ | 0.53 | | | $ | — | | | $ | — | | | | | |
| Distributions declared (Class P-T) | | $ | 0.53 | | | $ | — | | | $ | — | | | | | |
| | | | | | | | | | |
| Other data | | | | | | | | | | |
| Weighted average common shares outstanding | | 126,458,860 | | | 54,057,620 | | | 43,788,187 | | | | | |
| Total return, net of expense reimbursement to/from Advisor, attributed to common shares based on net asset value (Class A) | | 3.29 | % | | 9.56 | % | | 7.30 | % | | | | |
| Total return, net of expense reimbursement to/from Advisor, attributed to common shares based on net asset value (Class C) | | 4.03 | % | | 8.49 | % | | 7.54 | % | | | | |
| Total return, net of expense reimbursement to/from Advisor, attributed to common shares based on net asset value (Class I) | | 3.29 | % | | 9.51 | % | | 7.17 | % | | | | |
| Total return, net of expense reimbursement to/from Advisor, attributed to common shares based on net asset value (Class P-A) | | 5.18 | % | | 10.12 | % | | 5.66 | % | | | | |
| Total return, net of expense reimbursement to/from Advisor, attributed to common shares based on net asset value (Class P-I) | | 4.13 | % | | 10.23 | % | | 8.15 | % | | | | |
| Total return, net of expense reimbursement to/from Advisor, attributed to common shares based on net asset value (Class P-D) | | 3.81 | % | | — | % | | — | % | | | | |
| Total return, net of expense reimbursement to/from Advisor, attributed to common shares based on net asset value (Class P-S) | | 4.98 | % | | — | % | | — | % | | | | |
| Total return, net of expense reimbursement to/from Advisor, attributed to common shares based on net asset value (Class P-T) | | 5.48 | % | | — | % | | — | % | | | | |
| Number of portfolio company investments at period end | | 14 | | | 13 | | | 15 | | | | | |
| Gross funding of new or existing investments | | $ | 1,113,729,511 | | | $ | 395,034,767 | | | $ | 353,585,860 | | | | | |
| Principal payments and sales of investments for the period | | $ | 9,928,720 | | | $ | 67,958,438 | | | $ | 64,254,366 | | | | | |
(1)The per share calculation for net asset value was based on shares outstanding. All other per share calculations were derived by using the weighted average shares outstanding.
ITEM 7. MANAGEMENT’S DISCUSSION AND ANALYSIS OF FINANCIAL CONDITION AND RESULTS OF OPERATIONS
Forward-Looking Statements
Various statements in this annual report, including those that express a belief, expectation or intention, as well as those that are not statements of historical fact, are forward-looking statements. The forward-looking statements may include projections and estimates concerning the timing and success of specific projects, revenues, income and capital spending. We generally identify forward-looking statements with the words “believe,” “intend,” “expect,” “seek,” “may,” “will,” “should,” “would,” “anticipate,” “could,” “estimate,” “plan,” “predict,” “project” or their negatives, and other similar expressions. All statements we make relating to our estimated and projected earnings, margins, costs, expenditures, cash flows, growth rates and financial results, or to our expectations regarding future industry trends, are forward-looking statements. These forward-looking statements are subject to risks and uncertainties that may change at any time, and, therefore, our actual results may differ materially from those that we expected. The forward-looking statements contained in this report are largely based on our expectations, which reflect many estimates and assumptions made by our management. These estimates and assumptions reflect our best judgment based on currently known market conditions and other factors. Although we believe such estimates and assumptions are reasonable, we caution that it is very difficult to predict the impact of known factors, and it is impossible for us to anticipate all factors that could affect our actual results. In addition, our Advisor’s assumptions about future events may prove to be inaccurate. We caution all readers that the forward-looking statements contained in this report are not guarantees of future performance, and we cannot assure any reader that such statements will prove correct or that the forward-looking events and circumstances will occur. Actual results may differ materially from those anticipated or implied in the forward-looking statements due to the numerous risks and uncertainties as described under “Risk Factors” and elsewhere in this report. All forward-looking statements are based upon information available to us on the date of this report. We undertake no obligation to update or revise any forward-looking statements as a result of new information, future events or otherwise, except as otherwise
required by law. You are advised to consult any additional disclosures that we may make directly to you or through reports that we in the future may file with the SEC, including Annual Reports on Form 10-K, Quarterly Reports on Form 10-Q and Current Reports on Form 8-K. These cautionary statements qualify all forward-looking statements attributable to us, or persons acting on our behalf. The risks, contingencies and uncertainties associated with our forward-looking statements relate to, among other matters, the following:
•changes in the economy;
•the ability to complete the renewable energy projects in which we invest;
•our relationships with project developers, lawyers, investment and commercial banks, individual and institutional investors, consultants, diligence specialists, EPC companies, contractors, renewable energy technology manufacturers (such as panel manufacturers), solar insurance specialists, component manufacturers, software providers and other industry participants in the renewable energy, capital markets and project finance sectors;
•fluctuations in supply, demand, prices and other conditions for electricity, other commodities and RECs;
•public response to and changes in the local, state and federal regulatory framework affecting renewable energy projects, including the potential expiration or extension of the production tax credit (“PTC”), investment tax credit (“ITC”) and the related U.S. Treasury grants and potential reductions in renewable portfolio standards (“RPS”) requirements;
•competition from other energy developers;
•the worldwide demand for electricity and the market for renewable energy;
•the ability or inability of conventional fossil fuel based generation technologies to meet the worldwide demand for electricity;
•our competitive position and our expectation regarding key competitive factors;
•risks associated with our hedging strategies;
•potential environmental liabilities and the cost of compliance with applicable environmental laws and regulations, which may be material;
•our electrical production projections (including assumptions of curtailment and facility availability) for our renewable energy projects;
•our ability to operate our business efficiently, manage costs (including general and administrative expenses) effectively and generate cash flow;
•availability of suitable renewable energy resources and other weather conditions that affect our electricity production;
•the effects of litigation, including administrative and other proceedings or investigations relating to our renewable energy projects;
•non-payment by customers and enforcement of certain contractual provisions;
•risks associated with possible disruption in our operations or the economy generally due to terrorism or natural disasters; and
•future changes in laws or regulations and conditions in our operating areas.
Overview
Greenbacker Renewable Energy Company LLC, (the “LLC”), a Delaware limited liability company formed in December 2012, is an externally managed energy company that acquires and manages income-generating renewable energy and energy efficiency projects, and other energy-related businesses, as well as finances the construction and/or operation of these and other
sustainable development projects and businesses. The LLC conducts substantially all of its operations through its wholly owned subsidiary, Greenbacker Renewable Energy Corporation (“GREC”).
GREC is a Maryland corporation formed in November 2011, and the LLC currently holds all of the outstanding shares of capital stock of GREC. GREC Entity HoldCo LLC (“GREC HoldCo”), a wholly owned subsidiary of GREC, was formed in Delaware in June 2016. GREC Administration LLC and Danforth Shared Services LLC, both wholly owned subsidiaries of GREC, were formed in Delaware in January 2020 and May 2019, respectively. The use of “we”, “us”, “our” and the “Company” refer, collectively, to the LLC, GREC, GREC HoldCo, GREC Administration LLC and Danforth Shared Services LLC. We are externally managed and advised by our Advisor, Greenbacker Capital Management LLC (the “Advisor” or “GCM”), a renewable energy, energy efficiency and sustainability-related project acquisition, consulting and development company that is registered as an investment advisor under the Investment Advisers Act of 1940, as amended (“Advisers Act”). The LLC’s fiscal year-end is December 31.
Our business objective is to generate attractive risk-adjusted returns for our members, consisting of both current income and long-term capital appreciation, by acquiring and financing the construction and/or operation of income-generating renewable energy, energy efficiency and sustainable development projects, primarily within North America. We expect the size of our investments to generally range between approximately $5 million and $100 million. We will seek to maximize our risk-adjusted returns by: (1) capitalizing on market opportunities; (2) focusing on hard assets that produce dependable cash flows; (3) efficiently utilizing government incentives where available; (4) employing creative deal structuring to optimize capital and ownership structures; (5) partnering with experienced financial, legal, engineering and other professional firms; (6) employing sound due diligence and risk mitigation processes; and (7) monitoring and managing our portfolio of assets on an ongoing basis. We may change our investment policies and strategies without prior notice or member approval.
Our goal is to assemble a diversified portfolio of renewable energy, energy efficiency and other sustainability-related projects and businesses. Renewable energy projects generally earn revenue through the sale of generated electricity as well as frequently through the sale of other commodities such as RECs and EECs. We initially have focused on solar, wind and energy efficiency projects. We believe solar energy projects generally offer more predictable power generation characteristics due to the relative predictability of sunlight over the course of time compared to other renewable energy technologies, and therefore we expect them to provide more stable income streams. However, technological advances in wind turbines and other energy-generation technologies, as well as government incentives, also make wind energy and other types of projects attractive. Solar energy projects provide maximum energy production during daylight hours in the summer months when days are longer and nights shorter. Solar energy projects tend to have minimal environmental impact, enabling such projects to be developed close to areas of dense population where electricity demand is highest. Solar technology is scalable and well-established, and it is relatively simple to integrate new acquisitions and projects into our portfolio.
Over time, we have broadened our strategy, and expect to continue to broaden our strategy to include other types of renewable energy projects and energy efficiency projects and businesses, which may include wind farms, hydropower assets, geothermal plants, biomass and biofuel assets, combined heat and power technology assets, fuel cell assets and other energy efficiency assets, among others, and to the extent we deem the opportunity attractive, other energy and sustainability-related assets and businesses.
Our preferred investment strategy is to acquire controlling equity stakes in our target assets or to be named the managing member of a limited liability company in order to oversee and supervise its operations. We define controlling equity stakes as companies in which we own 25% or more of the voting securities of such company, have greater than 50% representation on such company’s board of directors, or as the managing member of a limited liability company. However, we will also provide financing to projects owned by others, including through the provision of secured loans which may or may not include some form of equity participation.
We may also provide projects with senior unsecured debt, subordinated secured debt, subordinated unsecured debt, mezzanine debt, convertible debt, convertible preferred equity and preferred equity, and make minority equity investments. We may also participate in projects by acquiring contractual payment rights or rights to receive a proportional interest in the operating cash flow or net income of a project. We may also make equity investments in or loans to parties financing the supply of renewable energy and energy efficiency to residential and commercial customers or adopting strategies that encourage energy conservation to reduce the consumption of energy by those customers. Our ongoing strategy will be tailored to balance long-term cash flow certainty, which we can achieve through long-term agreements for our projects, with shorter-term arrangements that allow us to potentially generate higher risk-adjusted returns.
We expect to supplement our equity capital and increase potential returns to our members through the use of prudent levels of borrowings both at the corporate level and the project level. In addition to any corporate credit facility or other secured and unsecured borrowings, we expect to use other financing methods at the project level as necessary, including but not limited to
joint venture structures, construction loans, property mortgages, letters of credit, sale and leaseback transactions, other lease transactions and other arrangements, any of which may be unsecured or may be secured by mortgages or other interests in our assets. In addition, we may issue publicly or privately placed debt instruments. When appropriate, we will seek to replace short-term sources of capital with long-term financing.
During the year ended December 31, 2021, we either closed on the acquisition or contracted for the acquisition of 150 renewable energy projects: 145 solar and five wind assets. During the year ended December 31, 2021, we had one project disposal. Refer to the Portfolio and Investment Activity section for further discussion. As our access to capital has increased, the average size of our projects increased from 3.6 MW per project as of December 31, 2020, to 6.5 MW per project as of December 31, 2021.
Our renewable energy projects generate revenue primarily by selling (1) generated electric energy and/or capacity to local utilities and high-quality utility, municipal, corporate and individual residential counterparties; and (2) in some cases, RECs, EECs and other commodities associated with renewable generation or related incentives. We seek to acquire or finance projects that contain transmission infrastructures and access to power grids or networks that will enable the generated power to be sold. We generally expect our projects will have PPAs with one or more counterparties, including local utilities or other high-credit-quality counterparties, who agree to purchase the electricity generated from the project. We refer to these PPAs as “must-take contracts,” and we refer to these other counterparties as “offtakers.” These must-take contracts in general are output-based and guarantee that all electricity generated by each project will be purchased.
Although we intend to work primarily with high-credit-quality counterparties, if an offtaker cannot fulfill its contractual obligation to purchase the power, we generally can sell the power to the local utility or other suitable counterparty, which would potentially ensure that revenue is generated for all solar electricity generation. We may also generate revenue from the receipt of interest, fees, capital gains and distributions from investments in our target assets.
We employ a rigorous credit underwriting process for each of our contractual counterparties, including: (1) identification of high-credit-quality counterparties with appropriate bonding and insurance capacity; (2) where available, the review of counterparty financial statements and/or publicly available credit rating reports; (3) worst-case analysis testing of assets; (4) ongoing monitoring of acquired assets and counterparty creditworthiness, including monitoring the public credit ratings reports issued by Moody’s and Standard and Poor’s; and (5) reviewing individual FICO scores in regard to residential solar where the homeowner is the counterparty.
The following table illustrates the allocation by percentage of the Company’s contracted revenue by counterparty type and creditworthiness for the years ended December 31, 2021 and December 31, 2020.
| | | | | | | | | | | |
| For the
year ended
December 31,
2021 | | For the
year ended
December 31,
2020 |
| Investment grade | | | |
| Utility | 64.7 | % | | 64.9 | % |
| Municipality | 8.8 | % | | 8.6 | % |
| Corporation | 6.5 | % | | 1.0 | % |
| Subtotal investment grade | 80.0 | % | | 74.5 | % |
| | | |
| Non-investment grade or no rating | | | |
| Utility | 11.2 | % | | 16.1 | % |
| Municipality | 5.2 | % | | 4.7 | % |
| Residential | 0.1 | % | | — | % |
| Corporation | 3.5 | % | | 4.7 | % |
| Subtotal non-investment grade or no rating | 20.0 | % | | 25.5 | % |
| Total | 100.0 | % | | 100.0 | % |
Our PPAs, when structured with utilities and other large commercial users of electricity, are generally long-term in nature, tied to 100% of the output of the specific generating asset, and priced at a rate established pursuant to a formula set by the contract. The formula is often dependent upon the type of subsidies, if any, offered by the local and state governments for project development. Although we focus on projects with long-term contracts that ensure price certainty, we may also look for
projects with shorter-term arrangements that will allow us to participate in market rate changes, which may lead to higher current income.
A number of the PPAs for our projects are structured as “behind the meter” agreements with residential, commercial or government entities. Under the agreements, all electricity generated by a project will be purchased by the offtaker at an agreed-upon rate that may be set at a slight discount to the retail electric tariff rate for the offtaker. These agreements also typically provide for annual rate increases over the term of the agreement, although that is not a necessary requirement. The behind the meter agreement is generally long term in nature, and further typically provides that, should the offtaker fail to fulfill its contractual obligation, any electricity that is not purchased by the offtaker may be sold to the local utility, usually at an equivalent wholesale spot electric rate.
We have structured some of our previous investments in residential solar with similar commercial arrangements to those of the PPAs with utilities and other large commercial users of electricity of our energy projects, as described above.
We currently finance energy efficiency projects, which seek to enable residential customers, businesses and governmental organizations to consume less energy while at the same time providing the same or greater level of amenity. Financing for energy efficiency projects is generally used to pay for energy efficiency retrofits of buildings, homes and businesses, and replacement of other inefficient energy-consuming assets with more modern technologies. These projects are structured to provide predictable long-term cash flows by receiving a portion of the energy savings and the potential sale of associated RECs and EECs generated by such installations. In each of our renewable energy and energy efficiency investments, we intend, where appropriate, to maximize the benefits of renewable portfolio standards (“RPS”) as well as other U.S. federal, state and local government support and incentives for the renewable energy industry.
In October 2020, Greenbacker Development Opportunities Fund I, LP (“GDEV”) was launched to make private equity and development capital investments in the sustainable infrastructure industry. GREC’s investment in GDEV is synergistic with the Company’s core business, and it is expected to retain and strengthen existing developer relationships, increase the number of developer relationships within the Company going forward, generate incremental investment opportunities for the Company and give the Company insights into new markets and trends within the industry.
Financing Strategy
We expect to supplement our equity capital and increase potential returns to our members through the use of prudent levels of borrowings both at the corporate level and the project level. The LLC’s Fourth Amended and Restated Limited Liability Company Operating Agreement does not impose limitations on the amount of borrowings we may employ, either at the corporate level or the project level. We expect that we will generally target a leverage ratio of up to $2 of debt for every $1 of equity on our overall portfolio, with individual allocations of leverage based on the mix of asset types and obligors; however, we will in no event exceed a leverage ratio of $3 of debt for every $1 of equity, unless any excess is approved by a majority of our independent directors. In addition to any corporate-level credit facility or other secured and unsecured borrowings, we expect to use other financing methods at the project level as necessary, including joint venture structures, construction loans, property mortgages, letters of credit, sale and leaseback transactions, other lease transactions, and other arrangements, any of which may be unsecured or may be secured by mortgages or other interests in our assets. In addition, we may issue publicly or privately placed debt instruments. Our indebtedness may be recourse or non-recourse, and may be cross-collateralized. In addition, we may invest in assets subject to existing liens, or may refinance the indebtedness on assets acquired on a leveraged basis. We may use the proceeds from any borrowings to acquire assets, refinance existing indebtedness, finance investments, fund distributions or for general corporate purposes. In addition to these financing methods, we may utilize tax equity structures to monetize U.S. federal income tax attributes.
The table below sets forth the Company’s investments in alternative energy generation portfolios as of December 31, 2021.
| | | | | | | | | | | | | | | | | | | | | | | | | | | | | | | | | | | | | | | | | |
| Transaction Close Date | | Industry | | Location(s) | | Form of Investment*** | | Cost**/Principal
Amount* | | Assets | | Generation
Capacity in (MW)* |
| Pacifica Portfolio | Q2 2020 - Q3 2020 | | Battery Storage | | California | | 100% Ownership | | $ | 11,288,841 | | | Operating and to-be-constructed battery energy storage facilities | | 14.3 | |
| Eagle Valley Biomass Portfolio | Q2 2019 | | Biomass | | Colorado | | 100% Ownership | | $ | 24,533,222 | | | Operating biomass facility | | 12.0 | |
| Celadon Portfolio | Q1 2019 - Q4 2021 | | Commercial Solar | | California, Colorado, Washington D.C., Illinois, Massachusetts, Minnesota, Nevada, New Jersey, New York, North Carolina, Ohio, Pennsylvania, Utah, Vermont, Washington, and Wisconsin | | 100% Ownership or Managing Member, Equity Owner | | $ | 165,129,450 | | | Commercial ground, rooftop-mounted photovoltaic systems and carport system | | 175.0 |
| GEH Portfolio | Q1 2015 - Q2 2021 | | Commercial Solar | | Arizona, California, Colorado, Connecticut, Florida, Hawaii, Indiana, Massachusetts, Maryland, New Jersey, New York, North Carolina, Tennessee, and Vermont | | 100% Ownership or Managing Member, Equity Owner | | $ | 150,463,205 | | | Commercial and residential ground, rooftop-mounted solar photovoltaic systems and carport system | | 100.3 |
| Ponderosa Portfolio | Q4 2020 - Q3 2021**** | | Commercial Solar | | Michigan, Montana, South Dakota, and Wyoming | | 100% Ownership | | $ | 49,514,975 | | | Commercial ground and rooftop-mounted photovoltaic systems | | 267.3 |
| Sego Lily - Solar Portfolio | Q4 2020 - Q1 2021 | | Commercial Solar | | California and Utah | | 100% Ownership or Managing Member, Equity Owner | | $ | 107,621,275 | | | Commercial ground and rooftop-mounted photovoltaic systems | | 119.9 | |
| Trillium Portfolio | Q4 2018 - Q4 2020 | | Commercial Solar | | Arkansas, California, Colorado, Maryland, Massachusetts, New Jersey, Oregon, Pennsylvania, Vermont, and Washington D.C. | | Managing Member, Equity Owner | | $ | 74,764,309 | | | Commercial and residential ground, rooftop-mounted solar photovoltaic systems and carport system | | 84.7 | |
| Other Commercial Solar Portfolios | Q3 2014 - Q4 2021 | | Commercial Solar | | Ontario, Canada, California, Colorado, Illinois, Maine, Maryland, Massachusetts, Michigan, Minnesota, Nevada, New Jersey, New York, North Carolina, Rhode Island, South Dakota, and Vermont | | 100% Ownership or Managing Member, Equity Owner, or Equity Owner | | $ | 250,865,362 | | | Commercial and residential ground and rooftop-mounted solar photovoltaic systems | | 1,470.6 |
| Sego Lily - Wind Portfolio | Q1 2020 - Q2 2021 | | Wind | | California and Maine | | Managing Member, Equity Owner | | $ | 117,410,390 | | | Operating wind power facilities | | 72.8 |
| Greenbacker Wind Holdings II Portfolio | Q4 2015 - Q4 2020 | | Wind | | Iowa, Massachusetts, and Montana | | 100% Ownership or Managing Member, Equity Owner | | $ | 62,787,210 | | | Operating wind power facilities | | 90.0 | |
| Greenbacker Wind - HoldCo Portfolio | Q2 2017 - Q4 2019 | | Wind | | Idaho, Iowa, Minnesota, Vermont | | 100% Ownership | | $ | 84,674,188 | | | Operating wind power facilities | | 131.3 | |
| | | | | | | | | | | | | | | | | | | | | | | | | | | | | | | | | | | | | | | | | |
| Transaction Close Date | | Industry | | Location(s) | | Form of Investment*** | | Cost**/Principal
Amount* | | Assets | | Generation
Capacity in (MW)* |
| Other Wind Investments Portfolios | Q4 2017 - Q3 2021 | | Wind | | California, Minnesota, and New York | | 100% Ownership | | $ | 56,638,076 | | | Operating wind power facilities | | 92.0 | |
| Other Portfolios | Q4 2015 | | Other | | Delaware, North Carolina, and Vermont | | 100% Ownership or Equity Owner | | $ | 35,034,396 | | | Commercial ground and rooftop-mounted photovoltaic systems | | N/A |
| Other Energy Efficiency Portfolios | Q3 2015 - Q4 2015 | | Energy Efficiency | | Pennsylvania, Puerto Rico | | Secured Loan, Capital Lease | | $ | 668,736 | | | Energy efficiency LED lighting | | N/A |
| Chaberton Loan | Q3 2021 | | Secured Loan | | Maryland | | Secured Loan | | $ | 2,247,962 | | | Loan | | N/A |
| Encore Loan | Q4 2019 | | Secured Loan | | Vermont | | Secured Loan | | $ | 3,058,527 | | | Loan | | N/A |
| Hudson Loan | Q2 2019 | | Secured Loan | | New York | | Secured Loan | | $ | 4,984,650 | | | Loan | | N/A |
| Hudson II Loan | Q4 2019 | | Secured Loan | | New York | | Secured Loan | | $ | 4,227,098 | | | Loan | | N/A |
| New Market Loan | Q4 2019 | | Secured Loan | | North Carolina | | Secured Loan | | $ | 5,008,070 | | | Loan | | N/A |
| Shepherd's Run Loan | Q4 2020 | | Secured Loan | | New York | | Secured Loan | | $ | 8,751,528 | | | Loan | | N/A |
| SE Solar Loan | Q1 2019 | | Secured Loan | | North Carolina | | Secured Loan | | $ | 5,008,304 | | | Loan | | N/A |
| Allspring Treasury Plus Money Market Fund - Institutional Class | Q4 2021 | | Money Market Funds | | N/A | | Money Market Funds | | $ | 16,823,110 | | | Money Market Funds | | N/A |
| Fidelity Government Portfolio - Class I | Q1 2020 | | Money Market Funds | | N/A | | Money Market Funds | | $ | 16,873,111 | | | Money Market Funds | | N/A |
| First American Government Obligations Fund - Class X | Q2 2021 | | Money Market Funds | | N/A | | Money Market Funds | | $ | 16,823,111 | | | Money Market Funds | | N/A |
| First American Government Obligations Fund - Class Z | Q4 2021 | | Money Market Funds | | N/A | | Money Market Funds | | $ | 50,000 | | | Money Market Funds | | N/A |
| JPMorgan US Government Money Market Fund - Class L | Q1 2021 | | Money Market Funds | | N/A | | Money Market Funds | | $ | 16,823,111 | | | Money Market Funds | | N/A |
| Total | | | | | | | | | $ | 1,292,072,217 | | | | | 2,630.2 | |
* Approximate
** Does not include assumed project-level debt
*** 100% equity ownership (>50%), equity owner (<50%), managing member of the limited liability company, secured loan, money market funds or a capital lease
**** This portfolio includes assets with a transaction close date prior to the period in which they were transferred to the Ponderosa Portfolio
Of the total capacity of 2,630.2 MW, 1,062.6 MW is associated with operating assets and 1,567.6 MW is associated with pre-operational assets, including certain projects where we have contracted for the acquisition of the project pursuant to membership interest purchase agreements. Refer to the Portfolio and Investment Activity section for further discussion.
The investments described above have allowed us to execute on our strategy of constructing a portfolio of projects offering predictable power-generation characteristics and generally stable income streams, which include seasonal solar generation income (generally stronger in the summer months), wind generation income (generally stronger in the winter months), biomass generation income, battery storage income and energy efficiency lighting investments.
During the first quarter of 2021, the Company modified the presentation of the Consolidated Schedule of Investments to consolidate certain underlying portfolios. Certain portfolios that had been separately presented on the Consolidated Schedule of Investments have been aggregated with other portfolios in the same industry to be presented in a consolidated manner on the Consolidated Schedule of Investments. These consolidation efforts have no impact on the underlying portfolios or their individual cost or fair values but rather represent the aggregation of several similar investments. Certain portfolios, including
those determined to be individually significant, remain presented separately. Management believes that the consolidation of our portfolios results in a presentation that better reflects the way in which we view our overall portfolio of investments and will enhance the information reported to the users of our financial statements.
Management has recast the Schedule of Investments as of December 31, 2020 to conform with current year presentation based upon the methodology as outlined above.
The LLC conducts a significant portion of its operations through GREC, of which the LLC is the sole shareholder. We intend to continue to operate our business in a manner permitting us to not be required to register under the Investment Company Act of 1940, as amended (the “Investment Company Act”).
Pursuant to the now-terminated Registration Statement on Form S-1 (File No. 333-211571), we offered on a continuous basis up to $1,000,000,000 in shares of our limited liability company interests. The primary offering was terminated on March 29, 2019. The LLC's initial offering pursuant to a Registration Statement on Form S-1 (File No. 333-178786-01) terminated on February 7, 2017. As of June 4, 2019, pursuant to our Registration Statement on Form S-3D (File No. 333-231960) we were offering a maximum of $10,000,000 in shares to our existing shareholders pursuant to the DRP. As of November 30, 2020, pursuant to our Registration Statement on Form S-3D (File No. 333-251021), the LLC is offering up to an additional $20,000,000 in Class A, C and I shares to our existing shareholders pursuant to the DRP. Shares of the LLC's limited liability company interests issued pursuant to the DRP through the period ending September 30, 2020 were being offered at the price equal to the then current offering price per each class of shares less selling commissions and dealer manager fees. Effective October 1, 2020, DRP shares are being offered at a price equal to our Monthly Share Value for each class of our shares. As of February 1, 2021, the DRP was amended to include all of the LLC’s privately offered share classes.
Pursuant to private placement memoranda, the LLC was offering Class P-A, P-I, P-S, P-T, and P-D shares. After the finalization of the December 31, 2021 NAV and Monthly Share Value, the offering price of the Class P-A, P-I, P-S, P-T, and P-D shares was $9.32, $8.80, $8.86, $9.40 and $9.07 per share, respectively. To the extent that our Monthly Share Value per share per class on the most recent valuation date increases above or decreases below our prior Monthly Share Value per share per class, we will adjust the offering prices of each class of shares as appropriate.
As of December 31, 2021, through initial purchases of shares and participation in the DRP, our Advisor owned 23,601 Class A shares and through initial purchases of shares, our Advisor owned 2,776 Class P-D shares. As of December 31, 2020, through initial purchases of shares and participation in the DRP, our Advisor owned 23,601 Class A shares and nil Class P-D shares.
As of December 31, 2021, we had received subscriptions for and issued 172,189,009 of our shares (including shares issued under the DRP) for gross proceeds of $1,558,357,569 (before dealer manager fees of $4,578,174 and selling commissions of $14,601,378 for net proceeds of $1,539,178,017). As of December 31, 2020, we had received subscriptions for and issued 67,133,640 of our shares (including shares issued under the DRP) for gross proceeds of $617,098,806 (before dealer manager fees of $4,308,949 and selling commissions of $14,198,029 for net proceeds of $598,591,828).
General Market Overview for Alternative Energy Projects
The U.S. electric consumer expects a virtually error-free, consistent supply of sufficient electricity at all times for all purposes. The U.S. power industry, which includes energy generation and transmission, is structured to ensure a sufficient, constant supply of energy to all end users to meet varying demand requirements on a minute-by-minute basis. Historically, the mix of electricity supply was dependent largely on fossil fuels such as coal and natural gas, as well as nuclear and hydroelectric power. However, this is changing rapidly due to the rise of renewable energy. According to the U.S. Energy Information Administration (the “EIA”), renewable energy represented 20% of U.S. electricity generation in 2021, a percentage which they expect to more than double over the next two decades. Renewable energy is poised to gain even more market share over the decades to come, driven largely by several trends:
The decline of coal. The U.S. coal industry is rapidly declining in the face of lower-cost natural gas and renewable energy, and regulations designed to reduce greenhouse gas emissions and protect public health.
Falling price of renewables. The cost of renewable energy, particularly solar and wind, has fallen substantially over the past decade, making renewable energy the lowest-cost provider of new generation in many markets.
State mandates. State requirements to use more renewable energy sources have contributed to the historic growth of renewables, and are likely to drive further growth.
Federal support. Availability of government and other financial incentives for building new renewable capacity has supported the case for renewables when they were priced.
Environmental concerns. Reliance on fossil fuels has resulted in excessive production of harmful greenhouse gas emissions, which has been identified as one of the major causes of global climate change and numerous other environmental issues. This has led to growing support among the voting public for an energy transition based upon renewable energy.
The result of these and other factors is that renewable energy has gone from being a niche player in energy markets to being widely perceived as the present and future of energy generation in the United States.
We anticipate that these trends will accelerate the growth of renewable energy, particularly solar and wind for power generation and batteries for storage.
The U.S. Renewable Energy Industry Has Been a High-Growth Market
The market for renewable energy has grown rapidly over the past decade. According to Bloomberg New Energy Finance, worldwide investment in renewable generation topped $366 billion in 2021, a trend which is expected to continue.
The U.S. Renewable Energy Industry Is Expected to Be a High-Growth Market for Decades
We believe that demand for renewable energy will continue to grow as countries seek to reduce their dependence on outside sources of energy, and as the political and social climate continues to demand social responsibility on environmental matters.
In addition, supported in part by federal tax credits in the early part of the projection period, U.S. federal renewable fuel standards and state RPS, non-hydropower renewable generating capacity is expected to grow at a faster rate than fossil fuel capacity, according to the Renewable Energy Data Book. According to the EIA, renewable energy generation facilities are expected to more than double as a percentage of total electricity generation over the next two decades.
Capital Shortage in the Market
Limited conventional fuel supplies, growing demand for energy, advances in technology, continuing climate change and improving price competitiveness between traditional and renewable energy sources are expected to drive the continued growth of renewable energy for years to come, Bloomberg New Energy Finance reports. Notwithstanding this growing demand, we believe that there is currently a shortage of capital available to satisfy the demands of the renewable energy sector in the United States and around the world, particularly with respect to newly developed small and mid-size projects and businesses. In addition, much of the capital that is available is focused on larger projects that have long-term offtaker contracts in place and does not allow project owners to take any “merchant” or investment risk with respect to RECs. We believe many project developers are not finding, or are encountering delays in accessing capital for their projects. As a result, we believe a significant opportunity exists for us to provide new forms of capital to meet this demand. With our permanent capital structure, we are ideally suited for investments in long-term assets like renewable energy, energy efficiency and other sustainability-related projects.
Current Competition in the Alternative Energy — Solar Marketplace
The solar financing market started as a cottage industry where developers would bring together high-net-worth investors to fund single solar and wind transactions. Though successful in jump starting the industry, true capital formation is a relatively new phenomenon and is not as well developed as in other asset classes. Currently in the alternative energy — solar marketplace, there are several sources of capital:
•Developer/Owner Operators. The major competition we face in the market for the assets we target comes from privately backed developer/owner operators. The capital from these organizations has generally been sourced from a combination of family offices/private equity funds and hedge funds. These organizations are generally set up as developers, with investment return expectations in the 20-30% range.
However, to facilitate the most favorable exit for the sponsors, the developer/owner operators seek to accumulate a significant portfolio of operating assets to provide a base level of stable and predictable earnings for the enterprise. Through a combination of developer profits and leverage they can generate satisfactory ongoing returns, with the bulk
of the upside being generated for the sponsors through the exit. Particularly in circumstances where equity markets experience a downturn, we are of the opinion this group of buyers will ultimately be capital constrained.
•Single-Purpose Limited Partnerships. These entities are typically funded by high-net-worth individuals or family offices, and are generally focused on a small number of deals, as they have a limited amount of capital to invest.
•Utilities. These are funded by institutional investors, including large life insurance companies, pension funds and infrastructure funds. This sector dominates investment in the larger projects (e.g., $100,000,000 or greater). We tend not to encounter this group in the markets we target because scale is always an important consideration for larger institutions.
In management’s view, the Company has been competitive in bidding for solar assets against all these sources of capital and maintains a significant pipeline of deals which can be consummated as offering proceeds are raised.
Opportunities in Solar Power Today
We believe that the greatest opportunity exists within the Small Utility Scale, Commercial Solar and Community Solar segments of the market. In the Small Utility Scale market, the Company can buy assets with similar commercial attributes to the Large Utility Scale projects — investment-grade offtaker, same equipment and warranties, same operations and maintenance service provider — but where returns are higher.
We have also noted a growing trend among U.S. corporations to work with developers and financiers to provide renewable power for their operations. Driven by a desire to save money, create certainty around long-term electricity prices and support green marketing initiatives, the Commercial and Industrial (C&I) segment is rapidly becoming one of the most exciting parts of the renewable energy project market. These deals tend to be smaller than Utility Scale solar, which fits well with our strategy of focusing on the lower middle market segment of the industry.
A number of U.S. states have adopted programs that encourage the development of Community Solar projects, where groups of companies, municipalities and individuals can buy renewable power from solar and wind plants that are located within the customers' utility zone. While there are certain complexities associated with such projects, we are closely monitoring the rapid growth of this segment.
In our view, there is a significant opportunity to aggregate portfolios of high-quality Small Utility Scale, Commercial Solar and Community Solar projects working with experienced developers looking for a reliable and sustainable source of capital to increase the certainty of their closing transactions. As a result, we have been focusing on building relationships with respected developers with a view toward acquiring pipelines of projects rather than one-off deals.
By working closely with developers to efficiently close their transactions, we are seeking to create a sustainable competitive advantage which will lead to recurring and consistent deal flow. Importantly, our strategy is differentiated from the developer/owner operators mentioned above, because we do not seek to compete with the developers. Rather, we work with developers so that they can focus their activities on development while we focus on the financing and long-term ownership of their developments. This alignment of interests is mutually beneficial and symbiotic.
Current Competition in the Alternative Energy — Wind Marketplace
For the U.S. wind industry, 2021 was its strongest year to date with a record-high 17.1 GW of wind capacity coming online, according to the EIA. That growth is expected to continue, with the EIA reporting that another 7.6 GW of wind capacity is already scheduled for 2022.
Thus, current market conditions remain favorable for additional wind development through 2022. Particularly for smaller middle market transactions involving assets similar to those in our current portfolio, we believe that we will continue to be competitive in bidding for wind assets. We also believe that we may see opportunities to purchase operating wind assets which have run through their tax credits.
Opportunities in Wind Today
We believe that the middle market segment presents the best opportunities for investment. This sector faces less competition for assets than the large utility scale sector, which tends to be fully banked. Furthermore, we believe that targeted
investments in select wind opportunities provide us with increased diversification of cash flows stemming from the fact that wind assets tend to perform better in the winter months while solar tends to perform better in the summer months.
We believe that this countercyclical diversification is highly beneficial in managing our cash flows throughout the year. We also believe that we are well positioned to find investable assets in this sector, as we have acquired over 200 MW of wind assets over the past two years. These purchases have enabled us to build relationships with respected developers which we may be able to work with in the near future.
General Market Overview for Battery Storage
In 2021, corporate funding in the battery storage sector was up 159%, totaling $17 billion across 101 corporate funding deals, according to Mercom Capital. This was driven by falling costs, particularly in certain battery chemistries such as lithium-ion. According to a recent analysis by Lazard in its “Levelized Cost of Storage Analysis (LCOS 6.0),” storage costs have declined across most use cases and technologies, particularly for shorter-duration applications. In addition, long-duration storage has begun to gain traction as a commercially viable solution to challenges created by intermittent energy resources such as solar or wind.
Due to its potential for rapid growth, as well as new state mandates rapidly falling costs for both short-term and long-term storage, battery storage represents a large and growing investment opportunity, we believe, for the foreseeable future.
Factors Impacting Our Operating Results
The results of our operations are affected by a number of factors, and will primarily depend on, among other things, the supply of renewable energy assets in the marketplace; the revenues we receive from renewable energy and energy efficiency projects and businesses; the market price of electricity; the availability of government incentives; local, regional and national economies; general market conditions; and the amount of our assets that are operating versus those that are non-operating because they are currently under construction, including the cost to construct such assets. Additionally, our operations are impacted by interest rates and the cost of financing provided by other financial market participants. Many of the factors that affect our operating results are beyond our control.
Size of portfolio. The size of our portfolio of investments is a key revenue driver. Generally, as the size of our portfolio grows, the amount of income we receive will increase. In addition, our portfolio of investments may grow at an uneven pace, as opportunities to make investments in our target assets may be irregularly timed, and the timing and extent of GCM’s success in identifying such assets, and our success in acquiring such assets, cannot be predicted. Lastly, other than management fees, most of our expenses are of a fixed nature. Therefore, expenses as a percentage of net assets are reduced as the net assets of the Company increase.
Pre-operational and non-earning assets. The increasing amount of pre-operational and non-earning assets (defined as deposits and other cash investments not currently generating a material investment return) in our portfolio is a significant factor in our revenue and net asset value. The amount of cash invested in these pre-operational and non-earning assets reduces investment income until (1) the asset reaches its commercial operation date; or (2) otherwise begins generating an investment return and commences regular distributions to the Company. We believe these assets, once operational or income generating, will provide returns consistent with the Company’s investment strategy.
Credit risk. We encounter credit risk relating to: (1) counterparties to the electricity and environmental credit sales agreements (including PPAs) for our projects; (2) counterparties responsible for project construction and hedging arrangements; (3) companies in which we may invest; and (4) any potential debt financing we or our projects may obtain. We seek to mitigate credit risk by entering into contracts with high-quality counterparties. However, it is still possible that these counterparties may be unable to fulfill their contractual obligations to us.
If counterparties to the electricity sales agreements for our projects or the companies in which we invest are unable to make payments to us when due, or at all, our financial condition and results of operations could be materially adversely affected. While we seek to mitigate construction-related credit risk by entering into contracts with high-quality EPC companies with appropriate bonding and insurance capacity, if the EPCs to the construction agreements for our projects are unable to fulfill their contractual obligations to us, our financial condition and results of operation could be materially adversely affected. We seek to mitigate credit risk by deploying a comprehensive review and asset selection process, including worst-case analysis and careful ongoing monitoring of acquired assets, as well as mitigation of negative credit effects through back-up planning. Nevertheless, unanticipated credit losses may occur that could adversely impact our operating results.
Electricity prices. All our projects benefit from take-or-pay agreements, with terms structured to take 100% of the power output. On average, the contracts in our existing operating portfolio have approximately 16 years remaining prior to exposure to market prices. The credit standing of the contract counterparty is a particular focus in situations where the contracts have a price escalator. Escalating contracts create an incentive for the counterparty to not continue to perform if the contract pricing deviates materially from the market price. If the contract is with a public or investment-grade entity, we have generally been confident that the contract terms will be honored. The only exception might apply in situations where rising electricity prices could create pressure around a political change at the state or local level.
Due to the take-or-pay nature of the contracts, we believe that the Company is largely insulated from the daily volatility of electricity market prices. Nevertheless, we monitor these markets to stay abreast of developments in the industry as they occur. Over recent years, we have seen a lot of volatility in gas prices. However, that volatility has been slow to translate into movements in electricity prices.
Electricity pricing is a function of a range of factors. The price of gas is just one component. Electricity prices also include: (1) a recovery of the cost of the generation plant; (2) the labor to operate it; (3) the cost to transport the fuel to the plant; (4) the cost to wheel the power to the customer; and (5) the cost to administer the utility. Thus, gas price volatility has less impact on the delivered price of electricity than one might expect.
The U.S. Energy Information Agency of the Department of Energy anticipates that electricity prices will rise annually by between 2.5% and 3.0% nationally for the next 20 years (on a nominal basis). Assuming the price at which we sell the power under our contracts is set at a discount to the current electricity price, and the escalator (to the extent there is one) is less than 2.5% per annum, we expect the contracted price will remain close to, if not below, the market price of electricity throughout the entire term of the contract.
Changes in market interest rates. To the extent that we use debt financing with unhedged floating interest rates, or in the case of any refinancing, general increases in interest rates over time may cause the interest expense associated with our borrowings to increase. This would decrease the value of our debt investments. Conversely, general decreases in interest rates over time may cause the interest expense associated with our borrowings to decrease and the value of our debt investments to increase.
Market conditions. We believe that demand for alternative forms of energy from traditional fossil-fuel energy will continue to grow as countries seek to reduce their dependence on outside sources of energy and as the political and social climate continues to demand social responsibility on environmental matters. Notwithstanding this growing demand, particularly with respect to small and mid-size projects and businesses that are newly developed, we believe that a significant shortage of capital currently exists in the market to satisfy the demands of the renewable energy sector in the United States and around the world.
Many of the traditional sources of equity capital for the renewable energy marketplace were attracted to renewable energy projects based on their ability to utilize ITCs and tax deductions. We believe that due to changes in their taxable income profiles that have made these tax incentives less valuable, these traditional sources of equity capital have withdrawn from the market. In addition, much of the capital that is available is focused on larger projects that have long-term offtake contracts in place and does not allow project owners to take any “merchant” or investment risk with respect to RECs. We believe many project developers are not finding, or are encountering delays in accessing, capital for their projects. As a result, we believe a significant opportunity exists for us to provide new forms of capital to meet this demand.
Regulatory matters. Regulatory and tax policy at the federal and state levels tends to be forward looking rather than retrospective. As a result, we do not see many regulatory or tax issues impacting any assets we already own or buy during the operation of a particular regulatory or tax regime.
Future changes, which could impact the returns on future transactions, will be factored into our buying decisions. In the past, we have seen government policy drive a lot of development activity. For example, when the government announces the phasing out of a tax incentive, developers race to get projects to a stage that ensures the project qualifies for the incentive. Policy-driven activity is generally short lived, but can skew the investment supply and demand dynamic.
From the federal perspective, changes in tax and regulatory policy could negatively affect prospective returns. Federal tax incentives are comprised of MACRS depreciation and the ITC. MACRS results in accelerated depreciation of renewable assets over a 5.5-year period. Given the wide application of MACRS to other asset classes, we believe it is less susceptible to change than the ITC. The ITC is a tax incentive that allows an investor to take up to 30% of the installed cost of a solar system as a federal tax credit. This rule was extended at the end of 2015, and again in December 2020, with the credit amounts incrementally lowered over the next few years, from 26% in 2021 to 22% in 2023; to 10% in 2024 and beyond.
Other kinds of regulatory changes that could negatively impact returns include the introduction of some kind of value-added tax either at the federal or state level, changes to property tax regimes, or any kind of targeted tax on the income of renewable energy generation assets. None of these possible changes appear likely any time soon, but it is impossible to predict the future with any real certainty.
Generally, the policy changes that have occurred over the past decade at the U.S. Environmental Protection Agency and U.S. Department of Energy have been very positive for renewables: stronger emission regulations and other mandates improving the case for renewable energy assets. In addition, in 2018, the U.S. imposed tariffs on photovoltaic (“PV”) panels imported to the U.S., which could have an impact on overall U.S. demand.
The regulatory market for electric power is highly fragmented, with each state having significant influence over the functioning of its respective market. As the primary regulator for utilities, states have implemented widely divergent policies. For example, some states allow utilities to be vertically integrated—producers of power as well as operators of the grid. Other states have separated those functions entirely.
We believe that this market diversity is a benefit for our program. States have been highly adept at advancing programs designed to benefit renewable energy, with or without federal government support. There are currently 31 states and the District of Columbia that have developed a renewable portfolio standard. As a result, we see state regulatory issues as a shifting mosaic of opportunities where some markets will present opportunities while others become less attractive on a prospective basis.
COVID-19 Impact
In March of 2020, the United States declared a National Emergency concerning the COVID-19 outbreak. This came after the World Health Organization declared the virus a global pandemic on March 11, 2020.
Since the outbreak of COVID-19 in the United States, the Company has generally been able to conduct its business despite the turmoil in markets and the shuttering of many businesses across the country. We have and will continue to assess the current and future business risks related to COVID-19 as new information becomes available, including any potential performance risk of our PPA and construction counterparties. As of the date of the filing, we are not aware of any material impact to our financial results.
Critical Accounting Policies and Use of Estimates
The following discussion addresses the accounting policies utilized based on our current operations. Our most critical accounting policies involve decisions and assessments that affect our reported assets and liabilities, as well as our reported revenues and expenses. We believe that all the decisions and assessments upon which our consolidated financial statements are based were reasonable as of the time made and were based upon information available to us at that time. Our critical accounting policies and accounting estimates may be expanded over time as we continue to implement our business and operating strategy. The material accounting policies and estimates that are most critical to an investor’s understanding of our financial results and condition, as well as those that require complex judgment decisions by our management, are discussed below.
Basis of Presentation
Our consolidated financial statements are prepared in accordance with U.S. generally accepted accounting principles (“GAAP”), which requires the use of estimates, assumptions and the exercise of subjective judgment as to future uncertainties.
Although we are organized and intend to conduct our business in a manner so that we are not required to register as an investment company under the Investment Company Act, the Company’s consolidated financial statements are prepared using the specialized accounting principles of Accounting Standards Codification Topic 946, Financial Services—Investment Companies (“ASC Topic 946”). In accordance with this specialized accounting guidance, the Company recognizes and carries all its investments, including investments in the underlying operating entities, at fair value with changes in fair value recognized in earnings. Additionally, the Company will not apply the equity method of accounting to its investments. The Company carries its liabilities at amounts payable, net of unamortized premiums or discounts. The Company does not currently plan to elect to carry its non-investment liabilities at fair value. Net assets are calculated as the carrying amounts of assets, including the fair value of investments, less the carrying amounts of its liabilities.
Basis of Consolidation
As provided under Regulation S-X and ASC Topic 946, the Company will generally not consolidate its investment in a company other than a wholly owned investment company or controlled operating company whose business consists of providing services to the Company. Accordingly, the Company consolidates in its consolidated financial statements the accounts of certain wholly owned subsidiaries that meet the criteria. All significant intercompany balances and transactions have been eliminated in consolidation.
Investment Classification
We classify our investments by level of control. “Control Investments” are investments in companies in which we own 25% or more of the voting securities of such company, have greater than 50% representation on such company’s board of directors, or that are limited liability companies for which we are the managing member. “Affiliate Investments” are investments in companies in which we own 5% or more, and less than 25% of the voting securities of such company. “Non-Control/Non-Affiliate Investments” are investments that are neither Control Investments nor Affiliate Investments. Because our consolidated financial statements are prepared in accordance with ASC Topic 946, we do not consolidate companies in which we have Control Investments, nor do we apply the equity method of accounting to our Control Investments or Affiliate Investments.
Valuation of Investments
Our Advisor, in conjunction with an independent valuation firm when necessary, subject to the review and approval of the Board of Directors, is ultimately responsible for the determination, in good faith, of the fair value of investments. In that regard, the Advisor has established policies and procedures, which have been reviewed and approved by our Board of Directors, to estimate the fair value of our investments, which are detailed below. Any changes to these policies and procedures are required to be approved by our Board of Directors, including a majority of our independent directors.
Investments for which market quotations are readily available are valued at such market quotations.
For most of our investments, market quotations will not be available. With respect to investments for which market quotations are not readily available, our Board of Directors has approved a multi-step valuation process each fiscal quarter, as described below:
1.Each investment will be valued by GCM. As part of the valuation process, GCM will prepare the valuations and associated supporting materials for review and approval by the Board of Directors.
2.Our Board of Directors has approved the selection of an independent valuation firm to assist with the review of the valuations prepared by GCM. At the direction of our Board of Directors, the independent valuation firm will review valuations prepared by GCM for the appropriate application of its valuation policies and the appropriateness of significant inputs used in the valuation models by performing certain limited procedures, which will include a review of GCM’s estimates of fair value for each investment, and providing an opinion that GCM’s estimate of fair value for each investment is reasonable. The independent valuation firm may also provide direct assistance to GCM in preparing fair value estimates if the Board of Directors approves such assistance. In the event that the independent valuation firm is directly involved in preparing the fair value estimate, our Board of Directors has the authority to hire a separate valuation firm to review that opinion of value.
3.The Audit Committee of our Board of Directors reviews and discusses the preliminary valuation prepared by GCM and the report of the independent valuation firm, if any.
4.Our Board of Directors reviews the valuations and approves the fair value of each investment in our portfolio in good faith based on input of GCM, the independent valuation firm, if any, and the Audit Committee.
Loan investments are valued utilizing a market approach, an income approach, or both approaches, as appropriate. The market approach uses prices and other relevant information generated by market transactions involving identical or comparable assets or liabilities. The income approach uses valuation techniques to convert future amounts (for example, interest and amortization payments) to a single present value amount (discounted) calculated based on an appropriate discount rate. The measurement is based on the net present value using current market expectations about those future amounts. In following these approaches, the types of factors that we may take into account in determining the fair value of our loans include as applicable: debt covenants, call protection provisions, information rights, the nature and realizable value of any collateral, the project’s ability to make payments, its earnings and discounted cash flows, the markets in which the project does business, comparisons
of financial ratios of peer business entities that are public, mergers and acquisitions comparables and the principal market and enterprise values, among other factors.
Equity investments are also valued using a market approach, an income approach, or both approaches, as appropriate. The market approach uses prices and other relevant information generated by market transactions involving identical or comparable assets or liabilities. The income approach uses valuation techniques to convert future amounts (for example net cash flows or earnings) to a single present value amount (discounted) calculated based on an appropriate discount rate. The measurement is based on the net present value using current market expectations about those future amounts.
In following these approaches, the types of factors that we may take into account in determining the fair value of our equity investments include, as applicable: available current market data, including relevant and applicable market trading and transaction comparables, applicable market yields and multiples, security covenants, the project’s earnings and discounted cash flows, the markets in which the project does business, comparisons of financial ratios of peer business entities that are public, mergers and acquisitions comparables, the principal market and enterprise values, among other factors.
OTC derivatives including swap contracts are valued daily using observable inputs, such as quotations provided by an independent pricing service, the counterparty and broker dealers, whenever available and considered reliable.
We have adopted Accounting Standards Codification Topic 820, Fair Value Measurement (“ASC Topic 820”), which defines fair value, establishes a framework for measuring fair value in accordance with GAAP, and expands disclosures about fair value measurements.
ASC Topic 820 clarifies that the fair value price is the price in an orderly transaction between market participants to sell an asset or transfer a liability in the market in which the reporting entity would transact for the asset or liability; that is, the principal or most advantageous market for the asset or liability. The transaction to sell the asset or transfer the liability is a hypothetical transaction at the measurement date, considered from the perspective of a market participant that holds the asset or owes the liability. ASC Topic 820 provides a consistent definition of fair value that focuses on exit price and prioritizes, within a measurement of fair value, the use of market-based inputs over entity-specific inputs. In addition, ASC Topic 820 provides a framework for measuring fair value and establishes a three-level hierarchy for fair value measurements based upon the transparency of inputs to the valuation of an asset or liability as of the measurement date. The three levels of valuation hierarchy established by ASC Topic 820 are defined as follows:
Level 1: Unadjusted quoted prices for identical assets or liabilities in active markets.
Level 2: Other significant observable inputs that are sourced either directly or indirectly from publications or pricing services, including dealer or broker markets, for identical or comparable assets or liabilities. Generally, these inputs should be widely accepted and public, non-proprietary and sourced from an independent third party.
Level 3: Inputs derived from a significant amount of unobservable market data and derived primarily through the use of internal valuation methodologies.
In all cases, the level in the fair value hierarchy within which the fair value measurement in its entirety falls will be determined based on the lowest level of input that is significant to the fair value measurement. Our assessment of the significance of a particular input to the fair value measurement in its entirety requires judgement and considers factors specific to each investment.
Our Board of Directors has approved the selection of an independent valuation firm to review our Advisor’s valuation methodology and to work with our Advisor and officers to provide additional inputs for consideration by our Audit Committee and to work directly with our full Board of Directors, at the Board of Directors’ request, with respect to the fair value of investments. For example, our Board of Directors may determine to engage more than one independent valuation firm in circumstances in which specific expertise of a particular asset or asset class is needed in connection with the valuation of an investment. In addition, GCM will recommend to our Board of Directors that one quarter of our investments be valued by an independent valuation firm each quarter, on a rotating quarterly basis. Accordingly, each such investment would be reviewed by an independent valuation firm at least once per year.
Our Board of Directors will have the ability to review our Advisor’s valuation methodologies each quarter in connection with GCM’s presentation of its valuation recommendations to the Audit Committee. If during the period between quarterly board meetings, GCM determines that significant changes have occurred since the prior meeting of the Board of Directors at which it presented its recommendations on the valuation methodology, then GCM will also prepare and present
recommendations to the Audit Committee of the Board of Directors of its proposed changes to the current valuation methodology. Any such changes to our valuation methodologies will require the approval of our Board of Directors, including a majority of our independent directors. We will disclose any change in our valuation methodologies, or any change in our investment criteria or strategies, that would constitute a fundamental change in a registration statement amendment prior to its implementation.
Foreign Currency Translation
The accounting records of the Company are maintained in U.S. Dollars. The fair value of investments and other assets and liabilities denominated in non-U.S. currencies are translated into U.S. Dollars using the exchange rate at the end of each reporting period. Amounts related to the purchases and sales of investments, investment income and expenses are translated at the rates of exchange prevailing on the respective dates of such transactions.
Net unrealized currency gains and losses arising from valuing foreign currency-denominated assets and liabilities at the current exchange rate are reflected as part of Net change in unrealized appreciation (depreciation) on Foreign currency translation in the Consolidated Statements of Operations.
Foreign security and currency translations may involve certain considerations and risks not typically associated with investing in U.S. companies and U.S. government securities. These risks include, but are not limited to, currency fluctuations and revaluations and future adverse political, social and economic developments, which could cause investments in foreign markets to be less liquid and prices to be more volatile than those of comparable U.S. companies or U.S. government securities.
Calculation of Net Asset Value
Net asset value by share class is calculated by subtracting total liabilities for each class from the total carrying amount of all assets for that class, which includes the fair value of investments. Net asset value per share is calculated by dividing net asset value for each class by the total number of outstanding common shares for that class on the reporting date. For purposes of calculating our NAV, we expect to carry all liabilities at cost.
The determination of the fair value of our investments requires judgment, especially with respect to investments for which market quotations are not available. For most of our investments, market quotations will not be available. Due to the inherent uncertainty of determining the fair value of investments that do not have a readily available market value, the fair value of the investments may differ significantly from the values that would have been used had a readily available market value existed for such investments, and the differences could be material. Because the calculation of our NAV is based, in part, on the fair value of our investments as determined by our Advisor, which is an affiliated entity of the Company, our calculation of NAV is to a degree subjective and could be adversely affected if the determinations regarding the fair value of our investments were materially higher than the values that we ultimately realize upon the disposal of such investments. Furthermore, the fair value of our investments, as reviewed and approved by our Board of Directors, may be materially different from the valuation as determined by an independent valuation firm.
Revenue Recognition
To the extent the Company expects to collect such amounts, interest income is recorded on an accrual basis. If there is reason to doubt an ability to collect such interest, interest receivable on loans and debt securities is not accrued for accounting purposes. Original issue discounts, market discounts or market premiums are accreted or amortized using the effective interest method as interest income. Prepayment premiums on loans and debt securities are recorded as interest income when received. Any application, origination or other fees earned by the Company in arranging or issuing debt are amortized over the expected term of the loan.
Loans are placed on non-accrual status when principal and interest are 90 days or more past due, or when there is a reasonable doubt that principal or interest will be collected. Accrued interest is generally reversed when a loan is placed on non-accrual. Interest payments received on non-accrual loans may be recognized as income or applied to principal depending upon management’s judgment regarding collectability. Non-accrual loans are generally restored to accrual status when past due and principal and interest is paid and, in management’s judgment, is likely to remain current.
Dividend income is recorded when dividends are declared and when it is determined that collection is probable. The timing and amount of dividend income is determined on at least a quarterly basis. This process includes an analysis at the individual project company level based on cash available from operations and working capital needed for the project company operations. Dividend income from our privately held equity investments is recognized when approved. On a quarterly basis at a minimum,
dividends received from the Company’s project companies, which generally reflect net cash flow from operations, are declared, accrued and paid.
Net Realized Gains or Losses and Net Change in Unrealized Appreciation or Depreciation on Investments
Without regard to unrealized appreciation or depreciation previously recognized, realized gains or losses will be measured as the difference between the net proceeds from the sale, repayment, or disposal of an asset and the adjusted cost basis of the asset. Net change in unrealized appreciation or depreciation will reflect the change in investment values during the reporting period, including any reversal of previously recorded unrealized appreciation or depreciation when gains or losses are realized.
Organization Costs
Organization costs are expensed on the Company’s Consolidated Statements of Operations as incurred.
Offering Costs
Offering costs include all costs to be paid by the Company in connection with the offering of its shares, including legal, accounting, printing, mailing and filing fees, charges of the Company’s escrow holder, transfer agent fees, due diligence expense reimbursements to participating broker dealers included in detailed and itemized invoices, and costs in connection with administrative oversight of the offering and marketing process, preparing supplemental sales materials, holding educational conferences, attending retail seminars conducted by broker dealers, finder's and other fees paid to third parties and sales commissions paid to registered representatives of our managing broker dealer. When recognized by the Company, offering costs will be recognized as a reduction of the proceeds from the offering.
Deferred Sales Commissions
The Company defers certain costs, principally sales commissions and related compensation, which are paid to the dealer manager and may be reallowed to financial advisors and broker dealers in the future in connection with the sale of shares sold with a reduced front-end-load sales charge and a trail fee. The costs expected to be incurred at the time of the sale of the Class C shares are recorded as a liability on the date of sale and represent the aggregate amount due for such costs over the period beginning at the time of sale and ending on the earlier date of (1) when the maximum amount of sales commission and related compensation is reached under regulatory regulations; (2) the date which approximates an expected liquidity event for the Company; or (3) the expected holding period of the investment. The costs expected to be incurred at the time of the sale of the Class P-T and Class P-S shares are recorded as a liability on the date of sale and represent the aggregate amount due for such costs over the period beginning at the time of sale and ending on the earlier date of (1) the date which approximates an expected liquidity event for the Company; or (2) the expected holding period of the investment. The estimated amount of the liability can be updated as management's assumption surrounding an expected liquidity event changes or if the maximum of sales-related commissions and costs under regulatory regulations is attained. As of December 31, 2021, and December 31, 2020, the Company recorded a liability for deferred sales commissions in the amount of $4,626,626 and $131,875, respectively.
Financing Costs
Financing costs related to debt liabilities of the LLC, GREC or GREC HoldCo are presented on the Consolidated Statements of Assets and Liabilities as a direct deduction from the carrying amount of that debt liability. Financing costs are deferred and amortized using the straight-line method over the life of the debt liability.
Recently Issued Accounting Pronouncements
In August 2018, the Financial Accounting Standards Board (FASB) issued ASU No. 2018-13, “Fair Value Measurement (Topic 820): Disclosure Framework—Changes to the Disclosure Requirements for Fair Value Measurement,” which modifies the disclosure requirements on fair value measurements. The new guidance is effective for fiscal years, and interim periods within those fiscal years, beginning after December 15, 2019 (fiscal 2020 for the Company). Upon the effective date, certain provisions are to be applied prospectively, while others are to be applied retrospectively to all periods presented. An entity is permitted to early adopt any removed or modified disclosures upon issuance of this ASU and delay adoption of the additional disclosures until their effective date. Beginning on January 1, 2020, we have adopted ASU 2018-13 in our consolidated financial statements and disclosures.
In March 2020, the FASB issued ASU 2020-04, "Reference Rate Reform (Topic 848): Facilitation of the effects of Reference Rate Reform on Financial Reporting," which provides companies with optional financial reporting alternatives to
reduce the cost and complexity associated with the accounting for contracts and hedging relationships affected by reference rate reform. The amendments in this update are effective for all entities as of March 12, 2020 through December 31, 2022. An entity may elect to apply the amendments for contract as of any date from the beginning of an interim period that includes or is subsequent to March 12, 2020. As of December 31, 2021, we have not elected to apply the optional amendments and are currently evaluating the impact of the ASU and the effect on our consolidated financial statements.
JOBS Act
We qualify as an “emerging growth company” pursuant to the provisions of the JOBS Act, enacted on April 5, 2012. For as long as we are an “emerging growth company,” we may take advantage of certain exemptions from various reporting requirements that are applicable to other public companies that are not “emerging growth companies,” including, but not limited to, not being required to comply with the auditor attestation requirements of Section 404(b) of the Sarbanes-Oxley Act, reduced disclosure obligations regarding executive compensation in our periodic reports and proxy statements, and exemptions from the requirements of holding advisory “say-on-pay” votes on executive compensation and shareholder advisory votes on golden parachute compensation.
Under the JOBS Act, we will remain an “emerging growth company” until the earliest of:
•the last day of the fiscal year during which we have total annual gross revenues of $1 billion or more;
•the last day of the fiscal year following the fifth anniversary of the completion of our offering;
•the date on which we have, during the previous three-year period, issued more than $1 billion in non-convertible debt; and
•the date on which we are deemed to be a “large accelerated filer” under the Securities Exchange Act of 1934, as amended (the “Exchange Act”). We will qualify as a large accelerated filer as of the first day of the first fiscal year after we have (i) more than $700,000,000 in outstanding common equity held by our non-affiliates as of the last day of our most recently completed second fiscal quarter; (ii) been a public company for at least 12 months; and (iii) filed at least one annual report with the SEC. The value of our outstanding common equity will be measured each year on the last day of our second fiscal quarter.
The JOBS Act also provides that an “emerging growth company” can utilize the extended transition period provided in Section 7(a)(2)(B) of the Securities Act for complying with new or revised accounting standards. However, we are choosing to opt out of that extended transition period, and, as a result, we will comply with new or revised accounting standards on the relevant dates on which adoption of such standards is required for companies that are not “emerging growth companies.” Section 107 of the JOBS Act provides that our decision to opt out of the extended transition period for complying with new or revised accounting standards is irrevocable.
Amendments to the Operating Agreement Related to Incentive Allocations
On August 25, 2020, the LLC made certain amendments to the Operating Agreement to remove the provisions therein related to the Income Incentive Distribution and the Capital Gains Incentive Distribution, in each case allocable to the Special Unitholder under certain circumstances, and to replace them with provisions for a performance participation fee (the “Performance Participation Fee”) based on the periodic total return generated by the LLC, payable under certain circumstances by the LLC to the Special Unitholder. This was approved by the LLC's shareholders and was applied retroactively on April 1, 2020 and for all periods thereafter. The Liquidation Incentive Distribution provision in the Operating Agreement was correspondingly amended to reflect that the Liquidation Incentive Distribution will be calculated based on the difference between the LLC's net proceeds from a liquidation or listing of our shares (in either case, as calculated in accordance with the Operating Agreement) and the LLC's NAV immediately prior to the time of such liquidation or listing.
Portfolio and Investment Activity
As of December 31, 2021, the Company invested in numerous solar, wind, battery storage, biomass and energy efficiency projects included in 14 investment portfolios, as well as seven secured loans, as follows:
Battery Storage
Pacifica Portfolio
This portfolio consists of operating and pre-operating battery storage facilities totaling approximately 14.3 MW, located in California. Of the total, approximately 7.8 MW is associated with pre-operating battery storage facilities which are expected to reach COD during 2022. For all facilities within this portfolio, power is either sold or will be sold to municipal or commercial offtakers for a 10 year term.
Biomass
Eagle Valley Biomass Portfolio
This portfolio consists of an operating biomass facility approximating 12.0 MW, located in Colorado. The system sells power to the local utility under a PPA arrangement with a 20 year term.
Commercial Solar
Celadon Portfolio
This portfolio consists of operating and pre-operating solar power facilities totaling approximately 175.0 MW, located across California, Colorado, Washington D.C., Illinois, Massachusetts, Minnesota, Nevada, New Jersey, New York, North Carolina, Ohio, Pennsylvania, Utah, Vermont, Washington, and Wisconsin. Of the total, approximately 104.4 MW is associated with pre-operating solar power facilities which are expected to reach COD over the period ending in 2023. For all facilities within this portfolio, power is either sold or will be sold through PPA contracts that range from nine to 30 years. During the year ended December 31, 2021, 47 projects comprising 101.8 MW of the total for the portfolio were transferred from the Trillium Portfolio and Other Commercial Solar Portfolios.
GEH Portfolio
This portfolio consists of operating and pre-operating solar power facilities totaling approximately 100.3 MW, located across Arizona, California, Colorado, Connecticut, Florida, Hawaii, Indiana, Massachusetts, Maryland, New Jersey, New York, North Carolina, Tennessee, and Vermont. The systems sell power under PPA arrangements ranging from 14 to 25 years. Certain systems also sell RECs and SRECs to the local utilities. Certain of the facilities, representing 8.4 MW of the total for the portfolio, represents leased operating solar power facilities. During the remaining term of the lease, which is approximately nine years, there is the potential for the Company to purchase these assets directly upon the agreement and consent of the parties.
Ponderosa Portfolio
This portfolio consists of pre-operating solar power facilities totaling approximately 267.3 MW, located across Michigan, Montana, South Dakota, and Wyoming. These pre-operating solar power facilities are expected to reach COD over the period ending in 2023. For all facilities within this portfolio, power will be sold through PPA contracts that range from 15 to 25 years.
Sego Lily - Solar Portfolio
This portfolio consists of operating and pre-operating solar power facilities totaling approximately 119.9 MW, located across California and Utah. Of the total, approximately 104.0 MW is associated with pre-operating solar power facilities which are expected to reach COD during 2022. For all facilities within this portfolio, power is either sold or will be sold through PPA contracts that range from 15 to 20 years.
Trillium Portfolio
This portfolio consists of operating solar power facilities totaling approximately 84.7 MW, located across Arkansas, California, Colorado, Maryland, Massachusetts, New Jersey, Oregon, Pennsylvania, Vermont, and Washington D.C. These projects consist primarily of commercial ground and rooftop-mounted photovoltaic systems. The systems primarily sell power to various commercial, municipal, residential and utility offtakers under long-term PPAs that range from five to 28 years.
Other Commercial Solar Portfolios
This portfolio consists of operating and pre-operating solar power facilities totaling approximately 1,470.6 MW, located in Ontario, Canada, California, Colorado, Illinois, Maine, Maryland, Massachusetts, Michigan, Minnesota, Nevada, New Jersey, New York, North Carolina, Rhode Island, South Dakota, and Vermont. Of the total, approximately 1,083.8 MW is associated with pre-operating solar power facilities which are expected to reach COD over the period ending in 2024. For all facilities
within this portfolio, power is either sold or will be sold through long-term PPAs. During the year ended December 31, 2021, 98 assets comprising 1,035.4 MW were acquired. Included within that amount for the year ended December 31, 2021, the Company contracted to acquire a 617.5 MW pre-operating solar facility.
Wind
Sego Lily - Wind Portfolio
This portfolio consists of operating wind power facilities totaling approximately 72.8 MW, located in California and Maine. During the year ended December 31, 2021, one asset comprising 15.3 MW of the total for the portfolio was transferred from the Greenbacker Wind Holdings II Portfolio. The systems sell power under PPA arrangements with a 20 year term.
Greenbacker Wind Holdings II Portfolio
This portfolio consists of operating wind power facilities totaling approximately 90.0 MW, located in Iowa, Massachusetts, and Montana. These systems primarily sell power to various municipal and utility offtakers under long-term PPAs. Certain systems also sell RECs to the local utilities. During the year ended December 31, 2021, one asset comprising 5.0 MW of the total for the portfolio was transferred from the Other Wind Investments Portfolios.
Greenbacker Wind - HoldCo Portfolio ("GB Wind HoldCo")
This portfolio consists of operating wind power facilities totaling approximately 131.3 MW, located in Idaho, Iowa, Minnesota, Vermont. The systems sell power under PPA arrangements ranging from 20 to 25 years. Certain systems also sell RECs to the local utilities.
Other Wind Investments Portfolios
This portfolio consists of operating wind power facilities totaling approximately 92.0 MW, located in California, Minnesota, and New York. For all facilities within this portfolio, power is either sold or will be sold through long-term PPAs. During the year ended December 31, 2021, three assets comprising 86.1 MW of the total for the portfolio were added.
Other Portfolios
This portfolio consists of acquisition costs related to energy projects being acquired in Delaware, North Carolina, and Vermont. Additionally, the Company has invested capital to acquire and safe harbor panels that will be used in the construction of various pipeline projects.
In addition, on October 9, 2020, GREC made a $5,000,000 limited partner (“LP”) commitment to Greenbacker Development Opportunities Fund I, LP (“GDEV”), which was increased to $6,075,000 in the fourth quarter of 2020. In April 2021, the commitment to GDEV increased to $7,500,000. As of December 31, 2021, $7,242,495 of the commitment was funded—the fair value of this investment was $7,580,119.
GDEV is an affiliate of GREC, as GDEV possesses the same investment advisor as GREC. The agreement between GDEV and GREC was negotiated at an arm’s length and contains standard terms and conditions that would be included in a third-party limited partnership agreement. However, as part of the agreement between GDEV and GREC, GREC was issued a membership interest in Greenbacker Development Opportunities GP I, LLC (“GDEV GP”), the general partner which provides for a 10% allocation of GDEV GP's carried interest in GDEV.
Other Energy Efficiency Portfolios
This portfolio consists of capital leases and secured loans, including loans to the related parties LED Funding LLC and Renew AEC One LLC (the “AEC Companies”).
Secured Loans
Chaberton Loan
In September 2021, the Company entered into a short-term secured loan agreement with Chaberton Acquisition Holdings LLC. The loan bears an interest rate of 8% and matures on September 30, 2022.
Encore Loan
In October 2019, the Company entered into a short-term secured loan agreement with Encore Equipment, LLC. The loan bears an interest rate of 10% and matures on January 31, 2022. On March 23, 2022, the maturity date was amended to April 30, 2022 in the Eleventh Amendment to the Loan and Security Agreement.
Hudson Loan
In June 2019, the Company entered into a short-term secured loan agreement with Hecate Energy New York Holdings LLC. The loan bears an interest rate of 8% and matures on January 31, 2022. The loan was repaid in full as of February 15, 2022.
Hudson II Loan
In November 2019, the Company entered into a short-term secured loan agreement with Hecate Energy New York Holdings LLC. The loan bears an interest rate of 8% and matures on January 31, 2022. The loan was repaid in full as of February 15, 2022.
New Market Loan
In October 2019, the Company entered into a short-term secured loan agreement with New Market Solar, LLC. The loan bears an interest rate of 9% and matures on March 31, 2022.
Shepherd's Run Loan
In January 2021, the Company entered into a short-term secured loan agreement with Hecate Energy Columbia County 1 LLC. The loan bears an interest at a rate of 8% and matures on September 30, 2022.
SE Solar Loan
In February 2019, the Company entered into a short-term secured loan agreement with SunEnergy1, LLC. The loan bears an interest rate of 9% and matures on March 31, 2022.
Portfolio Disposals
There were no material sales during the year ended December 31, 2021.
The following portfolios had sales of assets during the year ended December 31, 2020:
Other Commercial Solar Portfolios
The Company entered into a transaction with Greenbacker Renewable Opportunity Zone Fund LLC (“GROZ”) to sell the Gliden Solar LLC investment, included in Other Commercial Solar Portfolios, on December 22, 2020 for an initial sale price of $12,752,215. GROZ is an affiliate of GREC, as GROZ shares the same Advisor as GREC. Since GROZ is an affiliate of the Company, the determination of the purchase price was based on the fair value of the investment as determined by an independent third-party appraiser. The purchase was approved by a majority of the Company’s Board of Directors (including a majority of the independent directors) not otherwise interested in the transaction to be fair and reasonable to the Company.
The transaction resulted in a realized (loss) gain of (34,290) and $1,608,644, recorded in the years ended December 31, 2021 and December 31, 2020, respectively. GROZ paid an initial amount of $7,993,972 at closing. The transaction resulted in a receivable recorded of $4,758,243 as of December 31, 2020, in Investment sales receivable on the Consolidated Statements of Assets and Liabilities. The sale proceeds were received in full as of December 31, 2021.
Residential Portfolios
On March 5, 2020, the Company closed a transaction to sell the entirety of its investments in the Greenbacker Residential Solar Portfolio and the Greenbacker Residential Solar Portfolio II (collectively, the “Residential Portfolios”). The Residential Portfolios comprised 3,668 individual residential sites, which were accumulated through a series of transactions from October 2016 to July 2017. The purchase price consideration for this transaction was $42,891,241, which resulted in a realized gain of
$8,152,495, all of which was recorded in the year ended December 31, 2020. The transaction resulted in a receivable of nil as of December 31, 2020.
GEH Portfolio
On January 10, 2020, the Company closed a transaction to sell three assets, North Carolina I, North Carolina II, and South Robeson, all included in the GEH Portfolio. The portfolio consisted of systems that comprised 11.35 MW of commercial solar photovoltaic systems. The purchase price consideration for this transaction was $11,084,803, which resulted in a realized loss of $(1,574,616) recorded for the year ending December 31, 2020, in Net realized gain on investments on the Consolidated Statements of Operations. The transaction resulted in a receivable of nil as of December 31, 2020.
The following portfolios were sold during the year ended December 31, 2019:
Raleigh Portfolio
On December 24, 2019, the Company entered into an agreement to sell 100% of the equity interests in Holocene Renewable Energy Fund 3, LLC. (“Raleigh Portfolio”). The Raleigh Portfolio was composed of 26 MW of commercial ground and rooftop-mounted solar photovoltaic systems located in North Carolina. The purchase price consideration for this transaction was $24,521,981, which resulted in a gain of $3,544,782 as it relates to the sale. Company recorded additional working capital adjustment for the sale, which resulted in realized (losses) of $(44,995) and $(398,151) for the year ending December 31, 2021 and December 31, 2020, respectively, recorded in Net realized gain on investments on the Consolidated Statements of Operations. The sale proceeds were received in full as of December 31, 2020.
Enfinity Colorado DHA Portfolio
On October 18, 2019, the Company entered into an agreement to sell 100% of the equity of Enfinity Colorado DHA 1, LLC, which comprised 666 residential rooftop solar systems totaling 2.5 MW, located in and around Denver, Colorado. The purchase price consideration for this transaction was $6,895,444. The transaction resulted in a realized gain of $606,580 recorded in the Consolidated Statement of Operations. During 2020, the Company finalized the working capital adjustment for the sale, which resulted in a realized loss of $(76,797) for the year ended December 31, 2020, recorded in Net realized gain on investments on the Consolidated Statements of Operations.
Phoenix Portfolio
The Company entered into a transaction with GROZ to sell the Sol Phoenix Solar LLC investment, included within the Phoenix Solar Portfolio, on September 30, 2019, for an initial sale price of $16,874,761, pending final adjustments. The sale price was adjusted during the fourth quarter of 2019 and increased to total $17,175,554 as of December 31, 2019, and finalized in the second quarter of 2020 to total $18,060,275. The changes to the purchase price were based upon a final fair value determination of the investment as determined by an independent third-party appraiser. GROZ is an affiliate of GREC, as GROZ shares the same Advisor as GREC. Since GROZ is an affiliate of the Company, the determination of the purchase price was based on the fair value of the investment as determined by an independent third-party appraiser. The purchase was determined by a majority of the Company’s Board of Directors (including a majority of the independent directors) not otherwise interested in the transaction to be fair and reasonable to the Company.
The transaction resulted in a realized gain of $7,636,438, of which $141,974 was recorded in the year ended December 31, 2020. GROZ paid an initial amount of $1,500,000 at closing, with an additional $8,184,393 paid by GROZ as of December 31, 2019. The sale proceeds were received in full as of December 31, 2020.
Fremont Portfolio
On December 10, 2019, the Company, through its wholly owned subsidiary, Citrine Solar LLC, entered into a second transaction with GROZ to sell the Fremont CO I, LLC asset. The asset originally sold for a purchase price of $5,272,475, which increased to $5,335,009 in the second quarter of 2020, based upon the fair value of the investment as determined by an independent third-party appraiser and a determination by a majority of the Company’s Board of Directors (including a majority of the independent directors) not otherwise interested in the transaction that the purchase price was fair and reasonable to the Company.
The transaction resulted in a realized gain of $794,967 in the year ending December 31, 2019, which was reduced by $(32,576) in the year ended December 31, 2020, due to the final accounting of the sale process. As of December 31, 2019, a total of $2,531,000 was paid by GROZ. The sale proceeds were received in full as of December 31, 2020.
Investment Summary
The following table presents the gross purchases of the gross funding of additional capital for new or existing investments for the years ended December 31, 2021, 2020 and 2019:
| | | | | | | | | | | | | | | | | |
| For the year ended
December 31, 2021 | | For the year ended
December 31, 2020 | | For the year ended
December 31, 2019 |
| Battery Storage | | | | | |
| Pacifica Portfolio | $ | 2,443,306 | | | $ | 8,977,603 | | | $ | — | |
| Biomass | | | | | |
| Eagle Valley Biomass Portfolio | 1,446,870 | | | 2,280,896 | | | 21,256,245 | |
| Commercial Solar | | | | | |
| Celadon Portfolio | 158,735,073 | | | — | | | — | |
| GEH Portfolio | 1,254,176 | | | 27,574,153 | | | 55,614,238 | |
| Raleigh Portfolio | 44,995 | | | — | | | 150,000 | |
| Other Commercial Solar Portfolios | 232,569,444 | | | 113,520,911 | | | 125,461,658 | |
| Ponderosa Portfolio | 17,623,736 | | | — | | | — | |
| Sego Lily - Solar Portfolio | 111,523,109 | | | 26,336,685 | | | — | |
| Trillium Portfolio | 127,398,935 | | | 124,283,655 | | | 20,725,345 | |
| Residential Solar | | | | | |
| Enfinity Colorado DHA Portfolio | — | | | — | | | 505,000 | |
| Greenbacker Residential Solar Portfolio | — | | | 13,000 | | | — | |
| Greenbacker Residential Solar Portfolio II | 50,398 | | | 265,000 | | | 52,000 | |
| Wind | | | | | |
| Sego Lily - Wind Portfolio | 293,280,770 | | | — | | | — | |
| Greenbacker Wind - HoldCo Portfolio | 13,417,803 | | | 31,098,522 | | | 50,040,000 | |
| Greenbacker Wind Portfolio - Maine | — | | | 12,457,689 | | | — | |
| Other Wind Investments Portfolios | 55,522,198 | | | 620,415 | | | 25,720,259 | |
| Greenbacker Wind Holdings II Portfolio | 33,994,616 | | | 9,957,207 | | | 2,647,196 | |
| Other Investments | | | | | |
| Other Portfolios | 39,992,961 | | | 22,758,309 | | | 12,003,453 | |
| Secured Loans | | | | | |
| Chaberton Loan | 2,247,962 | | | — | | | — | |
| BNRG Loan* | — | | | 671,965 | | | — | |
| Encore Loan | 13,421 | | | 5,606,046 | | | 5,000,680 | |
| Holiday Hill Loan | — | | | — | | | 10,250,000 | |
| Hudson Loan | 1,345,394 | | | 464,149 | | | 11,537,903 | |
| Hudson II Loan | 1,345,394 | | | — | | | — | |
| New Market Loan | 720 | | | 7,350 | | | 5,000,000 | |
| SE Solar Loan | 3,060 | | | 4,000,000 | | | 5,000,000 | |
| Shepherd's Run Loan | 8,751,528 | | | — | | | — | |
| TUUSSO Loan | 10,723,642 | | | 4,141,212 | | | 2,621,883 | |
| $ | 1,113,729,511 | | | $ | 395,034,767 | | | $ | 353,585,860 | |
* In October 2020, the Company entered into a short-term secured loan agreement with BNRG Portland LLC with a maturity date of December 18, 2020. As of December 31, 2020, the remaining loan balance was paid by BNRG Portland LLC.
During the year ended December 31, 2021, we either closed on the acquisition or contracted for the acquisition of 150 renewable energy projects: 145 solar and five wind assets. During the year ended December 31, 2021, we had one project disposal. As our access to capital has increased, the average size of our projects increased from 3.6 MW per project as of December 31, 2020 to 6.5 MW per project as of December 31, 2021.
For the year ended December 31, 2020, we either closed on the acquisition or contracted for the acquisition of 102 renewable energy projects: 67 solar, two wind, and 33 battery storage assets. During the year ended December 31, 2020, we had
seven project disposals. As our access to capital increased, the average size of our projects increased from 3.5 MW per project as of December 31, 2019 to 3.6 MW per project as of December 31, 2020.
For the year ended December 31, 2019, we either closed on the acquisition or contracted for the acquisition of 27 renewable energy projects: 22 solar, four wind, and one biomass asset. During the year ended December 31, 2019, we had eight project disposals. As our access to capital increased, the average size of our projects increased from 2.5 MW per project as of December 31, 2018 to 3.5 MW as of December 31, 2019.
The composition of the Company’s investments as of December 31, 2021, at fair value, were as follows:
| | | | | | | | | | | | | | | | | |
| Investments
at Cost | | Investments at
Fair Value | | Fair Value
Percentage
of Total
Portfolio |
| Battery Storage | | | | | |
| Pacifica Portfolio | $ | 11,288,841 | | | $ | 10,747,811 | | | 0.7 | % |
| Subtotal | $ | 11,288,841 | | | $ | 10,747,811 | | | 0.7 | % |
| Biomass | | | | | |
| Eagle Valley Biomass Portfolio | $ | 24,533,222 | | | $ | 17,184,912 | | | 1.2 | % |
| Subtotal | $ | 24,533,222 | | | $ | 17,184,912 | | | 1.2 | % |
| Commercial Solar | | | | | |
| Celadon Portfolio | $ | 165,129,450 | | | $ | 187,410,880 | | | 13.1 | % |
| GEH Portfolio | 150,463,205 | | | 157,925,117 | | | 11.0 | % |
| Ponderosa Portfolio | 49,514,975 | | | 59,577,751 | | | 4.1 | % |
| Sego Lily - Solar Portfolio | 107,621,275 | | | 122,272,431 | | | 8.5 | % |
| Trillium Portfolio | 74,764,309 | | | 101,432,185 | | | 7.1 | % |
| Other Commercial Solar Portfolios | 250,865,362 | | | 302,548,767 | | | 21.1 | % |
| Subtotal | $ | 798,358,576 | | | $ | 931,167,131 | | | 64.9 | % |
| Wind | | | | | |
| Sego Lily - Wind Portfolio | $ | 117,410,390 | | | $ | 140,965,616 | | | 9.8 | % |
| Greenbacker Wind Holdings II Portfolio | 62,787,210 | | | 62,272,198 | | | 4.3 | % |
| Greenbacker Wind - HoldCo Portfolio | 84,674,188 | | | 78,025,844 | | | 5.4 | % |
| Other Wind Investments Portfolios | 56,638,076 | | | 58,770,864 | | | 4.1 | % |
| Subtotal | $ | 321,509,864 | | | $ | 340,034,522 | | | 23.6 | % |
| Other Investments | | | | | |
| Other Portfolios | $ | 35,034,396 | | | $ | 35,243,259 | | | 2.5 | % |
| Subtotal | $ | 35,034,396 | | | $ | 35,243,259 | | | 2.5 | % |
| Energy Efficiency | | | | | |
| Other Energy Efficiency Portfolios | $ | 668,736 | | | $ | 685,784 | | | — | % |
| Subtotal | $ | 668,736 | | | $ | 685,784 | | | — | % |
| Secured Loans | | | | | |
| Chaberton Loan | $ | 2,247,962 | | | $ | 2,247,962 | | | 0.2 | % |
| Encore Loan | 3,058,527 | | | 3,058,527 | | | 0.2 | % |
| Hudson Loan | 4,984,650 | | | 4,984,650 | | | 0.3 | % |
| Hudson II Loan | 4,227,098 | | | 4,227,098 | | | 0.3 | % |
| New Market Loan | 5,008,070 | | | 5,008,070 | | | 0.3 | % |
| Shepherd's Run Loan | 8,751,528 | | | 8,751,528 | | | 0.6 | % |
| SE Solar Loan | 5,008,304 | | | 5,008,304 | | | 0.3 | % |
| Subtotal | $ | 33,286,139 | | | $ | 33,286,139 | | | 2.2 | % |
| Investments in Money Market Funds | | | | | |
| Allspring Treasury Plus Money Market Fund - Institutional Class | $ | 16,823,110 | | | $ | 16,823,110 | | | 1.2 | % |
| Fidelity Government Portfolio - Class I | 16,873,111 | | | 16,873,111 | | | 1.2 | % |
| First American Government Obligations Fund - Class X | 16,823,111 | | | 16,823,111 | | | 1.2 | % |
| First American Government Obligations Fund - Class Z | 50,000 | | | 50,000 | | | — | % |
| JPMorgan US Government Money Market Fund - Class L | 16,823,111 | | | 16,823,111 | | | 1.2 | % |
| Subtotal | $ | 67,392,443 | | | $ | 67,392,443 | | | 4.8 | % |
| Total | $ | 1,292,072,217 | | | $ | 1,435,742,001 | | | 100 | % |
The composition of the Company’s investments as of December 31, 2020, at fair value, were as follows:
| | | | | | | | | | | | | | | | | |
| Investments
at Cost | | Investments at
Fair Value | | Fair Value
Percentage
of Total
Portfolio |
| Battery Storage | | | | | |
| Pacifica Portfolio | $ | 8,839,235 | | | $ | 8,839,235 | | | 1.3 | % |
| Subtotal | $ | 8,839,235 | | | $ | 8,839,235 | | | 1.3 | % |
| Biomass | | | | | |
| Eagle Valley Biomass Portfolio | $ | 23,236,352 | | | $ | 23,236,352 | | | 3.5 | % |
| Subtotal | $ | 23,236,352 | | | $ | 23,236,352 | | | 3.5 | % |
| Commercial Solar | | | | | |
| GEH Portfolio | $ | 114,253,479 | | | $ | 124,637,707 | | | 18.9 | % |
| Magnolia Sun Portfolio | 33,008,559 | | | 36,904,011 | | | 5.6 | % |
| Other Commercial Solar Portfolios | 67,933,619 | | | 70,814,994 | | | 10.7 | % |
| Sego Lily Solar Portfolio | 29,178,404 | | | 62,135,652 | | | 9.4 | % |
| Trillium Portfolio | 83,219,738 | | | 105,913,033 | | | 16.0 | % |
| Subtotal | $ | 327,593,799 | | | $ | 400,405,397 | | | 60.6 | % |
| Wind | | | | | |
| Greenbacker Wind Holdings II Portfolio | $ | 33,834,320 | | | $ | 35,839,967 | | | 5.4 | % |
| Greenbacker Wind - HoldCo Portfolio | 73,244,891 | | | 75,013,771 | | | 11.4 | % |
| Greenbacker Wind Portfolio - Maine | 12,704,196 | | | 23,758,084 | | | 3.6 | % |
| Other Wind Investments Portfolios | 19,986,133 | | | 20,356,806 | | | 3.1 | % |
| Subtotal | $ | 139,769,540 | | | $ | 154,968,628 | | | 23.5 | % |
| Other Investments | | | | | |
| Other Portfolios | 23,669,446 | | | 23,291,114 | | | 3.5 | % |
| Subtotal | $ | 23,669,446 | | | $ | 23,291,114 | | | 3.5 | % |
| Energy Efficiency | | | | | |
| Other Energy Efficiency Portfolios | $ | 738,348 | | | $ | 741,581 | | | 0.1 | % |
| Subtotal | $ | 738,348 | | | $ | 741,581 | | | 0.1 | % |
| Secured Loans | | | | | |
| Encore Loan | $ | 10,606,725 | | | $ | 10,606,725 | | | 1.6 | % |
| Hudson Loan | 6,021,402 | | | 6,021,402 | | | 0.9 | % |
| Hudson II Loan | 3,923,873 | | | 3,923,873 | | | 0.6 | % |
| New Market Loan | 5,007,350 | | | 5,007,350 | | | 0.8 | % |
| SE Solar Loan | 5,005,244 | | | 5,005,244 | | | 0.8 | % |
| TUUSSO Loan | 6,763,096 | | | 6,763,096 | | | 1.0 | % |
| Subtotal | $ | 37,327,690 | | | $ | 37,327,690 | | | 5.7 | % |
| Investments in Money Market Funds | | | | | |
| Fidelity Government Portfolio - Class I | $ | 10,100,000 | | | $ | 10,100,000 | | | 1.5 | % |
| First American Government Obligations Fund - Class Z | 1,072,720 | | | 1,072,720 | | | 0.2 | % |
| Invesco Government & Agency Portfolio - Institutional Class | 7 | | | 7 | | | — | % |
| Subtotal | $ | 11,172,727 | | | $ | 11,172,727 | | | 1.7 | % |
| Total | $ | 572,347,137 | | | $ | 659,982,724 | | | 100 | % |
Results of Operations
A discussion of the results of operations for the years ended December 31, 2021, 2020 and 2019 are as follows:
Revenues
As the majority of our assets consist of equity investments in entities established to own and operate our renewable energy projects, the majority of the revenue we generate is in the form of dividend income. Dividend income is not equivalent to the gross revenue produced at the project level, but is instead the amount of free cash that is distributed from the project entities to the Company from time to time after paying for all project-level expenses, remitting principal payments not funded by the Company, and complying with any specific project-level debt and tax equity covenants. Thus, the presentation of investment income in our financial statements differs from the traditional presentation shown in the financial statements or entities not prepared in accordance with ASC 946 and, most notably, is not equivalent to revenue as one might expect to see in financial statements not prepared in accordance with ASC 946.
The timing and amount of dividend income to be distributed to the Company is determined on at least a quarterly basis by the Company. This process includes an analysis at the individual project entity level of the cash available from operations and necessary working capital needed for the proper daily operations of the project. As a general rule, the dividend income from our equity investments is recognized as income only when it is received by the Company, or expected to be received by the Company immediately after each quarter end, whereas the undistributed income is retained within the project entities (i.e., included in working capital of the project company) and is added to the carrying value of those investments on the balance sheet. The other major component of our revenue is interest income earned on our debt investments, including loans to developers and loans made directly or indirectly to renewable energy projects. Dividend income for the years ended December 31, 2021, 2020 and 2019 totaled $28,631,462, $21,495,843 and $17,160,351, respectively, while interest income earned on our cash, cash equivalents and secured loans (including the amortization of origination and other fees) amounted to $3,919,675, $2,934,059 and $1,602,354, respectively.
The increase in dividend income in the year ended December 31, 2021 from the year ended December 31, 2020 was primarily attributable to the acquisition of operating assets and completion of construction assets during the latter part of 2020 into 2021.
The increase in interest income for the year ended December 31, 2021 from the year ended December 31, 2020 was primarily attributed to the increase in our interest-bearing loans to unaffiliated entities.
During 2021, the fair value of our investments increased from $660 million as of December 31, 2020 to $1,436 million as of December 31, 2021, or a 117.5% increase. As of December 31, 2021, and December 31, 2020 we have approximately $384 million and $144 million in pre-operational and non-earning assets, respectively, which amounts to 20.2% and 13.4% of our gross investment amounts, respectively, and 26.6% and 26.0% of our net assets, respectively. We expect that the majority, but not all, of the assets that are currently pre-operational and non-earning to become revenue generating during 2022 and into 2024, but we also expect to continue to make new investments in projects prior to the commencement of construction. As noted above, the strategy of investing in projects prior to the commencement of construction results in an increase in costs with no immediate increase in dividend income from those projects.
| | | | | | | | | | | | | | | | | | | | |
| Balance | | December 31, 2021 | | December 31, 2020 | | December 31, 2019 |
| Investments in controlled/affiliated and non-controlled/non-affiliated portfolios, at fair value | | $ | 1,368,349,558 | | | $ | 648,809,997 | | | $ | 475,175,871 | |
| Investments in money markets, at fair value | | $ | 67,392,443 | | | $ | 11,172,727 | | | $ | 4,984,621 | |
| Total investments, at fair value | | $ | 1,435,742,001 | | | $ | 659,982,724 | | | $ | 480,160,492 | |
| Notes payable balances of the Company and its operating entities | | $ | 421,053,561 | | | $ | 507,108,553 | | | $ | 261,850,711 | |
| Cash, cash equivalents and restricted cash | | $ | 121,863,392 | | | $ | 4,675,836 | | | $ | 4,081,470 | |
| Less: Note payable balance of the Company | | $ | (82,151,509) | | | $ | (90,145,500) | | | $ | (71,990,467) | |
| | | | | | |
| Gross Investment Amount | | $ | 1,896,507,445 | | | $ | 1,081,621,613 | | | $ | 674,102,206 | |
| | | | | | |
| Additional Metrics | | | | | | |
| Pre-operational and non-earning assets | | $ | 383,562,821 | | | $ | 144,404,286 | | | $ | 128,632,161 | |
| Pre-operational and non-earning assets as a % of gross investment amount | | 20.2 | % | | 13.4 | % | | 19.1 | % |
| Pre-operational and non-earning assets as a % of net assets | | 26.6 | % | | 26.0 | % | | 31.5 | % |
Expenses
For the years ended December 31, 2021, 2020 and 2019, the Company incurred $38,784,760, $22,784,046, and $14,548,902 in operating expenses, respectively, including the management fees earned by the Advisor, which represents 3.50%, 4.86%, and 3.97% of average net assets, respectively.
For the years ended December 31, 2021, 2020 and 2019, the Advisor earned $21,940,099, $10,364,635 and $8,461,616 respectively, in management fees due to the increase in net assets most notably in 2021 due to the significant increase in capital
raised. The consolidated financial statements reflect a $4,672,078, $4,571,927 and nil performance participation fee for the years ended December 31, 2021, 2020 and, 2019 based primarily on net unrealized appreciation on our investments.
Lastly, for the years ended December 31, 2021, 2020 and 2019, the Company generated a tax (benefit) from operations of $(9,050,004), $(7,161,831) and $(3,188,431), respectively. The benefit recorded within net investment income (loss) is mainly derived from net operating losses incurred by the Company.
For the years ended December 31, 2021, 2020 and 2019, net investment income (loss) was $2,655,809, $8,807,687 and $7,277,091, respectively, or $0.02, $0.16 and $0.17, respectively, per share.
The Company's expenses primarily relate to the payment of asset management fees under our advisory agreement with the Advisor as well as performance participation fees to the Special Unitholder. We also bear other expenses, which include, among other things:
•the cost of calculating our NAV, including the related fees and cost of retaining third-party valuation services;
•the cost of effecting sales and repurchases of units;
•fees payable to third parties relating to, or associated with, our financial and legal affairs, making investments and valuing investments, including fees and expenses associated with performing due diligence reviews of prospective investments and sub-advisors;
•interest payable on debt incurred to finance our investments;
•transfer agent and custodial fees;
•federal and state registration fees;
•costs of board meetings, unitholders’ reports and notices, and any proxy statements;
•directors’ and officers’ errors and omissions liability insurance and other types of insurance;
•direct costs, including those relating to printing of unitholder reports and advertising or sales materials, mailing, telephone and staff;
•fees and expenses associated with independent audits and outside legal costs, including compliance with the Sarbanes-Oxley Act of 2002 and applicable federal and state securities laws; and
•all other expenses incurred by us or the Advisor or sub-advisors in connection with administering our investment portfolio, including expenses incurred by our Advisor in performing certain of its obligations under the advisory agreement.
Net Change in Realized and Unrealized Gain (Loss) on Investments, Foreign Currency Translation and Deferred Tax Assets
Net realized gain (loss) on investments, Net change in unrealized appreciation (depreciation) on Investments and Net change in unrealized appreciation (depreciation) on Foreign currency translation are reported separately on the Consolidated Statements of Operations. We measure realized gains or losses as the difference between the net proceeds from the sale, repayment, or disposal of an asset and the adjusted cost basis of the asset, without regard to unrealized appreciation or depreciation previously recognized. Net change in unrealized appreciation or depreciation will reflect the change in investment values during the reporting period, including any reversal of previously recorded unrealized appreciation or depreciation, when gains or losses are realized.
For the years ended 2021, 2020 and 2019, we recognized a realized (loss) gain of $(29,182), $7,830,550 and $12,915,738, respectively. The gain in 2020 related to the sale of the Greenbacker Residential Solar Portfolio I, Greenbacker Residential Solar Portfolio II, Sol Phoenix, Fremont, Gliden and East to West Portfolio assets. The gain in 2019 related to the sale of the following projects: Phoenix Portfolio, Fremont Portfolio, Enfinity Colorado DHA and the Raleigh Portfolio. A net change of $58,283,123, $46,596,822 and $22,302,164 of unrealized appreciation was recorded for the years ended December 31, 2021, 2020 and 2019, respectively, of which $56,023,470, $51,377,370 and $27,296,880, respectively of unrealized appreciation
related to the change in value of investments, $10,727, $92,019 and $7,589, respectively of unrealized appreciation related to the change in value based upon changes in foreign currency exchange rates, and $2,248,926, $(4,872,567) and $(5,002,305) of unrealized appreciation (depreciation) related to the change in value of swap contracts.
The (provision for) income taxes on realized and unrealized gain (loss) on investments, foreign currency translation and swap contracts for the years ended December 31, 2021, 2020 and 2019 was $(9,050,004), $(7,161,831) and $(3,188,431), respectively. The provision is mainly derived from unrealized tax basis gains on the Company's investments offset by net operating losses incurred and investment tax credit carryforwards related to the Company's investments which, unlike for financial statement purposes under GAAP, are consolidated for tax purposes.
Changes in Net Assets from Operations
For the years ended December 31, 2021, 2020 and 2019, we recorded a net increase in net assets resulting from operations of $43,020,789, $44,705,715 and $32,033,020, respectively, or $0.34, $0.83 and $0.73, respectively, per share. The increase in net assets primarily relates to our net investment income earned during the year and unrealized appreciation related to the change in value of investments.
Dividend Coverage Ratio and Realized Gains
As further discussed below, towards the end of 2017, our Advisor began to observe an increase in the opportunities to participate in projects that were largely similar to our operating assets in terms of the long-term risks, but which had the potential for additional returns if we could manage some additional risks in the early stages of the investment lifecycle. As a result, we determined that we should expand our investment capabilities to include four basic investment categories: operating assets, commercial operation date, notice to proceed, and special situations. Since then, in addition to acquiring operating assets, a substantial portion of our investment activity consists of acquiring pre-operational assets which we then fund through construction until such time as the assets are placed in service and start generating revenue. Depending on the circumstances, the construction process can take several months during which time we are not generating revenues from these investments, and are paying distributions on the capital raised to fund the investments. When determining the price to be paid for pre-operational assets, we perform a discounted cash flow analysis using conservative assumptions regarding the lifetime operating returns of the projects and incorporating the pre-operational period into our analysis. Through the construction period we continue to incur substantial operating expenses associated with owning and managing these investments, as well as pay distributions on the capital raised to fund the investments. Thus, from a near term financial perspective, the Company’s financial statements and overall dividend coverage ratio is negatively impacted.
An analysis of the effect of realized gains on the Company’s dividend coverage ratio is as follows:
| | | | | | | | | | | | | | | | | | | | | | | | | | | | | | | | |
| Description | | 2021 | | 2020 | | 2019 | | 2018 | | 2017 |
| Net investment income before taxes | | $ | (6,233,623) | | | $ | 1,645,856 | | | $ | 4,213,803 | | | $ | 9,681,310 | | | $ | 7,459,040 | |
| Shareholder distributions (total including DRP) | | $ | 71,114,670 | | | $ | 31,038,522 | | | $ | 25,884,100 | | | $ | 17,738,130 | | | $ | 11,403,610 | |
| Dividend coverage ratio (net investment income/total distributions) | | (8.8) | % | | 5.3 | % | | 16.3 | % | | 54.6 | % | | 65.4 | % |
| Realized (losses) gains | | $ | (29,182) | | | $ | 7,830,550 | | | $ | 12,915,738 | | | $ | — | | | $ | 694,000 | |
| Gross dividend coverage ratio (net investment income and realized gains/total shareholder distributions) | | (8.8) | % | | 30.5 | % | | 66.2 | % | | 54.6 | % | | 71.5 | % |
The Company has built its business around investing in long-term income-producing assets in the renewable energy industry utilizing the cash flow associated with those assets to pay monthly distributions to our investors. When fully invested, we will measure success based upon generating a consolidated cash flow stream, which enables the Company to pay all shareholder distributions through the operating returns of the Company’s projects. As such, our long-term goal has always been to achieve a distribution coverage ratio of at least 1:1, and to grow that ratio meaningfully over time, so that we can increase long-term returns to investors either through distribution growth or by growing the net asset value of our shares through reinvestment on net investment income.
Investment Company Accounting Considerations
Since the Company’s consolidated financial statements are prepared using the specialized accounting principles of ASC Topic 946, our Advisor produces an estimate of the fair market value of each of our investments quarterly. When valuing our investments under the income method, net operating earnings generated at the project level are included in our valuation models. While the valuation models take into account all revenue, Dividend income recorded from each of our project companies may be more or less than that included in our valuation models each period due to various cash flow considerations. As an example, since many of our projects are held in tax partnership structures, or in related entities with bank-financed project-level debt, the Company may be contractually limited in its ability to make dividend distributions from project companies to the Company. Since project entities are not consolidated with the Company under ASC Topic 946, in many cases not all net income from operations earned by a project company is distributed to the Company. While this non-distributed income is included in the calculation of fair market value and unrealized gain/loss on investments, it is not included in Net investment income on the Consolidated Statements of Operations, and therefore not included in our dividend coverage ratio.
Investing in Asset Classifications other than Operating Assets
We believe that the hallmark of a good investment strategy is the ability to take advantage of new opportunities and adjust to changing market conditions. Towards the end of 2017, our Advisor began to observe an increase in the opportunities to participate in projects that were largely similar to our operating assets in terms of the long-term risks, but which promised additional returns if we could manage some additional risks in the early stages of the investment lifecycle. As a result, we determined that we should expand our investment capabilities to include four basic investment categories:
1.Operating Assets—As a continuation of our initial strategy, the Company will continue to invest in solar, wind and other alternative energy assets that are already in commercial operation and generating investment returns through the sale of contracted electricity and environmental attributes.
2.Commercial Operation Date (“COD”)—The Company will also purchase assets that have been constructed by developers but have not been placed in service. Functionally these assets are generally ready to generate electricity and have reached a milestone known as the COD. While we have determined that a modest investment premium could be obtained by investing at COD, most importantly the term of the contracted cash flows is maximized through this strategy.
3.Notice to Proceed (“NTP”)—We further determined that we could invest in assets that had not yet been constructed but that had received substantially all of the permits necessary to begin construction, a milestone known as NTP. While potentially riskier than operating or COD projects due to the level of construction risk, we believe that the additional return associated with these projects more than compensates for the additional risk. Furthermore, when we invest in NTP assets we have the added benefit of having more control of equipment selection and implementation of construction best practices, which positively affects the long-term performance of our plants. With the continued growth of the renewable energy market, driven by increases in the level of Renewable Portfolio Standards in several states and the planned wind-down of federal tax incentives, we identified a significant number of NTP transactions coming to market and an opportunity to develop strong pipeline-type relationships with the developers of these projects. Besides increasing returns to investors, this has enabled management to substantially increase our access to a proprietary pipeline of sound projects.
4.Special Situations—We also determined there are market opportunities for selected projects driven by either technical or financial issues, either at the project or owner level, that can be relatively easily resolved by accessing the broad range of expertise we have in-house to deal with our day-to-day operations. Therefore, we determined that on a limited basis the Company would seek investments that had these characteristics, since by resolving the issues we have the potential to generate above-market returns.
In order to execute on this strategy, management recognized the need to build a dedicated team of technical asset management professionals. Greenbacker Administration therefore began hiring a team of experienced engineers and construction managers, which enabled the Company to expand our investment focus into these additional categories of investment. Having access to the technical expertise enabled the Company to purchase operationally challenged solar and wind farms while having a sound financial understanding of the costs and time required to resolve the issues. Having an in-house team of technical asset management professionals increases our ability to extract revenue from aging solar assets through repowers and plant optimization. It also allows us to capitalize on the acquisition of “distressed” assets as the number of those assets exponentially increases over the coming years. Lastly, it enabled us to invest in earlier-stage projects where the projects were fully permitted but construction had not yet commenced. Having access to this level and breadth of expertise is a major competitive advantage for the Company in the marketplace.
Strategic Considerations of Investing in NTP Projects
We believe that investing across the four investment categories discussed above provides the best opportunity for the Company to generate superior investment returns over the medium term, diversify our portfolio, and create a proprietary pipeline of sound investment opportunities for future growth. The downside of this approach is that investing in pre-operational solar and wind projects that are underperforming has a negative impact on near-term cash flows and dividend coverage. To minimize the downside effects of the strategy, management has continued to explore more sophisticated financing tools to enable us to direct more of our investable capital into current income-generating investments going forward. As the size of our portfolio grows, our ability to access the more sophisticated financial products increases.
History of Distribution Coverage
2014 - 2018
During the period from April 2014, when we started raising capital, through the end of 2017, our investment strategy consisted wholly of purchasing operating renewable energy projects that were in service and generating income from the sale of electricity under long-term power purchase contracts. By investing exclusively in operating assets, the Company was able to demonstrate steady improvement in distribution coverage through that period. This initial operational period also corresponded to a significant increase in assets under management, as well as the deployment of capital in income producing renewable energy operating assets. During 2018, the Company began to expand its investment focus with the purchase of the Midway III project in September 2018. There were no assets under construction in 2017, whereas by December 31, 2018, the Company’s investment portfolio included a total of $67 million of to-be-constructed assets. Given the substantial increase in non-income-generating assets, the distribution coverage ratio fell to 54.58% on average assets by December 31, 2018.
2019
By December 31, 2019, total capital deployed in pre-operational and non-earning assets reached approximately $129 million which amounted to 31.5% of net assets, or 19.1% of the gross investment amount. In addition, Greenbacker Administration costs increased approximately $3 million year over year due to the increase in specialist headcount to manage the construction and operational risks associated with these investment initiatives. These increased costs directly reduced the operating cash flows from project-level entities that would otherwise have been available to distribute to the Company as dividend income. When these projects commenced operations, any increase in the fair value of the project was recognized as an unrealized gain on the Consolidated Statements of Operations, not as investment income. Thus, while costs incurred prior to operation reduce the dividend coverage ratio, any unrealized gains on the value of the project after reaching operations have no effect on the dividend coverage ratio.
2020
As of December 31, 2020, total capital deployed in pre-operational and non-earning assets reached approximately $144 million which amounts to 26.0% of net assets, or 13.4% of the gross investment amount. In addition, Greenbacker Administration costs continued to increase due to the increase in specialist headcount to manage the construction and operational risks associated with these investment initiatives. These increased costs directly reduced the operating cash flows from project-level entities that would otherwise have been available to distribute to the Company as dividend income. Consistent with 2019, as these projects commenced operations, any increase in the fair value of the project was recognized as an unrealized gain on the Consolidated Statements of Operations, not as investment income. Thus, while costs incurred prior to operation reduce the dividend coverage ratio, any unrealized gains on the value of the project after reaching operations have no effect on the dividend coverage ratio.
2021
As of December 31, 2021, total capital deployed in pre-operational and non-earning assets reached approximately $384 million which amounts to 26.6% of net assets, or 20.2% of the gross investment amount. Additionally, as a result of the significant capital raised during the year ended December 31, 2021, the Company has $67 million in investments in money market funds as of December 31, 2021, amounting to an additional 4.8% of our net assets, or 3.6% of our gross investment amounts. Any change in the fair value of the Company's investments, whether the projects are operating or pre-operational, is recognized as an unrealized gain on the Consolidated Statements of Operations, not as investment income. Thus, while costs incurred prior to operation reduce the dividend coverage ratio, any unrealized gains on the value of the project before or after reaching operations have no effect on the dividend coverage ratio. From a near-term financial perspective, the Company’s financial statements and overall dividend coverage ratio are negatively impacted.
Demonstrating Value Creation Through Selected Asset Sales
During 2019 and continuing into 2020, we engaged in a process of selling selected projects considered to be non-core investments, or for which there were compelling opportunities to sell at prices in excess of original cost. During the year ended December 31, 2021 the Company had no material sales or disposals.
During the year ended December 31, 2020, the Company sold two operating portfolios and a portion of another operating portfolio. A discussion of the acquisition and sale process for two operating portfolios sold in 2020 are as follows:
Residential Solar Portfolios
Greenbacker Residential Solar Portfolio
Origination Process. In the second quarter of 2016, the Company purchased 1,610 operating residential photovoltaic solar systems from One Roof Energy (“ORE”) located in California, Connecticut, Massachusetts, New Jersey and New York. While Greenbacker had focused exclusively upon purchasing commercial and utility solar projects since commencement of operations, the deal team identified an opportunity to purchase these assets from ORE at a price that was extremely attractive, especially given the high credit quality of the homeowners (average FICO score of 740). The Company was able to purchase an additional 1,015 residential solar systems early in early 2017 as ORE experienced financial problems that forced it to cease operations. These portfolios provided an attractive cash flow from operations as well as higher than average cash yield.
Greenbacker Residential Solar II Portfolio
Origination Process. Having successfully purchased and managed a portfolio of residential solar assets, earlier in the year, the Company sought to increase its scale and take advantage of dislocations in the residential solar market, so it agreed to purchase an additional 1,250 operating residential photovoltaic solar systems located in California, Arizona, New York, New Jersey, Massachusetts, Maryland, Nevada and Connecticut from Terraform, a residential solar developer whose parent company, SunEdison, had gone into bankruptcy. While the transaction was very complex, we were highly attracted to this portfolio due to the high credit quality of the residential homeowners, and felt that the price we paid for the portfolio was well below the market prices we had observed in other residential solar portfolio sales and securitizations. Lastly, there was estimated to be considerable upside in this portfolio if we could complete construction of some of the to-be-built residential solar projects. Through active management we were able to complete construction and operate a number of additional projects that were purchased alongside the operating projects, and were also able to improve the overall management of the portfolio.
Sale Process. In the third quarter of 2019, the Company decided to explore the potential exit of the entirety of its residential solar business to take advantage of market yield compression and our estimation that the market had reached the late stage of a bull market cycle. Management’s view was that maintaining exposure to consumer credit in the form of residential rooftop power contracts was increasingly imprudent. The Company began a process in the final quarter of 2019 with a dedicated buyer and was able to complete the sale of the portfolio in the first quarter of 2020.
Commercial Solar Portfolios
GEH Portfolio
Origination Process. In February 2015, the Company purchased a portfolio of 13 commercial solar systems located in various states across the US from MP2 Capital and Blu Leaf Ventures, which we subsequently described as the “East to West Assets” included in the GEH Portfolio. These assets consisted of two 2.0 MW commercial solar systems located in North Carolina. Then in December 2015 the Company purchased a portfolio of two commercial solar systems from Heelstone Energy, LLC, including one 5.0 MW system located in North Carolina, which was also added to the GEH Portfolio. All three projects were placed in service from 2011 to 2013, and sold 100% of the power produced to Duke Energy, an investment grade offtaker, through 15-20-year PPAs. The projects were accumulated as part of the process of adding affordable operating solar projects with solid offtakers to our portfolio in the very early phases of our investment activity.
Sale Process. In mid-2019, we began discussions with USF Holdings Corp. to sell 100% of our interest in the Raleigh Portfolio, which consisted of five projects in North Carolina, together with three of the projects in the GEH Portfolio located in North Carolina, all of which were selling power to Duke Energy. The transaction was structured with two
separate closings, the first of which occurred in December 2019 in respect of the Raleigh Portfolio and the second in January 2020 in respect of the three projects from the GEH Portfolio. As these projects were nearing the 10-year mark of their remaining PPA terms, the Company was looking to sell the Raleigh Portfolio and three projects from the GEH Portfolio to reinvest the proceeds into projects with longer-term contacted cash flows. The second close of the transaction, which included the three projects from the GEH Portfolio, occurred in January 2020.
During the year ended December 31, 2019, the Company sold two portfolios at COD, as well as two operating portfolios. A discussion of the acquisition and sale process for two operating portfolios sold in 2019 are as follows:
Enfinity Colorado DHA Portfolio
Origination Process. In the first quarter of 2017, the Company purchased a 2.5MW portfolio of residential assets in Denver, CO. determining there were numerous investment merits that made this project a desirable portfolio company. Unlike other residential portfolios which have standalone PPAs with individuals and are rated using FICO scores, this portfolio had a single offtaker, the Denver Housing Authority (“DHA”), an entity providing public housing in the City of Denver. This portfolio provided an attractive cash flow from operations as well as cash yield. Lastly, the Company had a positive relationship with the operations and maintenance provider reducing our operational risk.
Sale Process. In the third quarter of 2019, the Company decided to explore the potential exit of the residential solar business to take advantage of market yield compression and a healthy economy. Through ongoing contact during the life of our ownership, the Company was aware that DHA was interested in purchasing the project and was willing to purchase at a competitive price. The Company managed the due diligence process for the potential sale throughout the summer of 2019, culminating in the execution of a purchase and sale agreement in October 2019 and a final closing in December 2019.
Raleigh Portfolio
Origination Process. In the third quarter of 2017, the Company purchased a 27.8MW portfolio comprised of five commercial solar systems located in North Carolina from Conergy Projects, Inc. The projects were placed in service throughout 2015 and sold 100% of the power produced to Duke Energy, an investment grade offtaker, through a 15-year PPA. We were able to purchase this asset as a part of the global orderly wind down of Conergy, Inc., a multinational EPC, developer and owner of utility scale solar projects. Additionally, the Company purchased the asset unlevered which provided immediate flexibility to leverage the asset.
Sale Process. In mid-2019, we began discussions with USF Holdings Corp to sell 100% of our interest in the five Raleigh projects, in addition to three other projects included in the Company’s East to West Portfolio in two separate closings. As these projects were nearing the 10-year mark of their remaining respective PPA terms, the Company was looking to sell the Raleigh Portfolio and recirculate the sales proceeds into projects with longer term contracts. The initial close of the Raleigh Portfolio, which included five projects, occurred in December 2019.
| | | | | | | | | | | | | | | | | | | | | | | | | | |
| Portfolio | | Cost Basis
of Investment | | Sale Price | | Realized Gain (Loss) | | Realized Gain (Loss)/Cost |
| Greenbacker Residential Solar Portfolios* | | $34,604,189 | | $42,891,241 | | $8,287,052 | | 23.9 | % |
| GEH Portfolio | | $12,659,419 | | $11,084,803 | | $(1,574,616) | | (12.4) | % |
| Enfinity Colorado DHA Portfolio* | | $6,288,864 | | $6,895,444 | | $606,580 | | 9.6 | % |
| Raleigh Portfolio* | | $21,022,194 | | $24,521,981 | | $3,499,787 | | 16.6 | % |
* Updated for final proceeds after net working capital true-up calculations.
Electricity Production by Our Investments
Between 2019 through the end of 2021, we observed 140% growth in annual total megawatt hours (“MWh”) production output across our solar, wind, and biomass energy projects in our investment portfolio, resulting in a corresponding growth of revenues earned by our investments. This growth was due in large part to the increase in the capital we deployed in commercial solar and wind projects while increasing the diversification of our portfolio geographically, technologically and across various investment-grade offtakers.
Our strategy of purchasing distributed generation and opportunistic utility-scale projects where we benefit from less competition from large capital providers and existing relationships with developers who expand their projects to larger scale
continues to enable us to build a highly diversified portfolio. While buying and operating smaller projects creates a lot of challenges versus buying large single projects, we see significant benefits in terms of the investment return potential, the ability to buy pipelines of deals from developers, and the overall scalability of the asset class, where solar and wind projects can be purchased to match capital inflows.
The most significant growth by segment over the last three years was in wind, with a 197% increase in MWh production. This increase is largely due to the acquisition of two operating wind projects located in Minnesota, which are included in the Other Wind Investments Portfolios, as well as certain wind projects included in the Sego Lily - Wind Portfolio that reached operations in 2021. Commercial solar achieved an increase of 137% in MWh production over the last three years. This increase is largely due to the increase in assets within the Trillium portfolio. Also, at the end of 2021, we had 98 commercial solar assets under construction, which are expected to increase in value as a result of the growth in production and revenues of our portfolio in 2022 and beyond.
For the year ended December 31, 2021, and December 31, 2020, the total MWh produced across all renewable energy projects in our portfolio were 1,479,921 MWh and 990,891 MWh, respectively, an increase of 49%. The most significant growth by segment for the year ended 2021 as compared to the year ended 2020 was commercial solar. The year-over-year increase of 102% was largely due to the Turquoise Solar and GB Solar TE 2020 projects, both included in Other Commercial Solar Portfolios, as well as the remaining projects included in the Trillium Portfolio becoming operational during the period.
| | | | | | | | | | | | | | | | | | | | |
| MWh by Segment | | 2021 | | 2020 | | 2019 |
| Commercial Solar | | 580,148 | | | 287,867 | | | 245,015 | |
| Residential Solar | | 182 | | | 4,058 | | | 32,934 | |
| Wind | | 804,558 | | | 606,725 | | | 271,118 | |
| Biomass | | 95,033 | | | 92,241 | | | 67,892 | |
| Total | | 1,479,921 | | | 990,891 | | | 616,959 | |
Offering Prices of Our Shares
The Company's shares had been offered at the following prices, based on the then current net asset value determination through the period ending September 2020. Commencing as of October 1, 2020, the offering prices were determined monthly,
as opposed to quarterly, and were based upon the Monthly Share Value. The offering prices since inception, and the dates they were effective, are as follows:
| | | | | | | | | | | | | | | | | | | | | | | | | | | | | | | | | | | | | | | | | | | | | | | | | | | | | | | | | | | | | | | | | | | |
| Period | | Class | | | | | | | | | | | |
| From | | To | | A | | C | | I | | P-A | | P-I | | P-S | | P-T | | P-D | | | | | | | | | | | |
| 25-Apr-14 | | 4-Nov-15 | | $ | 10.00 | | | $ | 9.58 | | | $ | 9.19 | | | N/A | | N/A | | N/A | | N/A | | N/A | | | | | | | | | | | |
| 5-Nov-15 | | 4-Feb-16 | | $ | 10.02 | | | $ | 9.60 | | | $ | 9.21 | | | N/A | | N/A | | N/A | | N/A | | N/A | | | | | | | | | | | |
| 5-Feb-16 | | 5-May-16 | | $ | 10.05 | | | $ | 9.62 | | | $ | 9.23 | | | N/A | | N/A | | N/A | | N/A | | N/A | | | | | | | | | | | |
| 6-May-16 | | 3-Aug-16 | | $ | 10.07 | | | $ | 9.64 | | | $ | 9.25 | | | $ | 9.59 | | | $ | 8.81 | | | N/A | | N/A | | N/A | | | | | | | | | | | |
| 4-Aug-16 | | 6-Nov-16 | | $ | 10.23 | | | $ | 9.79 | | | $ | 9.39 | | | $ | 9.79 | | | $ | 8.95 | | | N/A | | N/A | | N/A | | | | | | | | | | | |
| 7-Nov-16 | | 7-Feb-17 | | $ | 10.28 | | | $ | 9.58 | | | $ | 9.45 | | | $ | 9.78 | | | $ | 8.83 | | | N/A | | N/A | | N/A | | | | | | | | | | | |
| 8-Feb-17 | | 4-May-17 | | $ | 10.22 | | | $ | 9.53 | | | $ | 9.39 | | | $ | 9.70 | | | $ | 8.76 | | | N/A | | N/A | | N/A | | | | | | | | | | | |
| 5-May-17 | | 17-May-17 | | $ | 10.17 | | | $ | 9.48 | | | $ | 9.34 | | | $ | 9.70 | | | $ | 8.69 | | | N/A | | N/A | | N/A | | | | | | | | | | | |
| 18-May-17 | | 3-Aug-17 | | $ | 9.74 | | | $ | 9.07 | | | $ | 8.94 | | | $ | 9.70 | | | $ | 8.69 | | | N/A | | N/A | | N/A | | | | | | | | | | | |
| 4-Aug-17 | | 2-Nov-17 | | $ | 9.72 | | | $ | 9.08 | | | $ | 8.93 | | | N/A | | $ | 8.73 | | | N/A | | N/A | | N/A | | | | | | | | | | | |
| 3-Nov-17 | | 5-Feb-18 | | $ | 9.74 | | | $ | 9.09 | | | $ | 8.94 | | | N/A | | $ | 8.75 | | | N/A | | N/A | | N/A | | | | | | | | | | | |
| 6-Feb-18 | | 6-May-18 | | $ | 9.78 | | | $ | 9.09 | | | $ | 8.98 | | | $ | 9.65 | | * | $ | 8.81 | | | N/A | | N/A | | N/A | | | | | | | | | | | |
| 7-May-18 | | 2-Aug-18 | | $ | 9.80 | | | $ | 9.12 | | | $ | 9.01 | | | $ | 9.68 | | | $ | 8.84 | | | N/A | | N/A | | N/A | | | | | | | | | | | |
| 3-Aug-18 | | 31-Oct-18 | | $ | 9.83 | | | $ | 9.17 | | | $ | 9.03 | | | $ | 9.69 | | | $ | 8.90 | | | N/A | | N/A | | N/A | | | | | | | | | | | |
| 1-Nov-18 | | 6-Feb-19 | | $ | 9.79 | | | $ | 9.15 | | | $ | 8.99 | | | $ | 9.68 | | | $ | 8.89 | | | N/A | | N/A | | N/A | | | | | | | | | | | |
| 7-Feb-19 | | 6-May-19 | | $ | 9.63 | | | $ | 9.01 | | | $ | 8.84 | | | $ | 9.50 | | ** | $ | 8.76 | | | N/A | | N/A | | N/A | | | | | | | | | | | |
| 7-May-19 | | 1-Aug-19 | | N/A | | N/A | | N/A | | N/A | | $ | 8.76 | | | N/A | | N/A | | N/A | | | | | | | | | | | |
| 2-Aug-19 | | 8-Nov-19 | | N/A | | N/A | | N/A | | N/A | | $ | 8.77 | | | N/A | | N/A | | N/A | | | | | | | | | | | |
| 9-Nov-19 | | 19-Mar-20 | | N/A | | N/A | | N/A | | N/A | | $ | 8.93 | | | N/A | | N/A | | N/A | | | | | | | | | | | |
| 20-Mar-20 | | 18-May-20 | | N/A | | N/A | | N/A | | N/A | | $ | 8.90 | | | N/A | | N/A | | N/A | | | | | | | | | | | |
| 19-May-20 | | 20-Aug-20 | | N/A | | N/A | | N/A | | N/A | | $ | 8.95 | | | N/A | | N/A | | N/A | | | | | | | | | | | |
| 21-Aug-20 | | 1-Nov-20 | | N/A | | N/A | | N/A | | N/A | | $ | 9.02 | | | N/A | | N/A | | N/A | | | | | | | | | | | |
| 2-Nov-20 | | 31-Jan-21 | | N/A | | N/A | | N/A | | $ | 9.42 | | ** | $ | 9.02 | | | $ | 9.57 | | | $ | 9.60 | | | $ | 9.30 | | | | | | | | | | | | |
| 1-Feb-21 | | 26-Feb-21 | | N/A | | N/A | | N/A | | $ | 9.38 | | | $ | 8.96 | | | $ | 9.00 | | | $ | 9.53 | | | $ | 9.24 | | | | | | | | | | | | |
| 1-Mar-21 | | 31-Mar-21 | | N/A | | N/A | | N/A | | $ | 9.44 | | | $ | 9.02 | | | $ | 9.00 | | | $ | 9.53 | | | $ | 9.24 | | | | | | | | | | | | |
| 1-Apr-21 | | 30-Apr-21 | | N/A | | N/A | | N/A | | $ | 9.47 | | | $ | 9.02 | | | $ | 9.01 | | | $ | 9.53 | | | $ | 9.24 | | | | | | | | | | | | |
| 3-May-21 | | 31-May-21 | | N/A | | N/A | | N/A | | $ | 9.39 | | | $ | 8.92 | | | $ | 8.99 | | | $ | 9.50 | | | $ | 9.20 | | | | | | | | | | | | |
| 1-Jun-21 | | 30-Jun-21 | | N/A | | N/A | | N/A | | $ | 9.39 | | | $ | 8.92 | | | $ | 8.99 | | | $ | 9.50 | | | $ | 9.20 | | | | | | | | | | | | |
| 1-Jul-21 | | 1-Aug-21 | | N/A | | N/A | | N/A | | $ | 9.39 | | | $ | 8.92 | | | $ | 8.99 | | | $ | 9.50 | | | $ | 9.20 | | | | | | | | | | | | |
| 2-Aug-21 | | 31-Aug-21 | | N/A | | N/A | | N/A | | $ | 9.44 | | | $ | 8.91 | | | $ | 8.97 | | | $ | 9.54 | | | $ | 9.19 | | | | | | | | | | | | |
| 1-Sep-21 | | 30-Sep-21 | | N/A | | N/A | | N/A | | $ | 9.44 | | | $ | 8.91 | | | $ | 8.97 | | | $ | 9.54 | | | $ | 9.19 | | | | | | | | | | | | |
| 1-Oct-21 | | 31-Oct-21 | | N/A | | N/A | | N/A | | $ | 9.44 | | | $ | 8.91 | | | $ | 8.97 | | | $ | 9.54 | | | $ | 9.19 | | | | | | | | | | | | |
| 1-Nov-21 | | 30-Nov-21 | | N/A | | N/A | | N/A | | $ | 9.33 | | | $ | 8.80 | | | $ | 8.85 | | | $ | 9.41 | | | $ | 9.09 | | | | | | | | | | | | |
| 1-Dec-21 | | 31-Dec-21 | | N/A | | N/A | | N/A | | $ | 9.33 | | | $ | 8.80 | | | $ | 8.85 | | | $ | 9.41 | | | $ | 9.09 | | | | | | | | | | | | |
| 3-Jan-22 | | 31-Jan-22 | | N/A | | N/A | | N/A | | $ | 9.33 | | | $ | 8.80 | | | $ | 8.85 | | | $ | 9.41 | | | $ | 9.09 | | | | | | | | | | | | |
| 1-Feb-22 | | 28-Feb-22 | | N/A | | N/A | | N/A | | $ | 9.32 | | | $ | 8.80 | | | $ | 8.86 | | | $ | 9.40 | | | $ | 9.07 | | | | | | | | | | | | |
| 1-Mar-22 | | — | | N/A | | N/A | | N/A | | $ | 9.32 | | | $ | 8.80 | | | $ | 8.86 | | | $ | 9.40 | | | $ | 9.07 | | | | | | | | | | | | |
* Effective April 16, 2018
** Ceased February 8, 2019 and recommenced as of November 2, 2020
Liquidity and Capital Resources
As of December 31, 2021, and December 31, 2020, the Company had $92,179,779 and $4,675,836, respectively, in cash. Our current cash balance is generally reflective of the cash necessary to fund normal operations. In 2022, we anticipate continuing to (1) increase our draw on current financing facilities; (2) enter into new financing arrangements and (3) raise additional equity through our current private placement. We use our cash and additional liquidity facilities to fund the acquisition, construction and operation of renewable energy and energy efficiency and sustainable development projects, make
investments in renewable energy businesses, repay principal and interest on our borrowings, make distributions to our members and fund our operations. Our primary sources of cash have generally consisted of:
•the net proceeds from the offering;
•dividends, fees, and interest earned from our portfolio of investments, as a result of, among other things, cash flows from a project’s power sales;
•proceeds from sales of assets and capital repayments from investments;
•financing fees, retainers and structuring fees;
•tax equity capital contributions in partnerships where the Company is the managing member; and
•borrowing capacity under current and future financing sources.
Operating entities of the Company, which are accounted for as investments using fair value in the Company’s consolidated financial statements under ASC 820, had approximately $338,902,052 and $416,963,053 in outstanding notes payable collateralized by certain assets and membership interests in limited liability companies included in the Eagle Valley Biomass, Greenbacker Wind - HoldCo, GEH, Greenbacker Wind Holdings II, Other Commercial Solar, Trillium and Other Portfolios as of December 31, 2021 and December 31, 2020, respectively.
Since the Company maintains operating control over all entities with project-level debt outstanding, we have included the total amount of the debt outstanding in the below table, summarizing notes payable associated with the Company’s operating subsidiaries as well as GREC and the LLC.
On January 5, 2018, the Company, through GREC HoldCo, entered into a Credit Agreement by and among the Company, the Company’s wholly owned subsidiary, GREC, the lenders party thereto and Fifth Third Bank, as administrative agent, as sole lead arranger, sole lead bookrunner, and as swap counterparty. The credit facility (the “Credit Facility”) consisted of a loan of up to the lesser of $60,000,000 or a borrowing base amount based on various solar projects that act as collateral for the Credit Facility, of which approximately $25.7 million was drawn down at closing. The Credit Facility allowed for additional drawdowns through December 31, 2018 and converted to a term loan with a maturity on January 5, 2024.
On June 20, 2019, the Company, through GREC HoldCo, entered into an Amended and Restated Credit Agreement with the lenders party thereto and Fifth Third Bank, as administrative agent, sole lead arranger, sole lead bookrunner and swap counterparty. The new credit facility (the “New Credit Facility”) consists of a loan of up to the lesser of $110,000,000 or a borrowing base amount based on various solar projects that act as collateral for the Credit Facility, of which approximately $58.3 million was drawn down at closing. In November 2020, the Company, through GREC HoldCo, entered into the Second Amended and Restated Credit Agreement, which amends the New Credit Facility to make available a non-revolving line of Credit Facility that will convert into a term loan facility and a letter of Credit Facility. The commitments of the lenders aggregate to $97,822,841 between existing term loans, future committed loans and letters of credit, of which approximately $90.7 million was drawn down at closing. The New Credit Facility allowed for additional drawdowns through November 25, 2021, at which point the outstanding loans converted to an additional term loan that matures on June 20, 2025.
The Company used the net proceeds of borrowings under the New Credit Facility for investment in additional alternative energy power generation assets that are anticipated to become projects and for other general corporate purposes. Loans made under the New Credit Facility bear interest at 1.75% in excess of the three-month LIBOR. Prior to the New Credit Facility converting to a term loan, quarterly commitment fees on the average daily unused portion of the Credit Facility were payable at a rate per annum of 0.50%.
Borrowings under the New Credit Facility are back-levered and secured by all of the assets of GREC HoldCo and the equity interests of each direct and indirect subsidiary of the Company. The LLC, GREC and each direct and indirect subsidiary of the Company are guarantors of the Company’s obligations under the New Credit Facility. GREC has pledged all of the equity interests of GREC HoldCo as collateral for the New Credit Facility.
Regarding the Credit Facility, the Company has entered into five separate interest rate swap agreements as economic hedges. The first swap, with a trade date of June 15, 2017, an effective date of June 30, 2018 and an initial notional amount of $20,900,650, was used to swap the floating-rate interest payments on an additional principal amount of the Credit Facility, for a corresponding fixed payment. The fixed swap rate is 2.26%. The second swap, with a trade date of January 11, 2018, an
effective date of December 31, 2018 and an initial notional amount of $29,624,945 was used to swap the floating-rate interest payments on the remaining unhedged portion of the Credit Facility, as well as the estimated additional drawdowns, for a corresponding fixed payment. The fixed swap rate is 2.65%. The third swap, with a trade date of February 7, 2018, an effective date of December 31, 2018 and an initial notional amount of $4,180,063, was used to swap the floating-rate interest payments on the remaining unhedged portion of the Credit Facility, as well as the estimated additional drawdowns, for a corresponding fixed payment. The fixed swap rate is 2.97%. The fourth swap, with a trade date of January 2, 2019, an effective date of September 30, 2019 and an initial notional amount of $38,203,507, was used to swap the floating-rate interest payments on the remaining unhedged portion of the Credit Facility, as well as the estimated additional drawdowns, for a corresponding fixed payment. The fixed swap rate is 2.69%. The fifth swap, with a trade date of February 19, 2021, an effective date of February 26, 2021 and an initial notional amount of $7,068,965, was used to swap the floating-rate interest payments on the remaining unhedged portion of the Credit Facility, as well as the estimated additional drawdowns, for a corresponding fixed payment. The fixed swap rate is 1.64%.
If an event of default shall occur and be continuing under the New Credit Facility, the commitments under the New Credit Facility may be terminated and the principal amount outstanding under the New Credit Facility, together with all accrued unpaid interest and other amounts owing in respect thereof, may be declared immediately due and payable.
On December 6, 2019, the Company entered into a $15,000,000 revolving letter of credit facility (“LC Facility”) agreement with Fifth Third Bank. On January 30, 2020, the LC Facility was amended to include an equipment loan, and the amount of $5.6 million was drawn down under the equipment facility loan. On March 18, 2020, a repayment of $1.9 million was made, reducing the outstanding balance of the equipment facility loan. On June 9, 2020, a repayment of the remaining outstanding balance occurred. In October 2020, the LC Facility agreement was amended to increase the aggregate principal amount to $22,500,000. On April 1, 2021, the LC Facility agreement was amended to maintain cash collateral in an amount equal to 100% of the outstanding obligation and the letter of credit fee was reduced from 2.25% to 0.75%. On June 3, 2021, the LC Facility agreement was amended to extend the maturity date to September 4, 2021. On September 3, 2021, the LC Facility agreement was amended to extend the maturity date to September 4, 2022. On September 28, 2021, the LC Facility agreement was amended to increase the aggregate principal amount to $32,500,000.
The weighted average interest rate including associated swap agreements and deferred financing costs on all notes payable outstanding at the Company’s operating entities was 4.45% for the year ended December 31, 2021.
The following table summarizes the notes payable balances of the Company and its investment entities for the year ended December 31, 2021, in addition to committed but undrawn funds on notes payable:
| | | | | | | | | | | | | | | | | | | | | | | |
| Interest Rates | | | | |
| Range | | Weighted
Average | | Maturity Dates | | December 31,
2021 |
| Fixed rate notes payable | 1.905% - 9.088% | | 3.15 | % | | 4/3/2023 - 9/29/2049 | | $ | 35,727,885 | |
| Floating rate notes payable | 2.243% - 4.692% | | 4.59 | % | | 6/30/2022 - 11/22/2027 | | 385,325,676 | |
| | | | | | | $ | 421,053,561 | |
The following table summarizes the notes payable balances of the Company and its investment entities for the year ended December 31, 2020, in addition to committed but undrawn funds on notes payable:
| | | | | | | | | | | | | | | | | | | | | | | |
| Interest Rates | | | | |
| Range | | Weighted
Average | | Maturity Dates | | December 31,
2020 |
| Fixed rate notes payable | 1.905% - 9.088% | | 4.08 | % | | 3/1/2021 - 9/29/2049 | | $ | 60,619,233 | |
| Floating rate notes payable | 1.621% - 4.030% | | 2.31 | % | | 3/30/2021 - 12/29/2044 | | 446,489,320 | |
| | | | | | | $ | 507,108,553 | |
The principal payments due on the notes payable for the Company and its investment entities for each of the next five years ending December 31, and thereafter, including amounts expected to be drawn down on existing commitments, are as follows:
| | | | | | | | |
| Year ending December 31 | | Principal
Payments |
| 2022 | | $ | 29,954,014 | |
| 2023 | | 22,800,311 | |
| 2024 | | 22,813,223 | |
| 2025 | | 87,982,692 | |
| 2026 | | 17,240,941 | |
| Thereafter | | 240,262,380 | |
| | $ | 421,053,561 | |
In the future, we expect that our ongoing sources of financing will be through corporate-level credit facilities or other secured and unsecured borrowings. In addition, we expect to use other financing methods at the project level as necessary, including joint venture structures, construction loans, property mortgages, letters of credit, sale and leaseback transactions, other lease transactions and other arrangements, any of which may be unsecured or may be secured by mortgages or other interests in our assets. Other sources of capital may include tax equity financings, whereby an investor receives an allocation of tax benefits as well as cash distribution.
Tax equity investors are passive investors, usually large tax-paying financial entities such as banks, insurance companies and utility affiliates that use these investments to reduce future tax liabilities. Depending on the arrangement, until the tax equity investors achieve their agreed-upon rate of return, they may be entitled to a portion of the applicable project’s operating cash flow, as well as substantially all of the project’s ITCs, accelerated depreciation and taxable income or loss. Typically, tax equity financing transactions are structured so that the tax equity investors reach their target return between five and 10 years after the applicable project achieves commercial operation.
As a result, a tax equity financing may substantially reduce the cash distributions from the applicable project, and the period during which the tax equity investors receive most of their cash distributions may last longer than expected if the portfolio company’s energy projects perform below our expectations. While the terms of a tax equity financing may cause cash to be diverted away from the Company to the tax equity investor for certain periods specified in the financing arrangement (often five to 10 years, measured from commencement of the tax equity financing), then we expect to couple investments where cash is so restrained with other cash-flowing investments so as to provide cash for distributions to investors.
Hedging Activities
Regarding the Credit Facility, the Company has entered into five separate interest rate swap agreements as economic hedges. The first swap, with a trade date of June 15, 2017, an effective date of June 30, 2018 and an initial notional amount of $20,900,650, was used to swap the floating-rate interest payments on an additional principal amount of the Credit Facility, for a corresponding fixed payment. The fixed swap rate is 2.26%. The second swap, with a trade date of January 11, 2018, an effective date of December 31, 2018 and an initial notional amount of $29,624,945 was used to swap the floating-rate interest payments on the remaining unhedged portion of the Credit Facility, as well as the estimated additional drawdowns, for a corresponding fixed payment. The fixed swap rate is 2.65%. The third swap, with a trade date of February 7, 2018, an effective date of December 31, 2018 and an initial notional amount of $4,180,063, was used to swap the floating-rate interest payments on the remaining unhedged portion of the Credit Facility, as well as the estimated additional drawdowns, for a corresponding fixed payment. The fixed swap rate is 2.97%. The fourth swap, with a trade date of January 2, 2019, an effective date of September 30, 2019 and an initial notional amount of $38,203,507, was used to swap the floating-rate interest payments on the remaining unhedged portion of the Credit Facility, as well as the estimated additional drawdowns, for a corresponding fixed payment. The fixed swap rate is 2.69%. The fifth swap, with a trade date of February 19, 2021, an effective date of February 26, 2021 and an initial notional amount of $7,068,965, was used to swap the floating-rate interest payments on the remaining unhedged portion of the Credit Facility, as well as the estimated additional drawdowns, for a corresponding fixed payment. The fixed swap rate is 1.64%.
During December 2021, the Company entered into an agreement with Canadian Imperial Bank of Commerce for the purpose of hedging our investment in a pre-operating solar facility that the Company has contracted to acquire. The derivative instrument has a trade date of December 15, 2021, an effective date of March 31, 2024 and an initial notional amount of $284,692,696. The fixed rate is 1.604%. Per the terms of the agreement, the swap is contingent on the transaction closing. While the transaction has not yet closed, in order to lock in the terms, the Company made a payment for the amount of $5,000,000 to be maintained as cash collateral. As of December 31, 2021, this cash collateral is recorded in Other assets in the Consolidated Statements of Assets and Liabilities.
The Company's investment in the Canadian Northern Lights asset, included in Other Commercial Solar Portfolios, is located in and around Toronto, Ontario, Canada. As a result, we have foreign currency risk related to our revenue and operating expenses, which are denominated in Canadian Dollars as opposed to U.S. Dollars. While we are currently of the opinion that the currency fluctuation between the Canadian and U.S. Dollar will not have a material impact on our operating results, we may in the future hedge this risk through the use of currency swap transactions or other financial instruments if the impact on our results of operations becomes material.
Contractual Obligations
While the Company does not include a contractual obligations table herein, as all obligations of the Company are short term, we have included the following information related to commitments of the Company to further assist investors in understanding our outstanding commitments.
Advisory Agreement
GCM, a private firm that is registered as an investment adviser under the Advisers Act, serves as our Advisor. Under the direction of our Board of Directors, GCM manages our day-to-day operations and provides advisory and management services to us. The advisory agreement was previously approved by our Board of Directors and became effective on April 25, 2014. Unless earlier terminated, the advisory agreement will remain in effect for successive one-year periods if approved annually by a majority of our independent directors. The advisory agreement was amended and restated and approved by the Board of Directors in May 2021 with an effective date of July 1, 2021 through April 30, 2022.
Pursuant to the advisory agreement, GCM is authorized to retain one or more sub-advisors with expertise in our target assets to assist GCM in fulfilling its responsibilities under the advisory agreement. However, GCM will be required to monitor any sub-advisor to ensure that material information discussed by management of any sub-advisor is communicated to our Board of Directors, as appropriate. If GCM retains any sub-advisor, our Advisor will pay such sub-advisor a portion of the fees that it receives from us. We will not pay any additional fees to a sub-advisor. While our Advisor will oversee the performance of any sub-advisor, our Advisor will remain primarily liable to us to perform all of its duties under the advisory agreement, including those delegated to any sub-advisor. As of December 31, 2021, no sub-advisors have been retained by GCM to assist it in performing its responsibilities under the advisory agreement.
We pay GCM a base management fee for advisory and management services. Through June 30, 2021, the base management fee was calculated at a monthly rate of 0.167% (2.00% annually) of our gross assets up to $800,000,000 (including amounts borrowed). The base management fee monthly rate is 0.14583% (1.75% annually) for gross assets from $800,000,001 to $1,500,000,000 and 0.125% (1.50% annually) for gross assets greater than $1,500,000,000. The Special Unitholder, an entity affiliated with our Advisor, will hold the special unit in our Company, entitling it to a performance participation fee, as well as a liquidation performance participation fee, payable upon a listing or a liquidation.
On July 1, 2021, the Company entered into the Fourth Amended and Restated Advisory Agreement with the Advisor. Effective July 1, 2021, the base management fee payable to GCM is calculated at a monthly rate of 0.167% (2.00% annually) of the net assets until the net asset value exceeds $800,000,000. The base management fee monthly rate will decrease to 0.14583% (1.75% annually) for net assets between $800,000,001 to $1,500,000,000 and to 0.125% (1.50% annually) for net assets greater than $1,500,000,000.
Administration Agreement
Greenbacker Administration serves as our Administrator. Since commencement of operations, Greenbacker Administration delegated certain of its accounting-related administrative functions to U.S. Bancorp Fund Services, LLC (doing business as “U.S. Bank Global Fund Services”). Greenbacker Administration may enter into similar arrangements with other third-party administrators, including with respect to fund accounting and administrative services. Greenbacker Administration performs certain asset management, construction management, compliance and oversight services, as well as asset accounting and administrative services, for many of the Company’s investments. The fee for these services is billed at cost to the Company’s individual investments. During the year ended December 31, 2021, the Company incurred $13,198,810 of fees for these services. During the year ended December 31, 2020, the Company incurred $7,289,176 of fees for these services. Such fees are recorded as a reduction to Dividend income in the Consolidated Statements of Operations.
Pledge of Collateral and Unsecured Guarantee of Loans to Subsidiaries
Borrowings under the GREC EH Credit Facilities are secured by the assets, cash, agreements and equity interests in GREC HoldCo and its subsidiaries. The LLC and GREC are guarantors of GREC HoldCo’s obligations under the GREC EH Credit Facilities. Pursuant to various loan agreements between the operating entities of the Company and various lenders, the operating entities have pledged all operating assets as well as the membership interests in various operating subsidiaries as collateral for the term loans, with maturity dates ranging from June 2022 through September 2049. The amount of the unsecured guaranty on the outstanding principal of the GREC EH Credit Facility is approximately $82.2 million as of December 31, 2021.
Investment in To-Be-Constructed Assets
Pursuant to various engineering, procurement and construction contracts to which 42 entities of the Company are individually a party, the entities, and indirectly the Company, has committed an outstanding balance of approximately $540.2 million to complete construction of the facilities. Based upon current construction schedules, the expectation is that these commitments will be fulfilled in 2022 into 2024. In addition, pursuant to various membership interest purchase agreements to which the Company’s operating entities are individually a party, the operating entities, and indirectly the Company, have committed an outstanding balance of approximately $1,038.2 million as of December 31, 2021 to complete the closing pursuant to all conditions being met under the membership interest purchase agreements. The Company plans to use debt and tax equity financing as well as cash on hand to fund such commitments.
Renewable Energy Credit
For certain solar and wind power systems in the GEH, Other Commercial Solar, Greenbacker Wind Holdings II, Greenbacker Wind - HoldCo and Trillium Portfolios (the “Portfolios”), the Company has received incentives in the form of RECs. In certain cases, the Portfolios have entered into fixed-price, fixed volume forward sale transactions to monetize these RECs for specific entities. If we are unable to satisfy the transaction requirements due to lack of production, we may have to purchase RECs on the spot market and/or pay specified replacement cost damages. Based upon current production projections, we do not expect a requirement to purchase RECs to fulfill our current REC sales contracts. If RECs earned by the Portfolios are not sold on a forward basis, they are sold in the spot market, with revenue recorded in the accounts of the underlying investment when received.
Recording of a sale of RECs under GAAP is accounted for under Accounting Standards Codification Topic 606, Revenue Recognition. There are no differences in the process and related revenue recognition between REC sales to utilities and non-utility customers. Revenue is recorded in our wholly owned, single-member LLCs when all revenue recognition criteria are met, including that there is persuasive evidence that an arrangement exists (typically through a contract), services are rendered through the production of electricity, pricing is fixed and determinable under the contract and collectability is reasonably assured. The accounting policy adopted by our wholly owned, single-member LLC related to RECs is that the revenue recognition criteria are met when the energy is produced, and a REC is created and transferred to a third party.
If any of our REC counterparties fail to satisfy their contractual obligations, our costs may increase under replacement agreements that may be required. We would also likely incur expenses in locating alternative parties to provide the services we expect to receive under our advisory agreement. For the majority of the forward REC contracts currently effective as of December 31, 2021, GREC and/or the Company has provided an unsecured guaranty related to the delivery obligations under these contracts. The amount of the unsecured guaranty on REC contracts is nil as of December 31, 2021.
Pledge of Parent Company Guarantees
Pursuant to various contracts in which the Company has provided a parent company guarantee, excluding those discussed above, the operating entities, and indirectly the Company, has committed $114 million in unsecured guarantees, in the event of a default at the underlying entity as of December 31, 2021.
We currently have no off-balance-sheet arrangements, including any risk management of commodity pricing or other hedging practices.
Distributions
Subject to the Board of Directors’ review and approval and applicable legal restrictions, we intend to authorize and declare distributions on a quarterly basis and pay distributions on a monthly basis. We will calculate each member’s specific distribution amount for the period using record and declaration dates, and each member’s distributions will begin to accrue on
the date we accept each member’s subscription for shares. From time to time, we may also pay interim special distributions in the form of cash or shares, with the approval of our Board of Directors.
Distributions will be made on all classes of our shares at the same time. The cash distributions with respect to the Class C, P-S and P-T shares are lower than the cash distributions with respect to Class A, I, P-A, P-I and P-D shares because of the distribution fee relating to Class C, P-S and P-T shares, which will be allocated as a class-specific charge. Amounts distributed to each class will be allocated among the holders of our shares in such class in proportion to their shares.
Cash distributions paid during the periods presented were funded from the following sources noted below:
| | | | | | | | | | | | | | | | | |
| For the
year ended
December 31,
2021 | | For the
year ended
December 31,
2020 | | For the
year ended
December 31,
2019 |
| Cash from operations | $ | — | | | $ | 1,645,856 | | | $ | 4,213,803 | |
| Offering proceeds | 55,097,266 | | | 22,149,268 | | | 14,393,447 | |
| Total cash distributions | $ | 55,097,266 | | | $ | 23,795,124 | | | $ | 18,607,250 | |
The Company expects to continue to fund distributions from a combination of cash from operations as well as other external financing sources. Due to the Company’s change in investment portfolio composition to include a greater percentage of pre-operational assets, a significant amount of distributions will continue to be funded from other external financing sources.
Inflation
We do not anticipate that inflation will have a significant effect on our results of operations. However, in the event of a significant increase in inflation, interest rates could rise, and our projects and investments may be materially adversely affected.
Seasonality
Certain types of renewable power generation may exhibit seasonal behavior. For example, wind power generation is generally stronger in winter than in summer as wind speed tends to be higher when the weather is colder. In contrast, solar power generation is typically stronger in the summer than in the winter. This is primarily due to the brighter sunshine, longer days and shorter nights of the summer months, which generally result in the highest power output of the year for solar power. Because these seasonal variations are relatively predictable for these types of assets, we factor in the effects of seasonality when analyzing a potential investment in these target assets. Therefore, the impact that seasonality may have on our business, including the cash flows from our investments in our target assets, will depend on the diversity of our investments in renewable energy, energy efficiency and other sustainability-related projects in our overall portfolio at such time as we have fully invested the proceeds from this offering. However, in the early stages of our operations, or to the extent our initial investments are concentrated in either solar or wind power, we expect our business to be seasonal based on the type of investment, as discussed above.
ITEM 7A. QUANTITATIVE AND QUALITATIVE DISCLOSURES ABOUT MARKET RISK
The following qualitative disclosures regarding our market risk exposures — except for (i) those disclosures that are statements of historical fact; and (ii) the descriptions of how we, along with our Advisor, manage our primary market risk exposures — constitute forward-looking statements within the meaning of Section 27A of the Securities Act and Section 21E of the Exchange Act. Our primary market risk exposures as well as the strategies used and to be used by the Advisor managing such exposures are subject to numerous uncertainties, contingencies and risks, any one of which could cause the actual results of our risk controls to differ materially from the objectives of such strategies. Government interventions, defaults and expropriations, illiquid markets, the emergence of dominant fundamental factors, political upheavals, changes in historical price relationships, an influx of new market participants, increased regulation and many other factors could result in material losses as well as in material changes to our risk exposures and risk management strategies. There can be no assurance that our current market exposure and/or risk management strategies will not change materially or that any such strategies will be effective in either the short or long term. Investors must be prepared to lose all or substantially all their investment in the shares.
We anticipate that our primary market risks will be related to commodity prices, the credit quality of our counterparties and project companies and market interest rates. We will seek to manage these risks while, at the same time, seeking to provide an opportunity for members to realize attractive returns through ownership of our shares.
Commodity Price Risk
Investments in renewable energy and energy efficiency projects and businesses expose us to volatility in the market prices of electricity. To stabilize our revenue, we generally expect our projects will have PPAs with local utilities and offtakers that ensure that all or most of electricity generated by each project will be purchased at the contracted price. In the event any electricity is not purchased by the offtaker or the energy produced exceeds the offtaker’s capacity, we generally will sell that excess energy to the local utility or another suitable counterparty, which would ensure revenue is generated for all electricity produced. We may be exposed to the risk that the offtaker will fail to perform under the PPA, with the result that we will have to sell our electricity at the market price, which could be disadvantageous.
In regard to the market price of oil, our investments are little affected by the volatility in this market, as most oil consumed in the U.S. today is used for transportation infrastructure and not for the generation of electricity.
Credit Risk
Through our investments in our target assets, we expect to be indirectly exposed to credit risk relating to counterparties to the electricity sales agreements (including PPAs) for our projects as well as the businesses in which we invest. If counterparties to the electricity sales agreements for our projects or the businesses in which we invest are unable to make payments to us when due, or at all, our financial condition and results of operations could be materially adversely affected. GCM will seek to mitigate this risk by deploying a comprehensive review and asset selection process and careful ongoing monitoring of acquired assets. In addition, we expect our projects will seek contracts with high-credit-quality counterparties. Nevertheless, unanticipated credit losses could occur, which could adversely impact our operating results.
Changes in Market Interest Rates
With respect to our proposed business operations, general increases in interest rates over time may cause the interest expense associated with our borrowings to increase, and the value of our debt investments to decline. Conversely, general decreases in interest rates over time may cause the interest expense associated with our borrowings to decrease, and the value of our debt investments to increase.
Changes in Government Incentives
Retrospective changes in the levels of government incentives may have a negative impact on current investments. Prospective changes in the levels of government incentives, including renewable energy credits and investment tax credits, may impact the relative attractiveness of future investments in various renewable energy projects, which could make it difficult for GCM to find suitable investments in the sector.
ITEM 8. CONSOLIDATED FINANCIAL STATEMENTS AND SUPPLEMENTARY DATA
INDEX TO CONSOLIDATED FINANCIAL STATEMENTS
| | | | | |
| Page |
| |
| Audited Consolidated Financial Statements: | |
| |
| |
| |
| |
| |
| |
KPMG LLP
345 Park Avenue
New York, NY 10154-0102
Report of Independent Registered Public Accounting Firm
To the Members and Board of Directors Greenbacker Renewable Energy Company LLC:
Opinion on the Consolidated Financial Statements
We have audited the accompanying consolidated statements of assets and liabilities of Greenbacker Renewable Energy Company LLC and Subsidiaries (the Company), including the consolidated schedules of investments as of December 31, 2021 and 2020, the related consolidated statements of operations, changes in net assets, and cash flows for each of the years in the three-year period ended December 31, 2021, and the related notes (collectively, the consolidated financial statements). In our opinion, the consolidated financial statements present fairly, in all material respects, the financial position of the Company as of
December 31, 2021 and 2020, and the results of its operations and its cash flows for each of the years in the three-year period ended December 31, 2021, in conformity with U.S. generally accepted accounting principles.
Basis for Opinion
These consolidated financial statements are the responsibility of the Company’s management. Our responsibility is to express an opinion on these consolidated financial statements based on our audits. We are a public accounting firm registered with the Public Company Accounting Oversight Board (United States) (PCAOB) and are required to be independent with respect to the Company in accordance with the U.S. federal securities laws and the applicable rules and regulations of the Securities and Exchange Commission and the PCAOB.
We conducted our audits in accordance with the standards of the PCAOB. Those standards require that we plan and perform the audit to obtain reasonable assurance about whether the consolidated financial statements are free of material misstatement, whether due to error or fraud. The Company is not required to have, nor were we engaged to perform, an audit of its internal control over financial reporting. As part of our audits, we are required to obtain an understanding of internal control over financial reporting but not for the purpose of expressing an opinion on the effectiveness of the Company’s internal control over financial reporting.
Accordingly, we express no such opinion.
Our audits included performing procedures to assess the risks of material misstatement of the consolidated financial statements, whether due to error or fraud, and performing procedures that respond to those risks. Such procedures included examining, on a test basis, evidence regarding the amounts and disclosures in the consolidated financial statements. Our audits also included evaluating the accounting principles used and significant estimates made by management, as well as evaluating the overall presentation of the consolidated financial statements. We believe that our audits provide a reasonable basis for our opinion.
We have served as the Company’s auditor since 2012.
New York, New York
March 30, 2022
KPMG LLP, a Delaware limited liability partnership and a member firm of
the KPMG global organization of independent member firms affiliated with
KPMG International Limited, a private English company limited by guarantee.
GREENBACKER RENEWABLE ENERGY COMPANY LLC AND SUBSIDIARIES
CONSOLIDATED STATEMENTS OF ASSETS AND LIABILITIES
| | | | | | | | | | | |
| December 31,
2021 | | December 31,
2020 |
| ASSETS | | | |
| Investments in controlled/affiliated portfolios, at fair value (cost of $1,191,393,635 and $523,846,720, respectively) | $ | 1,335,063,419 | | | $ | 611,482,307 | |
| Investments in non-controlled/non-affiliated portfolios, at fair value (cost of $33,286,139 and $37,327,690, respectively) | 33,286,139 | | | 37,327,690 | |
| Investments in money market funds, at fair value (cost of $67,392,443 and $11,172,727, respectively) | 67,392,443 | | | 11,172,727 | |
| Cash and cash equivalents | 92,179,779 | | | 4,675,836 | |
| Restricted cash | 29,683,613 | | | — | |
| Shareholder contribution receivable | 2,052,750 | | | 6,418,454 | |
| Dividend receivable | 10,481,202 | | | 7,181,629 | |
| Investment sales receivable | 69,994 | | | 4,759,184 | |
| Return of capital receivable | 654,622 | | | 2,159,762 | |
| Other assets** | 11,695,159 | | | 3,198,872 | |
| Total assets | $ | 1,582,559,120 | | | $ | 688,376,461 | |
| | | |
| LIABILITIES | | | |
| Swap contracts, at fair value | $ | 7,501,983 | | | $ | 9,750,909 | |
| Deferred tax liabilities, net of allowance | 26,707,096 | | | 17,868,138 | |
| Payable for investments purchased | 1,037,461 | | | 4,451,570 | |
| Term note payable, net of financing costs | 79,413,622 | | | 86,501,654 | |
| Management fee payable | 2,271,687 | | | 1,055,600 | |
| Performance participation fee payable | 3,359,269 | | | 3,540,052 | |
| Accounts payable and accrued expenses | 2,298,343 | | | 590,404 | |
| Due to Advisor | 607,610 | | | 1,751 | |
| Shareholder distributions payable | 7,930,813 | | | 2,984,521 | |
| Payable for repurchases of common stock | 7,493,978 | | | 5,948,128 | |
| Deferred sales commission payable | 4,626,626 | | | 131,875 | |
| Total liabilities | $ | 143,248,488 | | | $ | 132,824,602 | |
| | | |
| Commitments and contingencies (Note 10. Commitments and Contingencies) | 0 | | 0 |
| | | |
| MEMBERS’ EQUITY (NET ASSETS) | | | |
| Preferred stock, par value, $.001 per share, 50,000,000 authorized; none issued and outstanding | $ | — | | | $ | — | |
| Common stock, par value, $.001 per share, 350,000,000 authorized; 165,387,519 and 62,870,347 shares issued and outstanding, respectively | 165,388 | | | 62,870 | |
| Paid-in capital in excess of par value | 1,468,107,899 | | | 550,896,111 | |
| Accumulated (losses) gains* | (28,962,655) | | | 4,592,878 | |
| Total common members’ equity | 1,439,310,632 | | | 555,551,859 | |
| Special unitholder’s equity | — | | | — | |
| Total members’ equity (net assets) | 1,439,310,632 | | | 555,551,859 | |
| Total liabilities and equity | $ | 1,582,559,120 | | | $ | 688,376,461 | |
| | | |
| Net assets, Class A (shares outstanding of 16,580,558 and 16,844,129, respectively) | $ | 137,994,947 | | | $ | 144,978,110 | |
| Net assets, Class C (shares outstanding of 2,741,963 and 2,734,661, respectively) | 22,290,310 | | | 22,836,128 | |
| Net assets, Class I (shares outstanding of 6,449,493 and 6,526,001, respectively) | 53,665,823 | | | 56,156,327 | |
| Net assets, Class P-A (shares outstanding of 783,593 and 55,264, respectively) | 6,721,670 | | | 480,799 | |
| Net assets, Class P-D (shares outstanding of 198,548 and nil, respectively) | 1,747,603 | | | — | |
| Net assets, Class P-I (shares outstanding of 92,069,013 and 36,710,292, respectively) | 810,046,418 | | | 331,100,495 | |
| Net assets, Class P-S (shares outstanding of 46,324,757 and nil, respectively) | 404,803,246 | | | — | |
| Net assets, Class P-T (shares outstanding of 239,594 and nil, respectively) | 2,040,615 | | | — | |
| Total common members’ equity | $ | 1,439,310,632 | | | $ | 555,551,859 | |
*Accumulated deficit, accumulated net realized gain on investments, and accumulated unrealized appreciation on investments, net of deferred taxes, foreign currency translation, and swap contracts are included in accumulated gains (losses).
**As of December 31, 2021, Other assets includes $5,000,000 of cash collateral associated with a derivative instrument.
The accompanying notes are an integral part of these consolidated financial statements.
F-3
GREENBACKER RENEWABLE ENERGY COMPANY LLC AND SUBSIDIARIES
CONSOLIDATED STATEMENTS OF OPERATIONS
| | | | | | | | | | | | | | | | | |
| For the year ended December 31,
2021 | | For the year ended December 31,
2020 | | For the year ended December 31,
2019 |
| Investment income: | | | | | |
| Investment income from controlled, affiliated investments: | | | | | |
| Dividend income | $ | 28,631,462 | | | $ | 21,495,843 | | | $ | 17,160,351 | |
| Interest income | — | | | 4,579 | | | 13,060 | |
| Total investment income from controlled, affiliated investments | $ | 28,631,462 | | | $ | 21,500,422 | | | $ | 17,173,411 | |
| | | | | |
| Investment income from non-controlled, non-affiliated investments: | | | | | |
| Interest income | 3,919,675 | | | 2,929,480 | | | 1,589,294 | |
| Total investment income | $ | 32,551,137 | | | $ | 24,429,902 | | | $ | 18,762,705 | |
| Operating expenses: | | | | | |
| Management fee expense | 21,940,099 | | | 10,364,635 | | | 8,461,616 | |
| Audit and tax expense | 1,812,189 | | | 1,534,984 | | | 1,156,874 | |
| Interest and financing expenses | 2,988,749 | | | 3,019,833 | | | 2,812,802 | |
| General and administration expenses | 658,439 | | | 335,912 | | | 239,202 | |
| Performance participation fee | 4,672,078 | | | 4,571,927 | | | — | |
| Legal expenses | 535,759 | | | 560,684 | | | 351,128 | |
| Directors fees and expenses | 432,860 | | | 387,249 | | | 398,845 | |
| Insurance expense | 295,958 | | | 159,237 | | | 161,610 | |
| Transfer agent expense | 701,321 | | | 529,124 | | | 477,198 | |
| Other expenses* | 4,747,308 | | | 2,068,063 | | | 489,627 | |
| Operating expenses before performance participation fee waiver | 38,784,760 | | | 23,531,648 | | | 14,548,902 | |
| Performance participation fee waiver | — | | | (747,602) | | | — | |
| Total operating expenses, net of performance participation fee waiver | 38,784,760 | | | 22,784,046 | | | 14,548,902 | |
| Net investment income before taxes | (6,233,623) | | | 1,645,856 | | | 4,213,803 | |
| (Benefit from) income taxes | (9,050,004) | | | (7,161,831) | | | (3,188,431) | |
| Franchise tax expense | 160,572 | | | — | | | 125,143 | |
| Net investment income | 2,655,809 | | | 8,807,687 | | | 7,277,091 | |
| | | | | |
| Net change in realized and unrealized gain (loss) on investments, foreign currency translation and deferred tax assets: | | | | | |
| Net realized gain (loss) on investments | (29,182) | | | 7,830,550 | | | 12,915,738 | |
| Net change in unrealized appreciation (depreciation) on: | | | | | |
| Investments | 56,023,470 | | | 51,377,370 | | | 27,296,880 | |
| Foreign currency translation | 10,727 | | | 92,019 | | | 7,589 | |
| Swap contracts | 2,248,926 | | | (4,872,567) | | | (5,002,305) | |
| (Provision for) income taxes on realized and unrealized gain (loss) on investments, foreign currency translation and swap contracts | (17,888,961) | | | (18,529,344) | | | (10,461,973) | |
| Net increase in net assets resulting from operations | 43,020,789 | | | 44,705,715 | | | 32,033,020 | |
| Net decrease in net assets attributed to special unitholder | — | | | (1,154,308) | | | (5,270,670) | |
| Net increase in net assets attributed to common members | $ | 43,020,789 | | | $ | 43,551,407 | | | $ | 26,762,350 | |
| | | | | |
| Common stock per share information —basic and diluted: | | | | | |
| Net investment income | $ | 0.02 | | | $ | 0.16 | | | $ | 0.17 | |
| Net increase in net assets attributed to common members | $ | 0.34 | | | $ | 0.81 | | | $ | 0.61 | |
| Weighted average common shares outstanding | 126,458,860 | | | 54,057,620 | | | 43,788,187 | |
*For the years ended December 31, 2021, 2020 and 2019, Other expenses includes $2,024,070, $1,702,655, and $229,731 of net realized losses on swap contracts, respectively.
The accompanying notes are an integral part of these consolidated financial statements.
GREENBACKER RENEWABLE ENERGY COMPANY LLC AND SUBSIDIARIES
CONSOLIDATED STATEMENTS OF CHANGES IN NET ASSETS
For the Years Ended December 31, 2019, 2020 and 2021
| | | | | | | | | | | | | | | | | | | | | | | | | | | | | | | | | | | | | | | | | | | | | | | | | | | | | | | | | | | | | | | | | |
| Common Members | | | | |
| Shares | | Par
Value | | Paid-in
Capital in
Excess of
Par Value | | Accumulated
Deficit | | Accumulated
Net
Realized
Gain on
Investments | | Accumulated
Unrealized
Appreciation
(Depreciation) on
Investments,
Net of
Deferred
Taxes | | Accumulated
Unrealized
Appreciation
(Depreciation)
on Foreign
Currency
Translation | | Accumulated
Unrealized
Appreciation
(Depreciation)
on Swap
Contracts | | Common
Members’
Equity | | Special
Unitholder | | Total
Members’
Equity
(Net
Assets) |
| Balances as of December 31, 2018 | 37,003,502 | | | $ | 37,004 | | | $ | 321,741,819 | | | $ | (19,870,206) | | | $ | 698,460 | | | $ | 10,458,111 | | | $ | (208,579) | | | $ | 123,962 | | | $ | 312,980,571 | | | $ | 1,797,138 | | | $ | 314,777,709 | |
| Proceeds from issuance of common stock, net | 11,086,672 | | | 11,087 | | | 97,330,310 | | | — | | | — | | | — | | | — | | | — | | | 97,341,397 | | | — | | | 97,341,397 | |
| Issuance of common stock under distribution reinvestment plan | 784,496 | | | 784 | | | 6,751,893 | | | — | | | — | | | — | | | — | | | — | | | 6,752,677 | | | — | | | 6,752,677 | |
| Repurchases of common stock | (985,060) | | | (985) | | | (8,521,405) | | | — | | | — | | | — | | | — | | | — | | | (8,522,390) | | | — | | | (8,522,390) | |
| Offering costs | — | | | — | | | (690,848) | | | — | | | — | | | — | | | — | | | — | | | (690,848) | | | — | | | (690,848) | |
| Shareholder distributions | — | | | — | | | — | | | (25,884,105) | | | — | | | — | | | — | | | — | | | (25,884,105) | | | — | | | (25,884,105) | |
| Distributions to Special Unitholder | — | | | — | | | — | | | — | | | — | | | — | | | — | | | — | | | — | | | (170,000) | | | (170,000) | |
| Net investment income | — | | | — | | | — | | | 7,277,091 | | | — | | | — | | | — | | | — | | | 7,277,091 | | | — | | | 7,277,091 | |
| Net realized gain on investments | — | | | — | | | — | | | — | | | 11,265,324 | | | — | | | — | | | — | | | 11,265,324 | | | 1,650,414 | | | 12,915,738 | |
| Net change in unrealized appreciation on investments | — | | | — | | | — | | | — | | | — | | | 22,676,163 | | | — | | | — | | | 22,676,163 | | | 4,620,717 | | | 27,296,880 | |
| Net change in unrealized appreciation on foreign currency translation | — | | | — | | | — | | | — | | | — | | | — | | | 7,589 | | | — | | | 7,589 | | | — | | | 7,589 | |
| Net change in unrealized depreciation on swap contracts | — | | | — | | | — | | | — | | | — | | | — | | | — | | | (4,001,844) | | | (4,001,844) | | | (1,000,461) | | | (5,002,305) | |
| (Provision for) income taxes on realized and unrealized gain (loss) on investments, foreign currency translation and swap contracts | — | | | — | | | — | | | — | | | — | | | (10,461,973) | | | — | | | — | | | (10,461,973) | | | — | | | (10,461,973) | |
| Balances as of December 31, 2019 | 47,889,610 | | | 47,890 | | | 416,611,769 | | | (38,477,220) | | | 11,963,784 | | | 22,672,301 | | | (200,990) | | | (3,877,882) | | | 408,739,652 | | | 6,897,808 | | | 415,637,460 | |
| Proceeds from issuance of common stock, net | 16,168,757 | | | 16,167 | | | 144,779,086 | | | — | | | — | | | — | | | — | | | — | | | 144,795,253 | | | — | | | 144,795,253 | |
| Issuance of common stock under distribution reinvestment plan | 774,551 | | | 775 | | | 6,646,246 | | | — | | | — | | | — | | | — | | | — | | | 6,647,021 | | | — | | | 6,647,021 | |
| Repurchases of common stock | (1,962,300) | | | (1,962) | | | (17,139,240) | | | — | | | — | | | — | | | — | | | — | | | (17,141,202) | | | — | | | (17,141,202) | |
| Proceeds from shares transferred | (271) | | | — | | | — | | | — | | | — | | | — | | | — | | | — | | | — | | | — | | | — | |
| Offering costs | — | | | — | | | (1,750) | | | — | | | — | | | — | | | — | | | — | | | (1,750) | | | — | | | (1,750) | |
| Shareholder distributions | — | | | — | | | — | | | (31,038,522) | | | — | | | — | | | — | | | — | | | (31,038,522) | | | — | | | (31,038,522) | |
| Distributions to Special Unitholder | — | | | — | | | — | | | — | | | — | | | — | | | — | | | — | | | — | | | (8,052,116) | | | (8,052,116) | |
| Net investment income | — | | | — | | | — | | | 8,807,687 | | | — | | | — | | | — | | | — | | | 8,807,687 | | | — | | | 8,807,687 | |
| Net realized gain on investments | — | | | — | | | — | | | — | | | 6,177,848 | | | — | | | — | | | — | | | 6,177,848 | | | 1,652,702 | | | 7,830,550 | |
| Net change in unrealized appreciation (depreciation) on investments | — | | | — | | | — | | | — | | | — | | | 51,616,418 | | | — | | | — | | | 51,616,418 | | | (239,048) | | | 51,377,370 | |
| Net change in unrealized appreciation on foreign currency translation | — | | | — | | | — | | | — | | | — | | | — | | | 92,019 | | | — | | | 92,019 | | | — | | | 92,019 | |
| Net change in unrealized depreciation on swap contracts | — | | | — | | | — | | | — | | | — | | | — | | | — | | | (4,613,221) | | | (4,613,221) | | | (259,346) | | | (4,872,567) | |
| (Provision for) income taxes on realized and unrealized gain (loss) on investments, foreign currency translation and swap contracts | — | | | — | | | — | | | — | | | — | | | (18,529,344) | | | — | | | — | | | (18,529,344) | | | — | | | (18,529,344) | |
| Balances as of December 31, 2020 | 62,870,347 | | | 62,870 | | | 550,896,111 | | | (60,708,055) | | | 18,141,632 | | | 55,759,375 | | | (108,971) | | | (8,491,103) | | | 555,551,859 | | | — | | | 555,551,859 | |
| Proceeds from issuance of common stock, net | 103,638,424 | | | 103,638 | | | 928,182,804 | | | — | | | — | | | — | | | — | | | — | | | 928,286,442 | | | — | | | 928,286,442 | |
| Issuance of common stock under distribution reinvestment plan | 1,418,253 | | | 1,418 | | | 12,289,558 | | | — | | | — | | | — | | | — | | | — | | | 12,290,976 | | | — | | | 12,290,976 | |
| Repurchases of common stock | (2,538,197) | | | (2,538) | | | (22,201,916) | | | — | | | — | | | — | | | — | | | — | | | (22,204,454) | | | — | | | (22,204,454) | |
| Proceeds from shares transferred | (1,308) | | | — | | | — | | | — | | | — | | | — | | | — | | | — | | | — | | | — | | | — | |
| Offering costs | — | | | — | | | (1,058,658) | | | — | | | — | | | — | | | — | | | — | | | (1,058,658) | | | — | | | (1,058,658) | |
| Deferred sales commissions | — | | | — | | | — | | | (5,461,652) | | | — | | | — | | | — | | | — | | | (5,461,652) | | | — | | | (5,461,652) | |
| Shareholder distributions | — | | | — | | | — | | | (71,114,670) | | | — | | | — | | | — | | | — | | | (71,114,670) | | | — | | | (71,114,670) | |
| Net investment income | — | | | — | | | — | | | 2,655,809 | | | — | | | — | | | — | | | — | | | 2,655,809 | | | — | | | 2,655,809 | |
| Net realized (loss) on investments | — | | | — | | | — | | | — | | | (29,182) | | | — | | | — | | | — | | | (29,182) | | | — | | | (29,182) | |
| Net change in unrealized appreciation on investments | — | | | — | | | — | | | — | | | — | | | 56,023,470 | | | — | | | — | | | 56,023,470 | | | — | | | 56,023,470 | |
| Net change in unrealized appreciation on foreign currency translation | — | | | — | | | — | | | — | | | — | | | — | | | 10,727 | | | — | | | 10,727 | | | — | | | 10,727 | |
| Net change in unrealized appreciation on swap contracts | — | | | — | | | — | | | — | | | — | | | — | | | — | | | 2,248,926 | | | 2,248,926 | | | — | | | 2,248,926 | |
| (Provision for) income taxes on realized and unrealized gain (loss) on investments, foreign currency translation and swap contracts | — | | | — | | | — | | | — | | | — | | | (17,888,961) | | | — | | | — | | | (17,888,961) | | | — | | | (17,888,961) | |
| Balances as of December 31, 2021 | 165,387,519 | | | $ | 165,388 | | | $ | 1,468,107,899 | | | $ | (134,628,568) | | | $ | 18,112,450 | | | $ | 93,893,884 | | | $ | (98,244) | | | $ | (6,242,177) | | | $ | 1,439,310,632 | | | $ | — | | | $ | 1,439,310,632 | |
The accompanying notes are an integral part of these consolidated financial statements.
GREENBACKER RENEWABLE ENERGY COMPANY LLC AND SUBSIDIARIES
CONSOLIDATED STATEMENTS OF CASH FLOWS
| | | | | | | | | | | | | | | | | |
| For the year ended December 31,
2021 | | For the year ended December 31,
2020 | | For the year ended December 31,
2019 |
| Operating activities | | | | | |
| Net increase in net assets from operations | $ | 43,020,789 | | | $ | 44,705,715 | | | $ | 32,033,020 | |
| Adjustments to reconcile net increase in net assets from operations to net cash used in operating activities: | | | | | |
| Amortization of deferred financing costs | 905,959 | | | 576,464 | | | 226,742 | |
| Gross funding of new or existing investments | (1,113,729,511) | | | (395,034,767) | | | (353,585,860) | |
| Return of capital | 440,266,245 | | | 212,742,142 | | | 161,551,945 | |
| Proceeds from principal payments and sales of investments | 9,928,720 | | | 67,958,438 | | | 64,254,366 | |
| Purchase of money market funds, net | (56,219,716) | | | (6,188,106) | | | 29,337,280 | |
| Net realized (gain) loss on investments | 29,182 | | | (7,830,550) | | | (12,915,738) | |
| Net change in unrealized appreciation on investments | (56,023,470) | | | (51,377,370) | | | (27,296,880) | |
| Net change in unrealized appreciation on foreign currency translation | (10,727) | | | (92,019) | | | (7,589) | |
| Net change in unrealized (appreciation) depreciation on swap contracts | (2,248,926) | | | 4,872,567 | | | 5,002,305 | |
| Deferred tax expense | 8,838,958 | | | 11,367,513 | | | 7,273,542 | |
| (Increase) decrease in other assets: | | | | | |
| Receivable for investments sold | 4,689,190 | | | 17,254,307 | | | (22,013,491) | |
| Receivable for return of capital | 1,505,140 | | | (2,159,762) | | | — | |
| Dividend receivable | (3,299,573) | | | (6,560,783) | | | (132,846) | |
| Other assets | (8,496,287) | | | (2,587,312) | | | (410,486) | |
| Increase (decrease) in other liabilities: | | | | | |
| Payable for investments purchased | (3,414,109) | | | (3,050,697) | | | 7,493,366 | |
| Management fee payable | 1,216,087 | | | 782,618 | | | (315,179) | |
| Performance participation fee payable | (180,783) | | | 3,540,052 | | | — | |
| Accounts payable and accrued expenses | 1,707,939 | | | 159,231 | | | (299,509) | |
| Net cash (used in) operating activities | (731,514,893) | | | (110,922,319) | | | (109,805,012) | |
| | | | | |
| Financing activities | | | | | |
| Borrowings on credit facility and term note | — | | | 34,736,220 | | | 55,580,682 | |
| Paydowns on credit facility and term note | (7,993,991) | | | (16,584,956) | | | (14,255,676) | |
| Payments of financing costs | — | | | (1,116,629) | | | (2,192,009) | |
| Proceeds from issuance of shares of common stock, net | 933,869,472 | | | 139,553,538 | | | 97,025,448 | |
| Distributions paid | (55,097,266) | | | (23,795,124) | | | (18,607,250) | |
| Offering costs | (452,799) | | | — | | | (710,029) | |
| Deferred sales commission | (966,901) | | | — | | | — | |
| Repurchases of common stock | (20,656,066) | | | (13,224,248) | | | (7,585,418) | |
| Distribution to Special Unitholder | — | | | (8,052,116) | | | (170,000) | |
| Net cash provided by financing activities | 848,702,449 | | | 111,516,685 | | | 109,085,748 | |
| Net increase (decrease) in cash and cash equivalents | 117,187,556 | | | 594,366 | | | (719,264) | |
| Cash, cash equivalents and restricted cash, beginning of period | 4,675,836 | | | 4,081,470 | | | 4,800,734 | |
| Cash, cash equivalents and restricted cash, end of period | $ | 121,863,392 | | | $ | 4,675,836 | | | $ | 4,081,470 | |
| | | | | |
| Reconciliation of cash, cash equivalents and restricted cash per the Consolidated Statements of Assets and Liabilities | | | | | |
| Cash and cash equivalents | $ | 92,179,779 | | | $ | 4,675,836 | | | $ | 3,652,218 | |
| Restricted cash | 29,683,613 | | | — | | | 429,252 | |
| Total cash, cash equivalents and restricted cash | $ | 121,863,392 | | | $ | 4,675,836 | | | $ | 4,081,470 | |
| | | | | |
| Supplemental disclosure of cash flow information | | | | | |
| Cash interest paid during the period | $ | 1,659,715 | | | $ | 3,289,568 | | | $ | 1,360,409 | |
| Shareholder contribution receivable from sale of common stock | $ | 2,052,750 | | | $ | 6,418,454 | | | $ | 650,000 | |
| Due to Advisor for offering costs | $ | 607,610 | | | $ | 1,751 | | | $ | — | |
| Deferred sales commission payable | $ | 4,626,626 | | | $ | 131,875 | | | $ | 56,483 | |
The accompanying notes are an integral part of these consolidated financial statements.
GREENBACKER RENEWABLE ENERGY COMPANY LLC AND SUBSIDIARIES
CONSOLIDATED SCHEDULES OF INVESTMENTS
December 31, 2021
| | | | | | | | | | | | | | | | | | | | | | | | | | | | | | | | | | | | | | |
Investments in controlled/affiliated portfolios (f) | | Interest | | Maturity | | Shares or Principal Amount | | Cost | | Fair Value | | Percentage of Net Assets (a) |
| Limited Liability Company Member Interests in the United States - Not readily marketable | | | | | | | | | | | | |
| | | | | | | | | | | | |
| Battery Storage | | | | | | 100% Ownership | | $ | 11,288,841 | | | $ | 10,747,811 | | | 0.7 | % |
| Pacifica Portfolio (e) | | | | | | | | $ | 11,288,841 | | | $ | 10,747,811 | | | 0.7 | % |
| Total Battery Storage - 0.7% | | | | | | | | | | | | |
| | | | | | | | | | | | |
| Biomass | | | | | | | | | | | | |
| Eagle Valley Biomass Portfolio | | | | | | 100% Ownership | | $ | 24,533,222 | | | $ | 17,184,912 | | | 1.2 | % |
| Total Biomass - 1.2% | | | | | | | | $ | 24,533,222 | | | $ | 17,184,912 | | | 1.2 | % |
| | | | | | | | | | | | |
| Commercial Solar | | | | | | | | | | | | |
| Celadon Portfolio (e) | | | | | | 100% Ownership or Managing Member, Equity Owner | | $ | 165,129,450 | | | $ | 187,410,880 | | | 13.0 | % |
| GEH Portfolio (e) | | | | | | 100% Ownership or Managing Member, Equity Owner | | 150,463,205 | | | 157,925,117 | | | 11.0 | % |
| Ponderosa Portfolio (e) | | | | | | 100% Ownership | | 49,514,975 | | | 59,577,751 | | | 4.1 | % |
| Sego Lily - Solar Portfolio (e) | | | | | | 100% Ownership or Managing Member, Equity Owner | | 107,621,275 | | | 122,272,431 | | | 8.5 | % |
| Trillium Portfolio | | | | | | Managing Member, Equity Owner | | 74,764,309 | | | 101,432,185 | | | 7.0 | % |
| Other Commercial Solar Portfolios (d)(e) | | | | | | 100% Ownership or Managing Member, Equity Owner or Equity Owner | | 250,865,362 | | | 302,548,767 | | | 21.0 | % |
| Total Commercial Solar - 64.6% | | | | | | | | $ | 798,358,576 | | | $ | 931,167,131 | | | 64.6 | % |
| | | | | | | | | | | | |
| Wind | | | | | | | | | | | | |
| Sego Lily - Wind Portfolio | | | | | | Managing Member, Equity Owner | | $ | 117,410,390 | | | $ | 140,965,616 | | | 9.8 | % |
| Greenbacker Wind Holdings II Portfolio | | | | | | 100% Ownership or Managing Member, Equity Owner | | 62,787,210 | | | 62,272,198 | | | 4.3 | % |
| Greenbacker Wind - HoldCo Portfolio | | | | | | 100% Ownership | | 84,674,188 | | | 78,025,844 | | | 5.4 | % |
| Other Wind Investments Portfolios | | | | | | 100% Ownership | | 56,638,076 | | | 58,770,864 | | | 4.1 | % |
| Total Wind - 23.6% | | | | | | | | $ | 321,509,864 | | | $ | 340,034,522 | | | 23.6 | % |
| | | | | | | | | | | | |
| Other Investments | | | | | | | | | | | | |
| Other Portfolios | | | | | | (c) | | $ | 35,034,396 | | | $ | 35,243,259 | | | 2.4 | % |
| Total Other Investments - 2.4% | | | | | | | | $ | 35,034,396 | | | $ | 35,243,259 | | | 2.4 | % |
| | | | | | | | | | | | |
| Energy Efficiency in the United States | | | | | | | | | | | | |
| Other Energy Efficiency Portfolios | | | | | | (b) | | $ | 668,736 | | | $ | 685,784 | | | — | % |
| Total Energy Efficiency - —% | | | | | | | | $ | 668,736 | | | $ | 685,784 | | | — | % |
| Total Investments in controlled/affiliated Portfolios | | | | | | | | $ | 1,191,393,635 | | | $ | 1,335,063,419 | | | 92.5 | % |
| | | | | | | | | | | | |
| | | | | | | | | | | | | | | | | | | | | | | | | | | | | | | | | | | | | | |
Investments in controlled/affiliated portfolios (f) | | Interest | | Maturity | | Shares or Principal Amount | | Cost | | Fair Value | | Percentage of Net Assets (a) |
| Investments in non-controlled/non-affiliated portfolios | | | | | | | | | | | | |
| Secured Loans - Not readily marketable | | | | | | | | | | | | |
| Chaberton Loan | | 8.00 | % | | 9/30/2022 | | $2,247,962 | | $ | 2,247,962 | | | $ | 2,247,962 | | | 0.2 | % |
| Encore Loan | | 10.00 | % | | 1/31/2022 | | $3,058,527 | | 3,058,527 | | | 3,058,527 | | | 0.2 | % |
| Hudson Loan | | 8.00 | % | | 1/31/2022 | | $4,984,650 | | 4,984,650 | | | 4,984,650 | | | 0.3 | % |
| Hudson II Loan | | 8.00 | % | | 1/31/2022 | | $4,227,098 | | 4,227,098 | | | 4,227,098 | | | 0.3 | % |
| New Market Loan | | 9.00 | % | | 3/31/2022 | | $5,008,070 | | 5,008,070 | | | 5,008,070 | | | 0.3 | % |
| Shepherd's Run Loan | | 8.00 | % | | 9/30/2022 | | $8,751,528 | | 8,751,528 | | | 8,751,528 | | | 0.6 | % |
| SE Solar Loan | | 9.00 | % | | 3/31/2022 | | $5,008,304 | | 5,008,304 | | | 5,008,304 | | | 0.3 | % |
| Total Secured Loans - Not readily marketable - 2.2% | | | | | | | | $ | 33,286,139 | | | $ | 33,286,139 | | | 2.2 | % |
| Total Investments in non-controlled/non-affiliated portfolios | | | | | | | | $ | 33,286,139 | | | $ | 33,286,139 | | | 2.2 | % |
| | | | | | | | | | | | |
| Investments in Money Market Funds | | | | | | | | | | | | |
| Allspring Treasury Plus Money Market Fund - Institutional Class | | | | | | $16,823,110 | | $ | 16,823,110 | | | $ | 16,823,110 | | | 1.2 | % |
| Fidelity Government Portfolio - Class I | | | | | | $16,873,111 | | 16,873,111 | | | 16,873,111 | | | 1.2 | % |
| First American Government Obligations Fund - Class X | | | | | | $16,823,111 | | 16,823,111 | | | 16,823,111 | | | 1.2 | % |
| First American Government Obligations Fund - Class Z | | | | | | $50,000 | | 50,000 | | | 50,000 | | | — | % |
| JPMorgan US Government Money Market Fund - Class L | | | | | | $16,823,111 | | 16,823,111 | | | 16,823,111 | | | 1.2 | % |
| Total Investments in Money Market Funds - 4.8% | | | | | | | | $ | 67,392,443 | | | $ | 67,392,443 | | | 4.8 | % |
| | | | | | | | | | | | |
| TOTAL INVESTMENTS: 99.5% | | | | | | | | $ | 1,292,072,217 | | | $ | 1,435,742,001 | | | 99.5 | % |
LIABILITIES IN EXCESS OF OTHER ASSETS OTHER THAN INVESTMENTS: 0.5% | | | | | | | | | | 3,568,631 | | | 0.5 | % |
| TOTAL NET ASSETS: 100.0% | | | | | | | | | | $ | 1,439,310,632 | | | 100.0 | % |
(a)Percentages are based on net assets of $1,439,310,632 as of December 31, 2021.
(b)Includes capital leases and secured loans.
(c)Includes pre-acquisition and due diligence expenses.
(d)Includes the Canadian Northern Lights assets, which are located outside of the United States of America and are a Capital Stock investment.
(e)Includes assets that have not reached COD.
(f)Refer to Note 3. Investments for discussion on the consolidation of certain underlying portfolios within this Consolidated Schedules of Investments.
Interest Rate Swaps
| | | | | | | | | | | | | | | | | | | | | | | | | | | | | | | | | | | | | | | | | | | | | | | | | | |
| Counterparty | | Pay/Receive
Floating Rate | | Floating Rate Index | | Fixed Pay Rate | | Payment Frequency | | Maturity Date | | Notional Amount | | Value | | Upfront
Premiums Paid
(Received) |
| Fifth Third Financial Risk Solutions | | Receive | | 1-MO-USD-LIBOR | | 2.261 | % | | Monthly | | 2/29/2032 | | $ | 15,406,096 | | | $ | (767,195) | | | $ | — | |
| Fifth Third Financial Risk Solutions | | Receive | | 1-MO-USD-LIBOR | | 2.648 | % | | Monthly | | 12/31/2038 | | 26,207,255 | | | (1,899,786) | | | — | |
| Fifth Third Financial Risk Solutions | | Receive | | 1-MO-USD-LIBOR | | 2.965 | % | | Monthly | | 12/31/2038 | | 3,607,242 | | | (378,543) | | | — | |
| Fifth Third Financial Risk Solutions | | Receive | | 1-MO-USD-LIBOR | | 2.688 | % | | Monthly | | 12/31/2034 | | 31,616,866 | | | (2,294,124) | | | — | |
| Fifth Third Financial Risk Solutions | | Receive | | 1-MO-USD-LIBOR | | 1.642 | % | | Monthly | | 6/30/2040 | | 5,314,050 | | | (106,475) | | | — | |
| Canadian Imperial Bank of Commerce | | Receive | | USD-SOFR-COMPOUND | | 1.604 | % | | Quarterly | | 6/30/2044 | | 284,692,696 | | | (2,055,860) | | | 5,000,000 | |
| | | | | | | | | | | | | | $ | (7,501,983) | | | $ | 5,000,000 | |
The accompanying notes are an integral part of these consolidated financial statements.
GREENBACKER RENEWABLE ENERGY COMPANY LLC AND SUBSIDIARIES
CONSOLIDATED SCHEDULES OF INVESTMENTS
December 31, 2020
| | | | | | | | | | | | | | | | | | | | | | | | | | | | | | | | | | | | | | |
| Investments in controlled/affiliated portfolios (f) | | Interest | | Maturity | | Shares or Principal Amount | | Cost | | Fair Value | | Percentage of Net Assets (a) |
| Limited Liability Company Member Interests in the United States- Not readily marketable | | | | | | | | | | | | |
| Battery Storage | | | | | | | | | | | | |
| Pacifica Portfolio (e) | | | | | | 100% Ownership | | $ | 8,839,235 | | | $ | 8,839,235 | | | 1.6 | % |
| Total Battery Storage - 1.6% | | | | | | | | $ | 8,839,235 | | | $ | 8,839,235 | | | 1.6 | % |
| | | | | | | | | | | | |
| Biomass | | | | | | | | | | | | |
| Eagle Valley Biomass Portfolio | | | | | | 100% Ownership | | $ | 23,236,352 | | | $ | 23,236,352 | | | 4.2 | % |
| Total Biomass - 4.2% | | | | | | | | $ | 23,236,352 | | | $ | 23,236,352 | | | 4.2 | % |
| | | | | | | | | | | | |
| Commercial Solar | | | | | | | | | | | | |
| GEH Portfolio | | | | | | 100% Ownership or Managing Member, Equity Owner | | $ | 114,253,479 | | | $ | 124,637,707 | | | 22.4 | % |
| Magnolia Sun Portfolio | | | | | | 100% Ownership or Managing Member, Equity Owner | | 33,008,559 | | | 36,904,011 | | | 6.6 | % |
| Other Commercial Solar Portfolios (d)(e) | | | | | | 100% Ownership or Managing Member, Equity Owner | | 67,933,619 | | | 70,814,994 | | | 12.7 | % |
| Sego Lily - Solar Portfolio (e) | | | | | | 100% Ownership | | 29,178,404 | | | 62,135,652 | | | 11.2 | % |
| Trillium Portfolio (e) | | | | | | Managing Member, Majority Equity Owner | | 83,219,738 | | | 105,913,033 | | | 19.1 | % |
| Total Commercial Solar - 72.0% | | | | | | | | $ | 327,593,799 | | | $ | 400,405,397 | | | 72.0 | % |
| | | | | | | | | | | | |
| Wind | | | | | | | | | | | | |
| Greenbacker Wind Holdings II Portfolio | | | | | | 100% Ownership or Managing Member, Equity Owner | | $ | 33,834,320 | | | $ | 35,839,967 | | | 6.5 | % |
| Greenbacker Wind - HoldCo Portfolio | | | | | | 100% Ownership | | 73,244,891 | | | 75,013,771 | | | 13.5 | % |
| Greenbacker Wind Portfolio - Maine (e) | | | | | | 100% Ownership | | 12,704,196 | | | 23,758,084 | | | 4.3 | % |
| Other Wind Investments Portfolios | | | | | | 100% Ownership or Managing Member, Majority Equity Owner | | 19,986,133 | | | 20,356,806 | | | 3.7 | % |
| Total Wind - 28.0% | | | | | | | | $ | 139,769,540 | | | $ | 154,968,628 | | | 28.0 | % |
| | | | | | | | | | | | |
| Other Investments | | | | | | | | | | | | |
| Other Portfolios | | | | | | (c) | | $ | 23,669,446 | | | $ | 23,291,114 | | | 4.2 | % |
| Total Other Investments - 4.2% | | | | | | | | $ | 23,669,446 | | | $ | 23,291,114 | | | 4.2 | % |
| | | | | | | | | | | | |
| Energy Efficiency in the United States | | | | | | | | | | | | |
| Other Energy Efficiency Portfolios | | | | | | (b) | | $ | 738,348 | | | $ | 741,581 | | | 0.2 | % |
| Total Energy Efficiency in the United States - 0.2% | | | | | | | | $ | 738,348 | | | $ | 741,581 | | | 0.2 | % |
| Total Investments in controlled/affiliated Portfolios | | | | | | | | $ | 523,846,720 | | | $ | 611,482,307 | | | 110.2 | % |
| | | | | | | | | | | | |
| Investments in non-controlled/non-affiliated portfolios | | | | | | | | | | | | |
| Secured Loans - Not readily marketable | | | | | | | | | | | | |
| Encore Loan | | 10.00 | % | | 2/28/2021 | | $10,606,725 | | $ | 10,606,725 | | | $ | 10,606,725 | | | 1.9 | % |
| Hudson Loan | | 8.00 | % | | 3/31/2021 | | $6,021,402 | | 6,021,402 | | | 6,021,402 | | | 1.1 | % |
| Hudson II Loan | | 8.00 | % | | 3/31/2021 | | $3,923,873 | | 3,923,873 | | | 3,923,873 | | | 0.7 | % |
| New Market Loan | | 9.00 | % | | 4/30/2021 | | $5,007,350 | | 5,007,350 | | | 5,007,350 | | | 0.9 | % |
| | | | | | | | | | | | | | | | | | | | | | | | | | | | | | | | | | | | | | |
| Investments in controlled/affiliated portfolios (f) | | Interest | | Maturity | | Shares or Principal Amount | | Cost | | Fair Value | | Percentage of Net Assets (a) |
| SE Solar Loan | | 9.00 | % | | 2/21/2021 | | $5,005,244 | | 5,005,244 | | | 5,005,244 | | | 0.9 | % |
| TUUSSO Loan | | 8.00 | % | | 4/30/2021 | | $6,763,096 | | 6,763,096 | | | 6,763,096 | | | 1.2 | % |
| Total Secured Loans - Not readily marketable - 6.7% | | | | | | | | $ | 37,327,690 | | | $ | 37,327,690 | | | 6.7 | % |
| Total Investments in non-controlled/non-affiliated portfolios | | | | | | | | $ | 37,327,690 | | | $ | 37,327,690 | | | 6.7 | % |
| | | | | | | | | | | | |
| Investments in Money Market Funds | | | | | | | | | | | | |
| Fidelity Government Portfolio - Class I | | | | | | $10,100,000 | | $ | 10,100,000 | | | $ | 10,100,000 | | | 1.8 | % |
| First American Government Obligation Fund - Class Z | | | | | | $1,072,720 | | 1,072,720 | | | 1,072,720 | | | 0.2 | % |
| Invesco Government & Agency Portfolio - Institutional Class | | | | | | $7 | | 7 | | | 7 | | | — | % |
| Total Investments in Money Market Funds - 2.0% | | | | | | | | $ | 11,172,727 | | | $ | 11,172,727 | | | 2.0 | % |
| | | | | | | | | | | | |
| TOTAL INVESTMENTS: 118.9% | | | | | | | | $ | 572,347,137 | | | $ | 659,982,724 | | | 118.9 | % |
LIABILITIES IN EXCESS OF OTHER ASSETS OTHER THAN INVESTMENTS: (18.9)% | | | | | | | | | | (104,430,865) | | | (18.9) | % |
| TOTAL NET ASSETS: 100.0% | | | | | | | | | | $ | 555,551,859 | | | 100.0 | % |
(a)Percentages are based on net assets of $555,551,859 as of December 31, 2020.
(b)Includes capital leases and secured loans.
(c)Includes pre-acquisition and due diligence expenses.
(d)Includes the Canadian Northern Lights assets, which are located outside of the United States of America and are a Capital Stock investment.
(e)Includes assets that have not reached COD.
(f)Refer to Note 3. Investments for discussion on the consolidation of certain underlying portfolios within the Consolidated Schedules of Investments.
Interest Rate Swaps
| | | | | | | | | | | | | | | | | | | | | | | | | | | | | | | | | | | | | | | | | | | | | | | | | | |
| Counterparty | | Pay/Receive
Floating Rate | | Floating Rate Index | | Fixed Pay Rate | | Payment Frequency | | Maturity Date | | Notional Amount | | Value | | Upfront
Premiums Paid
(Received) |
| Fifth Third Financial Risk Solutions | | Receive | | 1-MO-USD-LIBOR | | 1.110 | % | | Monthly | | 7/9/2021 | | $ | 3,033,889 | | | $ | (15,502) | | | $ | — | |
| Fifth Third Financial Risk Solutions | | Receive | | 1-MO-USD-LIBOR | | 2.261 | % | | Monthly | | 2/29/2032 | | 17,197,263 | | | (1,588,956) | | | — | |
| Fifth Third Financial Risk Solutions | | Receive | | 1-MO-USD-LIBOR | | 2.648 | % | | Monthly | | 12/31/2038 | | 25,672,154 | | | (3,388,560) | | | — | |
| Fifth Third Financial Risk Solutions | | Receive | | 1-MO-USD-LIBOR | | 2.965 | % | | Monthly | | 12/31/2038 | | 3,707,924 | | | (614,732) | | | — | |
| Fifth Third Financial Risk Solutions | | Receive | | 1-MO-USD-LIBOR | | 2.688 | % | | Monthly | | 12/31/2034 | | 34,695,980 | | | (4,143,159) | | | — | |
| | | | | | | | | | | | | | $ | (9,750,909) | | | $ | — | |
The accompanying notes are an integral part of these consolidated financial statements.
GREENBACKER RENEWABLE ENERGY COMPANY LLC AND SUBSIDIARIES
NOTES TO CONSOLIDATED FINANCIAL STATEMENTS
December 31, 2021
Note 1. Organization and Operations of the Company
Greenbacker Renewable Energy Company LLC (the “LLC”), a Delaware limited liability company formed in December 2012, is an externally managed energy company that acquires and manages income-generating renewable energy and energy efficiency projects, and other energy-related businesses, as well as finances the construction and/or operation of these and other sustainable development projects and businesses. The LLC conducts substantially all its operations through its wholly owned subsidiary, Greenbacker Renewable Energy Corporation (“GREC”).
GREC is a Maryland corporation formed in November 2011, and the LLC currently holds all the outstanding shares of capital stock of GREC. GREC Entity HoldCo LLC (“GREC HoldCo”), a wholly owned subsidiary of GREC, was formed in Delaware in June 2016. GREC Administration LLC and Danforth Shared Services LLC, both wholly owned subsidiaries of GREC, were formed in Delaware in January 2020 and May 2019, respectively. The use of “we,” “us,” “our” and the “Company” refer, collectively, to the LLC, GREC, GREC HoldCo, GREC Administration LLC and Danforth Shared Services LLC. We are externally managed and advised by our advisor, Greenbacker Capital Management LLC (the “Advisor” or “GCM”), a renewable energy, energy efficiency and sustainability-related project acquisition, consulting and development company that is registered as an investment adviser under the Investment Advisers Act of 1940, as amended (“Advisers Act”). The LLC’s fiscal year-end is December 31.
Pursuant to an initial Registration Statement filed in December 2011 (File No. 333-178786-01) and a second Registration Statement filed in February 2017 (File No. 333-211571), the LLC offered up to $1,000,000,000 in shares of limited liability company interests, or the shares, including up to $200,000,000 of shares pursuant to the LLC’s Distribution Reinvestment Plan (the “DRP”). Pursuant to the DRP, a shareholder owning publicly offered share classes may elect to have the full amount of cash distributions reinvested in additional shares. As of March 29, 2019, the LLC terminated its public offering of the shares as well as its privately offered Class P-A shares, which was subsequently reinstated as of October 18, 2020. While the LLC publicly offered three classes of shares: Classes A, C and I, as of December 31, 2021, the LLC was privately offering Classes P-A, P-I, P-D, P-T and P-S shares on a continuous basis. The publicly offered share classes had different selling commissions and dealer manager fees, and there is an ongoing distribution fee with respect to Class C shares. Following the termination of the LLC’s public offering of shares, the DRP continues to be available to existing investors who purchased shares as offered under the public offering.
As of June 4, 2019, pursuant to our Registration Statement on Form S-3D (File No. 333-231960), we offered a maximum of $10,000,000 in shares to our existing shareholders pursuant to the DRP. As of November 30, 2020, pursuant to our Registration Statement on Form S-3D (File No. 333-251021), the LLC was offering up to an additional $20,000,000 in Class A, C and I shares to our existing shareholders pursuant to the DRP. As of February 1, 2021, the DRP was amended to include all of the LLC's privately offered share classes, and thus is available to all investors as is the LLC's Share Repurchase Program. As of March 17, 2022, the Company is closed to new equity capital and is no longer offering shares except pursuant to the DRP.
As of December 31, 2021, the Company has made solar, wind, biomass, battery storage, and energy efficiency investments in 14 portfolios domiciled in the United States and in Canada, as well as 7 secured loan investments in the United States (See Note 3. Investments). As of December 31, 2020, the Company had made solar, wind, biomass, battery storage, and energy efficiency investments in 13 portfolios domiciled in the United States and in Canada, as well as 6 secured loan investments in the United States. Refer to Note 3. Investments for discussion on the consolidation of certain underlying portfolios within the Consolidated Schedules of Investments.
GREENBACKER RENEWABLE ENERGY COMPANY LLC AND SUBSIDIARIES
NOTES TO CONSOLIDATED FINANCIAL STATEMENTS
December 31, 2021
Note 2. Significant Accounting Policies
Basis of Presentation
The Company’s consolidated financial statements are prepared in accordance with U.S. generally accepted accounting principles (“GAAP”), which requires the use of estimates, assumptions and the exercise of subjective judgment as to future uncertainties. Actual results could differ from those estimates, assumptions and judgments. Significant items subject to such estimates will include determining the fair value of investments, revenue recognition, income tax uncertainties and other contingencies. The consolidated financial statements of the Company include the accounts of the LLC and its consolidated subsidiaries, GREC, GREC HoldCo, and GREC Administration LLC and Danforth Shared Services LLC, both of which provide administrative services to the Company. All intercompany accounts and transactions have been eliminated.
The Company’s consolidated financial statements are prepared using the specialized accounting principles of Accounting Standards Codification Topic 946, Financial Services—Investment Companies (“ASC Topic 946”). In accordance with this specialized accounting guidance, the Company recognizes and carries all its investments, including investments in the underlying operating entities, at fair value with changes in fair value recognized in earnings. Additionally, the Company will not apply the equity method of accounting to its investments. The Company carries its liabilities at amounts payable, net of unamortized premiums or discounts. The Company does not currently plan to elect to carry its non-investment liabilities at fair value. Net assets are calculated as the carrying amounts of assets, including the fair value of investments, less the carrying amounts of its liabilities.
The financial information associated with the December 31, 2021 consolidated financial statements has been prepared by management and, in the opinion of management, contains all adjustments and eliminations necessary for a fair presentation in accordance with GAAP.
Basis of Consolidation
As provided under Regulation S-X and ASC Topic 946, the Company will generally not consolidate its investment in a company other than a wholly owned investment company or controlled operating company whose business consists of providing services to the Company. Accordingly, the Company consolidates in its consolidated financial statements the accounts of certain wholly owned subsidiaries that meet the criteria. All significant intercompany balances and transactions have been eliminated in consolidation.
Cash and Cash Equivalents
Cash consists of demand deposits at a financial institution. Such deposits may be in excess of the Federal Deposit Insurance Corporation insurance limits. The Company has not experienced any losses in any such accounts.
As of December 31, 2021, the Company had $92,179,779 in cash presented on the Consolidated Statements of Assets and Liabilities. As of December 31, 2021, the Company did not hold any cash equivalents.
Restricted Cash
Restricted cash consists of cash accounts or letters of credit that are restricted for use on specific investments. As of December 31, 2021, restricted cash included $29,683,613 of collateral related to the ongoing construction of certain of the Company's pre-operational assets.
Foreign Currency Translation
The accounting records of the Company are maintained in U.S. Dollars. The fair value of investments and other assets and liabilities denominated in non-U.S. currencies are translated into U.S. Dollars using the exchange rate at the end of each
GREENBACKER RENEWABLE ENERGY COMPANY LLC AND SUBSIDIARIES
NOTES TO CONSOLIDATED FINANCIAL STATEMENTS
December 31, 2021
Note 2. Significant Accounting Policies (cont.)
reporting period. Amounts related to the purchases and sales of investments, investment income and expenses are translated at the rates of exchange prevailing on the respective dates of such transactions.
Net unrealized currency gains and losses arising from valuing foreign currency-denominated assets and liabilities at the current exchange rate are reflected as part of Net change in unrealized appreciation (depreciation) on Foreign currency translation in the Consolidated Statements of Operations.
Foreign security and currency translations may involve certain considerations and risks not typically associated with investing in U.S. companies and U.S. government securities. These risks include, but are not limited to, currency fluctuations and revaluations and future adverse political, social and economic developments, which could cause investments in foreign markets to be less liquid and prices to be more volatile than those of comparable U.S. companies or U.S. government securities.
Valuation of Investments at Fair Value
Accounting Standards Codification Topic 820, Fair Value Measurement (“ASC Topic 820”) defines fair value, establishes a framework for measuring fair value in accordance with GAAP and expands disclosures about fair value. The Company recognizes and accounts for its investments at fair value. The fair value of the investments does not reflect transaction costs that may be incurred upon disposition of the investments.
Fair value is defined as the price that would be received to sell an asset or paid to transfer a liability in an orderly transaction between market participants. Fair value is an exchange price notion under which fair value is the price in an orderly transaction between market participants to sell an asset or transfer a liability in the market in which the reporting entity would transact for the asset or liability.
The Advisor has established procedures to estimate the fair value of its investments that the Company’s Board of Directors has reviewed and approved. To the extent that such market data is available, the Company will use observable market data to estimate the fair value of investments. In the absence of quoted market prices in active markets, or quoted market prices for similar assets in markets that are not active, the Company will use the valuation methodologies described below with unobservable data based on the best available information in the circumstances. These methodologies incorporate the Company’s assumptions about the factors that a market participant would use to value the asset.
The Company considers investments in money market funds to be short-term investments. Short-term investments are stated at cost, which approximates fair value.
For investments for which quoted market prices are not available, which comprise most of our investment portfolio, fair value is estimated by using the cost, income, or market approach. The income approach assumes that value is created by the expectation of future benefits, discounted by a risk premium, to calculate a current cash value. This estimate is the fair value: the amount an investor would be willing to pay to receive those future benefits. The market approach compares either recent comparable transactions to the investment or an offer to purchase an investment based upon a qualified bid: a signed term sheet and/or a signed purchase agreement. Adjustments to proposed prices are made to account for the probability of the deal closing, changes between proposed and executed terms, and any dissimilarity between the comparable transactions and their underlying investments. If multiple bids are qualified in the same valuation period, a blended market approach will be calculated.
Prior to the second quarter of 2020, fair value for pre-operational assets was approximated using the cost approach. Beginning in the second quarter of 2020, our Advisor expanded the criteria whereby certain pre-operational assets are identified and qualified for the income approach, rather than the cost approach, for approximating fair value. Currently, we consider all owned assets that are fully construction ready with no impediments to begin construction and where the costs to complete such projects are well understood for the income approach. The fair value of such eligible projects is determined based upon a discounted cash flow methodology. If the portfolio has any significant portion of value that remains subject to negotiation or contract or if other significant risks to complete the project exist, the investment may be held at cost, as an approximation of fair value. These valuation methodologies involve a significant degree of judgment by management.
GREENBACKER RENEWABLE ENERGY COMPANY LLC AND SUBSIDIARIES
NOTES TO CONSOLIDATED FINANCIAL STATEMENTS
December 31, 2021
Note 2. Significant Accounting Policies (cont.)
In determining the appropriate fair value of an investment using these approaches, the most significant information and assumptions include, as applicable: available current market data, including relevant and applicable comparable market transactions, applicable market yields and multiples, security covenants, call protection provisions, information rights, the nature and realizable value of any collateral, the investment’s ability to make payments, its earnings and discounted cash flows, the markets in which the project does business, comparisons of financial ratios of peer companies that are public, comparable mergers and acquisitions, the principal market and enterprise values and environmental factors, among other factors.
The estimated fair values will not necessarily represent the amounts that may be ultimately realized due to the occurrence or non-occurrence of future circumstances that cannot be reasonably determined. Because of the inherent uncertainty of the valuation of the investments, the estimate of fair values may differ significantly from the value that would have been used had a broader market for the investments existed.
The authoritative accounting guidance prioritizes the use of market-based inputs over entity-specific inputs and establishes a three-level hierarchy for fair value measurements based upon the transparency of inputs to the valuation. The three levels of valuation hierarchy are defined as follows:
Level 1: Unadjusted quoted prices for identical assets or liabilities in active markets.
Level 2: Other significant observable inputs that are sourced either directly or indirectly from publications or pricing services, including dealer or broker markets, for identical or comparable assets or liabilities. Generally, these inputs should be widely accepted and public, non-proprietary and sourced from an independent third party.
Level 3: Inputs derived from a significant amount of unobservable market data and derived primarily through the use of internal valuation methodologies.
In all cases, the level in the fair value hierarchy within which the fair value measurement in its entirety falls will be determined based on the lowest level of input that is significant to the fair value measurement. Our assessment of the significance of an input to the fair value measurement in its entirety requires judgment and considers factors specific to each investment.
Calculation of Net Asset Value
Net asset value ("NAV") by share class is calculated by subtracting total liabilities for each class from the total carrying amount of all assets for that class, which includes the fair value of investments. Net asset value per share is calculated by dividing net asset value for each class by the total number of outstanding common shares for that class on the reporting date. For purposes of calculating our NAV, we carry all liabilities at cost.
Earnings per Share
In accordance with the provisions of ASC Topic 260—Earnings per Share (“ASC Topic 260”), basic earnings per share is computed by dividing earnings available to common members by the weighted average number of shares outstanding during the period. Other potentially dilutive common shares, and the related impact to earnings, are considered when calculating earnings per share on a diluted basis.
The following information sets forth the computation of the weighted average basic and diluted net increase in net assets attributed to common members per share and net investment income per share for the years ended December 31, 2021, 2020 and 2019, respectively.
GREENBACKER RENEWABLE ENERGY COMPANY LLC AND SUBSIDIARIES
NOTES TO CONSOLIDATED FINANCIAL STATEMENTS
December 31, 2021
Note 2. Significant Accounting Policies (cont.)
| | | | | | | | | | | | | | | | | |
| For the year ended December 31,
2021 | | For the year ended December 31,
2020 | | For the year ended December 31,
2019 |
| Basic and diluted | | | | | |
| Net investment income | $ | 2,655,809 | | | $ | 8,807,687 | | | $ | 7,277,091 | |
| Net increase in net assets attributed to common members | $ | 43,020,789 | | | $ | 43,551,407 | | | $ | 26,762,350 | |
| Net investment income per share | $ | 0.02 | | | $ | 0.16 | | | $ | 0.17 | |
| Net increase in net assets attributed to common members per share | $ | 0.34 | | | $ | 0.81 | | | $ | 0.61 | |
| Weighted average common shares outstanding | 126,458,860 | | | 54,057,620 | | | 43,788,187 | |
Revenue Recognition
To the extent the Company expects to collect such amounts, interest income is recorded on an accrual basis. If there is reason to doubt an ability to collect such interest, interest receivable on loans and debt securities is not accrued for accounting purposes. Original issue discounts, market discounts or market premiums are accreted or amortized using the effective interest method as interest income. Prepayment premiums on loans and debt securities are recorded as interest income when received. Any application, origination or other fees earned by the Company in arranging or issuing debt are amortized over the expected term of the loan.
Loans are placed on non-accrual status when principal and interest are 90 days or more past due, or when there is a reasonable doubt that principal or interest will be collected. Accrued interest is generally reversed when a loan is placed on non-accrual. Interest payments received on non-accrual loans may be recognized as income or applied to principal depending upon management’s judgment regarding collectability. Non-accrual loans are generally restored to accrual status when past due and principal and interest is paid and, in management’s judgment, is likely to remain current.
Dividend income is recorded when dividends are declared and determined that collection is probable. The timing and amount of dividend income is determined on at least a quarterly basis. This process includes an analysis at the individual project company level based on cash available from operations and working capital needed for the project company operations. Dividend income from our privately held, equity investments is recognized when approved. On a quarterly basis at a minimum, dividends received from the Company’s project companies, which generally reflect net cash flow from operations, are declared, accrued and paid.
Net Realized Gains or Losses and Net Change in Unrealized Appreciation or Depreciation on Investments
Without regard to unrealized appreciation or depreciation previously recognized, realized gains or losses will be measured as the difference between the net proceeds from the sale, repayment, or disposal of an asset and the adjusted cost basis of the asset. Net change in unrealized appreciation or depreciation will reflect the change in investment values during the reporting period, including any reversal of previously recorded unrealized appreciation or depreciation when gains or losses are realized.
Payment-in-Kind
For loans and debt securities with contractual payment-in-kind interest, if the fair value of the investment indicates that such interest is collectible, any interest will be added to the principal balance of such investments and be recorded as income.
Distribution Policy
Distributions to members, if any, will be authorized and declared by our Board of Directors quarterly in advance and paid monthly. From time to time, we may also pay interim special distributions in the form of cash or shares, with the approval of
GREENBACKER RENEWABLE ENERGY COMPANY LLC AND SUBSIDIARIES
NOTES TO CONSOLIDATED FINANCIAL STATEMENTS
December 31, 2021
Note 2. Significant Accounting Policies (cont.)
our Board of Directors. Distributions will be made on all classes of shares at the same time. The cash distributions paid to the shareholder with respect to the Class C, P-S and P-T shares will be lower than the cash distributions with respect to the LLC's other share classes because of the distribution fee associated with the Class C, P-S and P-T shares, which is allocated specifically to these classes' net assets. Amounts distributed to each class are allocated amongst the holders of the shares in such class in proportion to their shares. Distributions declared by our Board of Directors are recognized as distribution liabilities on the ex-dividend date.
Organization and Offering Costs
Organization and offering costs (“O&O costs”), other than sales commissions and the dealer manager fee, were initially paid by our Advisor and/or dealer manager on behalf of the Company in connection with its formation and the offering of its shares pursuant to now-terminated Registration Statements on Form S-1 (File No. 333-178786-01 and File No. 333-211571, respectively).
The Company was obligated to reimburse our Advisor for O&O costs that it incurred on behalf of the Company, in accordance with the advisory agreement. However, with respect to the Company’s public offerings, the aggregate of selling commissions, dealer manager fees and the other O&O costs borne by the Company was not to exceed 15% of gross offering proceeds.
Offering costs incurred by our Advisor in conjunction with the offering of shares of Class P-A, P-S, P-T and P-D under our private placement memoranda are subject to the reimbursement by the Company up to 0.50% (50 basis points) of gross offering proceeds for each such class of shares.
The costs incurred by our Advisor and/or dealer manager are recognized as a liability of the Company to the extent that the Company is obligated to reimburse our Advisor and/or dealer manager. When recognized by the Company, organizational costs are expensed and offering costs, excluding selling commissions and dealer manager fees, are recognized as a reduction of the proceeds from the offering. As of December 31, 2021, $1,058,658 in O&O costs were incurred by our Advisor with respect to the Company’s continuous offering, of which $607,610 is a current payable and the remaining $0 is a contingent liability of the Company. As of December 31, 2020, $94,486 in O&O costs were incurred by our Advisor with respect to the Company’s continuous offering, of which $1,751 was a current payable and the remaining $92,735 was a contingent liability of the Company.
The following table provides information in regard to the status of O&O costs related to the continuous offering as of December 31, 2021:
| | | | | | | | |
| | December 31, 2021 |
| Total O&O costs incurred by the Advisor and dealer manager | | $ | 1,058,658 | |
| Amounts previously reimbursed to the Advisor/dealer manager by the Company | | 451,048 | |
| Amounts accrued and/or payable to Advisor by the Company | | 607,610 | |
| Amounts of the contingent liability subject to payment by the Company only upon adequate gross offering proceeds being raised | | $ | — | |
The following table provides information in regard to the status of O&O costs related to the terminated offering as of December 31, 2020:
GREENBACKER RENEWABLE ENERGY COMPANY LLC AND SUBSIDIARIES
NOTES TO CONSOLIDATED FINANCIAL STATEMENTS
December 31, 2021
Note 2. Significant Accounting Policies (cont.)
| | | | | | | | |
| | December 31,
2020 |
| Total O&O costs incurred by the Advisor and dealer manager | | $ | 94,486 | |
| Amounts previously reimbursed to the Advisor/dealer manager by the Company | | — | |
| Amounts accrued and/or payable to Advisor by the Company | | 1,751 | |
| Amounts of the contingent liability subject to payment by the Company only upon adequate gross offering proceeds being raised | | $ | 92,735 | |
Financing Costs
Financing costs incurred by the Company for the issuance of debt liabilities are deferred and amortized using the straight-line method over the life of the debt liability. Financing costs related to debt liabilities incurred by the Company are presented on the Consolidated Statements of Assets and Liabilities as a direct deduction from the carrying amount of that debt liability.
Return of Capital Receivable
For operational assets, if the project company has inadequate cash to fund day-to-day expenses, the Company will loan funds to that project company through an investment. Once the project company has adequate cash, they will repay the loan by sending a return of capital distribution. As of December 31, 2021, and 2020, a return of capital receivable of $654,622 and $2,159,762, respectively, was recorded on the Consolidated Statements of Assets and Liabilities.
Capital Gains Incentive Allocation and Distribution
Pursuant to the terms of the LLC’s Third Amended and Restated Limited Liability Company Agreement, a capital gains incentive allocation was earned by GREC Advisors, LLC (the “Special Unitholder”), an affiliate of our Advisor, on realized gains (net of realized and unrealized losses) since inception from the sale of investments from the Company’s portfolio during operations prior to a liquidation of the Company. While the terms of the LLC’s Third Amended and Restated Limited Liability Company Agreement did not contemplate the inclusion of unrealized gains in the calculation of the capital gains incentive allocation, the Company included unrealized gains in the calculation of the capital gains incentive distribution. This amount reflected the incentive distribution that would have been payable if the Company’s entire portfolio was liquidated at its fair value as of the Consolidated Statements of Assets and Liabilities date, even though the Special Unitholder was not entitled to an incentive distribution with respect to unrealized gains unless and until such gains were realized. Thus, on each date that net asset value was calculated, the Company calculated the capital gains incentive distribution as if it were due and payable as of the end of such period and reflected as an allocation of equity between common members and the Special Unitholder.
The capital gains incentive allocation was eliminated with the adoption of the Fourth Amended and Restated Limited Liability Company Agreement in August 2020 (as amended in November 2020, the “Operating Agreement”). A one-time distribution (settlement) in the amount of $4,749,000 was mutually agreed upon by the Company and the Special Unitholder. The remaining $4,193,559 was written off by reclassifying the Special Unitholder’s equity into common members' equity upon adoption of the Operating Agreement. The $(1,154,308) is presented on the Consolidated Statements of Operations as the Net decrease in net assets attributed to special unitholder for the year ended December 31, 2020. The Special unitholder’s equity on the Consolidated Statements of Assets and Liabilities as of December 31, 2020 is nil.
Performance Participation Fee
Under the Operating Agreement, the incentive fee payable by the Company was simplified to be structured with two components: the performance participation fee and the liquidation performance participation fee (each as defined in Note 5. Related Party Agreements and Transaction Agreements). The performance participation fee is based on the Company's total return amount during the relevant calculation period. The calculation of the performance participation fee is further detailed in Note 5. Related Party Agreements and Transaction Agreements. The performance participation fee is accounted for and classified as an operating expense and reflected as the performance participation fee on the Consolidated Statements of
GREENBACKER RENEWABLE ENERGY COMPANY LLC AND SUBSIDIARIES
NOTES TO CONSOLIDATED FINANCIAL STATEMENTS
December 31, 2021
Note 2. Significant Accounting Policies (cont.)
Operations. Under the new Operating Agreement, a performance participation fee payable of $3,359,269 and $3,540,052 was recorded as of December 31, 2021 and December 31, 2020, respectively, in the Consolidated Statements of Assets and Liabilities. The Performance Participation Fee recorded on the Consolidated Statements of Operations for the years ended December 31, 2021 and 2020 is $4,672,078 and $4,571,927, respectively.
As disclosed in the 2020 Form 10-K, a result of the revisions to prior period financial statements discussed in Note 12. Revisions to Prior Period Financial Statements, there were a certain amount of proceeds paid under the Company’s share repurchase program that otherwise would not have been paid due to the misstatement historically impacting the Company’s share repurchase price. As a result, the Special Unitholder waived $(747,602) of performance participation fees for the year ended December 31, 2020, which is recorded as Performance participation fee waiver in the Consolidated Statements of Operations.
Deferred Sales Commissions
The Company defers certain costs, principally sales commissions and related compensation, which are paid to the dealer manager and may be reallowed to financial advisors and broker-dealers in the future in connection with the sale of shares sold with a reduced front-end load sales charge and a trail fee. The costs expected to be incurred at the time of the sale of the Class C shares are recorded as a liability on the date of sale and represents the aggregate amount due for such costs over the period beginning at the time of sale and ending on the earlier date of (1) when the maximum amount of sales commission and related compensation is reached under regulatory regulations; (2) the date which approximates an expected liquidity event for the Company; or (3) the expected holding period of the investment. The costs expected to be incurred at the time of the sale of the Class P-T and Class P-S shares are recorded as a liability on the date of sale and represents the aggregate amount due for such costs over the period beginning at the time of sale and ending on the earlier date of (1) the date which approximates an expected liquidity event for the Company; or (2) the expected holding period of the investment. The estimated amount of the liability can be updated as management’s assumption surrounding an expected liquidity event changes or if the maximum of sales-related commissions and costs under regulatory regulations is attained. As of December 31, 2021, and 2020, the Company recorded a liability for deferred sales commissions in the amount of $4,626,626 and $131,875, respectively.
Reclassifications
Certain prior year amounts have been reclassified to conform with current year presentation. These reclassifications had no impact on prior periods’ results. Refer to Note 3. Investments for discussion on the consolidation of certain underlying portfolios within the Consolidated Schedules of Investments.
Derivative Instruments
The Company may utilize interest rate swaps to modify interest rate characteristics of existing debt obligations to manage interest rate exposure. These are recorded at fair value either as assets or liabilities in the accompanying Consolidated Statements of Assets and Liabilities with changes in the fair value of interest rate swaps during the period recognized as either an unrealized appreciation or depreciation in the accompanying Consolidated Statements of Operations. On the expiration, termination or settlement of a derivatives contract, the Company generally records a gain or loss. When there is a master netting agreement with a financial institution, any gain or loss on interest rate swaps with the same financial institution are netted for financial statement presentation.
The fair value of interest rate swap contracts open as of December 31, 2021 is included on the Consolidated Schedule of Investments by contract. For the year ended December 31, 2021, the Company’s average monthly notional exposure to interest rate swap contracts was $109,591,475.
GREENBACKER RENEWABLE ENERGY COMPANY LLC AND SUBSIDIARIES
NOTES TO CONSOLIDATED FINANCIAL STATEMENTS
December 31, 2021
Note 2. Significant Accounting Policies (cont.)
Consolidated Statements of Assets and Liabilities – Fair Values of Derivatives at December 31, 2021
| | | | | | | | | | | | | | | | | | | | | | | |
| | Asset Derivatives | Liability Derivatives |
| Risk Exposure | | Consolidated Statement of Assets and Liabilities Location | | Fair Value | Consolidated Statement of Assets and Liabilities Location | | Fair Value |
| Swaps | | | | | | | |
| Interest Rate Risk | | Swap contracts, at fair value | | $ | — | | Swap contracts, at fair value | | $ | 7,501,983 | |
| | | | $ | — | | | | $ | 7,501,983 | |
Consolidated Statements of Assets and Liabilities – Fair Value of Derivatives at December 31, 2020
| | | | | | | | | | | | | | | | | | | | | | | |
| | Asset Derivatives | Liability Derivatives |
| Risk Exposure | | Consolidated Statement of Assets and Liabilities Location | | Fair Value | Consolidated Statement of Assets and Liabilities Location | | Fair Value |
| Swaps | | | | | | | |
| Interest Rate Risk | | Swap contracts, at fair value | | $ | — | | Swap contracts, at fair value | | $ | 9,750,909 | |
| | | | $ | — | | | | $ | 9,750,909 | |
The effect of derivative instruments on the Consolidated Statements of Operations
| | | | | | | | | | | | | | | | | | | | |
| Risk Exposure | | Change in net unrealized depreciation on derivative transactions for the year ended December 31,
2021 | | Change in net unrealized depreciation on derivative transactions for the year ended December 31,
2020 | | Change in net unrealized depreciation on derivative transactions for the year ended December 31,
2019 |
| Swaps | | | | | | |
| Interest Rate Risk | | $ | 2,248,926 | | | $ | (4,872,567) | | | $ | (5,002,305) | |
| | $ | 2,248,926 | | | $ | (4,872,567) | | | $ | (5,002,305) | |
| | | | | | | | | | | | | | | | | | | | |
| Risk Exposure | | Other expenses for the year ended December 31,
2021 | | Other expenses for the year ended December 31,
2020 | | Other expenses for the year ended December 31,
2019 |
| Swaps | | | | | | |
| Interest Rate Risk | | $ | 2,024,070 | | | $ | 1,702,655 | | | $ | 229,731 | |
| | $ | 2,024,070 | | | $ | 1,702,655 | | | $ | 229,731 | |
GREENBACKER RENEWABLE ENERGY COMPANY LLC AND SUBSIDIARIES
NOTES TO CONSOLIDATED FINANCIAL STATEMENTS
December 31, 2021
Note 2. Significant Accounting Policies (cont.)
By using derivative instruments, the Company is exposed to the counterparty’s credit risk – the risk that derivative counterparties may not perform in accordance with the contractual provisions offset by the value of any collateral received. The Company’s exposure to credit risk associated with counterparty non-performance is limited to collateral posted and the unrealized gains inherent in such transactions that are recognized in the Consolidated Statements of Assets and Liabilities. As appropriate, the Company minimizes counterparty credit risk through credit monitoring procedures and managing margin and collateral requirements.
During December 2021, the Company entered into an agreement with Canadian Imperial Bank of Commerce for the purpose of hedging our investment in a pre-operating solar facility that the Company has contracted to acquire. The derivative instrument has a trade date of December 15, 2021, an effective date of March 31, 2024 and an initial notional amount of $284,692,696. The fixed rate is 1.604%. Per the terms of the agreement, the swap is contingent on the transaction closing. While the transaction has not yet closed, in order to lock in the terms, the Company made a payment for the amount of $5,000,000 to be maintained as cash collateral. As of December 31, 2021, this cash collateral is recorded in Other assets in the Consolidated Statements of Assets and Liabilities.
Regarding our investment in the Canadian Northern Lights assets included in the Other Commercial Solar Portfolios, we have foreign currency risk related to our revenue and operating expenses, which are denominated in Canadian Dollars as opposed to U.S. Dollars.
Income Taxes
The LLC intends to operate so that it will qualify to be treated as a partnership for U.S. federal income tax purposes under the Internal Revenue Code. As such, it will not be subject to any U.S. federal and state income taxes. In any year, it is possible that the LLC will not meet the qualifying income exception and will not qualify to be treated as a partnership. If the LLC does not meet the qualifying income exception, the members would then be treated as stockholders in a corporation, and the Company would become taxable as a corporation for U.S. federal income tax purposes under the Internal Revenue Code. The LLC would be required to pay income tax at corporate rates on its net taxable income. To the extent of the Company’s earnings and profits, and the payment of the distributions would not be deductible by the LLC, distributions to members from the LLC would constitute dividend income taxable to such members.
The LLC plans to conduct substantially all its operations through its wholly owned subsidiary, GREC, which is a corporation that is subject to U.S. federal, state, and local income taxes. Accordingly, most of its operations will be subject to U.S. federal, state, and local income taxes. As of December 31, 2021, including territories and provinces, the portfolio resides in 36 jurisdictions.
Income taxes are accounted for under the assets and liabilities method. Deferred tax assets and liabilities are recorded for the estimated future tax consequences attributable to differences between items that are recognized in the consolidated financial statements and tax returns in different years. Deferred tax assets and liabilities are measured using enacted tax rates expected to apply to taxable income in the years in which those temporary differences are expected to be recovered or settled. The effect on deferred tax assets and liabilities of a change in tax rates is recognized in income in the period that includes the enactment date.
For income tax benefits to be recognized, including uncertain tax benefits, a tax position must be more likely than not to be sustained upon examination by taxing authorities. The amount recognized is measured as the largest amount of the benefit that is more likely than not to be realized upon ultimate settlement. A valuation allowance is established against net deferred tax assets if, based on the weight of available evidence, it is more likely than not that some or all of the net deferred tax assets will not be realized. Changes in recognition or measurement are reflected in the period in which the change in judgment occurs. Interest and penalties associated with income taxes, if any, will be recognized in general and administrative expense.
The Company does not consolidate its investments for financial statements; rather, it accounts for its investments at fair value under the specialized accounting of ASC Topic 946. The tax attributes of the individual investments will be considered and incorporated in the Company’s fair value estimates for those investments. The amounts recognized in the consolidated financial statements for unrealized appreciation and depreciation will result in a difference between the consolidated financial
GREENBACKER RENEWABLE ENERGY COMPANY LLC AND SUBSIDIARIES
NOTES TO CONSOLIDATED FINANCIAL STATEMENTS
December 31, 2021
Note 2. Significant Accounting Policies (cont.)
statements and the cost basis of the assets for tax purposes. These differences will be recognized as deferred tax assets and liabilities. Generally, the entities that hold the Company’s investments will be included in the consolidated tax return of GREC and the differences between the amounts recognized for financial statement purposes and the tax return will be recognized as additional deferred tax assets and liabilities.
The Company follows the authoritative guidance on accounting for uncertainty in income taxes and has concluded it has no material uncertain tax positions to be recognized at this time.
The Company assessed its tax positions for all open tax years as of December 31, 2021 for all U.S. federal and state tax jurisdictions for the years 2014 through 2021. The results of this assessment are included in the Company’s tax provision and deferred tax assets as of December 31, 2021.
Recently Issued Accounting Pronouncements
In August 2018, the FASB issued ASU No. 2018-13, “Fair Value Measurement (Topic 820): Disclosure Framework—Changes to the Disclosure Requirements for Fair Value Measurement,” which modifies the disclosure requirements on fair value measurements. The new guidance is effective for fiscal years, and interim periods within those fiscal years, beginning after December 15, 2019 (fiscal 2020 for the Company). Upon the effective date, certain provisions are to be applied prospectively, while others are to be applied retrospectively to all periods presented. An entity is permitted to early adopt any removed or modified disclosures upon issuance of this ASU and delay adoption of the additional disclosures until their effective date. Beginning on January 1, 2020, we have adopted ASU 2018-13 in our consolidated financial statements and disclosures.
In March 2020, the FASB issued ASU No. 2020-04, “Reference Rate Reform (Topic 848): Facilitation of the Effects of Reference Rate Reform on Financial Reporting,” which provides companies with optional financial reporting alternatives to reduce the cost and complexity associated with the accounting for contracts and hedging relationships affected by reference rate reform. The amendments in this update are effective for all entities as of March 12, 2020 through December 31, 2022. An entity may elect to apply the amendments for contracts as of any date from the beginning of an interim period that includes or is subsequent to March 12, 2020. As of December 31, 2021, we have not elected to apply the optional amendments and are currently evaluating the impact of the ASU and the effect on our consolidated financial statements.
Revisions to Prior Period Financial Statements
As disclosed in the 2020 Form 10-K and discussed further in Note 12. Revisions to Prior Period Financial Statements, we identified errors related to deferred tax assets included in our consolidated financial statements for the quarterly period ended September 30, 2016 and each subsequent quarterly and annual period through the quarterly period ending June 30, 2020. The deferred tax assets error related to the capital gains incentive allocation and distribution earned by the “Special Unitholder.” The LLC intends to operate so that it will qualify to be treated as a partnership for U.S. federal income tax purposes under the Internal Revenue Code. As such, it will not be subject to any U.S. federal and state income taxes. Since the capital gains incentive allocation and distribution was the responsibility of the LLC, and the LLC is not subject to any income taxes, there should not have been a corresponding deferred tax asset recorded in the consolidated financial statements.
In accordance with the guidance in the FASB ASC Topic 250, Accounting Changes and Error Corrections; ASC Topic 250-10-S99-1, Assessing Materiality; and ASC Topic 250-10-S99-1, Considering the Effects of Prior Year Misstatements in Current Year Financial Statements, we concluded that our previously issued consolidated financial statements were not materially misstated as a result of these errors. We revised our previously reported quarterly and annual consolidated financial statements for the periods since September 30, 2016. The historical periods presented in this Annual Report on Form 10-K have been revised with corresponding adjustment to accumulated gains (losses) on the Consolidated Statements of Assets and Liabilities to correct for these errors. See Note 12. Revisions to Prior Period Financial Statements for the impact of the revisions on each of the individual affected line items in the consolidated financial statements.
GREENBACKER RENEWABLE ENERGY COMPANY LLC AND SUBSIDIARIES
NOTES TO CONSOLIDATED FINANCIAL STATEMENTS
December 31, 2021
Note 3. Investments
During the first quarter of 2021, the Company modified the presentation of the Consolidated Schedule of Investments to consolidate certain underlying portfolios. Certain portfolios that had been separately presented on the Consolidated Schedule of Investments are now aggregated with other portfolios in the same industry to be presented in a consolidated manner on the Consolidated Schedule of Investments. These consolidation efforts had no impact on the underlying portfolios or their individual cost or fair values, but rather represent the aggregation of several similar investments. Certain portfolios, including those determined to be individually significant, remain presented separately. Management believes that the consolidation of our portfolios results in a presentation that more accurately reflects the way in which we view our overall portfolio of investments and will enhance the information reported to the users of our financial statements.
Management has recast the Schedule of Investments as of December 31, 2020 to conform with current year presentation based upon the methodology as outlined above.
GREENBACKER RENEWABLE ENERGY COMPANY LLC AND SUBSIDIARIES
NOTES TO CONSOLIDATED FINANCIAL STATEMENTS
December 31, 2021
Note 3. Investments (cont.)
The composition of the Company’s investments as of December 31, 2021, at fair value, were as follows:
| | | | | | | | | | | | | | | | | |
| Investments at
Cost | | Investments at
Fair Value | | Fair Value
Percentage of
Total Portfolio |
| Battery Storage: | | | | | |
| Pacifica Portfolio | $ | 11,288,841 | | | $ | 10,747,811 | | | 0.7 | % |
| Subtotal | $ | 11,288,841 | | | $ | 10,747,811 | | | 0.7 | % |
| Biomass: | | | | | |
| Eagle Valley Biomass Portfolio | $ | 24,533,222 | | | $ | 17,184,912 | | | 1.2 | % |
| Subtotal | $ | 24,533,222 | | | $ | 17,184,912 | | | 1.2 | % |
| Commercial Solar: | | | | | |
| Celadon Portfolio | $ | 165,129,450 | | | $ | 187,410,880 | | | 13.1 | % |
| GEH Portfolio | 150,463,205 | | | 157,925,117 | | | 11.0 | % |
| Ponderosa Portfolio | 49,514,975 | | | 59,577,751 | | | 4.1 | % |
| Sego Lily - Solar Portfolio | 107,621,275 | | | 122,272,431 | | | 8.5 | % |
| Trillium Portfolio | 74,764,309 | | | 101,432,185 | | | 7.1 | % |
| Other Commercial Solar Portfolios | 250,865,362 | | | 302,548,767 | | | 21.1 | % |
| Subtotal | $ | 798,358,576 | | | $ | 931,167,131 | | | 64.9 | % |
| Wind: | | | | | |
| Sego Lily - Wind Portfolio | $ | 117,410,390 | | | $ | 140,965,616 | | | 9.8 | % |
| Greenbacker Wind Holdings II Portfolio | 62,787,210 | | | 62,272,198 | | | 4.3 | % |
| Greenbacker Wind - HoldCo Portfolio | 84,674,188 | | | 78,025,844 | | | 5.4 | % |
| Other Wind Investments Portfolios | 56,638,076 | | | 58,770,864 | | | 4.1 | % |
| Subtotal | $ | 321,509,864 | | | $ | 340,034,522 | | | 23.6 | % |
| Other Investments: | | | | | |
| Other Portfolios | $ | 35,034,396 | | | $ | 35,243,259 | | | 2.5 | % |
| Subtotal | $ | 35,034,396 | | | $ | 35,243,259 | | | 2.5 | % |
| Energy Efficiency: | | | | | |
| Other Energy Efficiency Portfolios | $ | 668,736 | | | $ | 685,784 | | | 0.1 | % |
| Subtotal | $ | 668,736 | | | $ | 685,784 | | | 0.1 | % |
| Secured Loans: | | | | | |
| Chaberton Loan | $ | 2,247,962 | | | $ | 2,247,962 | | | 0.2 | % |
| Encore Loan | 3,058,527 | | | 3,058,527 | | | 0.2 | % |
| Hudson Loan | 4,984,650 | | | 4,984,650 | | | 0.3 | % |
| Hudson II Loan | 4,227,098 | | | 4,227,098 | | | 0.3 | % |
| New Market Loan | 5,008,070 | | | 5,008,070 | | | 0.3 | % |
| Shepherd's Run Loan | 8,751,528 | | | 8,751,528 | | | 0.6 | % |
| SE Solar Loan | 5,008,304 | | | 5,008,304 | | | 0.3 | % |
| Subtotal | $ | 33,286,139 | | | $ | 33,286,139 | | | 2.2 | % |
| Investments in Money Market Funds: | | | | | |
| Allspring Treasury Plus Money Market Fund - Institutional Class | $ | 16,823,110 | | | $ | 16,823,110 | | | 1.2 | % |
| Fidelity Government Portfolio - Class I | 16,873,111 | | | 16,873,111 | | | 1.2 | % |
| First American Government Obligations Fund - Class X | 16,823,111 | | | 16,823,111 | | | 1.2 | % |
| First American Government Obligations Fund - Class Z | 50,000 | | | 50,000 | | | — | % |
| JPMorgan US Government Money Market Fund - Class L | 16,823,111 | | | 16,823,111 | | | 1.2 | % |
| Subtotal | $ | 67,392,443 | | | $ | 67,392,443 | | | 4.8 | % |
| Total | $ | 1,292,072,217 | | | $ | 1,435,742,001 | | | 100.0 | % |
GREENBACKER RENEWABLE ENERGY COMPANY LLC AND SUBSIDIARIES
NOTES TO CONSOLIDATED FINANCIAL STATEMENTS
December 31, 2021
Note 3. Investments (cont.)
The composition of the Company’s investments as of December 31, 2020, at fair value, were as follows:
| | | | | | | | | | | | | | | | | |
| Investments at
Cost | | Investments at
Fair Value | | Fair Value
Percentage of
Total Portfolio |
| Battery Storage: | | | | | |
| Pacifica Portfolio | $ | 8,839,235 | | | $ | 8,839,235 | | | 1.3 | % |
| Subtotal | $ | 8,839,235 | | | $ | 8,839,235 | | | 1.3 | % |
| Biomass: | | | | | |
| Eagle Valley Biomass Portfolio | $ | 23,236,352 | | | $ | 23,236,352 | | | 3.5 | % |
| Subtotal | $ | 23,236,352 | | | $ | 23,236,352 | | | 3.5 | % |
| Commercial Solar: | | | | | |
| GEH Portfolio | $ | 114,253,479 | | | $ | 124,637,707 | | | 18.9 | % |
| Magnolia Sun Portfolio | 33,008,559 | | | 36,904,011 | | | 5.6 | % |
| Other Commercial Solar Portfolios | 67,933,619 | | | 70,814,994 | | | 10.7 | % |
| Sego Lily - Solar Portfolio | 29,178,404 | | | 62,135,652 | | | 9.4 | % |
| Trillium Portfolio | 83,219,738 | | | 105,913,033 | | | 16.1 | % |
| Subtotal | $ | 327,593,799 | | | $ | 400,405,397 | | | 60.7 | % |
| Wind: | | | | | |
| Greenbacker Wind Holdings II Portfolio | $ | 33,834,320 | | | $ | 35,839,967 | | | 5.4 | % |
| Greenbacker Wind - HoldCo Portfolio | 73,244,891 | | | 75,013,771 | | | 11.4 | % |
| Greenbacker Wind Portfolio - Maine | 12,704,196 | | | 23,758,084 | | | 3.6 | % |
| Other Wind Investments Portfolios | 19,986,133 | | | 20,356,806 | | | 3.1 | % |
| Subtotal | $ | 139,769,540 | | | $ | 154,968,628 | | | 23.5 | % |
| Other Investments: | | | | | |
| Other Portfolios | $ | 23,669,446 | | | $ | 23,291,114 | | | 3.5 | % |
| Subtotal | $ | 23,669,446 | | | $ | 23,291,114 | | | 3.5 | % |
| Energy Efficiency: | | | | | |
| Other Energy Efficiency Portfolios | $ | 738,348 | | | $ | 741,581 | | | 0.1 | % |
| Subtotal | $ | 738,348 | | | $ | 741,581 | | | 0.1 | % |
| Secured Loans: | | | | | |
| Encore Loan | $ | 10,606,725 | | | $ | 10,606,725 | | | 1.6 | % |
| Hudson Loan | 6,021,402 | | | 6,021,402 | | | 0.9 | % |
| Hudson II Loan | 3,923,873 | | | 3,923,873 | | | 0.6 | % |
| New Market Loan | 5,007,350 | | | 5,007,350 | | | 0.8 | % |
| SE Solar Loan | 5,005,244 | | | 5,005,244 | | | 0.8 | % |
| TUUSSO Loan | $ | 6,763,096 | | | $ | 6,763,096 | | | 1.0 | % |
| Subtotal | $ | 37,327,690 | | | $ | 37,327,690 | | | 5.7 | % |
| Investments Money Market Funds: | | | | | |
| Fidelity Government Portfolio - Class I | $ | 10,100,000 | | | $ | 10,100,000 | | | 1.5 | % |
| First American Government Obligation Fund - Class Z | 1,072,720 | | | 1,072,720 | | | 0.2 | % |
| Invesco Government & Agency Portfolio - Institutional Class | 7 | | | 7 | | | — | % |
| Subtotal | $ | 11,172,727 | | | $ | 11,172,727 | | | 1.7 | % |
| Total | $ | 572,347,137 | | | $ | 659,982,724 | | | 100.0 | % |
GREENBACKER RENEWABLE ENERGY COMPANY LLC AND SUBSIDIARIES
NOTES TO CONSOLIDATED FINANCIAL STATEMENTS
December 31, 2021
Note 3. Investments (cont.)
The counterparty to all the energy efficiency investments held by the Company as of December 31, 2021 and December 31, 2020 is a related party (See Note 5. Related Party Agreements and Transaction Agreements).
The composition of the Company’s investments as of December 31, 2021 by geographic region, at fair value, were as follows:
| | | | | | | | | | | | | | | | | |
| Investments at
Cost | | Investments at
Fair Value | | Fair Value
Percentage of
Total Portfolio |
| United States: | | | | | |
| East Region | $ | 376,929,916 | | | $ | 444,160,983 | | | 30.9 | % |
| Mid - West Region | 222,573,610 | | | 233,427,679 | | | 16.3 | |
| Mountain Region | 268,907,355 | | | 286,693,236 | | | 20.0 | |
| South Region | 105,516,478 | | | 111,030,877 | | | 7.7 | |
| West Region | 249,149,279 | | | 291,286,897 | | | 20.3 | |
| Total United States | $ | 1,223,076,638 | | | $ | 1,366,599,672 | | | 95.2 | % |
| Canada: | 1,603,136 | | | 1,749,886 | | | 0.1 | |
| Money Markets: | 67,392,443 | | | 67,392,443 | | | 4.7 | |
| Total | $ | 1,292,072,217 | | | $ | 1,435,742,001 | | | 100.0 | % |
The composition of the Company’s investments as of December 31, 2020 by geographic region, at fair value, were as follows:
| | | | | | | | | | | | | | | | | |
| Investments at
Cost | | Investments at
Fair Value | | Fair Value
Percentage of
Total Portfolio |
| United States: | | | | | |
| East Region | $ | 148,159,362 | | | $ | 168,616,615 | | | 25.5 | % |
| Mid - West Region | 120,709,771 | | | 127,384,880 | | | 19.3 | |
| Mountain Region | 113,435,944 | | | 153,512,583 | | | 23.3 | |
| South Region | 83,302,384 | | | 85,763,612 | | | 13.0 | |
| West Region | 93,963,813 | | | 111,842,679 | | | 16.9 | |
| Total United States | $ | 559,571,274 | | | $ | 647,120,369 | | | 98.0 | % |
| Canada: | 1,603,136 | | | 1,689,628 | | | 0.3 | |
| Money Markets: | 11,172,727 | | | 11,172,727 | | | 1.7 | |
| Total | $ | 572,347,137 | | | $ | 659,982,724 | | | 100.0 | % |
GREENBACKER RENEWABLE ENERGY COMPANY LLC AND SUBSIDIARIES
NOTES TO CONSOLIDATED FINANCIAL STATEMENTS
December 31, 2021
Note 3. Investments (cont.)
The composition of the Company’s investments as of December 31, 2021 by industry, at fair value, were as follows:
| | | | | | | | | | | | | | | | | |
| Investments at
Cost | | Investments at
Fair Value | | Fair Value
Percentage of
Total Portfolio |
Battery Storage (2) | $ | 11,288,841 | | | $ | 10,747,811 | | | 0.7 | % |
| Biomass | 24,533,222 | | | 17,184,912 | | | 1.2 | |
Commercial Solar (1) (2) | 831,644,715 | | | 964,453,270 | | | 67.2 | |
| Wind | 321,509,864 | | | 340,034,522 | | | 23.7 | |
| Other Investments | 35,034,396 | | | 35,243,259 | | | 2.5 | |
| Energy Efficiency | 668,736 | | | 685,784 | | | — | |
| Money Market Funds | 67,392,443 | | | 67,392,443 | | | 4.7 | |
| Total | $ | 1,292,072,217 | | | $ | 1,435,742,001 | | | 100.0 | % |
(1) Includes loans in the amount of $33,286,139.
(2) Includes assets that have not reached COD.
The composition of the Company’s investments as of December 31, 2020 by industry, at fair value, were as follows:
| | | | | | | | | | | | | | | | | |
| Investments at
Cost | | Investments at
Fair Value | | Fair Value
Percentage of
Total Portfolio |
| Biomass | $ | 23,236,352 | | | $ | 23,236,352 | | | 3.5 | % |
Commercial Solar (1) (2) | 364,921,489 | | | 437,733,087 | | | 66.4 | |
Battery Storage (2) | 8,839,235 | | | 8,839,235 | | | 1.3 | |
Wind (2) | 139,769,540 | | | 154,968,628 | | | 23.5 | |
| Other Investments | 23,669,446 | | | 23,291,114 | | | 3.5 | |
| Energy Efficiency | 738,348 | | | 741,581 | | | 0.1 | |
| Money Market Funds | 11,172,727 | | | 11,172,727 | | | 1.7 | |
| Total | $ | 572,347,137 | | | $ | 659,982,724 | | | 100.0 | % |
(1) Includes loans in the amount of $37,327,690.
(2) Includes assets that have not reached COD.
Investments held as of December 31, 2021 and 2020 are considered Control Investments, which are defined as investments in companies in which the Company owns 25% or more of the voting securities of such company, have greater than 50% representation on such company’s board of directors, or are investments in limited liability companies for which the Company serves as managing member.
GREENBACKER RENEWABLE ENERGY COMPANY LLC AND SUBSIDIARIES
NOTES TO CONSOLIDATED FINANCIAL STATEMENTS
December 31, 2021
Note 4. Fair Value Measurements — Investments
The following table presents fair value measurements of investments, by major class, as of December 31, 2021, according to the fair value hierarchy:
| | | | | | | | | | | | | | | | | | | | | | | |
| Valuation Inputs |
| Level 1 | | Level 2 | | Level 3 | | Fair Value |
| Limited Liability Company Member Interests | $ | — | | | $ | — | | | $ | 1,332,932,893 | | | $ | 1,332,932,893 | |
| Capital Stock | — | | | — | | | 1,749,886 | | | 1,749,886 | |
| Energy Efficiency Secured Loans | — | | | — | | | 380,640 | | | 380,640 | |
| Secured Loans - Other | — | | | — | | | 33,286,139 | | | 33,286,139 | |
| Money Market Funds | 67,392,443 | | | — | | | — | | | 67,392,443 | |
| Total | $ | 67,392,443 | | | $ | — | | | $ | 1,368,349,558 | | | $ | 1,435,742,001 | |
| Other Financial Instruments* | | | | | | | |
| Open swap contracts - liabilities | $ | — | | | $ | (7,501,983) | | | $ | — | | | $ | (7,501,983) | |
| Total | $ | — | | | $ | (7,501,983) | | | $ | — | | | $ | (7,501,983) | |
*Other financial instruments are derivatives, such as futures, forward currency contracts, and swaps. These instruments are reflected at the unrealized appreciation (depreciation) on the instrument.
The following table presents fair value measurements of investments, by major class, as of December 31, 2020, according to the fair value hierarchy:
| | | | | | | | | | | | | | | | | | | | | | | |
| Valuation Inputs |
| Level 1 | | Level 2 | | Level 3 | | Fair Value |
| Limited Liability Company Member Interests | $ | — | | | $ | — | | | $ | 609,394,039 | | | $ | 609,394,039 | |
| Capital Stock | — | | | — | | | 1,689,628 | | | 1,689,628 | |
| Energy Efficiency Secured Loans | — | | | — | | | 398,640 | | | 398,640 | |
| Secured Loans - Other | — | | | — | | | 37,327,690 | | | 37,327,690 | |
| Money Market Funds | 11,172,727 | | | — | | | — | | | 11,172,727 | |
| Total | $ | 11,172,727 | | | $ | — | | | $ | 648,809,997 | | | $ | 659,982,724 | |
| Other Financial Instruments* | | | | | | | |
| Open swap contracts - liabilities | $ | — | | | $ | (9,750,909) | | | $ | — | | | $ | (9,750,909) | |
| Total | $ | — | | | $ | (9,750,909) | | | $ | — | | | $ | (9,750,909) | |
*Other financial instruments are derivatives, such as futures, forward currency contracts, and swaps. These instruments are reflected at the unrealized appreciation (depreciation) on the instrument.
GREENBACKER RENEWABLE ENERGY COMPANY LLC AND SUBSIDIARIES
NOTES TO CONSOLIDATED FINANCIAL STATEMENTS
December 31, 2021
Note 4. Fair Value Measurements — Investments (cont.)
The following table provides a reconciliation of the beginning and ending balances for investments that use Level 3 inputs for the year ended December 31, 2021:
| | | | | | | | | | | | | | | | | | | | | | | | | | | | | | | | | | | | | | | | | | | | | | | |
| Balance as of December 31,
2020 | | Net change
in
unrealized
appreciation
on
investments | | Translation
of assets and
liabilities
denominated
in foreign
currencies | | Purchases | | Cost adjustments (1) | | Sales and repayments of investments (2) | | Net realized
loss on
investments | | Balance as of December 31,
2021 |
| Limited Liability Company Member Interests | $ | 609,394,039 | | | $ | 55,973,939 | | | $ | — | | | $ | 1,089,298,390 | | | $ | (440,266,245) | | | $ | 18,561,952 | | | $ | (29,182) | | | $ | 1,332,932,893 | |
| Capital Stock | 1,689,628 | | | 49,531 | | | 10,727 | | | — | | | — | | | — | | | — | | | 1,749,886 | |
| Energy Efficiency - Secured Loans | 398,640 | | | — | | | — | | | — | | | — | | | (18,000) | | | — | | | 380,640 | |
| Secured Loans - Other | 37,327,690 | | | — | | | — | | | 24,431,121 | | | — | | | (28,472,672) | | | — | | | 33,286,139 | |
| Total | $ | 648,809,997 | | | $ | 56,023,470 | | | $ | 10,727 | | | $ | 1,113,729,511 | | | $ | (440,266,245) | | | $ | (9,928,720) | | | $ | (29,182) | | | $ | 1,368,349,558 | |
(1)Includes paid-in-kind interest, return of capital and additional investments in existing investments, if any.
(2)Includes principal repayments on loans.
The total change in unrealized appreciation included in the Consolidated Statements of Operations within Net change in unrealized appreciation (depreciation) on Investments and Foreign currency translation for the year ended December 31, 2021 attributable to Level 3 investments still held as of December 31, 2021 was $56,034,197. Reclassifications impacting Level 3 of the fair value hierarchy are reported as transfers in or out of Level 3 as of the beginning of the period in which the reclassifications occur. There were no reclassifications attributable to Level 3 investments during the year ended December 31, 2021.
The following table provides a reconciliation of the beginning and ending balances for investments that use Level 3 inputs for the year ended December 31, 2020:
| | | | | | | | | | | | | | | | | | | | | | | | | | | | | | | | | | | | | | | | | | | | | | | |
| Balance as of December 31,
2019 | | Net change in unrealized appreciation on investments | | Translation of assets and liabilities denominated in foreign currencies | | Purchases | | Cost adjustments (1) | | Sales and repayments of investments (2) | | Net realized gain on investments | | Balance as of December 31,
2020 |
| Limited Liability Company Member Interests | $ | 449,981,086 | | | $ | 51,391,716 | | | $ | — | | | $ | 380,144,045 | | | $ | (212,742,142) | | | $ | (67,211,216) | | | $ | 7,830,550 | | | $ | 609,394,039 | |
| Capital Stock | 1,611,955 | | | (14,346) | | | 92,019 | | | — | | | — | | | — | | | — | | | 1,689,628 | |
| Energy Efficiency - Secured Loans | 479,140 | | | — | | | — | | | — | | | — | | | (80,500) | | | — | | | 398,640 | |
| Secured Loans - Other | 23,103,690 | | | — | | | — | | | 14,890,722 | | | — | | | (666,722) | | | — | | | 37,327,690 | |
| Total | $ | 475,175,871 | | | $ | 51,377,370 | | | $ | 92,019 | | | $ | 395,034,767 | | | $ | (212,742,142) | | | $ | (67,958,438) | | | $ | 7,830,550 | | | $ | 648,809,997 | |
(1)Includes paid-in-kind interest, return of capital and additional investments in existing investments, if any.
(2)Includes principal repayments on loans.
The total change in unrealized appreciation included in the Consolidated Statements of Operations within Net change in unrealized appreciation (depreciation) on Investments and Foreign currency translation for the year ended December 31, 2020 attributable to Level 3 investments still held as of December 31, 2020 was $62,789,888. Reclassifications impacting Level 3 of the fair value hierarchy are reported as transfers in or out of Level 3 as of the beginning of the period in which the reclassifications occur. There were no reclassifications attributable to Level 3 investments during the year ended December 31, 2020.
GREENBACKER RENEWABLE ENERGY COMPANY LLC AND SUBSIDIARIES
NOTES TO CONSOLIDATED FINANCIAL STATEMENTS
December 31, 2021
Note 4. Fair Value Measurements — Investments (cont.)
The following table provides a reconciliation of the beginning and ending balances for investments that use Level 3 inputs for the year ended December 31, 2019:
| | | | | | | | | | | | | | | | | | | | | | | | | | | | | | | | | | | | | | | | | | | | | | | |
| Balance as of December 31,
2018 | | Net change in unrealized appreciation on investments | | Translation of assets and liabilities denominated in foreign currencies | | Purchases | | Cost adjustments (1) | | Sales and Repayments of investments (2) | | Net realized gain on investments | | Balance as of December 31,
2019 |
| Limited Liability Company Member Interests | $ | 304,542,921 | | | $ | 27,774,068 | | | $ | — | | | $ | 314,175,394 | | | $ | (159,495,169) | | | $ | (49,931,866) | | | $ | 12,915,738 | | | $ | 449,981,086 | |
| Capital Stock | 2,081,554 | | | (477,188) | | | 7,589 | | | — | | | — | | | — | | | — | | | 1,611,955 | |
| Energy Efficiency - Secured Loans | 551,640 | | | — | | | — | | | — | | | — | | | (72,500) | | | — | | | 479,140 | |
| Secured Loans - Other | — | | | — | | | — | | | 39,410,466 | | | (2,056,776) | | | (14,250,000) | | | — | | | 23,103,690 | |
| Total | $ | 307,176,115 | | | $ | 27,296,880 | | | $ | 7,589 | | | $ | 353,585,860 | | | $ | (161,551,945) | | | $ | (64,254,366) | | | $ | 12,915,738 | | | $ | 475,175,871 | |
(1)Includes paid-in-kind interest, return of capital and additional investments in existing investments, if any.
(2)Includes principal repayments on loans.
The total change in unrealized appreciation included in the Consolidated Statements of Operations within Net change in unrealized appreciation (depreciation) on Investments and Foreign currency translation for the year ended December 31, 2019 attributable to Level 3 investments still held as of December 31, 2019 was $27,304,469. Reclassifications impacting Level 3 of the fair value hierarchy are reported as transfers in or out of Level 3 as of the beginning of the period in which the reclassifications occur. There were no reclassifications attributable to Level 3 investments during the year ended December 31, 2019.
GREENBACKER RENEWABLE ENERGY COMPANY LLC AND SUBSIDIARIES
NOTES TO CONSOLIDATED FINANCIAL STATEMENTS
December 31, 2021
Note 4. Fair Value Measurements — Investments (cont.)
As of December 31, 2021, most of the Company's portfolio investments utilized Level 3 inputs. The following table presents the quantitative information about Level 3 fair value measurements of the Company’s investments as of December 31, 2021:
| | | | | | | | | | | | | | | | | | | | | | | |
| Fair Value | | Valuation Techniques | | Unobservable Inputs | | Range of Inputs
(weighted average) |
| Battery Storage* | $ | 10,747,811 | | | Income Approach and Transaction Cost | | Discount rate, kWh storage, potential leverage and estimated remaining useful life | | 9.37%, 2.16% annual degradation in production, 11 years |
| Biomass | $ | 17,184,912 | | | Income Approach | | Discount rate, kWh production, potential leverage and estimated remaining useful life | | 8.25%, No annual degradation in production, 12 years |
| Commercial Solar* | $ | 931,167,131 | | | Income Approach and Transaction Cost | | Discount rate, kWh production, potential leverage and estimated remaining useful life | | 3.50%–9.07% (7.63%), 0%–0.50% (0.50%) annual degradation in production, 9.2–39.0 (33.6) years |
| Wind | $ | 340,034,522 | | | Income Approach | | Discount rate, kWh production, potential leverage and estimated remaining useful life | | 7.75%–8.43% (7.81%), No annual degradation in production, 18.7–31.0 (26.4) years |
| Other Investments | $ | 35,243,259 | | | Transaction Cost | | Not Applicable | | Not Applicable |
| Energy Efficiency | $ | 685,784 | | | Income and Collateral-Based Approach | | Market yields and value of collateral | | 10.25%, No annual degradation in production, 3.2–4.0 (3.6) years |
| Secured Loans | $ | 33,286,139 | | | Yield Analysis | | Market yields | | 8.00%–10.00% (8.48%) |
*Includes assets that have not reached COD.
As of December 31, 2020, most of the Company’s portfolio investments utilized Level 3 inputs. The following table presents the quantitative information about Level 3 fair value measurements of the Company’s investments as of December 31, 2020:
GREENBACKER RENEWABLE ENERGY COMPANY LLC AND SUBSIDIARIES
NOTES TO CONSOLIDATED FINANCIAL STATEMENTS
December 31, 2021
Note 4. Fair Value Measurements — Investments (cont.)
| | | | | | | | | | | | | | | | | | | | | | | |
| Fair Value | | Valuation Techniques | | Unobservable Inputs | | Range of Inputs (weighted average) |
| Battery Storage* | $ | 8,839,235 | | | Transaction Cost | | Not Applicable | | Not Applicable |
| Biomass | $ | 23,236,352 | | | Transaction Cost | | Not Applicable | | Not Applicable |
| Commercial Solar* | $ | 400,405,397 | | | Income Approach | | Discount rate, kWh production, potential leverage and estimated remaining useful life | | 7.25%–8.59% (8.01%) 0.50% annual degradation in production 8.5–40.0 (33.7) years |
| Wind* | $ | 154,968,628 | | | Income Approach and Transaction Cost | | Discount rate, kWh production, potential leverage and estimated remaining useful life | | 7.75%–9.25% (8.42%) No annual degradation in production, 19.7–30.7 (24.4) years |
| Other Investments | $ | 23,291,114 | | | Transaction Cost | | Not Applicable | | Not Applicable |
| Energy Efficiency | $ | 741,581 | | | Income and Collateral-Based Approach | | Income-Based Approach and Market yields | | 10.25% No annual degradation in production 4.2–5.0 (4.6) years |
| Secured Loans | $ | 37,327,690 | | | Yield Analysis | | Market yields | | 8.00%–10.00% (8.84%) |
*Includes assets that have not reached COD.
GREC utilizes primarily proprietary discounted cash flow pricing models in the fair value measurement of the Company’s investments. Significant unobservable inputs include discount rates and estimates related to the future production of electricity. Significant increases or decreases in discount rates used or actual kilowatt-hour production can significantly increase or decrease the fair value measurement.
GREENBACKER RENEWABLE ENERGY COMPANY LLC AND SUBSIDIARIES
NOTES TO CONSOLIDATED FINANCIAL STATEMENTS
December 31, 2021
Note 5. Related Party Agreements and Transaction Agreements
The Company has executed advisory and administration agreements with the Advisor and Greenbacker Administration, LLC, our administrator, respectively, which entitles the Advisor, and certain affiliates of the Advisor, to specified fees upon the provision of certain services with regard to the ongoing management of the Company as well as reimbursement of O&O costs incurred by the Advisor on behalf of the Company (as discussed in Note 2. Significant Accounting Policies) and certain other operating costs incurred by the Advisor on behalf of the Company. As the Company’s previous public offering was terminated on March 29, 2019, our former dealer manager will no longer receive any selling commissions or dealer manager fees. However, our former dealer manager will continue to receive distribution fees on Class C shares until the maximum amount of commissions and dealer manager fees permitted by applicable regulation is reached.
The term “Special Unitholder” refers to GREC Advisors, LLC, a Delaware limited liability company, which is a subsidiary of our Advisor, and “special unit”, refers to the special unit of limited liability company interest in the LLC. This entitles the Special Unitholder to an incentive allocation and distribution.
The commissions, fees and reimbursement obligations related to our terminated continuous public offering and ongoing private placement included Selling Commissions, Dealer Manager fees and Distribution fees payable to the former dealer manager for Class A, Class C, Class P-A and Class I shares ranging from 1.75% to 7% of gross offering proceeds from the sale of such shares.
With respect to Class C shares only, the Company pays the former dealer manager a distribution fee that accrues daily in an amount equal to 1/365th of 0.80% of the amount of the net asset value for the Class C shares for such day on a continuous basis from year to year. The Company will stop paying distribution fees at the earlier of 1) a listing of the Class C shares on a national securities exchange; 2) total underwriting compensation in the offering equals 10% of the gross proceeds from the primary offering of Class C shares, following the completion of such offering; or 3) Class C shares are no longer outstanding. The dealer manager may re-allow all or a portion of the distribution fee to participating broker-dealers and servicing broker-dealers. The Company estimated the amount of distribution fees expected to be paid and recorded that liability at the time of sale. The liability is included in Deferred sales commission payable on the Consolidated Statements of Assets and Liabilities and fees recorded in Accumulated gains (losses) (specific to the Class C Shares) on the Consolidated Statements of Assets and Liabilities. The Company continues to assess the value of the liability on a regular basis.
The Company also reimbursed the Advisor for the O&O costs (other than selling commissions and dealer manager fees) it had incurred on the Company’s behalf related to the now terminated Registration Statements, only to the extent that the reimbursement would not cause the selling commissions, dealer manager fee and the other O&O costs borne by the Company to exceed 15.0% of the gross offering proceeds as the amount of proceeds increases.
Offering costs incurred by our Advisor in conjunction with the offering of shares of Class P-A, P-S, P-T and P-D under our private placement memoranda are subject to the reimbursement by the Company up to 0.50% (50 basis points) of gross offering proceeds for each such class of shares.
The fees and reimbursement obligations related to our ongoing operation of the Company are as follows:
GREENBACKER RENEWABLE ENERGY COMPANY LLC AND SUBSIDIARIES
NOTES TO CONSOLIDATED FINANCIAL STATEMENTS
December 31, 2021
Note 5. Related Party Agreements and Transactions Agreements (cont.)
| | | | | | | | |
| Type of Compensation and Recipient | | Determination of Amount |
| Base Management Fees — Advisor | | The base management fee payable to the Advisor will be calculated at a monthly rate of 0.167% (2.00% annually) of our gross assets (including amounts borrowed up to $50,000,000) until gross assets exceed $800,000,000. The base management fee monthly rate will decrease to 0.14583% (1.75% annually) for gross assets between $800,000,001 to $1,500,000,000 and 0.125% (1.50% annually) for gross assets greater than $1,500,000,000. For services rendered under the advisory agreement, the base management fee will be payable monthly in arrears, or more frequently as authorized under the advisory agreement. The base management fee will be calculated based on the average of the values of our gross assets for each day of the prior month. Base management fees for any partial period will be appropriately prorated. The base management fee may be deferred or waived, in whole or in part, at the election of the Advisor. All or any part of the deferred base management fee not taken as to any period shall be deferred without interest and may be taken in any period prior to the occurrence of a liquidity event as the Advisor shall determine in its sole discretion.
On July 1, 2021, the Company entered into the Fourth Amended and Restated Advisory Agreement with the Advisor. Effective July 1, 2021, the base management fee payable to the Advisor is calculated at a monthly rate of 0.167% (2.00% annually) of the net assets until the net assets exceed $800,000,000. The base management fee monthly rate will decrease to 0.14583% (1.75% annually) for net assets between $800,000,001 to $1,500,000,000 and to 0.125% (1.50% annually) for net assets greater than $1,500,000,000. |
| Incentive Allocation and Distribution — Special Unitholder (effective through March 31, 2020) | | Under the LLC's Third Amended and Restated Limited Liability Company Agreement dated June 27, 2014, the incentive allocation and distribution had three parts: Income Incentive Distribution, Capital Gains Incentive Distribution and the Liquidation Incentive Distribution. The features of this incentive fee structure were as follows:
|
| | ● The Income Incentive Distribution provided for the Special Unitholder, as a member of the LLC, to receive, on a quarterly basis, a cash distribution equal to a percentage of the LLC’s net investment income (as calculated in accordance with the LLC's Third Amended and Restated Limited Liability Company Agreement) for each quarter, in excess of a specified hurdle rate. |
| | ● The Capital Gains Incentive Distribution provided for the Special Unitholder, as a member of the LLC, to receive, on a quarterly basis, a cash distribution equal to a percentage of the LLC’s realized capital gains (as calculated in accordance with the LLC's Third Amended and Restated Limited Liability Company Agreement) for each quarter. |
| | ● The Liquidation Incentive Distribution provided for the Special Unitholder to receive a cash distribution equal to a percentage of the difference between the net proceeds from the liquidation of the LLC or the exchange listing of its shares (as calculated in accordance with the LLC's Third Amended and Restated Limited Liability Company Agreement) and the LLC’s aggregate NAV immediately prior to the time of such liquidation or listing. |
GREENBACKER RENEWABLE ENERGY COMPANY LLC AND SUBSIDIARIES
NOTES TO CONSOLIDATED FINANCIAL STATEMENTS
December 31, 2021
Note 5. Related Party Agreements and Transactions Agreements (cont.)
| | | | | | | | |
| Type of Compensation and Recipient | | Determination of Amount |
| Performance Participation Fees (effective April 1, 2020 and thereafter) | | Under the Operating Agreement, the "Performance Participation Fee" which the Special Unitholder is entitled to is calculated and payable in arrears, for an amount equal to 12.5% of the total return generated by the LLC during the most recently completed fiscal quarter, subject to a hurdle amount of 1.50% (or 6% annualized) (the "Hurdle Amount"), a loss carryforward amount and a fee carryforward amount. The "Total Return Amount" is defined for each quarterly calculation period, as an amount equal to the sum of:
•The aggregate amount of all cash distributions accrued or paid (without duplication) during such quarter on the shares outstanding at the end of such quarter, plus
•The amount of the change in aggregate NAV of such shares since the beginning of such quarter, before giving effect to (x) changes in the aggregate NAV of such shares during such quarter resulting solely from the net proceeds of issuances and/or repurchase of shares by the LLC, and (y) the amount of any accrual of the Performance Participation Fee during such quarter. |
| | The calculation of the Total Return Amount for each period shall include any appreciation or depreciation in the NAV of the shares issued during such period, but exclude the proceeds from the initial issuance of such shares. The total NAV of the shares outstanding as of the last business day of a calendar quarter shall be the amount against which changes in the total NAV of the shares outstanding during the subsequent calendar quarter is measured. Furthermore, the "Loss Carryforward Amount" shall initially equal zero and cumulatively increase in any calendar quarter by the absolute value of any negative total return for such quarter and cumulatively decrease in any calendar quarter by the amount of any positive total return. The "Fee Carryforward Amount" shall also initially equal zero, and cumulatively increase in any calendar quarter by (i) the amount, if any, by which the Hurdle Amount (noted above) for such quarter exceeds any positive Total Return Amount for such quarter; and (ii) the amount, if any, by which the catch-up amount for such quarter exceeds excess profits for such quarter. The fee carryforward amount shall cumulatively decrease in any calendar quarter by the amount, if any, of the Fee Carryforward Amount paid to the Special Unitholder for such quarter. Neither the Loss Carryforward Amount nor the Fee Carryforward Amounts shall be less than zero at any given time. |
GREENBACKER RENEWABLE ENERGY COMPANY LLC AND SUBSIDIARIES
NOTES TO CONSOLIDATED FINANCIAL STATEMENTS
December 31, 2021
Note 5. Related Party Agreements and Transactions Agreements (cont.)
| | | | | | | | |
| Type of Compensation and Recipient | | Determination of Amount |
| | The Special Unitholder shall receive the Performance Participation Fee as follows:
● if the Total Return Amount for the applicable period exceeds the sum of (x) the Hurdle Amount for such period and (y) the Loss Carryforward Amount for such Period (any such excess, “Excess Profits”), 100% of such Excess Profits until the total amount paid to the Special Unitholder equals 12.5% of the sum of (x) the Hurdle Amount for such period and (y) any amount paid to the Special Unitholder pursuant to this clause (the “Catch-Up Amount”);
● to the extent there are remaining Excess Profits after payment of the Catch-Up Amount, 100% of such remaining Excess Profits until such amount paid to the Special Unitholder equals the amount of the Fee Carryforward Amount for such period; and
● to the extent there are remaining Excess Profits after payment of the Catch-Up Amount and the Fee Carryforward Amount (as defined above), 12.5% of such remaining Excess Profits.
|
| | The "Liquidation Performance Participation Fee" payable to the Special Unitholder will equal 20.0% of the net proceeds from a liquidation of the LLC in excess of adjusted capital, as measured immediately prior to liquidation. Adjusted capital shall mean the LLC NAV immediately prior to the time of a liquidation or a listing. In the event of any liquidity event that involves a listing of the LLC’s shares, or a transaction in which the LLC’s members receive shares of a company that is listed, on a national securities exchange, the Liquidation Performance Participation Fee will equal 20.0% of the amount, if any, by which the LLC’s listing value following such liquidity event exceeds the adjusted capital, as calculated immediately prior to such listing (the “Listing Premium”). Any such Listing Premium and related Liquidation Performance Participation Fee will be determined and payable in arrears 30 days after the commencement of trading following such liquidity event.
The amendments to the incentive fee structure pursuant to the Operating Agreement were applied retroactively as of April 1, 2020 and for all periods thereafter. |
For the years ended December 31, 2021, 2020 and 2019, the Advisor earned $21,940,099, $10,364,635 and $8,461,616, respectively, in management fees. As of December 31, 2021 and 2020, the Company owed $2,271,687 and $1,055,600, respectively, to the Advisor in management fees, which amounts are included in Management fee payable on the Consolidated Statements of Assets and Liabilities.
The Consolidated Statements of Operations reflects $4,672,078 and $4,571,927 Performance Participation Fee for the years ended December 31, 2021 and 2020, respectively. There was no capital gains incentive distribution for the year ended December 31, 2021 as this no longer exists under the new Performance Participation Fees methodology discussed above. There was a capital gains incentive distribution of $8,052,116 and $170,000 earned in the years ended December 31, 2020 and 2019, respectively. The Consolidated Statements of Operations also reflects a $1,154,308 and $5,270,670 incentive allocation shown as a Net decrease in net assets attributed to special unitholder for the years ended December 31, 2020 and 2019, respectively.
As of December 31, 2021, the Performance Participation Fee payable and due was $3,359,269, which is reflected as the Performance participation fee payable on the Consolidated Statements of Assets and Liabilities.
GREENBACKER RENEWABLE ENERGY COMPANY LLC AND SUBSIDIARIES
NOTES TO CONSOLIDATED FINANCIAL STATEMENTS
December 31, 2021
Note 5. Related Party Agreements and Transactions Agreements (cont.)
As previously discussed, under the Operating Agreement the Performance Participation Fee payable and due for the year ended December 31, 2020 was $3,540,052. As disclosed in the 2020 Form 10-K, the revisions to prior period financial statements resulted in a certain amount of proceeds paid under the Company’s share repurchase program that otherwise would not have been paid due to the misstatement historically impacting the Company’s offering price. To remedy the effect of the overpayment, GREC Advisors, LLC waived $(747,602) of performance participation fee for the year ended December 31, 2020, shown as Performance participation fee waiver on the Consolidated Statements of Operations. As of December 31, 2020, the total net amount of $3,540,052 remained unpaid and is reflected as the Performance participation fee payable on the Consolidated Statements of Assets and Liabilities.
As of December 31, 2021 and 2020, $607,610 and $1,751 were due to the Advisor for O&O costs related to the continuous private offering, and shown as Due to Advisor on the Consolidated Statements of Assets and Liabilities, respectively.
In the years ended December 31, 2021 and 2020, no dealer manager fees or selling commissions were paid to the former dealer manager. For the year ended December 31, 2019, the Company paid $231,892 in dealer manager fees, and $594,247 in selling commissions to the Company’s former dealer manager. These fees and commissions were paid in connection with the sale of the Company’s shares to investors and were recorded against the proceeds from the issuance of shares prior to receipt by the Company, and therefore are not reflected in the Consolidated Statements of Operations.
As of December 31, 2021 and 2020, the Advisor owned 23,601 Class A shares. As of December 31, 2021 and 2020, the Advisor owned 2,776 and NaN Class P-D shares, respectively.
The Company entered into secured loans to finance the purchase and installation of energy-efficient lighting with LED Funding LLC and Renew AEC One LLC (“AEC Companies”). All of the loans with LED Funding LLC, an AEC Company, converted to an operating lease on the day the energy efficiency upgrades became operational. AEC Companies are considered related parties, as the members of these entities own an indirect, non-controlling ownership interest in the Advisor. The loans outstanding between the AEC Companies and the Company, and the subsequent operating leases, were negotiated at an arm’s length and contain standard terms and conditions that would be included in third-party lending agreements, including required security and collateral, interest rates based upon risk of the specific loan, and term of the loan. These investments have a cost of $668,736 and a fair value of $685,784 and are included in Other Energy Efficiency Portfolios in the Consolidated Schedules of Investments as of December 31, 2021. As of December 31, 2021, all loans and operating leases are considered current per their terms.
On October 9, 2020, the Company made a $5,000,000 limited partner (“LP”) commitment to Greenbacker Development Opportunities Fund I, LP (“GDEV”), which was increased to $6,075,000 in the fourth quarter of 2020. In April 2021, the commitment to GDEV increased to $7,500,000. As the initial investor, the Company was awarded a 10% carried interest participation in Greenbacker Development Opportunities GP I, LLC, GDEV's general partner. GDEV is an affiliate of GREC as GDEV shares the same investment advisor as GREC. As of December 31, 2021, $7,242,495 of the commitment was funded. This investment's cost of $7,242,495 and fair value of $7,580,119, is included in Other Portfolios in the Consolidated Schedules of Investments.
On December 22, 2020, the Company, through its wholly owned subsidiary, Citrine Solar LLC, entered into a third transaction with Greenbacker Renewable Opportunity Zone Fund LLC (“GROZ”) to sell Gliden Solar, LLC. The asset was sold for a purchase price of $12,752,215 based upon the fair value of the investment as determined by an independent third-party appraiser. The transaction resulted in a realized gain of $1,608,644 recorded in the Consolidated Statements of Operations for the year ended December 31, 2020. As of December 31, 2021 and December 31, 2020 the remaining balance of nil and $4,758,243 is included in Investment sales receivable in the Consolidated Statements of Assets and Liabilities. Further, net working capital adjustments resulted in an additional realized (loss) of $(34,290) recorded in the Consolidated Statements of Operations for the year ended December 31, 2021.
The Company entered into a transaction with Greenbacker Renewable Opportunity Zone Fund LLC (“GROZ”) to sell the Sol Phoenix Solar LLC investment, included within the Phoenix Solar Portfolio, on September 30, 2019 for an initial sale price of $16,874,761, pending final adjustments. The sales price was adjusted during the fourth quarter of 2019 and increased to
GREENBACKER RENEWABLE ENERGY COMPANY LLC AND SUBSIDIARIES
NOTES TO CONSOLIDATED FINANCIAL STATEMENTS
December 31, 2021
Note 5. Related Party Agreements and Transactions Agreements (cont.)
$17,175,554 as of December 31, 2019, and finalized in the second quarter of 2020 to total $18,060,275. The changes to the purchase price were based upon a final fair value determination of the investment as determined by an independent third-party appraiser. GROZ is an affiliate of GREC, as GROZ shares the same advisor as GREC. Since GROZ is an affiliate of the Company, the determination of the purchase price was based on the fair value of the investment as determined by an independent third-party appraiser, and the purchase was approved by a majority of the Company’s Board of Directors (including a majority of the independent directors) not otherwise interested in the transaction to be fair and reasonable to the Company.
The transaction resulted in a realized gain of $7,636,438, of which $141,974 was recorded for the year ended December 31, 2020, in Net realized (loss)/gain on investments on the Consolidated Statements of Operations. GROZ paid an initial amount of $1,500,000 at closing, with an additional $8,184,393 paid by GROZ as of December 31, 2019. The remainder was paid in the year ended December 31, 2020.
On December 10, 2019 the Company, through its wholly owned subsidiary, Citrine Solar LLC, entered into a second transaction with GROZ to sell the Fremont CO I, LLC asset. The asset was sold for a purchase price of $5,272,475, which increased to $5,335,009 in the second quarter of 2020, based upon the fair value of the investment as determined by an independent third-party appraiser. The transaction resulted in a realized gain of $794,967 in the year ending December 31, 2019, which was reduced by $(32,576) in the twelve months ending December 31, 2020 due to the final accounting of the sale process. As of December 31, 2019, a total of $2,531,000 was paid by GROZ. The remainder was paid in the year ended December 31, 2020.
GREENBACKER RENEWABLE ENERGY COMPANY LLC AND SUBSIDIARIES
NOTES TO CONSOLIDATED FINANCIAL STATEMENTS
December 31, 2021
Note 6. Borrowings
On January 5, 2018, the Company, through GREC HoldCo, entered into a Credit Agreement by and among the Company, the Company’s wholly owned subsidiary, GREC, the lenders party thereto and Fifth Third Bank, as administrative agent, as sole lead arranger, sole lead bookrunner, and as swap counterparty. The credit facility (the “Credit Facility”) consisted of a loan of up to the lesser of $60,000,000 or a borrowing base amount based on various solar projects that act as collateral for the Credit Facility, of which approximately $25.7 million was drawn down at closing. The Credit Facility allowed for additional drawdowns through December 31, 2018 and converted to a term loan with a maturity on January 5, 2024.
On June 20, 2019, the Company, through GREC HoldCo, entered into an Amended and Restated Credit Agreement with the lenders party thereto and Fifth Third Bank, as administrative agent, sole lead arranger, sole lead bookrunner and swap counterparty. The new Credit Facility (the “New Credit Facility”) consists of a loan of up to the lesser of $110,000,000 or a borrowing base amount based on various solar projects that act as collateral for the credit facility, of which approximately $58.3 million was drawn down at closing. In November 2020, the Company, through GREC HoldCo, entered into the Second Amended and Restated Credit Agreement, which amends the New Credit Facility to make available a non-revolving line of Credit Facility that will convert into a term loan facility and a letter of Credit Facility. The commitments of the lenders aggregate to $97,822,841 between existing term loans, future committed loans and letters of credit, of which approximately $90.7 million was drawn down at closing. The New Credit Facility allowed for additional drawdowns through November 25, 2021, and converted to a term loan with a maturity on June 20, 2025.
The Company used the net proceeds of borrowings under the New Credit Facility for investment in additional alternative energy power generation assets that are anticipated to become projects and for other general corporate purposes. Loans made under the New Credit Facility bear interest at 1.75% in excess of the three-month LIBOR. Prior to the New Credit Facility converting to a term loan, quarterly commitment fees on the average daily unused portion of the Credit Facility were payable at a rate per annum of 0.50%.
Borrowings under the New Credit Facility are back-leveraged and secured by all the assets of GREC HoldCo and the equity interests of each direct and indirect subsidiary of the Company. The LLC, GREC and each direct and indirect subsidiary of the Company are guarantors of the Company’s obligations under the New Credit Facility. GREC has pledged all the equity interests of the GREC HoldCo as collateral for the New Credit Facility.
Regarding the Credit Facility, the Company has entered into five separate interest rate swap agreements as economic hedges. The first swap, with a trade date of June 15, 2017, an effective date of June 30, 2018 and an initial notional amount of $20,900,650, was used to swap the floating-rate interest payments on an additional principal amount of the Credit Facility, for a corresponding fixed payment. The fixed swap rate is 2.26%. The second swap, with a trade date of January 11, 2018, an effective date of December 31, 2018 and an initial notional amount of $29,624,945 was used to swap the floating-rate interest payments on the remaining unhedged portion of the Credit Facility, as well as the estimated additional drawdowns, for a corresponding fixed payment. The fixed swap rate is 2.65%. The third swap, with a trade date of February 7, 2018, an effective date of December 31, 2018 and an initial notional amount of $4,180,063, was used to swap the floating-rate interest payments on the remaining unhedged portion of the Credit Facility, as well as the estimated additional drawdowns, for a corresponding fixed payment. The fixed swap rate is 2.97%. The fourth swap, with a trade date of January 2, 2019, an effective date of September 30, 2019 and an initial notional amount of $38,203,507, was used to swap the floating-rate interest payments on the remaining unhedged portion of the Credit Facility, as well as the estimated additional drawdowns, for a corresponding fixed payment. The fixed swap rate is 2.69%. The fifth swap, with a trade date of February 19, 2021, an effective date of February 26, 2021 and an initial notional amount of $7,068,965, was used to swap the floating-rate interest payments on the remaining unhedged portion of the Credit Facility, as well as the estimated additional drawdowns, for a corresponding fixed payment. The fixed swap rate is 1.64%.
If an event of default shall occur and be continuing under the New Credit Facility, the commitments under the New Credit Facility may be terminated and the principal amount outstanding under the New Credit Facility, together with all accrued unpaid interest and other amounts owing in respect thereof, may be declared immediately due and payable.
GREENBACKER RENEWABLE ENERGY COMPANY LLC AND SUBSIDIARIES
NOTES TO CONSOLIDATED FINANCIAL STATEMENTS
December 31, 2021
Note 6. Borrowings (cont.)
On December 6, 2019, the Company entered into a $15,000,000 revolving letter of credit facility agreement (“LC Facility”) with Fifth Third Bank. On January 30, 2020, the LC Facility was amended to include an equipment loan, and the amount of $5.6 million was drawn down under the equipment facility loan. On March 18, 2020, a repayment of $1.9 million was made, reducing the outstanding balance of the equipment loan facility. On June 9, 2020, a repayment of the remaining outstanding balance occurred. In October 2020, the LC Facility agreement was amended to increase the aggregate principal amount to $22,500,000. On April 1, 2021, the LC Facility agreement was amended to maintain cash collateral in an amount equal to 100% of the outstanding obligation and the letter of credit fee was reduced from 2.25% to 0.75%. On June 3, 2021, the LC Facility agreement was amended to extend the maturity date to September 4, 2021. On September 3, 2021, the LC Facility agreement was amended to extend the maturity date to September 4, 2022. On September 28, 2021, the LC Facility agreement was amended to increase the aggregate principal amount to $32,500,000.
The Company’s borrowings as of December 31, 2021 and December 31, 2020 was as follows:
| | | | | | | | | | | | | | | | | | | | | | | | | | | | | | | | | | | | | | | | | | | | | | | | | | | | | | | | | | | |
| December 31, 2021 | | December 31, 2020 |
| Aggregate
Principal Amount
Available | | Principal Amount
Outstanding | | Carrying Value | | Deferred
Financing Costs | | Term Note
Payable, Net of
Financing Costs | | Aggregate
Principal Amount
Available | | Principal
Amount Outstanding | | Carrying Value | | Deferred
Financing Costs | | Term Note
Payable, Net of
Financing Costs |
| New Credit Facility | $ | 97,822,841 | | | $ | 82,151,509 | | | $ | 82,151,509 | | | $ | 2,737,887 | | | $ | 79,413,622 | | | $ | 97,822,841 | | | $ | 90,145,500 | | | $ | 90,145,500 | | | $ | 3,643,846 | | | $ | 86,501,654 | |
| LC Facility | 32,500,000 | | | — | | | — | | | — | | | — | | | 22,500,000 | | | — | | | — | | | — | | | — | |
| Total | $ | 130,322,841 | | | $ | 82,151,509 | | | $ | 82,151,509 | | | $ | 2,737,887 | | | $ | 79,413,622 | | | $ | 120,322,841 | | | $ | 90,145,500 | | | $ | 90,145,500 | | | $ | 3,643,846 | | | $ | 86,501,654 | |
The following table shows the components of interest expense related to the Company's borrowings for the year ended December 31, 2021:
| | | | | |
| For the year ended December 31,
2021 |
| Credit Facility commitment fee | $ | 423,075 | |
| Credit Facility loan interest | 1,659,715 | |
| Amortization of deferred financing costs | 905,959 | |
| Other* | — | |
| Total | $ | 2,988,749 | |
| Weighted average interest rate on Credit Facility | 1.88 | % |
| Weighted average outstanding balance of Credit Facility | $ | 87,020,554 | |
*Primarily includes financing costs of Credit Facility.
The following table shows the components of interest expense related to the Company's borrowings for the year ended December 31, 2020:
GREENBACKER RENEWABLE ENERGY COMPANY LLC AND SUBSIDIARIES
NOTES TO CONSOLIDATED FINANCIAL STATEMENTS
December 31, 2021
Note 6. Borrowings (cont.)
| | | | | |
| For the year ended December 31,
2020 |
| Credit Facility commitment fee | $ | 361,373 | |
| Credit Facility loan interest | 2,081,996 | |
| Amortization of deferred financing costs | 576,464 | |
| Other* | — | |
| Total | $ | 3,019,833 | |
| Weighted average interest rate on Credit Facility | 2.61 | % |
| Weighted average outstanding balance of Credit Facility | $ | 74,831,946 | |
*Primarily includes financing costs of credit facility.
The following table shows the components of interest expense related to the Company's borrowings for the year ended December 31, 2019:
| | | | | |
| For the year ended December 31,
2019 |
| Credit Facility commitment fee | $ | 43,087 | |
| Credit Facility loan interest | 1,360,409 | |
| Amortization of deferred financing costs | 226,742 | |
| Other* | 1,182,564 | |
| Total | $ | 2,812,802 | |
| Weighted average interest rate on Credit Facility | 4.32 | % |
| Weighted average outstanding balance of Credit Facility | $ | 53,753,277 | |
*Primarily includes financing costs of credit facility.
The principal payments due on borrowings for each of the next five years ending December 31 and thereafter, are as follows:
| | | | | | | | |
| Year Ending December 31 | | Principal
Payments |
| 2022 | | $ | 7,954,526 | |
| 2023 | | 8,098,085 | |
| 2024 | | 8,245,188 | |
| 2025 | | 57,853,710 | |
| 2026 | | — | |
| Thereafter | | — | |
| | $ | 82,151,509 | |
GREENBACKER RENEWABLE ENERGY COMPANY LLC AND SUBSIDIARIES
NOTES TO CONSOLIDATED FINANCIAL STATEMENTS
December 31, 2021
Note 7. Members’ Equity
General
Pursuant to the terms of the Operating Agreement, the LLC may issue up to 400,000,000 shares, of which 350,000,000 shares are currently designated as Class A, C, I, P-A, P-D, P-S, P-T and P-I shares (collectively, common shares), and 50,000,000 are designated as preferred shares and one special unit. Each class of common shares will have the same voting rights.
Refer to Note 5. Related Party Agreements and Transaction Agreements for the commissions and fees for each common share class in connection with the Company’s continuous public offering pursuant to a Registration Statement on Form S-1 (File No. 333-211571), which terminated on March 29, 2019, as well as the private offering of Class P-A.
Class P-A shares were not offered for sale from March 29, 2019 through October 17, 2020, but were reinstated as of October 18, 2020, along with the commencement of three new share classes: P-D, P-T and P-S.
The following table is a summary of the shares issued and repurchased during the period and outstanding as of December 31, 2021:
| | | | | | | | | | | | | | | | | | | | | | | | | | | | | | | | | | | |
| Shares Outstanding as of December 31, 2020 | | Shares Sold During the
Period | | Shares Issued
through Reinvestment
of Distributions
During the Period | | Shares Repurchased
During the Period | | Shares Transferred During the Period | | Shares Outstanding as of December 31, 2021 |
| Class A shares | 16,844,129 | | | — | | | 413,371 | | | (661,926) | | | (15,016) | | | 16,580,558 | |
| Class C shares | 2,734,661 | | | — | | | 93,130 | | | (85,828) | | | — | | | 2,741,963 | |
| Class I shares | 6,526,001 | | | — | | | 231,377 | | | (296,575) | | | (11,310) | | | 6,449,493 | |
| Class P-A shares | 55,264 | | | 711,897 | | | 16,432 | | | — | | | — | | | 783,593 | |
| Class P-I shares | 36,710,292 | | | 56,416,202 | | | 411,369 | | | (1,493,868) | | | 25,018 | | | 92,069,013 | |
| Class P-D shares | — | | | 197,405 | | | 1,143 | | | — | | | — | | | 198,548 | |
| Class P-S shares | — | | | 46,075,796 | | | 248,961 | | | — | | | — | | | 46,324,757 | |
| Class P-T shares | — | | | 237,124 | | | 2,470 | | | — | | | — | | | 239,594 | |
| Total | 62,870,347 | | | 103,638,424 | | | 1,418,253 | | | (2,538,197) | | | (1,308) | | | 165,387,519 | |
The following table is a summary of the shares issued and repurchased during the period and outstanding as of December 31, 2020:
| | | | | | | | | | | | | | | | | | | | | | | | | | | | | | | | | | | |
| Shares Outstanding as of December 31,
2019 | | Shares Sold
During the Period | | Shares Issued
through Reinvestment
of Distributions
During the Period | | Shares Repurchased
During the Period | | Shares Transferred During the Period | | Shares Outstanding as of December 31,
2020 |
| Class A shares | 17,210,016 | | | 12,964 | | | 436,348 | | | (815,199) | | | — | | | 16,844,129 | |
| Class C shares | 2,718,475 | | | — | | | 95,536 | | | (66,086) | | | (13,264) | | | 2,734,661 | |
| Class I shares | 6,693,658 | | | 5,783 | | | 242,963 | | | (429,396) | | | 12,993 | | | 6,526,001 | |
| Class P-A shares | 18,109 | | | 37,155 | | | — | | | — | | | — | | | 55,264 | |
| Class P-I shares | 21,249,352 | | | 16,112,855 | | | (296) | | | (651,619) | | | — | | | 36,710,292 | |
| Total | 47,889,610 | | | 16,168,757 | | | 774,551 | | | (1,962,300) | | | (271) | | | 62,870,347 | |
GREENBACKER RENEWABLE ENERGY COMPANY LLC AND SUBSIDIARIES
NOTES TO CONSOLIDATED FINANCIAL STATEMENTS
December 31, 2021
Note 7. Members’ Equity (cont.)
The proceeds from shares sold and the value of shares issued through the reinvestment of distributions for each class of shares for the years ended December 31, 2021, 2020 and 2019 were as follows:
| | | | | | | | | | | | | | | | | | | | | | | | | | | | | | | | | | | | | | | | | | | | | | | | | | | | | |
| Class A
Shares | | Class C
Shares | | Class I
Shares | | Class P-A
Shares | | Class P-I
Shares | | Class P-D Shares | | Class P-S Shares | | Class P-T Shares | | Total |
| For the Year Ended December 31, 2021 | | | | | | | | | | | | | | | | | |
| Proceeds from Shares Sold | $ | — | | | $ | — | | | $ | — | | | $ | 6,210,692 | | | $ | 504,228,647 | | | $ | 1,774,641 | | | $413,941,487 | | $ | 2,130,975 | | | $ | 928,286,442 | |
| Proceeds from Shares Issued through Reinvestment of Distributions | $ | 3,511,041 | | | $ | 768,984 | | | $ | 1,964,922 | | | $ | 142,773 | | | $ | 3,648,652 | | | $ | 10,264 | | | $ | 2,222,218 | | | $ | 22,122 | | | $ | 12,290,976 | |
| For the Year Ended December 31, 2020 | | | | | | | | | | | | | | | | | |
| Proceeds from Shares Sold | $ | 110,970 | | | $ | — | | | $ | 49,850 | | | $ | 323,750 | | | $ | 144,310,683 | | | $ | — | | | $ | — | | | $ | — | | | $ | 144,795,253 | |
| Proceeds from Shares Issued through Reinvestment of Distributions | $ | 3,755,174 | | | $ | 802,289 | | | $ | 2,089,430 | | | $ | — | | | $ | 128 | | | $ | — | | | $ | — | | | $ | — | | | $ | 6,647,021 | |
| For the Year Ended December 31, 2019 | | | | | | | | | | | | | | | | | |
| Proceeds from Shares Sold | $ | 5,256,053 | | | $ | 3,651,717 | | | $ | 3,773,270 | | | $ | 22,875 | | | $ | 84,637,482 | | | $ | — | | | $ | — | | | $ | — | | | $ | 97,341,397 | |
| Proceeds from Shares Issued through Reinvestment of Distributions | $ | 3,944,111 | | | $ | 733,788 | | | $ | 2,074,778 | | | $ | — | | | $ | — | | | $ | — | | | $ | — | | | $ | — | | | $ | 6,752,677 | |
As of December 31, 2021, 2020 and 2019, none of the LLC’s preferred shares were issued and outstanding.
The Operating Agreement authorizes the LLC's Board of Directors, without approval of any of the members, to increase the number of shares the LLC is authorized to issue and to classify and reclassify any authorized but unissued class or series of shares into any other class or series of shares having such designations, preferences, right, power and duties as may be specified by the LLC's Board of Directors. The Operating Agreement also authorizes the LLC's Board of Directors, without approval of any of the members, to issue additional shares of any class or series for the consideration and on the terms and conditions established by the LLC's Board of Directors. In addition, the Company may also issue additional limited liability company interests that have designations, preferences, right, powers and duties that are different from, and may be senior to, those applicable to the common shares. The Special Unitholder will hold the special unit in the Company. Refer to Note 5. Related Party Agreements and Transaction Agreements for the terms of the special unit.
Distribution Reinvestment Plan
The Company adopted a DRP through which the Company’s Class A, C and I shareholders may elect to purchase additional shares with distributions from the Company rather than receiving the cash distributions. The DRP was amended as of February 1, 2021 to include all share classes. Shares issued pursuant to the DRP will have the same voting rights as shares offered pursuant to the Company's prior public and current private offerings. As of November 30, 2020, pursuant to our Registration Statement on Form S-3D (File No. 333-251021), the Company is offering up to $20,000,000 in Class A, C and I
GREENBACKER RENEWABLE ENERGY COMPANY LLC AND SUBSIDIARIES
NOTES TO CONSOLIDATED FINANCIAL STATEMENTS
December 31, 2021
Note 7. Members’ Equity (cont.)
shares to our existing shareholders pursuant to the DRP. Management plans to increase the size of the offering once the maximum offering amount is reached. No dealer manager fees, selling commissions or other sales charges will be paid with respect to shares issued pursuant to the DRP except for distribution fees on Class C, P-S and P-T shares. At its discretion, the Board of Directors may amend, suspend or terminate the DRP. The Board of Directors may also modify or waive the terms of the DRP with respect to certain or all shareholders, in its discretion, to be in the best interests of the Company. A participant may terminate participation in the DRP by written notice to the plan administrator, received by the plan administrator at least 10 days prior to the distribution payment date.
As of December 31, 2021, the Company issued 2,438,154 Class A shares, 409,657 Class C shares, 1,152,785 Class I shares, 16,432 Class P-A shares, 411,369 Class P-I shares, 1,143 Class P-D shares, 248,961 Class P-S shares, and 2,470 Class P-T shares for a total of 4,680,971 shares issued under the DRP. As of December 31, 2020, the Company issued 2,024,783 Class A shares, 316,527 Class C shares, and 921,408 Class I shares, for a total of 3,262,718 shares issued under the DRP.
Share Repurchase Program
The Company offers a share repurchase program (“share repurchase program”) pursuant to which quarterly share repurchases will be conducted to allow members to sell shares back to the Company at a price equal to the then current offering price less the selling commissions and dealer manager fees associated with that class of shares.
The share repurchase program includes numerous restrictions that will limit a shareholder’s ability to sell shares. At the sole discretion of the Board of Directors, the Company may also use cash on hand (including the proceeds from the issuance of new shares), cash available from borrowings and cash from liquidation of investments to repurchase shares.
The shareholders’ right to purchase is subject to the availability of funds and the other provisions of the share repurchase program. Additionally, a member must hold his or her shares for a minimum of one year before he or she can participate in the share repurchase program, subject to any of the following special circumstances: (i) the written request of the estate, heir or beneficiary or a deceased shareholder; (ii) a qualifying disability of the shareholder for a non-temporary period of time provided that the condition causing the qualifying disability was not pre-existing on the date that the shareholder became a shareholder; (iii) a determination of incompetence of the shareholder by a state or federal court located in the United States; or (iv) as determined by the Board of Directors, in their discretion, to be in the interests of the Company. If a member has made more than one purchase of shares, the one-year holding period will be calculated separately with respect to each purchase.
Through September 30, 2020, quarterly share repurchases were conducted to allow up to approximately 5% of the weighted average number of outstanding shares in any 12-month period to be repurchased by the Company. Effective September 1, 2020, the Company, through approval by its Board of Directors, adopted an amended share repurchase program, pursuant to which the Company will conduct quarterly share repurchases to allow members to sell all or a portion of their shares (of any class) back to the Company. The quarterly share repurchase limits for the Company’s new share repurchase program are set forth below.
GREENBACKER RENEWABLE ENERGY COMPANY LLC AND SUBSIDIARIES
NOTES TO CONSOLIDATED FINANCIAL STATEMENTS
December 31, 2021
Note 7. Members’ Equity (cont.)
| | | | | |
| Quarter Ending | Share Repurchase Limit(s) |
| December 31, 2020 | During such fiscal quarter, 1.875% of the weighted average number of shares outstanding in the prior four fiscal quarters |
| |
| March 31, 2021 | During such fiscal quarter, 2.50% of the weighted average number of shares outstanding in the prior four fiscal quarters |
| |
| June 30, 2021 | During such fiscal quarter, 3.75% of the weighted average number of shares outstanding in the prior four fiscal quarters |
| |
| September 30, 2021, and each quarter thereafter | During any 12-month period, 20.00% of the weighted average number of outstanding shares
During any fiscal quarter, 5.00% of the weighted average number of shares outstanding in the prior four fiscal quarters |
We have received an order for our repurchase program from the SEC under Rule 102(a) of Regulation M under the Exchange Act. In addition, our repurchase program is substantially similar to repurchase programs for which the SEC has stated it will not recommend enforcement action under Rule 13e-4 and Regulation 14E under the Exchange Act.
GREENBACKER RENEWABLE ENERGY COMPANY LLC AND SUBSIDIARIES
NOTES TO CONSOLIDATED FINANCIAL STATEMENTS
December 31, 2021
Note 8. Distributions
On the last business day of each month, with the authorization of the Company’s Board of Directors, the Company declares distributions on each outstanding Class A, C, I, P-A, P-I, P-D, P-T and P-S shares. These distributions are calculated based on shareholders of record for each day in amounts equal to that exhibited in the table below based upon distribution period and class of share.
| | | | | | | | | | | | | | | | | | | | | | | | | | | | | | | | | | | | | | | | | | | | | | | | | | | | | |
| | | Class of Share |
| Distribution Period | | A | | C | | I | | P-A | | P-I | | P-D | | P-T | | P-S |
| 1-Nov-15 | 31-Jan-16 | | $ | 0.00165 | | | $ | 0.00165 | | | $ | 0.00165 | | | $ | — | | | $ | — | | | $ | — | | | $ | — | | | $ | — | |
| 1-Feb-16 | 30-Apr-16 | | $ | 0.00166 | | | $ | 0.00166 | | | $ | 0.00166 | | | $ | — | | | $ | — | | | $ | — | | | $ | — | | | $ | — | |
| 1-May-16 | 31-Jul-16 | | $ | 0.00166 | | | $ | 0.00166 | | | $ | 0.00166 | | | $ | 0.00158 | | | $ | 0.00158 | | | $ | — | | | $ | — | | | $ | — | |
| 1-Aug-16 | 31-Oct-16 | | $ | 0.00168 | | | $ | 0.00168 | | | $ | 0.00168 | | | $ | 0.00160 | | | $ | 0.00160 | | | $ | — | | | $ | — | | | $ | — | |
| 1-Nov-16 | 31-Jan-17 | | $ | 0.00169 | | | $ | 0.00164 | | | $ | 0.00169 | | | $ | 0.00160 | | | $ | 0.00160 | | | $ | — | | | $ | — | | | $ | — | |
| 1-Feb-17 | 30-Apr-17 | | $ | 0.00168 | | | $ | 0.00164 | | | $ | 0.00168 | | | $ | 0.00160 | | | $ | 0.00160 | | | $ | — | | | $ | — | | | $ | — | |
| 1-May-17 | 31-Jul-17 | | $ | 0.00167 | | | $ | 0.00163 | | | $ | 0.00167 | | | $ | 0.00160 | | | $ | 0.00158 | | | $ | — | | | $ | — | | | $ | — | |
| 1-Aug-17 | 31-Oct-17 | | $ | 0.00167 | | | $ | 0.00163 | | | $ | 0.00167 | | | $ | — | | | $ | 0.00159 | | | $ | — | | | $ | — | | | $ | — | |
| 1-Nov-17 | 31-Oct-18 | | $ | 0.00167 | | | $ | 0.00163 | | | $ | 0.00167 | | | $ | — | | | $ | 0.00158 | | | $ | — | | | $ | — | | | $ | — | |
| 1-Nov-18 | 30-Apr-20 | | $ | 0.00167 | | | $ | 0.00163 | | | $ | 0.00167 | | | $ | 0.00165 | | | $ | 0.00158 | | | $ | — | | | $ | — | | | $ | — | |
| 1-May-20 | 30-Nov-20 | | $ | 0.00152 | | | $ | 0.00149 | | | $ | 0.00152 | | | $ | 0.00153 | | | $ | 0.00158 | | | $ | — | | | $ | — | | | $ | — | |
| 1-Dec-20 | — | | $ | 0.00152 | | | $ | 0.00149 | | | $ | 0.00152 | | | $ | 0.00152 | | | $ | 0.00158 | | | $ | 0.00158 | | | $ | 0.00158 | | | $ | 0.00158 | |
The following table reflects the distributions declared during the year ended December 31, 2021:
| | | | | | | | | | | | | | | | | | | | |
| Pay Date | | Paid in Cash | | Values of Shares Issued under DRP | | Total |
| February 1, 2021 | | $ | 2,555,800 | | | $ | 538,241 | | | $ | 3,094,041 | |
| March 4, 2021 | | 3,063,308 | | | 487,868 | | | 3,551,176 | |
| April 1, 2021 | | 4,783,092 | | | 523,715 | | | 5,306,807 | |
| May 3, 2021 | | 4,733,419 | | | 565,208 | | | 5,298,627 | |
| June 1, 2021 | | 4,762,355 | | | 886,124 | | | 5,648,479 | |
| July 1, 2021 | | 4,709,348 | | | 960,096 | | | 5,669,444 | |
| August 2, 2021 | | 5,217,796 | | | 1,071,227 | | | 6,289,023 | |
| September 1, 2021 | | 5,423,345 | | | 1,145,375 | | | 6,568,720 | |
| October 1, 2021 | | 5,516,811 | | | 1,229,494 | | | 6,746,305 | |
| November 1, 2021 | | 5,946,262 | | | 1,463,710 | | | 7,409,972 | |
| December 1, 2021 | | 5,938,698 | | | 1,662,579 | | | 7,601,277 | |
| January 3, 2022 | | 6,174,878 | | | 1,755,921 | | | 7,930,799 | |
| Total | | $ | 58,825,112 | | | $ | 12,289,558 | | | $ | 71,114,670 | |
The following table reflects the distributions declared during the year ended December 31, 2020:
GREENBACKER RENEWABLE ENERGY COMPANY LLC AND SUBSIDIARIES
NOTES TO CONSOLIDATED FINANCIAL STATEMENTS
December 31, 2021
Note 8. Distributions (cont.)
| | | | | | | | | | | | | | | | | | | | |
| Pay Date | | Paid in Cash | | Value of Shares Issued under DRP | | Total |
| February 3, 2020 | | $ | 1,788,542 | | | $ | 603,697 | | | $ | 2,392,239 | |
| March 2, 2020 | | 1,733,243 | | | 561,984 | | | 2,295,227 | |
| April 2, 2020 | | 1,890,493 | | | 593,200 | | | 2,483,693 | |
| May 1, 2020 | | 1,838,747 | | | 578,258 | | | 2,417,005 | |
| June 1, 2020 | | 1,829,752 | | | 551,563 | | | 2,381,315 | |
| July 1, 2020 | | 1,827,301 | | | 532,220 | | | 2,359,521 | |
| August 3, 2020 | | 2,133,835 | | | 548,210 | | | 2,682,045 | |
| September 1, 2020 | | 2,157,292 | | | 546,746 | | | 2,704,038 | |
| October 1, 2020 | | 2,178,934 | | | 529,183 | | | 2,708,117 | |
| November 2, 2020 | | 2,285,549 | | | 539,435 | | | 2,824,984 | |
| December 1, 2020 | | 2,281,547 | | | 524,274 | | | 2,805,821 | |
| January 1, 2021 | | 2,447,041 | | | 537,476 | | | 2,984,517 | |
| Total | | $ | 24,392,276 | | | $ | 6,646,246 | | | $ | 31,038,522 | |
The following table reflects the distributions declared during the year ended December 31, 2019:
| | | | | | | | | | | | | | | | | | | | |
| Pay Date | | Paid in Cash | | Value of Shares Issued under DRP | | Total |
| February 1, 2019 | | $ | 1,317,325 | | | $ | 583,571 | | | $ | 1,900,896 | |
| March 1, 2019 | | 1,247,614 | | | 552,615 | | | 1,800,229 | |
| April 1, 2019 | | 1,452,785 | | | 611,200 | | | 2,063,985 | |
| May 1, 2019 | | 1,438,057 | | | 600,614 | | | 2,038,671 | |
| June 3, 2019 | | 1,553,801 | | | 622,584 | | | 2,176,385 | |
| July 1, 2019 | | 1,764,525 | | | 383,627 | | | 2,148,152 | |
| August 1, 2019 | | 1,850,929 | | | 393,237 | | | 2,244,166 | |
| September 2, 2019 | | 1,664,451 | | | 613,333 | | | 2,277,784 | |
| October 1, 2019 | | 1,647,967 | | | 589,581 | | | 2,237,548 | |
| November 1, 2019 | | 1,716,132 | | | 609,283 | | | 2,325,415 | |
| December 2, 2019 | | 1,693,670 | | | 587,119 | | | 2,280,789 | |
| January 1, 2020 | | 1,784,956 | | | 605,129 | | | 2,390,085 | |
| Total | | $ | 19,132,212 | | | $ | 6,751,893 | | | $ | 25,884,105 | |
All distributions paid for the year ended December 31, 2021 are expected to be reported as a return of capital to members for tax reporting purposes, and all distributions paid for the years ended December 31, 2020 and 2019 were reported as a return of capital to members for tax purposes.
GREENBACKER RENEWABLE ENERGY COMPANY LLC AND SUBSIDIARIES
NOTES TO CONSOLIDATED FINANCIAL STATEMENTS
December 31, 2021
Note 8. Distributions (cont.)
Cash distributions paid during the periods presented were funded from the following sources noted below:
| | | | | | | | | | | | | | | | | |
| For the year ended December 31,
2021 | | For the year ended December 31,
2020 | | For the year ended December 31,
2019 |
| Cash from operations | $ | — | | | $ | 1,645,856 | | | $ | 4,213,803 | |
| Offering proceeds | 55,097,266 | | | 22,149,268 | | | 14,393,447 | |
| Total cash distributions | $ | 55,097,266 | | | $ | 23,795,124 | | | $ | 18,607,250 | |
The Company expects to continue to fund distributions from a combination of cash from operations as well as other external financing sources. Due to the Company’s change in investment portfolio composition to include a greater percentage of pre-operational assets, a significant amount of distributions will continue to be funded from other external financing sources.
GREENBACKER RENEWABLE ENERGY COMPANY LLC AND SUBSIDIARIES
NOTES TO CONSOLIDATED FINANCIAL STATEMENTS
December 31, 2021
Note 9. Income Taxes
The LLC conducts most of its operations through GREC, its taxable wholly owned subsidiary. The consolidated income tax provision for the years ended December 31, 2021, 2020 and 2019 is composed of the following:
| | | | | | | | | | | | | | | | | |
| Current | | Deferred | | Total |
| Year Ended December 31, 2021 | | | | | |
| U.S. federal | $ | — | | | $ | 5,075,307 | | | $ | 5,075,307 | |
| State and local | — | | | 2,946,388 | | | 2,946,388 | |
| Foreign jurisdiction | — | | | — | | | — | |
| Provision for income taxes | $ | — | | | $ | 8,021,695 | | | $ | 8,021,695 | |
| Change in valuation allowance | — | | | 817,262 | | | 817,262 | |
| Provision for income taxes, net | $ | — | | | $ | 8,838,957 | | | $ | 8,838,957 | |
| | | | | | | | | | | | | | | | | |
| Current | | Deferred | | Total |
| Year Ended December 31, 2020 | | | | | |
| U.S. federal | $ | — | | | $ | 9,454,902 | | | $ | 9,454,902 | |
| State and local | — | | | 2,716,238 | | | 2,716,238 | |
| Foreign jurisdiction | — | | | — | | | — | |
| Provision for income taxes | $ | — | | | $ | 12,171,140 | | | $ | 12,171,140 | |
| Change in valuation allowance | — | | | (803,627) | | | (803,627) | |
| Provision for income taxes, net | $ | — | | | $ | 11,367,513 | | | $ | 11,367,513 | |
| | | | | | | | | | | | | | | | | |
| Current | | Deferred | | Total |
| Year Ended December 31, 2019 | | | | | |
| U.S. federal | $ | — | | | $ | 5,658,918 | | | $ | 5,658,918 | |
| State and local | — | | | 382,931 | | | 382,931 | |
| Foreign jurisdiction | — | | | — | | | — | |
| Provision for income taxes | $ | — | | | $ | 6,041,849 | | | $ | 6,041,849 | |
| Change in valuation allowance | — | | | 1,231,693 | | | 1,231,693 | |
| Provision for income taxes, net | $ | — | | | $ | 7,273,542 | | | $ | 7,273,542 | |
GREENBACKER RENEWABLE ENERGY COMPANY LLC AND SUBSIDIARIES
NOTES TO CONSOLIDATED FINANCIAL STATEMENTS
December 31, 2021
Note 9. Income Taxes (cont.)
The principal differences between our effective tax rate on operations and the U.S. federal statutory income tax rate are as follows:
| | | | | | | | | | | | | | | | | | | | | | | | | | |
| | 2021 | Percentage | | 2020 | Percentage | | 2019 | Percentage |
| Taxes at statutory U.S. federal income tax rate | $ | 10,890,547 | | 21.0 | % | | $ | 11,532,973 | | 21.0 | % | | $ | 7,125,202 | | 21.0 | % |
| Permanent differences (GREC LLC and other) | 347,555 | | 0.7 | % | | (1,396,678) | | (2.5) | % | | 1,387,056 | | 4.1 | % |
| State income taxes, net of federal benefit | 2,253,655 | | 4.3 | % | | 2,623,353 | | 4.8 | % | | 1,504,182 | | 4.4 | % |
| Write off state credits | 334,079 | | 0.6 | % | | 634,229 | | 1.2 | % | | — | | — | % |
| Rate changes | — | | — | % | | — | | — | % | | (1,121,251) | | (3.3) | % |
| Return to provision and other adjustments | (1,850,554) | | (3.6) | % | | (257,314) | | (0.5) | % | | (2,606,695) | | (7.7) | % |
| Federal tax credits | (3,953,587) | | (7.6) | % | | (965,423) | | (1.8) | % | | (246,645) | | (0.7) | % |
| Change in valuation allowance | 817,262 | | 1.6 | % | | (803,627) | | (1.5) | % | | 1,231,693 | | 3.6 | % |
| Actual provision for income taxes | $ | 8,838,957 | | 17.0 | % | | $ | 11,367,513 | | 20.7 | % | | $ | 7,273,542 | | 21.4 | % |
Deferred tax assets (liabilities) have been classified on the accompanying Consolidated Statements of Assets and Liabilities as of December 31, 2021 and 2020 as follows:
| | | | | | | | | | | |
| 2021 | | 2020 |
| Amortization | $ | 42,799 | | | $ | 48,179 | |
| Disallowed interest | 4,731,734 | | | — | |
| Net operating losses | 60,652,197 | | | 39,397,236 | |
| Federal and state tax credits | 11,996,064 | | | 7,120,567 | |
| Unrealized gains | (102,617,534) | | | (63,739,027) | |
| Deferred tax liabilities | $ | (25,194,740) | | | $ | (17,173,045) | |
| Less: valuation allowance | (1,512,356) | | | (695,093) | |
| Deferred tax liabilities, net | $ | (26,707,096) | | | $ | (17,868,138) | |
GREENBACKER RENEWABLE ENERGY COMPANY LLC AND SUBSIDIARIES
NOTES TO CONSOLIDATED FINANCIAL STATEMENTS
December 31, 2021
Note 9. Income Taxes (cont.)
As of December 31, 2021, the Company has federal net operating loss carryforwards of approximately $228,673,606. Approximately $179,166,225 of the carryforward is indefinite lived with the remaining $49,507,381 expiring in 2034 through 2037. Federal tax credit carryforwards are approximately $11,996,064 and expire in 2035 through 2041.
State net operating loss and credit carryforwards total approximately $234,637,050 and nil, respectively. Approximately $28,357,352 of the net operating loss carryforward is indefinite lived with the remaining $206,279,698 expiring in 2022 through 2041 with earlier years expirations reserved by a valuation allowance.
As new tax legislation was enacted on December 22, 2017, commonly referred to as the Tax Cuts and Jobs Act (the “TCJA”), the Company recognized the effect of any material changes in the TCJA in the determination of deferred tax assets and liabilities for the year ending December 31, 2018. The major aspects of the TCJA that affected the Company included 1) the reduction of the corporate tax rate to 21%, effective December 22, 2017, which caused the Company to remeasure its deferred tax assets and liabilities to reflect the effects of tax rate change in 2017; and 2) a deduction of interest expense up to only 30% (50% for 2019 and 2020) of “adjusted taxable income” (as defined in the TCJA) and the ability of post-2019 net operating losses (“NOLs”) to only offset up to 80% of taxable income, with the understanding that any unused NOL can be carried forward indefinitely, which caused the Company to modify certain assumptions in regard to utilization of NOL and investment tax credits in determining any potential valuation allowance. While cost recovery was modified to allow companies to expense 100% of investments in depreciable property, the Company expects to continue to depreciate renewable energy assets over a five-year life span using accelerated methodology.
In assessing the realizability of deferred tax assets, management considers whether it is more likely than not that some portion or all of the deferred tax assets will not be realized. The ultimate realization of deferred tax assets is dependent upon the generation of future taxable income during the periods in which those temporary differences become deductible. Management considers the scheduled reversal of deferred tax assets, projected future taxable income and tax planning strategies in making this assessment. Based upon projections for future taxable income over the periods in which the deferred tax assets would be deductible, management as of December 31, 2021 has applied a partial valuation allowance of $1,512,356 against the deferred tax assets that are not more likely than not to be utilized during their carryforward period. This represents an $817,262 net increase as compared to valuation allowances of $695,093 for the year ended December 31, 2020. The net increase is due to changes in forecasted taxable income and deferred tax liabilities reversing in the carryforward periods, offset in part by decreases due to previously reserved and expired state investment tax credits.
The Company follows the authoritative guidance on accounting for uncertainty in income taxes and has concluded that it has no material uncertain tax positions to be recognized as of December 31, 2021.
The Company assessed its tax positions and filings for all open tax years as of December 31, 2021 for all federal and state tax jurisdictions for the years 2014 through 2021. The results of this assessment are included in the Company’s tax provision and deferred tax assets as of December 31, 2021.
The effective tax rate for the year ended December 31, 2021 is 17.0%. The primary items giving rise to the difference between the 21.0% statutory rate and the 17.0% effective tax rate are primarily state taxes, 2020 provision to return adjustments and federal tax credits.
The effective tax rate for the year ended December 31, 2020 is 20.7%. The primary items giving rise to the difference between the 21.0% statutory rate and the 20.7% effective tax are primarily state taxes, 2019 provision to return adjustments and federal tax credits.
The effective tax rate for the year ended December 31, 2019 is 21.4%. The primary items giving rise to the difference between the 21.0% statutory rate and the 21.4% effective tax are primarily state taxes, 2018 provision to return adjustments and federal tax credits.
GREENBACKER RENEWABLE ENERGY COMPANY LLC AND SUBSIDIARIES
NOTES TO CONSOLIDATED FINANCIAL STATEMENTS
December 31, 2021
Note 9. Income Taxes (cont.)
Federal and state statutes of limitations are generally open for all years in which the Company has generated net operating losses, the earliest of which is the year ended December 31, 2014.
GREENBACKER RENEWABLE ENERGY COMPANY LLC AND SUBSIDIARIES
NOTES TO CONSOLIDATED FINANCIAL STATEMENTS
December 31, 2021
Note 10. Commitments and Contingencies
Legal Proceedings
The Company may become involved in legal proceedings, administrative proceedings, claims and other litigation that arise in the ordinary course of business. Individuals and interest groups may sue to challenge the issuance of a permit for a renewable energy project or seek to enjoin construction of a wind energy project. In addition, we may be subject to legal proceedings or claims contesting the construction or operation of our renewable energy projects. In defending ourselves in these proceedings, we may incur significant expenses in legal fees and other related expenses, regardless of the outcome of such proceedings. Unfavorable outcomes or developments relating to these proceedings, such as judgments for monetary damages, injunctions or denial or revocation of permits, could have a material adverse effect on our business, financial condition and results of operations. In addition, settlement of claims could adversely affect our financial condition and results of operations. As of December 31, 2021, management is not aware of any legal proceedings that might have a significant adverse impact on the Company.
Pledge of Collateral and Unsecured Guarantee of Loans to Subsidiaries
Pursuant to various project loan agreements between the operating entities of the Company, subsidiary holding companies and various lenders, the operating entities and the subsidiary holding companies have pledged all solar operating assets as well as the membership interests in various operating subsidiaries as collateral for the term loans with maturity dates ranging from June 2022 through September 2049.
Investment in To-Be-Constructed Assets and Membership Interest Purchase Commitments
Pursuant to various engineering, procurement and construction contracts to which 42 entities of the Company are individually a party, the entities, and indirectly the Company, have committed an outstanding balance of approximately $540.2 million to complete construction of the facilities. Based upon current construction schedules, the expectation is that these commitments will be fulfilled in 2022 into 2024. In addition, pursuant to various membership interest purchase agreements to which the Company’s operating entities are individually a party, the operating entities, and indirectly the Company, have committed an outstanding balance of approximately $1,038.2 million to complete the closing pursuant to all conditions being met under the membership interest purchase agreements as of December 31, 2021. The Company plans to use debt and tax equity financing as well as cash on hand to fund such commitments.
Unsecured Guarantee of Subsidiary Renewable Energy Credit (“REC”) Forward Contracts
For the majority of the forward REC contracts currently effective as of December 31, 2021 where a subsidiary of the Company is the principal, the Company has provided an unsecured guarantee related to the delivery obligations. The amount of the unsecured guaranty related to REC delivery performance obligations is nil as of December 31, 2021.
Pledge of Parent Company Guarantees
Pursuant to various contracts in which the Company has provided a parent company guarantee, excluding those discussed above, the operating entities, and indirectly the Company, have committed an additional $114.4 million in unsecured guarantees in the event of a default at the underlying entity, as of December 31, 2021.
See Note 2. Significant Accounting Policies and Note 5. Related Party Agreements and Transaction Agreements for an additional discussion of the Company’s commitments and contingencies.
GREENBACKER RENEWABLE ENERGY COMPANY LLC AND SUBSIDIARIES
NOTES TO CONSOLIDATED FINANCIAL STATEMENTS
December 31, 2021
Note 11. Financial Highlights
The following is a schedule of the financial highlights of the Company attributed to Class A, C, I, P-A, P-I, P-D, P-S, and P-T shares for the year ended December 31, 2021:
| | | | | | | | | | | | | | | | | | | | | | | | | | | | | | | | | | | | | | | | | | | | | | | |
| For the year ended December 31, 2021 |
| Class A Shares | | Class C Shares | | Class I Shares | | Class P-A Shares | | Class P-I Shares | | Class P-D Shares | | Class P-S Shares | | Class P-T Shares |
| Per share data attributed to common shares (1) | | | | | | | | | | | | | | | |
| Net Asset Value at beginning of period | $ | 8.61 | | | $ | 8.35 | | | $ | 8.61 | | | $ | 8.70 | | | $ | 9.02 | | | $ | 8.96 | | $ | 8.84 | | $ | 8.57 |
| Net investment income | 0.02 | | | 0.02 | | | 0.02 | | | 0.02 | | | 0.02 | | | 0.02 | | 0.02 | | 0.02 |
| Net realized and unrealized gain on investments and swap contracts | 0.46 | | | 0.46 | | | 0.46 | | | 0.46 | | | 0.46 | | | 0.46 | | 0.46 | | 0.46 |
| Change in translation of assets and liabilities denominated in foreign currencies (3) | — | | | — | | | — | | | — | | | — | | | — | | — | | — |
| (Provision for) income taxes on realized and unrealized gain (loss) on investments, foreign currency translation and swap contracts | (0.14) | | | (0.14) | | | (0.14) | | | (0.14) | | | (0.14) | | | (0.14) | | | (0.14) | | | (0.14) | |
| Net increase in net assets attributed to common members | 0.34 | | | 0.34 | | | 0.34 | | | 0.34 | | 0.34 | | | 0.34 | | | 0.34 | | | 0.34 | |
| Shareholder distributions: | | | | | | | | | | | | | | | |
| Distributions from net investment income | — | | | — | | | — | | | — | | | — | | | — | | — | | — |
| Distributions from offering proceeds | (0.56) | | | (0.54) | | | (0.56) | | | (0.56) | | | (0.58) | | | (0.53) | | (0.53) | | (0.53) |
| Other (2) | (0.07) | | | (0.02) | | | (0.07) | | | 0.10 | | | 0.02 | | | 0.03 | | | 0.09 | | | 0.14 | |
| Net decrease in members’ equity attributed to common shares | (0.63) | | | (0.56) | | | (0.63) | | | (0.46) | | | (0.56) | | | (0.50) | | | (0.44) | | | (0.39) | |
| Net asset value for common shares at end of period | $ | 8.32 | | | $ | 8.13 | | | $ | 8.32 | | | $ | 8.58 | | | $ | 8.80 | | | $ | 8.80 | | | $ | 8.74 | | | $ | 8.52 | |
| Common members’ equity at end of period | $ | 137,994,947 | | | $ | 22,290,310 | | | $ | 53,665,823 | | | $ | 6,721,670 | | | $ | 810,046,418 | | | $ | 1,747,603 | | $ | 404,803,246 | | $ | 2,040,615 |
| Common shares outstanding at end of period | 16,580,558 | | | 2,741,963 | | | 6,449,493 | | | 783,593 | | | 92,069,013 | | 198,548 | | 46,324,757 | | 239,594 |
| | | | | | | | | | | | | | | |
| Ratio/supplemental data for common shares (annualized) | | | | | | | | | | | | | | | |
| Total return attributed to common shares based on net asset value | 3.29 | % | | 4.03 | % | | 3.29 | % | | 5.18 | % | | 4.13 | % | | 3.81 | % | | 4.98 | % | | 5.48 | % |
| Ratio of net investment income to average net assets | 0.25 | % | | 0.26 | % | | 0.25 | % | | 0.23 | % | | 0.24 | % | | 0.22 | % | | 0.24 | % | | 0.24 | % |
| Ratio of operating expenses to average net assets | 3.68 | % | | 3.77 | % | | 3.67 | % | | 3.34 | % | | 3.45 | % | | 3.28 | % | | 3.53 | % | | 3.48 | % |
| Portfolio turnover rate | 0.98 | % | | 0.98 | % | | 0.98 | % | | 0.98 | % | | 0.98 | % | | 0.98 | % | | 0.98 | % | | 0.98 | % |
(1)The per share data for Class A, C, I, P-A, P-I, P-D, P-S, and P-T shares were derived by using the weighted average shares outstanding during the year ended December 31, 2021, which were 16,741,429, 2,751,320, 6,552,391, 479,717, 67,370,914, 129,799, 32,304,342, and $128,948, respectively.
(2)Represents the impact of different share amounts used in calculating certain per share data based on weighted average shares outstanding during the period and the impact of shares at a price other than the net asset value.
(3)Amount is less than $0.01 per share.
The following is a schedule of the financial highlights of the Company adjusted for the effect of the revisions discussed in Note 12 attributed to Class A, C, I, P-A and P-I shares for the year ended December 31, 2020.
GREENBACKER RENEWABLE ENERGY COMPANY LLC AND SUBSIDIARIES
NOTES TO CONSOLIDATED FINANCIAL STATEMENTS
December 31, 2021
Note 11. Financial Highlights (cont.)
| | | | | | | | | | | | | | | | | | | | | | | | | | | | | |
| For the year ended December 31, 2020 |
| Class A
Shares | | Class C
Shares | | Class I
Shares | | Class P-A
Shares | | Class P-I
Shares |
| Per share data attributed to common shares (1) | | | | | | | | | |
| Net Asset Value at beginning of period | $ | 8.40 | | | $ | 8.23 | | | $ | 8.40 | | | $ | 8.44 | | | $ | 8.73 | |
| Net investment income (2) | 0.16 | | | 0.16 | | | 0.16 | | | 0.16 | | | 0.16 | |
| Net realized and unrealized gain on investments and swap contracts, net of incentive allocation to special unitholder | 0.99 | | | 0.99 | | | 0.99 | | | 0.99 | | | 0.99 | |
| Change in translation of assets and liabilities denominated in foreign currencies (3) | — | | | — | | | — | | | — | | | — | |
| (Provision for) income taxes on realized and unrealized gain (loss) on investments, foreign currency translation and swap contracts | (0.34) | | | (0.34) | | | (0.34) | | | (0.34) | | | (0.34) | |
| Net increase in net assets attributed to common members | 0.81 | | | 0.81 | | | 0.81 | | | 0.81 | | | 0.81 | |
| Shareholder distributions: | | | | | | | | | |
| Distributions from net investment income | (0.03) | | | (0.03) | | | (0.03) | | | (0.03) | | | (0.03) | |
| Distributions from offering proceeds | (0.54) | | | (0.53) | | | (0.54) | | | (0.54) | | | (0.55) | |
| Offering costs and deferred sales commissions | — | | | (0.09) | | | — | | | — | | | — | |
| Other (4) | (0.03) | | | (0.04) | | | (0.03) | | | 0.02 | | | 0.06 | |
| Net decrease in members’ equity attributed to common shares | (0.60) | | | (0.69) | | | (0.60) | | | (0.55) | | | (0.52) | |
| Net asset value for common shares at end of period | $ | 8.61 | | | $ | 8.35 | | | $ | 8.61 | | | $ | 8.70 | | | $ | 9.02 | |
| Common members’ equity at end of period | $ | 144,978,110 | | | $ | 22,836,128 | | | $ | 56,156,327 | | | $ | 480,799 | | | $ | 331,100,495 | |
| Common shares outstanding at end of period | 16,844,129 | | | 2,734,661 | | | 6,526,001 | | | 55,264 | | | 36,710,292 | |
| | | | | | | | | |
| Ratio/supplemental data for common shares (annualized) | | | | | | | | | |
| Total return attributed to common shares based on net asset value | 9.56 | % | | 8.49 | % | | 9.51 | % | | 10.12 | % | | 10.23 | % |
| Ratio of net investment income to average net assets | 1.92 | % | | 1.97 | % | | 1.92 | % | | 1.90 | % | | 1.84 | % |
| Ratio of operating expenses to average net assets before performance participation fee waiver | 5.12 | % | | 5.26 | % | | 5.13 | % | | 5.06 | % | | 4.91 | % |
| Ratio of operating expenses to average net assets after performance participation fee waiver | 4.96 | % | | 5.09 | % | | 4.96 | % | | 4.90 | % | | 4.75 | % |
| Portfolio turnover rate | 12.35 | % | | 12.35 | % | | 12.35 | % | | 12.35 | % | | 12.35 | % |
(1)The per share data for Class A, C, I, P-A and P-I shares were derived by using the weighted average shares outstanding during the year ended December 31, 2020, which were 17,188,603, 2,740,846, 6,672,886, 19,632, and 27,435,653, respectively.
(2)Does not reflect any incentive fees that may be payable to the Special Unitholder.
GREENBACKER RENEWABLE ENERGY COMPANY LLC AND SUBSIDIARIES
NOTES TO CONSOLIDATED FINANCIAL STATEMENTS
December 31, 2021
Note 11. Financial Highlights (cont.)
(3)Amount is less than $0.01 per share.
(4)Represents the impact of different share amounts used in calculating certain per share data based on weighted average shares outstanding during the period and the impact of shares at a price other than the net asset value.
The following is a schedule of the financial highlights of the Company attributed to Class A, C, I, P-A and P-I shares for the year ended December 31, 2019.
| | | | | | | | | | | | | | | | | | | | | | | | | | | | | |
| For the year ended December 31, 2019 |
| Class A
Shares | | Class C
Shares | | Class I
Shares | | Class P-A
Shares | | Class P-I
Shares |
| Per share data attributed to common shares (1) | | | | | | | | | |
| Net Asset Value at beginning of period | $ | 8.40 | | | $ | 8.21 | | | $ | 8.40 | | | $ | 8.40 | | | $ | 8.62 | |
| Net investment income (2) | 0.17 | | | 0.17 | | | 0.17 | | | 0.17 | | | 0.17 | |
| Net realized and unrealized gain (loss) on investments and swap contracts, net of incentive allocation to special unitholder | 0.68 | | | 0.68 | | | 0.68 | | | 0.68 | | | 0.68 | |
| Change in translation of assets and liabilities denominated in foreign currencies (3) | — | | | — | | | — | | | — | | | — | |
| (Provision for) income taxes on realized and unrealized gain (loss) on investments, foreign currency translation and swap contracts | (0.24) | | | (0.24) | | | (0.24) | | | (0.24) | | | (0.24) | |
| Net increase in net assets attributed to common members | 0.61 | | | 0.61 | | | 0.61 | | | 0.61 | | | 0.61 | |
| Shareholder distributions: | | | | | | | | | |
| Distributions from net investment income | (0.10) | | | (0.10) | | | (0.10) | | | (0.10) | | | (0.10) | |
| Distributions from offering proceeds | (0.51) | | | (0.50) | | | (0.51) | | | (0.51) | | | (0.48) | |
| Offering costs and deferred sales commissions | (0.02) | | | (0.05) | | | (0.03) | | | — | | | — | |
| Other (4) | 0.02 | | | 0.06 | | | 0.03 | | | 0.04 | | | 0.08 | |
| Net decrease in members’ equity attributed to common shares | (0.61) | | | (0.59) | | | (0.61) | | | (0.57) | | | (0.50) | |
| Net asset value for common shares at end of period | $ | 8.40 | | | $ | 8.23 | | | $ | 8.40 | | | $ | 8.44 | | | $ | 8.73 | |
| Common members’ equity at end of period | $ | 144,540,863 | | | $ | 22,364,784 | | | $ | 56,217,673 | | | $ | 152,879 | | | $ | 185,463,453 | |
| Common shares outstanding at end of period | 17,210,016 | | | 2,718,475 | | | 6,693,658 | | | 18,109 | | | 21,249,352 | |
| | | | | | | | | |
| Ratio/supplemental data for common shares (annualized) | | | | | | | | | |
| Total return attributed to common shares based on net asset value | 7.30 | % | | 7.54 | % | | 7.04 | % | | 5.66 | % | | 8.15 | % |
| Ratio of net investment income to average net assets | 2.01 | % | | 2.02 | % | | 1.99 | % | | 2.00 | % | | 1.95 | % |
| Ratio of operating expenses to average net assets | 4.01 | % | | 4.04 | % | | 3.98 | % | | 3.99 | % | | 3.90 | % |
| Portfolio turnover rate | 14.04 | % | | 14.04 | % | | 14.04 | % | | 14.04 | % | | 14.04 | % |
(1)The per share data for Class A, C, I, P-A and P-I shares were derived by using the weighted average shares outstanding during the year ended December 31, 2019, which were 17,270,555, 2,645,713, 6,642,314 17,841, and 17,211,763, respectively.
GREENBACKER RENEWABLE ENERGY COMPANY LLC AND SUBSIDIARIES
NOTES TO CONSOLIDATED FINANCIAL STATEMENTS
December 31, 2021
Note 11. Financial Highlights (cont.)
(2)Does not reflect any incentive fees that may be payable to the Special Unitholder.
(3)Amount is less than $0.01 per share.
(4)Represents the impact of the different share amounts used in calculating certain per share data based on weighted average shares outstanding during the period and the impact of shares at a price other than the net asset value.
GREENBACKER RENEWABLE ENERGY COMPANY LLC AND SUBSIDIARIES
NOTES TO CONSOLIDATED FINANCIAL STATEMENTS
December 31, 2021
Note 12. Revisions to Prior Period Financial Statements
As disclosed in the 2020 Form 10-K, during the year ended December 31, 2020, we identified errors related to deferred tax assets included in our consolidated financial statements for the quarterly period ending September 30, 2016 and each subsequent quarterly and annual period through the quarterly period ending June 30, 2020. We concluded that our previously issued consolidated financial statements were not materially misstated as a result of these errors, but the correction would be material to the current period Consolidated Statements of Operations. As such, we revised our previously reported quarterly and annual consolidated financial statements for the periods since September 30, 2016. The historical periods presented in this Annual Report on Form 10-K have been revised with corresponding adjustment to accumulated gains (losses) on the Consolidated Statements of Assets and Liabilities to correct for these errors.
The errors resulted in an overstatement of our deferred tax assets, net of allowance, on the Consolidated Statements of Assets and Liabilities and also affected the (Provision for) income taxes on realized and unrealized gain (loss) on investments, foreign currency translation and swap contracts on the Consolidated Statements of Operations.
These errors had no impact on our cash flows, and as such, did not impact our Consolidated Statements of Cash Flows.
The following tables set forth the effect of the revisions on each of the individual affected line items in the consolidated financial statements:
| | | | | | | | | | | | | | | | | |
| For the year ended December 31, 2019 |
| As Previously Reported | | Adjustments | | As Revised |
| Consolidated Statement of Operations data | | | | | |
| (Provision for) income taxes on realized and unrealized gain (loss) on investments, foreign currency translation and swap contracts | $ | (7,926,882) | | | $ | (2,535,091) | | | $ | (10,461,973) | |
| Net increase in net assets resulting from operations | 34,568,111 | | | (2,535,091) | | | 32,033,020 | |
| Net increase in net assets attributed to common members | 29,297,441 | | | (2,535,091) | | | 26,762,350 | |
| Common stock per share information - basic and diluted | | | | | |
| Net increase in net assets attributed to common members | $ | 0.67 | | | $ | (0.06) | | | $ | 0.61 | |
GREENBACKER RENEWABLE ENERGY COMPANY LLC AND SUBSIDIARIES
NOTES TO CONSOLIDATED FINANCIAL STATEMENTS
December 31, 2021
Note 13. Subsequent Events
The Company’s management has evaluated subsequent events through the date of issuance of the consolidated financial statements. There have been no subsequent events that occurred during such period that would require disclosure in the consolidated financial statements or would be required to be recognized in the consolidated financial statements as of and for the year ended December 31, 2021 other than that disclosed below.
As of March 17, 2022, the Company closed to new equity capital and terminated its offering of shares except pursuant to the DRP. This close allows the Company to evaluate strategic directions for its portfolio. The Company also intends to use the period to solidify its portfolio, bringing more of its construction assets online and optimizing the financing of its portfolio.
GREENBACKER RENEWABLE ENERGY COMPANY LLC AND SUBSIDIARIES
NOTES TO CONSOLIDATED FINANCIAL STATEMENTS
December 31, 2021
Note 14. COVID-19 Impact
In March of 2020, the United States declared a National Emergency concerning the COVID-19 outbreak. This came after the World Health Organization declared the virus a global pandemic on March 11, 2020.
Since the outbreak of COVID-19 in the United States, the Company has generally been able to conduct its business despite the turmoil in markets and the shuttering of many businesses across the country. We have and will continue to assess the current and future business risks related to COVID-19 as new information becomes available, including any potential performance risk of our PPA and construction counterparties. As of the date of the filing, we are not aware of any material impact to our financial results.
ITEM 9. CHANGES IN AND DISAGREEMENTS WITH ACCOUNTANTS ON ACCOUNTING AND FINANCIAL 81 DISCLOSURE
None.
ITEM 9A. CONTROLS AND PROCEDURES
Disclosure Controls
In accordance with Rules 13a-15(b) and 15d-15(b) of the Securities Exchange Act of 1934, as amended (the “Exchange Act”), we, under the supervision and with the participation of our Chief Executive Officer and Chief Financial Officer, carried out an evaluation of the effectiveness of our disclosure controls and procedures (as defined in Rule 13a-15(e) and Rule 15d-15(e) of the Exchange Act) as of the end of the period covered by this Annual Report on Form 10-K, and determined that the disclosure controls and procedures are effective. Our disclosure controls and procedures are designed to provide reasonable assurance that information we are required to disclose in the reports that we file or submit under the Exchange Act are recorded, processed and summarized and reported within the time period specified in the applicable rules and forms.
Management’s Report on Internal Control over Financial Reporting
Our internal control over financial reporting is a process designed to provide reasonable assurance regarding the reliability of financial reporting and the preparation of financial statements for external purposes in accordance with GAAP. The internal control over financial reporting for the Company includes those policies and procedures that (i) pertain to the maintenance of records that, in reasonable detail, accurately and fairly reflect the transactions and dispositions of assets; (ii) provide reasonable assurance that transactions are recorded as necessary to permit preparation of financial statements in accordance with GAAP, and that receipts and expenditures are being made only in accordance with authorizations of our management; and (iii) provide reasonable assurance regarding the prevention or timely detection of unauthorized acquisition, use or disposition of assets that could have a material effect on the consolidated financial statements of the Company.
Because of its inherent limitations, internal control over financial reporting may not prevent or detect misstatements. All internal control systems, no matter how well designed, have inherent limitations, including the possibility of human error and the circumvention of overriding controls. Accordingly, even effective internal control over financial reporting can provide only reasonable assurance with respect to financial statement preparation. Also, projections of any evaluation of effectiveness to future periods are subject to the risk that controls may become inadequate because of changes in conditions, or that the degree of compliance with the policies or procedures may deteriorate.
Our management assessed the effectiveness of the internal control over financial reporting as of December 31, 2021, based on the framework set forth by the Committee of Sponsoring Organizations of the Treadway Commission (COSO) in its 2013 framework as part of its assessment. Based on that assessment, our management concluded that, as of December 31, 2021, the internal control over financial reporting for the Company is effective based on the criteria established in Internal Control-Integrated Framework.
This annual report does not include an attestation report of the Company’s independent registered public accounting firm regarding internal control over financial reporting. Our management’s report was not subject to attestation by the Company’s independent registered public accounting firm pursuant to the rules of the SEC that permit the Company to provide only management’s report in this annual report.
Change in Internal Control Over Financial Reporting
No change occurred in our internal control over financial reporting (as defined in Rule 13a-15(f) and 15d-15(f) of the Exchange Act) during the year ended December 31, 2021 that has materially affected, or is reasonably likely to materially affect, our internal control over financial reporting.
Limitations on the Effectiveness of Controls
Any control system, no matter how well designed and operated, can only provide reasonable (but not absolute) assurance that its objectives will be met. Furthermore, no evaluation of controls can provide absolute assurance that all control issues and instances of fraud, if any, have been detected.
ITEM 9B. Other Information
None.
GREENBACKER RENEWABLE ENERGY COMPANY LLC AND SUBSIDIARIES
NOTES TO CONSOLIDATED FINANCIAL STATEMENTS
December 31, 2021
ITEM 9C. Disclosure Regarding Foreign Jurisdictions that Prevent Inspections
Not Applicable.
PART III
ITEM 10. DIRECTORS, EXECUTIVE OFFICERS AND CORPORATE GOVERNANCE
Our business and affairs are overseen by our Board of Directors, as provided by our Operating Agreement and Delaware law. The Board of Directors has retained GCM to manage our investment activities, the quarterly valuation of our assets and our financing arrangements, subject to the board’s supervision. The Board of Directors currently has an Audit Committee and a Nominating and Corporate Governance Committee and may establish additional committees from time to time as necessary. Each director will serve until the next annual meeting of members and until his or her successor is duly elected. Although the number of directors may be increased or decreased, a decrease will not have the effect of shortening the term of any incumbent director. Any director may resign at any time and may be removed with or without cause by the members upon the affirmative vote of at least a majority of the votes entitled to be cast at a meeting called for the purpose of the proposed removal. The notice of the meeting shall indicate that the purpose, or one of the purposes, of the meeting is to determine if the director shall be removed.
A vacancy created by an increase in the number of directors or the death, resignation, removal, adjudicated incompetence or other incapacity of a director may be filled only by a vote of a majority of the remaining directors. As provided in our Operating Agreement, nominations of individuals to fill the vacancy of a board seat previously filled by an independent director will be made by the remaining independent directors.
Our Board of Directors consists of seven members, a majority of whom are independent directors as such term is defined in NASDAQ Listing Rule 5605(a)(2). We are prohibited from making loans or extending credit, directly or indirectly, to our directors or executive officers under section 402 of the Sarbanes-Oxley Act of 2002.
Our Board of Directors serve in a fiduciary capacity to us and have a fiduciary duty to our members. This means that each director must perform his or her duties in good faith and in a manner that each director considers to be in our best interest and in the best interests of the members. Our Board of Directors has a fiduciary responsibility for the safekeeping and use of all of our funds and assets and will not employ or permit another to employ such funds or assets in any manner except for the exclusive benefit of us.
Directors and Executive Officers
The following table sets forth certain information regarding our directors and executive officers. The biographical descriptions for each director include the specific experience, qualifications, attributes and skills that led to the conclusion by our Board of Directors that such person should serve as a director.
| | | | | | | | | | | | | | | | | | | | |
| Name | | Age | | Position(s) Held with Us | | Director/Executive
Officer Since |
| David Sher | | 58 | | Director | | 2012 |
| Charles Wheeler | | 61 | | Chief Executive Officer, President, and Director | | 2012 |
| Richard C. Butt | | 66 | | Chief Financial Officer and Secretary | | 2014 |
| Robert Brennan | | 59 | | Director | | 2019 |
| Kathleen Cuocolo | | 70 | | Independent Director | | 2013 |
| Robert Herriott | | 52 | | Independent Director | | 2013 |
| David M. Kastin | | 54 | | Independent Director | | 2013 |
| Cynthia Curtis | | 62 | | Independent Director | | 2019 |
David Sher has been a board member since our inception in December 2012. Mr. Sher has served as Chief Executive Officer of GCM and Co-Chief Executive Officer of Greenbacker Group LLC since August 2012 (having previously served as a Managing Director of Greenbacker Group LLC since February 2011), as well as a member of GCM’s Investment Committee. He has also served as Chief Executive Officer and as a director of GREC since November 2011. Prior to joining our Company, Mr. Sher was a senior advisor at Prospect Capital Corporation, a mezzanine debt and private equity firm that manages a publicly traded, closed-end, dividend-focused investment company, from June 2009 to January 2011 (NASDAQ: PSEC). Prior to joining Prospect Capital, Mr. Sher was a serial entrepreneur founding a number of ventures in the financial services and brokerage industry. In 2002, Mr. Sher was a founder and Managing Director of ESP Technologies, a leading provider of financial software and services to institutional asset managers and hedge funds. In May of 2007, that company was sold to a group of investors. Prior to co-founding ESP, Mr. Sher was a founder and CEO of an online brokerage company, ElephantX dot com Inc. Additionally, in September 1997, he co-founded, developed and managed Lafayette Capital Management LLC, a
statistical arbitrage hedge fund. Mr. Sher also spent six years at Bear Stearns where he developed trading ideas and strategies for correspondent clearing customers from 1991 to 1997.
Mr. Sher holds a Master of International Affairs from Columbia University and a Bachelor of Arts in Political Science from Rutgers University.
Mr. Sher was selected to serve as a director because he is our Advisor’s Chief Executive Officer and has over 20 years of executive experience in various areas, having previously served as founder and CEO of several companies, including two broker-dealers. He has substantial private equity and investing experience involving originated loan transactions, including serving as a senior advisor at Prospect Capital Corporation, a publicly traded business development company (NASDAQ: PSEC). He also has experience working in the renewable energy sector, including a transaction involving the proposed sale of a 28MW biomass power plant to a private equity firm. David Sher is the brother of Robert Sher, a managing director of GCM.
Charles Wheeler has served as our Chief Executive Officer, President, and as a board member since our inception in December 2012. Mr. Wheeler has also served as President of GCM and Co-Chief Executive Officer of Greenbacker Group LLC since August 2012 (having previously served as a Managing Director of Greenbacker Group LLC since August 2011), and as President and a director of GREC since November 2011. Mr. Wheeler is a veteran of the investment banking industry, having spent 24 years, from 1987 to January 2011, with the Macquarie Group, one of Australia’s leading investment banks. During that time, Mr. Wheeler held several senior positions with the Macquarie Group, including Head of Financial Products for North America from 2007 to January 2009 and Head of Renewables for North America from September 2007 to December 2010. From 1998 to August 2007, Mr. Wheeler was a Director of the Financial Products Group at Macquarie in Australia, with responsibility for the development, distribution and ongoing management of a wide variety of retail financial products, including REITs, infrastructure bonds, international investment trusts and diversified domestic investment trusts. Prior to joining Macquarie, Mr. Wheeler was a tax manager with Touche Ross & Co. in Australia (which was merged into KPMG in Australia).
Mr. Wheeler holds a Bachelor of Economics from Sydney University and is a member of the Institute of Chartered Accountants of Australia.
Mr. Wheeler was selected to serve as a director because he is our Chief Executive Officer and has significant knowledge of, and relationships within, the project and structured finance industry and the renewable energy sector due to his numerous positions with the Macquarie Group. Mr. Wheeler also brings his extensive background in project and structured finance to bear on the renewables sector. He had experience working in the solar and wind energy sectors while at Macquarie, including a transaction involving the purchase and subsequent management of a large portfolio of distributed solar assets located in California, the consideration of several proposals to invest equity into solar thermal power plants across the Southwest, the acquisition of a wind developer in Texas, and the evaluation of numerous wind development opportunities across Canada and the United States. Furthermore, during his tenure at Macquarie, Mr. Wheeler participated in several other renewable energy resource transactions, including a proposal to invest equity into a significant unlisted geothermal developer based in Nevada.
Richard C. Butt has served as our Chief Financial Officer from January 2012 to July 2013 and since April 2014. Mr. Butt has held a variety of senior management positions at global investment and financial institutions. Most recently, from July 2012 to August 2013, he served as President and Chief Executive Officer of P3 Global Management LLC, a firm focused on investing in municipal infrastructure assets. From August 2006 to January 2011, he served as President of Macquarie Capital Investment Management LLC, with offices in New York and Sydney, Australia, responsible for administration, operations, finance, compliance, treasury, marketing, business operations and FX/cash management for portfolios domiciled in North America, Australia, Asia, Europe and the Caribbean. In addition, Mr. Butt served as Chief Financial and Accounting Officer for Macquarie Global Infrastructure Fund, a New York Stock Exchange-listed closed-end fund (NYSE: MGU). Prior to joining Macquarie, Mr. Butt served as President of Refco Alternative Investments LLC and Refco Fund Holdings LLC, the commodity pool businesses associated with Refco, Inc., from January 2003 to August 2006. In this capacity, Mr. Butt was responsible for the initial development and ongoing operations of numerous public and private commodity pools. During the period from 1990 through 2003, he served in various operational and financial capacities with multiple mutual/hedge fund third-party administration firms. Earlier in his career, he served as Vice President at Fidelity Investments, where he was responsible for fund accounting and financial reporting for all equity and global mutual funds. Mr. Butt is a Certified Public Accountant (inactive), previously working at major accounting firms such as PricewaterhouseCoopers LLP, from July 1978 to July 1984, where he was an Audit Manager, and KPMG from December 1994 to October 1996, where he was a Director in its financial services consulting practice. Mr. Butt holds a bachelor’s degree in Management Science from Duke University.
Robert Brennan has been a director since May 2019. Robert has served as Co-Chair of the Board of Directors of GREC and as a Non-Executive Officer of GCM since December 1, 2017. Mr. Brennan was previously a Senior Managing Director and
Head of Guggenheim Partners Commercial Real Estate Finance Group, where from 2010 to 2017 he built a national commercial mortgage loan origination, servicing and asset management business responsible for nearly $10 billion of loans for client investment portfolios. Additionally, Mr. Brennan was an executive member and founding investor of Pillar Financial, Guggenheim’s GSE licensed lending, mortgage banking, and servicing affiliate, which was sold to SunTrust Bank in late 2016. Mr. Brennan spent the last 26 years of his 34-year Wall Street career focused on real estate, in which he played a wide range of roles including trading, origination, structuring and banking, and asset management. Mr. Brennan was involved with a broad array of property and project types ranging from conventional income producing to project-based transactions. Prior to Guggenheim, he was the Global Head of Credit Suisse’s Real Estate Finance and Securitization Group which was a dominant global leader in the commercial real estate finance industry. Mr. Brennan joined Credit Suisse in November 2000, when it was merged with Donaldson, Lufkin and Jenrette (“DLJ”), where he was a Managing Director and Head of the Commercial Mortgage Group. Mr. Brennan held previous positions at UBS Securities and L.F. Rothschild and started his career in 1983 with E.F. Hutton, where he was an Associate in the Investment Banking Division. Mr. Brennan is a graduate of the University of Vermont and holds an M.B.A. from New York University. He is a member of the Board of the Commercial Real Estate Finance Council, where he chairs the long-range planning and investment committee.
Kathleen Cuocolo, an independent director since July 2013, is currently President of Syntax LLC, a company that has created a new class of equity indices—Syntax Stratified Indices. She is responsible for overseeing the business and infrastructure development at Syntax of a family of Stratified IndicesTM and Stratified FundsTM. Ms. Cuocolo was formerly Managing Director, Head of Global ETF Accounting and Administration at Bank of New York Mellon from April 2008 until March 2013. Prior to Bank of New York Mellon, she was President of Cuocolo & Associates from January 2004 through March 2008, where she specialized in board governance services. From September 1982 through July 2003, Ms. Cuocolo served as Executive Vice President of State Street Corporation, where she was also Head of US Fund Administration Services and the founder of Exchange Traded Fund Services. In addition, Ms. Cuocolo served as an independent director of Guardian Life Mutual Funds from June 2006 through its acquisition by RS Investments in December 2007; Chairperson of Select Sectors SPDR Trust from August 2000 through October 2007; trustee of SPDR Trust from January 1993 through July 2003; President and Director of The China Fund from September 1999 through July 2003; and President of the State Street Master Funds from January 2000 through July 2003. Ms. Cuocolo was selected to serve as an independent director based upon her extensive experience in financial service administration as well as an investor.
Robert Herriott, an independent director since July 2013, founded RBT Public Affairs Group in January 2009. Mr. Herriott has worked in public affairs since 1994, serving in various political, legislative, and governmental liaison roles. In his capacity with RBT Public Affairs Group, Mr. Herriott was involved with legislative and regulatory issues concerning FATCA, the Dodd-Frank Act, and Investment Management Operational Due Diligence, among others, including Green Energy Initiatives and Healthcare. Prior to forming RBT Public Affairs Group, Mr. Herriott served from January 2007 to April 2009 as an internal advisor to the Toy Industry Association, assisting in the legislative and regulatory reform of the industry, and harmonizing manufacturing standards between the United States, China and the European Union.
Mr. Herriott has testified before legislative bodies regarding pending legislation and spoken throughout the U.S. and internationally on how to interact with government, communication strategy, the U.S. legislative process, and specific industry issues pending before governmental entities. Mr. Herriott continues to advise clients on macro and micro governmental and political risk analysis, as well as reputation management and public affairs campaigns. Mr. Herriott was selected to serve as an independent director based on his extensive experience with legislative and regulatory issues, and with federal government energy initiatives, in particular. Since joining the Company as an independent director, Mr. Herriott has earned a certificate in Energy Innovation and Emerging Technologies from Stanford University and a Directorship Certification from the National Association of Corporate Directors.
David M. Kastin has been an independent director since July 2013. Since August 2020, he has been General Counsel and Corporate Secretary of Clever Leaves International, Inc. From August 2015 through January 2020, he was Senior Vice President, General Counsel and Corporate Secretary of Vitamin Shoppe, Inc. From August 2007 through August 2015, Mr. Kastin was Senior Vice President, General Counsel and Corporate Secretary of Town Sports International Holdings, Inc. From March 2007 through July 2007, he was Senior Associate General Counsel and Corporate Secretary of Sequa Corporation, a diversified manufacturer. From March 2003 through December 2006, Mr. Kastin was in-house counsel at Toys “R” Us, Inc., most recently serving as Vice President–Deputy General Counsel. From 1996 through 2003, he was an associate in the corporate and securities departments at several prominent New York law firms, including Bryan Cave LLP. From September 1992 through October 1996, Mr. Kastin was a Staff Attorney in the Northeast Regional Office of the U.S. Securities and Exchange Commission. Mr. Kastin was selected to serve as an independent director based on his extensive experience as a legal and strategic advisor to publicly traded companies.
Cynthia Curtis has been an independent director since May 2019. She is currently Senior Vice President of Sustainability for JLL, a Fortune 200 commercial real estate services company. She is responsible for elevating JLL’s sustainability program, embedding it broadly throughout the business and driving meaningful impact with and through JLL’s clients. Ms. Curtis also collaborates with the Investor Relations team to ensure its investors have a more complete understanding of JLL’s competencies, goals and impacts. She represents the Company on the World Green Building Council’s Corporate Advisory Board. Previously, Ms. Curtis worked in the public, private and non-profit sectors, including at Ceres CA Technologies, where she served as Vice President and Chief Sustainability Officer, and at EMC (now Dell), where she was Senior Director, Services Marketing. She lives in the Boston area, is a member of the New England Women in Energy and the Environment, chairs the Wellesley Village Church Energy Committee, and built one of the region’s first gold LEED-certified residences. Ms. Curtis was selected to serve as an independent director based on her extensive experience in marketing and sustainability.
We operate under the direction of our Board of Directors, a majority of whom are independent—Kathleen Cuocolo, Robert Herriott, David M. Kastin, and Cynthia Curtis. Charles Wheeler, who also serves as Chief Executive Officer and President of the Company and President of our Advisor, and David Sher, who also serves as Chief Executive Officer of our Advisor, are the other members of our Board of Directors. No member of our Board of Directors, including Messrs. Sher and Wheeler, has ever served as an officer or director of the dealer manager, or of any of their affiliates.
Committees of the Board of Directors
The entire Board of Directors considers all major decisions concerning our business. However, our Operating Agreement provides that our Board of Directors may establish such committees as our board believes appropriate. Our Board of Directors will appoint the members of the committee in its discretion, provided a majority of the members of the Audit Committee of our Board of Directors be composed of independent directors. Our Board of Directors has established an Audit Committee and adopted a charter for the Audit Committee that complies with current U.S. federal and NASDAQ rules relating to corporate governance matters. In addition, our Board of Directors has established a Nominating and Corporate Governance Committee, as described below.
Audit Committee
Our audit committee is composed of Kathleen Cuocolo, Robert Herriott, Cynthia Curtis and David M. Kastin, all of whom are independent directors. The Audit Committee will assist the Board of Directors in overseeing:
•our accounting and financial reporting processes;
•the integrity and audits of our consolidated financial statements;
•our compliance with legal and regulatory requirements;
•the qualifications and independence of our independent auditors; and
•the performance of our internal and independent auditors.
Kathleen Cuocolo chairs our audit committee and serves as our “audit committee financial expert,” as that term is defined by the SEC.
Nominating and Corporate Governance Committee
Our Nominating and Corporate Governance Committee is composed of Charles Wheeler, David Sher, Robert Brennan, Cynthia Curtis and Robert Herriott. Cynthia Curtis and Robert Herriott are the independent directors on the Committee. The Nominating and Corporate Governance Committee operates pursuant to a charter approved by our Board of Directors. The charter sets forth the responsibilities of the Nominating and Corporate Governance Committee, including making nominations for the appointment or election of independent directors, retirement policies and investment professionals training policies.
Robert Herriott chairs our Nominating and Corporate Governance Committee.
ITEM 11. EXECUTIVE COMPENSATION
None of our executive officers will receive any compensation for their service as our executive officers.
ITEM 12. SECURITY OWNERSHIP OF CERTAIN BENEFICIAL OWNERS AND MANAGEMENT AND RELATED MEMBER MATTERS
The following table sets forth, as of the date of this report, information with respect to the beneficial ownership of our shares by:
•each person known to us to beneficially own more than 5% of any class of the outstanding shares;
•each of our directors, director nominees and named executive officers; and
•all of our directors and executive officers as a group.
We have issued 23,601 Class A and 2,776 Class P-D shares to our Advisor. Beneficial ownership is determined in accordance with the rules of the SEC and includes voting or investment power with respect to the securities. There are no shares subject to options that are currently exercisable or exercisable within 60 days of the offering. Unless otherwise indicated, all shares are owned directly, and the indicated person has sole voting and investment power.
| | | | | | | | | | | | | | |
| Name and Address (1) | | Number
of Shares
Beneficially
Owned | | Percentage
of all
Shares
Issued and
Outstanding |
| Greenbacker Capital Management LLC (2) | | 26,377 | | | 0.02 | % |
| Greenbacker Group LLC | | — | | | — | % |
| David Sher | | 11,659 | | | 0.01 | % |
| Charles Wheeler | | 27,738 | | | 0.02 | % |
| Richard C. Butt | | 30,328 | | | 0.02 | % |
| Robert Brennan | | 12,000 | | | 0.01 | % |
| Kathleen Cuocolo | | 32,971 | | | 0.02 | % |
| Cynthia Curtis | | 5,466 | | | — | % |
| Robert Herriott | | 11,305 | | | 0.01 | % |
| David M. Kastin | | 10,798 | | | 0.01 | % |
| All officers and directors as a group (8 persons)* | | 142,264 | | | 0.09 | % |
*Percentages may not foot due to rounding.
(1) Unless otherwise indicated, the address of each beneficial owner is c/o Greenbacker Capital Management LLC, 30 Danforth Street, Suite 206, Portland, ME 04101.
(2) Greenbacker Capital Management LLC (GCM) is a wholly owned subsidiary of Greenbacker Group LLC. The Board of Directors of Greenbacker Group LLC has investment power over the Class A shares held by GCM, including the power to dispose, or to direct the disposition, of such shares. Charles Wheeler, David Sher and Robert Brennan are members of the Board of Directors of Greenbacker Group LLC.
ITEM 13. CERTAIN RELATIONSHIPS AND RELATED TRANSACTIONS, AND DIRECTOR INDEPENDENCE
Our Board of Directors oversees our management. However, we have entered into the advisory agreement with our Advisor, GCM, pursuant to which GCM is responsible for managing us on a day-to-day basis and identifying and making investments on our behalf. Prior to February 8, 2019, GCM was a joint venture between Greenbacker Group LLC and Strategic Capital Advisory Services, LLC, or Strategic Capital, an affiliate of our former dealer manager, SC Distributors, and certain of our directors and/or officers. Strategic Capital, an affiliate of our former dealer manager, SC Distributors, which owned up to a 25% interest in our Advisor, generally provided to us, on behalf of our Advisor, certain non-investment advisory services, including but not limited to formation services related to our Company and the structure of our organization, financial and strategic planning advice and analysis, overseeing the development of marketing materials, selecting and negotiating with third-party vendors, and other administrative and operational services. With GCM becoming a wholly owned subsidiary of Greenbacker Group LLC as of February 8, 2019, these services, as they may be required, are provided by either GCM or by Greenbacker Group LLC. The non-managing member exercised no control or influence over our investment, asset management
or accounting functions, or any other aspect of our management or operations. In connection with providing such services from our inception through February 8, 2019, Greenbacker Group LLC paid Strategic Capital an aggregate of $1,250,000 in fees. We have reimbursed such fees in connection with our obligation to reimburse our Advisor and its affiliates for certain organization and offering expenses incurred by them on our behalf, subject to the limitation that such reimbursements would not cause the selling commissions, the dealer manager fee and the other organization and offering expenses borne by us to exceed 15% of gross offering proceeds as of the date of reimbursement.
Through each of their ownership interests in Greenbacker Group LLC, Charles Wheeler, our Chief Executive Officer and a member of our Board of Directors, and David Sher, a member of our Board of Directors, indirectly own an 8.41% and a 5.42% interest, respectively, in our Advisor. In addition, several of our officers and directors, including Messrs. Sher and Wheeler, are officers of our Advisor. As a result, the advisory agreement between us and our Advisor was negotiated between related parties, and its terms, including fees and other amounts payable, may not be as favorable to us as if they had been negotiated with unaffiliated third parties.
Except for the advancement of funds pursuant to certain indemnification provisions of our Operating Agreement, no loans, credit facilities, credit agreements or otherwise will be made by us to our Advisor or any of its affiliates. Our Advisor, SC Distributors and their affiliates will receive the compensation described herein.
Our Advisor’s services under the advisory agreement will not be exclusive, and it may furnish the same or similar services to other entities, including businesses that may directly or indirectly compete with us, so long as its services to us are not impaired by the provision of such services to others, and provided that the Advisor notify us prior to being engaged to serve as an advisor to a fund or another company having a similar investment strategy.
With respect to our renewable energy, energy efficiency and sustainability investments, our Advisor does target similar investment opportunities for other clients. Our Advisor has instituted appropriate allocation methodologies as well as third-party investment committee and/or board approvals to ensure all clients are treated fairly.
We have entered into license agreements with Greenbacker Group LLC, pursuant to which it has agreed to grant us a non-exclusive, royalty-free license to use the name “Greenbacker Renewable Energy Company LLC.” In addition, we have entered into an administration agreement with Greenbacker Administration, pursuant to which the Administrator will provide us with administrative services and will receive compensation from us for its services. As of the date hereof, Greenbacker Administration has delegated certain of its accounting-related administrative functions to U.S. Bancorp Fund Services, LLC. While Greenbacker Administration performs a majority of asset management, construction management, accounting and oversight services for the Company’s investments, it is anticipated that Greenbacker Administration will continue to delegate certain administrative functions for GREC and the LLC.
ITEM 14. PRINCIPAL ACCOUNTANT FEES AND SERVICES
The Audit Committee has appointed KPMG as our independent registered public accounting firm for the fiscal years ending December 31, 2021 and 2020.
Fees Billed for KPMG LLP
Our independent registered public accounting firm is KPMG LLP, New York, NY, Auditor ID: 185.
The following table shows the fees for audit and other services provided by KPMG for fiscal 2021 and 2020:
| | | | | | | | | | | |
| 2021 | | 2020 |
Audit fees (1) | $ | 1,134,350 | | | $ | 880,760 | |
Audit-related fees (2) | — | | | 10,000 | |
Tax fees (3) | 129,790 | | | 121,052 | |
All other fees (4) | — | | | — | |
| Total | $ | 1,264,140 | | | $ | 1,011,812 | |
The Audit Committee has approved all of the services and fees listed in the previous table.
The Audit Committee has delegated to the chair of the Audit Committee the authority to pre-approve audit-related and non-audit services not prohibited by law to be performed by our independent registered public accounting firm, and associated fees
up to a maximum for any one service of $25,000, provided that the chair shall report any decisions to pre-approve services and fees to the full Audit Committee at its next regular meeting.
(1)Audit fees represent fees for professional services provided in connection with the audit of the LLC's consolidated financial statements and review of the LLC's quarterly consolidated financial statements and audit services provided in connection with the LLC's quarterly and annual statutory or regulatory filings.
(2)Audit-related fees consist of all fees associated with statutory and regulatory filings other than the LLC's quarterly and annual statutory and regulatory filings, such as fees to issue consents for the LLC's filing of prospectuses.
(3)Tax fees consist of tax compliance fees.
(4)Other fees billed in the reporting periods for services provided by KPMG include consents for the LLC’s audited financial statements to be included in various SEC filings.
KPMG has not provided services or charged fees to our Advisor or entities that are controlling, controlled by or under common control of our Advisor.
PART IV
ITEM 15. EXHIBITS, CONSOLIDATED FINANCIAL STATEMENT SCHEDULES
The following exhibits are included, or incorporated by reference, in this Annual Report on Form 10-K for the year ended December 31, 2021 (and are numbered in accordance with Item 601 of Regulation S-K).
(a)Documents Filed as Part of this Report
(1)The following consolidated financial statements are set forth in Item 8:
•Report of Independent Registered Public Accounting Firm
•Consolidated Statements of Assets and Liabilities as of December 31, 2021 and 2020
•Consolidated Statements of Operations for the years ended December 31, 2021, 2020 and 2019
•Consolidated Statements of Changes in Net Assets for the years ended December 31, 2021, 2020 and 2019
•Consolidated Statements of Cash Flows for the years ended December 31, 2021, 2020 and 2019
•Consolidated Schedules of Investments as of December 31, 2021 and 2020
•Notes to the Consolidated Financial Statements
(2)Financial Statement Schedules have been omitted because they are not applicable, or the required information is shown in the Consolidated Financial Statements or Notes thereto in Item 8 of this annual report.
(b)Exhibits
The following exhibits are filed as part of this report or hereby incorporated by reference to exhibits previously filed with the Securities and Exchange Commission:
| | | | | | | | |
Exhibit
Number | | Description of Document |
| | |
| 3.1* | | |
| | |
| 3.2* | | |
| | |
| 10.1* | | |
| | |
| 10.2* | | |
| | |
| 10.3* | | |
| | |
| | | | | | | | |
Exhibit
Number | | Description of Document |
| | |
| 10.4* | | Credit Agreement among GREC Entity Holdco LLC, as Borrower, Greenbacker Renewable Energy Corporation, as Intermediate Holdco, Greenbacker Renewable Energy Company LLC, as Parent, the lenders named therein, and Fifth Third Bank, as Administrative Agent, dated July 11, 2016 (Incorporated by reference from Exhibit 10.1 of the Registrant’s Form 8-K (File No. 333-178786-01) filed on July 14, 2016) |
| | |
| 10.5* | | Credit Agreement among GREC Entity Holdco LLC, as Borrower, Greenbacker Renewable Energy Corporation, as Intermediate Holdco, Greenbacker Renewable Energy Company LLC, as Parent, the lenders named therein, and Fifth Third Bank, as Administrative Agent, dated January 5, 2018 (Incorporated by reference from Exhibit 10.1 of the Registrant’s Form 8-K (File No. 000-55610) filed on January 10, 2018) |
| | |
| 10.6* | | Credit Agreement among GREC Entity Holdco LLC, as Borrower, Greenbacker Renewable Energy Corporation, as Intermediate Holdco, Greenbacker Renewable Energy Company LLC, as Parent, the lenders named therein, and Fifth Third Bank, as Administrative Agent, dated June 20, 2019 (Incorporated by reference from Exhibit 10.1 of the Registrant’s Form 8-K (File No. 000-55610) filed on June 25, 2019) |
| | |
| 14.1* | | |
| | |
| 21.1** | | |
| | |
| 24.1** | | |
| | |
| 31.1** | | |
| | |
| 31.2** | | |
| | |
| 32.1** | | |
| | |
| 32.2** | | |
| | |
| 101 | | The following materials from Greenbacker Renewable Energy Company LLC’s Annual Report on Form 10-K for the year ended December 31, 2021, filed on March 30, 2022 formatted in XBRL (eXtensible Business Reporting Language): (i) Consolidated Statements of Assets and Liabilities; (ii) Consolidated Statements of Operations; (iii) Consolidated Statements of Changes in Net Assets; (iv) Consolidated Statements of Cash Flows; (v) Consolidated Schedules of Investments; and (vi) Notes to the Consolidated Financial Statements. |
*Filed previously
** Filed herewith
ITEM 16. FORM 10-K SUMMARY
None.
SIGNATURES
Pursuant to the requirements of the Securities Exchange Act of 1934, the registrant has duly caused this report to be signed on its behalf by the undersigned, thereunto duly authorized.
| | | | | | | | |
| Date: March 30, 2022 | By | /s/ Charles Wheeler |
| | Charles Wheeler |
| | Chairman, Chief Executive Officer and Director |
| | (Principal Executive Officer) |
| | Greenbacker Renewable Energy Company LLC |
| | |
| Date: March 30, 2022 | By | /s/ Richard C. Butt |
| | Richard C. Butt |
| | Chief Financial Officer and Principal Accounting Officer |
| | (Principal Financial and Accounting Officer) Greenbacker Renewable Energy Company LLC |
Pursuant to the requirements of the Securities Exchange Act of 1934, this report has been signed below by the following persons on behalf of the registrant and in the capacities and on the dates indicated.
| | | | | | | | | | | | | | |
| Signature | | Title | | Date |
| | | | |
| /s/ Charles Wheeler | | Chairman, Chief Executive Officer and Director | | March 30, 2022 |
| Charles Wheeler | | (Principal Executive Officer) | | |
| | | | |
| /s/ Richard C. Butt | | Chief Financial Officer and Principal Accounting Officer | | March 30, 2022 |
| Richard C. Butt | | (Principal Financial and Accounting Officer) | | |
KNOW ALL MEN BY THESE PRESENTS, that each person whose signature appears below constitutes and appoints each of Charles Wheeler and Richard C. Butt, respectively, as his true and lawful attorney-in-fact and agent, with full power of substitution and resubstitution, for him and his name, place and stead, in any and all capacities, to sign any or all amendments to this annual report on Form 10-K, and to file the same, with all exhibits thereto and other documents in connection therewith, with the SEC, granting unto said attorney-in-fact and agent, full power and authority to do and perform each and every act and thing requisite and necessary to be done in and about the premises, as fully to all intents and purposes as he might or could do in person, hereby ratifying and confirming all that said attorney-in-fact and agent or any of his substitutes, may lawfully do or cause to be done by virtue hereof.
| | | | | | | | | | | |
| /s/ David Sher | | | |
| David Sher | | Director | March 30, 2022 |
| | | |
| /s/ Kathleen Cuocolo | | | |
| Kathleen Cuocolo | | Director | March 30, 2022 |
| | | |
| /s/ Robert Herriott | | | |
| Robert Herriott | | Director | March 30, 2022 |
| | | |
| /s/ David M. Kastin | | | |
| David M. Kastin | | Director | March 30, 2022 |
| | | |
| /s/ Robert Brennan | | | |
| Robert Brennan | | Director | March 30, 2022 |
| | | |
| /s/ Cynthia Curtis | | | |
| Cynthia Curtis | | Director | March 30, 2022 |