Investor Letter Q2 2022 July 21, 2022 This Investor Letter contains forward-looking statements and non-GAAP financial measures, please see Appendix for additional information. Exhibit 99.2
The second quarter of 2022 proved more challenging than we expected. Revenue grew 13% year-over-year to $1.11 billion, which resulted in adjusted EBITDA of $7 million and free cash flow of negative $147 million. Daily active users (DAU) grew to 347 million, an increase of 54 million or 18% year-over-year in Q2. We also observed a number of encouraging engagement trends across our platform, including growth in overall content engagement. While the continued growth of our community increases the long-term opportunity for our business, our financial results for Q2 do not reflect the scale of our ambition. We are not satisfied with the results we are delivering, regardless of the current headwinds. From 2018 — our first full year as a public company — through the end of 2021, our revenue grew at an average compound annual rate of more than 50%. The rapid growth of our top line has been fueled by our fast-growing community, deep engagement with our platform, and a robust advertising business that has driven measurable returns for our advertising partners. However, over the past year, a series of significant headwinds have emerged that have disrupted this momentum. Platform policy changes have upended more than a decade of advertising industry standards, and macroeconomic challenges have disrupted many of the industry segments that have been most critical to the growing demand for our advertising solutions. We are also seeing increasing competition for advertising dollars that are now growing more slowly. Our revenue growth has substantially slowed, and we are evolving our business and strategy to adapt. We are working to reaccelerate growth and take share, but we believe it will likely take some time before we see significant improvements. To return to a higher rate of long-term revenue growth, we are focusing on three priorities. First, we will continue to invest in our products and platforms to sustain the growth of our community. Second, we will invest heavily in our direct-response advertising business to deliver measurable returns on advertising spending. Lastly, we will cultivate new sources of revenue that will help diversify our top-line growth to build a more resilient business. We also intend to recalibrate our investment levels to build a path to free cash flow break-even or better, even with reduced rates of revenue growth. We will continue to invest with a long-term perspective, especially in areas that are critical to realizing the long-term opportunity of augmented reality, but we are taking a hard look at how to better drive productivity across our teams. This will include a substantially reduced rate of hiring and a strict reprioritization of goals and initiatives across the company. We will also implement a stock repurchase program designed to offset the impact of dilution from our stock-based compensation program to protect the long-term value of our business for our investors. We expect to emerge from this recalibration as a more focused and more productive organization that is well positioned to capture the long-term growth opportunity we see ahead. SNAP INC. | Q2 2022 | INVESTOR LETTER 2
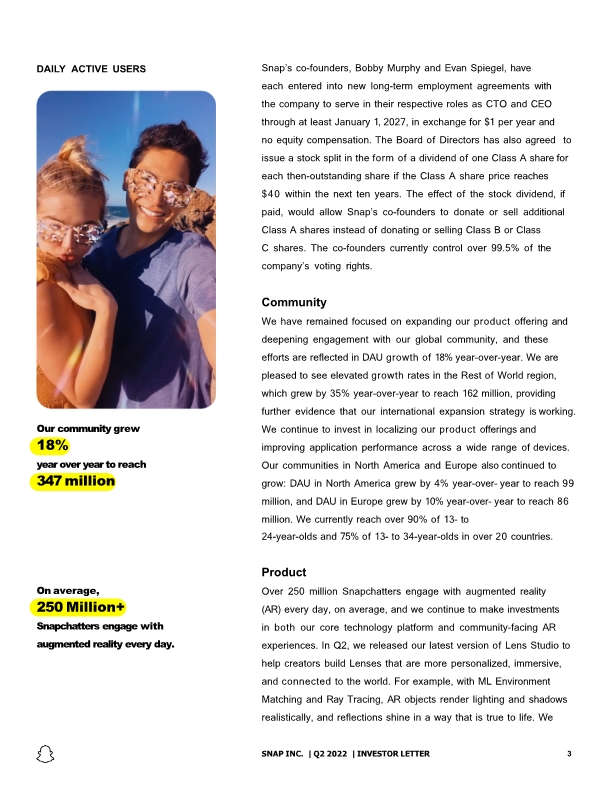
Snap’s co-founders, Bobby Murphy and Evan Spiegel, have each entered into new long-term employment agreements with the company to serve in their respective roles as CTO and CEO through at least January 1, 2027, in exchange for $1 per year and no equity compensation. The Board of Directors has also agreed to issue a stock split in the form of a dividend of one Class A share for each then-outstanding share if the Class A share price reaches $40 within the next ten years. The effect of the stock dividend, if paid, would allow Snap’s co-founders to donate or sell additional Class A shares instead of donating or selling Class B or Class C shares. The co-founders currently control over 99.5% of the company’s voting rights. Community We have remained focused on expanding our product offering and deepening engagement with our global community, and these efforts are reflected in DAU growth of 18% year-over-year. We are pleased to see elevated growth rates in the Rest of World region, which grew by 35% year-over-year to reach 162 million, providing further evidence that our international expansion strategy is working. We continue to invest in localizing our product offerings and improving application performance across a wide range of devices. Our communities in North America and Europe also continued to grow: DAU in North America grew by 4% year-over- year to reach 99 million, and DAU in Europe grew by 10% year-over- year to reach 86 million. We currently reach over 90% of 13- to 24-year-olds and 75% of 13- to 34-year-olds in over 20 countries. Product Over 250 million Snapchatters engage with augmented reality (AR) every day, on average, and we continue to make investments in both our core technology platform and community-facing AR experiences. In Q2, we released our latest version of Lens Studio to help creators build Lenses that are more personalized, immersive, and connected to the world. For example, with ML Environment Matching and Ray Tracing, AR objects render lighting and shadows realistically, and reflections shine in a way that is true to life. We DAILY ACTIVE USERS SNAP INC. | Q2 2022 | INVESTOR LETTER 3 Our community grew 18% year over year to reach 347 million On average, 250 Million+ Snapchatters engage with augmented reality every day.
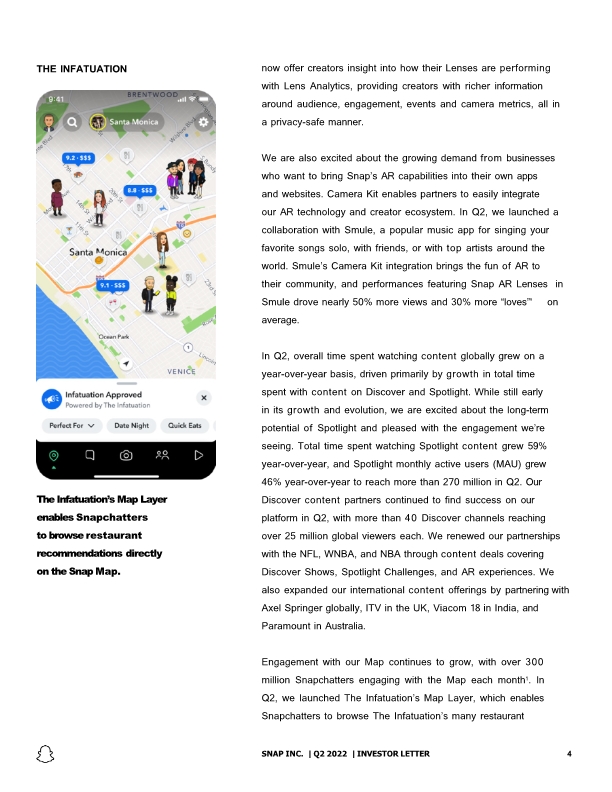
THE INFATUATION The Infatuation’s Map Layer enables Snapchatters to browse restaurant recommendations directly on the Snap Map. now offer creators insight into how their Lenses are performing with Lens Analytics, providing creators with richer information around audience, engagement, events and camera metrics, all in a privacy-safe manner. SNAP INC. | Q2 2022 | INVESTOR LETTER 4 We are also excited about the growing demand from businesses who want to bring Snap’s AR capabilities into their own apps and websites. Camera Kit enables partners to easily integrate our AR technology and creator ecosystem. In Q2, we launched a collaboration with Smule, a popular music app for singing your favorite songs solo, with friends, or with top artists around the world. Smule’s Camera Kit integration brings the fun of AR to their community, and performances featuring Snap AR Lenses in Smule drove nearly 50% more views and 30% more “loves”' on average. In Q2, overall time spent watching content globally grew on a year-over-year basis, driven primarily by growth in total time spent with content on Discover and Spotlight. While still early in its growth and evolution, we are excited about the long-term potential of Spotlight and pleased with the engagement we’re seeing. Total time spent watching Spotlight content grew 59% year-over-year, and Spotlight monthly active users (MAU) grew 46% year-over-year to reach more than 270 million in Q2. Our Discover content partners continued to find success on our platform in Q2, with more than 40 Discover channels reaching over 25 million global viewers each. We renewed our partnerships with the NFL, WNBA, and NBA through content deals covering Discover Shows, Spotlight Challenges, and AR experiences. We also expanded our international content offerings by partnering with Axel Springer globally, ITV in the UK, Viacom 18 in India, and Paramount in Australia. Engagement with our Map continues to grow, with over 300 million Snapchatters engaging with the Map each month1. In Q2, we launched The Infatuation’s Map Layer, which enables Snapchatters to browse The Infatuation’s many restaurant
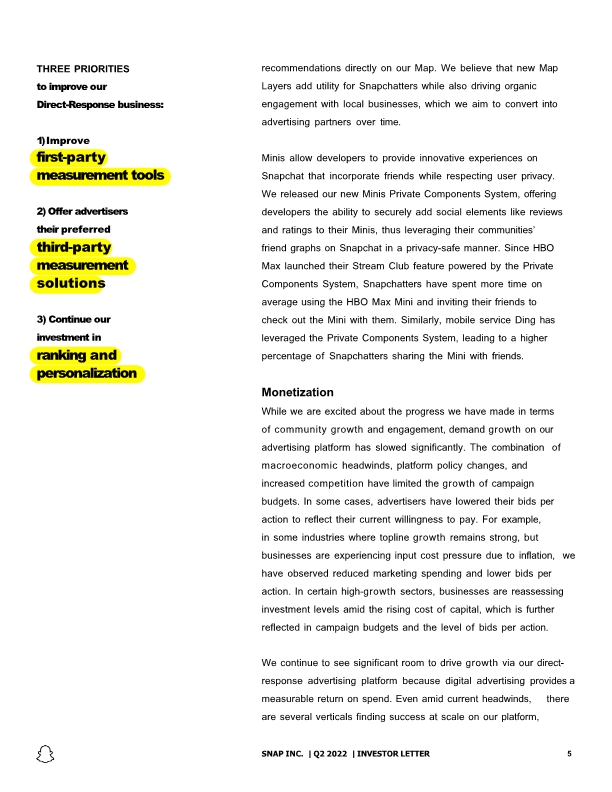
THREE PRIORITIES to improve our Direct-Response business: SNAP INC. | Q2 2022 | INVESTOR LETTER 5 1) Improve first-party measurement tools 2) Offer advertisers their preferred third-party measurement solutions 3) Continue our investment in ranking and personalization recommendations directly on our Map. We believe that new Map Layers add utility for Snapchatters while also driving organic engagement with local businesses, which we aim to convert into advertising partners over time. Minis allow developers to provide innovative experiences on Snapchat that incorporate friends while respecting user privacy. We released our new Minis Private Components System, offering developers the ability to securely add social elements like reviews and ratings to their Minis, thus leveraging their communities’ friend graphs on Snapchat in a privacy-safe manner. Since HBO Max launched their Stream Club feature powered by the Private Components System, Snapchatters have spent more time on average using the HBO Max Mini and inviting their friends to check out the Mini with them. Similarly, mobile service Ding has leveraged the Private Components System, leading to a higher percentage of Snapchatters sharing the Mini with friends. Monetization While we are excited about the progress we have made in terms of community growth and engagement, demand growth on our advertising platform has slowed significantly. The combination of macroeconomic headwinds, platform policy changes, and increased competition have limited the growth of campaign budgets. In some cases, advertisers have lowered their bids per action to reflect their current willingness to pay. For example, in some industries where topline growth remains strong, but businesses are experiencing input cost pressure due to inflation, we have observed reduced marketing spending and lower bids per action. In certain high-growth sectors, businesses are reassessing investment levels amid the rising cost of capital, which is further reflected in campaign budgets and the level of bids per action. We continue to see significant room to drive growth via our direct- response advertising platform because digital advertising provides a measurable return on spend. Even amid current headwinds, there are several verticals finding success at scale on our platform,
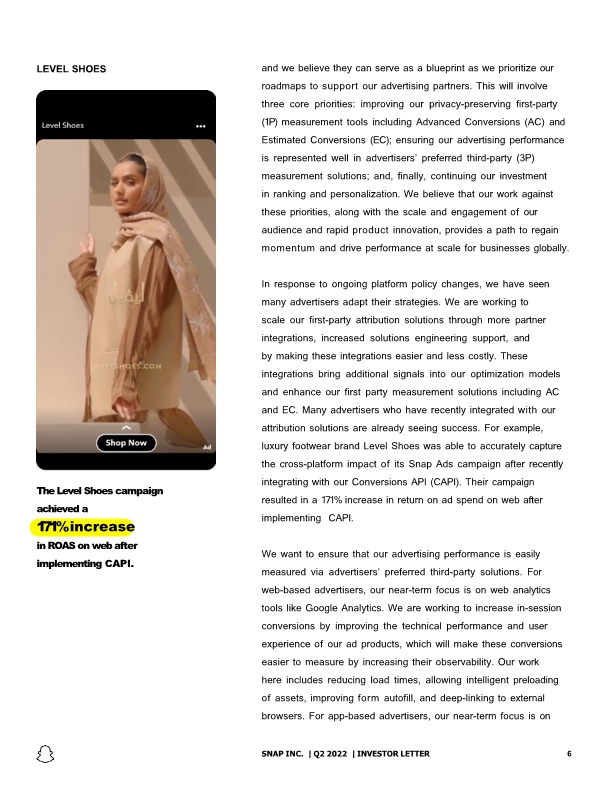
and we believe they can serve as a blueprint as we prioritize our roadmaps to support our advertising partners. This will involve three core priorities: improving our privacy-preserving first-party (1P) measurement tools including Advanced Conversions (AC) and Estimated Conversions (EC); ensuring our advertising performance is represented well in advertisers’ preferred third-party (3P) measurement solutions; and, finally, continuing our investment in ranking and personalization. We believe that our work against these priorities, along with the scale and engagement of our audience and rapid product innovation, provides a path to regain momentum and drive performance at scale for businesses globally. In response to ongoing platform policy changes, we have seen many advertisers adapt their strategies. We are working to scale our first-party attribution solutions through more partner integrations, increased solutions engineering support, and by making these integrations easier and less costly. These integrations bring additional signals into our optimization models and enhance our first party measurement solutions including AC and EC. Many advertisers who have recently integrated with our attribution solutions are already seeing success. For example, luxury footwear brand Level Shoes was able to accurately capture the cross-platform impact of its Snap Ads campaign after recently integrating with our Conversions API (CAPI). Their campaign resulted in a 171% increase in return on ad spend on web after implementing CAPI. We want to ensure that our advertising performance is easily measured via advertisers’ preferred third-party solutions. For web-based advertisers, our near-term focus is on web analytics tools like Google Analytics. We are working to increase in-session conversions by improving the technical performance and user experience of our ad products, which will make these conversions easier to measure by increasing their observability. Our work here includes reducing load times, allowing intelligent preloading of assets, improving form autofill, and deep-linking to external browsers. For app-based advertisers, our near-term focus is on The Level Shoes campaign achieved a 171% increase in ROAS on web after implementing CAPI. LEVEL SHOES SNAP INC. | Q2 2022 | INVESTOR LETTER 6
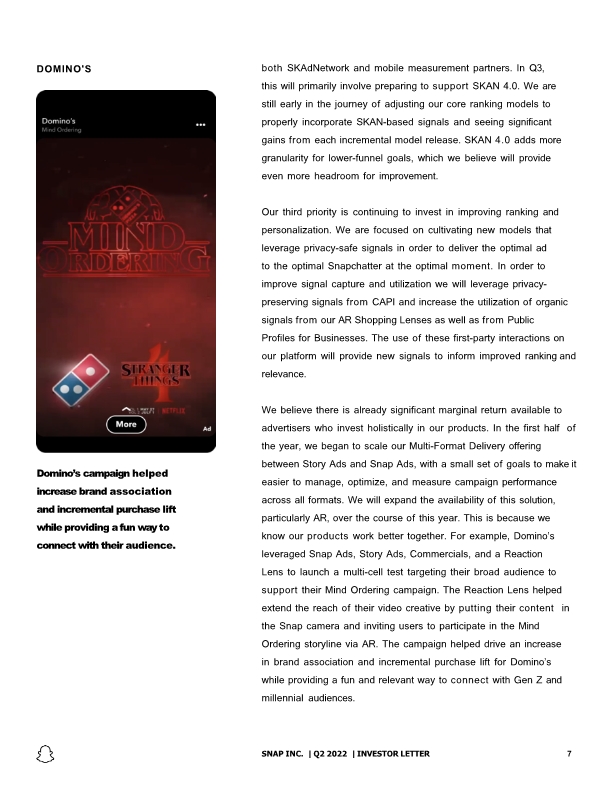
both SKAdNetwork and mobile measurement partners. In Q3, this will primarily involve preparing to support SKAN 4.0. We are still early in the journey of adjusting our core ranking models to properly incorporate SKAN-based signals and seeing significant gains from each incremental model release. SKAN 4.0 adds more granularity for lower-funnel goals, which we believe will provide even more headroom for improvement. Our third priority is continuing to invest in improving ranking and personalization. We are focused on cultivating new models that leverage privacy-safe signals in order to deliver the optimal ad to the optimal Snapchatter at the optimal moment. In order to improve signal capture and utilization we will leverage privacy- preserving signals from CAPI and increase the utilization of organic signals from our AR Shopping Lenses as well as from Public Profiles for Businesses. The use of these first-party interactions on our platform will provide new signals to inform improved ranking and relevance. We believe there is already significant marginal return available to advertisers who invest holistically in our products. In the first half of the year, we began to scale our Multi-Format Delivery offering between Story Ads and Snap Ads, with a small set of goals to make it easier to manage, optimize, and measure campaign performance across all formats. We will expand the availability of this solution, particularly AR, over the course of this year. This is because we know our products work better together. For example, Domino’s leveraged Snap Ads, Story Ads, Commercials, and a Reaction Lens to launch a multi-cell test targeting their broad audience to support their Mind Ordering campaign. The Reaction Lens helped extend the reach of their video creative by putting their content in the Snap camera and inviting users to participate in the Mind Ordering storyline via AR. The campaign helped drive an increase in brand association and incremental purchase lift for Domino’s while providing a fun and relevant way to connect with Gen Z and millennial audiences. DOMINO'S Domino’s campaign helped increase brand association and incremental purchase lift while providing a fun way to connect with their audience. SNAP INC. | Q2 2022 | INVESTOR LETTER 7
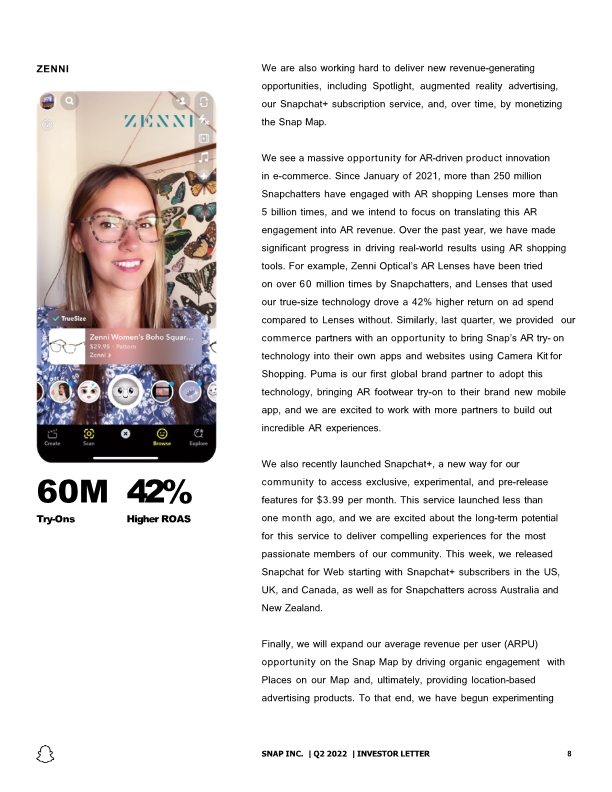
60M 42% Try-Ons Higher ROAS ZENNI We are also working hard to deliver new revenue-generating opportunities, including Spotlight, augmented reality advertising, our Snapchat+ subscription service, and, over time, by monetizing the Snap Map. SNAP INC. | Q2 2022 | INVESTOR LETTER 8 We see a massive opportunity for AR-driven product innovation in e-commerce. Since January of 2021, more than 250 million Snapchatters have engaged with AR shopping Lenses more than 5 billion times, and we intend to focus on translating this AR engagement into AR revenue. Over the past year, we have made significant progress in driving real-world results using AR shopping tools. For example, Zenni Optical’s AR Lenses have been tried on over 60 million times by Snapchatters, and Lenses that used our true-size technology drove a 42% higher return on ad spend compared to Lenses without. Similarly, last quarter, we provided our commerce partners with an opportunity to bring Snap’s AR try- on technology into their own apps and websites using Camera Kit for Shopping. Puma is our first global brand partner to adopt this technology, bringing AR footwear try-on to their brand new mobile app, and we are excited to work with more partners to build out incredible AR experiences. We also recently launched Snapchat+, a new way for our community to access exclusive, experimental, and pre-release features for $3.99 per month. This service launched less than one month ago, and we are excited about the long-term potential for this service to deliver compelling experiences for the most passionate members of our community. This week, we released Snapchat for Web starting with Snapchat+ subscribers in the US, UK, and Canada, as well as for Snapchatters across Australia and New Zealand. Finally, we will expand our average revenue per user (ARPU) opportunity on the Snap Map by driving organic engagement with Places on our Map and, ultimately, providing location-based advertising products. To that end, we have begun experimenting
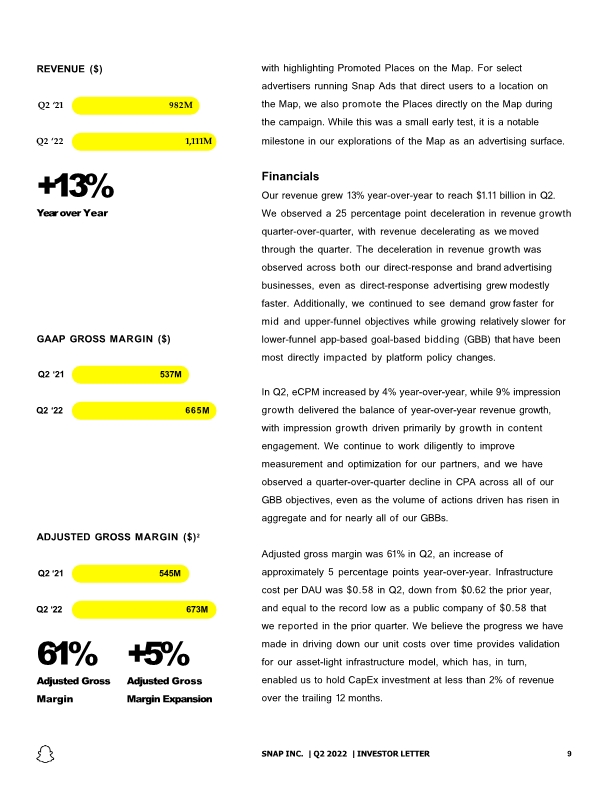
REVENUE ($) +13% Year over Year Q2 ‘21 982M Q2 ‘22 1,111M GAAP GROSS MARGIN ($) Q2 ‘21 537M Q2 ‘22 665M ADJUSTED GROSS MARGIN ($)2 61% Adjusted Gross Margin +5% Adjusted Gross Margin Expansion Q2 ‘21 545M Q2 ‘22 SNAP INC. | Q2 2022 | INVESTOR LETTER 9 673M with highlighting Promoted Places on the Map. For select advertisers running Snap Ads that direct users to a location on the Map, we also promote the Places directly on the Map during the campaign. While this was a small early test, it is a notable milestone in our explorations of the Map as an advertising surface. Financials Our revenue grew 13% year-over-year to reach $1.11 billion in Q2. We observed a 25 percentage point deceleration in revenue growth quarter-over-quarter, with revenue decelerating as we moved through the quarter. The deceleration in revenue growth was observed across both our direct-response and brand advertising businesses, even as direct-response advertising grew modestly faster. Additionally, we continued to see demand grow faster for mid and upper-funnel objectives while growing relatively slower for lower-funnel app-based goal-based bidding (GBB) that have been most directly impacted by platform policy changes. In Q2, eCPM increased by 4% year-over-year, while 9% impression growth delivered the balance of year-over-year revenue growth, with impression growth driven primarily by growth in content engagement. We continue to work diligently to improve measurement and optimization for our partners, and we have observed a quarter-over-quarter decline in CPA across all of our GBB objectives, even as the volume of actions driven has risen in aggregate and for nearly all of our GBBs. Adjusted gross margin was 61% in Q2, an increase of approximately 5 percentage points year-over-year. Infrastructure cost per DAU was $0.58 in Q2, down from $0.62 the prior year, and equal to the record low as a public company of $0.58 that we reported in the prior quarter. We believe the progress we have made in driving down our unit costs over time provides validation for our asset-light infrastructure model, which has, in turn, enabled us to hold CapEx investment at less than 2% of revenue over the trailing 12 months.
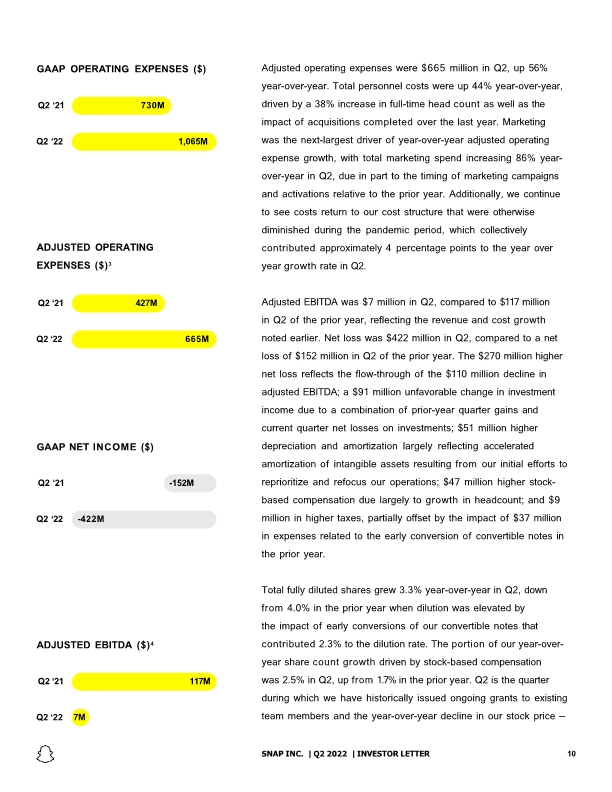
ADJUSTED OPERATING EXPENSES ($)3 Q2 ‘21 427M Q2 ‘22 665M GAAP OPERATING EXPENSES ($) Q2 ‘21 730M Q2 ‘22 1,065M ADJUSTED EBITDA ($)4 Q2 ‘21 117M Q2 ‘22 7M GAAP NET INCOME ($) Q2 ‘21 -152M Q2 ‘22 SNAP INC. | Q2 2022 | INVESTOR LETTER 10 -422M Adjusted operating expenses were $665 million in Q2, up 56% year-over-year. Total personnel costs were up 44% year-over-year, driven by a 38% increase in full-time head count as well as the impact of acquisitions completed over the last year. Marketing was the next-largest driver of year-over-year adjusted operating expense growth, with total marketing spend increasing 86% year- over-year in Q2, due in part to the timing of marketing campaigns and activations relative to the prior year. Additionally, we continue to see costs return to our cost structure that were otherwise diminished during the pandemic period, which collectively contributed approximately 4 percentage points to the year over year growth rate in Q2. Adjusted EBITDA was $7 million in Q2, compared to $117 million in Q2 of the prior year, reflecting the revenue and cost growth noted earlier. Net loss was $422 million in Q2, compared to a net loss of $152 million in Q2 of the prior year. The $270 million higher net loss reflects the flow-through of the $110 million decline in adjusted EBITDA; a $91 million unfavorable change in investment income due to a combination of prior-year quarter gains and current quarter net losses on investments; $51 million higher depreciation and amortization largely reflecting accelerated amortization of intangible assets resulting from our initial efforts to reprioritize and refocus our operations; $47 million higher stock- based compensation due largely to growth in headcount; and $9 million in higher taxes, partially offset by the impact of $37 million in expenses related to the early conversion of convertible notes in the prior year. Total fully diluted shares grew 3.3% year-over-year in Q2, down from 4.0% in the prior year when dilution was elevated by the impact of early conversions of our convertible notes that contributed 2.3% to the dilution rate. The portion of our year-over- year share count growth driven by stock-based compensation was 2.5% in Q2, up from 1.7% in the prior year. Q2 is the quarter during which we have historically issued ongoing grants to existing team members and the year-over-year decline in our stock price —
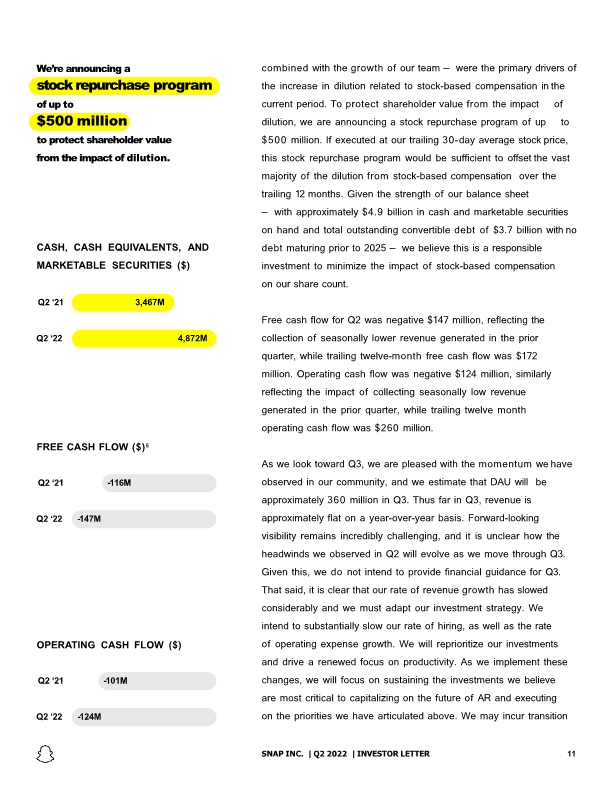
OPERATING CASH FLOW ($) Q2 ‘21 -101M Q2 ‘22 -124M We’re announcing a stock repurchase program of up to $500 million to protect shareholder value from the impact of dilution. CASH, CASH EQUIVALENTS, AND MARKETABLE SECURITIES ($) Q2 ‘21 3,467M Q2 ‘22 4,872M FREE CASH FLOW ($)5 Q2 ‘21 -116M Q2 ‘22 SNAP INC. | Q2 2022 | INVESTOR LETTER 11 -147M combined with the growth of our team — were the primary drivers of the increase in dilution related to stock-based compensation in the current period. To protect shareholder value from the impact of dilution, we are announcing a stock repurchase program of up to $500 million. If executed at our trailing 30-day average stock price, this stock repurchase program would be sufficient to offset the vast majority of the dilution from stock-based compensation over the trailing 12 months. Given the strength of our balance sheet — with approximately $4.9 billion in cash and marketable securities on hand and total outstanding convertible debt of $3.7 billion with no debt maturing prior to 2025 — we believe this is a responsible investment to minimize the impact of stock-based compensation on our share count. Free cash flow for Q2 was negative $147 million, reflecting the collection of seasonally lower revenue generated in the prior quarter, while trailing twelve-month free cash flow was $172 million. Operating cash flow was negative $124 million, similarly reflecting the impact of collecting seasonally low revenue generated in the prior quarter, while trailing twelve month operating cash flow was $260 million. As we look toward Q3, we are pleased with the momentum we have observed in our community, and we estimate that DAU will be approximately 360 million in Q3. Thus far in Q3, revenue is approximately flat on a year-over-year basis. Forward-looking visibility remains incredibly challenging, and it is unclear how the headwinds we observed in Q2 will evolve as we move through Q3. Given this, we do not intend to provide financial guidance for Q3. That said, it is clear that our rate of revenue growth has slowed considerably and we must adapt our investment strategy. We intend to substantially slow our rate of hiring, as well as the rate of operating expense growth. We will reprioritize our investments and drive a renewed focus on productivity. As we implement these changes, we will focus on sustaining the investments we believe are most critical to capitalizing on the future of AR and executing on the priorities we have articulated above. We may incur transition
costs in the near term as we execute on these changes, but we expect to emerge with a more focused cost structure as a result. While our Q2 financial results do not reflect our ambition for our business, we will meet the challenges of the current operating environment by prioritizing the needs of our community and partners who are essential to our success, investing heavily in our direct-response advertising business to deliver measurable return on investment for our advertising partners, and executing against our enormous opportunity in augmented reality as we work to accelerate our road map and deliver against our long-term plans for computing overlaid on the world. We are deeply grateful for the continued support of our team members, customers, partners, and investors as we continue to innovate and work towards our business goals. We define a Map Active User as a registered Snapchat user who opens the map at least once during the period of interest. Prior to June 2022, we reported Map Active Users using a different methodology. As a result, Map Active Users are not comparable to those in prior periods. We define adjusted gross margin as GAAP revenue less adjusted cost of revenue, and as a percentage, divided by GAAP revenue. Adjusted cost of revenue excludes stock- based compensation expense and other payroll related tax expense, depreciation and amortization, and certain other non-cash or nonrecurring items impacting net income (loss) from time to time of $8 million and $8 million for the three months ended June 30, 2022 and 2021, respectively. Adjusted operating expenses excludes stock-based compensation expense and other payroll related tax expense, depreciation and amortization, and certain other non-cash or non-recurring items impacting net income (loss) from time to time of $400 million and $302 million for the three months ended June 30, 2022 and 2021, respectively. We define Adjusted EBITDA as net income (loss), excluding interest income; interest expense; other income (expense), net; income tax benefit (expense); depreciation and amortization; stockbased compensation expense and other payroll related tax expense; and certain other non-cash or non-recurring items impacting net income (loss) from time to time. See Appendix for reconciliation of net loss to Adjusted EBITDA. We define Free Cash Flow as net cash provided by (used in) operating activities, reduced by purchases of property and equipment. See Appendix for reconciliation of net cash provided by (used in) operating activities to Free Cash Flow. SNAP INC. | Q2 2022 | INVESTOR LETTER 12
Appendix
This letter contains forward-looking statements within the meaning of Section 27A of the Securities Act of 1933, as amended, or the Securities Act, and Section 21E of the Securities Exchange Act of 1934, as amended, or the Exchange Act about us and our industry that involve substantial risks and uncertainties. All statements other than statements of historical facts contained in this letter, including statements regarding guidance, our future results of operations or financial condition, our stock repurchase program, future stock dividends, business strategy and plans, user growth and engagement, product initiatives, objectives of management for future operations, and advertiser and partner offerings, are forward-looking statements. In some cases, you can identify forward-looking statements because they contain words such as “anticipate,” “believe,” “contemplate,” “continue,” “could,” “estimate,” “expect,” “going to,” “intend,” “may,” “plan,” “potential,” “predict,” “project,” “should,” “target,” “will,” or “would” or the negative of these words or other similar terms or expressions. We caution you that the foregoing may not include all of the forward-looking statements made in this letter. You should not rely on forward-looking statements as predictions of future events. We have based the forward-looking statements contained in this letter primarily on our current expectations and projections about future events and trends, including our financial outlook, geo-political conflicts, and the COVID-19 pandemic, that we believe may continue to affect our business, financial condition, results of operations, and prospects. These forward-looking statements are subject to risks and uncertainties related to: our financial performance; our ability to attain and sustain profitability; our ability to generate and sustain positive cash flow; our ability to attract and retain users, publishers, and advertisers; competition and new market entrants; managing our international expansion and our growth and future expenses; compliance with new laws, regulations, and executive actions; our ability to maintain, protect, and enhance our intellectual property; our ability to succeed in existing and new market segments; our ability to attract and retain qualified and key personnel; our ability to repay outstanding debt; future acquisitions, divestitures or investments; and the potential adverse impact of climate change, natural disasters, health epidemics, macroeconomic conditions, and war or other armed conflict, as well as risks, uncertainties, and other factors described in “Risk Factors” and elsewhere in our most recent periodic report filed with the U.S. Securities and Exchange Commission, or SEC, which is available on the SEC’s website at www.sec.gov. Additional information will be made available in Snap Inc.’s periodic report that will be filed with the SEC for the period covered by this letter and other filings that we make from time to time with the SEC. In addition, any forward-looking statements contained in this letter are based on assumptions that we believe to be reasonable as of this date. We undertake no obligation to update any forward-looking statements to reflect events or circumstances after the date of this letter or to reflect new information or the occurrence of unanticipated events, including future developments related to geo-political conflicts, the COVID-19 pandemic, and macroeconomic conditions, except as required by law. SNAP INC. | Q2 2022 | INVESTOR LETTER 14 Forward Looking Statements
To supplement our consolidated financial statements, which are prepared and presented in accordance with GAAP, we use certain non-GAAP financial measures, as described below, to understand and evaluate our core operating performance. These non-GAAP financial measures, which may be different than similarly titled measures used by other companies, are presented to enhance investors’ overall understanding of our financial performance and should not be considered a substitute for, or superior to, the financial information prepared and presented in accordance with GAAP. We use the non-GAAP financial measure of Free Cash Flow, which is defined as net cash provided by (used in) operating activities, reduced by purchases of property and equipment. We believe Free Cash Flow is an important liquidity measure of the cash that is available, after capital expenditures, for operational expenses and investment in our business and is a key financial indicator used by management. Additionally, we believe that Free Cash Flow is an important measure since we use third-party infrastructure partners to host our services and therefore we do not incur significant capital expenditures to support revenue generating activities. Free Cash Flow is useful to investors as a liquidity measure because it measures our ability to generate or use cash. Once our business needs and obligations are met, cash can be used to maintain a strong balance sheet and invest in future growth. We use the non-GAAP financial measure of Adjusted EBITDA, which is defined as net income (loss); excluding interest income; interest expense; other income (expense), net; income tax benefit (expense); depreciation and amortization; stock-based compensation expense and other payroll related tax expense; and certain other non-cash or non-recurring items impacting net income (loss) from time to time. We believe that Adjusted EBITDA helps identify underlying trends in our business that could otherwise be masked by the effect of the expenses that we exclude in Adjusted EBITDA. We use the non-GAAP financial measure of non-GAAP net income (loss), which is defined as net income (loss); excluding amortization of intangible assets; stock-based compensation expense and other payroll related tax expense; certain other non- cash or non-recurring items impacting net income (loss) from time to time; and related income tax adjustments. Non-GAAP net income (loss) and weighted average diluted shares are then used to calculate non-GAAP diluted net income (loss) per share. Similar to Adjusted EBITDA, we believe these measures help identify underlying trends in our business that could otherwise be masked by the effect of the expenses we exclude in the measure. We believe that these non-GAAP financial measures provide useful information about our financial performance, enhance the overall understanding of our past performance and future prospects, and allow for greater transparency with respect to key metrics used by our management for financial and operational decision-making. We are presenting these non-GAAP measures to assist investors in seeing our financial performance through the eyes of management, and because we believe that these measures provide an additional tool for investors to use in comparing our core financial performance over multiple periods with other companies in our industry. For a reconciliation of these non-GAAP financial measures to the most directly comparable GAAP financial measure, please see “Reconciliation of GAAP to Non-GAAP Financial Measures” included as an Appendix to this letter. Snap Inc., “Snapchat,” and our other registered and common law trade names, trademarks, and service marks are the property of Snap Inc. or our subsidiaries. SNAP INC. | Q2 2022 | INVESTOR LETTER 15 Non-GAAP Financial Measures
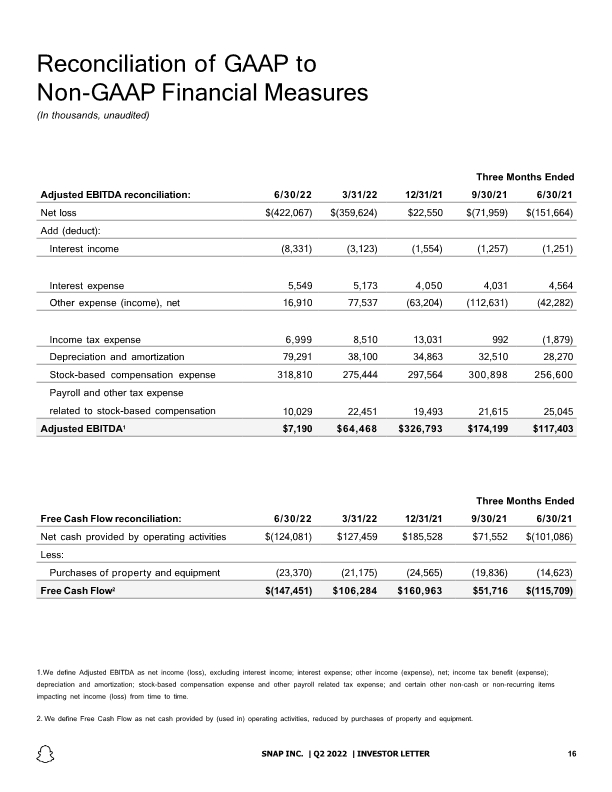
Three Months Ended SNAP INC. | Q2 2022 | INVESTOR LETTER 16 Three Months Ended Reconciliation of GAAP to Non-GAAP Financial Measures (In thousands, unaudited) We define Adjusted EBITDA as net income (loss), excluding interest income; interest expense; other income (expense), net; income tax benefit (expense); depreciation and amortization; stock-based compensation expense and other payroll related tax expense; and certain other non-cash or non-recurring items impacting net income (loss) from time to time. We define Free Cash Flow as net cash provided by (used in) operating activities, reduced by purchases of property and equipment.


