Use these links to rapidly review the document
Table of Contents
TABLE OF CONTENTS
Exhibit 99.2

Annual Report
2018
GRANITE REIT
Table of Contents
Table of Contents
| | |
Letter to Unitholders | | 1 |
Management's Discussion and Analysis of Results of Operations and Financial Position | | 3 |
Management's Responsibility for Financial Reporting | | 64 |
Reports of Independent Registered Public Accounting Firm | | 65 |
Combined Balance Sheets | | 68 |
Combined Statements of Net Income | | 69 |
Combined Statements of Comprehensive Income | | 70 |
Combined Statements of Unitholders' Equity | | 71 |
Combined Statements of Cash Flows | | 72 |
Notes to Combined Financial Statements | | 73 |
Corporate Information | | Inside Back Cover |
| | |
 | | 77 King St. W., Suite 4010
P.O. Box 159, TD Centre
Toronto, ON, M5K 1H1 Canada
|
LETTER TO UNITHOLDERS
Dear Unitholders:
2018 was another active and successful year for Granite, underpinned by strong financial results, approval of a new strategic plan, significant progress made towards achieving our strategic objectives and a transition to new leadership.
Granite acquired over $540 million in modern e-commerce and distribution assets, which when combined with the gains generated from the sale of non-core assets, significantly increased net asset value and improved the quality and diversification of the portfolio. As a result of this activity, Granite increased FFO per unit while maintaining overall debt levels and liquidity with which to fund future acquisitions and development.
Organizationally, I was appointed as President and CEO on August 1st, replacing Michael Forsayeth, who retired that same month. Following the annual general meeting in June, the Board also welcomed the election of Jennifer Warren as a trustee. Finally, a new strategic plan was approved by the Board in November, setting the course for Granite over the next five years.
As highlighted below, the initiatives taken in 2018 have strategically positioned Granite to execute on its priorities and continue to deliver strong financial performance for unitholders.
HIGHLIGHTS FOR 2018
Unitholder Return and Increased Distribution
- •
- Granite delivered a total return in 2018 of approximately 13.5% for our unitholders (vs 1.0% for the S&P TSX Capped REIT Index and -12.2% for the S&P TSX) and a 2.9% year-over-year increase in the annual amount distributed to unitholders to $2.80 per unit for 2019, marking our seventh consecutive annual distribution increase.
Strategic Allocation of Capital
- •
- $730 million generated from the sale of 16 non-core assets at an average capitalization rate of 6.7%, contributing to the overall fair value gains on investment properties of approximately $355 million or $7.75 per unit in net asset value;
- •
- $544 million invested in modern assets in key e-commerce and distribution markets in the United States and Germany at an average in-going yield of 5.8%;
- •
- $500 million 5-year unsecured revolving facility, available in Canadian dollars, US dollars or Euros;
- •
- $550 million in unsecured committed term facilities were obtained at a weighted average term of 5.6 years and bearing a weighted average fixed interest rate of 1.76%;
- •
- $63.5 million to repurchase 1.28 million of Granite's stapled units at an average price of $49.55; and
- •
- $628 million of additional commitments made to acquire, construct or develop properties in 2019.
Portfolio Enhancement & Tenant Diversification
- •
- Reduced Magna concentration from 61% to 47% as a percentage of gross leasable area and 71% to 54% as a percentage of annualized revenue.
Financial & Operational Performance
- •
- FFO per unit year-over-year growth of 13.2%, despite the loss of approximately $49 million in annualized revenue from the $730 million in dispositions. AFFO per unit decreased by 2.6% year-over-year;
- •
- Net leverage ratio of 19% providing in excess of $1.2 billion in debt capacity and approximately $1.2 billion in available liquidity;
- •
- 3.2 million square feet of lease expiries renewed or re-leased at an average increase in base rent of 4.6%; and
- •
- Occupancy rate at year end of 99.1%.
Focused Strategy
- •
- A new strategic plan, which sets the course for Granite for the next five years, was approved in November; and
- •
- All employee compensation to be aligned with the achievement of targets and objectives of the strategic plan.
OUTLOOK
As noted above, the actions taken by management and the Board over the past few years have resulted in a strong foundation upon which we can continue to build. With over $1.0 billion in liquidity, Granite is uniquely positioned to capitalize on an active pipeline of development and acquisition opportunities, and continue to make progress towards achieving its strategic objectives.
For the remainder of 2019, Granite will focus on the following priorities:
- •
- Increase scale in target markets;
- •
- Dispose of select non-core assets and exit non-core markets;
- •
- Drive net asset value, FFO and AFFO per unit growth;
- •
- Enhance platform capabilities in Europe and the United States;
- •
- Execute on development projects in Plainfield, IN and Altbach, Germany; and
- •
- Reduce Magna concentration to below 50% as a percentage of revenue.
As we execute on the initiatives above for 2019, we will adhere to our core principle of delivering maximum long-term value for Granite's unitholders. In pursuit of this, we will continue to prioritize total return, net asset value, portfolio quality, platform capability and the maintenance of a conservative capital structure.
On a personal note, this is my first of what I hope to be many letters to Granite's unitholders. It is a privilege to join the Granite team, and I would like to thank the Board of Trustees for providing me with this tremendous opportunity. I would also like to acknowledge Michael Forsayeth and the team for their assistance and support during and after the transition.
Looking forward, all of us at Granite are truly excited about meeting the challenges in front of us and fulfilling our potential.
To our unitholders, I want to thank you for investing in Granite and for your continued support and trust.
Sincerely,

Kevan Gorrie,
President and Chief Executive Officer
FFO, AFFO and related per unit amounts as well as net leverage ratio are not International Financial Reporting Standards ("IFRS") measures. Please refer to the Basis of Presentation and Non-IFRS Measures sections in the attached MD&A for definitions and reconciliations to IFRS measures.
Table of Contents
MANAGEMENT'S DISCUSSION AND ANALYSIS OF RESULTS OF OPERATIONS AND FINANCIAL POSITION |
| | |
Basis of Presentation | |
3 |
Financial and Operating Highlights | |
4 |
Business Overview and Strategic Outlook | |
5 |
Significant Matters | |
7 |
Results of Operations | |
11 |
Investment Properties | |
27 |
Liquidity and Capital Resources | |
36 |
Commitments, Contractual Obligations, Contingencies and Off-Balance Sheet Arrangements | |
44 |
Related Party Transactions | |
45 |
Non-IFRS Measures | |
46 |
Significant Accounting Estimates | |
49 |
New Accounting Pronouncements and Developments | |
51 |
Internal Controls over Financial Reporting | |
54 |
Risks and Uncertainties | |
55 |
Selected Annual and Quarterly Data | |
56 |
Forward-Looking Statements | |
61 |
Management's Discussion and Analysis of Results of Operations and Financial Position ("MD&A") of Granite Real Estate Investment Trust ("Granite REIT") and Granite REIT Inc. ("Granite GP") summarizes the significant factors affecting the combined operating results, financial condition, liquidity and cash flows of Granite REIT, Granite GP and their subsidiaries (collectively "Granite" or the "Trust") for the three month period and year ended December 31, 2018. Unless otherwise noted, all amounts are in millions of Canadian dollars. This MD&A should be read in conjunction with the accompanying audited combined financial statements for the year ended December 31, 2018 prepared in accordance with International Financial Reporting Standards ("IFRS") as issued by the International Accounting Standards Board. The MD&A was prepared as at March 6, 2019 and its contents were approved by the Board of Trustees of Granite REIT and Board of Directors of Granite GP on this date. Additional information relating to Granite, including the 2018 Annual Information Form ("AIF") dated March 6, 2019, can be obtained from the Trust's website atwww.granitereit.com, on SEDAR atwww.sedar.comand on EDGAR at www.sec.gov.
In addition to using financial measures determined in accordance with IFRS, Granite also uses certain non-IFRS measures in managing its business to measure financial and operating performance as well as for capital allocation decisions and valuation purposes. Granite believes that providing these measures on a supplemental basis to the IFRS results is helpful to investors in assessing the overall performance of Granite's business. These non-IFRS measures include net operating income before lease termination and close-out fees, straight-line rent and tenant incentive amortization ("NOI — cash basis"), same property NOI — cash basis, funds from operations ("FFO"), adjusted funds from operations ("AFFO"), FFO payout ratio, AFFO payout ratio, leverage ratio, interest coverage ratio, net leverage ratio, indebtedness ratio, unencumbered asset coverage ratio and any related per unit amounts. Readers are cautioned that these measures do not have standardized meanings prescribed under IFRS and, therefore, should not be construed as alternatives to net income, cash provided by operating activities or any other measure calculated in accordance with IFRS. Additionally, because these terms do not have standardized meanings prescribed by IFRS, they may not be comparable to similarly titled measures presented by other reporting issuers. Refer to "NON-IFRS MEASURES" for definitions and reconciliations of non-IFRS measures to IFRS financial measures.
Table of Contents
FINANCIAL AND OPERATING HIGHLIGHTS |
| | | | | | | | | | | | | |
| | | | | | | | | | |
| | Three Months Ended
December 31, | | Years Ended
December 31, | |
|---|
(in millions, except as noted)
| | 2018
| | 2017
| | 2018
| | 2017
| |
|---|
| | | | | | | | | | |
Operating highlights | | | | | | | | | |
Revenue(1) | | $ | 59.9 | | $ | 62.6 | | $ | 247.5 | | $ | 244.7 | |
NOI — cash basis(2) | | 52.9 | | 56.2 | | 216.7 | | 218.2 | |
Net income attributable to stapled unitholders | | 85.9 | | 233.6 | | 465.2 | | 357.7 | |
FFO(2)(3) | | 40.9 | | 41.6 | | 168.9 | | 153.2 | |
AFFO(2)(3) | | 39.8 | | 32.6 | | 138.1 | | 145.4 | |
Cash flows provided from operating activities | | 34.7 | | 38.2 | | 157.9 | | 158.7 | |
Monthly distributions paid | | 31.1 | | 30.6 | | 125.1 | | 122.6 | |
FFO payout ratio(2)(4) | | 77% | | 75% | | 78% | | 78% | |
AFFO payout ratio(2)(4) | | 79% | | 95% | | 91% | | 82% | |
Per unit amounts | |
| |
| |
| |
| |
Diluted FFO(2)(3) | | $ | 0.90 | | $ | 0.89 | | $ | 3.68 | | $ | 3.25 | |
Diluted AFFO(2)(3) | | $ | 0.87 | | $ | 0.69 | | $ | 3.01 | | $ | 3.09 | |
Monthly distributions paid | | $ | 0.68 | | $ | 0.65 | | $ | 2.72 | | $ | 2.60 | |
Diluted weighted average number of units | | 45.7 | | 47.0 | | 45.9 | | 47.1 | |
| | | | | | | | | |
As at December 31,
| | 2018
| | 2017
| |
|---|
| | | | | | |
Financial highlights | | | | | | | |
Investment properties — fair value(5) | | | $ | 3,425.0 | | | $ | 2,733.6 | |
Assets held for sale(5) | | | 44.2 | | | 391.4 | |
Cash and cash equivalents | | | 658.2 | | | 69.0 | |
Total debt | | | 1,303.2 | | | 741.4 | |
Trading price per unit (TSX: GRT.UN) | | | $ | 53.21 | | | $ | 49.25 | |
Debt metrics, ratings and outlook | | |
| | |
| |
Net leverage ratio(2) | | | 19% | | | 25% | |
Interest coverage ratio(2) | | | 9.4x | | | 9.5x | |
Weighted average cost of debt | | | 2.17% | | | 2.54% | |
Weighted average debt term-to-maturity, in years | | | 4.7 | | | 4.8 | |
DBRS rating and outlook | | BBB stable | | BBB stable | |
Moody's rating and outlook | | Baa2 stable | | Baa2 stable | |
Property metrics(5) | | |
| | |
| |
Number of investment properties | | | 84 | | | 87 | |
Income-producing properties | | | 80 | | | 84 | |
Properties under development | | | 2 | | | — | |
Land held for development | | | 2 | | | 3 | |
Gross leasable area ("GLA"), square feet | | | 32.2 | | | 29.1 | |
Occupancy, by GLA | | | 99.1% | | | 98.4% | |
Magna as a percentage of annualized revenue(6) | | | 54% | | | 71% | |
Magna as a percentage of GLA | | | 47% | | | 61% | |
Weighted average lease term, in years by GLA | | | 6.0 | | | 5.9 | |
Overall capitalization rate(7) | | | 6.7% | | | 7.6% | |
| | | | | | |
Table of Contents
- (1)
- Granite has retrospectively applied IFRS 15,Revenue from Contracts with Customers (see "NEW ACCOUNTING PRONOUNCEMENTS AND DEVELOPMENTS") and all historical periods herein have been restated to reflect such treatment.
- (2)
- For definitions of Granite's non-IFRS measures, refer to the section "NON-IFRS MEASURES".
- (3)
- For the year ended December 31, 2018, Granite recognized $1.0 million ($0.02 per unit) in revenue related to a lease termination and close-out fee and a net $8.5 million ($0.19 per unit) foreign exchange gain on the remeasurement of US dollar cash proceeds from the sale of investment properties in January 2018. For the year ended December 31, 2017, Granite incurred $5.9 million ($0.12 per unit) of expenses in connection with a proxy contest that preceded the June 2017 annual general meeting and recognized $1.6 million ($0.03 per unit) related to lease termination and close-out fees in revenue. FFO, AFFO and the per unit amounts include the aforementioned items.
In the first quarter of 2018, Granite also paid $9.1 million ($0.19 per unit) related to a tenant incentive allowance for a 2014 lease extension at the Eurostar facility in Graz, Austria. AFFO and AFFO per unit amounts have been reduced by this $9.1 million tenant allowance payment. - (4)
- For comparative purposes, the FFO payout ratio and AFFO payout ratio exclude the lease termination and close-out fee of $1.0 million and the net $8.5 million foreign exchange gain on the remeasurement of US dollar cash proceeds from the sale of properties for the year ended December 31, 2018 as well as the lease termination and close-out fees of $1.6 million and the $5.9 million of proxy contest expenses in the prior year. AFFO payout ratio further excludes the $9.1 million tenant incentive payment made in 2018 in connection with the 2014 lease extension at the Eurostar facility.
- (5)
- Assets held for sale are excluded from investment properties and related property metrics. Accordingly, six such assets that were held for sale at December 31, 2018 and 10 such assets that were held for sale at December 31, 2017 were excluded from investment properties and related property metrics at December 31, 2018 and December 31, 2017, respectively, throughout this MD&A.
- (6)
- Annualized revenue for each period presented is calculated as rental revenue excluding tenant recoveries, recognized in accordance with IFRS, in the month of December multiplied by twelve months.
- (7)
- Refer to "Valuation Metrics by Investment Property Asset Category" in "Investment Properties" section.
BUSINESS OVERVIEW AND STRATEGIC OUTLOOK |
Business Overview
Granite is a Canadian-based real estate investment trust ("REIT") engaged in the acquisition, development, ownership and management of industrial, warehouse and logistics properties in North America and Europe. As at March 6, 2019, Granite owns 86 investment properties in nine countries having approximately 33.6 million square feet of gross leasable area. The tenant base includes Magna International Inc. and its operating subsidiaries (collectively "Magna") as the largest tenant, in addition to tenants from various other industries. Properties leased to Magna are generally leased to operating subsidiaries of Magna International Inc. and the terms of the leases are not guaranteed by the parent company except for certain leases wherein the parent is the tenant.
Granite's investment properties consist of income-producing properties, properties under development and land held for development (see "INVESTMENT PROPERTIES"). The income-producing properties consist of light industrial properties, heavy industrial manufacturing facilities, warehouse and logistics properties, corporate offices, product development and engineering centres and test facilities. The lease payments are primarily denominated in three currencies: the Canadian dollar ("$"), the Euro ("€") and the US dollar ("US$").
Table of Contents
Granite's investment properties (excluding the six assets held for sale) by geographic location, property count and square footage as at March 6, 2019 are summarized below:
Investment Properties Summary
Nine countries/86 properties/33.6(1) million square feet
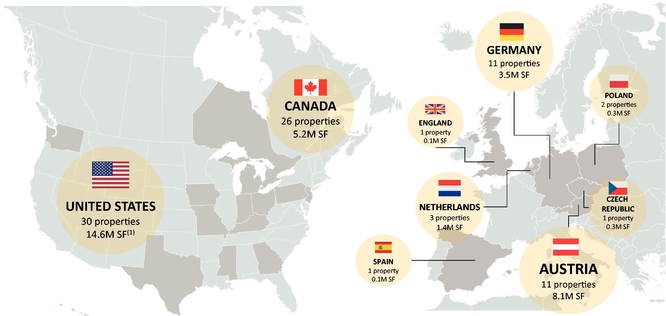
- (1)
- Includes a 0.3 million square foot expansion completed in West Jefferson, OH and two income-producing properties representing 1.0 million of GLA acquired subsequent to December 31, 2018.
Strategic Outlook
Management continues to identify and pursue value creation opportunities that will build on Granite's current foundation, leverage the balance sheet and invest to grow and diversify the asset base.
Granite's long-term strategy is to continue to build an institutional quality and globally diversified industrial real estate business; to grow and diversify its asset base through acquisitions, development, re-development and dispositions; to optimize its balance sheet; and to reduce its exposure to Magna and the special purpose properties (see "INVESTMENT PROPERTIES") over the long-term.
Following the sale of 16 non-core properties in 2018 (see "SIGNIFICANT MATTERS"), Granite has positioned itself to capitalize on market opportunities within its geographic footprint and execute on its strategy as well as benefit from a net leverage ratio of 19%, liquidity of approximately $1.2 billion and a strong pipeline of acquisition and development opportunities.
As Granite looks to the remainder of 2019, its priorities are as follows:
- •
- Strategically redeploy the proceeds from the recently sold properties and financing initiatives;
- •
- Accelerate growth in its target markets in North America and Europe primarily through property, portfolio and corporate acquisitions as well as through joint venture arrangements and development of modern logistics and e-commerce assets in e-commerce markets;
- •
- Continue to dispose of select non-core assets;
- •
- Maintain a target occupancy in excess of 98%;
- •
- Enhance Granite's global platform;
- •
- Grow net asset value as well as FFO and AFFO per unit; and
- •
- Pursue development opportunities within the existing portfolio.
Executing on these near-term priorities will accelerate the ongoing transformation of Granite into an institutional quality e-commerce and distribution real estate business.
Table of Contents
Property Acquisitions
During the year ended December 31, 2018, Granite acquired seven income-producing modern properties in the United States and one in Germany as well as one property comprised of development land in the United States. Property acquisitions consisted of the following:
| | | | | | | | | | | | | | | | | | |
| | | | | | | | | | | | | |
2018 Acquisitions
(in millions, except as noted)
Property Address
| | Location
| | Sq ft(1)
| | Weighted Average
Lease Term,
in years by
sq ft(1)
| | Date Acquired
| | Property
Purchase
Price
| | In-going
Stabilized
Yield(1)
|
|---|
| | | | | | | | | | | | | |
Income-producing properties: | | | | | | | | | | |
3870 Ronald Reagan Parkway | | Plainfield, IN | | | 0.6 | | | 5.8 | | Mar 23, 2018 | | | $ | 50.8 | | 5.3% |
181 Antrim Commons Drive | | Greencastle, PA | | | 0.4 | | | 14.6 | | Apr 4, 2018 | | | 44.3 | | 5.7% |
Ohio portfolio (four properties): | |
| | |
| | |
| |
| | |
| |
|
10, 100 and 115 Enterprise Parkway and 15 Commerce Parkway | | West Jefferson, OH | | | 3.8 | | | 7.0 | | May 23, 2018 | | | 299.3 | | 6.0% |
Joseph-Meyer-Straße 3 | | Erfurt, Germany | | | 0.7 | | | 4.7 | | Jul 12, 2018 | | | 82.7 | | 5.4% |
120 Velocity Way | | Shepherdsville, KY | | | 0.7 | | | 4.8 | | Dec 3, 2018 | | | 65.9 | | 5.7% |
Development land: | | |
| | |
| |
| | |
| |
|
12.9 acres of development land, Lot 18, Park 70 | | West Jefferson, OH | | | N/A | | | N/A | | Nov 1, 2018 | | | 1.2 | | N/A |
| | | | | | | | | | | | | |
Total | | | | | 6.2 | | | 6.8 | | | | | $ | 544.2 | | 5.8% |
| | | | | | | | | | | | | |
- (1)
- As at the date of acquisition
Acquisition, Construction and Development Commitments
Granite had the following property expansion and purchase commitments as well as construction and development commitments:
| | | | | | | | | | | | | | | | |
| | | | | | | | | | | |
Commitments
(in millions, except as noted)
Property Location
| | Additional
sq ft
| | Payments/
Deposits
Made(1)
| | Future
Commitments
| | Total
Cost
| | Year-One
Stabilized
Yield
|
|---|
| | | | | | | | | | | |
As at December 31, 2018: | | | | | | | |
Expansion at West Jefferson, OH | | 0.3 | | | $ | 20.6 | | | $ | 3.5 | | $ | 24.1 | | 6.1% |
Leasehold interest in two properties in Mississauga, ON | | 0.9 | | | 7.0 | | | 147.0 | | 154.0 | | 4.5% |
Properties under development in Texas and Indiana as well as other construction commitments | | 1.4 | | | 34.5 | | | 306.5 | | 341.0 | | 6.0% |
| | | | | | | | | | | |
| | 2.6 | | | $ | 62.1 | | | $ | 457.0 | | $ | 519.1 | | 5.4% |
Commitments between January 1, 2019 and March 6, 2019: | |
| | |
| | |
| |
| |
|
Two property purchases in Wilmer and Hutchins, TX(2) | |
1.0 | | |
— | | |
168.8 | |
168.8 | |
6.2% |
Demolition phase of property under development in Germany | | — | | | — | | | 1.7 | | 1.7 | | N/A |
| | | | | | | | | | | |
| | 3.6 | | | $ | 62.1 | | | $ | 627.5 | | $ | 689.6 | | 5.6% |
| | | | | | | | | | | |
- (1)
- As at December 31, 2018
- (2)
- Subsequent to December 31, 2018, Granite committed to acquire these properties. On March 1, 2019, Granite purchased the properties for total consideration of $168.8 million.
Table of Contents
Commitments as at December 31, 2018
In January 2019, Granite completed a building expansion at a West Jefferson, Ohio property for $24.1 million (US$17.7 million) that added 0.3 million square feet and is expected to contribute approximately $1.4 million in additional annual revenue upon rent commencement in the first quarter of 2020 subsequent to a rent-free period of approximately one year. Construction of the expansion commenced during the third quarter of 2018 and was substantially completed in January 2019.
A deposit of $7.0 million was made during 2018 to acquire the leasehold interest in two income-producing properties located in Mississauga, Ontario for total consideration of $154.0 million. This commitment to purchase the leasehold interest is subject to customary closing conditions and the consent of the ground lessor. The purchase is expected to close in the second quarter of 2019.
A deposit of $27.3 million (US$20.0 million) was also made during 2018 in connection with a contractual commitment to acquire a property under development in the state of Texas. This commitment to purchase the property under development is subject to specific confidentiality provisions and customary closing conditions including certain purchase rights in favour of the tenant and is expected to close concurrently with the lease commencement in the third quarter of 2019 following construction of the building.
As at December 31, 2018, Granite's commitment to purchase these aforementioned properties and expansion together with additional contractual commitments related to construction and development projects, including the development of a property in Plainfield, Indiana, amounted to approximately $457 million.
Commitments subsequent to December 31, 2018
On March 1, 2019, Granite acquired two properties in the United States for $168.8 million (US$123.7 million). The first property, 201 Sunridge Boulevard, Wilmer, Texas, is a 0.8 million square feet, 30-foot clear height distribution centre situated on 53.4 acres of land. Constructed in 2008, the property is 100% leased to a subsidiary of Unilever for a remaining lease term of 9.5 years. The excess land on the property can support a building expansion of up to 0.3 million square feet, providing attractive site flexibility and the potential for additional income in the future. The second property, 3501 North Lancaster Hutchins Road, Hutchins, Texas, is a 174.6 acre site, containing three buildings totaling 0.2 million square feet. The property is 100% leased to a leading wholesale automotive auction company for a remaining lease term of 10.4 years. The gross leasable area of the existing buildings represents a site coverage ratio of only 2.6%, providing significant potential for future development. Both properties are located within the southeast Dallas-Fort Worth industrial market.
During the first quarter of 2019, Granite entered into an agreement for approximately $1.7 million (€1.1 million) to demolish an existing building on a 15 acre site in Altbach, Germany. As at March 6, 2019, the demolition of the property is almost complete and construction of a 0.3 million square foot distribution/light industrial facility is expected to commence later in 2019.
Table of Contents
2018 Property Dispositions
During the year ended December 31, 2018, 16 properties previously classified as assets held for sale were disposed of for approximately $730 million and an overall capitalization rate of 6.7%. The properties consisted of the following:
| | | | | | | | | | | | | | | | |
| | | | | | | | | | | | |
2018 Dispositions
(in millions, except as noted)
Property Address
| | Location
| | Sq ft
| | Date Disposed
| | Sale Price
| | Annualized
Revenue(1)
| |
|---|
| | | | | | | | | | | | |
111 Cosma Drive | | Bowling Green, KY | | 1.2 | | Jan 30, 2018 | | | $ | 170.0 | | | $ | 12.0 | |
1 Cosma Court and 170 Edward Street | | St. Thomas, ON | | 1.5 | | Jan 30, 2018 | | | 154.6 | | | 10.8 | |
Newpark campus (seven properties): | |
| |
| |
| | |
| | |
| |
521, 550, 561, 564, 581, 594 and 630 Newpark Boulevard | | Newmarket, ON | | 0.6 | | Jan 31, 2018 | | | 63.0 | | | 2.8 | |
1 Clearview Drive | | Tillsonburg, ON | | 0.3 | | Jul 18, 2018 | | | 7.2 | | | 0.6 | |
120 Moon Acres Road | | Piedmont, SC | | 1.1 | | Sep 13, 2018 | | | 216.4 | | | 14.2 | |
1000 JD Yarnell Industrial Parkway | | Clinton, TN | | 0.5 | | Sep 13, 2018 | | | 54.8 | | | 4.1 | |
337 and 375 Magna Drive | | Aurora, ON | | 0.1 | | Sep 27, 2018 | | | 60.0 | | | 3.7 | |
Industriestrasse 11 | | Schleiz, Germany | | 0.1 | | Oct 4, 2018 | | | 3.6 | | | 0.4 | |
| | | | | | | | | | | | |
| | | | 5.4 | | | | | $ | 729.6 | | | $ | 48.6 | |
| | | | | | | | | | | | |
- (1)
- Annualized revenue is calculated as rental revenue excluding tenant recoveries, recognized in accordance with IFRS, in the month the property was first classified as an asset held for sale multiplied by twelve months.
During the year ended December 31, 2018, Granite completed the sale of its two remaining special purpose properties in the United States located in Piedmont, South Carolina and Clinton, Tennessee. The gross proceeds for these two properties of $216.4 million and $54.8 million included amounts that are expected to be received in the first quarters of 2020 and 2019, respectively, and were based on an estimated consumer price index inflation factor at the date of disposition. At December 31, 2018, the expected remaining proceeds receivable was $11.8 million (US$8.7 million) for the property disposed of in South Carolina and $0.2 million (US$0.2 million) for the Tennessee property disposal. The proceeds receivable are subject to change and will be dependent upon the actual inflation factors.
Assets Held for Sale
At December 31, 2018, six investment properties located in Canada and the United States were classified as assets held for sale. The six properties, having an aggregate fair value of $44.2 million, consisted of the following:
| | | | | | | | | | | | | | |
| | | | | | | | | | |
Held for Sale
(in millions, except as noted)
Property Address
| | Location
| | Sq ft
| | Fair
Value
| | Annualized
Revenue(1)
| |
|---|
| | | | | | | | | | |
3 Walker Drive (nine acre parcel of land) | | Brampton, ON | | N/A | | | $ | 13.4 | | | $ | — | |
375 Edward Street | | Richmond Hill, ON | | 0.1 | | | 7.8 | | | — | |
403 S 8th Street | | Montezuma, IA | | 0.2 | | | 7.1 | | | 0.8 | |
1951 A Avenue | | Victor, IA | | 0.1 | | | 5.5 | | | 0.6 | |
408 N Maplewood Avenue | | Williamsburg, IA | | 0.2 | | | 7.2 | | | 0.6 | |
411 N Maplewood Avenue | | Williamsburg, IA | | 0.1 | | | 3.2 | | | 0.2 | |
| | | | | | | | | | |
| | | | 0.7 | | | $ | 44.2 | | | $ | 2.2 | |
| | | | | | | | | | |
- (1)
- Annualized revenue is calculated as rental revenue excluding tenant recoveries, recognized in accordance with IFRS, in the month the property was first classified as an asset held for sale multiplied by twelve months.
Table of Contents
These aforementioned properties were classified as assets held for sale on the combined balance sheets at December 31, 2018 and were excluded from the value of investment properties. These properties are also excluded from references to investment properties and related property metrics on the date thereof throughout this MD&A. During January and February 2019, all six properties classified as assets held for sale were sold for aggregate gross proceeds of $43.7 million.
Unsecured Term Loans
On December 12, 2018, Granite entered into and fully drew down a $300.0 million seven-year senior unsecured non-revolving term facility (the "2025 Term Loan"). Through a cross currency interest rate swap, Granite has exchanged the variable rate interest payments (Canadian Dollar Offered Rate "CDOR" plus margin) from the 2025 Term Loan for Euro denominated payments at a 2.202% fixed interest rate.
On December 19, 2018, Granite entered into and fully drew down a US$185.0 million four-year senior unsecured non-revolving term facility (the "2022 Term Loan"). Through a cross currency interest rate swap, Granite has exchanged the variable rate interest payments (LIBOR plus margin) from the 2022 Term Loan for Euro denominated payments at a 1.225% fixed interest rate.
Granite intends to use the net proceeds from both term loans for general corporate purposes, including to fund development and property acquisitions.
Officer and Board Appointments
Effective August 1, 2018, Kevan Gorrie became Granite's President and Chief Executive Officer, a trustee of Granite REIT and a director of Granite GP, replacing Michael Forsayeth.
Special Distribution to Unitholders
As a result of the increase in taxable income generated primarily by the sale transactions in 2018, Granite's Board of Trustees declared a special distribution in December 2018 of $1.20 per stapled unit which comprised 30.0 cents per unit payable in cash and 90.0 cents per unit payable by the issuance of stapled units. The cash portion of the special distribution was intended to provide liquidity to unitholders to cover all or part of any non-resident withholding taxes or other income tax obligations that may arise from the additional taxable income being distributed via the special distribution. On January 15, 2019, immediately following the issuance of the stapled units related to the portion of the special distribution payable in stapled units of 90.0 cents per unit, the stapled units were consolidated such that each unitholder held the same number of stapled units after the consolidation as each unitholder held prior to the special distribution.
Increase in Monthly Distributions
The 2019 targeted annualized distribution increased by 2.9% to $2.80 (23.3 cents per month) per stapled unit commencing with the monthly distribution paid in January 2019.
Table of Contents
Foreign Currency Translation
The majority of Granite's investment properties are located in Europe and the United States and the cash flows derived from such properties are primarily denominated in Euros and US dollars. Accordingly, fluctuations in the Canadian dollar, Granite's reporting currency, relative to the Euro and US dollar will result in fluctuations in the reported values of revenues, expenses, cash flows, assets and liabilities. The most significant foreign currency exchange rates that impact Granite's business are summarized in the following table:
| | | | | | | | | | | | | | | | | | | | | | | | | | | | | | | | | | | |
| | | | | | | | | | | | | | | | | | | | |
| | Average Exchange Rates | | Period End Exchange Rates | |
|---|
| | Three Months Ended
December 31, | |
| | Years Ended
December 31, | |
| |
| |
| |
| |
|---|
| |
| |
| | December 31,
2018
| | December 31,
2017
| |
| |
|---|
| | 2018
| | 2017
| | Change
| | 2018
| | 2017
| | Change
| | Change
| |
|---|
| | | | | | | | | | | | | | | | | | | | |
$ per €1.00 | | | 1.508 | | 1.497 | | | 1% | | | 1.530 | | 1.465 | | | 4% | | | 1.563 | | | 1.505 | | | 4% | |
$ per US$1.00 | | | 1.322 | | 1.271 | | | 4% | | | 1.296 | | 1.298 | | | —% | | | 1.364 | | | 1.252 | | | 9% | |
| | | | | | | | | | | | | | | | | | | | |
The average exchange rates for the three months ended December 31, 2018 were higher when compared to those for the three months ended December 31, 2017 as a result of the relative weakening of the Canadian dollar vis-à-vis the Euro and US dollar, which, on a comparative basis, increased the Canadian dollar equivalent of revenue and expenses from Granite's European and U.S. operations.
For the year ended December 31, 2018 compared to the prior year, the average exchange rates of the Canadian dollar to the Euro and US dollar were higher and slightly lower, respectively, which on a comparative basis, increased the Canadian dollar equivalent of revenue and expenses from Granite's European operations and marginally decreased the Canadian dollar equivalent of revenue and expenses from Granite's U.S. operations.
The period end exchange rates of the Canadian dollar to the Euro and US dollar on December 31, 2018 were higher when compared to the December 31, 2017 exchange rates. As a result, the Canadian dollar equivalent of assets and liabilities from Granite's European and U.S. subsidiaries were higher when compared to December 31, 2017.
On a net basis, the effect of the changes in exchange rates on Granite's operating results for the three month period and year ended December 31, 2018 was as follows:
Effects of Changes in Exchange Rates on Operating Results
| | | | | | | | | |
| | | | | | |
| | Three Months Ended
December 31, | | Years Ended
December 31, | |
|---|
(in millions, except per unit information)
| | 2018 vs 2017
| | 2018 vs 2017
| |
|---|
| | | | | | |
Increase in revenue | | | $ | 0.9 | | | $ | 4.5 | |
Increase in NOI — cash basis | | | 0.8 | | | 4.4 | |
Increase in net income | | | 1.2 | | | 5.0 | |
Increase in FFO | | | 0.9 | | | 2.8 | |
Increase in AFFO | | | 0.8 | | | 2.8 | |
Increase in FFO per unit | | | $ | 0.02 | | | $ | 0.06 | |
Increase in AFFO per unit | | | $ | 0.02 | | | $ | 0.06 | |
| | | | | | |
Table of Contents
Operating Results
Revenue
| | | | | | | | | | | | | | | | | | | | | | |
| | | | | | | | | | | | | | |
| | Three Months Ended
December 31, | |
| | Years Ended
December 31, | |
| |
|---|
| | 2018
| | 2017(1)
| | $ change
| | 2018
| | 2017(1)
| | $ change
| |
|---|
| | | | | | | | | | | | | | |
Rental revenue | | | $ | 53.5 | | | $ | 55.7 | | (2.2 | ) | $ | 220.0 | | | $ | 216.1 | | 3.9 | |
Tenant recoveries | | | 6.4 | | | 6.9 | | (0.5 | ) | 26.5 | | | 27.0 | | (0.5 | ) |
Lease termination and close-out fees | | | — | | | — | | — | | 1.0 | | | 1.6 | | (0.6 | ) |
| | | | | | | | | | | | | | |
Revenue | | | $ | 59.9 | | | $ | 62.6 | | (2.7 | ) | $ | 247.5 | | | $ | 244.7 | | 2.8 | |
| | | | | | | | | | | | | | |
- (1)
- Granite has retrospectively applied IFRS 15,Revenue from Contracts with Customers (see "NEW ACCOUNTING PRONOUNCEMENTS AND DEVELOPMENTS") and all historical periods herein have been restated to reflect such treatment.
Revenue for the three month period ended December 31, 2018 decreased $2.7 million to $59.9 million from $62.6 million in the prior year period. The components contributing to the change in revenue are detailed below:
Q4 2018 vs Q4 2017 Change in Revenue
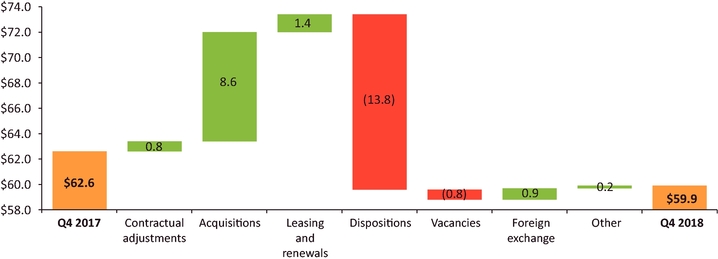
Additional details pertaining to the components of the change in revenue are as follows:
- •
- contractual rent adjustments included $0.7 million from consumer price index based increases and $0.1 million from fixed contractual adjustments related to rent escalations;
- •
- the acquisitions of properties located in the United States and Germany in 2018 increased revenue by $8.6 million, which included $0.7 million of tenant recoveries;
- •
- revenue increased by $1.4 million primarily due to the partial lease-up of a property in Novi, Michigan;
Table of Contents
- •
- the sale of 16 investment properties in Canada, the United States and Germany in 2018 decreased revenue by $13.8 million of which $1.6 million related to a reduction in property tax and insurance tenant recoveries;
- •
- vacancies arising from a lease expiry for a property in the Netherlands and three lease expiries for properties in Canada decreased revenue by $0.4 million each. The property in the Netherlands was re-leased in December 2018; and
- •
- foreign exchange had a $0.9 million positive impact as the weakening of the Canadian dollar against the Euro and US dollar increased revenue by $0.1 million and $0.8 million, respectively.
Revenue for the year ended December 31, 2018 increased $2.8 million to $247.5 million from $244.7 million in the prior year. The components contributing to the change in revenue are detailed below:
Year 2018 vs Year 2017 Change in Revenue
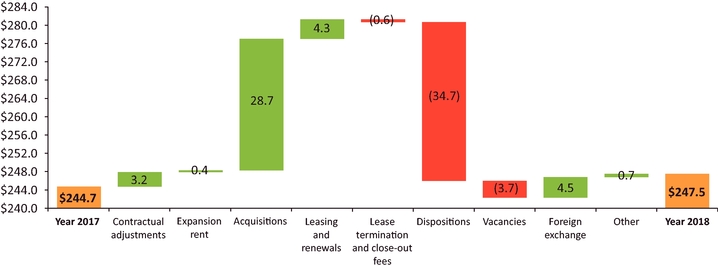
Additional details pertaining to the components of the change in revenue are as follows:
- •
- contractual rent adjustments included $2.8 million from consumer price index based increases and $0.4 million from fixed contractual adjustments related to rent escalations;
- •
- revenue increased by $0.4 million primarily due to the purchase of two building expansions in the United States in the prior year;
- •
- the acquisitions of properties located in the United States and Germany from October 2017 to December 2018 increased revenue by $28.7 million, which included $2.8 million of tenant recoveries;
- •
- revenue increased by $4.3 million primarily due to the partial lease-up of a property in Novi, Michigan;
- •
- revenue decreased by $1.6 million as a result of the lease termination and close-out fees received in the prior year, partially offset by a $1.0 million lease termination fee in 2018 for an acquired property in the United States for which the leasable area was re-leased to a new tenant;
- •
- the sale of 16 properties in Canada, the United States and Germany in 2018 decreased revenue by $34.7 million of which $4.4 million related to a reduction in property tax and insurance tenant recoveries;
Table of Contents
- •
- lease expiries for five properties in North America and two properties in Europe resulted in vacancies that decreased revenue by $1.5 million and $2.2 million, respectively; and
- •
- foreign exchange had a net $4.5 million positive impact largely from the weakening of the Canadian dollar against the Euro.
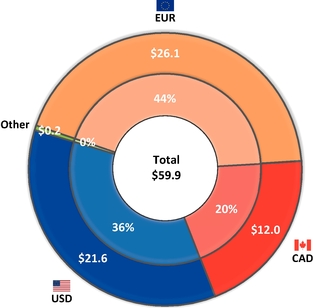
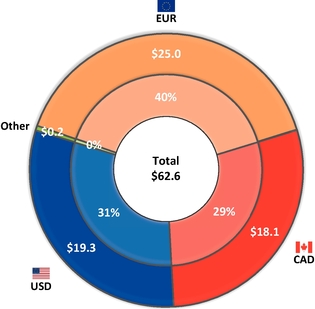
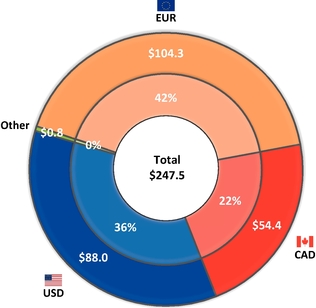
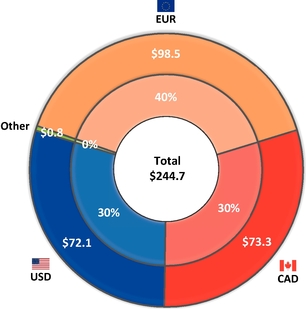
Revenue by major currency for the three month periods and years ended December 31, 2018 and 2017 was as follows:
| | |
Fourth Quarter 2018
| | Fourth Quarter 2017
|
|---|
 |
|
|
| | |
Year 2018
| | Year 2017
|
|---|
 |
|
|
The mix in revenue for the three months and year ended December 31, 2018 compared to the prior year periods has changed primarily with revenue denominated in US dollars increasing and revenue
Table of Contents
denominated in Canadian dollars decreasing as a result of the recent U.S. acquisitions and Canadian property dispositions.
As a majority of the Trust's revenue is denominated in currencies other than the Canadian dollar, Granite uses derivative financial instruments, including cross currency interest rate swaps and forward currency contracts, to partially hedge its exposure to foreign currencies and reduce the potential impact that foreign currency rate changes may have on Granite's operating results, cash flows and distributions.
Net Operating Income
Net operating income ("NOI") in the three months ended December 31, 2018 was $52.4 million compared to $54.5 million in the three months ended December 31, 2017. NOI in the year ended December 31, 2018 was $216.6 million compared to $213.3 million in the year ended December 31, 2017. NOI — cash basis excludes the impact of lease termination and close-out fees, and straight-line rent and tenant incentive amortization and reflects the cash generated by the income-producing properties excluding lease termination and close-out fees on a period-over-period basis. NOI — cash basis was $52.9 million in the three months ended December 31, 2018 compared with $56.2 million in the prior year period. NOI — cash basis was $216.7 million in the year ended December 31, 2018 compared with $218.2 million in the year ended December 31, 2017.
Same property NOI — cash basis refers to the NOI — cash basis for those properties owned by Granite throughout the entire current and prior year periods under comparison. Same property NOI — cash basis excludes properties that were acquired, disposed of, classified as properties under or held for development or assets held for sale during the periods under comparison. Same property NOI — cash basis in the three months ended December 31, 2018 was $42.9 million compared to $41.3 million in the three months ended December 31, 2017. Same property NOI — cash basis in the year ended December 31, 2018 was $170.9 million compared to $164.6 million in the year ended December 31, 2017. The changes in NOI, NOI — cash basis and same property NOI — cash basis are detailed below:
Changes in NOI(3), NOI — Cash Basis and Same Property NOI — Cash Basis
| | | | | | | | | | | | | | | | | | | | | | | | | | | |
| | | | | | | | | | | | | | | | | | |
| |
| | Three Months Ended
December 31, | |
| | Years Ended
December 31, | |
|---|
| | Sq ft(1)
(in millions)
| | Sq ft(1)
(in millions)
| |
|---|
| | 2018
| | 2017(2)
| | $ change
| | 2018
| | 2017(2)
| | $ change
| |
|---|
| | | | | | | | | | | | | | | | | | |
Revenue | | | | $ | 59.9 | | | $ | 62.6 | | (2.7 | ) | | | $ | 247.5 | | | $ | 244.7 | | 2.8 | |
Less: Property operating costs | | | | 7.5 | | | 8.1 | | (0.6 | ) | | | 30.9 | | | 31.4 | | (0.5 | ) |
| | | | | | | | | | | | | | | | | | |
NOI(3) | | | | $ | 52.4 | | | $ | 54.5 | | (2.1 | ) | | | $ | 216.6 | | | $ | 213.3 | | 3.3 | |
Add (deduct): | | | | | | | | | | | | | | | | | | | |
Lease termination and close-out fees | | | | — | | | — | | — | | | | (1.0 | ) | | (1.6 | ) | 0.6 | |
Straight-line rent amortization | | | | (0.8 | ) | | 0.3 | | (1.1 | ) | | | (4.3 | ) | | 1.1 | | (5.4 | ) |
Tenant incentive amortization | | | | 1.3 | | | 1.4 | | (0.1 | ) | | | 5.4 | | | 5.4 | | — | |
| | | | | | | | | | | | | | | | | | |
NOI — cash basis | | 32.2 | | $ | 52.9 | | | $ | 56.2 | | (3.3 | ) | 32.2 | | $ | 216.7 | | | $ | 218.2 | | (1.5 | ) |
Less NOI — cash basis for: | | | | | | | | | | | | | | | | | | | |
Acquisitions | | 8.4 | | 9.5 | | | 2.3 | | 7.2 | | 8.4 | | 26.0 | | | 2.3 | | 23.7 | |
Dispositions, assets held for sale and developments | | 0.7 | | 0.5 | | | 12.6 | | (12.1 | ) | 6.0 | | 19.8 | | | 51.3 | | (31.5 | ) |
| | | | | | | | | | | | | | | | | | |
Same property NOI — cash basis | | 23.8 | | $ | 42.9 | | | $ | 41.3 | | 1.6 | | 23.8 | | $ | 170.9 | | | $ | 164.6 | | 6.3 | |
| | | | | | | | | | | | | | | | | | |
- (1)
- The square footage relating to the NOI — cash basis represents GLA of 32.2 million square feet as at December 31, 2018. The square footage relating to the same property NOI — cash basis represents Granite's GLA of 23.8 million square feet as at
Table of Contents
December 31, 2018, which excludes the impact from the acquisitions, dispositions, assets held for sale and developments during the relevant periods.
- (2)
- The Trust has retrospectively applied IFRS 15,Revenue from Contracts with Customers (see "NEW ACCOUNTING PRONOUNCEMENTS AND DEVELOPMENTS") and all historical periods herein have been restated to reflect such treatment.
- (3)
- NOI is calculated in accordance with IFRS and is included in the audited combined financial statements as at and for the year ended December 31, 2018. Previously, Granite reported NOI as a non-IFRS financial measure, calculated as set forth above but excluding lease termination and close-out fee revenue. NOI for the year ended December 31, 2017 as calculated under the prior method was previously reported as $211.7 million, and for the quarter ended December 31, 2017 was previously reported as $54.5 million.
Property operating costs include recoverable and non-recoverable costs from tenants and consist of property taxes, utilities, insurance, repairs and maintenance, legal and other property-related expenses. None of Granite's employee compensation expenses are included in property operating costs.
Straight-line rent amortization represents the scheduled fixed rent changes or rent-free periods in leases that are recognized in revenue evenly on a straight-line basis over the term of the lease. Tenant incentive amortization mainly represents allowances provided to tenants that are recognized in revenue evenly on a straight-line basis over the term of the lease and primarily comprises the amortization associated with the cash allowance incentives paid to Magna in respect of the 10-year lease extensions exercised during the 2014 year at the Thondorf and Eurostar properties in Graz, Austria.
NOI — cash basis for the three month period ended December 31, 2018 decreased $3.3 million to $52.9 million from $56.2 million in the prior year period due to the decrease in rental revenue as noted previously and the straight-line rent amortization associated with the recent acquisitions in the United States and rent-free period for the re-leasing of a property in the Netherlands.
NOI — cash basis for the year ended December 31, 2018 decreased $1.5 million to $216.7 million from $218.2 million in the prior year as a result of the straight-line rent amortization for the properties mentioned above and rent-free periods associated with the partial lease-up of vacant space in Novi, Michigan and the early renewals and extensions of three leases in North America and Germany, partially offset by the increase in rental revenue as noted previously.
Same property NOI — cash basis for the three month period ended December 31, 2018 increased $1.6 million (3.9%) to $42.9 million primarily due to the increase in contractual rents, partial lease-up of the property in Novi, Michigan and the favourable foreign exchange impact from the weakening of the Canadian dollar against the US dollar, partially offset by vacancies for properties in Canada and the Netherlands. Excluding the impact of foreign exchange, same property NOI — cash basis for the three month period ended December 31, 2018 would have increased by 1.9%.
Same property NOI — cash basis for the year ended December 31, 2018 increased $6.3 million (3.8%) to $170.9 million largely resulting from the increase in contractual rents, the partial lease-up of the vacant space in Novi, Michigan and the property in Poland, and the favourable foreign exchange impact from the weakening of the Canadian dollar against the Euro, partially offset by vacancies for properties in North America and the Netherlands and rent-free periods for certain lease renewals in Europe. Excluding the impact of foreign exchange, same property NOI — cash basis for the year ended December 31, 2018 would have increased by 0.3%.
Table of Contents
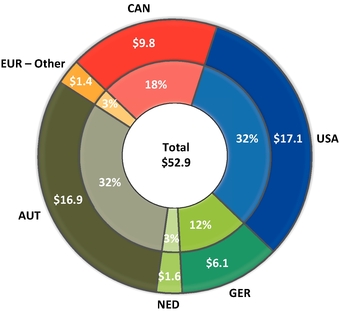
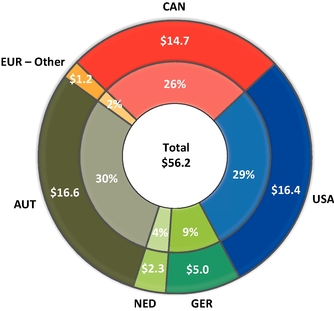
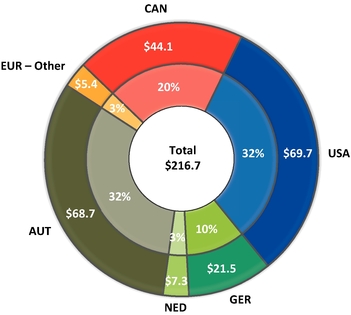
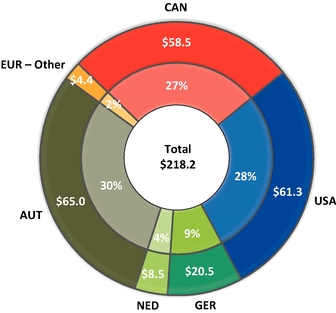
NOI — cash basis for the three month periods and years ended December 31, 2018 and 2017 by geography was as follows:
NOI — Cash Basis by Geography
| | |
Fourth Quarter 2018
| | Fourth Quarter 2017
|
|---|
 |
|
|
| | |
Year 2018
| | Year 2017
|
|---|
 |
|
|
Table of Contents
The mix in NOI — cash basis for the three months and year ended December 31, 2018 compared to the prior year periods has changed primarily with the percentage attributable to the United States increasing and Canada decreasing as a result of the recent U.S. acquisitions and Canadian property dispositions.
Granite's property portfolio and NOI — cash basis are geographically diversified, which reduces the risk to Granite's operating results of any particular country's economic downturn.
General and Administrative Expenses
General and administrative expenses consisted of the following:
General and Administrative Expenses
| | | | | | | | | | | | | | | | | | | | | | | |
| | | | | | | | | | | | | | |
| | Three Months Ended
December 31, | |
| | Years Ended
December 31, | |
| |
|---|
| | 2018
| | 2017
| | $ change
| | 2018
| | 2017
| | $ change
| |
|---|
| | | | | | | | | | | | | | |
Salaries and benefits | | | $ | 4.2 | | | $ | 3.1 | | | 1.1 | | $ | 16.0 | | $ | 12.1 | | | 3.9 | |
Audit, legal and consulting | | | 1.0 | | | 0.9 | | | 0.1 | | 4.0 | | 3.4 | | | 0.6 | |
Trustee/director fees and related expenses | | | 0.2 | | | 0.4 | | | (0.2 | ) | 1.1 | | 1.4 | | | (0.3 | ) |
Unit-based compensation including distributions and revaluations | | | 0.6 | | | 0.7 | | | (0.1 | ) | 3.2 | | 4.0 | | | (0.8 | ) |
Other public entity costs | | | 0.4 | | | 0.4 | | | — | | 1.6 | | 1.7 | | | (0.1 | ) |
Office rents | | | 0.2 | | | 0.2 | | | — | | 0.9 | | 0.9 | | | — | |
Other | | | 0.6 | | | 0.9 | | | (0.3 | ) | 2.6 | | 2.5 | | | 0.1 | |
| | | | | | | | | | | | | | |
General and administrative expenses | | | $ | 7.2 | | | $ | 6.6 | | | 0.6 | | $ | 29.4 | | $ | 26.0 | | | 3.4 | |
| | | | | | | | | | | | | | |
General and administrative expenses were $7.2 million for the three month period ended December 31, 2018 and increased $0.6 million in comparison to the prior year period primarily as a result of the following:
- •
- an increase in salaries and benefits expense mainly due to higher incentive pay expense, partially offset by;
- •
- a decrease in trustee/director fees as a result of a reduction in board fees starting in 2017; and
- •
- a decrease in other general and administrative expenses primarily due to fees for various administrative matters, such as staff replacements and travel, incurred in the prior year period.
General and administrative expenses were $29.4 million for the year ended December 31, 2018 and increased $3.4 million in comparison to the prior year primarily as a result of the following:
- •
- an increase in salaries and benefits expense mainly due to compensation costs associated with departing employees including Granite's former Chief Executive Officer and Chief Operating Officer as well as higher incentive pay expense in the 2018 year; and
- •
- an increase in audit, legal and consulting costs due to corporate advisory matters including internal reorganizations and administrative matters, such as temporary staff replacements. These increases were partially offset by:
- •
- the reduction in unit-based compensation costs mainly due to the decrease in fair value remeasurement expense resulting from fluctuations in the market price of the Trust's stapled units. For the years ended December 31, 2018 and 2017, general and administrative expenses included a
Table of Contents
Proxy Contest Expenses
In the year ended December 31, 2017, Granite incurred expenses of $5.9 million in connection with the proxy contest leading up to Granite's June 2017 annual general meeting. Included in the proxy contest expenses are legal, advisory and proxy solicitation costs incurred directly by Granite and a $2.0 million reimbursement of out-of-pocket fees and expenses incurred by Front Four Capital Group and Sandpiper Group regarding matters relating to the annual general meeting. Sandpiper Group received $0.7 million of the reimbursement. An individual affiliated with Sandpiper Group is a related party of Granite by virtue of becoming a director of Granite GP and a trustee of Granite REIT.
Interest Income
Interest income for the three month periods ended December 31, 2018 and 2017 was $0.8 million and $0.1 million, respectively. The $0.7 million increase is primarily due to interest income earned from higher cash balances resulting from property dispositions and the drawdowns from the term loans.
Interest income for the years ended December 31, 2018 and 2017 was $2.6 million and $0.5 million, respectively. The $2.1 million increase is primarily due to interest income earned from higher cash balances as noted above and a vendor take-back mortgage receivable associated with a property disposition. The mortgage receivable bore interest at an annual rate of 6.0% and was repaid on April 16, 2018.
Interest Expense and Other Financing Costs
Interest expense and other financing costs for the three month periods ended December 31, 2018 and 2017 remained consistent at $5.5 million. The fourth quarter of 2018 included interest expense associated with the term loan drawdowns in December 2018 while the prior year period included interest expense for the outstanding credit facility draws.
Interest expense and other financing costs for the years ended December 31, 2018 and 2017 were $22.4 million and $20.0 million, respectively. The $2.4 million increase is primarily related to:
- •
- the higher interest expense associated with the credit facility draws and term loans indebtedness during 2018;
- •
- the foreign exchange impact resulting from the relative weakening of the Canadian dollar against the Euro on the cross currency interest rate swaps; and
- •
- the higher standby fees relating to the increased borrowing capacity under the credit facility.
As at December 31, 2018, Granite's weighted average cost of interest-bearing debt was 2.17% (2017 — 2.54%) and the weighted average debt term-to-maturity was 4.7 years (2017 — 4.8 years).
Foreign Exchange Gains/Losses, Net
Granite recognized net foreign exchange gains of $1.4 million and $0.8 million in the three month periods ended December 31, 2018 and 2017, respectively. The $0.6 million increase in net foreign exchange gains is primarily due to the settlement of two cross currency interest rate swaps entered into to fund the property acquisition in Germany.
Granite recognized net foreign exchange gains of $9.4 million in the year ended December 31, 2018 which included an $8.5 million foreign exchange gain related to the remeasurement of the US dollar cash proceeds received from the sale of three investment properties in January 2018. In comparison, Granite recognized net foreign exchange losses of $0.6 million in the year ended December 31, 2017. The $10.0 million increase
Table of Contents
in net foreign exchange gains is substantially due to the remeasurement of the US dollar cash proceeds and, to a lesser extent, the settlement of two cross currency interest rate swaps as noted above, partially offset by the net remeasurement of certain monetary assets and liabilities of the Trust that are denominated in US dollars or Euros.
Fair Value Gains/Losses on Investment Properties, Net
Net fair value gains on investment properties were $52.9 million and $185.2 million in the three month periods ended December 31, 2018 and 2017, respectively. In the three month period ended December 31, 2018, net fair value gains of $52.9 million were largely attributable to a compression in discount and terminal capitalization rates for properties located in Canada, the United States and the Netherlands that resulted from a greater market demand for industrial real estate properties and, to a lesser extent, the increase in fair value to the expected sale price for the multi-purpose properties sold in the first quarter of 2019 and the positive changes in leasing assumptions associated with new leases and lease renewals.
The net fair value gains on investment properties in the three month period ended December 31, 2017 of $185.2 million were primarily attributable to i) the increase in fair value to the sale price for the 10 properties (three special purpose properties and seven multi-purpose facilities) sold in January 2018 and the higher valuation implied on certain remaining special purpose properties (see "INVESTMENT PROPERTIES") from the pricing realized and the liquidity potential demonstrated from the sale and ii) a compression in discount and terminal capitalization rates for certain multi-purpose properties located in Canada resulting from market demand which led to improved asset pricing.
Net fair value gains on investment properties were $354.7 million and $212.1 million in the years ended December 31, 2018 and 2017, respectively. In the year ended December 31, 2018, net fair value gains of $354.7 million were largely attributable to i) an increase in fair value to the sale price for the multi-purpose and special purpose properties sold in 2018 and 2019, ii) a compression in discount and terminal capitalization rates and an increase in market rents for properties located in Canada, the United States, Germany and the Netherlands resulting from a greater market demand and, to a lesser extent, iii) positive changes in leasing assumptions primarily from contractual rent increases, new leases and lease renewals.
The net fair value gains on investment properties in the year ended December 31, 2017 of $212.1 million were attributable to several factors, and, in particular, to i) the increase in fair value to the sale price for the 10 properties sold in January 2018 and the higher valuation implied on certain remaining special purpose properties, as noted above, ii) a compression in discount and terminal capitalization rates for certain modern warehouse and multi-purpose properties located in Canada, the United States and Europe resulting from market demand which led to improved asset pricing and iii) favourable changes in leasing assumptions from new leases or renewals executed at multi-purpose properties located in Canada and the United States and modern warehouse properties in Europe.
Acquisition Transaction Costs
Acquisition transaction costs for the three month period and year ended December 31, 2018 were $0.4 million and $8.0 million compared to $0.4 million and $0.7 million for the prior year periods, respectively. Acquisition transaction costs primarily include land transfer tax, legal and advisory costs associated with completed acquisitions and, to a lesser extent, legal and advisory costs associated with pursuing acquisition opportunities that were not completed. The increase in acquisition transaction costs for the current year is due to greater overall acquisition activity and a $5.4 million land transfer tax for the property acquired in Germany.
Table of Contents
Loss on Sale of Investment Properties
The loss on sale of investment properties for the three month period and year ended December 31, 2018 was $1.5 million and $6.9 million, respectively, compared to $0.4 million for both prior year periods. Loss on sale of investment properties is related to broker commissions and legal and advisory costs associated with the dispositions or planned dispositions of assets held for sale.
Other Income
Other income of $2.3 million for the year ended December 31, 2018 is attributable to a settlement amount related to a land use matter for a property in Ontario, Canada. Granite received $1.4 million of the settlement during 2018 and the remaining balance was collected in January 2019.
Income Tax Expense
Income tax expense comprised the following:
| | | | | | | | | | | | | | | | | | | | | |
| | | | | | | | | | | | | | |
| | Three Months Ended
December 31, | |
| | Years Ended
December 31, | |
| |
|---|
| | 2018
| | 2017
| | $ change
| | 2018
| | 2017
| | $ change
| |
|---|
| | | | | | | | | | | | | | |
Foreign operations | | $ | 1.3 | | $ | 1.4 | | | (0.1 | ) | $ | 5.9 | | $ | 5.2 | | | 0.7 | |
Withholding taxes | | — | | — | | | — | | 0.7 | | 1.0 | | | (0.3 | ) |
Related to sale of an investment property | | — | | — | | | — | | 0.2 | | — | | | 0.2 | |
Other | | (0.5 | ) | 0.1 | | | (0.6 | ) | 0.8 | | 1.5 | | | (0.7 | ) |
| | | | | | | | | | | | | | |
Current tax expense | | 0.8 | | 1.5 | | | (0.7 | ) | 7.6 | | 7.7 | | | (0.1 | ) |
Deferred tax expense | | 4.6 | | (8.0 | ) | | 12.6 | | 45.0 | | 5.7 | | | 39.3 | |
| | | | | | | | | | | | | | |
Income tax expense | | $ | 5.4 | | $ | (6.5 | ) | | 11.9 | | $ | 52.6 | | $ | 13.4 | | | 39.2 | |
| | | | | | | | | | | | | | |
For the three months ended December 31, 2018, the current tax expense decreased compared to the prior year period primarily due to the favourable settlement of an Austrian tax matter in the fourth quarter of 2018.
For the year ended December 31, 2018, the current tax expense decreased compared to the prior year primarily due to the favourable settlement of an Austrian tax matter and lower withholding taxes incurred on inter-company dividends, partially offset by higher taxable income generated in taxable European jurisdictions, the foreign exchange impact resulting from the relative weakening of the Canadian dollar on Euro denominated tax expense and the tax expense associated with the disposition of a property located in Germany.
The increase in deferred tax expense for the three months and year ended December 31, 2018 compared to the prior year periods was primarily due to an increase in fair value gains in jurisdictions in which deferred taxes are recorded and the reduction in the US tax rate enacted in December 2017 that resulted in a deferred tax recovery in the prior year.
Table of Contents
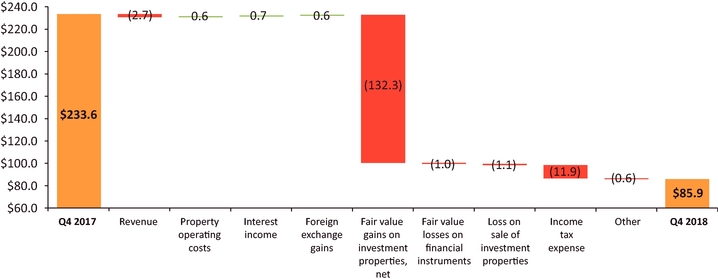
Net Income Attributable to Stapled Unitholders
For the three month period ended December 31, 2018, net income attributable to stapled unitholders was $85.9 million compared to $233.6 million in the prior year period. The $147.7 million net decrease was primarily due to a $132.3 million decrease in net fair value gains on investment properties and an $11.9 million increase in income tax expense. The $147.7 million decrease in net income attributable to stapled unitholders is summarized below:
Q4 2018 vs Q4 2017 Change in Net Income Attributable to Stapled Unitholders
For the year ended December 31, 2018, net income attributable to stapled unitholders was $465.2 million compared to $357.7 million in the prior year. The $107.5 million net increase was primarily due to a $142.6 million increase in net fair value gains on investment properties, partially offset by a corresponding $39.3 million increase in deferred income tax expense. The $107.5 million increase in net income attributable to stapled unitholders is summarized below:
Year 2018 vs Year 2017 Change in Net Income Attributable to Stapled Unitholders
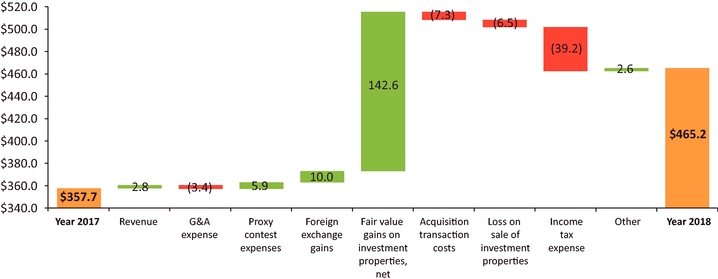
Table of Contents
Funds From Operations and Adjusted Funds From Operations
The reconciliation of net income attributable to stapled unitholders to FFO and AFFO for the three months and years ended December 31, 2018 and 2017 is presented below:
FFO AND AFFO RECONCILIATION
| | | | | | | | | | | | | | | |
| | | | | | | | | | | | |
| |
| | Three Months Ended
December 31, | | Years Ended
December 31, | |
|---|
(in millions, except per unit information)
| |
| |
|---|
| |
| | 2018
| | 2017
| | 2018
| | 2017
| |
|---|
| | | | | | | | | | | | |
Net income attributable to stapled unitholders | | | | $ | 85.9 | | $ | 233.6 | | $ | 465.2 | | $ | 357.7 | |
Add (deduct): | | | | | | | | | | | |
Fair value gains on investment properties, net | | | | (52.9 | ) | (185.2 | ) | (354.7 | ) | (212.1 | ) |
Fair value losses on financial instruments | | | | 1.4 | | 0.4 | | 0.5 | | 0.8 | |
Acquisition transaction costs | | | | 0.4 | | 0.4 | | 8.0 | | 0.7 | |
Loss on sale of investment properties | | | | 1.5 | | 0.4 | | 6.9 | | 0.4 | |
Other income — settlement award | | | | — | | — | | (2.3 | ) | — | |
Current income tax expense associated with the sale of an investment property | | | | — | | — | | 0.2 | | — | |
Deferred income tax expense | | | | 4.6 | | (8.0 | ) | 45.0 | | 5.7 | |
Non-controlling interests relating to the above | | | | — | | — | | 0.1 | | — | |
| | | | | | | | | | | | |
FFO | | [A] | | $ | 40.9 | | $ | 41.6 | | $ | 168.9 | | $ | 153.2 | |
Add (deduct): | | | | | | | | | | | |
Maintenance or improvement capital expenditures paid | | | | (1.2 | ) | (9.3 | ) | (17.8 | ) | (10.7 | ) |
Leasing commissions paid | | | | (0.2 | ) | (1.2 | ) | (4.2 | ) | (2.6 | ) |
Tenant incentives paid | | | | (0.2 | ) | (0.2 | ) | (9.9 | ) | (1.0 | ) |
Tenant incentive amortization | | | | 1.3 | | 1.4 | | 5.4 | | 5.4 | |
Straight-line rent amortization | | | | (0.8 | ) | 0.3 | | (4.3 | ) | 1.1 | |
| | | | | | | | | | | | |
AFFO | | [B] | | $ | 39.8 | | $ | 32.6 | | $ | 138.1 | | $ | 145.4 | |
| | | | | | | | | | | | |
Per unit amounts: | | | |
| |
| |
| |
| |
Basic and Diluted FFO per stapled unit | | [A]/[C] and [A]/[D] | | $ | 0.90 | | $ | 0.89 | | $ | 3.68 | | $ | 3.25 | |
Basic and Diluted AFFO per stapled unit | | [B]/[C] and [B]/[D] | | $ | 0.87 | | $ | 0.69 | | $ | 3.01 | | $ | 3.09 | |
Basic weighted average number of stapled units | | [C] | |
45.7 | |
46.9 | |
45.9 | |
47.1 | |
Diluted weighted average number of stapled units | | [D] | | 45.7 | | 47.0 | | 45.9 | | 47.1 | |
| | | | | | | | | | | | |
Table of Contents
Funds From Operations
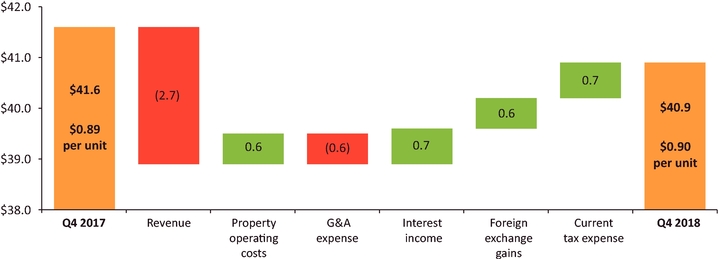
FFO for the three month period ended December 31, 2018 was $40.9 million ($0.90 per unit) compared to $41.6 million ($0.89 per unit) in the prior year period. The $0.7 million decrease in FFO is summarized below:
Q4 2018 vs Q4 2017 Change in FFO
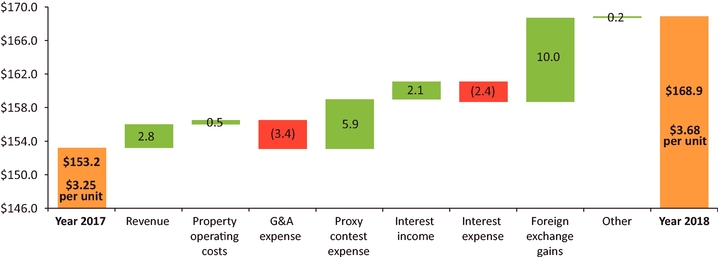
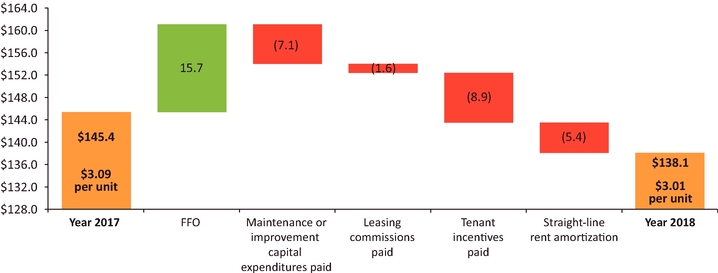
FFO for the year ended December 31, 2018 was $168.9 million ($3.68 per unit) compared to $153.2 million ($3.25 per unit) in the prior year. The $15.7 million ($0.43 per unit) increase in FFO is summarized below:
Year 2018 vs Year 2017 Change in FFO
Excluding the following items which can be a source of variance between periods: the lease termination and close-out fee of $1.0 million ($0.02 per unit) and the net foreign exchange gain on the remeasurement of US dollar cash proceeds from the sale of investment properties in January 2018 of $8.5 million ($0.19 per unit), FFO would have been $159.4 million ($3.47 per unit) in the year ended December 31, 2018. In comparison, excluding the proxy contest expense of $5.9 million ($0.12 per unit) and the lease termination and close-out fees of $1.6 million ($0.03 per unit), FFO would have been $157.5 million ($3.34 per unit) in the prior year.
Table of Contents
Adjusted Funds From Operations
As previously detailed in the FFO and AFFO reconciliation table, AFFO for the three month period ended December 31, 2018 was $39.8 million ($0.87 per unit) compared to $32.6 million ($0.69 per unit) in the prior year period. The $7.2 million ($0.18 per unit) increase in AFFO is summarized below:
Q4 2018 vs Q4 2017 Change in AFFO
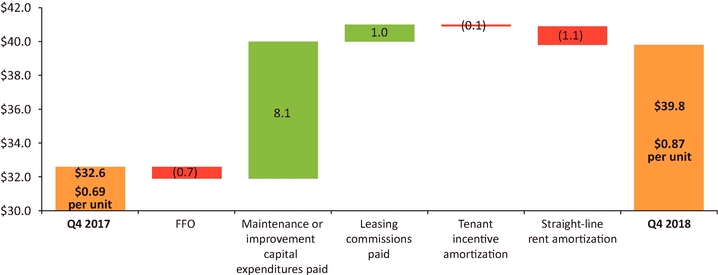
Additional details pertaining to the components of the change in AFFO are as follows:
- •
- the $0.7 million decrease in FFO, as noted previously;
- •
- an $8.1 million decrease in capital expenditures paid largely relating to an improvement project at the partially leased-up property in Novi, Michigan in the prior year period; and
- •
- a $1.0 million decrease in leasing commissions paid largely relating to the property in Novi, Michigan in the prior year period, as noted above, partially offset by;
- •
- a $0.1 million decrease in AFFO from tenant incentive amortization; and
- •
- a $1.1 million decrease in AFFO from straight-line rent amortization associated with the recent acquisitions in the United States and rent-free period for the re-leasing of a property in the Netherlands.
Table of Contents
AFFO for the year ended December 31, 2018 was $138.1 million ($3.01 per unit) compared to $145.4 million ($3.09 per unit) in the prior year. The $7.3 million ($0.08 per unit) decrease in AFFO is summarized below:
Year 2018 vs Year 2017 Change in AFFO
Additional details pertaining to the components of the change in AFFO are as follows:
- •
- the $15.7 million increase in FFO, as noted above, partially offset by;
- •
- a $7.1 million increase in capital expenditures paid largely relating to improvement projects at properties in Novi, Michigan and Olive Branch, Mississippi;
- •
- a $1.6 million increase in leasing commissions paid primarily relating to the re-leasing of the property in Olive Branch, Mississippi, the developed property in Poland, as well as lease renewals and extensions for two properties in the United States and Germany, partially offset by leasing commissions paid for the partially leased-up property in Novi, Michigan in the prior year;
- •
- a $8.9 million increase in tenant incentives paid in 2018 largely relating to a tenant allowance for a 2014 lease extension at the Eurostar facility in Graz, Austria; and
- •
- a $5.4 million decrease in AFFO from straight-line rent amortization, primarily from newly acquired properties in the United States and rent-free periods associated with the partial lease-up of vacant space in Novi, Michigan, the re-leasing of a property in the Netherlands and the early renewals and extensions of three leases in North America and Germany.
Excluding the following items which can be a source of variance between periods: lease termination and close-out fee of $1.0 million ($0.02 per unit) recognized in revenue, the net foreign exchange gain on the remeasurement of US dollar cash proceeds from the sale of investment properties in January 2018 of $8.5 million ($0.19 per unit) and the payment of the tenant incentive allowance made in connection with a 2014 lease extension at the Eurostar facility in Graz, Austria of $9.1 million ($0.19 per unit), AFFO would have been $137.7 million ($2.99 per unit) in the year ended December 31, 2018. In comparison, excluding the proxy contest expense of $5.9 million ($0.12 per unit) and lease termination and close-out fees of $1.6 million ($0.03 per unit), AFFO would have been $149.7 million ($3.18 per unit) in the prior year.
Table of Contents
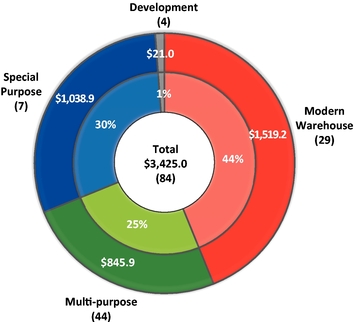
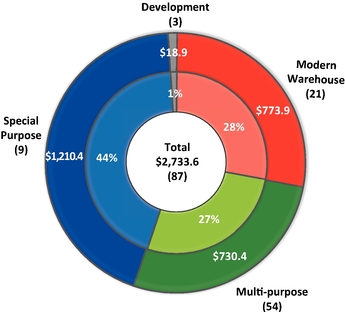
Granite's investment properties consist of income-producing properties, properties under development and land held for development. Substantially all of the income-producing properties are for industrial use and can be categorized as (i) modern logistics/distribution warehouse facilities ("modern warehouse facilities"), which were recently acquired or newly developed/redeveloped, (ii) multi-purpose facilities, which are tenantable by a wide variety of potential users or (iii) special purpose properties designed and built with specialized features and leased to Magna. The attributes of the income-producing properties are versatile and are based on the needs of the tenant such that an industrial property used by a certain tenant for light or heavy manufacturing can be used by another tenant for other industrial uses after some retrofitting if necessary. Accordingly, the investment property portfolio is substantially for industrial use and, as such, Granite determined that its asset class comprises industrial properties for purposes of financial reporting. The fair value of the industrial properties, as noted below, is based upon the current tenanting, existing use and attributes of such properties.
Properties under development comprise a 29 acre site located in Indiana, United States where Granite is planning to construct a 0.5 million square foot logistics-industrial property in 2019 and a 15 acre site in Altbach, Germany where Granite is demolishing the existing building and expects to begin construction of a 0.3 million square foot Class A distribution/light industrial facility later in 2019. Land held for development comprise a 16 acre parcel of land located in Wroclaw, Poland that could provide for approximately 0.3 million square feet of logistics-warehouse space as well as 12.9 acres of development land in Ohio, United States which was recently acquired.
Summary attributes of the investment properties at December 31, 2018 and 2017 were as follows:
Investment Properties Summary(1)
| | | | | | | |
| | | | | | |
As at December 31,
|
|
2018
|
|
2017
|
|
|---|
| | | | | | |
(in millions, except as noted) | | | | | |
Investment properties — fair value | | $ | 3,425.0 | | $ | 2,733.6 | |
Income-producing properties | | 3,404.0 | | 2,714.7 | |
Properties under development | | 17.0 | | — | |
Land held for development | | 4.0 | | 18.9 | |
Overall capitalization rate | | 6.7% | | 7.6% | |
Number of investment properties | |
84 | |
87 | |
Income-producing properties | | 80 | | 84 | |
Properties under development | | 2 | | — | |
Land held for development | | 2 | | 3 | |
Property metrics | |
| |
| |
GLA, square feet | | 32.2 | | 29.1 | |
Occupancy, by GLA | | 99.1% | | 98.4% | |
Weighted average lease term, in years by square footage | | 6.0 | | 5.9 | |
Total number of tenants | | 48 | | 40 | |
Magna as a percentage of annualized revenue(2) | | 54% | | 71% | |
Magna as a percentage of GLA | | 47% | | 61% | |
| | | | | | |
Table of Contents
| | | | | | | |
| | | | | | |
As at December 31,
|
|
2018
|
|
2017
|
|
|---|
| | | | | | |
(in millions, except as noted) | | | | | |
Assets held for sale | | | | | |
Fair value | | $ | 44.2 | | $ | 391.4 | |
Number of properties | | 6 | | 10 | |
GLA, square feet | | 0.7 | | 3.2 | |
Magna as a percentage of GLA | | 94% | | 95% | |
Annualized revenue(2) | | $ | 2.2 | | $ | 25.6 | |
| | | | | | |
- (1)
- Assets held for sale are excluded from investment properties and related property metrics. Accordingly, six such assets that were held for sale at December 31, 2018 (subsequently sold) and 10 such assets that were held for sale at December 31, 2017 were excluded from investment properties and related property metrics at December 31, 2018 and December 31, 2017, respectively, throughout this MD&A.
- (2)
- Annualized revenue for each period presented is calculated as rental revenue excluding tenant recoveries, recognized in accordance with IFRS, in the month of December multiplied by twelve months.
The fair value of the investment properties by asset category as at December 31, 2018 and 2017 was as follows:
Fair Value of Investment Properties by Asset Category(1)
| | |
December 31, 2018
 | | December 31, 2017
 |
- (1)
- Number of properties denoted in parentheses
Table of Contents
Granite has a specialized and high quality global portfolio of large scale properties strategically located in Canada, the United States and Europe. The fair value of the investment properties by country as at December 31, 2018 and 2017 was as follows:
Fair Value of Investment Properties by Geography(1)
| | |
December 31, 2018
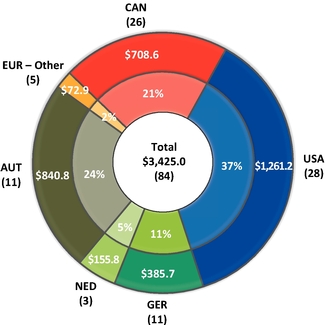 | | December 31, 2017
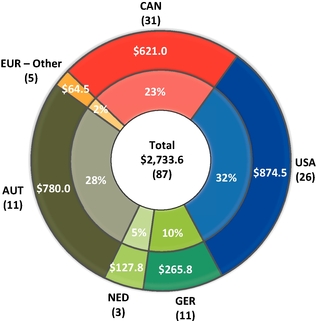 |
- (1)
- Number of properties denoted in parentheses
The change in the fair value of investment properties by asset category during the year ended December 31, 2018 was as follows:
Change in Fair Value of Investment Properties by Asset Category
| | | | | | | | | | | | | | | | | | | | | | | | | | | | | | | | | | | | | |
| | | | | | | | | | | | | | | | | | | | |
| | January 1,
2018
| | Fair value
gains
| | Acquisitions
| | Capital
expenditures
| | Foreign
exchange
gains
| | Transfers
| | Other
changes
| | Classified as
assets held
for sale
| | December 31,
2018
| |
|---|
| | | | | | | | | | | | | | | | | | | | |
Modern warehouse facilities | | | $ | 773.9 | | | 85.8 | | | 543.0 | | | 24.8 | | | 85.1 | | | — | | | 6.6 | | | — | | | $ | 1,519.2 | |
Multi-purpose facilities | | | 730.4 | | | 204.4 | | | — | | | 3.3 | | | 21.8 | | | (12.2 | ) | | — | | | (101.8 | ) | | 845.9 | |
Special purpose properties | | | 1,210.4 | | | 63.1 | | | — | | | — | | | 40.4 | | | — | | | (4.5 | ) | | (270.5 | ) | | 1,038.9 | |
| | | | | | | | | | | | | | | | | | | | |
Income-Producing Properties | | | 2,714.7 | | | 353.3 | | | 543.0 | | | 28.1 | | | 147.3 | | | (12.2 | ) | | 2.1 | | | (372.3 | ) | | 3,404.0 | |
Properties Under Development | | | — | | | — | | | — | | | 0.3 | | | 0.3 | | | 16.4 | | | — | | | — | | | 17.0 | |
Land Held For Development | | | 18.9 | | | 1.2 | | | 1.2 | | | 0.1 | | | 0.2 | | | (4.2 | ) | | — | | | (13.4 | ) | | 4.0 | |
| | | | | | | | | | | | | | | | | | | | |
| | | $ | 2,733.6 | | | $ | 354.5 | | | $ | 544.2 | | | $ | 28.5 | | | $ | 147.8 | | | — | | | $ | 2.1 | | | $ | (385.7 | ) | | $ | 3,425.0 | |
| | | | | | | | | | | | | | | | | | | | |
Table of Contents
During the year ended December 31, 2018, the fair value of investment properties increased by $691.4 million, primarily due to:
- •
- net fair value gains of $354.5 million which were largely attributable to i) an increase in fair value to the sale price for the multi-purpose and special purpose properties sold in 2018 or in 2019, ii) for properties across the modern warehouse, multi-purpose and special purpose asset categories, a compression in discount and terminal capitalization rates and an increase in market rents resulting from a greater market demand for industrial real estate properties and, to a lesser extent, iii) positive changes in leasing assumptions primarily from contractual rent increase, new leases and lease renewals;
- •
- the acquisitions of seven income-producing properties in the United States and one property in Germany for $544.2 million consisting of a portfolio of four properties near Columbus, Ohio for $299.3 million, one property in Greencastle, Pennsylvania for $44.3 million, one property in Plainfield, Indiana for $50.8 million, one property in Shepherdsville, Kentucky for $65.9 million and one property in Erfurt, Germany for $82.7 million, as well as the purchase of 12.9 acres of development land in West Jefferson, Ohio for $1.2 million (see "SIGNIFICANT MATTERS");
- •
- capital expenditures of $28.5 million, of which $19.9 million related to the construction of a 0.3 million square foot expansion at an acquired property near Columbus, Ohio, and the remaining largely related to maintenance or improvement capital expenditures including $4.2 million for a modern warehouse property located in Mississippi, United States, which was acquired in October 2017 and re-leased to another tenant, and $2.7 million for a multi-purpose property located in Michigan, United States, which was leased to a tenant for part of the space during the third quarter of 2017. Capital expenditures can include expansion or development expenditures and maintenance or improvement expenditures. Expansion or development capital expenditures are discretionary in nature and are incurred to generate new revenue streams and/or increase the productivity of a property. Maintenance or improvement capital expenditures relate to sustaining the existing earnings capacity of a property;
- •
- foreign exchange gains of $147.8 million, which primarily included foreign exchange gains of $98.2 million and $49.1 million resulting from the relative weakening of the Canadian dollar against the US dollar and the Euro, respectively; and
- •
- the classification of 12 properties valued at $385.7 million as assets held for sale, six of which were sold during the second half of the year. The remaining six properties are classified as assets held for sale on the combined balance sheet and excluded from the investment properties categorization (see "SIGNIFICANT MATTERS"). The remaining six properties were sold during January and February 2019.
Fair values were primarily determined by discounting the expected future cash flows, generally over a term of 10 years, plus a terminal value based on the application of a capitalization rate to estimated year 11 cash flows. Granite measures its investment properties using valuations prepared by management. Granite does not measure its investment properties based on valuations prepared by external appraisers but uses such external appraisals as data points, together with other external market information accumulated by management, in arriving at its own conclusions on values. Management uses valuation assumptions such as discount rates, terminal capitalization rates and market rental rates applied in external appraisals or sourced from valuation experts; however, the Trust also uses its historical renewal experience with tenants, its direct knowledge of the specialized nature of Granite's portfolio and tenant profile and its knowledge of the actual condition of the properties in making business judgments about lease renewal probabilities, renewal rents and capital expenditures. There has been no change in the valuation methodology used during the year ended December 31, 2018. The key valuation metrics for Granite's investment properties including the discount and terminal capitalization rates by jurisdiction are summarized in note 4 to the audited combined
Table of Contents
financial statements for the year ended December 31, 2018. In addition, valuation metrics for Granite's income-producing properties (excluding assets held for sale) by asset category as at December 31, 2018 and 2017 were as follows:
Valuation Metrics by Income-Producing Property Asset Category
| | | | | | | | | | | | | | | | | | | | | | | | | |
| | | | | | | | | | | | | | | | | | |
| | Modern
warehouse
facilities | | Multi-purpose
facilities | | Special
purpose
properties | | Total | |
|---|
As at December 31,
| | 2018
| | 2017
| | 2018
| | 2017
| | 2018
| | 2017
| | 2018
| | 2017
| |
|---|
| | | | | | | | | | | | | | | | | | |
Overall capitalization rate(1)(2) | | 5.66% | | 6.18% | | 7.06% | | 8.84% | | 7.77% | | 7.77% | | 6.65% | | 7.60% | |
Terminal capitalization rate(1) | | 6.25% | | 6.49% | | 6.95% | | 7.49% | | 7.50% | | 8.11% | | 6.81% | | 7.48% | |
Discount rate(1) | | 6.34% | | 6.98% | | 7.02% | | 8.04% | | 7.63% | | 7.72% | | 6.90% | | 7.59% | |
| | | | | | | | | | | | | | | | | | |
- (1)
- Weighted based on income-producing property fair value.
- (2)
- Overall capitalization rate is calculated as stabilized net operating income (property revenue less property expenses) divided by the fair value of the property.
The compression in overall capitalization rates, terminal capitalization rates and discount rates across Granite's portfolio at December 31, 2018 in comparison to the prior year was primarily attributable to a greater market demand for industrial real estate and, to a lesser extent, positive changes in leasing assumptions related to new leases and lease renewals. In addition, as a result of the acquisitions and dispositions during 2018, the composition of Granite's property portfolio has shifted to a greater number of modern warehouse facilities which have lower capitalization rates and fewer special purpose and multi-purpose properties which generally have higher capitalization rates.
A sensitivity analysis of the fair value of income-producing properties to changes in the overall capitalization rate, terminal capitalization rate and discount rate at December 31, 2018 is presented below:
Sensitivity Analysis of Fair Value of Income-Producing Properties
| | | | | | | | | | | | | |
| | | | | | | | |
Rate sensitivity
| | Overall capitalization rate
| | Terminal capitalization rate
| | Discount rate
| |
|---|
| | | | | | | | |
+50 bps | | | 3,154.6 | | | 3,273.2 | | | 3,278.7 | |
+25 bps | | | 3,274.3 | | | 3,335.7 | | | 3,340.1 | |
| | | | | | | | |
Base rate | | | $ | 3,404.0 | | | $ | 3,404.0 | | | $ | 3,404.0 | |
| | | | | | | | |
-25 bps | | | 3,545.1 | | | 3,475.8 | | | 3,467.5 | |
-50 bps | | | 3,699.2 | | | 3,554.8 | | | 3,533.7 | |
| | | | | | | | |
Maintenance or Improvement Capital Expenditures and Leasing Costs
As defined previously in the change in fair value of investment properties by asset category, maintenance or improvement capital expenditures relate to sustaining the existing earnings capacity of the property portfolio.
Leasing costs include direct leasing costs and lease incentives. Direct leasing costs include broker commissions incurred in negotiating and arranging tenant leases. Lease incentives include the cost of leasehold improvements to tenant spaces and/or cash allowances provided to tenants for leasehold improvement costs.
Table of Contents
Maintenance or Improvement Capital Expenditures and Leasing Costs Payments
The maintenance or improvement capital expenditures and leasing costs paid by quarter and for the years ended December 31, 2018 and 2017 were as follows:
Maintenance or Improvement Capital Expenditures and Leasing Costs Paid
| | | | | | | | | | | | | | | | | | | | | | | | | | | | | | | | | | | | | | | | | | | |
| | | | | | | | | | | | | | | | | | | | | | | | |
| |
| | Q1'17
| | Q2'17
| | Q3'17
| | Q4'17
| | 2017
Total
| | Q1'18
| | Q2'18
| | Q3'18
| | Q4'18
| | 2018
Total
| |
|---|
| | | | | | | | | | | | | | | | | | | | | | | | |
Maintenance or improvement capital expenditures paid | | | | | $ | 0.6 | | | $ | 0.3 | | | $ | 0.6 | | | $ | 9.3 | | | $ | 10.8 | | | $ | 8.8 | | | $ | 6.2 | | | $ | 1.6 | | | $ | 1.2 | | | $ | 17.8 | |
Leasing costs paid | | | | | 0.3 | | | 0.3 | | | 1.6 | | | 1.4 | | | 3.6 | | | 10.8 | | | 2.4 | | | 0.5 | | | 0.4 | | | 14.1 | |
| | | | | | | | | | | | | | | | | | | | | | | | |
Total paid | | [A] | | | $ | 0.9 | | | $ | 0.6 | | | $ | 2.2 | | | $ | 10.7 | | | $ | 14.4 | | | $ | 19.6 | | | $ | 8.6 | | | $ | 2.1 | | | $ | 1.6 | | | $ | 31.9 | |
GLA, square feet | | [B] | | | 30.1 | | | 30.2 | | | 30.2 | | | 29.1 | | | N/A | | | 29.7 | | | 31.8 | | | 32.5 | | | 32.2 | | | N/A | |
$ paid per square feet | | [A]/[B] | | | $ | 0.03 | | | $ | 0.02 | | | $ | 0.07 | | | $ | 0.37 | | | $ | 0.49 | | | $ | 0.66 | | | $ | 0.27 | | | $ | 0.06 | | | $ | 0.05 | | | $ | 1.04 | |
| | | | | | | | | | | | | | | | | | | | | | | | |
In the first quarter of 2018, Granite paid $9.1 million related to a tenant incentive allowance for a 2014 lease extension at the 1.1 million square foot Eurostar facility in Graz, Austria.
Commencing with the third quarter of 2017, Granite undertook to re-develop its Novi, MI property which was vacated by Magna in March 2017. Granite leased 71% of the space to Hanon Systems for a minimum lease term of 15 years commencing in January 2018. The 0.3 million square foot facility is one of the very few office properties in Granite's portfolio.
Granite has invested a total of $22.7 million in capital during 2017 and 2018 to reposition and lease the Novi, MI flex office property. The following is a summary of the capital expenditures and leasing costs paid by quarter in connection with the Novi, MI property:
Novi, MI Property: Maintenance or Improvement Capital Expenditures and Leasing Costs Paid
| | | | | | | | | | | | | | | | | | | | | | | | | | | | | | | | | | | | | | | | | |
| | | | | | | | | | | | | | | | | | | | | | |
| | Q1'17
| | Q2'17
| | Q3'17
| | Q4'17
| | 2017
Total
| | Q1'18
| | Q2'18
| | Q3'18
| | Q4'18
| | 2018
Total
| |
|---|
| | | | | | | | | | | | | | | | | | | | | | |
Maintenance or improvement capital expenditures paid | | | — | | | — | | | $ | 0.1 | | | $ | 8.0 | | | $ | 8.1 | | | $ | 8.4 | | | $ | 3.2 | | | $ | 0.1 | | | $ | 0.5 | | | $ | 12.2 | |
Leasing costs paid | | | — | | | — | | | 1.2 | | | 1.0 | | | 2.2 | | | 0.2 | | | — | | | — | | | — | | | 0.2 | |
| | | | | | | | | | | | | | | | | | | | | | |
Total paid | | | — | | | — | | | $ | 1.3 | | | $ | 9.0 | | | $ | 10.3 | | | $ | 8.6 | | | $ | 3.2 | | | $ | 0.1 | | | $ | 0.5 | | | $ | 12.4 | |
| | | | | | | | | | | | | | | | | | | | | | |
Granite is actively marketing the remaining 0.1 million square feet of available space and anticipates incurring additional cash outflows totaling approximately $6.6 million in capital expenditures and leasing costs during 2019 to complete the Novi, MI facility and lease-up of the remaining available space.
Table of Contents
Excluding the non-recurring or unusual items noted above for the Graz, Austria and Novi, MI properties, the maintenance or improvement capital expenditures and leasing costs paid by quarter and for the years ended December 31, 2018 and 2017 were as follows:
Maintenance or Improvement Capital Expenditures and Leasing Costs Paid —
Excluding Novi, MI and Graz, Austria
| | | | | | | | | | | | | | | | | | | | | | | | | | | | | | | | | | | | | | | | | | | |
| | | | | | | | | | | | | | | | | | | | | | | | |
| |
| | Q1'17
| | Q2'17
| | Q3'17
| | Q4'17
| | 2017
Total
| | Q1'18
| | Q2'18
| | Q3'18
| | Q4'18
| | 2018
Total
| |
|---|
| | | | | | | | | | | | | | | | | | | | | | | | |
Maintenance or improvement capital expenditures paid | | | | | $ | 0.6 | | | $ | 0.3 | | | $ | 0.5 | | | $ | 1.3 | | | $ | 2.7 | | | $ | 0.4 | | | $ | 3.0 | | | $ | 1.5 | | | $ | 0.7 | | | $ | 5.6 | |
Leasing costs paid | | | | | 0.3 | | | 0.3 | | | 0.4 | | | 0.4 | | | 1.4 | | | 1.5 | | | 2.4 | | | 0.5 | | | 0.4 | | | 4.8 | |
| | | | | | | | | | | | | | | | | | | | | | | | |
Total paid | | [C] | | | $ | 0.9 | | | $ | 0.6 | | | $ | 0.9 | | | $ | 1.7 | | | $ | 4.1 | | | $ | 1.9 | | | $ | 5.4 | | | $ | 2.0 | | | $ | 1.1 | | | $ | 10.4 | |
GLA, square feet | | [D] | | | 30.1 | | | 30.2 | | | 29.9 | | | 28.8 | | | N/A | | | 29.4 | | | 31.5 | | | 32.2 | | | 31.9 | | | N/A | |
$ paid per square feet | | [C]/[D] | | | $ | 0.03 | | | $ | 0.02 | | | $ | 0.03 | | | $ | 0.06 | | | $ | 0.14 | | | $ | 0.06 | | | $ | 0.17 | | | $ | 0.06 | | | $ | 0.03 | | | $ | 0.32 | |
| | | | | | | | | | | | | | | | | | | | | | | | |
Leasing Profile
Magna, Granite's Largest Tenant
At December 31, 2018, Magna International Inc. or one of its operating subsidiaries was the tenant at 41 (December 31, 2017 — 52) of Granite's income-producing properties and comprised 54% (December 31, 2017 — 71%) of Granite's annualized revenue and 47% (December 2017 — 61%) of Granite's GLA. According to its public disclosure, Magna International Inc. has a credit rating of A3 with a stable outlook by Moody's Investor Service, A- with a stable outlook by Standard & Poor's and A(low) with a stable outlook by DBRS Limited. Magna International Inc. is a technology company and one of the world's largest automotive suppliers with international manufacturing operations and product development, engineering and sales centres. Its capabilities include body exteriors and structures, power and vision technologies, seating systems and complete vehicle solutions.
Granite's relationship with Magna is an arm's length landlord and tenant relationship governed by the terms of Granite's leases. Granite's properties are generally leased to operating subsidiaries of Magna International Inc. and are not guaranteed by the parent company; however, Magna International Inc. is the tenant under certain of Granite's leases. The terms of the lease arrangements with Magna generally provide for the following:
- •
- the obligation of Magna to pay for costs of occupancy, including operating costs, property taxes and maintenance and repair costs;
- •
- rent escalations based on either fixed-rate steps or inflation;
- •
- renewal options tied to market rental rates or inflation;
- •
- environmental indemnities from the tenant; and
- •
- a right of first refusal in favour of Magna on the sale of a property.
Renewal terms, rates and conditions are typically set out in Granite's leases with Magna and form the basis for tenancies that continue beyond the expiries of the initial lease terms.
According to its public disclosure, Magna's success is primarily dependent upon the levels of North American, European and Chinese car and light truck production by Magna's customers and the relative
Table of Contents
amount of content Magna has in the various programs. Granite expects Magna to continuously seek to optimize its global manufacturing footprint and consequently, Magna may or may not renew leases for facilities currently under lease at their expiries.
Other Tenants
In addition to Magna, at December 31, 2018, Granite had 47 other tenants from various industries which in aggregate comprised 46% of the Trust's annualized revenue. These tenants each accounted for less than 4% of the Trust's annualized revenue as at December 31, 2018.
Granite's top 10 tenants by annualized revenue at December 31, 2018 are summarized in the table below:
| | | | | | | | |
| | | | | | | | | |
Tenant
| | Annualized Revenue %
| | GLA %
| | WALT (years)
| | Credit Rating(1)(2)
|
|---|
| | | | | | | | | |
Magna | | 54% | | 47% | | 5.9 | | A(low) |
Restoration Hardware | | 3% | | 4% | | 9.3 | | NR |
Ingram Micro | | 3% | | 3% | | 6.0 | | BBB(low) |
Mars Petcare | | 3% | | 4% | | 3.3 | | NR |
Hanon Systems | | 2% | | 1% | | 14.1 | | AA |
Ricoh | | 2% | | 2% | | 6.5 | | BBB(high) |
Grupo Antolin | | 2% | | 3% | | 9.7 | | B(high) |
Samsung | | 2% | | 2% | | 3.2 | | AA(low) |
Torrid | | 2% | | 2% | | 6.7 | | NR |
LGI | | 2% | | 2% | | 4.2 | | NR |
| | | | | | | | | |
Top 10 Tenants | | 75% | | 70% | | 6.1 | | |
| | | | | | | | | |
- (1)
- Credit rating is quoted on the DBRS equivalent rating scale where publicly available. NR refers to Not Rated.
- (2)
- The credit rating indicated above may, in some instances, apply to an affiliated company of Granite's tenant.
Table of Contents
Lease Expiration
As at December 31, 2018, Granite's portfolio had a weighted average lease term by square footage of 6.0 years (December 31, 2017 — 5.9 years) with lease expiries by GLA (in thousands of square feet), lease count and annualized revenue (calculated as rental revenue excluding tenant recoveries, recognized in accordance with IFRS, in December 2018 multiplied by twelve months, in millions) as set out in the table below:
| | | | |
| | | | | |
| |
Lease Maturity Summary
|
| |
| | | | | |
| | | | | | | | | | | | | | | | | | | | | | | | | | | | | | | | | | | | | | | | | | | | | | | | | | | | | | | | | | | | | | | | | | | | | | | | | | | | | |
| | | | | | | | | | | | | | | | | | | | | | | | | | | | | | | | | | | | | | |
| |
| |
| |
| | Vacancies | | 2019 | | 2020 | | 2021 | | 2022 | | 2023 | | 2024 | | 2025 and Beyond | |
|---|
| |
| | Total
Lease
Count
| | Total
Annualized
Revenue $
| |
|---|
Country
| | Total
GLA
| | Sq Ft
| | Sq Ft
| | Annualized
Revenue $
| | Sq Ft
| | Annualized
Revenue $
| | Sq Ft
| | Annualized
Revenue $
| | Sq Ft
| | Annualized
Revenue $
| | Sq Ft
| | Annualized
Revenue $
| | Sq Ft
| | Annualized
Revenue $
| | Sq Ft
| | Annualized
Revenue $
| |
|---|
| | | | | | | | | | | | | | | | | | | | | | | | | | | | | | | | | | | | | | |
Canada | | 5,260 | | | 25 | | | | 39.7 | | | | 190 | | | | 85 | | | | 0.7 | | | 843 | | | 6.0 | | | 316 | | | 2.9 | | | 639 | | | 4.4 | | | 594 | | | 3.0 | | | 389 | | | 2.6 | | | 2,204 | | | 20.1 | | |
United States | | 13,907 | | | 40 | | | | 76.2 | | | | 135 | | | | 817 | | | | 4.4 | | | 1,091 | | | 6.2 | | | 87 | | | 0.7 | | | 2,903 | | | 13.5 | | | 2,010 | | | 10.0 | | | 1,434 | | | 8.0 | | | 5,430 | | | 33.4 | | |
Austria | | 8,101 | | | 12 | | | | 63.8 | | | | — | | | | — | | | | — | | | 101 | | | 0.6 | | | 389 | | | 2.7 | | | 802 | | | 9.7 | | | 125 | | | 1.2 | | | 5,349 | | | 38.8 | | | 1,335 | | | 10.8 | | |
Germany | | 3,504 | | | 11 | | | | 24.4 | | | | — | | | | — | | | | — | | | 195 | | | 0.7 | | | 548 | | | 3.7 | | | 283 | | | 2.3 | | | 1,947 | | | 14.3 | | | — | | | — | | | 531 | | | 3.4 | | |
Netherlands | | 1,441 | | | 3 | | | | 9.6 | | | | — | | | | — | | | | — | | | — | | | — | | | — | | | — | | | — | | | — | | | 314 | | | 2.2 | | | — | | | — | | | 1,127 | | | 7.4 | | |
Other | | 751 | | | 8 | | | | 5.6 | | | | — | | | | 45 | | | | 0.2 | | | 133 | | | 0.6 | | | 336 | | | 3.2 | | | 56 | | | 0.4 | | | 90 | | | 0.8 | | | 91 | | | 0.4 | | | — | | | — | | |
| | | | | | | | | | | | | | | | | | | | | | | | | | | | | | | | | | | | | | |
Total | | 32,964 | | | 99 | | | | 219.3 | | | | 325 | | | | 947 | | | | 5.3 | | | 2,363 | | | 14.1 | | | 1,676 | | | 13.2 | | | 4,683 | | | 30.3 | | | 5,080 | | | 31.5 | | | 7,263 | | | 49.8 | | | 10,627 | | | 75.1 | | |
| | | | | | | | | | | | | | | | | | | | | | | | | | | | | | | | | | | | | | |
Less: Properties classified as assets held for sale | | |
| | |
| | |
| | |
| | |
| | |
| | |
| | |
Canada | |
(45 |
) | |
— | | | |
— | | | |
(45 |
) |
| |
— | | | |
— | | |
— | | |
— | | |
— | | |
— | | |
— | | |
— | | |
— | | |
— | | |
— | | |
— | | |
— | | |
— | | |
United States | | (683 | ) | | (4 | ) | | | (2.2 | ) | | | — | | | | — | | | | — | | | — | | | — | | | — | | | — | | | (311 | ) | | (0.9 | ) | | — | | | — | | | — | | | — | | | (372 | ) | | (1.3 | ) | |
| | | | | | | | | | | | | | | | | | | | | | | | | | | | | | | | | | | | | | |
As at December 31, 2018 | | 32,236 | | | 95 | | | | 217.1 | | | | 280 | | | | 947 | | | | 5.3 | | | 2,363 | | | 14.1 | | | 1,676 | | | 13.2 | | | 4,372 | | | 29.4 | | | 5,080 | | | 31.5 | | | 7,263 | | | 49.8 | | | 10,255 | | | 73.8 | | |
| | | | | | | | | | | | | | | | | | | | | | | | | | | | | | | | | | | | | | |
% of portfolio as at December 31, 2018: | | |
| | |
| | |
| | |
| | |
| | |
| | |
| | |
* by sq ft | |
100% | | | | | | | | | | |
0.9% | | | |
2.9% | | | | | | |
7.3% | | | | | |
5.2% | | | | | |
13.6% | | | | | |
15.8% | | | | | |
22.5% | | | | | |
31.8% | | | | | |
* by Annualized Revenue | | | | | | | | | 100% | | | | | | | | | | | | 2.4% | | | | | | 6.5% | | | | | | 6.1% | | | | | | 13.6% | | | | | | 14.5% | | | | | | 22.9% | | | | | | 34.0% | | |
| | | | | | | | | | | | | | | | | | | | | | | | | | | | | | | | | | | | | | |
Leasing and acquisition activities between January 1, 2019 and March 6, 2019: | | |
| | |
| | |
| | |
| | |
| | |
| | |
| | |
As at December 31, 2018 | |
32,236 | | |
95 | | | |
217.1 | | | |
280 | | | |
947 | | | |
5.3 | | |
2,363 | | |
14.1 | | |
1,676 | | |
13.2 | | |
4,372 | | |
29.4 | | |
5,080 | | |
31.5 | | |
7,263 | | |
49.8 | | |
10,255 | | |
73.8 | | |
Acquisition of two Texas properties(1) (acquired March 1, 2019) | | |
| | |
| | |
| | |
| | |
| | |
| | |
| | |
— United States | |
1,019 | | |
2 | | | |
10.9 | | | |
— | | | |
— | | | |
— | | |
— | | |
— | | |
— | | |
— | | |
— | | |
— | | |
— | | |
— | | |
— | | |
— | | |
1,019 | | |
10.9 | | |
Expansion of Columbus, Ohio property(1) | | |
| | |
| | |
| | |
| | |
| | |
| | |
| | |
— United States | |
308 | | |
— | | | |
1.4 | | | |
— | | | |
— | | | |
— | | |
— | | |
— | | |
— | | |
— | | |
— | | |
— | | |
— | | |
— | | |
— | | |
— | | |
308 | | |
1.4 | | |
Renewals, Extensions and Vacancies | | |
| | |
| | |
| | |
| | |
| | |
| | |
| | |
— Canada | |
— | | |
— | | | |
— | | | |
— | | | |
— | | | |
— | | |
(253 |
) | |
(2.6 |
) |
|
— | | |
— | | |
(292 |
) | |
(1.6 |
) |
|
— | | |
— | | |
545 | | |
4.2 | | |
— | | |
— | | |
— United States | |
— | | |
(1 |
) |
| |
(0.8 |
) |
| |
107 | | | |
(107 |
) |
| |
(0.8 |
) |
|
— | | |
— | | |
— | | |
— | | |
— | | |
— | | |
— | | |
— | | |
— | | |
— | | |
— | | |
— | | |
| | | | | | | | | | | | | | | | | | | | | | | | | | | | | | | | | | | | | | |
Total | | 33,563 | | | 96 | | | | 228.6 | | | | 387 | | | | 840 | | | | 4.5 | | | 2,110 | | | 11.5 | | | 1,676 | | | 13.2 | | | 4,080 | | | 27.8 | | | 5,080 | | | 31.5 | | | 7,808 | | | 54.0 | | | 11,582 | | | 86.1 | | |
| | | | | | | | | | | | | | | | | | | | | | | | | | | | | | | | | | | | | | |
(1)The annualized revenue for the acquisition and expansion represents the pro-forma revenue expected over a twelve month period.
Table of Contents
LIQUIDITY AND CAPITAL RESOURCES |
Liquidity
Granite has various sources of available liquidity including cash, cash equivalents and the unused portion of its unsecured credit facility that aggregated to $1,158.1 million as at December 31, 2018 compared to $286.2 million at December 31, 2017, as summarized below:
Sources of Available Liquidity
| | | | | | | |
| | | | | | |
As at December 31,
| | 2018
| | 2017
| |
|---|
| | | | | | |
Cash and cash equivalents | | $ | 658.2 | | $ | 69.0 | |
Unused portion of credit facility(1) | | 499.9 | | 217.2 | |
| | | | | | |
Available liquidity | | $ | 1,158.1 | | $ | 286.2 | |
| | | | | | |
Assets held for sale(2) | | $ | 44.2 | | $ | 391.4 | |
| | | | | | |
Unencumbered assets(3) | | $ | 3,425.0 | | $ | 2,733.6 | |
| | | | | | |
- (1)
- In February 2018, Granite entered into a new five-year $500.0 million credit facility thereby increasing its borrowing capacity by $250.0 million. See "Debt Structure — Credit Facility".
- (2)
- Six properties located in Canada and the United States were classified as assets held for sale on the combined financial statements at December 31, 2018 and were subsequently sold during January and February 2019. Ten properties located in Canada and the United States were classified as assets held for sale at December 31, 2017 and were subsequently sold in January 2018.
- (3)
- Unencumbered assets represent the carrying value of investment properties (excluding any assets held for sale) that are not encumbered by secured debt. Granite can seek to obtain secured financing against its unencumbered assets subject to certain restrictions and financial covenant limitations in its credit facility and term loan agreements as well as trust indentures.
The increase in available liquidity is due to cash proceeds realized from property dispositions and drawdowns on the terms loans completed in December 2018. Additional sources of liquidity available to Granite include cash flow generated from operations, asset sales and, if necessary, financing that may be obtained on its unencumbered assets.
Management believes that the Trust's cash resources, cash flow from operations and available third-party borrowings will be sufficient to finance its operations and capital expenditures program over the next year as well as to pay distributions. Granite expects to fund its ongoing operations and future growth through the use of (i) existing cash and cash equivalents, (ii) cash flow from operating activities, (iii) cash flows from asset sales, (iv) short-term financing available from the credit facility and/or (v) the issuance of unsecured debentures or equity, subject to market conditions.
Table of Contents
Cash Flow Components
Components of the Trust's cash flows were as follows:
Cash Flow Components Summary
| | | | | | | | | | | | | | | | | | | | | |
| | | | | | | | | | | | | | |
| | Three Months Ended
December 31, | |
| | Years Ended
December 31, | |
| |
|---|
| | 2018
| | 2017
| | $ change
| | 2018
| | 2017
| | $ change
| |
|---|
| | | | | | | | | | | | | | |
Cash and cash equivalents, beginning of period | | $ | 192.7 | | | $ | 190.9 | | | 1.8 | | $ | 69.0 | | $ | 246.2 | | (177.2 | ) |
Cash provided by operating activities | | 34.7 | | | 38.2 | | | (3.5 | ) | 157.9 | | 158.7 | | (0.8 | ) |
Cash provided by (used in) investing activities | | (86.3 | ) | | (157.0 | ) | | 70.7 | | 95.8 | | (237.9 | ) | 333.7 | |
Cash provided by (used in) financing activities | | 506.8 | | | (6.6 | ) | | 513.4 | | 324.2 | | (105.2 | ) | 429.4 | |
Effect of exchange rate changes on cash and cash equivalents | | 10.3 | | | 3.5 | | | 6.8 | | 11.3 | | 7.2 | | 4.1 | |
| | | | | | | | | | | | | | |
Cash and cash equivalents, end of period | | $ | 658.2 | | | $ | 69.0 | | | 589.2 | | $ | 658.2 | | $ | 69.0 | | 589.2 | |
| | | | | | | | | | | | | | |
Operating Activities
In the three month period ended December 31, 2018, operating activities generated cash of $34.7 million compared to $38.2 million in the prior year period. The decrease of $3.5 million was due to various factors including, among others, an increase in income taxes paid of $2.0 million primarily related to increased tax instalments.
In the year ended December 31, 2018, operating activities generated cash of $157.9 million compared to $158.7 million in the prior year. The decrease of $0.8 million was due to various factors including, among other, the following:
- •
- an increase in tenant incentives paid of $8.9 million which substantially related to a $9.1 million payment in 2018 associated with a 2014 lease extension at the Eurostar facility in Graz, Austria;
- •
- an increase in income taxes paid of $6.8 million primarily relating to increased tax instalments and the receipt of an income tax refund in the prior year;
- •
- an increase in interest paid of $3.4 million related to increased credit facility draws throughout the year and higher standby fees for the credit facility; and
- •
- an increase in leasing commissions paid of $1.6 million, partially offset by;
- •
- an increase in cash provided by working capital changes of $11.4 million primarily due to an increase in accounts payable and accrued liabilities largely related to the land transfer tax for the property acquired in Germany, an obligation to make certain repairs in connection with a property disposed of in the United States and unit-based compensation payments made in the prior year to former directors/trustees; and
Table of Contents
- •
- an increase in net realized foreign exchange gains of $10.0 million primarily due to the remeasurement of the US dollar proceeds received from the sale of investment properties in January 2018.
Investing Activities
Investing activities for the three month period ended December 31, 2018 used cash of $86.3 million and primarily related to the following:
- •
- the acquisition of an income-producing property in Shepherdsville, Kentucky for $65.9 million;
- •
- the purchase of 12.9 acres of development land in West Jefferson, Ohio for $1.2 million;
- •
- investment property expansion capital expenditures paid of $14.5 million substantially relating to the construction of a 0.3 million square foot expansion at an acquired property near Columbus, Ohio, and maintenance and improvement capital expenditures paid of $1.2 million largely relating to improvement projects at a property in Novi, Michigan and a multi-tenanted property in Pooler, Georgia; and
- •
- a $7.0 million deposit to acquire the leasehold interest in two income-producing properties located in Mississauga, Ontario for total consideration of $154.0 million. This commitment to purchase is subject to customary closing conditions and the consent of the ground lessor. These cash outflows are partially offset by;
- •
- net proceeds of $3.5 million received from the disposition of a property in Germany.
Investing activities for the three month period ended December 31, 2017 used cash of $157.0 million and primarily related to the remaining balance paid for the acquisition of three income-producing properties in the United States of $146.7 million.
Investing activities for the year ended December 31, 2018 generated cash of $95.8 million and primarily related to the following:
- •
- net proceeds of $681.3 million received from the disposition of 16 income-producing properties in Canada, the United States and Germany. The property dispositions in South Carolina and Tennessee have remaining proceeds of $11.8 million (US$8.7 million) and $0.2 million (US$0.2 million) that are expected to be received in the first quarters of 2020 and 2019, respectively; and
- •
- the receipt of a $30.0 million vendor take-back mortgage resulting from the sale of seven properties in Newmarket, Ontario in January 2018, partially offset by;
- •
- the acquisitions of eight income-producing properties in the United States and Germany for $547.9 million consisting of a $304.2 million portfolio of four properties in West Jefferson, Ohio, $50.7 million for a property in Plainfield, Indiana, $44.4 million for a property in Greencastle, Pennsylvania, $82.7 million for a property in Erfurt, Germany and one property in Shepherdsville, Kentucky for $65.9 million;
- •
- the purchase of 12.9 acres of development land in West Jefferson, Ohio for $1.2 million;
- •
- investment property maintenance and improvement capital expenditures paid of $17.8 million largely relating to improvement projects at the property in Novi, Michigan as noted above and a modern warehouse property located in Olive Branch, Mississippi which was acquired in October 2017 and re-leased to another tenant, and development and expansion capital expenditures paid of $15.4 million largely relating to the 0.3 million square foot expansion at the property near Columbus, Ohio mentioned previously; and
Table of Contents
- •
- $33.1 million of deposits relating to property acquisitions. A $7.0 million deposit was made to acquire the leasehold interest in two properties located in Mississauga, Ontario as noted above. A $26.1 million deposit was made to acquire a property under development in the state of Texas. The commitment to purchase the property under development is subject to specific confidentiality provisions and customary closing conditions including certain purchase rights in favour of the tenant and is expected to close concurrently with the lease commencement in the third quarter of 2019 following construction of the building.
Investing activities for the year ended December 31, 2017 used cash of $237.9 million of which $154.0 million related to the acquisition of three income-producing properties in the United States, $70.8 million related to the purchase of expansion capital expenditures for additions constructed at two special purpose properties in the United States and investment property maintenance and improvement capital expenditures of $10.7 million largely relating to the property in Novi, Michigan as well as maintenance projects in Canada.
Financing Activities
Cash provided by financing activities for the three month period ended December 31, 2018 of $506.8 million largely comprised $548.7 million of proceeds from unsecured term loans, partially offset by $31.1 million of distribution payments and $6.3 million of bank indebtedness repayments.
Cash used in financing activities for the three month period ended December 31, 2017 of $6.6 million related to $30.6 million of distribution payments and $6.5 million to repurchase the Trust's stapled units under the normal course issuer bid, partially offset by a net $31.0 million of US dollar denominated bank indebtedness proceeds that was used to fund an acquisition in October 2017.
Cash provided by financing activities for the year ended December 31, 2018 of $324.2 million comprised $548.7 million of proceeds from unsecured term loans, partially offset by distribution payments of $125.1 million, repurchases of the Trust's stapled units under the normal course issuer bid of $63.5 million and net $32.5 million of bank indebtedness repayments.
Cash used in financing activities for the year ended December 31, 2017 of $105.2 million largely comprised distribution payments of $122.6 million and repurchases of the Trust's stapled units of $12.0 million under the normal course issuer bid, partially offset by net $31.0 million of US dollar denominated bank indebtedness proceeds that were used to fund an acquisition in October 2017.
Table of Contents
Debt Structure
Granite's debt structure and key debt metrics as at December 31, 2018 and 2017 were as follows:
Summary Debt Structure and Debt Metrics
| | | | | | | | | | | | | | | | | | | |
| | | | | | | | | | | | |
As at December 31,
| |
| | 2018
| | 2018
Adjusted(2)
| | 2017
| | 2017
Adjusted(2)
| |
|---|
| | | | | | | | | | | | |
Unsecured debt, net | | | | | $ | 1,198.4 | | | $ | 1,198.4 | | | $ | 647.3 | | | $ | 647.3 | |
Cross currency interest rate swaps, net | | | | | 104.8 | | | 104.8 | | | 61.5 | | | 61.5 | |
Bank indebtedness | | | | | — | | | — | | | 32.6 | | | 32.6 | |
| | | | | | | | | | | | |
Total debt | | [A] | | | $ | 1,303.2 | | | $ | 1,303.2 | | | $ | 741.4 | | | $ | 741.4 | |
Less: cash and cash equivalents | | | | | 658.2 | | | 702.0 | | | 69.0 | | | 460.4 | |
| | | | | | | | | | | | |
Net debt | | [B] | | | $ | 645.0 | | | $ | 601.2 | | | $ | 672.4 | | | $ | 281.0 | |
| | | | | | | | | | | | |
Investment properties, all unencumbered by secured debt | | [C] | | | $ | 3,425.0 | | | $ | 3,425.0 | | | $ | 2,733.6 | | | $ | 2,733.6 | |
| | | | | | | | | | | | |
Adjusted EBITDA(1) | | [D] | | | $ | 187.0 | | | $ | 181.1 | | | $ | 185.0 | | | $ | 159.4 | |
Interest expense | | | | | $ | 22.4 | | | $ | 22.4 | | | $ | 20.0 | | | $ | 20.0 | |
Interest income | | | | | (2.6 | ) | | (2.6 | ) | | (0.5 | ) | | (0.5 | ) |
| | | | | | | | | | | | |
Interest expense, net | | [E] | | | $ | 19.8 | | | $ | 19.8 | | | $ | 19.5 | | | $ | 19.5 | |
Debt metrics | | | | |
| | |
| | |
| | |
| |
Leverage ratio(1) | | [A]/[C] | | | 38% | | | 38% | | | 27% | | | 27% | |
Net leverage ratio(1) | | [B]/[C] | | | 19% | | | 18% | | | 25% | | | 10% | |
Interest coverage ratio(1) | | [D]/[E] | | | 9.4x | | | 9.1x | | | 9.5x | | | 8.2x | |
Unencumbered asset coverage ratio(1) | | [C]/[A] | | | 2.6x | | | 2.6x | | | 3.7x | | | 3.7x | |
Indebtedness ratio(1) | | [A]/[D] | | | 7.0x | | | 7.2x | | | 4.0x | | | 4.7x | |
Weighted average cost of debt | | | | | 2.17% | | | 2.17% | | | 2.54% | | | 2.54% | |
Weighted average debt term-to-maturity, in years | | | | | 4.7 | | | 4.7 | | | 4.8 | | | 4.8 | |
Ratings and outlook | | | | |
| | |
| | |
| | |
| |
DBRS | | | | BBB stable | | BBB stable | | BBB stable | | BBB stable | |
Moody's | | �� | | Baa2 stable | | Baa2 stable | | Baa2 stable | | Baa2 stable | |
| | | | | | | | | | | | |
- (1)
- Represents a non-IFRS measure. For definitions of Granite's non-IFRS measures, refer to the section "NON-IFRS MEASURES".
- (2)
- The 2018 Adjusted column represents the summary of debt structure and debt metrics at December 31, 2018 after adjusting for the following items:
• the cash proceeds from the dispositions of the six assets held for sale; and
• the Adjusted EBITDA relating to a reduction of $2.2 million associated with the revenue reduction from the sale of the six assets held for sale and $18.1 million from proforma EBITDA of the dispositions occurring on January 1, 2018, partially offset by an increase of $14.4 million from proforma EBITDA of the acquisitions occurring at the beginning of the year.
The 2017 Adjusted column represents the summary of debt structure and debt metrics at December 31, 2017 after adjusting for the cash proceeds from the sale of the 10 properties in January 2018 as well as the corresponding reduction in Adjusted EBITDA of $25.6 million for the year 2017 associated with the revenue reduction from the sale of the 10 properties.
Table of Contents
Unsecured Debt and Cross Currency Interest Rate Swaps
2025 Term Loan and Cross Currency Interest Rate Swap
On December 12, 2018, Granite REIT Holdings Limited Partnership ("Granite LP") entered into a senior unsecured non-revolving term facility in the amount of $300.0 million (the "2025 Term Loan") that matures on December 12, 2025. The 2025 Term Loan was available in one drawdown and is fully prepayable without penalty. Any amount repaid may not be re-borrowed. On December 12, 2018, $300.0 million was drawn on the 2025 Term Loan. Interest on drawn amounts is calculated based on CDOR plus an applicable margin determined by reference to the external credit rating of Granite LP and is payable monthly in advance. At December 31, 2018, the full $300.0 million remained outstanding and the balance, net of deferred financing costs, was $298.7 million.
On December 12, 2018, the Trust entered into a cross currency interest rate swap to exchange the CDOR plus margin interest payments from the 2025 Term Loan for Euro denominated payments at a 2.202% fixed interest rate. In addition, under the terms of the swap, the Trust will pay principal proceeds of €198.2 million in exchange for which it will receive $300.0 million on December 12, 2025. As at December 31, 2018, the fair value of the cross currency interest rate swap was a net financial liability of $17.1 million.
2022 Term Loan and Cross Currency Interest Rate Swap
On December 19, 2018, the Trust entered into a senior unsecured non-revolving term facility in the amount of US$185.0 million (the "2022 Term Loan") that matures on December 19, 2022. The 2022 Term Loan was available in one US dollar drawdown and is fully prepayable without penalty. Any amount repaid may not be re-borrowed. On December 19, 2018, US$185.0 million was drawn on the 2022 Term Loan. Interest on drawn amounts is calculated based on LIBOR plus an applicable margin determined by reference to the external credit rating of Granite LP and is payable monthly in arrears. At December 31, 2018, the full US$185.0 million remained outstanding and the balance, net of deferred financing costs, was $251.9 million.
On December 19, 2018, the Trust entered into a cross currency interest rate swap to exchange the LIBOR plus margin interest payments from the 2022 Term Loan for Euro denominated payments at a 1.225% fixed interest rate. In addition, under the terms of the swap, the Trust will pay principal proceeds of €163.0 million in exchange for which it will receive US$185.0 million on December 19, 2022. As at December 31, 2018, the fair value of the cross currency interest rate swap was a net financial liability of $3.8 million.
2023 Debentures and Cross Currency Interest Rate Swap
On December 20, 2016, the Trust issued $400.0 million aggregate principal amount of 3.873% Series 3 senior debentures due November 30, 2023 (the "2023 Debentures"). Interest on the 2023 Debentures is payable semi-annually in arrears on May 30 and November 30 of each year. At December 31, 2018, all of the 2023 Debentures remained outstanding and the balance, net of deferred financing costs, was $398.4 million.
On December 20, 2016, the Trust entered into a cross currency interest rate swap to exchange the 3.873% interest payments from the 2023 Debentures for Euro denominated payments at a 2.43% fixed interest rate. Under the terms of the swap, the Trust will pay principal proceeds of €281.1 million in exchange for which it will receive $400.0 million on November 30, 2023. As at December 31, 2018, the fair value of the cross currency interest rate swap was a net financial liability of $56.9 million.
2021 Debentures and Cross Currency Interest Rate Swap
In July 2014, the Trust issued $250.0 million aggregate principal amount of 3.788% Series 2 senior debentures due July 5, 2021 (the "2021 Debentures"). Interest on the 2021 Debentures is payable semi-annually in arrears on January 5 and July 5 of each year. At December 31, 2018, all of the 2021 Debentures remained outstanding and the balance, net of deferred financing costs, was $249.4 million.
Table of Contents
In July 2014, the Trust entered into a cross currency interest rate swap to exchange the 3.788% interest payments from the 2021 Debentures for Euro denominated payments at a 2.68% fixed interest rate. Under the terms of the swap, the Trust will pay principal proceeds of €171.9 million in exchange for which it will receive $250.0 million on July 5, 2021. As at December 31, 2018, the fair value of the cross currency interest rate swap was a net financial liability of $26.9 million.
The 2021 Debentures, 2023 Debentures, 2022 Term Loan and 2025 Term Loan rank pari passu with all of the Trust's other existing and future senior unsecured indebtedness and are guaranteed by Granite REIT and Granite GP. The fair values of the cross currency interest rate swaps are dependent upon a number of assumptions including the Euro exchange rate against the Canadian or US dollars and the Euro, Canadian and U.S. government benchmark interest rates.
Credit Facility
On February 1, 2018, the Trust entered into a new unsecured revolving credit facility in the amount of $500.0 million that is available by way of Canadian dollar, US dollar or Euro denominated loans or letters of credit and matures on February 1, 2023. The Trust has the option to extend the maturity date by one year to February 1, 2024 subject to the agreement of lenders in respect of a minimum of 662/3% of the aggregate amount committed under the facility. The credit facility provides the Trust with the ability to increase the amount of the commitment by an additional aggregate principal amount of up to $100.0 million with the consent of the participating lenders. Interest on drawn amounts is calculated based on an applicable margin determined by reference to the external credit rating of Granite REIT and Granite GP, as is a commitment fee in respect of undrawn amounts. As at December 31, 2018, the Trust had no amounts drawn from the credit facility and $0.1 million in letters of credit issued against the facility.
Debt Metrics and Financial Covenants
Granite uses the debt metrics noted above to assess its borrowing capacity and the ability to meet its current and future financing obligations. At December 31, 2018, the debt ratios remain relatively favourable providing financial flexibility for future growth.
Granite's unsecured debentures, term loans and credit facility agreements contain financial and non-financial covenants that include maintaining certain leverage and debt service ratios. As at December 31, 2018, Granite was in compliance with all of these covenants.
Credit Ratings
On April 12, 2018, Moody's Investors Service, Inc. ("Moody's") confirmed its credit rating on the 2021 Debentures and 2023 Debentures of Baa2 with a stable outlook. On March 19, 2018, DBRS confirmed the BBB rating on the 2021 Debentures and the 2023 Debentures with a stable trend. Credit ratings are intended to provide investors with an independent measure of credit quality of an issue of securities. A rating accorded to any security is not a recommendation to buy, sell or hold such securities and may be subject to revision or withdrawal at any time by the rating organization which granted such ratings.
Unitholders' Equity
Outstanding Stapled Units
As at March 6, 2019, the Trust had 45,684,529 stapled units issued and outstanding. The decrease from the issued and outstanding stapled units of 45,685,229 at December 31, 2018 resulted from the repurchase of 700 stapled units pursuant to Granite's normal course issuer bid subsequent to year end (see "NORMAL COURSE ISSUER BID").
Table of Contents
Distributions
Monthly distributions declared to stapled unitholders in the three month periods ended December 31, 2018 and 2017 were $31.4 million or 68.7 cents per stapled unit and $31.0 million or 66.1 cents per stapled unit, respectively. Monthly distributions declared to stapled unitholders in the years ended December 31, 2018 and 2017 were $125.1 million or $2.73 per stapled unit and $123.1 million or $2.61 per stapled unit, respectively.
As a result of the increase in taxable income generated primarily by the sale transactions in 2018, Granite's Board of Trustees declared a special distribution in December 2018 of $1.20 per stapled unit which comprised 30.0 cents per unit payable in cash and 90.0 cents per unit payable by the issuance of stapled units. Immediately following the issuance of the stapled units, the stapled units were consolidated such that each unitholder held the same number of stapled units after the consolidation as each unitholder held prior to the special distribution. See "SIGNIFICANT MATTERS — Special Distributions to Unitholders".
The distributions declared in January 2019 in the amount of $10.6 million or 23.3 cents per stapled unit were paid on February 15, 2019 and the distributions declared in February 2019 of $10.6 million or 23.3 cents per stapled unit will be paid on March 15, 2019.
Pursuant to the requirement of National Policy 41-201,Income Trusts and Other Indirect Offerings, the following table outlines the differences between cash flow from operating activities and cash distributions as well as the differences between net income and cash distributions, in accordance with the Policy guidelines.
Cash Flows from Operating Activities in Excess (Shortfall) of Distributions Paid and Payable
| | | | | | | | | | | | | |
| | | | | | | | | | |
| | Three Months Ended
December 31, | | Years Ended
December 31, | |
|---|
| | 2018
| | 2017
| | 2018
| | 2017
| |
|---|
| | | | | | | | | | |
Net income | | $ | 85.9 | | $ | 233.6 | | $ | 465.4 | | $ | 357.7 | |
| | | | | | | | | | |
Cash flows provided by operating activities | | 34.7 | | 38.2 | | 157.9 | | 158.7 | |
Monthly distributions paid and payable | | (31.4 | ) | (31.0 | ) | (125.1 | ) | (123.1 | ) |
Special distribution payable in cash | | (13.7 | ) | — | | (13.7 | ) | — | |
| | | | | | | | | | |
Cash flows from operating activities in excess (shortfall) of distributions paid and payable | | $ | (10.4 | ) | $ | 7.2 | | $ | 19.1 | | $ | 35.6 | |
| | | | | | | | | | |
Monthly distributions paid for the three month periods and years ended December 31, 2018 and 2017 were funded with cash flows from operating activities. The special distribution paid in cash on January 15, 2019 was funded with available cash on hand.
Net income prepared in accordance with IFRS recognizes revenue and expenses at time intervals that do not necessarily match the receipt or payment of cash. Therefore, when establishing cash distributions to unitholders, consideration is given to factors such as FFO, AFFO, cash generated from and required for operating activities and forward-looking cash flow information, including forecasts and budgets. Management does not expect current or potential future commitments to replace or maintain its investment properties to adversely affect cash distributions.
Table of Contents
Normal Course Issuer Bid
On May 16, 2018, Granite announced the acceptance by the Toronto Stock Exchange ("TSX") of Granite's Notice of Intention to Make a Normal Course Issuer Bid ("NCIB"). Pursuant to the NCIB, Granite proposes to purchase through the facilities of the TSX and any alternative trading system in Canada, from time to time and if considered advisable, up to an aggregate of 3,939,255 of Granite's issued and outstanding stapled units. The NCIB commenced on May 18, 2018 and will conclude on the earlier of the date on which purchases under the bid have been completed and May 17, 2019. Pursuant to the policies of the TSX, daily purchases made by Granite through the TSX may not exceed 16,546 stapled units, subject to certain exceptions. Granite entered into an automatic securities purchase plan with a broker in order to facilitate repurchases of the stapled units under the NCIB during specified blackout periods. Pursuant to a previous notice of intention to conduct a NCIB, Granite received approval from the TSX to purchase stapled units for the period May 16, 2017 to May 15, 2018.
During the year ended December 31, 2018, Granite repurchased 1,282,171 stapled units for consideration of $63.5 million and an additional 700 units for consideration of less than $0.1 million subsequent to the year-end at an aggregate average purchase price of $49.55 per unit. During the year ended December 31, 2017, Granite repurchased 241,034 stapled units for consideration of $12.0 million representing an average purchase price of $49.94 per unit.
COMMITMENTS, CONTRACTUAL OBLIGATIONS, CONTINGENCIES AND OFF-BALANCE SHEET ARRANGEMENTS |
The Trust is subject to various legal proceedings and claims that arise in the ordinary course of business. Management believes that the final outcome of such matters will not have a material adverse effect on the financial position, results of operations or liquidity of the Trust. However, actual outcomes may differ from management's expectations.
The Trust has made commitments for future payments of interest and principal on bank indebtedness and long-term debt, construction and development project costs, purchases of properties and certain other costs. At December 31, 2018, these contractual obligations had the following maturities:
| | | | | | | | | | | | | | | | | | | | | | | |
| | | | | | | | | | | | | | | | |
As at December 31, 2018
| | Total
| | 2019
| | 2020
| | 2021
| | 2022
| | 2023
| | Thereafter
| |
|---|
| | | | | | | | | | | | | | | | |
Unsecured debentures | | $ | 650.0 | | $ | — | | $ | — | | $ | 250.0 | | $ | — | | $ | 400.0 | | | $ | — | |
Unsecured term loans | | 552.4 | | — | | — | | — | | 252.4 | | — | | | 300.0 | |
Cross currency interest rate swaps | | 104.7 | | — | | — | | 26.9 | | 3.8 | | 56.9 | | | 17.1 | |
Interest payments: | | | | | | | | | | | | | | | | |
Unsecured debentures, net of cross currency interest rate swap savings | | 73.4 | | 17.5 | | 17.5 | | 17.5 | | 10.4 | | 10.5 | | | — | |
Unsecured term loans, net of cross currency interest rate swap savings | | 59.3 | | 9.8 | | 9.8 | | 9.8 | | 9.8 | | 6.7 | | | 13.4 | |
Construction, development and property purchase commitments | | 457.0 | | 457.0 | | — | | — | | — | | — | | | — | |
| | | | | | | | | | | | | | | | |
| | $ | 1,896.8 | | $ | 484.3 | | $ | 27.3 | | $ | 304.2 | | $ | 276.4 | | $ | 474.1 | | | $ | 330.5 | |
| | | | | | | | | | | | | | | | |
Off-balance sheet arrangements consist of outstanding letters of credit to support certain contractual obligations, property purchase commitments, construction and development project commitments and certain operating agreements. At December 31, 2018, the Trust had $0.1 million in letters of credit
Table of Contents
outstanding. Additionally, the Trust had contractual commitments related to construction and development projects, the purchase of a property in the United States, and the purchase of a leasehold interest in two properties in Canada amounting in aggregate to approximately $457.0 million at December 31, 2018. The construction and development projects are expected to be completed in the latter part of 2019. The commitment to purchase the property in the United States is subject to specific confidentiality provisions and customary closing conditions including certain purchase rights in favour of the tenant and is expected to close in the third quarter of 2019 following construction of the building. The commitment to purchase the leasehold interest in two income-producing properties in Canada, which is expected to close in the second quarter of 2019, is subject to customary closing conditions and the consent of the ground lessor. Granite expects to fund these commitments through the use of cash on hand, cash from operations and/or Granite's credit facility. At December 31, 2018, the Trust also had commitments on non-cancellable operating leases requiring future minimum annual rental payments as follows:
| | | | | |
Not later than 1 year | | | $ | 0.5 | |
Later than 1 year and not later than 5 years | | | 1.1 | |
Later than 5 years | | | — | |
| | | | | |
| | | $ | 1.6 | |
| | | | | |
| | | | | |
| | | | | |
In addition, the Trust is committed to making annual payments under two ground leases for the land upon which two income-producing properties are situated of $0.5 million and $0.1 million to the years 2049 and 2096, respectively.
For further discussion of commitments, contractual obligations, contingencies and off-balance sheet arrangements, refer to notes 8, 9, 16 and 20 to the audited combined financial statements for the year ended December 31, 2018 and "LIQUIDITY AND CAPITAL RESOURCES".
RELATED PARTY TRANSACTIONS |
For a discussion of the Trust's transactions with related parties, refer to note 18 of the audited combined financial statements for the year ended December 31, 2018.
Table of Contents
Funds from operations
FFO is a non-IFRS performance measure that is widely used by the real estate industry in evaluating the operating performance of real estate entities. Granite calculates FFO as net income attributable to stapled unitholders excluding fair value gains (losses) on investment properties and financial instruments, gains (losses) on sale of investment properties including the associated current income tax, acquisition transaction costs, deferred income taxes and certain other items, net of non-controlling interests in such items. The Trust's determination of FFO follows the definition prescribed by the Real Estate Property Association of Canada ("REALPAC") White Paper on Funds From Operations & Adjusted Funds From Operations for IFRS dated February 2018 and as subsequently amended ("White Paper"). Granite considers FFO to be a meaningful supplemental measure that can be used to determine the Trust's ability to service debt, fund capital expenditures and provide distributions to stapled unitholders. FFO is reconciled to net income, which is the most directly comparable IFRS measure (see "RESULTS OF OPERATIONS — Funds From Operations and Adjusted Funds From Operations"). FFO should not be construed as an alternative to net income or cash flow generated from operating activities determined in accordance with IFRS.
Adjusted funds from operations
AFFO is a non-IFRS performance measure that is widely used by the real estate industry in evaluating the recurring economic earnings performance of real estate entities after considering certain costs associated with sustaining such earnings. Granite calculates AFFO as net income attributable to stapled unitholders including all adjustments used to calculate FFO and further adjusts for actual maintenance capital expenditures that are required to sustain Granite's productive capacity, leasing costs such as leasing commissions and tenant allowances paid, tenant improvements and non-cash straight-line rent and tenant incentive amortization, net of non-controlling interests in such items. The Trust's determination of AFFO follows the definition prescribed by REALPAC's White Paper. Granite considers AFFO to be a meaningful supplemental measure that can be used to determine the Trust's ability to service debt, fund expansion capital expenditures, fund property development and provide distributions to stapled unitholders after considering costs associated with sustaining operating earnings. AFFO is also reconciled to net income, which is the most directly comparable IFRS measure (see "RESULTS OF OPERATIONS — Funds From Operations and Adjusted Funds From Operations"). AFFO should not be construed as an alternative to net income or cash flow generated from operating activities determined in accordance with IFRS.
FFO and AFFO payout ratios
The FFO and AFFO payout ratios are calculated as monthly distributions declared to unitholders divided by FFO and AFFO, respectively, in a period. FFO payout ratio and AFFO payout ratio may exclude revenue or expenses incurred during a period that can be a source of variance between periods. The FFO payout ratio and AFFO payout ratio are supplemental measures widely used by analysts and investors in evaluating the sustainability of the Trust's monthly distributions to stapled unitholders.
Table of Contents
FFO and AFFO Payout Ratios
| | | | | | | | | | | | | | | | | | |
| | | | | | | | | | | | |
| |
| | Three Months Ended
December 31, | | Years Ended
December 31, | |
|---|
(in millions, except as noted)
| |
| | 2018
| | 2017
| | 2018
| | 2017
| |
|---|
| | | | | | | | | | | | |
Monthly distributions declared to unitholders | | [A] | | | $ | 31.4 | | $ | 31.0 | | | $ | 125.1 | | | $ | 123.1 | |
FFO | | | | |
40.9 | |
41.6 | | |
168.9 | | |
153.2 | |
Add (deduct): | | | | | | | | | | | | | | |
Proxy contest expenses | | | | | — | | — | | | — | | | 5.9 | |
Foreign exchange gain on the remeasurement of US cash proceeds from sale of properties | | | | | — | | — | | | (8.5) | | | — | |
Lease termination and close-out fees | | | | | — | | — | | | (1.0) | | | (1.6) | |
| | | | | | | | | | | | |
FFO adjusted for the above | | [B] | | | $ | 40.9 | | $ | 41.6 | | | $ | 159.4 | | | $ | 157.5 | |
AFFO | | | | |
39.8 | |
32.6 | | |
138.1 | | |
145.4 | |
Add (deduct): | | | | | | | | | | | | | | |
Proxy contest expenses | | | | | — | | — | | | — | | | 5.9 | |
Tenant allowance payment made in connection with a 2014 lease extension at the Eurostar facility in Austria | | | | | — | | — | | | 9.1 | | | — | |
Foreign exchange gain on the remeasurement of US cash proceeds from sale of properties | | | | | — | | — | | | (8.5) | | | — | |
Lease termination and close-out fees | | | | | — | | — | | | (1.0) | | | (1.6) | |
| | | | | | | | | | | | |
AFFO adjusted for the above | | [C] | | | $ | 39.8 | | $ | 32.6 | | | $ | 137.7 | | | $ | 149.7 | |
FFO payout ratio | | [A]/[B] | | | 77% | | 75% | | | 78% | | | 78% | |
AFFO payout ratio | | [A]/[C] | | | 79% | | 95% | | | 91% | | | 82% | |
| | | | | | | | | | | | |
Net operating income — cash basis
Granite uses NOI on a cash basis, which adjusts NOI to exclude lease termination and close-out fees, and the non-cash impact from straight-line rent and tenant incentive amortization recognized during the period (see "RESULTS OF OPERATIONS — Net Operating Income"). NOI — cash basis is a commonly used measure by the real estate industry and Granite believes it is a useful supplementary measure of the income generated by and operating performance of income-producing properties in addition to the most comparable IFRS measure, which Granite believes is NOI. NOI — cash basis is also a key input in Granite's determination of the fair value of its investment property portfolio.
Same property net operating income — cash basis
Same property NOI — cash basis refers to the NOI — cash basis for those properties owned by Granite throughout the entire current and prior year periods under comparison. Same property NOI — cash basis excludes properties that were acquired, disposed of, classified as properties under or held for development or assets held for sale during the periods under comparison (see "RESULTS OF OPERATIONS — Net Operating Income"). Granite believes that same property NOI — cash basis is a useful supplementary measure in understanding period-over-period organic changes in NOI — cash basis from the same stock of properties owned.
Table of Contents
Adjusted earnings before interest, income taxes, depreciation and amortization ("Adjusted EBITDA")
Adjusted EBITDA is calculated as net income before lease termination and close-out fees, interest expense, interest income, income tax expense, depreciation and amortization expense, foreign exchange gains (losses) on the remeasurement of proceeds from the sale of investment properties, proxy contest expenses, fair value gains (losses) on investment properties and financial instruments, acquisition transaction costs, other income relating to a settlement award and gains (losses) on the sale of investment properties. Adjusted EBITDA represents an operating cash flow measure that Granite uses in calculating the interest coverage ratio and indebtedness ratio noted below. Adjusted EBITDA is also defined in Granite's debt agreements and used in calculating the Trust's debt covenants.
Adjusted EBITDA Reconciliation
| | | | | | | |
| | | | | | |
For the years ended December 31,
| | 2018
| | 2017
| |
|---|
| | | | | | |
Net income | | $ | 465.4 | | $ | 357.7 | |
Add (deduct): | | | | | |
Lease termination and close-out fees | | (1.0 | ) | (1.6 | ) |
Interest expense and other financing costs | | 22.4 | | 20.0 | |
Interest income | | (2.6 | ) | (0.5 | ) |
Income tax expense | | 52.6 | | 13.4 | |
Depreciation and amortization | | 0.3 | | 0.3 | |
Foreign exchange gain on the remeasurement of US cash proceeds from sale of properties | | (8.5 | ) | — | |
Fair value gains on investment properties, net | | (354.7 | ) | (212.1 | ) |
Fair value losses on financial instruments | | 0.5 | | 0.8 | |
Loss on sale of investment properties | | 6.9 | | 0.4 | |
Acquisition transaction costs | | 8.0 | | 0.7 | |
Other income — settlement award | | (2.3 | ) | — | |
Proxy contest expenses | | — | | 5.9 | |
| | | | | | |
Adjusted EBITDA | | $ | 187.0 | | $ | 185.0 | |
| | | | | | |
Interest coverage ratio
The interest coverage ratio is calculated on a 12-month trailing basis using Adjusted EBITDA divided by net interest expense. Granite believes the interest coverage ratio is useful in evaluating the Trust's ability to meet its interest expense obligations (see "LIQUIDITY AND CAPITAL RESOURCES — Debt Structure").
Indebtedness ratio
The indebtedness ratio is calculated as total debt divided by Adjusted EBITDA and Granite believes it is useful in evaluating the Trust's ability to repay outstanding debt using its operating cash flows (see "LIQUIDITY AND CAPITAL RESOURCES — Debt Structure").
Leverage and net leverage ratios
The leverage ratio is calculated as the carrying value of total debt divided by the fair value of investment properties while the net leverage ratio subtracts cash and cash equivalents from total debt. The leverage ratio and net leverage ratio are supplemental measures that Granite believes are useful in evaluating the
Table of Contents
Trust's degree of financial leverage, borrowing capacity and the relative strength of its balance sheet (see "LIQUIDITY AND CAPITAL RESOURCES — Debt Structure").
Unencumbered asset coverage ratio
The unencumbered asset coverage ratio is calculated as the carrying value of investment properties (excluding assets held for sale) that are not encumbered by secured debt divided by the carrying value of total unsecured debt and is a supplemental measure that Granite believes is useful in evaluating the Trust's degree of asset coverage provided by its unencumbered investment properties to total unsecured debt (see "LIQUIDITY AND CAPITAL RESOURCES — Debt Structure").
SIGNIFICANT ACCOUNTING ESTIMATES |
The preparation of financial statements in conformity with IFRS requires management to apply judgment and make estimates that affect the amounts reported and disclosed in the combined financial statements. Management bases estimates on historical experience and various other assumptions that are believed to be reasonable in the circumstances, the results of which form the basis for making judgments about the values of assets and liabilities. On an ongoing basis, management evaluates its estimates. However, actual results could differ from those estimates.
The Trust's significant accounting policies that involve the most judgment and estimates are as follows:
Judgments
Leases
The Trust's policy for revenue recognition is described in note 2(k) of the audited combined financial statements for the year ended December 31, 2018. The Trust makes judgments in determining whether certain leases are operating or finance leases, in particular tenant leases with long contractual terms, leases where the property is a large square-footage and/or architecturally specialized and long-term ground leases where the Trust is the lessee.
Investment properties
The Trust's policy relating to investment properties is described in note 2(d) of the audited combined financial statements for the year ended December 31, 2018. In applying this policy, judgment is used in determining whether certain costs incurred for tenant improvements are additions to the carrying amount of the property or represent incentives, identifying the point at which practical completion of properties under development occurs and determining borrowing costs to be capitalized to the carrying value of properties under development. Judgment is also applied in determining the use, extent and frequency of independent appraisals.
Income taxes
The Trust applies judgment in determining whether it will continue to qualify as a REIT for both Canadian and United States tax purposes for the foreseeable future. However, should it at some point no longer qualify, the Trust would be subject to income tax which could materially affect future distributions to unitholders and would also be required to recognize additional current and/or deferred income taxes.
Table of Contents
Estimates and Assumptions
Valuation of investment properties
The fair value of investment properties is determined by management using primarily the discounted cash flow method in which the income and expenses are projected over the anticipated term of the investment plus a terminal value discounted using an appropriate discount rate. The Trust obtains, from time to time, appraisals from independent qualified real estate valuation experts. However, the Trust does not measure its investment properties based on these appraisals but uses them as data points, together with other external market information accumulated by management, in arriving at its own conclusions on values. Management uses valuation assumptions such as discount rates, terminal capitalization rates and market rental rates applied in external appraisals or sourced from valuation experts; however, the Trust also uses its historical renewal experience with tenants, its direct knowledge of the specialized nature of Granite's portfolio and tenant profile and its knowledge of the actual condition of the properties in making business judgments about lease renewal probabilities, renewal rents and capital expenditures. There has been no change in the valuation methodology used during the year ended December 31, 2018. The critical assumptions relating to the Trust's estimates of fair values of investment properties include the receipt of contractual rents, contractual renewal terms, expected future market rental rates, discount rates that reflect current market uncertainties, capitalization rates and recent investment property prices. If there is any change in these assumptions or regional, national or international economic conditions, the fair value of investment properties may change materially. Refer to the "Investment Properties" section and note 4 of the audited combined financial statements for the year ended December 31, 2018 for further information on the estimates and assumptions made by management in connection with the fair values of investment properties.
Fair value of financial instruments
Where the fair value of financial assets or liabilities recorded on the balance sheet or disclosed in the notes cannot be derived from active markets, it is determined using valuation techniques including the discounted cash flow model. The inputs to these models are taken from observable markets where possible but, where this is not feasible, a degree of judgment is required in establishing fair values. The judgments include considerations of inputs such as credit risk and volatility. Changes in assumptions about these factors could materially affect the reported fair value of financial instruments.
Income taxes
The Trust operates in a number of countries and is subject to the income tax laws and related tax treaties in each of its operating jurisdictions. These laws and treaties can be subject to different interpretations by relevant taxation authorities. Significant judgment is required in the estimation of Granite's income tax expense, interpretation and application of the relevant tax laws and treaties and provision for any exposure that may arise from tax positions that are under audit by relevant taxation authorities.
The recognition and measurement of deferred tax assets or liabilities is dependent on management's estimate of future taxable profits and income tax rates that are expected to be in effect in the period the asset is realized or the liability is settled. Any changes in management's estimates can result in changes in deferred tax assets or liabilities as reported in the combined balance sheets and also the deferred income tax expense in the combined statements of net income.
Table of Contents
NEW ACCOUNTING PRONOUNCEMENTS AND DEVELOPMENTS |
New Standards Adopted
Effective January 1, 2018, the Trust applied for the first time certain standards and amendments that require restatement of previous financial statements. The nature and effect of these changes on the combined financial statements are disclosed below.
IFRS 15,Revenue from Contracts with Customers
In May 2014, the International Accounting Standards Board ("IASB") issued IFRS 15,Revenue from Contracts with Customers ("IFRS 15") which replaced IAS 18,Revenue and IAS 11,Construction Contracts and other related revenue interpretations effective January 1, 2018. IFRS 15 establishes the principles that the Trust applies to report useful information about the nature, amount, timing and uncertainty of revenue and cash flows arising from a contract with a customer.
As the Trust's most material revenue stream of rental revenue is outside the scope of the new standard, the adoption of the new standard did not have a material impact on the combined statements of net income and comprehensive income. The recovery of costs related to common area maintenance services is considered within the scope of IFRS 15 and the Trust has concluded that the pattern of revenue recognition remains unchanged. As a result of the adoption of IFRS 15, the Trust discloses revenue recognized from contracts with tenants related to common area maintenance recoveries separately from other sources of revenue. In addition, the Trust assessed that it is a principal in relation to property taxes and insurance that are paid directly by the tenants under certain net leases as the Trust is primarily responsible for fulfilling the promise to satisfy its property tax obligations and is a beneficiary as it relates to potential property insurance claims. Therefore, the Trust recognizes the gross amount of consideration for property taxes and insurance premiums. As a result of the adoption of IFRS 15, in the three month periods ended December 31, 2018 and 2017, tenant recoveries revenue and property operating costs each increased by $3.5 million and $5.4 million, respectively. For the years ended December 31, 2018 and 2017, tenant recoveries revenue and property operating costs each increased by $16.7 million and $22.0 million, respectively. There was no impact to net income, opening retained earnings, unitholders' equity or cash flows from the adoption of this standard. Refer to note 12(a) to the audited combined financial statements for the incremental disclosures required under IFRS 15.
IFRS 9,Financial Instruments
In July 2014, the IASB issued IFRS 9,Financial Instruments ("IFRS 9") which replaced IAS 39,Financial Instruments: Recognition and Measurement ("IAS 39") effective January 1, 2018. IFRS 9 provides new guidance on the classification and measurement, impairment and hedge accounting for financial instruments in addition to clarification for the treatment of modifications of financial liabilities. IFRS 9 is required to be adopted retrospectively with certain available transition provisions.
The adoption of this standard did not have any significant impact on the combined financial statements for the current or prior periods.
Classification and measurement:
IFRS 9 requires a new approach for the classification and measurement of financial assets based on the Trust's business models for managing these financial assets and their contractual cash flow characteristics. This approach is summarized as follows:
- •
- Assets held for the purpose of collecting contractual cash flows that solely represent payments of principal and interest are measured at amortized cost.
Table of Contents
- •
- Assets held within a business model where assets are both held for the purpose of collecting contractual cash flows or sold prior to maturity and the contractual cash flows solely represent payments of principal and interest are measured at fair value through other comprehensive income ("FVTOCI").
- •
- Assets held within another business model or assets that do not have contractual cash flow characteristics that are solely payments of principal and interest are measured at fair value through profit or loss ("FVTPL").
The Trust has completed its review of all financial instruments held and has performed a cash flow and business model assessment and the impact is summarized as follows:
- •
- The Trust's cash and cash equivalents, restricted cash, accounts receivable and long-term receivables, previously classified as loans and receivables under IAS 39, are now classified as amortized cost and continue to be measured at amortized cost.
- •
- The Trust's unsecured debentures, bank indebtedness, accounts payable and accrued liabilities and distributions payable, previously classified as other financial liabilities under IAS 39, are now classified as amortized cost and continue to be measured at amortized cost.
- •
- The Trust's derivative asset and liability instruments continue to be classified and measured at FVTPL.
Refer to notes 2(o) and 16 to the audited combined financial statements for the classification and measurement basis of financial assets and liabilities under IFRS 9.
Impairment:
IFRS 9 introduces a new expected credit loss ("ECL") impairment model for all financial assets measured at amortized cost or debt instruments measured at FVTOCI.
The ECL model uses an allowance for expected credit losses being recorded regardless of whether or not there has been an actual loss event. The Trust measures the loss allowance for its financial assets at an amount equal to the lifetime ECL. The impact of the credit loss modelling process is summarized as follows:
- •
- The Trust did not record an ECL allowance against long-term receivables as historical experience of loss on these balances is insignificant and, based on the assessment of forward-looking information, no significant increases in losses are expected. The Trust will continue to assess the valuation of these instruments.
- •
- The Trust did not record an ECL allowance against accounts receivable and has determined that its internal processes of evaluating each receivable on a specific basis for collectability using historical experience and adjusted for forward-looking information, would appropriately allow the Trust to determine if there are significant increases in credit risk to then record a corresponding ECL allowance.
Hedge accounting:
IFRS 9 also introduces a new hedge accounting model that expands the scope of hedge items and risks eligible for hedge accounting and aligns hedge accounting more closely with risk management. This new standard did not fundamentally change the types of hedging relationships or the requirement to measure and recognize ineffectiveness; however, it provides for more hedging strategies that are used for risk management to qualify for hedge accounting and introduces more judgment to assess the effectiveness of a hedging relationship.
Table of Contents
Financial liabilities:
Generally, IFRS 9 did not introduce changes to the measurement of financial liabilities. The Trust continues to measure its financial liabilities at amortized cost.
In regards to term modifications for financial liabilities, IFRS 9 requires that when a financial liability measured at amortized cost is modified or exchanged, and such modification or exchange does not result in derecognition, the adjustment to the amortized cost of the financial liability is recognized in profit or loss.
IFRS 2,Share-based Payment
In June 2016, the IASB issued amendments to IFRS 2,Share-based Payment clarifying how to account for the effects of vesting and non-vesting conditions on the measurement of cash-settled share-based payments, share-based payment transactions with a net settlement feature and a modification to the terms and conditions that change the classification of the transactions. These amendments are effective for annual periods beginning on January 1, 2018. The adoption of this amendment did not have an impact on the combined financial statements.
IAS 40,Investment Properties
On December 8, 2016, the IASB issued an amendment to IAS 40,Investment Properties that requires an asset to be transferred to or from investment property only when there is a change in use. A change in use occurs when the property meets, or ceases to meet, the definition of investment property and there is evidence of the change in use. The amendments are effective for years beginning on January 1, 2018. The adoption of these amendments and clarifications did not have an impact on the combined financial statements.
Future Accounting Policy Changes
New accounting standards issued but not yet applicable to the combined financial statements for the year ended December 31, 2018 are described below. Granite intends to adopt these standards when they become effective.
IFRS 16,Leases
In January 2016, the IASB issued IFRS 16,Leases ("IFRS 16") which replaces IAS 17,Leases and its associated interpretative guidance. IFRS 16 applies a control model to the identification of leases, distinguishing between a lease and a non-lease component on the basis of whether the customer controls the specified asset. For those contracts that are or contain a lease, IFRS 16 introduces significant changes to the accounting by lessees, introducing a single, on-balance sheet accounting model that is similar to current finance lease accounting, with limited exceptions for short-term leases or leases of low value assets. Lessor accounting remains largely unchanged as the distinction between operating and finance leases is retained. The standard is effective for annual periods beginning on or after January 1, 2019. The Trust does not expect this standard to have a significant impact on its combined financial statements as leases with tenants are expected to be accounted for as operating leases in the same manner they are currently being reported. The Trust has two investment properties located on land that is leased. Currently, the ground rent payments are expensed. It is expected that under IFRS 16, a right-of-use asset addition to investment properties and a lease obligation liability will be recorded with associated financing charges. The Trust also has rent expense associated with office space in Toronto, Canada and Vienna, Austria and office equipment. It is expected that under IFRS 16, a right-of-use asset addition and obligation liability will be recorded for these lease obligations as well. The Trust has completed the issue identification phase of the transition and is in the process of completing its evaluation of the resulting impact on its combined financial statements and internal controls.
Table of Contents
IFRIC 23,Uncertainty over Income Tax Treatments
In June 2017, the IFRS Interpretations Committee issued IFRIC 23,Uncertainty over Income Tax Treatments ("IFRIC 23") which clarifies how the recognition and measurement requirements of IAS 12,Income Taxes, are applied where there is uncertainty over income tax treatments. This standard is effective for annual periods beginning on or after January 1, 2019. The Trust is currently assessing the impact of IFRIC 23 on its combined financial statements.
IFRS 3,Business Combinations
In October 2018, the IASB issued amendments to IFRS 3,Business Combinations. The amendments clarified the definition of a business and provide guidance on whether an acquisition represents a group of assets or a business. The amendments also permit a simplified assessment of whether an acquired set of activities and assets is a group of assets rather than a business. Distinguishing between a business and a group of assets is important as an acquirer would only recognize goodwill when acquiring a business. The amendments apply to transactions for which the acquisition date is on or after the first annual reporting period beginning on or after January 1, 2020. Earlier adoption is permitted. The Trust is assessing the impact of these amendments on its combined financial statements.
INTERNAL CONTROLS OVER FINANCIAL REPORTING |
Disclosure Controls and Procedures
The President and Chief Executive Officer and the Chief Financial Officer of Granite have evaluated the effectiveness of the Trust's disclosure controls and procedures as defined in National Instrument 52-109 — Certification of Disclosure in Issuers' Annual and Interim Filings ("NI 52-109") and in Rules 13a-15(e) and 15d-15(e) under the United States Securities and Exchange Act of 1934 as of December 31, 2018 (the "Evaluation Date"). They have concluded that, as of the Evaluation Date, the Trust's disclosure controls and procedures were effective to ensure that information required to be disclosed by the Trust in the reports that they file or submit is (i) recorded, processed, summarized and reported within the time periods specified in the applicable rules and (ii) accumulated and communicated to the Trust's management, including their principal executive and principal financial officers, or persons performing similar functions, as appropriate to allow timely decisions regarding required disclosure.
Management's Report on Internal Control Over Financial Reporting
The Trust's management is responsible for establishing and maintaining adequate internal control over financial reporting (as such term is defined in NI 52-109 and Rules 13a-15(f) and 15d-15(f) under the United States Securities Exchange Act of 1934) for the Trust.
The Trust's internal control over financial reporting is a process designed by, or under the supervision of, the Trust's principal executive and principal financial officers, or persons performing similar functions, and effected by the Trust's board of directors, management and other personnel, to provide reasonable assurance regarding the reliability of financial reporting and the preparation of financial statements for external purposes in accordance with generally accepted accounting principles and includes those policies and procedures that: (1) pertain to the maintenance of records that, in reasonable detail, accurately and fairly reflect the transactions and dispositions of the Trust's assets; (2) provide reasonable assurance that transactions are recorded as necessary to permit preparation of financial statements in accordance with generally accepted accounting principles, and that the Trust's receipts and expenditures are being made only in accordance with authorizations of its management and directors; and (3) provide reasonable assurance regarding prevention or timely detection of unauthorized acquisition, use or disposition of the Trust's assets that could have a material effect on the financial statements.
Table of Contents
Under the supervision and with the participation of the Trust's President and Chief Executive Officer and Chief Financial Officer, management conducted an evaluation of the effectiveness of the Trust's internal control over financial reporting, as of the Evaluation Date, based on the framework set forth inInternal Control — Integrated Framework (2013) issued by the Committee of Sponsoring Organizations of the Treadway Commission. Based on its evaluation under this framework, management concluded that the Trust's internal control over financial reporting was effective as of December 31, 2018.
Deloitte LLP, an independent registered public accounting firm, who audited and reported on the Trust's combined financial statements as at and for the year ended December 31, 2018 and whose report is included in the Trust's annual report for fiscal 2018, has also issued an attestation report under standards of the Public Company Accounting Oversight Board (United States) on the Trust's internal control over financial reporting as of December 31, 2018. The attestation report precedes the audited financial statements included in the Trust's annual report for fiscal 2018.
Changes in Internal Control Over Financial Reporting
As of the Evaluation Date, there were no changes in the Trust's internal control over financial reporting that occurred during the period beginning on the date immediately following the end of the period in respect of which Granite made its most recent previous interim filing and ended on December 31, 2018 that have materially affected, or that are reasonably likely to materially affect, the Trust's internal control over financial reporting.
Limitation on the Effectiveness of Controls and Procedures
Granite's management, including the President and Chief Executive Officer and the Chief Financial Officer, does not expect that the Trust's controls and procedures will prevent all potential error and fraud. A control system, no matter how well conceived and operated, can provide only reasonable, not absolute, assurance that the objectives of the control system are met.
Investing in the Trust's stapled units involves a high degree of risk. There are a number of risk factors that could have a material adverse effect on Granite's business, financial condition, operating results and prospects. These risks and uncertainties are discussed in Granite's AIF filed with securities regulators in Canada and available online atwww.sedar.com and Annual Report on Form 40-F filed with the SEC and available online on EDGAR atwww.sec.gov, each in respect of the year ended December 31, 2018.
Table of Contents
SELECTED ANNUAL AND QUARTERLY DATA |
The annual and quarterly financial data reflects fluctuations in revenue, FFO, AFFO, investment properties and total debt primarily from the timing of leasing and development activities, property sales, acquisitions and foreign exchange. Investment properties also fluctuate from the effect of measuring properties at fair value under IFRS. Net income attributable to unitholders primarily fluctuates from fair value gains/losses on investment properties.
Refer to note 2 of the audited combined financial statements for the year ended December 31, 2018 for a description of the accounting policies used in the determination of the financial data.
Annual Data
| | | | | | | | | | |
| | | | | | | | |
Years ended December 31,
| | 2018
| | 2017
| | 2016
| |
|---|
| | | | | | | | |
(in millions, except as noted) | | | | | | | |
Operating highlights(1)(2) | | | | | | | |
Revenue(3) | | $ | 247.5 | | $ | 244.7 | | $ | 245.2 | |
NOI — cash basis(1) | | $ | 216.7 | | $ | 218.2 | | $ | 220.6 | |
Fair value gain on investment properties, net | | $ | 354.7 | | $ | 212.1 | | $ | 175.9 | |
Net income attributable to stapled unitholders | | $ | 465.2 | | $ | 357.7 | | $ | 279.3 | |
Cash provided by operating activities | | $ | 157.9 | | $ | 158.7 | | $ | 160.0 | |
FFO(1) | | $ | 168.9 | | $ | 153.2 | | $ | 149.7 | |
AFFO(1) | | $ | 138.1 | | $ | 145.4 | | $ | 149.3 | |
FFO payout ratio(1) | | 78% | | 78% | | 71% | |
AFFO payout ratio(1) | | 91% | | 82% | | 71% | |
Per unit amounts | |
| |
| |
| |
Diluted FFO(1) | | $ | 3.68 | | $ | 3.25 | | $ | 3.18 | |
Diluted AFFO(1) | | $ | 3.01 | | $ | 3.09 | | $ | 3.17 | |
Monthly distributions paid | | $ | 2.72 | | $ | 2.60 | | $ | 2.40 | |
Financial highlights | |
| |
| |
| |
Investment properties(4) | | $ | 3,425.0 | | $ | 2,733.6 | | $ | 2,653.1 | |
Assets held for sale | | $ | 44.2 | | $ | 391.4 | | — | |
Cash and cash equivalents | | $ | 658.2 | | $ | 69.0 | | $ | 246.2 | |
Total debt | | $ | 1,303.2 | | $ | 741.4 | | $ | 657.4 | |
Diluted weighted average units outstanding | | 45.9 | | 47.1 | | 47.1 | |
Maintenance or improvements capital expenditures paid(5) | | $ | 5.6 | | $ | 2.7 | | $ | 2.1 | |
Leasing costs paid(5) | | $ | 4.8 | | $ | 1.4 | | $ | 3.7 | |
Property metrics(4) | |
| |
| |
| |
Number of income-producing properties | | 80 | | 84 | | 92 | |
GLA, square feet | | 32.2 | | 29.1 | | 29.6 | |
Occupancy, by GLA | | 99.1% | | 98.4% | | 99.4% | |
Weighted average lease term, years | | 6.0 | | 5.9 | | 7.0 | |
| | | | | | | | |
- (1)
- For definitions of Granite's non-IFRS measures, refer to the section "NON-IFRS MEASURES".
- (2)
- Explanations for specific changes in the annual financial data table above are as follows:
- •
- 2018 — Net income attributable to unitholders, cash provided by operating activities and FFO included $1.0 million ($0.02 per unit) in revenue related to a lease termination and close-out fee and a net $8.5 million ($0.19 per unit) foreign exchange gain on the remeasurement of US dollar cash proceeds from the sale of investment properties in January 2018. FFO used to calculate FFO payout ratio and AFFO payout ratio excludes the aforementioned items as they can be a source of
Table of Contents
variance between periods. AFFO payout ratio further excludes a $9.1 million tenant incentive payment made in 2018 in connection with the 2014 lease extension at the Eurostar facility. The fair value gains on investment properties of $354.7 million were largely attributable to i) an increase in fair value to the sale price for the multi-purpose and special purpose properties sold in 2018 or in 2019, ii) a compression in discount and terminal capitalization rates and an increase in market rents for properties located in Canada, the United States, Germany and the Netherlands resulting from a greater market demand and, to a lesser extent, iii) positive changes in leasing assumptions primarily from contractual rent increases, new leases and lease renewals.
- •
- 2017 — Net income attributable to unitholders, cash provided by operating activities and FFO included $1.6 million of lease termination and close-out fees in revenue in connection with tenants having vacated properties and $5.9 million of expenses in connection with the proxy contest leading up to Granite's June 2017 annual general meeting. FFO used to calculate FFO payout ratio and AFFO payout ratio excludes the aforementioned items as they can be a source of variance between periods. The fair value gain on investment properties of $212.1 million was attributable to several factors, and, in particular, from i) the increase in fair value to the sale price for 10 properties, including three special purpose properties, sold in January 2018 and the higher valuation implied on certain remaining special purpose properties from the pricing realized and the liquidity potential demonstrated from the sale, ii) a compression in discount and terminal capitalization rates for certain modern warehouse and multi-purpose properties located in Canada, the United States and Europe and iii) favourable changes in leasing assumptions from new leases or renewals executed during 2017.
- •
- 2016 — Net income attributable to unitholders, cash provided by operating activities and FFO included $11.9 million of redemption costs associated with the early redemption of debentures that were due to mature in October 2018. FFO used to calculate FFO payout ratio and AFFO payout ratio excludes the $11.9 million early redemption expense as this cost can be a source of variance between periods. The fair value gain on investment properties of $175.9 million included the positive changes to leasing assumptions, which generally resulted in increased certainty and the extension of contractual cash flows, relating to lease extensions or renewals and extensions associated with 15 properties, including seven special purpose properties, concluded with Magna.
- (3)
- The Trust has retrospectively applied IFRS 15,Revenue from Contracts with Customers (see "NEW ACCOUNTING PRONOUNCEMENTS AND DEVELOPMENTS") and all historical periods herein have been restated to reflect such treatment.
- (4)
- Excludes properties held for sale which are classified as assets held for sale on the combined balance sheet as at December 31, 2018 and 2017.
- (5)
- Excludes maintenance or improvement capital expenditures and leasing costs related to a $9.1 million tenant incentive allowance for a 2014 lease extension in Graz, Austria paid in 2018 and the partially re-leased flex office property in Novi, Michigan paid in 2017 and 2018 (see "INVESTMENT PROPERTIES").
Table of Contents
Quarterly Data 2018
| | | | | | | | | | | | | |
| | | | | | | | | | |
(in millions, except as noted)
| | Mar 31,
2018
| | Jun 30,
2018
| | Sep 30,
2018
| | Dec 31,
2018
| |
|---|
| | | | | | | | | | |
Operating highlights(1)(2) | | | | | | | | | |
Revenue(3) | | $ | 61.7 | | $ | 62.1 | | $ | 63.8 | | $ | 59.9 | |
NOI — cash basis(1) | | $ | 52.2 | | $ | 55.2 | | $ | 56.4 | | $ | 52.9 | |
Fair value gain on investment properties, net | | $ | 32.3 | | $ | 127.9 | | $ | 141.6 | | $ | 52.9 | |
Net income attributable to stapled unitholders | | $ | 72.4 | | $ | 149.1 | | $ | 157.8 | | $ | 85.9 | |
Cash provided by operating activities | | $ | 37.6 | | $ | 45.0 | | $ | 40.6 | | $ | 34.7 | |
FFO(1) | | $ | 51.3 | | $ | 37.6 | | $ | 39.1 | | $ | 40.9 | |
AFFO(1) | | $ | 31.2 | | $ | 29.4 | | $ | 37.7 | | $ | 39.8 | |
FFO payout ratio(1) | | 79% | | 79% | | 80% | | 77% | |
AFFO payout ratio(1) | | 109% | | 99% | | 82% | | 79% | |
Per unit amounts | |
| |
| |
| |
| |
Diluted FFO(1) | | $ | 1.11 | | $ | 0.82 | | $ | 0.85 | | $ | 0.90 | |
Diluted AFFO(1) | | $ | 0.67 | | $ | 0.64 | | $ | 0.82 | | $ | 0.87 | |
Monthly distributions paid | | $ | 0.68 | | $ | 0.68 | | $ | 0.68 | | $ | 0.68 | |
Financial highlights | |
| |
| |
| |
| |
Investment properties(4) | | $ | 2,916.1 | | $ | 3,031.2 | | $ | 3,198.0 | | $ | 3,425.0 | |
Assets held for sale | | — | | $ | 341.4 | | $ | 17.0 | | $ | 44.2 | |
Cash and cash equivalents | | $ | 273.8 | | $ | 50.1 | | $ | 192.7 | | $ | 658.2 | |
Total debt | | $ | 745.7 | | $ | 817.6 | | $ | 715.9 | | $ | 1,303.2 | |
Diluted weighted average units outstanding | | 46.3 | | 45.8 | | 45.8 | | 45.7 | |
Maintenance or improvements capital expenditures paid(5) | | $ | 0.4 | | $ | 3.0 | | $ | 1.5 | | $ | 0.7 | |
Leasing costs paid(5) | | $ | 1.5 | | $ | 2.4 | | $ | 0.5 | | $ | 0.4 | |
Property metrics(4) | |
| |
| |
| |
| |
Number of income-producing properties | | 85 | | 84 | | 85 | | 80 | |
GLA, square feet | | 29.7 | | 31.8 | | 32.5 | | 32.2 | |
Occupancy, by GLA | | 98.7% | | 97.3% | | 97.3% | | 99.1% | |
Weighted average lease term, years | | 6.0 | | 5.9 | | 5.9 | | 6.0 | |
| | | | | | | | | | |
- (1)
- For definitions of Granite's non-IFRS measures, refer to the section "NON-IFRS MEASURES".
- (2)
- Explanations for specific changes in the quarterly financial data table above are as follows:
- •
- Q1'18 — Revenue, net income attributable to unitholders, cash provided by operating activities and FFO included $1.0 million of lease termination and close-out fee in revenue in connection with a tenant having vacated a property and a $10.4 million foreign exchange gain on the remeasurement of US dollar proceeds from the sale of investment properties in January 2018. FFO used to calculate FFO payout ratio and AFFO payout ratio excludes the aforementioned items as these items can be a source of variance between periods. AFFO included $9.1 million related to the payment of a tenant incentive allowance made in connection with a 2014 lease extension at the Eurostar facility in Graz, Austria. AFFO used to calculate AFFO payout ratio excludes the $9.1 million tenant incentive payment as this cost can be a source of variance between periods.
- •
- Q2'18 — Net income attributable to unitholders, cash provided by operating activities and FFO included a $1.9 million foreign exchange loss on the remeasurement of US dollar proceeds from the sale of investment properties in January 2018. FFO used to calculate FFO payout ratio and AFFO payout ratio excludes the $1.9 million foreign exchange loss on the remeasurement of US dollar proceeds from the sale of investment properties as this item can be a source of variance between periods. Fair value gain on investment properties of $127.9 million included the increase in fair value to the
Table of Contents
- (3)
- The Trust has retrospectively applied IFRS 15,Revenue from Contracts with Customers (see "NEW ACCOUNTING PRONOUNCEMENTS AND DEVELOPMENTS") and all historical periods herein have been restated to reflect such treatment.
- (4)
- Excludes properties held for sale which are classified as assets held for sale on the combined balance sheet as at the respective quarter-end.
- (5)
- Excludes maintenance or improvement capital expenditures and leasing costs paid related to a $9.1 million tenant incentive allowance for a 2014 lease extension in Graz, Austria and the partially re-leased flex office property in Novi, Michigan (see "INVESTMENT PROPERTIES").
Table of Contents
Quarterly Data 2017
| | | | | | | | | | | | | | |
| | | | | | | | | | |
(in millions, except as noted)
|
|
Mar 31,
2017
|
|
Jun 30,
2017
|
|
Sep 30,
2017
|
|
Dec 31,
2017
|
|
|---|
| | | | | | | | | | |
Operating highlights(1)(2) | | | | | | | | | | |
Revenue(3) | | | $ | 60.8 | | $ | 60.5 | | $ | 60.8 | | $ | 62.6 | |
NOI — cash basis(1) | | | $ | 54.4 | | $ | 54.2 | | $ | 53.4 | | $ | 56.2 | |
Fair value gain (loss) on investment properties, net | | | $ | (7.3 | ) | $ | 17.2 | | $ | 17.0 | | $ | 185.2 | |
Net income attributable to stapled unitholders | | | $ | 30.2 | | $ | 42.9 | | $ | 51.0 | | $ | 233.6 | |
Cash provided by operating activities | | | $ | 46.2 | | $ | 33.8 | | $ | 40.5 | | $ | 38.2 | |
FFO(1) | | | $ | 39.6 | | $ | 31.6 | | $ | 40.4 | | $ | 41.6 | |
AFFO(1) | | | $ | 40.3 | | $ | 32.4 | | $ | 40.1 | | $ | 32.6 | |
FFO payout ratio(1) | | | 78% | | 82% | | 79% | | 75% | |
AFFO payout ratio(1) | | | 76% | | 80% | | 80% | | 95% | |
Per unit amounts | | |
| |
| |
| |
| |
Diluted FFO(1) | | | $ | 0.84 | | $ | 0.67 | | $ | 0.85 | | $ | 0.89 | |
Diluted AFFO(1) | | | $ | 0.86 | | $ | 0.69 | | $ | 0.85 | | $ | 0.69 | |
Monthly distributions paid | | | $ | 0.65 | | $ | 0.65 | | $ | 0.65 | | $ | 0.65 | |
Financial highlights | | |
| |
| |
| |
| |
Investment properties(4) | | | $ | 2,717.6 | | $ | 2,758.0 | | $ | 2,749.0 | | $ | 2,733.6 | |
Assets held for sale | | | — | | — | | — | | $ | 391.4 | |
Cash and cash equivalents | | | $ | 189.7 | | $ | 196.5 | | $ | 190.9 | | $ | 69.0 | |
Total debt | | | $ | 650.5 | | $ | 682.7 | | $ | 691.5 | | $ | 741.4 | |
Diluted weighted average units outstanding | | | 47.1 | | 47.2 | | 47.2 | | 47.0 | |
Maintenance or improvements capital expenditures paid(5) | | | $ | 0.6 | | $ | 0.3 | | $ | 0.5 | | $ | 1.3 | |
Leasing costs paid(5) | | | $ | 0.3 | | $ | 0.3 | | $ | 0.4 | | $ | 0.4 | |
Property metrics(4) | | |
| |
| |
| |
| |
Number of income-producing properties | | | 92 | | 92 | | 92 | | 84 | |
GLA, square feet | | | 30.1 | | 30.2 | | 30.2 | | 29.1 | |
Occupancy, by GLA | | | 98.4% | | 98.1% | | 98.4% | | 98.4% | |
Weighted average lease term, years | | | 6.9 | | 6.7 | | 6.6 | | 5.9 | |
| | | | | | | | | | |
- (1)
- For definitions of Granite's non-IFRS measures, refer to the section "NON-IFRS MEASURES".
- (2)
- Explanations for specific changes in the quarterly financial data table above are as follows:
- •
- Q2'17 — Net income attributable to unitholders, cash provided by operating activities and FFO included $5.9 million of expenses in connection with the proxy contest leading up to Granite's June 2017 annual general meeting. FFO used to calculate FFO payout ratio and AFFO payout ratio excludes the $5.9 million proxy contest expenses as this cost can be a source of variance between periods.
- •
- Q3'17 — Revenue, net income attributable to unitholders, cash provided by operating activities and FFO included $1.6 million of lease termination and close-out fees in revenue in connection with tenants having vacated properties. FFO used to calculate FFO payout ratio and AFFO payout ratio excludes the $1.6 million lease termination and close-out fees as this revenue can be a source of variance between periods.
- •
- Q4'17 — Fair value gain on investment properties of $185.2 million included the increase in fair value to the sale price for 10 properties, including three special purpose properties, sold in January 2018 and the higher valuation implied on certain remaining special purpose properties from the pricing realized and the liquidity potential demonstrated from the sale.
- (3)
- The Trust has retrospectively applied IFRS 15,Revenue from Contracts with Customers (see "NEW ACCOUNTING PRONOUNCEMENTS AND DEVELOPMENTS") and all historical periods herein have been restated to reflect such treatment.
Table of Contents
- (4)
- Excludes properties held for sale which are classified as assets held for sale on the combined balance sheet as at the respective quarter-end.
- (5)
- Excludes maintenance or improvement capital expenditures and leasing costs paid related to the partially re-leased flex office property in Novi, Michigan (see "INVESTMENT PROPERTIES").
FORWARD-LOOKING STATEMENTS |
This MD&A and accompanying letter to unitholders may contain statements that, to the extent they are not recitations of historical fact, constitute "forward-looking statements" or "forward-looking information" within the meaning of applicable securities legislation, including the United States Securities Act of 1933, as amended, the United States Securities Exchange Act of 1934, as amended, and applicable Canadian securities legislation. Forward-looking statements and forward-looking information may include, among others, statements regarding Granite's future plans, goals, strategies, intentions, beliefs, estimates, costs, objectives, capital structure, cost of capital, tenant base, tax consequences, economic performance or expectations, or the assumptions underlying any of the foregoing. Words such as "outlook", "may", "would", "could", "should", "will", "likely", "expect", "anticipate", "believe", "intend", "plan", "forecast", "project", "estimate", "seek" and similar expressions are used to identify forward-looking statements and forward-looking information. Forward-looking statements and forward-looking information should not be read as guarantees of future events, performance or results and will not necessarily be accurate indications of whether or the times at or by which such future performance will be achieved. Undue reliance should not be placed on such statements. There can also be no assurance that: the expansion and diversification of Granite's real estate portfolio and the reduction in Granite's exposure to Magna and the special purpose properties; the ability of Granite to find satisfactory acquisition, joint venture and development opportunities and to strategically redeploy the proceeds from recently sold properties and financing initiatives; the expected completion of the acquisitions of a property in the United States and the construction and leasing of a building thereon and the leasehold interest in two properties in Canada; Granite's ability to dispose of any non-core assets on satisfactory terms; Granite's ability to meet its target occupancy goals; and the expected amount of any distributions, can be achieved in a timely manner, with the expected impact or at all. Forward-looking statements and forward-looking information are based on information available at the time and/or management's good faith assumptions and analyses made in light of Granite's perception of historical trends, current conditions and expected future developments, as well as other factors Granite believes are appropriate in the circumstances, and are subject to known and unknown risks, uncertainties and other unpredictable factors, many of which are beyond Granite's control, that could cause actual events or results to differ materially from such forward-looking statements and forward-looking information. Important factors that could cause such differences include, but are not limited to, the risk of changes to tax or other laws and treaties that may adversely affect Granite REIT's mutual fund trust status under the Income Tax Act (Canada) or the effective tax rate in other jurisdictions in which Granite operates; economic, market and competitive conditions and other risks that may adversely affect Granite's ability to expand and diversify its real estate portfolio and dispose of any non-core assets on satisfactory terms; and the risks set forth in the "Risk Factors" section in Granite's AIF for 2018 dated March 6, 2019, filed on SEDAR atwww.sedar.com and attached as Exhibit 1 to the Trust's Annual Report on Form 40-F for the year ended December 31, 2018 filed with the SEC and available online on EDGAR atwww.sec.gov, all of which investors are strongly advised to review. The "Risk Factors" section also contains information about the material factors or assumptions underlying such forward-looking statements and forward-looking information. Forward-looking statements and forward-looking information speak only as of the date the statements and information were made and unless otherwise required by applicable securities laws, Granite expressly disclaims any intention and undertakes no obligation to update or revise any forward-looking statements or forward-looking information contained in this MD&A to reflect subsequent information, events or circumstances or otherwise.
Audited Combined Financial Statements
of Granite Real Estate Investment Trust
and Granite REIT Inc.
For the year ended December 31, 2018
MANAGEMENT'S RESPONSIBILITY FOR FINANCIAL REPORTING |
Management of Granite Real Estate Investment Trust and Granite REIT Inc. (collectively the "Trust") is responsible for the preparation and presentation of the combined financial statements and all information included in the 2018 Annual Report. The combined financial statements were prepared by management in accordance with International Financial Reporting Standards as issued by the International Accounting Standards Board and where appropriate, reflect estimates based on management's best judgement in the circumstances. Financial information as presented elsewhere in the 2018 Annual Report has been prepared by management to ensure consistency with information contained in the combined financial statements. The combined financial statements have been audited by independent auditors and reviewed by the Audit Committees and approved by both the Board of Trustees of Granite Real Estate Investment Trust and the Board of Directors of Granite REIT Inc.
Management is responsible for the development and maintenance of systems of internal accounting and administrative controls of high quality. Such systems are designed to provide reasonable assurance that the financial information is accurate, relevant and reliable and that the Trust's assets are appropriately accounted for and adequately safeguarded. Management has determined that, as at December 31, 2018 and based on the framework set forth inInternal Control-Integrated Framework (2013) issued by the Committee of Sponsoring Organizations of the Treadway Commission, internal control over financial reporting was effective. The Trust's Chief Executive Officer and Chief Financial Officer, in compliance with Section 302 of the U.S. Sarbanes-Oxley Act of 2002 ("SOX"), has provided a SOX-related certification in connection with the Trust's annual disclosure document in the U.S. (Form 40-F) to the U.S. Securities and Exchange Commission. In accordance with National Instrument 52-109, a similar certification has been provided to the Canadian Securities Administrators.
The Trust's Audit Committees are appointed by their respective Boards and are comprised solely of outside independent Directors or Trustees. The Audit Committees meet periodically with management, as well as with the independent auditors, to satisfy themselves that each is properly discharging its responsibilities to review the combined financial statements and the independent auditors' report and to discuss significant financial reporting issues and auditing matters. The Audit Committees report their findings to the Boards for consideration when approving the combined financial statements for issuance to the stapled unitholders.
The combined financial statements and the effectiveness of internal control over financial reporting have been audited by Deloitte LLP, the independent auditors, in accordance with the standards of the Public Company Accounting Oversight Board (United States) on behalf of the stapled unitholders. The Auditors' Reports outline the nature of their examination and their opinion on the combined financial statements of the Trust and the effectiveness of the Trust's internal control over financial reporting. The independent auditors have full and unrestricted access to the Audit Committees.
| | |
| |  |
Kevan Gorrie
President and Chief Executive Officer | | Ilias Konstantopoulos
Chief Financial Officer
|
Toronto, Canada
March 6, 2019
Report of Independent Registered Public Accounting Firm |
To the Board of Trustees and Unitholders of Granite Real Estate Investment Trust and the Board of Directors and Shareholders of Granite REIT Inc.
Opinion on the Combined Financial Statements
We have audited the accompanying combined balance sheets of Granite REIT Inc. and Granite Real Estate Investment Trust and subsidiaries (collectively, the "Trust"), as at December 31, 2018 and December 31, 2017, the related combined statements of net income, comprehensive income, unitholders' equity and cash flows, for each of the two years in the period ended December 31, 2018, and the related notes, (collectively referred to as the "financial statements"). In our opinion, the financial statements present fairly, in all material respects, the financial position of the Trust as at December 31, 2018 and 2017, and its financial performance and its cash flows for each of the two years in the period ended December 31, 2018, in conformity with International Financial Reporting Standards as issued by the International Accounting Standards Board.
We have also audited, in accordance with the standards of the Public Company Accounting Oversight Board (United States) (PCAOB), the Trust's internal control over financial reporting as of December 31, 2018, based on criteria established inInternal Control — Integrated Framework (2013) issued by the Committee of Sponsoring Organizations of the Treadway Commission and our report dated March 6, 2019 expressed an unqualified opinion on the Trust's internal control over financial reporting.
Basis for Opinion
These financial statements are the responsibility of the Trust's management. Our responsibility is to express an opinion on the Trust's financial statements based on our audits. We are a public accounting firm registered with the PCAOB and are required to be independent with respect to the Trust in accordance with the U.S. federal securities laws and the applicable rules and regulations of the Securities and Exchange Commission and the PCAOB.
We conducted our audits in accordance with the standards of the PCAOB. Those standards require that we plan and perform the audits to obtain reasonable assurance about whether the financial statements are free of material misstatement, whether due to error or fraud. Our audits included performing procedures to assess the risks of material misstatement of the financial statements, whether due to error or fraud, and performing procedures that respond to those risks. Such procedures included examining, on a test basis, evidence regarding the amounts and disclosures in the financial statements. Our audits also included evaluating the accounting principles used and significant estimates made by management, as well as evaluating the overall presentation of the financial statements. We believe that our audits provide a reasonable basis for our opinion.
/s/ Deloitte LLP
Chartered Professional Accountants
Licensed Public Accountants
Toronto, Canada
March 6, 2019
We have served as the Trust's auditor since 2012.
Report of Independent Registered Public Accounting Firm |
To the Board of Trustees and Unitholders of Granite Real Estate Investment Trust and the Board of Directors and Shareholders of Granite REIT Inc.
Opinion on Internal Control over Financial Reporting
We have audited the internal control over financial reporting of Granite REIT Inc. and Granite Real Estate Investment Trust and subsidiaries (collectively, the "Trust") as of December 31, 2018, based on criteria established inInternal Control — Integrated Framework (2013) issued by the Committee of Sponsoring Organizations of the Treadway Commission (COSO). In our opinion, the Trust maintained, in all material respects, effective internal control over financial reporting as of December 31, 2018, based on criteria established inInternal Control — Integrated Framework (2013) issued by COSO.
We have also audited, in accordance with the standards of the Public Company Accounting Oversight Board (United States) (PCAOB), the combined financial statements as at and for the year ended December 31, 2018, of the Trust and our report dated March 6, 2019, expressed an unqualified opinion on those financial statements.
Basis for Opinion
The Trust's management is responsible for maintaining effective internal control over financial reporting and for its assessment of the effectiveness of internal control over financial reporting, included in the accompanying Management's Report on Internal Control over Financial Reporting. Our responsibility is to express an opinion on the Trust's internal control over financial reporting based on our audit. We are a public accounting firm registered with the PCAOB and are required to be independent with respect to the Trust in accordance with the U.S. federal securities laws and the applicable rules and regulations of the Securities and Exchange Commission and the PCAOB.
We conducted our audit in accordance with the standards of the PCAOB. Those standards require that we plan and perform the audit to obtain reasonable assurance about whether effective internal control over financial reporting was maintained in all material respects. Our audit included obtaining an understanding of internal control over financial reporting, assessing the risk that a material weakness exists, testing and evaluating the design and operating effectiveness of internal control based on the assessed risk, and performing such other procedures as we considered necessary in the circumstances. We believe that our audit provides a reasonable basis for our opinion.
Definition and Limitations of Internal Control over Financial Reporting
A company's internal control over financial reporting is a process designed to provide reasonable assurance regarding the reliability of financial reporting and the preparation of financial statements for external purposes in accordance with generally accepted accounting principles. A company's internal control over financial reporting includes those policies and procedures that (1) pertain to the maintenance of records that, in reasonable detail, accurately and fairly reflect the transactions and dispositions of the assets of the company; (2) provide reasonable assurance that transactions are recorded as necessary to permit preparation of financial statements in accordance with generally accepted accounting principles, and that receipts and expenditures of the company are being made only in accordance with authorizations of management and directors of the company; and (3) provide reasonable assurance regarding prevention or timely detection of unauthorized acquisition, use, or disposition of the company's assets that could have a material effect on the financial statements.
Because of its inherent limitations, internal control over financial reporting may not prevent or detect misstatements. Also, projections of any evaluation of effectiveness to future periods are subject to the risk that controls may become inadequate because of changes in conditions, or that the degree of compliance with the policies or procedures may deteriorate.
/s/ Deloitte LLP
Chartered Professional Accountants
Licensed Public Accountants
Toronto, Canada
March 6, 2019
Granite REIT Annual Report 2018
Combined Balance Sheets
(Canadian dollars in thousands)
| | | | | | | | | |
| | | | | | | | |
As at December 31,
| | Note
| | 2018
| | 2017
| |
|---|
| | | | | | | | |
ASSETS | | | | | | | |
Non-current assets: | |
| |
| |
| |
Investment properties | | 3, 4 | | $ | 3,424,978 | | $ | 2,733,568 | |
Acquisition deposits | | 3 | | 34,288 | | — | |
Deferred tax assets | | 13(c) | | 5,301 | | 5,742 | |
Fixed assets, net | | | | 771 | | 951 | |
Other assets | | 6 | | 13,425 | | 666 | |
| | | | | | | | |
| | | | 3,478,763 | | 2,740,927 | |
Current assets: | |
| |
| |
| |
Assets held for sale | | 5 | | 44,238 | | 391,453 | |
Accounts receivable | | | | 4,316 | | 2,310 | |
Income taxes receivable | | 13 | | 212 | | 180 | |
Prepaid expenses and other | | 7 | | 2,510 | | 2,029 | |
Restricted cash | | | | 470 | | 515 | |
Cash and cash equivalents | | 15(d) | | 658,246 | | 69,019 | |
| | | | | | | | |
Total assets | | | | $ | 4,188,755 | | $ | 3,206,433 | |
| | | | | | | | |
LIABILITIES AND EQUITY | |
| |
| |
| |
Non-current liabilities: | |
| |
| |
| |
Unsecured debt, net | | 8(a) | | $ | 1,198,414 | | $ | 647,306 | |
Cross currency interest rate swaps | | 8(b) | | 104,757 | | 61,466 | |
Deferred tax liabilities | | 13(c) | | 303,965 | | 244,052 | |
| | | | | | | | |
| | | | 1,607,136 | | 952,824 | |
Current liabilities: | |
| |
| |
| |
Other liability | | 9 | | — | | 8,968 | |
Deferred revenue | | 9 | | 4,290 | | 3,965 | |
Bank indebtedness | | 9 | | — | | 32,552 | |
Accounts payable and accrued liabilities | | 9 | | 41,967 | | 43,342 | |
Distributions payable | | 10 | | 24,357 | | 10,647 | |
Income taxes payable | | 13 | | 14,020 | | 16,273 | |
| | | | | | | | |
Total liabilities | | | | 1,691,770 | | 1,068,571 | |
| | | | | | | | |
Equity: | |
| |
| |
| |
Stapled unitholders' equity | | 11 | | 2,495,518 | | 2,136,614 | |
Non-controlling interests | | | | 1,467 | | 1,248 | |
| | | | | | | | |
Total equity | | | | 2,496,985 | | 2,137,862 | |
| | | | | | | | |
Total liabilities and equity | | | | $ | 4,188,755 | | $ | 3,206,433 | |
| | | | | | | | |
Commitments and contingencies (note 20)
See accompanying notes
| | | | |
| | | On behalf of the Boards: |
| | /s/ Kelly Marshall
Director/Trustee | | /s/ Gerald J. Miller
Director/Trustee |
Granite REIT Annual Report 2018
Combined Statements of Net Income
(Canadian dollars in thousands)
| | | | | | | | | |
| | | | | | | | |
Years ended December 31,
| | Note
| | 2018
| | 2017(1)
| |
|---|
| | | | | | | | |
Rental revenue | | | | $ | 219,986 | | $ | 216,131 | |
Tenant recoveries | | 12(a) | | 26,501 | | 26,945 | |
Lease termination and close-out fees | | | | 996 | | 1,607 | |
| | | | | | | | |
Revenue | | | | 247,483 | | 244,683 | |
Property operating costs | | 12(b) | | 30,942 | | 31,345 | |
| | | | | | | | |
Net operating income | | | | 216,541 | | 213,338 | |
General and administrative expenses | |
12(c) | |
29,404 | |
26,066 | |
Proxy contest expenses | | 12(d) | | — | | 5,866 | |
Depreciation and amortization | | | | 300 | | 335 | |
Interest income | | | | (2,638 | ) | (540 | ) |
Interest expense and other financing costs | | 12(e) | | 22,413 | | 20,011 | |
Foreign exchange losses (gains), net | | 12(f) | | (9,390 | ) | 572 | |
Fair value gains on investment properties, net | | 4, 5 | | (354,707 | ) | (212,106 | ) |
Fair value losses on financial instruments | | 12(g) | | 562 | | 823 | |
Acquisition transaction costs | | 3 | | 7,968 | | 718 | |
Loss on sale of investment properties | | 5 | | 6,871 | | 427 | |
Other income | | 12(h) | | (2,250 | ) | — | |
| | | | | | | | |
Income before income taxes | | | | 518,008 | | 371,166 | |
Income tax expense | | 13 | | 52,651 | | 13,418 | |
| | | | | | | | |
Net income | | | | $ | 465,357 | | $ | 357,748 | |
| | | | | | | | |
- (1)
- The Trust has retrospectively applied IFRS 15,Revenue from Contracts with Customers (note 2(o)).
| | | | | | | | | |
Net income attributable to: | | | | | | | |
Stapled unitholders | | | | $ | 465,156 | | $ | 357,702 | |
Non-controlling interests | | | | 201 | | 46 | |
| | | | | | | | |
| | | | $ | 465,357 | | $ | 357,748 | |
| | | | | | | | |
See accompanying notes
Granite REIT Annual Report 2018
Combined Statements of Comprehensive Income
(Canadian dollars in thousands)
| | | | | | | | | |
| | | | | | | | |
Years ended December 31,
| | Note
| | 2018
| | 2017
| |
|---|
| | | | | | | | |
Net income | | | | $ | 465,357 | | $ | 357,748 | |
Other comprehensive income (loss): | |
| |
| |
| |
Foreign currency translation adjustment(1) | | | | 141,355 | | 17,825 | |
Unrealized loss on net investment hedges, includes income taxes of nil(1) | | 8(b) | | (48,431 | ) | (52,810 | ) |
| | | | | | | | |
Total other comprehensive income (loss) | | | | 92,924 | | (34,985 | ) |
| | | | | | | | |
Comprehensive income | | | | $ | 558,281 | | $ | 322,763 | |
| | | | | | | | |
- (1)
- Items that may be reclassified subsequently to net income if a foreign subsidiary is disposed of or hedges are terminated or no longer assessed as effective (note 2(h)).
| | | | | | | | | |
Comprehensive income attributable to: | | | | | | | |
Stapled unitholders | | | | $ | 558,042 | | $ | 322,534 | |
Non-controlling interests | | | | 239 | | 229 | |
| | | | | | | | |
| | | | $ | 558,281 | | $ | 322,763 | |
| | | | | | | | |
See accompanying notes
Granite REIT Annual Report 2018
Combined Statements of Unitholders' Equity
(Canadian dollars in thousands)
| | | | | | | | | | | | | | | | | | | | | | | | | | | | | | |
| |
| |
| |
| |
| |
| |
| |
| |
| |
|---|
| | | | | | | | | | | | | | | | | | |
| | Number
of
units
(000s)
| |
| |
| | Retained
earnings
(Deficit)
| | Accumulated
other
comprehensive
income
| | Stapled
unitholders'
equity
| | Non-
controlling
interests
| |
| |
|---|
Year ended
December 31, 2018
| | Stapled
units
| | Contributed
surplus
| | Equity
| |
|---|
| | | | | | | | | | | | | | | | | | |
As at January 1, 2018 | | | 46,903 | | $ | 2,118,460 | | | $ | 60,274 | | $ | (160,686 | ) | | $ | 118,566 | | | $ | 2,136,614 | | | $ | 1,248 | | $ | 2,137,862 | |
Net income | | | — | | — | | | — | | 465,156 | | | — | | | 465,156 | | | 201 | | 465,357 | |
Other comprehensive income | | | — | | — | | | — | | — | | | 92,886 | | | 92,886 | | | 38 | | 92,924 | |
Distributions (note 10) | | | — | | — | | | 41,128 | | (179,969 | ) | | — | | | (138,841 | ) | | (20 | ) | (138,861 | ) |
Units issued under the stapled unit plan (note 11(b)) | | | 64 | | 3,233 | | | — | | — | | | — | | | 3,233 | | | — | | 3,233 | |
Units repurchased for cancellation (note 11(c)) | | | (1,282 | ) | (57,915 | ) | | (5,615 | ) | — | | | — | | | (63,530 | ) | | — | | (63,530 | ) |
| | | | | | | | | | | | | | | | | | |
As at December 31, 2018 | | | 45,685 | | $ | 2,063,778 | | | $ | 95,787 | | $ | 124,501 | | | $ | 211,452 | | | $ | 2,495,518 | | | $ | 1,467 | | $ | 2,496,985 | |
| | | | | | | | | | | | | | | | | | |
| | | | | | | | | | | | | | | | | | | | | | | | | | | | | | |
| | | | | | | | | | | | | | | | | | |
Year ended
December 31, 2017
| | Number
of
units
(000s)
| | Stapled
units
| | Contributed
surplus
| | Deficit
| | Accumulated
other
comprehensive
income (loss)
| | Stapled
unitholders'
equity
| | Non-
controlling
interests
| | Equity
| |
|---|
| | | | | | | | | | | | | | | | | | |
As at January 1, 2017 | | | 47,123 | | $ | 2,128,378 | | | $ | 61,425 | | $ | (395,330 | ) | | $ | 153,734 | | | $ | 1,948,207 | | | $ | 1,529 | | $ | 1,949,736 | |
Net income | | | — | | — | | | — | | 357,702 | | | — | | | 357,702 | | | 46 | | 357,748 | |
Other comprehensive income (loss) | | | — | | — | | | — | | — | | | (35,168 | ) | | (35,168 | ) | | 183 | | (34,985 | ) |
Distributions (note 10) | | | — | | — | | | — | | (123,058 | ) | | — | | | (123,058 | ) | | (510 | ) | (123,568 | ) |
Units issued under the stapled unit plan (note 11(b)) | | | 22 | | 977 | | | — | | — | | | — | | | 977 | | | — | | 977 | |
Units repurchased for cancellation (note 11(c)) | | | (242 | ) | (10,895 | ) | | (1,151 | ) | — | | | — | | | (12,046 | ) | | — | | (12,046 | ) |
| | | | | | | | | | | | | | | | | | |
As at December 31, 2017 | | | 46,903 | | $ | 2,118,460 | | | $ | 60,274 | | $ | (160,686 | ) | | $ | 118,566 | | | $ | 2,136,614 | | | $ | 1,248 | | $ | 2,137,862 | |
| | | | | | | | | | | | | | | | | | |
See accompanying notes
Granite REIT Annual Report 2018
Combined Statements of Cash Flows
(Canadian dollars in thousands)
| | | | | | | | | |
| | | | | | | | |
Years ended December 31,
| | Note
| | 2018
| | 2017
| |
|---|
| | | | | | | | |
OPERATING ACTIVITIES | | | | | | | |
Net income | | | | $ | 465,357 | | $ | 357,748 | |
Items not involving current cash flows | | 15(a) | | (294,790 | ) | (192,530 | ) |
Leasing commissions paid | | | | (4,225 | ) | (2,581 | ) |
Tenant incentives paid | | | | (9,913 | ) | (1,036 | ) |
Current income tax expense | | 13(a) | | 7,631 | | 7,709 | |
Income taxes paid | | | | (10,273 | ) | (3,468 | ) |
Interest expense | | | | 21,440 | | 18,151 | |
Interest paid | | | | (21,116 | ) | (17,719 | ) |
Changes in working capital balances | | 15(b) | | 3,777 | | (7,597 | ) |
| | | | | | | | |
Cash provided by operating activities | | | | 157,888 | | 158,677 | |
| | | | | | | | |
INVESTING ACTIVITIES | |
| |
| |
| |
Investment properties: | | | | | | | |
Property acquisitions | | 3 | | (547,895 | ) | (153,979 | ) |
Development land purchase | | 3 | | (1,225 | ) | — | |
Proceeds from disposals, net | | 4, 5 | | 681,319 | | — | |
Mortgage receivable proceeds | | 5 | | 30,000 | | — | |
Capital expenditures | | | | | | | |
— Maintenance or improvements | | | | (17,799 | ) | (10,736 | ) |
— Developments or expansions | | | | (15,378 | ) | (72,404 | ) |
Acquisition deposits | | 3 | | (33,086 | ) | — | |
Fixed asset additions | | | | (111 | ) | (553 | ) |
Decrease (increase) in other assets | | | | 36 | | (175 | ) |
| | | | | | | | |
Cash provided by (used in) investing activities | | | | 95,861 | | (237,847 | ) |
| | | | | | | | |
FINANCING ACTIVITIES | |
| |
| |
| |
Distributions paid | | | | (125,131 | ) | (122,637 | ) |
Proceeds from unsecured term loans | | 8 | | 548,677 | | — | |
Proceeds from bank indebtedness | | | | 247,274 | | 121,097 | |
Repayments of bank indebtedness | | | | (279,768 | ) | (90,142 | ) |
Financing costs paid | | | | (3,319 | ) | (1,000 | ) |
Distributions to non-controlling interests | | | | (20 | ) | (510 | ) |
Repurchase of stapled units | | 11(c) | | (63,530 | ) | (12,046 | ) |
| | | | | | | | |
Cash provided by (used in) financing activities | | | | 324,183 | | (105,238 | ) |
| | | | | | | | |
Effect of exchange rate changes on cash and cash equivalents | | | |
11,295 | |
7,212 | |
| | | | | | | | |
Net increase (decrease) in cash and cash equivalents during the year | | | |
589,227 | |
(177,196 |
) |
Cash and cash equivalents, beginning of year | | | | 69,019 | | 246,215 | |
| | | | | | | | |
Cash and cash equivalents, end of year | | | | $ | 658,246 | | $ | 69,019 | |
| | | | | | | | |
See accompanying notes
Granite REIT Annual Report 2018
Notes to Combined Financial Statements
(All amounts in thousands of Canadian dollars unless otherwise noted)
1. NATURE AND DESCRIPTION OF THE TRUST |
Effective January 3, 2013, Granite Real Estate Inc. ("Granite Co.") completed its conversion from a corporate structure to a stapled unit real estate investment trust ("REIT") structure. All of the common shares of Granite Co. were exchanged, on a one-for-one basis, for stapled units, each of which consists of one unit of Granite Real Estate Investment Trust ("Granite REIT") and one common share of Granite REIT Inc. ("Granite GP"). Granite REIT is an unincorporated, open-ended, limited purpose trust established under and governed by the laws of the province of Ontario and created pursuant to a Declaration of Trust dated September 28, 2012 and as subsequently amended on January 3, 2013 and December 20, 2017. Granite GP was incorporated on September 28, 2012 under theBusiness Corporations Act (British Columbia). Granite REIT, Granite GP and their subsidiaries (together "Granite" or the "Trust") are carrying on the business previously conducted by Granite Co.
The stapled units trade on the Toronto Stock Exchange and on the New York Stock Exchange. The principal office of Granite REIT is 77 King Street West, Suite 4010, P.O. Box 159, Toronto-Dominion Centre, Toronto, Ontario, M5K 1H1, Canada. The registered office of Granite GP is Suite 2600, Three Bentall Centre, 595 Burrard Street P.O. Box 49314, Vancouver, British Columbia, V7X 1L3, Canada.
The Trust is a Canadian-based REIT engaged in the acquisition, development, ownership and management of industrial, warehouse and logistics properties in North America and Europe. The Trust's tenant base includes Magna International Inc. and its operating subsidiaries (together "Magna") as its largest tenants, in addition to tenants from various other industries.
These combined financial statements were approved by the Board of Trustees of Granite REIT and Board of Directors of Granite GP on March 6, 2019.
2. SIGNIFICANT ACCOUNTING POLICIES |
The accounting policies described below were applied consistently to all periods presented in these combined financial statements. New accounting standards and interpretations adopted in the year ended December 31, 2018 are described in note 2(o) and future accounting standards not yet effective are described in note 2(p).
- (a)
- Basis of Presentation and Statement of Compliance
The combined financial statements have been prepared in accordance with International Financial Reporting Standards ("IFRS") as issued by the International Accounting Standards Board ("IASB").
- (b)
- Combined Financial Statements and Basis of Consolidation
As a result of the REIT conversion described in note 1, the Trust does not have a single parent; however, each unit of Granite REIT and each share of Granite GP trade as a single stapled unit and accordingly, Granite REIT and Granite GP have identical ownership. Therefore, these financial statements have been prepared on a combined basis whereby the assets, liabilities and results of Granite GP and Granite REIT have been combined. The combined financial statements include the subsidiaries of Granite GP and Granite REIT. Subsidiaries are fully consolidated by Granite GP or Granite REIT from the date of acquisition, being the date on which control is obtained. The subsidiaries continue to be consolidated until the date that such control ceases. Control exists when Granite GP or Granite REIT have power, exposure or rights to variable returns and the ability to use their power over the entity to affect the amount of returns it generates.
All intercompany balances, income and expenses and unrealized gains and losses resulting from intercompany transactions are eliminated.
Granite REIT Annual Report 2018
- (c)
- Trust Units
The stapled units are redeemable at the option of the holder and, therefore, are required to be accounted for as financial liabilities, except where certain exemption conditions are met, in which case redeemable instruments may be classified as equity. The attributes of the stapled units meet the exemption conditions set out in IAS 32,Financial Instruments: Presentation and are, therefore, presented as equity for purposes of that standard.
- (d)
- Investment Properties
The Trust accounts for its investment properties, which include income-producing properties, properties under development and land held for development, in accordance with IAS 40,Investment Property. For acquired investment properties that meet the definition of a business, the acquisition is accounted for as a business combination (note 2(e)); otherwise they are initially measured at cost including directly attributable expenses. Subsequent to acquisition, investment properties are carried at fair value, which is determined based on available market evidence at the balance sheet date including, among other things, rental revenue from current leases and reasonable and supportable assumptions that represent what knowledgeable, willing parties would assume about rental revenue from future leases less future cash outflows in respect of capital expenditures. Gains and losses arising from changes in fair value are recognized in net income in the period of change.
Income-Producing Properties
The carrying value of income-producing properties includes the impact of straight-line rental revenue (note 2(k)), tenant incentives and deferred leasing costs since these amounts are incorporated in the determination of the fair value of income-producing properties.
When an income-producing property is disposed of, the gain or loss is determined as the difference between the disposal proceeds, net of selling costs, and the carrying amount of the property and is recognized in net income in the period of disposal.
Properties Under Development
The Trust's development properties are classified as such until the property is substantially completed and available for occupancy. The Trust capitalizes acquisition, development and expansion costs, including direct construction costs, borrowing costs and indirect costs wholly attributable to development. Borrowing costs are capitalized to projects under development or construction based on the average accumulated expenditures outstanding during the period multiplied by the Trust's average borrowing rate on existing debt. Where borrowings are associated with specific developments, the amount capitalized is the gross borrowing cost incurred on such borrowings less any investment income arising on temporary investment of these borrowings. The capitalization of borrowing costs is suspended if there are prolonged periods that development activity is interrupted. The Trust capitalizes direct and indirect costs, including property taxes and insurance of the development property, if activities necessary to ready the development property for its intended use are in progress. Costs of internal personnel and other indirect costs that are not wholly attributable to a project are expensed as incurred.
Properties under development are measured at fair value with appropriate estimates made for construction costs and timeline and related assumptions in order to determine the fair value of the property.
- (e)
- Business Combinations
The Trust accounts for investment property acquisitions as a business combination if the particular assets and set of activities acquired can be operated and managed as a business in their current state for the purpose of providing a return to the unitholders. The Trust applies the acquisition method to account for business combinations. The consideration transferred for a business combination is the fair value of the assets transferred, the liabilities incurred to the former owners of the acquiree and the equity interests issued by the Trust. The total consideration includes the fair value of any asset or liability resulting from a
Granite REIT Annual Report 2018
contingent consideration arrangement. Identifiable assets acquired as well as liabilities and contingent liabilities assumed in a business combination are measured initially at their fair values at the acquisition date.
The Trust recognizes any non-controlling interest in the acquiree on an acquisition-by-acquisition basis, either at fair value or at the non-controlling interest's proportionate share of the recognized amounts of the acquiree's identifiable net assets.
Acquisition related costs are expensed as incurred.
Any contingent consideration is recognized at fair value at the acquisition date. Subsequent changes to the fair value of contingent consideration that is recorded as an asset or liability is recognized in net income.
Goodwill is initially measured as the excess of the aggregate of the consideration transferred and the fair value of non-controlling interest over the identifiable net assets acquired. If the consideration transferred is lower than the fair value of the net assets acquired, the difference is recognized in net income.
- (f)
- Assets Held for Sale
Non-current assets (and disposal groups) are classified as held for sale if their carrying amounts will be recovered principally through a sale transaction rather than through continuing use. This condition is satisfied when the asset is available for immediate sale in its present condition, management is committed to the sale and it is highly probable to occur within one year.
- (g)
- Foreign Currency Translation
The assets and liabilities of the Trust's foreign operations are translated into Canadian dollars using exchange rates prevailing at the end of each reporting period. Income and expense items are translated at the average exchange rates for the period, unless exchange rates fluctuate significantly during that period, in which case, for material transactions, the exchange rates at the dates of those transactions are used. Exchange differences arising are recognized in other comprehensive income and accumulated in equity.
In preparing the financial statements of each entity, transactions in currencies other than the entity's functional currency (foreign currencies) are recognized at the average rates of exchange prevailing in the period. At the end of each reporting period, monetary items denominated in foreign currencies are retranslated at the rates prevailing at that date. Non-monetary items carried at fair value that are denominated in foreign currencies are retranslated at the rates prevailing at the date when the fair value was determined. Non-monetary items that are measured in terms of historical cost in a foreign currency are not retranslated. Exchange differences on monetary items are recognized in net income in the period in which they arise except for:
- •
- The effective portion of exchange differences on transactions entered into in order to hedge certain foreign currency risks are recognized in other comprehensive income;
- •
- Exchange differences on monetary items receivable from or payable to a foreign operation for which settlement is neither planned nor likely to occur (therefore forming part of the net investment in the foreign operation) are recognized in other comprehensive income; and
- •
- Exchange differences on foreign currency borrowings related to capitalized interest for assets under construction.
- (h)
- Derivatives and Hedging
Derivative instruments, such as the cross currency interest rate swaps and the foreign exchange forward contracts, are recorded in the combined balance sheet at fair value, including those derivatives that are embedded in financial or non-financial contracts. Changes in the fair value of derivative instruments which are not designated as hedges for accounting purposes are recognized in the combined statements of net income. The Trust utilizes derivative financial instruments from time to time in the management of its
Granite REIT Annual Report 2018
foreign currency and interest rate exposures. The Trust's policy is not to utilize derivative financial instruments for trading or speculative purposes.
The Trust applies hedge accounting to certain derivative and non-derivative financial instruments designated as hedges of net investments in subsidiaries with a functional currency other than the Canadian dollar. Hedge accounting is discontinued prospectively when the hedge relationship is terminated or no longer qualifies as a hedge, or when the hedging item is sold or terminated. In a net investment hedging relationship, the effective portion of foreign exchange gains or losses on the hedging instruments is recognized in other comprehensive income and the ineffective portion is recognized in net income. The amounts recorded in accumulated other comprehensive income are recognized in net income when there is a disposition or partial disposition of the foreign subsidiary.
- (i)
- Cash and Cash Equivalents and Restricted Cash
Cash and cash equivalents include cash and short-term investments with original maturities of three months or less.
Restricted cash represents segregated cash accounts for a specific purpose and cannot be used for general corporate purposes.
- (j)
- Fixed Assets
Fixed assets are recorded at cost less accumulated depreciation. Depreciation expense is recorded on a straight-line basis over the estimated useful lives of the fixed assets, which typically range from 3 to 5 years for computer hardware and software and 5 to 7 years for other furniture and fixtures. Leasehold improvements are amortized over the term of the applicable lease.
- (k)
- Revenue Recognition
Where Granite has retained substantially all the benefits and risks of ownership of its rental properties, leases with its tenants are accounted for as operating leases. Where substantially all the benefits and risks of ownership of the Trust's rental properties have been transferred to its tenants, the Trust's leases are accounted for as finance leases. All of the Trust's current leases are operating leases.
Certain leases contain rent escalation clauses or provide for tenant occupancy during periods for which no rent is due. Granite records the total rental income on a straight-line basis over the term of the lease. An accrued straight-line rent receivable is recorded from tenants for the difference between the straight-line rent and the rent that is contractually owing. In addition, tenant incentives including cash allowances provided to tenants are recognized as a reduction in rental revenue on a straight-line basis over the term of the lease where it is determined that the tenant fixturing has no benefit to Granite beyond the existing tenancy.
- (l)
- Unit-Based Compensation Plans
Incentive Stock Option Plan
Compensation expense for option grants is based on the fair value of the options at the grant date and is recognized over the period from the grant date to the date the award is vested. A liability is recognized for outstanding options based upon the fair value as the Trust is an open-ended trust making its units redeemable. During the period in which options are outstanding, the liability is adjusted for changes in the fair value with such adjustments being recognized as compensation expense in general and administrative expenses in the period in which they occur. The liability balance is reduced as options are exercised and recorded in equity as stapled units along with the proceeds received on exercise.
Executive Deferred Stapled Unit Plan
The executive deferred stapled unit plan is measured at fair value at the date of grant and amortized to compensation expense from the effective date of the grant to the final vesting date. Compensation expense
Granite REIT Annual Report 2018
is recognized on a proportionate basis consistent with the vesting features of each tranche of the grant. Compensation expense for executive deferred stapled units granted under the plan is recognized in general and administrative expenses with a corresponding liability recognized based upon the fair value of the Trust's stapled units as the Trust is an open-ended trust making its units redeemable. During the period in which the executive deferred stapled units are outstanding, the liability is adjusted for changes in the market value of the Trust's stapled unit, with such adjustments being recognized as compensation expense in general and administrative expenses in the period in which they occur. The liability balance is reduced as deferred stapled units are settled for stapled units and recorded in equity.
Director/Trustee Deferred Share Unit Plan
The compensation expense and a corresponding liability associated with the director/trustee deferred share unit plan is measured based on the market value of the underlying stapled units. During the period in which the awards are outstanding, the liability is adjusted for changes in the market value of the underlying stapled unit, with such positive or negative adjustments being recognized in general and administrative expenses in the period in which they occur. The liability balance is settled for cash when a director/trustee ceases to be a member of the Board.
- (m)
- Income Taxes
Operations in Canada
Granite qualifies as a mutual fund trust under the Income Tax Act (Canada) (the "Act") and as such the Trust itself will not be subject to income taxes provided it continues to qualify as a REIT for purposes of the Act. A REIT is not taxable and not considered to be a Specified Investment Flow-through Trust provided it complies with certain tests and it distributes all of its taxable income in a taxation year to its unitholders.
The Trust's qualification as a REIT results in no current or deferred income tax being recognized in the combined financial statements for income taxes related to the Canadian investment properties. Current income tax related to certain taxable Canadian entities is determined on the basis of enacted or substantively enacted tax rates and laws at each balance sheet date.
Operations in the United States
The Trust's investment property operations in the United States are conducted in a qualifying United States REIT ("US REIT") for purposes of the Internal Revenue Code of 1986, as amended. As a qualifying US REIT, it is not taxable provided it complies with certain tests in addition to the requirement to distribute substantially all of its taxable income.
As a qualifying US REIT, current income taxes on U.S. taxable income have not been recorded in the combined financial statements. However, the Trust has recorded deferred income taxes that may arise on the disposition of its investment properties as the Trust will likely be subject to entity level income tax in connection with such transactions pursuant to the Foreign Investment in Real Property Tax Act.
Operations in Europe
The Trust consolidates certain entities that continue to be subject to income tax.
Income taxes for taxable entities in Europe, as well as other entities in Canada or the United States subject to tax, are recorded as follows:
Current Income Tax
The current income tax expense is determined on the basis of enacted or substantively enacted tax rates and laws at each balance sheet date.
Granite REIT Annual Report 2018
Deferred Income Tax
Deferred income tax is recorded, using the liability method, on temporary differences arising between the tax basis of assets and liabilities and the amounts reported in the combined financial statements. Deferred income tax is measured using tax rates and laws that are enacted and substantively enacted as at each balance sheet date which are expected to apply when the temporary differences are expected to reverse. Deferred income tax assets are recognized only to the extent that it is probable that sufficient future taxable profit will be available against which the deductible temporary difference can be utilized.
Each of the current and deferred tax assets and liabilities are offset when they are levied by the same taxation authorities on either the same taxable entities, or different taxable entities within the same reporting group that settle on a net basis, and when there is a legal right to offset.
- (n)
- Significant Accounting Judgments, Estimates and Assumptions
The preparation of these combined financial statements requires management to make judgments, estimates and assumptions that affect the reported amounts of assets and liabilities, the disclosure of contingent assets and liabilities at the date of the combined financial statements and the reported amounts of revenue and expenses during the reporting periods.
Management believes that the judgments, estimates and assumptions utilized in preparing the combined financial statements are reasonable and prudent; however, actual results could be materially different and require an adjustment to the reported results.
Judgments
The following are the critical judgments that have been made in applying the Trust's accounting policies and that have the most significant effect on the amounts recognized in the combined financial statements:
Leases
The Trust's policy for revenue recognition is described in note 2(k). The Trust makes judgments in determining whether certain leases are operating or finance leases, in particular tenant leases with long contractual terms, leases where the property is a large square-footage and/or architecturally specialized and long-term ground leases where the Trust is the lessee.
Investment properties
The Trust's policy relating to investment properties is described in note 2(d). In applying this policy, judgment is used in determining whether certain costs incurred for tenant improvements are additions to the carrying amount of the property or represent incentives, identifying the point at which practical completion of properties under development occurs and determining borrowing costs to be capitalized to the carrying value of properties under development. Judgment is also applied in determining the use, extent and frequency of independent appraisals.
Income taxes
The Trust applies judgment in determining whether it will continue to qualify as a REIT for both Canadian and U.S. tax purposes for the foreseeable future. However, should it at some point no longer qualify, it would be subject to income tax and would be required to recognize current and deferred income taxes.
Granite REIT Annual Report 2018
Estimates and Assumptions
The key assumptions concerning the future and other key sources of estimation uncertainty at the balance sheet date that have a significant risk of causing a material adjustment to the carrying amounts of assets and liabilities within the next financial year include the following:
Valuation of investment properties
The fair value of investment properties is determined by management using primarily the discounted cash flow method in which the income and expenses are projected over the anticipated term of the investment plus a terminal value discounted using an appropriate discount rate. The Trust obtains, from time to time, appraisals from independent qualified real estate valuation experts. However, the Trust does not measure its investment properties based on these appraisals but uses them as data points, together with other external market information accumulated by management, in arriving at its own conclusions on values. Management uses valuation assumptions such as discount rates, terminal capitalization rates and market rental rates applied in external appraisals or sourced from valuation experts; however, the Trust also uses its historical renewal experience with tenants, its direct knowledge of the specialized nature of Granite's portfolio and tenant profile and the actual condition of the properties in making business judgments about lease renewal probabilities, renewal rents and capital expenditures. The critical assumptions relating to the Trust's estimates of fair values of investment properties include the receipt of contractual rents, contractual renewal terms, expected future market rental rates, discount rates that reflect current market uncertainties, capitalization rates and recent investment property prices. If there is any change in these assumptions or regional, national or international economic conditions, the fair value of investment properties may change materially. Refer to note 4 for further information on the estimates and assumptions made by management.
Fair value of financial instruments
Where the fair value of financial assets or liabilities recorded on the balance sheet or disclosed in the notes cannot be derived from active markets, they are determined using valuation techniques including the discounted cash flow method. The inputs to these models are taken from observable markets where possible, but where this is not feasible, a degree of judgment is required in establishing fair values. The judgments include considerations of inputs such as credit risk and volatility. Changes in assumptions about these factors could materially affect the reported fair value of financial instruments.
Income taxes
The Trust operates in a number of countries and is subject to the income tax laws and related tax treaties in each of its operating jurisdictions. These laws and treaties can be subject to different interpretations by relevant taxation authorities. Significant judgment is required in the estimation of Granite's income tax expense, interpretation and application of the relevant tax laws and treaties and provision for any exposure that may arise from tax positions that are under audit by relevant taxation authorities.
The recognition and measurement of deferred tax assets or liabilities is dependent on management's estimate of future taxable profits and income tax rates that are expected to be in effect in the period the asset is realized or the liability is settled. Any changes in management's estimate can result in changes in deferred tax assets or liabilities as reported in the combined balance sheets and also the deferred income tax expense in the combined statements of net income.
- (o)
- Accounting Standards Adopted in 2018
The Trust applied new standards and interpretations in the annual combined financial statements for the year ended December 31, 2018 with comparative figures adjusted accordingly. The nature and effect of the changes are disclosed below.
Granite REIT Annual Report 2018
IFRS 15,Revenue from Contracts with Customers
In May 2014, the IASB issued IFRS 15,Revenue from Contracts with Customers ("IFRS 15") which replaced IAS 18,Revenue and IAS 11,Construction Contracts and other related revenue interpretations effective January 1, 2018. IFRS 15 establishes the principles that the Trust applies to report useful information about the nature, amount, timing and uncertainty of revenue and cash flows arising from a contract with a customer.
As the Trust's most material revenue stream of rental revenue is outside the scope of the new standard, the adoption of the new standard did not have a material impact on the combined statements of net income and comprehensive income. The recovery of costs related to common area maintenance services is considered within the scope of IFRS 15 and the Trust has concluded that the pattern of revenue recognition remains unchanged. As a result of the adoption of IFRS 15, the Trust discloses revenue recognized from contracts with tenants related to common area maintenance recoveries separately from other sources of revenue. In addition, the Trust assessed that it is a principal in relation to property taxes and insurance that are paid directly by the tenants under certain net leases as the Trust is primarily responsible for fulfilling the promise to satisfy its property tax obligations and is a beneficiary as it relates to potential property insurance claims. Therefore, the Trust recognizes the gross amount of consideration for property taxes and insurance premiums. As a result of the adoption of IFRS 15, for the years ended December 31, 2018 and 2017, tenant recoveries revenue and property operating costs each increased by $16.7 million and $22.0 million, respectively. There was no impact to net income, opening retained earnings, unitholders' equity or cash flows from the adoption of this standard as at December 31, 2018 and December 31, 2017, and for each of the periods then ended, and accordingly an opening balance sheet for the earliest period related to the adoption of the standard is not presented. Refer to note 12(a) for the incremental disclosures required under IFRS 15.
IFRS 9,Financial Instruments
In July 2014, the IASB issued IFRS 9,Financial Instruments ("IFRS 9") which replaced IAS 39,Financial Instruments: Recognition and Measurement ("IAS 39") effective January 1, 2018. IFRS 9 provides new guidance on the classification and measurement, impairment and hedge accounting for financial instruments in addition to clarification for the treatment of modifications of financial liabilities. IFRS 9 is required to be adopted retrospectively with certain available transition provisions.
The adoption of this standard did not have any significant impact on the combined financial statements for the current or prior years.
Classification and measurement:
IFRS 9 requires a new approach for the classification and measurement of financial assets based on the Trust's business models for managing these financial assets and their contractual cash flow characteristics. This approach is summarized as follows:
- •
- Assets held for the purpose of collecting contractual cash flows that solely represent payments of principal and interest are measured at amortized cost.
- •
- Assets held within a business model where assets are both held for the purpose of collecting contractual cash flows or sold prior to maturity and the contractual cash flows solely represent payments of principal and interest are measured at fair value through other comprehensive income ("FVTOCI").
- •
- Assets held within another business model or assets that do not have contractual cash flow characteristics that are solely payments of principal and interest are measured at fair value through profit or loss ("FVTPL").
Granite REIT Annual Report 2018
The Trust completed its review of all financial instruments held and performed a cash flow and business model assessment, and the impact is summarized as follows:
- •
- The Trust's cash and cash equivalents, restricted cash, accounts receivable and certain long-term receivables, previously classified as loans and receivables under IAS 39, are now classified as amortized cost and continue to be measured at amortized cost.
- •
- The Trust's unsecured debentures, bank indebtedness, accounts payable and accrued liabilities and distributions payable, previously classified as other financial liabilities under IAS 39, are now classified as amortized cost and continue to be measured at amortized cost.
- •
- The Trust's derivative asset and liability instruments continue to be classified and measured at FVTPL.
The following summarizes the Trust's classification and measurement of its financial assets and liabilities:
| | |
| | | |
| | Classification and
Measurement Basis
|
|---|
| | | |
Financial assets | | |
Long-term receivables included in other assets | | Amortized Cost |
Long-term proceeds receivable associated with a property disposal included in other assets | | Fair Value |
Accounts receivable | | Amortized Cost |
Short-term proceeds receivable associated with a property disposal included in accounts receivable | | Fair Value |
Foreign exchange forward contracts included in prepaid expenses and other | | Fair Value |
Restricted cash | | Amortized Cost |
Cash and cash equivalents | | Amortized Cost |
Financial liabilities | |
|
Unsecured debentures, net | | Amortized Cost |
Unsecured term loans, net | | Amortized Cost |
Cross currency interest rate swaps | | Fair Value |
Bank indebtedness | | Amortized Cost |
Tenant incentive allowance included in other liability | | Fair Value |
Accounts payable and accrued liabilities | | Amortized Cost |
Foreign exchange forward contracts included in accounts payable and accrued liabilities | | Fair Value |
Distributions payable | | Amortized Cost |
| | | |
Refer to note 16 for the measurement basis of financial assets and liabilities under IFRS 9.
Impairment:
IFRS 9 introduces a new expected credit loss ("ECL") impairment model for all financial assets measured at amortized cost or debt instruments measured at FVTOCI.
The ECL model uses an allowance for expected credit losses being recorded regardless of whether or not there has been an actual loss event. The Trust measures the loss allowance for its financial assets at an amount equal to the lifetime ECL. The impact of the credit loss modelling process is summarized as follows:
- •
- The Trust did not record an ECL allowance against long-term receivables as historical experience of loss on these balances is insignificant and, based on the assessment of forward-looking information, no significant increases in losses are expected. The Trust will continue to assess the valuation of these instruments.
- •
- The Trust did not record an ECL allowance against accounts receivable and has determined that its internal processes of evaluating each receivable on a specific basis for collectability using historical experience and adjusted for forward-looking information, would appropriately allow the Trust to determine if there are significant increases in credit risk to then record a corresponding ECL allowance.
Granite REIT Annual Report 2018
Hedge accounting:
IFRS 9 also introduces a new hedge accounting model that expands the scope of hedge items and risks eligible for hedge accounting and aligns hedge accounting more closely with risk management. This new standard did not fundamentally change the types of hedging relationships or the requirement to measure and recognize ineffectiveness; however, it provides for more hedging strategies that are used for risk management to qualify for hedge accounting and introduces more judgment to assess the effectiveness of a hedging relationship. In accordance with IFRS 9's transition provisions for hedge accounting, the Trust has chosen as its accounting policy to continue to apply the hedge accounting requirement of IAS 39 for hedge relationships existing on and subsequent to January 1, 2018. Refer to note 2(h) for the Trust's accounting policy associated with hedge accounting.
Financial liabilities:
Generally, IFRS 9 did not introduce changes to the measurement of financial liabilities. The Trust continues to measure its financial liabilities at amortized cost.
In regards to term modifications for financial liabilities, IFRS 9 requires that when a financial liability measured at amortized cost is modified or exchanged, and such modification or exchange does not result in derecognition, the adjustment to the amortized cost of the financial liability is recognized in net income.
IFRS 2,Share-based Payment
In June 2016, the IASB issued amendments to IFRS 2,Share-based Payment clarifying how to account for the effects of vesting and non-vesting conditions on the measurement of cash-settled share-based payments, share-based payment transactions with a net settlement feature and a modification to the terms and conditions that change the classification of the transactions. These amendments are effective for annual periods beginning on January 1, 2018. The adoption of this amendment did not have an impact on the combined financial statements.
IAS 40,Investment Properties
On December 8, 2016, the IASB issued an amendment to IAS 40,Investment Properties that requires an asset to be transferred to or from investment property only when there is a change in use. A change in use occurs when the property meets, or ceases to meet, the definition of investment property and there is evidence of the change in use. The amendments are effective for years beginning on January 1, 2018. The adoption of these amendments and clarifications did not have an impact on the combined financial statements.
- (p)
- Future Accounting Policy Changes
IFRS 16,Leases
In January 2016, the IASB issued IFRS 16,Leases ("IFRS 16") which replaces IAS 17,Leases and its associated interpretative guidance. IFRS 16 applies a control model to the identification of leases, distinguishing between a lease and a non-lease component on the basis of whether the customer controls the specified asset. For those contracts that are or contain a lease, IFRS 16 introduces significant changes to the accounting by lessees, introducing a single, on-balance sheet accounting model that is similar to current finance lease accounting, with limited exceptions for short-term leases or leases of low value assets. Lessor accounting remains largely unchanged as the distinction between operating and finance leases is retained. The standard is effective for annual periods beginning on or after January 1, 2019. The Trust does not expect this standard to have a significant impact on its combined financial statements as leases with tenants are expected to be accounted for as operating leases in the same manner they are currently being reported. The Trust has two investment properties located on land that is leased. Currently, the ground rent payments are
Granite REIT Annual Report 2018
expensed. It is expected that under IFRS 16, a right-of-use asset addition to investment properties and a lease obligation liability will be recorded with associated financing charges. The Trust also has rent expense associated with office space in Toronto, Canada and Vienna, Austria and office equipment. It is expected that under IFRS 16, a right-of-use asset addition and obligation liability will be recorded for these lease obligations as well. The Trust has completed the issue identification phase of the transition and is in the process of completing its evaluation of the resulting impact on its combined financial statements and internal controls.
IFRIC 23,Uncertainty over Income Tax Treatments
In June 2017, the IFRS Interpretations Committee issued IFRIC 23,Uncertainty over Income Tax Treatments ("IFRIC 23") which clarifies how the recognition and measurement requirements of IAS 12,Income Taxes, are applied where there is uncertainty over income tax treatments. This standard is effective for annual periods beginning on or after January 1, 2019. The Trust is currently assessing the impact of IFRIC 23 on its combined financial statements.
IFRS 3,Business Combinations
In October 2018, the IASB issued amendments to IFRS 3,Business Combinations. The amendments clarified the definition of a business and provide guidance on whether an acquisition represents a group of assets or a business. The amendments also permit a simplified assessment of whether an acquired set of activities and assets is a group of assets rather than a business. Distinguishing between a business and a group of assets is important as an acquirer would only recognize goodwill when acquiring a business. The amendments apply to transactions for which the acquisition date is on or after the first annual reporting period beginning on or after January 1, 2020. Earlier adoption is permitted. The Trust is assessing the impact of these amendments on its combined financial statements.
During the years ended December 31, 2018 and 2017, Granite acquired income-producing properties and development land consisting of the following:
Business Combination — Income-Producing Properties:
2018 Acquisitions
| | | | | | | | |
| | | | | | | |
Property
| | Location
| | Date acquired
| | Property
purchase price
|
|---|
| | | | | | | |
3870 Ronald Reagan Parkway | |
Plainfield, Indiana | |
March 23, 2018 | |
|
$ |
50,835 |
181 Antrim Commons Drive | |
Greencastle, Pennsylvania | |
April 4, 2018 | | |
44,323 |
Ohio portfolio (four properties):
10, 100 and 115 Enterprise Parkway and 15 Commerce Parkway | |
West Jefferson, Ohio | |
May 23, 2018 | | |
299,297 |
Joseph-Meyer-Straße 3 | |
Erfurt, Germany | |
July 12, 2018 | | |
82,677 |
120 Velocity Way | |
Shepherdsville, Kentucky | |
December 3, 2018 | | |
65,866 |
| | | | | | | |
Total purchase price | | | | | |
|
$ |
542,998 |
| | | | | | | |
Granite REIT Annual Report 2018
During the year ended December 31, 2018, the Trust recognized $20.1 million of revenue and $33.2 million of net income related to the aforementioned acquisitions completed in 2018. Had these acquisitions occurred on January 1, 2018, the Trust would have recognized proforma revenue and net income of approximately $35.4 million and $56.7 million, respectively, during the year ended December 31, 2018.
2017 Acquisition
| | | | | | | | | |
| | | | | | | | |
Property
| | Location
| | Date acquired
| | Property
purchase price
| |
|---|
| | | | | | | | |
Mississippi and Ohio portfolio (three properties): | | | | | | | | |
8735 South Crossroads Drive, 535 Gateway Blvd
and 601 & 673 Gateway Blvd | | Olive Branch, Mississippi
and Monroe, Ohio | | October 6, 2017 | | | $ | 154,726 | |
| | | | | | | | |
Total purchase price | | | | | | | $ | 154,726 | |
| | | | | | | | |
During the year ended December 31, 2017, the Trust recognized $2.8 million of revenue and $1.6 million of net income related to the aforementioned acquisition completed in 2017. Had this acquisition occurred on January 1, 2017, the Trust would have recognized proforma revenue and net income of approximately $10.4 million and $7.0 million, respectively, during the year ended December 31, 2017.
The following table summarizes the total consideration paid for the income-producing property acquisitions and the fair value of the total identifiable net assets acquired at the acquisition dates:
| | | | | | | | | |
| | | | | | |
| | 2018
acquisitions
| | 2017
acquisition
| |
|---|
| | | | | | |
Purchase consideration | | | | | | | |
Cash on hand | | | $ | 380,206 | | | $ | 117,227 | |
Cash sourced from credit facility | | | 167,689 | | | 36,752 | |
| | | | | | |
Total cash consideration paid | | | $ | 547,895 | | | $ | 153,979 | |
| | | | | | |
Recognized amounts of identifiable net assets acquired measured at their respective fair values: | | | | | | | |
Investment properties | | | $ | 542,998 | | | $ | 154,726 | |
Working capital | | | 4,897 | | | (747 | ) |
| | | | | | |
Total identifiable net assets | | | $ | 547,895 | | | $ | 153,979 | |
| | | | | | |
During the year ended December 31, 2018, the Trust incurred $7.4 million (2017 — $0.5 million) of land transfer tax, legal and advisory costs associated with the aforementioned completed acquisitions, of which $5.4 million (2017 — nil) related to land transfer tax for the German acquisition. The Trust incurred an additional $0.6 million (2017 — $0.2 million) of costs related to pursuing other acquisition opportunities. These costs are included in acquisition transaction costs in the combined statements of net income.
Asset Purchase — Development Land:
On November 1, 2018, Granite purchased approximately 12.9 acres of development land in West Jefferson, Ohio for cash consideration of $1.2 million.
Acquisition Deposits
As at December 31, 2018, Granite had made deposits of $34.3 million relating to property acquisitions. A deposit of $7.0 million was made to acquire the leasehold interest in two income-producing properties located in Mississauga, Ontario for total consideration of $154.0 million. This commitment to purchase the
Granite REIT Annual Report 2018
two leasehold interests is subject to customary closing conditions and the consent of the ground lessor. A deposit of $27.3 million (US$20.0 million) was also made in connection with a contractual commitment to acquire a property under development in the state of Texas. This commitment to purchase the property under development is subject to specific confidentiality provisions and customary closing conditions including certain purchase rights in favour of the tenant and is expected to close concurrently with the lease commencement in the third quarter of 2019 following construction of the building. These contractual commitments are included in the commitments and contingencies note (note 20(b)).
| | | | | | | |
| | | | | | |
As at December 31,
| | 2018
| | 2017
| |
|---|
| | | | | | |
Income-producing properties | | $ | 3,403,985 | | $ | 2,714,684 | |
Properties under development | | 17,009 | | — | |
Land held for development | | 3,984 | | 18,884 | |
| | | | | | |
| | $ | 3,424,978 | | $ | 2,733,568 | |
| | | | | | |
Changes in investment properties are shown in the following table:
| | | | | | | | | | | | | | | | | | | | | |
| | | | | | | | | | | | | | |
Years ended December 31,
| | 2018
| |
| | 2017
| |
|---|
| | | | | | | | | | | | | | |
| | Income-
producing
properties
| | Properties
under
development
| | Land held for
development
| |
| | Income-
producing
properties
| | Land held for
development
| |
|---|
| | | | | | | | | | | | | | |
Balance, beginning of year | | $ | 2,714,684 | | | $ | — | | | $ | 18,884 | | | | $ | 2,646,292 | | | $ | 6,803 | |
Additions | | | | | | | | | | | | | | | | |
— Capital expenditures: | | | | | | | | | | | | | | | | |
Maintenance or improvements | | 8,164 | | | — | | | — | | | | 21,065 | | | — | |
Developments or expansions | | 19,986 | | | 287 | | | 66 | | | | 72,774 | | | — | |
— Acquisitions (note 3) | | 542,998 | | | — | | | 1,232 | | | | 154,726 | | | — | |
— Leasing commissions | | 3,340 | | | — | | | — | | | | 3,573 | | | — | |
— Tenant incentives | | 816 | | | — | | | — | | | | 803 | | | — | |
Transfers to properties under development | | (12,206 | ) | | 16,473 | | | (4,267 | ) | | | (12,076 | ) | | 12,076 | |
Fair value gains, net | | 353,258 | | | — | | | 1,253 | | | | 212,106 | | | — | |
Foreign currency translation, net | | 147,336 | | | 249 | | | 196 | | | | 12,800 | | | 5 | |
Amortization of straight-line rent | | 4,274 | | | — | | | — | | | | (1,101 | ) | | — | |
Amortization of tenant incentives | | (5,402 | ) | | — | | | — | | | | (5,410 | ) | | — | |
Other changes | | (972 | ) | | — | | | — | | | | 585 | | | — | |
Classified as assets held for sale (note 5) | | (372,291 | ) | | — | | | (13,380 | ) | | | (391,453 | ) | | — | |
| | | | | | | | | | | | | | |
Balance, end of year | | $ | 3,403,985 | | | $ | 17,009 | | | $ | 3,984 | | | | $ | 2,714,684 | | | $ | 18,884 | |
| | | | | | | | | | | | | | |
During the year ended December 31, 2018, the Trust disposed of 16 properties (2017 — no dispositions) previously classified as assets held for sale for aggregate gross proceeds of $729.6 million (note 5). The fair value gains during the year ended December 31, 2018, excluding the 16 properties sold in the year, was $354.5 million. As at December 31, 2018, six properties with an aggregate fair value of $44.2 million, were classified as assets held for sale (note 5).
Granite REIT Annual Report 2018
The Trust determines the fair value of an income-producing property based upon, among other things, rental income from current leases and assumptions about rental income from future leases reflecting market conditions and lease renewals at the applicable balance sheet dates, less future cash outflows in respect of such leases. Fair values are primarily determined by discounting the expected future cash flows, generally over a term of 10 years, plus a terminal value based on the application of a capitalization rate to estimated year 11 cash flows. The fair values of properties under development are measured using a discounted cash flow model, net of costs to complete, as of the balance sheet date. The Trust measures its investment properties using valuations prepared by management. The Trust does not measure its investment properties based on valuations prepared by external appraisers but uses such external appraisals as data points, together with other external market information accumulated by management, in arriving at its own conclusions on values. Management uses valuation assumptions such as discount rates, terminal capitalization rates and market rental rates applied in external appraisals or sourced from valuation experts; however, the Trust also uses its historical renewal experience with tenants, its direct knowledge of the specialized nature of Granite's portfolio and tenant profile and its knowledge of the actual condition of the properties in making business judgments about lease renewal probabilities, renewal rents and capital expenditures. There has been no change in the valuation methodology during the year.
Included in investment properties is $14.8 million (2017 — $9.8 million) of net straight-line rent receivable arising from the recognition of rental revenue on a straight-line basis over the lease term.
Details about contractual obligations to purchase, construct and develop properties can be found in the commitments and contingencies note (note 20).
Tenant minimum rental commitments payable to Granite on non-cancellable operating leases (excluding assets held for sale) are as follows:
| | | | |
| | | | |
Not later than 1 year | | $ | 222,093 | |
Later than 1 year and not later than 5 years | | 759,729 | |
Later than 5 years | | 494,554 | |
| | | | |
| | $ | 1,476,376 | |
| | | | |
Granite REIT Annual Report 2018
Valuations are most sensitive to changes in discount rates and terminal capitalization rates. The key valuation metrics for income-producing properties by country are set out below:
| | | | | | | | | | | | | | | | | | | | | | | | | | | |
| | | | | | | | | | | | | | | | |
As at December 31,
| | 2018(1)
| |
| | 2017(1)
| |
|---|
| | | | | | | | | | | | | | | | |
| | Maximum
| | Minimum
| | Weighted
average(2)
| |
| | Maximum
| | Minimum
| | Weighted
average(2)
| |
|---|
| | | | | | | | | | | | | | | | |
Canada | | | | | | | | | | | | | | | | | | | | | |
Discount rate | | | 7.75% | | | 5.00% | | | 5.63% | | | | | 8.25% | | | 6.50% | | �� | 6.84% | |
Terminal capitalization rate | | | 7.00% | | | 5.00% | | | 6.01% | | | | | 8.00% | | | 5.75% | | | 6.17% | |
United States | | | | | | | | | | | | | | | | | | | | | |
Discount rate | | | 10.00% | | | 5.75% | | | 6.68% | | | | | 11.00% | | | 6.25% | | | 7.68% | |
Terminal capitalization rate | | | 9.75% | | | 5.25% | | | 6.46% | | | | | 10.75% | | | 5.75% | | | 7.30% | |
Germany | | | | | | | | | | | | | | | | | | | | | |
Discount rate | | | 8.25% | | | 5.70% | | | 6.89% | | | | | 9.00% | | | 6.50% | | | 7.89% | |
Terminal capitalization rate | | | 8.75% | | | 5.25% | | | 6.89% | | | | | 9.50% | | | 5.75% | | | 7.91% | |
Austria | | | | | | | | | | | | | | | | | | | | | |
Discount rate | | | 10.00% | | | 8.00% | | | 8.37% | | | | | 10.00% | | | 7.75% | | | 8.05% | |
Terminal capitalization rate | | | 10.00% | | | 7.00% | | | 7.88% | | | | | 9.50% | | | 8.25% | | | 8.53% | |
Netherlands | | | | | | | | | | | | | | | | | | | | | |
Discount rate | | | 6.50% | | | 5.70% | | | 5.93% | | | | | 7.00% | | | 6.25% | | | 6.62% | |
Terminal capitalization rate | | | 7.45% | | | 6.00% | | | 6.48% | | | | | 7.30% | | | 7.05% | | | 7.17% | |
Other | | | | | | | | | | | | | | | | | | | | | |
Discount rate | | | 9.50% | | | 6.75% | | | 8.23% | | | | | 9.85% | | | 7.25% | | | 8.62% | |
Terminal capitalization rate | | | 10.00% | | | 6.75% | | | 8.48% | | | | | 10.00% | | | 6.75% | | | 8.39% | |
Total | | | | | | | | | | | | | | | | | | | | | |
Discount rate | | | 10.00% | | | 5.00% | | | 6.90% | | | | | 11.00% | | | 6.25% | | | 7.59% | |
Terminal capitalization rate | | | 10.00% | | | 5.00% | | | 6.81% | | | | | 10.75% | | | 5.75% | | | 7.48% | |
| | | | | | | | | | | | | | | | |
- (1)
- Excludes assets held for sale at the respective year end (note 5).
- (2)
- Weighted based on income-producing property fair value.
The table below summarizes the sensitivity of the fair value of income-producing properties to changes in either the discount rate or terminal capitalization rate:
| | | | | | | | | | | | | | | |
| | | | | | | | | | |
| | Discount Rate | | Terminal
Capitalization Rate | |
|---|
Rate sensitivity
| | Fair value
| | Change in
fair value
| | Fair value
| | Change in
fair value
| |
|---|
| | | | | | | | | | |
+50 basis points | | $ | 3,278,655 | | | $ | (125,330 | ) | $ | 3,273,191 | | | $ | (130,794 | ) |
+25 basis points | | 3,340,091 | | | (63,894 | ) | 3,335,690 | | | (68,295 | ) |
Base rate | | 3,403,985 | | | — | | 3,403,985 | | | — | |
–25 basis points | | 3,467,547 | | | 63,562 | | 3,475,841 | | | 71,856 | |
–50 basis points | | $ | 3,533,654 | | | $ | 129,669 | | $ | 3,554,797 | | | $ | 150,812 | |
| | | | | | | | | | |
Granite REIT Annual Report 2018
5. ASSETS HELD FOR SALE AND DISPOSITIONS |
At December 31, 2018, six investment properties with an aggregate fair value of $44.2 million are classified as assets held for sale. At December 31, 2017, 10 investment properties having a fair value of $391.5 million were classified as assets held for sale and were disposed of in January 2018.
The six properties classified as assets held for sale at December 31, 2018 consist of the following:
| | | | | | | |
| | | | | | |
Property
| | Location
| | Fair value
| |
|---|
| | | | | | |
3 Walker Drive | | Brampton, Ontario | | | $ | 13,380 | |
375 Edward Street | | Richmond Hill, Ontario | | | 7,800 | |
403 S 8th Street | | Montezuma, Iowa | | | 7,148 | |
1951 A Avenue | | Victor, Iowa | | | 5,520 | |
408 N Maplewood Avenue | | Williamsburg, Iowa | | | 7,162 | |
411 N Maplewood Avenue | | Williamsburg, Iowa | | | 3,228 | |
| | | | | | |
| | | | | $ | 44,238 | |
| | | | | | |
All six properties were sold during January and February 2019 for aggregate proceeds of $43.7 million.
During the year ended December 31, 2018, 16 properties located in Canada, the United States and Germany previously classified as assets held for sale were disposed. The properties consist of the following:
| | | | | | | | | | | |
| | | | | | | | |
Property
| | Location
| | Date disposed
| | Sale price
| |
|---|
| | | | | | | | |
111 Cosma Drive | | Bowling Green, Kentucky | | January 30, 2018 | | | $ | 169,998 | | |
1 Cosma Court and 170 Edward Street | | St Thomas, Ontario | | January 30, 2018 | | | 154,568 | | |
Newpark campus (seven properties): 521, 550, 561, 564, 581, 594 and 630 Newpark Boulevard | | Newmarket, Ontario | | January 31, 2018 | | | 63,000 | | |
1 Clearview Drive | | Tillsonburg, Ontario | | July 18, 2018 | | | 7,200 | | |
120 Moon Acres Road | | Piedmont, South Carolina | | September 13, 2018 | | | 216,459 | | |
1000 JD Yarnell Industrial Parkway | | Clinton, Tennessee | | September 13, 2018 | | | 54,798 | | |
337 and 375 Magna Drive | | Aurora, Ontario | | September 27, 2018 | | | 60,000 | | |
Industriestrasse 11 | | Schleiz, Germany | | October 4, 2018 | | | 3,585 | | |
| | | | | | | | |
| | | | | | | $ | 729,608 | | |
| | | | | | | | |
The gross proceeds of $63.0 million for the seven properties in Newmarket, Ontario included a vendor take-back mortgage of $30.0 million. The mortgage receivable bore interest at an annual rate of 6.0% and was repaid on April 16, 2018.
The gross proceeds noted above for the property disposals in South Carolina and Tennessee included $12.3 million (US$9.5 million) and $0.4 million (US$0.3 million) of proceeds that are expected to be received in the first quarters of 2020 and 2019, respectively. The estimated sale price of $216.5 million for the South Carolina disposition and $54.8 million for the Tennessee disposition was determined using an income approach which assumed a forecast consumer price index inflation factor at the date of disposition. Accordingly, the proceeds receivable are subject to change and will be dependent upon the actual consumer
Granite REIT Annual Report 2018
price index inflation factors as at December 31, 2018 and 2019. During the year ended December 31, 2018, the changes in the proceeds receivable are shown in the following table:
| | | | | | | | | |
| | | | | | |
| | South Carolina
property
| | Tennessee
property
| |
|---|
| | | | | | |
Balance, September 13, 2018 | | | $ | 12,313 | | | $ | 400 | |
| | | | | | |
Change in consumer price index inflation factor | | | (1,166 | ) | | (231 | ) |
Foreign exchange | | | 658 | | | 62 | |
| | | | | | |
Balance, December 31, 2018 | | | $ | 11,805 | | | $ | 231 | |
| | | | | | |
At December 31, 2018, the proceeds receivable of $11.8 million (US$8.7 million) for the property disposed of in South Carolina is recorded in other assets (note 6) and the $0.2 million (US$0.2 million) proceeds receivable from the Tennessee property disposal is included in accounts receivable on the combined balance sheet.
In connection with the property disposal in South Carolina, Granite has retained an obligation to make certain repairs to the building. Accordingly, a liability of approximately $2.0 million is recorded in accounts payable and accrued liabilities on the combined balance sheet (note 9). The estimated amount was determined using a third-party report but can change over time as the repairs are completed.
The following table summarizes the fair value changes in properties classified as assets held for sale:
| | | | | | | |
| | | | | | |
Years ended December 31,
| | 2018
| | 2017
| |
|---|
| | | | | | |
Balance, beginning of year | | $ | 391,453 | | $
| —
| |
| | | | | | |
Fair value gains, net | | 196 | | — | |
Foreign currency translation, net | | (3,466 | ) | — | |
Disposals | | (729,608 | ) | — | |
Classified as assets held for sale from investment properties (note 4) | | 385,671 | | 391,453 | |
Other | | (8 | ) | —
| |
| | | | | | |
Balance, end of year | | $ | 44,238 | | $ | 391,453 | |
| | | | | | |
During the year ended December 31, 2018, Granite incurred $6.9 million (2017 — $0.4 million) of broker commissions and legal and advisory costs associated with the disposal or planned disposal of the assets held for sale which are included in loss on sale of investment properties on the combined statements of net income. The $6.9 million loss on sale of investment properties for the year ended December 31, 2018 also included $1.4 million relating to the adjustment in proceeds receivable from the South Carolina and Tennessee property disposals arising from the change in consumer price index inflation factors noted above.
Granite REIT Annual Report 2018
Other assets consist of:
| | | | | | | |
| | | | | | |
As at December 31,
| | 2018
| | 2017
| |
|---|
| | | | | | |
Deferred financing costs associated with the revolving credit facility | | $ | 1,172 | | $ | 211 | |
Long-term receivables | | 448 | | 455 | |
Long-term proceeds receivable associated with a property disposal (note 5) | | 11,805 | | —
| |
| | | | | | |
| | $ | 13,425 | | $ | 666 | |
| | | | | | |
The long-term proceeds receivable associated with a property disposal is expected to be settled in the first quarter of 2020.
Prepaid Expenses and Other
As at December 31, 2018, prepaid expenses and other of $2.5 million (2017 — $2.0 million) primarily includes prepaid insurance premiums of $1.0 million (2017 — $0.6 million), prepaid interest associated with the 2025 Term Loan (note 8) of $0.4 million (2017 — nil) and unrealized gains on foreign exchange forward contracts of $0.1 million (2017 — $0.7 million).
8. UNSECURED DEBT AND CROSS CURRENCY INTEREST RATE SWAPS |
- (a)
- Unsecured Debentures and Term Loans, Net
| | | | | | | | | | | | | | | | | | |
| | | | | | | | | | | | |
As at December 31,
| |
| | 2018
| | 2017
| |
|---|
| | | | | | | | | | | | |
| | Maturity Date
| | Amortized
Cost(1)
| | Principal
issued and
outstanding
| | Amortized
Cost(1)
| | Principal
issued and
outstanding
| |
|---|
| | | | | | | | | | | | |
2021 Debentures | | July 5, 2021 | | $ | 249,424 | | | $ | 250,000 | | | $ | 249,201 | | | $ | 250,000 | |
2023 Debentures | | November 30, 2023 | | 398,425 | | | 400,000 | | | 398,105 | | | 400,000 | |
2022 Term Loan(2) | | December 19, 2022 | | 251,853 | | | 252,414 | | | — | | | — | |
2025 Term Loan | | December 12, 2025 | | 298,712 | | | 300,000 | | | — | | | —
| |
| | | | | | | | | | | | |
| | | | $ | 1,198,414 | | | $ | 1,202,414 | | | $ | 647,306 | | | $ | 650,000 | |
| | | | | | | | | | | | |
- (1)
- The amounts outstanding are net of deferred financing costs. The deferred financing costs are amortized using the effective interest method and recorded in interest expense.
- (2)
- The term loan maturing on December 19, 2022 is denominated in US dollars and was originally drawn in the amount of US$185.0 million.
2021 Debentures
On July 3, 2014, Granite REIT Holdings Limited Partnership ("Granite LP"), a wholly-owned subsidiary of Granite, issued at par $250.0 million aggregate principal amount of 3.788% Series 2 senior debentures due July 5, 2021 (the "2021 Debentures"). Interest on the 2021 Debentures is payable semi-annually in arrears on January 5 and July 5 of each year. Deferred financing costs of $1.6 million were incurred and recorded as a reduction against the principal owing.
Granite REIT Annual Report 2018
The 2021 Debentures are redeemable, in whole or in part, at Granite's option at any time and from time to time, at a price equal to accrued and unpaid interest plus the greater of (a) 100% of the principal amount of the 2021 Debentures to be redeemed; and (b) the Canada Yield Price. The Canada Yield Price means, in respect of a 2021 Debenture, a price equal to which, if the 2021 Debenture were to be issued at such price on the redemption date, would provide a yield thereon from the redemption date to its maturity date equal to 46.0 basis points above the yield that a non-callable Government of Canada bond, trading at par, would carry if issued on the redemption date with a maturity date of July 5, 2021. Granite also has the option to redeem the 2021 Debentures at par plus any accrued and unpaid interest within 30 days of the maturity date of July 5, 2021.
2023 Debentures
On December 20, 2016, Granite LP issued $400.0 million aggregate principal amount of 3.873% Series 3 senior debentures due November 30, 2023 (the "2023 Debentures") at a nominal premium. Interest on the 2023 Debentures is payable semi-annually in arrears on May 30 and November 30 of each year. Deferred financing costs of $2.2 million were incurred and recorded as a reduction against the principal owing.
The 2023 Debentures are redeemable, in whole or in part, at Granite's option at any time and from time to time, at a price equal to accrued and unpaid interest plus the greater of (a) 100% of the principal amount of the 2023 Debentures to be redeemed; and (b) the Canada Yield Price. The Canada Yield Price means, in respect of a 2023 Debenture, a price equal to which, if the 2023 Debenture were to be issued at such price on the redemption date, would provide a yield thereon from the redemption date to its maturity date equal to 62.5 basis points above the yield that a non-callable Government of Canada bond, trading at par, would carry if issued on the redemption date with a maturity date of November 30, 2023. Granite also has the option to redeem the 2023 Debentures at par plus any accrued and unpaid interest within 30 days of the maturity date of November 30, 2023.
2022 Term Loan
On December 19, 2018, Granite LP entered into a senior unsecured non-revolving term facility in the amount of US$185.0 million (the "2022 Term Loan") that matures on December 19, 2022. The 2022 Term Loan was available in one US dollar drawdown and is fully prepayable without penalty. Any amount repaid may not be re-borrowed. On December 19, 2018, US$185.0 million was drawn on the 2022 Term Loan. Interest on drawn amounts is calculated based on LIBOR plus an applicable margin determined by reference to the external credit rating of Granite LP and is payable monthly in arrears. Deferred financing costs of $0.6 million were incurred and recorded as a reduction against the principal owing.
2025 Term Loan
On December 12, 2018, Granite LP entered into a senior unsecured non-revolving term facility in the amount of $300.0 million (the "2025 Term Loan") that matures on December 12, 2025. The 2025 Term Loan was available in one drawdown and is fully prepayable without penalty. Any amount repaid may not be re-borrowed. On December 12, 2018, $300.0 million was drawn on the 2025 Term Loan. Interest on drawn amounts is calculated based on the Canadian Dollar Offered Rate ("CDOR") plus an applicable margin determined by reference to the external credit rating of Granite LP and is payable monthly in advance. Deferred financing costs of $1.3 million were incurred and recorded as a reduction against the principal owing.
The 2021 Debentures, 2023 Debentures, 2022 Term Loan and 2025 Term Loan rank pari passu with all of Granite LP's other existing and future senior unsecured indebtedness and are guaranteed by Granite REIT and Granite GP.
Granite REIT Annual Report 2018
- (b)
- Cross Currency Interest Rate Swaps
| | | | | | | |
| | | | | | |
As at December 31,
| | 2018
| | 2017
| |
|---|
| | | | | | |
Financial liabilities at fair value | | | | | |
2021 Cross Currency Interest Rate Swap | | $ | 26,877 | | $ | 19,429 | |
2023 Cross Currency Interest Rate Swap | | 56,922 | | 42,037 | |
2022 Cross Currency Interest Rate Swap | | 3,826 | | — | |
2025 Cross Currency Interest Rate Swap | | 17,132 | | —
| |
| | | | | | |
| | $ | 104,757 | | $ | 61,466 | |
| | | | | | |
On July 3, 2014, the Trust entered into a cross currency interest rate swap (the "2021 Cross Currency Interest Rate Swap") to exchange the 3.788% interest payments from the 2021 Debentures for Euro denominated payments at a 2.68% fixed interest rate. In addition, under the terms of the swap, the Trust will pay principal proceeds of €171.9 million in exchange for which it will receive $250.0 million on July 5, 2021.
On December 20, 2016, the Trust entered into a cross currency interest rate swap (the "2023 Cross Currency Interest Rate Swap") to exchange the 3.873% interest payments from the 2023 Debentures for Euro denominated payments at a 2.43% fixed interest rate. In addition, under the terms of the swap, the Trust will pay principal proceeds of €281.1 million in exchange for which it will receive $400.0 million on November 30, 2023.
On December 19, 2018, the Trust entered into a cross currency interest rate swap (the "2022 Cross Currency Interest Rate Swap") to exchange the LIBOR plus margin interest payments from the 2022 Term Loan for Euro denominated payments at a 1.225% fixed interest rate. In addition, under the terms of the swap, the Trust will pay principal proceeds of €163.0 million in exchange for which it will receive US$185.0 million on December 19, 2022.
On December 12, 2018, the Trust entered into a cross currency interest rate swap (the "2025 Cross Currency Interest Rate Swap") to exchange the CDOR plus margin interest payments from the 2025 Term Loan for Euro denominated payments at a 2.202% fixed interest rate. In addition, under the terms of the swap, the Trust will pay principal proceeds of €198.2 million in exchange for which it will receive $300.0 million on December 12, 2025.
The cross currency interest rate swaps are designated as net investment hedges of the Trust's investment in foreign operations. In addition, the Trust has on occasion designated its US dollar draws from the credit facility as net investment hedges of its investment in the US operations. The effectiveness of the hedges are assessed quarterly. For the year ended December 31, 2018, the Trust has assessed that the hedges continued to be effective. As an effective hedge, the fair value gains or losses on the cross currency interest rate swaps and the foreign exchange gains or losses on the outstanding 2022 Term Loan and US dollar credit facility draws are recognized in other comprehensive income. The Trust has elected to record the differences resulting from the lower interest rate associated with the cross currency interest rate swaps in the combined statements of net income.
Granite REIT Annual Report 2018
Other Liability
As at December 31, 2017, the other liability consisted of a tenant allowance payable of $9.0 million (€6.0 million). This tenant allowance was paid to a tenant on February 2, 2018 and related to a 2014 lease extension at the Eurostar facility in Graz, Austria. The €6.0 million allowance was discounted and was accreted to its face value through a charge to interest expense. During the year ended December 31, 2018, accretion of $0.1 million (2017 — $0.7 million) was charged to interest expense.
Deferred Revenue
Deferred revenue relates to prepaid and unearned revenue received from tenants and fluctuates with the timing of rental receipts.
Bank Indebtedness
On February 1, 2018, the Trust entered into a new unsecured revolving credit facility in the amount of $500.0 million that is available by way of Canadian dollar, US dollar or Euro denominated loans or letters of credit and matures on February 1, 2023. The Trust has the option to extend the maturity date by one year to February 1, 2024 subject to the agreement of lenders in respect of a minimum of 662/3% of the aggregate amount committed under the facility. The credit facility provides the Trust with the ability to increase the amount of the commitment by an additional aggregate principal amount of up to $100.0 million with the consent of the participating lenders. As at December 31, 2018, the Trust had no amounts (2017 — $32.6 million) drawn from the credit facility and $0.1 million (2017 — $0.2 million) in letters of credit issued against the facility.
Accounts Payable and Accrued Liabilities
| | | | | | | |
| | | | | | |
As at December 31,
| | 2018
| | 2017
| |
|---|
| | | | | | |
Accounts payable | | $ | 5,352 | | $ | 5,676 | |
Accrued salaries, incentives and benefits | | 5,364 | | 4,304 | |
Accrued interest payable | | 6,606 | | 6,016 | |
Accrued construction payable | | 2,429 | | 12,622 | |
Accrued professional fees | | 2,910 | | 2,434 | |
Accrued employee unit-based compensation | | 3,193 | | 3,416 | |
Accrued trustee/director unit-based compensation | | 2,330 | | 1,367 | |
Accrued property operating costs | | 2,013 | | 3,110 | |
Accrued land transfer tax in connection with an acquisition | | 5,499 | | — | |
Accrued leasing commissions | | 407 | | 1,291 | |
Accrual associated with a property disposal (note 5) | | 2,047 | | — | |
Other accrued liabilities | | 3,817 | | 3,106 | |
| | | | | | |
| | $ | 41,967 | | $ | 43,342 | |
| | | | | | |
10. DISTRIBUTIONS TO STAPLED UNITHOLDERS |
Distributions payable at December 31, 2018 of $24.3 million were paid on January 15, 2019 and represent the December 2018 monthly distributions of $10.6 million (23.3 cents per stapled unit) and a special
Granite REIT Annual Report 2018
distribution of $13.7 million (30.0 cents per stapled unit). Distributions payable at December 31, 2017 of $10.6 million were paid on January 16, 2018 and represented the December 2017 monthly distributions.
Total distributions declared to stapled unitholders are as follows:
| | | | | | | | | | | | | | | | | |
| | | | | | | | | | |
Years ended December 31,
| | 2018
| | 2017
| |
|---|
| | | | | | | | | | |
| | Total
distributions
| | Distributions
per unit
| | Total
distributions
| | Distributions
per unit
| |
|---|
| | | | | | | | | | |
Monthly distributions paid and payable in cash | | | $ | 125,131 | | | $ | 2.73 | | | $ | 123,058 | | | $ | 2.61 | |
Special distribution payable in cash | | | 13,710 | | | $ | 0.30 | | | — | | | — | |
Special distribution payable in stapled units | | | 41,128 | | | $ | 0.90 | | | — | | | —
| |
| | | | | | | | | | |
| | | $ | 179,969 | | | | | | $ | 123,058 | | | | |
| | | | | | | | | | |
As a result of the increase in taxable income generated primarily as a result of the sale transactions in 2018, Granite's Board of Trustees declared a special distribution in December 2018 of $1.20 per stapled unit which comprised 30.0 cents per unit payable in cash and 90.0 cents per unit payable by the issuance of stapled units. Immediately following the issuance of the stapled units, the stapled units were consolidated such that each unitholder held the same number of stapled units after the consolidation as each unitholder held prior to the special distribution. As at December 31, 2018, the special distribution declared in units of $41.1 million was recorded to contributed surplus in accordance with IAS 32,Financial Instruments: Presentation as the Trust was settling the distribution with a fixed number of its own equity instruments.
Subsequent to December 31, 2018, the distributions declared in January 2019 in the amount of $10.6 million or 23.3 cents per stapled unit were paid on February 15, 2019 and the distributions declared in February 2019 of $10.6 million or 23.3 cents per stapled unit will be paid on March 15, 2019.
11. STAPLED UNITHOLDERS' EQUITY |
- (a)
- Stapled Units
The stapled units consist of one unit of Granite REIT and one common share of Granite GP. Granite REIT is authorized to issue an unlimited number of units. Granite GP's authorized share capital consists of an unlimited number of common shares without par value. Each stapled unit is entitled to distributions and/or dividends in the case of Granite GP as and when declared and, in the event of termination of Granite REIT and Granite GP, to the net assets of Granite REIT and Granite GP remaining after satisfaction of all liabilities.
- (b)
- Unit-Based Compensation
Incentive Stock Option Plan
The Incentive Stock Option Plan allows for the grant of stock options or stock appreciation rights to directors, officers, employees and consultants. As at December 31, 2018 and December 31, 2017, there were no options outstanding under this plan.
Director/Trustee Deferred Share Unit Plan
Granite established Non-Employee Director Share-Based Compensation Plans (the "DSPs") which provide for a deferral of up to 100% of each non-employee director's total annual remuneration, at specified levels elected by each director, until such director ceases to be a director. The amounts deferred under the DSPs are reflected by notional deferred share units ("DSUs") whose value at the time that the particular payment
Granite REIT Annual Report 2018
to the director is determined reflects the fair market value of a stapled unit. The value of a DSU thus appreciates or depreciates with changes in the market price of the stapled units. The DSPs also provide for the accrual of notional distribution equivalents on any distributions paid on the stapled units. Under the DSPs, when a director or trustee leaves the Board, the director or trustee receives a cash payment at an elected date equal to the value of the accrued DSUs at such date. There is no option under the DSPs for directors or trustees to receive stapled units in exchange for DSUs.
A reconciliation of the changes in the DSUs outstanding is presented below:
| | | | | | | | | | | | | | | | | |
| | | | | | | | | | |
| | 2018 | | 2017 | |
|---|
| | Number
(000s)
| | Weighted Average
Grant Date
Fair Value
| | Number
(000s)
| | Weighted Average
Grant Date
Fair Value
| |
|---|
| | | | | | | | | | |
DSUs outstanding, January 1 | | | 28 | | | $ | 41.88 | | | 147 | | | $ | 35.43 | |
Granted | | | 16 | | | 53.11 | | | 23 | | | 48.75 | |
Settled | | | — | | | — | | | (142 | ) | | 50.81 | |
| | | | | | | | | | |
DSUs outstanding, December 31 | | | 44 | | | $ | 46.01 | | | 28 | | | $ | 41.88 | |
| | | | | | | | | | |
Executive Deferred Stapled Unit Plan
The Executive Stapled Unit Plan (the "Stapled Unit Plan") is designed to provide equity-based compensation in the form of stapled units to executives and other employees (the "Participants"). The maximum number of stapled units which may be issued pursuant to the Stapled Unit Plan is 1.0 million. The Stapled Unit Plan entitles a Participant to receive a stapled unit or a cash payment equal to the market value of the stapled unit, which on any date is the volume weighted average trading price of a stapled unit on the Toronto Stock Exchange or New York Stock Exchange over the preceding five trading days. The form of redemption of the stapled units is determined by the Compensation, Governance and Nominating Committee and is not at the option of the Participant. Vesting conditions in respect of a grant are determined by the Compensation, Governance and Nominating Committee at the time the grant is made and may result in the vesting of more or less than 100% of the number of stapled units. The Stapled Unit Plan also provides for the accrual of distribution equivalent amounts based on distributions paid on the stapled units. Stapled units are, unless otherwise agreed or otherwise required by the Stapled Unit Plan, settled within 60 days following vesting.
A reconciliation of the changes in stapled units outstanding under the Stapled Unit Plan is presented below:
| | | | | | | | | |
| | | | | | | | | | |
| | 2018 | | 2017 | |
|---|
| | Number
(000s)
| | Weighted Average
Grant Date
Fair Value
| | Number
(000s)
| | Weighted Average
Grant Date
Fair Value
| |
|---|
| | | | | | | | | | |
Stapled units outstanding, January 1 | | 106 | | $43.32 | | 82 | | $42.34 | |
New grants(1) | | 75 | | 53.29 | | 49 | | 45.81 | |
Forfeited | | — | | — | | (3 | ) | 45.23 | |
Settled | | (64 | ) | 42.14 | | (22 | ) | 45.36 | |
| | | | | | | | | | |
Stapled units outstanding, December 31(1) | | 117 | | $50.34 | | 106 | | $43.32 | |
| | | | | | | | | | |
- (1)
- New grants include 3,730 performance based units granted to an executive during 2018 (2017 — nil).
Granite REIT Annual Report 2018
The Trust's unit-based compensation expense recognized in general and administrative expenses was:
| | | | | | | |
| | | | | | |
Years ended December 31,
| | 2018
| | 2017
| |
|---|
| | | | | | |
DSPs for trustees/directors | | $ | 948 | | $ | 2,001 | |
Stapled Unit Plan for executives and employees | | 2,996 | | 2,911 | |
| | | | | | |
Unit-based compensation expense | | $ | 3,944 | | $ | 4,912 | |
| | | | | | |
Fair value remeasurement expense included in the above | | $ | 500 | | $ | 1,237 | |
| | | | | | |
- (c)
- Normal Course Issuer Bid
On May 16, 2018, Granite announced the acceptance by the Toronto Stock Exchange ("TSX") of Granite's Notice of Intention to Make a Normal Course Issuer Bid ("NCIB"). Pursuant to the NCIB, Granite proposes to purchase through the facilities of the TSX and any alternative trading system in Canada, from time to time and if considered advisable, up to an aggregate of 3,939,255 of Granite's issued and outstanding stapled units. The NCIB commenced on May 18, 2018 and will conclude on the earlier of the date on which purchases under the bid have been completed and May 17, 2019. Pursuant to the policies of the TSX, daily purchases made by Granite through the TSX may not exceed 16,546 stapled units, subject to certain exceptions. Granite entered into an automatic securities purchase plan with a broker in order to facilitate repurchases of the stapled units under the NCIB during specified blackout periods. Pursuant to a previous notice of intention to conduct a NCIB, Granite received approval from the TSX to purchase stapled units for the period May 16, 2017 to May 15, 2018.
During the year ended December 31, 2018, Granite repurchased 1,282,171 stapled units (2017 — 241,034 stapled units) for consideration of $63.5 million (2017 — $12.0 million). The difference between the repurchase price and the average cost of the stapled units of $5.6 million (2017 — $1.2 million) was recorded to contributed surplus. Subsequent to year end and as at March 6, 2019, an additional 700 units were repurchased for less than $0.1 million.
- (d)
- Accumulated Other Comprehensive Income
Accumulated other comprehensive income consists of the following:
| | | | | | | |
| | | | | | |
As at December 31,
| | 2018
| | 2017
| |
|---|
| | | | | | |
Foreign currency translation gains on investments in subsidiaries, net of related hedging activities and non-controlling interests(1) | | $ | 320,158 | | $ | 183,729 | |
Fair value losses on derivatives designated as net investment hedges | | (108,706 | ) | (65,163 | ) |
| | | | | | |
| | $ | 211,452 | | $ | 118,566 | |
| | | | | | |
- (1)
- Includes foreign currency translation gains and losses from non-derivative financial instruments designated as net investment hedges.
Granite REIT Annual Report 2018
12. RECOVERIES, COSTS AND EXPENSES |
- (a)
- Tenant recoveries revenue consist of:
| | | | | | | |
| | | | | | |
Years ended December 31,
| | 2018
| | 2017
| |
|---|
| | | | | | |
Property taxes | | $ | 19,344 | | $ | 22,609 | |
Property insurance | | 2,174 | | 1,903 | |
Operating costs | | 4,983 | | 2,433 | |
| | | | | | |
| | $ | 26,501 | | $ | 26,945 | |
| | | | | | |
- (b)
- Property operating costs consist of:
| | | | | | | |
| | | | | | |
Years ended December 31,
| | 2018
| | 2017
| |
|---|
| | | | | | |
Non-recoverable from tenants: | | | | | |
Property taxes and utilities | | $ | 1,077 | | $ | 1,035 | |
Legal | | 436 | | 324 | |
Consulting | | 123 | | 379 | |
Environmental and appraisals | | 702 | | 708 | |
Repairs and maintenance | | 725 | | 659 | |
Ground rents | | 664 | | 628 | |
Other | | 730 | | 653 | |
| | | | | | |
| | $ | 4,457 | | $ | 4,386 | |
| | | | | | |
Recoverable from tenants: | |
| |
| |
Property taxes and utilities | | $ | 20,127 | | $ | 23,105 | |
Property insurance | | 2,138 | | 1,910 | |
Repairs and maintenance | | 2,069 | | 749 | |
Property management fees | | 1,470 | | 741 | |
Other | | 681 | | 454 | |
| | | | | | |
| | $ | 26,485 | | $ | 26,959 | |
| | | | | | |
Property operating costs | | $ | 30,942 | | $ | 31,345 | |
| | | | | | |
- (c)
- General and administrative expenses consist of:
| | | | | | | |
| | | | | | |
Years ended December 31,
| | 2018
| | 2017
| |
|---|
| | | | | | |
Salaries, incentives and benefits | | $ | 16,030 | | $ | 12,113 | |
Audit, legal and consulting | | 3,972 | | 3,382 | |
Trustee/director fees and related expenses | | 1,067 | | 1,438 | |
Unit-based compensation including distributions and revaluations | | 3,214 | | 4,017 | |
Other public entity costs | | 1,651 | | 1,687 | |
Office rents | | 900 | | 901 | |
Other | | 2,570 | | 2,528 | |
| | | | | | |
| | $ | 29,404 | | $ | 26,066 | |
| | | | | | |
Granite REIT Annual Report 2018
(d) In connection with the proxy contest that preceded the June 2017 annual general meeting ("AGM"), Granite incurred $5.9 million of expenses in the year ended December 31, 2017. Included in the proxy contest expenses are legal, advisory and proxy solicitation costs incurred directly by Granite and a $2.0 million reimbursement of out-of-pocket fees and expenses incurred by Front Four Capital Group and Sandpiper Group regarding matters relating to the AGM. Sandpiper Group received $0.7 million of the reimbursement. An individual affiliated with Sandpiper Group is a related party of Granite by virtue of becoming a director of Granite GP and a trustee of Granite REIT.
- (e)
- Interest expense and other financing costs consist of:
| | | | | | | |
| | | | | | |
Years ended December 31,
| | 2018
| | 2017
| |
|---|
| | | | | | |
Interest and amortized issuance costs relating to debentures and term loans | | $ | 18,544 | | $ | 17,416 | |
Amortization of deferred financing costs and other interest expense and accretion charges | | 3,869 | | 2,595 | |
| | | | | | |
| | $ | 22,413 | | $ | 20,011 | |
| | | | | | |
(f) For the year ended December 31, 2018, foreign exchange gains of $9.4 million (2017 — loss of $0.6 million) included, among other, an $8.5 million foreign exchange gain due to the remeasurement of the US dollar proceeds from the sale of three investment properties in January 2018 and a $1.4 million gain from the settlement of two cross currency swaps during the 2018 year for which the Trust did not employ hedge accounting.
- (g)
- Fair value losses on financial instruments consist of:
| | | | | | | |
| | | | | | |
Years ended December 31,
| | 2018
| | 2017
| |
|---|
| | | | | | |
Foreign exchange forward contracts, net | | $ | 562 | | $ | 823 | |
| | | | | | |
| | $ | 562 | | $ | 823 | |
| | | | | | |
(h) During the year ended December 31, 2018, Granite entered into a settlement agreement related to a land use matter for a property in Ontario, Canada. Granite was awarded a settlement amount of $2.3 million of which $1.4 million was received during 2018 and the remaining balance was collected in January 2019.
Granite REIT Annual Report 2018
- (a)
- The major components of the income tax expense are:
| | | | | | | |
| | | | | | |
Years ended December 31,
| | 2018
| | 2017
| |
|---|
| | | | | | |
Current income tax: | | | | | |
Current taxes | | $ | 7,902 | | $ | 6,503 | |
Current taxes referring to previous periods | | (973 | ) | 228 | |
Withholding taxes and other | | 702 | | 978 | |
| | | | | | |
| | $ | 7,631 | | $ | 7,709 | |
| | | | | | |
Deferred income tax: | |
| |
| |
Origination and reversal of temporary differences | | $ | 56,423 | | $ | 42,250 | |
Impact of changes in tax rates | | (4,637 | ) | (35,047 | ) |
Benefits arising from a previously unrecognized tax loss that reduced: | | | | | |
— Current tax expense | | (6,408 | ) | — | |
— Deferred tax expense | | (200 | ) | — | |
Withholding taxes on profits of subsidiaries | | 85 | | (629 | ) |
Other | | (243 | ) | (865 | ) |
| | | | | | |
| | $ | 45,020 | | $ | 5,709 | |
| | | | | | |
Income tax expense | | $ | 52,651 | | $ | 13,418 | |
| | | | | | |
For the year ended December 31, 2018, current tax expense includes $0.2 million (2017 — nil) associated with the disposition of a property in Germany.
(b) The effective income tax rate reported in the combined statements of net income varies from the Canadian statutory rate for the following reasons:
| | | | | | | | |
| | | | | | |
Years ended December 31,
| | 2018
| | 2017
| |
|---|
| | | | | | |
Income before income taxes | | $ | 518,008 | | | $ | 371,166 | |
| | | | | | |
Expected income taxes at the Canadian statutory tax rate of 26.5%
(2017 — 26.5%) | | $ | 137,272 | | | $ | 98,359 | |
Income distributed and taxable to unitholders | | (81,272 | ) | | (50,005 | ) |
Net foreign rate differentials | | (7,830 | ) | | (3,708 | ) |
Net change in provisions for uncertain tax positions | | 810 | | | 1,762 | |
Net permanent differences | | 7,261 | | | 1,947 | |
Net effect of change in tax rates | | (4,637 | ) | | (35,047 | ) |
Withholding taxes and other | | 1,047 | | | 110 | |
| | | | | | |
Income tax expense | | $ | 52,651 | | | $ | 13,418 | |
| | | | | | |
Granite REIT Annual Report 2018
- (c)
- Deferred tax assets and liabilities consist of temporary differences related to the following:
| | | | | | | |
| | | | | | |
As at December 31,
| | 2018
| | 2017
| |
|---|
| | | | | | |
Deferred tax assets: | | | | | |
Investment properties | | $ | 769 | | $ | 11 | |
Eligible capital expenditures | | 2,441 | | 2,625 | |
Other | | 2,091 | | 3,106 | |
| | | | | | |
Deferred tax assets | | $ | 5,301 | | $ | 5,742 | |
| | | | | | |
Deferred tax liabilities: | |
| |
| |
Investment properties | | $ | 304,593 | | $ | 243,357 | |
Withholding tax on undistributed subsidiary profits | | 682 | | 512 | |
Other | | (1,310 | ) | 183 | |
| | | | | | |
Deferred tax liabilities | | $ | 303,965 | | $ | 244,052 | |
| | | | | | |
- (d)
- Changes in the net deferred tax liabilities consist of the following:
| | | | | | | |
| | | | | | |
Years ended December 31,
| | 2018
| | 2017
| |
|---|
| | | | | | |
Balance, beginning of year | | $ | 238,310 | | $ | 231,852 | |
Deferred tax expense recognized in net income | | 45,020 | | 5,709 | |
Foreign currency translation of deferred tax balances | | 15,334 | | 749 | |
| | | | | | |
Net deferred tax liabilities, end of year | | $ | 298,664 | | $ | 238,310 | |
| | | | | | |
(e) Net cash payments of income taxes amounted to $10.3 million for the year ended December 31, 2018 (2017 — $3.5 million) which included $0.7 million of withholding taxes paid (2017 — $1.0 million).
(f) The Trust conducts operations in a number of countries with varying statutory rates of taxation. Judgment is required in the estimation of income tax expense and deferred income tax assets and liabilities in each of the Trust's operating jurisdictions. This process involves estimating actual current tax exposure, assessing temporary differences that result from the different treatments of items for tax and accounting purposes, assessing whether it is more likely than not that deferred income tax assets will be realized and, based on all the available evidence, determining if a provision is required on all or a portion of such deferred income tax assets. The Trust reports a liability for uncertain tax positions ("unrecognized tax benefits") taken or expected to be taken in a tax return. The Trust recognizes interest and penalties, if any, related to unrecognized tax benefits in income tax expense.
As at December 31, 2018, the Trust had $13.2 million (2017 — $12.0 million) of unrecognized income tax benefits, including $0.3 million (2017 — $0.2 million) related to accrued interest and penalties, all of which could ultimately reduce the Trust's effective tax rate should these tax benefits become recognized. The Trust believes that it has adequately provided for reasonably foreseeable outcomes related to tax examinations and that any resolution will not have a material effect on the combined financial position, results of operations or cash flows. However, the Trust cannot predict with any level of certainty the exact nature of any future possible outcome.
Granite REIT Annual Report 2018
A reconciliation of the beginning and ending amounts of unrecognized tax benefits is as follows:
| | | | | | | |
| | | | | | |
As at December 31,
| | 2018
| | 2017
| |
|---|
| | | | | | |
Unrecognized tax benefits balance, beginning of year | | $ | 12,035 | | $ | 10,143 | |
Decreases for tax positions of prior years | | (1,183 | ) | (416 | ) |
Increases for tax positions of current year | | 1,898 | | 1,727 | |
Foreign currency impact | | 447 | | 581 | |
| | | | | | |
Unrecognized tax benefits balance, end of year | | $ | 13,197 | | $ | 12,035 | |
| | | | | | |
It is reasonably possible that the gross unrecognized tax benefits, as of December 31, 2018, could decrease in the next 12 months. The quantum of the decrease could range between a nominal amount and $2.8 million (2017 — a nominal amount and $0.4 million) and relates primarily to tax years becoming statute barred for purposes of future tax examinations by local taxing authorities and the outcome of current tax examinations. For the year ended December 31, 2018, $0.1 million of interest and penalties was recorded (2017 — $0.1 million) in income tax expense in the combined statements of net income.
As at December 31, 2018, the following tax years remained subject to examination:
| | | | |
| | | | |
Major Jurisdictions
| |
| |
|---|
| | | | |
Canada | | 2012 through 2018 | |
United States | | 2015 through 2018 | |
Austria | | 2013 through 2018 | |
Germany | | 2013 through 2018 | |
Netherlands | | 2013 through 2018 | |
| | | | |
As at December 31, 2018, the Trust had approximately $280.0 million of Canadian capital loss carryforwards that do not expire and other losses and deductible temporary differences in various tax jurisdictions of approximately $32.9 million. The Trust believes it is not probable that these tax assets can be realized; and accordingly, no related deferred tax asset was recognized at December 31, 2018.
14. SEGMENTED DISCLOSURE INFORMATION |
The Trust has one reportable segment — the ownership and rental of industrial real estate as determined by the information reviewed by the chief operating decision maker who is the President and Chief Executive Officer. The following tables present certain information with respect to geographic segmentation:
Revenue
| | | | | | | | | | | | | |
| | | | | | | | | | |
Years ended December 31,
| | 2018
| | 2017
| |
|---|
| | | | | | | | | | |
Canada | | $ | 54,372 | | 22% | | $ | 73,261 | | 30% | |
United States | | 88,006 | | 36% | | 72,143 | | 30% | |
Austria | | 65,523 | | 26% | | 61,687 | | 25% | |
Germany | | 24,735 | | 10% | | 22,721 | | 9% | |
Netherlands | | 8,621 | | 3% | | 9,577 | | 4% | |
Other Europe | | 6,226 | | 3% | | 5,294 | | 2% | |
| | | | | | | | | | |
| | $ | 247,483 | | 100% | | $ | 244,683 | | 100% | |
| | | | | | | | | | |
Granite REIT Annual Report 2018
For the year ended December 31, 2018, revenue from Magna comprised approximately 61% (2017 — 75%) of the Trust's total revenue.
Investment properties
| | | | | | | | | | | | | |
| | | | | | | | | | |
As at December 31,
| | 2018
| | 2017
| |
|---|
| | | | | | | | | | |
Canada | | $ | 708,645 | | 21% | | $ | 621,003 | | 23% | |
United States | | 1,261,183 | | 37% | | 874,499 | | 32% | |
Austria | | 840,803 | | 24% | | 780,030 | | 28% | |
Germany | | 385,703 | | 11% | | 265,734 | | 10% | |
Netherlands | | 155,778 | | 5% | | 127,807 | | 5% | |
Other Europe | | 72,866 | | 2% | | 64,495 | | 2% | |
| | | | | | | | | | |
| | $ | 3,424,978 | | 100% | | $ | 2,733,568 | | 100% | |
| | | | | | | | | | |
15. DETAILS OF CASH FLOWS |
- (a)
- Items not involving current cash flows are shown in the following table:
| | | | | | | |
| | | | | | |
Years ended December 31,
| | 2018
| | 2017
| |
|---|
| | | | | | |
Straight-line rent amortization | | $ | (4,274 | ) | $ | 1,101 | |
Tenant incentive amortization | | 5,402 | | 5,410 | |
Unit-based compensation expense (note 11(b)) | | 3,944 | | 4,912 | |
Fair value gains on investment properties | | (354,707 | ) | (212,106 | ) |
Depreciation and amortization | | 300 | | 335 | |
Fair value losses on financial instruments | | 562 | | 823 | |
Loss on sale of investment properties | | 6,871 | | 427 | |
Amortization of issuance costs relating to debentures and term loans | | 555 | | 542 | |
Amortization of deferred financing costs | | 497 | | 219 | |
Deferred income taxes | | 45,020 | | 5,709 | |
Other | | 1,040 | | 98 | |
| | | | | | |
| | $ | (294,790 | ) | $ | (192,530 | ) |
| | | | | | |
- (b)
- Changes in working capital balances are shown in the following table:
| | | | | | | |
| | | | | | |
Years ended December 31,
| | 2018
| | 2017
| |
|---|
| | | | | | |
Accounts receivable | | $ | (1,626 | ) | $ | (1,191 | ) |
Prepaid expenses and other | | (475 | ) | (362 | ) |
Accounts payable and accrued liabilities | | 5,788 | | (4,681 | ) |
Deferred revenue | | (245 | ) | (1,411 | ) |
Restricted cash | | 335 | | 48 | |
| | | | | | |
| | $ | 3,777 | | $ | (7,597 | ) |
| | | | | | |
- (c)
- Non-cash investing and financing activities
The combined statement of cash flows for the year ended December 31, 2018 does not include i) property disposal proceeds of $0.2 million and $11.8 million that are expected to be received in the years 2019 and
Granite REIT Annual Report 2018
2020, respectively (note 5) and ii) the special distribution declared in December 2018 of $54.8 million (note 10). In addition, during the year ended December 31, 2018, 64 thousand stapled units (2017 — 22 thousand stapled units) with a value of $3.2 million (2017 — $1.0 million) were issued under the Stapled Unit Plan (note 11(b)) and are not recorded in the combined statements of cash flows.
- (d)
- Cash and cash equivalents consist of:
| | | | | | | |
| | | | | | |
Years ended December 31,
| | 2018
| | 2017
| |
|---|
| | | | | | |
Cash | | $ | 534,975 | | $ | 55,608 | |
Short-term deposits | | 123,271 | | 13,411 | |
| | | | | | |
| | $ | 658,246 | | $ | 69,019 | |
| | | | | | |
16. FAIR VALUE AND RISK MANAGEMENT |
- (a)
- Fair Value of Financial Instruments
The following table provides the measurement basis of financial assets and liabilities as at December 31, 2018 and 2017:
| | | | | | | | | | | | | | | |
| | | | | | | | | | |
As at December 31,
| | 2018
| | 2017
| |
|---|
| | | | | | | | | | |
| | Carrying
Value
| | Fair Value
| | Carrying
Value
| | Fair Value
| |
|---|
| | | | | | | | | | |
Financial assets | | | | | | | | | | | |
Other assets | | $ | 12,253 | (1) | $ | 12,253 | | | $ | 455 | (1) | | $ | 455 | |
Accounts receivable | | 4,316 | | 4,316 | | | 2,310 | | | 2,310 | |
Prepaid expenses and other | | 111 | (2) | 111 | | | 705 | (2) | | 705 | |
Restricted cash | | 470 | | 470 | | | 515 | | | 515 | |
Cash and cash equivalents | | 658,246 | | 658,246 | | | 69,019 | | | 69,019 | |
| | | | | | | | | | |
| | $ | 675,396 | | $ | 675,396 | | | $ | 73,004 | | | $ | 73,004 | |
| | | | | | | | | | |
Financial liabilities | |
| |
| | |
| | |
| |
Unsecured debentures, net | | $ | 647,849 | | $ | 654,365 | | | $ | 647,306 | | | $ | 655,035 | |
Unsecured term loans, net | | 550,565 | | 550,565 | | | — | | | — | |
Cross currency interest rate swaps | | 104,757 | | 104,757 | | | 61,466 | | | 61,466 | |
Other liability | | — | | — | | | 8,968 | | | 8,968 | |
Bank indebtedness | | — | | — | | | 32,552 | | | 32,552 | |
Accounts payable and accrued liabilities | | 41,957 | | 41,957 | | | 43,300 | | | 43,300 | |
Accounts payable and accrued liabilities | | 10 | (3) | 10 | | | 42 | (3) | | 42 | |
Distributions payable | | 24,357 | | 24,357 | | | 10,647 | | | 10,647 | |
| | | | | | | | | | |
| | $ | 1,369,495 | | $ | 1,376,011 | | | $ | 804,281 | | | $ | 812,010 | |
| | | | | | | | | | |
- (1)
- Long-term receivables included in other assets.
- (2)
- Foreign exchange forward contracts included in prepaid expenses.
- (3)
- Foreign exchange forward contracts included in accounts payable and accrued liabilities.
Granite REIT Annual Report 2018
The fair values of the Trust's accounts receivable, cash and cash equivalents, restricted cash, bank indebtedness, accounts payable and accrued liabilities and distributions payable approximate their carrying amounts due to the relatively short periods to maturity of these financial instruments. The fair value of the long-term receivables approximate their carrying amount as the receivable either bears interest at rates comparable to current market rates or is revalued at each reporting period. The fair value of the foreign exchange forward contracts approximate their carrying value as the asset or liability is revalued at the reporting date. The fair values of the unsecured debentures are determined using quoted market prices. The fair values of the term loans approximate their carrying amounts as the term loans were recently drawn and bear interest at rates comparable to current market rates at the reporting date. The fair values of the cross currency interest rate swaps are determined using market inputs quoted by their counterparties. The fair value of the other liability approximated its carrying value as the liability was revalued at each reporting date.
The Trust periodically purchases foreign exchange forward contracts to hedge specific anticipated foreign currency transactions and to mitigate its foreign exchange exposure on its net cash flows. At December 31, 2018, the Trust held three outstanding foreign exchange forward contracts (2017 — 18 contracts outstanding). The foreign exchange contracts are comprised of contracts to purchase $9.5 million and sell €6.0 million. For the year ended December 31, 2018, the Trust recorded a net fair value loss of $0.6 million (2017 — $0.8 million) on the outstanding foreign exchange forward contracts (note 12(g)).
- (b)
- Fair Value Hierarchy
Fair value measurements are based on inputs of observable and unobservable market data that a market participant would use in pricing an asset or liability. IFRS establishes a fair value hierarchy which is summarized below:
| | |
Level 1: | | Fair value determined using quoted prices in active markets for identical assets or liabilities. |
Level 2: | | Fair value determined using significant observable inputs, generally either quoted prices in active markets for similar assets or liabilities or quoted prices in markets that are not active. |
Level 3: | | Fair value determined using significant unobservable inputs, such as pricing models, discounted cash flows or similar techniques. |
Granite REIT Annual Report 2018
The following tables represent information related to the Trust's assets and liabilities measured or disclosed at fair value on a recurring and non-recurring basis and the level within the fair value hierarchy in which the fair value measurements fall.
| | | | | | | | | | |
| | | | | | | | |
As at December 31, 2018
| | Level 1
| | Level 2
| | Level 3
| |
|---|
| | | | | | | | |
ASSETS AND LIABILITIES MEASURED OR DISCLOSED AT FAIR VALUE | | | | | | | |
Assets measured at fair value | | | | | | | |
Investment properties | | $ | — | | $ | — | | $ | 3,424,978 | |
Assets held for sale | | — | | — | | 44,238 | |
Long-term proceeds receivable associated with a property disposal included in other assets (note 5) | | — | | — | | 11,805 | |
Short-term proceeds receivable associated with a property disposal included in accounts receivable (note 5) | | — | | — | | 231 | |
Foreign exchange forward contracts included in prepaid expenses and other | | — | | 111 | | — | |
Liabilities measured or disclosed at fair value | |
| |
| |
| |
Unsecured debentures, net | | 654,365 | | — | | — | |
Unsecured term loans, net | | — | | 550,565 | | — | |
Cross currency interest rate swaps | | — | | 104,757 | | — | |
Foreign exchange forward contracts included in accounts payable and accrued liabilities | | — | | 10 | | — | |
| | | | | | | | |
Net assets (liabilities) measured or disclosed at fair value | | $ | (654,365 | ) | $ | (655,221 | ) | $ | 3,481,252 | |
| | | | | | | | |
| | | | | | | | | | |
| | | | | | | | |
As at December 31, 2017
| | Level 1
| | Level 2
| | Level 3
| |
|---|
| | | | | | | | |
ASSETS AND LIABILITIES MEASURED OR DISCLOSED AT FAIR VALUE | | | | | | | |
Assets measured at fair value | | | | | | | |
Investment properties | | $ | — | | $ | — | | $ | 2,733,568 | |
Assets held for sale | | — | | — | | 391,453 | |
Foreign exchange forward contracts included in prepaid expenses and other | | — | | 705 | | — | |
Liabilities measured or disclosed at fair value | |
| |
| |
| |
Unsecured debentures, net | | 655,035 | | — | | — | |
Cross currency interest rate swaps | | — | | 61,466 | | — | |
Other liability | | — | | — | | 8,968 | |
Bank indebtedness | | — | | 32,552 | | — | |
Foreign exchange forward contracts included in accounts payable and accrued liabilities | | — | | 42 | | — | |
| | | | | | | | |
Net assets (liabilities) measured or disclosed at fair value | | $ | (655,035 | ) | $ | (93,355 | ) | $ | 3,116,053 | |
| | | | | | | | |
For assets and liabilities that are measured at fair value on a recurring basis, the Trust determines whether transfers between the levels of the fair value hierarchy have occurred by reassessing categorization (based on the lowest level input that is significant to the fair value measurement as a whole) at the end of each reporting period. For the years ended December 31, 2018 and 2017, there were no transfers between the levels.
Granite REIT Annual Report 2018
Refer to note 4, Investment Properties, and note 5, Assets Held for Sale and Dispositions, for a description of the valuation techniques and inputs used in the fair value measurement and for a reconciliation of the fair value measurements of investment properties, assets held for sale and proceeds receivable associated with property disposals which are recognized in Level 3 of the fair value hierarchy.
- (c)
- Risk Management
The main risks arising from the Trust's financial instruments are credit, interest rate, foreign exchange and liquidity risks. The Trust's approach to managing these risks is summarized below:
- (i)
- Credit risk
The Trust's financial assets that are exposed to credit risk consist primarily of cash and cash equivalents and accounts receivable.
Cash and cash equivalents include short-term investments, such as term deposits, which are invested in governments and financial institutions with a minimum credit rating of BBB (based on Standard & Poor's ("S&P") rating scale) or A3 (based on Moody's Investor Services' ("Moody's") rating scale). Concentration of credit risk is further reduced by limiting the amount that is invested in any one government or financial institution.
Magna accounts for approximately 61% of the Trust's rental revenue. Although its operating subsidiaries are not individually rated, Magna International Inc. has an investment grade credit rating from Moody's, S&P and Dominion Bond Rating Service which mitigates the Trust's credit risk. Substantially all of the Trust's accounts receivable are collected within 30 days. The balance of accounts receivable past due is not significant.
- (ii)
- Interest rate risk
As at December 31, 2018, the Trust's exposure to interest rate risk is limited. Approximately 56% of the Trust's interest bearing debt consists of fixed rate debt in the form of the 2021 Debentures and the 2023 Debentures. After taking into account the related cross currency interest rate swaps, the 2021 Debentures and the 2023 Debentures have effective fixed interest rates of 2.68% and 2.43%, respectively. The remaining 44% of the Trust's interest bearing debt consists of variable rate debt in the form of the 2022 Term Loan and 2025 Term Loan. After taking into account the related cross currency interest rate swaps, the 2022 Term Loan and 2025 Term Loan have effective fixed interest rates of 1.225% and 2.202%, respectively.
- (iii)
- Foreign exchange risk
As at December 31, 2018, the Trust is exposed to foreign exchange risk primarily in respect of movements in the Euro and the US dollar. The Trust is structured such that its foreign operations are primarily conducted by entities with a functional currency which is the same as the economic environment in which the operations take place. As a result, the net income impact of currency risk associated with financial instruments is limited as its financial assets and liabilities are generally denominated in the functional currency of the subsidiary that holds the financial instrument. However, the Trust is exposed to foreign currency risk on its net investment in its foreign currency denominated operations and certain Trust level foreign currency denominated assets and liabilities. At December 31, 2018, the Trust's foreign currency denominated net assets are $2.8 billion primarily in US dollars and Euros. A 1% change in the US dollar and Euro exchange rates relative to the Canadian dollar would result in a gain or loss of approximately $14.6 million and $12.5 million, respectively, to comprehensive income.
Granite generates rental income that is not all denominated in Canadian dollars. Since the financial results are reported in Canadian dollars, the Trust is subject to foreign currency fluctuations that could,
Granite REIT Annual Report 2018
from time to time, have an impact on the operating results. For the year ended December 31, 2018, a 1% change in the US dollar and Euro exchange rates relative to the Canadian dollar would have impacted revenue by approximately $0.9 million and $1.1 million, respectively.
For the year ended December 31, 2018, the Trust has designated its cross currency interest rate swaps relating to the $650.0 million of unsecured debentures and $552.4 million of unsecured term loans as hedges of its net investment in the European operations (note 8(b)). In addition, the Trust has on occasion designated its US dollar draws from the credit facility as hedges of its net investment in the US operations.
- (iv)
- Liquidity risk
Liquidity risk is the risk the Trust will encounter difficulties in meeting its financial obligations as they become due. The Trust may also be subject to the risks associated with debt financing, including the risks that the unsecured debentures, term loans and credit facility may not be able to be refinanced. The Trust's objectives in minimizing liquidity risk are to maintain prudent levels of leverage on its investment properties, staggering its debt maturity profile and maintaining investment grade credit ratings. In addition, the Declaration of Trust establishes certain debt ratio limits.
The estimated contractual maturities of the Trust's financial liabilities are summarized below:
| | | | | | | | | | | | | | | | | | | | | | | | | |
| | | | | | | | | | | | | | | | | |
| | As at December 31, 2018
| | Total
| | 2019
| | 2020
| | 2021
| | 2022
| | 2023
| | Thereafter
| |
|---|
| | | | | | | | | | | | | | | | | |
| | Unsecured debentures | | $ | 650,000 | | $ | — | | $ | — | | $ | 250,000 | | $ | — | | $ | 400,000 | | | $ | — | | |
| | Unsecured term loans | | 552,414 | | — | | — | | — | | 252,414 | | — | | | 300,000 | | |
| | Cross currency interest rate swaps | | 104,757 | | — | | — | | 26,877 | | 3,826 | | 56,922 | | | 17,132 | | |
| | Interest payments(1): | | | | | | | | | | | | | | | | | |
| | Unsecured debentures, net of cross currency interest rate swap savings | | 73,387 | | 17,497 | | 17,497 | | 17,497 | | 10,448 | | 10,448 | | | — | | |
| | Unsecured term loans, net of cross currency interest rate swap savings | | 59,275 | | 9,784 | | 9,784 | | 9,784 | | 9,784 | | 6,713 | | | 13,426 | | |
| | Accounts payable and accrued liabilities | | 41,967 | | 40,177 | | 1,560 | | 230 | | — | | — | | | — | | |
| | Distributions payable | | 24,357 | | 24,357 | | — | | — | | — | | — | | | — | | |
| | | | | | | | | | | | | | | | | |
| | | | $ | 1,506,157 | | $ | 91,815 | | $ | 28,841 | | $ | 304,388 | | $ | 276,472 | | $ | 474,083 | | | $ | 330,558 | | |
| | | | | | | | | | | | | | | | | |
- (1)
- Represents aggregate interest expense expected to be paid over the term of the debt, on an undiscounted basis, based on actual current interest rates and average foreign exchange rates.
Granite REIT Annual Report 2018
The Trust's capital structure comprises the total of the stapled unitholders' equity and debt. The total managed capital of the Trust is summarized below:
| | | | | | | |
| | | | | | |
As at December 31,
| | 2018
| | 2017
| |
|---|
| | | | | | |
Unsecured debentures, net | | $ | 647,849 | | $ | 647,306 | |
Unsecured term loans, net | | 550,565 | | — | |
Cross currency interest rate swaps | | 104,757 | | 61,466 | |
Bank indebtedness | | — | | 32,552 | |
| | | | | | |
Total debt | | 1,303,171 | | 741,324 | |
Stapled unitholders' equity | | 2,495,518 | | 2,136,614 | |
| | | | | | |
Total managed capital | | $ | 3,798,689 | | $ | 2,877,938 | |
| | | | | | |
The Trust manages, monitors and adjusts its capital balances in response to the availability of capital, economic conditions and investment opportunities with the following objectives in mind:
- •
- Compliance with investment and debt restrictions pursuant to the Amended and Restated Declaration of Trust;
- •
- Compliance with existing debt covenants;
- •
- Maintaining investment grade credit ratings;
- •
- Supporting the Trust's business strategies including ongoing operations, property development and acquisitions;
- •
- Generating stable and growing cash distributions; and
- •
- Building long-term unitholder value.
The Amended and Restated Declaration of Trust contains certain provisions with respect to capital management which include:
- •
- The Trust shall not incur or assume any indebtedness if, after giving effect to the incurring or assumption of the indebtedness, the total indebtedness of the Trust would be more than 65% of the Gross Book Value (as defined in the Amended and Restated Declaration of Trust); and
- •
- The Trust shall not invest in raw land for development, except for (i) existing properties with additional development, (ii) the purpose of renovating or expanding existing properties or (iii) the development of new properties, provided that the aggregate cost of the investments of the Trust in raw land, after giving effect to the proposed investment, will not exceed 15% of Gross Book Value.
At December 31, 2018, the Trust's combined debt consists of the unsecured debentures, the term loans and the credit facility when drawn, each of which have various financial covenants. These covenants are defined within the trust indenture, the term loan agreements and the credit facility agreement and, depending on the debt instrument, include a total indebtedness ratio, a secured indebtedness ratio, an interest coverage ratio, an unencumbered asset ratio and a minimum equity threshold. The Trust monitors these provisions and covenants and was in compliance with their respective requirements as at December 31, 2018 and 2017.
Granite REIT Annual Report 2018
Distributions are made at the discretion of the Board of Trustees (the "Board") and Granite REIT intends to distribute each year all of its taxable income pursuant to its Amended and Restated Declaration of Trust as calculated in accordance with the Income Tax Act. As the Trust's taxable income exceeded monthly distributions during the year ended December 31, 2018, the Trust declared a special distribution of $1.20 per stapled unit (note 10). This special distribution was made to ensure that Granite would not be liable to pay income taxes for the taxation year ending December 31, 2018. For fiscal year 2018, the Trust also declared a monthly distribution of $0.227 per stapled unit from January to November and a monthly distribution of $0.233 per stapled unit for the month of December. The Board determines monthly distribution levels having considered, among other factors, estimated 2018 and 2019 cash generated from operations and capital requirements, the alignment of its current and targeted payout ratios with the Trust's strategic objectives and compliance with the above noted provisions and financial covenants.
18. RELATED PARTY TRANSACTIONS |
For the year ended December 31, 2018, key management personnel include the Trustees/Directors, the current President and Chief Executive Officer, the former Chief Executive Officer, the former Chief Operating Officer, the Chief Financial Officer and the Executive Vice President, Head of Global Real Estate. For the year ended December 31, 2017, key management personnel included the Trustees/Directors, the Chief Executive Officer, the Chief Operating Officer and the Chief Financial Officer. Information with respect to the Trustees'/Directors' fees is included in notes 11(b) and 12(c). The compensation expense associated with the Trust's key management personnel was as follows:
| | | | | | | |
| | | | | | |
Years ended December 31,
| | 2018
| | 2017
| |
|---|
| | | | | | |
Salaries, incentives and short-term benefits | | $ | 6,057 | | $ | 3,051 | |
Unit-based compensation expense including fair value adjustments | | 2,380 | | 2,371 | |
| | | | | | |
| | $ | 8,437 | | $ | 5,422 | |
| | | | | | |
Accounts payable and accrued liabilities at December 31, 2018 includes $0.4 million (2017 — nil) of compensation owing to the former Chief Executive Officer.
Related party transactions for the year ended December 31, 2017 also included a $0.7 million reimbursement of proxy contest expenses to a company affiliated with a director/trustee of Granite in connection with the 2017 annual general meeting (note 12(d)).
Granite REIT Annual Report 2018
19. COMBINED FINANCIAL INFORMATION |
The combined financial statements include the financial position and results of operations and cash flows of each of Granite REIT and Granite GP. Below is a summary of the financial information for each entity along with the elimination entries and other adjustments that aggregate to the combined financial statements:
| | | | | | | | | | | | | | | | | |
| | | | | | | | | | |
Balance Sheet
| | As at December 31, 2018
| |
|---|
| | | | | | | | | | |
| | Granite REIT
| | Granite GP
| | Eliminations/
Adjustments
| | Granite REIT and
Granite GP
Combined
| |
|---|
| | | | | | | | | | |
ASSETS | | | | | | | | | | | | | |
Non-current assets: | | | | | | | | | | | | | |
Investment properties | | | $ | 3,424,978 | | | | | | | | | $ | 3,424,978 | |
Investment in Granite LP(1) | | | — | | | 17 | | | (17 | ) | | — | |
Other non-current assets | | | 53,785 | | | | | | | | | 53,785 | |
| | | | | | | | | | |
| | | 3,478,763 | | | 17 | | | (17 | ) | | 3,478,763 | |
Current assets: | | |
| | |
| | |
| | |
| |
Assets held for sale | | | 44,238 | | | | | | | | | 44,238 | |
Other current assets | | | 7,462 | | | 46 | | | | | | 7,508 | |
Intercompany receivable(2) | | | — | | | 7,130 | | | (7,130 | ) | | — | |
Cash and cash equivalents | | | 657,432 | | | 814 | | | | | | 658,246 | |
| | | | | | | | | | |
Total assets | | | $ | 4,187,895 | | | 8,007 | | | (7,147 | ) | | $ | 4,188,755 | |
| | | | | | | | | | |
LIABILITIES AND EQUITY | | |
| | |
| | |
| | |
| |
Non-current liabilities: | | | | | | | | | | | | | |
Unsecured debt, net | | | $ | 1,198,414 | | | | | | | | | $ | 1,198,414 | |
Other non-current liabilities | | | 408,722 | | | | | | | | | 408,722 | |
| | | | | | | | | | |
| | | 1,607,136 | | | | | | | | | 1,607,136 | |
Current liabilities: | | |
| | |
| | |
| | |
| |
Intercompany payable(2) | | | 7,130 | | | | | | (7,130 | ) | | — | |
Other current liabilities | | | 76,644 | | | 7,990 | | | | | | 84,634 | |
| | | | | | | | | | |
Total liabilities | | | 1,690,910 | | | 7,990 | | | (7,130 | ) | | 1,691,770 | |
| | | | | | | | | | |
Equity: | | |
| | |
| | |
| | |
| |
Stapled unitholders' equity | | | 2,495,501 | | | 17 | | | | | | 2,495,518 | |
Non-controlling interests | | | 1,484 | | | | | | (17 | ) | | 1,467 | |
| | | | | | | | | | |
Total liabilities and equity | | | $ | 4,187,895 | | | 8,007 | | | (7,147 | ) | | $ | 4,188,755 | |
| | | | | | | | | | |
- (1)
- Granite LP is 100% owned by Granite REIT and Granite GP.
- (2)
- Represents employee and trustee/director compensation related amounts which will be reimbursed by Granite LP.
Granite REIT Annual Report 2018
| | | | | | | | | | | | | | | | | |
| | | | | | | | | | |
Balance Sheet
| | As at December 31, 2017
| |
|---|
| | | | | | | | | | |
| | Granite REIT
| | Granite GP
| | Eliminations/
Adjustments
| | Granite REIT and
Granite GP
Combined
| |
|---|
| | | | | | | | | | |
ASSETS | | | | | | | | | | | | | |
Non-current assets: | | | | | | | | | | | | | |
Investment properties | | | $ | 2,733,568 | | | | | | | | | $ | 2,733,568 | |
Investment in Granite LP(1) | | | — | | | 12 | | | (12 | ) | | — | |
Other non-current assets | | | 7,359 | | | | | | | | | 7,359 | |
| | | | | | | | | | |
| | | 2,740,927 | | | 12 | | | (12 | ) | | 2,740,927 | |
Current assets: | | |
| | |
| | |
| | |
| |
Assets held for sale | | | 391,453 | | | | | | | | | 391,453 | |
Other current assets | | | 4,988 | | | 46 | | | | | | 5,034 | |
Intercompany receivable(2) | | | — | | | 6,331 | | | (6,331 | ) | | — | |
Cash and cash equivalents | | | 68,572 | | | 447 | | | | | | 69,019 | |
| | | | | | | | | | |
Total assets | | | $ | 3,205,940 | | | 6,836 | | | (6,343 | ) | | $ | 3,206,433 | |
| | | | | | | | | | |
LIABILITIES AND EQUITY | | |
| | |
| | |
| | |
| |
Non-current liabilities: | | | | | | | | | | | | | |
Unsecured debt, net | | | $ | 647,306 | | | | | | | | | $ | 647,306 | |
Other non-current liabilities | | | 305,518 | | | | | | | | | 305,518 | |
| | | | | | | | | | |
| | | 952,824 | | | | | | | | | 952,824 | |
| | | | | | | | | | |
Current liabilities: | | |
| | |
| | |
| | |
| |
Bank indebtedness | | | 32,552 | | | | | | | | | 32,552 | |
Intercompany payable(2) | | | 6,331 | | | | | | (6,331 | ) | | — | |
Other current liabilities | | | 76,371 | | | 6,824 | | | | | | 83,195 | |
| | | | | | | | | | |
Total liabilities | | | 1,068,078 | | | 6,824 | | | (6,331 | ) | | 1,068,571 | |
| | | | | | | | | | |
Equity: | | |
| | |
| | |
| | |
| |
Stapled unitholders' equity | | | 2,136,602 | | | 12 | | | | | | 2,136,614 | |
Non-controlling interests | | | 1,260 | | | | | | (12 | ) | | 1,248 | |
| | | | | | | | | | |
Total liabilities and equity | | | $ | 3,205,940 | | | 6,836 | | | (6,343 | ) | | $ | 3,206,433 | |
| | | | | | | | | | |
- (1)
- Granite LP is 100% owned by Granite REIT and Granite GP.
- (2)
- Represents employee and trustee/director compensation related amounts which will be reimbursed by Granite LP.
Granite REIT Annual Report 2018
| | | | | | | | | | | | | | | | | |
| | | | | | | | | | |
Income Statement
| | Year ended December 31, 2018
| |
|---|
| | | | | | | | | | |
| | Granite REIT
| | Granite GP
| | Eliminations/
Adjustments
| | Granite REIT and
Granite GP
Combined
| |
|---|
| | | | | | | | | | |
Revenue | | | $ | 247,483 | | | | | | | | | $ | 247,483 | |
General and administrative expenses | | | 29,404 | | | | | | | | | 29,404 | |
Interest expense and other financing costs | | | 22,413 | | | | | | | | | 22,413 | |
Other costs and expenses, net | | | 16,964 | | | | | | | | | 16,964 | |
Share of (income) loss of Granite LP | | | — | | | (5 | ) | | 5 | | | — | |
Fair value gains on investment properties, net | | | (354,707 | ) | | | | | | | | (354,707 | ) |
Fair value loss on financial instruments | | | 562 | | | | | | | | | 562 | |
Acquisition transaction costs | | | 7,968 | | | | | | | | | 7,968 | |
Loss on sale of investment properties | | | 6,871 | | | | | | | | | 6,871 | |
| | | | | | | | | | |
Income before income taxes | | | 518,008 | | | 5 | | | (5 | ) | | 518,008 | |
Income tax expense | | | 52,651 | | | | | | | | | 52,651 | |
| | | | | | | | | | |
Net income | | | 465,357 | | | 5 | | | (5 | ) | | 465,357 | |
| | | | | | | | | | |
Less net income attributable to non-controlling interests | | | 206 | | | | | | (5 | ) | | 201 | |
| | | | | | | | | | |
Net income attributable to stapled unitholders | | | $ | 465,151 | | | 5 | | | — | | | $ | 465,156 | |
| | | | | | | | | | |
| | | | | | | | | | | | | | | | | |
| | | | | | | | | | |
Income Statement
| | Year ended December 31, 2017
| |
|---|
| | | | | | | | | | |
| | Granite REIT
| | Granite GP
| | Eliminations/
Adjustments
| | Granite REIT and
Granite GP
Combined
| |
|---|
| | | | | | | | | | |
Revenue | | | $ | 244,683 | | | | | | | | | $ | 244,683 | |
General and administrative expenses | | | 26,066 | | | | | | | | | 26,066 | |
Proxy contest expenses | | | 5,866 | | | | | | | | | 5,866 | |
Interest expense and other financing costs | | | 20,011 | | | | | | | | | 20,011 | |
Other costs and expenses, net | | | 31,712 | | | | | | | | | 31,712 | |
Share of (income) loss of Granite LP | | | — | | | (4 | ) | | 4 | | | — | |
Fair value gains on investment properties, net | | | (212,106 | ) | | | | | | | | (212,106 | ) |
Fair value losses on financial instruments | | | 823 | | | | | | | | | 823 | |
Acquisition transaction costs | | | 718 | | | | | | | | | 718 | |
Loss on sale of investment properties | | | 427 | | | | | | | | | 427 | |
| | | | | | | | | | |
Income before income taxes | | | 371,166 | | | 4 | | | (4 | ) | | 371,166 | |
Income tax expense | | | 13,418 | | | | | | | | | 13,418 | |
| | | | | | | | | | |
Net income | | | 357,748 | | | 4 | | | (4 | ) | | 357,748 | |
| | | | | | | | | | |
Less net income attributable to non-controlling interests | | | 50 | | | | | | (4 | ) | | 46 | |
| | | | | | | | | | |
Net income attributable to stapled unitholders | | | $ | 357,698 | | | 4 | | | — | | | $ | 357,702 | |
| | | | | | | | | | |
Granite REIT Annual Report 2018
| | | | | | | | | | | | | | | | | |
| | | | | | | | | | |
Statement of Cash Flows
| | Year ended December 31, 2018
| |
|---|
| | | | | | | | | | |
| | Granite REIT
| | Granite GP
| | Eliminations/
Adjustments
| | Granite REIT and
Granite GP
Combined
| |
|---|
| | | | | | | | | | |
OPERATING ACTIVITIES | | | | | | | | | | | | | |
Net income | | | $ | 465,357 | | | 5 | | | (5 | ) | | $ | 465,357 | |
Items not involving current cash flows | | | (294,790 | ) | | (5 | ) | | 5 | | | (294,790 | ) |
Changes in working capital balances | | | 3,410 | | | 367 | | | | | | 3,777 | |
Other operating activities | | | (16,456 | ) | | | | | | | | (16,456 | ) |
| | | | | | | | | | |
Cash provided by operating activities | | | 157,521 | | | 367 | | | — | | | 157,888 | |
| | | | | | | | | | |
INVESTING ACTIVITIES | | |
| | |
| | |
| | |
| |
Business acquisitions | | | (547,895 | ) | | | | | | | | (547,895 | ) |
Proceeds from disposals, net | | | 681,319 | | | | | | | | | 681,319 | |
Investment property capital additions | | | | | | | | | | | | | |
— Maintenance or improvements | | | (17,799 | ) | | | | | | | | (17,799 | ) |
— Developments or expansions | | | (15,378 | ) | | | | | | | | (15,378 | ) |
Acquisition deposits | | | (33,086 | ) | | | | | | | | (33,086 | ) |
Other investing activities | | | 28,700 | | | | | | | | | 28,700 | |
| | | | | | | | | | |
Cash provided by investing activities | | | 95,861 | | | — | | | — | | | 95,861 | |
| | | | | | | | | | |
FINANCING ACTIVITIES | | |
| | |
| | |
| | |
| |
Distributions paid | | | (125,131 | ) | | | | | | | | (125,131 | ) |
Other financing activities | | | 449,314 | | | | | | | | | 449,314 | |
| | | | | | | | | | |
Cash provided by financing activities | | | 324,183 | | | — | | | — | | | 324,183 | |
| | | | | | | | | | |
Effect of exchange rate changes | | | 11,295 | | | | | | | | | 11,295 | |
| | | | | | | | | | |
Net increase in cash and cash equivalents during the year | | | $ | 588,860 | | | 367 | | | — | | | $ | 589,227 | |
| | | | | | | | | | |
| | | | | | | | | | | | | | | | | |
| | | | | | | | | | |
Statement of Cash Flows
| | Year ended December 31, 2017
| |
|---|
| | | | | | | | | | |
| | Granite REIT
| | Granite GP
| | Eliminations/
Adjustments
| | Granite REIT and
Granite GP
Combined
| |
|---|
| | | | | | | | | | |
OPERATING ACTIVITIES | | | | | | | | | | | | | |
Net income | | | $ | 357,748 | | | 4 | | | (4 | ) | | $ | 357,748 | |
Items not involving current cash flows | | | (192,530 | ) | | (4 | ) | | 4 | | | (192,530 | ) |
Changes in working capital balances | | | (8,011 | ) | | 414 | | | | | | (7,597 | ) |
Other operating activities | | | 1,056 | | | | | | | | | 1,056 | |
| | | | | | | | | | |
Cash provided by operating activities | | | 158,263 | | | 414 | | | — | | | 158,677 | |
| | | | | | | | | | |
INVESTING ACTIVITIES | | |
| | |
| | |
| | |
| |
Business acquisitions | | | (153,979 | ) | | | | | | | | (153,979 | ) |
Investment property capital additions | | | | | | | | | | | | | |
— Maintenance or improvements | | | (10,736 | ) | | | | | | | | (10,736 | ) |
— Developments or expansions | | | (72,404 | ) | | | | | | | | (72,404 | ) |
Other investing activities | | | (728 | ) | | | | | | | | (728 | ) |
| | | | | | | | | | |
Cash used in investing activities | | | (237,847 | ) | | — | | | — | | | (237,847 | ) |
| | | | | | | | | | |
FINANCING ACTIVITIES | | |
| | |
| | |
| | |
| |
Distributions paid | | | (122,637 | ) | | | | | | | | (122,637 | ) |
Other financing activities | | | 17,399 | | | | | | | | | 17,399 | |
| | | | | | | | | | |
Cash used in financing activities | | | (105,238 | ) | | — | | | — | | | (105,238 | ) |
| | | | | | | | | | |
Effect of exchange rate changes | | | 7,212 | | | | | | | | | 7,212 | |
| | | | | | | | | | |
Net increase (decrease) in cash and cash equivalents during the year | | | $ | (177,610 | ) | | 414 | | | — | | | $ | (177,196 | ) |
| | | | | | | | | | |
Granite REIT Annual Report 2018
20. COMMITMENTS AND CONTINGENCIES |
(a) The Trust is subject to various legal proceedings and claims that arise in the ordinary course of business. Management and legal counsel evaluate all claims which are generally covered by Granite's insurance policies. Any liability from remaining claims is not probable to occur and would not have a material adverse effect on the combined financial statements. However, actual outcomes may differ from management's expectations.
(b) At December 31, 2018, the Trust's contractual commitments related to construction and development projects, the purchase of a property in the United States and the leasehold interest in two properties in Canada (note 3) amounted to approximately $457.0 million.
(c) At December 31, 2018, the Trust had commitments on non-cancellable operating leases requiring future minimum annual rental payments as follows:
| | | | |
Not later than 1 year | | $ | 461 | |
Later than 1 year and not later than 5 years | | 1,123 | |
Later than 5 years | | — | |
| | | | |
| | $ | 1,584 | |
| | | | |
| | | | |
| | | | |
In addition, the Trust is committed to making annual payments under two ground leases for the land upon which two income-producing properties in Europe are situated of $0.5 million and $0.1 million to the years 2049 and 2096, respectively. As at December 31, 2018, the fair value of the investment properties situated on the land under ground leases is $57.2 million.
(d) The Trust owns a property located in Canada for which the tenant has a purchase option to acquire the property from Granite at a stipulated price included in the lease agreement. To date, the tenant has not exercised such purchase option to acquire the property.
(a) During January and February 2019, all six properties classified as assets held for sale at December 31, 2018 were sold for aggregate proceeds of $43.7 million, which approximated their carrying value (note 5).
(b) On March 1, 2019, Granite acquired two income-producing industrial properties near Dallas, Texas at a purchase price of US$123.7 million which was funded with cash on hand.
(c) Subsequent to December 31, 2018, the Trust declared monthly distributions in January and February 2019 of $10.6 million each (note 10).
| | |

| | REIT Information
|
| | | | |
| Board of Trustees | | Officers | | Office Location |
Kelly Marshall
Chairman
Peter Aghar
Trustee
Donald Clow
Trustee
Remco Daal
Trustee
Kevan Gorrie
Trustee
Samir Manji
Trustee
Al Mawani
Trustee
Gerald Miller
Trustee
Jennifer Warren
Trustee | | Kevan Gorrie
President and Chief Executive Officer
Ilias Konstantopoulos
Chief Financial Officer
Lorne Kumer
Executive Vice President,
Head of Global Real Estate | | 77 King Street West
Suite 4010, P.O. Box 159
Toronto-Dominion Centre
Toronto, ON M5K 1H1
Phone: (647) 925-7500
Fax: (416) 861-1240
Investor Relations Queries
Kevan Gorrie
President and Chief Executive Officer
(647) 925-7500
Ilias Konstantopoulos
Chief Financial Officer
(647) 925-7540
|
| | | | |
| | Transfer Agents and Registrars |
| |
|
| | Canada | | United States |
| | Computershare Investor Services Inc.
100 University Avenue, 8th Floor, North Tower
Toronto, Ontario, Canada M5J 2Y1
Phone: 1 (800) 564-6253
www.computershare.com | | Computershare Trust Company N.A.
462 S. 4th Street
Louisville, Kentucky, USA 40202 |
| | | | | | |
Exchange Listings
|
| Stapled Units | | – | | Toronto Stock Exchange (GRT.UN) and New York Stock Exchange (GRP.U) |
Please refer to our website (www.granitereit.com) for information on Granite's compliance with the corporate governance standards of the New York Stock Exchange and applicable Canadian standards and guidelines.
|
Publicly Available Documents
|
Copies of the financial statements for the year ended December 31, 2018 are available through the Internet on the Electronic Data Gathering Analysis and Retrieval System (EDGAR), which can be accessed at www.sec.gov, and on the System for Electronic Document Analysis and Retrieval (SEDAR), which can be accessed at www.sedar.com. Other required securities filings can also be found on EDGAR and SEDAR.
|
| | |

| | Granite REIT
77 King Street West
Suite 4010, P.O. Box 159
Toronto-Dominion Centre
Toronto, ON M5K 1H1
Phone: (647) 925-7500
Fax: (416) 861-1240
www.granitereit.com
|