Exhibit 4.5
MANAGEMENT’S DISCUSSION AND ANALYSIS OF RESULTS OF OPERATIONS AND FINANCIAL POSITION
| TABLE OF CONTENTS |
| 1 | ||||
| 2 | ||||
| 3 | ||||
| 5 | ||||
| 8 | ||||
| 24 | ||||
| 34 | ||||
Commitments, Contractual Obligations, Contingencies andOff-Balance Sheet Arrangements | 41 | |||
| 41 | ||||
| 45 | ||||
| 46 | ||||
| 50 | ||||
| 50 | ||||
| 51 | ||||
| 52 | ||||
| BASIS OF PRESENTATION |
Management’s Discussion and Analysis of Results of Operations and Financial Position (“MD&A”) of Granite Real Estate Investment Trust (“Granite REIT”) and Granite REIT Inc. (“Granite GP”) summarizes the significant factors affecting the combined operating results, financial condition, liquidity and cash flows of Granite REIT, Granite GP and their subsidiaries (collectively “Granite” or the “Trust”) for the three and six month periods ended June 30, 2019. Unless otherwise noted, all amounts are in millions of Canadian dollars. This MD&A should be read in conjunction with the accompanying unaudited condensed combined financial statements for the three and six month periods ended June 30, 2019 and the audited combined financial statements for the year ended December 31, 2018 prepared in accordance with International Financial Reporting Standards (“IFRS”) as issued by the International Accounting Standards Board. The MD&A was prepared as at July 31, 2019 and its contents were approved by the Board of Trustees of Granite REIT and Board of Directors of Granite GP on this date. Additional information relating to Granite, including the Annual Report and Annual Information Form (“AIF”) for fiscal 2018, can be obtained from the Trust’s website atwww.granitereit.com, on SEDAR atwww.sedar.comand on EDGAR atwww.sec.gov.
In addition to using financial measures determined in accordance with IFRS, Granite also uses certainnon-IFRS measures in managing its business to measure financial and operating performance as well as for capital allocation decisions and valuation purposes. Granite believes that providing these measures on a supplemental basis to the IFRS results is helpful to investors in assessing the overall performance of Granite’s business. Thesenon-IFRS measures include net operating income before lease termination andclose-out fees, straight-line rent and tenant incentive amortization (“NOI — cash basis”), same property NOI — cash basis, funds from operations (“FFO”), adjusted funds from operations (“AFFO”), FFO payout ratio, AFFO payout ratio, leverage ratio, interest coverage ratio, net leverage ratio, indebtedness ratio, unencumbered asset coverage ratio and any related per unit amounts. Readers are cautioned that these measures do not have standardized meanings prescribed under IFRS and, therefore, should not be construed as alternatives to net income, cash provided by operating activities or any other measure calculated in accordance with IFRS. Additionally, because these terms do not have standardized meanings prescribed by IFRS, they may not be comparable to similarly titled measures presented by other reporting issuers. Refer to “NON-IFRS MEASURES” for definitions and reconciliations ofnon-IFRS measures to IFRS financial measures.
Granite REIT 2019 Second Quarter Report 1
| FINANCIAL AND OPERATING HIGHLIGHTS |
| Three Months Ended June 30, | Six Months Ended June 30, | |||||||||||||||
| (in millions, except as noted) | 2019 | 2018 | 2019 | 2018 | ||||||||||||
Operating highlights | ||||||||||||||||
Revenue | $ | 67.9 | $ | 62.1 | $ | 131.3 | $ | 123.8 | ||||||||
NOI — cash basis(1) | 58.3 | 55.2 | 113.3 | 107.5 | ||||||||||||
Net income attributable to stapled unitholders | 98.7 | 149.2 | 176.9 | 221.5 | ||||||||||||
FFO(1)(2) | 43.1 | 37.6 | 83.8 | 88.7 | ||||||||||||
AFFO(1)(2) | 42.3 | 29.4 | 81.5 | 60.5 | ||||||||||||
Cash flows provided from operating activities | 50.1 | 45.0 | 90.5 | 82.5 | ||||||||||||
Monthly distributions paid | 33.7 | 31.2 | 65.6 | 62.8 | ||||||||||||
Special distribution paid | — | — | 13.7 | — | ||||||||||||
FFO payout ratio(1)(3) | 81% | 79% | 80% | 79% | ||||||||||||
AFFO payout ratio(1)(3) | 83% | 99% | 83% | 104% | ||||||||||||
Per unit amounts | ||||||||||||||||
Diluted FFO(1)(2) | $ | 0.89 | $ | 0.82 | $ | 1.78 | $ | 1.93 | ||||||||
Diluted AFFO(1)(2) | $ | 0.88 | $ | 0.64 | $ | 1.73 | $ | 1.32 | ||||||||
Monthly distributions paid | $ | 0.70 | $ | 0.68 | $ | 1.40 | $ | 1.36 | ||||||||
Special distribution paid | — | — | $ | 0.30 | — | |||||||||||
Diluted weighted average number of units | 48.3 | 45.8 | 47.0 | 46.1 | ||||||||||||
| As at June 30, 2019 and December 31, 2018 | 2019 | 2018 | ||||||||||||||
Financial highlights | ||||||||||||||||
Investment properties — fair value(4) | $ | 3,799.1 | $ | 3,425.0 | ||||||||||||
Assets held for sale(4) | 50.5 | 44.2 | ||||||||||||||
Cash and cash equivalents | 496.9 | 658.2 | ||||||||||||||
Total debt(5) | 1,285.6 | 1,303.2 | ||||||||||||||
Trading price per unit (TSX: GRT.UN) | $ | 60.29 | $ | 53.21 | ||||||||||||
Debt metrics, ratings and outlook | ||||||||||||||||
Net leverage ratio(1) | 21% | 19% | ||||||||||||||
Interest coverage ratio(1) | 9.3x | 9.4x | ||||||||||||||
Indebtedness ratio (total debt to adjusted EBITDA)(1) | 6.8x | 7.0x | ||||||||||||||
Weighted average cost of debt(6) | 2.17% | 2.17% | ||||||||||||||
Weighted average debtterm-to-maturity, in years(6) | 4.2 | 4.7 | ||||||||||||||
DBRS rating and outlook | BBB stable | BBB stable | ||||||||||||||
Moody’s rating and outlook | Baa2 stable | Baa2 stable | ||||||||||||||
Property metrics(4) | ||||||||||||||||
Number of investment properties | 83 | 84 | ||||||||||||||
Income-producing properties | 79 | 80 | ||||||||||||||
Properties under development | 2 | 2 | ||||||||||||||
Land held for development | 2 | 2 | ||||||||||||||
Gross leasable area (“GLA”), square feet | 34.5 | 32.2 | ||||||||||||||
Occupancy, by GLA | 98.9% | 99.1% | ||||||||||||||
Magna as a percentage of annualized revenue(7) | 48% | 54% | ||||||||||||||
Magna as a percentage of GLA | 41% | 47% | ||||||||||||||
Weighted average lease term in years, by GLA | 6.0 | 6.0 | ||||||||||||||
Overall capitalization rate(8) | 6.3% | 6.7% | ||||||||||||||
| (1) | For definitions of Granite’snon-IFRS measures, refer to the section “NON-IFRS MEASURES”. |
2 Granite REIT 2019 Second Quarter Report
| (2) | For the three and six months ended June 30, 2019, Granite recognized $0.6 million ($0.01 per unit) and $0.9 million ($0.02 per unit), respectively, in revenue related to lease termination andclose-out fees. For the three months ended June 30, 2018, Granite recognized a $1.9 million ($0.04 per unit) realized foreign exchange loss in the period relating to the remeasurement of US dollar cash proceeds from the sale of investment properties in January 2018. For the six months ended June 30, 2018, Granite recognized $1.0 million ($0.02 per unit) in revenue related to a lease termination andclose-out fee and a net $8.5 million ($0.19 per unit) realized foreign exchange gain during the period on the remeasurement of US dollar cash proceeds from the sale of investment properties in January 2018. FFO, AFFO and the per unit amounts include the aforementioned items. |
In the first quarter of 2018, Granite also paid $9.1 million ($0.19 per unit) related to a tenant incentive allowance for a 2014 lease extension at the Eurostar facility in Graz, Austria. AFFO and AFFO per unit amounts have been reduced by this $9.1 million tenant allowance payment. |
| (3) | The FFO and AFFO payout ratios are calculated as monthly distributions, which exclude the special distribution, declared to unitholders divided by FFO and AFFO, respectively, in a period. For comparative purposes, the FFO payout ratio and AFFO payout ratio for the three months ended June 30, 2019 and 2018 exclude the lease termination andclose-out fees of $0.6 million and the $1.9 million realized foreign exchange loss relating to the remeasurement of US dollar cash proceeds from the sale of investment properties in January 2018, respectively. |
For comparative purposes, the FFO payout ratio and AFFO payout ratio for the six months ended June 30, 2019 and 2018 exclude the lease termination andclose-out fees of $0.9 million and $1.0 million, respectively, as well as the net $8.5 million realized foreign exchange gain relating to the remeasurement of US dollar cash proceeds from the sale of properties during the six months ended June 30, 2018. |
AFFO payout ratio further excludes the $9.1 million tenant incentive payment made in 2018 in connection with the 2014 lease extension at the Eurostar facility. |
| (4) | Assets held for sale are excluded from investment properties and related property metrics. Accordingly, six such assets that were held for sale at June 30, 2019 and six such assets that were held for sale at December 31, 2018 were excluded from investment properties and related property metrics at June 30, 2019 and December 31, 2018, respectively, throughout this MD&A. |
| (5) | The Trust has adopted IFRS 16,Leases effective January 1, 2019 resulting in the recognition of lease obligations on the combined balance sheet and, thereby, included in total debt (see “NEW ACCOUNTING PRONOUNCEMENTS AND DEVELOPMENTS”). |
| (6) | Excludes lease obligations noted above. |
| (7) | Annualized revenue for each period presented is calculated as rental revenue excluding tenant recoveries, recognized in accordance with IFRS, in the reported month multiplied by 12 months. |
| (8) | Refer to “Valuation Metrics by Investment Property Asset Category” in the“Investment Properties”section. |
| BUSINESS OVERVIEW AND STRATEGIC OUTLOOK |
Business Overview
Granite is a Canadian-based real estate investment trust (“REIT”) engaged in the acquisition, development, ownership and management of industrial, warehouse and logistics properties in North America and Europe. As at July 31, 2019, Granite owns 85 investment properties in nine countries having approximately 34.7 million square feetof gross leasable area. The tenant base includes Magna International Inc. and its operating subsidiaries (collectively, “Magna”) as the largest tenant, in addition to tenants from various other industries. Properties leased to Magna are generally leased to operating subsidiaries of Magna International Inc. and the terms of the leases are not guaranteed by the parent company except for certain leases wherein the parent is the tenant.
Granite’s investment properties consist of income-producing properties, properties under development and land held for development (see“INVESTMENT PROPERTIES”). The income-producing properties consist of light industrial properties, heavy industrial manufacturing facilities, distribution/warehouse and logistics properties, corporate offices, product development and engineering centres and test facilities. The lease
Granite REIT 2019 Second Quarter Report 3
payments are primarily denominated in three currencies: the Canadian dollar (“$”), the Euro (“€”) and the US dollar (“US$”). Granite’s investment properties (excluding six assets held for sale) by geographic location, property count and square footage as at July 31, 2019 are summarized below:
Investment Properties Summary(1)
Nine countries/85 properties/34.7 million square feet |
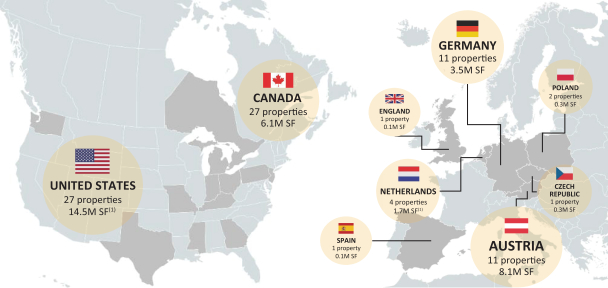
| (1) | Includes an income-producing property in the Netherlands representing 0.3 million square feet of GLA and one property in the United States comprised of 190.6 acres of development land acquired subsequent to June 30, 2019. |
Strategic Outlook
Management continues to identify and pursue value creation and investment opportunities that will generate superior long-term total return for unitholders.
Granite’s strategy is to continue to build an institutional quality and globally diversified industrial real estate business; to grow and diversify its asset base through acquisitions, development,re-development and dispositions; to optimize its balance sheet; and to reduce its exposure to Magna and the special purpose properties (see“INVESTMENT PROPERTIES”) over the long-term.
Following the sale of 22non-core properties in 2018 and 2019 and the recent equity offering, Granite has positioned itself financially to capitalize on a strong pipeline of acquisition and development opportunities within its geographic footprint and execute on its strategic plan.
As Granite looks to the remainder of 2019, its priorities are as follows:
| • | Strategically deploy the proceeds from the recent equity offering and property dispositions; |
| • | Accelerate growth in its target markets in North America and Europe primarily through property, portfolio and corporate acquisitions as well as through joint venture arrangements and development of modern logistics ande-commerce assets; |
| • | Continue to dispose of selectnon-core assets; |
| • | Maintain a target occupancy in excess of 98%; |
| • | Enhance Granite’s global platform; |
4 Granite REIT 2019 Second Quarter Report
| • | Grow net asset value as well as FFO and AFFO per unit through intensive asset management; |
| • | Maintain lower leverage providing balance sheet flexibility and liquidity; and |
| • | Pursue development opportunities within the existing portfolio. |
| SIGNIFICANT MATTERS |
Property Acquisitions
During the six months ended June 30, 2019, Granite acquired three income-producing modern industrial properties in the United States and the leasehold interest in two properties in Mississauga, Ontario. Subsequent to thequarter-end, Granite acquired two properties consisting of development land in the United States and an income-producing property in Born, Netherlands. Property acquisitions consisted of the following:
Acquisitions (in millions, except as noted)
Property Address | Location | Sq ft(1) | Weighted sq ft(1) | Date Acquired | Property Purchase Price(2) | In-going Yield(1) | ||||||||||||||||||
Acquired during the six months ended June 30, 2019: |
| |||||||||||||||||||||||
201 Sunridge Boulevard | Wilmer, TX | 0.8 | 9.5 | Mar 1, 2019 | $ | 58.1 | 5.1% | |||||||||||||||||
3501 North Lancaster Hutchins Road | Lancaster, TX | 0.2 | 10.4 | Mar 1, 2019 | 106.1 | 6.8% | ||||||||||||||||||
Leasehold interest in two properties: 2020 and 2095 Logistics Drive | Mississauga, ON | 0.9 | 8.7 | Apr 9, 2019 | 153.6 | (3) | 4.5% | |||||||||||||||||
1901 Beggrow Street | Columbus, OH | 0.8 | 4.7 | May 23, 2019 | 71.6 | 5.7% | ||||||||||||||||||
Acquired between July 1, 2019 and July 31, 2019: |
| |||||||||||||||||||||||
190.6 acres of development land | Harris County, Texas | N/A | N/A | July 1, 2019 | 33.4 | N/A | ||||||||||||||||||
Heirweg 3 | Born, Netherlands | 0.3 | 7.6 | July 8, 2019 | 25.7 | 6.1% | ||||||||||||||||||
| 3.0 | 7.9 | $ | 448.5 | 5.4% | ||||||||||||||||||||
| (1) | As at the date of acquisition. |
| (2) | Purchase price does not include transaction costs associated with property acquisitions. |
| (3) | Excludesright-of-use asset of $20.5 million associated with ground lease (see “NEW ACCOUNTING PRONOUNCEMENTS AND DEVELOPMENTS”). |
On April 9, 2019, Granite acquired the leasehold interest in two distribution/warehouse properties located in Mississauga, Ontario for total consideration of $153.6 million. The contractual rent at 2020 Logistics Drive is significantly below market, providing expected net operating income growth upon lease rollover. The property located at 2095 Logistics Drive is expected to be expanded by approximately 0.1 million square feet by the second quarter of 2020, generating additional net operating income at an estimated yield of 8.9%.
On May 23, 2019, Granite acquired 1901 Beggrow Street, a 36 foot clear height distribution centre situated on 51.1 acres of land in Columbus, Ohio for consideration of $71.6 million (US$53.2 million). This state of the art facility was completed in 2018 and is 100% leased to a subsidiary of Pepsico, Inc. The property is well-located within the major southeast Columbus industrial market and within two miles of the Rickenbacker International Airport, one of the only cargo-dedicated airports in the world. The building can be expanded by approximately 0.2 million square feet, providing attractive site flexibility and growth potential.
On July 1, 2019, Granite, in partnership with NorthPoint Development, acquired a greenfield site in Houston, Texas for $33.4 million (US$25.4 million) for the future development of up to a 2.5 million square foot multi-phased business park capable of accommodating buildings ranging from 0.3 million to 1.2 million square feet. Speculative construction of the initial phase, consisting of two buildings totaling 0.6 million square feet, is anticipated to begin in the third quarter of 2019. The project is expected to generate a development yield spread of greater than 200 basis points. Granite’s partner, NorthPoint Development, will
Granite REIT 2019 Second Quarter Report 5
act as development manager for the project. The site is strategically located within Houston’s northeast submarket and located directly on US Highway 90, benefiting from exceptional access to Houston’s extensive interstate system, the city’s railroads and the Houston International Airport.
On July 8, 2019, Granite acquired Heirweg 3, a distribution centre situated on 7.4 acres of land in Born, Netherlands for $25.7 million (€17.5 million). Constructed in 2008, the property is 100% leased to Broekman Logistics and is well-located in an established business park. Its strategic location and close proximity to an inland port, rail and the A2 motorway provide excellent distribution access serving the local Dutch market as well as broader European markets.
Acquisition, Construction and Development Commitments
As at the date of this MD&A, Granite had the following property purchase and construction and development commitments:
Commitments (in millions, except as noted)
Property Location | Additional sq ft | Accruals/ Payments/ Deposits | Future Commitments | Total Cost | Year-One Stabilized Yield | |||||||||||||||
As at June 30, 2019: | ||||||||||||||||||||
Demolition phase of property under development in Altbach, Germany | — | $ | 1.2 | $ | 0.4 | $ | 1.6 | N/A | ||||||||||||
Expansion of 2095 Logistics Drive, Mississauga, ON | 0.1 | — | 9.0 | 9.0 | 8.9% | |||||||||||||||
Properties under development in Texas and Indiana as well as other construction commitments | 2.8 | 29.7 | 290.9 | 320.6 | 5.6% | |||||||||||||||
| 2.9 | $ | 30.9 | $ | 300.3 | $ | 331.2 | 5.7% | |||||||||||||
Commitments between July 1, 2019 and July 31, 2019: |
| |||||||||||||||||||
Property purchase in Horn Lake, Mississippi | 0.3 | — | 24.0 | 24.0 | 5.7% | |||||||||||||||
| 3.2 | $ | 30.9 | $ | 324.3 | $ | 355.2 | 5.7% | |||||||||||||
| (1) | As at June 30, 2019. |
A deposit of $26.2 million (US$20.0 million) was made during 2018 in connection with a contractual commitment to acquire a property under development in the state of Texas. This commitment to purchase the property under development is subject to specific confidentiality provisions and customary closing conditions including certain purchase rights in favour of the tenant and is expected to close in the fourth quarter of 2019 following construction of the building and commencement of the lease.
During the first quarter of 2019, Granite entered into an agreement for approximately $1.6 million (€1.1 million) to demolish an existing building on a13-acre site in Altbach, Germany. As at July 31, 2019, the demolition of the property is substantially complete and construction of a 0.3 million square foot distribution/light industrial facility is expected to commence in the first quarter of 2020, subject to receipt of all required permits and state approval.
On July 17, 2019, Granite agreed to acquire 1222 Commerce Parkway, a 32 foot clear height distribution centre situated on 20.9 acres of land in Horn Lake, Mississippi for total consideration of $24.0 million (US$18.5 million). The property was constructed in 2018 and is 100% leased to DSV Solutions and EPE Industries for a remaining weighted average lease term of 4.8 years. The acquisition is subject to customary closing conditions and is expected to close in the third quarter of 2019. The property is located within the DeSoto County submarket, less than 15 miles from downtown Memphis, Tennessee. The property offers exceptional access to Interstate 55 and proximity to the Memphis International Airport, which is home to the FedEx World Hub, the busiest air cargo airport in the United States.
6 Granite REIT 2019 Second Quarter Report
Property Dispositions
During the six months ended June 30, 2019, six properties previously classified as assets held for sale were disposed of for approximately $43.8 million. The properties consisted of the following:
Dispositions (in millions, except as noted)
Property Address | Location | Sq ft | Date Disposed | Sale Price | Annualized Revenue(1) | |||||||||||||
3 Walker Drive (a nine-acre parcel of land) | Brampton, ON | N/A | Jan 15, 2019 | $ | 13.4 | $ | — | |||||||||||
Iowa properties(four properties): | ||||||||||||||||||
403 S 8th Street | Montezuma, IA | |||||||||||||||||
1951 A Avenue | Victor, IA | |||||||||||||||||
408 N Maplewood Avenue | Williamsburg, IA | |||||||||||||||||
411 N Maplewood Avenue | Williamsburg, IA | 0.6 | Feb 25, 2019 | 22.3 | 2.2 | |||||||||||||
375 Edward Street | Richmond Hill, ON | 0.1 | Feb 27, 2019 | 8.1 | — | |||||||||||||
| 0.7 | $ | 43.8 | $ | 2.2 | ||||||||||||||
| (1) | Annualized revenue is calculated as rental revenue excluding tenant recoveries, recognized in accordance with IFRS, in the month the property was first classified as an asset held for sale multiplied by 12 months. |
Assets Held for Sale
As at June 30, 2019, six investment properties located in Canada and the United States were classified as assets held for sale. The six properties, having an aggregate fair value of $50.5 million, consisted of the following:
Held for Sale (in millions, except as noted)
Property Address | Location | Sq ft | Fair Value | Annualized Revenue(1) | ||||||||||
Michigan properties (five properties): | ||||||||||||||
6151 Bancroft Avenue | Alto, MI | |||||||||||||
3501 John F Donnelly Drive | Holland, MI | |||||||||||||
3575 128th Avenue | Holland, MI | |||||||||||||
3601 John F Donnelly Drive | Holland, MI | |||||||||||||
1800 Hayes Street | Grand Haven, MI | 0.7 | $ | 38.0 | $ | 3.6 | ||||||||
330 Finchdene Square | Toronto, ON | 0.1 | 12.5 | — | ||||||||||
| 0.8 | $ | 50.5 | $ | 3.6 | ||||||||||
| (1) | Annualized revenue is calculated as rental revenue excluding tenant recoveries, recognized in accordance with IFRS, in the month the property was first classified as an asset held for sale multiplied by 12 months. |
These aforementioned properties were classified as assets held for sale on the combined balance sheets at June 30, 2019 and were excluded from the value of investment properties. These properties are also excluded from references to investment properties and related property metrics as at June 30, 2019 throughout this MD&A.
Officer and Board Changes and Appointments
On June 3, 2019, Granite announced the departure of its Chief Financial Officer (“CFO”), Ilias Konstantopoulos. Subsequently, effective July 8, 2019, Teresa Neto was appointed Granite’s CFO. Ms. Neto has over 13 years of real estate experience and has held previous CFO positions at publicly traded real estate investment trusts in Canada, most recently at Pure Industrial Real Estate Trust and prior to that at Northwest Healthcare Properties REIT. Ms. Neto has a chartered professional accounting designation (CPA, CA) and is a member of the Institute of Corporate Directors.
Granite REIT 2019 Second Quarter Report 7
On June 13, 2019, at the Trust’s annual general meeting, Fern Grodner and Sheila Murray were elected as new trustees of Granite REIT and directors of Granite GP. Donald Clow and Samir Manji did not stand forre-election. Ms. Grodner has over 25 years of corporate real estate experience which includes her roles at Amazon.com, Inc. as Senior Manager, Global Real Estate and Facilities and JDS Uniphase Corporation overseeing all real estate aspects of office and manufacturing sites. Ms. Murray was most recently the President and prior to that, the Executive Vice-President, General Counsel and Secretary of CI Financial Corp., following a25-year career at Blake, Cassels & Graydon LLP. Ms. Murray is also a member of the Board of Directors of Teck Resources Limited, Lendified Holdings Inc., and the SickKids Foundation, a trustee of the Toronto Symphony Foundation, and has been a director of a number of other private and public companies.
Bought Deal Equity Offering
On April 30, 2019, Granite completed an offering of 3,749,000 stapled units at a price of $61.50 per unit for gross proceeds of $230.6 million, including 489,000 stapled units issued pursuant to the exercise of the over-allotment option granted to the underwriters. Total costs related to the offering totaled $10.2 million.
Normal Course Issuer Bid
On May 14, 2019, Granite renewed its normal course issuer bid for an additional year.
| RESULTS OF OPERATIONS |
Foreign Currency Translation
The majority of Granite’s investment properties are located in Europe and the United States and the cash flows derived from such properties are primarily denominated in Euros and US dollars. Accordingly, fluctuations in the Canadian dollar, Granite’s reporting currency, relative to the Euro and US dollar will result in fluctuations in the reported values of revenues, expenses, cash flows, assets and liabilities. The most significant foreign currency exchange rates that impact Granite’s business are summarized in the following table:
Average Exchange Rates | Period End Exchange Rates | |||||||||||||||||||||||||||||||||||||||||||
Three Months Ended June 30, | Six Months Ended | June 30, 2019 | December 31, 2018 | |||||||||||||||||||||||||||||||||||||||||
| 2019 | 2018 | Change | 2019 | 2018 | Change | Change | ||||||||||||||||||||||||||||||||||||||
$ per€1.00 | 1.503 | 1.539 | (2% | ) | 1.506 | 1.547 | (3% | ) | 1.489 | 1.563 | (5% | ) | ||||||||||||||||||||||||||||||||
$ per US$1.00 | 1.338 | 1.291 | 4% | 1.333 | 1.278 | 4% | 1.309 | 1.364 | (4% | ) | ||||||||||||||||||||||||||||||||||
For the three and six months ended June 30, 2019 compared to the prior year periods, the average exchange rates of the Canadian dollar relative to the Euro and US dollar were lower and higher, respectively, which on a comparative basis, decreased the Canadian dollar equivalent of revenue and expenses from Granite’s European operations and increased the Canadian dollar equivalent of revenue and expenses from Granite’s US operations.
The period end exchange rates of the Canadian dollar relative to the Euro and US dollar on June 30, 2019 were lower when compared to the December 31, 2018 exchange rates. As a result, the Canadian dollar equivalent of assets and liabilities from Granite’s European and US subsidiaries were lower when compared to December 31, 2018.
8 Granite REIT 2019 Second Quarter Report
On a net basis, the effect of the changes in exchange rates on Granite’s operating results for the three and six months ended June 30, 2019 was as follows:
Effects of Changes in Exchange Rates on Operating Results |
| Three Months Ended June 30, | Six Months Ended June 30, | |||||||
| (in millions, except per unit information) | 2019 vs 2018 | 2019 vs 2018 | ||||||
Increase in revenue | $ | 0.2 | $ | 0.3 | ||||
Increase in NOI — cash basis | — | 0.1 | ||||||
Increase in net income | 0.3 | 0.7 | ||||||
Increase in FFO | 0.5 | 1.4 | ||||||
Increase in AFFO | 0.4 | 1.1 | ||||||
Increase in FFO per unit | $ | 0.01 | $ | 0.03 | ||||
Increase in AFFO per unit | $ | 0.01 | $ | 0.02 | ||||
Operating Results
Revenue
Revenue |
Three Months Ended | Six Months Ended June 30, | |||||||||||||||||||||||||||
| 2019 | 2018 | $ change | 2019 | 2018 | $ change | |||||||||||||||||||||||
Rental revenue | $ | 59.6 | $ | 55.3 | 4.3 | $ | 115.4 | $ | 109.3 | 6.1 | ||||||||||||||||||
Tenant recoveries | 7.7 | 6.8 | 0.9 | 15.0 | 13.5 | 1.5 | ||||||||||||||||||||||
Lease termination andclose-out fees | 0.6 | — | 0.6 | 0.9 | 1.0 | (0.1 | ) | |||||||||||||||||||||
Revenue | $ | 67.9 | $ | 62.1 | 5.8 | $ | 131.3 | $ | 123.8 | 7.5 | ||||||||||||||||||
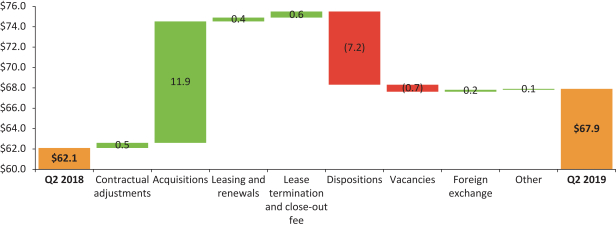
Revenue for the three month period ended June 30, 2019 increased $5.8 million to $67.9 million from $62.1 million in the prior year period. The components contributing to the change in revenue are detailed below:
Q2 2019 vs Q2 2018 Change in Revenue |
Granite REIT 2019 Second Quarter Report 9
Additional details pertaining to the components of the change in revenue are as follows:
| • | contractual rent adjustments included $0.3 million from consumer price index based increases and $0.2 million from fixed contractual adjustments related to rent escalations; |
| • | the acquisitions of properties located in the United States, Canada and Germany beginning in the second quarter of 2018 increased revenue by $11.9 million, which included $1.6 million of tenant recoveries; |
| • | revenue increased by $0.4 million due to various renewal andre-leasing activities for properties primarily in Canada, the United States and Austria; |
| • | revenue increased by $0.6 million as a result of a leaseclose-out fee received in 2019 for a property in Canada that was vacated and classified as asset held for sale; |
| • | the sale of 11 properties in Canada, the United States and Germany beginning in the second quarter of 2018 decreased revenue by $7.2 million of which $0.6 million related to a reduction in property tax and insurance tenant recoveries; |
| • | two lease expiries and one lease termination for properties in Canada and the United States resulted in vacancies that decreased revenue by $0.3 million and $0.4 million, respectively; and |
| • | foreign exchange had a net $0.2 million positive impact as the weakening of the Canadian dollar against the US dollar increased revenue by $0.8 million while the relative strengthening of the Canadian dollar against the Euro decreased revenue by $0.6 million. |
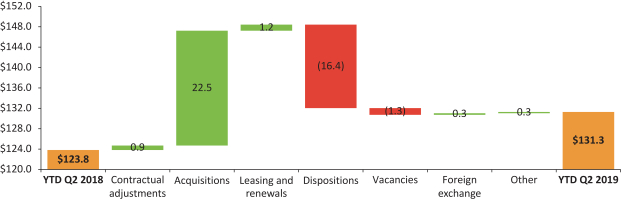
Revenue for the six month period ended June 30, 2019 increased $7.5 million to $131.3 million from $123.8 million in the prior year period. The components contributing to the change in revenue are detailed below:
Q2 2019 YTD vs Q2 2018 YTD Change in Revenue |
Additional details pertaining to the components of the change in revenue are as follows:
| • | contractual rent adjustments included $0.6 million from consumer price index based increases and $0.3 million from fixed contractual adjustments related to rent escalations; |
| • | the acquisitions of properties located in the United States, Canada and Germany during 2018 and 2019 increased revenue by $22.5 million, which included $2.7 million of tenant recoveries; |
| • | revenue increased by $1.2 million due to various renewal andre-leasing activities for properties primarily in Canada and the United States; |
| • | the sale of 21 properties in Canada, the United States and Germany in 2018 and 2019 decreased revenue by $16.4 million of which $1.7 million related to a reduction in property tax and insurance tenant recoveries; |
10 Granite REIT 2019 Second Quarter Report
| • | three vacancies noted above for properties in Canada and the United States decreased revenue by $0.6 million and $0.7 million, respectively; and |
| • | foreign exchange had a net $0.3 million positive impact as the weakening of the Canadian dollar against the US dollar increased revenue by $1.7 million while the relative strengthening of the Canadian dollar against the Euro decreased revenue by $1.4 million. |
Revenue by major currency for the three and six months ended June 30, 2019 and 2018 was as follows:
Revenue by Currency |
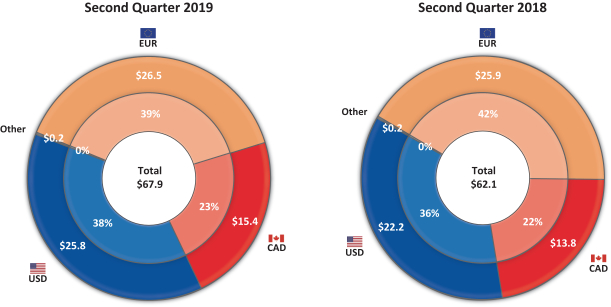
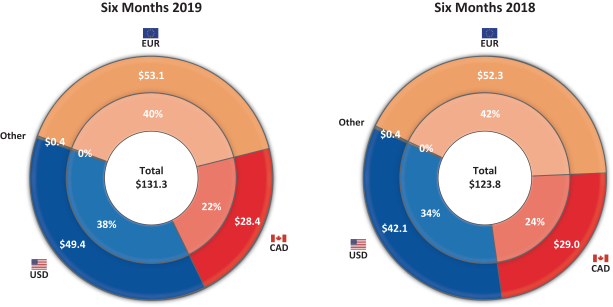
As a majority of the Trust’s revenue is denominated in currencies other than the Canadian dollar, Granite uses derivative financial instruments, including cross currency interest rate swaps and forward currency contracts,
Granite REIT 2019 Second Quarter Report 11
to partially hedge its exposure to foreign currencies and reduce the potential impact that foreign currency rate changes may have on Granite’s operating results, cash flows and distributions (see “DEBT STRUCTURE”).
Net Operating Income
Net operating income (“NOI”) in the three months ended June 30, 2019 was $59.1 million compared to $54.7 million in the three months ended June 30, 2018. NOI in the six months ended June 30, 2019 was $114.3 million compared to $108.5 million in the six months ended June 30, 2018. NOI — cash basis excludes the impact of lease termination andclose-out fees, and straight-line rent and tenant incentive amortization and reflects the cash generated by the income-producing properties excluding lease termination andclose-out fees on a period-over-period basis. NOI — cash basis was $58.3 million in the three months ended June 30, 2019 compared with $55.2 million in the prior year period. NOI — cash basis was $113.3 million in the six months ended June 30, 2019 compared with $107.5 million in the six months ended June 30, 2018.
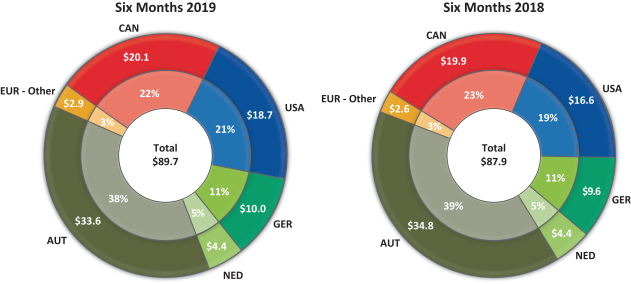
Same property NOI — cash basis refers to the NOI — cash basis for those properties owned by Granite throughout the entire current and prior year periods under comparison. Same property NOI — cash basis excludes properties that were acquired, disposed of, classified as properties under or held for development or assets held for sale during the periods under comparison. Same property NOI — cash basis in the three months ended June 30, 2019 and 2018 were both $45.5 million. Same property NOI — cash basis in the six months ended June 30, 2019 was $89.7 million compared to $87.9 million in the six months ended June 30, 2018. The changes in NOI, NOI — cash basis and same property NOI — cash basis are detailed below:
Changes in NOI(2), NOI — Cash Basis and Same Property NOI — Cash Basis |
Sq ft(1) (in millions) | Three Months Ended June 30, | $ change | Sq ft(1) (in millions) | Six Months Ended June 30, | $ change | |||||||||||||||||||||||||||
| 2019 | 2018 | 2019 | 2018 | |||||||||||||||||||||||||||||
Revenue | $ | 67.9 | $ | 62.1 | 5.8 | $ | 131.3 | $ | 123.8 | 7.5 | ||||||||||||||||||||||
Less: Property operating costs | (8.8 | ) | (7.4 | ) | (1.4 | ) | (17.0 | ) | (15.3 | ) | (1.7 | ) | ||||||||||||||||||||
NOI(2) | $ | 59.1 | $ | 54.7 | 4.4 | $ | 114.3 | $ | 108.5 | 5.8 | ||||||||||||||||||||||
Add (deduct): | ||||||||||||||||||||||||||||||||
Lease termination andclose-out fees | (0.6 | ) | — | (0.6 | ) | (0.9 | ) | (1.0 | ) | 0.1 | ||||||||||||||||||||||
Straight-line rent amortization | (1.5 | ) | (0.8 | ) | (0.7 | ) | (2.7 | ) | (2.7 | ) | — | |||||||||||||||||||||
Tenant incentive amortization | 1.3 | 1.3 | — | 2.6 | 2.7 | (0.1 | ) | |||||||||||||||||||||||||
NOI — cash basis | 34.5 | $ | 58.3 | $ | 55.2 | 3.1 | 34.5 | $ | 113.3 | $ | 107.5 | 5.8 | ||||||||||||||||||||
Less NOI — cash basis for: | ||||||||||||||||||||||||||||||||
Acquisitions | 8.4 | (11.7 | ) | (2.7 | ) | (9.0 | ) | 9.0 | (21.3 | ) | (3.4 | ) | (17.9 | ) | ||||||||||||||||||
Dispositions, assets held for sale and developments | 0.8 | (1.1 | ) | (7.0 | ) | 5.9 | 1.6 | (2.3 | ) | (16.2 | ) | 13.9 | ||||||||||||||||||||
Same property NOI — cash basis | 26.1 | $ | 45.5 | $ | 45.5 | — | 25.5 | $ | 89.7 | $ | 87.9 | 1.8 | ||||||||||||||||||||
| (1) | The square footage relating to the NOI — cash basis represents GLA of 34.5 million square feet as at June 30, 2019. The square footage relating to the same property NOI — cash basis represents the aforementioned GLA excluding the impact from the acquisitions during the relevant periods. |
| (2) | NOI is calculated in accordance with IFRS and is included in the unaudited condensed combined financial statements as at and for the three and six months ended June 30, 2019. In the prior year periods, Granite reported NOI as anon-IFRS financial measure, calculated as set forth above but excluding lease termination andclose-out fee revenue. NOI for the six months ended June 30, 2018 was previously reported as $107.5 million, and for the quarter ended June 30, 2018 remained the same as previously reported. |
12 Granite REIT 2019 Second Quarter Report
Property operating costs include recoverable andnon-recoverable costs from tenants and consist of property taxes, utilities, insurance, repairs and maintenance, legal and other property-related expenses. None of Granite’s employee compensation expenses are included in property operating costs.
Straight-line rent amortization represents the scheduled fixed rent changes or rent-free periods in leases that are recognized in revenue evenly on a straight-line basis over the term of the lease. Tenant incentive amortization mainly represents allowances provided to tenants that are recognized in revenue evenly on a straight-line basis over the term of the lease and primarily comprises the amortization associated with the cash allowance incentives paid to Magna in respect of the10-year lease extensions exercised during the 2014 year at the Thondorf and Eurostar properties in Graz, Austria.
NOI — cash basis for the three month period ended June 30, 2019 increased $3.1 million to $58.3 million from $55.2 million in the prior year period largely as a result of the increase in rental revenue as noted previously, partially offset by an increase in property operating costs primarily relating to the properties acquired in 2018 and 2019 and a decrease from straight-line rent amortization, primarily from rent-free periods associated with the building expansion completed in January 2019 at the West Jefferson, Ohio property and the recently acquired property in Mississauga, Ontario.
NOI — cash basis for the six month period ended June 30, 2019 increased $5.8 million to $113.3 million from $107.5 million in the prior year period largely as a result of the increase in rental revenue as noted previously.
Same property NOI — cash basis for the three month periods ended June 30, 2019 and 2018 remained consistent at $45.5 million. Same property NOI — cash basis for the six month period ended June 30, 2019 increased $1.8 million (2.0%) to $89.7 million primarily due to the increase in contractual rents, partiallease-up of the property in Novi, Michigan, andre-leasing and renewals of various leases for properties located in Canada, the United States and Germany, partially offset by vacancies for properties in Canada and the United States and the unfavourable foreign exchange impact from the strengthening of the Canadian dollar against the Euro. Excluding the impact of foreign exchange, same property NOI — cash basis for the three and six month periods ended June 30, 2019 would have increased by 0.6% and 2.8%, respectively.
Granite REIT 2019 Second Quarter Report 13
NOI — cash basis for the three and six month periods ended June 30, 2019 and 2018 by geography was as follows:
NOI — Cash Basis by Geography |
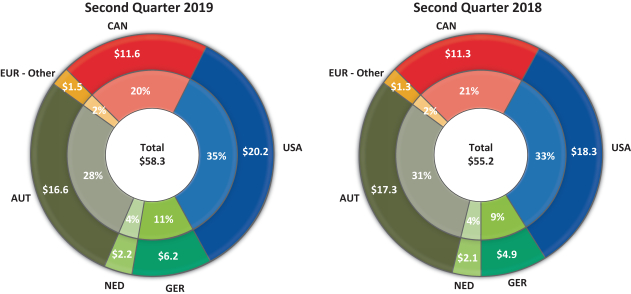
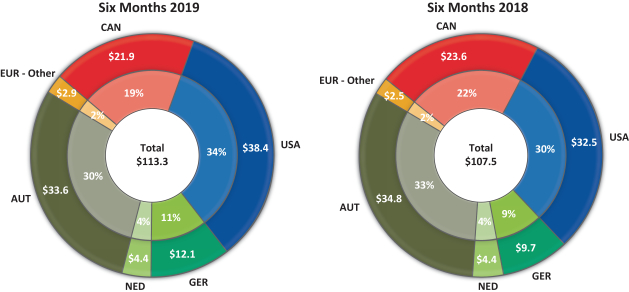
Granite’s property portfolio and NOI — cash basis are geographically diversified, which reduces the risk to Granite’s operating results from any particular country’s economic downturn.
14 Granite REIT 2019 Second Quarter Report
Same property NOI — cash basis for the three and six month periods ended June 30, 2019 and 2018 by geography was as follows:
Same Property NOI — Cash Basis by Geography |
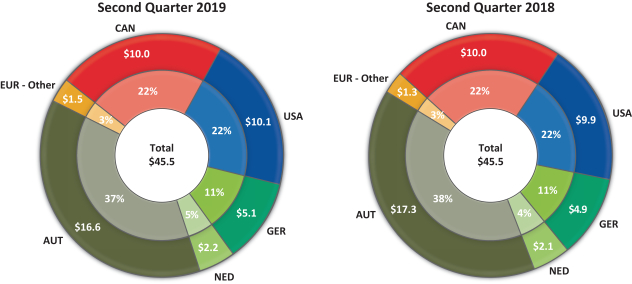
Granite REIT 2019 Second Quarter Report 15
General and Administrative Expenses
General and administrative expenses consisted of the following:
General and Administrative Expenses |
| Three Months Ended June 30, | Six Months Ended June 30, | |||||||||||||||||||||||||||
| 2019 | 2018 | $ change | 2019 | 2018 | $ change | |||||||||||||||||||||||
Salaries and benefits | $ | 4.4 | $ | 3.6 | 0.8 | $ | 7.4 | $ | 8.1 | (0.7 | ) | |||||||||||||||||
Audit, legal and consulting | 1.1 | 1.1 | — | 2.5 | 1.9 | 0.6 | ||||||||||||||||||||||
Trustee/director fees and related expenses | 0.3 | 0.3 | — | 0.6 | 0.6 | — | ||||||||||||||||||||||
Unit-based compensation including distributions and revaluations | 1.3 | 0.6 | 0.7 | 3.2 | 1.6 | 1.6 | ||||||||||||||||||||||
Other public entity costs | 0.7 | 0.6 | 0.1 | 1.2 | 0.9 | 0.3 | ||||||||||||||||||||||
Office rents including property taxes and common area maintenance costs | 0.1 | 0.2 | (0.1 | ) | 0.2 | 0.4 | (0.2 | ) | ||||||||||||||||||||
Other | 0.7 | 0.8 | (0.1 | ) | 1.4 | 1.1 | 0.3 | |||||||||||||||||||||
General and administrative expenses | $ | 8.6 | $ | 7.2 | 1.4 | $ | 16.5 | $ | 14.6 | 1.9 | ||||||||||||||||||
General and administrative expenses were $8.6 million for the three month period ended June 30, 2019 and increased $1.4 million in comparison to the prior year period primarily as a result of the following:
| • | an increase in salaries and benefits expense mainly due to higher compensation costs of $0.6 million in the current year period compared to the prior year period associated with departed executives. The compensation costs related to the former CFO were $1.6 million for the current year period; and |
| • | an increase in unit-based compensation costs mainly due to the accelerated vesting of awards related to the former CFO of $0.5 million, partially offset by the increase in fair value remeasurement recovery resulting from fluctuations in the market price of the Trust’s stapled units. For the three months ended June 30, 2019 and 2018, general and administrative expenses included a fair value remeasurement recovery of $0.2 million and expense of $0.2 million, respectively, associated with the unit-based compensation plans. |
General and administrative expenses were $16.5 million for the six months ended June 30, 2019 and increased $1.9 million in comparison to the prior year period primarily as a result of the following:
| • | an increase in unit-based compensation costs due to the increase in fair value remeasurement expense resulting from fluctuations in the market price of the Trust’s stapled units, greater awards outstanding under the plans and the accelerated vesting of awards noted above. For the six months ended June 30, 2019 and 2018, general and administrative expenses included a fair value remeasurement expense of $1.0 million and $0.5 million, respectively, associated with the unit-based compensation plans; and |
| • | an increase in audit, legal and consulting costs due to corporate advisory matters including internal reorganizations and administrative matters. These increases were partially offset by: |
| • | a decrease in salaries and benefits expense mainly due to a $0.5 million decrease in compensation costs in the current year period (including compensation related to the former CFO) compared to the prior year period associated with departed executives. |
16 Granite REIT 2019 Second Quarter Report
Interest Income
Interest income for the three month period ended June 30, 2019 increased $2.1 million to $2.7 million from $0.6 million in the prior year period. Interest income for the six month period ended June 30, 2019 increased $3.9 million to $5.6 million from $1.7 million in the prior year period. Both increases were primarily due to interest income earned from higher cash balances resulting from the proceeds from the April 2019 equity offering and drawdowns from the term loans in December 2018.
Interest Expense and Other Financing Costs
Interest expense and other financing costs for the three month period ended June 30, 2019 increased $2.4 million to $7.8 million from $5.4 million in the prior year period. Interest expense and other financing costs for the six months ended June 30, 2019 increased $4.4 million to $15.4 million from $11.0 million in the prior year period. Both increases were primarily related to:
| • | interest expense associated with the term loan drawdowns in December 2018; and |
| • | the accretion of interest related to lease obligations as a result of the adoption of IFRS 16,Leasesin 2019(see“NEW ACCOUNTING PRONOUNCEMENTS AND DEVELOPMENTS”). These increases were partially offset by: |
| • | the higher interest expense associated with the credit facility draws in the prior year period. |
As at June 30, 2019, Granite’s weighted average cost of interest-bearing debt was 2.17% (June 30, 2018 — 2.65%) and the weighted average debtterm-to-maturity was 4.2 years (June 30, 2018 — 4.0 years).
Foreign Exchange Gains/Losses, Net
Granite recognized net foreign exchange losses of $0.3 million and $2.3 million in the three month periods ended June 30, 2019 and 2018, respectively. The $2.0 million decrease in net foreign exchange losses is substantially due to the realized foreign exchange loss of $1.9 million recognized in the prior year period relating to the remeasurement of the US dollar cash proceeds from the sale of three investment properties in January 2018.
Granite recognized net foreign exchange losses of $0.8 million and foreign exchange gains of $9.1 million in the six month periods ended June 30, 2019 and 2018, respectively. The $9.9 million increase in net foreign exchange losses is substantially due to the realized net foreign exchange gain of $8.5 million in the prior year period relating to the remeasurement of the US dollar cash proceeds from the sale of three investment properties in January 2018 and, to a lesser extent, the remeasurement of certain monetary assets and liabilities of the Trust that are denominated in US dollars or Euros.
Acquisition Transaction Costs
There were no amounts recorded in acquisition transaction costs for the three and six month periods ended June 30, 2019 as Granite has early adopted, effective January 1, 2019, the amendments to IFRS 3,Business Combinations (see “NEW ACCOUNTING PRONOUNCEMENTS AND DEVELOPMENTS”). Accordingly, transaction costs relating to asset acquisitions are initially recorded to investment properties and, when subsequently measured at fair value, are expensed to net fair value gains/losses on investment properties. For the three and six month periods ended June 30, 2019, transaction costs of $0.9 million and $1.3 million, respectively, were recorded to net fair value gains/losses on investment properties. Acquisition transaction costs for the three and six month periods ended June 30, 2018 were $1.6 million and $1.7 million, respectively. Acquisition transaction costs primarily include land transfer tax and legal and advisory costs.
Granite REIT 2019 Second Quarter Report 17
Fair Value Gains/Losses on Investment Properties, Net
Net fair value gains on investment properties were $69.6 million and $127.9 million in the three month periods ended June 30, 2019 and 2018, respectively. In the three month period ended June 30, 2019, net fair value gains of $69.6 million were primarily attributable to (i) the favourable changes in leasing assumptions associated with fair market rent increases for properties located in Canada and the United States and (ii) a compression in discount and terminal capitalization rates for certain European properties, both resulting from the continued market demand for industrial real estate properties.
Net fair value gains on investment properties in the three month period ended June 30, 2018 of $127.9 million were largely attributable to (i) the increase in fair value to the expected sale price of the six multi-purpose and special purpose propertiesclassified as assets held for sale in the second quarter of 2018 and (ii) for certain properties across Granite’s portfolio, positive changes in leasing assumptions primarily from fair market rent increases and a compression in discount and terminal capitalization rates resulting from market demand.
Net fair value gains on investment properties were $119.7 million and $160.2 million in the six month periods ended June 30, 2019 and 2018, respectively. In the six month period ended June 30, 2019, net fair value gains of $119.7 million were attributable to various factors including (i) the positive changes in leasing assumptions associated with lease renewals and fair market rent increases for properties located in Canada and the United States and (ii) a compression in discount and terminal capitalization rates for certain European properties resulting from the continued market demand for industrial real estate properties.
Net fair value gains on investment properties in the six month period ended June 30, 2018 of $160.2 million were primarily attributable to (i) the increase in fair value to the expected sale price of six multi-purpose and special purpose properties as noted above and(ii) for certain properties across Granite’s portfolio, positive changes in leasing assumptions primarily from contractual and fair market rent increases as well as lease renewals and a compression in discount and terminal capitalization rates resulting from market demand.
Loss on Sale of Investment Properties
The loss on sale of investment properties for the three and six month periods ended June 30, 2019 was $0.6 million and $1.4 million compared to $0.1 million and $1.2 million for the prior year periods, respectively. Loss on sale of investment properties is related to broker commissions and legal and advisory costs associated with the dispositions or planned dispositions of assets held for sale.
18 Granite REIT 2019 Second Quarter Report
Income Tax Expense
Income tax expense comprised the following:
Income Tax Expense |
| Three Months Ended June 30, | Six Months Ended June 30, | |||||||||||||||||||||||||||
| 2019 | 2018 | $ change | 2019 | 2018 | $ change | |||||||||||||||||||||||
Foreign operations | $ | 1.2 | $ | 1.4 | (0.2 | ) | $ | 2.7 | $ | 3.0 | (0.3 | ) | ||||||||||||||||
Withholding taxes | — | 0.7 | (0.7 | ) | — | 0.7 | (0.7 | ) | ||||||||||||||||||||
Related to sale of an investment property | — | 0.2 | (0.2 | ) | — | 0.2 | (0.2 | ) | ||||||||||||||||||||
Other | 0.5 | 0.5 | — | 0.9 | 0.9 | — | ||||||||||||||||||||||
Current tax expense | 1.7 | 2.8 | (1.1 | ) | 3.6 | 4.8 | (1.2 | ) | ||||||||||||||||||||
Deferred tax expense | 11.8 | 18.1 | (6.3 | ) | 22.7 | 26.1 | (3.4 | ) | ||||||||||||||||||||
Income tax expense | $ | 13.5 | $ | 20.9 | (7.4 | ) | $ | 26.3 | $ | 30.9 | (4.6 | ) | ||||||||||||||||
For the three and six months ended June 30, 2019, the current tax expense decreased compared to the prior year periods primarily due to withholding taxes on inter-company dividends paid in the prior year periods, the foreign exchange impact resulting from the relative strengthening of the Canadian dollar on Euro denominated tax expense, and the payment of taxes in the prior year periods on the disposition of a property located in Germany.
The decrease in deferred tax expense for the three and six months ended June 30, 2019 compared to the prior year periods was primarily due to a decrease in fair value gains in jurisdictions in which deferred taxes are recorded.
Granite REIT 2019 Second Quarter Report 19
Net Income Attributable to Stapled Unitholders
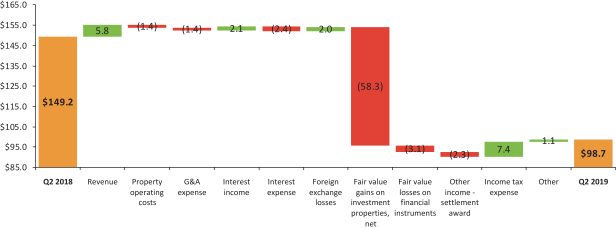
For the three month period ended June 30, 2019, net income attributable to stapled unitholders was $98.7 million compared to $149.2 million in the prior year period. The $50.5 million net decrease was primarily due to a $58.3 million decrease in net fair value gains on investment properties, partially offset by a $5.8 million increase in revenue. The $50.5 million decrease in net income attributable to stapled unitholders is summarized below:
Q2 2019 vs Q2 2018 Change in Net Income Attributable to Stapled Unitholders |
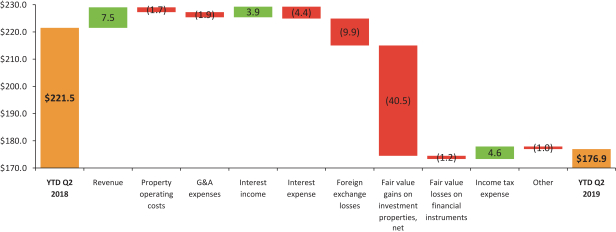
For the six month period ended June 30, 2019, net income attributable to stapled unitholders was $176.9 million compared to $221.5 million in the prior year period. The $44.6 million net decrease was primarily due to a $40.5 million decrease in net fair value gains on investment properties. The $44.6 million decrease in net income attributable to stapled unitholders is summarized below:
Q2 2019 YTD vs Q2 2018 YTD Change in Net Income Attributable to Stapled Unitholders |
20 Granite REIT 2019 Second Quarter Report
Funds From Operations and Adjusted Funds From Operations
The reconciliation of net income attributable to stapled unitholders to FFO and AFFO for the three and six months ended June 30, 2019 and 2018 is presented below:
FFO AND AFFO RECONCILIATION |
| Three Months Ended June 30, | Six Months Ended June 30, | |||||||||||||||||
| (in millions, except per unit information) | 2019 | 2018 | 2019 | 2018 | ||||||||||||||
Net income attributable to stapled unitholders | $ | 98.7 | $ | 149.2 | $ | 176.9 | $ | 221.5 | ||||||||||
Add (deduct): | ||||||||||||||||||
Fair value gains on investment | (69.6 | ) | (127.9 | ) | (119.7 | ) | (160.2 | ) | ||||||||||
Fair value losses (gains) on financial instruments | 1.7 | (1.4 | ) | 1.8 | 0.5 | |||||||||||||
Acquisition transaction costs | — | 1.6 | — | 1.7 | ||||||||||||||
Loss on sale of investment properties | 0.6 | 0.1 | 1.4 | 1.2 | ||||||||||||||
Other income — settlement award | — | (2.3 | ) | — | (2.3 | ) | ||||||||||||
Current income tax expense associated with the sale of an investment property | — | 0.2 | — | 0.2 | ||||||||||||||
Deferred income tax expense | 11.8 | 18.1 | 22.7 | 26.1 | ||||||||||||||
Fair value remeasurement expense relating to the Executive Deferred Stapled Unit Plan(1) | — | — | 0.7 | — | ||||||||||||||
Non-controlling interests relating to the above | (0.1 | ) | — | — | — | |||||||||||||
FFO | [A] | $ | 43.1 | $ | 37.6 | $ | 83.8 | $ | 88.7 | |||||||||
Add (deduct): | ||||||||||||||||||
Maintenance or improvement | (0.6 | ) | (6.2 | ) | (1.8 | ) | (15.0 | ) | ||||||||||
Leasing commissions paid | — | (2.3 | ) | (0.2 | ) | (4.0 | ) | |||||||||||
Tenant incentives paid | — | (0.2 | ) | (0.2 | ) | (9.2 | ) | |||||||||||
Tenant incentive amortization | 1.3 | 1.3 | 2.6 | 2.7 | ||||||||||||||
Straight-line rent amortization | (1.5 | ) | (0.8 | ) | (2.7 | ) | (2.7 | ) | ||||||||||
AFFO | [B] | $ | 42.3 | $ | 29.4 | $ | 81.5 | $ | 60.5 | |||||||||
Per unit amounts: | ||||||||||||||||||
Basic and diluted FFO per stapled unit | [A]/[C] and [A]/[D] | $ | 0.89 | $ | 0.82 | $ | 1.78 | $ | 1.93 | |||||||||
Basic and diluted AFFO per stapled unit | [B]/[C] and [B]/[D] | $ | 0.88 | $ | 0.64 | $ | 1.73 | $ | 1.32 | |||||||||
Basic weighted average number of | [C] | 48.2 | 45.8 | 47.0 | 46.0 | |||||||||||||
Diluted weighted average number of stapled units | [D] | 48.3 | 45.8 | 47.0 | 46.1 | |||||||||||||
| (1) | The Executive Deferred Stapled Unit Plan provides equity-based compensation in the form of stapled units to executives and other employees. It is anticipated that the fair value remeasurement relating to the Executive Deferred Stapled Unit Plan will fluctuate and have a greater impact on FFO and AFFO going forward and has, therefore, been adjusted in FFO and AFFO in accordance with the REALPAC White Paper. The comparative amount was not adjusted as it was not significant in the prior year periods and the year 2018. |
Granite REIT 2019 Second Quarter Report 21
Funds From Operations
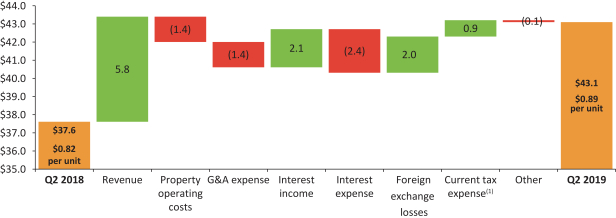
FFO for the three month period ended June 30, 2019 was $43.1 million ($0.89 per unit) compared to $37.6 million ($0.82 per unit) in the prior year period. The $5.5 million ($0.07 per unit) increase in FFO is summarized below:
Q2 2019 vs Q2 2018 Change in FFO |
| (1) | Excludes current tax expense of $0.2 million associated with the sale of an investment property in 2018. |
Excluding the compensation costs of $2.1 million ($0.04 per unit) associated with the departure of the former CFO, which include the accelerated vesting of unit-based awards, FFO would have been $45.2 million ($0.93 per unit) in the three month period ended June 30, 2019. Excluding the foreign exchange loss of $1.9 million ($0.04 per unit) realized during the second quarter of 2018 on US dollar cash proceeds from the sale of investment properties in January 2018 and the compensation costs relating to departed executives of $1.0 million ($0.02 per unit), FFO would have been $40.5 million ($0.88 per unit) in the three month period ended June 30, 2018.
FFO for the six months ended June 30, 2019 was $83.8 million ($1.78 per unit) compared to $88.7 million ($1.93 per unit) in the prior year period. The $4.9 million ($0.15 per unit) decrease in FFO is summarized below:
Q2 2019 YTD vs Q2 2018 YTD Change in FFO |
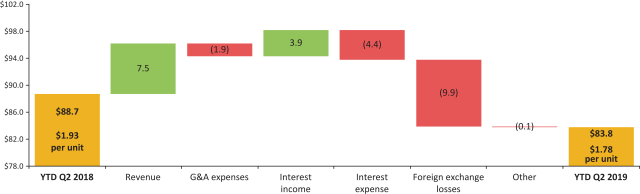
Excluding the compensation costs of $2.1 million ($0.04 per unit) associated with the departure of the former CFO, which include the accelerated vesting of unit-based awards, FFO would have been $85.9 million ($1.82 per unit) for the six months ended June 30, 2019. In comparison, excluding the net
22 Granite REIT 2019 Second Quarter Report
foreign exchange gain of $8.5 million ($0.19 per unit) realized during the period on the remeasurement of US dollar cash proceeds from the sale of investment properties in January 2018 and the compensation costs associated with departed executives of $2.4 million ($0.05 per unit), FFO would have been $82.6 million ($1.79 per unit) in the prior year period.
Adjusted Funds From Operations
As previously detailed in the FFO and AFFO reconciliation table, AFFO for the three month period ended June 30, 2019 was $42.3 million ($0.88 per unit) compared to $29.4 million ($0.64 per unit) in the prior year period. The $12.9 million ($0.24 per unit) increase in AFFO is summarized below:
Q2 2019 vs Q2 2018 Change in AFFO |
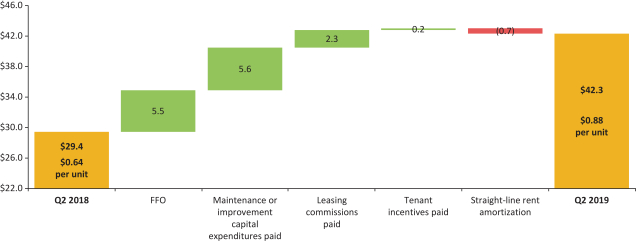
Additional details pertaining to the components of the change in AFFO are as follows:
| • | the $5.5 million increase in FFO, as noted previously; |
| • | a $5.6 million decrease in capital expenditures paid largely due to higher payments made in the prior year period relating to improvement projects arising fromre-leasing activities at a property in Novi, Michigan and a property located in Olive Branch, Mississippi acquired in 2017; and |
| • | a $2.3 million decrease in leasing commissions paid due to payments made in the prior year period relating to there-leasing of the property located in Olive Branch, Mississippi, partially offset by; |
| • | a $0.7 million decrease in AFFO from straight-line rent amortization, primarily from rent-free periods associated with the building expansion completed in January 2019 at the West Jefferson, Ohio property and the recently acquired property in Mississauga, Ontario. |
Excluding the compensation costs of $2.1 million ($0.04 per unit) associated with the departure of the former CFO, which include the accelerated vesting of unit-based awards, AFFO would have been $44.4 million ($0.92 per unit) in the three month period ended June 30, 2019. In comparison, excluding the foreign exchange loss of $1.9 million ($0.04 per unit) realized during the second quarter of 2018 on US dollar cash proceeds from the sale of investment properties in January 2018 and the compensation costs associated with departed executives of $1.0 million ($0.02 per unit), AFFO would have been $32.3 million ($0.70 per unit) in the prior year period.
Granite REIT 2019 Second Quarter Report 23
AFFO for the six months ended June 30, 2019 was $81.5 million ($1.73 per unit) compared to $60.5 million ($1.32 per unit) in the prior year period. The $21.0 million ($0.41 per unit) increase in AFFO is summarized below:
Q2 2019 YTD vs Q2 YTD 2018 Change in AFFO |
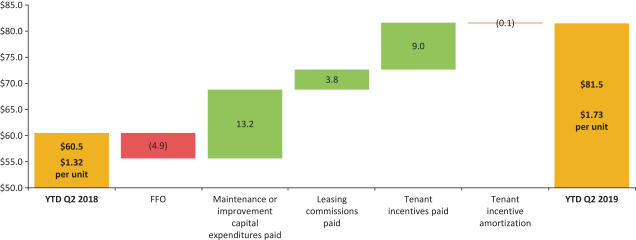
Additional details pertaining to the components of the change in AFFO are as follows:
| • | the $4.9 million decrease in FFO, as noted previously, partially offset by; |
| • | a $13.2 million decrease in capital expenditures paid largely due to higher payments made in the prior year period relating to improvement projects arising fromre-leasing activities at the properties in Novi, Michigan and Olive Branch, Mississippi as noted above; |
| • | a $3.8 million decrease in leasing commissions paid primarily due to payments made in the prior year period relating to there-leasing of the property located in Olive Branch, Mississippi, the developed property in Poland, the partiallyleased-up property in Novi, Michigan, as well as lease renewals and extensions for two properties in the United States and Germany; and |
| • | a $9.0 million decrease in tenant incentives paid largely due to a 2018 payment relating to a tenant allowance for a 2014 lease extension at the Eurostar facility in Graz, Austria. |
Excluding the compensation costs of $2.1 million ($0.04 per unit) associated with the departure of the former CFO, which include the accelerated vesting of unit-based awards, AFFO would have been $83.6 million ($1.77 per unit) for the six months ended June 30, 2019. In comparison, excluding the net foreign exchange gain of $8.5 million ($0.19 per unit) realized during the period on the remeasurement of US dollar cash proceeds from the sale of investment properties in January 2018, compensation costs associated with departed executives of $2.4 million ($0.05 per unit) and the payment of the tenant incentive allowance made in connection with a 2014 lease extension at the Eurostar facility in Graz, Austria of $9.1 million ($0.19 per unit), AFFO would have been $63.5 million ($1.37 per unit) in the six months ended June 30, 2018.
| INVESTMENT PROPERTIES |
Granite’s investment properties consist of income-producing properties, properties under development and land held for development. Substantially all of the income-producing properties are for industrial use and can be categorized as (i) modern logistics/distribution warehouse facilities (“modern warehouse facilities”), which were recently acquired or newly developed/redeveloped, (ii) multi-purpose facilities, which are tenantable by a wide variety of potential users or (iii) special purpose properties designed and built with specialized features and leased to Magna. The attributes of the income-producing properties are versatile and are based on the needs of the tenant such that an industrial property used by a certain tenant
24 Granite REIT 2019 Second Quarter Report
for light or heavy manufacturing can be used by another tenant for other industrial uses after some retrofitting if necessary. Accordingly, the investment property portfolio is substantially for industrial use and, as such, Granite determined that its asset class comprises industrial properties for purposes of financial reporting. The fair value of the industrial properties, as noted below, is based upon the current tenanting, existing use and attributes of such properties.
Properties under development comprise a site in Altbach, Germany where the demolition of the property is substantially complete and construction of a distribution/light industrial facility is subject to receipt of all required permits and state approval, and a parcel of development land in Plainfield, Indiana where construction of a class A distribution/warehouse commenced in the second quarter of 2019 and the total expected costs are approximately $32 million.
Land held for development comprise a16-acre parcel of land located in Wroclaw, Poland that could provide for approximately 0.3 million square feet of logistics-warehouse space as well as 12.9 acres of development land in Ohio, United States that was acquired in 2018.
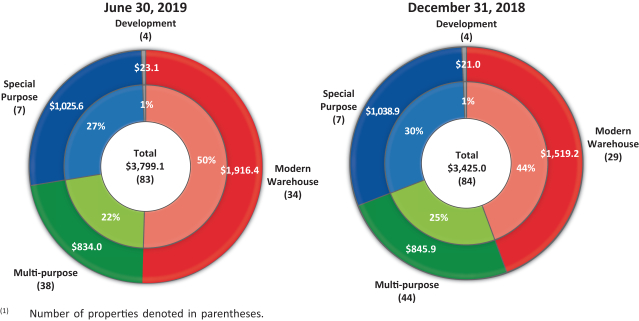
Summary attributes of the investment properties as at June 30, 2019 and December 31, 2018 were as follows:
Investment Properties Summary(1) |
| As at June 30, 2019 and December 31, 2018 | 2019 | 2018 | ||||||
(in millions, except as noted) | ||||||||
Investment properties — fair value | $ | 3,799.1 | $ | 3,425.0 | ||||
Income-producing properties | 3,776.0 | 3,404.0 | ||||||
Properties under development | 18.4 | 17.0 | ||||||
Land held for development | 4.7 | 4.0 | ||||||
Overall capitalization rate(2) | 6.3% | 6.7% | ||||||
Number of investment properties | 83 | 84 | ||||||
Income-producing properties | 79 | 80 | ||||||
Properties under development | 2 | 2 | ||||||
Land held for development | 2 | 2 | ||||||
Property metrics | ||||||||
GLA, square feet | 34.5 | 32.2 | ||||||
Occupancy, by GLA | 98.9% | 99.1% | ||||||
Weighted average lease term in years, by square footage | 6.0 | 6.0 | ||||||
Total number of tenants | 51 | 48 | ||||||
Magna as a percentage of annualized revenue(3) | 48% | 54% | ||||||
Magna as a percentage of GLA | 41% | 47% | ||||||
Granite REIT 2019 Second Quarter Report 25
Assets Held for Sale(1) | ||||
| As at June 30, 2019 and December 31, 2018 | 2019 | 2018 | ||||||
(in millions, except as noted) | ||||||||
Assets held for sale | ||||||||
Fair value | $ | 50.5 | $ | 44.2 | ||||
Number of properties | 6 | 6 | ||||||
GLA, square feet | 0.8 | 0.7 | ||||||
Magna as a percentage of GLA | 90% | 94% | ||||||
Annualized revenue(3) | $ | 3.6 | $ | 2.2 | ||||
| (1) | Assets held for sale are excluded from investment properties and related property metrics. Accordingly, six such assets that were held for sale as at June 30, 2019 and six such assets that were held for sale as at December 31, 2018 were excluded from investment properties and related property metrics as at June 30, 2019 and December 31, 2018, respectively, throughout this MD&A. |
| (2) | Overall capitalization rate pertains only to income-producing properties. |
| (3) | Annualized revenue for each period presented is calculated as rental revenue excluding tenant recoveries, recognized in accordance with IFRS, in the reported month multiplied by 12 months. |
The fair value of the investment properties by asset category as at June 30, 2019 and December 31, 2018 was as follows:
Fair Value of Investment Properties by Asset Category(1) |
26 Granite REIT 2019 Second Quarter Report
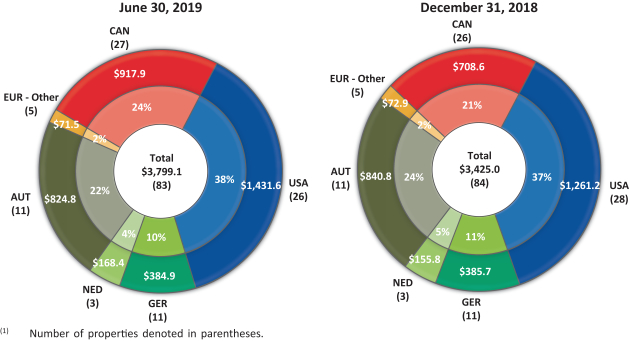
Granite has a specialized and high quality global portfolio of large scale properties strategically located in Canada, the United States and Europe. The fair value of the investment properties by country as at June 30, 2019 and December 31, 2018 was as follows:
Fair Value of Investment Properties by Geography(1) |
The change in the fair value of investment properties by asset category during the six months ended June 30, 2019 was as follows:
Change in Fair Value of Investment Properties by Asset Category |
| January 1, 2019 | June 30, 2019 | |||||||||||||||||||||||||||||||||||
| Investment properties | Ground leases | Fair value gains | Acquisitions | Capital expenditures | Foreign exchange losses | Other changes | Classified as assets held for sale | Investment properties | ||||||||||||||||||||||||||||
Modern | $ | 1,519.2 | 11.8 | 36.3 | 411.2 | 3.8 | (68.9 | ) | 3.0 | — | $ | 1,916.4 | ||||||||||||||||||||||||
Multi-purpose facilities | 845.9 | — | 55.9 | — | 0.7 | (17.4 | ) | 0.1 | (51.2 | ) | 834.0 | |||||||||||||||||||||||||
Special purpose properties | 1,038.9 | — | 26.3 | — | — | (37.3 | ) | (2.3 | ) | — | 1,025.6 | |||||||||||||||||||||||||
Income-Producing Properties | 3,404.0 | 11.8 | 118.5 | 411.2 | 4.5 | (123.6 | ) | 0.8 | (51.2 | ) | 3,776.0 | |||||||||||||||||||||||||
Properties Under Development | 17.0 | — | — | — | 2.2 | (0.8 | ) | — | — | 18.4 | ||||||||||||||||||||||||||
Land Held For Development | 4.0 | — | 0.9 | — | — | (0.2 | ) | — | — | 4.7 | ||||||||||||||||||||||||||
| $ | 3,425.0 | $ | 11.8 | $ | 119.4 | $ | 411.2 | $ | 6.7 | $ | (124.6 | ) | $ | 0.8 | $ | (51.2 | ) | $ | 3,799.1 | |||||||||||||||||
Granite REIT 2019 Second Quarter Report 27
During the six months ended June 30, 2019, the fair value of investment properties increased by $374.1 million, primarily due to:
| • | the recognition of ground leases effective January 1, 2019 under IFRS 16,Leases has increased the fair value of investment properties by $11.8 million, consisting of $9.1 million in Botlek, Netherlands and $2.7 million in Soest, Germany (see“NEW ACCOUNTING PRONOUNCEMENTS AND DEVELOPMENTS”). The obligations for these two land leases have been recorded on the combined balance sheet with theright-of-use assets recorded in investment properties; |
| • | net fair value gains of $119.4 million which were attributable to various factors including (i) the positive changes in leasing assumptions associated with lease renewals and fair market rent increases for certain properties located in Canada and the United States and (ii) a compression in discount and terminal capitalization rates for certain European properties resulting from the continued market demand for industrial real estate properties; |
| • | the acquisitions of three income-producing properties in the United States and the leasehold interest in two properties in Canada for $411.2 million consisting of two properties in Texas for $164.2 million, one property in Columbus, Ohio for $71.6 million, the leasehold interest in two properties in Mississauga, Ontario for $174.1 million and the associated transaction costs of $1.3 million (see “SIGNIFICANT MATTERS”); and |
| • | capital expenditures of $6.7 million, of which $3.4 million related to the construction of a 0.3 million square foot recently completed expansion at an acquired property near Columbus, Ohio and $2.2 million related to development capital expenditures for two properties under construction in Altbach, Germany and Indiana, United States. Capital expenditures can include expansion or development expenditures and maintenance or improvement expenditures. Expansion or development capital expenditures are discretionary in nature and are incurred to generate new revenue streams and/or increase the productivity of a property. Maintenance or improvement capital expenditures relate to sustaining the existing earnings capacity of a property. |
These increases are partially offset by:
| • | foreign exchange losses of $124.6 million, which primarily include foreign exchange losses of $57.5 million and $65.5 million resulting from the relative strengthening of the Canadian dollar against the US dollar and the Euro, respectively; and |
| • | the classification of six properties valued at $51.2 million as assets held for sale. These properties are classified as assets held for sale on the combined balance sheet and excluded from the investment properties categorization (see “SIGNIFICANT MATTERS”). |
Fair values were primarily determined by discounting the expected future cash flows, generally over a term of 10 years, plus a terminal value based on the application of a capitalization rate to estimated year 11 cash flows. Granite measures its investment properties using valuations prepared by management. Granite does not measure its investment properties based on valuations prepared by external appraisers but uses such external appraisals as data points, together with other external market information accumulated by management, in arriving at its own conclusions on values. Management uses valuation assumptions such as discount rates, terminal capitalization rates and market rental rates applied in external appraisals or sourced from valuation experts; however, the Trust also uses its historical renewal experience with tenants, its direct knowledge of the specialized nature of Granite’s portfolio and tenant profile and its knowledge of the actual condition of the properties in making business judgments about lease renewal probabilities, renewal rents and capital expenditures. There has been no change in the valuation methodology used during the six month period ended June 30, 2019. The key valuation metrics for Granite’s investment properties including the discount and terminal capitalization rates by jurisdiction are summarized in note 4 to the unaudited condensed combined financial statements for the three and six month periods ended
28 Granite REIT 2019 Second Quarter Report
June 30, 2019. In addition, valuation metrics for Granite’s income-producing properties (excluding assets held for sale) by asset category as at June 30, 2019 and December 31, 2018 were as follows:
Valuation Metrics by Income-Producing Property Asset Category |
As at June 30, 2019 and | Modern warehouse facilities | Multi-purpose facilities | Special purpose properties | Total | ||||||||||||||||||||||||||||||||||||||||
| 2019 | 2018 | 2019 | 2018 | 2019 | 2018 | 2019 | 2018 | |||||||||||||||||||||||||||||||||||||
Overall capitalization rate(1)(2) | 5.50% | 5.66% | 6.58% | 7.06% | 7.58% | 7.77% | 6.30% | 6.65% | ||||||||||||||||||||||||||||||||||||
Terminal capitalization rate(1) | 6.17% | 6.25% | 6.72% | 6.95% | 7.13% | 7.50% | 6.56% | 6.81% | ||||||||||||||||||||||||||||||||||||
Discount rate(1) | 6.24% | 6.34% | 6.79% | 7.02% | 7.48% | 7.63% | 6.70% | 6.90% | ||||||||||||||||||||||||||||||||||||
| (1) | Weighted based on income-producing property fair value. |
| (2) | Overall capitalization rate is calculated as stabilized net operating income (property revenue less property expenses) divided by the fair value of the property. |
A sensitivity analysis of the fair value of income-producing properties to changes in the overall capitalization rate, terminal capitalization rate and discount rate at June 30, 2019 is presented below:
Sensitivity Analysis of Fair Value of Income-Producing Properties |
| Rate sensitivity | Overall capitalization rate | Terminal capitalization rate | Discount rate | |||||||||
+50 bps | 3,485.7 | 3,627.2 | 3,637.2 | |||||||||
+25 bps | 3,624.7 | 3,698.7 | 3,705.7 | |||||||||
Base rate | $ | 3,776.0 | $ | 3,776.0 | $ | 3,776.0 | ||||||
-25 bps | 3,941.2 | 3,859.6 | 3,847.9 | |||||||||
-50 bps | 4,122.5 | 3,950.5 | 3,921.7 | |||||||||
Maintenance or Improvement Capital Expenditures and Leasing Costs
Maintenance or improvement capital expenditures relate to sustaining the existing earnings capacity of the property portfolio. Leasing costs include direct leasing costs and lease incentives. Direct leasing costs include broker commissions incurred in negotiating and arranging tenant leases. Lease incentives include the cost of leasehold improvements to tenant spaces and/or cash allowances provided to tenants for leasehold improvement costs.
Maintenance or Improvement Capital Expenditures and Leasing Costs Paid
The maintenance or improvement capital expenditures and leasing costs paid by quarter for the trailing eight quarters were as follows:
Maintenance or Improvement Capital Expenditures and Leasing Costs Paid |
| Q2’19 | Q1’19 | Q4’18 | Q3’18 | Q2’18 | Q1’18 | Q4’17 | Q3’17 | |||||||||||||||||||||||||||
Maintenance or improvement capital expenditures paid | $ | 0.6 | $ | 1.2 | $ | 1.2 | $ | 1.6 | $ | 6.2 | $ | 8.8 | $ | 9.3 | $ | 0.6 | ||||||||||||||||||
Leasing costs paid | — | 0.4 | 0.4 | 0.5 | 2.4 | 10.8 | 1.4 | 1.6 | ||||||||||||||||||||||||||
Total paid | [A] | $ | 0.6 | $ | 1.6 | $ | 1.6 | $ | 2.1 | $ | 8.6 | $ | 19.6 | $ | 10.7 | $ | 2.2 | |||||||||||||||||
GLA, square feet | [B] | 34.5 | 32.8 | 32.2 | 32.5 | 31.8 | 29.7 | 29.1 | 30.2 | |||||||||||||||||||||||||
$ paid per square feet | [A]/[B] | $ | 0.02 | $ | 0.05 | $ | 0.05 | $ | 0.06 | $ | 0.27 | $ | 0.66 | $ | 0.37 | $ | 0.07 | |||||||||||||||||
Granite REIT 2019 Second Quarter Report 29
In the first quarter of 2018, Granite paid $9.1 million related to a tenant incentive allowance for a 2014 lease extension at the 1.1 million square foot Eurostar facility in Graz, Austria.
Commencing with the third quarter of 2017, Granite undertook tore-develop its Novi, MI property, which was vacated by Magna in March 2017. Granite leased 71% of the space to Hanon Systems for a minimum lease term of 15 years commencing in January 2018. The 0.3 million square foot facility is one of the very few office properties in Granite’s portfolio.
Granite has invested a total of $23.6 million in capital commencing 2017 to reposition and lease the Novi, MI flex office property. The following is a summary of the capital expenditures and leasing costs paid by quarter in connection with the Novi, MI property:
Novi, MI Property: Maintenance or Improvement Capital Expenditures and Leasing Costs Paid |
| Q2’19 | Q1’19 | Q4’18 | Q3’18 | Q2’18 | Q1’18 | Q4’17 | Q3’17 | |||||||||||||||||||||||||
Maintenance or improvement capital expenditures paid | $ | 0.3 | $ | 0.6 | $ | 0.5 | $ | 0.1 | $ | 3.2 | $ | 8.4 | $ | 8.0 | $ | 0.1 | ||||||||||||||||
Leasing costs paid | — | — | — | — | — | 0.2 | 1.0 | 1.2 | ||||||||||||||||||||||||
Total paid | $ | 0.3 | $ | 0.6 | $ | 0.5 | $ | 0.1 | $ | 3.2 | $ | 8.6 | $ | 9.0 | $ | 1.3 | ||||||||||||||||
Granite is actively marketing the remaining 0.1 million square feet of available space and anticipates incurring additional cash outflows totaling approximately $5.6 million in capital expenditures and leasing costs over the next year to complete the Novi, MI facility andlease-up of the remaining available space.
Excluding thenon-recurring or unusual items noted above for the Graz, Austria and Novi, MI properties, the maintenance or improvement capital expenditures and leasing costs paid by quarter for the trailing eight quarters were as follows:
Maintenance or Improvement Capital Expenditures and Leasing Costs Paid — |
| Q2’19 | Q1’19 | Q4’18 | Q3’18 | Q2’18 | Q1’18 | Q4’17 | Q3’17 | |||||||||||||||||||||||||||
Maintenance or improvement capital expenditures paid | $ | 0.3 | $ | 0.6 | $ | 0.7 | $ | 1.5 | $ | 3.0 | $ | 0.4 | $ | 1.3 | $ | 0.5 | ||||||||||||||||||
Leasing costs paid | — | 0.4 | 0.4 | 0.5 | 2.4 | 1.5 | 0.4 | 0.4 | ||||||||||||||||||||||||||
Total paid | [C] | $ | 0.3 | $ | 1.0 | $ | 1.1 | $ | 2.0 | $ | 5.4 | $ | 1.9 | $ | 1.7 | $ | 0.9 | |||||||||||||||||
GLA, square feet | [D] | 34.2 | 32.5 | 31.9 | 32.2 | 31.5 | 29.4 | 28.8 | 29.9 | |||||||||||||||||||||||||
$ paid per square feet | [C]/[D] | $ | 0.01 | $ | 0.03 | �� | $ | 0.03 | $ | 0.06 | $ | 0.17 | $ | 0.06 | $ | 0.06 | $ | 0.03 | ||||||||||||||||
30 Granite REIT 2019 Second Quarter Report
Development and Expansion Projects
The attributes of Granite’s properties under development and expansion projects as at June 30, 2019 were as follows:
Development and Expansion Projects |
Land (in acres) | Expected (in millions) | Target/actual start date of construction | Target completion date | Expected total construction cost(1) | ||||||||||||||||
As at June 30, 2019 | ||||||||||||||||||||
Properties under development | ||||||||||||||||||||
Plainfield, Indiana | 30 | 0.5 | Q2 2019 | Q1 2020 | $ | 32.0 | ||||||||||||||
Altbach, Germany | 13 | 0.3 | Q1 2020 | Q4 2020 | 31.0 | |||||||||||||||
Expansion project | ||||||||||||||||||||
2095 Logistics Drive, Mississauga, Ontario | 9 | 0.1 | Q4 2019 | Q2 2020 | 9.0 | |||||||||||||||
| 52 | 0.9 | $ | 72.0 | |||||||||||||||||
Projects entered into between July 1, 2019 and July 31, 2019: |
| |||||||||||||||||||
Development land in Houston, Texas acquired July 1, 2019 (initial phase of construction) | 191 | 0.6 | Q3 2019 | Q3 2020 | 50.4 | |||||||||||||||
| 243 | 1.5 | $ | 122.4 | |||||||||||||||||
| (1) | Construction cost excludes cost of land. |
Leasing Profile
Magna, Granite’s Largest Tenant
At June 30, 2019, Magna International Inc. or one of its operating subsidiaries was the tenant at 36 (December 31, 2018 — 41) of Granite’s income-producing properties and comprised 48% (December 31, 2018 — 54%) of Granite’s annualized revenue and 41% (December 31, 2018 — 47%) of Granite’s GLA. According to its public disclosure, Magna International Inc. has a credit rating of A3 with a stable outlook by Moody’s Investor Service,A- with a stable outlook by Standard & Poor’s and A(low) with a stable outlook by DBRS Limited. Magna International Inc. is a technology company and a global automotive supplier with international manufacturing operations and product development, engineering and sales centres. Its capabilities include body exteriors and structures, power and vision technologies, seating systems and complete vehicle solutions.
Granite’s relationship with Magna is an arm’s length landlord and tenant relationship governed by the terms of Granite’s leases. Granite’s properties are generally leased to operating subsidiaries of Magna International Inc. and are not guaranteed by the parent company; however, Magna International Inc. is the tenant under certain of Granite’s leases. The terms of the lease arrangements with Magna generally provide for the following:
| • | the obligation of Magna to pay for costs of occupancy, including operating costs, property taxes and maintenance and repair costs; |
| • | rent escalations based on either fixed-rate steps or inflation; |
| • | renewal options tied to market rental rates or inflation; |
| • | environmental indemnities from the tenant; and |
| • | a right of first refusal in favour of Magna on the sale of a property. |
Renewal terms, rates and conditions are typically set out in Granite’s leases with Magna and form the basis for tenancies that continue beyond the expiries of the initial lease terms.
Granite REIT 2019 Second Quarter Report 31
According to its public disclosure, Magna’s success is primarily dependent upon the levels of North American, European and Chinese car and light truck production by Magna’s customers. Granite expects Magna to continuously seek to optimize its global manufacturing footprint and consequently, Magna may or may not renew leases for facilities currently under lease at their expiries.
Other Tenants
In addition to Magna, at June 30, 2019, Granite had 50 other tenants from various industries that in aggregate comprised 52% of the Trust’s annualized revenue. Each of these tenants accounted for less than 4% of the Trust’s annualized revenue as at June 30, 2019.
Granite’s top 10 tenants by annualized revenue at June 30, 2019 are summarized in the table below:
Top 10 Tenants Summary |
| Tenant | Annualized Revenue % | GLA % | WALT (years) | Credit Rating(1)(2) | ||||||||||||
Magna | 48% | 41% | 5.7 | A(low) | ||||||||||||
ADESA | 3% | 1% | 10.1 | BB(low) | ||||||||||||
Restoration Hardware | 3% | 4% | 8.8 | NR | ||||||||||||
Ingram Micro | 3% | 3% | 5.5 | BBB(low) | ||||||||||||
Mars Petcare | 2% | 4% | 2.8 | NR | ||||||||||||
Wayfair | 2% | 2% | 6.3 | NR | ||||||||||||
Hanon Systems | 2% | 1% | 13.6 | AA | ||||||||||||
Ricoh | 2% | 2% | 6.0 | BBB(high) | ||||||||||||
Grupo Antolin | 2% | 2% | 9.3 | B(high) | ||||||||||||
Samsung | 2% | 2% | 2.8 | AA(low) | ||||||||||||
Top 10 Tenants | 69% | 62% | 5.9 | |||||||||||||
| (1) | Credit rating is quoted on the DBRS equivalent rating scale where publicly available. NR refers to Not Rated. |
| (2) | The credit rating indicated may, in some instances, apply to an affiliated company of Granite’s tenant which may not be the guarantor of the lease. |
32 Granite REIT 2019 Second Quarter Report
Lease Expiration
As at June 30, 2019, Granite’s portfolio had a weighted average lease term by square footage of 6.0 years (December 31, 2018 — 6.0 years) with lease expiries by GLA (in thousands of square feet), lease count and annualized revenue (calculated as rental revenue excluding tenant recoveries, recognized in accordance with IFRS, in June 2019 multiplied by 12 months, in millions) as set out in the table below:
Lease Maturity Summary |
| Total GLA | Total Lease Count | Total Annualized Revenue $ | Vacancies | 2019 | 2020 | 2021 | 2022 | 2023 | 2024 | 2025 and Beyond | ||||||||||||||||||||||||||||||||||||||||||||||||||||||||||||||||||||||||||||||||||||||||||
| Country | Sq Ft | Sq Ft | Annualized Revenue $ | Sq Ft | Annualized Revenue $ | Sq Ft | Annualized Revenue $ | Sq Ft | Annualized Revenue $ | Sq Ft | Annualized Revenue $ | Sq Ft | Annualized Revenue $ | Sq Ft | Annualized Revenue $ | |||||||||||||||||||||||||||||||||||||||||||||||||||||||||||||||||||||||||||||||||||||
Canada | 6,158 | 26 | 48.0 | 230 | — | — | 523 | 2.9 | 316 | 2.9 | 347 | 2.9 | 594 | 3.6 | 934 | 6.9 | 3,214 | 28.8 | ||||||||||||||||||||||||||||||||||||||||||||||||||||||||||||||||||||||||||||||||||
United States | 15,354 | 38 | 89.7 | 241 | 711 | 3.6 | 370 | 2.7 | 87 | 0.7 | 2,591 | 12.3 | 2,731 | 13.8 | 2,237 | 12.3 | 6,386 | 44.3 | ||||||||||||||||||||||||||||||||||||||||||||||||||||||||||||||||||||||||||||||||||
Austria | 8,101 | 12 | 62.6 | — | — | — | 101 | 0.6 | 389 | 2.7 | 802 | 9.5 | 125 | 1.2 | 5,349 | 38.0 | 1,335 | 10.6 | ||||||||||||||||||||||||||||||||||||||||||||||||||||||||||||||||||||||||||||||||||
Germany | 3,504 | 11 | 24.6 | — | — | — | — | — | 548 | 3.7 | 283 | 2.2 | 1,947 | 14.0 | — | — | 726 | 4.7 | ||||||||||||||||||||||||||||||||||||||||||||||||||||||||||||||||||||||||||||||||||
Netherlands | 1,441 | 3 | 9.6 | — | — | — | — | — | — | — | — | — | 314 | 2.2 | — | — | 1,127 | 7.4 | ||||||||||||||||||||||||||||||||||||||||||||||||||||||||||||||||||||||||||||||||||
Other | 751 | 8 | 5.4 | — | 45 | 0.2 | 133 | 0.6 | 336 | 3.1 | 56 | 0.3 | 90 | 0.8 | — | — | 91 | 0.4 | ||||||||||||||||||||||||||||||||||||||||||||||||||||||||||||||||||||||||||||||||||
Total | 35,309 | 98 | 239.9 | 471 | 756 | 3.8 | 1,127 | 6.8 | 1,676 | 13.1 | 4,079 | 27.2 | 5,801 | 35.6 | 8,520 | 57.2 | 12,879 | 96.2 | ||||||||||||||||||||||||||||||||||||||||||||||||||||||||||||||||||||||||||||||||||
Less: Properties classified as assets held for sale |
| |||||||||||||||||||||||||||||||||||||||||||||||||||||||||||||||||||||||||||||||||||||||||||||||||||
Canada | (85 | ) | — | — | (85 | ) | — | — | — | — | — | — | — | — | — | — | — | — | ||||||||||||||||||||||||||||||||||||||||||||||||||||||||||||||||||||||||||||||||||
United States | (747 | ) | (5 | ) | (3.6 | ) | — | — | — | — | — | — | — | (171 | ) | (0.5 | ) | (576 | ) | (3.1 | ) | — | — | — | — | |||||||||||||||||||||||||||||||||||||||||||||||||||||||||||||||||||||||||||
As at June 30, 2019 | 34,477 | 93 | 236.3 | 386 | 756 | 3.8 | 1,127 | 6.8 | 1,676 | 13.1 | 3,908 | 26.7 | 5,225 | 32.5 | 8,520 | 57.2 | 12,879 | 96.2 | ||||||||||||||||||||||||||||||||||||||||||||||||||||||||||||||||||||||||||||||||||
% of portfolio as at June 30, 2019: |
| |||||||||||||||||||||||||||||||||||||||||||||||||||||||||||||||||||||||||||||||||||||||||||||||||||
* by sq ft | 100% | 1.1% | (2) | 2.2% | 3.3% | 4.9% | 11.3% | 15.2% | 24.7% | 37.3% | ||||||||||||||||||||||||||||||||||||||||||||||||||||||||||||||||||||||||||||||||||||||||||
* by Annualized Revenue | 100% | 1.6% | 2.9% | 5.5% | 11.3% | 13.8% | 24.2% | 40.7% | ||||||||||||||||||||||||||||||||||||||||||||||||||||||||||||||||||||||||||||||||||||||||||||
Acquisition and leasing activities between July 1, 2019 and July 31, 2019: |
| |||||||||||||||||||||||||||||||||||||||||||||||||||||||||||||||||||||||||||||||||||||||||||||||||||
As at June 30, 2019 | 34,477 | 93 | 236.3 | 386 | 756 | 3.8 | 1,127 | 6.8 | 1,676 | 13.1 | 3,908 | 26.7 | 5,225 | 32.5 | 8,520 | 57.2 | 12,879 | 96.2 | ||||||||||||||||||||||||||||||||||||||||||||||||||||||||||||||||||||||||||||||||||
Acquisition of Born, Netherlands property(1)(acquired July 8, 2019) |
| |||||||||||||||||||||||||||||||||||||||||||||||||||||||||||||||||||||||||||||||||||||||||||||||||||
— Netherlands | 259 | 1 | 1.6 | — | — | — | — | — | — | — | — | — | — | — | — | — | 259 | 1.6 | ||||||||||||||||||||||||||||||||||||||||||||||||||||||||||||||||||||||||||||||||||
Renewal, Extension and Re-leasing |
| |||||||||||||||||||||||||||||||||||||||||||||||||||||||||||||||||||||||||||||||||||||||||||||||||||
— Canada | — | — | — | — | — | — | — | — | — | — | — | — | (214 | ) | (1.3 | ) | — | — | 214 | 1.3 | ||||||||||||||||||||||||||||||||||||||||||||||||||||||||||||||||||||||||||||||||
— United States | — | 1 | 0.7 | (107 | ) | (652 | ) | (3.0 | ) | — | — | — | — | — | — | 652 | 3.0 | — | — | 107 | 0.7 | |||||||||||||||||||||||||||||||||||||||||||||||||||||||||||||||||||||||||||||||
Total | 34,736 | 95 | 238.6 | 279 | 104 | 0.8 | 1,127 | 6.8 | 1,676 | 13.1 | 3,908 | 26.7 | 5,663 | 34.2 | 8,520 | 57.2 | 13,459 | 99.8 | ||||||||||||||||||||||||||||||||||||||||||||||||||||||||||||||||||||||||||||||||||
| (1) | The annualized revenue for the acquisition represents thepro-forma revenue expected over a12-month period. |
| (2) | The committed occupancy as at June 30, 2019 is 99.3% after adjusting for two leases signed during the second quarter of 2019 relating to 0.2 million square feet of GLA in the United States. This includes the leasing of a vacant space in July 2019 and a lease extension and amending agreement for an existing tenant expected to commence in August 2019 at another vacant space. |
Granite REIT 2019 Second Quarter Report 33
| LIQUIDITY AND CAPITAL RESOURCES |
Liquidity
Granite has various sources of available liquidity including cash, cash equivalents and the unused portion of its unsecured credit facility that aggregated to $995.8 million as at June 30, 2019 compared to $1,158.1 million at December 31, 2018, as summarized below:
Sources of Available Liquidity |
| As at June 30, 2019 and December 31, 2018 | 2019 | 2018 | ||||||
Cash and cash equivalents | $ | 496.9 | $ | 658.2 | ||||
Unused portion of credit facility | 498.9 | 499.9 | ||||||
Available liquidity | $ | 995.8 | $ | 1,158.1 | ||||
Additional sources of liquidity: | ||||||||
Assets held for sale(1) | $ | 50.5 | $ | 44.2 | ||||
Unencumbered assets(2) | $ | 3,799.1 | $ | 3,425.0 | ||||
| (1) | Six properties located in Canada and the United States were classified as assets held for sale on the combined financial statements at June 30, 2019. Six properties located in Canada and the United States were classified as assets held for sale on the combined financial statements at December 31, 2018 and were subsequently sold during January and February 2019. |
| (2) | Unencumbered assets represent the carrying value of investment properties (excluding any assets held for sale) that are not encumbered by secured debt. Granite can seek to obtain secured financing against its unencumbered assets subject to certain restrictions and financial covenant limitations in its credit facility, term loan agreements and trust indentures. |
The available liquidity is primarily due to cash proceeds realized from the bought deal equity offering in April 2019 and drawdowns on the term loans completed in December 2018. Granite intends to use and has partially used the net proceeds of the equity offering to fund completed and potential acquisitions of properties, development and expansion projects and for general trust purposes.
Management believes that the Trust’s cash resources, cash flow from operations and available third-party borrowings will be sufficient to finance its operations and capital expenditures program over the next year as well as to pay distributions. Granite expects to fund its ongoing operations and future growth through the use of (i) existing cash and cash equivalents, (ii) cash flow from operating activities, (iii) cash flows from asset sales, (iv) short-term financing available from the credit facility, (v) the issuance of unsecured debentures or equity, subject to market conditions and/or, if necessary, (vi) financing that may be obtained on its unencumbered assets.
34 Granite REIT 2019 Second Quarter Report
Cash Flow Components
Components of the Trust’s cash flows were as follows:
Cash Flow Components Summary |
| Three Months Ended June 30, | Six Months Ended June 30, | |||||||||||||||||||||||||||
| 2019 | 2018 | $ change | 2019 | 2018 | $ change | |||||||||||||||||||||||
Cash and cash equivalents, beginning of period | $ | 501.0 | $ | 273.8 | 227.2 | $ | 658.2 | $ | 69.0 | 589.2 | ||||||||||||||||||
Cash provided by operating activities | 50.1 | 45.0 | 5.1 | 90.5 | 82.5 | 8.0 | ||||||||||||||||||||||
Cash used in investing activities | (238.2 | ) | (312.0 | ) | 73.8 | (381.7 | ) | (37.2 | ) | (344.5 | ) | |||||||||||||||||
Cash provided by (used in) financing activities | 186.0 | �� | 49.1 | 136.9 | 140.0 | (67.8 | ) | 207.8 | ||||||||||||||||||||
Effect of exchange rate changes on cash and cash equivalents | (2.0 | ) | (5.8 | ) | 3.8 | (10.1 | ) | 3.6 | (13.7 | ) | ||||||||||||||||||
Cash and cash equivalents, end of period | $ | 496.9 | $ | 50.1 | 446.8 | $ | 496.9 | $ | 50.1 | 446.8 | ||||||||||||||||||
Operating Activities
In the three month period ended June 30, 2019, operating activities generated cash of $50.1 million compared to $45.0 million in the prior year period. The increase of $5.1 million was due to various factors including, among others, the following:
| • | an increase in cash provided by working capital changes of $3.1 million primarily due to an increase in accounts payable and accrued liabilities related to higher compensation costs and property operating costs associated with acquisitions; |
| • | a decrease in leasing commissions paid of $2.3 million; and |
| • | a decrease in net realized foreign exchange losses of $2.0 million primarily due to the foreign exchange loss recognized in the prior year period relating to the remeasurement of the US dollar proceeds from the sale of investment properties in January 2018, partially offset by; |
| • | an increase in interest paid of $2.2 million largely associated with the term loan drawdowns in December 2018. |
In the six months ended June 30, 2019, operating activities generated cash of $90.5 million compared to $82.5 million in the prior year period. The increase of $8.0 million was due to various factors including, among other, the following:
| • | a decrease in tenant incentives paid of $9.1 million which related to a payment in 2018 associated with a 2014 lease extension at the Eurostar facility in Graz, Austria; and |
| • | a decrease in leasing commissions paid of $3.8 million, partially offset by; |
| • | an increase in interest paid of $4.6 million largely associated with the term loan drawdowns in December 2018. |
Investing Activities
Investing activities for the three month period ended June 30, 2019 used cash of $238.2 million and primarily related to the following:
| • | acquisitions of $219.1 million consisting of the remaining balance for the leasehold interest in two properties in Canada for $146.6 million, one property in Columbus, Ohio for $71.6 million and the associated transaction costs of $0.9 million; and |
Granite REIT 2019 Second Quarter Report 35
| • | a $33.9 million advance payment to acquire the development land located in Harris County, Texas and to fund Granite’s initial capital contribution in a joint arrangement with a third-party to complete the purchase of the land. These cash outflows are partially offset by; |
| • | the receipt of a $16.8 million vendor take-back mortgage relating to the sale of four properties in Iowa in February 2019. |
Investing activities for the three month period ended June 30, 2018 used cash of $312.0 million and primarily related to the following:
| • | the acquisitions of five income-producing properties in the United States for $327.3 million consisting of a $304.2 million portfolio of four properties in West Jefferson, Ohio and $23.1 million related to the remaining balance paid for a property in Greencastle, Pennsylvania, partially offset by; |
| • | the receipt of a $30.0 million vendor take-back mortgage relating to the sale of seven properties in Newmarket, Ontario in January 2018. |
Investing activities for the six months ended June 30, 2019 used cash of $381.7 million and primarily related to the following:
| • | the acquisitions of three income-producing properties in the United States and the leasehold interest in two properties in Canada for $383.7 million consisting of two properties in Texas for $164.2 million, the remaining balance paid relating to the leasehold interest in two properties in Mississauga, Ontario for $146.6 million, one property in Columbus, Ohio for $71.6 million and the associated transaction costs of $1.3 million; |
| • | investment property development and expansion capital expenditures paid of $4.7 million relating to the completed expansion at the property near Columbus, Ohio as well as the properties under development in Altbach, Germany and Plainfield, Indiana, and maintenance and improvement capital expenditures paid of $1.8 million largely relating to improvement projects at a property in Novi, Michigan, a vacant property in Canada and a multi-tenanted property in Olive Branch, Mississippi; and |
| • | a $33.9 million advance payment to acquire the development land located in Harris County, Texas and to fund Granite’s initial capital contribution in a joint arrangement with a third-party to complete the purchase of the land. These cash outflows are partially offset by; |
| • | net proceeds of $25.6 million received from the disposition of six properties in Canada and the United States during the first quarter of 2019; and |
| • | the receipt of a $16.8 million vendor take-back mortgage as noted above. |
Investing activities for the six months ended June 30, 2018 used cash of $37.2 million and primarily related to the following:
| • | the acquisitions of six income-producing properties in the United States for $399.4 million consisting of a $304.2 million portfolio of four properties in West Jefferson, Ohio, $50.8 million for a property in Plainfield, Indiana and $44.4 million for a property in Greencastle, Pennsylvania, partially offset by; |
| • | net proceeds of $356.5 million received from the disposition of 10 income-producing properties in Canada and the United States in January 2018. |
Financing Activities
Cash provided by financing activities for the three month period ended June 30, 2019 of $186.0 million largely comprised $220.4 million of proceeds from the stapled unit offering completed in April 2019, net of issuance costs, partially offset by $33.7 million of distribution payments.
36 Granite REIT 2019 Second Quarter Report
Cash provided by financing activities for the three month period ended June 30, 2018 of $49.1 million comprised net $90.2 million of bank indebtedness proceeds, partially offset by $31.2 million of distribution payments and $9.9 million to repurchase the Trust’s stapled units under the normal course issuer bid.
Cash provided by financing activities for the six months ended June 30, 2019 of $140.0 million comprised $220.4 million of net proceeds from the stapled unit offering as noted above, partially offset by monthly distribution payments of $65.6 million and $13.7 million relating to a special distribution payment.
Cash used in financing activities for the six months ended June 30, 2018 of $67.8 million comprised distribution payments of $62.8 million and repurchases of the Trust’s stapled units under the normal course issuer bid of $60.9 million, partially offset by a net $57.4 million of bank indebtedness proceeds.
Debt Structure
Granite’s debt structure and key debt metrics as at June 30, 2019 and December 31, 2018 were as follows:
Summary Debt Structure and Debt Metrics |
| As at June 30, 2019 and December 31, 2018 | 2019 | 2018 | ||||||||||||
Unsecured debt, net | $1,188.6 | $1,198.4 | ||||||||||||
Cross currency interest rate swaps, net | 63.8 | 104.8 | ||||||||||||
Lease obligations(1) | 33.2 | — | ||||||||||||
Total debt | [A] | $1,285.6 | $1,303.2 | |||||||||||
Less: cash and cash equivalents | 496.9 | 658.2 | ||||||||||||
Net debt | [B] | $ 788.7 | $ 645.0 | |||||||||||
Investment properties, all unencumbered by secured debt | [C] | $3,799.1 | $3,425.0 | |||||||||||
Trailing12-month adjusted EBITDA(2) | [D] | $ 189.7 | $ 187.0 | |||||||||||
Interest expense | $ 26.8 | $ 22.4 | ||||||||||||
Interest income | (6.5 | ) | (2.6 | ) | ||||||||||
Trailing12-month interest expense, net | [E] | $ 20.3 | $ 19.8 | |||||||||||
Debt metrics | ||||||||||||||
Leverage ratio(2) | [A]/[C] | 34% | 38% | |||||||||||
Net leverage ratio(2) | [B]/[C] | 21% | 19% | |||||||||||
Interest coverage ratio(2) | [D]/[E] | 9.3x | 9.4x | |||||||||||
Unencumbered asset coverage ratio(2) | [C]/[A] | 3.0x | 2.6x | |||||||||||
Indebtedness ratio (debt to adjusted EBITDA)(2) | [A]/[D] | 6.8x | 7.0x | |||||||||||
Weighted average cost of debt(3) | 2.17% | 2.17% | ||||||||||||
Weighted average debtterm-to-maturity, in years(3) | 4.2 | 4.7 | ||||||||||||
Ratings and outlook | ||||||||||||||
DBRS | BBB stable | BBB stable | ||||||||||||
Moody’s | Baa2 stable | Baa2 stable | ||||||||||||
| (1) | The Trust has adopted IFRS 16,Leases effective January 1, 2019 resulting in the recognition of lease obligations on the combined balance sheet (see “NEW ACCOUNTING PRONOUNCEMENTS AND DEVELOPMENTS”). |
| (2) | Represents anon-IFRS measure. For definitions of Granite’snon-IFRS measures, refer to the section “NON-IFRS MEASURES”. |
| (3) | Excludes lease obligations noted above. |
Granite REIT 2019 Second Quarter Report 37
Unsecured Debt and Cross Currency Interest Rate Swaps
2025 Term Loan and Cross Currency Interest Rate Swap
On December 12, 2018, Granite REIT Holdings Limited Partnership (“Granite LP”) entered into a senior unsecurednon-revolving term facility in the amount of $300.0 million (the “2025 Term Loan”) that matures on December 12, 2025. The 2025 Term Loan was available in one drawdown and is fully prepayable without penalty. Any amount repaid may not bere-borrowed. On December 12, 2018, $300.0 million was drawn on the 2025 Term Loan. Interest on drawn amounts is calculated based on the Canadian Dollar Offered Rate (“CDOR”) plus an applicable margin determined by reference to the external credit rating of Granite LP and is payable monthly in advance. At June 30, 2019, the full $300.0 million remained outstanding and the balance, net of deferred financing costs, was $298.8 million.
On December 12, 2018, the Trust entered into a cross currency interest rate swap to exchange the CDOR plus margin interest payments from the 2025 Term Loan for Euro denominated payments at a 2.202% fixed interest rate. In addition, under the terms of the swap, the Trust will pay principal proceeds of€198.2 million in exchange for which it will receive $300.0 million on December 12, 2025. As at June 30, 2019, the fair value of the cross currency interest rate swap was a net financial liability of $13.9 million.
2022 Term Loan and Cross Currency Interest Rate Swap
On December 19, 2018, the Trust entered into a senior unsecurednon-revolving term facility in the amount of US$185.0 million (the “2022 Term Loan”) that matures on December 19, 2022. The 2022 Term Loan was available in one US dollar drawdown and is fully prepayable without penalty. Any amount repaid may not bere-borrowed. On December 19, 2018, US$185.0 million was drawn on the 2022 Term Loan. Interest on drawn amounts is calculated based on LIBOR plus an applicable margin determined by reference to the external credit rating of Granite LP and is payable monthly in arrears. At June 30, 2019, the full US$185.0 million remained outstanding and the balance, net of deferred financing costs, was $241.7 million.
On December 19, 2018, the Trust entered into a cross currency interest rate swap to exchange the LIBOR plus margin interest payments from the 2022 Term Loan for Euro denominated payments at a 1.225% fixed interest rate. In addition, under the terms of the swap, the Trust will pay principal proceeds of€163.0 million in exchange for which it will receive US$185.0 million on December 19, 2022. As at June 30, 2019, the fair value of the cross currency interest rate swap was a net financial liability of $5.5 million.
2023 Debentures and Cross Currency Interest Rate Swap
On December 20, 2016, the Trust issued $400.0 million aggregate principal amount of 3.873% Series 3 senior debentures due November 30, 2023 (the “2023 Debentures”). Interest on the 2023 Debentures is payable semi-annually in arrears on May 30 and November 30 of each year. At June 30, 2019, all of the 2023 Debentures remained outstanding and the balance, net of deferred financing costs, was $398.6 million.
On December 20, 2016, the Trust entered into a cross currency interest rate swap to exchange the 3.873% interest payments from the 2023 Debentures for Euro denominated payments at a 2.43% fixed interest rate. Under the terms of the swap, the Trust will pay principal proceeds of€281.1 million in exchange for which it will receive $400.0 million on November 30, 2023. As at June 30, 2019, the fair value of the cross currency interest rate swap was a net financial liability of $33.4 million.
2021 Debentures and Cross Currency Interest Rate Swap
In July 2014, the Trust issued $250.0 million aggregate principal amount of 3.788% Series 2 senior debentures due July 5, 2021 (the “2021 Debentures”). Interest on the 2021 Debentures is payable semi-annually in arrears on January 5 and July 5 of each year. At June 30, 2019, all of the 2021 Debentures remained outstanding and the balance, net of deferred financing costs, was $249.5 million.
38 Granite REIT 2019 Second Quarter Report
In July 2014, the Trust entered into a cross currency interest rate swap to exchange the 3.788% interest payments from the 2021 Debentures for Euro denominated payments at a 2.68% fixed interest rate. Under the terms of the swap, the Trust will pay principal proceeds of€171.9 million in exchange for which it will receive $250.0 million on July 5, 2021. As at June 30, 2019, the fair value of the cross currency interest rate swap was a net financial liability of $11.0 million.
The 2021 Debentures, 2023 Debentures, 2022 Term Loan and 2025 Term Loan rank pari passu with all of the Trust’s other existing and future senior unsecured indebtedness and are guaranteed by Granite REIT and Granite GP. The fair values of the cross currency interest rate swaps are dependent upon a number of assumptions including the Euro exchange rate against the Canadian or US dollars and the Euro, Canadian and US government benchmark interest rates.
Credit Facility
On February 1, 2018, the Trust entered into an unsecured revolving credit facility in the amount of $500.0 million that is available by way of Canadian dollar, US dollar or Euro denominated loans or letters of credit and matures on February 1, 2023. The Trust has the option to extend the maturity date by one year to February 1, 2024 subject to the agreement of lenders in respect of a minimum of 662/3% of the aggregate amount committed under the facility. The credit facility provides the Trust with the ability to increase the amount of the commitment by an additional aggregate principal amount of up to $100.0 million with the consent of the participating lenders. Interest on drawn amounts is calculated based on an applicable margin determined by reference to the external credit rating of Granite REIT and Granite GP, as is a commitment fee in respect of undrawn amounts. As at June 30, 2019, the Trust had no amounts drawn from the credit facility and $1.1 million in letters of credit issued against the facility.
Debt Metrics and Financial Covenants
Granite uses the debt metrics noted above to assess its borrowing capacity and the ability to meet its current and future financing obligations. At June 30, 2019, there were no significant changes in the debt ratios, which remain relatively favourable, providing financial flexibility for future growth.
Granite’s unsecured debentures, term loans and credit facility agreements contain financial andnon-financial covenants that include maintaining certain leverage and debt service ratios. As at June 30, 2019, Granite was in compliance with all of these covenants.
Credit Ratings
On March 14, 2019, Moody’s Investors Service, Inc. (“Moody’s”) confirmed its credit rating on the 2021 Debentures and 2023 Debentures of Baa2 with a stable outlook. On April 1, 2019, DBRS confirmed the BBB rating on the 2021 Debentures and the 2023 Debentures with a stable trend. Credit ratings are intended to provide investors with an independent measure of credit quality of an issue of securities. A rating accorded to any security is not a recommendation to buy, sell or hold such securities and may be subject to revision or withdrawal at any time by the rating organization which granted such ratings.
Unitholders’ Equity
Outstanding Stapled Units
As at July 31, 2019, the Trust had 49,443,103 stapled units issued and outstanding.
Distributions
Granite REIT’s monthly distribution to unitholders is currently 23.3 cents per stapled unit. For 2019, based on this current monthly rate, Granite expects to make total annual distributions of $2.80 per stapled unit. Monthly distributions declared to stapled unitholders in the three month periods ended June 30, 2019 and 2018 were $34.6 million or 69.9 cents per stapled unit and $31.1 million or 68.1 cents per stapled unit,
Granite REIT 2019 Second Quarter Report 39
respectively. Total distributions declared to stapled unitholders in the six month periods ended June 30, 2019 and 2018 were $66.5 million or $1.40 per stapled unit and $62.6 million or $1.36 per stapled unit, respectively. On July 17, 2019, a monthly distribution of $11.5 million or 23.3 cents per stapled unit was declared and will be paid on August 15, 2019.
As a result of the increase in taxable income generated primarily by the sale transactions in 2018, Granite’s Board of Trustees declared a special distribution in December 2018 of $1.20 per stapled unit which comprised 30.0 cents per unit payable in cash and 90.0 cents per unit payable by the issuance of stapled units, both of which were paid on January 15, 2019. Immediately following the issuance of the stapled units, the stapled units were consolidated such that each unitholder held the same number of stapled units after the consolidation as each unitholder held prior to the special distribution.
Pursuant to the requirement of National Policy41-201,Income Trusts and Other Indirect Offerings(“NP41-201”), the following table outlines the differences between cash flow from operating activities and cash distributions as well as the differences between net income and cash distributions, in accordance with the guidelines under NP41-201.
Cash Flows from Operating Activities in Excess of Distributions Paid and Payable |
| Three Months Ended June 30, | Six Months Ended June 30, | |||||||||||||||
| 2019 | 2018 | 2019 | 2018 | |||||||||||||
Net income | $ | 98.7 | $ | 149.2 | $ | 177.0 | $ | 221.6 | ||||||||
Cash flows provided by operating activities | 50.1 | 45.0 | 90.5 | 82.5 | ||||||||||||
Monthly distributions paid and payable(1) | (34.6 | ) | (31.1 | ) | (66.5 | ) | (62.6 | ) | ||||||||
Cash flows from operating activities in excess of distributions paid and payable(1) | $ | 15.5 | $ | 13.9 | $ | 24.0 | $ | 19.9 | ||||||||
| (1) | Excludes the special distribution paid in January 2019. |
Monthly distributions paid for the three and six month periods ended June 30, 2019 and 2018 were funded with cash flows from operating activities.
Net income prepared in accordance with IFRS recognizes revenue and expenses at time intervals that do not necessarily match the receipt or payment of cash. Therefore, when establishing cash distributions to unitholders, consideration is given to factors such as FFO, AFFO, cash generated from and required for operating activities and forward-looking cash flow information, including forecasts and budgets. Management does not expect current or potential future commitments to replace or maintain its investment properties to adversely affect cash distributions.
Equity Offering
On April 30, 2019, Granite completed an offering of 3,260,000 stapled units at a price of $61.50 per unit for gross proceeds of $200.5 million. On April 26, 2019, the syndicate of underwriters elected, pursuant to the terms of the underwriting agreement in respect of the offering, to exercise its over-allotment option in full, resulting in the issuance of an additional 489,000 stapled units on April 30, 2019 for additional gross proceeds of $30.1 million. The aggregate gross proceeds raised pursuant to the offering, including the exercise of the over-allotment option, were $230.6 million. The net proceeds received by Granite after deducting the underwriters’ fees and the expenses were $220.4 million.
Normal Course Issuer Bid
On May 14, 2019, Granite announced the acceptance by the Toronto Stock Exchange (“TSX”) of Granite’s Notice of Intention to Make a Normal Course Issuer Bid (“NCIB”). Pursuant to the NCIB, Granite proposes to
40 Granite REIT 2019 Second Quarter Report
purchase through the facilities of the TSX and any alternative trading system in Canada, from time to time and if considered advisable, up to an aggregate of 4,853,666 of Granite’s issued and outstanding stapled units. The NCIB commenced on May 21, 2019 and will conclude on the earlier of the date on which purchases under the bid have been completed and May 20, 2020. Pursuant to the policies of the TSX, daily purchases made by Granite through the TSX may not exceed 41,484 stapled units, subject to certain exceptions. Granite entered into an automatic securities purchase plan with a broker in order to facilitate repurchases of the stapled units under the NCIB during specified blackout periods. Pursuant to a previous notice of intention to conduct a NCIB, Granite received approval from the TSX to purchase stapled units for the period May 18, 2018 to May 17, 2019.
During the six months ended June 30, 2019, Granite repurchased 700 stapled units for consideration of less than $0.1 million at an aggregate average purchase price of $52.96 per unit. During the six months ended June 30, 2018, Granite repurchased 1,233,459 stapled units for consideration of $60.9 million, representing an average purchase price of $49.41.
| COMMITMENTS, CONTRACTUAL OBLIGATIONS, CONTINGENCIES ANDOFF-BALANCE SHEET ARRANGEMENTS |
The Trust is subject to various legal proceedings and claims that arise in the ordinary course of business. Management believes that the final outcome of such matters will not have a material adverse effect on the financial position, results of operations or liquidity of the Trust. However, actual outcomes may differ from management’s expectations.
Commitments onnon-cancellable operating leases that were previously disclosed are recorded as lease obligations on the condensed combined financial statements under IFRS 16,Leases effective January 1, 2019 (see “New Accounting Pronouncements and Developments”).
Off-balance sheet arrangements consist of outstanding letters of credit to support certain contractual obligations, property purchase commitments and construction and development project commitments. At June 30, 2019, the Trust had $1.1 million in letters of credit outstanding. Additionally, at June 30, 2019, the Trust had contractual commitments related to construction and development projects and the purchase of a property in the United States amounting in aggregate to approximately $300.3 million. The construction and development projects are expected to be completed over the next year. The commitment to purchase the property in the United States is subject to specific confidentiality provisions and customary closing conditions including certain purchase rights in favour of the tenant and is expected to close in the fourth quarter of 2019 following construction of the building. Granite expects to fund these commitments through the use of cash on hand, cash from operations and/or Granite’s credit facility. Subsequent to the quarter-end, a tenant has exercised its purchase option to acquire a 0.2 million square foot property located in Canada at a stipulated price included in the lease agreement. The property is expected to be sold in the fourth quarter of 2019.
For further discussion of commitments, contractual obligations, contingencies andoff-balance sheet arrangements, refer to notes 8, 9, 17 and 18 to the unaudited condensed combined financial statements for the three and six month periods ended June 30, 2019.
| NON-IFRS MEASURES |
Funds from operations
FFO is anon-IFRS performance measure that is widely used by the real estate industry in evaluating the operating performance of real estate entities. Granite calculates FFO as net income attributable to stapled unitholders excluding fair value gains (losses) on investment properties and financial instruments, gains (losses) on sale of investment properties including the associated current income tax, acquisition
Granite REIT 2019 Second Quarter Report 41
transaction costs, deferred income taxes and certain other items, net ofnon-controlling interests in such items. The Trust’s determination of FFO follows the definition prescribed by the Real Estate Property Association of Canada (“REALPAC”) White Paper on Funds From Operations & Adjusted Funds From Operations for IFRS dated February 2019 and as subsequently amended (“White Paper”). Granite considers FFO to be a meaningful supplemental measure that can be used to determine the Trust’s ability to service debt, fund capital expenditures and provide distributions to stapled unitholders. FFO is reconciled to net income, which is the most directly comparable IFRS measure (see “RESULTS OF OPERATIONS — Funds From Operations and Adjusted Funds FromOperations”). FFO should not be construed as an alternative to net income or cash flow generated from operating activities determined in accordance with IFRS.
Adjusted funds from operations
AFFO is anon-IFRS performance measure that is widely used by the real estate industry in evaluating the recurring economic earnings performance of real estate entities after considering certain costs associated with sustaining such earnings. Granite calculates AFFO as net income attributable to stapled unitholders including all adjustments used to calculate FFO and further adjusts for actual maintenance capital expenditures that are required to sustain Granite’s productive capacity, leasing costs such as leasing commissions and tenant incentives paid andnon-cash straight-line rent and tenant incentive amortization, net ofnon-controlling interests in such items. The Trust’s determination of AFFO follows the definition prescribed by REALPAC’s White Paper. Granite considers AFFO to be a meaningful supplemental measure that can be used to determine the Trust’s ability to service debt, fund expansion capital expenditures, fund property development and provide distributions to stapled unitholders after considering costs associated with sustaining operating earnings. AFFO is also reconciled to net income, which is the most directly comparable IFRS measure (see “RESULTS OF OPERATIONS — Funds From Operations and Adjusted Funds From Operations”). AFFO should not be construed as an alternative to net income or cash flow generated from operating activities determined in accordance with IFRS.
FFO and AFFO payout ratios
The FFO and AFFO payout ratios are calculated as monthly distributions, which exclude the special distribution, declared to unitholders divided by FFO and AFFO, respectively, in a period. FFO payout ratio and AFFO payout ratio may exclude revenue or expenses incurred during a period that can be a source of variance between periods. The FFO payout ratio and AFFO payout ratio are supplemental measures widely used by analysts and investors in evaluating the sustainability of the Trust’s monthly distributions to stapled unitholders.
42 Granite REIT 2019 Second Quarter Report
FFO and AFFO Payout Ratios | ||||||||||
| Three Months Ended June 30, | Six Months Ended June 30, | |||||||||||||||||
| (in millions, except as noted) | 2019 | 2018 | 2019 | 2018 | ||||||||||||||
Monthly distributions declared to unitholders | [A] | $ | 34.6 | $ | 31.1 | $ | 66.5 | $ | 62.6 | |||||||||
FFO | 43.1 | 37.6 | 83.8 | 88.7 | ||||||||||||||
Add (deduct): | ||||||||||||||||||
Foreign exchange loss (gain) on the remeasurement of US cash proceeds from sale of properties | — | 1.9 | — | (8.5 | ) | |||||||||||||
Lease termination andclose-out fees | (0.6 | ) | — | (0.9 | ) | (1.0 | ) | |||||||||||
FFO adjusted for the above | [B] | $ | 42.5 | $ | 39.5 | $ | 82.9 | $ | 79.2 | |||||||||
AFFO | 42.3 | 29.4 | 81.5 | 60.5 | ||||||||||||||
Add (deduct): | ||||||||||||||||||
Tenant allowance payment made in connection with a 2014 lease extension at the Eurostar facility in Austria | — | — | — | 9.1 | ||||||||||||||
Foreign exchange loss (gain) on the remeasurement of US cash proceeds from sale of properties | — | 1.9 | — | (8.5 | ) | |||||||||||||
Lease termination andclose-out fees | (0.6 | ) | — | (0.9 | ) | (1.0 | ) | |||||||||||
AFFO adjusted for the above | [C] | $ | 41.7 | $ | 31.3 | $ | 80.6 | $ | 60.1 | |||||||||
FFO payout ratio | [A]/[B] | 81% | 79% | 80% | 79% | |||||||||||||
AFFO payout ratio | [A]/[C] | 83% | 99% | 83% | 104% | |||||||||||||
Net operating income — cash basis
Granite uses NOI on a cash basis, which adjusts NOI to exclude lease termination andclose-out fees, and thenon-cash impact from straight-line rent and tenant incentive amortization recognized during the period (see “RESULTS OF OPERATIONS — Net Operating Income”). NOI — cash basis is a commonly used measure by the real estate industry and Granite believes it is a useful supplementary measure of the income generated by and operating performance of income-producing properties in addition to the most comparable IFRS measure, which Granite believes is NOI. NOI — cash basis is also a key input in Granite’s determination of the fair value of its investment property portfolio.
Same property net operating income — cash basis
Same property NOI — cash basis refers to the NOI — cash basis for those properties owned by Granite throughout the entire current and prior year periods under comparison. Same property NOI — cash basis excludes properties that were acquired, disposed of, classified as properties under or held for development or assets held for sale during the periods under comparison (see “RESULTS OF OPERATIONS — Net Operating Income”). Granite believes that same property NOI — cash basis is a useful supplementary measure in understanding period-over-period organic changes in NOI — cash basis from the same stock of properties owned.
Adjusted earnings before interest, income taxes, depreciation and amortization (“Adjusted EBITDA”)
Adjusted EBITDA is calculated as net income before lease termination andclose-out fees, interest expense, interest income, income tax expense, depreciation and amortization expense, foreign exchange gains (losses) on the remeasurement of proceeds from the sale of investment properties, fair value gains (losses)
Granite REIT 2019 Second Quarter Report 43
on investment properties and financial instruments, acquisition transaction costs, other income relating to a settlement award and gains (losses) on the sale of investment properties. Adjusted EBITDA represents an operating cash flow measure that Granite uses in calculating the interest coverage ratio and indebtedness ratio noted below. Adjusted EBITDA is also defined in Granite’s debt agreements and used in calculating the Trust’s debt covenants.
Adjusted EBITDA Reconciliation | ||||
| For the12-months ended June 30, 2019 and December 31, 2018 | 2019 | 2018 | ||||||
Net income | $ | 420.8 | $ | 465.4 | ||||
Add (deduct): | ||||||||
Lease termination andclose-out fees | (0.9 | ) | (1.0 | ) | ||||
Interest expense and other financing costs | 26.8 | 22.4 | ||||||
Interest income | (6.5 | ) | (2.6 | ) | ||||
Income tax expense | 48.1 | 52.6 | ||||||
Depreciation and amortization | 0.6 | 0.3 | ||||||
Foreign exchange gain on the remeasurement of US cash proceeds from sale of properties | — | (8.5 | ) | |||||
Fair value gains on investment properties, net | (314.2 | ) | (354.7 | ) | ||||
Fair value losses on financial instruments | 1.8 | 0.5 | ||||||
Loss on sale of investment properties | 7.0 | 6.9 | ||||||
Acquisition transaction costs | 6.2 | 8.0 | ||||||
Other income — settlement award | — | (2.3 | ) | |||||
Adjusted EBITDA | $ | 189.7 | $ | 187.0 | ||||
Interest coverage ratio
The interest coverage ratio is calculated on a12-month trailing basis using Adjusted EBITDA divided by net interest expense. Granite believes the interest coverage ratio is useful in evaluating the Trust’s ability to meet its interest expense obligations (see“LIQUIDITY AND CAPITAL RESOURCES — Debt Structure”).
Indebtedness ratio
The indebtedness ratio is calculated as total debt divided by Adjusted EBITDA and Granite believes it is useful in evaluating the Trust’s ability to repay outstanding debt using its operating cash flows (see“LIQUIDITY AND CAPITAL RESOURCES — Debt Structure”).
Leverage and net leverage ratios
The leverage ratio is calculated as the carrying value of total debt divided by the fair value of investment properties while the net leverage ratio subtracts cash and cash equivalents from total debt. The leverage ratio and net leverage ratio are supplemental measures that Granite believes are useful in evaluating the Trust’s degree of financial leverage, borrowing capacity and the relative strength of its balance sheet (see“LIQUIDITY AND CAPITAL RESOURCES — Debt Structure”).
Unencumbered asset coverage ratio
The unencumbered asset coverage ratio is calculated as the carrying value of investment properties (excluding assets held for sale) that are not encumbered by secured debt divided by the carrying value of total unsecured debt and is a supplemental measure that Granite believes is useful in evaluating the Trust’s degree of asset coverage provided by its unencumbered investment properties to total unsecured debt (see“LIQUIDITY AND CAPITAL RESOURCES — Debt Structure”).
44 Granite REIT 2019 Second Quarter Report
| SIGNIFICANT ACCOUNTING ESTIMATES |
The preparation of financial statements in conformity with IFRS requires management to apply judgment and make estimates that affect the amounts reported and disclosed in the combined financial statements. Management bases estimates on historical experience and various other assumptions that are believed to be reasonable in the circumstances, the results of which form the basis for making judgments about the values of assets and liabilities. On an ongoing basis, management evaluates its estimates. However, actual results could differ from those estimates.
The Trust’s significant accounting policies that involve the most judgment and estimates are as follows:
Judgments
Leases
The Trust’s policy for revenue recognition is described in note 2(k) of the audited combined financial statements for the year ended December 31, 2018. The Trust makes judgments in determining whether certain leases are operating or finance leases, in particular tenant leases with long contractual terms and leases where the property is a large square-footage and/or architecturally specialized. Refer to the “New Accounting Pronouncements and Developments” section for information on the adoption of IFRS 16,Leases effective January 1, 2019.
Investment properties
The Trust’s policy relating to investment properties is described in note 2(d) of the audited combined financial statements for the year ended December 31, 2018. In applying this policy, judgment is used in determining whether certain costs incurred for tenant improvements are additions to the carrying amount of the property or represent incentives, identifying the point at which practical completion of properties under development occurs and determining borrowing costs to be capitalized to the carrying value of properties under development. Judgment is also applied in determining the use, extent and frequency of independent appraisals.
Income taxes
The Trust applies judgment in determining whether it will continue to qualify as a REIT for both Canadian and United States tax purposes for the foreseeable future. However, should it at some point no longer qualify, the Trust would be subject to income tax which could materially affect future distributions to unitholders and would also be required to recognize additional current and/or deferred income taxes.
Estimates and Assumptions
Valuation of investment properties
The fair value of investment properties is determined by management using primarily the discounted cash flow method in which the income and expenses are projected over the anticipated term of the investment plus a terminal value discounted using an appropriate discount rate. The Trust obtains, from time to time, appraisals from independent qualified real estate valuation experts. However, the Trust does not measure its investment properties based on these appraisals but uses them as data points, together with other external market information accumulated by management, in arriving at its own conclusions on values. Management uses valuation assumptions such as discount rates, terminal capitalization rates and market rental rates applied in external appraisals or sourced from valuation experts; however, the Trust also uses its historical renewal experience with tenants, its direct knowledge of the specialized nature of Granite’s portfolio and tenant profile and its knowledge of the actual condition of the properties in making business judgments about lease renewal probabilities, renewal rents and capital expenditures. There has been no change in the valuation methodology used during the six month period ended June 30, 2019. The critical
Granite REIT 2019 Second Quarter Report 45
assumptions relating to the Trust’s estimates of fair values of investment properties include the receipt of contractual rents, contractual renewal terms, expected future market rental rates, discount rates that reflect current market uncertainties, capitalization rates and recent investment property prices. If there is any change in these assumptions or regional, national or international economic conditions, the fair value of investment properties may change materially. Refer to the “Investment Properties” section and note 4 of the unaudited condensed combined financial statements for the three and six month periods ended June 30, 2019 for further information on the estimates and assumptions made by management in connection with the fair values of investment properties.
Fair value of financial instruments
Where the fair value of financial assets or liabilities recorded on the balance sheet or disclosed in the notes cannot be derived from active markets, it is determined using valuation techniques including the discounted cash flow model. The inputs to these models are taken from observable markets where possible but, where this is not feasible, a degree of judgment is required in establishing fair values. The judgments include considerations of inputs such as credit risk and volatility. Changes in assumptions about these factors could materially affect the reported fair value of financial instruments.
Income taxes
The Trust operates in a number of countries and is subject to the income tax laws and related tax treaties in each of its operating jurisdictions. These laws and treaties can be subject to different interpretations by relevant taxation authorities. Significant judgment is required in the estimation of Granite’s income tax expense, interpretation and application of the relevant tax laws and treaties and provision for any exposure that may arise from tax positions that are under audit by relevant taxation authorities.
The recognition and measurement of deferred tax assets or liabilities is dependent on management’s estimate of future taxable profits and income tax rates that are expected to be in effect in the period the asset is realized or the liability is settled. Any changes in management’s estimates can result in changes in deferred tax assets or liabilities as reported in the combined balance sheets and also the deferred income tax expense in the combined statements of net income.
| NEW ACCOUNTING PRONOUNCEMENTS AND DEVELOPMENTS |
New Standards Adopted
The accounting policies adopted in the preparation of the condensed combined financial statements are consistent with those followed in the preparation of the Trust’s annual combined financial statements for the year ended December 31, 2018, except for the adoption of new standards and interpretations effective January 1, 2019. The nature and effect of these changes are disclosed below.
Amendments to IFRS 3, Business Combinations
In connection with the combined financial statements for the three and six month periods ended June 30, 2019, the Trust determined to early adopt the amendments to IFRS 3,Business Combinations (“IFRS 3 Amendments”) effective January 1, 2019 in advance of their mandatory effective date of January 1, 2020. The Trust adopted the IFRS 3 Amendments prospectively and therefore the comparative information presented for 2018 has not been restated. The IFRS 3 Amendments clarify the definition of a business in determining whether an acquisition is a business combination or an asset acquisition. The IFRS 3 Amendments have removed the requirement for an assessment of whether market participants are capable of replacing any missing inputs or processes and continuing to produce outputs; the reference to an ability to reduce costs; and require, at a minimum, the acquired set of activities and assets to include an
46 Granite REIT 2019 Second Quarter Report
input and a substantive process to meet the definition of a business. The IFRS 3 Amendments also provide for an optional concentration test to assess whether substantially all of the fair value of the gross assets acquired is concentrated in a single identifiable asset or group of similar identifiable assets. The Trust has adopted the standard effective January 1, 2019 in the three and six month periods ended June 30, 2019. The Trust did not recognize the impact of adopting the IFRS 3 Amendments in the condensed combined financial statements for the three months ended March 31, 2019 and 2018, issued on May 7, 2019 as it had not determined to early adopt the IFRS 3 Amendments at that time. The condensed combined statements of net income and cash flows for the six month period ended June 30, 2019 include the recognition of the IFRS 3 Amendments retroactive to January 1, 2019. The impact from the adoption of the IFRS 3 Amendments relating to the three month period ended March 31, 2019, and recognized in the six month period ended June 30, 2019 in each of the statements of net income and cash flows is as follows:
Relating to the Three Months Ended March 31, 2019 | ||||
Condensed Combined Statement of Net Income: | ||||
Reduction in acquisition transaction costs | $ | 0.4 | ||
Reduction in fair value gains on investment properties, net | (0.4 | ) | ||
Net impact to the Condensed Combined Statement of Net Income | $ | — | ||
Condensed Combined Statements of Cash Flows: | ||||
Reduction in fair value gains on investment properties within items not involving operating cash flows (operating activities) | $ | 0.4 | ||
Reduction in changes in working capital balances (operating activities) | 0.5 | |||
Increase in property acquisition costs (investing activities) | (0.9 | ) | ||
Net impact to the Condensed Combined Statements of Cash Flows | $ | — | ||
The adoption of the IFRS 3 Amendments had no impact to the combined balance sheet as at June 30, 2019 and the statements of comprehensive income for the three and six month periods ended June 30, 2019.
Following the adoption of the IFRS 3 Amendments, the Trust continues to account for business combinations in which control is acquired under the acquisition method. When a property acquisition is made, the Trust considers the inputs, processes and outputs of the acquiree in assessing whether it meets the definition of a business. When the acquired set of activities and assets lack a substantive process in place and will be integrated into the Trust’s existing operations, the acquisition does not meet the definition of a business and is accounted for as an asset acquisition. An asset acquisition is accounted for as an acquisition of a group of assets and liabilities. The cost of the acquisition, including transaction costs, is allocated to the assets and liabilities acquired based on their relative fair values, and no goodwill or deferred tax is recognized. Subsequently, where the acquired asset represents an investment property, it is measured at fair value in accordance with IAS 40, Investment Properties.
IFRS 16, Leases
In January 2016, the International Accounting Standards Board (“IASB”) issued IFRS 16,Leases (‘‘IFRS 16’’) which replaced International Accounting Standard (“IAS”) 17,Leases and its associated interpretative guidance. For contracts that are or contain a lease, IFRS 16 introduces significant changes to the accounting by lessees, introducing a single,on-balance sheet accounting model that is similar to finance lease accounting, with limited exceptions for short-term leases or leases of low value assets. Lessor accounting remains substantially unchanged as the distinction between operating and finance leases is retained.
The Trust has applied IFRS 16 using the modified retrospective approach and, therefore, the cumulative effect of initial application is recognized in retained earnings at January 1, 2019. Accordingly, the comparative information presented for 2018 has not been restated.
Granite REIT 2019 Second Quarter Report 47
As a lessee
Definition of a lease
Previously, the Trust determined at contract inception whether an arrangement was or contained a lease under IAS 17. The Trust now assesses whether a contract is or contains a lease based on the new definition of a lease. Under IFRS 16, a contract is or contains a lease if the contract conveys a right to control the use of an identified asset for a period of time in exchange for consideration.
On transition to IFRS 16, the Trust applied IFRS 16 only to contracts that were previously identified as leases. Contracts that were not identified as leases under IAS 17 and associated interpretative guidance were not reassessed as the practical expedient offered under the standard was applied. Therefore, the new definition of a lease under IFRS 16 has been applied only to contracts entered into or changed on or after January 1, 2019.
In accordance with IFRS 16, at inception or on modification of a contract that contains a lease component, the Trust allocates the consideration in the contract to each lease andnon-lease component based on their relative stand-alone prices.
Accounting policy
The Trust recognizes aright-of-use asset and a lease obligation at the lease commencement date. The Trust presentsright-of-use assets that do not meet the definition of investment property in ‘‘fixed assets’’ on the combined balance sheet, the same line item as it presents underlying assets of the same nature that it owns. Theright-of-use asset is initially measured at cost and, subsequently, at cost less any accumulated depreciation and impairment, and adjusted for certain remeasurements of the lease obligation. When aright-of-use asset meets the definition of investment property, it is presented in “investment properties” on the combined balance sheet. Theright-of-use asset is initially measured at cost and subsequently, it is measured at fair value in accordance with the Trust’s accounting policies.
The lease liability is initially measured at the present value of the lease payments at the commencement date, discounted using the interest rate implicit in the lease or, if that rate cannot be readily determined, at the Trust’s incremental borrowing rate. Generally, the Trust uses its incremental borrowing rate as the discount rate. The Trust presents lease liabilities in “lease obligations” on the combined balance sheet.
The lease obligation is subsequently increased by the interest cost on the lease liability and decreased by lease payments made. It is remeasured when there is a change in future lease payments arising from a change in an index or rate, a change in the estimate of the amount expected to be payable under a residual value guarantee or, as appropriate, a change in the assessment of whether a purchase or extension option is reasonably certain to be exercised or a termination option is reasonably certain not to be exercised.
The Trust has applied judgment to determine the lease term for some lease contracts in which it is a lessee that include renewal or termination options. The assessment of whether the Trust is reasonably certain to exercise such options impacts the lease term which, in turn, significantly affects the amount of lease obligations andright-of-use assets recognized. The Trust also applies judgment in determining the discount rate used to present value the lease obligations.
Transition
In accordance with IFRS 16, the Trust recognizedright-of-use assets and lease obligations for applicable leases except for leases oflow-value assets for which the Trust has elected not to recognizeright-of-use assets and lease liabilities. The Trust recognizes the lease payments associated with theselow-value asset leases as an expense on a straight-line basis over the lease term.
The Trust leases assets related to ground leases, office space and office equipment. Lease obligations were measured at the present value of the remaining lease payments, discounted at the Trust’s incremental borrowing rate as at January 1, 2019.
48 Granite REIT 2019 Second Quarter Report
Right-of-use assets are measured at either:
| • | Their carrying amount as if IFRS 16 had been applied since the commencement date, discounted using the lessee’s incremental borrowing rate at the date of initial application; or |
| • | An amount equal to the lease liability, adjusted by the amount of any prepaid or accrued lease payments. |
The Trust recognized aright-of-use asset at a value equal to the lease obligation and, therefore, there was no impact to retained earnings as at January 1, 2019.
The Trust used the following additional practical expedients when applying IFRS 16 to leases previously classified as operating leases under IAS 17:
| • | Applied the exemption not to recognizeright-of-use assets and obligations for leases with less than 12 months of lease term; |
| • | Applied the exemption not to allocate the consideration in a contract to each lease andnon-lease component; |
| • | Excluded initial direct costs from measuring theright-of-use asset at the date of initial application; and |
| • | Used hindsight when determining the lease term if the contract contains options to extend or terminate the lease. |
Impact on transition
As at June 30, 2019, the Trust had leases for the use of office space, office and other equipment and three ground leases for the land upon which four income-producing properties in Europe and Canada are situated. In accordance with IFRS 16, the Trust recognized these operating leases asright-of-use assets and recorded related lease liability obligations on the condensed combined balance sheet as follows:
| Fixed assets | Investment properties | Lease obligations | ||||||||||||||||||||||||||
| Office space | Equipment | Total | Ground leases | |||||||||||||||||||||||||
Balance at January 1, 2019 | $ | 1.7 | $ | 0.1 | $ | 1.8 | $ | 11.8 | $ | 13.6 | ||||||||||||||||||
Balance at June 30, 2019 | $ | 1.5 | $ | 0.1 | $ | 1.6 | $ | 31.6 | $ | 33.2 | ||||||||||||||||||
When measuring lease liabilities for leases that were classified as operating leases, the Trust discounted lease payments using its incremental borrowing rate at January 1, 2019. The weighted average rate applied is 4.4%.
During the three and six month periods ended June 30, 2019, the Trust recorded an additionalright-of-use asset and related lease obligation of $20.5 million for the ground lease associated with the acquisition of two income-producing properties in Mississauga, Ontario in April 2019. The Trust also recorded additionalright-of-use assets and lease obligations of less than $0.1 million for equipment.
Also in accordance with IFRS 16, the Trust has recognized depreciation and interest costs, instead of operating lease expense. During the three and six month periods ended June 30, 2019, the Trust recognized $0.2 million and $0.3 million of depreciation and amortization expense, respectively, and $0.4 million and $0.5 million of interest expense from these leases, respectively. No depreciation is recognized for theright-of-use asset that meets the definition of investment property.
As a lessor
The Trust leases its investment properties, includingright-of-use assets, to tenants and has determined that thein-place leases as at June 30, 2019 are operating leases. The accounting policies applicable to the Trust
Granite REIT 2019 Second Quarter Report 49
as a lessor are in accordance with IAS 17. The Trust is not required to make any adjustments on transition to IFRS 16 for leases in which it is a lessor.
IFRIC 23, Uncertainty Over Income Tax Treatments
In June 2017, the IFRS Interpretations Committee issued IFRIC 23,Uncertainty Over Income Tax Treatments(“IFRIC 23”)which clarifies how the recognition and measurement requirements of IAS 12,Income Taxes, are applied where there is uncertainty over income tax treatments. This standard is effective for annual periods beginning on or after January 1, 2019. The adoption of this standard did not have an impact on the combined financial statements.
Future Accounting Policy Changes
There are no new accounting standards issued but not yet applicable to the condensed combined financial statements for the three and six months ended June 30, 2019.
| INTERNAL CONTROLS OVER FINANCIAL REPORTING |
During the second quarter of 2019, there were no changes in the Trust’s internal controls over financial reporting that had materially affected or are reasonably likely to materially affect the internal controls over financial reporting.
| RISKS AND UNCERTAINTIES |
Investing in the Trust’s stapled units involves a high degree of risk. There are a number of risk factors that could have a material adverse effect on Granite’s business, financial condition, operating results and prospects. These risks and uncertainties are discussed in Granite’s AIF filed with securities regulators in Canada and available online atwww.sedar.com and Annual Report on Form40-F filed with the SEC and available online on EDGAR atwww.sec.gov, each in respect of the year ended December 31, 2018, and remain substantially unchanged in respect of the three and six month periods ended June 30, 2019.
50 Granite REIT 2019 Second Quarter Report
| QUARTERLY FINANCIAL DATA (UNAUDITED) |
| (in millions, except as noted) | Q2’19 | Q1’19(6) | Q4’18 | Q3’18 | Q2’18 | Q1’18 | Q4’17 | Q3’17 | ||||||||||||||||||||||||
Operating highlights(1)(2) | ||||||||||||||||||||||||||||||||
Revenue | $ | 67.9 | $ | 63.4 | $ | 59.9 | $ | 63.8 | $ | 62.1 | $ | 61.7 | $ | 62.6 | $ | 60.8 | ||||||||||||||||
NOI — cash basis(1) | $ | 58.3 | $ | 55.1 | $ | 52.9 | $ | 56.4 | $ | 55.2 | $ | 52.3 | $ | 56.2 | $ | 53.5 | ||||||||||||||||
Fair value gain on investment properties, net | $ | 69.6 | $ | 50.1 | $ | 52.9 | $ | 141.6 | $ | 127.9 | $ | 32.3 | $ | 185.2 | $ | 17.0 | ||||||||||||||||
Net income attributable to | $ | 98.7 | $ | 78.3 | $ | 85.9 | $ | 157.8 | $ | 149.2 | $ | 72.4 | $ | 233.6 | $ | 51.0 | ||||||||||||||||
Cash provided by operating activities | $ | 50.1 | $ | 40.4 | $ | 34.7 | $ | 40.6 | $ | 45.0 | $ | 37.6 | $ | 38.2 | $ | 40.5 | ||||||||||||||||
FFO(1) | $ | 43.1 | $ | 40.7 | $ | 40.9 | $ | 39.1 | $ | 37.6 | $ | 51.3 | $ | 41.6 | $ | 40.5 | ||||||||||||||||
AFFO(1) | $ | 42.3 | $ | 39.3 | $ | 39.8 | $ | 37.7 | $ | 29.4 | $ | 31.1 | $ | 32.6 | $ | 40.1 | ||||||||||||||||
FFO payout ratio(1) | 81% | 79% | 77% | 80% | 79% | 79% | 75% | 79% | ||||||||||||||||||||||||
AFFO payout ratio(1) | 83% | 82% | 79% | 82% | 99% | 109% | 95% | 80% | ||||||||||||||||||||||||
Per unit amounts | ||||||||||||||||||||||||||||||||
Diluted FFO(1) | $ | 0.89 | $ | 0.89 | $ | 0.90 | $ | 0.86 | $ | 0.82 | $ | 1.11 | $ | 0.89 | $ | 0.86 | ||||||||||||||||
Diluted AFFO(1) | $ | 0.88 | $ | 0.86 | $ | 0.87 | $ | 0.82 | $ | 0.64 | $ | 0.67 | $ | 0.69 | $ | 0.85 | ||||||||||||||||
Monthly distributions paid | $ | 0.70 | $ | 0.70 | $ | 0.68 | $ | 0.68 | $ | 0.68 | $ | 0.68 | $ | 0.65 | $ | 0.65 | ||||||||||||||||
Special distribution paid | — | $ | 0.30 | — | — | — | — | — | — | |||||||||||||||||||||||
Financial highlights | ||||||||||||||||||||||||||||||||
Investment properties(3) | $ | 3,799.1 | $ | 3,532.8 | $ | 3,425.0 | $ | 3,198.0 | $ | 3,031.2 | $ | 2,916.1 | $ | 2,733.6 | $ | 2,749.0 | ||||||||||||||||
Assets held for sale | $ | 50.5 | $ | 38.7 | $ | 44.2 | $ | 17.0 | $ | 341.4 | — | $ | 391.4 | — | ||||||||||||||||||
Cash and cash equivalents | $ | 496.9 | $ | 501.0 | $ | 658.2 | $ | 192.7 | $ | 50.1 | $ | 273.8 | $ | 69.0 | $ | 190.9 | ||||||||||||||||
Total debt(4) | $ | 1,285.6 | $ | 1,261.6 | $ | 1,303.2 | $ | 715.9 | $ | 817.6 | $ | 745.7 | $ | 741.4 | $ | 691.5 | ||||||||||||||||
Diluted weighted average | 48.3 | 45.7 | 45.7 | 45.8 | 45.8 | 46.3 | 47.0 | 47.2 | ||||||||||||||||||||||||
Maintenance or | $ | 0.3 | $ | 0.6 | $ | 0.7 | $ | 1.5 | $ | 3.0 | $ | 0.4 | $ | 1.3 | $ | 0.5 | ||||||||||||||||
Leasing costs paid(5) | — | $ | 0.4 | $ | 0.4 | $ | 0.5 | $ | 2.4 | $ | 1.5 | $ | 0.4 | $ | 0.4 | |||||||||||||||||
Property metrics(3) | ||||||||||||||||||||||||||||||||
Number of income-producing properties | 79 | 77 | 80 | 85 | 84 | 85 | 84 | 92 | ||||||||||||||||||||||||
GLA, square feet | 34.5 | 32.8 | 32.2 | 32.5 | 31.8 | 29.7 | 29.1 | 30.2 | ||||||||||||||||||||||||
Occupancy, by GLA | 98.9% | 98.8% | 99.1% | 97.3% | 97.3% | 98.7% | 98.4% | 98.4% | ||||||||||||||||||||||||
Weighted average lease term, years | 6.0 | 6.1 | 6.0 | 5.9 | 5.9 | 6.0 | 5.9 | 6.6 | ||||||||||||||||||||||||
| (1) | For definitions of Granite’snon-IFRS measures, refer to the section “NON-IFRS MEASURES”. |
| (2) | The quarterly financial data reflects fluctuations in revenue, FFO, AFFO, investment properties and total debt primarily from the timing of leasing and development activities, property sales, acquisitions and foreign exchange. Investment properties also fluctuate from the effect of measuring properties at fair value under IFRS. Net income attributable to unitholders primarily fluctuates from fair value gains/losses on investment properties. Explanations for specific changes in the quarterly financial data table above are as follows: |
| • | Q2’19 — Revenue, net income attributable to unitholders, cash provided by operating activities and FFO included $0.6 million of lease termination andclose-out fee in revenue in connection with a tenant having vacated a property. FFO used to calculate FFO payout ratio and AFFO payout ratio excludes the $0.6 million lease termination andclose-out fee as this revenue can be a source of variance between periods. |
| • | Q1’19 — Revenue, net income attributable to unitholders, cash provided by operating activities and FFO included $0.3 million of lease termination andclose-out fee in revenue in connection with a tenant having vacated a property. FFO used to calculate FFO payout ratio and AFFO payout ratio excludes the $0.3 million lease termination andclose-out fee as this revenue can be a source of variance between periods. |
| • | Q4’18 — Fair value gains on investment properties of $52.9 million were largely attributable to a compression in discount and terminal capitalization rates for properties located in Canada, the United States and the Netherlands that resulted from a greater market demand for industrial real estate properties and, to a lesser extent, the increase in fair value to the expected sale price for the multi-purpose properties sold in 2019 and the positive changes in leasing assumptions associated with new leases and lease renewals. |
Granite REIT 2019 Second Quarter Report 51
| • | Q3’18 — Fair value gain on investment properties of $141.6 million included a compression in discount and terminal capitalization rates and an increase in market rents for properties in Canada, the United States, Germany and the Netherlands resulting from the limited availability and greater market demand for industrial real estate properties. |
| • | Q2’18 — Net income attributable to unitholders, cash provided by operating activities and FFO included a $1.9 million foreign exchange loss recognized in the period relating to the remeasurement of US dollar proceeds from the sale of investment properties in January 2018. FFO used to calculate FFO payout ratio and AFFO payout ratio excludes the $1.9 million foreign exchange loss on the remeasurement of US dollar proceeds from the sale of investment properties as this item can be a source of variance between periods. Fair value gain on investment properties of $127.9 million included the increase in fair value to the expected sale price of six multi-purpose and special purpose properties classified as assets held for sale in the second quarter of 2018. |
| • | Q1’18 — Revenue, net income attributable to unitholders, cash provided by operating activities and FFO included $1.0 million of lease termination andclose-out fee in revenue in connection with a tenant having vacated a property and a $10.4 million foreign exchange gain recognized in the period relating to the remeasurement of US dollar proceeds from the sale of investment properties in January 2018. FFO used to calculate FFO payout ratio and AFFO payout ratio excludes the aforementioned items as these items can be a source of variance between periods. AFFO included $9.1 million related to the payment of a tenant incentive allowance made in connection with a 2014 lease extension at the Eurostar facility in Graz, Austria. AFFO used to calculate AFFO payout ratio excludes the $9.1 million tenant incentive payment as this cost can be a source of variance between periods. |
| • | Q4’17 — Fair value gain on investment properties of $185.2 million included the increase in fair value to the sale price for 10 properties, including three special purpose properties, sold in January 2018 and the higher valuation implied on certain remaining special purpose properties from the pricing realized and the liquidity potential demonstrated from the dispositions. |
| • | Q3’17 — Revenue, net income attributable to unitholders, cash provided by operating activities and FFO included $1.6 million of lease termination andclose-out fees in revenue in connection with tenants having vacated properties. FFO used to calculate FFO payout ratio and AFFO payout ratio excludes the $1.6 million lease termination andclose-out fees as this revenue can be a source of variance between periods. |
| (3) | Excludes properties held for sale which are classified as assets held for sale on the combined balance sheet as at the respectivequarter-end. |
| (4) | The Trust has adopted IFRS 16,Leases effective January 1, 2019 resulting in the recognition of lease obligations on the combined balance sheet and, thereby, included in total debt (see “NEW ACCOUNTING PRONOUNCEMENTS AND DEVELOPMENTS”). |
| (5) | Excludes maintenance or improvement capital expenditures and leasing costs paid related to a $9.1 million tenant incentive allowance for a 2014 lease extension in Graz, Austria and the partiallyre-leased flex office property in Novi, Michigan (see “INVESTMENT PROPERTIES”). |
| (6) | Granite has early adopted, effective January 1, 2019, the IFRS 3 Amendments in the three and six month periods ended June 30, 2019 (see “NEW ACCOUNTING PRONOUNCEMENTS AND DEVELOPMENTS”). Accordingly, transaction costs relating to asset acquisitions are initially recorded to investment properties and, when subsequently measured at fair value, are expensed to net fair value gains/losses on investment properties. Prior to the early adoption of the IFRS 3 Amendments, property acquisitions were accounted as business combinations and transaction costs were expensed in its own line item in the statement of net income. Net fair value gains on investment properties and cash provided by operating activities for the three months ended March 31, 2019 were previously reported as $50.5 million and $39.5 million, respectively. |
| FORWARD-LOOKING STATEMENTS |
This MD&A may contain statements that, to the extent they are not recitations of historical fact, constitute “forward-looking statements” or “forward-looking information” within the meaning of applicable securities legislation, including the United States Securities Act of 1933, as amended, the United States Securities Exchange Act of 1934, as amended, and applicable Canadian securities legislation. Forward-looking statements and forward-looking information may include, among others, statements regarding Granite’s future plans, goals, strategies, intentions, beliefs, estimates, costs, objectives, capital structure, cost of capital, tenant base, tax consequences, economic performance or expectations, or the assumptions underlying any of the foregoing. Words such as “outlook”, “may”, “would”, “could”, “should”, “will”, “likely”, “expect”, “anticipate”, “believe”, “intend”, “plan”, “forecast”, “project”, “estimate”, “seek” and similar expressions are used to identify forward-looking statements and forward-looking information. Forward-looking statements and forward-looking information should not be read as guarantees of future
52 Granite REIT 2019 Second Quarter Report
events, performance or results and will not necessarily be accurate indications of whether or the times at or by which such future performance will be achieved. Undue reliance should not be placed on such statements. There can also be no assurance that: the expansion and diversification of Granite’s real estate portfolio and the reduction in Granite’s exposure to Magna and the special purpose properties; the ability of Granite to accelerate growth and to grow its net asset value and FFO and AFFO per unit; the ability of Granite to find satisfactory acquisition, joint venture and development opportunities and to strategically deploy the proceeds from recently sold properties and financing initiatives; Granite’s intended use of the net proceeds from the equity offering to fund potential acquisitions and for the other purposes described previously; the potential for expansion and rental growth at the properties in Mississauga, Ontario and Columbus, Ohio; the expected enhancement to the yield of such properties from such potential expansion and rental growth; the expected construction on and development yield of the acquired greenfield site in Houston, Texas; the expected construction of the distribution/light industrial facility on the 13-acre site in Altbach, Germany; the proposed acquisition of the distribution centre in Horn Lake, Mississippi and the expected timing of the closing of such acquisition; Granite’s ability to dispose of anynon-core assets on satisfactory terms; Granite’s ability to meet its target occupancy goals; and the expected amount of any distributions, can be achieved in a timely manner, with the expected impact or at all. Forward-looking statements and forward-looking information are based on information available at the time and/or management’s good faith assumptions and analyses made in light of Granite’s perception of historical trends, current conditions and expected future developments, as well as other factors Granite believes are appropriate in the circumstances, and are subject to known and unknown risks, uncertainties and other unpredictable factors, many of which are beyond Granite’s control, that could cause actual events or results to differ materially from such forward-looking statements and forward-looking information. Important factors that could cause such differences include, but are not limited to, the risk of changes to tax or other laws and treaties that may adversely affect Granite REIT’s mutual fund trust status under the Income Tax Act (Canada) or the effective tax rate in other jurisdictions in which Granite operates; economic, market and competitive conditions and other risks that may adversely affect Granite’s ability to expand and diversify its real estate portfolio and dispose of anynon-core assets on satisfactory terms; and the risks set forth in the “Risk Factors” section in Granite’s AIF for 2018 dated March 6, 2019, filed on SEDAR at www.sedar.com and attached as Exhibit 1 to the Trust’s Annual Report on Form40-F for the year ended December 31, 2018 filed with the SEC and available online on EDGAR at www.sec.gov, all of which investors are strongly advised to review. The “Risk Factors” section also contains information about the material factors or assumptions underlying such forward-looking statements and forward-looking information. Forward-looking statements and forward-looking information speak only as of the date the statements and information were made and unless otherwise required by applicable securities laws, Granite expressly disclaims any intention and undertakes no obligation to update or revise any forward-looking statements or forward-looking information contained in this MD&A to reflect subsequent information, events or circumstances or otherwise.
Granite REIT 2019 Second Quarter Report 53