Table of Contents
Exhibit 99.1

Third Quarter Report
2021
Table of Contents
Management’s Discussion and Analysis of Results of Operations and Financial Position | 3 | |
| 64 | ||
| 65 | ||
| 66 | ||
| 67 | ||
| 68 | ||
| 69 | ||
| Inside Back Cover | ||
Granite REIT 2021 Third Quarter Report
Table of Contents
MANAGEMENT’S DISCUSSION AND ANALYSIS OF RESULTS OF OPERATIONS AND FINANCIAL POSITION
| TABLE OF CONTENTS |
| 3 | ||||
| 4 | ||||
| 5 | ||||
| 11 | ||||
| 13 | ||||
| 15 | ||||
| 32 | ||||
| 44 | ||||
Commitments, Contractual Obligations, Contingencies and Off-Balance Sheet Arrangements | 53 | |||
| Non-IFRS Performance Measures | 53 | |||
| Significant Accounting Estimates | 57 | |||
| 59 | ||||
| 59 | ||||
| Risks and Uncertainties | 59 | |||
| Quarterly Financial Data | 60 | |||
| Forward-Looking Statements | 61 | |||
| BASIS OF PRESENTATION |
Management’s Discussion and Analysis of Results of Operations and Financial Position (“MD&A”) of Granite Real Estate Investment Trust (“Granite REIT”) and Granite REIT Inc. (“Granite GP”) summarizes the significant factors affecting the combined operating results, financial condition, liquidity and cash flows of Granite REIT, Granite GP and their subsidiaries (collectively “Granite” or the “Trust”) for the three and nine months ended September 30, 2021. Unless otherwise noted, all amounts are in millions of Canadian dollars. This MD&A should be read in conjunction with the accompanying unaudited condensed combined financial statements for the three and nine months ended September 30, 2021 prepared in accordance with International Financial Reporting Standards (“IFRS”) as issued by the International Accounting Standards Board. The MD&A was prepared as at November 3, 2021 and its contents were approved by the Board of Trustees of Granite REIT and Board of Directors of Granite GP on this date. Additional information relating to Granite, including the Annual Report and Annual Information Form (“AIF”) for fiscal 2020 and dated March 3, 2021, can be obtained from the Trust’s website at www.granitereit.com, on SEDAR at www.sedar.com and on EDGAR at www.sec.gov.
In addition to using financial measures determined in accordance with IFRS, Granite also uses certain non-IFRS measures in managing its business to measure financial and operating performance as well as for capital allocation decisions and valuation purposes. Granite believes that providing these measures on a supplemental basis to the IFRS amounts is helpful to investors in assessing the overall performance of Granite’s business. These non-IFRS measures include net operating income before lease termination and close-out fees, straight-line rent and tenant incentive amortization (“NOI — cash basis”), same property NOI — cash basis, constant currency same property NOI, funds from operations (“FFO”), adjusted funds from operations (“AFFO”),
Granite REIT 2021 Third Quarter Report 3
Table of Contents
FFO payout ratio, AFFO payout ratio, leverage ratio, interest coverage ratio, net leverage ratio, indebtedness ratio, adjusted earnings before interest, income taxes, depreciation and amortization (“Adjusted EBITDA”), unencumbered asset coverage ratio and any related per unit amounts. Readers are cautioned that these measures do not have standardized meanings prescribed under IFRS and, therefore, should not be construed as alternatives to net income, cash provided by operating activities or any other measure calculated in accordance with IFRS. Additionally, because these terms do not have standardized meanings prescribed by IFRS, they may not be comparable to similarly titled measures presented by other reporting issuers. Refer to “NON-IFRS PERFORMANCE MEASURES” for definitions and reconciliations of non-IFRS measures to IFRS financial measures.
| FINANCIAL AND OPERATING HIGHLIGHTS |
| Three Months Ended September 30, | Nine Months Ended September 30, | |||||||||||||||
| (in millions, except as noted) | 2021 | 2020 | 2021 | 2020 | ||||||||||||
Operating highlights | ||||||||||||||||
Revenue | $98.3 | $87.9 | $288.2 | $247.0 | ||||||||||||
NOI | 84.5 | 76.5 | 246.4 | 215.6 | ||||||||||||
NOI — cash basis(1) | 83.6 | 74.5 | 243.2 | 213.2 | ||||||||||||
Net income attributable to stapled unitholders | 421.8 | 105.2 | 968.8 | 262.2 | ||||||||||||
FFO(1) | 65.2 | 55.5 | 184.5 | 165.8 | ||||||||||||
AFFO(1) | 61.2 | 52.7 | 176.0 | 159.6 | ||||||||||||
Cash flows provided from operating activities | 79.5 | 69.0 | 208.5 | 189.0 | ||||||||||||
Monthly distributions paid | 49.3 | 42.0 | 141.8 | 120.1 | ||||||||||||
FFO payout ratio(1)(2) | 76% | 76% | 76% | 73% | ||||||||||||
AFFO payout ratio(1)(2) | 81% | 80% | 79% | 76% | ||||||||||||
Per unit amounts | ||||||||||||||||
Diluted FFO(1) | $0.99 | $0.96 | $2.91 | $2.98 | ||||||||||||
Diluted AFFO(1) | $0.93 | $0.91 | $2.78 | $2.87 | ||||||||||||
Monthly distributions paid | $0.75 | $0.73 | $1.50 | $1.45 | ||||||||||||
Diluted weighted average number of units | 65.8 | 57.9 | 63.4 | 55.7 | ||||||||||||
4 Granite REIT 2021 Third Quarter Report
Table of Contents
| As at September 30, 2021 and December 31, 2020 | 2021 | 2020 | ||||||
Financial highlights | ||||||||
Investment properties — fair value(7) | $7,286.3 | $5,855.6 | ||||||
Assets held for sale(7) | 43.2 | — | ||||||
Cash and cash equivalents | 779.0 | 831.3 | ||||||
Total debt(3) | 2,449.2 | 2,297.5 | ||||||
Trading price per unit (TSX: GRT.UN) | $ 89.93 | $ 77.90 | ||||||
Debt metrics, ratings and outlook | ||||||||
Net leverage ratio(1) | 23% | 25% | ||||||
Interest coverage ratio(1) | 6.8x | 7.9x | ||||||
Indebtedness ratio (total debt to adjusted EBITDA)(1) | 8.3x | 8.7x | ||||||
Weighted average cost of debt(4) | 1.81% | 1.91% | ||||||
Weighted average debt term-to-maturity, in years(4) | 5.8 | 5.6 | ||||||
DBRS rating and outlook | | BBB (high) stable | | BBB stable | ||||
Moody’s rating and outlook | Baa2 stable | Baa2 stable | ||||||
Property metrics(7) | ||||||||
Number of investment properties | 126 | 115 | ||||||
Income-producing properties | 114 | 108 | ||||||
Properties under development | 9 | 3 | ||||||
Land held for development | 3 | 4 | ||||||
Gross leasable area (“GLA”), square feet | 53.3 | 49.5 | ||||||
Occupancy, by GLA | 99.2% | 99.6% | ||||||
Magna as a percentage of annualized revenue(5) | 31% | 36% | ||||||
Magna as a percentage of GLA | 24% | 27% | ||||||
Weighted average lease term in years, by GLA | 5.8 | 6.3 | ||||||
Overall capitalization rate(6) | 4.8% | 5.6% | ||||||
| (1) | For definitions of Granite’s non-IFRS measures, refer to the section “NON-IFRS PERFORMANCE MEASURES”. |
| (2) | The FFO and AFFO payout ratios are calculated as monthly distributions, divided by FFO and AFFO, respectively, in a period. |
| (3) | Total debt includes lease obligations recognized under IFRS 16, Leases. |
| (4) | Excludes lease obligations recognized under IFRS 16, Leases noted above. |
| (5) | Annualized revenue for each period presented is calculated as rental revenue excluding tenant recoveries, recognized in accordance with IFRS, in the reported month multiplied by 12 months. Annualized revenue excludes revenue from properties classified as assets held for sale. |
| (6) | Refer to “Valuation Metrics by Asset Category” in the “INVESTMENT PROPERTIES” section. |
| (7) | Assets held for sale are excluded from investment properties and related property metrics. Accordingly, three such assets that were held for sale at September 30, 2021 were excluded from investment properties and related metrics at September 30, 2021 throughout this MD&A. |
| SIGNIFICANT MATTERS |
COVID-19 Pandemic
Granite’s portfolio is well positioned to deliver both cash flow stability and growth as well as long-term value for unitholders. Throughout 2020 and 2021 thus far, amidst the novel coronavirus (“COVID-19”) pandemic, Granite has continued to achieve net asset value appreciation and stable net operating income growth, while executing on its strategic initiatives. Although the full impact of the COVID-19 pandemic continues to be difficult to predict, Granite believes that its portfolio and strong liquidity position will allow it to weather the on-going impact of COVID-19.
Granite REIT 2021 Third Quarter Report 5
Table of Contents
Granite’s tenant base is comprised of generally high-quality credit companies with 53% of total annualized revenue represented by Granite’s top ten tenants (see “INVESTMENT PROPERTIES — Leasing Profile-Other Tenants” for a summary of Granite’s top ten tenants). COVID-19 has had, and will continue to have, a varied impact on Granite’s tenants depending on their specific businesses. Certain tenants have seen increased activity during this COVID-19 period while other tenants slowed down or shut down operations temporarily in the earlier months of the COVID-19 pandemic. It is difficult to predict at this time what continued impact COVID-19, including further waves of new infections, targeted public health restrictions and reinstated emergency measures in the markets where Granite operates, will have on the businesses of Granite’s tenants and the resulting direct impact on Granite’s operations.
During the three and nine months ended September 30, 2021, there has not been a significant impact on Granite’s operations, assets or liabilities as a result of COVID-19. Throughout the pandemic thus far, Granite has not realized any negative impacts on rent collections and therefore has not recognized any provisions for uncollected rent at this time. Granite reviewed its future cash flow projections and the valuation of its properties considering the impacts of the COVID-19 pandemic during the nine months ended September 30, 2021 and Granite does not expect, at this time, that COVID-19 will have a significant negative impact to the fair value of its investment property portfolio. In addition, there have not been any significant fair value losses on investment properties recorded in the three and nine months ended September 30, 2021.
From a liquidity perspective, as at the date of this MD&A, November 3, 2021, Granite has total liquidity of approximately $1.8 billion, including its fully undrawn operating facility which is sufficient to meet its current commitments, development and construction projects. During the first quarter of 2021, Granite amended its existing unsecured revolving credit facility agreement to extend the maturity date for a new five-year term to March 31, 2026 and increase the facility’s limit from $0.5 billion to $1.0 billion. Granite’s nearest debt maturity of $400.0 million does not occur until November 2023, and Granite’s investment property portfolio of approximately $7.3 billion remains fully unencumbered. Granite believes it is well-positioned to weather any short-term negative impacts on its business; however, Granite will continue to evaluate and monitor its liquidity as the situation prolongs.
From a leasing perspective, as at the date of this MD&A, November 3, 2021, Granite has renewed 99% of its 2021 lease maturities. With respect to 2022, Granite has renewed 46% of its 2022 lease maturities with 3.0 million square feet outstanding representing 5.6% of the total portfolio. Granite does not believe that the impacts of COVID-19 will materially affect overall leasing activity for 2021 and beyond, including its impact on market rents, tenant demand for space, tenant allowances or incentives and lease terms.
With respect to Granite’s outstanding development projects, progress has not been materially impacted by COVID-19. For more information on Granite’s development projects, please see “SIGNIFICANT MATTERS — Construction, Development and Property Commitments” and “INVESTMENT PROPERTIES — Development and Expansion Projects”.
Consistent with its usual practice, Granite continues to review the value of its investment properties. The COVID-19 pandemic has not had a significant negative impact on the valuation of Granite’s investment properties. The duration of the COVID-19 pandemic, including further waves of new infections in the markets where Granite operates that may lead to further targeted public health restrictions and additional emergency measures, cannot be predicted. As such, the length and full scope of the economic impact of COVID-19 and other consequential changes it will have on Granite’s business and operations in the long-term cannot be forecasted with certainty at this time. Certain aspects of Granite’s business and operations that could potentially be impacted
6 Granite REIT 2021 Third Quarter Report
Table of Contents
include rental income, occupancy, capital expenditures, future demand for space and market rents, all of which ultimately impact the underlying valuation of investment properties.
Property Acquisitions
As at the date of this MD&A, November 3, 2021, during 2021, Granite has acquired ten income-producing industrial properties in the United States and the Netherlands, four properties under development in the United States, and a parcel of development land in Canada. Property acquisitions consisted of the following:
Acquisitions (in millions, except as noted)
Property Address | Location | Sq ft(1) | Weighted Average Lease Term, in years by sq ft(1) | Date Acquired | Property Purchase Price(2) | Stabilized Yield(1) | ||||||||||||||||||
Acquired during the nine months ended September 30, 2021: |
| |||||||||||||||||||||||
Income-producing properties: | ||||||||||||||||||||||||
3090 Highway 42 (3) |
| Locust Grove, GA |
|
| 1.0 |
|
| 7.6 | (4) |
| March 12, 2021 |
| $ | 85.1 |
|
| 5.0% |
| ||||||
3801 Rock Creek Blvd. |
| Joliet, IL |
|
| 0.3 |
|
| 5.9 |
|
| June 25, 2021 |
|
| 30.2 |
|
| 4.6% |
| ||||||
3900 Rock Creek Blvd. |
| Joliet, IL |
|
| 0.3 |
|
| 4.1 |
|
| June 25, 2021 |
|
| 34.7 |
|
| 5.2% |
| ||||||
1695-1701 Crossroads Dr. |
| Joliet, IL |
|
| 0.5 |
|
| 2.9 |
|
| June 25, 2021 |
|
| 50.7 |
|
| 4.6% |
| ||||||
US Portfolio (4 properties): | ||||||||||||||||||||||||
1243 Gregory Dr. | Antioch, IL | |||||||||||||||||||||||
60 Logistics Blvd. | Richwood, KY | |||||||||||||||||||||||
8740 South Crossroads Dr. | Olive Branch, MS | |||||||||||||||||||||||
12577 State Line Rd. | Olive Branch, MS | 2.4 | 3.2 | September 3, 2021 | 243.7 | 4.7% | ||||||||||||||||||
1600 Rock Creek Blvd. |
| Joliet, IL |
|
| 0.1 |
| 4.4 |
|
| September 7, 2021 |
|
| 20.7 |
|
| 4.9% |
| |||||||
Sophialaan 5 |
| Utrecht, Netherlands |
|
| 0.2 |
| 1.2 |
|
| September 17, 2021 |
|
| 42.1 |
|
| 2.3% |
| |||||||
Properties under development: | ||||||||||||||||||||||||
2120 Logistics Way |
| Murfreesboro, TN |
|
| N/A |
|
| N/A |
|
| June 30, 2021 |
|
| 17.3 |
|
| 5.3% |
| ||||||
Highway 109 (3 properties) |
| Lebanon, TN |
|
| N/A |
|
| N/A |
|
| September 8, 2021 |
|
| 6.5 |
|
| 5.3% |
| ||||||
Development land: | ||||||||||||||||||||||||
375/395 Hardy Rd. |
| Brantford, ON |
|
| N/A |
|
| N/A |
|
| August 16, 2021 |
|
| 62.2 |
|
| N/A |
| ||||||
| 4.8 | $ | 593.2 |
|
| 4.6% |
| |||||||||||||||||
| (1) | As at the date of acquisition except as noted in note 3 and 4 below. |
| (2) | Purchase price does not include transaction costs associated with property acquisitions. |
| (3) | To provide for a real estate tax abatement, the Trust acquired a leasehold interest in this property which resulted in the recognition of a right-of-use asset, including transaction costs of $85.9 million. The Trust will acquire freehold title to the property on December 1, 2028. |
| (4) | Weighted average lease term applicable to the occupied space. |
Third Quarter 2021 Acquisitions
On August 16, 2021, Granite acquired a 92.2 acre parcel of land in Brantford, Ontario for the development of a multi-phased business park comprising a total of approximately 1.7 million square feet of modern distribution and logistics space for $62.2 million. The greenfield site is serviced and capable of accommodating state-of-the-art buildings ranging from 100,000 square feet to 400,000 square feet with the first phase of construction anticipated to commence in the third quarter of 2022. The site is centrally located 0.5 kilometers from Highway 403, in one of Brantford’s rapidly evolving distribution nodes, providing access to nearly 8.8 million people within a 90-minute drive.
Granite REIT 2021 Third Quarter Report 7
Table of Contents
On September 3, 2021, Granite acquired a portfolio of four modern distribution warehouses located in Chicago, Cincinnati and Memphis (the “US Portfolio”), collectively totaling 2.4 million square feet. The properties were acquired at a combined purchase price of approximately $243.7 million (US$195.0 million) representing an in-going yield of 4.7%. The properties are 100% leased to seven tenants for a weighted average remaining lease term of 3.2 years. These institutional-quality assets have minimum 32’ clear heights with an average age of 8 years. All of the assets are well located in their respective markets, with close proximity to key
transportation and distribution infrastructure.
On September 7, 2021, Granite acquired a 0.1 million square foot modern distribution facility located in the Chicago submarket of Joliet, IL for $20.7 million (US$16.4 million). The property is 100% leased to two tenants for a weighted average remaining lease term of 4.4 years and is being acquired at an in-going yield of 4.9%. Located in immediate proximity to Granite’s three recently acquired assets in Chicago, the building features 32’ clear height and is situated on 8 acres of land, near the intersection of the I-55 and I-80.
On September 8, 2021, Granite acquired on a forward funding basis a portfolio of three modern distribution facilities totaling 0.5 million square feet to be constructed on 39.0 acres in the Nashville suburb of Lebanon, Tennessee for $6.5 million (US$5.2 million). Currently in early-stage development, the properties are expected to be completed in Q4 2022 at a total fixed cost, including land, of $83.9 million (US$66.2 million). These state-of-the-art facilities will have modern features including 32’ clear height, LED lighting and other sustainable design features. The properties have direct access to Highway 109, and are located 19 miles from Nashville International Airport and 24 miles from downtown Nashville. The properties are expected to achieve a stabilized development yield of 5.3%. Al. Neyer will act as development manager for the project.
On September 17, 2021, Granite acquired Sophialaan 5, a 0.2 million square foot logistics complex situated on 10.1 acres in Utrecht, Netherlands for $42.1 million (€28.2 million).The property is 60% leased with below-market rents to 18 tenants for a weighted average lease term of 2.0 years. Strategically located in Utrecht, one of the most central logistics markets in the Netherlands, the property is adjacent to the A2 motorway and in close proximity to the A12 and A27 motorways, which connect to the Belgian and German borders. The property is being acquired at an ingoing yield of approximately 2.3%. Upon stabilization, the property is expected to generate a yield of approximately 4.5%. The site’s premier location within the Netherlands also provides for future re-development potential.
Property Dispositions
During the nine months ended September 30, 2021, Granite disposed of two properties for total proceeds of $23.8 million.
Dispositions (in millions, except as noted)
Property Address | Location | Sq ft | Date Disposed | Sale Price(1) | Annualized Revenue (2) | |||||||||||||||
Disposed during the nine months ended September 30, 2021: |
| |||||||||||||||||||
Hedera Road, Ravensbank Business Park |
| Redditch, United Kingdom |
|
| 0.1 |
|
| January 28, 2021 |
| $ | 10.6 |
| $ | 0.8 |
| |||||
Puchberger Straße 267 | Weikersdorf, Austria | 0.2 | June 30, 2021 | 13.2 | 0.7 | |||||||||||||||
| 0.3 | $ | 23.8 |
| $ | 1.5 |
| |||||||||||||
| (1) | Sale price does not include transaction costs associated with disposition. |
| (2) | As at the date of disposition. The property in Weikersdorf, Austria was 53% occupied on the disposition date. |
8 Granite REIT 2021 Third Quarter Report
Table of Contents
Assets Held for Sale
As at September 30, 2021, two income producing properties and one parcel of land held for development located in Poland and Austria were classified as assets held for sale. The three properties, having an aggregate fair value of $43.2 million and annualized revenue of $2.8 million were classified as assets held for sale on the combined balance sheet at September 30, 2021 and were excluded from the value of investment properties. These properties are also excluded from references to investment properties and related property metrics as at September 30, 2021 throughout this MD&A.
Construction, Development and Property Commitments
Granite had the following property purchases and construction and development commitments as at September 30, 2021:
Commitments (in millions, except as noted)
Property Location | Additional sq ft | Accruals/ Payments/ Deposits Made | Future Commitments (1) | Total Cost | Year-One Stabilized Yield (2) | |||||||||||||||
As at September 30, 2021: | ||||||||||||||||||||
Development, construction or expansion: | ||||||||||||||||||||
Redevelopment in Altbach, Germany |
| 0.3 | $ | 22.1 |
| $ | 10.2 |
| $ | 32.3 |
|
| 6.8% |
| ||||||
Properties under development in Houston, Texas |
| 1.4 |
| 12.7 |
| 122.1 |
| 134.8 |
| 5.7% |
| |||||||||
Property under development in Fort Worth, Texas |
| 0.6 |
| 9.7 |
| 34.3 |
| 44.0 |
| 5.8% |
| |||||||||
Property under development in Murfreesboro, TN |
| 0.8 |
| 14.5 |
| 62.5 |
| 77.0 |
| 5.3% |
| |||||||||
Properties under development in Lebanon, TN |
| 0.5 |
| 4.0 |
| 62.8 |
| 66.8 |
| 5.3% |
| |||||||||
Expansion of 2095 Logistics Drive, Mississauga, ON |
| 0.1 |
| 6.4 |
| 4.6 |
| 11.0 |
| 7.7% |
| |||||||||
Expansion of 555 Beck Cres., Ajax, ON |
| — |
|
| 0.2 |
| 8.3 |
| 8.5 |
| 5.5% |
| ||||||||
Tenant improvement commitment at developed property in Plainfield, Indiana |
| — |
|
| — |
|
| 2.6 |
| 2.6 |
| —% |
| |||||||
Other construction commitments |
| — |
|
| 1.9 |
| 8.3 |
| 10.2 |
| —% |
| ||||||||
| 3.7 | $ | 71.5 |
| $ | 315.7 |
| $ | 387.2 |
|
| 5.7% |
| |||||||
Other property commitments: | ||||||||||||||||||||
Development loan/acquisition of two completed properties in Indiana |
| 1.0 |
| $ | 11.5 |
| $ | 95.3 |
| $ | 106.8 |
|
| 5.0% |
| |||||
Acquisition of a completed property in Tilburg, NL |
| 0.5 |
|
| 11.4 |
| 99.7 |
| 111.1 |
| 3.2% |
| ||||||||
| 5.2 | $ | 94.4 |
| $ | 510.7 |
| $ | 605.1 |
|
| 5.1% |
| |||||||
| (1) | Includes signed contracts and future budgeted expenditures not yet contracted. |
| (2) | Yield based on total cost including land. |
During the third quarter of 2021, Granite and its partner NorthPoint Development entered into a new build-to-suit lease with a leading e-commerce retailer at its Houston development site, for an initial term of 10.9 years. The approximate 688,000 square foot, 40’ clear height, modern distribution building is being constructed as the second phase of the multi-phase development, in addition to the initial phase one of approximately 669,000 square feet currently under construction. The build-to-suit project is estimated to be completed in the second quarter of 2022, while phase one is expected to be completed in the fourth quarter of 2022.
On September 8, 2021, Granite acquired on a forward-funding basis, three modern industrial buildings totaling approximately 509,000 square feet to be constructed on a 38.8 acre site in Lebanon, Tennessee. (see “SIGNIFICANT MATTERS — Property Acquisitions” above).
On September 1, 2021, Granite advanced $5.2 million (US$4.1 million) by means of a loan to the developer of two industrial properties being constructed in Indiana. The loan has a maximum draw amount of $69.7 million (US$55.0 million). Due upon completion of the development which
Granite REIT 2021 Third Quarter Report 9
Table of Contents
is expected to be in late 2022, the loan is secured by the properties under construction and related land. Concurrently, on September 1, 2021, Granite entered into a purchase and sale agreement with the developer to acquire the two properties upon completion for $98.2 million (US$77.5 million) plus estimated leasing costs and sustainability features of $8.6 million (US$6.8 million), subject to customary closing conditions. On signing, the Trust paid a deposit to the seller of $6.3 million (US$5.0 million) towards the acquisition which will be applied to the purchase price at the time of closing. The properties are located in close proximity to significant distribution infrastructure with access to major highways/thoroughfares providing regional and national connectivity.
On September 17, 2021, Granite signed a commitment to purchase an approximate 495,000 square foot modern distribution centre in Tilburg, Netherlands once completed in the third quarter of 2022 for $111.1 million (€75.7 million), subject to customary closing conditions. Upon signing of the commitment, Granite paid a deposit to the seller of $11.4 million (€7.5 million). The property is 100% leased for 10 years to a prominent European supplier of domestic appliances and is located within Business Park Kraaiven, a main logistics hub within the Netherlands and one kilometer from Granite’s De Kroonstraat 1 asset acquired in 2020.
Issuance of Unsecured Debentures
On August 30, 2021, Granite completed an offering of $500.0 million aggregate principal amount of 2.194% Series 6 senior unsecured debentures due August 30, 2028 (the “2028 Debentures”). The net proceeds received by Granite after deducting the financing costs totaling $2.9 million were $497.1 million. The 2028 Debentures are guaranteed by Granite REIT and Granite GP. The 2028 Debentures are Granite’s second green bond issuance pursuant to its Green Bond Framework. Granite has used a portion of the net proceeds and intends to use an amount equal to the net proceeds of the 2028 Debentures to finance or refinance, in whole or in part, expenditures associated with Eligible Green Projects as described in the Granite Green Bond Framework, which is available on Granite’s website.
On August 30, 2021 Granite also entered into a cross currency interest rate swap to exchange the Canadian dollar denominated principal and interest payments of the 2028 Debentures for US dollar denominated payments, resulting in an effective fixed interest rate of 2.096% for the seven year term (see “LIQUIDITY AND CAPITAL RESOURCES — Debt Structure — Unsecured Debt and Cross Currency Interest Rate Swaps”).
Renewal of Base Shelf Prospectus
On October 4, 2021, Granite filed and obtained a receipt for new base shelf prospectuses for both equity and debt securities (the “Shelf Prospectuses”). Granite has filed the Shelf Prospectuses to maintain financial flexibility and to have the ability to offer securities and debt on an accelerated basis pursuant to the filing of prospectus supplements. There is no certainty any securities or debt will be offered or sold under the Shelf Prospectuses.
The Shelf Prospectuses are valid for a 25-month period, during which time Granite may offer and issue, from time to time, stapled units, stapled convertible debentures, stapled subscription receipts, stapled warrants, units or any combination thereof, having an aggregate offering price of up to $1.5 billion or debt securities having an aggregate offering price of up to $1.75 billion.
Each offering under the Shelf Prospectuses will require the filing of a prospectus supplement that will include the specific terms of the securities being offered at that time.
10 Granite REIT 2021 Third Quarter Report
Table of Contents
ATM Program
On November 3, 2021, Granite is filing a prospectus supplement (the “Prospectus Supplement”) to the Shelf Prospectus of Granite Real Estate Investment Trust and Granite REIT Inc. establishing
an equity at-the-market equity distribution program (the “ATM Program”), in each of the provinces and territories of Canada, that allows it to issue and sell, at its discretion, up to $250.0 million of stapled units to the public, from time to time. Stapled units sold under the ATM Program will be sold at the prevailing market prices at the time of sale when issued, directly through the facilities of the Toronto Stock Exchange (“TSX”) or any other recognized marketplace upon which the stapled units are listed or quoted or where the stapled units are traded in Canada. Granite intends to use the net proceeds from the ATM Program, if any, to fund potential future acquisitions, development activity, and for general trust purposes.
Increase in Distributions
On November 3, 2021, Granite increased its targeted annualized distribution by 3.3% to $3.10 ($0.2583 cents per month) per stapled unit from $3.00 ($0.2500 cents per month) per stapled unit to be effective upon the declaration of the distribution in respect of the month of December 2021 and payable in mid-January 2022.
| BUSINESS OVERVIEW AND STRATEGIC OUTLOOK |
Business Overview
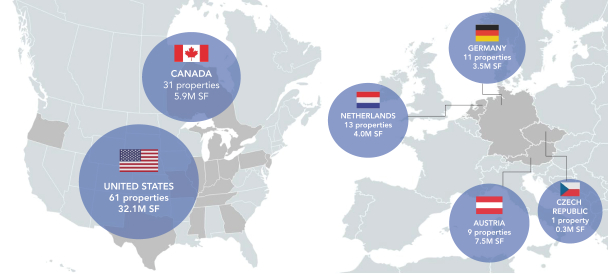
Granite is a Canadian-based real estate investment trust (“REIT”) engaged in the acquisition, development, ownership and management of logistics, warehouse and industrial properties in North America and Europe. As at November 3, 2021, excluding assets held for sale, Granite owns 126 investment properties in six countries having approximately 53.3 million square feet of gross leasable area. Granite has a highly-integrated team of real estate professionals with extensive experience in operations, leasing, development, investment and asset management located at its head office in Toronto, Canada and regional offices in Dallas, U.S.A; Vienna, Austria; and Amsterdam, Netherlands.
Granite REIT 2021 Third Quarter Report 11
Table of Contents
Granite’s investment properties consist of income-producing properties, properties under development and land held for development (see “INVESTMENT PROPERTIES”). The income-producing properties consist primarily of logistics, e-commerce and distribution warehouse, light industrial and heavy industrial manufacturing properties. Lease payments are primarily denominated in three currencies: the Canadian dollar (“$”), the Euro (“€”) and the US dollar (“US$”). Granite’s investment properties (excluding assets held for sale) by geographic location, property count and square footage as at November 3, 2021 are summarized below:
Investment Properties Summary
Six countries/126 properties/53.3 million square feet
|
Strategic Outlook
Management continues to identify and pursue value creation and investment opportunities that management believes will generate superior long-term total returns for unitholders.
Granite’s long-term strategy is to continue to build an institutional quality and globally diversified industrial real estate business; to grow and diversify its asset base through acquisitions, development, re-development and dispositions; to maintain a conservative balance sheet; and to reduce its exposure to its largest tenant, Magna International Inc. and its operating subsidiaries (collectively, “Magna”) and the special purpose properties (see “INVESTMENT PROPERTIES”).
Granite has positioned itself financially to execute on its strategic plan including to capitalize on a strong pipeline of acquisition and existing and future development opportunities within its targeted geographic footprint.
As Granite looks to the remainder of 2021, its priorities are set out below:
| • | Continue to grow in its target markets in North America and Europe primarily through property and portfolio acquisitions as well as through the development of modern logistics and e-commerce assets and selective joint venture arrangements; |
| • | Grow net asset value as well as FFO and AFFO per unit through active asset management; |
| • | Pursue development and expansion opportunities within the existing portfolio; |
| • | Maintain conservative capital ratios providing balance sheet flexibility and liquidity; |
12 Granite REIT 2021 Third Quarter Report
Table of Contents
| • | Continue to expand and enhance Granite’s global platform; and |
| • | Further integrate Granite’s Environmental, Social, Governance and Resilience (ESG+R) principles into investment and management processes and continue to implement strategic initiatives to enhance its ESG+R Program. |
| ENVIRONMENTAL, SOCIAL, GOVERNANCE, AND RESILIENCE (ESG+R) |
Granite recognizes the important role building owners can play in fostering the efficient use of resources and respecting our environment. As a good steward for investors, Granite seeks to practically incorporate sustainability in its actions and decision-making process, while generating returns for unitholders.
Consistent with this principle, Granite applies the following long-term ESG+R objectives in its business:
| Environmental | Social | Governance | Resilience | |||
| Promote efficiency and sustainable practices at both our properties and our corporate offices | Engage with our investors, employees, tenants, property managers, and community | Disclose our ESG+R performance as a commitment to transparency and accountability | Identify and mitigate potential climate-related risks within our portfolio |
Granite’s ESG+R program is aligned with INREV1, GRESB2, GRI3 and UNPRI4. Data provided herein has been reviewed by a third party ESG+R consultant and represents a snapshot of current performance.
GRESB
|  | |
|  | |


GRESB assesses and scores the Environmental, Social, and Governance (ESG) performance of real estate portfolios around the world and this year increased to over 1,500 participants. Granite completed its second annual GRESB Real Estate Assessment in June 2021.
Granite ranked 1st out of 10 in the North America Industrial GRESB public disclosure group which evaluates the level of ESG disclosure by listed property companies and REITs. Granite also achieved 3rd, and was sole Canadian entity, in the North American Industrial Listed GRESB peer group for Standing Investments with a score of 65.
| 1 | European Association for Investors in Non-Listed Real Estate Vehicles |
| 2 | Global Real Estate Sustainability Benchmarking |
| 3 | Global Reporting Initiative |
| 4 | United Nations’ Principles for Responsible Investing |
Granite REIT 2021 Third Quarter Report 13
Table of Contents
Below is a selection of key actions and performance items of Granite’s ESG+R Program:
Environmental – Actions & Performance
| • | Work to reduce the amount of landlord-controlled energy, operational emissions (scope 1 and 2), and water by 25% by 2030 (or 2.5% annual reduction) at Granite’s assets5; |
| • | Strategically evaluate and pursue applicable green building certifications at Granite’s properties and achieve 30% third-party green building certifications by floor area by 2030; and |
| • | Commit that all development projects controlled by Granite will be built to standards consistent with the scope of Granite’s Green Bond Framework and certify 100% of new developments to a third-party green building certification standard (such as LEED, BREEAM, Green Globes, DGNB). |
Property | Size (sq ft) in millions | Region | Certification Type | Level | ||||||
15 Commerce Pkwy. | 1.3 | USA | LEED New Construction and Major Renovation | Certified | ||||||
100 Clyde Alexander Lane | 0.7 | USA | LEED Core and Shell Development | Certified | ||||||
101 Clyde Alexander Lane | 0.3 | USA | LEED Core and Shell Development | Certified | ||||||
1201 Allpoints Court | 0.5 | USA | Green Globes New Construction | 2 Green Globes | ||||||
1243 Gregory Dr. | 0.5 | USA | LEED Core and Shell Development | Silver | ||||||
2100 Center Square Rd. | 0.4 | USA | LEED Core and Shell Development | Silver | ||||||
3501 North Lancaster Hutchins Rd. | 0.2 | USA | LEED New Construction and Major Renovation | Silver | ||||||
8735 South Crossroads Dr. | 0.9 | USA | LEED Core and Shell Development | Certified | ||||||
Aquamarijnweg 2 & 4, Bleiswijk | 0.2 | Netherlands | BREEAM New construction | Very Good | ||||||
De Kroonstrat 1 (Phase 1), De Poosthoornstraat 2 (Phase 2) | 0.5 | Netherlands | BREEAM New construction | Excellent | ||||||
Francis Baconstraat 4 | 0.1 | Netherlands | BREEAM New construction | Very Good | ||||||
Oude Graaf 15 | 0.2 | Netherlands | BREEAM New construction | Excellent | ||||||
Social – Actions & Performance
| • | Granite administered its 2021 Employee Engagement Survey in April 2021 to gain an understanding of employee engagement and the effectiveness of its workplace practices; |
| • | In 2021, Granite will be sending a survey to tenants to gauge satisfaction levels and identify opportunities for improvement; |
| • | Granite established a return to office policy allowing for the safe return of its employees to the workplace while providing enhanced work from home flexibility during the work week; and |
| • | Beehives have been installed at two assets, one in 2020 and one in 2021, to promote local biodiversity and engagement with our tenants. |
Governance – Actions & Performance
| • | Provide leadership over Granite’s ESG+R Program through the Granite ESG+R Committee; |
| • | Provide transparency to investors by incorporating ESG+R into regular updates to unitholders and stakeholders and through formal reporting frameworks such as GRESB, Sustainability Accounting Standards Board (SASB), Climate Disclosure Project (CDP), and GRI; |
| • | Granite completed its inaugural CDP submission in July 2021; |
| • | Granite’s 2020 ESG Overview was released in June 2020. The 2021 Sustainability Report issued August 4, 2021; and |
| • | Monitor asset compliance with government benchmarking requirements and ESG+R-related regulations. |
| 5 | Granite’s emissions reduction targets are aligned with the Paris Accord goal of limiting global warming to two degrees Celsius above pre-industrial levels. |
14 Granite REIT 2021 Third Quarter Report
Table of Contents
Resilience – Actions & Performance
| • | Aligning Granite’s resilience program with the Task Force on Climate-Related Financial Disclosures (TCFD) framework; |
| • | Assess physical and transition climate-change risks during the new acquisition due diligence process and evaluate measures to increase resiliency in our underwriting process; and |
| • | Granite uses the integrated Measurabl Four Twenty Seven (427) platform to provide climate risk analytics for each asset with 1-100 risk scores in seven categories of climate related risks – sea level rise, floods, hurricanes, heat stress, water stress, wildfires, and earthquakes. |
| RESULTS OF OPERATIONS |
Net Income
The following is a summary of financial information from the unaudited condensed combined statements of net income for the three and nine months ended September 30, 2021 and 2020, respectively:
Net Income |
Three Months Ended | Nine Months Ended September 30, | |||||||||||||||||||||||
| (in millions, except as noted) | 2021 | 2020 | $ change | 2021 | 2020 | $ change | ||||||||||||||||||
Rental revenue | $ | 98.3 | $ | 87.9 | 10.4 | $ | 288.2 | $ | 247.0 | 41.2 | ||||||||||||||
Revenue | 98.3 | 87.9 | 10.4 | 288.2 | 247.0 | 41.2 | ||||||||||||||||||
Property operating costs | 13.8 | 11.4 | 2.4 | 41.8 | 31.4 | 10.4 | ||||||||||||||||||
Net operating income | 84.5 | 76.5 | 8.0 | 246.4 | 215.6 | 30.8 | ||||||||||||||||||
General and administrative expenses | 8.9 | 9.6 | (0.7 | ) | 26.0 | 24.3 | 1.7 | |||||||||||||||||
Depreciation and amortization | 0.3 | 0.3 | — | 1.1 | 0.8 | 0.3 | ||||||||||||||||||
Interest income | (0.9 | ) | (0.5 | ) | (0.4 | ) | (2.2 | ) | (1.8 | ) | (0.4 | ) | ||||||||||||
Interest expense and other financing costs | 10.7 | 10.6 | 0.1 | 35.1 | 25.0 | 10.1 | ||||||||||||||||||
Foreign exchange gains, net | (1.2 | ) | (0.3 | ) | (0.9 | ) | (3.0 | ) | (3.0 | ) | — | |||||||||||||
Fair value gains on investment properties, net | (432.2 | ) | (62.1 | ) | (370.1 | ) | (949.8 | ) | (132.6 | ) | (817.2 | ) | ||||||||||||
Fair value losses (gains) on financial instruments, net | 1.3 | (1.0 | ) | 2.3 | 1.8 | 4.7 | (2.9 | ) | ||||||||||||||||
Loss on sale of investment properties, net | — | 0.2 | (0.2 | ) | 0.6 | 0.2 | 0.4 | |||||||||||||||||
Income before income taxes | 497.6 | 119.7 | 377.9 | 1,136.8 | 298.0 | 838.8 | ||||||||||||||||||
Income tax expense | 75.8 | 14.5 | 61.3 | 167.8 | 35.7 | 132.1 | ||||||||||||||||||
Net income | $ | 421.8 | $ | 105.2 | 316.6 | $ | 969.0 | $ | 262.3 | 706.7 | ||||||||||||||
Net income attributable to: | ||||||||||||||||||||||||
Stapled unitholders | 421.8 | 105.2 | 316.6 | 968.8 | 262.2 | 706.6 | ||||||||||||||||||
Non-controlling interests | — | — | — | 0.2 | 0.1 | 0.1 | ||||||||||||||||||
| $ | 421.8 | $ | 105.2 | 316.6 | $ | 969.0 | $ | 262.3 | 706.7 | |||||||||||||||
Granite REIT 2021 Third Quarter Report 15
Table of Contents
Foreign Currency Translation
The majority of Granite’s investment properties are located in Europe and the United States and the cash flows derived from such properties are primarily denominated in Euros and US dollars. Accordingly, fluctuations in the Canadian dollar, Granite’s reporting currency, relative to the Euro and US dollar will result in fluctuations in the reported values of revenues, expenses, cash flows, assets and liabilities. The most significant foreign currency exchange rates that impact Granite’s business are summarized in the following table:
| Average Exchange Rates | Period End Exchange Rates | |||||||||||||||||||||||||||||||||||||||
| Three Months Ended September 30, | Nine Months Ended September 30, | September 30, | December 31, | |||||||||||||||||||||||||||||||||||||
| 2021 | 2020 | Change | 2021 | 2020 | Change | 2021 | 2020 | Change | ||||||||||||||||||||||||||||||||
$ per €1.00 | 1.485 | 1.558 | (5%) | 1.496 | 1.521 | (2%) | 1.467 | 1.560 | (6%) | |||||||||||||||||||||||||||||||
$ per US$1.00 | 1.260 | 1.332 | (5%) | 1.251 | 1.354 | (8%) | 1.267 | 1.275 | (1%) | |||||||||||||||||||||||||||||||
For the three and nine months ended September 30, 2021 compared to the prior year periods, the average exchange rates of the Euro and US dollar relative to the Canadian dollar were lower, which on a comparative basis, decreased the Canadian dollar equivalent of revenue and expenses from Granite’s European and US operations.
The period end exchange rates of the Euro and the US dollar relative to the Canadian dollar on September 30, 2021 were lower when compared to the December 31, 2020 exchange rates. As a result, the Canadian dollar equivalent of assets and liabilities from Granite’s European and US operations were lower when compared to December 31, 2020.
On a net basis, the effect of the changes in exchange rates on Granite’s operating results for the three and nine months ended September 30, 2021 was as follows:
Effects of Changes in Exchange Rates on Operating Results |
| Three Months Ended September 30, | Nine Months Ended September 30, | |||||||
(in millions, except per unit information) | 2021 vs 2020 | 2021 vs 2020 | ||||||
Decrease in revenue |
| $(4.5) |
|
| $(13.4) |
| ||
Decrease in NOI — cash basis |
| (5.1) |
|
| (16.0) |
| ||
Decrease in net income |
| (14.9) |
|
| (42.8) |
| ||
Decrease in FFO |
| (3.1) |
|
| (9.8) |
| ||
Decrease in AFFO |
| (2.9) |
|
| (9.2) |
| ||
Decrease in FFO per unit |
| $(0.05) |
|
| $(0.15) |
| ||
Decrease in AFFO per unit |
| $(0.04) |
|
| $(0.15) |
| ||
16 Granite REIT 2021 Third Quarter Report
Table of Contents
Operating Results
Revenue
Revenue |
| Three Months Ended September 30, | Nine Months Ended September 30, | |||||||||||||||||||||||||||
| 2021 | 2020 | $ change | 2021 | 2020 | $ change | |||||||||||||||||||||||
Rental revenue and amortization(1) | $ | 85.2 | $ | 77.0 | 8.2 | $ | 247.6 | $ | 217.1 | 30.5 | ||||||||||||||||||
Tenant recoveries | 13.1 | 10.9 | 2.2 | 40.6 | 29.9 | 10.7 | ||||||||||||||||||||||
Revenue | $ | 98.3 | $ | 87.9 | 10.4 | $ | 288.2 | $ | 247.0 | 41.2 | ||||||||||||||||||
| (1) | Rental revenue and amortization include base rent, straight-line rent amortization and tenant incentive amortization. |
Revenue for the three month period ended September 30, 2021 increased by $10.4 million to $98.3 million from $87.9 million in the prior year period. The components contributing to the change in revenue are detailed below:
Q3 2021 vs Q3 2020 Change in Revenue |
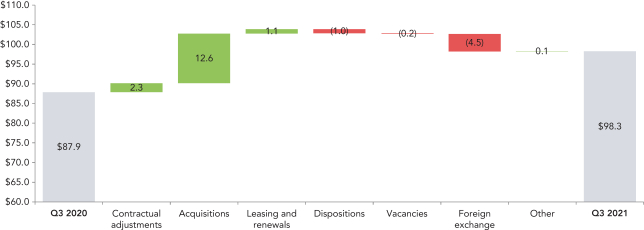
Additional details pertaining to the components of the change in revenue are as follows:
| • | contractual rent adjustments included $0.5 million from consumer price index based increases and $1.8 million from fixed contractual adjustments related to rent escalations; |
| • | the acquisitions of properties located in the United States, Canada and the Netherlands beginning in the third quarter of 2020 increased revenue by $12.6 million, which included $1.7 million of tenant recoveries; |
| • | revenue increased by $1.1 million due to various renewal and re-leasing activities for properties primarily in Canada and the United States; |
| • | the sale of properties located in Canada, Spain, Austria and the United Kingdom during 2020 and 2021 decreased revenue by $1.0 million; and |
| • | foreign exchange had a net $4.5 million negative impact as the relative strengthening of the Canadian dollar against the Euro and US dollar decreased revenue by $1.6 million and $2.9 million, respectively. |
Granite REIT 2021 Third Quarter Report 17
Table of Contents
Revenue for the nine month period ended September 30, 2021 increased by $41.2 million to $288.2 million from $247.0 million in the prior year period. The components contributing to the change in revenue are detailed below:
Q3 2021 YTD vs Q3 2020 YTD Change in Revenue |
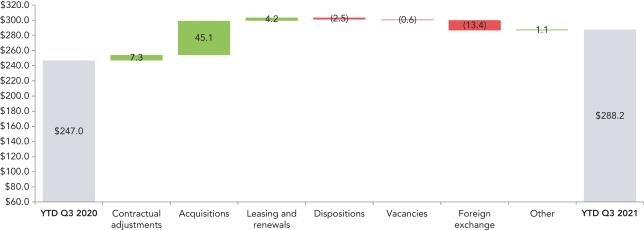
Additional details pertaining to the components of the change in revenue are as follows:
| • | contractual rent adjustments included $1.0 million from consumer price index based increases and $6.3 million from fixed contractual adjustments related to rent escalations; |
| • | the acquisitions of properties located in the United States, Canada and the Netherlands during 2020 and 2021 increased revenue by $45.1 million, which included $7.2 million of tenant recoveries; |
| • | revenue increased by $4.2 million due to various renewal and re-leasing activities for properties primarily in Canada and the United States; |
| • | the sale of properties located in Canada, Spain, Austria and the United Kingdom during 2020 and 2021 decreased revenue by $2.5 million; and |
| • | foreign exchange had a net $13.4 million negative impact as the relative strengthening of the Canadian dollar against the Euro and US dollar decreased revenue by $1.6 million and $11.8 million, respectively. |
18 Granite REIT 2021 Third Quarter Report
Table of Contents
Revenue by major currency for the three and nine month periods ended September 30, 2021 and 2020 was as follows:
Revenue by Currency |
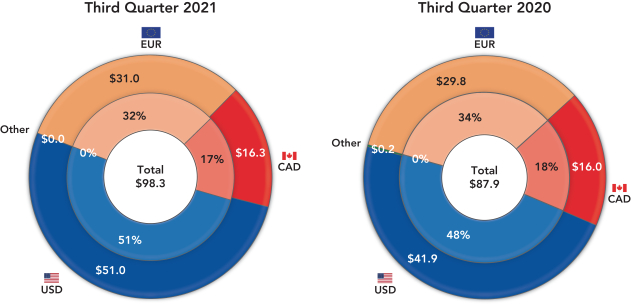
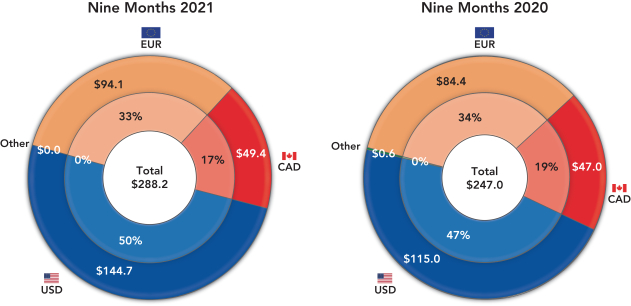
As a majority of the Trust’s revenue is denominated in currencies other than the Canadian dollar, Granite uses derivative financial instruments, including cross currency interest rate swaps, forward currency contracts and foreign exchange collars, to partially hedge its exposure to foreign currencies and reduce the potential impact that foreign currency rate changes may have on Granite’s operating results, cash flows and distributions (see “LIQUIDITY AND CAPITAL RESOURCES — Debt Structure”).
Granite REIT 2021 Third Quarter Report 19
Table of Contents
Net Operating Income
Net operating income (“NOI”) in the three months ended September 30, 2021 was $84.5 million compared to $76.5 million during the three months ended September 30, 2020. NOI in the nine months ended September 30, 2021 was $246.4 million compared to $215.6 million in the nine months ended September 30, 2020. NOI — cash basis excludes the impact of lease termination, close-out fees, straight-line rent and tenant incentive amortization and reflects the cash generated by the income-producing properties excluding lease termination and close-out fees on a period-over-period basis. NOI — cash basis was $83.6 million in the three months ended September 30, 2021 compared with $74.5 million in the prior year period, an increase of 12.2%. NOI — cash basis was $243.2 million in the nine months ended September 30, 2021 compared with $213.2 million in the prior year period, an increase of 14.1%.
Same property NOI — cash basis refers to the NOI — cash basis for those properties owned by Granite throughout the entire current and prior year periods under comparison. Same property NOI — cash basis excludes the impact of properties that were acquired, disposed and classified as held for sale, or properties under development during the periods under comparison. Same property NOI — cash basis in the three months ended September 30, 2021 was $72.7 million, compared with $72.4 million in the prior year period. The changes in same property are detailed below:
Same Property NOI
|
| Sq ft(1) (in millions) | Three Months Ended September 30, | Sq ft(1) (in millions) | Nine Months Ended September 30, | |||||||||||||||||||||||||||||||||||||
| 2021 | 2020 | $ change | % change | 2021 | 2020 | $ change | % change | |||||||||||||||||||||||||||||||||
Revenue | $ | 98.3 | $ | 87.9 | 10.4 | $ | 288.2 | $ | 247.0 | 41.2 | ||||||||||||||||||||||||||||||
Less: Property operating costs | 13.8 | 11.4 | 2.4 | 41.8 | 31.4 | 10.4 | ||||||||||||||||||||||||||||||||||
NOI | $ | 84.5 | $ | 76.5 | 8.0 | 10.5% | $ | 246.4 | $ | 215.6 | 30.8 | 14.3% | ||||||||||||||||||||||||||||
Add (deduct): | ||||||||||||||||||||||||||||||||||||||||
Straight-line rent amortization | (2.2 | ) | (3.3 | ) | 1.1 | (7.1 | ) | (6.3 | ) | (0.8 | ) | |||||||||||||||||||||||||||||
Tenant incentive amortization | 1.3 | 1.3 | — | 3.9 | 3.9 | — | ||||||||||||||||||||||||||||||||||
NOI — cash basis | 53.3 | $ | 83.6 | $ | 74.5 | 9.1 | 12.2% | 53.3 | $ | 243.2 | $ | 213.2 | 30.0 | 14.1% | ||||||||||||||||||||||||||
Less NOI — cash basis for: | ||||||||||||||||||||||||||||||||||||||||
Acquisitions | 9.4 | (10.2 | ) | (0.3 | ) | (9.9 | ) | 14.2 | (39.7 | ) | (5.7 | ) | (34.0 | ) | ||||||||||||||||||||||||||
Developments | — | — | — | — | 0.5 | (1.8 | ) | 0.1 | (1.9 | ) | ||||||||||||||||||||||||||||||
Dispositions and assets held for sale | 0.8 | (0.7 | ) | (1.8 | ) | 1.1 | 0.8 | (2.5 | ) | (5.5 | ) | 3.0 | ||||||||||||||||||||||||||||
Same property NOI — cash basis | 43.9 | $ | 72.7 | $ | 72.4 | 0.3 | 0.4% | 38.6 | $ | 199.2 | $ | 202.1 | (2.9 | ) | (1.4)% | |||||||||||||||||||||||||
Constant currency same property NOI — cash basis(2) | 43.9 | $ | 72.7 | $ | 69.3 | 3.4 | 5.0% | 38.6 | $ | 199.2 | $ | 194.1 | 5.1 | 2.6% | ||||||||||||||||||||||||||
| (1) | The square footage relating to the NOI — cash basis represents GLA of 53.3 million square feet as at September 30, 2021. The square footage relating to the same property NOI — cash basis represents the aforementioned GLA excluding the impact from the acquisitions, dispositions, assets held for sale, and developments during the relevant period. |
| (2) | Constant currency same property NOI — cash basis is calculated by converting the comparative same property NOI — cash basis at current foreign exchange rates. |
20 Granite REIT 2021 Third Quarter Report
Table of Contents
Property operating costs include recoverable and non-recoverable costs from tenants and consist of property taxes, utilities, insurance, repairs and maintenance, legal and other property-related expenses. Granite’s employee compensation expenses are excluded in property operating costs.
Straight-line rent amortization represents the scheduled fixed rent changes or rent-free periods in leases that are recognized in revenue evenly on a straight-line basis over the term of the lease. Tenant incentive amortization mainly represents allowances provided to tenants that are recognized in revenue evenly on a straight-line basis over the term of the lease and primarily comprises the amortization associated with the cash allowance incentives paid to Magna in respect of the 10-year lease extensions exercised during the 2014 year at the Thondorf and Eurostar properties in Graz, Austria.
NOI — cash basis for the three months ended September 30, 2021 increased by $9.1 million to $83.6 million from $74.5 million in the prior year period, representing an increase of 12.2%. NOI — cash basis for the nine months ended September 30, 2021 increased by $30.0 million to $243.2 million from $213.2 million in the prior year period, representing an increase of 14.1%. The increase in NOI — cash basis was largely a result of the increase in rental revenue as noted previously, partially offset by an increase in property operating costs primarily relating to the properties acquired in 2020 and 2021 to date.
Same property NOI — cash basis for the three months ended September 30, 2021 increased by $0.3 million (0.4%) to $72.7 million from $72.4 million primarily due to the increase in contractual rents arising from both consumer price index and fixed rent increases, re-leasing and renewals of various leases for properties primarily located in the United States, Canada and the Netherlands, and the expiry of free rent periods for certain assets, offset by the unfavourable foreign exchange impact from the strengthening of the Canadian dollar against the Euro and US dollar. Excluding the impact of foreign exchange, same property NOI — cash basis for the three month period ended September 30, 2021 increased by $3.4 million (5.0%) from the prior year period.
Same property NOI — cash basis for the nine months ended September 30, 2021 decreased $2.9 million (1.4%) to $199.2 million from $202.1 million primarily due to the unfavourable foreign exchange impact from the strengthening of the Canadian dollar against the Euro and US dollar, partially offset by the increase in contractual rents arising from both consumer price index and fixed rent increases, re-leasing and renewals of various leases for properties primarily located in the United States, and Canada. Excluding the impact of foreign exchange, same property NOI — cash basis for the nine month period ended September 30, 2021 increased $5.1 million (2.6%) from the prior year period.
Granite REIT 2021 Third Quarter Report 21
Table of Contents
NOI — cash basis for the three and nine month periods ended September 30, 2021 and 2020 by geography was as follows:
NOI — Cash Basis by Geography
|
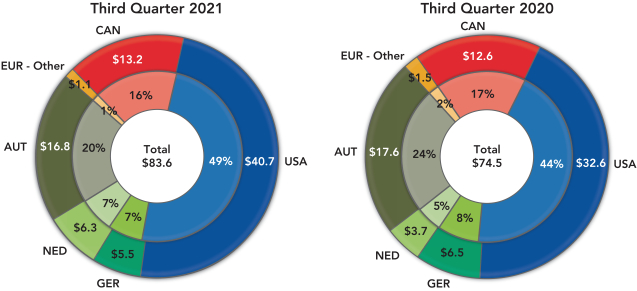
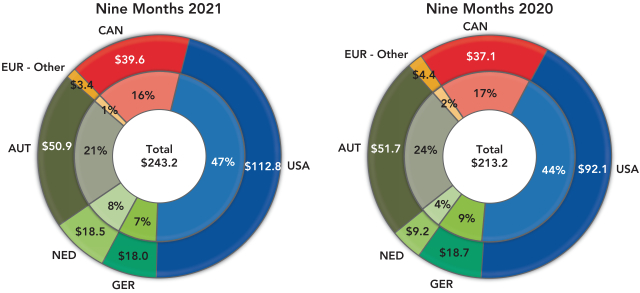
Granite’s property portfolio and NOI — cash basis are geographically diversified, which reduces the risk to Granite’s operating results from any particular country’s economic downturn.
22 Granite REIT 2021 Third Quarter Report
Table of Contents
Same property NOI — cash basis for the three and nine month periods ended September 30, 2021 and 2020 by geography was as follows:
Same Property NOI — Cash Basis by Geography
|
Three Months Ended September 30, | Nine Months Ended September 30, | |||||||||||||||||||||||||||
| 2021 | 2020 | % change | 2021 | 2020 | % change | |||||||||||||||||||||||
Canada | $ | 12.6 | $ | 12.0 | 5.0% | $ | 37.6 | $ | 35.7 | 5.2% | ||||||||||||||||||
United States | 33.2 | 32.7 | 1.8% | 83.6 | 87.5 | (4.4)% | ||||||||||||||||||||||
Austria | 16.5 | 17.0 | (3.0)% | 49.7 | 49.9 | (0.3)% | ||||||||||||||||||||||
Germany | 5.5 | 6.5 | (14.6)% | 18.0 | 18.7 | (4.0)% | ||||||||||||||||||||||
Netherlands | 4.2 | 3.5 | 18.9% | 8.2 | 8.2 | —% | ||||||||||||||||||||||
Europe — Other | 0.7 | 0.7 | (3.2)% | 2.1 | 2.1 | 0.1% | ||||||||||||||||||||||
Same Property NOI — cash basis | $ | 72.7 | $ | 72.4 | 0.4% | $ | 199.2 | $ | 202.1 | (1.4)% | ||||||||||||||||||
Constant currency same property NOI — cash basis for the three and nine month periods ended September 30, 2021 and 2020 by geography was as follows, which is calculated by converting the comparative same property NOI — cash basis at current foreign exchange rates:
Constant Currency Same Property NOI — Cash Basis by Geography
|
Three Months Ended September 30, | Nine Months Ended September 30, | |||||||||||||||||||||||||||
| 2021 | 2020 | % change | 2021 | 2020 | % change | |||||||||||||||||||||||
Canada | $ | 12.6 | $ | 12.0 | 5.0% | $ | 37.6 | $ | 35.7 | 5.2% | ||||||||||||||||||
United States | 33.2 | 30.9 | 7.6% | 83.6 | 80.8 | 3.5% | ||||||||||||||||||||||
Austria | 16.5 | 16.2 | 1.8% | 49.7 | 49.1 | 1.3% | ||||||||||||||||||||||
Germany | 5.5 | 6.2 | (10.4)% | 18.0 | 18.4 | (2.3)% | ||||||||||||||||||||||
Netherlands | 4.2 | 3.3 | 28.3% | 8.2 | 8.1 | 1.7% | ||||||||||||||||||||||
Europe — Other | 0.7 | 0.7 | 1.6% | 2.1 | 2.1 | 1.7% | ||||||||||||||||||||||
Constant Currency Same Property NOI — cash basis(1) | $ | 72.7 | $ | 69.3 | 5.0% | $ | 199.2 | $ | 194.2 | 2.6% | ||||||||||||||||||
| (1) | Constant currency same property NOI — cash basis is calculated by converting the comparative same property NOI — cash basis at current foreign exchange rates. |
Granite REIT 2021 Third Quarter Report 23
Table of Contents
General and Administrative Expenses
General and administrative expenses consisted of the following:
General and Administrative Expenses
| ||||||||||||
Three Months Ended September 30, | Nine Months Ended September 30, | |||||||||||||||||||||||||||
| 2021 | 2020 | $ change | 2021 | 2020 | $ change | |||||||||||||||||||||||
Salaries and benefits | $3.6 | $ | 4.1 | (0.5 | ) | $ | 12.2 | $ | 11.1 | 1.1 | ||||||||||||||||||
Audit, legal and consulting | 1.0 | 0.8 | 0.2 | 2.6 | 2.6 | — | ||||||||||||||||||||||
Trustee/director fees and related expenses | 0.4 | 0.4 | — | 1.2 | 1.0 | 0.2 | ||||||||||||||||||||||
Executive unit-based compensation expense including distributions | 1.2 | 1.5 | (0.3 | ) | 3.8 | 3.7 | 0.1 | |||||||||||||||||||||
Fair value remeasurement of trustee/director and executive unit-based compensation plans | 1.6 | 1.4 | 0.2 | 2.5 | 1.8 | 0.7 | ||||||||||||||||||||||
Other public entity costs | 0.4 | 0.5 | (0.1 | ) | 1.5 | 1.4 | 0.1 | |||||||||||||||||||||
Office rents including property taxes and common area maintenance costs | 0.1 | 0.1 | — | 0.3 | 0.3 | — | ||||||||||||||||||||||
Capital tax | 0.1 | 0.3 | (0.2 | ) | 0.4 | 0.6 | (0.2 | ) | ||||||||||||||||||||
Information technology | 0.4 | 0.3 | 0.1 | 1.3 | 0.8 | 0.5 | ||||||||||||||||||||||
Other | 0.3 | 0.2 | 0.1 | 0.6 | 1.0 | (0.4 | ) | |||||||||||||||||||||
| $9.1 | $ | 9.6 | (0.5 | ) | $ | 26.4 | $ | 24.3 | 2.1 | |||||||||||||||||||
Less: capitalized general and administrative expenses | (0.2 | ) | — | (0.2 | ) | (0.4 | ) | — | (0.4 | ) | ||||||||||||||||||
General and administrative expenses | $8.9 | $ | 9.6 | (0.7 | ) | $ | 26.0 | $ | 24.3 | 1.7 | ||||||||||||||||||
General and administrative expenses were $8.9 million for the three month period ended September 30, 2021 and decreased $0.7 million in comparison to the prior year period primarily as a result of the following:
| • | a decrease in salaries and benefits primarily due to a $1.1 million severance for a departed executive in the prior year period, partially offset by an increase in salaries and benefits expense due to additional employees in North America and Europe; |
| • | an increase in capitalized general administrative expenses related to an increase in development activity in the current year period; and |
| • | a decrease in executive unit-based compensation expense due to the accelerated vesting of awards for a departed executive in the prior year period, partially offset by; |
| • | an increase in audit, legal and consulting expenses due to consulting costs incurred in the current year period associated with ESG+R initiatives undertaken by Granite. |
24 Granite REIT 2021 Third Quarter Report
Table of Contents
General and administrative expenses were $26.0 million for the nine month period ended September 30, 2021 and increased $1.7 million in comparison to the prior year period primarily as a result of the following:
| • | an increase in salaries and benefits expense primarily due to additional employees as previously mentioned and an increase to incentive compensation paid in the current year period relating to the 2020 fiscal year, partially offset by the severance for a departed executive noted above; and |
| • | an increase in the fair value remeasurement associated with the trustee/director and executive unit-based compensation plans resulting from the increase in market price of the Trust’s stapled units in the current year period relative to the prior year, partially offset by; |
| • | an increase in capitalized general administrative expenses resulting from salaries and wages related to an increase in development activity in the current year period. |
Interest Income
Interest income for the three month period ended September 30, 2021 increased $0.4 million to $0.9 million from $0.5 million in the prior year period. Interest income for the nine month period ended September 30, 2021 increased $0.4 million to $2.2 million from $1.8 million in the prior year period. Both increases were due to higher invested cash balances on hand.
Interest Expense and Other Financing Costs
Interest expense and other financing costs for the three month period ended September 30, 2021 increased $0.1 million to $10.7 million from $10.6 million in the prior year period. The increase was related to higher interest costs resulting from the issuance of the 2028 Debentures in August 2021 and the 2030 Debentures in December 2020, partially offset by lower interest costs resulting from Granite LP’s redemption of the then outstanding $250.0 million aggregate principal amount of its 3.788% Series 2 senior debentures due July 5, 2021 (the “2021 Debentures”) on January 4, 2021.
Interest expense and other financing costs for the nine month periods ended September 30, 2021 and 2020 were $35.1 million and $25.0 million, respectively. The $10.1 million increase is primarily due to increased interest costs related to the issuance of the 2028 Debentures in August 2021, the 2027 Debentures in June 2020, the 2030 Debentures in December 2020, and the $4.0 million of early redemption premium incurred for the 2021 Debentures and $0.5 million of accelerated amortization of original financing costs related to the financing of Granite’s credit facility during the first quarter of 2021.
As at September 30, 2021, Granite’s weighted average cost of interest-bearing debt was 1.81% (September 30, 2020 — 2.16%) and the weighted average debt term-to-maturity was 5.8 years (September 30, 2020 — 4.5 years).
Foreign Exchange Gains and Losses, Net
Granite recognized net foreign exchange gains of $1.2 million and $0.3 million the three months ended September 30, 2021 and 2020, respectively. The $0.9 million increase in net foreign exchange gains is primarily due to foreign exchange gains from the settlement of foreign exchange collar contracts in the current year period, offset partially by the remeasurement of certain monetary assets and liabilities of the Trust that are denominated in US dollars and Euros as a result of the strengthening of the Canadian dollar against the US dollar and Euro.
Granite REIT 2021 Third Quarter Report 25
Table of Contents
Granite recognized net foreign exchange gains of $3.0 million and $3.0 million in the nine months ended September 30, 2021 and 2020, respectively.
Fair Value Gains and Losses on Investment Properties, Net
Net fair value gains on investment properties were $432.2 million and $62.1 million in the three months ended September 30, 2021 and 2020, respectively. In the three months ended September 30, 2021, net fair value gains of $432.2 million were primarily attributable to favourable changes in fair market rent assumptions as well as compression in discount and terminal capitalization rates for properties located in the Greater Toronto Area in Ontario, Canada (the “GTA”) and across the United States and Europe.
Net fair value gains on investment properties in the three months ended September 30, 2020 of $62.1 million were primarily attributable to favourable changes in leasing assumptions associated with fair market rent increases as well as compression in discount and terminal capitalization rates for properties located in the GTA and across the United States as well as compression in discount and terminal capitalization rates for certain of the Trust’s modern warehouse properties in Germany and the Netherlands, partially offset by an increase in discount rates for certain properties located in Austria due to market conditions and the nature of the tenants and properties in this jurisdiction.
Net fair value gains on investment properties were $949.8 million and $132.6 million in the nine months ended September 30, 2021 and 2020, respectively. In the nine months ended September 30, 2021, net fair value gains of $949.8 million were primarily attributable to various factors including i) favourable changes in leasing assumptions associated with fair market rent increases for properties located in Canada and the United States and ii) compression in discount and terminal capitalization rates for properties located in the GTA and across the United States and Europe resulting from the continued market demand for industrial real estate properties.
Net fair value gains on investment properties in the nine months ended September 30, 2020 of $132.6 million were attributable to various factors including i) an increase in fair value of an acquired property in Dallas, Texas as a result of market confirmation of capitalization rates favourable to initial acquisition metrics of the forward purchase for this modern e-commerce facility, ii) the favourable changes in leasing assumptions associated with fair market rent increases for properties located in Canada and the United States and iii) the increase in fair value of Granite’s developed property in Plainfield, Indiana as a result of executing a full building 10-year lease with a new tenant, partially offset by an increase in discount rates for properties located in Austria and Germany due to market conditions and the nature of the tenants and properties across these jurisdictions.
Fair Value Gains and Losses on Financial Instruments, Net
Fair value losses on financial instruments for the three month period ended September 30, 2021 were $1.3 million. The fair value gains on financial instruments for the three month period ended September 30, 2020 were $1.0 million. The fair value losses on financial instruments for the nine month periods ended September 30, 2021 and 2020 were $1.8 million and $4.7 million, respectively. The fair value losses on financial instruments for the three month period ended September 30, 2021 are related to the fair value movements of the 2024 Cross Currency Interest Rate Swap, offset by fair value losses on foreign exchange collar contracts. The fair value losses on financial instruments for the nine months ended September 30, 2021 are related to the net fair value gains of $0.3 million associated with the fair value movements of the 2021 Cross Currency
26 Granite REIT 2021 Third Quarter Report
Table of Contents
Interest Rate Swap and the 2024 Cross Currency Interest Rate Swap, offset by fair value losses on foreign exchange collar contracts. The fair value losses on financial instruments for the three and nine months ended September 30, 2020 are related to (i) the fair value change of the 2024 Cross Currency Interest Swap and (ii) unrealized losses on foreign exchange forward contracts, partially offset by fair value gains on foreign exchange collar contracts. These derivatives have not been designated in a hedging relationship and fair value changes are therefore recorded in the unaudited condensed statements of net income.
Loss on Sale of Investment Properties, Net
No properties were disposed of during the three month period ended September 30, 2021. The loss on sale of investment properties for the nine month period ended September 30, 2021 was $0.6 million and is primarily related to broker commissions and legal advisory costs associated with the disposition of the property in Weikersdorf, Austria on June 30, 2021 and the property in Redditch, United Kingdom disposed on January 28, 2021. The loss on sale of investment properties for the three and nine month periods ended September 30, 2020 was $0.2 million primarily related to broker commissions and legal and advisory costs associate with the dispositions of two properties in Canada on September 14, 2020.
Income Tax Expense
Income tax expense is comprised of the following:
Income Tax Expense |
| Three Months Ended September 30, | Nine Months Ended September 30, | |||||||||||||||||||||||||||
| 2021 | 2020 | $ change | 2021 | 2020 | $ change | |||||||||||||||||||||||
Foreign operations | $ | 1.9 | $ | 1.7 | 0.2 | $ | 5.4 | $ | 5.0 | 0.4 | ||||||||||||||||||
Related to sale of investment properties | — | — | — | 2.3 | — | 2.3 | ||||||||||||||||||||||
Other | 0.5 | 0.5 | — | 1.0 | 0.5 | 0.5 | ||||||||||||||||||||||
Current tax expense | 2.4 | 2.2 | 0.2 | 8.7 | 5.5 | 3.2 | ||||||||||||||||||||||
Deferred tax expense | 73.4 | 12.3 | 61.1 | 159.1 | 30.1 | 129.0 | ||||||||||||||||||||||
Income tax expense | $ | 75.8 | $ | 14.5 | 61.3 | $ | 167.8 | $ | 35.6 | 132.2 | ||||||||||||||||||
For the three months ended September 30, 2021, current tax expense increased compared to the prior year period primarily due to higher taxes in foreign jurisdictions from acquisitions.
For the nine months ended September 30, 2021, current tax expense increased compared to the prior year period primarily due to the sale of an asset in Austria and higher taxes in foreign jurisdictions from acquisitions, as well as the recognition of tax assets in Canada for taxation years that have gone statute barred during 2020; partially offset by the recognition of tax assets in Germany for taxation years that have gone statute barred during 2021 and the strengthening of the Canadian dollar as compared to prior year.
The increase in deferred tax expense for the three and nine months ended September 30, 2021 compared to the prior year periods was primarily due to an increase in fair value gains in jurisdictions in which deferred taxes are recorded.
Granite REIT 2021 Third Quarter Report 27
Table of Contents
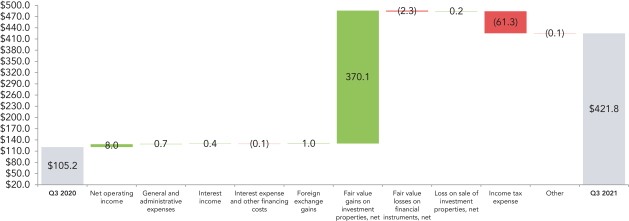
Net Income Attributable to Stapled Unitholders
For the three month period ended September 30, 2021, net income attributable to stapled unitholders was $421.8 million compared to $105.2 million in the prior year period. The increase in net income attributable to stapled unitholders was primarily due to a $370.1 million increase in fair value gains on investment properties and a $8.0 million increase in net operating income, partially offset by a $61.3 million increase in income tax expense. The period-over-period variance is further summarized below:
Q3 2021 vs Q3 2020 Change in Net Income Attributable to Stapled Unitholders
|
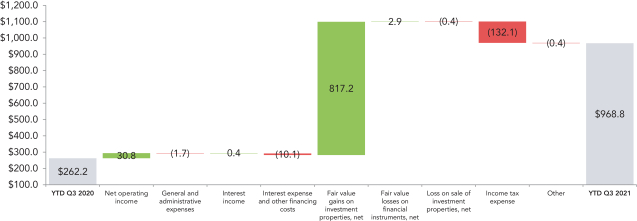
For the nine month period ended September 30, 2021, net income attributable to stapled unitholders was $968.8 million compared to $262.2 million in the prior year period. The increase in net income attributable to stapled unitholders was primarily due to a $817.2 million increase in fair value gains on investment properties and a $30.8 million increase in net operating income, partially offset by a $132.1 million increase in income tax expense and a $10.1 million increase in interest expense and other financing costs. The period-over-period variance is further summarized below:
Q3 2021 YTD vs Q3 2020 YTD Change in Net Income Attributable to Stapled Unitholders
|
28 Granite REIT 2021 Third Quarter Report
Table of Contents
Funds From Operations and Adjusted Funds From Operations
The reconciliation of net income attributable to stapled unitholders to FFO and AFFO for the three and nine months ended September 30, 2021 and 2020, respectively is presented below:
FFO and AFFO Reconciliation
|
| Three Months Ended | Nine Months Ended | |||||||||||||||||||||
| September 30, | September 30, | |||||||||||||||||||||
| (in millions, except per unit information) | 2021 | 2020 | 2021 | 2020 | ||||||||||||||||||
Net income attributable to stapled unitholders | $ | 421.8 | $ | 105.2 | $ | 968.8 | $ | 262.2 | ||||||||||||||
Add (deduct): | ||||||||||||||||||||||
Fair value gains on investment properties, net | (432.2 | ) | (62.1 | ) | (949.8 | ) | (132.6 | ) | ||||||||||||||
Fair value losses (gains) on financial instruments | 1.3 | (1.0 | ) | 1.8 | 4.7 | |||||||||||||||||
Loss on sale of investment properties | — | 0.2 | 0.6 | 0.2 | ||||||||||||||||||
Current income tax expense associated with the sale of investment properties | — | — | 2.3 | — | ||||||||||||||||||
Deferred income tax expense | 73.4 | 12.3 | 159.1 | 30.1 | ||||||||||||||||||
Fair value remeasurement expense relating to the Executive Deferred Stapled Unit Plan | 0.9 | 0.9 | 1.5 | 1.1 | ||||||||||||||||||
Non-controlling interests relating to the above | — | — | 0.2 | 0.1 | ||||||||||||||||||
FFO | [A] | $ | 65.2 | $ | 55.5 | $ | 184.5 | $ | 165.8 | |||||||||||||
Add (deduct): | ||||||||||||||||||||||
Maintenance or improvement capital expenditures incurred | (0.8 | ) | (0.2 | ) | (2.7 | ) | (3.2 | ) | ||||||||||||||
Leasing commissions incurred | (2.3 | ) | — | (2.5 | ) | (0.1 | ) | |||||||||||||||
Tenant allowances incurred | — | (0.6 | ) | (0.2 | ) | (0.6 | ) | |||||||||||||||
Tenant incentive amortization | 1.3 | 1.4 | 3.9 | 4.0 | ||||||||||||||||||
Straight-line rent amortization | (2.2 | ) | (3.4 | ) | (7.0 | ) | (6.3 | ) | ||||||||||||||
AFFO | [B] | $ | 61.2 | $ | 52.7 | $ | 176.0 | $ | 159.6 | |||||||||||||
Per unit amounts: | ||||||||||||||||||||||
Basic and diluted FFO per stapled unit | [A]/[C] and [A]/[D] | $ | 0.99 | $ | 0.96 | $ | 2.91 | $ | 2.98 | |||||||||||||
Basic and diluted AFFO per stapled unit | [B]/[C] and [B]/[D] | $ | 0.93 | $ | 0.91 | $ | 2.78 | $ | 2.87 | |||||||||||||
Basic weighted average number of stapled units | [C] | 65.7 | 57.8 | 63.4 | 55.6 | |||||||||||||||||
Diluted weighted average number of stapled units | [D] | 65.8 | 57.9 | 63.4 | 55.7 | |||||||||||||||||
Granite REIT 2021 Third Quarter Report 29
Table of Contents
Funds From Operations
FFO for the three month period ended September 30, 2021 was $65.2 million ($0.99 per unit) compared to $55.5 million ($0.96 per unit) in the prior year period. Included in the FFO for the third quarter of 2020 is $1.1 million of severance costs associated with the departure of an executive. Excluding this severance expense, FFO would have been $56.6 million ($0.98 per unit). The changes in the FFO components is summarized below:
Q3 2021 vs Q3 2020 Change in FFO
|

FFO for the nine month period ended September 30, 2021 was $184.5 million ($2.91 per unit) compared to $165.8 million ($2.98 per unit) in the prior year period. The changes in the FFO components is summarized below:
Q3 2021 YTD vs Q3 2020 YTD Change in FFO
|
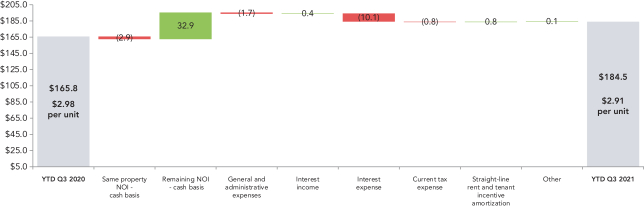
Included in FFO for the nine months ended September 30, 2021 is $4.0 million of early redemption premium related to the 2021 Debentures and $0.5 million of accelerated amortization of original financing costs related to the refinancing of Granite’s credit facility. Excluding these refinancing costs, FFO would be $189.0 million ($2.98 per unit).
FFO for the nine month period ended September 30, 2020 includes $1.1 million of severance costs associated with the departure of an executive. Excluding this severance expense, FFO would have been $166.9 million ($3.00 per unit).
30 Granite REIT 2021 Third Quarter Report
Table of Contents
AFFO for the three month period ended September 30, 2021 was $61.2 million ($0.93 per unit) compared to $52.7 million ($0.91 per unit) in the prior year period. Excluding the aforementioned severance of $1.1 million recognized in the third quarter of 2020, AFFO would have been $53.8 million ($0.93 per unit). The $8.5 million ($0.02 per unit) increase in AFFO is summarized below:
Q3 2021 vs Q3 2020 Change in AFFO |
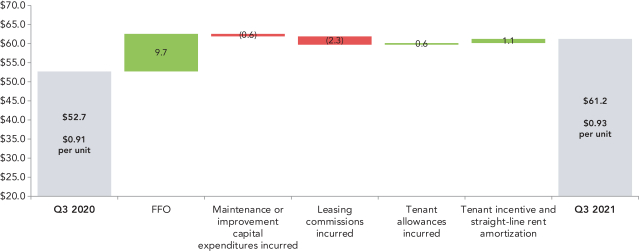
Additional details pertaining to the components of the change in AFFO are as follows:
| • | the $9.7 million increase in FFO, as noted previously; and |
| • | a $1.1 million decrease in tenant incentive and straight-line rent amortization, partially offset by; |
| • | a $2.3 million decrease in AFFO from higher leasing commissions incurred in the current year period resulting from a lease extension in the United States. |
Granite REIT 2021 Third Quarter Report 31
Table of Contents
AFFO for the nine month period ended September 30, 2021 was $176.0 million ($2.78 per unit) compared to $159.6 million ($2.87 per unit) in the prior year period. The $16.4 million increase and $0.09 per unit decrease in AFFO is summarized below:
Q3 2021 YTD vs Q3 2020 YTD Change in AFFO |
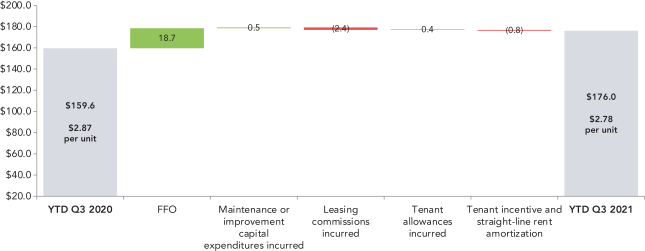
Additional details pertaining to the components of the change in AFFO are as follows:
| • | the $18.7 million increase in FFO, as noted previously, partially offset by; |
| • | a $2.4 million decrease in AFFO from higher leasing commissions incurred in the current year period resulting from a lease extension in the United States. |
Excluding the aforementioned refinancing costs of $4.5 million recognized in the nine month period ended September 30, 2021, AFFO would be $180.5 million ($2.85 per unit).
| INVESTMENT PROPERTIES |
Granite’s investment properties consist of income-producing properties, properties under development and land held for development. Substantially all of the income-producing properties are for industrial use and can be categorized as (i) distribution/e-commerce, (ii) industrial/warehouse, (iii) flex/office or (iv) special purpose properties designed and built with specialized features and leased to Magna. Granite’s categorization of income-producing properties has been updated in 2021 to reflect how management characterizes its properties in light of Granite’s recent growth and transformation of its portfolio towards logistics, e-commerce and distribution/warehouse facilities.
The attributes of the income-producing properties are versatile and are based on the needs of the tenant such that an industrial property used by a certain tenant for light or heavy manufacturing can be used by another tenant for other industrial uses after some retrofitting if necessary. Accordingly, the investment property portfolio is substantially for industrial use and, as such, Granite determined that its asset class comprises industrial properties for purposes of financial reporting. The fair value of the industrial properties, as noted below, is based upon the current tenanting, existing use and attributes of such properties.
Properties under development are comprised of (i) 89.0 acre greenfield site in Houston, Texas for which construction is underway on three modern industrial buildings (two speculative and one pre-leased) totaling 1.4 million square feet and are expected to be completed between the
32 Granite REIT 2021 Third Quarter Report
Table of Contents
second quarter of 2022 and fourth quarter of 2022, (ii) a 13.0 acre site in Altbach, Germany where construction of a 0.3 million square foot distribution/light industrial facility is underway and is expected to be completed in the first quarter of 2022, (iii) 36.0 acre site in Fort Worth, Texas where vertical construction of a 0.6 million square foot, 36’ clear, state-of-the-art distribution/e-commerce facility with completion expected in the second quarter of 2022, (iv) a 51.0 acre greenfield site in Murfreesboro, Tennessee, where vertical construction of a 0.8 million square foot modern distribution facility is underway with an expected completion date in the third quarter of 2022 and (v) a 39.0 acre site acquired by Granite on September 8, 2021 in Lebanon, Tennessee, where construction of three modern industrial buildings totaling 0.5 million square feet is expected to be completed in the fourth quarter of 2022.
Land held for development comprises the remaining 101.0 acres of land in Houston, Texas held for the future development of up to a 2.7 million square foot multi-phased business park capable of accommodating buildings ranging from 0.3 million to 1.3 million square feet (of which 1.4 million square feet is underway as noted above), 12.9 acres of development land in West Jefferson, Ohio and a 92.2 acre parcel of land in Brantford, Ontario, acquired by Granite on August 16, 2021, for the development of a multi-phased business park comprising a total of approximately 1.7 million square feet of modern distribution and logistics space.
Summary attributes of the investment properties as at September 30, 2021 and December 31, 2020 are as follows:
Investment Properties Summary |
| As at September 30, 2021 and December 31, 2020 | 2021 | 2020 | ||||||
(in millions, except as noted) | ||||||||
Investment properties — fair value | $ | 7,286.3 | $ | 5,855.6 | ||||
Income-producing properties | 7,097.9 | 5,786.3 | ||||||
Properties under development | 109.5 | 31.5 | ||||||
Land held for development | 78.9 | 37.8 | ||||||
Overall capitalization rate(1) | 4.77% | 5.61% | ||||||
Number of investment properties | 126 | 115 | ||||||
Income-producing properties | 114 | 108 | ||||||
Properties under development | 9 | 3 | ||||||
Land held for development | 3 | 4 | ||||||
Property metrics | ||||||||
GLA, square feet | 53.3 | 49.5 | ||||||
Occupancy, by GLA | 99.2% | 99.6% | ||||||
Weighted average lease term in years, by square footage | 5.8 | 6.3 | ||||||
Total number of tenants | 117 | 86 | ||||||
Magna as a percentage of annualized revenue(2) | 31% | 36% | ||||||
Magna as a percentage of GLA | 24% | 27% | ||||||
| (1) | Overall capitalization rate pertains only to income-producing properties. |
| (2) | Annualized revenue for each period presented is calculated as rental revenue excluding tenant recoveries, recognized in accordance with IFRS, in the reported month multiplied by 12 months. Annualized revenue excludes revenue from properties classified as assets held for sale. |
Granite REIT 2021 Third Quarter Report 33
Table of Contents
Assets Held for Sale(1) |
| As at September 30, 2021 and December 31, 2020 | 2021 | 2020 | ||||||
(in millions, except as noted) | ||||||||
Assets held for sale | ||||||||
Fair value | $ | 43.2 | $ | — | ||||
Number of properties | 3 | — | ||||||
GLA, square feet | 0.3 | — | ||||||
Magna as a percentage of GLA | —% | —% | ||||||
Annualized revenue | $ | 2.8 | $ | — | ||||
| (1) | Assets held for sale are excluded from investment properties and related property metrics. Accordingly, three such assets that were held for sale as at September 30, 2021 were excluded from investment properties and related property metrics as at September 30, 2021 throughout this MD&A. |
Granite has a high-quality global portfolio of large-scale properties strategically located in Canada, the United States and Europe. The fair value of the investment properties by country as at September 30, 2021 and December 31, 2020 was as follows:
Fair Value of Investment Properties by Geography(1) |
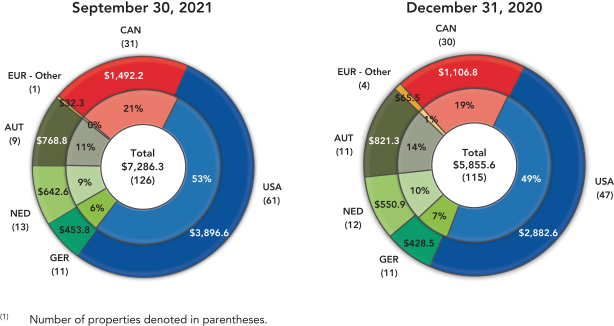
34 Granite REIT 2021 Third Quarter Report
Table of Contents
The change in the fair value of investment properties by geography during the nine months ended September 30, 2021 was as follows:
Change in Fair Value of Investment Properties by Geography
|
| January 1, 2021 | Acquisitions | Costs to complete acquired properties | Dispositions | Capital and leasing expenditures | Developments and expansion | Transfers(1) | Other | Fair value gains | Foreign Exchange | Classified as assets held for sale | September 30, 2021 | |||||||||||||||||||||||||||||||||||||
Income-Producing Properties | ||||||||||||||||||||||||||||||||||||||||||||||||
Canada | $ | 1,106.7 | $ | — | $ | — | $ | — | $ | 0.8 | $ | 6.4 | $ | — | $ | 0.8 | $ | 315.3 | $ | — | $ | — | $ | 1,430.0 | ||||||||||||||||||||||||
USA | 2,833.0 | 466.7 | 8.3 | — | 4.1 | — | — | 5.7 | 488.7 | (2.8 | ) | — | 3,803.7 | |||||||||||||||||||||||||||||||||||
Austria | 821.0 | — | — | (13.2 | ) | 0.1 | — | — | (3.6 | ) | 25.3 | (48.5 | ) | (12.3 | ) | 768.8 | ||||||||||||||||||||||||||||||||
Germany | 412.6 | — | — | — | 1.5 | — | — | 0.3 | 30.9 | (24.8 | ) | — | 420.5 | |||||||||||||||||||||||||||||||||||
Netherlands | 551.0 | 45.6 | — | — | 0.1 | (0.3 | ) | — | 0.4 | 80.2 | (34.4 | ) | — | 642.6 | ||||||||||||||||||||||||||||||||||
Other Europe | 62.0 | — | — | (10.6 | ) | — | — | — | (0.1 | ) | 11.0 | (2.6 | ) | (27.4 | ) | 32.3 | ||||||||||||||||||||||||||||||||
| 5,786.3 | 512.3 | 8.3 | (23.8 | ) | 6.6 | 6.1 | — | 3.5 | 951.4 | (113.1 | ) | (39.7 | ) | 7,097.9 | ||||||||||||||||||||||||||||||||||
Properties Under Development | ||||||||||||||||||||||||||||||||||||||||||||||||
USA | 15.6 | 24.1 | — | — | 3.3 | 15.9 | 16.8 | — | (0.3 | ) | 0.8 | — | 76.2 | |||||||||||||||||||||||||||||||||||
Germany | 15.9 | — | — | — | — | 18.7 | — | — | — | (1.3 | ) | — | 33.3 | |||||||||||||||||||||||||||||||||||
| 31.5 | 24.1 | — | — | 3.3 | 34.6 | 16.8 | — | (0.3 | ) | (0.5 | ) | — | 109.5 | |||||||||||||||||||||||||||||||||||
Land Held for Development | ||||||||||||||||||||||||||||||||||||||||||||||||
Canada | — | 63.7 | — | — | — | — | — | — | (1.5 | ) | — | — | 62.2 | |||||||||||||||||||||||||||||||||||
USA | 34.0 | — | — | — | — | — | (16.8 | ) | — | 0.2 | (0.7 | ) | — | 16.7 | ||||||||||||||||||||||||||||||||||
Other Europe | 3.8 | — | — | — | — | — | — | — | — | (0.3 | ) | (3.5 | ) | — | ||||||||||||||||||||||||||||||||||
| 37.8 | 63.7 | — | — | — | — | (16.8 | ) | — | (1.3 | ) | (1.0 | ) | (3.5 | ) | 78.9 | |||||||||||||||||||||||||||||||||
Total | $ | 5,855.6 | $ | 600.1 | $ | 8.3 | ($ | 23.8 | ) | $ | 9.9 | $ | 40.7 | $ | — | $ | 3.5 | $ | 949.8 | ($ | 114.6 | ) | ($ | 43.2 | ) | $ | 7,286.3 | |||||||||||||||||||||
| (1) | Transfers are related to the reclassification of land held for development in Fort Worth, Texas and Houston, Texas to properties under development during the first and third quarter of 2021, respectively. |
During the nine months ended September 30, 2021, the fair value of investment properties increased by $1,430.7 million primarily due to:
| • | net fair value gains of $949.8 million which were attributable to various factors including fair market rent increases as well as compression in discount and terminal capitalization rates for properties located in the GTA and across the United States and Europe; |
| • | the acquisitions of ten income-producing properties, four properties under development in the United States and the Netherlands and a parcel of land held for development in Canada for $593.2 million (see “SIGNIFICANT MATTERS — Property Acquisitions”); and |
| • | the additions of $40.7 million relating to expansion projects at two properties in Canada, a property under development in Altbach, Germany and four properties under development in the United States (see “SIGNIFICANT MATTERS — Construction, Development and Property Commitments)” partially offset by; |
| • | foreign exchange losses of $114.6 million resulting from the relative strengthening of the Canadian dollar against the US dollar and the Euro; |
| • | the classification of two income-producing properties and one parcel of land valued at $43.2 million as assets held for sale. These properties are classified as assets held for sale on the combined balance sheet and excluded from the investment properties categorization (see “SIGNIFICANT MATTERS — Assets Held for Sale”); and |
| • | the dispositions of two income-producing properties in the United Kingdom and Austria for $23.8 million (see “SIGNIFICANT MATTERS — Dispositions”). |
Granite REIT 2021 Third Quarter Report 35
Table of Contents
Fair values were primarily determined by discounting the expected future cash flows, generally over a term of 10 years, plus a terminal value based on the application of a capitalization rate to estimated year 11 cash flows. Granite measures its investment properties using valuations prepared by management. Granite does not measure its investment properties based on valuations prepared by external appraisers but uses such external appraisals as data points, together with other external market information accumulated by management, in arriving at its own conclusions on values. Management uses valuation assumptions such as discount rates, terminal capitalization rates and market rental rates applied in external appraisals or sourced from valuation experts; however, the Trust also uses its historical renewal experience with tenants, its direct knowledge of the specialized nature of Granite’s portfolio and tenant profile and its knowledge of the actual condition of the properties in making business judgments about lease renewal probabilities, renewal rents and capital expenditures. There has been no change in the valuation methodology used during the three and nine months ended September 30, 2021. The key valuation metrics for Granite’s investment properties including the discount and terminal capitalization rates by jurisdiction are summarized in note 4 to the unaudited condensed combined financial statements for the three and nine months ended September 30, 2021. In addition, valuation metrics for Granite’s income-producing properties by asset category and region as at September 30, 2021 and December 31, 2020 were as follows:
| Valuation Metrics by Asset Category | ||||||||||||||||||||
| Distribution/ E-Commerce | Industrial/ Warehouse | Special purpose properties | Flex/ Office | Total | ||||||||||||||||||||||||||||||||||||
| As at September 30, 2021 and December 31, 2020 | 2021 | 2020 | 2021 | 2020 | 2021 | 2020 | 2021 | 2020 | 2021 | 2020 | ||||||||||||||||||||||||||||||
Overall capitalization rate(1)(2) | 4.30% | 4.97% | 4.55% | 5.79% | 7.01% | 7.71% | 5.36% | 6.02% | 4.77% | 5.61% | ||||||||||||||||||||||||||||||
Terminal capitalization rate(1) | 4.84% | 5.44% | 5.13% | 5.96% | 6.45% | 6.87% | 6.27% | 6.93% | 5.16% | 5.82% | ||||||||||||||||||||||||||||||
Discount rate(1) | 5.40% | 5.89% | 5.85% | 6.69% | 7.38% | 7.77% | 6.88% | 7.30% | 5.79% | 6.38% | ||||||||||||||||||||||||||||||
| (1) | Weighted based on income-producing property fair value. |
| (2) | Overall capitalization rate is calculated as stabilized net operating income (property revenue less property expenses) divided by the fair value of the property. |
| Valuation Metrics by Region | ||||||||||||||||||||
| As at September 30, 2021 | Canada | USA | Austria | Germany | Nether- lands | Other Europe | Total | |||||||||||||||||||||
Income-producing property fair value | $ | 1,430.0 | $ | 3,803.7 | $ | 768.8 | $ | 420.5 | $ | 642.6 | $ | 32.3 | $ | 7,097.9 | ||||||||||||||
Weighted average capitalization | 3.68% | 4.52% | 8.17% | 5.62% | 3.92% | 7.23% | 4.77% | |||||||||||||||||||||
| As at December 31, 2020 | Canada | USA | Austria | Germany | Nether- lands | Other Europe | Total | |||||||||||||||||||||
Income-producing property fair value | $ | 1,106.7 | $ | 2,833.0 | $ | 821.0 | $ | 412.6 | $ | 551.0 | $ | 62.0 | $ | 5,786.3 | ||||||||||||||
Weighted average capitalization | 4.64% | 5.24% | 8.56% | 5.87% | 4.57% | 8.15% | 5.61% | |||||||||||||||||||||
| (1) | Weighted based on income-producing property fair value. |
36 Granite REIT 2021 Third Quarter Report
Table of Contents
A sensitivity analysis of the fair value of income-producing properties to changes in the overall capitalization rate, terminal capitalization rate and discount rate at September 30, 2021 is presented below:
Sensitivity Analysis of Fair Value of Income-Producing Properties | ||||||
| Rate sensitivity | Overall capitalization rate | Terminal capitalization rate | Discount rate | |||||||||
+50 bps | 6,372.1 | 6,677.0 | 6,825.3 | |||||||||
+25 bps | 6,714.1 | 6,877.0 | 6,960.0 | |||||||||
Base rate | $ | 7,097.9 | $ | 7,097.9 | $ | 7,097.9 | ||||||
-25 bps | 7,532.5 | 7,343.1 | 7,239.2 | |||||||||
-50 bps | 8,029.5 | 7,617.0 | 7,384.1 | |||||||||
Capital Expenditures and Leasing Costs
Capital expenditures relate to sustaining the existing earnings capacity of the property portfolio. Capital expenditures can include expansion or development expenditures and maintenance or improvement expenditures. Expansion or development capital expenditures are discretionary in nature and are incurred to generate new revenue streams and/or increase the productivity of a property. Maintenance or improvement capital expenditures relate to sustaining the existing earnings capacity of a property. Leasing costs include direct leasing costs and lease incentives. Direct leasing costs include broker commissions incurred in negotiating and arranging tenant leases. Lease incentives include the cost of leasehold improvements to tenant spaces and/or cash allowances provided to tenants for leasehold improvement costs.
Granite REIT 2021 Third Quarter Report 37
Table of Contents
Included in total capital expenditure and leasing cost additions to investment properties are items which relate to the completion or lease up of recently acquired or developed properties. Such items are excluded from Granite’s calculation of AFFO. A reconciliation of total capital and leasing cost additions to investment properties to those included in AFFO for the three and nine months ended September 30, 2021 and 2020 is below:
Maintenance Capital Expenditures and Leasing Costs | ||||
| Three Months Ended September 30, | Nine Months Ended September 30, | |||||||||||||||||||
| 2021 | 2020 | 2021 | 2020 | |||||||||||||||||
Additions to investment properties: | ||||||||||||||||||||
Leasing costs | $ | 5.6 | $ | 0.6 | $ | 5.8 | $ | 2.5 | ||||||||||||
Tenant improvements(1) | 0.2 | 0.6 | 0.5 | 0.6 | ||||||||||||||||
Maintenance capital expenditures | 1.9 | 0.2 | 3.5 | 3.2 | ||||||||||||||||
Other capital expenditures | 12.4 | 2.0 | 14.5 | 8.7 | ||||||||||||||||
| $ | 20.1 | $ | 3.4 | $ | 24.3 | $ | 15.0 | |||||||||||||
Less: | ||||||||||||||||||||
Leasing costs related to acquisition activities | — | (0.5 | ) | (0.1 | ) | (0.5 | ) | |||||||||||||
Leasing costs related to development activities | (3.3 | ) | — | (3.3 | ) | (1.9 | ) | |||||||||||||
Capital expenditures related to expansions | (4.5 | ) | — | (6.8 | ) | — | ||||||||||||||
Capital expenditures related to property acquisitions | (9.2 | ) | (2.1 | ) | (8.7 | ) | (8.7 | ) | ||||||||||||
Capital expenditures and leasing costs included in AFFO | $ | 3.1 | $ | 0.8 | $ | 5.4 | $ | 3.9 | ||||||||||||
| (1) | Tenant improvements include tenant allowances and landlord’s work. |
The capital expenditures and leasing costs incurred by quarter for the trailing eight quarters were as follows:
Capital Expenditures and Leasing Costs — Trailing Eight Quarters |
| Q3’21 | Q2’21 | Q1’21 | Q4’20 | Q3’20 | Q2’20 | Q1’20 | Q4’19 | |||||||||||||||||||||||||||
Total capital expenditures incurred | $ | 14.3 | $ | 3.2 | $ | 0.7 | $ | 13.3 | $ | 2.2 | $ | 6.2 | $ | 3.4 | $ | 1.0 | ||||||||||||||||||
Total leasing costs incurred | 2.5 | 0.3 | — | 2.1 | 1.2 | 2.0 | — | 0.8 | ||||||||||||||||||||||||||
Total incurred | [A] | $ | 16.8 | $ | 3.5 | $ | 0.7 | $ | 15.4 | $ | 3.4 | $ | 8.2 | $ | 3.4 | $ | 1.8 | |||||||||||||||||
Less: Capital expenditures and leasing costs related to acquisitions and developments | (13.7 | ) | (1.8 | ) | (0.1 | ) | (13.1 | ) | (2.6 | ) | (6.1 | ) | (2.4 | ) | (0.2 | ) | ||||||||||||||||||
Capital expenditures and leasing costs included in AFFO | [B] | $ | 3.1 | $ | 1.7 | $ | 0.6 | $ | 2.3 | $ | 0.8 | $ | 2.1 | $ | 1.0 | $ | 1.6 | |||||||||||||||||
GLA, square feet | [C] | 53.3 | 51.3 | 50.4 | 49.5 | 45.4 | 44.3 | 40.0 | 40.0 | |||||||||||||||||||||||||
$ total incurred per square feet | [A]/[C] | $ | 0.32 | $ | 0.07 | $ | 0.01 | $ | 0.31 | $ | 0.07 | $ | 0.19 | $ | 0.09 | $ | 0.05 | |||||||||||||||||
$ capital expenditures and leasing costs included in AFFO per square feet | [B]/[C] | $ | 0.06 | $ | 0.03 | $ | 0.01 | $ | 0.05 | $ | 0.02 | $ | 0.05 | $ | 0.03 | $ | 0.04 | |||||||||||||||||
38 Granite REIT 2021 Third Quarter Report
Table of Contents
Development and Expansion Projects
The attributes of Granite’s properties under development and expansion projects as at September 30, 2021 were as follows:
Development and Expansion Projects |
Land (in acres) | Expected (in millions) | Target/ actual start date of construction | Target completion date | Actual construction | Expected total construction cost(1) | |||||||||||||||||||
As at September 30, 2021 | ||||||||||||||||||||||||
Properties under development | ||||||||||||||||||||||||
Houston, Texas (Phase I and II) | 89.3 | 1.4 | Q4 2019 | Q4 2022 | $ | 12.8 | $ | 134.8 | ||||||||||||||||
Fort Worth, Texas | 36.4 | 0.6 | Q2 2021 | Q2 2022 | 9.7 | 44.8 | ||||||||||||||||||
Altbach, Germany | 12.8 | 0.3 | Q1 2021 | Q1 2022 | 22.5 | 32.3 | ||||||||||||||||||
Murfreesboro, Tennessee | 50.8 | 0.8 | Q3 2021 | Q3 2022 | 14.4 | 77.0 | ||||||||||||||||||
Highway 109, Tennessee | 38.8 | 0.5 | Q3 2021 | Q4 2022 | 4.6 | 66.8 | ||||||||||||||||||
Expansion projects | ||||||||||||||||||||||||
2095 Logistics Drive, Mississauga, Ontario | 9.5 | 0.1 | Q4 2019 | Q1 2022 | 6.6 | 11.0 | ||||||||||||||||||
555 Beck Cres., Ajax, Ontario | 7.6 | — | Q2 2021 | Q3 2022 | 0.2 | 8.5 | ||||||||||||||||||
| 245.2 | 3.7 | $ | 70.8 | $ | 375.2 | |||||||||||||||||||
| (1) | Construction cost excludes cost of land. |
During the third quarter of 2021, Granite and its partner NorthPoint Development entered into a new build-to-suit lease with a leading e-commerce retailer at its Houston development site, for an initial term of 10.9 years. The approximate 688,000 square foot, 40’ clear height, modern distribution building is being constructed as the second phase of the multi-phase development, in addition to the initial phase one of approximately 669,000 square feet currently under construction. The build-to-suit project is estimated to be completed in the second quarter of 2022, while phase one is expected to be completed in the fourth quarter of 2022.
At Granite’s site in Fort Worth, Texas, vertical construction commenced during the second quarter of 2021. This speculative 605,000 square foot, 36’ clear, state-of-the-art distribution/e-commerce facility is expected to be completed in the second quarter of 2022.
At Granite’s site in Murfreesboro, Tennessee, vertical construction commenced during the third quarter of 2021. This speculative 844,000 square foot, 40’ clear, state-of-the-art distribution/e-commerce facility is expected to be completed in the third quarter of 2022.
Vertical construction of the temperature controlled building expansion of approximately 60,000 square feet at its property at 2095 Logistics Drive in Mississauga, Ontario is expected to be completed by the first quarter of 2022.
Granite continues to advance site planning for the speculative expansion of 555 Beck Crescent in Ajax, Ontario. Vertical construction of the approximate 49,000 square foot, 32’ clear height expansion is expected to commence in the fourth quarter of 2021 with completion anticipated by the third quarter of 2022.
Granite REIT 2021 Third Quarter Report 39
Table of Contents
On September 8, 2021, Granite acquired, on a forward-funding basis, three modern industrial buildings totaling approximately 509,000 square feet, with 32’ clear heights that will be constructed on a 38.8 acre site in Lebanon, Tennessee. Construction commenced during the third quarter of 2021 with completion anticipated by the fourth quarter of 2022.
Leasing Profile
Magna, Granite’s Largest Tenant
At September 30, 2021, Magna International Inc. or one of its operating subsidiaries was the tenant at 30 (December 31, 2020 — 32) of Granite’s income-producing properties and comprised 31% (December 31, 2020 — 36%) of Granite’s annualized revenue and 24% (December 31, 2020 — 27%) of Granite’s GLA.
On June 18, 2021, Moody’s Investor Service, Inc. (“Moody’s”) confirmed Magna International Inc.’s credit rating of A3 and changed the trend to “Stable Outlook” from “Negative Outlook”. On July 6, 2021, DBRS confirmed the A(low) credit rating and changed the trend to “Stable Outlook” from “Negative Outlook”. On July 21, 2021, Standard & Poor’s confirmed the A- credit rating and changed the trend to “Stable Outlook” from “Negative Outlook”. Magna is a global mobility technology company with complete vehicle engineering and contract manufacturing expertise. Magna’s product capabilities include body, chassis, exteriors, seating, powertrain, active driver assistance, electronics, mechatronics, mirrors, lighting and roof systems.
Granite’s relationship with Magna is an arm’s length landlord and tenant relationship governed by the terms of Granite’s leases. Granite’s properties are generally leased to operating subsidiaries of Magna International Inc. and are not guaranteed by the parent company; however, Magna International Inc. is the tenant under certain of Granite’s leases. The terms of the lease arrangements with Magna generally provide for the following:
| • | the obligation of Magna to pay for costs of occupancy, including operating costs, property taxes and maintenance and repair costs; |
| • | rent escalations based on either fixed-rate steps or inflation; |
| • | renewal options tied to market rental rates or inflation; |
| • | environmental indemnities from the tenant; and |
| • | a right of first refusal in favour of Magna on the sale of a property. |
Renewal terms, rates and conditions are typically set out in Granite’s leases with Magna and form the basis for tenancies that continue beyond the expiries of the initial lease terms.
According to its public disclosure, Magna’s success is primarily dependent upon the levels of North American, European and Chinese car and light truck production by Magna’s customers. Granite expects Magna to continuously seek to optimize its global manufacturing footprint and consequently, Magna may or may not renew leases for facilities currently under lease at their expiries.
Other Tenants
In addition to Magna, at September 30, 2021, Granite had 116 other tenants from various industries that in aggregate comprised 69% of the Trust’s annualized revenue. Each of these tenants accounted for less than 6% of the Trust’s annualized revenue as at September 30, 2021.
40 Granite REIT 2021 Third Quarter Report
Table of Contents
Granite’s top 10 tenants by annualized revenue at September 30, 2021 are summarized in the table below:
Top 10 Tenants Summary |
| Tenant | Annualized Revenue % | GLA% | WALT (years) | Credit Rating(1)(2) | ||||||||||
Magna | 31% | 24% | 4.2 | A- | ||||||||||
Amazon | 5% | 5% | 17.4 | AA | ||||||||||
True Value Company | 3% | 3% | 19.4 | NR | ||||||||||
ADESA | 2% | —% | 7.8 | NR | ||||||||||
Restoration Hardware | 2% | 2% | 6.6 | Ba2 | ||||||||||
Light Mobility Solutions GmbH | 2% | 1% | 2.2 | NR | ||||||||||
Hanon Systems | 2% | 1% | 7.9 | AA | ||||||||||
Spreetail FTP | 2% | 2% | 5.1 | NR | ||||||||||
Ingram Micro | 2% | 2% | 3.3 | BB- | ||||||||||
Cornerstone Brands | 2% | 2% | 3.0 | B+ | ||||||||||
Top 10 Tenants | 53% | 42% | 6.7 | |||||||||||
| (1) | Credit rating is quoted on the Standard & Poor’s rating scale or equivalent where publicly available. NR refers to Not Rated. |
| (2) | The credit rating indicated may, in some instances, apply to an affiliated company of Granite’s tenant which may not be the guarantor of the lease. |
Granite REIT 2021 Third Quarter Report 41
Table of Contents
Lease Expiration
As at September 30, 2021, Granite’s portfolio had a weighted average lease term by square footage of 5.8 years (December 31, 2020 — 6.3 years) with lease expiries by GLA (in thousands of square feet) and any lease renewals committed adjusted accordingly, lease count and annualized revenue (calculated as rental revenue excluding tenant recoveries, recognized in accordance with IFRS, in September 2021, excluding assets held for sale, multiplied by 12 months, in millions) as set out in the table below:
Lease Maturity Summary
|
Total | Total | Total | Vacancies | 2021 | 2022 | 2023 | 2024 | 2025 | 2026 | 2027 and Beyond | ||||||||||||||||||||||||||||||||||||||||||||||||||||||||||||||||||||||||||||||||||||||||||
| Country | Sq Ft | Sq Ft | Annualized Revenue $ | Sq Ft | Annualized Revenue $ | Sq Ft | Annualized Revenue $ | Sq Ft | Annualized Revenue $ | Sq Ft | Annualized Revenue $ | Sq Ft | Annualized Revenue $ | Sq Ft | Annualized Revenue $ | |||||||||||||||||||||||||||||||||||||||||||||||||||||||||||||||||||||||||||||||||||||
Canada | 5,891 | 30 | 54.0 | — | 316 | 3.6 | 347 | 2.9 | 380 | 2.3 | 642 | 5.4 | 1,449 | 11.5 | 258 | 2.3 | 2,499 | 26.0 | ||||||||||||||||||||||||||||||||||||||||||||||||||||||||||||||||||||||||||||||||||
Canada-committed | — | — | (0.1 | ) | — | (316 | ) | (3.6 | ) | (276 | ) | (1.6 | ) | — | — | — | — | — | — | 316 | 3.5 | 276 | 1.6 | |||||||||||||||||||||||||||||||||||||||||||||||||||||||||||||||||||||||||||||
Canada — net | 5,891 | 30 | 53.9 | — | — | — | 71 | 1.3 | 380 | 2.3 | 642 | 5.4 | 1,449 | 11.5 | 574 | 5.8 | 2,775 | 27.6 | ||||||||||||||||||||||||||||||||||||||||||||||||||||||||||||||||||||||||||||||||||
United States | 32,165 | 73 | 179.1 | 342 | 680 | 12.0 | 4,036 | 19.8 | 6,253 | 29.6 | 3,129 | 16.0 | 1,340 | 6.9 | 3,077 | 16.5 | 13,308 | 78.3 | ||||||||||||||||||||||||||||||||||||||||||||||||||||||||||||||||||||||||||||||||||
United States-committed | — | — | — | — | (680 | ) | (12.0 | ) | (1,952 | ) | (8.5 | ) | — | — | 346 | 1.7 | — | — | 87 | 0.8 | 2,199 | 18.0 | ||||||||||||||||||||||||||||||||||||||||||||||||||||||||||||||||||||||||||||||
United States — net | 32,165 | 73 | 179.1 | 342 | — | — | 2,084 | 11.3 | 6,253 | 29.6 | 3,475 | 17.7 | 1,340 | 6.9 | 3,164 | 17.3 | 15,507 | 96.3 | ||||||||||||||||||||||||||||||||||||||||||||||||||||||||||||||||||||||||||||||||||
Austria | 7,472 | 9 | 61.7 | — | 389 | 3.0 | 802 | 10.1 | 125 | 1.3 | 5,349 | 38.1 | — | — | — | — | 807 | 9.2 | ||||||||||||||||||||||||||||||||||||||||||||||||||||||||||||||||||||||||||||||||||
Austria-committed | — | — | — | — | (389 | ) | (3.0 | ) | — | — | — | — | — | — | — | — | 389 | 3.0 | — | — | ||||||||||||||||||||||||||||||||||||||||||||||||||||||||||||||||||||||||||||||||
Austria-net | 7,472 | 9 | 61.7 | — | — | — | 802 | 10.1 | 125 | 1.3 | 5,349 | 38.1 | — | — | 389 | 3.0 | 807 | 9.2 | ||||||||||||||||||||||||||||||||||||||||||||||||||||||||||||||||||||||||||||||||||
Germany | 3,504 | 12 | 24.4 | — | 548 | 3.4 | 283 | 2.2 | 1,947 | 13.9 | — | — | 195 | 1.6 | 303 | 1.6 | 228 | 1.7 | ||||||||||||||||||||||||||||||||||||||||||||||||||||||||||||||||||||||||||||||||||
Germany-committed | — | — | — | — | (548 | ) | (3.4 | ) | (283 | ) | (2.2 | ) | 240 | 1.3 | 308 | 2.1 | — | — | — | — | 283 | 2.2 | ||||||||||||||||||||||||||||||||||||||||||||||||||||||||||||||||||||||||||||||
Germany-net | 3,504 | 12 | 24.4 | — | — | — | — | — | 2,187 | 15.2 | 308 | 2.1 | 195 | 1.6 | 303 | 1.6 | 511 | 3.9 | ||||||||||||||||||||||||||||||||||||||||||||||||||||||||||||||||||||||||||||||||||
Netherlands | 4,006 | 36 | 27.8 | 78 | 13 | 0.1 | 25 | 0.1 | 326 | 2.6 | 68 | 1.0 | 630 | 4.9 | 355 | 1.6 | 2,511 | 17.5 | ||||||||||||||||||||||||||||||||||||||||||||||||||||||||||||||||||||||||||||||||||
Europe Other | 299 | 1 | 2.8 | — | 299 | 2.8 | — | — | — | — | — | — | — | — | — | — | — | — | ||||||||||||||||||||||||||||||||||||||||||||||||||||||||||||||||||||||||||||||||||
Europe Other committed | — | — | — | — | (299 | ) | (2.8 | ) | — | — | — | — | — | — | — | — | 299 | 2.8 | — | — | ||||||||||||||||||||||||||||||||||||||||||||||||||||||||||||||||||||||||||||||||
Europe Other- net | 299 | 1 | 2.8 | — | — | — | — | — | — | — | — | — | — | — | 299 | 2.8 | — | — | ||||||||||||||||||||||||||||||||||||||||||||||||||||||||||||||||||||||||||||||||||
Total | 53,337 | 161 | 349.8 | 420 | 2,245 | 24.9 | 5,493 | 35.1 | 9,031 | 49.7 | 9,188 | 60.5 | 3,614 | 24.9 | 3,993 | 22.0 | 19,353 | 132.7 | ||||||||||||||||||||||||||||||||||||||||||||||||||||||||||||||||||||||||||||||||||
Total-committed | — | — | (0.1 | ) | — | (2,232 | ) | (24.8 | ) | (2,511 | ) | (12.3 | ) | 240 | 1.3 | 654 | 3.8 | — | — | 1,091 | 10.1 | 2,758 | 21.8 | |||||||||||||||||||||||||||||||||||||||||||||||||||||||||||||||||||||||||||||
As at September 30, 2021 | 53,337 | 161 | 349.7 | 420 | 13 | 0.1 | 2,982 | 22.8 | 9,271 | 51.0 | 9,842 | 64.3 | 3,614 | 24.9 | 5,084 | 32.1 | 22,111 | 154.5 | ||||||||||||||||||||||||||||||||||||||||||||||||||||||||||||||||||||||||||||||||||
% of portfolio as at September 30, 2021: |
| |||||||||||||||||||||||||||||||||||||||||||||||||||||||||||||||||||||||||||||||||||||||||||||||||||
* by sq ft | 100% | 0.8% | —% | 5.6% | 17.4% | 18.4% | 6.8% | 9.5% | 41.5% | |||||||||||||||||||||||||||||||||||||||||||||||||||||||||||||||||||||||||||||||||||||||||||
* by Annualized Revenue | 100% | —% | 6.5% | 14.6% | 18.4% | 7.1% | 9.2% | 44.2% | ||||||||||||||||||||||||||||||||||||||||||||||||||||||||||||||||||||||||||||||||||||||||||||
42 Granite REIT 2021 Third Quarter Report
Table of Contents
Occupancy Roll Forward
The table below provides a summary of occupancy changes during the three and nine months ended September 30, 2021.
Occupancy Roll Forward for Q3 2021 |
| Three Months Ended September 30, 2021 | ||||||||||||||||||||||||||||
| (in thousands, sq ft, except as noted) | Canada | USA | Austria | Germany | Netherlands | Europe - Other | Total | |||||||||||||||||||||
Total portfolio size, July 1, 2021 | 5,891 | 29,626 | 7,889 | 3,504 | 3,810 | 571 | 51,291 | |||||||||||||||||||||
Vacancy, July 1, 2021 | — | (341 | ) | — | — | — | (29) | (370 | ) | |||||||||||||||||||
Occupancy, July 1, 2021 | 5,891 | 29,285 | 7,889 | 3,504 | 3,810 | 542 | 50,921 | |||||||||||||||||||||
Occupancy %, July 1, 2021 | 100.0% | 98.8% | 100.0% | 100.0% | 100.0% | 94.9% | 99.3% | |||||||||||||||||||||
Acquired occupancy, net | — | 2,539 | — | — | 118 | — | 2,657 | |||||||||||||||||||||
Dispositions and assets held for sale | — | — | (417) | — | — | (272) | (689) | |||||||||||||||||||||
Expiries | (115) | — | — | (120) | — | — | (235) | |||||||||||||||||||||
Renewals | 115 | — | — | — | — | — | 115 | |||||||||||||||||||||
New Leases | — | — | — | 120 | — | 29 | 149 | |||||||||||||||||||||
Occupancy, September 30, 2021 | 5,891 | 31,824 | 7,472 | 3,504 | 3,928 | 299 | 52,918 | |||||||||||||||||||||
Total portfolio size, September 30, 2021 | 5,891 | 32,165 | 7,472 | 3,504 | 4,006 | 299 | 53,337 | |||||||||||||||||||||
Occupancy %, September 30, 2021 | 100.0% | 98.9% | 100.0% | 100.0% | 98.1% | 100.0% | 99.2% | |||||||||||||||||||||
Occupancy Roll Forward for Q3 2021 YTD |
| Nine Months Ended September 30, 2021 | ||||||||||||||||||||||||||||
| (in thousands, sq ft, except as noted) | Canada | USA | Austria | Germany | Netherlands | Europe - Other | Total | |||||||||||||||||||||
Total portfolio size, January 1, 2021 | 5,891 | 27,521 | 8,101 | 3,504 | 3,810 | 661 | 49,488 | |||||||||||||||||||||
Vacancy, January 1, 2021 | — | (90 | ) | — | — | — | (29) | (119 | ) | |||||||||||||||||||
Occupancy, January 1, 2021 | 5,891 | 27,431 | 8,101 | 3,504 | 3,810 | 632 | 49,369 | |||||||||||||||||||||
Occupancy %, January 1, 2021 | 100.0% | 99.7% | 100.0% | 100.0% | 100.0% | 95.6% | 99.8% | |||||||||||||||||||||
Acquired occupancy, net | — | 4,393 | — | — | 118 | — | 4,511 | |||||||||||||||||||||
Dispositions and assets held for sale | — | — | (629) | — | — | (362) | (991) | |||||||||||||||||||||
Expiries | (316) | (679) | (389) | (548) | — | (37) | (1,969) | |||||||||||||||||||||
Renewals | 316 | 316 | 389 | 428 | — | 37 | 1,486 | |||||||||||||||||||||
New Leases | — | 363 | — | 120 | — | 29 | 512 | |||||||||||||||||||||
Occupancy, September 30, 2021 | 5,891 | 31,824 | 7,472 | 3,504 | 3,928 | 299 | 52,918 | |||||||||||||||||||||
Total portfolio size, September 30, 2021 | 5,891 | 32,165 | 7,472 | 3,504 | 4,006 | 299 | 53,337 | |||||||||||||||||||||
Occupancy %, September 30, 2021 | 100.0% | 98.9% | 100.0% | 100.0% | 98.1% | 100.0% | 99.2% | |||||||||||||||||||||
Granite REIT 2021 Third Quarter Report 43
Table of Contents
LIQUIDITY AND CAPITAL RESOURCES
Liquidity
Granite has various sources of available liquidity including cash, cash equivalents and the unused portion of its unsecured credit facility that aggregated to $1,777.0 million as at September 30, 2021 compared to $1,330.3 million at December 31, 2020, as summarized below:
Sources of Available Liquidity
|
| As at September 30, 2021 and December 31, 2020 | 2021 | 2020 | ||||||
Cash and cash equivalents | $ | 779.0 |
| $ | 831.3 |
| ||
Unused portion of credit facility |
| 998.0 |
| 499.0 | ||||
Available liquidity | $ | 1,777.0 |
| $ | 1,330.3 |
| ||
Additional sources of liquidity: | ||||||||
Assets held for sale(1) | $ | 43.2 |
| — |
| |||
Unencumbered assets(2) | $ | 7,286.3 |
| $ | 5,855.6 |
| ||
| (1) | Two income producing properties and one parcel of land held for development located in Europe were classified as assets held for sale on the unaudited condensed combined financial statements at September 30, 2021. |
| (2) | Unencumbered assets represent the carrying value of investment properties (excluding any assets held for sale) that are not encumbered by secured debt. Granite can seek to obtain secured financing against its unencumbered assets subject to certain restrictions and financial covenant limitations in its credit facility, term loan agreements and trust indentures. |
The increase in liquidity is primarily due to the amendment made to the existing unsecured credit facility on March 31, 2021 resulting in an additional borrowing capacity of $500 million, the net proceeds of $303.1 million from the equity offering completed on June 9, 2021, and the net proceeds of $497.1 million from the issuance of the 2028 Debentures on August 30, 2021, partially offset by the redemption of the 2021 Debentures of $254.0 million on January 4, 2021, the settlement of the related 2021 Cross-Currency Interest Rate Swap of $18.8 million, and $600.1 million relating to the acquisitions of ten income-producing properties, four properties under development and a parcel of development land in the United States, Canada and the Netherlands. Granite intends to use and has partially used the net proceeds of debenture and equity offerings completed in 2020 and 2021 to fund completed and potential acquisitions of properties, to repay debt and to finance or refinance expenditures associated with Eligible Green Projects (as described in the Granite Green Bond Framework, which is available on Granite’s website), for commitments under existing development projects and for general trust purposes.
Management believes that the Trust’s cash resources, cash flow from operations and available third-party borrowings will be sufficient to finance its operations and capital expenditures program over the next year as well as to pay distributions. Granite expects to fund its ongoing operations and future growth through the use of (i) existing cash and cash equivalents, (ii) cash flows from operating activities, (iii) cash flows from asset sales, (iv) short-term financing available from the credit facility, (v) the issuance of unsecured debentures or equity, subject to market conditions and/or, if necessary, (vi) financing that may be obtained on its unencumbered assets. For information about the impact of COVID-19 on Granite’s liquidity, please see “SIGNIFICANT MATTERS — COVID-19 Pandemic”.
44 Granite REIT 2021 Third Quarter Report
Table of Contents
Cash Flow Components
Components of the Trust’s cash flows were as follows:
Cash Flow Components Summary
|
Three Months Ended September 30, | Nine Months Ended September 30, | |||||||||||||||||||||||
| 2021 | 2020 | $ change | 2021 | 2020 | $ change | |||||||||||||||||||
Cash and cash equivalents, beginning of period | $ | 678.1 | $ | 617.2 | 60.9 | $ | 831.3 | $ | 298.7 | 532.6 | ||||||||||||||
Cash provided by operating activities | 79.5 | 69.0 | 10.5 | 208.5 | 189.0 | 19.5 | ||||||||||||||||||
Cash used in investing activities | (429.2 | ) | (98.9 | ) | (330.3 | ) | (645.9 | ) | (579.5 | ) | (66.4 | ) | ||||||||||||
Cash provided by (used in) financing activities | 448.3 | (43.8 | ) | 492.1 | 382.7 | 627.9 | (245.2 | ) | ||||||||||||||||
Effect of exchange rate changes on cash and cash equivalents | 2.3 | (3.8 | ) | 6.1 | 2.4 | 3.6 | (1.2 | ) | ||||||||||||||||
Cash and cash equivalents, end of period | $ | 779.0 | $ | 539.7 | 239.3 | $ | 779.0 | $ | 539.7 | 239.3 | ||||||||||||||
Operating Activities
During the three month period ended September 30, 2021, operating activities generated cash of $79.5 million compared to $69.0 million in the prior year period. The increase of $10.5 million was due to various factors as noted in the “RESULTS OF OPERATIONS” section including, among others, the following:
| • | an increase in net operating income of $8.0 million; |
| • | a decrease of $3.5 million in income taxes paid; |
| • | an increase in foreign exchange gains of $0.9 million; |
| • | a decrease of $0.7 million in general and administrative expenses; and |
| • | an increase in interest income of $0.4 million, partially offset by; |
| • | an increase of $4.2 million in interest paid. |
During the nine month period ended September 30, 2021, operating activities generated cash of $208.5 million compared to $189.0 million in the prior year period. The increase of $19.5 million was due to various factors as noted in the “RESULTS OF OPERATIONS” section including, among others, the following:
| • | an increase in net operating income of $30.8 million; and |
| • | a decrease of $1.7 million in income taxes paid, partially offset by; |
| • | a decrease of $6.6 million from cash provided by working capital changes primarily due to a decrease in accounts payable and increase in accounts receivable due to timing of payments and receipts; |
| • | an increase in general and administrative expenses of $1.7 million; and |
| • | an increase of $6.3 million of interest paid. |
Granite REIT 2021 Third Quarter Report 45
Table of Contents
Investing Activities
Investing activities for the three month period ended September 30, 2021 used cash of $429.2 million and primarily related to the following:
| • | the acquisitions of six income-producing properties, three properties under development and a parcel of development land in Canada, United States and the Netherlands for $380.8 million including acquisition costs of $5.9 million (see “SIGNIFICANT MATTERS — Property Acquisitions”); |
| • | leasing commissions paid of $5.4 million largely relating to leasing activity for two properties in the United States, including one property under development that was pre-leased during the quarter; |
| • | additions to income-producing properties paid of $12.1 million, primarily attributable to the completion of an acquired property of $8.3 million in Dallas, Texas and ongoing maintenance and expansion capital in Canada and the United States; |
| • | additions to properties under development paid of $16.9 million, primarily attributable to Granite’s ongoing development projects in Germany and the United States; |
| • | acquisition deposits paid of $16.9 million, consisting of advance payments for acquisitions under contract in the United States and the Netherlands; and |
| • | loan advances made of $5.2 million to the developer of two industrial properties being constructed in Indiana. |
Investing activities for the three month period ended September 30, 2020 used cash of $98.9 million and primarily related to the following:
| • | the acquisitions of nine income-producing properties in Canada, the United States and the Netherlands for $114.7 million and related working capital of $7.3 million acquired as part of the Tilburg, Netherlands property; |
| • | additions to income-producing properties paid of $3.4 million largely relating to capital expenditures at properties in Canada and the United States; and |
| • | additions to properties under development paid of $7.9 million relating to four properties in Indiana and Texas, United States, as well as Bleiswijk, Netherlands and Altbach, Germany, partially offset by; |
| • | net proceeds of $35.5 million received from the dispositions of two income-producing properties in Canada for $23.5 million and the receipt of a proceeds receivable related to the disposal of a property in South Carolina in September 2018 of $12.1 million. |
Investing activities for the nine month period ended September 30, 2021 used cash of $645.9 million and primarily related to the following:
| • | the acquisitions of ten income-producing properties, four properties under development and a parcel of development land in Canada, the United States and the Netherlands for $600.1 million including acquisition costs of $6.8 million (see “SIGNIFICANT MATTERS — Property Acquisitions”); |
| • | additions to income-producing properties paid of $19.2 million, primarily attributable to the completion of an acquired property of $8.3 million in Dallas, Texas and ongoing maintenance and expansion capital in Canada and the United States; |
46 Granite REIT 2021 Third Quarter Report
Table of Contents
| • | additions to properties under development paid of $27.9 million, primarily attributable to Granite’s ongoing development projects in Germany and the United States; |
| • | acquisition deposits paid of $17.9 million, consisting of advance payments for acquisitions under contract in the United States and the Netherlands; and |
| • | loan advances made of $5.2 million to the developer of two industrial properties being constructed in Indiana, partially offset by; |
| • | net proceeds of $23.2 million received from the disposition of two income-producing properties in the United Kingdom and Austria. |
Investing activities for the nine months ended September 30, 2020 used cash of $579.5 million and primarily related to the following:
| • | the acquisitions of seventeen income-producing properties in Canada, the United States and the Netherlands and a parcel of development land in the United States for $565.3 million and related working capital of $7.3 million acquired as part of the Tilburg, Netherlands property; |
| • | additions to income-producing properties paid of $13.4 million largely relating to capital expenditures at properties in Canada and the United States; and |
| • | additions to properties under development paid of $33.4 million relating to four properties in Indiana and Texas, United States, as well as Bleiswijk, Netherlands and Altbach, Germany, partially offset by; |
| • | net proceeds of $35.5 million received from the dispositions of two income-producing properties in Canada for $23.5 million and the receipt of a proceeds receivable related to the disposal of a property in South Carolina in September 2018 of $12.1 million. |
Financing Activities
Cash provided by financing activities for the three month period ended September 30, 2021 of $448.3 million largely comprised $497.8 million of proceeds from the senior unsecured debentures issued on August 30, 2021, net of issuance costs paid, partially offset by $49.3 million of monthly distribution payments.
Cash used by financing activities for the three month period ended September 30, 2020 of $43.8 million largely comprised distribution payments of $42.0 million and $1.0 million of deferred financing costs paid in connection with the issuance of the 2027 Debentures.
Cash provided by financing activities for the nine month period ended September 30, 2021 of $382.7 million largely comprised $497.8 million of proceeds from the 2028 Debentures issued on August 30, 2021 and $303.1 million of net proceeds from the stapled unit offering completed on June 9, 2021, net of issuance costs paid, partially offset by $254.0 million relating to the redemption of the 2021 Debentures, including early prepayment premium and settlement of the related 2021 Cross Currency Interest Rate Swap of $18.8 million, financing fees paid for the renewal of Granite’s credit facility of $2.9 million and $141.8 million of monthly distribution payments.
Cash provided by financing activities for the nine months ended September 30, 2020 of $627.9 million largely comprised $496.9 million of proceeds from the June 2020 debenture offering, net of issuance costs paid and $276.9 million of proceeds from the June 2020 stapled unit offering, net of issuance costs, partially offset by $120.1 million of distribution payments and $25.0 million relating to the repurchase of stapled units under the normal course issuer bid.
Granite REIT 2021 Third Quarter Report 47
Table of Contents
Debt Structure
Granite’s debt structure and key debt metrics as at September 30, 2021 and December 31, 2020 were as follows:
Summary Debt Structure and Debt Metrics |
| As at September 30, 2021 and December 31, 2020 | 2021 | 2020 | ||||||||
Unsecured debt, net | $2,424.9 | $2,178.1 | ||||||||
Cross currency interest rate swaps, net (3) | (8.3 | ) | 85.6 | |||||||
Lease obligations | 32.6 | 33.8 | ||||||||
Total debt | [A] | $2,449.2 | $2,297.5 | |||||||
Less: cash and cash equivalents | 779.0 | 831.3 | ||||||||
Net debt | [B] | $1,670.2 | $1,466.2 | |||||||
Investment properties, all unencumbered by secured debt | [C] | $7,286.3 | $5,855.6 | |||||||
Trailing 12-month adjusted EBITDA(1) | [D] | $ 293.7 | $ 264.5 | |||||||
Interest expense | $ 45.9 | $ 35.8 | ||||||||
Interest income | (2.8 | ) | (2.4 | ) | ||||||
Trailing 12-month interest expense, net | [E] | $ 43.1 | $ 33.4 | |||||||
Debt metrics | ||||||||||
Leverage ratio(1) | [A]/[C] | 34% | 39% | |||||||
Net leverage ratio(1) | [B]/[C] | 23% | 25% | |||||||
Interest coverage ratio(1) | [D]/[E] | 6.8x | 7.9x | |||||||
Unencumbered asset coverage ratio(1) | [C]/[A] | 3.0x | 2.5x | |||||||
Indebtedness ratio(1) | [A]/[D] | 8.3x | 8.7x | |||||||
Weighted average cost of debt(2) | 1.81% | 1.91% | ||||||||
Weighted average debt term-to-maturity, in years(2) | 5.8 | 5.6 | ||||||||
Ratings and outlook | ||||||||||
DBRS | BBB (high) stable | BBB stable | ||||||||
Moody’s | Baa2 stable | Baa2 stable | ||||||||
| (1) | Represents a non-IFRS measure. For definitions of Granite’s non-IFRS measures, refer to the section “NON-IFRS PERFORMANCE MEASURES”. |
| (2) | Excludes lease obligations noted above. |
| (3) | Balance is net of the cross currency interest rate swap asset. |
Unsecured Debt and Cross Currency Interest Rate Swaps
2028 Debentures and Cross Currency Interest Rate Swap
On August 30, 2021, Granite REIT Holdings Limited Partnership (“Granite LP”) issued $500.0 million aggregate principal amount of 2.194% Series 6 senior debentures due August 30, 2028 (the “2028 Debentures”). Interest on the 2028 Debentures is payable semi-annually in arrears on February 28 and August 30 of each year. At September 30, 2021, all of the 2028 Debentures remained outstanding and the balance, net of deferred financing costs, was $497.2 million.
On August 30, 2021, Granite LP entered into a cross currency interest rate swap (the “2028 Cross Currency Interest Rate Swap”) to exchange the 2.194% semi-annual interest payments from the 2028 Debentures for US dollar denominated interest payments at a 2.096% fixed interest rate. In addition, under the terms of the 2028 Cross Currency Interest Rate Swap, Granite LP will pay principal proceeds of $397.0 million in exchange for which it will receive $500.0 million on
48 Granite REIT 2021 Third Quarter Report
Table of Contents
August 28, 2028. As at September 30, 2021, the fair value of the 2028 Cross Currency Interest Rate Swap was a net financial liability of $9.4 million.
2030 Debentures and Cross Currency Interest Rate Swap
On December 18, 2020, Granite LP issued $500.0 million aggregate principal amount of 2.378% Series 5 senior debentures due December 18, 2030 (the “2030 Debentures”). Interest on the 2030 Debentures is payable semi-annually in arrears on June 18 and December 18 of each year. At September 30, 2021, all of the 2030 Debentures remained outstanding and the balance, net of deferred financing costs, was $497.3 million.
On December 18, 2020, Granite LP entered into a cross currency interest rate swap (the “2030 Cross Currency Interest Rate Swap”) to exchange the 2.378% semi-annual interest payments from the 2030 Debentures for Euro denominated interest payments at a 1.045% fixed interest rate. In addition, under the terms of the 2030 Cross Currency Interest Rate Swap, Granite LP will pay principal proceeds of €319.4 million in exchange for which it will receive $500.0 million on December 18, 2030. As at September 30, 2021, the fair value of the 2030 Cross Currency Interest Rate Swap was a net financial asset of $11.4 million.
2027 Debentures and Cross Currency Interest Rate Swap
On June 4, 2020, Granite LP issued $500.0 million aggregate principal amount of 3.062% Series 4 senior debentures due June 4, 2027 (the “2027 Debentures”). Interest on the 2027 Debentures is payable semi-annually in arrears on June 4 and December 4 of each year. At September 30, 2021, all of the 2027 Debentures remained outstanding and the balance, net of deferred financing costs, was $497.5 million.
On June 4, 2020, Granite LP entered into a cross currency interest rate swap (the “2027 Cross Currency Interest Rate Swap”) to exchange the $500.0 million proceeds and the 3.062% semi-annual interest payments from the 2027 Debentures for US$370.3 million and US dollar denominated interest payments at a 2.964% fixed interest rate. In addition, under the terms of the 2030 Cross Currency Interest Rate Swap, Granite LP will pay principal proceeds of US$370.3 million in exchange for which it will receive $500.0 million on June 4, 2027. As at September 30, 2021, the fair value of the 2027 Cross Currency Interest Rate Swap was a net financial asset of $27.7 million.
2026 Term Loan and Cross Currency Interest Rate Swap
On December 12, 2018, Granite LP entered into and fully drew down a $300.0 million senior unsecured non-revolving term facility that originally matured on December 12, 2025. On November 27, 2019, Granite refinanced the $300.0 million term facility and extended the maturity date one year to December 11, 2026 (the “2026 Term Loan”). The 2026 Term Loan is fully prepayable without penalty. Any amount repaid may not be re-borrowed. Interest on drawn amounts is calculated based on the Canadian Dollar Offered Rate (“CDOR”) plus an applicable margin determined by reference to the external credit rating of Granite LP and is payable monthly in advance. At September 30, 2021, the full $300.0 million remained outstanding and the balance, net of deferred financing costs and debt modification losses, was $299.6 million.
On December 12, 2018, Granite LP entered into a cross currency interest rate swap (the “2026 Cross Currency Interest Rate Swap”) to exchange the CDOR plus margin interest payments from the term loan that originally matured in 2025 for Euro denominated payments at a 2.202% fixed interest rate. As a result of the term loan extension on November 27, 2019, the previously existing cross currency interest rate swap was settled for $6.8 million and a new cross currency
Granite REIT 2021 Third Quarter Report 49
Table of Contents
interest rate swap was entered into. The 2026 Cross Currency Interest Rate Swap exchanges the CDOR plus margin monthly interest payments from the 2026 Term Loan for Euro denominated payments at a 1.355% fixed interest rate. In addition, under the terms of the swap, Granite LP will pay principal proceeds of €205.5 million in exchange for which it will receive $300.0 million on December 11, 2026. As at September 30, 2021, the fair value of the 2026 Cross Currency Interest Rate Swap was a net financial liability of $0.3 million.
2024 Term Loan and Cross Currency Interest Rate Swap
On December 19, 2018, Granite LP entered into and fully drew down a US$185.0 million senior unsecured non-revolving term facility that originally matured on December 19, 2022. On October 10, 2019, Granite refinanced the US$185.0 million term facility and extended the maturity date two years to December 19, 2024 (the “2024 Term Loan”). The 2024 Term Loan is fully prepayable without penalty. Any amount repaid may not be re-borrowed. Interest on drawn amounts is calculated based on LIBOR plus an applicable margin determined by reference to the external credit rating of Granite LP and is payable monthly in arrears. At September 30, 2021, the full US$185.0 million remained outstanding and the balance, net of deferred financing costs and debt modification losses, was $234.0 million.
On December 19, 2018, Granite LP entered into a cross currency interest rate swap (the “2024 Cross Currency Interest Rate Swap”) to exchange the LIBOR plus margin interest payments from the term loan that originally matured in 2022 for Euro denominated payments at a 1.225% fixed interest rate. On September 24, 2019, in conjunction with the term loan refinancing, Granite LP entered into a new cross currency interest rate swap (the “2024 Cross Currency Interest Rate Swap”). The 2024 Cross Currency Interest Rate Swap exchanges the LIBOR plus margin monthly interest payments from the 2024 Term Loan for Euro denominated payments at a 0.522% fixed interest rate. In addition, under the terms of the 2024 Cross Currency Interest Rate Swap, Granite LP will pay principal proceeds of €168.2 million in exchange for which it will receive US$185.0 million on December 19, 2024. As at September 30, 2021, the fair value of the 2024 Cross Currency Interest Rate Swap was a net financial liability of $10.6 million.
2023 Debentures and Cross Currency Interest Rate Swap
On December 20, 2016, Granite LP issued $400.0 million aggregate principal amount of 3.873% Series 3 senior debentures due November 30, 2023 (the “2023 Debentures”). Interest on the 2023 Debentures is payable semi-annually in arrears on May 30 and November 30 of each year. At September 30, 2021, all of the 2023 Debentures remained outstanding and the balance, net of deferred financing costs, was $399.3 million.
On December 20, 2016, Granite LP entered into a cross currency interest rate swap (the “2023 Cross Currency Interest Rate Swap”) to exchange the 3.873% interest payments from the 2023 Debentures for Euro denominated payments at a 2.43% fixed interest rate. Under the terms of the 2023 Cross Currency Interest Rate Swap, Granite LP will pay principal proceeds of €281.1 million in exchange for which it will receive $400.0 million on November 30, 2023. As at September 30, 2021, the fair value of the 2023 Cross Currency Interest Rate Swap was a net financial liability of $10.5 million.
2021 Debentures and Cross Currency Interest Rate Swap
On January 4, 2021, Granite LP redeemed in full the outstanding $250.0 million aggregate principal amount of the 2021 Debentures for a total redemption price of $254.0 million, including early redemption premium. In conjunction with the redemption, the 2021 Cross Currency Interest Rate Swap was terminated on January 4, 2021 and the related mark to market liability of $18.8 million was settled.
50 Granite REIT 2021 Third Quarter Report
Table of Contents
The 2023 Debentures, the 2027 Debentures, the 2030 Debentures, the 2028 Debentures, the 2024 Term Loan and the 2026 Term Loan rank pari passu with all of the Trust’s other existing and future senior unsecured indebtedness and are guaranteed by Granite REIT and Granite GP. The fair values of the cross currency interest rate swaps are dependent upon a number of assumptions including the Euro exchange rate against the Canadian or US dollars, the US dollar exchange rate against the Canadian dollar and the Euro, and Canadian and US government benchmark interest rates.
Credit Facility
On March 31, 2021, the Trust amended its existing unsecured revolving credit facility agreement to extend the existing maturity date of February 1, 2023 to March 31, 2026. In addition, the credit facility’s limit increased from $0.5 billion to $1.0 billion. Draws on the credit facility are available by way of Canadian dollar, US dollar or Euro denominated loans or Canadian dollar or US dollar denominated letters of credit. Interest on drawn amounts is calculated based on an applicable margin determined by reference to the external credit rating of Granite REIT and Granite GP, as is a commitment fee in respect of undrawn amounts. As at September 30, 2021, the Trust had no amounts drawn from the credit facility and $1.7 million in letters of credit issued against the facility.
Debt Metrics and Financial Covenants
Granite uses the debt metrics noted above to assess its borrowing capacity and the ability to meet its current and future financing obligations. At September 30, 2021, there were no significant changes in the debt ratios other than the decrease in the leverage and indebtedness ratios as a result of the increase in the Trust’s investment properties as a result of fair value increases and recent acquisitions. The debt ratios remain relatively favourable and provide financial flexibility for future growth.
Granite’s unsecured debentures, term loans and credit facility agreements contain financial and non-financial covenants that include maintaining certain leverage and debt service ratios. As at September 30, 2021, Granite was in compliance with all of these covenants.
Credit Ratings
On March 22, 2021, DBRS upgraded Granite LP’s Issuer Rating and credit rating on the 2023 Debentures, 2027 Debentures and 2030 Debentures to BBB(high) from BBB with stable trends. On March 12, 2021, Moody’s confirmed the Baa2 rating on the 2023 Debentures, 2027 Debentures and 2030 Debentures with a stable outlook. Credit ratings are intended to provide investors with an independent measure of credit quality of an issue of securities. A rating accorded to any security is not a recommendation to buy, sell or hold such securities and may be subject to revision or withdrawal at any time by the rating organization which granted such rating.
Unitholders’ Equity
Outstanding Stapled Units
As at November 3, 2021, the Trust had 65,693,840 stapled units issued and outstanding.
As at November 3, 2021, the Trust had 50,355 restricted stapled units (representing the right to receive 50,355 stapled units) and 77,692 performance stapled units (representing the right to receive a maximum of 155,384 stapled units) outstanding under the Trust’s Executive Deferred Stapled Unit Plan. The Executive Deferred Stapled Unit Plan is designed to provide equity-based compensation to employees of Granite who are, by the nature of their position or job, in a position to contribute to the success of Granite.
Granite REIT 2021 Third Quarter Report 51
Table of Contents
Distributions
Granite REIT’s monthly distribution to unitholders is currently 25.0 cents per stapled unit. For 2021, based on its current monthly rate, Granite expects to make total annual distributions of $3.00 per stapled unit. Monthly distributions declared to stapled unitholders in the three month periods ended September 30, 2021 and 2020 were $49.3 million or 75.0 cents per stapled unit and $42.0 million or 72.6 cents per stapled unit, respectively. Total distributions declared to stapled unitholders in the nine month periods ended September 30, 2021 and 2020 were $142.8 million or $2.25 per stapled unit and $121.1 million or $2.18 per stapled unit, respectively.
Distributions declared in October 2021 in the amount of $16.4 million or 25.0 cents per stapled unit will be paid on November 15, 2021.
Pursuant to the requirement of National Policy 41-201, Income Trusts and Other Indirect Offerings (“NP 41-201”), the following table outlines the differences between cash flow from operating activities and cash distributions as well as the differences between net income and cash distributions, in accordance with the guidelines under NP 41-201.
Cash Flows from Operating Activities in Excess of Distributions Paid and Payable |
| Three Months Ended September 30, | Nine Months Ended September 30, | |||||||||||||||||||
| 2021 | 2020 | 2021 | 2020 | |||||||||||||||||
Net income | $ | 421.8 | $ | 105.2 | $ | 969.0 | $ | 262.3 | ||||||||||||
Cash flows provided by operating activities | 79.5 | 69.0 | 208.5 | 189.0 | ||||||||||||||||
Monthly cash distributions paid and payable | (49.3 | ) | (42.0 | ) | (142.8 | ) | (121.1 | ) | ||||||||||||
Cash flows from operating activities in excess of distributions paid and payable | $ | 30.2 | $ | 27.0 | $ | 65.7 | $ | 67.9 | ||||||||||||
Monthly distributions for the three and nine month periods ended September 30, 2021 and 2020 were funded with cash flows from operating activities.
Net income prepared in accordance with IFRS recognizes revenue and expenses at time intervals that do not necessarily match the receipt or payment of cash. Therefore, when establishing cash distributions to unitholders, consideration is given to factors such as FFO, AFFO, cash generated from and required for operating activities and forward-looking cash flow information, including forecasts and budgets. Management does not expect current or potential future commitments to replace or maintain its investment properties to adversely affect cash distributions.
Normal Course Issuer Bid
On May 19, 2021, Granite announced the acceptance by the Toronto Stock Exchange (“TSX”) of Granite’s Notice of Intention to Make a Normal Course Issuer Bid (“NCIB”). Pursuant to the NCIB, Granite proposes to purchase through the facilities of the TSX and any alternative trading system in Canada, from time to time and if considered advisable, up to an aggregate of 6,154,057 of Granite’s issued and outstanding stapled units. The NCIB commenced on May 21, 2021 and will conclude on the earlier of the date on which purchases under the bid have been completed and May 20, 2022. Pursuant to the policies of the TSX, daily purchases made by Granite through the TSX may not exceed 46,074 stapled units, subject to certain exceptions. Granite had entered into an automatic securities purchase plan with a broker in order to facilitate repurchases of the stapled units under the NCIB during specified blackout periods.
52 Granite REIT 2021 Third Quarter Report
Table of Contents
Pursuant to a previous notice of intention to conduct a NCIB, Granite received approval from the TSX to purchase stapled units for the period May 21, 2020 to May 20, 2021.
During the nine months ended September 30, 2021, there were no stapled unit repurchases under the NCIB. During the nine months ended September 30, 2020, Granite repurchased 490,952 stapled units at an average stapled unit cost of $50.95 for total consideration of $25.0 million.
| COMMITMENTS, CONTRACTUAL OBLIGATIONS, CONTINGENCIES AND OFF-BALANCE SHEET ARRANGEMENTS |
The Trust is subject to various legal proceedings and claims that arise in the ordinary course of business. Management believes that the final outcome of such matters will not have a material adverse effect on the financial position, results of operations or liquidity of the Trust. However, actual outcomes may differ from management’s expectations.
Off-balance sheet arrangements consist of outstanding letters of credit to support certain contractual obligations, property purchase commitments, construction and development project commitments and certain operating agreements. As at September 30, 2021, the Trust had $1.7 million in letters of credit outstanding. Additionally, at September 30, 2021, the Trust’s contractual commitments totaled $510.7 million comprised of construction and development projects of $315.7 million and the committed acquisitions of two properties in Indiana and a property in the Netherlands upon completion totaling $195.0 million. Granite expects to fund these commitments over the next year through the use of cash on hand, cash from operations and/or Granite’s credit facility.
For further discussion of commitments, contractual obligations, contingencies and off-balance sheet arrangements, refer to notes 7, 9 and 17 to the unaudited condensed combined financial statements for the three and nine months ended September 30, 2021.
| NON-IFRS PERFORMANCE MEASURES |
Funds from operations
FFO is a non-IFRS performance measure that is widely used by the real estate industry in evaluating the operating performance of real estate entities. Granite calculates FFO as net income attributable to stapled unitholders excluding fair value gains (losses) on investment properties and financial instruments, gains (losses) on sale of investment properties including the associated current income tax, deferred income taxes and certain other items, net of non-controlling interests in such items. The Trust’s determination of FFO follows the definition prescribed by the Real Estate Property Association of Canada (“REALPAC”) White Paper on Funds From Operations & Adjusted Funds From Operations for IFRS dated February 2019 and as subsequently amended (“White Paper”). Granite considers FFO to be a meaningful supplemental measure that can be used to determine the Trust’s ability to service debt, fund capital expenditures and provide distributions to stapled unitholders. FFO is reconciled to net income, which is the most directly comparable IFRS measure (see “RESULTS OF OPERATIONS — Funds From Operations and Adjusted Funds From Operations”). FFO should not be construed as an alternative to net income or cash flow generated from operating activities determined in accordance with IFRS.
Granite REIT 2021 Third Quarter Report 53
Table of Contents
Adjusted funds from operations
AFFO is a non-IFRS performance measure that is widely used by the real estate industry in evaluating the recurring economic earnings performance of real estate entities after considering certain costs associated with sustaining such earnings. Granite calculates AFFO as net income attributable to stapled unitholders including all adjustments used to calculate FFO and further adjusts for actual maintenance capital expenditures that are required to sustain Granite’s productive capacity, leasing costs such as leasing commissions and tenant allowances incurred and non-cash straight-line rent and tenant incentive amortization, net of non-controlling interests in such items. The Trust’s determination of AFFO follows the definition prescribed by REALPAC’s White Paper. Granite considers AFFO to be a meaningful supplemental measure that can be used to determine the Trust’s ability to service debt, fund expansion capital expenditures, fund property development and provide distributions to stapled unitholders after considering costs associated with sustaining operating earnings. AFFO is also reconciled to net income, which is the most directly comparable IFRS measure (see “RESULTS OF OPERATIONS — Funds From Operations and Adjusted Funds From Operations”). AFFO should not be construed as an alternative to net income or cash flow generated from operating activities determined in accordance with IFRS.
FFO and AFFO payout ratios
The FFO and AFFO payout ratios are calculated as monthly distributions, which exclude special distributions, declared to unitholders divided by FFO and AFFO, respectively, in a period. FFO payout ratio and AFFO payout ratio may exclude revenue or expenses incurred during a period that can be a source of variance between periods. The FFO payout ratio and AFFO payout ratio are supplemental measures widely used by analysts and investors in evaluating the sustainability of the Trust’s monthly distributions to stapled unitholders.
54 Granite REIT 2021 Third Quarter Report
Table of Contents
FFO and AFFO Payout Ratios |
| Three Months Ended September 30, | Nine Months Ended September 30, | |||||||||||||||||
| 2021 | 2020 | 2021 | 2020 | |||||||||||||||
(in millions, except as noted) | ||||||||||||||||||
Monthly distributions declared to unitholders | [A] | $ | 49.3 | $ | 42.0 | $ | 142.8 | $ | 121.1 | |||||||||
FFO | 65.2 | 55.5 | 184.5 | 165.8 | ||||||||||||||
Add (deduct): | ||||||||||||||||||
Early redemption premium related to 2021 Debentures | — | — | 4.0 | — | ||||||||||||||
Accelerated amortization of credit facility deferred finance fees | — | — | 0.5 | — | ||||||||||||||
FFO adjusted for the above | [B] | $ | 65.2 | $ | 55.5 | $ | 189.0 | $ | 165.8 | |||||||||
AFFO | 61.2 | 52.7 | 176.0 | 159.6 | ||||||||||||||
Add (deduct): | ||||||||||||||||||
Early redemption premium related to 2021 Debentures | — | — | 4.0 | — | ||||||||||||||
Accelerated amortization of credit facility | — | — | 0.5 | — | ||||||||||||||
AFFO adjusted for the above | [C] | $ | 61.2 | $ | 52.7 | $ | 180.5 | $ | 159.6 | |||||||||
FFO payout ratio | [A]/[B] | 76% | 76% | 76% | 73% | |||||||||||||
AFFO payout ratio | [A]/[C] | 81% | 80% | 79% | 76% | |||||||||||||
Net operating income — cash basis
Granite uses NOI on a cash basis, which adjusts NOI to exclude lease termination and close-out fees, and the non-cash impact from straight-line rent and tenant incentive amortization recognized during the period (see “RESULTS OF OPERATIONS — Net Operating Income”). NOI — cash basis is a commonly used measure by the real estate industry and Granite believes it is a useful supplementary measure of the income generated by and operating performance of income-producing properties in addition to the most comparable IFRS measure, which Granite believes is NOI. NOI — cash basis is also a key input in Granite’s determination of the fair value of its investment property portfolio.
Same property net operating income — cash basis
Same property NOI — cash basis refers to the NOI — cash basis for those properties owned by Granite throughout the entire current and prior year periods under comparison. Same property NOI — cash basis excludes properties that were acquired, disposed of, classified as properties under or held for development or assets held for sale during the periods under comparison (see “RESULTS OF OPERATIONS — Net Operating Income”). Granite believes that same property NOI — cash basis is a useful supplementary measure in understanding period-over-period organic changes in NOI — cash basis from the same stock of properties owned.
Constant currency same property NOI
Constant currency same property NOI is a non-GAAP measure used by management in evaluating the performance of properties owned by Granite throughout the entire current and
Granite REIT 2021 Third Quarter Report 55
Table of Contents
prior year periods on a constant currency basis. It is calculated by taking same property NOI as defined above and excluding the impact of foreign currency translation by converting the same property NOI denominated in foreign currency in the respective periods at the current period average exchange rates (see “RESULTS OF OPERATIONS — Net Operating Income”).
Adjusted earnings before interest, income taxes, depreciation and amortization (“Adjusted EBITDA”)
Adjusted EBITDA is calculated as net income before lease termination and close-out fees, interest expense, interest income, income tax expense, depreciation and amortization expense, fair value gains (losses) on investment properties and financial instruments, other expense relating to real estate transfer tax and loss on the sale of investment properties. Adjusted EBITDA, calculated on a 12-month trailing basis (“trailing 12-month adjusted EBITDA”), represents an operating cash flow measure that Granite uses in calculating the interest coverage ratio and indebtedness ratio noted below. Adjusted EBITDA is also defined in Granite’s debt agreements and used in calculating the Trust’s debt covenants.
Adjusted EBITDA Reconciliation
| ||||
| For the 12-months ended September 30, 2021 and December 31, 2020 | 2021 | 2020 | ||||||
Net income | $ | 1,136.7 | $ | 429.9 | ||||
Add (deduct): | ||||||||
Interest expense and other financing costs | 45.9 | 35.8 | ||||||
Interest income | (2.8 | ) | (2.4 | ) | ||||
Income tax expense | 201.3 | 69.1 | ||||||
Depreciation and amortization | 1.4 | 1.2 | ||||||
Fair value gains on investment properties, net | (1,090.6 | ) | (273.4 | ) | ||||
Fair value losses on financial instruments | 0.5 | 3.4 | ||||||
Loss on sale of investment properties | 1.3 | 0.9 | ||||||
Adjusted EBITDA | $ | 293.7 | $ | 264.5 | ||||
Interest coverage ratio
The interest coverage ratio is calculated on a 12-month trailing basis using Adjusted EBITDA divided by net interest expense. Granite believes the interest coverage ratio is useful in evaluating the Trust’s ability to meet its interest expense obligations (see “LIQUIDITY AND CAPITAL RESOURCES — Debt Structure”).
Indebtedness ratio
The indebtedness ratio is calculated as total debt divided by Adjusted EBITDA and Granite believes it is useful in evaluating the Trust’s ability to repay outstanding debt using its operating cash flows (see “LIQUIDITY AND CAPITAL RESOURCES — Debt Structure”).
Leverage and net leverage ratios
The leverage ratio is calculated as the carrying value of total debt divided by the fair value of investment properties while the net leverage ratio subtracts cash and cash equivalents from total debt. The leverage ratio and net leverage ratio are supplemental measures that Granite believes are useful in evaluating the Trust’s degree of financial leverage, borrowing capacity and the relative strength of its balance sheet (see “LIQUIDITY AND CAPITAL RESOURCES — Debt Structure”).
56 Granite REIT 2021 Third Quarter Report
Table of Contents
Unencumbered asset coverage ratio
The unencumbered asset coverage ratio is calculated as the carrying value of investment properties (excluding assets held for sale) that are not encumbered by secured debt divided by the carrying value of total unsecured debt and is a supplemental measure that Granite believes is useful in evaluating the Trust’s degree of asset coverage provided by its unencumbered investment properties to total unsecured debt (see “LIQUIDITY AND CAPITAL RESOURCES — Debt Structure”).
| SIGNIFICANT ACCOUNTING ESTIMATES |
The preparation of financial statements in conformity with IFRS requires management to apply judgment and make estimates that affect the amounts reported and disclosed in the combined financial statements. Management bases estimates on historical experience and various other assumptions that are believed to be reasonable in the circumstances, the results of which form the basis for making judgments about the values of assets and liabilities. On an ongoing basis, management evaluates its estimates. However, actual results could differ from those estimates.
The Trust’s significant accounting policies that involve the most judgment and estimates are as follows:
Judgments
Leases
The Trust’s policy for revenue recognition is described in note 2(l) of the audited combined financial statements for the year ended December 31, 2020. The Trust makes judgments in determining whether certain leases are operating or finance leases, in particular tenant leases with long contractual terms or leases where the property is a large square-footage and/or architecturally specialized. The Trust also makes judgments in determining the lease term for some lease contracts in which it is a lessee that include renewal or termination options. The assessment of whether the Trust is reasonably certain to exercise such options impacts the lease term which, in turn, significantly affects the amount of lease obligations and right-of-use assets recognized.
Investment properties
The Trust’s policy relating to investment properties is described in note 2(d) of the audited combined financial statements for the year ended December 31, 2020. In applying this policy, judgment is used in determining whether certain costs incurred for tenant improvements are additions to the carrying amount of the property or represent incentives, identifying the point at which practical completion of properties under development occurs and determining borrowing costs to be capitalized to the carrying value of properties under development. Judgment is also applied in determining the use, extent and frequency of independent appraisals.
Income taxes
The Trust applies judgment in determining whether it will continue to qualify as a REIT for both Canadian and United States tax purposes for the foreseeable future. However, should it at some point no longer qualify, the Trust would be subject to income tax which could materially affect future distributions to unitholders and would also be required to recognize additional current and/or deferred income taxes.
Granite REIT 2021 Third Quarter Report 57
Table of Contents
Estimates and Assumptions
Valuation of investment properties
The fair value of investment properties is determined by management using primarily the discounted cash flow method in which the income and expenses are projected over the anticipated term of the investment plus a terminal value discounted using an appropriate discount rate. The Trust obtains, from time to time, appraisals from independent qualified real estate valuation experts. However, the Trust does not measure its investment properties based on these appraisals but uses them as data points, together with other external market information accumulated by management, in arriving at its own conclusions on values. Management uses valuation assumptions such as discount rates, terminal capitalization rates and market rental rates applied in external appraisals or sourced from valuation experts; however, the Trust also uses its historical renewal experience with tenants, its direct knowledge of the specialized nature of certain of Granite’s portfolio and tenant profile and its knowledge of the actual condition of the properties in making business judgments about lease renewal probabilities, renewal rents and capital expenditures. There has been no change in the valuation methodology used during the three and nine months ended September 30, 2021. The critical assumptions relating to the Trust’s estimates of fair values of investment properties include the receipt of contractual rents, contractual renewal terms, expected future market rental rates, discount rates that reflect current market uncertainties, capitalization rates and recent investment property prices. If there is any change in these assumptions or regional, national or international economic conditions, the fair value of investment properties may change materially. Refer to the “Investment Properties” section and note 4 of the unaudited condensed combined financial statements for the three and nine months ended September 30, 2021 for further information on the estimates and assumptions made by management in connection with the fair values of investment properties.
Fair value of financial instruments
Where the fair value of financial assets or liabilities recorded on the balance sheet or disclosed in the notes cannot be derived from active markets, it is determined using valuation techniques including the discounted cash flow model. The inputs to these models are taken from observable markets where possible but, where this is not feasible, a degree of judgment is required in establishing fair values. The judgments include considerations of inputs such as credit risk and volatility. Changes in assumptions about these factors could materially affect the reported fair value of financial instruments.
Income taxes
The Trust operates in a number of countries and is subject to the income tax laws and related tax treaties in each of its operating jurisdictions. These laws and treaties can be subject to different interpretations by relevant taxation authorities. Significant judgment is required in the estimation of Granite’s income tax expense, interpretation and application of the relevant tax laws and treaties and the provision for any exposure that may arise from tax positions that are under audit by relevant taxation authorities.
The recognition and measurement of deferred tax assets or liabilities is dependent on management’s estimate of future taxable profits and income tax rates that are expected to be in effect in the period the asset is realized or the liability is settled. Any changes in management’s estimates can result in changes in deferred tax assets or liabilities as reported in the combined balance sheets and also the deferred income tax expense in the combined statements of net income.
58 Granite REIT 2021 Third Quarter Report
Table of Contents
| NEW ACCOUNTING PRONOUNCEMENTS AND DEVELOPMENTS |
Future Accounting Policy Changes
As at September 30, 2021, there are no new accounting standards issued but not yet applicable to the unaudited condensed combined financial statements.
| INTERNAL CONTROLS OVER FINANCIAL REPORTING |
During the third quarter of 2021, there were no changes in the Trust’s internal controls over financial reporting that had materially affected or are reasonably likely to materially affect the internal controls over financial reporting.
| RISKS AND UNCERTAINTIES |
Investing in the Trust’s stapled units involves a high degree of risk. There are a number of risk factors that could have a material adverse effect on Granite’s business, financial condition, operating results and prospects. These risks and uncertainties are discussed in Granite’s AIF filed with securities regulators in Canada and available online at www.sedar.com and Annual Report on Form 40-F filed with the SEC and available online on EDGAR at www.sec.gov, each in respect of the year ended December 31, 2020 and remain substantially unchanged in respect of the three and nine month periods ended September 30, 2021.
Granite REIT 2021 Third Quarter Report 59
Table of Contents
| QUARTERLY FINANCIAL DATA (UNAUDITED) |
| (in millions, except as noted) | Q3’21 | Q2’21 | Q1’21 | Q4’20 | Q3’20 | Q2’20 | Q1’20 | Q4’19 | ||||||||||||||||||||||||
Operating highlights(1)(2) | ||||||||||||||||||||||||||||||||
Revenue | $ | 98.3 | $ | 94.0 | $ | 95.9 | $ | 93.2 | $ | 87.9 | $ | 81.0 | $ | 78.1 | $ | 73.6 | ||||||||||||||||
NOI — cash basis(1) | $ | 83.6 | $ | 79.9 | $ | 79.8 | $ | 76.3 | $ | 74.5 | $ | 71.0 | $ | 67.8 | $ | 63.8 | ||||||||||||||||
Fair value gain on investment properties, net | $ | 432.2 | $ | 308.0 | $ | 209.5 | $ | 140.8 | $ | 62.1 | $ | 34.5 | $ | 36.0 | $ | 47.5 | ||||||||||||||||
Net income attributable to stapled unitholders | $ | 421.8 | $ | 317.0 | $ | 230.2 | $ | 167.6 | $ | 105.2 | $ | 75.7 | $ | 81.3 | $ | 90.6 | ||||||||||||||||
Cash provided by operating activities | $ | 79.5 | $ | 64.7 | $ | 64.3 | $ | 60.3 | $ | 69.0 | $ | 65.2 | $ | 54.9 | $ | 50.9 | ||||||||||||||||
FFO(1) | $ | 65.2 | $ | 62.2 | $ | 57.1 | $ | 59.6 | $ | 55.5 | $ | 53.5 | $ | 56.8 | $ | 47.9 | ||||||||||||||||
AFFO(1) | $ | 61.2 | $ | 60.1 | $ | 54.7 | $ | 56.1 | $ | 52.7 | $ | 51.3 | $ | 55.6 | $ | 46.2 | ||||||||||||||||
FFO payout ratio(1) | 76% | 76% | 75% | 74% | 76% | 75% | 69% | 80% | ||||||||||||||||||||||||
AFFO payout ratio(1) | 81% | 79% | 78% | 79% | 80% | 78% | 70% | 83% | ||||||||||||||||||||||||
Per unit amounts | ||||||||||||||||||||||||||||||||
Diluted FFO(1) | $ | 0.99 | $ | 0.99 | $ | 0.93 | $ | 1.00 | $ | 0.96 | $ | 0.97 | $ | 1.05 | $ | 0.91 | ||||||||||||||||
Diluted AFFO(1) | $ | 0.93 | $ | 0.96 | $ | 0.89 | $ | 0.94 | $ | 0.91 | $ | 0.93 | $ | 1.03 | $ | 0.88 | ||||||||||||||||
Monthly distributions paid | $ | 0.75 | $ | 0.75 | $ | 0.75 | $ | 0.73 | $ | 0.73 | $ | 0.73 | $ | 0.73 | $ | 0.70 | ||||||||||||||||
Diluted weighted average number of units | 65.8 | 62.8 | 61.7 | 59.5 | 57.9 | 54.9 | 54.1 | 52.6 | ||||||||||||||||||||||||
Financial highlights | ||||||||||||||||||||||||||||||||
Investment properties(3) | $ | 7,286.3 | $ | 6,396.6 | $ | 6,003.7 | $ | 5,855.6 | $ | 5,338.9 | $ | 5,097.3 | $ | 4,810.0 | $ | 4,457.9 | ||||||||||||||||
Assets held for sale | $ | 43.2 | — | — | — | — | — | — | — | |||||||||||||||||||||||
Cash and cash equivalents | $ | 779.0 | $ | 678.1 | $ | 480.7 | $ | 831.3 | $ | 539.7 | $ | 617.2 | $ | 242.1 | $ | 298.7 | ||||||||||||||||
Total debt(4) | $ | 2,449.2 | $ | 1,936.0 | $ | 1,959.5 | $ | 2,297.5 | $ | 1,814.8 | $ | 1,800.5 | $ | 1,309.8 | $ | 1,250.3 | ||||||||||||||||
Total capital expenditures incurred | $ | 14.3 | $ | 3.2 | $ | 0.7 | $ | 13.3 | $ | 2.2 | $ | 6.2 | $ | 3.4 | $ | 1.0 | ||||||||||||||||
Total leasing costs incurred | $ | 2.5 | $ | 0.3 | — | $ | 2.1 | $ | 1.2 | $ | 2.0 | — | $ | 0.8 | ||||||||||||||||||
Property metrics(3) | ||||||||||||||||||||||||||||||||
Number of income-producing properties | 114 | 110 | 108 | 108 | 102 | 94 | 85 | 85 | ||||||||||||||||||||||||
GLA, square feet | 53.3 | 51.3 | 50.4 | 49.5 | 45.4 | 44.3 | 40.0 | 40.0 | ||||||||||||||||||||||||
Occupancy, by GLA | 99.2% | 99.3% | 99.1% | 99.6% | 98.9% | 99.1% | 99.0% | 99.0% | ||||||||||||||||||||||||
Weighted average lease term, years | 5.8 | 6.0 | 6.1 | 6.3 | 5.9 | 6.1 | 6.3 | 6.5 | ||||||||||||||||||||||||
| (1) | For definitions of Granite’s non-IFRS measures, refer to the section “NON-IFRS PERFORMANCE MEASURES”. |
| (2) | The quarterly financial data reflects fluctuations in revenue, FFO, AFFO, investment properties and total debt primarily from the timing of leasing and development activities, property sales, acquisitions and foreign exchange. Investment properties also fluctuate from the effect of measuring properties at fair value under IFRS. Net income attributable to unitholders primarily fluctuates from fair value gains/losses on investment properties. Explanations for specific changes in the quarterly financial data table above are as follows: |
| • | Q3’21 — Fair value gains on investment properties of $432.2 million were largely attributable to favourable changes in leasing assumptions associated with fair market rent increases as well as compression in discount and terminal capitalization rates for properties located in the GTA and across the United States and Europe. |
| • | Q2’21 — Fair value gains on investment properties of $308.0 million were largely attributable to favourable changes fair market rent assumptions as well as compression in discount and terminal capitalization rates for properties located in the GTA and across the United States as well as for certain of the Trust’s modern warehouse properties in Europe. |
60 Granite REIT 2021 Third Quarter Report
Table of Contents
| • | Q1’21 — Fair value gains on investment properties of $209.5 million were largely attributable to favourable changes fair market rent assumptions as well as compression in discount and terminal capitalization rates for properties located in the GTA and across the United States as well as for certain of the Trust’s modern warehouse properties in Europe. |
| • | Q4’20 — Fair value gains on investment properties of $140.8 million were largely attributable to (i) favourable changes in leasing assumptions associated with fair market rent increases as well as compression in discount and terminal capitalization rates for properties across the United States and certain warehouse properties in Germany and the Netherlands resulted from a greater market demand for industrial real estate. |
| • | Q3’20 — Fair value gains on investment properties of $62.1 million were largely attributable to favourable changes in leasing assumptions associated with fair market rent increases as well as compression in discount and terminal capitalization rates for properties located in the GTA and across the United States as well as compression in discount and terminal capitalization rates for certain of the Trust’s modern warehouse properties in Germany and the Netherlands. |
| • | Q2’20 — Fair value gains on investment properties of $34.5 million were largely attributable to (i) the favourable changes in leasing assumptions associated with fair market rent increases for properties located in Canada and (ii) the increase in fair value of the recently developed property in Plainfield, Indiana as a result of executing a full building 10-year lease with a new tenant, marginally offset by an increase in discount rates for certain properties located in Austria due to market conditions and the nature of the tenants and properties in this jurisdiction. |
| • | Q1’20 — Fair value gains on investment properties of $36.0 million were attributable to various factors including an increase in fair value for the recently acquired property in Dallas, Texas as a result of market confirmation of capitalization rates favourable to initial acquisition metrics of the forward purchase for this modern e-commerce facility, partially offset by an increase in discount rates for properties located in Austria and Germany due to market conditions and the nature of the properties across these jurisdictions. |
| • | Q4’19 — Net income attributable to unitholders, cash provided by operating activities and FFO included a net $2.0 million ($0.04 per unit) real estate transfer tax ($2.7 million) and related tax recovery ($0.7 million) which resulted from an internal reorganization. |
| (3) | Excludes properties held for sale which are classified as assets held for sale on the combined balance sheet as at the respective quarter-end. |
| (4) | Total debt includes lease obligations recognized under IFRS 16, Leases. |
| FORWARD-LOOKING STATEMENTS |
This MD&A may contain statements that, to the extent they are not recitations of historical fact, constitute “forward-looking statements” or “forward-looking information” within the meaning of applicable securities legislation, including the United States Securities Act of 1933, as amended, the United States Securities Exchange Act of 1934, as amended, and applicable Canadian securities legislation. Forward-looking statements and forward-looking information may include, among others, statements regarding Granite’s future plans, goals, strategies, intentions, beliefs, estimates, costs, objectives, capital structure, cost of capital, tenant base, tax consequences, economic performance or expectations, or the assumptions underlying any of the foregoing. Words such as “outlook”, “may”, “would”, “could”, “should”, “will”, “likely”, “expect”, “anticipate”, “believe”, “intend”, “plan”, “forecast”, “project”, “estimate”, “seek” and similar expressions are used to identify forward-looking statements and forward-looking information. Forward-looking statements and forward-looking information should not be read as guarantees of future events, performance or results and will not necessarily be accurate indications of whether or the times at or by which such future performance will be achieved. Undue reliance should not be placed on such statements. There can also be no assurance that: Granite’s expectations regarding the impact of the COVID-19 pandemic and government measures to contain it, including with respect to Granite’s ability to weather the impact of COVID-19, the effectiveness of measures intended to mitigate such impact, and Granite’s ability to deliver cash flow stability and growth and create long-term value for unitholders; Granite’s ability to implement its ESG+R program and related targets and goals; the expansion and diversification of Granite’s real estate portfolio and the reduction in Granite’s exposure to Magna and the special purpose properties;
Granite REIT 2021 Third Quarter Report 61
Table of Contents
the ability of Granite to accelerate growth and to grow its net asset value and FFO and AFFO per unit; the ability of Granite to find and integrate satisfactory acquisition, joint venture and development opportunities and to strategically deploy the proceeds from recently sold properties and financing initiatives; Granite’s sale from time to time of stapled units under its ATM Program; Granite’s intended use of the net proceeds of its equity and debenture offerings to fund potential acquisitions and for the other purposes described previously; the potential for expansion and rental growth at the properties in Mississauga and Ajax, Ontario and the expected enhancement to the yields of such properties from such potential expansion and rental growth; the expected construction on and development yield of the site in Houston, Texas; the expected development and construction of an e-commerce and logistics warehouse on land in Fort Worth, Texas; the expected construction of the distribution/light industrial facility on the 13-acre site in Altbach, Germany; the expected construction of a modern distribution facility on the 50.8 acre site in Murfreesboro, Tennessee; the expected development of three modern distribution facilities in Lebanon, Tennessee, and the expected yield from the development; the expected development of a multi-phased business park on the 92.2 acre site in Brantford, Ontario, and the potential yield from the project; the timing of payment of associated unpaid construction costs and holdbacks; Granite’s ability to dispose of any non-core assets on satisfactory terms; Granite’s ability to meet its target occupancy goals; Granite’s ability to secure sustainability or other certifications for any of its properties; the expected impact of the refinancing of the term loans on Granite’s returns and cash flow; and the expected amount of any distributions and distribution increase, can be achieved in a timely manner, with the expected impact or at all. Forward-looking statements and forward-looking information are based on information available at the time and/or management’s good faith assumptions and analyses made in light of Granite’s perception of historical trends, current conditions and expected future developments, as well as other factors Granite believes are appropriate in the circumstances. Given the impact of the COVID-19 pandemic and government measures to contain it, there is inherently more uncertainty associated with our assumptions as compared to prior periods. Forward-looking statements and forward-looking information are subject to known and unknown risks, uncertainties and other unpredictable factors, many of which are beyond Granite’s control, that could cause actual events or results to differ materially from such forward-looking statements and forward-looking information. Important factors that could cause such differences include, but are not limited to, the impact of the COVID-19 pandemic and government measures to contain it, and the resulting economic downturn, on Granite’s business, operations and financial condition; the risk that the pandemic or such measures intensify; the duration of the pandemic and related impacts; the risk of changes to tax or other laws and treaties that may adversely affect Granite REIT’s mutual fund trust status under the Income Tax Act (Canada) or the effective tax rate in other jurisdictions in which Granite operates; economic, market and competitive conditions and other risks that may adversely affect Granite’s ability to expand and diversify its real estate portfolio and dispose of any non-core assets on satisfactory terms; and the risks set forth in the “Risk Factors” section in Granite’s AIF for 2020 dated March 3, 2021, filed on SEDAR at www.sedar.com and attached as Exhibit 1 to the Trust’s Annual Report on Form 40-F for the year ended December 31, 2020 filed with the SEC and available online on EDGAR at www.sec.gov, all of which investors are strongly advised to review. The “Risk Factors” section also contains information about the material factors or assumptions underlying such forward-looking statements and forward-looking information. Forward-looking statements and forward-looking information speak only as of the date the statements and information were made and unless otherwise required by applicable securities laws, Granite expressly disclaims any intention and undertakes no obligation to update or revise any forward-looking statements or forward-looking information contained in this MD&A to reflect subsequent information, events or circumstances or otherwise.
62 Granite REIT 2021 Third Quarter Report
Table of Contents

Condensed Combined Financial Statements
of Granite Real Estate Investment Trust
and Granite REIT Inc.
For the three and nine months ended September 30, 2021 and 2020
Table of Contents
Condensed Combined Balance Sheets
(Canadian dollars in thousands)
(Unaudited)
| As at | Note | September 30, 2021 | December 31, 2020 | |||||||||
ASSETS | ||||||||||||
Non-current assets: | ||||||||||||
Investment properties | 4 | $ | 7,286,250 | $ | 5,855,583 | |||||||
Construction funds in escrow | 6 | — | 8,402 | |||||||||
Acquisition deposits | 17,708 | — | ||||||||||
Deferred tax assets | 4,326 | 4,730 | ||||||||||
Fixed assets, net | 2,748 | 3,290 | ||||||||||
Cross currency interest rate swaps | 7(b) | 39,117 | 28,676 | |||||||||
Loan receivable | 6 | 5,175 | — | |||||||||
Other assets | 6 | 2,933 | 948 | |||||||||
| 7,358,257 | 5,901,629 | |||||||||||
Current assets: | ||||||||||||
Assets held for sale | 5 | 43,200 | — | |||||||||
Accounts receivable | 7,065 | 6,746 | ||||||||||
Income taxes receivable | 1,558 | 915 | ||||||||||
Prepaid expenses and other | 6,650 | 6,902 | ||||||||||
Cash and cash equivalents | 14(d) | 778,965 | 831,280 | |||||||||
Total assets | $ | 8,195,695 | $ | 6,747,472 | ||||||||
LIABILITIES AND EQUITY | ||||||||||||
Non-current liabilities: | ||||||||||||
Unsecured debt, net | 7(a) | $ | 2,424,878 | $ | 1,928,252 | |||||||
Cross currency interest rate swaps | 7(b) | 30,826 | 97,311 | |||||||||
Long-term portion of lease obligations | 8 | 31,934 | 32,944 | |||||||||
Deferred tax liabilities | 539,910 | 392,841 | ||||||||||
| 3,027,548 | 2,451,348 | |||||||||||
Current liabilities: | ||||||||||||
Unsecured debt, net | 7(a) | — | 249,870 | |||||||||
Cross currency interest rate swaps | 7(b) | — | 16,953 | |||||||||
Deferred revenue | 9 | 14,862 | 11,276 | |||||||||
Accounts payable and accrued liabilities | 9 | 81,777 | 61,197 | |||||||||
Distributions payable | 10 | 16,423 | 15,422 | |||||||||
Short-term portion of lease obligations | 8 | 619 | 829 | |||||||||
Income taxes payable | 23,959 | 18,373 | ||||||||||
Total liabilities | 3,165,188 | 2,825,268 | ||||||||||
Equity: | ||||||||||||
Stapled unitholders’ equity | 11 | 5,028,240 | 3,920,069 | |||||||||
Non-controlling interests | 2,267 | 2,135 | ||||||||||
Total equity | 5,030,507 | 3,922,204 | ||||||||||
Total liabilities and equity | $ | 8,195,695 | $ | 6,747,472 | ||||||||
Commitments and contingencies (note 17)
See accompanying notes
64 Granite REIT 2021 Third Quarter Report
Table of Contents
Condensed Combined Statements of Net Income
(Canadian dollars in thousands)
(Unaudited)
| Three Months Ended September 30, | Nine Months Ended September 30, | |||||||||||||||||||
| Note | 2021 | 2020 | 2021 | 2020 | ||||||||||||||||
Rental revenue | 12(a) | $ | 98,270 | $ | 87,900 | $ | 288,175 | $ | 246,958 | |||||||||||
Property operating costs | 12(b) | 13,765 | 11,417 | 41,795 | 31,428 | |||||||||||||||
Net operating income | 84,505 | 76,483 | 246,380 | 215,530 | ||||||||||||||||
General and administrative expenses | 12(c) | 8,870 | 9,572 | 26,024 | 24,285 | |||||||||||||||
Depreciation and amortization | 360 | 286 | 1,051 | 794 | ||||||||||||||||
Interest income | (848 | ) | (535 | ) | (2,214 | ) | (1,810 | ) | ||||||||||||
Interest expense and other financing costs | 12(d) | 10,691 | 10,587 | 35,088 | 24,995 | |||||||||||||||
Foreign exchange gains, net | (1,228 | ) | (247 | ) | (3,023 | ) | (2,989 | ) | ||||||||||||
Fair value gains on investment properties, net | 4 | (432,238 | ) | (62,045 | ) | (949,779 | ) | (132,586 | ) | |||||||||||
Fair value losses (gains) on financial instruments, net | 12(e) | 1,302 | (1,048 | ) | 1,790 | 4,737 | ||||||||||||||
Loss on sale of investment properties | 5 | 16 | 164 | 592 | 164 | |||||||||||||||
Income before income taxes | 497,580 | 119,749 | 1,136,851 | 297,940 | ||||||||||||||||
Income tax expense | 13 | 75,802 | 14,513 | 167,823 | 35,650 | |||||||||||||||
Net income | $ | 421,778 | $ | 105,236 | $ | 969,028 | $ | 262,290 | ||||||||||||
Net income attributable to: | ||||||||||||||||||||
Stapled unitholders | $ | 421,751 | $ | 105,199 | $ | 968,795 | $ | 262,152 | ||||||||||||
Non-controlling interests | 27 | 37 | 233 | 138 | ||||||||||||||||
| $ | 421,778 | $ | 105,236 | $ | 969,028 | $ | 262,290 | |||||||||||||
See accompanying notes
Granite REIT 2021 Third Quarter Report 65
Table of Contents
Condensed Combined Statements of Comprehensive Income
(Canadian dollars in thousands)
(Unaudited)
| Three Months Ended September 30, | Nine Months Ended September 30, | |||||||||||||||||||
| Note | 2021 | 2020 | 2021 | 2020 | ||||||||||||||||
Net income | $ | 421,778 | $ | 105,236 | $ | 969,028 | $ | 262,290 | ||||||||||||
Other comprehensive income (loss): | ||||||||||||||||||||
Foreign currency translation adjustment(1) | 67,196 | (24,631 | ) | (96,883 | ) | 139,517 | ||||||||||||||
Unrealized (loss) gain on net investment hedges, includes income taxes of nil(1) | 7 | (b) | (19,622 | ) | (15,930 | ) | 73,797 | (60,276 | ) | |||||||||||
Total other comprehensive income (loss) | 47,574 | (40,561 | ) | (23,086 | ) | 79,241 | ||||||||||||||
Comprehensive income | $ | 469,352 | $ | 64,675 | $ | 945,942 | $ | 341,531 | ||||||||||||
(1) Items that may be reclassified subsequently to net income if a foreign subsidiary is disposed of or hedges are terminated or no longer assessed as effective.
|
| |||||||||||||||||||
Comprehensive income attributable to: | ||||||||||||||||||||
Stapled unitholders | $ | 469,316 | $ | 64,641 | $ | 945,743 | $ | 341,376 | ||||||||||||
Non-controlling interests | 36 | 34 | 199 | 155 | ||||||||||||||||
| $ | 469,352 | $ | 64,675 | $ | 945,942 | $ | 341,531 | |||||||||||||
See accompanying notes
66 Granite REIT 2021 Third Quarter Report
Table of Contents
Condensed Combined Statements of Unitholders’ Equity
(Canadian dollars in thousands)
(Unaudited)
| Nine Months Ended September 30, 2021 | ||||||||||||||||||||||||||||||||
Number of units (000s) | Stapled units | Contributed surplus | Retained earnings | Accumulated other comprehensive income (loss) | Stapled unitholders’ equity | Non- controlling interests | Equity | |||||||||||||||||||||||||
As at January 1, 2021 | 61,688 | $ | 3,139,194 | $ | 53,326 | $ | 631,649 | $ | 95,900 | $ | 3,920,069 | $ | 2,135 | $ | 3,922,204 | |||||||||||||||||
Net income | — | — | — | 968,795 | — | 968,795 | 233 | 969,028 | ||||||||||||||||||||||||
Other comprehensive loss | — | — | — | — | (23,052 | ) | (23,052 | ) | (34 | ) | (23,086 | ) | ||||||||||||||||||||
Stapled unit offering, net of issuance costs (note 11(c)) | 3,979 | 303,097 | — | — | — | 303,097 | — | 303,097 | ||||||||||||||||||||||||
Distributions (note 10) | — | — | — | (142,812 | ) | — | (142,812 | ) | (144 | ) | (142,956 | ) | ||||||||||||||||||||
Contributions from non-controlling interests | — | — | — | — | — | — | 77 | 77 | ||||||||||||||||||||||||
Units issued under the stapled unit plan (note 11(a)) | 26 | 2,143 | — | — | — | 2,143 | — | 2,143 | ||||||||||||||||||||||||
As at September 30, 2021 | 65,693 | $ | 3,444,434 | $ | 53,326 | $ | 1,457,632 | $ | 72,848 | $ | 5,028,240 | $ | 2,267 | $ | 5,030,507 | |||||||||||||||||
| Nine Months Ended September 30, 2020 | ||||||||||||||||||||||||||||||||
Number of units (000s) | Stapled units | Contributed surplus | Retained earnings | Accumulated other comprehensive income | Stapled unitholders’ equity | Non- controlling interests | Equity | |||||||||||||||||||||||||
As at January 1, 2020 | 54,052 | $ | 2,608,050 | $ | 54,654 | $ | 367,249 | $ | 116,190 | $ | 3,146,143 | $ | 1,967 | $ | 3,148,110 | |||||||||||||||||
Net income | — | — | — | 262,152 | — | 262,152 | 138 | 262,290 | ||||||||||||||||||||||||
Other comprehensive income | — | — | — | — | 79,224 | 79,224 | 17 | 79,241 | ||||||||||||||||||||||||
Stapled unit offering, net of issuance costs (note 11(c)) | 4,255 | 276,918 | — | — | — | 276,918 | — | 276,918 | ||||||||||||||||||||||||
Distributions (note 10) | — | — | — | (121,054 | ) | — | (121,054 | ) | (130 | ) | (121,184 | ) | ||||||||||||||||||||
Contributions from non-controlling interests | — | — | — | — | — | — | 94 | 94 | ||||||||||||||||||||||||
Units issued under the stapled unit plan (note 11(a)) | 31 | 1,977 | — | — | — | 1,977 | — | 1,977 | ||||||||||||||||||||||||
Units repurchased for cancellation (note 11(b)) | (491 | ) | (23,689 | ) | (1,328 | ) | — | — | (25,017 | ) | — | (25,017 | ) | |||||||||||||||||||
As at September 30, 2020 | 57,847 | $ | 2,863,256 | $ | 53,326 | $ | 508,347 | $ | 195,414 | $ | 3,620,343 | $ | 2,086 | $ | 3,622,429 | |||||||||||||||||
See accompanying notes
Granite REIT 2021 Third Quarter Report 67
Table of Contents
Condensed Combined Statements of Cash Flows
(Canadian dollars in thousands)
(Unaudited)
| Three Months Ended September 30, | Nine Months Ended September 30, | |||||||||||||||||||
| Note | 2021 | 2020 | 2021 | 2020 | ||||||||||||||||
OPERATING ACTIVITIES | ||||||||||||||||||||
Net income | $ | 421,778 | $ | 105,236 | $ | 969,028 | $ | 262,290 | ||||||||||||
Items not involving operating cash flows | 14(a) | (354,573 | ) | (48,497 | ) | (777,258 | ) | (91,827 | ) | |||||||||||
Current income tax expense | 13(a) | 2,406 | 2,159 | 8,709 | 5,535 | |||||||||||||||
Income taxes paid | (1,247 | ) | (4,789 | ) | (3,035 | ) | (4,766 | ) | ||||||||||||
Interest expense | 10,381 | 10,094 | 29,794 | 23,678 | ||||||||||||||||
Interest paid | (9,776 | ) | (5,597 | ) | (24,164 | ) | (17,901 | ) | ||||||||||||
Changes in working capital balances | 14(b) | 10,468 | 10,388 | 5,403 | 12,016 | |||||||||||||||
Cash provided by operating activities | 79,437 | 68,994 | 208,477 | 189,025 | ||||||||||||||||
INVESTING ACTIVITIES | ||||||||||||||||||||
Investment properties: | ||||||||||||||||||||
Property acquisitions | 3 | (380,802 | ) | (114,713 | ) | (600,091 | ) | (565,346 | ) | |||||||||||
Working capital acquired on acquisitions | — | (7,252 | ) | — | (7,252 | ) | ||||||||||||||
Proceeds from (costs of) disposals, net | 4, 5 | (16 | ) | 35,468 | 23,188 | 35,468 | ||||||||||||||
Leasing commissions paid | (5,359 | ) | (2,535 | ) | (6,239 | ) | (2,535 | ) | ||||||||||||
Tenant allowances paid | (227 | ) | (349 | ) | (528 | ) | (590 | ) | ||||||||||||
Additions to income-producing properties | (12,065 | ) | (3,350 | ) | (19,185 | ) | (13,351 | ) | ||||||||||||
Additions to properties under development | (16,926 | ) | (7,923 | ) | (27,875 | ) | (33,434 | ) | ||||||||||||
Construction funds released from escrow | 6 | 8,313 | 2,012 | 8,341 | 8,603 | |||||||||||||||
Loan receivable advances | 6 | (5,151 | ) | — | (5,151 | ) | — | |||||||||||||
Acquisition deposits paid | (16,912 | ) | — | (17,912 | ) | — | ||||||||||||||
Fixed asset additions | (82 | ) | (314 | ) | (479 | ) | (1,048 | ) | ||||||||||||
Cash used in investing activities | (429,227 | ) | (98,956 | ) | (645,931 | ) | (579,485 | ) | ||||||||||||
FINANCING ACTIVITIES | ||||||||||||||||||||
Monthly distributions paid | (49,261 | ) | (41,994 | ) | (141,812 | ) | (120,134 | ) | ||||||||||||
Proceeds from unsecured debentures, net of financing costs | 497,840 | (999 | ) | 497,840 | 496,895 | |||||||||||||||
Repayment of lease obligations | 8 | (195 | ) | (198 | ) | (554 | ) | (642 | ) | |||||||||||
Repayment of unsecured debt, including early redemption premium | 7(a) | — | — | (253,963 | ) | — | ||||||||||||||
Settlement of cross currency interest rate swap | 7(a) | — | — | (18,787 | ) | — | ||||||||||||||
Financing costs paid | 6 | — | — | (2,914 | ) | (30 | ) | |||||||||||||
Distributions to non-controlling interests | — | — | (144 | ) | (130 | ) | ||||||||||||||
Proceeds from stapled unit offerings, net of issuance costs | 11(c) | (35 | ) | (593 | ) | 303,097 | 276,918 | |||||||||||||
Repurchase of stapled units | 11(b) | — | — | — | (25,017 | ) | ||||||||||||||
Cash provided by (used in) financing activities | 448,349 | (43,784 | ) | 382,763 | 627,860 | |||||||||||||||
Effect of exchange rate changes on cash and cash equivalents | 2,264 | (3,825 | ) | 2,376 | 3,600 | |||||||||||||||
Net increase (decrease) in cash and cash equivalents during the period | 100,823 | (77,571 | ) | (52,315 | ) | 241,000 | ||||||||||||||
Cash and cash equivalents, beginning of period | 678,142 | 617,248 | 831,280 | 298,677 | ||||||||||||||||
Cash and cash equivalents, end of period | $ | 778,965 | $ | 539,677 | $ | 778,965 | $ | 539,677 | ||||||||||||
See accompanying notes
68 Granite REIT 2021 Third Quarter Report
Table of Contents
Notes to Condensed Combined Financial Statements
(All amounts in thousands of Canadian dollars unless otherwise noted)
(Unaudited)
1. NATURE AND DESCRIPTION OF THE TRUST |
Effective January 3, 2013, Granite Real Estate Inc. (“Granite Co.”) completed its conversion from a corporate structure to a stapled unit real estate investment trust (“REIT”) structure. All of the common shares of Granite Co. were exchanged, on a one-for-one basis, for stapled units, each of which consists of one unit of Granite Real Estate Investment Trust (“Granite REIT”) and one common share of Granite REIT Inc. (“Granite GP”). Granite REIT is an unincorporated, open-ended, limited purpose trust established under and governed by the laws of the province of Ontario and created pursuant to a Declaration of Trust dated September 28, 2012 and as subsequently amended on January 3, 2013 and December 20, 2017. Granite GP was incorporated on September 28, 2012 under the Business Corporations Act (British Columbia). Granite REIT, Granite GP and their subsidiaries (together “Granite” or the “Trust”) are carrying on the business previously conducted by Granite Co.
The stapled units trade on the Toronto Stock Exchange and on the New York Stock Exchange. The principal office of Granite REIT is 77 King Street West, Suite 4010, P.O. Box 159, Toronto-Dominion Centre, Toronto, Ontario, M5K 1H1, Canada. The registered office of Granite GP is Suite 2600, Three Bentall Centre, 595 Burrard Street, P.O. Box 49314, Vancouver, British Columbia, V7X 1L3, Canada.
The Trust is a Canadian-based REIT engaged in the acquisition, development, ownership and management of logistics, warehouse and industrial properties in North America and Europe.
These condensed combined financial statements were approved by the Board of Trustees of Granite REIT and Board of Directors of Granite GP on November 3, 2021.
2. SIGNIFICANT ACCOUNTING POLICIES |
| (a) | Basis of Presentation and Statement of Compliance |
The condensed combined financial statements for the three and nine month periods ended September 30, 2021 have been prepared in accordance with International Accounting Standard 34, Interim Financial Reporting (“IAS 34”) as issued by the International Accounting Standards Board (“IASB”). These interim condensed combined financial statements do not include all the information and disclosures required in the annual financial statements, which were prepared in accordance with International Financial Reporting Standards (“IFRS”), and should be read in conjunction with the Trust’s annual financial statements as at and for the year ended December 31, 2020.
| (b) | Combined Financial Statements and Basis of Consolidation |
As a result of the REIT conversion described in note 1, the Trust does not have a single parent; however, each unit of Granite REIT and each share of Granite GP trade as a single stapled unit and accordingly, Granite REIT and Granite GP have identical ownership. Therefore, these financial statements have been prepared on a combined basis whereby the assets, liabilities and results of Granite GP and Granite REIT have been combined. The combined financial statements include the subsidiaries of Granite GP and Granite REIT. Subsidiaries are fully consolidated by Granite GP or Granite REIT from the date of acquisition, being the date on which control is obtained. The subsidiaries continue to be consolidated until the date that such control ceases. Control exists
Granite REIT 2021 Third Quarter Report 69
Table of Contents
when Granite GP or Granite REIT have power, exposure or rights to variable returns and the ability to use their power over the entity to affect the amount of returns it generates.
All intercompany balances, income and expenses and unrealized gains and losses resulting from intercompany transactions are eliminated.
| (c) | Accounting policies |
The condensed combined financial statements have been prepared using the same accounting policies as were used for the Trust’s annual combined financial statements and the notes thereto for the year ended December 31, 2020.
| (d) | Future Accounting Policy Changes |
As at September 30, 2021, there are no new accounting standards issued but not yet applicable to the condensed combined financial statements.
| (e) | COVID-19 Pandemic |
The coronavirus disease (“COVID-19”) pandemic has resulted in governments across Granite’s operating markets enacting emergency measures to combat the spread of the virus. These measures, which include the implementation of travel bans, self-imposed quarantine periods and social distancing, have caused material disruption to businesses globally resulting in an economic slowdown. Global equity and capital markets have also experienced significant volatility during this time. Governments across the globe have reacted with significant monetary and fiscal interventions designed to stabilize economic conditions. Granite is continuing to monitor the impact of the COVID-19 pandemic on its business, liquidity and results of operations.
During the three and nine month periods ended September 30, 2021, there has not been any significant impact on Granite’s operations, assets or liabilities as a result of COVID-19. Throughout the pandemic thus far, Granite has not realized any negative impacts on rent collections and therefore has not recognized any provisions for uncollected rent at this time as a result of COVID-19. Granite reviewed its future cash flow projections and the valuation of its properties considering the impacts of the COVID-19 pandemic during the nine month period ended September 30, 2021 and Granite does not expect, at this time, that COVID-19 will have a significant negative impact to the fair value of its investment property portfolio.
Granite continues to review its future cash flow projections and the valuation of its investment properties in light of the COVID-19 pandemic. The carrying value of Granite’s investment properties reflects its best estimate for the highest and best use as at September 30, 2021 (note 4). The duration of the COVID-19 pandemic, and the potential for further waves of new infections in the markets where Granite operates that could lead to additional emergency measures, cannot be predicted. As such, the length and full scope of the economic impact of COVID-19 and other consequential changes it will have on Granite’s business and operations in the long-term cannot be forecasted with certainty at this time. Certain aspects of Granite’s business and operations that could potentially be impacted include rental income, occupancy, capital expenditures, future demand for space and market rents, all of which ultimately impact the underlying valuation of investment properties.
70 Granite REIT 2021 Third Quarter Report
Table of Contents
3. ACQUISITIONS |
During the nine month periods ended September 30, 2021 and 2020, Granite made the following property acquisitions:
Acquisitions During The Nine Months Ended September 30, 2021
| Property | Location | Date acquired | Property purchase price | Transaction costs | Total acquisition cost | |||||||||||||||
Income-producing properties: | ||||||||||||||||||||
3090 Highway 42 (1) | Locust Grove, GA | March 12, 2021 | $ | 85,138 | $ | 401 | $ | 85,539 | ||||||||||||
3801 Rock Creek Blvd. | Joliet, IL | June 25, 2021 | 30,247 | 75 | 30,322 | |||||||||||||||
3900 Rock Creek Blvd. | Joliet, IL | June 25, 2021 | 34,673 | 85 | 34,758 | |||||||||||||||
1695-1701 Crossroads Dr. | Joliet, IL | June 25, 2021 | 50,657 | 118 | 50,775 | |||||||||||||||
US Portfolio (four properties): |
| |||||||||||||||||||
1243 Gregory Dr. | Antioch, IL | |||||||||||||||||||
60 Logistics Blvd. | Richwood, KY | |||||||||||||||||||
8740 South Crossroads Dr. | Olive Branch, MS | |||||||||||||||||||
12577 State Line Rd. | Olive Branch, MS | September 3, 2021 | 243,697 | 337 | 244,034 | |||||||||||||||
1600 Rock Creek Blvd. | Joliet, IL | September 7, 2021 | 20,705 | 616 | 21,321 | |||||||||||||||
Sophialaan 5 | Utrecht, Netherlands | September 17, 2021 | 42,125 | 3,432 | 45,557 | |||||||||||||||
| 507,242 | 5,064 | 512,306 | ||||||||||||||||||
Properties under development: | ||||||||||||||||||||
2120 Logistics Way | Murfreesboro, TN | June 30, 2021 | 17,308 | 213 | 17,521 | |||||||||||||||
Highway 109 | Lebanon, TN | September 8, 2021 | 6,505 | 67 | 6,572 | |||||||||||||||
| 23,813 | 280 | 24,093 | ||||||||||||||||||
Development land: | ||||||||||||||||||||
375/395 Hardy Rd. | Brantford, ON | August 16, 2021 | 62,201 | 1,491 | 63,692 | |||||||||||||||
| $ | 593,256 | $ | 6,835 | $ | 600,091 | |||||||||||||||
| (1) | The Trust acquired the leasehold interest in the property which resulted in the recognition of a right-of-use asset, including transaction costs, of $85,913. The Trust will acquire freehold title to the property on December 1, 2028. |
Granite REIT 2021 Third Quarter Report 71
Table of Contents
Acquisitions During The Nine Months Ended September 30, 2020
| Property | Location | Date acquired | Property purchase price | Transaction costs | Total acquisition cost | |||||||||||||||
Property under development: | ||||||||||||||||||||
Aquamarijnweg 2 | | Bleiswijk, Netherlands |
| March 13, 2020 | $ | 35,632 | $ | 145 | $ | 35,777 | ||||||||||
Income-producing properties: | ||||||||||||||||||||
Oude Graaf 15 | Weert, Netherlands | May 1, 2020 | 31,910 | 297 | 32,207 | |||||||||||||||
De Kroonstraat 1 | Tilburg, Netherlands | July 1, 2020 | 71,716 | 646 | 72,362 | |||||||||||||||
Francis Baconstraat 4 | Ede, Netherlands | July 1, 2020 | 21,403 | 243 | 21,646 | |||||||||||||||
8995 Airport Road | Brampton, ON | September 1, 2020 | 22,173 | 452 | 22,625 | |||||||||||||||
555 Beck Crescent | Ajax, ON | September 30, 2020 | 15,350 | 335 | 15,685 | |||||||||||||||
Midwest portfolio (five properties): | ||||||||||||||||||||
6201 Green Pointe Drive South 8779 Le Saint Drive 8754 Trade Port Drive 445 Airtech Parkway | | Groveport, OH Hamilton, OH West Chester, OH Indianapolis, IN |
| June 18, 2020 | 177,647 | 785 | 178,432 | |||||||||||||
5415 Centerpoint Parkway | Obetz, OH | July 8, 2020 | 45,092 | 252 | 45,344 | |||||||||||||||
Memphis portfolio (three properties): | ||||||||||||||||||||
4460 E. Holmes Road 4995 Citation Drive 8650 Commerce Drive | | Memphis, TN Memphis, TN Southaven, MS |
| June 18, 2020 | 111,590 | 491 | 112,081 | |||||||||||||
Mississauga portfolio (four properties): | ||||||||||||||||||||
5600, 5610, 5620 and 5630 Timberlea Boulevard | Mississauga, ON | September 28, 2020 | 19,450 | 473 | 19,923 | |||||||||||||||
| 516,331 | 3,974 | 520,305 | ||||||||||||||||||
Development land: | ||||||||||||||||||||
5005 Parker Henderson Road | Fort Worth, TX | June 8, 2020 | 8,932 | 332 | 9,264 | |||||||||||||||
| $ | 560,895 | $ | 4,451 | $ | 565,346 | |||||||||||||||
During the nine month period ended September 30, 2021, transaction costs of $6.8 million (2020 — $4.5 million), which included land transfer taxes, and legal and advisory costs, were first capitalized to the cost of the respective properties and then subsequently expensed to net fair value gains on investment properties on the condensed combined statements of net income as a result of measuring the properties at fair value.
72 Granite REIT 2021 Third Quarter Report
Table of Contents
4. INVESTMENT PROPERTIES |
| As at | September 30, 2021 | December 31, 2020 | ||||||
Income-producing properties | $ | 7,097,891 | $ | 5,786,338 | ||||
Properties under development | 109,476 | 31,488 | ||||||
Land held for development | 78,883 | 37,757 | ||||||
| $ | 7,286,250 | $ | 5,855,583 | |||||
Changes in investment properties are shown in the following table:
| Nine Months Ended September 30, 2021 | Year Ended December 31, 2020 | |||||||||||||||||||||||||||||||
| Income- producing properties | Properties under development | Land held for development | Income- producing properties | Properties under | Land held for development | |||||||||||||||||||||||||||
Balance, beginning of period | $ | 5,786,338 | $ | 31,488 | $ | 37,757 | $ | 4,377,623 | $ | 51,310 | $ | 28,966 | ||||||||||||||||||||
Maintenance or improvements | 3,497 | — | — | 3,997 | — | — | ||||||||||||||||||||||||||
Leasing commissions | 2,456 | 3,298 | — | 3,449 | — | — | ||||||||||||||||||||||||||
Tenant allowances | 528 | — | — | 1,784 | — | — | ||||||||||||||||||||||||||
Developments or expansions | 6,094 | 34,559 | 47 | 12,582 | 39,083 | 458 | ||||||||||||||||||||||||||
Acquisitions (note 3) | 512,306 | 24,093 | 63,692 | 1,000,618 | 35,777 | 9,264 | ||||||||||||||||||||||||||
Costs to complete acquired property (note 6) | 8,344 | — | — | 8,622 | — | — | ||||||||||||||||||||||||||
Disposals (note 5) | (23,780 | ) | — | — | (31,276 | ) | — | — | ||||||||||||||||||||||||
Transfer to properties under development | — | 16,812 | (16,812 | ) | — | — | — | |||||||||||||||||||||||||
Transfer to income-producing properties | — | — | — | 97,733 | (97,733 | ) | — | |||||||||||||||||||||||||
Amortization of straight-line rent | 7,049 | — | — | 8,842 | — | — | ||||||||||||||||||||||||||
Amortization of tenant allowances | (3,880 | ) | — | — | (5,321 | ) | — | — | ||||||||||||||||||||||||
Other changes | 266 | — | — | (16 | ) | — | — | |||||||||||||||||||||||||
Fair value gains (losses), net | 951,413 | (280 | ) | (1,354 | ) | 273,914 | (145 | ) | (332 | ) | ||||||||||||||||||||||
Foreign currency translation, net | (113,061 | ) | (494 | ) | (926 | ) | 33,787 | 3,196 | (599 | ) | ||||||||||||||||||||||
Classified as assets held for sale (note 5) | (39,679 | ) | — | (3,521 | ) | — | — | — | ||||||||||||||||||||||||
Balance, end of period | $ | 7,097,891 | $ | 109,476 | $ | 78,883 | $ | 5,786,338 | $ | 31,488 | $ | 37,757 | ||||||||||||||||||||
The Trust determines the fair value of an income-producing property based upon, among other things, rental income from current leases and assumptions about rental income from future leases reflecting market conditions and lease renewals at the applicable balance sheet dates, less future cash outflows in respect of such leases. Fair values are primarily determined by discounting the expected future cash flows, generally over a term of 10 years, plus a terminal value based on the application of a capitalization rate to estimated year 11 cash flows. The fair values of properties under development are measured using a discounted cash flow model, net of costs to complete, as of the balance sheet date. The Trust measures its investment properties using valuations prepared by management. The Trust does not measure its investment properties based on valuations prepared by external appraisers but uses such external appraisals as data points,
Granite REIT 2021 Third Quarter Report 73
Table of Contents
together with other external market information accumulated by management, in arriving at its own conclusions on values. Management uses valuation assumptions such as discount rates, terminal capitalization rates and market rental rates applied in external appraisals or sourced from valuation experts; however, the Trust also uses its historical renewal experience with tenants, its direct knowledge of the specialized nature of certain of Granite’s portfolio and tenant profile and its knowledge of the actual condition of the properties in making business judgments about lease renewal probabilities, renewal rents and capital expenditures. There has been no change in the valuation methodology during the period.
Refer to note 2(e) for a discussion of the impact of the COVID-19 pandemic on the Trust’s business and operations, including the valuation of investment properties.
Included in investment properties is $34.0 million (December 31, 2020 — $27.2 million) of net straight-line rent receivables arising from the recognition of rental revenue on a straight-line basis over the lease term.
Details about contractual obligations to purchase, construct and develop properties can be found in the commitments and contingencies note (note 17).
Valuations are most sensitive to changes in discount rates and terminal capitalization rates. The key valuation metrics for income-producing properties by country are set out below:
| As at | September 30, 2021 | December 31, 2020 | ||||||||||||||||||||||||||||||
| Weighted average(1) | Maximum | Minimum | Weighted average(1) | Maximum | Minimum | |||||||||||||||||||||||||||
Canada | ||||||||||||||||||||||||||||||||
Discount rate | 5.10% | 5.75% | 4.50% | 5.71% | 6.25% | 5.25% | ||||||||||||||||||||||||||
Terminal capitalization rate | 4.52% | 5.25% | 4.00% | 5.22% | 5.50% | 4.75% | ||||||||||||||||||||||||||
United States | ||||||||||||||||||||||||||||||||
Discount rate | 5.66% | 9.25% | 4.75% | 6.18% | 9.25% | 5.00% | ||||||||||||||||||||||||||
Terminal capitalization rate | 4.94% | 8.50% | 4.00% | 5.58% | 8.50% | 4.75% | ||||||||||||||||||||||||||
Germany | ||||||||||||||||||||||||||||||||
Discount rate | 6.64% | 9.75% | 5.25% | 6.85% | 9.00% | 5.50% | ||||||||||||||||||||||||||
Terminal capitalization rate | 5.52% | 8.75% | 4.00% | 5.83% | 8.25% | 4.50% | ||||||||||||||||||||||||||
Austria | ||||||||||||||||||||||||||||||||
Discount rate | 8.38% | 9.50% | 8.00% | 8.58% | 10.50% | 8.25% | ||||||||||||||||||||||||||
Terminal capitalization rate | 7.25% | 7.75% | 6.75% | 7.47% | 9.75% | 7.00% | ||||||||||||||||||||||||||
Netherlands | ||||||||||||||||||||||||||||||||
Discount rate | 4.43% | 5.75% | 3.75% | 4.99% | 6.25% | 4.40% | ||||||||||||||||||||||||||
Terminal capitalization rate | 5.03% | 7.70% | 3.80% | 5.58% | 7.40% | 4.80% | ||||||||||||||||||||||||||
Other | ||||||||||||||||||||||||||||||||
Discount rate | 6.75% | 6.75% | 6.75% | 7.32% | 7.50% | 7.00% | ||||||||||||||||||||||||||
Terminal capitalization rate | 6.50% | 6.50% | 6.50% | 6.97% | 9.75% | 6.00% | ||||||||||||||||||||||||||
Total | ||||||||||||||||||||||||||||||||
Discount rate | 5.79% | 9.75% | 3.75% | 6.38% | 10.50% | 4.40% | ||||||||||||||||||||||||||
Terminal capitalization rate | 5.16% | 8.75% | 3.80% | 5.82% | 9.75% | 4.50% | ||||||||||||||||||||||||||
| (1) | Weighted based on income-producing property fair value. |
74 Granite REIT 2021 Third Quarter Report
Table of Contents
5. ASSETS HELD FOR SALE AND DISPOSITIONS |
Assets Held for Sale
At September 30, 2021, two income-producing properties and one piece of land located in Austria and Poland having a total fair value of $43.2 million are classified as assets held for sale. At December 31, 2020, there were no investment properties classified as assets held for sale.
Dispositions
During the nine month period ended September 30, 2021, Granite disposed of two properties located in the United Kingdom and Austria. The details of the disposed properties are as follows:
| Property | Location | Date disposed | Sale price | |||||||||
Hedera Road, Ravensbank Business Park | Redditch, United Kingdom | January 28, 2021 | $ | 10,550 | ||||||||
Puchberger Straße 267 | Weikersdorf, Austria | June 30, 2021 | 13,230 | |||||||||
| $ | 23,780 | |||||||||||
During the nine month period ended September 30, 2020, Granite disposed of two properties located in Canada for gross proceeds totaling $23.5 million.
During the three and nine month periods ended September 30, 2021, Granite incurred less than $0.1 million (2020 — $0.6 million) and $0.6 million (2020 — $0.6 million), respectively, of broker commissions and legal and advisory costs associated with the disposals which are included in loss on sale of investment properties on the condensed combined statements of net income. In connection with the disposal of a property in South Carolina in September 2018, on July 22, 2020, Granite settled the associated obligation in cash. Upon receipt of the proceeds receivable, a resulting gain of $0.4 million was realized which was included in loss on sale of investment properties on the condensed combined statement of net income.
6. NON-CURRENT ASSETS |
Construction Funds In Escrow
On November 19, 2019, Granite acquired a developed property located at 1301 Chalk Hill Road, Dallas, Texas which had outstanding construction work. Consequently, $20.5 million (US$15.5 million) of the purchase price was placed in escrow to pay for the remaining construction costs. The funds are released from escrow as the construction is completed. As construction is completed, the construction costs are capitalized to the cost of the investment property. During the nine month period ended September 30, 2021, $8.3 million (US$6.6 million) was released from escrow and capitalized to the property (note 4) (2020 — $8.6 million (US$6.3 million)). As at September 30, 2021, there was no outstanding balance in escrow (December 31, 2020 — $8.4 million (US$6.6 million)).
Loan Receivable
On September 1, 2021, Granite advanced $5.2 million (US$4.1 million) by means of a loan to the developer of two industrial properties being constructed in Indiana, United States. The loan has a maximum draw amount of $69.7 million (US$55.0 million). The loan, due upon completion of the development which is expected to be in late 2022, is secured by the properties under
Granite REIT 2021 Third Quarter Report 75
Table of Contents
construction and related land. As at September 30, 2021, the balance of the loan receivable is $5.2 million (US$4.1 million) (December 31, 2020 — nil).
Concurrently, on September 1, 2021, Granite entered into a purchase and sale agreement with the developer to acquire the two properties upon completion for $98.2 million (US$77.5 million) plus estimated leasing costs and sustainability features of $8.6 million (US$6.8 million), subject to customary closing conditions. On signing, the Trust paid a deposit to the seller of $6.3 million (US$5.0 million), which is included in Acquisition Deposits on the condensed combined balance sheet.
Other Assets
| As at | September 30, 2021 | December 31, 2020 | ||||||
Deferred financing costs associated with the revolving credit facility | $ | 2,615 | $ | 599 | ||||
Long-term receivables | 318 | 349 | ||||||
| $ | 2,933 | $ | 948 | |||||
On March 31, 2021, the Trust amended its existing unsecured revolving credit facility agreement to extend the existing maturity date from February 1, 2023 to March 31, 2026 and increased its borrowing capacity under the credit facility from $0.5 billion to $1.0 billion (note 9), resulting in financing costs of $2.9 million being incurred. In addition, during the nine month period ended September 30, 2021, Granite recorded an acceleration of $0.5 million amortization for its original credit facility’s financing costs (note 12(d)) (2020 — nil).
7. UNSECURED DEBT AND CROSS CURRENCY INTEREST RATE SWAPS |
| (a) | Unsecured Debentures and Term Loans, Net |
| As at | September 30, 2021 | December 31, 2020 | ||||||||||||||||||
| Maturity Date | Amortized Cost(1) | Principal issued and | Amortized Cost(1) | Principal issued and | ||||||||||||||||
2021 Debentures | July 5, 2021 | $ | — | $ | — | $ | 249,870 | $ | 250,000 | |||||||||||
2023 Debentures | November 30, 2023 | 399,306 | 400,000 | 399,066 | 400,000 | |||||||||||||||
2027 Debentures | June 4, 2027 | 497,507 | 500,000 | 497,179 | 500,000 | |||||||||||||||
2028 Debentures | August 30, 2028 | 497,186 | 500,000 | — | — | |||||||||||||||
2030 Debentures | December 18, 2030 | 497,262 | 500,000 | 497,060 | 500,000 | |||||||||||||||
2024 Term Loan | December 19, 2024 | 234,030 | 234,460 | 235,419 | 235,949 | |||||||||||||||
2026 Term Loan | December 11, 2026 | 299,587 | 300,000 | 299,528 | 300,000 | |||||||||||||||
| $ | 2,424,878 | $ | 2,434,460 | $ | 2,178,122 | $ | 2,185,949 | |||||||||||||
| (1) | The amounts outstanding are net of deferred financing costs and, in the case of the term loans, debt modification losses. The deferred financing costs and debt modification losses are amortized using the effective interest method and are recorded in interest expense. |
76 Granite REIT 2021 Third Quarter Report
Table of Contents
| As at | September 30, 2021 | December 31, 2020 | ||||||
Unsecured Debentures and Term Loans, Net | ||||||||
Non-current | $ | 2,424,878 | $ | 1,928,252 | ||||
Current | — | 249,870 | ||||||
| $ | 2,424,878 | $ | 2,178,122 | |||||
On January 4, 2021, Granite REIT Holdings Limited Partnership (“Granite LP”), a wholly-owned subsidiary of Granite, redeemed in full the outstanding $250.0 million aggregate principal amount of the 2021 Debentures. Granite incurred early redemption premium of $4.0 million, which have been recorded in interest expense and other financing costs in the condensed combined statement of net income (note 12(d)). In conjunction with the redemption, the 2021 Cross Currency Interest Rate Swap was terminated on January 4, 2021, and the related mark to market liability of $18.8 million was settled.
On August 30, 2021, Granite LP issued at par $500.0 million aggregate principal amount of 2.194% Series 6 senior unsecured debentures due August 30, 2028 (the “2028 Debentures”). Interest on the 2028 Debentures is payable semi-annually in arrears on February 28 and August 30 of each year. Deferred financing costs of $2.9 million were incurred in connection with the issuance of the 2028 Debentures and are recorded as a reduction against the principal owing.
The 2028 Debentures are redeemable, in whole or in part, at Granite’s option at any time and from time to time, at a price equal to accrued and unpaid interest plus the greater of (a) 100% of the principal amount of the 2028 Debentures to be redeemed; and (b) the Canada Yield Price. The Canada Yield Price means, in respect of a 2028 Debenture, a price equal to which, if the 2028 Debenture were to be issued at such price on the redemption date, would provide a yield thereon from the redemption date to its maturity date equal to 28.5 basis points above the yield that a non-callable Government of Canada bond, trading at par, would carry if issued on the redemption date with a maturity date of August 30, 2028. Granite also has the option to redeem the 2028 Debentures at par plus any accrued and unpaid interest within 60 days of the maturity date of August 30, 2028.
| (b) | Cross Currency Interest Rate Swaps |
| As at | September 30, 2021 | December 31, 2020 | ||||||
Financial assets at fair value | ||||||||
2027 Cross Currency Interest Rate Swap | $ | 27,681 | $ | 28,676 | ||||
2030 Cross Currency Interest Rate Swap | 11,436 | — | ||||||
| $ | 39,117 | $ | 28,676 | |||||
Financial liabilities at fair value | ||||||||
2021 Cross Currency Interest Rate Swap | $ | — | $ | 16,953 | ||||
2023 Cross Currency Interest Rate Swap | 10,501 | 36,540 | ||||||
2028 Cross Currency Interest Rate Swap | 9,416 | — | ||||||
2030 Cross Currency Interest Rate Swap | — | 10,545 | ||||||
2024 Cross Currency Interest Rate Swap | 10,598 | 25,370 | ||||||
2026 Cross Currency Interest Rate Swap | 311 | 24,856 | ||||||
| $ | 30,826 | $ | 114,264 | |||||
Granite REIT 2021 Third Quarter Report 77
Table of Contents
| As at | September 30, 2021 | December 31, 2020 | ||||||
Financial liabilities at fair value | ||||||||
Non-current | $ | 30,826 | $ | 97,311 | ||||
Current | — | 16,953 | ||||||
| $ | 30,826 | $ | 114,264 | |||||
On July 3, 2014, Granite LP entered into a cross currency interest rate swap (the “2021 Cross Currency Interest Rate Swap”) to exchange the 3.788% semi-annual interest payments from the 2021 Debentures for Euro denominated payments at a 2.68% fixed interest rate. In addition, under the terms of the swap, Granite LP will pay principal proceeds of €171.9 million in exchange for which it will receive $250.0 million on July 5, 2021. On January 4, 2021, the 2021 Cross Currency Interest Rate Swap was terminated in conjunction with the redemption of the 2021 Debentures (note 7(a)).
On December 20, 2016, Granite LP entered into a cross currency interest rate swap (the “2023 Cross Currency Interest Rate Swap”) to exchange the 3.873% semi-annual interest payments from the 2023 Debentures for Euro denominated payments at a 2.43% fixed interest rate. In addition, under the terms of the swap, Granite LP will pay principal proceeds of €281.1 million in exchange for which it will receive $400.0 million on November 30, 2023.
On September 24, 2019, in conjunction with a refinancing, Granite LP entered into a new cross currency interest rate swap (the “2024 Cross Currency Interest Rate Swap”) to exchange the LIBOR plus margin monthly interest payments from the 2024 Term Loan for Euro denominated payments at a 0.522% fixed interest rate. In addition, under the terms of the 2024 Cross Currency Interest Rate Swap, Granite LP will pay principal proceeds of €168.2 million in exchange for which it will receive US$185.0 million on December 19, 2024.
On November 27, 2019, also in conjunction with a refinancing, Granite LP entered into a new cross currency interest rate swap (the “2026 Cross Currency Interest Rate Swap”) to exchange the CDOR plus margin monthly interest payments from the 2026 Term Loan for Euro denominated payments at a 1.355% fixed interest rate. In addition, under the terms of the swap, Granite LP will pay principal proceeds of €205.5 million in exchange for which it will receive $300.0 million on December 11, 2026.
On June 4, 2020, Granite LP entered into a cross currency interest rate swap (the “2027 Cross Currency Interest Rate Swap”) to exchange the $500.0 million proceeds and the 3.062% semi-annual interest payments from the 2027 Debentures for US$370.3 million and US dollar denominated interest payments at a 2.964% fixed interest rate. In addition, under the terms of the swap, Granite LP will pay principal proceeds of US$370.3 million in exchange for which it will receive $500.0 million on June 4, 2027.
On December 18, 2020, Granite LP entered into a cross currency interest rate swap (the “2030 Cross Currency Interest Rate Swap”) to exchange the 2.378% semi-annual interest payments from the 2030 Debentures for Euro denominated interest payments at a 1.045% fixed interest rate. In addition, under the terms of the swap, Granite LP will pay principal proceeds of €319.4 million in exchange for which it will receive $500.0 million on December 18, 2030.
On August 30, 2021, Granite LP entered into a cross currency interest rate swap (the “2028 Cross Currency Interest Rate Swap”) to exchange the $500.0 million proceeds and the 2.194%
78 Granite REIT 2021 Third Quarter Report
Table of Contents
semi-annual interest payments from the 2028 Debentures for US$397.0 million and US dollar denominated interest payments at a 2.096% fixed interest rate. In addition, under the terms of the swap, Granite LP will pay principal proceeds of US$397.0 million in exchange for which it will receive $500.0 million on August 30, 2028.
The cross currency interest rate swaps are designated as net investment hedges of the Trust’s investments in foreign operations. The effectiveness of the hedges is assessed quarterly. Gains and losses associated with the effective portion of the hedges are recognized in other comprehensive income. For the three and nine month periods ended September 30, 2021, the Trust has assessed the net investment hedge associated with each cross currency interest rate swap, except for the 2021 Cross Currency Interest Rate Swap and a portion of the 2024 Cross Currency Interest Rate Swap, to be effective.
On December 18, 2020, as a result of the designation of the 2030 Cross Currency Interest Rate Swap, the Trust de-designated the 2021 Cross Currency Interest Rate Swap. Since the Trust did not employ hedge accounting for the 2021 Cross Currency Interest Rate Swap from the period January 1 to January 3, 2021, a fair value loss of $0.7 million is recognized in fair value losses on financial instruments, net (note 12(e)) in the condensed combined statement of net income.
With the refinancing of the 2024 Term Loan in 2019, the Trust has assessed only the foreign exchange movements associated with the fair value change of the 2024 Cross Currency Interest Rate Swap to be effective. Accordingly, the change in fair value relating to foreign exchange movements on the 2024 Cross Currency Interest Rate Swap is recorded in other comprehensive income. For the three and nine month periods ended September 30, 2021, since there is no effective hedge for the interest and other movements associated with the fair value change of the 2024 Cross Currency Interest Rate Swap, a fair value gain of $0.1 million and $1.0 million is recognized in fair value losses on financial instruments, net (note 12(e)), respectively, in the condensed combined statements of net income.
The Trust has elected to record the differences resulting from the lower interest rates associated with the cross currency interest rate swaps in the condensed combined statements of net income.
8. LEASE OBLIGATIONS |
As at September 30, 2021, the Trust had leases for the use of office space, office and other equipment, and ground leases for the land upon which four income-producing properties in Europe and Canada are situated. The Trust recognized these leases as right-of-use assets and recorded related lease liability obligations.
Future minimum lease payments relating to the right-of-use assets as at September 30, 2021 in aggregate for the next five years and thereafter are as follows:
Remainder of 2021 | $ | 137 | ||
2022 | 537 | |||
2023 | 323 | |||
2024 | 296 | |||
2025 | 263 | |||
2026 and thereafter | 30,997 | |||
| $ | 32,553 |
Granite REIT 2021 Third Quarter Report 79
Table of Contents
During the three and nine month periods ended September 30, 2021, the Trust recognized $0.4 million (2020 — $0.4 million) and $1.2 million (2020 — $1.2 million) of interest expense, respectively, related to lease obligations (note 12(d)).
9. CURRENT LIABILITIES |
Deferred Revenue
Deferred revenue relates to prepaid and unearned revenue received from tenants and fluctuates with the timing of rental receipts.
Bank Indebtedness
On March 31, 2021, the Trust amended its existing unsecured revolving credit facility agreement to extend the existing maturity date of February 1, 2023 to March 31, 2026. In addition, the credit facility’s limit increased from $0.5 billion to $1.0 billion. Draws on the credit facility are available by way of Canadian dollar, US dollar or Euro denominated loans or Canadian dollar or US dollar denominated letters of credit. The credit facility provides Granite the ability to increase the amount of the commitment by an additional aggregate principal amount of up to $500.0 million with the consent of the participating lenders. As at September 30, 2021, the Trust had no amounts drawn (December 31, 2020 — nil) from the credit facility and $1.7 million (December 31, 2020 — $1.0 million) in letters of credit issued against the facility.
Accounts Payable and Accrued Liabilities
| As at | September 30, 2021 | December 31, 2020 | ||||||
Accounts payable | $ | 1,699 | $ | 3,849 | ||||
Commodity tax payable | 6,475 | 4,337 | ||||||
Tenant security deposits | 6,893 | 6,793 | ||||||
Employee unit-based compensation | 8,095 | 7,118 | ||||||
Trustee/director unit-based compensation | 7,313 | 5,219 | ||||||
Accrued salaries, incentives and benefits | 4,067 | 5,783 | ||||||
Accrued interest payable | 14,550 | 7,956 | ||||||
Accrued construction payable | 11,644 | 6,285 | ||||||
Accrued professional fees | 2,224 | 2,620 | ||||||
Accrued property operating costs | 12,274 | 8,878 | ||||||
Other tenant related liabilities | 3,494 | 1,690 | ||||||
Other accrued liabilities | 3,049 | 669 | ||||||
| $ | 81,777 | $ | 61,197 | |||||
10. DISTRIBUTIONS TO STAPLED UNITHOLDERS |
Total distributions declared to stapled unitholders in the three month period ended September 30, 2021 were $49.3 million (2020 — $42.0 million) or 75.0 cents per stapled unit (2020 — 72.6 cents per stapled unit). Total distributions declared to stapled unitholders in the nine month period ended September 30, 2021 were $142.8 million (2020 — $121.1 million) or $2.25 per stapled unit (2020 — $2.18 per stapled unit).
80 Granite REIT 2021 Third Quarter Report
Table of Contents
Distributions payable at September 30, 2021 of $16.4 million (25.0 cents per stapled unit), representing the September 2021 monthly distribution, were paid on October 15, 2021. Distributions payable at December 31, 2020 of $15.4 million were paid on January 15, 2021 and represented the December 2020 monthly distribution.
Subsequent to September 30, 2021, the distributions declared in October 2021 in the amount of $16.4 million or 25.0 cents per stapled unit will be paid on November 15, 2021.
11. STAPLED UNITHOLDERS’ EQUITY |
| (a) | Unit-Based Compensation |
Incentive Stock Option Plan
The Incentive Stock Option Plan allows for the grant of stock options or stock appreciation rights to directors, officers, employees and consultants. As at September 30, 2021 and December 31, 2020, there were no options outstanding under this plan.
Director/Trustee Deferred Share Unit Plan
The Trust has two Non-Employee Director Share-Based Compensation Plans (the “DSPs”) which provide for a deferral of up to 100% of each non-employee director’s total annual remuneration, at specified levels elected by each director. A reconciliation of the changes in the notional deferred share units (“DSUs”) outstanding is presented below:
| 2021 | 2020 | |||||||||||||||||||
| Number (000s) | Weighted Average Grant Date Fair Value | Number (000s) | Weighted Average Grant Date Fair Value | |||||||||||||||||
DSUs outstanding, January 1 | 67 | $ | 52.93 | 50 | $ | 48.01 | ||||||||||||||
Granted | 14 | 78.89 | 13 | 66.73 | ||||||||||||||||
DSUs outstanding, September 30 | 81 | $ | 57.26 | 63 | $ | 51.87 | ||||||||||||||
Granite REIT 2021 Third Quarter Report 81
Table of Contents
Executive Deferred Stapled Unit Plan
The Executive Deferred Stapled Unit Plan (the “Restricted Stapled Unit Plan”) of the Trust provides for the issuance of Restricted Share Units (“RSUs”) and Performance Share Units (“PSUs”) and is designed to provide equity-based compensation in the form of stapled units to executives and other employees (the “Participants”). A reconciliation of the changes in notional stapled units outstanding under the Restricted Stapled Unit Plan is presented below:
| 2021 | 2020 | |||||||||||||||||||
| Number (000s) | Weighted Average Grant Date Fair Value | Number (000s) | Weighted Average Grant Date | |||||||||||||||||
RSUs and PSUs outstanding, January 1 | 128 | $ | 59.83 | 145 | $ | 55.93 | ||||||||||||||
New grants and distributions (1) | 50 | 78.50 | 53 | 66.61 | ||||||||||||||||
Forfeited | — | — | (1 | ) | 67.66 | |||||||||||||||
Settled in cash | (24 | ) | 59.21 | (33 | ) | 55.70 | ||||||||||||||
Settled in stapled units | (26 | ) | 59.21 | (31 | ) | 55.70 | ||||||||||||||
RSUs and PSUs outstanding, September 30(2) | 128 | $ | 66.98 | 133 | $ | 60.18 | ||||||||||||||
| (1) | Includes 18.7 RSUs and 25.0 PSUs granted during the nine month period ended September 30, 2021 (2020 — 20.8 RSUs and 26.5 PSUs). |
| (2) | Total restricted stapled units outstanding at September 30, 2021 include a total of 50.2 RSUs and 77.5 PSUs granted (2020 — 75.6 RSUs and 57.3 PSUs). |
The fair value of the outstanding RSUs was $5.1 million at September 30, 2021 and is based on the market price of the Trust’s stapled unit. The fair value is adjusted for changes in the market price of the Trust’s stapled unit and recorded as a liability in the employee unit-based compensation payables (note 9).
The fair value of the outstanding PSUs was $3.0 million at September 30, 2021 and is recorded as a liability in the employee unit-based compensation payables (note 9). The fair value is calculated using the Monte-Carlo simulation model based on the assumptions below as well as a market adjustment factor based on the total unitholder return of the Trust’s stapled units relative to the S&P/TSX Capped REIT Index.
| Grant Date | January 1, 2021, January 1, 2020, January 1, August 12 and September 24, 2019 | |||
PSUs granted | 76,100 | |||
Term to expiry | 2.3 years | |||
Average volatility rate | 25.0% | |||
Weighted average risk free interest rate | 0.5% | |||
82 Granite REIT 2021 Third Quarter Report
Table of Contents
The Trust’s unit-based compensation expense recognized in general and administrative expenses was:
Three Months Ended September 30, | Nine Months Ended September 30, | |||||||||||||||||||
| 2021 | 2020 | 2021 | 2020 | |||||||||||||||||
DSUs for trustees/directors (1) | $ | 1,010 | $ | 855 | $ | 2,055 | $ | 1,485 | ||||||||||||
Restricted Stapled Unit Plan for executives and employees | 2,045 | 2,394 | 5,272 | 4,768 | ||||||||||||||||
Unit-based compensation expense | $ | 3,055 | $ | 3,249 | $ | 7,327 | $ | 6,253 | ||||||||||||
Fair value remeasurement expense included in the above: | ||||||||||||||||||||
DSUs for trustees/directors | $ | 684 | $ | 522 | $ | 994 | $ | 638 | ||||||||||||
Restricted Stapled Unit Plan for executives and employees | 851 | 886 | 1,472 | 1,145 | ||||||||||||||||
Total fair value remeasurement expense | $ | 1,535 | $ | 1,408 | $ | 2,466 | $ | 1,783 | ||||||||||||
| (1) | In respect of fees mandated and elected to be taken as DSUs. |
| (b) | Normal Course Issuer Bid |
On May 19, 2021, Granite announced the acceptance by the Toronto Stock Exchange (“TSX”) of Granite’s Notice of Intention to Make a Normal Course Issuer Bid (“NCIB”). Pursuant to the NCIB, Granite proposes to purchase through the facilities of the TSX and any alternative trading system in Canada, from time to time and if considered advisable, up to an aggregate of 6,154,057 of Granite’s issued and outstanding stapled units. The NCIB commenced on May 21, 2021 and will conclude on the earlier of the date on which purchases under the bid have been completed and May 20, 2022. Pursuant to the policies of the TSX, daily purchases made by Granite through the TSX may not exceed 46,074 stapled units, subject to certain exceptions. Granite had entered into an automatic securities purchase plan with a broker in order to facilitate repurchases of the stapled units under the NCIB during specified blackout periods. Pursuant to a previous notice of intention to conduct a NCIB, Granite received approval from the TSX to purchase stapled units for the period May 21, 2020 to May 20, 2021.
During the nine month period ended September 30, 2021, there were no stapled unit repurchases under the NCIB. During the nine month period ended September 30, 2020, Granite repurchased 490,952 stapled units at an average stapled unit cost of $50.95 for total consideration of $25.0 million. The difference between the repurchase price and the average cost of the stapled units of $1.3 million was recorded to contributed surplus.
| (c) | Stapled Unit Offerings |
On June 9, 2021, Granite completed an offering of 3,979,000 stapled units at a price of $79.50 per unit for gross proceeds of $316.3 million, including 519,000 stapled units issued pursuant to the exercise of the over-allotment option granted to the underwriters. Total costs related to the offering totaled $13.2 million and were recorded as a reduction to stapled unitholders’ equity. The net proceeds received by Granite after deducting the total costs related to the offering were $303.1 million.
On June 2, 2020, Granite completed an offering of 4,255,000 stapled units at a price of $68.00 per unit for gross proceeds of $289.3 million, including 555,000 stapled units issued pursuant to the exercise of the over-allotment option granted to the underwriters. Total costs related to the
Granite REIT 2021 Third Quarter Report 83
Table of Contents
offering totaled $12.4 million and were recorded as a reduction to stapled unitholders’ equity. The net proceeds received by Granite after deducting the total costs related to the offering were $276.9 million.
| (d) | Accumulated Other Comprehensive Income |
Accumulated other comprehensive income consists of the following:
| As at September 30, | 2021 | 2020 | ||||||
Foreign currency translation gains on investments in subsidiaries, net of related hedging activities and non-controlling interests(1) | $ | 92,809 | $ | 292,320 | ||||
Fair value losses on derivatives designated as net investment hedges | (19,961 | ) | (96,906 | ) | ||||
| $ | 72,848 | $ | 195,414 | |||||
| (1) | Includes foreign currency translation gains and losses from non-derivative financial instruments designated as net investment hedges. |
12. RENTAL REVENUE, RECOVERIES, COSTS AND EXPENSES |
| (a) | Rental revenue consists of: |
Three Months Ended September 30, | Nine Months Ended September 30, | |||||||||||||||||
| 2021 | 2020 | 2021 | 2020 | |||||||||||||||
Base rent | $ | 84,232 | $ | 75,086 | $ | 244,449 | $ | 214,769 | ||||||||||
Straight-line rent amortization | 2,202 | 3,337 | 7,049 | 6,262 | ||||||||||||||
Tenant incentive amortization | (1,281 | ) | (1,377 | ) | (3,880 | ) | (3,963 | ) | ||||||||||
Property tax recoveries | 8,808 | 7,728 | 25,823 | 20,229 | ||||||||||||||
Property insurance recoveries | 956 | 742 | 2,461 | 1,941 | ||||||||||||||
Operating cost recoveries | 3,353 | 2,384 | 12,273 | 7,720 | ||||||||||||||
| $ | 98,270 | $ | 87,900 | $ | 288,175 | $ | 246,958 | |||||||||||
84 Granite REIT 2021 Third Quarter Report
Table of Contents
| (b) | Property operating costs consist of: |
| Three Months Ended September 30, | Nine Months Ended September 30, | |||||||||||||||||||
| 2021 | 2020 | 2021 | 2020 | |||||||||||||||||
Non-recoverable from tenants: | ||||||||||||||||||||
Property taxes and utilities | $ | 186 | $ | 253 | $ | 518 | $ | 723 | ||||||||||||
Property insurance | 88 | 81 | 321 | 218 | ||||||||||||||||
Repairs and maintenance | 90 | 210 | 231 | 538 | ||||||||||||||||
Property management fees | 164 | 72 | 327 | 236 | ||||||||||||||||
Professional fees | 38 | 61 | 186 | 136 | ||||||||||||||||
Environmental and appraisals | 74 | 22 | 203 | 259 | ||||||||||||||||
Other | 68 | 17 | 195 | 39 | ||||||||||||||||
| $ | 708 | $ | 716 | $ | 1,981 | $ | 2,149 | |||||||||||||
Recoverable from tenants: | ||||||||||||||||||||
Property taxes and utilities | $ | 9,770 | $ | 8,012 | $ | 28,605 | $ | 21,881 | ||||||||||||
Property insurance | 1,019 | 781 | 3,001 | 2,177 | ||||||||||||||||
Repairs and maintenance | 1,458 | 1,122 | 5,923 | 2,591 | ||||||||||||||||
Property management fees | 765 | 734 | 2,120 | 1,964 | ||||||||||||||||
Other | 45 | 52 | 165 | 666 | ||||||||||||||||
| $ | 13,057 | $ | 10,701 | $ | 39,814 | $ | 29,279 | |||||||||||||
Property operating costs | $ | 13,765 | $ | 11,417 | $ | 41,795 | $ | 31,428 | ||||||||||||
| (c) | General and administrative expenses consist of: |
| Three Months Ended September 30, | Nine Months Ended September 30, | |||||||||||||||||||
| 2021 | 2020 | 2021 | 2020 | |||||||||||||||||
Salaries, incentives and benefits | $ | 3,623 | $ | 4,061 | $ | 12,200 | $ | 11,105 | ||||||||||||
Audit, legal and consulting | 1,016 | 801 | 2,641 | 2,591 | ||||||||||||||||
Trustee/director fees including distributions, revaluations and expenses (1) | 1,066 | 895 | 2,191 | 1,635 | ||||||||||||||||
RSU and PSU compensation expense including distributions and revaluations (1) | 2,045 | 2,394 | 5,272 | 4,768 | ||||||||||||||||
Other public entity costs | 410 | 510 | 1,492 | 1,446 | ||||||||||||||||
Office rents including property taxes and common area maintenance costs | 108 | 111 | 310 | 309 | ||||||||||||||||
Capital tax | 144 | 290 | 436 | 630 | ||||||||||||||||
Information technology costs | 437 | 312 | 1,339 | 826 | ||||||||||||||||
Other | 248 | 221 | 574 | 1,016 | ||||||||||||||||
| $ | 9,097 | $ | 9,595 | $ | 26,455 | $ | 24,326 | |||||||||||||
Less: capitalized general and administrative expenses | (227 | ) | (23 | ) | (431 | ) | (41) | |||||||||||||
| $ | 8,870 | $ | 9,572 | $ | 26,024 | $ | 24,285 | |||||||||||||
| (1) | For fair value remeasurement expense amounts see note 11(a). |
Granite REIT 2021 Third Quarter Report 85
Table of Contents
During the three month and nine month periods ended September 30, 2021, Granite incurred less than $0.1 million (2020 — less than $0.1 million) and less than $0.1 million (2020 — $0.1 million), respectively, of general and administrative expenses relating to COVID-19.
| (d) | Interest expense and other financing costs consist of: |
| Three Months Ended September 30, | Nine Months Ended September 30, | |||||||||||||||||||
| 2021 | 2020 | 2021 | 2020 | |||||||||||||||||
Interest and amortized issuance costs and modification losses relating to debentures and term loans | $ | 9,500 | $ | 9,798 | $ | 27,280 | $ | 22,677 | ||||||||||||
Early redemption premium relating to 2021 Debentures (note 7(a)) | — | — | 3,963 | — | ||||||||||||||||
Amortization of deferred financing costs and other interest expense and charges (note 6) | 929 | 561 | 2,909 | 1,680 | ||||||||||||||||
Interest expense related to lease obligations (note 8) | 390 | 402 | 1,186 | 1,195 | ||||||||||||||||
| $ | 10,819 | $ | 10,761 | $ | 35,338 | $ | 25,552 | |||||||||||||
Less: capitalized interest | (128 | ) | (174 | ) | (250 | ) | (557 | ) | ||||||||||||
| $ | 10,691 | $ | 10,587 | $ | 35,088 | $ | 24,995 | |||||||||||||
| (e) | Fair value losses (gains) on financial instruments, net, consist of: |
| Three Months Ended September 30, | Nine Months Ended September 30, | |||||||||||||||||||
| 2021 | 2020 | 2021 | 2020 | |||||||||||||||||
Foreign exchange forward contracts, net (note 15(a)) | $ | — | $ | 215 | $ | — | $ | 226 | ||||||||||||
Foreign exchange collar contracts, net (note 15(a)) | 1,401 | 185 | 2,143 | (1,192 | ) | |||||||||||||||
Cross currency interest rate swaps (note 7(b)) | (99 | ) | (1,448 | ) | (353 | ) | 5,703 | |||||||||||||
| $ | 1,302 | $ | (1,048 | ) | $ | 1,790 | $ | 4,737 | ||||||||||||
For the three month period ended September 30, 2021, the fair value gain of $0.1 million is associated with the fair value movement of the 2024 Cross Currency Interest Rate Swap. For the nine month period ended September 30, 2021, the net fair value gain of $0.3 million is associated with the fair value movements of the 2021 Cross Currency Interest Rate Swap and 2024 Cross Currency Interest Rate Swap. The Trust did not employ or partially employed hedge accounting for the derivatives and therefore the change in fair value is recognized in fair value losses on financial instruments, net, in the condensed combined statements of net income (note 7(b)).
For the three and nine month periods ended September 30, 2020, the fair value gain of $1.4 million and fair value loss of $5.7 million, respectively, were associated with the fair value movement of the 2024 Cross Currency Interest Rate Swap. The Trust did not employ or partially employed hedge accounting for the derivative and therefore the change in fair value was recognized in fair value losses on financial instruments, net, in the condensed combined statements of net income.
86 Granite REIT 2021 Third Quarter Report
Table of Contents
13. INCOME TAXES |
| (a) | The major components of the income tax expense are: |
| Three Months Ended September 30, | Nine Months Ended September 30, | |||||||||||||||||||
| 2021 | 2020 | 2021 | 2020 | |||||||||||||||||
Current income tax expense | $ | 2,406 | $ | 2,159 | $ | 8,709 | $ | 5,535 | ||||||||||||
Deferred income tax expense | 73,396 | 12,354 | 159,114 | 30,115 | ||||||||||||||||
Income tax expense | $ | 75,802 | $ | 14,513 | $ | 167,823 | $ | 35,650 | ||||||||||||
(b) The effective income tax rate reported in the condensed combined statements of net income varies from the Canadian statutory rate for the following reasons:
| Three Months Ended September 30, | Nine Months Ended September 30, | |||||||||||||||||||
| 2021 | 2020 | 2021 | 2020 | |||||||||||||||||
Income before income taxes | $ | 497,580 | $ | 119,749 | $ | 1,136,851 | $ | 297,940 | ||||||||||||
Expected income taxes at the Canadian statutory tax rate of 26.5% (2020 — 26.5%) | $ | 131,858 | $ | 31,733 | $ | 301,265 | $ | 78,954 | ||||||||||||
Income distributed and taxable to unitholders | (47,469 | ) | (14,937 | ) | (113,522 | ) | (40,251 | ) | ||||||||||||
Net foreign rate differentials | (8,832 | ) | (2,887 | ) | (19,468 | ) | (6,336 | ) | ||||||||||||
Net change in provisions for uncertain tax positions | 569 | 443 | 1,019 | 466 | ||||||||||||||||
Net permanent differences | (33 | ) | (21 | ) | (23 | ) | (70 | ) | ||||||||||||
Net effect of change in tax rates | (2 | ) | — | (1,046 | ) | — | ||||||||||||||
Withholding taxes and other | (289 | ) | 182 | (402 | ) | 2,887 | ||||||||||||||
Income tax expense | $ | 75,802 | $ | 14,513 | $ | 167,823 | $ | 35,650 | ||||||||||||
Granite REIT 2021 Third Quarter Report 87
Table of Contents
14. DETAILS OF CASH FLOWS |
| (a) | Items not involving operating cash flows are shown in the following table: |
| Three Months Ended September 30, | Nine Months Ended September 30, | |||||||||||||||||
| 2021 | 2020 | 2021 | 2020 | |||||||||||||||
Straight-line rent amortization | $ | (2,202 | ) | $ | (3,337 | ) | $ | (7,049 | ) | $ | (6,262 | ) | ||||||
Tenant incentive amortization | 1,281 | 1,377 | 3,880 | 3,963 | ||||||||||||||
Unit-based compensation expense (note 11(a)) | 3,055 | 3,249 | 7,327 | 6,253 | ||||||||||||||
Fair value gains on investment properties | (432,238 | ) | (62,045 | ) | (949,779 | ) | (132,586 | ) | ||||||||||
Depreciation and amortization | 360 | 286 | 1,051 | 794 | ||||||||||||||
Fair value losses (gains) on financial instruments, net (note 12(e)) | 1,302 | (1,048 | ) | 1,790 | 4,737 | |||||||||||||
Loss on sale of investment properties | 16 | 164 | 592 | 164 | ||||||||||||||
Amortization of issuance costs and modification losses relating to debentures and term loans | 354 | 303 | 1,093 | 714 | ||||||||||||||
Amortization of deferred financing costs | 146 | 78 | 888 | 234 | ||||||||||||||
Deferred income taxes (note 13(a)) | 73,396 | 12,354 | 159,114 | 30,115 | ||||||||||||||
Early redemption premium (note 7(a)) | — | — | 3,963 | — | ||||||||||||||
Other | (43 | ) | 122 | (128 | ) | 47 | ||||||||||||
| $ | (354,573 | ) | $ | (48,497 | ) | $ | (777,258 | ) | $ | (91,827 | ) | |||||||
(b) Changes in working capital balances are shown in the following table:
|
| |||||||||||||||||
| Three Months Ended September 30, | Nine Months Ended September 30, | |||||||||||||||||
| 2021 | 2020 | 2021 | 2020 | |||||||||||||||
Accounts receivable | $ | (220 | ) | $ | 7,011 | $ | (1,244 | ) | $ | 8,395 | ||||||||
Prepaid expenses and other | (1,649 | ) | 725 | (1,951 | ) | 676 | ||||||||||||
Accounts payable and accrued liabilities | 9,261 | 1,941 | 4,830 | 829 | ||||||||||||||
Deferred revenue | 3,076 | 711 | 3,768 | 2,116 | ||||||||||||||
| $ | 10,468 | $ | 10,388 | $ | 5,403 | $ | 12,016 | |||||||||||
| (c) | Non-cash investing and financing activities |
During the nine month period ended September 30, 2021, 26 thousand stapled units (2020 — 31 thousand stapled units) with a value of $2.1 million (2020 — $2.0 million) were issued under the Restricted Stapled Unit Plan (note 11(a)) and are not recorded in the condensed combined statements of cash flows.
88 Granite REIT 2021 Third Quarter Report
Table of Contents
| (d) | Cash and cash equivalents consist of: |
| As at | September 30, 2021 | December 31, 2020 | ||||||
Cash | $ | 678,388 | $ | 780,979 | ||||
Short-term deposits | 100,577 | 50,301 | ||||||
| $ | 778,965 | $ | 831,280 | |||||
15. FAIR VALUE AND RISK MANAGEMENT |
| (a) | Fair Value of Financial Instruments |
The following table provides the measurement basis of financial assets and liabilities as at September 30, 2021 and December 31, 2020:
| As at | September 30, 2021 | December 31, 2020 | ||||||||||||||
| Carrying Value | Fair Value | Carrying Value | Fair Value | |||||||||||||
Financial assets | ||||||||||||||||
Construction funds in escrow | $ | — | $ | — | $ | 8,402 | $ | 8,402 | ||||||||
Other assets | 318 | (1) | 318 | 349 | (1) | 349 | ||||||||||
Cross currency interest rate swaps | 39,117 | 39,117 | 28,676 | 28,676 | ||||||||||||
Loan receivable | 5,175 | 5,175 | — | — | ||||||||||||
Accounts receivable | 7,065 | 7,065 | 6,746 | 6,746 | ||||||||||||
Prepaid expenses and other | 484 | (2) | 484 | 2,627 | (2) | 2,627 | ||||||||||
Cash and cash equivalents | 778,965 | 778,965 | 831,280 | 831,280 | ||||||||||||
| $ | 831,124 | $ | 831,124 | $ | 878,080 | $ | 878,080 | |||||||||
Financial liabilities | ||||||||||||||||
Unsecured debentures, net | $ | 1,891,261 | $ | 1,926,690 | $ | 1,643,175 | (3) | $ | 1,737,185 | |||||||
Unsecured term loans, net | 533,617 | 533,617 | 534,947 | 534,947 | ||||||||||||
Cross currency interest rate swaps | 30,826 | 30,826 | 114,264 | (4) | 114,264 | |||||||||||
Accounts payable and accrued liabilities | 81,777 | 81,777 | 61,197 | 61,197 | ||||||||||||
Distributions payable | 16,423 | 16,423 | 15,422 | 15,422 | ||||||||||||
| $ | 2,553,904 | $ | 2,589,333 | $ | 2,369,005 | $ | 2,463,015 | |||||||||
| (1) | Long-term receivables included in other assets (note 6). |
| (2) | Foreign exchange collars included in prepaid expenses. |
| (3) | Balance includes current and non-current portions (note 7(a)). |
| (4) | Balance includes current and non-current portions (note 7(b)). |
The fair values of the Trust’s construction funds in escrow, loan receivable, accounts receivable, cash and cash equivalents, accounts payable and accrued liabilities and distributions payable approximate their carrying amounts due to the relatively short periods to maturity of these financial instruments. The fair value of the long-term receivable included in other assets approximates its carrying amount as the receivable bears interest at rates comparable to current market rates. The fair values of the unsecured debentures are determined using quoted market prices. The fair values of the term loans approximate their carrying amounts as the term loans bear interest at rates comparable to the current market rates. The fair values of the cross currency interest rate swaps and foreign exchange collars are determined using market inputs quoted by their counterparties. The fair value of the foreign exchange forward contracts approximate their carrying values as the asset or liability is revalued at the reporting date.
Granite REIT 2021 Third Quarter Report 89
Table of Contents
The Trust periodically purchases foreign exchange collars and forward contracts to hedge specific anticipated foreign currency transactions and to mitigate its foreign exchange exposure on its net cash flows. At September 30, 2021 and December 31, 2020, the Trust did not have any outstanding foreign exchange forward contracts. For the three and nine month periods ended September 30, 2020, the Trust recorded a net fair value loss of $0.2 million related to outstanding foreign exchange forward contracts (note 12(e)). At September 30, 2021, the Trust held three outstanding foreign exchange collar contracts (December 31, 2020 — 12) with a notional value of US$15.0 million (December 31, 2020 — US$60.0 million) and contracts the Trust to sell US dollars and receive Canadian dollars if specific US dollar exchange rates relative to the Canadian dollar are met. The Trust also held three outstanding foreign exchange collar contracts (December 31, 2020 — 12) with a notional value of €6.0 million (December 31, 2020 — €24.0 million) and contracts the Trust to sell Euros and receive Canadian dollars if specific Euro exchange rates relative to the Canadian dollar are met. For the three and nine month periods ended September 30, 2021, the Trust recorded a net fair value loss of $1.4 million (2020 — $0.2 million) and $2.1 million (2020 — net fair value gain of $1.2 million), respectively, related to the outstanding foreign exchange collar contracts (note 12(e)). The Trust did not employ hedge accounting for these financial instruments.
| (b) | Fair Value Hierarchy |
Fair value measurements are based on inputs of observable and unobservable market data that a market participant would use in pricing an asset or liability. IFRS establishes a fair value hierarchy which is summarized below:
| Level 1: | Fair value determined using quoted prices in active markets for identical assets or liabilities. |
| Level 2: | Fair value determined using significant observable inputs, generally either quoted prices in active markets for similar assets or liabilities or quoted prices in markets that are not active. |
| Level 3: | Fair value determined using significant unobservable inputs, such as pricing models, discounted cash flows or similar techniques. |
The following tables represent information related to the Trust’s assets and liabilities measured or disclosed at fair value on a recurring and non-recurring basis and the level within the fair value hierarchy in which the fair value measurements fall.
| As at September 30, 2021 | Level 1 | Level 2 | Level 3 | |||||||||
ASSETS AND LIABILITIES MEASURED OR DISCLOSED AT FAIR VALUE | ||||||||||||
Assets measured at fair value | ||||||||||||
Investment properties (note 4) | $ | — | $ | — | $ | 7,286,250 | ||||||
Assets held for sale (note 5) | — | — | 43,200 | |||||||||
Cross currency interest rate swaps (note 7) | — | 39,117 | — | |||||||||
Foreign exchange collars included in prepaid expenses and other | — | 484 | — | |||||||||
Liabilities measured or disclosed at fair value | ||||||||||||
Unsecured debentures, net (note 7) | 1,926,690 | — | — | |||||||||
Unsecured term loans, net (note 7) | — | 533,617 | — | |||||||||
Cross currency interest rate swaps (note 7) | — | 30,826 | — | |||||||||
Net (liabilities) assets measured or disclosed at fair value | $ | (1,926,690 | ) | $ | (524,842 | ) | $ | 7,329,450 | ||||
90 Granite REIT 2021 Third Quarter Report
Table of Contents
| As at December 31, 2020 | Level 1 | Level 2 | Level 3 | |||||||||
ASSETS AND LIABILITIES MEASURED OR DISCLOSED AT FAIR VALUE | ||||||||||||
Assets measured at fair value | ||||||||||||
Investment properties (note 4) | $ | — | $ | — | $ | 5,855,583 | ||||||
Cross currency interest rate swap (note 7) | — | 28,676 | — | |||||||||
Foreign exchange collars included in prepaid expenses and other | — | 2,627 | — | |||||||||
Liabilities measured or disclosed at fair value | ||||||||||||
Unsecured debentures, net (note 7) | 1,737,185 | — | — | |||||||||
Unsecured term loans, net (note 7) | — | 534,947 | — | |||||||||
Cross currency interest rate swaps (note 7) | — | 114,264 | — | |||||||||
Net (liabilities) assets measured or disclosed at fair value | $ | (1,737,185 | ) | $ | (617,908 | ) | $ | 5,855,583 | ||||
For assets and liabilities that are measured at fair value on a recurring basis, the Trust determines whether transfers between the levels of the fair value hierarchy have occurred by reassessing categorization (based on the lowest level input that is significant to the fair value measurement as a whole) at the end of each reporting period. For the three and nine month periods ended September 30, 2021 and the year ended December 31, 2020, there were no transfers between the levels.
| (c) | Risk Management |
Foreign exchange risk
As at September 30, 2021, the Trust is exposed to foreign exchange risk primarily in respect of movements in the Euro and the US dollar. The Trust is structured such that its foreign operations are primarily conducted by entities with a functional currency which is the same as the economic environment in which the operations take place. As a result, the net income impact of currency risk associated with financial instruments is limited as its financial assets and liabilities are generally denominated in the functional currency of the subsidiary that holds the financial instrument. However, the Trust is exposed to foreign currency risk on its net investment in its foreign currency denominated operations and certain Trust level foreign currency denominated assets and liabilities. At September 30, 2021, the Trust’s foreign currency denominated net assets are $5.5 billion primarily in US dollars and Euros. A 1% change in the US dollar and Euro exchange rates relative to the Canadian dollar would result in a gain or loss of approximately $37.5 million and $16.8 million, respectively, to comprehensive income.
Granite REIT 2021 Third Quarter Report 91
Table of Contents
16. COMBINED FINANCIAL INFORMATION |
The condensed combined financial statements include the financial position and results of operations and cash flows of each of Granite REIT and Granite GP. Below is a summary of the financial information for each entity along with the elimination entries and other adjustments that aggregate to the condensed combined financial statements:
| Balance Sheet | As at September 30, 2021 | |||||||||||||||
| Granite REIT | Granite GP | Eliminations/ Adjustments | Granite REIT and Granite GP Combined | |||||||||||||
ASSETS | ||||||||||||||||
Non-current assets: | ||||||||||||||||
Investment properties | $ | 7,286,250 | $ | 7,286,250 | ||||||||||||
Investment in Granite LP(1) | — | 35 | (35 | ) | — | |||||||||||
Other non-current assets | 72,007 | 72,007 | ||||||||||||||
| 7,358,257 | 35 | (35 | ) | 7,358,257 | ||||||||||||
Current assets: | ||||||||||||||||
Assets held for sale | 43,200 | 43,200 | ||||||||||||||
Other current assets | 15,256 | 17 | 15,273 | |||||||||||||
Intercompany receivable(2) | — | 15,173 | (15,173 | ) | — | |||||||||||
Cash and cash equivalents | 778,255 | 710 | 778,965 | |||||||||||||
Total assets | $ | 8,194,968 | 15,935 | (15,208 | ) | $ | 8,195,695 | |||||||||
LIABILITIES AND EQUITY | ||||||||||||||||
Non-current liabilities: | ||||||||||||||||
Unsecured debt, net | $ | 2,424,878 | $ | 2,424,878 | ||||||||||||
Other non-current liabilities | 602,670 | 602,670 | ||||||||||||||
| 3,027,548 | 3,027,548 | |||||||||||||||
Current liabilities: | ||||||||||||||||
Intercompany payable (2) | 15,173 | (15,173 | ) | — | ||||||||||||
Other current liabilities | 121,740 | 15,900 | 137,640 | |||||||||||||
Total liabilities | 3,164,461 | 15,900 | (15,173 | ) | 3,165,188 | |||||||||||
Equity: | ||||||||||||||||
Stapled unitholders’ equity | 5,028,205 | 35 | 5,028,240 | |||||||||||||
Non-controlling interests | 2,302 | (35 | ) | 2,267 | ||||||||||||
Total liabilities and equity | $ | 8,194,968 | 15,935 | (15,208 | ) | $ | 8,195,695 | |||||||||
| (1) | Granite REIT Holdings Limited Partnership (“Granite LP”) is 100% owned by Granite REIT and Granite GP. |
| (2) | Represents employee and trustee/director compensation related amounts which will be reimbursed by Granite LP. |
92 Granite REIT 2021 Third Quarter Report
Table of Contents
| Balance Sheet | As at December 31, 2020 | |||||||||||||||
| Granite REIT | Granite GP | Eliminations/ Adjustments | Granite REIT and Granite GP Combined | |||||||||||||
ASSETS | ||||||||||||||||
Non-current assets: | ||||||||||||||||
Investment properties | $ | 5,855,583 | $ | 5,855,583 | ||||||||||||
Investment in Granite LP(1) | — | 25 | (25 | ) | — | |||||||||||
Other non-current assets | 46,046 | 46,046 | ||||||||||||||
| 5,901,629 | 25 | (25 | ) | 5,901,629 | ||||||||||||
Current assets: | ||||||||||||||||
Other current assets | 14,546 | 17 | 14,563 | |||||||||||||
Intercompany receivable(2) | — | 13,792 | (13,792 | ) | — | |||||||||||
Cash and cash equivalents | 830,455 | 825 | 831,280 | |||||||||||||
Total assets | $ | 6,746,630 | 14,659 | (13,817 | ) | $ | 6,747,472 | |||||||||
LIABILITIES AND EQUITY |
| |||||||||||||||
Non-current liabilities: | ||||||||||||||||
Unsecured debt, net | $ | 1,928,252 | $ | 1,928,252 | ||||||||||||
Other non-current liabilities | 523,096 | 523,096 | ||||||||||||||
| 2,451,348 | 2,451,348 | |||||||||||||||
Current liabilities: | ||||||||||||||||
Unsecured debt, net | 249,870 | 249,870 | ||||||||||||||
Intercompany payable(2) | 13,792 | (13,792 | ) | — | ||||||||||||
Other current liabilities | 109,416 | 14,634 | 124,050 | |||||||||||||
Total liabilities | 2,824,426 | 14,634 | (13,792 | ) | 2,825,268 | |||||||||||
Equity: | ||||||||||||||||
Stapled unitholders’ equity | 3,920,044 | 25 | 3,920,069 | |||||||||||||
Non-controlling interests | 2,160 | (25 | ) | 2,135 | ||||||||||||
Total liabilities and equity | $ | 6,746,630 | 14,659 | (13,817 | ) | $ | 6,747,472 | |||||||||
| (1) | Granite LP is 100% owned by Granite REIT and Granite GP. |
| (2) | Represents employee and trustee/director compensation related amounts which will be reimbursed by Granite LP. |
Granite REIT 2021 Third Quarter Report 93
Table of Contents
| Income Statement | Three Months Ended September 30, 2021 | |||||||||||||||
| Granite REIT | Granite GP | Eliminations/ Adjustments | Granite REIT and Granite GP Combined | |||||||||||||
Revenue | $ | 98,270 | $ | 98,270 | ||||||||||||
General and administrative expenses | 8,870 | 8,870 | ||||||||||||||
Interest expense and other financing costs, net | 10,691 | 10,691 | ||||||||||||||
Other costs and expenses, net | 12,049 | 12,049 | ||||||||||||||
Share of (income) loss of Granite LP | — | (5 | ) | 5 | — | |||||||||||
Fair value gains on investment properties, net | (432,238 | ) | (432,238 | ) | ||||||||||||
Fair value losses on financial instruments, net | 1,302 | 1,302 | ||||||||||||||
Loss on sale of investment properties | 16 | 16 | ||||||||||||||
Income before income taxes | 497,580 | 5 | (5 | ) | 497,580 | |||||||||||
Income tax expense | 75,802 | 75,802 | ||||||||||||||
Net income | 421,778 | 5 | (5 | ) | 421,778 | |||||||||||
Less net income attributable to non-controlling interests | 32 | (5 | ) | 27 | ||||||||||||
Net income attributable to stapled unitholders | $ | 421,746 | 5 | — | $ | 421,751 | ||||||||||
| Income Statement | Three Months Ended September 30, 2020 | |||||||||||||||
| Granite REIT | Granite GP | Eliminations/ Adjustments | Granite REIT and Granite GP Combined | |||||||||||||
Revenue | $ | 87,900 | $ | 87,900 | ||||||||||||
General and administrative expenses | 9,572 | 9,572 | ||||||||||||||
Interest expense and other financing costs, net | 10,587 | 10,587 | ||||||||||||||
Other costs and expenses, net | 10,921 | 10,921 | ||||||||||||||
Share of (income) loss of Granite LP | — | (1 | ) | 1 | — | |||||||||||
Fair value gains on investment properties, net | (62,045 | ) | (62,045 | ) | ||||||||||||
Fair value gains on financial instruments, net | (1,048 | ) | (1,048 | ) | ||||||||||||
Loss on sale of investment properties | 164 | 164 | ||||||||||||||
Income before income taxes | 119,749 | 1 | (1 | ) | 119,749 | |||||||||||
Income tax expense | 14,513 | 14,513 | ||||||||||||||
Net income | 105,236 | 1 | (1 | ) | 105,236 | |||||||||||
Less net income attributable to non-controlling interests | 38 | (1 | ) | 37 | ||||||||||||
Net income attributable to stapled unitholders | $ | 105,198 | 1 | — | $ | 105,199 | ||||||||||
94 Granite REIT 2021 Third Quarter Report
Table of Contents
| Income Statement | Nine Months Ended September 30, 2021 | |||||||||||||||
| Granite REIT | Granite GP | Eliminations/ Adjustments | Granite REIT and Granite GP Combined | |||||||||||||
Revenue | $ | 288,175 | $ | 288,175 | ||||||||||||
General and administrative expenses | 26,024 | 26,024 | ||||||||||||||
Interest expense and other financing costs | 35,088 | 35,088 | ||||||||||||||
Other costs and expenses, net | 37,609 | 37,609 | ||||||||||||||
Share of (income) loss of Granite LP | — | (10 | ) | 10 | — | |||||||||||
Fair value gains on investment properties, net | (949,779 | ) | (949,779 | ) | ||||||||||||
Fair value losses on financial instruments, net | 1,790 | 1,790 | ||||||||||||||
Loss on sale of investment properties | 592 | 592 | ||||||||||||||
Income before income taxes | 1,136,851 | 10 | (10 | ) | 1,136,851 | |||||||||||
Income tax expense | 167,823 | 167,823 | ||||||||||||||
Net income | 969,028 | 10 | (10 | ) | 969,028 | |||||||||||
Less net income attributable to non-controlling interests | 243 | (10 | ) | 233 | ||||||||||||
Net income attributable to stapled unitholders | $ | 968,785 | 10 | — | $ | 968,795 | ||||||||||
| Income Statement | Nine Months Ended September 30, 2020 | |||||||||||||||
| Granite REIT | Granite GP | Eliminations/ Adjustments | Granite REIT and Granite GP Combined | |||||||||||||
Revenue | $ | 246,958 | $ | 246,958 | ||||||||||||
General and administrative expenses | 24,285 | 24,285 | ||||||||||||||
Interest expense and other financing costs | 24,995 | 24,995 | ||||||||||||||
Other costs and expenses, net | 27,423 | 27,423 | ||||||||||||||
Share of (income) loss of Granite LP | — | (3 | ) | 3 | — | |||||||||||
Fair value gains on investment properties, net | (132,586 | ) | (132,586 | ) | ||||||||||||
Fair value losses on financial instruments, net | 4,737 | 4,737 | ||||||||||||||
Loss on sale of investment properties | 164 | 164 | ||||||||||||||
Income before income taxes | 297,940 | 3 | (3 | ) | 297,940 | |||||||||||
Income tax expense | 35,650 | 35,650 | ||||||||||||||
Net income | 262,290 | 3 | (3 | ) | 262,290 | |||||||||||
Less net income attributable to non-controlling interests | 141 | (3 | ) | 138 | ||||||||||||
Net income attributable to stapled unitholders | $ | 262,149 | 3 | — | $ | 262,152 | ||||||||||
Granite REIT 2021 Third Quarter Report 95
Table of Contents
| Statement of Cash Flows | Three Months Ended September 30, 2021 | |||||||||||||||
| Granite REIT | Granite GP | Eliminations/ Adjustments | Granite REIT and Granite GP Combined | |||||||||||||
OPERATING ACTIVITIES | ||||||||||||||||
Net income | $ | 421,778 | 5 | (5 | ) | $ | 421,778 | |||||||||
Items not involving current cash flows | (354,573 | ) | (5 | ) | 5 | (354,573 | ) | |||||||||
Changes in working capital balances | 10,012 | 456 | 10,468 | |||||||||||||
Other operating activities | 1,764 | 1,764 | ||||||||||||||
Cash provided by operating activities | 78,981 | 456 | — | 79,437 | ||||||||||||
INVESTING ACTIVITIES | ||||||||||||||||
Property acquisitions | (380,802 | ) | (380,802 | ) | ||||||||||||
Costs of disposals, net | (16 | ) | (16 | ) | ||||||||||||
Additions to income-producing properties | (12,065 | ) | (12,065 | ) | ||||||||||||
Additions to properties under development | (16,926 | ) | (16,926 | ) | ||||||||||||
Construction funds released from escrow | 8,313 | 8,313 | ||||||||||||||
Other investing activities | (27,731 | ) | (27,731 | ) | ||||||||||||
Cash used in investing activities | (429,227 | ) | — | — | (429,227 | ) | ||||||||||
FINANCING ACTIVITIES | ||||||||||||||||
Distributions paid | (49,261 | ) | (49,261 | ) | ||||||||||||
Other financing activities | 497,610 | 497,610 | ||||||||||||||
Cash provided by financing activities | 448,349 | — | — | 448,349 | ||||||||||||
Effect of exchange rate changes | 2,264 | 2,264 | ||||||||||||||
Net increase in cash and cash equivalents during the period | $ | 100,367 | 456 | — | $ | 100,823 | ||||||||||
| Statement of Cash Flows | Three Months Ended September 30, 2020 | |||||||||||||||
| Granite REIT | Granite GP | Eliminations/ Adjustments | Granite REIT and Granite GP Combined | |||||||||||||
OPERATING ACTIVITIES | ||||||||||||||||
Net income | $ | 105,236 | 1 | (1 | ) | $ | 105,236 | |||||||||
Items not involving current cash flows | (48,497 | ) | (1 | ) | 1 | (48,497 | ) | |||||||||
Changes in working capital balances | 10,254 | 134 | — | 10,388 | ||||||||||||
Other operating activities | 1,867 | 1,867 | ||||||||||||||
Cash provided by operating activities | 68,860 | 134 | — | 68,994 | ||||||||||||
INVESTING ACTIVITIES | ||||||||||||||||
Property acquisitions | (114,713 | ) | (114,713 | ) | ||||||||||||
Proceeds from disposals, net | 35,468 | 35,468 | ||||||||||||||
Additions to income-producing properties | (3,350 | ) | (3,350 | ) | ||||||||||||
Additions to properties under development | (7,923 | ) | (7,923 | ) | ||||||||||||
Construction funds released from escrow | 2,012 | 2,012 | ||||||||||||||
Other investing activities | (10,450 | ) | (10,450 | ) | ||||||||||||
Cash used in investing activities | (98,956 | ) | — | — | (98,956 | ) | ||||||||||
FINANCING ACTIVITIES | ||||||||||||||||
Distributions paid | (41,994 | ) | (41,994 | ) | ||||||||||||
Other financing activities | (1,790 | ) | (1,790 | ) | ||||||||||||
Cash used in financing activities | (43,784 | ) | — | — | (43,784 | ) | ||||||||||
Effect of exchange rate changes | (3,825 | ) | (3,825 | ) | ||||||||||||
Net (decrease) increase in cash and cash equivalents during the period | $ | (77,705 | ) | 134 | — | $ | (77,571 | ) | ||||||||
96 Granite REIT 2021 Third Quarter Report
Table of Contents
| Statement of Cash Flows | Nine Months Ended September 30, 2021 | |||||||||||||||
| Granite REIT | Granite GP | Eliminations/ Adjustments | Granite REIT and Granite GP Combined | |||||||||||||
OPERATING ACTIVITIES | ||||||||||||||||
Net income | $ | 969,028 | 10 | (10 | ) | $ | 969,028 | |||||||||
Items not involving operating cash flows | (777,258 | ) | (10 | ) | 10 | (777,258 | ) | |||||||||
Changes in working capital balances | 5,518 | (115 | ) | 5,403 | ||||||||||||
Other operating activities | 11,304 | 11,304 | ||||||||||||||
Cash provided by (used in) operating activities | 208,592 | (115 | ) | — | 208,477 | |||||||||||
INVESTING ACTIVITIES | ||||||||||||||||
Property acquisitions | (600,091 | ) | (600,091 | ) | ||||||||||||
Proceeds from disposals, net | 23,188 | 23,188 | ||||||||||||||
Additions to income-producing properties | (19,185 | ) | (19,185 | ) | ||||||||||||
Additions to properties under development | (27,875 | ) | (27,875 | ) | ||||||||||||
Construction funds released from escrow | 8,341 | 8,341 | ||||||||||||||
Other investing activities | (30,309 | ) | (30,309 | ) | ||||||||||||
Cash used in investing activities | (645,931 | ) | — | — | (645,931 | ) | ||||||||||
FINANCING ACTIVITIES | ||||||||||||||||
Distributions paid | (141,812 | ) | (141,812 | ) | ||||||||||||
Other financing activities | 524,575 | 524,575 | ||||||||||||||
Cash provided by financing activities | 382,763 | — | — | 382,763 | ||||||||||||
Effect of exchange rate changes | 2,376 | 2,376 | ||||||||||||||
Net decrease in cash and cash equivalents during the period | $ | (52,200 | ) | (115 | ) | — | $ | (52,315 | ) | |||||||
| Statement of Cash Flows | Nine Months Ended September 30, 2020 | |||||||||||||||
| Granite REIT | Granite GP | Eliminations/ Adjustments | Granite REIT and Granite GP Combined | |||||||||||||
OPERATING ACTIVITIES | ||||||||||||||||
Net income | $ | 262,290 | 3 | (3 | ) | $ | 262,290 | |||||||||
Items not involving operating cash flows | (91,827 | ) | (3 | ) | 3 | (91,827 | ) | |||||||||
Changes in working capital balances | 12,068 | (52 | ) | 12,016 | ||||||||||||
Other operating activities | 6,546 | 6,546 | ||||||||||||||
Cash provided by (used in) operating activities | 189,077 | (52 | ) | — | 189,025 | |||||||||||
INVESTING ACTIVITIES | ||||||||||||||||
Property acquisitions | (565,346 | ) | (565,346 | ) | ||||||||||||
Proceeds from disposals, net | 35,468 | 35,468 | ||||||||||||||
Additions to income-producing properties | (13,351 | ) | (13,351 | ) | ||||||||||||
Additions to properties under development | (33,434 | ) | (33,434 | ) | ||||||||||||
Construction funds released from escrow | 8,603 | 8,603 | ||||||||||||||
Other investing activities | (11,425 | ) | (11,425 | ) | ||||||||||||
Cash used in investing activities | (579,485 | ) | — | — | (579,485 | ) | ||||||||||
FINANCING ACTIVITIES | ||||||||||||||||
Distributions paid | (120,134 | ) | (120,134 | ) | ||||||||||||
Other financing activities | 747,994 | 747,994 | ||||||||||||||
Cash provided by financing activities | 627,860 | — | — | 627,860 | ||||||||||||
Effect of exchange rate changes | 3,600 | 3,600 | ||||||||||||||
Net increase (decrease) in cash and cash equivalents during the period | $ | 241,052 | (52 | ) | — | $ | 241,000 | |||||||||
Granite REIT 2021 Third Quarter Report 97
Table of Contents
17. COMMITMENTS AND CONTINGENCIES |
(a) The Trust is subject to various legal proceedings and claims that arise in the ordinary course of business. Management evaluates all claims with the advice of legal counsel. Management believes these claims are generally covered by Granite’s insurance policies and that any liability from remaining claims is not probable to occur and would not have a material adverse effect on the condensed combined financial statements. However, actual outcomes may differ from management’s expectations.
(b) As at September 30, 2021, the Trust’s contractual commitments totaled $510.7 million which comprised of construction and development projects of $315.7 million and the committed acquisitions of two properties in Indiana and a property in the Netherlands upon completion totaling $195.0 million.
(c) In connection with the acquisitions of investment properties located in Palmetto, Georgia on November 12, 2020 and in Locust Grove, Georgia on March 12, 2021, $123.1 million (US$97.1 million) of bonds were assumed. The authorized amount of the bonds is $131.8 million (US$104.0 million), of which $123.1 million (US$97.1 million) was outstanding as at September 30, 2021. The bonds provide for a real estate tax abatement for the acquired investment properties. Through a series of transactions, the Trust is both the bondholder and the obligor of the bonds. Therefore, in accordance with IAS 32, the bonds are not recorded in the condensed combined balance sheet.
The Trust is involved, in the normal course of business, in discussions, and has various letters of intent or conditional agreements, with respect to possible acquisitions of new properties and dispositions of existing properties in its portfolio. None of these commitments or contingencies, individually or in aggregate, would have a material impact on the condensed combined financial statements.
18. SUBSEQUENT EVENTS |
(a) Subsequent to September 30, 2021, the Trust declared monthly distributions for October 2021 of $16.4 million (note 10).
(b) On November 3, 2021, Granite is filing a prospectus supplement (the “Prospectus Supplement”) to the Shelf Prospectus of Granite Real Estate Investment Trust and Granite REIT Inc. establishing an equity at-the-market equity distribution program (the “ATM Program”), in each of the provinces and territories of Canada, that allows it to issue and sell, at its discretion, up to $250.0 million of stapled units to the public, from time to time. Stapled units sold under the ATM Program will be sold at the prevailing market prices at the time of sale when issued, directly through the facilities of the Toronto Stock Exchange (“TSX”) or any other recognized marketplace upon which the stapled units are listed or quoted or where the stapled units are traded in Canada. Granite intends to use the net proceeds from the ATM Program, if any, to fund potential future acquisitions, development activity, and for general trust purposes.
98 Granite REIT 2021 Third Quarter Report
Table of Contents
 |
|
Board of Trustees
Kelly Marshall Chairman
Peter Aghar Trustee
Remco Daal Trustee
Kevan Gorrie Trustee
Fern Grodner Trustee
Al Mawani Trustee
Gerald Miller Trustee
Sheila Murray Trustee
Emily Pang Trustee
Jennifer Warren Trustee
| Officers
Kevan Gorrie President and Chief Executive Officer
Teresa Neto Chief Financial Officer
Lorne Kumer Executive Vice President, Head of Global Real Estate
Michael Ramparas Executive Vice President, Global Real Estate and Head of Investments | Office Location
77 King Street West Suite 4010, P.O. Box 159 Toronto-Dominion Centre Toronto, ON M5K 1H1 Phone: (647) 925-7500 Fax: (416) 861-1240
Investor Relations Queries
Kevan Gorrie President and Chief Executive Officer (647) 925-7500
Teresa Neto Chief Financial Officer (647) 925-7560 | ||
Transfer Agents and Registrars | ||||
Canada Computershare Investor Services Inc. 100 University Avenue, 8th Floor, North Tower Toronto, Ontario, Canada M5J 2Y1 Phone: 1 (800) 564-6253 www.computershare.com |
United States Computershare Trust Company N.A. 462 S. 4th Street Louisville, Kentucky, USA 40202 | |||
Exchange Listings | ||||
Stapled Units | – Toronto Stock Exchange (GRT.UN) and New York Stock Exchange (GRP.U) | |||
Please refer to our website (www.granitereit.com) for information on Granite’s compliance with the corporate governance standards of the New York Stock Exchange and applicable Canadian standards and guidelines.
Publicly Available Documents
Copies of the financial statements for the year ended December 31, 2020 are available through the Internet on the Electronic Data Gathering Analysis and Retrieval System (EDGAR), which can be accessed at www.sec.gov, and on the System for Electronic Document Analysis and Retrieval (SEDAR), which can be accessed at www.sedar.com. Other required securities filings can also be found on EDGAR and SEDAR.
Table of Contents
|
Granite REIT
77 King Street West Suite 4010, P.O. Box 159 Toronto-Dominion Centre Toronto, ON M5K 1H1 Phone: (647) 925-7500 Fax: (416) 861-1240 www.granitereit.com |