Annual Report
2022
Table of Contents
| | | | | |
| |
| Management’s Discussion and Analysis of Results of Operations and Financial Position | 5 |
| Combined Balance Sheets | 82 |
| Combined Statements of Net Income | 83 |
| Combined Statements of Comprehensive Income | 84 |
| Combined Statements of Unitholders’ Equity | 85 |
| Combined Statements of Cash Flows | 86 |
| Notes to Combined Financial Statements | 87 |
| Corporate Information | Inside back cover |
| | | | | |
| 77 King St. W., Suite 4010 P.O. Box 159, TD Centre Toronto, ON, M5K 1H1 Canada |
LETTER TO UNITHOLDERS
Dear Unitholders:
2022 could be described as two distinct years that occurred over 365 days. The early part looked to be a continuation of the market recovery which began in 2021, fueled by ultra-low interest rates, easing of supply-chain disruptions and strong investor and user demand for modern logistics space. In stark contrast, the capital markets rapidly deteriorated in the second quarter, due to a rapid and significant increase in interest rates in response to rising inflation globally, combined with heightened geopolitical risk and economic uncertainty resulting from the Russian invasion of Ukraine. This rapid increase in interest rates negatively impacted discount rates and capitalization rates for all real estate sectors, but the overall impact on asset value was partially, if not fully, moderated by significant increases in Net Operating Income (“NOI”) and market rents for logistics real estate. This divergence in the operating environment from the investment climate continued to widen through the end of 2022, as fundamentals in the sector remained strong in the face of weakening investment conditions.
Despite this challenging environment, portfolio quality remained a priority and continued to improve in 2022. Although we effectively ceased all acquisition activity in the second half of the year, Granite completed over $481 million of acquisitions in 2022 in its target markets of Germany, the U.S., Netherlands and the Greater Toronto Area (the “GTA”). In response to the market headwinds that appeared in the second quarter, Granite refocused its capital allocation accordingly on funding active developments and maintaining liquidity. During 2022, Granite invested over $330 million into its active development and expansion pipeline, including the completion of projects comprising 1.8 million of additional square feet, which were fully occupied as of December 31, 2022 and are expected to generate roughly $14.1 million initially in annualized revenue. Lastly, Granite completed the disposition of two non-core assets in Poland and the Czech Republic for total proceeds of $66 million, which helped to further enhance portfolio diversification.
As a result of external market factors, 2022 was a relatively quiet year for Granite from a financing perspective, but we were able to opportunistically exploit difficult market conditions to drive net asset value (“NAV”) growth. In early 2022, Granite issued $13.4 million of equity using its at-the-market (“ATM”) equity program at an average unit price of $98.77. Conversely, Granite also repurchased over $155.5 million of equity under its normal course issuer bid (“NCIB”) program, representing over 2 million stapled units at an average cost of $71.81. In September 2022, Granite obtained a US$400 million, three year term loan to fully repay the outstanding balance on its Credit Facility with the remaining balance available to fund development and property acquisitions. Granite’s balance sheet at the end of 2022 remains strong, with over $1.1 billion of liquidity and net leverage of 32%.
With respect to our financial performance, Funds from Operations (“FFO”)(1) and Adjusted Funds from Operations (“AFFO”)(1) per unit increased 11% and 8% over 2021 respectively, due primarily to solid increases in same property net operating income - cash basis (“SPNOI - cash basis”)(1), contributions from acquisitions completed in the early part of the year and development stabilizations mentioned above. Granite recorded $220 million in net fair value losses in 2022, due to the expansion of discount and terminal capitalization rates in response to rising interest rates, partially offset by increases in NOI and fair market rents. Fair value reductions in Granite’s investment properties were more than offset by development capital and unrealized foreign exchange gains, resulting in a net increase to investment properties of $0.9 million to $8.8 billion as at December 31, 2022.
2022 was a strong year operationally for Granite, as demonstrated by year over year growth in achieved rental rates and SPNOI. In all, Granite completed 12.7 million square feet of renewals and new leases in 2022 at an average increase in rental rates of 26% and finished the year with an occupancy rate of 99.6%.
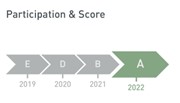
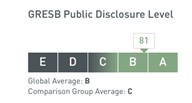
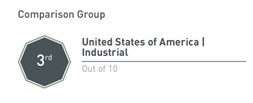
ESG continued to be a major focus in 2022 and progress continued to be made in a number of key areas of our program. Most notably, Granite once again improved its performance in the Global Real Estate Sustainability Benchmark (“GRESB”) Assessment for 2022, where Granite ranked 3rd out of 10 in the United States | Industrial GRESB peer group which evaluates the level of ESG disclosure by listed property companies and REITs. Granite also achieved 2nd out of 9 (improvement of 1 position over 2021) and was the sole Canadian entity, in the North American Industrial | Listed | Tenant Controlled GRESB peer group for Standing Investments with a score of 73 (+8 over 2021). As at December 31, 2022, Granite has allocated approximately $862 million of the net proceeds of the $1.0 billion of prior green bond offerings towards eligible green projects, such as the acquisition and construction of certified green buildings and energy-conservation measures. In 2022, Granite exceeded its initial target to support the production of new renewable energy through the installation of solar PV systems, and as such, has set a more ambitious renewable energy target of peak generation capacity of 24 MW by 2025. Lastly, in 2022, Granite added four properties having BREEAM In-Use certifications and another four properties with Institute of Real Estate Management (IREM) Certified Sustainable Properties (CSP) certifications. As at December 31, 2022 Granite has obtained green-building certifications at 24% of its portfolio by floor area and has committed to achieve 30% by 2030.
I would like to recognize our employees for their commitment and performance in 2022, achieving Granite’s objectives in another challenging environment.
Before moving on to our outlook and a summary of our priorities for 2023, please see below for a recap of major results and activities from 2022.
HIGHLIGHTS FOR 2022
Unitholder Return and Increased Distribution
•-31.9% total return for 2022 (vs -17.0% for the S&P TSX Capped REIT Index and -5.8% for the S&P/TSX Composite Index); and
•3.2% year-over-year increase in the annual amount distributed to unitholders to $3.20 per unit for 2023, marking our eleventh consecutive annual distribution increase. Granite’s AFFO payout ratio remained conservative at 76.5% for 2022.
Strategic Allocation of Capital
•$460 million invested in modern assets in key e-commerce and distribution markets in the GTA, the U.S., Germany and Netherlands at an average stabilized yield of 3.9%;
•US$400.0 million of new unsecured term debt, issued for a 3-year term bearing a fixed interest rate of 5.016% including the impact of the interest rate swap;
•$13.4 million in gross proceeds from ATM equity program issuances, representing 136,100 stapled units issued at an average price of $98.77. Granite has $236.6 million of remaining availability under the ATM to selectively fund the ongoing development program and future acquisitions;
•$155.5 million of equity repurchased under Granite’s NCIB representing 2,165,600 stapled units at an average stapled unit cost of $71.81;
•$1.0 billion of availability on the credit facility, which was amended to extend maturity by two years to March 31, 2028 to provide further liquidity and financial flexibility to execute the Strategic Plan;
•Net leverage ratio of 32%, providing approximately $0.5 billion in debt capacity and $1.1 billion in available liquidity at the end of the year; and
•Credit rating stable at BBB (high) stable by DBRS (Morningstar) and Baa2 Stable by Moody’s, recognizing Granite’s sector-leading credit metrics.
Portfolio Enhancement and Tenant Diversification
•8 income-producing properties totaling 2.8 million square feet acquired (including 4 forward purchases committed in 2021) with an average age of 5.1 years and weighted average lease term of 9.3 years, in key distribution markets in the GTA, the U.S., Germany and Netherlands;
•4 completed development and expansion projects contributing 1.8 million of additional square feet of gross leasable area which are fully leased as of December 31, 2022, generating $14.1 million in expected NOI annually at a yield on cost of 6.8%;
•10 on-going active development and expansion projects and 2 forward property commitments having total projected costs of $489 million and remaining commitments of $158 million. These projects are expected to contribute 3.9 million of additional square feet of gross leasable area and generate a weighted average stabilized yield of 6.0%;
•2 non-core properties disposed for gross proceeds of $66 million; and
•Magna concentration reduced from 22% to 20% as a percentage of gross leasable area and from 29% to 26% as a percentage of annualized revenue.
Financial and Operational Performance
•FFO and AFFO per unit of $4.43 and $4.05, respectively representing a year over year increase of 11% and 8%, respectively;
•SPNOI - cash basis average year-over-year growth, on a constant currency basis, of 4.3%;
•$220 million in net fair value losses taken due to expansion of discount and terminal capitalization rates across all of Granite's markets in response to rising interest rates, partially offset by fair market rent increases across the GTA and selective U.S. and European markets reflecting current market fundamentals. The negative impact on NAV as a result of the fair value losses was offset by contributions from development stabilization and unrealized foreign currency translation gains of $338 million as a result of the relative weakening of the Canadian dollar against the Euro and U.S. dollar from December 31, 2021 to December 31, 2022;
•12.7 million square feet of space renewed or re-leased at an average increase in base rent of 26%; and
•Occupancy rate as at December 31, 2022 of 99.6%.
Environmental, Social, Governance and Resilience (ESG+R) Performance
•Ranked 3rd out of 10 in the United States of America | Industrial GRESB peer group which evaluates the level of ESG disclosure by listed property companies and REITs. Granite’s score increased by 8 points (12%) compared to 2021 improving Granite’s overall position from 3rd to 2nd place out of 9 in the North American Industrial | Listed | Tenant Controlled peer group in 2022. Granite also achieved a score of A in the 2022 GRESB Public Disclosure Report, an increase from 2021’s score of B;
•Published Granite’s 2nd annual comprehensive Corporate ESG+R Report;
•$862.3 million of green bond net proceeds allocated to date towards Eligible Green Projects, as defined by Granite’s Green Bond Framework; representing 100% and 73% of the net proceeds of the 2027 Green Bond and the 2028 Green Bond, respectively; and
•Reinstated in-person connections with Granite’s stakeholders including an establishment of hybrid working model for our staff, property tours, tenant site visits, resumption of an in-person annual general meeting and a company-wide conference in Dallas, Texas.
OUTLOOK
Despite a challenging economic background, Granite finished 2022 on a strong note, with SPNOI - cash basis growth of 6.0% in the fourth quarter as compared with the fourth quarter of 2021, with further growth expected in 2023. Leasing momentum is robust on the back of high demand and strong fundamentals for modern logistics real estate in all of Granite’s markets, which has driven double digit leasing spreads overall on our new and renewal leasing activity. To date, Granite has renewed just over 80% of the 9.7 million square feet of 2023 lease maturities at an average increase in rental rate of approximately 20%. Primarily as a result of the ten-year lease extension of our facilities in Graz, Austria, we have already renewed roughly 55% of our 2024 maturities, which further improves the stability of our cash flow.
Construction continues at Granite’s ten active development and expansion projects and two forward property commitments, with expected completion dates between Q1 2023 and Q1 2024. Leasing momentum remains strong, and pre-leasing currently sits at 53% following roughly 520,000 square feet of new leases signed to date in 2023. The completion of Granite’s active development pipeline is expected to contribute significantly to FFO, AFFO and NAV growth in 2023 and 2024.
Thus far in 2023, risks associated with inflation and geopolitical instability remain elevated. However, as a result of prudent capital allocation, our liquidity and balance sheet capacity remain strong, and we are well positioned to fund our development projects in 2023 and deploy capital selectively on strategic opportunities in our target markets.
For the remainder of 2023, Granite will focus on the following priorities:
•Driving NAV, FFO and AFFO per unit growth while maintaining conservative capital ratios;
•Executing on development, redevelopment and expansion projects in the U.S., Europe and the GTA;
•Selectively pursuing strategic land and income-producing property acquisition opportunities in our target markets;
•Advancing our ESG program and delivering towards our detailed targets for 2023 and beyond; and
•Disposing of select non-core assets.
Successfully executing on these priorities, we believe, will continue to strengthen Granite’s position as one of the sector’s leaders and will ultimately maximize long-term value for our unitholders.
All of us at Granite wish you well and thank you for your continued trust and support.
Sincerely,
Kevan Gorrie,
President and Chief Executive Officer
FFO, AFFO and related per unit amounts, available liquidity, SPNOI — cash basis (same property net operating income — cash basis), constant currency SPNOI — cash basis (constant currency same property net operating income — cash basis) (each of which are non-IFRS performance measures) and net leverage ratio (which is a non-IFRS ratio) are not defined by International Financial Reporting Standards (‘‘IFRS’’) and do not have standard meanings. Please refer to the “Basis of Presentation”, “Non-IFRS Performance Measures” and “Non-IFRS Ratios” sections in the attached MD&A for definitions and reconciliations to IFRS measures.
MANAGEMENT’S DISCUSSION AND ANALYSIS OF RESULTS OF OPERATIONS AND FINANCIAL POSITION
TABLE OF CONTENTS
| | | | | | | | | | | | | | |
| Basis of Presentation | | | Commitments, Contractual Obligations, Contingencies and Off-Balance Sheet Arrangements | |
| Financial and Operating Highlights | | | Related Party Transactions | |
| Significant Matters | | | Non-IFRS Performance Measures and Ratios | |
| Business Overview and Strategic Outlook | | | Significant Accounting Estimates | |
| Environmental, Social, Governance, and Resilience (ESG+R) | | | New Accounting Pronouncements and Developments | |
| Results of Operations | | | Internal Controls over Financial Reporting | |
| Investment Properties | | | Risks and Uncertainties | |
| Liquidity and Capital Resources | | | Quarterly Financial Data | |
| | | Forward-Looking Statements | |
BASIS OF PRESENTATION
Management’s Discussion and Analysis of Results of Operations and Financial Position (“MD&A”) of Granite Real Estate Investment Trust (“Granite REIT”) and Granite REIT Inc. (“Granite GP”) summarizes the significant factors affecting the combined operating results, financial condition, liquidity and cash flows of Granite REIT, Granite GP and their subsidiaries (collectively “Granite” or the “Trust”) for the year ended December 31, 2022. Unless otherwise noted, all amounts are in millions of Canadian dollars. This MD&A should be read in conjunction with the accompanying audited combined financial statements for the year ended December 31, 2022 prepared in accordance with International Financial Reporting Standards (“IFRS”) as issued by the International Accounting Standards Board. The MD&A was prepared as at March 8, 2023 and its contents were approved by the Board of Trustees of Granite REIT and Board of Directors of Granite GP on this date. Additional information relating to Granite, including the Annual Report and Annual Information Form (“AIF”) for fiscal 2022 and dated March 8, 2023, can be obtained from the Trust’s website at www.granitereit.com, on SEDAR at www.sedar.com and on EDGAR at www.sec.gov.
In addition to using financial measures determined in accordance with IFRS, Granite also uses certain non-IFRS performance measures and non-IFRS ratios in managing its business to measure financial and operating performance as well as for capital allocation decisions and valuation purposes. Granite believes that providing these measures on a supplemental basis to the IFRS amounts is helpful to investors in assessing the overall performance of Granite’s business.
The non-IFRS performance measures include net operating income before lease termination and close-out fees, straight-line rent and tenant incentive amortization (“NOI - cash basis”), same property NOI - cash basis, constant currency same property NOI, funds from operations (“FFO”), adjusted funds from operations (“AFFO”), adjusted earnings before interest, income taxes, depreciation and amortization (“Adjusted EBITDA”), available liquidity, total debt and net debt. Refer to “NON-IFRS PERFORMANCE MEASURES” for definitions and reconciliations of non-IFRS measures to IFRS financial measures.
The non-IFRS performance ratios include FFO payout ratio, AFFO payout ratio, leverage ratio, interest coverage ratio, net leverage ratio, indebtedness ratio, unencumbered asset coverage ratio and any related per unit amounts. Refer to “NON-IFRS RATIOS” for definitions and reconciliations of non-IFRS ratios to IFRS financial measures.
Readers are cautioned that these measures do not have standardized meanings prescribed under IFRS and, therefore, should not be construed as alternatives to net (loss) income, cash provided by operating activities or any other measure calculated in accordance with IFRS. Additionally, because these terms do not have standardized meanings prescribed by IFRS, they may not be comparable to similarly titled measures presented by other reporting issuers.
FINANCIAL AND OPERATING HIGHLIGHTS
| | | | | | | | | | | | | | | | | | | | | | | |
| Three Months Ended December 31, | | Years Ended December 31, | | Year Ended December 31, |
| (in millions, except as noted) | 2022 | 2021 | | 2022 | 2021 | | 2020 |
| Operating highlights | | | | | | | |
| Revenue | $125.6 | $105.3 | | $455.6 | $393.5 | | $340.2 |
| NOI | 102.4 | 86.3 | | 380.4 | 332.7 | | 293.0 |
NOI - cash basis(1) | 99.6 | 85.7 | | 373.9 | 329.0 | | 289.5 |
| Net (loss) income attributable to stapled unitholders | (126.3) | 341.2 | | 155.8 | 1,310.0 | | 429.8 |
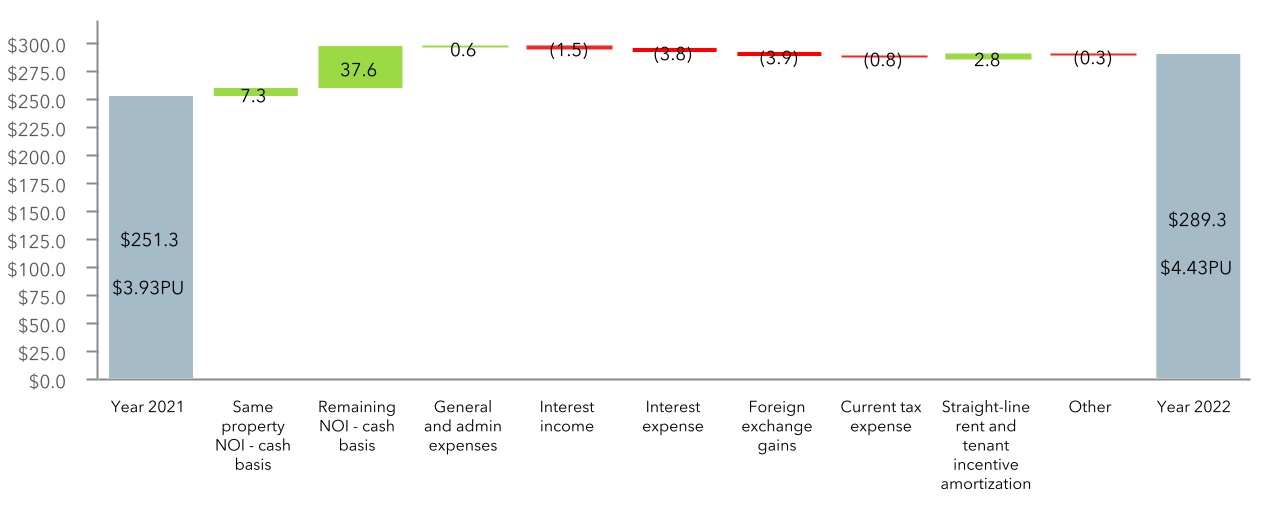
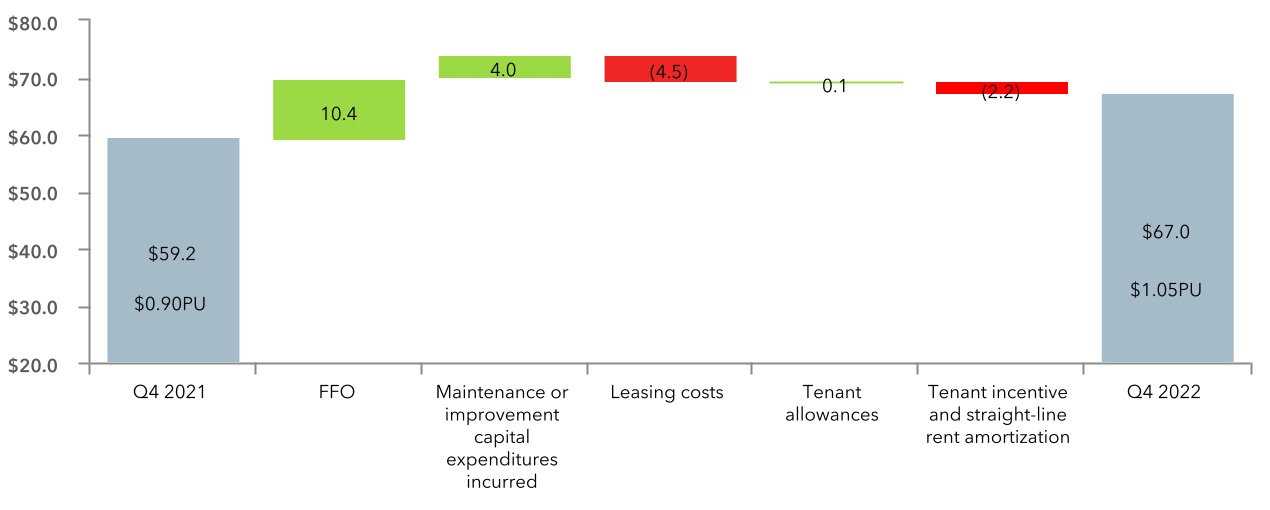
FFO(1) | 77.2 | 66.8 | | 289.3 | 251.3 | | 225.4 |
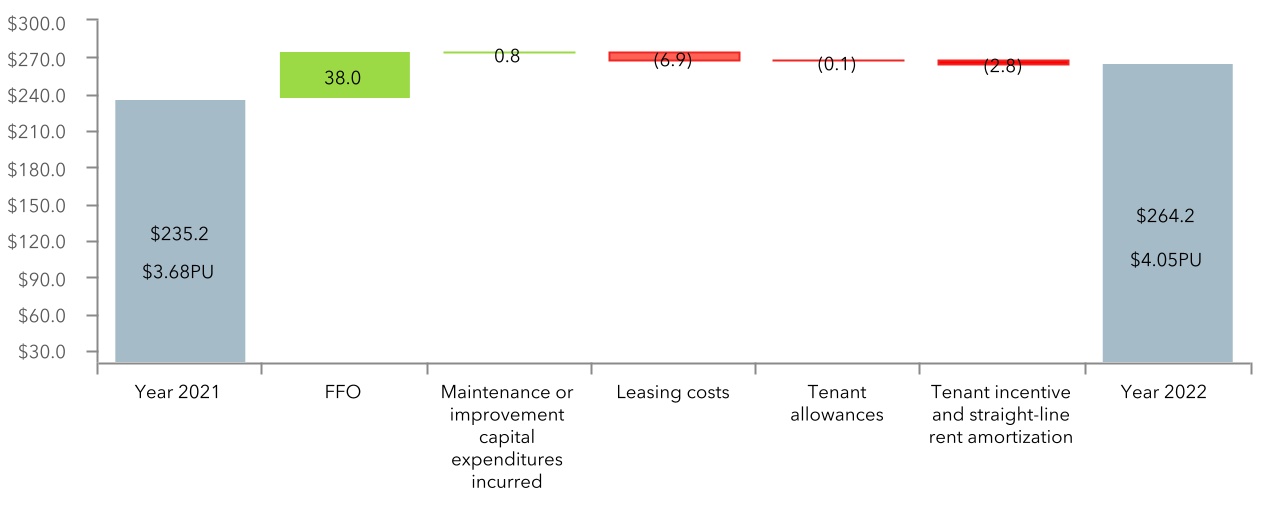
AFFO(1) | 67.0 | 59.2 | | 264.2 | 235.2 | | 215.7 |
| Cash provided by operating activities | 65.5 | 53.7 | | 277.5 | 262.3 | | 249.3 |
| Monthly distributions paid | 49.7 | 49.3 | | 202.3 | 191.1 | | 163.1 |
FFO payout ratio(1)(2) | 65 | % | 75 | % | | 70 | % | 75 | % | | 73 | % |
AFFO payout ratio(1)(2) | 75 | % | 84 | % | | 77 | % | 80 | % | | 77 | % |
| | | | | | | |
| Per unit amounts | | | | | | | |
Diluted FFO(1) | $1.20 | $1.02 | | $4.43 | $3.93 | | $3.98 |
Diluted AFFO(1) | $1.05 | $0.90 | | $4.05 | $3.68 | | $3.81 |
| Monthly distributions paid | $0.78 | $0.75 | | $3.10 | $3.00 | | $2.90 |
| Diluted weighted average number of units | 64.1 | 65.8 | | 65.3 | 64.0 | | 56.7 |
| | | | | | | | | | | |
| | | |
| As at December 31, | 2022 | 2021 | 2020 |
| Financial highlights | | | |
Investment properties - fair value (7) | $8,839.6 | $7,971.2 | $5,855.6 |
Assets held for sale(7) | 41.2 | 64.6 | — |
| Cash and cash equivalents | 135.1 | 402.5 | 831.3 |
Total debt(3) | 2,930.3 | 2,414.0 | 2,297.5 |
| Trading price per unit (TSX: GRT.UN) | $69.03 | $105.20 | $77.90 |
| | | |
| Debt metrics, ratings and outlook | | | |
Net leverage ratio(1) | 32 | % | 25 | % | 25 | % |
Interest coverage ratio(1) | 7.1x | 6.8x | 7.9x |
Indebtedness ratio (total debt to adjusted EBITDA)(1) | 8.3x | 8.1x | 8.7x |
Weighted average cost of debt(4) | 2.28 | % | 1.81 | % | 1.91 | % |
Weighted average debt term-to-maturity, in years(4) | 4.1 | 5.5 | 5.6 |
| DBRS rating and outlook | BBB (high) stable | BBB (high) stable | BBB stable |
| Moody’s rating and outlook | Baa2 Stable | Baa2 stable | Baa2 stable |
| | | |
Property metrics (7) | | | |
| Number of investment properties | 140 | 131 | 115 |
| Income-producing properties | 128 | 119 | 108 |
| Properties under development | 8 | 9 | 3 |
| Land held for development | 4 | 3 | 4 |
| Gross leasable area (“GLA”), square feet | 59.4 | 55.1 | 49.5 |
| Occupancy, by GLA | 99.6 | % | 99.7 | % | 99.6 | % |
Magna as a percentage of annualized revenue(5) | 26 | % | 29 | % | 36 | % |
| Magna as a percentage of GLA | 20 | % | 22 | % | 27 | % |
| Weighted average lease term in years, by GLA | 5.9 | 5.8 | 6.3 |
Overall capitalization rate(6) | 4.9 | % | 4.5 | % | 5.6 | % |
(1) For definitions of Granite’s non-IFRS measures and ratios, refer to the sections “NON-IFRS PERFORMANCE MEASURES” and “NON-IFRS RATIOS”.
(2) The FFO and AFFO payout ratios are calculated as monthly distributions, divided by FFO and AFFO, respectively, in a period.
(3) Total debt includes lease obligations recognized under IFRS 16, Leases.
(4) Excludes lease obligations recognized under IFRS 16, Leases.
(5) Annualized revenue presented is calculated as the contractual base rent for the month subsequent to the quarterly reporting period multiplied by 12 months. Annualized revenue excludes revenue from properties classified as assets held for sale.
(6) Refer to “Valuation Metrics by Asset Category” in the “INVESTMENT PROPERTIES” section.
(7) Assets held for sale are excluded from investment properties and related property metrics. Accordingly, two such assets that were held for sale at December 31, 2022 and three such assets that were held for sale at December 31, 2021 were excluded from investment properties and related metrics at December 31, 2022 and December 31, 2021, respectively, throughout this MD&A.
Property Acquisitions
During the year ended December 31, 2022, Granite acquired eight income-producing industrial properties in Germany, the United States, Canada and Netherlands, one property under development in the United States and one parcel of development land in Canada. Property acquisitions consisted of the following:
| | | | | | | | | | | | | | | | | | | | |
| Acquisitions | | Weighted Average Lease Term, in years by sq ft(1)(3) | | | |
| (in millions, except as noted) | | | | Property Purchase Price(2) | |
| Property Address | Location | Sq ft(1) | Date Acquired | Stabilized Yield(1) |
| | | |
| | | | | | |
| Income-producing properties: | | | | | | |
| Georg-Beatzel Straße 15 | Wiesbaden, GER | 0.2 | | 8.3 | | February 3, 2022 | $ | 62.0 | | 3.4 | % |
| Raiffeisenstraße 28-32 | Korbach, GER | 0.5 | | 8.2 | | February 3, 2022 | 60.3 | | 3.7 | % |
| In der Langen Else 4 | Erfurt, GER | 0.1 | | 1.9 | | February 3, 2022 | 17.6 | | 4.1 | % |
| 10566 Gateway Pt. | Clayton, USA | 0.9 | | 9.8 | | April 14, 2022 | 121.3 | | 4.2 | % |
| 2128 Gateway Pt. | Clayton, USA | 0.4 | | 10.3 | | April 14, 2022 | 57.9 | | 4.4 | % |
| 102 Parkshore Dr. | Brampton, CAN | 0.1 | | 7.0 | | May 24, 2022 | 20.9 | | 4.5 | % |
| 195 Steinway Blvd. | Etobicoke, CAN | 0.1 | | 15.0 | | May 26, 2022 | 17.7 | | 5.0 | % |
| Swaardvenstraat 75 | Tilburg, NL | 0.5 | | 10.0 | | July 1, 2022 | 102.1 | | 3.2 | % |
| | | | | | |
| | | | | | |
| | | | | | |
| | | | | | |
| | | | | | |
| | | | | | |
| | | | | | |
| | | | | | |
| | | | | | |
| | | | | | |
| | | | | | |
| Property under development: | | | | | |
| 905 Belle Ln. | Bolingbrook, USA | 0.2 | | N/A | May 5, 2022 | 14.5 | | 3.9 | % |
| | | | | | |
| | | | | | |
| | | | | | |
| Development land: | | | | | | |
| 161 Markel Dr. | Brant County, CAN | N/A | N/A | August 19, 2022 | 6.4 | N/A |
| | | | | | |
| | | | | | |
| | | | | | |
| | | | | | |
| | | |
| | | | | | |
| | | | | | |
| | | | | | |
| | | | | | |
| | | | | | |
| | | | | | |
| | | | | | |
| | | | | | |
| | | | | | |
| | | | | | |
| | 3.0 | | | | $ | 480.7 | | 3.8 | % |
(1) As at the date of acquisition except as noted in note 3 below.
(2) Purchase price does not include transaction costs associated with property acquisitions.
(3) Weighted average lease term applicable to the occupied space.
Property Dispositions
During the year ended December 31, 2022, Granite disposed of two income-producing properties and a parcel of land located in Poland and the Czech Republic for total proceeds of $66.0 million.
| | | | | | | | | | | | | | | | | |
| Dispositions | | | | |
| (in millions, except as noted) | | | | | |
| Property Address | Location | Sq ft | Date Disposed | Sale Price(1) | Annualized Revenue (2) |
| Disposed during the year ended December 31, 2022: | | | |
| | | | | |
| 10 Topolowa | Mirków, Poland | 0.3 | | February 18, 2022 | $34.5 | | $ | 1.6 | |
378 10 Hospodářský Park, České Velenice (3) | Třeboň, Czech Republic | 0.3 | | June 9, 2022 | 31.5 | | 2.6 | |
| | | | | |
| | 0.6 | | | $66.0 | | $ | 4.2 | |
(1) Sale price does not include transaction costs associated with disposition. |
(2) As at the date of disposition. |
(3) In conjunction with the disposal of the income producing property, the associated carrying value of the non-controlling interest of $1.4 million was derecognized on June 9, 2022. |
Assets Held for Sale
As at December 31, 2022, two income-producing properties located in Canada and the United States were classified as assets held for sale. The properties, having a fair value of $41.2 million and annualized revenue of $1.6 million were classified as assets held for sale on the audited combined balance sheet at December 31, 2022 and were excluded from the value of investment properties. The properties are also excluded from references to investment properties and related property metrics as at December 31, 2022 throughout this MD&A.
Construction, Development and Property Commitments
Granite had the following property purchases and construction and development commitments as at December 31, 2022:
| | | | | | | | | | | | | | | | | |
| Commitments | | Accruals/
Payments/
Deposits Made | | | Year-One Stabilized Yield (2) |
| (in millions, except as noted) | | | |
| Property Location | Additional
sq ft | Future Commitments (1) | Total
Cost |
| As at December 31, 2022: | | | | | |
| Development, construction or expansion: | | | | | |
| Properties under development in Houston, TX | 1.4 | | $ | 132.3 | | $ | 14.1 | | $ | 146.4 | | 6.4 | % |
| Properties under development in Lebanon, TN | 0.5 | | 55.4 | | 16.0 | | 71.4 | | 6.3 | % |
| Property under development in Brantford, ON | 0.4 | | 5.7 | | 63.4 | | 69.1 | | 6.8 | % |
| Property under development in Bolingbrook, IL | 0.2 | | 24.6 | | 12.9 | | 37.5 | | 3.9 | % |
| | | | | |
| Expansion of 555 Beck Cres., Ajax, ON | 0.1 | | 0.7 | | 7.8 | | 8.5 | | 7.6 | % |
| Expansion of 5400 E 500 S, Whitestown, IN | 0.3 | | 33.1 | | 9.3 | | 42.4 | | 5.5 | % |
| | | | | |
| Other construction commitments | — | | 77.8 | | 19.6 | | 97.4 | | — | % |
| | | | | |
| 2.9 | | $ | 329.6 | | $ | 143.1 | | $ | 472.7 | | 6.1 | % |
| | | | | |
| Other property commitments: | | | | |
| Development loan/acquisition of two completed properties in Indiana | 1.0 | $ | 79.3 | | $ | 34.8 | | $ | 114.1 | | 5.7 | % |
| | | | | |
| | | | | |
| | | | | |
| 3.9 | | $ | 408.9 | | $ | 177.9 | | $ | 586.8 | | 6.0 | % |
(1) Includes signed contracts and future budgeted expenditures not yet contracted.(2) Yield based on total cost including land (see “Development and Expansion Projects”).
During the fourth quarter, Granite achieved substantial completion of its 844,000 square foot, 40’ clear height, state-of-the-art modern distribution facility in Murfreesboro, Tennessee that was fully leased starting December 1, 2022 to a leading investment-grade producer of specialized commercial vehicles. This property is included in income-producing properties as at December 31, 2022.
Subsequent to year end, Granite achieved substantial completion of phase one (in March 2023) and phase two (in January 2023) of its development in Houston, Texas. Granite has signed leases with third-party logistics operators for approximately 521,000 square feet of phase one, which consists of two buildings totaling 669,000 square feet. The leases executed range in length between 5 and 7 years. Phase two, comprising of one building that is approximately 689,000 square feet, was pre-leased to a leading e-commerce retailer, and upon completion the lease commenced for an initial term of 10.9 years.
On January 19, 2023, Granite completed the 329,000 square foot, value-enhancing expansion of its approximate 633,000 square foot modern distribution facility in Whitestown, Indiana. Upon completion the lease for the entire facility was extended for a ten year term.
Granite’s other property commitments include a development loan and forward commitment to purchase two industrial properties in Indiana where construction of two buildings totaling 1.0 million square feet is expected to be completed in the first quarter of 2023.
Increase in Distributions
On November 9, 2022, Granite increased its targeted annualized distribution by 3.2% to $3.20 ($0.2667 per month) per stapled unit from $3.10 ($0.2583 per month) per stapled unit to be effective upon the declaration of the distribution in respect of the month of December 2022 and payable in mid-January 2023.
Normal Course Issuer Bid (“NCIB”)
During the fourth quarter, Granite repurchased 1,022,000 stapled units under the NCIB at an average stapled unit cost of $67.60 for total consideration of $69.1 million, excluding commissions.
Subsequent Events
On February 1, 2023, the leases at Granite’s properties in Graz, Austria (the “Graz Facilities”), comprising approximately 5.0 million square feet, were contractually extended for ten years to January 31, 2034. On February 1, 2024 the annual rent for the Graz Facilities for the initial five years of the extension will escalate by the increase in the consumer price index for the 60 month period preceding that date, to a maximum of ten percent.
On March 3, 2023, Granite amended its existing unsecured revolving credit facility (the “Credit Facility”) agreement to extend the maturity date for a new five-year term to March 31, 2028.
Russian Invasion of Ukraine
Granite currently holds investments and operates in Western Europe, specifically in Netherlands, Germany and Austria. Since the commencement of the Russian invasion of Ukraine in late February 2022 and up to the date of this MD&A, the European real estate markets in which Granite operates have remained orderly and Granite has continued to realize stable net operating income growth while continuing to execute on its strategic initiatives.
During the year ended December 31, 2022, and up to the date of this MD&A, there has not been a significant impact on Granite’s operations, assets or liabilities as a result of the war.
Although not directly impacted by the ongoing Russian/Ukraine war thus far, Granite and its tenants are exposed to a broad range of current and evolving risks including:
•slowdown of global economic growth and more specifically in the European region;
•inflationary pressures, including energy, labour and transportation/logistics;
•higher interest rates;
•energy security in Western Europe; and
•supply chain disruptions.
A material deterioration in any of the foregoing could have a material adverse effect on Granite’s tenants and their ability to continue to operate and pay rent, and impact debt and equity markets, either of which could adversely impact Granite’s operations and financial
performance. Granite is continuing to monitor the situation in Ukraine and globally and assessing its potential impact on Granite’s business.
BUSINESS OVERVIEW AND STRATEGIC OUTLOOK
Business Overview
Granite is a Canadian-based real estate investment trust (“REIT”) engaged in the acquisition, development, ownership and management of logistics, warehouse and industrial properties in North America and Europe. As at March 8, 2023, excluding assets held for sale, Granite owns 140 investment properties in five countries having approximately 59.4 million square feet of gross leasable area. Granite has a highly-integrated team of real estate professionals with extensive experience in operations, leasing, development, investment and asset management located at its head office in Toronto, Canada and regional offices in Dallas, United States; Vienna, Austria; and Amsterdam, Netherlands.
Granite’s investment properties consist of income-producing properties, properties under development and land held for development (see “INVESTMENT PROPERTIES”). The income-producing properties consist primarily of logistics, e-commerce and distribution warehouses, and light industrial and heavy industrial manufacturing properties. Lease payments are primarily denominated in three currencies: the Canadian dollar (“$”), the Euro (“€”) and the US dollar (“US$”). Granite’s investment properties (excluding assets held for sale) by geographic location, property count and square footage as at March 8, 2023 are summarized below:
| | |
| Investment Properties Summary |
| Five countries/140 properties/59.4 million square feet |
Strategic Outlook
Management continues to identify and pursue value creation and investment opportunities that management believes will generate superior long-term total returns for unitholders.
Granite’s long-term strategy is to continue to build an institutional quality and globally diversified industrial real estate business; to grow and diversify its asset base through acquisitions, development, re-development and dispositions; to maintain a conservative balance sheet; and to reduce its exposure to its largest tenant, Magna International Inc. and its operating subsidiaries (collectively, “Magna”) and the special purpose properties (see “INVESTMENT PROPERTIES”).
Granite has positioned itself financially to execute on its strategic plan including to capitalize on any strategic opportunities as they arise, and existing and future development activity within its targeted geographic footprint.
As Granite looks to 2023, its priorities are set out below:
•Driving FFO, AFFO and net asset value per unit growth while maintaining conservative capital ratios;
•Executing on development, redevelopment and expansion projects in the U.S., Europe, and the GTA;
•Selectively pursuing strategic land and income-producing property acquisition opportunities in our target markets;
•Advancing Granite’s Environmental, Social, Governance and Resilience (ESG+R) program and meeting established targets for 2023 and beyond; and
•Disposing of select non-core assets.
ENVIRONMENTAL, SOCIAL, GOVERNANCE, AND RESILIENCE (ESG+R)
Granite recognizes the important role building owners can play in fostering the efficient use of resources and respecting our environment. As a good steward for investors, Granite seeks to practically incorporate sustainability in its actions and decision-making process, while generating returns for unitholders.
Consistent with this principle, Granite applies the following long-term ESG+R objectives in its business:
| | | | | | | | | | | |
| Environmental | Social | Governance | Resilience |
| Promote efficiency and sustainable practices at both our properties and our corporate offices | Engage with our investors, employees, tenants, property managers, and community | Disclose our ESG+R performance as a commitment to transparency and accountability | Identify and mitigate potential climate-related risks within our portfolio |
Granite’s ESG+R program is aligned with SASB1, GRESB2, GRI3 and TCFD4. Data provided herein has been reviewed by a third-party ESG+R consultant and represents a snapshot of current performance.
GRESB
2022 GRESB Public Disclosure Report
GRESB assesses and scores the Environmental, Social, and Governance (“ESG”) performance of real estate portfolios around the world and this year increased to over 1,800 participants. Granite completed its third annual GRESB Real Estate Assessment in June 2022.
In GRESB’s Public Disclosure Report, which evaluates the level of ESG disclosure by listed property companies and REITs, Granite was ranked third in the North American Industrial sector comprised of 10 reporting entities. In comparison to Granite’s 2021 results, its Standing Investments score significantly improved from 65 to 73 points, placing Granite second in the North American Industrial Listed sector comprised of nine reporting entities, Granite being the sole Canadian reporting entity in this sector.
1 Sustainability Accounting Standards Board
2 Global Real Estate Sustainability Benchmarking
3 Global Reporting Initiative
4 Task Force on Climate-related Financial Disclosures
Below is a selection of key actions and performance items of Granite’s ESG+R Program:
Environmental — Actions & Performance
•Work to reduce landlord-controlled energy, operational emissions (scope 1 and 2), and water by 25% on an intensity basis, per square foot, by the beginning of 2030 (or 2.5% annual reduction) at Granite’s properties5;
•Increase the energy, emissions, water and waste data coverage across Granite’s portfolio to 50% of its income-producing portfolio by 2030 by collaborating with tenants, implementing green lease language, and obtaining data directly from the utility companies whenever available;
•Granite has exceeded its target to support the production of new renewable energy through the installation of on-site solar PV systems with the capacity to generate 5 MW of electricity by 20256 as solar PV systems with peak generation capacity of 8.5 MW are currently operational on Granite properties. Granite is setting a more ambitious renewable energy target to have solar PV systems with a peak generation capacity of 24 MW by 2025;
•Beehives have been installed at three properties to promote local biodiversity and engagement with tenants, with a fourth beehive planned to be added in 2023;
•Strategically evaluate and pursue applicable green building certifications at Granite’s properties and achieve 30% third-party green building certifications by floor area by 2030;
•Four properties achieved BREEAM In-Use certifications in 2022. One of the properties, 100 Enterprise Parkway, West Jefferson, Ohio, was the first property to be BREEAM certified in the State of Ohio;
•Four properties achieved Institute of Real Estate Management (IREM) Certified Sustainable Property certifications in 2022;
•Commit that all development projects controlled by Granite will be built to standards consistent with the scope of Granite’s Green Bond Framework and certify 100% of new developments to a third-party green building certification standard (such as LEED, BREEAM, Green Globes, DGNB); and
•Three properties received new construction certifications in 2022.
5 Granite’s emissions reduction targets are aligned with the Paris Climate Accords’ goal of limiting global warming to two degrees Celsius above pre-industrial levels.
6 Onsite solar projects are expected to be installed at 10 Granite assets by 2023.
| | | | | | | | | | | | | | |
| Property | Size (Sq ft) in millions | Location | Certification Type | Level |
| 12 Tradeport Rd. | 1.4 | Hanover Township, USA | BREEAM USA in Use | Good |
| 15 Commerce Pkwy. | 1.3 | West Jefferson, USA | LEED New Construction and Major Renovation; BREEAM USA in Use | Certified; Good |
| 100 Clyde Alexander Lane | 0.7 | Pooler, USA | LEED Core and Shell Development | Certified |
| 100 Enterprise Parkway | 1.2 | West Jefferson, USA | BREEAM USA In Use | Good |
| 101 Clyde Alexander Lane | 0.3 | Pooler, USA | LEED Core and Shell Development | Certified |
| 1201 Allpoints Court | 0.5 | Plainfield, USA | Green Globes New Construction | 2 Green Globes |
| 201 Sunridge Boulevard | 0.8 | Wilmer, USA | IREM Certified Sustainable Property | Certified |
| 501 Airtech Parkway | 0.5 | Plainfield, USA | IREM Certified Sustainable Property | Certified |
| 1243 Gregory Dr. | 0.5 | Antioch, USA | LEED Core and Shell Development | Silver |
| 1301 Chalk Hill Road | 2.3 | Dallas, USA | BREEAM USA In Use | Good |
| 2020 Logistics Drive | 0.8 | Mississauga, Canada | IREM Certified Sustainable Property | Certified |
| Expansion to 2095 Logistics Drive | 0.1 | Mississauga, Canada | Green Globes New Construction | 2 Green Globes |
| 2100 Center Square Rd. | 0.4 | Logan Township, USA | LEED Core and Shell Development | Silver |
| 3501 North Lancaster Hutchins Rd. | 0.2 | Lancaster, USA | LEED New Construction and Major Renovation | Silver |
| 5000 Village Creek Rd. | 0.6 | Fort Worth, USA | Green Globes New Construction | 2 Green Globes |
| 8735 South Crossroads Dr. | 0.9 | Olive Branch, USA | LEED Core and Shell Development | Certified |
| 8740 South Crossroads Dr. | 0.9 | Olive Branch, USA | LEED Core and Shell Development | Certified |
| 18201 NE Portal Way | 0.3 | Portland, USA | IREM Certified Sustainable Property | Certified |
| Aquamarijnweg 2 & 4 | 0.2 | Bleiswijk, Netherlands | BREEAM New Construction | Very Good |
| De Kroonstrat 1 (Phase 1), De Poosthoornstraat 2 (Phase 2) | 0.5 | Tilburg, Netherlands | BREEAM New Construction | Excellent |
| Francis Baconstraat 4 | 0.1 | Ede, Netherlands | BREEAM New Construction | Very Good |
| Im Ghai 36 | 0.3 | Altbach, Germany | DGNB New Construction Logistics Buildings | Gold |
| Oude Graaf 15 | 0.2 | Weert, Netherlands | BREEAM New Construction | Excellent |
Social — Actions & Performance
•Granite administered its 2021 Employee Engagement Survey in April 2021 to gain an understanding of employee engagement and the effectiveness of its workplace practices. Granite intends to follow up with a second employee engagement survey in 2023;
•In 2021, Granite conducted a survey of all tenants to gauge satisfaction levels and identify opportunities for improvement;
•In June 2022, Granite completed its tenant ESG+R surveys;
•Contribute at least $500 local currency (USD/CAD/EUR) per income-producing property in Granite’s portfolio toward charitable donations;
•As part of Granite’s due diligence process, assess 100% of potential acquisitions for ESG+R and identify areas for improvement;
•Granite established a hybrid working model in 2022, providing enhanced work from home flexibility during the work week; and
•Granite held a company-wide conference in Dallas, Texas during the third quarter of 2022 where third-party consultants, Re Tech Advisors (formerly LORD Green Strategies), presented updates and progress on Granite’s ESG+R program and recent market trends and developments to all employees.
Governance — Actions & Performance
•Provide leadership over Granite’s ESG+R Program through the Granite ESG+R Committee;
•Provide transparency to investors by incorporating ESG+R into regular updates to unitholders and stakeholders and through formal reporting frameworks such as GRESB, SASB, CDP, and GRI;
•Monitor asset compliance with government benchmarking requirements and ESG+R related regulations;
•Granite’s 2021 ESG+R Report was issued in August 2022 and follows the GRI framework with TCFD and SASB disclosures;
•Granite submitted to GRESB in June 2022 and is currently preparing for the 2023 submission;
•In June 2022, the Declaration of Trust was amended and restated to, among other things, (i) further align the Declaration of Trust with evolving governance best practices which includes introducing rights and remedies in favour of unitholders consistent with those available to shareholders of a corporation pursuant to the Business Corporations Act; and (ii) enhance unitholders’ rights respecting the process for and procedures at unitholder meetings, including the submission of proposals by unitholders;
•Granite maintains robust policies governing the various aspects of its business activities, which are reviewed annually and updated from time to time in order to reflect regulatory compliance and industry best practices, as appropriate; and
•Granite submitted its second CDP report in 2022.
Resilience — Actions & Performance
•Aligning Granite’s resilience program with the TCFD framework;
•Assess physical and transition climate-change risks during the new acquisition due diligence process and evaluate measures to increase resiliency in Granite’s underwriting process;
•Regular evaluation of Granite for physical and transition climate-change risks and evaluate strategies to mitigate risks; and
•Granite uses the Moody’s ESG Solutions Climate on Demand tool to manage climate-related analytics which generate 1-100 risk scores in six physical categories of climate-related risks: sea-level rise, floods, hurricanes, heat stress, water stress and wildfires.
RESULTS OF OPERATIONS
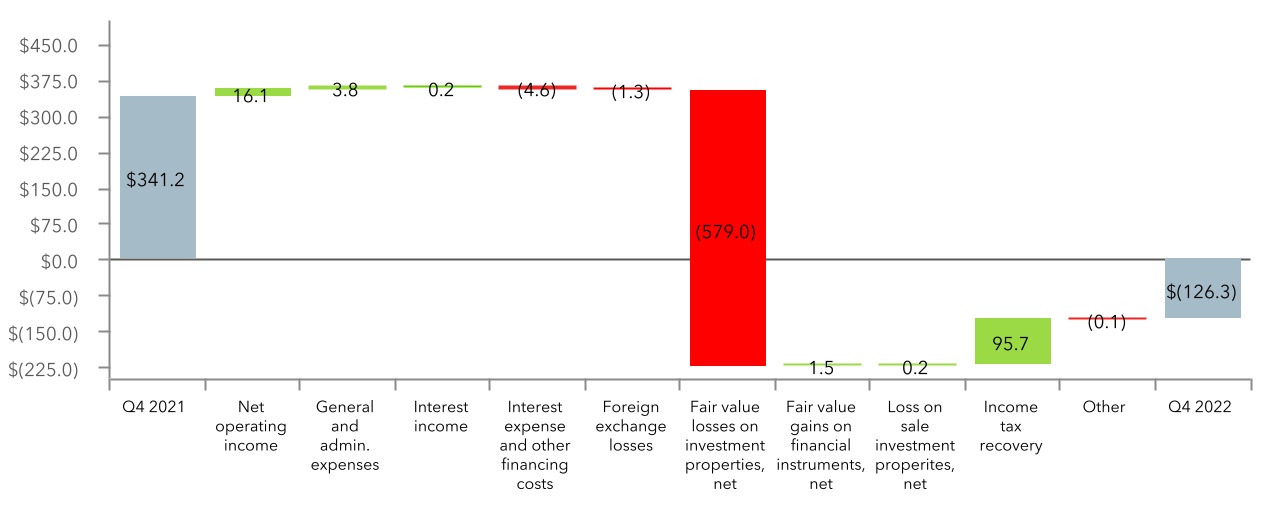
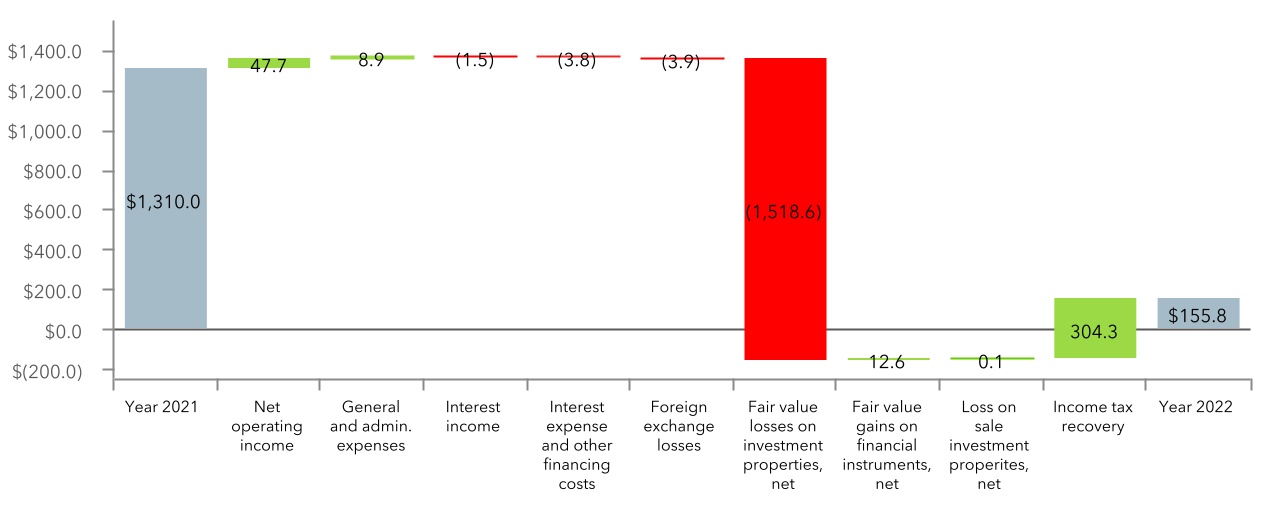
Net (Loss) Income
The following is a summary of financial information from the combined statements of net (loss) income for the three months and years ended December 31, 2022 and 2021, respectively:
| | | | | | | | | | | | | | | | | | | | | | | |
| Net (Loss) Income |
| | | | | | | |
| Three Months Ended December 31, | | Years Ended December 31, |
| (in millions, except as noted) | 2022 | 2021 | $ change | | 2022 | 2021 | $ change |
| Rental revenue | $ | 125.6 | | $ | 105.3 | | 20.3 | | | $ | 455.6 | | $ | 393.5 | | 62.1 | |
| Revenue | 125.6 | | 105.3 | | 20.3 | | | 455.6 | | 393.5 | | 62.1 | |
| Property operating costs | 23.2 | | 19.0 | | 4.2 | | | 75.2 | | 60.8 | | 14.4 | |
| Net operating income | 102.4 | | 86.3 | | 16.1 | | | 380.4 | | 332.7 | | 47.7 | |
| | | | | | | |
| General and administrative expenses | 8.6 | | 12.4 | | (3.8) | | | 29.5 | | 38.4 | | (8.9) | |
| Depreciation and amortization | 0.4 | | 0.2 | | 0.2 | | | 1.6 | | 1.3 | | 0.3 | |
| Interest income | (1.1) | | (0.9) | | (0.2) | | | (1.6) | | (3.1) | | 1.5 | |
| Interest expense and other financing costs | 16.7 | | 12.1 | | 4.6 | | | 51.0 | | 47.2 | | 3.8 | |
| Foreign exchange gains, net | (0.8) | | (2.1) | | 1.3 | | | (1.2) | | (5.1) | | 3.9 | |
| Fair value losses (gains) on investment properties, net | 229.9 | | (349.1) | | 579.0 | | | 219.7 | | (1,298.9) | | 1,518.6 | |
| Fair value (gains) losses on financial instruments, net | (2.1) | | (0.6) | | (1.5) | | | (11.4) | | 1.2 | | (12.6) | |
| Loss on sale of investment properties | — | | 0.2 | | (0.2) | | | 0.7 | | 0.8 | | (0.1) | |
| (Loss) income before income taxes | (149.2) | | 414.1 | | (563.3) | | | 92.1 | | 1,550.9 | | (1,458.8) | |
| Income tax (recovery) expense | (22.9) | | 72.8 | | (95.7) | | | (63.7) | | 240.6 | | (304.3) | |
| Net (loss) income | $ | (126.3) | | $ | 341.3 | | (467.6) | | $ | 155.8 | | $ | 1,310.3 | | (1,154.5) |
| | | | | | | |
| Net (loss) income attributable to: | | | | | | | |
| Stapled unitholders | (126.3) | | 341.2 | | (467.5) | | | 155.8 | | 1,310.0 | | (1,154.2) | |
| Non-controlling interests | — | | 0.1 | | (0.1) | | | — | | 0.3 | | (0.3) | |
| $ | (126.3) | | $ | 341.3 | | (467.6) | | $ | 155.8 | | $ | 1,310.3 | | (1,154.5) |
| | | | | | | |
Foreign Currency Translation
The majority of Granite’s investment properties are located in Europe and the United States and the cash flows derived from such properties are primarily denominated in Euros and US dollars. Accordingly, fluctuations in the Canadian dollar, Granite’s reporting currency, relative to the Euro and US dollar will result in fluctuations in the reported values of revenues, expenses, cash flows, assets and liabilities. The most significant foreign currency exchange rates that impact Granite’s business are summarized in the following table:
| | | | | | | | | | | | | | | | | | | | | | | | | | | | | | | | | | | | | | | | | | | | |
| Average Exchange Rates | | Period End Exchange Rates |
| Three Months Ended December 31, | | | Years Ended December 31, | | | December 31, | | December 31, | |
| 2022 | | 2021 | Change | | 2022 | | 2021 | Change | | 2022 | | 2021 | Change |
| $ per €1.00 | 1.386 | | | 1.441 | | (4 | %) | | 1.370 | | | 1.482 | | (8 | %) | | 1.447 | | | 1.440 | | — | % |
| $ per US$1.00 | 1.357 | | | 1.261 | | 8 | % | | 1.302 | | | 1.254 | | 4 | % | | 1.353 | | | 1.266 | | 7 | % |
For the three months and year ended December 31, 2022 compared to the prior year periods, the average exchange rate of the Euro relative to the Canadian dollar was lower, which on a comparative basis, decreased the Canadian dollar equivalent of revenue and expenses from Granite’s European operations.
For the three months and year ended December 31, 2022 compared to the prior year periods, the average exchange rate of the US dollar relative to the Canadian dollar was higher, which on a comparative basis, increased the Canadian dollar equivalent of revenue and expenses from Granite’s U.S. operations.
The period end exchange rates of the Euro and the US dollar relative to the Canadian dollar on December 31, 2022 were higher, when compared to the December 31, 2021 exchange rates. As a result, the Canadian dollar equivalent of assets and liabilities from Granite’s European and U.S. operations were higher, when compared to December 31, 2021.
On a net basis, the effect of the changes in exchange rates on Granite’s operating results for the three months and year ended December 31, 2022 was as follows:
| | | | | | | | | | | | | | |
| Effects of Changes in Exchange Rates on Operating Results |
| | | |
| Three Months Ended December 31, | Years Ended December 31, |
| (in millions, except per unit information) | 2022 vs 2021 | 2022 vs 2021 |
| Increase (decrease) in revenue | | $ | 3.7 | | | $ | (1.0) | |
| Increase (decrease) in NOI - cash basis | | 2.4 | | | (3.2) | |
| Decrease in net income | | (1.4) | | | (14.0) | |
| Increase in FFO | | 2.6 | | | 0.1 | |
| Increase (decrease) in AFFO | | 2.0 | | | (1.1) | |
| Increase in FFO per unit | | $0.04 | | — | |
| Increase (decrease) in AFFO per unit | | $0.03 | | $(0.02) |
Operating Results
Revenue
| | | | | | | | | | | | | | | | | | | | |
| Revenue |
| | | | | |
| Three Months Ended December 31, | | Years Ended December 31, | |
| 2022 | 2021 | $ change | 2022 | 2021 | $ change |
Rental revenue and amortization(1) | $ | 103.2 | | $ | 87.6 | | 15.6 | | $ | 382.7 | | $ | 335.2 | | 47.5 | |
| Tenant recoveries | 22.4 | | 17.7 | | 4.7 | | 72.9 | | 58.3 | | 14.6 | |
| | | | | | |
| Revenue | $ | 125.6 | | $ | 105.3 | | 20.3 | | $ | 455.6 | | $ | 393.5 | | 62.1 | |
|
(1) Rental revenue and amortization include base rent, straight-line rent amortization and tenant incentive amortization.
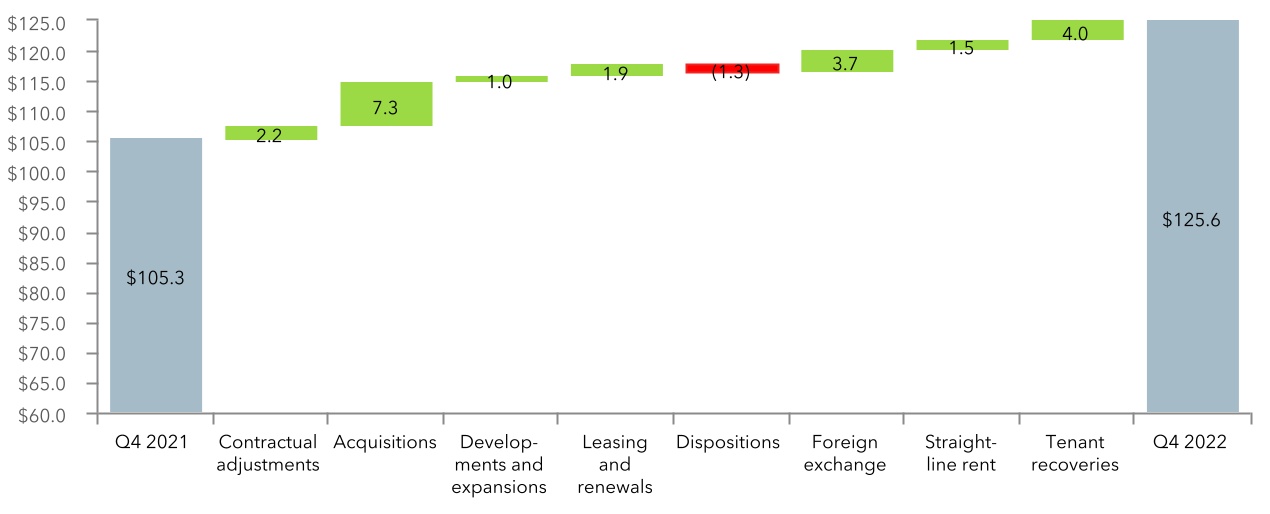
Revenue for the three month period ended December 31, 2022 increased by $20.3 million to $125.6 million from $105.3 million in the prior year period. The components contributing to the change in revenue are detailed below:
| | |
| Q4 2022 vs Q4 2021 Change in Revenue |
Additional details pertaining to the components of the change in revenue are as follows:
•contractual rent adjustments included $1.0 million from consumer price index based increases and $1.2 million from fixed contractual adjustments related to rent escalations;
•the acquisitions of properties located in the United States, Canada, Netherlands and Germany beginning in the fourth quarter of 2021 increased revenue by $7.3 million;
•the completion of one development and one expansion project in Germany and Canada, respectively, increased revenue by $1.0 million;
•revenue increased by $1.9 million due to renewal and re-leasing activities for properties primarily in Canada, the United States and Netherlands;
•the sale of properties located in Austria, Poland and the Czech Republic beginning in the fourth quarter of 2021 decreased revenue by $1.3 million;
•foreign exchange had a net $3.7 million positive impact to revenue primarily due to the relative weakening of the Canadian dollar against the US dollar, partially offset by the relative strengthening of the Canadian dollar against the Euro, which increased revenue by $5.0 million and decreased revenue by $1.3 million, respectively; and
•straight-line rent and tenant recoveries increased revenue by $1.5 million and $4.0 million, respectively.
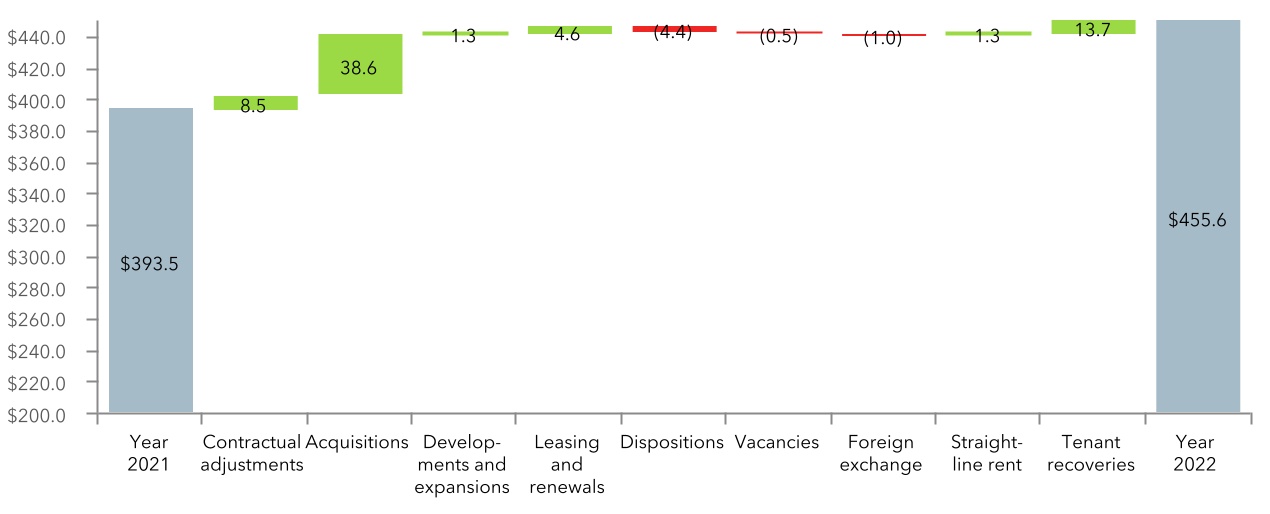
Revenue for the year ended December 31, 2022 increased by $62.1 million to $455.6 million from $393.5 million in the prior year period. The components contributing to the change in revenue are detailed below:
| | |
| Year 2022 vs Year 2021 Change in Revenue |
Additional details pertaining to the components of the change in revenue are as follows:
•contractual rent adjustments included $3.5 million from consumer price index based increases and $5.0 million from fixed contractual adjustments related to rent escalations;
•the acquisitions of properties located in the United States, Canada, Netherlands and Germany during 2021 and 2022 increased revenue by $38.6 million;
•the completion of one development and one expansion projects in Germany and Canada, respectively, increased revenue by $1.3 million;
•revenue increased by $4.6 million due to renewal and re-leasing activities for properties primarily in Canada, the United States, Netherlands and Germany;
•the sale of properties located in Austria, the United Kingdom, Poland and the Czech Republic during 2021 and 2022 decreased revenue by $4.4 million;
•vacancies at two properties in the United States decreased revenue by $0.5 million;
•foreign exchange had a net $1.0 million negative impact to revenue primarily due to the relative strengthening of the Canadian dollar against the Euro, partially offset by the relative weakening of the Canadian dollar against the US dollar, which decreased revenue by $10.6 million and increased revenue by $9.6 million, respectively; and
•straight-line rent and tenant recoveries increased revenue by $1.3 million and $13.7 million, respectively.
Net Operating Income
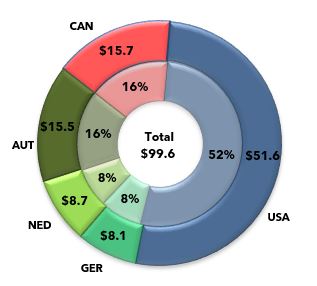
Net operating income (“NOI”) during the three months ended December 31, 2022 was $102.4 million compared to $86.3 million during the three months ended December 31, 2021. NOI for the year ended December 31, 2022 was $380.4 million compared to $332.7 million for the year ended December 31, 2021. NOI - cash basis excludes the impact of lease termination, close-out fees, straight-line rent and tenant incentive amortization and reflects the cash generated by the income-producing properties excluding lease termination and close-out fees on a period-over-period basis. NOI - cash basis was $99.6 million during the three months ended
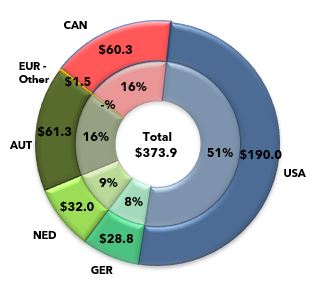
December 31, 2022 compared with $85.7 million during the prior year period, an increase of 16.2%. NOI — cash basis was $373.9 million for the year ended December 31, 2022 compared with $329.0 million for the prior year period, an increase of 13.6%.
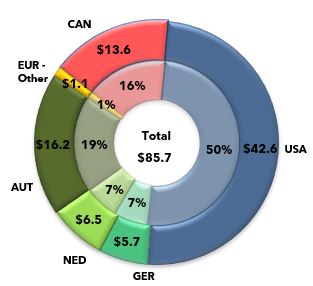
Same property NOI - cash basis refers to the NOI - cash basis for those properties owned by Granite throughout the entire current and prior year periods under comparison. Same property NOI - cash basis excludes the impact of properties that were acquired, disposed of and classified as held for sale, or properties under development during the periods under comparison. Same property NOI - cash basis for the three months ended December 31, 2022 was $90.6 million, compared with $83.3 million for the prior year period. Same property NOI — cash basis for the year ended December 31, 2022 was $318.9 million, compared to $311.6 million for the year ended December 31, 2021. The changes in NOI, NOI - cash basis and same property NOI - cash basis are detailed below:
| | | | | | | | | | | | | | | | | | | | | | | | | | | | | | | | |
| Same Property NOI |
| | | | | | | | | |
| Sq ft(1) | Three Months Ended December 31, | Sq ft(1) | Years Ended December 31, |
| (in millions) | 2022 | 2021 | $ change | % change | (in millions) | 2022 | 2021 | $ change | % change |
| Revenue | | $ | 125.6 | | $ | 105.3 | | 20.3 | | | | $ | 455.6 | | $ | 393.5 | | 62.1 | | |
| Less: Property operating costs | | 23.2 | | 19.0 | | 4.2 | | | | 75.2 | | 60.8 | | 14.4 | | |
| NOI | | $ | 102.4 | | $ | 86.3 | | 16.1 | | 18.7 | % | | $ | 380.4 | | $ | 332.7 | | 47.7 | | 14.3 | % |
| Add (deduct): | | | | | | | | | | |
| Straight-line rent amortization | | (3.6) | | (1.8) | | (1.8) | | | | (10.6) | | (8.8) | | (1.8) | | |
| Tenant incentive amortization | | 0.8 | | 1.2 | | (0.4) | | | | 4.1 | | 5.1 | | (1.0) | | |
| NOI - cash basis | 59.4 | | $ | 99.6 | | $ | 85.7 | | 13.9 | | 16.2 | % | 59.4 | | $ | 373.9 | | $ | 329.0 | | 44.9 | | 13.6 | % |
| Less NOI - cash basis for: | | | | | | | | | | |
| Acquisitions | 4.8 | | (7.8) | | (0.5) | | (7.3) | | | 10.5 | (50.8) | | (9.2) | | (41.6) | | |
| Developments | 0.9 | | (0.6) | | — | | (0.6) | | | 0.9 | | (0.5) | | (0.1) | | (0.4) | | |
| Dispositions and assets held for sale | 1.1 | | (0.6) | | (1.9) | | 1.3 | | | 1.1 | | (3.7) | | (8.1) | | 4.4 | | |
| Same property NOI - cash basis | 53.7 | | $ | 90.6 | | $ | 83.3 | | 7.3 | | 8.8 | % | 48.0 | $ | 318.9 | | $ | 311.6 | | 7.3 | | 2.3 | % |
Constant currency same property NOI - cash basis(2) | 53.7 | | $ | 90.6 | | $ | 85.5 | | 5.1 | | 6.0 | % | 48.0 | $ | 318.9 | | $ | 308.5 | | 10.4 | | 3.4 | % |
(1) The square footage relating to the NOI — cash basis represents GLA of 59.4 million square feet as at December 31, 2022. The square footage relating to the same property NOI — cash basis represents the aforementioned GLA excluding the impact from the acquisitions, dispositions, assets held for sale and developments during the relevant period.
(2) Constant currency same property NOI - cash basis is calculated by converting the comparative same property NOI - cash basis at current period average foreign exchange rates.
Property operating costs include recoverable and non-recoverable costs from tenants and consist of property taxes, utilities, insurance, repairs and maintenance, legal and other property-related expenses.
Straight-line rent amortization represents the scheduled fixed rent changes or rent-free periods in leases that are recognized in revenue evenly on a straight-line basis over the term of the lease. Tenant incentive amortization mainly represents allowances provided to tenants that are
recognized in revenue evenly on a straight-line basis over the term of the lease and primarily comprises the amortization associated with the cash allowance incentives paid to Magna in respect of the 10-year lease extensions exercised during the 2014 year at the Thondorf and Eurostar properties in Graz, Austria.
NOI - cash basis for the three months ended December 31, 2022 increased by $13.9 million to $99.6 million from $85.7 million in the prior year period, representing an increase of 16.2%. NOI - cash basis for the year ended December 31, 2022 increased by $44.9 million to $373.9 million from $329.0 million in the prior year period, representing an increase of 13.6%. The increase in NOI - cash basis was largely a result of the increase in rental revenue as noted previously, partially offset by an increase in property operating costs primarily relating to the properties acquired in 2021 and 2022.
Same property NOI - cash basis for the three months ended December 31, 2022 increased by $7.3 million (8.8%) to $90.6 million from $83.3 million primarily due to the increase in contractual rents arising from both consumer price index and fixed rent increases, re-leasing and renewals of leases for properties primarily located in Canada, the United States, Germany and Netherlands, and the favourable foreign exchange impact from the weakening of the Canadian dollar against the US dollar, partially offset by the unfavourable foreign exchange impact from the strengthening of the Canadian dollar against the Euro. Excluding the impact of foreign exchange, same property NOI - cash basis for the three month period ended December 31, 2022 increased by $5.1 million (6.0%) from the prior year period.
Same property NOI - cash basis for the year ended December 31, 2022 increased by $7.3 million (2.3%) to $318.9 million from $311.6 million primarily due to the increase in contractual rents arising from both consumer price index and fixed rent increases, re-leasing and renewals of leases for properties primarily located in Canada, the United States, Netherlands and Germany, and the favourable foreign exchange impact from the weakening of the Canadian dollar against the US dollar, partially offset by the unfavourable foreign exchange impact from the strengthening of the Canadian dollar against the Euro. Excluding the impact of foreign exchange, same property NOI - cash basis for the year ended December 31, 2022 increased by $10.4 million (3.4%) from the prior year period.
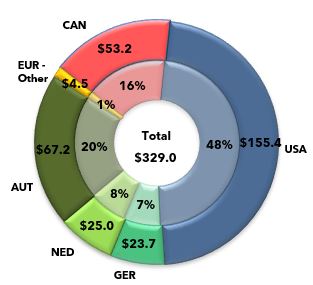
NOI - cash basis for the three month periods and years ended December 31, 2022 and 2021 by geography was as follows:
| | |
| NOI - Cash Basis by Geography |
| | | | | |
| Fourth Quarter 2022 | Fourth Quarter 2021 |
Granite’s property portfolio and NOI - cash basis are geographically diversified, which reduces the risk to Granite’s operating results from any particular country’s economic downturn.
Same property NOI - cash basis for the three month periods and years ended December 31, 2022 and 2021 by geography was as follows:
| | | | | | | | | | | | | | | | | | | | | | | |
| Same Property NOI - Cash Basis by Geography |
| | | | | | | |
| Three Months Ended December 31, | | Year Ended December 31, |
| 2022 | 2021 | % change | | 2022 | 2021 | % change |
| | | | | | | |
| Canada | $14.0 | | $13.2 | | 6.1 | % | | $54.3 | | $52.3 | | 3.8 | % |
| United States | 48.4 | | 42.1 | | 15.0 | % | | 156.1 | | 145.5 | | 7.3 | % |
| Austria | 15.6 | | 16.1 | | (3.1) | % | | 61.3 | | 65.7 | | (6.7) | % |
| Germany | 6.1 | | 5.7 | | 7.0 | % | | 23.5 | | 23.7 | | (0.8) | % |
| Netherlands | 6.5 | | 6.2 | | 4.8 | % | | 23.7 | | 24.4 | | (2.9) | % |
| Same Property NOI - cash basis | $90.6 | | $83.3 | | 8.8 | % | | $318.9 | | $311.6 | | 2.3 | % |
Constant currency same property NOI - cash basis for the three month periods and years ended December 31, 2022 and 2021 by geography was as follows, which is calculated by converting the comparative same property NOI - cash basis at current foreign exchange rates:
| | | | | | | | | | | | | | | | | | | | | | | |
| Constant Currency Same Property NOI - Cash Basis by Geography |
| | | | | |
| Three Months Ended December 31, | | Year Ended December 31, |
| 2022 | 2021 | % change | | 2022 | 2021 | % change |
| | | | | | | |
| Canada | $14.0 | $13.2 | 6.1 | % | | $54.3 | $52.3 | 3.8 | % |
| United States | 48.4 | | 45.3 | | 6.8 | % | | 156.1 | | 151.1 | | 3.3 | % |
| Austria | 15.6 | | 15.5 | | 0.6 | % | | 61.3 | | 60.7 | | 1.0 | % |
| Germany | 6.1 | | 5.5 | | 10.9 | % | | 23.5 | | 21.9 | | 7.3 | % |
| Netherlands | 6.5 | | 6.0 | | 8.3 | % | | 23.7 | | 22.5 | | 5.3 | % |
Constant Currency Same Property NOI - cash basis (1) | $90.6 | | $85.5 | 6.0 | % | | $318.9 | | $308.5 | 3.4 | % |
(1) Constant currency same property NOI - cash basis is calculated by converting the comparative same property NOI - cash basis at current period average foreign exchange rates.
General and Administrative Expenses
General and administrative expenses consisted of the following:
| | | | | | | | | | | | | | | | | | | | | | | |
| General and Administrative Expenses |
| | | | | |
| Three Months Ended December 31, | | Year Ended December 31, |
| 2022 | 2021 | $ change | | 2022 | 2021 | $ change |
| Salaries and benefits | $ | 4.5 | | $ | 4.9 | | (0.4) | | | $ | 18.2 | | $ | 17.1 | | 1.1 | |
| Audit, legal and consulting | 0.6 | | 0.9 | | (0.3) | | | 3.2 | | 3.5 | | (0.3) | |
| Trustee/director fees and related expenses | 0.4 | | 0.4 | | — | | | 1.7 | | 1.6 | | 0.1 | |
| Executive unit-based compensation expense including distributions | 0.9 | | 1.2 | | (0.3) | | | 4.6 | | 5.0 | | (0.4) | |
| Fair value remeasurement of trustee/director and executive unit-based compensation plans | — | | 3.6 | | (3.6) | | | (6.3) | | 6.1 | | (12.4) | |
| Other public entity costs | 0.3 | | 0.5 | | (0.2) | | | 2.6 | | 2.0 | | 0.6 | |
| Office rents including property taxes and common area maintenance costs | 0.2 | | 0.1 | | 0.1 | | | 0.5 | | 0.4 | | 0.1 | |
| Capital tax | 0.3 | | 0.2 | | 0.1 | | | 0.9 | | 0.6 | | 0.3 | |
| Information technology | 0.6 | | 0.5 | | 0.1 | | | 2.2 | | 1.8 | | 0.4 | |
| Other | 1.0 | | 0.4 | | 0.6 | | | 2.8 | | 1.0 | | 1.8 | |
| $ | 8.8 | | $ | 12.7 | | (3.9) | | | $ | 30.4 | | $ | 39.1 | | (8.7) | |
| Less: capitalized general and administrative expenses | (0.2) | | (0.3) | | 0.1 | | | (0.9) | | (0.7) | | (0.2) | |
| General and administrative expenses | $ | 8.6 | | $ | 12.4 | | (3.8) | | | $ | 29.5 | | $ | 38.4 | | (8.9) | |
General and administrative expenses were $8.6 million for the three month period ended December 31, 2022 and decreased $3.8 million in comparison to the prior year period primarily as a result of the following:
•a decrease in the fair value remeasurement expense associated with the trustee/director and executive unit-based compensation plans resulting from a slight increase in the market price of the Trust’s stapled units in the current year period compared to a larger increase in the market price of the Trust’s stapled units in the fourth quarter of 2021;
•a decrease in salaries and benefits expense primarily due to higher incentive compensation recorded in the prior year period, partially offset by an increase in headcount in North America and Europe;
•a decrease in audit, legal and consulting expenses primarily due to a decrease in professional fees relating to higher transactional activity in the prior year period; and
•a decrease in executive unit-based compensation expense primarily due to the decrease in the fair value of the performance stapled units (“PSU”) resulting in a lower compensation expense of the PSU grants, partially offset by;
•an increase in other general and administrative expenses primarily relating to the resumption of travel and property tours.
General and administrative expenses were $29.5 million for the year ended December 31, 2022 and decreased $8.9 million in comparison to the prior year period primarily as a result of the following:
•an increase in the fair value remeasurement recovery associated with the trustee/director and executive unit-based compensation plans resulting from a decrease in the market price of the Trust’s stapled units in the current year period compared to the increase in the market price of the Trust’s stapled units in the prior year period;
•a decrease in executive unit-based compensation expense primarily due to the decrease in the fair value of the performance stapled units (“PSU”) resulting in a lower compensation expense of the PSU grants; and
•a decrease in audit, legal and consulting expenses primarily due to a decrease in professional fees relating to higher transactional activity in the prior year period, partially offset by;
•an increase in salaries and benefits expense primarily due to an increase in headcount in North America and Europe;
•an increase in other public entity costs primarily due to the special business conducted at Granite’s in-person Annual General and Special Meeting, and higher public entity listing and ESG+R reporting fees; and
•an increase in other general and administrative expenses primarily relating to costs associated with the exploration of potential acquisitions, increased travelling expenses upon the resumption of property tours and staff travel, and recruiting fees as a result of the additional employees in North America and Europe.
Interest Income
Interest income for the three month period ended December 31, 2022 increased $0.2 million to $1.1 million from $0.9 million in the prior year period. The $0.2 million increase is primarily due to interest income earned from higher interest rates in the current year period relative to the prior year period, partially offset by lower invested cash balances on hand in the current year relative to the prior year. Interest income for the year ended December 31, 2022 decreased $1.5 million to $1.6 million from $3.1 million in the prior year period. The $1.5 million decrease is primarily due to lower invested cash balances on hand in the current year relative to the prior year, partially offset by higher interest rates in the current year.
Interest Expense and Other Financing Costs
Interest expense and other financing costs for the three month period ended December 31, 2022 increased $4.6 million to $16.7 million from $12.1 million in the prior year period. The increase was primarily due to the drawdown of the 2025 Term Loan (as defined herein) in September 2022 and higher interest costs due to an increase in borrowing rates in the current year period relative to the prior year period.
Interest expense and other financing costs for the year ended December 31, 2022 increased $3.8 million to $51.0 million from $47.2 million in the prior year period. The increase was primarily due to the issuance of the 2028 Debentures (as defined herein) in August 2021, draws on the Credit Facility, the drawdown of the 2025 Term Loan in September 2022 and higher interest costs due to an increase in borrowing rates in the current year relative to the prior year, partially offset by a decrease related to a $4.0 million early redemption premium for the $250.0 million aggregate principal amount of 3.788% Series 2 senior debentures due July 5, 2021 (“the 2021 Debentures”) recorded in the first quarter of 2021.
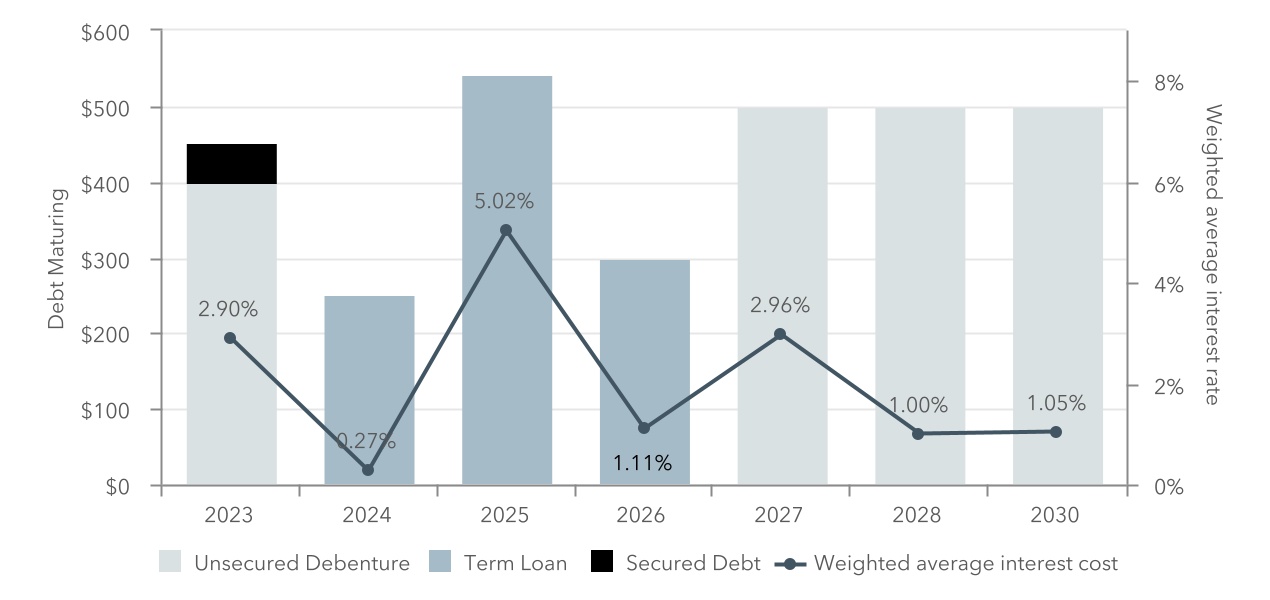
As at December 31, 2022, Granite’s weighted average cost of interest-bearing debt was 2.28% (December 31, 2021 - 1.81%) and the weighted average debt term-to-maturity was 4.1 years (December 31, 2021 - 5.5 years).
Foreign Exchange Gains and Losses, Net
Granite recognized net foreign exchange gains of $0.8 million and $2.1 million in the three months ended December 31, 2022 and 2021, respectively. The $1.3 million decrease in net foreign exchange gains is primarily due to the decrease in foreign exchange gains from the settlement of foreign exchange collar contracts of $0.7 million when compared to the prior year period and the remeasurement of certain monetary assets and liabilities of the Trust that are denominated in US dollars and Euros.
Granite recognized net foreign exchange gains of $1.2 million and $5.1 million in the years ended December 31, 2022 and 2021, respectively. The $3.9 million decrease in net foreign exchange gains is primarily due to the decrease in foreign exchange gains from the settlement of foreign exchange collar contracts of $4.5 million when compared to the prior year period, partially offset by the remeasurement of certain monetary assets and liabilities of the Trust that are denominated in US dollars and Euros.
Fair Value Gains and Losses on Investment Properties, Net
Net fair value losses on investment properties were $229.9 million and net fair value gains on investment properties were $349.1 million in the three months ended December 31, 2022 and 2021, respectively. In the three months ended December 31, 2022, net fair value losses of $229.9 million were primarily attributable to the expansion in discount and terminal capitalization rates across all of Granite’s markets in response to rising interest rates, partially offset by fair market rent increases across the GTA and selective U.S. and European markets reflecting current market fundamentals.
Net fair value gains on investment properties in the three months ended December 31, 2021 of $349.1 million were primarily attributable to favourable changes in fair market rent assumptions as well as compression in discount and terminal capitalization rates for properties located in the GTA and across the United States and Europe.
Net fair value losses on investment properties were $219.7 million and net fair value gains on investment properties were $1,298.9 million in the years ended December 31, 2022 and 2021, respectively. The net fair value losses recorded in the second, third and fourth quarters of 2022 exceeded the net fair value gains on investment properties of $490.6 million recognized during the first quarter of 2022, resulting in a net fair value loss on investment properties of $219.7 million in the year ended December 31, 2022.
Net fair value gains on investment properties in the year ended December 31, 2021 of $1,298.9 million were primarily attributable to various factors including (i) favourable changes in leasing assumptions associated with fair market rent increases for properties located in Canada and the United States and (ii) compression in discount and terminal capitalization rates for properties located in the GTA, across the United States and Europe resulting from the continued market demand for industrial real estate properties.
Fair Value Gains and Losses on Financial Instruments, Net
The net fair value gains on financial instruments were $2.1 million and $0.6 million for the three month periods ended December 31, 2022 and 2021, respectively. The net fair value gains on financial instruments for the year ended December 31, 2022 were $11.4 million and the net fair value losses on financial instruments for the year ended December 31, 2021 were $1.2 million. The net fair value gains on financial instruments for the three months ended December 31, 2022 are related to fair value gains from the 2024 Cross Currency Interest Rate Swap (as
defined herein) and net fair value gains on the foreign exchange collar contracts, partially offset by the fair value loss from the ineffective hedge portion of the combination of the 2025 Term Loan and 2025 Interest Rate Swap. The net fair value gains on financial instruments for the year ended December 31, 2022 are related to fair value gains from the 2024 Cross Currency Interest Rate Swap (as defined herein), partially offset by the net fair value losses on the foreign exchange collar contracts and fair value loss from the ineffective hedge portion of the combination of the 2025 Term Loan and 2025 Interest Rate Swap. The Trust partially employed or did not employ hedge accounting for the derivatives and foreign exchange collars, therefore the change in fair value is recognized in fair value (gains) losses on financial instruments, net, in the combined statements of net (loss) income.
The net fair value gains on financial instruments for the three months ended December 31, 2021 are related to the fair value movements of the 2024 Cross Currency Interest Rate Swap, partially offset by net fair value losses on foreign exchange collar contracts. The net fair value losses on financial instruments for the year ended December 31, 2021 are related the net fair value losses associated with the fair value movements of the 2021 Cross Currency Interest Rate Swap and the fair value losses on the foreign exchange collar contracts, partially offset by the fair value gains on the 2024 Cross Currency Interest Rate Swap. The Trust partially employed or did not employ hedge accounting for the derivatives and foreign exchange collars, therefore the change in fair value is recognized in fair value (gains) losses on financial instruments, net, in the combined statements of net (loss) income.
Loss on Sale of Investment Properties
There were no property dispositions during the three months ended December 31, 2022. The loss on sale of investment properties for the three months ended December 31, 2021 was $0.2 million and is primarily related to broker commissions and legal advisory costs associated with the disposition of the property in Ebergassing, Austria on November 20, 2021.
The loss on sale of investment properties for the year ended December 31, 2022 was $0.7 million and is primarily related to broker commissions and legal advisory costs associated with the disposition of the property in Třeboň, Czech Republic on June 9, 2022 and the property in Mirków, Poland on February 18, 2022. The loss on sale of investment properties for the year ended December 31, 2021 was $0.8 million and is primarily related to broker commissions and legal and advisory costs associated with the disposition of the property in Ebergassing, Austria previously mentioned, the property in Weikersdorf, Austria disposed on June 30, 2021 and the property in Redditch, United Kingdom disposed on January 28, 2021.
Income Tax (Recovery) Expense
Income tax (recovery) expense is comprised of the following:
| | | | | | | | | | | | | | | | | | | | | | | |
| Income Tax (Recovery) Expense |
| | | | | | |
| Three Months Ended December 31, | | Years Ended December 31, |
| 2022 | 2021 | $ change | | 2022 | 2021 | $ change |
| Foreign operations | $ | 2.0 | | $ | 1.4 | | 0.6 | | | $ | 6.7 | | $ | 6.8 | | (0.1) | |
| Related to sale of investment properties | — | | 2.8 | | (2.8) | | | — | | 5.1 | | (5.1) | |
| Other | (0.5) | | (1.3) | 0.8 | | | 0.6 | | (0.3) | 0.9 | |
| Current tax expense | 1.5 | | 2.9 | | (1.4) | | | 7.3 | | 11.6 | | (4.3) | |
| Deferred tax (recovery) expense | (24.4) | | 69.9 | | (94.3) | | | (71.0) | | 229.0 | | (300.0) | |
| Income tax (recovery) expense | $ | (22.9) | | $ | 72.8 | | (95.7) | | | $ | (63.7) | | $ | 240.6 | | (304.3) | |
For the three months ended December 31, 2022, current tax expense decreased compared to the prior year period primarily due to the recognition of tax assets in Austria, offset partially by a provision made pertaining to a past tax year in Austria.
For the year ended December 31, 2022, current tax expense decreased compared to the prior year period primarily due to higher current tax expense relating to the sale of two assets in Austria in 2021, the impact of the stronger Canadian dollar on Euro denominated tax expense as compared to the prior year and the recognition of tax assets in Germany and Austria for taxation years that have gone statute barred during 2022, partially offset by a provision made pertaining to a past tax year in Austria.
The increase in the deferred tax recovery for the three months and year ended December 31, 2022 compared to the deferred tax expense in the prior year periods was primarily due to the fair value losses recognized in jurisdictions in which deferred taxes are recorded as compared to fair value gains recognized in prior year periods.
Net (Loss) Income Attributable to Stapled Unitholders
For the three month period ended December 31, 2022, net loss attributable to stapled unitholders was $126.3 million compared to net income of $341.2 million in the prior year period. The increase in net loss attributable to stapled unitholders was primarily due to a $579.0 million increase in fair value losses on investment properties, partially offset by a $16.1 million increase in net operating income and a $95.7 million increase in income tax recovery. The period-over-period variance is further summarized below:
| | |
| Q4 2022 vs Q4 2021 Change in Net (Loss) Income Attributable to Stapled Unitholders |
For the year ended December 31, 2022, net income attributable to stapled unitholders was $155.8 million compared to $1,310.0 million in the prior year period. The decrease in net income attributable to stapled unitholders was primarily due to a $1,518.6 million increase in fair value losses on investment properties, partially offset by a $47.7 million increase in net operating income and a $304.3 million increase in income tax recovery. The period-over-period variance is further summarized below:
| | |
| Year 2022 vs Year 2021 Change in Net Income Attributable to Stapled Unitholders |
Funds From Operations and Adjusted Funds From Operations
The reconciliation of net (loss) income attributable to stapled unitholders to FFO and AFFO for the three months and years ended December 31, 2022 and 2021, respectively, is presented below:
| | | | | | | | | | | | | | | | | | | | |
| FFO and AFFO Reconciliation |
| | | | |
| | Three Months Ended December 31, | | Years Ended December 31, |
| (in millions, except per unit information) | | 2022 | 2021 | | 2022 | 2021 |
| Net (loss) income attributable to stapled unitholders | | $ | (126.3) | | $ | 341.2 | | | $ | 155.8 | | $ | 1,310.0 | |
| Add (deduct): | | | | | | |
| Fair value losses (gains) on investment properties, net | | 229.9 | | (349.1) | | | 219.7 | | (1,298.9) |
| Fair value (gains) losses on financial instruments, net | | (2.1) | | (0.6) | | | (11.4) | 1.2 |
| Loss on sale of investment properties | | — | | 0.2 | | | 0.7 | | 0.8 | |
| Current income tax expense associated with the sale of investment properties | | — | | 2.8 | | | — | | 5.1 | |
| Deferred tax (recovery) expense | | (24.4) | | 69.9 | | | (71.0) | 229.0 | |
| Fair value remeasurement of the Executive Deferred Stapled Unit Plan | | — | | 2.3 | | | (2.7) | 3.8 | |
Fair value remeasurement of the Directors Deferred Stapled Unit Plan(1) | | 0.1 | | — | | | (1.8) | — | |
| Non-controlling interests relating to the above | | — | | 0.1 | | | — | | 0.3 | |
| FFO | [A] | $ | 77.2 | | $ | 66.8 | | | $ | 289.3 | | $ | 251.3 | |
| Add (deduct): | | | | | | |
| Maintenance or improvement capital expenditures incurred | | (2.7) | | (6.7) | | | (8.6) | | (9.4) | |
| Leasing costs | | (4.5) | | — | | | (9.4) | | (2.5) | |
| Tenant allowances | | (0.2) | | (0.3) | | | (0.6) | | (0.5) | |
| Tenant incentive amortization | | 0.8 | | 1.2 | | | 4.1 | 5.1 | |
| Straight-line rent amortization | | (3.6) | | (1.8) | | | (10.6) | (8.8) | |
| AFFO | [B] | $ | 67.0 | | $ | 59.2 | | | $ | 264.2 | | $ | 235.2 | |
| | | | | | |
| Per unit amounts: | | | | | | |
| Basic FFO per stapled unit | [A]/[C] | $ | 1.21 | | $ | 1.02 | | | $ | 4.44 | | $ | 3.93 | |
| Diluted FFO per stapled unit | [A]/[D] | $ | 1.20 | | $ | 1.02 | | | $ | 4.43 | | $ | 3.93 | |
| | | | | | |
| | | | | | |
| | | | | | |
| Basic and diluted AFFO per stapled unit | [B]/[C] and [B]/[D] | $ | 1.05 | | $ | 0.90 | | | $ | 4.05 | | $ | 3.68 | |
| Basic weighted average number of stapled units | [C] | 63.9 | | 65.7 | | | 65.2 | | 64.0 | |
| Diluted weighted average number of stapled units | [D] | 64.1 | | 65.8 | | | 65.3 | | 64.0 | |
(1) On June 9, 2022, amendments were made to Granite’s Directors Deferred Stapled Unit (“DSU”) Plan (the “DSU Plan”) to allow, at the discretion of the Compensation, Governance and Nominating Committee (the "CGN Committee”) for the DSUs to be settled in cash or stapled units at the time of redemption. Accordingly, from the amendment date of June 9, 2022, fair value remeasurement of the DSU Plan has been included as an adjustment to FFO.
Funds From Operations
FFO for the three month period ended December 31, 2022 was $77.2 million ($1.20 per unit) compared to $66.8 million ($1.02 per unit) in the prior year period. The changes in the FFO components are summarized below:
| | |
| Q4 2022 vs Q4 2021 Change in FFO |
FFO for the year ended December 31, 2022 was $289.3 million ($4.43 per unit) compared to $251.3 million ($3.93 per unit) in the prior year period. The changes in the FFO components are summarized below:
| | |
| Year 2022 vs Year 2021 Change in FFO |
Included in FFO for the year ended December 31, 2021 were $4.0 million of early redemption premium related to the 2021 Debentures and $0.5 million of accelerated amortization of original financing costs related to the refinancing of the Credit Facility. Excluding these refinancing costs, FFO would have been $255.8 million ($4.00 per unit).
AFFO for the three month period ended December 31, 2022 was $67.0 million ($1.05 per unit) compared to $59.2 million ($0.90 per unit) in the prior year period. The $7.8 million increase and $0.15 per unit increase in AFFO components are summarized below:
| | |
| Q4 2022 vs Q4 2021 Change in AFFO |
Additional details pertaining to the components of the change in AFFO are as follows:
•the $10.4 million increase in FFO, as noted previously; and
•a $4.0 million increase in AFFO from lower maintenance or improvement capital expenditures incurred in the current year period relative to the prior year period, partially offset by;
•a $4.5 million decrease in AFFO primarily from an increase in leasing costs, primarily due to an increase in lease renewal activities compared to the prior year period; and
•a $2.2 million decrease in AFFO from an increase in tenant incentive and straight-line rent amortization primarily due to higher free-rent offered in the current year period relative to the prior year period as a result of lease renewals primarily in the United States and Canada, and new leases relating to completed development properties in the United States in the current year.
AFFO for the year ended December 31, 2022 was $264.2 million ($4.05 per unit) compared to $235.2 million ($3.68 per unit) in the prior year period. The $29.0 million increase and $0.37 per unit increase in AFFO components are summarized below:
| | |
| Year 2022 vs Year 2021 Change in AFFO |
Additional details pertaining to the components of the change in AFFO are as follows:
•the $38.0 million increase in FFO, as noted previously; and
•a $0.8 million increase in AFFO from lower maintenance or improvement capital expenditures incurred in the current year period relative to the prior year period, partially offset by;
•a $6.9 million decrease in AFFO from an increase in leasing costs, primarily related to lease renewal activities in the United States and Canada; and
•a $2.8 million decrease in AFFO from an increase in tenant incentive and straight-line rent amortization primarily due to higher free-rent offered in the current year period relative to the prior year as a result of lease renewals primarily in the United States and Canada and new leases relating to completed development properties primarily in the United States.
Excluding the aforementioned early redemption and refinancing costs of $4.5 million recognized in the year ended December 31, 2021, AFFO would have been $239.7 million ($3.75 per unit).
INVESTMENT PROPERTIES
Granite’s investment properties consist of income-producing properties, properties under development and land held for development. Substantially all of the income-producing properties are for industrial use and can be categorized as (i) distribution/e-commerce, (ii) industrial/warehouse, (iii) flex/office or (iv) special purpose properties designed and built with specialized features and leased primarily to Magna.
The attributes of the income-producing properties are versatile and are based on the needs of the tenant such that an industrial property used by a certain tenant for light or heavy manufacturing can be used by another tenant for other industrial uses after some retrofitting if necessary. Accordingly, the investment property portfolio is substantially for industrial use and, as such, Granite determined that its asset class comprises industrial properties for purposes of
financial reporting. The fair value of the industrial properties, as noted below, is based upon the current tenanting, existing use and attributes of such properties.
Properties under development are comprised of:
i.a 89.0 acre greenfield site in Houston, Texas for which construction is underway on three modern industrial buildings totaling 1.4 million square feet, of which approximately 1.2 million square feet is pre-leased, and are expected to be completed in the first quarter of 2023;
ii.a 22.0 acre site in Brantford, Ontario where construction of a 0.4 million square foot, build-to-suit, 40’ clear height, state-of-the-art distribution facility is underway with completion expected in the first quarter of 2024;
iii.a 39.0 acre site in Lebanon, Tennessee, where construction of three modern industrial buildings totaling 0.5 million square feet is expected to be completed in the first quarter of 2023; and
iv.a 13.0 acre site in Bolingbrook, Illinois where the vertical construction of a 0.2 million square foot built-to-suit modern distribution facility is underway and expected to be completed in the second quarter of 2023.
Land held for development is comprised of:
i.the remaining 101.0 acres of land in Houston, Texas held for the future development of up to a 1.3 million square foot multi-phased business park capable of accommodating buildings ranging from 0.3 million to 1.3 million square feet;
ii.12.9 acres of development land in West Jefferson, Ohio;
iii.the remaining 70.0 acre parcel of land in Brantford, Ontario, for the development of a multi-phased business park comprising a total of approximately 1.3 million square feet of modern distribution and logistics space upon completion; and
iv.10.1 acres of land in Brant County, Ontario for the development of a 0.2 million square foot modern distribution facility.
Summary attributes of the investment properties as at December 31, 2022 and December 31, 2021 are as follows:
| | |
| Investment Properties Summary |
| | | | | | | | |
| | |
| As at December 31, | 2022 | 2021 |
| | |
| (in millions, except as noted) | | |
| Investment properties - fair value | $8,839.6 | $7,971.2 |
| Income-producing properties | 8,486.1 | 7,727.4 |
| Properties under development | 272.5 | 162.8 |
| Land held for development | 81.0 | 81.0 |
Overall capitalization rate(1) | 4.87 | % | 4.53 | % |
| | |
| Number of investment properties | 140 | 131 |
| Income-producing properties | 128 | 119 |
| Properties under development | 8 | 9 |
| Land held for development | 4 | 3 |
| | |
| Property metrics | | |
| GLA, square feet | 59.4 | 55.1 |
| Occupancy, by GLA | 99.6 | % | 99.7 | % |
| Weighted average lease term in years, by square footage | 5.9 | 5.8 |
| Total number of tenants | 126 | 123 |
Magna as a percentage of annualized revenue(2) | 26 | % | 29 | % |
| Magna as a percentage of GLA | 20 | % | 22 | % |
(1) Overall capitalization rate pertains only to income-producing properties.
(2) Annualized revenue presented is calculated as the contractual base rent for the month subsequent to the quarterly reporting period multiplied by 12 months. Annualized revenue excludes revenue from properties classified as assets held for sale.
| | | | | | | | |
| | |
| As at December 31, | 2022 | 2021 |
| | |
| (in millions, except as noted) | | |
| Assets held for sale | | |
| Fair value | $41.2 | $64.6 |
| Number of properties | 2 | 3 |
| GLA, square feet | 0.3 | 0.6 |
| Magna as a percentage of GLA | 0 | % | 1 | % |
| Annualized revenue | $1.6 | $4.4 |
(1) Assets held for sale are excluded from investment properties and related property metrics. Accordingly, two such assets that were held for sale as at December 31, 2022 and three such assets that were held for sale as at December 31, 2021 were excluded from investment properties and related property metrics as at December 31, 2022 and December 31, 2021, respectively, throughout this MD&A.
Granite has a high-quality global portfolio of large-scale properties strategically located in Canada, the United States and Europe. The fair value of the investment properties by country as at December 31, 2022 and December 31, 2021 was as follows:
| | |
Fair Value of Investment Properties by Geography(1) |
| | | | | |
| December 31, 2022 | December 31, 2021 |
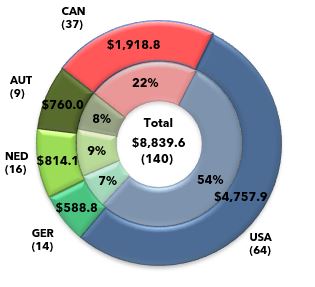
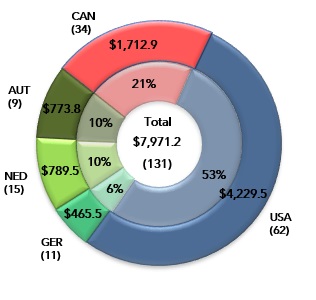
(1) Number of properties denoted in parentheses.
The change in the fair value of investment properties by geography during the year ended December 31, 2022 was as follows:
| | | | | | | | | | | | | | | | | | | | | | | | | | | | | | | | | | |
| Change in Fair Value of Investment Properties by Geography |
| | | | | | | | | | | | |
| January 1, 2022 | Acquisitions | | | Capital and leasing expenditures | Developments and expansion | Transfers (1) | Other | Fair value gains (losses) | Foreign exchange | Classified as assets held for sale | December 31, 2022 |
| Income-Producing Properties | | | | | | | | | | | |
| Canada | $ | 1,648.7 | | $ | 40.5 | | | | $ | 2.9 | | $ | 2.5 | | $ | — | | $ | 2.1 | | $ | 155.4 | | $ | — | | $ | (18.8) | | $ | 1,833.3 | |
| USA | 4,089.7 | | 179.4 | | | | 15.4 | | 39.2 | | 184.4 | | 9.1 | | (308.9) | | 305.3 | | (23.7) | | 4,489.9 | |
| Austria | 773.8 | | — | | | | 0.3 | | — | | — | | (4.2) | | (13.8) | | 3.9 | | — | | 760.0 | |
| Germany | 425.7 | | 148.9 | | | | 0.6 | | 2.2 | | 38.6 | | (0.4) | | (30.0) | | 3.2 | | — | | 588.8 | |
| Netherlands | 789.5 | | 102.3 | | | | 1.1 | | — | | — | | 0.3 | | (87.8) | | 8.7 | | — | | 814.1 | |
| 7,727.4 | | 471.1 | | | | 20.3 | | 43.9 | | 223.0 | | 6.9 | | (285.1) | | 321.1 | | (42.5) | | 8,486.1 | |
| Properties Under Development | | | | | | | | | | | |
| USA | 123.0 | | 14.6 | | | | — | | 222.8 | | (184.4) | | — | | 56.5 | | 17.5 | | — | | 250.0 | |
| Germany | 39.8 | | — | | | | — | | 0.4 | | (38.6) | | — | | — | | (1.6) | | — | | — | |
| Canada | — | | — | | | | — | | 4.9 | | 17.6 | | — | | — | | — | | — | | 22.5 | |
| 162.8 | | 14.6 | | | | — | | 228.1 | | (205.4) | | — | | 56.5 | | 15.9 | | — | | 272.5 | |
| Land Held for Development | | | | | | | | | | | |
| Canada | 64.2 | | 6.6 | | | | — | | 2.9 | | (17.6) | | — | | 6.9 | | — | | — | | 63.0 | |
| USA | 16.8 | | — | | | | — | | — | | — | | — | | — | | 1.2 | | — | | 18.0 | |
| 81.0 | | 6.6 | | | | — | | 2.9 | | (17.6) | | — | | 6.9 | | 1.2 | | — | | 81.0 | |
| Total | $ | 7,971.2 | | $ | 492.3 | | | | $ | 20.3 | | $ | 274.9 | | $ | — | | $ | 6.9 | | $ | (221.7) | | $ | 338.2 | | $ | (42.5) | | $ | 8,839.6 | |
(1) The transfers are related to the reclassifications of a parcel of land held for development in Brantford, Ontario to property under development and three completed properties under development to income-producing properties in Altbach, Germany and Fort Worth, Texas during the second quarter of 2022 and Murfreesboro, Tennessee in the fourth quarter of 2022.
During the year ended December 31, 2022, the fair value of investment properties increased by $868.4 million primarily due to:
•the acquisitions of eight income-producing properties, one property under development and one parcel of development land in Germany, the United States, Canada and Netherlands for $480.7 million, excluding associated transaction costs (see “SIGNIFICANT MATTERS - Property Acquisitions”);
•additions of $274.9 million primarily relating to expansion projects at two properties in Canada, one of which was completed during the second quarter of 2022, and two development properties in the United States and one in Germany, which were subsequently reclassified to income producing property during 2022, and eight properties under development in the United States and Canada (see “SIGNIFICANT MATTERS - Construction, Development and Property Commitments”); and
•foreign exchange gains of $338.2 million primarily resulting from the relative weakening of the Canadian dollar against the US dollar, partially offset by;
•net fair value losses of $221.7 million, which were primarily attributable to the expansion in discount and terminal capitalization rates across Granite’s markets in response to rising interest rates; and
•the classification of two income-producing properties with a current value of $41.2 million as assets held for sale. These properties are classified as assets held for sale on the audited combined balance sheet and excluded from the investment properties categorization (see “SIGNIFICANT MATTERS - Assets Held for Sale”).
Fair values were primarily determined by discounting the expected future cash flows, generally over a term of 10 years, plus a terminal value based on the application of a capitalization rate to estimated year 11 cash flows. Granite measures its investment properties using valuations prepared by management. Granite does not measure its investment properties based on valuations prepared by external appraisers but uses such external appraisals as data points, together with other external market information accumulated by management, in arriving at its own conclusions on values. Management uses valuation assumptions such as discount rates, terminal capitalization rates and market rental rates applied in external appraisals or sourced from valuation experts; however, the Trust also uses its historical renewal experience with tenants, its direct knowledge of the specialized nature of Granite’s portfolio and tenant profile and its knowledge of the actual condition of the properties in making business judgments about lease renewal probabilities, renewal rents and capital expenditures. There has been no change in the valuation methodology used during the year ended December 31, 2022. The key valuation metrics for Granite’s investment properties including the discount and terminal capitalization rates by jurisdiction are summarized in note 4 to the audited combined financial statements for the year ended December 31, 2022. In addition, valuation metrics for Granite’s income-producing properties by asset category and region as at December 31, 2022 and December 31, 2021 were as follows:
| | | | | | | | | | | | | | | | | | | | | | | | | | | | | | | | | | | | | | | | | | | | |
| Valuation Metrics by Asset Category |
| | | | | | | | | | |
| Distribution/ E-Commerce | | Industrial/Warehouse | | Special purpose properties | | Flex/ Office | | Total |
| | | | | | | | | | | | | | |
| As at December 31, | 2022 | 2021 | | 2022 | 2021 | | 2022 | 2021 | | 2022 | 2021 | | 2022 | 2021 |
Overall capitalization rate(1)(2) | 4.60% | 4.11% | | 4.04% | 4.20% | | 7.11% | 6.81% | | 5.50% | 5.00% | | 4.87% | 4.53% |
Terminal capitalization rate(1) | 5.47% | 4.73% | | 5.61% | 4.95% | | 6.56% | 6.37% | | 7.01% | 6.23% | | 5.66% | 5.03% |
Discount rate(1) | 6.21% | 5.30% | | 6.73% | 5.70% | | 7.75% | 7.29% | | 8.01% | 6.83% | | 6.50% | 5.67% |
| | | | | | | | | | | | | | | | | | | | | | | | | | | | | | | | | | | |
| Valuation Metrics by Region |
| | | | | | | | | | | |
| As at December 31, 2022 | Canada | | USA | | Austria | | Germany | | Nether-lands | | Total |
| Income-producing property fair value | $ | 1,833.3 | | | $ | 4,489.9 | | | $ | 760.0 | | | $ | 588.8 | | | $ | 814.1 | | | $ | 8,486.1 | |
Overall capitalization rate (1)(2) | 3.51% | | 4.84% | | 8.15% | | 5.63% | | 4.53% | | 4.87% |
| | | | | | | | | | | |
| As at December 31, 2021 | Canada | | USA | | Austria | | Germany | | Nether-lands | | Total |
| Income-producing property fair value | $ | 1,648.7 | | | $ | 4,089.7 | | | $ | 773.8 | | | $ | 425.7 | | | $ | 789.5 | | | $ | 7,727.4 | |
Overall capitalization rate (1)(2) | 3.51% | | 4.30% | | 7.98% | | 5.60% | | 3.87% | | 4.53% |
(1) Weighted based on income-producing property fair value.
(2) Overall capitalization rate is calculated as stabilized net operating income (property revenue less property expenses) divided by the fair value of the property.
A sensitivity analysis of the fair value of income-producing properties to changes in the overall capitalization rate, terminal capitalization rate and discount rate at December 31, 2022 is presented below:
| | | | | | | | | | | |
| Sensitivity Analysis of Fair Value of Income-Producing Properties |
| | | |
| Rate sensitivity | Overall capitalization rate | Terminal capitalization rate | Discount rate |
|
| +50 bps | 7,629.1 | | 8,043.5 | | 8,166.7 | |
| +25 bps | 8,032.4 | | 8,255.2 | | 8,324.7 | |
| Base rate | $8,486.1 | | $8,486.1 | | $8,486.1 | |
| -25 bps | 9,002.0 | | 8,740.6 | | 8,652.4 | |
| -50 bps | 9,597.6 | | 9,020.9 | | 8,822.3 | |
Capital Expenditures and Leasing Costs
Capital expenditures relate to sustaining the existing earnings capacity of the property portfolio. Capital expenditures can include expansion or development expenditures and maintenance or improvement expenditures. Expansion or development capital expenditures are discretionary in nature and are incurred to generate new revenue streams and/or increase the productivity of a property. Maintenance or improvement capital expenditures relate to sustaining the existing earnings capacity of a property. Leasing costs include direct leasing costs and lease incentives. Direct leasing costs include broker commissions incurred in negotiating and arranging tenant leases. Lease incentives include the cost of leasehold improvements to tenant spaces and/or cash allowances provided to tenants for leasehold improvement costs.
Included in total capital expenditure and leasing cost additions to investment properties are items which relate to the completion or lease up of recently acquired or developed properties. Such items are excluded from Granite’s calculation of AFFO. A reconciliation of total capital and leasing cost additions to investment properties to those included in AFFO for the three months and years ended December 31, 2022 and 2021 is below:
| | | | | | | | | | | | | | | | | |
| Maintenance Capital Expenditures and Leasing Costs |
| | | | |
| Three Months Ended December 31, | | Years Ended December 31, |
| 2022 | 2021 | | 2022 | 2021 |
| Additions to investment properties: | | | | | |
| Leasing costs | $ | 4.5 | | $ | — | | | $ | 10.0 | | $ | 5.8 | |
Tenant improvements (1) | 0.2 | | 2.9 | | | 0.6 | | 3.4 | |
| Maintenance capital expenditures | 2.8 | | 7.4 | | | 9.7 | | 10.8 | |
| Other capital expenditures | 16.3 | | 2.5 | | | 43.9 | | 17.1 | |
| $ | 23.8 | | $ | 12.8 | | | $ | 64.2 | | $ | 37.1 | |
| Less: | | | | | |
| Leasing costs and tenant improvements related to acquisition activities | — | | — | | | (0.4) | | (0.4) | |
| Leasing costs and tenant improvements related to development activities | — | | (2.6) | | | (0.2) | | (5.8) | |
| Capital expenditures related to expansions and developments | (16.3) | | (2.7) | | | (43.9) | | (9.4) | |
| Capital expenditures related to property acquisitions | (0.1) | | (0.5) | | | (1.1) | | (9.1) | |
| Capital expenditures and leasing costs included in AFFO | $ | 7.4 | | $ | 7.0 | | | $ | 18.6 | | $ | 12.4 | |
(1) Tenant improvements include tenant allowances and landlord’s work.
The capital expenditures and leasing costs incurred by quarter for the trailing eight quarters were as follows:
| | | | | | | | | | | | | | | | | | | | | | | | | | | | | | | |
| Capital Expenditures and Leasing Costs - Trailing Eight Quarters | | |
| | |
| | Q4 '22 | Q3 '22 | Q2 '22 | Q1 '22 | Q4 '21 | Q3 '21 | Q2 '21 | Q1 '21 | | |
| Total capital expenditures incurred | | $19.1 | $21.9 | $9.2 | $3.4 | $9.9 | $14.3 | $3.2 | $0.5 | | |
| Total leasing costs and tenant improvements incurred | | 4.7 | | 2.4 | | 1.5 | | 2.0 | | 2.9 | | 5.8 | | 0.3 | | 0.2 | | | |
| Total incurred | [A] | $23.8 | $24.3 | $10.7 | $5.4 | $12.8 | $20.1 | $3.5 | $0.7 | | |
| Less: Capital expenditures, leasing costs and tenant improvements related to acquisitions and developments | | (16.4) | | (17.7) | | (9.2) | | (2.3) | | (5.8) | | (17.0) | | (1.8) | | (0.1) | | | |
| | | | | | | | | | | |
| Capital expenditures and leasing costs included in AFFO | [B] | $7.4 | $6.6 | $1.5 | $3.1 | $7.0 | $3.1 | $1.7 | $0.6 | | |
| | | | | | | | | | | |
| GLA, square feet | [C] | 59.4 | 58.8 | 57.0 | 55.9 | 55.1 | 53.3 | 51.3 | 50.4 | | | |
| $ total incurred per square foot | [A]/[C] | $0.40 | $0.41 | $0.19 | $0.10 | $0.23 | $0.38 | $0.07 | $0.01 | | |
| $ capital expenditures and leasing costs included in AFFO per square foot | [B]/[C] | $0.12 | $0.11 | $0.03 | $0.06 | $0.13 | $0.06 | $0.03 | $0.01 | | |
Development and Expansion Projects
The attributes of Granite’s properties under development and expansion projects as at December 31, 2022 were as follows:
| | | | | | | | | | | | | | | | | | | | | | | | | | | | | |
| Development and Expansion Projects |
| | | |
| Land acreage
(in acres) | Expected sq ft of construction
(in millions) | Target/actual start date of construction | Target completion date | Actual construction costs as at December 31, 2022 | Expected total construction cost(1) | Cost of Land | Total Expected Cost | Year-One Stabilized Yield (2) |
| As at December 31, 2022 | | | | | | | | |
| Properties under development | | | | | | | |
| Houston, TX (Phase I and II) | 89.3 | | 1.4 | | Q4 2019 | Q1 2023 | $132.3 | $146.4 | $17.6 | $164.0 | 6.4 | % |
| Highway 109, Lebanon, TN | 38.8 | | 0.5 | | Q3 2021 | Q1 2023 | 55.4 | 71.4 | 2.9 | 74.3 | 6.3 | % |
| 4 Bowery Rd., Brantford, ON | 22.3 | | 0.4 | | Q2 2022 | Q1 2024 | 5.7 | 69.1 | 15.4 | 84.5 | 6.8 | % |
| 905 Belle Ln., Bolingbrook, IL | 12.9 | | 0.2 | | Q2 2022 | Q2 2023 | 24.6 | 37.5 | 15.3 | 52.8 | 3.9 | % |
| Expansion projects | | | | | | | | | |
| 555 Beck Cres., Ajax, ON | 7.6 | | 0.1 | | Q1 2023 | Q1 2024 | 0.7 | 8.5 | — | 8.5 | 7.6 | % |
| 5400 E 500 S, Whitestown, IN | 59.3 | | 0.3 | | Q1 2022 | Q1 2023 | 33.1 | 42.4 | — | 42.4 | 5.5 | % |
| | | | | | | | | |
| 230.2 | | 2.9 | | | | $251.8 | $375.3 | $51.2 | $426.5 | 6.1 | % |
| | | | | | | | | |
| | | | | | | |
| | | | | | | | | |
| | | | | | | | | |
(1) Construction cost excludes cost of land.
(2) Yield based on total cost including land.
During the fourth quarter, vertical construction continued at Granite’s site in Houston, Texas. Phase one consists of two buildings totaling 669,000 square feet, both of which reached substantial completion in March 2023. Granite has signed leases with third-party logistics operators for approximately 521,000 square feet of its phase one development, which will commence between March and June 2023. Phase two is a pre-leased 688,000 square foot, 40’ clear height, modern distribution building which achieved substantial completion on January 30, 2023.
At Granite’s site in Lebanon, Tennessee, during the fourth quarter, construction and leasing activity continued. These three modern distribution facilities totaling approximately 509,000 square feet, with 32’ clear heights, are expected to be completed in the first quarter of 2023.
During the fourth quarter, site work continued on its 410,000 square foot, 40’ clear height, state-of-the-art modern distribution facility in Brantford, Ontario. The build-to-suit facility being constructed for a global chocolate producer is expected to be completed in the first quarter of 2024.
In Bolingbrook, Illinois, during the fourth quarter, construction continued at Granite’s 220,000 square foot build-to-suit modern distribution facility. The building is pre-leased to a globally-recognized furniture provider and is expected to be completed in the second quarter of 2023.
Granite continues to advance site planning for the speculative expansion of 555 Beck Crescent in Ajax, ON. Construction of the approximately 50,000 square foot, 32’ clear height expansion is expected to commence in the first quarter of 2023 with completion anticipated by the first quarter of 2024.
During the fourth quarter, construction continued on the approximate 329,000 square foot, value-enhancing expansion of Granite’s approximate 633,000 square foot modern distribution facility in Whitestown, Indiana. On January 19, 2023, substantial completion of the building expansion was achieved and the lease for the approximate 1.0 million square foot facility was extended for a ten year term.
Leasing Profile
Magna, Granite’s Largest Tenant
At December 31, 2022, Magna International Inc. or one of its operating subsidiaries was the tenant at 27 (December 31, 2021 - 29) of Granite’s income-producing properties and comprised 26% (December 31, 2021 - 29%) of Granite’s annualized revenue and 20% (December 31, 2021 - 22%) of Granite’s GLA.
According to its public disclosures, Magna International Inc. has a credit rating of A3 with a stable outlook by Moody’s Investor Service, Inc. (“Moody’s”), A(low) credit rating with a stable outlook confirmed by DBRS and A- credit rating with a stable outlook by Standard & Poor’s. Magna is a global mobility technology company with complete vehicle engineering and contract manufacturing expertise. Magna’s product capabilities include body, chassis, exteriors, seating, powertrain, active driver assistance, electronics, mechatronics, mirrors, lighting and roof systems.
Granite’s relationship with Magna is an arm’s length landlord and tenant relationship governed by the terms of Granite’s leases. Granite’s properties are generally leased to operating subsidiaries of Magna International Inc. and are not guaranteed by the parent company; however, Magna International Inc. is the tenant under certain of Granite’s leases. The terms of the lease arrangements with Magna generally provide for the following:
•the obligation of Magna to pay for costs of occupancy, including operating costs, property taxes and maintenance and repair costs;
•rent escalations based on either fixed-rate steps or inflation;
•renewal options tied to market rental rates or inflation;
•environmental indemnities from the tenant; and
•a right of first refusal in favour of Magna on the sale of a property.
Renewal terms, rates and conditions are typically set out in Granite’s leases with Magna and form the basis for tenancies that continue beyond the expiries of the initial lease terms.
Granite expects Magna to continuously seek to optimize its global manufacturing footprint and consequently, Magna may or may not renew leases for facilities currently under lease at their expiries.
Other Tenants
In addition to Magna, at December 31, 2022, Granite had 125 other tenants from various industries that in aggregate comprised 74% of the Trust’s annualized revenue. Each of these tenants accounted for less than 5% of the Trust’s annualized revenue as at December 31, 2022.
Granite’s top 10 tenants by annualized revenue at December 31, 2022 are summarized in the table below:
| | | | | | | | | | | | | | |
| Top 10 Tenants Summary |
|
| Tenant | Annualized Revenue % | GLA % | WALT (years) | Credit Rating(1)(2) |
| Magna | 26 | % | 20 | % | 3.7 | | A- |
| Amazon | 4 | % | 4 | % | 16.2 | | AA |
| Mars Petcare US | 3 | % | 4 | % | 7.6 | | NR |
| True Value Company | 2 | % | 2 | % | 18.2 | | NR |
| ADESA | 2 | % | — | % | 6.6 | | CCC+ |
| Ceva Logistics US Inc. | 2 | % | 2 | % | 2.0 | | BB+ |
| Restoration Hardware | 2 | % | 2 | % | 5.3 | | Ba3 |
| Light Mobility Solutions GmbH | 2 | % | 1 | % | 0.9 | | NR |
| Samsung Electronics America | 2 | % | 1 | % | 3.8 | | AA- |
| Spreetail FTP | 2 | % | 2 | % | 3.8 | | NR |
| Top 10 Tenants | 47 | % | 38 | % | 5.9 | | |
(1) Credit rating is quoted on the Standard & Poor’s rating scale or equivalent where publicly available. NR refers to Not Rated.
(2) The credit rating indicated may, in some instances, apply to an affiliated company of Granite’s tenant which may not be the guarantor of the lease.
Lease Expiration
As at December 31, 2022, Granite’s portfolio had a weighted average lease term by square footage of 5.9 years (December 31, 2021 - 5.8 years) with lease expiries by GLA (in thousands of square feet) and any lease renewals committed adjusted accordingly, lease count and annualized revenue (calculated as the contractual base rent for the month subsequent to the quarterly reporting period multiplied by 12 months, in millions) as set out in the table below:
| | | | | | | | | | | | | | | | | | | | | | | | | | | | | | | | | | | | | | | | | | | | | | | | | | | | | | | | | | | | | | | | | | | | | | | | | | | | | |
| | | | Vacancies | | 2023 | | 2024 | | 2025 | | 2026 | | 2027 | | 2028 | | 2029 and Beyond |
| Country | Total GLA | Total Lease Count | Total Annualized Revenue $ | Sq Ft | | Sq Ft | Annualized Revenue $ | | Sq Ft | Annualized Revenue $ | | Sq Ft | Annualized Revenue $ | | Sq Ft | Annualized Revenue $ | | Sq Ft | Annualized Revenue $ | | Sq Ft | Annualized Revenue $ | | Sq Ft | Annualized Revenue $ |
| Canada | 6,544 | | 33 | | 62.5 | | 72 | | | 380 | | 2.5 | | | 569 | | 5.5 | | | 1,450 | | 11.3 | | | 573 | | 5.9 | | | 529 | | 6.4 | | | 79 | 1.2 | | | 2,892 | | 29.7 | |
Canada-committed (1) | — | | — | | — | | — | | | (289) | | (1.8) | | | — | | — | | | — | | — | | | — | | — | | | — | | — | | | 289 | 1.8 | | | — | | — | |
| Canada - net | 6,544 | | 33 | | 62.5 | | 72 | | | 91 | | 0.7 | | | 569 | | 5.5 | | | 1,450 | | 11.3 | | | 573 | | 5.9 | | | 529 | | 6.4 | | | 368 | 3.0 | | | 2,892 | | 29.7 | |
| United States | 35,400 | | 77 | | 210.1 | | 90 | | | 6,442 | | 33.0 | | | 3,475 | | 20.2 | | | 1,895 | | 11.1 | | | 3,611 | | 25.2 | | | 1,708 | | 8.1 | | | 3,911 | 19.4 | | | 14,268 | | 93.1 | |
United States-committed (1) | — | | — | | — | | — | | | (4,613) | | (22.9) | | | — | | — | | | 945 | | 4.2 | | | 76 | | 0.5 | | | 86 | | 0.6 | | | 2,232 | 11.1 | | | 1,274 | | 6.5 | |
| United States - net | 35,400 | | 77 | | 210.1 | | 90 | | | 1,829 | | 10.1 | | | 3,475 | | 20.2 | | | 2,840 | | 15.3 | | | 3,687 | | 25.7 | | | 1,794 | | 8.7 | | | 6,143 | 30.5 | | | 15,542 | | 99.6 | |
| Austria | 7,472 | | 9 | | 60.7 | | — | | | 125 | | 1.3 | | | 5,349 | | 37.1 | | | — | | — | | | 389 | | 3.0 | | | 802 | | 10.3 | | | 807 | 9.0 | | | — | | — | |
Austria-committed (1) | — | | — | | — | | — | | | — | | — | | | — | | — | | | — | | — | | | — | | — | | | — | | — | | | — | — | | | — | | — | |
| Austria-net | 7,472 | | 9 | | 60.7 | | — | | | 125 | | 1.3 | | | 5,349 | | 37.1 | | | — | | — | | | 389 | | 3.0 | | | 802 | | 10.3 | | | 807 | 9.0 | | | — | | — | |
| Germany | 4,640 | | 15 | | 34.7 | | — | | | 2,308 | | 16.7 | | | 308 | | 2.3 | | | 195 | | 1.7 | | | 303 | | 1.8 | | | 290 | | 2.1 | | | 339 | 2.5 | | | 897 | | 7.6 | |
Germany-committed (1) | — | | — | | — | | — | | | (1,390) | | (9.3) | | | — | | — | | | — | | — | | | 717 | | 4.3 | | | — | | — | | | 335 | 2.5 | | | 338 | | 2.5 | |
| Germany-net | 4,640 | | 15 | | 34.7 | | — | | | 918 | | 7.4 | | | 308 | | 2.3 | | | 195 | | 1.7 | | | 1,020 | | 6.1 | | | 290 | | 2.1 | | | 674 | 5.0 | | | 1,235 | | 10.1 | |
| Netherlands | 5,367 | | 32 | | 39.6 | | 48 | | | 411 | | 3.9 | | | 52 | | 0.7 | | | 629 | | 5.1 | | | 354 | | 1.7 | | | 1,125 | | 7.6 | | | — | — | | | 2,748 | | 20.6 | |
Netherlands - committed (1) | — | | — | | — | | — | | | (314) | | (2.8) | | | — | | — | | | — | | — | | | — | | — | | | — | | — | | | 314 | 2.8 | | | — | | — | |
| Netherlands - net | 5,367 | | 32 | | 39.6 | | 48 | | | 97 | | 1.1 | | | 52 | | 0.7 | | | 629 | | 5.1 | | | 354 | | 1.7 | | | 1,125 | | 7.6 | | | 314 | 2.8 | | | 2,748 | | 20.6 | |
| Total | 59,423 | | 166 | | 407.6 | | 210 | | | 9,666 | | 57.4 | | | 9,753 | | 65.8 | | | 4,169 | | 29.2 | | | 5,230 | | 37.6 | | | 4,454 | | 34.5 | | | 5,136 | | 32.1 | | | 20,805 | | 151.0 | |
Total-committed (1) | — | | — | | — | | — | | | (6,606) | | (36.8) | | | — | | — | | | 945 | | 4.2 | | | 793 | | 4.8 | | | 86 | | 0.6 | | | 3,170 | | 18.2 | | | 1,612 | | 9.0 | |
| As at December 31, 2022 | 59,423 | | 166 | | 407.6 | | 210 | | | 3,060 | | 20.6 | | | 9,753 | | 65.8 | | | 5,114 | | 33.4 | | | 6,023 | | 42.4 | | | 4,540 | | 35.1 | | | 8,306 | | 50.3 | | | 22,417 | | 160.0 | |
| % of portfolio as at December 31, 2022: | | | | | | | | | | | | | | | | | | | | | |
| * by sq ft (in %) | 100.0 | | | | 0.4 | | | 5.1 | | | | 16.4 | | | | 8.6 | | | | 10.1 | | | | 7.6 | | | | 14.0 | | | | 37.8 | | |
| * by Annualized Revenue (in %) | | | 100.0 | | | | | 5.1 | | | | 16.1 | | | | 8.2 | | | | 10.4 | | | | 8.6 | | | | 12.3 | | | | 39.3 | |
(1) Committed vacancies represent leases signed during the current period but not occupied until after period end.
Occupancy Roll Forward
The tables below provide a summary of occupancy changes during the three months and year ended December 31, 2022.
| | | | | | | | | | | | | | | | | | | | |
| Occupancy Roll Forward for Q4 2022 |
|
| Three Months Ended December 31, 2022 |
| (in thousands, sq ft, except as noted) | Canada | USA | Austria | Germany | Netherlands | Total |
| Total portfolio size, Oct 1, 2022 | 6,543 | 34,758 | 7,472 | 4,640 | 5,367 | 58,780 |
| Vacancy, Oct 1, 2022 | — | (283) | — | (186) | (33) | (502) |
| Occupancy, Oct 1, 2022 | 6,543 | 34,475 | 7,472 | 4,454 | 5,334 | 58,278 |
| Occupancy %, Oct 1, 2022 | 100.0 | % | 99.2 | % | 100.0 | % | 96.0 | % | 99.4 | % | 99.1 | % |
| | | | | | |
| | | | | | |
| Completed developments | — | 844 | — | — | — | 844 |
| | | | | | |
| | | | | | |
| Dispositions and assets held for sale | — | (202) | — | — | — | (202) |
| Expiries | (418) | (1,424) | (802) | (7) | (38) | (2,689) |
| Surrenders and early terminations | — | — | — | — | (14) | (14) |
| Renewals | 346 | 1,424 | 802 | 7 | 37 | 2,616 |
| New Leases | — | 193 | — | 186 | — | 379 |
| Occupancy, December 31, 2022 | 6,471 | 35,310 | 7,472 | 4,640 | 5,319 | 59,212 |
| Total portfolio size, December 31, 2022 | 6,544 | 35,400 | 7,472 | 4,640 | 5,367 | 59,423 |
| Occupancy %, December 31, 2022 | 98.9 | % | 99.7 | % | 100.0 | % | 100.0 | % | 99.1 | % | 99.6 | % |
| | | | | | |
| | | | | | |
| | | | | | |
| | | | | | |
|
| | | | | | |
| | | | | | | | | | | | | | | | | | | | |
| Occupancy Roll Forward for Year 2022 |
|
| Year Ended December 31, 2022 |
| (in thousands, sq ft, except as noted) | Canada | USA | Austria | Germany | Netherlands | Total |
| Total portfolio size, Jan 1, 2022 | 6,429 | 32,798 | 7,472 | 3,511 | 4,871 | 55,081 |
| Vacancy, Jan 1, 2022 | — | (90) | — | — | (53) | (143) |
| Occupancy, Jan 1, 2022 | 6,429 | 32,708 | 7,472 | 3,511 | 4,818 | 54,938 |
| Occupancy %, Jan 1, 2022 | 100.0 | % | 99.7 | % | 100.0 | % | 100.0 | % | 98.9 | % | 99.7 | % |
| Acquired occupancy, net | 123 | 1,355 | — | 836 | 496 | 2,810 |
| | | | | | |
| Completed developments | — | 1,449 | — | 293 | — | 1,742 |
| Completed expansions | 62 | — | — | — | — | 62 |
| Development vacancy | — | (605) | — | (186) | — | (791) |
| Dispositions and assets held for sale | (71) | (202) | — | — | — | (273) |
| Expiries | (418) | (4,393) | (802) | (290) | (94) | (5,997) |
| Surrenders and early terminations | — | (86) | — | — | (14) | (100) |
| Renewals | 346 | 4,031 | 802 | 290 | 93 | 5,562 |
| New Leases | — | 1,053 | — | 186 | 20 | 1,259 |
| Occupancy, December 31, 2022 | 6,471 | 35,310 | 7,472 | 4,640 | 5,319 | 59,212 |
| Total portfolio size, December 31, 2022 | 6,544 | 35,400 | 7,472 | 4,640 | 5,367 | 59,423 |
| Occupancy %, December 31, 2022 | 98.9 | % | 99.7 | % | 100.0 | % | 100.0 | % | 99.1 | % | 99.6 | % |
New and Renewal Lease Spreads
The following table summarizes rental rate spreads achieved on new and renewal leasing during the three months and year ended December 31, 2022.
| | | | | | | | | | | | | | | | | |
| New and Renewal Lease Spreads |
| | | | | |
| Three Months Ended December 31, 2022 | | Year Ended December 31, 2022 |
| Sq Ft (in thousands) | Rental Rate Spread(1) | | Sq Ft (in thousands) | Rental Rate Spread(1) |
| Canada | 345 | | 78 | % | | 345 | | 78 | % |
| United States | 1,617 | | 24 | % | | 4,480 | | 20 | % |
| Austria | 802 | | 1 | % | | 802 | | 1 | % |
| Germany | — | | — | % | | 290 | | — | % |
| Netherlands | 22 | | 9 | % | | 93 | | 7 | % |
| Total | 2,786 | | 24 | % | | 6,010 | | 19 | % |
(1) Rental rate spread (%) is calculated as the difference in renewal rent over expiring rent.
The Canadian leasing activity for the three months and year ended December 31, 2022 relates to three renewals of existing leases. The leasing activity in the United States for the three months ended December 31, 2022 represents two new leases and four lease renewals. For the new leasing completed in the United States, Granite was able to achieve leasing spreads in excess of 95%. The leasing activity in the United States for the year ended December 31, 2022 represents three new leases and nine renewals. On the new leases in the United States, Granite was able to achieve leasing spreads between 43% and 97%, reflecting the continued strong demand for industrial space.
In-Place Rental Rates
The following table summarizes the weighted average in-place rent by region:
| | | | | | | | | | | | | | |
| Weighted Average In-Place Rent |
| Weighted Average In-Place Rent (Per Sq Ft)(1)(2) | |
| December 31, 2022 | September 30, 2022 | December 31, 2021 | WALT (years)(3) |
| Canada | $ | 9.56 | | $ | 9.52 | | $ | 9.17 | | 6.5 | |
| United States | $ | 4.49 | | $ | 4.39 | | $ | 4.45 | | 6.6 | |
| Austria | € | 5.61 | | € | 5.61 | | € | 5.57 | | 2.1 | |
| Germany | € | 5.17 | | € | 4.78 | | € | 4.74 | | 4.6 | |
| Netherlands | € | 5.10 | | € | 5.01 | | € | 4.66 | | 6.3 | |
(1) Amounts shown in local currency.
(2) Weighted average in-place rent is calculated as the weighted average contractual base rent for the month subsequent to the quarterly reporting period multiplied by 12 months, divided by the total gross leaseable area.
(3) WALT as at December 31, 2022.
As at December 31, 2022, the weighted average in-place rent rates increased in all regions when compared with the rates noted in September 30, 2022 and December 31, 2021. The increases are driven by lease renewals, fixed contractual and consumer price index rent escalations, capturing strong positive rental rate spreads in all regions.
LIQUIDITY AND CAPITAL RESOURCES
Liquidity
Granite has various sources of available liquidity including cash, cash equivalents and the unused portion of its Credit Facility that aggregated to $1,131.6 million as at December 31, 2022 compared to $1,400.5 million at December 31, 2021, as summarized below:
| | | | | | | | |
| Sources of Available Liquidity |
| | |
| As at December 31, 2022 and December 31, 2021 | 2022 | 2021 |
| | |
| Cash and cash equivalents | $ | 135.1 | | $ | 402.5 | |
| Unused portion of Credit Facility | 996.5 | | 998.0 | |
Available liquidity (1) | $ | 1,131.6 | | $ | 1,400.5 | |
| Additional sources of liquidity: | | |
Assets held for sale(2) | $ | 41.2 | | $ | 64.6 | |
| | |
Unencumbered assets(3) | $ | 8,754.6 | | $ | 7,940.2 | |
(1) Represents a non-IFRS performance measure. For definitions of Granite’s non-IFRS performance measures, refer to the section “NON-IFRS PERFORMANCE MEASURES”.
(2) Two income-producing properties located in Canada and the United States were classified as assets held for sale on the audited combined financial statements at December 31, 2022. Two income-producing properties and one parcel of land held for development located in Europe were classified as assets held for sale on the audited combined financial statements at December 31, 2021.
(3) Unencumbered assets represent the carrying value of investment properties (excluding any assets held for sale) that are not encumbered by secured debt. Granite can seek to obtain secured financing against its unencumbered assets subject to certain restrictions and financial covenant limitations in its Credit Facility, term loan agreements and trust indentures.
The decrease in liquidity from December 31, 2021 to December 31, 2022 is primarily due to the acquisitions of eight income-producing properties, one property under development and a parcel of development land in Germany, the United States, Canada and Netherlands for $492.3 million, additions to investment properties primarily in the United States, Canada and Germany totaling $274.9 million and repurchases of stapled units under the NCIB of $155.5 million, partially offset by the net proceeds of $63.9 million received from the dispositions of two income-producing properties and a piece of land held for development located in Poland and the Czech Republic, net proceeds of $13.1 million received from the issuance of stapled units under the ATM Program (as defined herein) and net proceeds of $527.4 million received from the full drawdown of the 2025 Term Loan completed in September 2022. Granite intends to use its available liquidity to fund completed and potential acquisitions of properties, to finance or refinance expenditures associated with Eligible Green Projects (as described in the Granite Green Bond Framework, which is available on Granite’s website), for commitments under existing development projects and for general trust purposes.
Management believes that the Trust’s cash resources, cash flow from operations and available third-party borrowings will be sufficient to finance its operations and capital expenditures program over the next year as well as to pay distributions. Granite expects to fund its ongoing operations and future growth through the use of (i) existing cash and cash equivalents, (ii) cash flows from operating activities, (iii) cash flows from asset sales, (iv) financing available from the Credit Facility, (v) the issuance of unsecured debentures or equity, subject to market conditions and/or, if necessary, (vi) financing that may be obtained on its unencumbered assets.
Cash Flow Components
Components of the Trust’s cash flows were as follows:
| | | | | | | | | | | | | | | | | | | | | | | |
| Cash Flow Components Summary |
| | | | | | | |
| Three Months Ended December 31, | | Years Ended December 31, |
| 2022 | 2021 | $ change | | 2022 | 2021 | $ change |
| | | | | | | |
| Cash and cash equivalents, beginning of period | $ | 274.3 | | $ | 779.0 | | (504.7) | | | $ | 402.5 | | $ | 831.3 | | (428.8) | |
| Cash provided by operating activities | 65.5 | | 53.7 | | 11.8 | | | 277.5 | | 262.2 | | 15.3 | |
| Cash used in investing activities | (90.9) | | (379.5) | | 288.6 | | | (766.6) | | (1,025.4) | | 258.8 | |
| Cash (used in) provided by financing activities | (113.2) | | (49.2) | | (64.0) | | | 214.6 | | 333.5 | | (118.9) | |
| Effect of exchange rate changes on cash and cash equivalents | (0.6) | | (1.5) | | 0.9 | | | 7.1 | | 0.9 | | 6.2 | |
| Cash and cash equivalents, end of period | $ | 135.1 | | $ | 402.5 | | (267.4) | | | $ | 135.1 | | $ | 402.5 | | (267.4) | |
Operating Activities
During the three month period ended December 31, 2022, operating activities generated cash of $65.5 million compared to $53.7 million in the prior year period. The increase of $11.8 million was due to various factors as noted in the “RESULTS OF OPERATIONS” section including, among others, the following:
•an increase in net operating income - cash basis of $13.9 million;
•an increase of $3.0 million from cash used in working capital changes primarily due to timing of payments and receipts;
•a decrease of $1.5 million in income taxes paid;
•a decrease of $0.1 million in general and administrative expenses, excluding the impact of unit-based compensation; and
•an increase of $0.2 million in interest income primarily due to higher interest rates on invested cash, partially offset by;
•an increase of $5.9 million in interest paid as a result of higher debt balances and an increase in the weighted average cost of debt in the current year period; and
•a decrease of $1.3 million in foreign exchange gains.
During the year ended December 31, 2022, operating activities generated cash of $277.5 million compared to $262.2 million in the prior year period. The increase of $15.3 million was due to various factors as noted in the “RESULTS OF OPERATIONS” section including, among others, the following:
•an increase in net operating income - cash basis of $44.9 million; and
•a decrease of $1.9 million from cash used in working capital changes primarily due to timing of payments and receipts, partially offset by;
•an increase of $12.0 million in interest paid as a result of higher debt balances and an increase in the weighted average cost of debt in the current year;
•an increase of $11.1 million in income taxes paid as a result of payments made relating to past taxation years;
•a decrease of $3.9 million in foreign exchange gains;
•an increase of $3.9 million in general and administrative expenses, excluding the impact of unit-based compensation; and
•a decrease of $1.5 million in interest income due to the decrease in invested cash balances on hand.
Investing Activities
Investing activities for the three month period ended December 31, 2022 used cash of $90.9 million and primarily related to the following:
•additions to properties under development paid of $47.2 million, primarily attributable to Granite’s ongoing development projects in the United States and Canada;
•loan advances made of $12.9 million to the developer of two industrial properties being constructed in Indiana;
•additions to income-producing properties paid of $20.5 million primarily attributable to ongoing maintenance and expansion capital in Canada and the United States;
•the final settlements relating to previously completed acquisitions in 2022 of $6.0 million; and
•leasing commissions paid of $3.2 million largely relating to leasing activity for properties in the United States.
Investing activities for the three month period ended December 31, 2021 used cash of $379.5 million and primarily related to the following:
•the acquisitions of six income-producing properties in Canada, the United States and Netherlands paid of $325.8 million;
•additions to income-producing properties paid of $8.8 million, primarily attributable to ongoing maintenance and expansion capital in Canada and the United States;
•additions to properties under development paid of $43.3 million, primarily attributable to Granite’s ongoing development projects in the United States and Germany;
•acquisition deposits paid of $8.6 million, consisting of advance payments for acquisitions under contract in the United States and Germany; and
•loan advances made of $5.3 million to the developer of two industrial properties being constructed in Indiana, partially offset by;
•net proceeds of $12.2 million received from the disposition of an income-producing property in Austria.
Investing activities for the year ended December 31, 2022 used cash of $766.6 million and primarily related to the following:
•the acquisitions of eight income-producing properties, one property under development and a parcel of development land in Germany, the United States, Canada and Netherlands and the settlement of other acquisition related liabilities for $492.7 million (see “SIGNIFICANT MATTERS - Property Acquisitions”);
•additions to properties under development paid of $212.2 million, primarily attributable to Granite’s development projects in the United States, Canada and Germany;
•additions to income-producing properties paid of $54.9 million primarily attributable to ongoing maintenance and expansion capital in Canada and the United States; and
•loan advances made of $55.8 million to the developer of two industrial properties being constructed in Indiana, partially offset by;
•net proceeds of $63.9 million received from the dispositions of two income-producing properties and a piece of land held for development in Poland and the Czech Republic (see “SIGNIFICANT MATTERS - Dispositions”).
Investing activities for the year ended December 31, 2021 used cash of $1,025.4 million and primarily related to the following:
•the acquisitions of sixteen income-producing properties, four properties under development and a parcel of development land in Canada, the United States and Netherlands paid of $925.9 million;
•additions to income-producing properties paid of $28.0 million, primarily attributable to the completion of an acquired property of $8.3 million in Dallas, Texas and ongoing maintenance and expansion capital in Canada and the United States;
•additions to properties under development paid of $71.2 million, primarily attributable to Granite’s ongoing development projects in the United States and Germany;
•acquisition deposits paid of $26.5 million, consisting of advance payments for acquisitions under contract in the United States, Germany and Netherlands; and
•loan advances made of $10.5 million to the developer of two industrial properties being constructed in Indiana, partially offset by;
•net proceeds of $35.4 million received from the dispositions of three income-producing properties in the United Kingdom and Austria.
Financing Activities
Cash used in financing activities for the three month period ended December 31, 2022 of $113.2 million largely comprised of $49.7 million of monthly distribution payments and $69.1 million used for the repurchase of stapled units under the NCIB, partially offset by $5.8 million of proceeds from the secured construction loan relating to a development project in the United States.
Cash used in financing activities for the three month period ended December 31, 2021 of $49.2 million primarily comprised of monthly distribution payments.
Cash provided by financing activities for the year ended December 31, 2022 of $214.6 million largely comprised of $254.8 million of draws on the Credit Facility, $48.4 million of proceeds from the secured construction loan relating to a development project in the United States, $13.1 million of net proceeds received from the issuance of stapled units under the ATM Program, and $527.4 million of net proceeds from the full drawdown of the 2025 Term Loan, partially offset by $202.3 million of monthly distribution payments, $155.5 million used for the repurchase of stapled units under the NCIB, $6.6 million associated with the settlement of the 2028 Cross-Currency Interest Rate Swap, and $264.1 million used for the repayment of the Credit Facility.
Cash provided by financing activities for the year ended December 31, 2021 of $333.5 million largely comprised $497.3 million of proceeds from the 2028 Debentures issued on August 30, 2021 and $303.1 million of net proceeds from the stapled unit offering completed on June 9,
2021, net of issuance costs paid, partially offset by $254.0 million relating to the redemption of the 2021 Debentures, the early prepayment premium and settlement of the related 2021 Cross Currency Interest Rate Swap of $18.8 million, financing fees paid for the renewal of Granite’s Credit Facility of $2.9 million and $191.1 million of monthly distribution payments.
Debt Structure
Granite’s debt structure and key debt metrics as at December 31, 2022 and December 31, 2021 were as follows:
| | | | | | | | | | | |
| Summary Debt Structure and Debt Metrics |
| | | |
| As at December 31, | 2022 | 2021 |
| | | |
| Unsecured debt, net | | $ | 2,983.6 | $ | 2,425.1 |
Derivatives, net (4) | | (138.4) | (44.1) |
| Lease obligations | | 33.7 | 32.2 |
| Total unsecured debt | [A] | $ | 2,878.9 | $ | 2,413.2 |
| Secured debt | | 51.4 | 0.8 |
Total debt (1)(4) | [B] | $ | 2,930.3 | $ | 2,414.0 |
| Less: cash and cash equivalents | | 135.1 | 402.5 |
Net debt(1)(4) | [C] | $ | 2,795.2 | $ | 2,011.5 |
| | | |
| Investment properties | [D] | $ | 8,839.6 | $ | 7,971.2 |
| | | |
Unencumbered Assets(5) | [E] | $ | 8,754.6 | $ | 7,940.2 |
| | 99.0 | % | |
Trailing 12-month adjusted EBITDA(1) | [F] | $ | 352.1 | $ | 299.4 |
| Interest expense | | $ | 51.0 | $ | 47.2 |
| Interest income | | (1.6) | (3.1) |
| Trailing 12-month interest expense, net | [G] | $ | 49.4 | $ | 44.1 |
| | | |
| Debt metrics | | | |
Leverage ratio(2) | [B]/[D] | 33 | % | 30 | % |
Net leverage ratio(2) | [C]/[D] | 32 | % | 25 | % |
Interest coverage ratio(2) | [F]/[G] | 7.1x | 6.8x |
Unencumbered asset coverage ratio(2) | [E]/[A] | 3.0x | 3.3x |
Indebtedness ratio(2) | [B]/[F] | 8.3x | 8.1x |
Weighted average cost of debt(3) | | 2.28 | % | 1.81 | % |
Weighted average debt term-to-maturity, in years(3) | | 4.1 | 5.5 |
| Ratings and outlook | | | |
| DBRS | | BBB (high) stable | BBB (high) stable |
| Moody’s | | Baa2 Stable | Baa2 stable |
(1) Represents a non-IFRS measure. For definitions of Granite’s non-IFRS measures, refer to the section “NON-IFRS PERFORMANCE MEASURES”.
(2) Represents a non-IFRS ratio. For definitions of Granite’s non-IFRS ratios, refer to the section “NON-IFRS RATIOS”.
(3) Excludes lease obligations noted above.
(4) Balance is net of the derivative assets and derivative liabilities.
(5) Unencumbered assets represent the carrying value of investment properties (excluding any assets held for sale) that are not encumbered by secured debt. Granite can seek to obtain secured financing against its unencumbered assets subject to certain restrictions and financial covenant limitations in its Credit Facility, term loan agreements and trust indentures.
Unsecured Debt
2025 Term Loan
On September 15, 2022, Granite REIT Holdings Limited Partnership ("Granite LP") entered into and fully drew upon a US$400.0 million senior unsecured non-revolving term facility that will mature on September 15, 2025 (“2025 Term Loan”). The 2025 Term Loan is fully prepayable without penalty. Any amount repaid may not be re-borrowed. Interest on drawn amounts is calculated based on SOFR plus an applicable margin determined by reference to the external credit rating of Granite LP and is payable monthly in arrears. At December 31, 2022, the full US$400.0 million has been drawn and the balance, net of deferred financing costs, was $540.7 million.
2028 Debentures
On August 30, 2021, Granite LP issued $500.0 million aggregate principal amount of 2.194% Series 6 senior debentures due August 30, 2028 (the “2028 Debentures”). Interest on the 2028 Debentures is payable semi-annually in arrears on February 28 and August 30 of each year. At December 31, 2022, all of the 2028 Debentures remained outstanding and the balance, net of deferred financing costs, was $497.8 million.
2030 Debentures
On December 18, 2020, Granite LP issued $500.0 million aggregate principal amount of 2.378% Series 5 senior debentures due December 18, 2030 (the "2030 Debentures"). Interest on the 2030 Debentures is payable semi-annually in arrears on June 18 and December 18 of each year. At December 31, 2022, all of the 2030 Debentures remained outstanding and the balance, net of deferred financing costs, was $497.6 million.
2027 Debentures
On June 4, 2020, Granite LP issued $500.0 million aggregate principal amount of 3.062% Series 4 senior debentures due June 4, 2027 (the "2027 Debentures"). Interest on the 2027 Debentures is payable semi-annually in arrears on June 4 and December 4 of each year. At December 31, 2022, all of the 2027 Debentures remained outstanding and the balance, net of deferred financing costs, was $498.1 million.
2026 Term Loan
On December 12, 2018, Granite LP entered into and fully drew down a $300.0 million senior unsecured non-revolving term facility that originally matured on December 12, 2025. On November 27, 2019, Granite refinanced the $300.0 million term facility and extended the maturity date one year to December 11, 2026 (the “2026 Term Loan”). The 2026 Term Loan is fully prepayable without penalty. Any amount repaid may not be re-borrowed. Interest on drawn amounts is calculated based on the Canadian Dollar Offered Rate (“CDOR”) plus an applicable margin determined by reference to the external credit rating of Granite LP and is payable monthly in advance. At December 31, 2022, the full $300.0 million remained outstanding and the balance, net of deferred financing costs and debt modification losses, was $299.7 million.
As it is anticipated that the administrator of the Canadian Dollar Offered Rate ("CDOR") will cease publication of CDOR by June 28, 2024 and the Canadian financial benchmark will be replaced by the Canadian Overnight Repo Rate Average ("CORRA"), Granite intends to amend
the 2026 Term Loan and 2026 Cross Currency Interest Rate Swap before the end of June 2024 to update the benchmark rates in these agreements from CDOR to CORRA without any economic impact.
2024 Term Loan
On December 19, 2018, Granite LP entered into and fully drew down a US$185.0 million senior unsecured non-revolving term facility that originally matured on December 19, 2022. On October 10, 2019, Granite refinanced the US$185.0 million term facility and extended the maturity date two years to December 19, 2024 (the “2024 Term Loan”). The 2024 Term Loan is fully prepayable without penalty. Any amount repaid may not be re-borrowed. Interest on drawn amounts is calculated based on LIBOR plus an applicable margin determined by reference to the external credit rating of Granite LP and is payable monthly in arrears. At December 31, 2022, the full US$185.0 million remained outstanding and the balance, net of deferred financing costs and debt modification losses, was $250.1 million.
As the Federal Reserve Board has identified that the publication of the remainder of the US dollar London Interbank Offered Rate ("LIBOR") benchmark rates will be discontinued on June 30, 2023 and will be replaced by Secured Overnight Financing Rate ("SOFR"), Granite intends to amend the 2024 Term Loan and 2024 Cross Currency Interest Rate Swap before the end of June 2023 to update the benchmark rates in these agreements from LIBOR to SOFR without any economic impact.
2023 Debentures
On December 20, 2016, Granite LP issued $400.0 million aggregate principal amount of 3.873% Series 3 senior debentures due November 30, 2023 (the “2023 Debentures”). Interest on the 2023 Debentures is payable semi-annually in arrears on May 30 and November 30 of each year. At December 31, 2022, all of the 2023 Debentures remained outstanding and the balance, net of deferred financing costs, was $399.7 million.
The 2023 Debentures, the 2027 Debentures, the 2030 Debentures, the 2028 Debentures, the 2024 Term Loan, the 2026 Term Loan and the 2025 Term Loan rank pari passu with all of the Trust's other existing and future senior unsecured indebtedness and are guaranteed by Granite REIT and Granite GP.
Credit Facility
The Trust has available an unsecured revolving credit facility (the ‘‘Credit Facility’’) with a limit of $1.0 billion, maturing March 31, 2026. Draws on the Credit Facility are available by way of Canadian dollar, US dollar or Euro denominated loans or Canadian dollar or US dollar denominated letters of credit. The Credit Facility provides Granite the ability to increase the amount of the commitment by an additional aggregate principal amount of up to $500.0 million with consent of the participating lenders. As at December 31, 2022, the Trust had no amounts drawn and $3.5 million in letters of credit issued against the Credit Facility.
On March 3, 2023, Granite amended the Credit Facility to extend the maturity date for a new five-year term to March 31, 2028 (see “Subsequent Events”). Included in the amendment, Granite also updated the benchmark rates from LIBOR to SOFR, including a fixed spread for the basis difference between LIBOR and SOFR, for US dollar denominated draws and from LIBOR to the Euro Interbank Offered Rate ("EURIBOR") for Euro denominated draws. Such amendments to the benchmark rates result in no economic impact to Granite’s borrowing rates. As it is anticipated that the administrator of CDOR will cease publication of CDOR by
June 28, 2024 and the Canadian financial benchmark will be replaced by CORRA, Granite's Credit Facility contains fallback provisions to transition from CDOR to CORRA for Canadian denominated draws when CDOR is discontinued.
Secured Debt
On December 17, 2021, Granite entered into a secured construction loan relating to Phase II of its development project in Houston, Texas. The loan has a maximum draw amount of $59.9 million (US$44.3 million) and is secured by the property under construction and related land. The loan matures on December 17, 2023 and bears interest at the U.S. prime rate minus 90 basis points. Granite also has the option to extend the maturity date to December 17, 2024, subject to certain terms and conditions, which was not exercised as of December 31, 2022. As at December 31, 2022, the balance of the loan was $51.4 million (US$38.0 million).
Derivatives
Granite has entered into derivatives including cross-currency interest rate swaps and interest rate swaps to lower its overall cost of borrowings and to hedge its currency exposure. The below table summarizes Granite’s derivative arrangements outstanding as at December 31, 2022 and December 31, 2021:
| | | | | | | | | | | | | | | | | | | | | | | | | | | | | | | | | | | | | | | |
| | | | | | | | | | | | | |
| As at December 31, | | | | | | | | | | | 2022 | 2021 |
| | | | | | | | | |
| Notional amount to be paid | Interest payment rate | | Notional amount to be received | Interest receipt rate | | Maturity date | | | Fair value assets (liabilities) | Fair value assets (liabilities) |
| 2023 Cross Currency Interest Rate Swap | 281,100 | | EUR | 2.430 | % | | 400,000 | | CAD | 3.873 | % | | Nov. 30, 2023 | | | $ | (7,076) | | $ | (6,551) | |
| 2024 Cross Currency Interest Rate Swap | 168,200 | | EUR | 0.522 | % | | 185,000 | | USD | LIBOR plus margin | | Dec. 19, 2024 | | | 24,891 | | (5,056) | |
2025 Interest Rate Swap (1) | — | | — | | — | | | — | | — | | — | | | Sept. 15, 2025 | | | 5,244 | | — | |
| 2026 Cross Currency Interest Rate Swap | 205,500 | | EUR | 1.355 | % | | 300,000 | | CAD | CDOR plus margin | | Dec. 11, 2026 | | | 39,264 | | 7,844 | |
| 2027 Cross Currency Interest Rate Swap | 370,300 | | USD | 2.964 | % | | 500,000 | | CAD | 3.062 | % | | June 4, 2027 | | | 8,123 | | 28,752 | |
2028 Cross Currency Interest Rate Swap (2) | 397,000 | | USD | 2.096 | % | | 500,000 | | CAD | 2.194 | % | | Aug. 30, 2028 | | | — | | (7,017) | |
| 2028 Cross Currency Interest Rate Swap | 119,100 | | USD | 2.096 | % | | 150,000 | | CAD | 2.194 | % | | Aug. 30, 2028 | | | (6,391) | | — | |
2028 Cross Currency Interest Rate Swap (2) | 242,100 | | EUR | 0.536 | % | | 350,000 | | CAD | 2.194 | % | | Aug. 30, 2028 | | | 19,450 | | — | |
| 2030 Cross Currency Interest Rate Swap | 319,400 | | EUR | 1.045 | % | | 500,000 | | CAD | 2.378 | % | | Dec. 18, 2030 | | | 54,883 | | 26,172 | |
| | | | | | | | | | | | $ | 138,388 | | $ | 44,144 | |
(1)On September 15, 2022, Granite LP entered into a float to fixed interest rate swap (the “2025 Interest Rate Swap”) to exchange the floating SOFR portion of the interest payments of the 2025 Term Loan for fixed interest payments resulting in an all-in fixed interest rate of 5.016%.
(2)On February 3, 2022, Granite terminated $350.0 million of a total $500.0 million principal of the 2028 Cross Currency Interest Rate Swap and simultaneously entered into a new $350.0 million cross-currency interest rate swap maturing August 30, 2028, to exchange the Canadian dollar denominated principal and interest payments of the 2028 Debentures for Euro denominated payments at a fixed interest rate of 0.536%. Upon termination, Granite paid $6.6 million to settle the mark-to-market liability relating to the $350.0 million principal portion of the 2028 Cross Currency Interest Rate Swap.
Debt Maturity Profile
As at December 31, 2022, Granite’s debt maturity profile and future repayments are as outlined below:
| | | | | | | | | | | | | | | | | | | | | | | | | | | | | | | | | | | | | | | | | | | | | | | |
| % of Debt Maturing | | 15% | | 9% | | 18% | | 10% | | 16% | | 16% | | 16% | |
Debt Metrics and Financial Covenants
Granite uses the debt metrics noted above to assess its borrowing capacity and the ability to meet its current and future financing obligations. Granite’s interest coverage ratio improved from 6.8x for the year ended December 31, 2021 to 7.1x for the year ended December 31, 2022 as a result of 18% EBITDA growth year over year, partially offset by a 12% increase in interest expense. The increase in Granite’s leverage ratios and indebtedness ratios from December 31, 2021 to December 31, 2022 is primarily due to the incremental borrowings from the 2025 Term Loan obtained in September 2022 and fair value losses taken on investment properties of $229.9 million during 2022. The debt ratios remain relatively favourable and provide financial flexibility for future growth.
Granite’s unsecured debentures, term loans, secured debt and credit facility agreements contain financial and non-financial covenants that include maintaining certain leverage and debt service ratios. As at December 31, 2022, Granite was in compliance with all of these covenants.
Credit Ratings
On March 30, 2022, DBRS confirmed Granite LP’s Issuer Rating and credit rating on the 2023 Debentures, the 2027 Debentures, the 2028 Debentures and the 2030 Debentures as BBB(high) with stable trends. On June 24, 2022, Moody’s confirmed the Baa2 rating on the 2023 Debentures, the 2027 Debentures, the 2028 Debentures and the 2030 Debentures with a stable outlook. Credit ratings are intended to provide investors with an independent measure of credit quality of an issue of securities. A rating accorded to any security is not a
recommendation to buy, sell or hold such securities and may be subject to revision or withdrawal at any time by the rating organization which granted such rating.
Unitholders’ Equity
Outstanding Stapled Units
As at March 8, 2023, the Trust had 63,707,902 stapled units issued and outstanding.
As at March 8, 2023, the Trust had 74,678 restricted stapled units (representing the right to receive 74,678 stapled units) and 111,258 performance stapled units (representing the right to receive a maximum of 222,516 stapled units) outstanding under the Trust’s Executive Deferred Stapled Unit Plan. The Executive Deferred Stapled Unit Plan is designed to provide equity-based compensation to employees of Granite who are, by the nature of their position or job, in a position to contribute to the success of Granite.
As at March 8, 2023, the Trust had 118,619 deferred stapled units (representing the right to receive 118,619 stapled units) outstanding under the Trust’s Director/Trustee Deferred Share Unit Plan.
Distributions
On November 9, 2022, the Trust increased its targeted annualized distribution by 3.2% to $3.20 ($0.2667 per month) per stapled unit from $3.10 ($0.2583 per month) per stapled unit to be effective upon the declaration of the distribution in respect of the month of December 2022 and paid on January 17, 2023.
Total distributions declared to stapled unitholders in the three month periods ended December 31, 2022 and 2021 were $50.0 million or $0.7830 per stapled unit and $49.8 million or $0.7580 per stapled unit, respectively. Total distributions declared to stapled unitholders in the years ended December 31, 2022 and 2021 were $202.3 million or $3.1100 per stapled unit and $192.6 million or $3.0100 per stapled unit, respectively.
The distributions declared in January 2023 in the amount of $17.0 million or $0.2667 per stapled unit were paid on February 15, 2023 and the distributions declared in February 2023 of $17.0 million or $0.2667per stapled unit will be paid on March 15, 2023.
Pursuant to the requirement of National Policy 41-201, Income Trusts and Other Indirect Offerings (“NP 41-201”), the following table outlines the differences between cash flow from operating activities and cash distributions as well as the differences between net (loss) income and cash distributions, in accordance with the guidelines under NP 41-201.
| | | | | | | | | | | | | | | | | |
| Cash Flows from Operating Activities in Excess of Distributions Paid and Payable |
| | | | |
| Three Months Ended December 31, | | Years Ended December 31, |
| 2022 | 2021 | | 2022 | 2021 |
| Net (Loss) Income | $ | (126.3) | | $ | 341.3 | | | $ | 155.8 | | $ | 1,310.3 | |
| Cash flows provided by operating activities | 65.5 | | 53.8 | | | 277.5 | | 262.3 | |
| Monthly cash distributions paid and payable | (50.0) | | (49.8) | | | (202.3) | | (192.6) | |
| Cash flows from operating activities in excess of distributions paid and payable | $ | 15.5 | | $ | 4.0 | | | $ | 75.2 | | $ | 69.7 | |
Monthly distributions for the three month periods and years ended December 31, 2022 and 2021 were funded with cash flows from operating activities.
Net income prepared in accordance with IFRS recognizes revenue and expenses at time intervals that do not necessarily match the receipt or payment of cash. Therefore, when establishing cash distributions to unitholders, consideration is given to factors such as FFO, AFFO, cash generated from and required for operating activities and forward-looking cash flow information, including forecasts and budgets. Management does not expect current or potential future commitments to replace or maintain its investment properties to adversely affect cash distributions.
Normal Course Issuer Bid
On May 19, 2022, Granite announced the acceptance by the Toronto Stock Exchange ("TSX") of Granite’s Notice of Intention to Make a Normal Course Issuer Bid (“NCIB”). Pursuant to the NCIB, Granite proposes to purchase through the facilities of the TSX and any alternative trading system in Canada, from time to time and if considered advisable, up to an aggregate of 6,566,292 of Granite’s issued and outstanding stapled units. The NCIB commenced on May 24, 2022 and will conclude on the earlier of the date on which purchases under the bid have been completed and May 23, 2023. Pursuant to the policies of the TSX, daily purchases made by Granite through the TSX may not exceed 39,046 stapled units, subject to certain exceptions. Granite has entered into an automatic securities purchase plan with a broker in order to facilitate repurchases of the stapled units under the NCIB during specified blackout periods. Pursuant to a previous notice of intention to conduct a NCIB, Granite received approval from the TSX to purchase stapled units for the period May 21, 2021 to May 20, 2022.
During the three month period ended December 31, 2022, Granite repurchased 1,022,000 stapled units at an average stapled unit cost of $67.60 for total consideration of $69.1 million. During the year ended December 31, 2022, Granite repurchased 2,165,600 stapled units at an average stapled unit cost of $71.81 for total consideration of $155.5 million, excluding commissions. During the three months and year ended December 31, 2021, there were no stapled unit repurchases under the NCIB.
At-The-Market Equity Distribution Program
On November 3, 2021, Granite filed a prospectus supplement to the short form base shelf prospectus of Granite REIT and Granite GP dated October 1, 2021 establishing an at-the-market equity distribution program (the “ATM Program”), in each of the provinces and territories of Canada, that allows it to issue and sell, at its discretion, up to $250.0 million of stapled units to the public, from time to time. Stapled units sold under the ATM Program will be sold at the prevailing market prices at the time of sale when issued, directly through the facilities of the Toronto Stock Exchange or any other recognized marketplace upon which the stapled units are listed or quoted or where the stapled units are traded in Canada.
During the three month period ended December 31, 2022, there were no issuances under the ATM Program. During the year ended December 31, 2022, Granite issued 136,100 stapled units under the ATM Program at an average stapled unit price of $98.77 for gross proceeds of $13.4 million, and incurred issuance costs of $0.3 million, for net proceeds of $13.1 million.
COMMITMENTS, CONTRACTUAL OBLIGATIONS, CONTINGENCIES AND OFF-BALANCE SHEET ARRANGEMENTS
The Trust is subject to various legal proceedings and claims that arise in the ordinary course of business. Management believes that the final outcome of such matters will not have a material adverse effect on the financial position, results of operations or liquidity of the Trust. However, actual outcomes may differ from management’s expectations.
Off-balance sheet arrangements consist of outstanding letters of credit to support certain contractual obligations, property purchase commitments, construction and development project commitments and certain operating agreements. As at December 31, 2022, the Trust had $3.5 million in letters of credit outstanding. As at December 31, 2022, the Trust's contractual commitments totaled $177.9 million which comprised of construction and development projects of $143.1 million and the committed acquisitions of two properties in Indiana upon completion totaling $34.8 million. Granite expects to fund these commitments over the next year through the use of cash on hand, cash from operations and/or Granite’s Credit Facility.
For further discussion of commitments, contractual obligations, contingencies and off-balance sheet arrangements, refer to notes 8, 11 and 22 to the audited combined financial statements for the year ended December 31, 2022.
RELATED PARTY TRANSACTIONS
For a discussion of the Trust's transactions with related parties, refer to note 20 of the audited combined financial statements for the year ended December 31, 2022.
NON-IFRS PERFORMANCE MEASURES
The following non-IFRS performance measures are important measures used by management in evaluating the Trust’s underlying operating performance and debt management. These non-IFRS performance measures are not defined by IFRS and do not have standard meanings. The Trust’s method of calculating non-IFRS performance measures may differ from other issuers’ methods and, accordingly, the Trust’s non-IFRS performance measures may not be comparable with similar measures presented by other issuers.
Funds from operations
FFO is a non-IFRS performance measure that is widely used by the real estate industry in evaluating the operating performance of real estate entities. Granite calculates FFO as net income attributable to stapled unitholders excluding fair value gains (losses) on investment properties and financial instruments, gains (losses) on sale of investment properties including the associated current income tax, deferred income taxes and certain other items, net of non-controlling interests in such items. The Trust’s determination of FFO follows the definition prescribed by the Real Estate Property Association of Canada (“REALPAC”) guidelines on Funds From Operations & Adjusted Funds From Operations for IFRS dated January 2022 (“REALPAC Guidelines”). Granite considers FFO to be a meaningful supplemental measure that can be used to determine the Trust’s ability to service debt, fund capital expenditures and provide distributions to stapled unitholders. FFO is reconciled to net income, which is the most directly comparable IFRS measure (see “RESULTS OF OPERATIONS - Funds From Operations and Adjusted Funds From Operations” for the reconciliation of FFO to net income for the periods presented). FFO should not be construed as an alternative to net income or cash flow generated from operating activities determined in accordance with IFRS.
Adjusted funds from operations
AFFO is a non-IFRS performance measure that is widely used by the real estate industry in evaluating the recurring economic earnings performance of real estate entities after considering certain costs associated with sustaining such earnings. Granite calculates AFFO as net income attributable to stapled unitholders including all adjustments used to calculate FFO and further adjusts for actual maintenance capital expenditures that are required to sustain Granite’s productive capacity, leasing costs such as leasing commissions and tenant allowances incurred and non-cash straight-line rent and tenant incentive amortization, net of non-controlling interests in such items. The Trust's determination of AFFO follows the definition prescribed by the REALPAC Guidelines. Granite considers AFFO to be a meaningful supplemental measure that can be used to determine the Trust’s ability to service debt, fund expansion capital expenditures, fund property development and provide distributions to stapled unitholders after considering costs associated with sustaining operating earnings. AFFO is also reconciled to net income, which is the most directly comparable IFRS measure (see “RESULTS OF OPERATIONS - Funds From Operations and Adjusted Funds From Operations” for the reconciliation of AFFO to net income for the periods presented). AFFO should not be construed as an alternative to net income or cash flow generated from operating activities determined in accordance with IFRS.
Net operating income - cash basis
Granite uses NOI on a cash basis, which adjusts NOI to exclude lease termination and close-out fees, and the non-cash impact from straight-line rent and tenant incentive amortization recognized during the period (see “RESULTS OF OPERATIONS - Net Operating Income” for the reconciliation of NOI - cash basis to NOI for the periods presented). NOI - cash basis is a commonly used measure by the real estate industry and Granite believes it is a useful supplementary measure of the income generated by and operating performance of income-producing properties in addition to the most comparable IFRS measure, which Granite believes is NOI. NOI - cash basis is also a key input in Granite’s determination of the fair value of its investment property portfolio.
Same property net operating income - cash basis
Same property NOI - cash basis refers to the NOI - cash basis for those properties owned by Granite throughout the entire current and prior year periods under comparison. Same property NOI - cash basis excludes properties that were acquired, disposed of, classified as properties under or held for development or assets held for sale during the periods under comparison (see “RESULTS OF OPERATIONS - Net Operating Income” for a reconciliation of same property NOI - cash basis to NOI - cash basis and to NOI for the periods presented). Granite believes that same property NOI - cash basis is a useful supplementary measure in understanding period-over-period organic changes in NOI - cash basis from the same stock of properties owned.
Constant currency same property NOI
Constant currency same property NOI is a non-GAAP measure used by management in evaluating the performance of properties owned by Granite throughout the entire current and prior year periods on a constant currency basis. It is calculated by taking same property NOI as defined above and excluding the impact of foreign currency translation by converting the same property NOI denominated in foreign currency in the respective periods at the current period average exchange rates (see “RESULTS OF OPERATIONS - Net Operating Income” for a reconciliation of constant currency same property NOI to same property NOI - cash basis for the periods presented).
Adjusted earnings before interest, income taxes, depreciation and amortization (“Adjusted EBITDA”)
Adjusted EBITDA is calculated as net income before lease termination and close-out fees, interest expense, interest income, income tax expense, depreciation and amortization expense, fair value gains (losses) on investment properties and financial instruments, other expense relating to real estate transfer tax and loss on the sale of investment properties. Adjusted EBITDA, calculated on a 12-month trailing basis (“trailing 12-month adjusted EBITDA”), represents an operating cash flow measure that Granite uses in calculating the interest coverage ratio and indebtedness ratio noted below. Adjusted EBITDA is also defined in Granite’s debt agreements and used in calculating the Trust’s debt covenants.
| | | | | | | | |
| Adjusted EBITDA Reconciliation |
| | |
| | |
| For the 12-months ended December 31, | 2022 | 2021 |
| Net income | $ | 155.8 | | $ | 1,310.3 | |
| Add (deduct): | | |
| Interest expense and other financing costs | 51.0 | | 47.2 | |
| Interest income | (1.6) | | (3.1) | |
| Income tax (recovery) expense | (63.7) | | 240.6 | |
| Depreciation and amortization | 1.6 | | 1.3 | |
| Fair value losses (gains) on investment properties, net | 219.7 | | (1,298.9) | |
| Fair value (gains) losses on financial instruments, net | (11.4) | | 1.2 | |
| Loss on sale of investment properties | 0.7 | | 0.8 | |
| Adjusted EBITDA | $ | 352.1 | | $ | 299.4 | |
Available Liquidity
Available liquidity is a non-IFRS performance measure defined as the sum of cash and cash equivalents and the unused portion of the Credit Facility. Granite believes that available liquidity is a useful measure to investors in determining the Trust’s resources available as at period-end to meet its ongoing obligations and future commitments (see “LIQUIDITY AND CAPITAL RESOURCES - Liquidity”).
Total Debt and Net Debt
Total debt is a non-IFRS performance measure calculated as the sum of all current and non-current debt, the net mark to market fair value of derivatives and lease obligations as per the consolidated financial statements. Net debt subtracts cash and cash equivalents from total debt. Granite believes that it is useful to include the derivatives and lease obligations for the purposes of monitoring the Trust’s debt levels (see “LIQUIDITY AND CAPITAL RESOURCES - Debt Structure”).
NON-IFRS RATIOS
The following non-IFRS ratios are important measures used by management in evaluating the Trust’s underlying operating performance and debt management. These non-IFRS ratios are not defined by IFRS and do not have standard meanings. The Trust’s method of calculating non-IFRS ratios may differ from other issuers’ methods and, accordingly, the Trust’s non-IFRS ratios may not be comparable with similar measures presented by other issuers.
FFO and AFFO payout ratios
The FFO and AFFO payout ratios are calculated as monthly distributions, which exclude special distributions, declared to unitholders divided by FFO and AFFO (non-IFRS performance measures), respectively, in a period. FFO payout ratio and AFFO payout ratio may exclude revenue or expenses incurred during a period that can be a source of variance between periods. The FFO payout ratio and AFFO payout ratio are supplemental measures widely used by investors in evaluating the sustainability of the Trust’s monthly distributions to stapled unitholders.
| | | | | | | | | | | | | | | | | | | | |
| FFO and AFFO Payout Ratios |
| | | | | |
| | Three Months Ended December 31, | | Years Ended December 31, |
| | 2022 | 2021 | | 2022 | 2021 |
| Monthly distributions declared to unitholders | [A] | $50.0 | $49.8 | | $202.3 | $192.6 |
| | | | | | |
| FFO | | 77.2 | 66.8 | | 289.3 | 251.3 |
| Add (deduct): | | | | | | |
| Early redemption premium related to 2021 Debentures | | — | — | | — | 4.0 |
| Accelerated amortization of credit facility deferred finance fees | | — | — | | — | 0.5 |
| FFO adjusted for the above | [B] | $77.2 | $66.8 | | $289.3 | $255.8 |
| | | | | | |
| AFFO | | 67.0 | 59.2 | | 264.2 | 235.2 |
| Add (deduct): | | | | | | |
| Early redemption premium related to 2021 Debentures | | — | — | | — | 4.0 |
| Accelerated amortization of credit facility deferred finance fees | | — | — | | — | 0.5 |
| AFFO adjusted for the above | [C] | $67.0 | $59.2 | | $264.2 | $239.7 |
| FFO payout ratio | [A]/[B] | 65 | % | 75 | % | | 70 | % | 75 | % |
| AFFO payout ratio | [A]/[C] | 75 | % | 84 | % | | 77 | % | 80 | % |
Interest coverage ratio
The interest coverage ratio is calculated on a 12-month trailing basis using Adjusted EBITDA (a non-IFRS performance measure) divided by net interest expense. Granite believes the interest coverage ratio is useful in evaluating the Trust’s ability to meet its interest expense obligations (see “LIQUIDITY AND CAPITAL RESOURCES - Debt Structure”).
Indebtedness ratio
The indebtedness ratio is calculated as total debt (a non-IFRS performance measure) divided by Adjusted EBITDA (a non-IFRS performance measure) and Granite believes it is useful in evaluating the Trust’s ability to repay outstanding debt using its operating cash flows (see “LIQUIDITY AND CAPITAL RESOURCES - Debt Structure”).
Leverage and net leverage ratios
The leverage ratio is calculated as total debt (a non-IFRS performance measure) divided by the fair value of investment properties (excluding assets held for sale) while the net leverage ratio subtracts cash and cash equivalents from total debt. The leverage ratio and net leverage ratio are supplemental measures that Granite believes are useful in evaluating the Trust’s degree of financial leverage, borrowing capacity and the relative strength of its balance sheet (see “LIQUIDITY AND CAPITAL RESOURCES - Debt Structure”).
Unencumbered asset coverage ratio
The unencumbered asset coverage ratio is calculated as the carrying value of investment properties (excluding assets held for sale) that are not encumbered by secured debt divided by the carrying value of total unsecured debt and is a supplemental measure that Granite believes is useful in evaluating the Trust’s degree of asset coverage provided by its unencumbered investment properties to total unsecured debt (see “LIQUIDITY AND CAPITAL RESOURCES - Debt Structure”).
SIGNIFICANT ACCOUNTING ESTIMATES
The preparation of financial statements in conformity with IFRS requires management to apply judgment and make estimates that affect the amounts reported and disclosed in the combined financial statements. Management bases estimates on historical experience and various other assumptions that are believed to be reasonable in the circumstances, the results of which form the basis for making judgments about the values of assets and liabilities. On an ongoing basis, management evaluates its estimates. However, actual results could differ from those estimates.
The Trust’s significant accounting policies that involve the most judgment and estimates are as follows:
Judgments
Leases
The Trust’s policy for revenue recognition is described in note 2(l) of the audited combined financial statements for the year ended December 31, 2022. The Trust makes judgments in determining whether certain leases are operating or finance leases, in particular tenant leases with long contractual terms or leases where the property is a large square-footage and/or architecturally specialized. The Trust also makes judgments in determining the lease term for some lease contracts in which it is a lessee that include renewal or termination options. The assessment of whether the Trust is reasonably certain to exercise such options impacts the lease term which, in turn, significantly affects the amount of lease obligations and right-of-use assets recognized.
Investment properties
The Trust’s policy relating to investment properties is described in note 2(d) of the audited combined financial statements for the year ended December 31, 2022. In applying this policy, judgment is used in determining whether certain costs incurred for tenant improvements are additions to the carrying amount of the property or represent incentives, identifying the point at which practical completion of properties under development occurs and determining borrowing costs to be capitalized to the carrying value of properties under development. Judgment is also applied in determining the use, extent and frequency of independent appraisals.
Income taxes
The Trust applies judgment in determining whether it will continue to qualify as a REIT for both Canadian and United States tax purposes for the foreseeable future. However, should it at some point no longer qualify, the Trust would be subject to income tax which could materially affect future distributions to unitholders and would also be required to recognize additional current and/or deferred income taxes.
Estimates and Assumptions
Valuation of investment properties
The fair value of investment properties is determined by management using primarily the discounted cash flow method in which the income and expenses are projected over the anticipated term of the investment plus a terminal value discounted using an appropriate discount rate. The Trust obtains, from time to time, appraisals from independent qualified real estate valuation experts. However, the Trust does not measure its investment properties based on these appraisals but uses them as data points, together with other external market information accumulated by management, in arriving at its own conclusions on values. Management uses valuation assumptions such as discount rates, terminal capitalization rates and market rental rates applied in external appraisals or sourced from valuation experts; however, the Trust also uses its historical renewal experience with tenants, its direct knowledge of the specialized nature of certain of Granite’s portfolio and tenant profile and its knowledge of the actual condition of the properties in making business judgments about lease renewal probabilities, renewal rents and capital expenditures. There has been no change in the valuation methodology used during the year ended December 31, 2022. The critical assumptions relating to the Trust’s estimates of fair values of investment properties include the receipt of contractual rents, contractual renewal terms, expected future market rental rates, discount rates that reflect current market uncertainties, capitalization rates and recent investment property prices. If there is any change in these assumptions or regional, national or international economic conditions, the fair value of investment properties may change materially. Refer to the “INVESTMENT PROPERTIES” section and note 4 of the audited combined financial statements for the year ended December 31, 2022 for further information on the estimates and assumptions made by management in connection with the fair values of investment properties.
Fair value of financial instruments
Where the fair value of financial assets or liabilities recorded on the balance sheet or disclosed in the notes cannot be derived from active markets, it is determined using valuation techniques including the discounted cash flow model. The inputs to these models are taken from observable markets where possible but, where this is not feasible, a degree of judgment is required in establishing fair values. The judgments include considerations of inputs such as credit risk and volatility. Changes in assumptions about these factors could materially affect the reported fair value of financial instruments.
Income taxes
The Trust operates in a number of countries and is subject to the income tax laws and related tax treaties in each of its operating jurisdictions. These laws and treaties can be subject to different interpretations by relevant taxation authorities. Significant judgment is required in the estimation of Granite’s income tax expense, interpretation and application of the relevant tax laws and treaties and the provision for any exposure that may arise from tax positions that are under audit by relevant taxation authorities.
The recognition and measurement of deferred tax assets or liabilities is dependent on management’s estimate of future taxable profits and income tax rates that are expected to be in effect in the period the asset is realized or the liability is settled. Any changes in management’s estimates can result in changes in deferred tax assets or liabilities as reported in the combined balance sheets and also the deferred income tax expense in the combined statements of net income.
NEW ACCOUNTING PRONOUNCEMENTS AND DEVELOPMENTS
Future Accounting Policy Changes
As at December 31, 2022, there are no new accounting standards issued with a material effect but not yet applicable to the audited combined financial statements.
| | | | | | | | | | | | | | |
| INTERNAL CONTROLS OVER FINANCIAL REPORTING |
Disclosure Controls and Procedures
The President and Chief Executive Officer and the Chief Financial Officer of Granite have evaluated the effectiveness of the Trust’s disclosure controls and procedures as defined in National Instrument 52-109 - Certification of Disclosure in Issuers’ Annual and Interim Filings (“NI 52-109”) and in Rules 13a-15(e) and 15d-15(e) under the United States Securities Exchange Act of 1934 as of December 31, 2022 (the “Evaluation Date”). They have concluded that, as of the Evaluation Date, the Trust’s disclosure controls and procedures were effective to ensure that information required to be disclosed by the Trust in the reports that they file or submit is (i) recorded, processed, summarized and reported within the time periods specified in the applicable rules and (ii) accumulated and communicated to the Trust’s management, including their principal executive and principal financial officers, or persons performing similar functions, as appropriate to allow timely decisions regarding required disclosure.
Management’s Report on Internal Control Over Financial Reporting
The Trust’s management is responsible for establishing and maintaining adequate internal control over financial reporting (as such term is defined in NI 52-109 and Rules 13a-15(f) and 15d-15(f) under the United States Securities Exchange Act of 1934) for the Trust.
The Trust’s internal control over financial reporting is a process designed by, or under the supervision of, the Trust’s principal executive and principal financial officers, or persons performing similar functions, and effected by the Trust’s board of directors, management and other personnel, to provide reasonable assurance regarding the reliability of financial reporting and the preparation of financial statements for external purposes in accordance with generally accepted accounting principles and includes those policies and procedures that: (1) pertain to the maintenance of records that, in reasonable detail, accurately and fairly reflect the transactions and dispositions of the Trust’s assets; (2) provide reasonable assurance that transactions are recorded as necessary to permit preparation of financial statements in accordance with generally accepted accounting principles, and that the Trust’s receipts and expenditures are being made only in accordance with authorizations of its management and directors; and (3) provide reasonable assurance regarding prevention or timely detection of unauthorized acquisition, use or disposition of the Trust’s assets that could have a material effect on the financial statements.
Under the supervision and with the participation of the Trust’s President and Chief Executive Officer and Chief Financial Officer, management conducted an evaluation of the effectiveness of the Trust’s internal control over financial reporting, as of the Evaluation Date, based on the framework set forth in Internal Control - Integrated Framework (2013) issued by the Committee of Sponsoring Organizations of the Treadway Commission. Based on its evaluation under this framework, management concluded that the Trust’s internal control over financial reporting was effective as of December 31, 2022.
Deloitte LLP, an independent registered public accounting firm, who audited and reported on the Trust’s audited combined financial statements as at and for the year ended December 31, 2022 and whose report is included in the Trust’s annual report for fiscal 2022, has also issued an attestation report under standards of the Public Company Accounting Oversight Board (United States) on the Trust’s internal control over financial reporting as of December 31, 2022. The attestation report precedes the audited financial statements included in the Trust’s annual report for fiscal 2022.
Changes in Internal Control Over Financial Reporting
As of the Evaluation Date, there were no changes in the Trust’s internal control over financial reporting that occurred during the period beginning on the date immediately following the end of the period in respect of which Granite made its most recent previous interim filing and ended on December 31, 2022 that have materially affected, or that are reasonably likely to materially affect, the Trust’s internal control over financial reporting.
Limitation on the Effectiveness of Controls and Procedures
Granite’s management, including the President and Chief Executive Officer and the Chief Financial Officer, does not expect that the Trust’s controls and procedures will prevent all potential error and fraud. A control system, no matter how well conceived and operated, can provide only reasonable, not absolute, assurance that the objectives of the control system are met.
RISKS AND UNCERTAINTIES
Investing in the Trust’s stapled units involves a high degree of risk. There are a number of risk factors that could have a material adverse effect on Granite’s business, financial condition, operating results and prospects. These risks and uncertainties are discussed in Granite’s AIF filed with securities regulators in Canada and available online at www.sedar.com and Annual Report on Form 40-F filed with the SEC and available online on EDGAR at www.sec.gov, each in respect of the year ended December 31, 2022.
QUARTERLY FINANCIAL DATA (UNAUDITED)
| | | | | | | | | | | | | | | | | | | | | | | | | | |
| (in millions, except as noted) | Q4 '22 | Q3 '22 | Q2 '22 | Q1 '22 | Q4 '21 | Q3 '21 | Q2 '21 | Q1 '21 |
Operating highlights(3) | | | | | | | | |
| Revenue | $ | 125.6 | | $ | 111.6 | | $ | 109.8 | | $ | 108.6 | | $ | 105.3 | | $ | 98.3 | | $ | 94.0 | | $ | 95.9 | |
NOI - cash basis(1) | $ | 99.6 | | $ | 93.1 | | $ | 90.4 | | $ | 90.8 | | $ | 85.7 | | $ | 83.6 | | $ | 79.9 | | $ | 79.8 | |
| Fair value (losses) gains on investment properties, net | $ | (229.9) | | $ | (229.2) | | $ | (251.3) | | $ | 490.6 | | $ | 349.1 | | $ | 432.2 | | $ | 308.0 | | $ | 209.5 | |
| Net (loss) income attributable to stapled unitholders | $ | (126.3) | | $ | (93.3) | | $ | (122.3) | | $ | 497.7 | | $ | 341.3 | | $ | 421.8 | | $ | 317.0 | | $ | 230.2 | |
| Cash provided by operating activities | $ | 65.5 | | $ | 78.3 | | $ | 63.2 | | $ | 70.5 | | $ | 53.7 | | $ | 79.5 | | $ | 64.7 | | $ | 64.3 | |
FFO(1) | $ | 77.2 | | $ | 70.7 | | $ | 72.1 | | $ | 69.4 | | $ | 66.8 | | $ | 65.2 | | $ | 62.2 | | $ | 57.1 | |
AFFO(1) | $ | 67.0 | | $ | 63.3 | | $ | 68.2 | | $ | 65.9 | | $ | 59.2 | | $ | 61.2 | | $ | 60.1 | | $ | 54.7 | |
FFO payout ratio(2) | 65% | 71% | 71% | 73% | 75% | 76% | 76% | 75% |
AFFO payout ratio(2) | 75% | 80% | 75% | 77% | 84% | 81% | 79% | 78% |
| | | | | | | | |
| Per unit amounts | | | | | | | | |
Diluted FFO(1) | $ | 1.20 | | $ | 1.08 | | $ | 1.09 | | $ | 1.05 | | $ | 1.02 | | $ | 0.99 | | $ | 0.99 | | $ | 0.93 | |
Diluted AFFO(1) | $ | 1.05 | | $ | 0.97 | | $ | 1.04 | | $ | 1.00 | | $ | 0.90 | | $ | 0.93 | | $ | 0.96 | | $ | 0.89 | |
| Monthly distributions paid | $ | 0.78 | | $ | 0.78 | | $ | 0.78 | | $ | 0.78 | | $ | 0.75 | | $ | 0.75 | | $ | 0.75 | | $ | 0.75 | |
| | | | | | | | |
| Diluted weighted average number of units | 64.1 | | 65.5 | | 65.9 | | 65.8 | | 65.8 | | 65.8 | | 62.8 | | 61.7 | |
| | | | | | | | |
| Financial highlights | | | | | | | | |
Investment properties(4) | $ | 8,839.6 | | $ | 8,938.9 | | $ | 8,533.4 | | $ | 8,526.8 | | $ | 7,971.2 | | $ | 7,286.3 | | $ | 6,396.6 | | $ | 6,003.7 | |
| Assets held for sale | $ | 41.2 | | $ | 17.5 | | $ | 156.2 | | $ | 32.9 | | $ | 64.6 | | $ | 43.2 | | $ | — | | $ | — | |
| Cash and cash equivalents | $ | 135.1 | | $ | 274.3 | | $ | 157.6 | | $ | 228.5 | | $ | 402.5 | | $ | 779.0 | | $ | 678.1 | | $ | 480.7 | |
Total debt(1) | $ | 2,930.3 | | $ | 2,852.4 | | $ | 2,540.0 | | $ | 2,340.4 | | $ | 2,414.0 | | $ | 2,449.2 | | $ | 1,936.0 | | $ | 1,959.5 | |
| Total capital expenditures incurred | $ | 19.1 | | $ | 21.9 | | $ | 9.2 | | $ | 3.4 | | $ | 9.9 | | $ | 14.3 | | $ | 3.2 | | $ | 0.5 | |
| Total leasing costs and tenant improvements incurred | $ | 4.7 | | $ | 2.4 | | $ | 1.5 | | $ | 2.0 | | $ | 2.9 | | $ | 5.8 | | $ | 0.3 | | $ | 0.2 | |
| | | | | | | | |
Property metrics(4) | | | | | | | | |
| Number of income-producing properties | 128 | 128 | 126 | 122 | 119 | 114 | 110 | 108 |
| GLA, square feet | 59.4 | 58.8 | 57.0 | 55.9 | 55.1 | 53.3 | 51.3 | 50.4 |
| Occupancy, by GLA | 99.6% | 99.1% | 97.8% | 99.7% | 99.7% | 99.2% | 99.3% | 99.1% |
| Weighted average lease term, years | 5.9 | 5.7 | 5.5 | 5.7 | 5.8 | 5.8 | 6.0 | 6.1 |
(1) For definitions of Granite’s non-IFRS measures, refer to the section “NON-IFRS PERFORMANCE MEASURES”.
(2) For definitions of Granite’s non-IFRS ratios, refer to the section “NON-IFRS RATIOS”.
(3) The quarterly financial data reflects fluctuations in revenue, FFO, AFFO, investment properties and total debt primarily from the timing of leasing and development activities, property sales, acquisitions and foreign exchange. Investment properties also fluctuate from the effect of measuring properties at fair value under IFRS. Net income (loss) attributable to unitholders primarily fluctuates from fair value gains/losses on investment properties.
(4) Excludes properties held for sale which are classified as assets held for sale on the combined balance sheet as at the respective quarter-end.
The following table reconciles revenue, as determined in accordance with IFRS, to net operating income - cash basis for the periods ended as indicated. Refer to the sections “RESULTS OF OPERATIONS” and “NON-IFRS PERFORMANCE MEASURES”, for further details.
| | | | | | | | | | | | | | | | | | | | | | | | | | |
| (in millions) | Q4 '22 | Q3 '22 | Q2 '22 | Q1 '22 | Q4 '21 | Q3 '21 | Q2 '21 | Q1 '21 |
| Revenue | $ | 125.6 | | $ | 111.6 | | $ | 109.8 | | $ | 108.6 | | $ | 105.3 | | $ | 98.3 | | $ | 94.0 | | $ | 95.9 | |
| Less: Property operating costs | 23.2 | | 17.6 | | 17.0 | | 17.4 | | 19.0 | | 13.8 | | 13.7 | | 14.4 | |
| NOI | 102.4 | | 94.0 | | 92.8 | | 91.2 | | 86.3 | | 84.5 | | 80.3 | | 81.5 | |
| Add (deduct): | | | | | | | | |
| Straight-line rent amortization | (3.6) | | (1.9) | | (3.5) | | (1.6) | | (1.8) | | (2.2) | | (1.7) | | (3.1) | |
| Tenant incentive amortization | 0.8 | | 1.0 | | 1.1 | | 1.2 | | 1.2 | | 1.3 | | 1.3 | | 1.4 | |
| NOI - cash basis | $ | 99.6 | | $ | 93.1 | | $ | 90.4 | | $ | 90.8 | | $ | 85.7 | | $ | 83.6 | | $ | 79.9 | | $ | 79.8 | |
The following table reconciles net income (loss) attributable to stapled unitholders, as determined in accordance with IFRS, to FFO and AFFO for the periods ended as indicated. Refer to the sections “RESULTS OF OPERATIONS” and “NON-IFRS PERFORMANCE MEASURES”, for further details.
| | | | | | | | | | | | | | | | | | | | | | | | | | |
| (in millions, except as noted) | Q4 '22 | Q3 '22 | Q2 '22 | Q1 '22 | Q4 '21 | Q3 '21 | Q2 '21 | Q1 '21 |
| Net (loss) income attributable to stapled unitholders | $ | (126.3) | | $ | (93.3) | | $ | (122.3) | | $ | 497.7 | | $ | 341.2 | | $ | 421.8 | | $ | 316.9 | | $ | 230.1 | |
| Add (deduct): | | | | | | | | |
| Fair value losses (gains) on investment properties, net | 229.9 | | 229.2 | | 251.3 | | (490.6) | | (349.1) | | (432.2) | | (308.0) | | (209.5) | |
| Fair value (gains) losses on financial instruments | (2.1) | | (1.4) | | (3.3) | | (4.6) | | (0.6) | | 1.3 | | 0.2 | | 0.3 | |
| Loss on sale of investment properties | — | | — | | 0.3 | | 0.4 | | 0.2 | | — | | 0.4 | | 0.2 | |
| Current income tax expense associated with the sale of investment properties | — | | — | | — | | — | | 2.8 | | — | | 2.3 | | — | |
| Deferred income tax (recovery) expense | (24.4) | | (61.3) | | (51.8) | | 66.5 | | 69.9 | | 73.4 | | 49.8 | | 35.9 | |
| Fair value remeasurement of the Executive Deferred Stapled Unit Plan | — | | (1.3) | | (1.4) | | — | | 2.3 | | 0.9 | | 0.6 | | — | |
Fair value remeasurement of the Directors Deferred Stapled Unit Plan(1) | 0.1 | | (1.2) | | (0.7) | | — | | — | | — | | — | | — | |
| Non-controlling interests relating to the above | — | | — | | — | | — | | 0.1 | | — | | — | | 0.1 | |
| FFO | $ | 77.2 | | $ | 70.7 | | $ | 72.1 | | $ | 69.4 | | $ | 66.8 | | $ | 65.2 | | $ | 62.2 | | $ | 57.1 | |
| Add (deduct): | | | | | | | | |
| Maintenance or improvement capital expenditures incurred | (2.7) | | (4.3) | | (0.5) | | (1.1) | | (6.7) | | (0.8) | | (1.4) | | (0.5) | |
| Leasing costs | (4.5) | | (2.0) | | (0.9) | | (2.0) | | — | | (2.3) | | (0.2) | | — | |
| Tenant allowances | (0.2) | | (0.3) | | (0.1) | | — | | (0.3) | | — | | (0.1) | | (0.1) | |
| Tenant incentive amortization | 0.8 | | 1.1 | | 1.1 | | 1.2 | | 1.2 | | 1.3 | | 1.3 | | 1.3 | |
| Straight-line rent amortization | (3.6) | | (1.9) | | (3.5) | | (1.6) | | (1.8) | | (2.2) | | (1.7) | | (3.1) | |
| AFFO | $ | 67.0 | | $ | 63.3 | | $ | 68.2 | | $ | 65.9 | | $ | 59.2 | | $ | 61.2 | | $ | 60.1 | | $ | 54.7 | |
(1) On June 9, 2022, amendments were made to the DSU Plan to allow, at the discretion of the CGN Committee, for the DSUs to be settled in cash or stapled units, equal to the value of the accumulated DSUs at such date. Accordingly, from the amendment date of June 9, 2022, fair value remeasurement of the DSU Plan has been included as adjustment to FFO.
The following table reconciles total debt for the periods ended as indicated. Refer to the sections “Unitholders’ Equity” and “NON-IFRS PERFORMANCE MEASURES”, for further details.
| | | | | | | | | | | | | | | | | | | | | | | | | | |
| (in millions) | Q4 '22 | Q3 '22 | Q2 '22 | Q1 '22 | Q4 '21 | Q3 '21 | Q2 '21 | Q1 '21 |
| Unsecured debt, net | $ | 2,983.6 | | $ | 2,995.9 | | $ | 2,643.5 | | $ | 2,422.3 | | $ | 2,425.1 | | $ | 2,424.9 | | $ | 1,922.4 | | $ | 1,925.2 | |
| Derivatives, net | (138.4) | | (223.1) | | (169.4) | | (126.1) | | (44.1) | | (8.3) | | (19.3) | | 1.4 | |
| Lease obligations | 33.7 | | 33.2 | | 33.3 | | 31.5 | | 32.2 | | 32.6 | | 32.9 | | 32.9 | |
| Total unsecured debt | 2,878.9 | | 2,806.0 | | 2,507.4 | | 2,327.7 | | 2,413.2 | | 2,449.2 | | 1,936.0 | | 1,959.5 | |
| Secured debt | 51.4 | | 46.4 | | 32.6 | | 12.7 | | 0.8 | | — | | — | | — | |
| Total debt | $ | 2,930.3 | | $ | 2,852.4 | | $ | 2,540.0 | | $ | 2,340.4 | | $ | 2,414.0 | | $ | 2,449.2 | | $ | 1,936.0 | | $ | 1,959.5 | |
FORWARD-LOOKING STATEMENTS
This MD&A may contain statements that, to the extent they are not recitations of historical fact, constitute “forward-looking statements” or “forward-looking information” within the meaning of applicable securities legislation, including the United States Securities Act of 1933, as amended, the United States Securities Exchange Act of 1934, as amended, and applicable Canadian securities legislation. Forward-looking statements and forward-looking information may include, among others, statements regarding Granite’s future plans, goals, strategies, intentions, beliefs, estimates, costs, objectives, capital structure, cost of capital, tenant base, tax consequences, economic performance or expectations, or the assumptions underlying any of the foregoing. Words such as “outlook”, “may”, “would”, “could”, “should”, “will”, “likely”, “expect”, “anticipate”, “believe”, “intend”, “plan”, “forecast”, “project”, “estimate”, “seek” and similar expressions are used to identify forward-looking statements and forward-looking information. Forward-looking statements and forward-looking information should not be read as guarantees of future events, performance or results and will not necessarily be accurate indications of whether or the times at or by which such future performance will be achieved. Undue reliance should not be placed on such statements. There can also be no assurance that Granite’s expectations regarding various matters, including the following, will be realized in a timely manner, with the expected impact or at all: the effectiveness of measures intended to mitigate such impact, and Granite’s ability to deliver cash flow stability and growth and create long-term value for unitholders; Granite’s ability to implement its ESG+R program and related targets and goals; the expansion and diversification of Granite’s real estate portfolio and the reduction in Granite’s exposure to Magna and the special purpose properties; Granite’s ability to accelerate growth and to grow its net asset value and FFO and AFFO per unit; Granite’s ability to find and integrate satisfactory acquisition, joint venture and development opportunities and to strategically deploy the proceeds from recently sold properties and financing initiatives; Granite’s sale from time to time of stapled units under its ATM Program; the potential for expansion and rental growth at the properties in Ajax, Ontario and Whitestown, Indiana and the enhancement to the yields of such properties from such potential expansion and rental growth; the expected completion of the two industrial properties in Indiana that Granite has committed to purchase; the construction on and development yield of the 89.0 acre site in Houston, Texas; the development of three modern distribution facilities in Lebanon, Tennessee, and the yield from the development; the development of a 0.4 million square foot distribution facility on the 22.0 acre site in Brantford, Ontario, and the potential yield from the project; the development of a 0.2 million square foot built-to-suit modern distribution facility at a 13.0 acre site in Bolingbrook, Illinois, and the potential yield from the project; the development of a 2.7 million square foot multi-phased business park on the remaining 101.0 acres of land in Houston, Texas and the potential yield from the project; the development of 12.9 acres of land in West Jefferson, Ohio and the potential yield from that project; the development of a 1.3 million square foot multi-phased business park on the remaining 70.0 acre parcel of land in Brantford, Ontario and the potential yield from that project; the development of a 0.2 million square foot modern distribution/logistics facility in Brant County, Ontario and the potential yield of the project; the timing of payment of associated unpaid construction costs and holdbacks; Granite’s ability to dispose of any non-core assets on satisfactory terms; Granite’s ability to meet its target occupancy goals; Granite’s ability to secure sustainability or other certifications for any of its properties; the impact of the refinancing of the term loans on Granite’s returns and cash flow; and the amount of any distributions and distribution increase. Forward-looking statements and forward-looking information are based on information available at the time and/or management’s good faith assumptions and analyses made in light of Granite’s perception of historical trends, current conditions and expected future developments, as well as other factors Granite believes are appropriate in the circumstances. Forward-looking statements and forward-looking information
are subject to known and unknown risks, uncertainties and other unpredictable factors, many of which are beyond Granite’s control, that could cause actual events or results to differ materially from such forward-looking statements and forward-looking information. Important factors that could cause such differences include, but are not limited to, the risk of changes to tax or other laws and treaties that may adversely affect Granite REIT’s mutual fund trust status under the Income Tax Act (Canada) or the effective tax rate in other jurisdictions in which Granite operates; the risks related to Russia’s 2022 invasion of Ukraine that may adversely impact Granite’s operations and financial performance; economic, market and competitive conditions and other risks that may adversely affect Granite’s ability to expand and diversify its real estate portfolio and dispose of any non-core assets on satisfactory terms; and the risks set forth in the “Risk Factors” section in Granite’s AIF for 2022 dated March 8, 2023, filed on SEDAR at www.sedar.com and attached as Exhibit 1 to the Trust’s Annual Report on Form 40-F for the year ended December 31, 2022 filed with the SEC and available online on EDGAR at www.sec.gov, all of which investors are strongly advised to review. The “Risk Factors” section also contains information about the material factors or assumptions underlying such forward-looking statements and forward-looking information. Forward-looking statements and forward-looking information speak only as of the date the statements and information were made and unless otherwise required by applicable securities laws, Granite expressly disclaims any intention and undertakes no obligation to update or revise any forward-looking statements or forward-looking information contained in this MD&A to reflect subsequent information, events or circumstances or otherwise.
| | |
| Audited Combined Financial Statements |
| of Granite Real Estate Investment Trust |
| and Granite REIT Inc. |
| For the years ended December 31, 2022 and 2021 |
| | | | | |
| REPORT OF INDEPENDENT REGISTERED PUBLIC ACCOUNTING FIRM |
To the Board of Trustees and Unitholders of Granite Real Estate Investment Trust and the Board of Directors and Shareholders of Granite REIT Inc.
Opinion on the Financial Statements
We have audited the accompanying combined balance sheets of Granite Real Estate Investment Trust and subsidiaries and Granite REIT Inc. (collectively, the "Trust") as of December 31, 2022 and December 31, 2021, the related combined statements of net income, comprehensive income, unitholders' equity, and cash flows, for each of the two years in the period ended December 31, 2022, and the related notes (collectively referred to as the "financial statements"). In our opinion, the financial statements present fairly, in all material respects, the financial position of the Trust as of December 31, 2022 and 2021, and its financial performance and its cash flows for each of the two years in the period ended December 31, 2022, in conformity with International Financial Reporting Standards as issued by the International Accounting Standards Board.
We have also audited, in accordance with the standards of the Public Company Accounting Oversight Board (United States) (PCAOB), the Trust's internal control over financial reporting as of December 31, 2022, based on criteria established in Internal Control - Integrated Framework (2013) issued by the Committee of Sponsoring Organizations of the Treadway Commission and our report dated March 8, 2023, expressed an unqualified opinion on the Trust's internal control over financial reporting.
Basis for Opinion
These financial statements are the responsibility of the Trust's management. Our responsibility is to express an opinion on the Trust's financial statements based on our audits. We are a public accounting firm registered with the PCAOB and are required to be independent with respect to the Trust in accordance with the U.S. federal securities laws and the applicable rules and regulations of the Securities and Exchange Commission and the PCAOB.
We conducted our audits in accordance with the standards of the PCAOB. Those standards require that we plan and perform the audit to obtain reasonable assurance about whether the financial statements are free of material misstatement, whether due to error or fraud. Our audits included performing procedures to assess the risks of material misstatement of the financial statements, whether due to error or fraud, and performing procedures that respond to those risks. Such procedures included examining, on a test basis, evidence regarding the amounts and disclosures in the financial statements. Our audits also included evaluating the accounting principles used and significant estimates made by management, as well as evaluating the overall presentation of the financial statements. We believe that our audits provide a reasonable basis for our opinion.
Critical Audit Matter
The critical audit matter communicated below is a matter arising from the current-period audit of the financial statements that was communicated or required to be communicated to the audit committee and that (1) relates to accounts or disclosures that are material to the financial statements and (2) involved our especially challenging, subjective, or complex judgments. The communication of critical audit matters does not alter in any way our opinion on the financial statements, taken as a whole, and we are not, by communicating the critical audit matter below, providing a separate opinion on the critical audit matter or on the accounts or disclosures to which it relates.
Fair Value of Investment Properties – Refer to Notes 2(d), 2(o) Estimates and Assumptions (i) and 4 of the financial statements
Critical Audit Matter Description
The Trust has elected the fair value model for all investment properties and, accordingly, measures all investment properties at fair value subsequent to initial recognition on the balance sheet. The Trust primarily uses a discounted cash flow model to estimate the fair value of investment properties. The critical assumptions relating to the Trust's estimates of fair values of investment properties include contractual rents, contractual renewal terms, expected future market rental rates, discount rates that reflect current market uncertainties, capitalization rates and recent investment property prices.
While there are several assumptions that are required to determine the fair value of all investment properties, the critical assumptions with the highest degree of subjectivity and impact on fair values are the expected future market rental rates, discount rates and capitalization rates, otherwise referred to herein as terminal capitalization rates. Auditing these critical assumptions required a high degree of auditor judgment as the estimations made by management contain significant measurement uncertainty. This resulted in an increased extent of audit effort, including the need to involve our fair value specialists.
How the Critical Audit Matter Was Addressed in the Audit
Our audit procedures related to the expected future market rental rates, discount rates and terminal capitalization rates used to determine the fair value of the investment properties included the following, among others:
•Evaluated the effectiveness of controls over determining investment properties’ fair value, including those over the determination of the expected future market rental rates, the discount rates and terminal capitalization rates.
•Evaluated the reasonableness of management’s forecast of expected future market rental rates by comparing management’s forecasts with historical results, internal communications to management and the Board of Trustees and contractual information, where applicable.
•With the assistance of our fair value specialists, evaluated the reasonableness of management’s forecast of expected future market rental rates, discount rates and terminal capitalization rates by considering recent market transactions and industry surveys.
/s/ Deloitte LLP
Chartered Professional Accountants
Licensed Public Accountants
Toronto, Canada
March 8, 2023
We have served as the Trust's auditor since 2012.
| | | | | |
| REPORT OF INDEPENDENT REGISTERED PUBLIC ACCOUNTING FIRM |
To the Board of Trustees and Unitholders of Granite Real Estate Investment Trust and the Board of Directors and Shareholders of Granite REIT Inc.
Opinion on Internal Control over Financial Reporting
We have audited the internal control over financial reporting of Granite Real Estate Investment Trust and subsidiaries and Granite REIT Inc. (collectively, the “Trust") as of December 31, 2022, based on criteria established in Internal Control - Integrated Framework (2013) issued by the Committee of Sponsoring Organizations of the Treadway Commission (COSO). In our opinion, the Trust maintained, in all material respects, effective internal control over financial reporting as of December 31, 2022, based on criteria established in Internal Control - Integrated Framework (2013) issued by COSO.
We have also audited, in accordance with the standards of the Public Company Accounting Oversight Board (United States) (PCAOB), the combined financial statements as at and for the year ended December 31, 2022, of the Trust and our report dated March 8, 2023, expressed an unqualified opinion on those financial statements.
Basis for Opinion
The Trust's management is responsible for maintaining effective internal control over financial reporting and for its assessment of the effectiveness of internal control over financial reporting, included in the accompanying Management's Report on Internal Control over Financial Reporting. Our responsibility is to express an opinion on the Trust’s internal control over financial reporting based on our audit. We are a public accounting firm registered with the PCAOB and are required to be independent with respect to the Trust in accordance with the U.S. federal securities laws and the applicable rules and regulations of the Securities and Exchange Commission and the PCAOB.
We conducted our audit in accordance with the standards of the PCAOB. Those standards require that we plan and perform the audit to obtain reasonable assurance about whether effective internal control over financial reporting was maintained in all material respects. Our audit included obtaining an understanding of internal control over financial reporting, assessing the risk that a material weakness exists, testing and evaluating the design and operating effectiveness of internal control based on the assessed risk, and performing such other procedures as we considered necessary in the circumstances. We believe that our audit provides a reasonable basis for our opinion.
Definition and Limitations of Internal Control over Financial Reporting
A company’s internal control over financial reporting is a process designed to provide reasonable assurance regarding the reliability of financial reporting and the preparation of financial statements for external purposes in accordance with generally accepted accounting principles. A company’s internal control over financial reporting includes those policies and procedures that (1) pertain to the maintenance of records that, in reasonable detail, accurately and fairly reflect the transactions and dispositions of the assets of the company; (2) provide reasonable assurance that transactions are recorded as necessary to permit preparation of financial statements in accordance with generally accepted accounting principles, and that receipts and expenditures of the company are being made only in accordance with authorizations of management and directors of the company; and (3) provide reasonable assurance regarding prevention or timely detection of unauthorized acquisition, use, or disposition of the company’s assets that could have a material effect on the financial statements.
Because of its inherent limitations, internal control over financial reporting may not prevent or detect misstatements. Also, projections of any evaluation of effectiveness to future periods are subject to the risk that controls may become inadequate because of changes in conditions, or that the degree of compliance with the policies or procedures may deteriorate.
/s/ Deloitte LLP
Chartered Professional Accountants
Licensed Public Accountants
Toronto, Canada
March 8, 2023
| | | | | |
| MANAGEMENT'S RESPONSIBILITY FOR FINANCIAL REPORTING |
Management of Granite Real Estate Investment Trust and Granite REIT Inc. (collectively the “Trust”) is responsible for the preparation and presentation of the combined financial statements and all information included in the 2022 Annual Report. The combined financial statements were prepared by management in accordance with International Financial Reporting Standards as issued by the International Accounting Standards Board and where appropriate, reflect estimates based on management’s best judgement in the circumstances. Financial information as presented elsewhere in the 2022 Annual Report has been prepared by management to ensure consistency with information contained in the combined financial statements. The combined financial statements have been audited by independent auditors and reviewed by the Audit Committees and approved by both the Board of Trustees of Granite Real Estate Investment Trust and the Board of Directors of Granite REIT Inc.
Management is responsible for the development and maintenance of systems of internal accounting and administrative controls of high quality. Such systems are designed to provide reasonable assurance that the financial information is accurate, relevant and reliable and that the Trust’s assets are appropriately accounted for and adequately safeguarded. Management has determined that, as at December 31, 2022 and based on the framework set forth in Internal Control - Integrated Framework (2013) issued by the Committee of Sponsoring Organizations of the Treadway Commission, internal control over financial reporting was effective. The Trust’s President and Chief Executive Officer and Chief Financial Officer, in compliance with Section 302 of the U.S. Sarbanes-Oxley Act of 2002 (“SOX”), has provided a SOX-related certification in connection with the Trust’s annual disclosure document in the U.S. (Form 40-F) to the U.S. Securities and Exchange Commission. In accordance with National Instrument 52-109, a similar certification has been provided to the Canadian Securities Administrators.
The Trust’s Audit Committees are appointed by their respective Boards and are comprised solely of outside independent Directors or Trustees. The Audit Committees meet periodically with management, as well as with the independent auditors, to satisfy themselves that each is properly discharging its responsibilities to review the combined financial statements and the independent auditors’ report and to discuss significant financial reporting issues and auditing matters. The Audit Committees report their findings to the Boards for consideration when approving the combined financial statements for issuance to the stapled unitholders.
The combined financial statements and the effectiveness of internal control over financial reporting have been audited by Deloitte LLP, the independent auditors, in accordance with Canadian generally accepted auditing standards and the standards of the Public Company Accounting Oversight Board (United States) on behalf of the stapled unitholders. The Auditors’ Reports outline the nature of their examination and their opinion on the combined financial statements of the Trust and the effectiveness of the Trust’s internal control over financial reporting. The independent auditors have full and unrestricted access to the Audit Committees.
| | | | | |
| |
| Kevan Gorrie | Teresa Neto |
| President and Chief Executive Officer | Chief Financial Officer |
| |
| Toronto, Canada, | |
| March 8, 2023 | |
Combined Balance Sheets
(Canadian dollars in thousands)
| | | | | | | | | | | |
| | | |
| As at December 31, | Note | 2022 | 2021 |
| |
|
|
| ASSETS | | | |
| | | |
| Non-current assets: | | | |
| Investment properties | 4 | $ | 8,839,571 | | $ | 7,971,158 | |
| | | |
| Acquisition deposits | 22 | 8,487 | | 26,053 | |
| Deferred tax assets | 15(c) | 629 | | 4,452 | |
| Fixed assets, net | | 4,037 | | 2,486 | |
| Derivatives | 8(c) | 151,855 | | 62,768 | |
| Loan receivable | 7 | — | | 10,471 | |
| Other assets | 6 | 2,181 | | 2,780 | |
| | 9,006,760 | | 8,080,168 | |
| | | |
| Current assets: | | | |
| Assets held for sale | 5 | | 41,182 | | 64,612 | |
| | | |
| Loan receivable | 7 | | 69,186 | | — | |
| Accounts receivable | | 12,176 | | 10,771 | |
| Income taxes receivable | | 1,288 | | 1,437 | |
| Prepaid expenses and other | | 14,681 | | 7,196 | |
| | | |
| Cash and cash equivalents | 17(d) | 135,081 | | 402,513 | |
| | | |
| Total assets | | $ | 9,280,354 | | $ | 8,566,697 | |
| | | |
| LIABILITIES AND EQUITY | | | |
| | | |
| Non-current liabilities: | | | |
| Unsecured debt, net | 8(a), (b) | $ | 2,583,930 | | $ | 2,425,089 | |
| Derivatives | 8(c) | 6,391 | | 18,624 | |
| Secured debt | 9 | — | | 763 | |
| Long-term portion of lease obligations | 10 | 32,977 | | 31,645 | |
| Deferred tax liabilities | 15(c) | 557,391 | | 604,667 | |
| | 3,180,689 | | 3,080,788 | |
| | | |
| Current liabilities: | | | |
| Unsecured debt, net | 8(a), (b) | 399,707 | | — | |
| Derivatives | 8(c) | 7,076 | | — | |
| Secured debt | 9 | 51,373 | | — | |
| Deferred revenue | 11 | 17,358 | | 12,099 | |
| | | |
| Accounts payable and accrued liabilities | 11 | 114,775 | | 113,244 | |
| Distributions payable | 12 | 16,991 | | 16,969 | |
| Short-term portion of lease obligations | 10 | 746 | | 505 | |
| Income taxes payable | | 11,292 | | 21,558 | |
| | | |
| Total liabilities | | 3,800,007 | | 3,245,163 | |
| | | |
| Equity: | | | |
| Stapled unitholders’ equity | 13 | 5,475,375 | | 5,318,653 | |
| Non-controlling interests | | 4,972 | | 2,881 | |
| Total equity | | 5,480,347 | | 5,321,534 | |
| Total liabilities and equity | | $ | 9,280,354 | | $ | 8,566,697 | |
Commitments and contingencies (note 22) On behalf of the Boards:
See accompanying notes
/s/ Kelly Marshall /s/ Gerald J. Miller
Director/Trustee Director/Trustee
Combined Statements of Net Income
(Canadian dollars in thousands)
| | | | | | | | | | | | | | |
| | | | |
| Years ended December 31, | Note | | | | 2022 | 2021 |
| | | | | | |
| Rental revenue | 14(a) | | | | $ | 455,579 | | $ | 393,488 | |
| | | | | | |
| | | | | | |
| Property operating costs | 14(b) | | | | 75,221 | | 60,812 | |
| Net operating income | | | | | 380,358 | | 332,676 | |
| | | | | | |
| General and administrative expenses | 14(c) | | | | 29,465 | | 38,400 | |
| Depreciation and amortization | | | | | 1,598 | | 1,320 | |
| Interest income | | | | | (1,625) | | (3,109) | |
| Interest expense and other financing costs | 14(d) | | | | 50,967 | | 47,226 | |
| Foreign exchange gains, net | | | | | (1,215) | | (5,110) | |
| Fair value losses (gains) on investment properties, net | 4,5 | | | | 219,728 | | (1,298,865) | |
| Fair value (gains) losses on financial instruments, net | 14(e) | | | | (11,383) | | 1,214 | |
| Loss on sale of investment properties | 5 | | | | 666 | | 761 | |
| Income before income taxes | | | | | 92,157 | 1,550,839 |
| Income tax (recovery) expense | 15 | | | | (63,665) | 240,567 |
| Net income | | | | | $ | 155,822 | | $ | 1,310,272 | |
| | | | | | |
| Net income attributable to: | | | | | | |
| | | | | | |
| Stapled unitholders | | | | | $ | 155,768 | | $ | 1,309,937 | |
| Non-controlling interests | | | | | 54 | | 335 |
| | | | | $ | 155,822 | | $ | 1,310,272 | |
See accompanying notes
Combined Statements of Comprehensive Income
(Canadian dollars in thousands)
| | | | | | | | | | | | | | |
| | | | |
| Years ended December 31, | Note | | | | 2022 | 2021 |
| | | | | | |
Net income | | | | | $ | 155,822 | | $ | 1,310,272 | |
| Other comprehensive income (loss): | | | | | | |
Foreign currency translation adjustment(1) | | | | | 309,410 | | (136,194) | |
Unrealized gain on net investment hedges, including income taxes of nil(1) | 8(c) | | | | 32,244 | 112,235 |
| Total other comprehensive income (loss) | | | | | 341,654 | (23,959) |
| Comprehensive income | | | | | $ | 497,476 | | $ | 1,286,313 | |
(1) Items that may be reclassified subsequently to net income if a foreign subsidiary is disposed of or hedges are terminated or no longer assessed as effective (note 2(h)). |
| | | | | | |
| Comprehensive income attributable to: | | | | | |
| Stapled unitholders | | | | | $ | 497,349 | | $ | 1,285,988 | |
| Non-controlling interests | | | | | 127 | | 325 | |
| | | | | $ | 497,476 | | $ | 1,286,313 | |
| | | | | | |
| | | | | | |
| | | | | | |
| | | | | | |
| | | | | | |
See accompanying notes
Combined Statements of Unitholders' Equity
(Canadian dollars in thousands)
| | | | | | | | | | | | | | | | | | | | | | | | | | |
| | | | | | |
| Year Ended December 31, 2022 | | | | | | |
| Number
of units
(000s) | Stapled units | Contributed surplus | Retained earnings | Accumulated other comprehensive income | Stapled unitholders' equity | Non-
controlling
interests | Equity |
| As at January 1,2022 | 65,694 | | $ | 3,444,418 | | $ | 53,326 | | $ | 1,748,958 | | $ | 71,951 | | $ | 5,318,653 | | $ | 2,881 | | $ | 5,321,534 | |
| Net income | — | | — | | — | | 155,768 | | — | | 155,768 | | 54 | | 155,822 | |
| Other comprehensive income | — | | — | | — | | — | | 341,581 | | 341,581 | | 73 | | 341,654 | |
| Distributions (note 12) | — | | — | | — | | (202,306) | | — | | (202,306) | | (41) | | (202,347) | |
| Contributions from non-controlling interests | — | | — | | — | | — | | — | | — | | 3,417 | | 3,417 | |
| Disposition of non-controlling interests (note 5) | — | | — | | — | | — | | — | | — | | (1,412) | | (1,412) | |
| Units issued under the stapled unit plan (note 13(b)) | 44 | | 4,089 | | — | | — | | — | | 4,089 | | — | | 4,089 | |
| Stapled units issued, net of issuance costs (note 13(e)) | 136 | | 13,115 | | — | | — | | — | | 13,115 | | — | | 13,115 | |
| Units repurchased for cancellation (note 13(c)) | (2,166) | | (113,800) | | (41,725) | | — | | — | | (155,525) | | — | | (155,525) | |
| As at December 31, 2022 | 63,708 | | $ | 3,347,822 | | $ | 11,601 | | $ | 1,702,420 | | $ | 413,532 | | $ | 5,475,375 | | $ | 4,972 | | $ | 5,480,347 | |
| | | | | | | | |
| | | | | | | | |
| | | | | | |
| Year Ended December 31, 2021 | | | | | | |
| Number
of units
(000s) | Stapled units | Contributed surplus | Retained earnings | Accumulated other comprehensive income | Stapled unitholders' equity | Non-
controlling
interests | Equity |
| | | | | | | | |
| As at January 1, 2021 | 61,688 | | $ | 3,139,194 | | $ | 53,326 | | $ | 631,649 | | $ | 95,900 | | $ | 3,920,069 | | $ | 2,135 | | $ | 3,922,204 | |
| Net income | — | | — | | — | | 1,309,937 | | — | | 1,309,937 | | 335 | | 1,310,272 | |
| Other comprehensive loss | — | | — | | — | | — | | (23,949) | | (23,949) | | (10) | | (23,959) | |
| Distributions (note 12) | — | | — | | — | | (192,628) | | — | | (192,628) | | (154) | | (192,782) | |
| Contributions from non-controlling interests | — | | — | | — | | — | | — | | — | | 575 | | 575 | |
| Units issued under the stapled unit plan (note 13(b)) | 27 | | 2,164 | | — | | — | | — | | 2,164 | | — | | 2,164 | |
| Stapled units issued, net of issuance costs (note 13(d)) | 3,979 | | 303,060 | | — | | — | | — | | 303,060 | | — | | 303,060 | |
| As at December 31, 2021 | 65,694 | | $ | 3,444,418 | | $ | 53,326 | | $ | 1,748,958 | | $ | 71,951 | | $ | 5,318,653 | | $ | 2,881 | | $ | 5,321,534 | |
| | | | | |
See accompanying notes
Combined Statements of Cash Flows
(Canadian dollars in thousands)
| | | | | | | | | | | | | | |
| | | | |
| Years ended December 31, | Note | | | | 2022 | 2021 |
| | | | | | |
| OPERATING ACTIVITIES | | | | | | |
| | | | | | |
| Net income | | | | | $ | 155,822 | | $ | 1,310,272 | |
| Items not involving operating cash flows | 17(a) | | | | 135,088 | | (1,051,650) | |
| Current income tax expense | 15(a) | | | | 7,380 | | 11,619 | |
| Income taxes paid | | | | | (18,090) | | (7,039) | |
| Interest expense | | | | | 49,892 | | 41,591 | |
| Interest paid | | | | | (52,494) | | (40,483) | |
| Changes in working capital balances | 17(b) | | | | (102) | | (2,046) | |
| Cash provided by operating activities | | | | | 277,496 | | 262,264 | |
| | | | | | |
| INVESTING ACTIVITIES | | | | | | |
| | | | | | |
| Investment properties: | | | | | | |
| Property acquisitions | 3 | | | | (492,717) | | (925,447) | |
| | | | | | |
| Proceeds from disposals, net | 4, 5 | | | | 63,943 | | 35,428 | |
| Leasing costs paid | | | | | (8,739) | | (6,244) | |
| Tenant allowances paid | | | | | (558) | | (821) | |
| Additions to income-producing properties | | | | | (54,933) | | (28,003) | |
| Additions to properties under development | | | | | (212,245) | | (71,168) | |
| Construction funds (in) released from escrow | | | | | (4,720) | | 8,341 | |
| Loan receivable advances | 7 | | | | (55,780) | | (10,455) | |
| Acquisition deposits paid | | | | | — | | (26,466) | |
| | | | | | |
| Fixed asset additions | | | | | (807) | | (589) | |
| Cash used in investing activities | | | | | (766,556) | | (1,025,424) | |
| | | | | | |
| FINANCING ACTIVITIES | | | | | | |
| | | | | | |
| Monthly distributions paid | | | | | (202,284) | | (191,082) | |
| Proceeds from secured debt | 9 | | | | | 48,439 | | 774 | |
| Proceeds from unsecured credit facility draws | | | | | 254,804 | | — | |
| Repayment of unsecured credit facility draws | | | | | (264,060) | | — | |
| Proceeds from unsecured term loan, net of financing costs | 8(b) | | | | 527,441 | | — | |
| Proceeds from unsecured debenture, net of financing costs | 8(b) | | | | — | | 497,289 | |
| Repayment of unsecured debenture, including early redemption premium | 8(b) | | | | — | | (253,963) | |
| Settlement of cross currency interest rate swap | 8(b), (c) | | | | (6,563) | | (18,787) | |
| Repayment of lease obligations | 10 | | | | | (767) | | (748) | |
| Financing costs paid | | | | | — | | (2,914) | |
| Distributions to non-controlling interests | | | | | (41) | | (154) | |
| Proceeds from stapled unit offerings, net of issuance costs | 13(d), (e) | | | | 13,115 | | 303,060 | |
| Repurchase of stapled units | 13(c) | | | | (155,525) | | — | |
| Cash provided by financing activities | | | | | 214,559 | | 333,475 | |
| | | | | | |
| Effect of exchange rate changes on cash and cash equivalents | | | | | 7,069 | | 918 | |
| Net decrease in cash and cash equivalents during the year | | | | | (267,432) | | (428,767) | |
| Cash and cash equivalents, beginning of year | | | | | 402,513 | | 831,280 | |
| Cash and cash equivalents, end of year | | | | | $ | 135,081 | | $ | 402,513 | |
| | | | | | |
See accompanying notes
Notes to Combined Financial Statements
(All amounts in thousands of Canadian dollars unless otherwise noted)
| | | | | |
| 1. | NATURE AND DESCRIPTION OF THE TRUST |
Effective January 3, 2013, Granite Real Estate Inc. (“Granite Co.”) completed its conversion from a corporate structure to a stapled unit real estate investment trust (“REIT”) structure. All of the common shares of Granite Co. were exchanged, on a one-for-one basis, for stapled units, each of which consists of one unit of Granite Real Estate Investment Trust ("Granite REIT") and one common share of Granite REIT Inc. ("Granite GP"). Granite REIT is an unincorporated, open-ended, limited purpose trust established under and governed by the laws of the province of Ontario and created pursuant to a Declaration of Trust dated September 28, 2012 as subsequently amended and restated on June 9, 2022. Granite GP was incorporated on September 28, 2012 under the Business Corporations Act (British Columbia). Granite REIT, Granite GP and their subsidiaries (together "Granite" or the "Trust") are carrying on the business previously conducted by Granite Co.
The stapled units trade on the Toronto Stock Exchange and on the New York Stock Exchange. The principal office of Granite REIT is 77 King Street West, Suite 4010, P.O. Box 159, Toronto-Dominion Centre, Toronto, Ontario, M5K 1H1, Canada. The registered office of Granite GP is Suite 2600, Three Bentall Centre, 595 Burrard Street, P.O. Box 49314, Vancouver, British Columbia, V7X 1L3, Canada.
The Trust is a Canadian-based REIT engaged in the acquisition, development, ownership and management of logistics, warehouse and industrial properties in North America and Europe.
These combined financial statements were approved by the Board of Trustees of Granite REIT and Board of Directors of Granite GP on March 8, 2023.
| | | | | |
| 2. | SIGNIFICANT ACCOUNTING POLICIES |
The accounting policies described below were applied consistently to all periods presented in these combined financial statements.
(a) Basis of Presentation and Statement of Compliance
The combined financial statements have been prepared in accordance with International Financial Reporting Standards (“IFRS”) as issued by the International Accounting Standards Board (“IASB”).
(b) Combined Financial Statements and Basis of Consolidation
As a result of the REIT conversion described in note 1, the Trust does not have a single parent; however, each unit of Granite REIT and each share of Granite GP trade as a single stapled unit and accordingly, Granite REIT and Granite GP have identical ownership. Therefore, these financial statements have been prepared on a combined basis whereby the assets, liabilities and results of Granite GP and Granite REIT have been combined. The combined financial statements include the subsidiaries of Granite GP and Granite REIT. Subsidiaries are fully consolidated by Granite GP or Granite REIT from the date of acquisition, being the date on which control is obtained. The subsidiaries continue to be consolidated until the date that such control ceases. Control exists when Granite GP or Granite REIT have power, exposure or rights
to variable returns and the ability to use their power over the entity to affect the amount of returns it generates.
All intercompany balances, income and expenses and unrealized gains and losses resulting from intercompany transactions are eliminated.
(c) Trust Units
The stapled units are redeemable at the option of the holder and, therefore, are required to be accounted for as financial liabilities, except where certain exemption conditions are met, in which case redeemable instruments may be classified as equity. The attributes of the stapled units meet the exemption conditions set out in IAS 32, Financial Instruments: Presentation and are, therefore, presented as equity on the combined balance sheets.
(d) Investment Properties
The Trust accounts for its investment properties, which include income-producing properties, properties under development and land held for development, in accordance with IAS 40, Investment Property. For acquired investment properties that meet the definition of a business, the acquisition is accounted for as a business combination (note 2(e)); otherwise they are initially measured at cost including directly attributable expenses. Subsequent to acquisition, investment properties are carried at fair value, which is determined based on available market evidence at the balance sheet date including, among other things, rental revenue from current leases and reasonable and supportable assumptions that represent what knowledgeable, willing parties would assume about rental revenue from future leases less future cash outflows in respect of capital expenditures. Gains and losses arising from changes in fair value are recognized in net income in the period of change.
Income-Producing Properties
The carrying value of income-producing properties includes the impact of straight-line rental revenue (note 2(l)), tenant incentives and deferred leasing costs since these amounts are incorporated in the determination of the fair value of income-producing properties.
When an income-producing property is disposed of, the gain or loss is determined as the difference between the disposal proceeds, net of selling costs, and the carrying amount of the property and is recognized in net income in the period of disposal.
Properties Under Development
The Trust’s development properties are classified as such until the property is substantially completed and available for occupancy. The initial cost of properties under development includes the acquisition cost of the land and direct development or expansion costs, including construction costs, borrowing costs and indirect costs wholly attributable to development. Borrowing costs are capitalized to projects under development or construction based on the average accumulated expenditures outstanding during the period multiplied by the Trust’s average borrowing rate on existing debt. Where borrowings are associated with specific developments, the amount capitalized is the gross borrowing cost incurred on such borrowings less any investment income arising on temporary investment of these borrowings. The capitalization of borrowing costs is suspended if there are prolonged periods that development activity is interrupted. The Trust capitalizes direct and indirect costs, including property taxes and insurance of the development property, if activities necessary to ready the
development property for its intended use are in progress. Costs of internal personnel and other indirect costs that are wholly attributable to a project are capitalized as incurred.
If considered reliably measurable, properties under development are carried at fair value. Properties under development are measured at cost if fair value is not reliably measurable. In determining the fair value of properties under development consideration is given to, among other things, remaining construction costs, development risk, the stage of project completion and the reliability of cash inflows after project completion.
(e)Business Combinations
The Trust accounts for property acquisitions as a business combination if the particular assets and set of activities acquired can be operated and managed as a business in their current state for the purpose of providing a return to the unitholders. In accordance with IFRS 3, Business Combinations, the acquired set of activities and assets in an acquisition must include an input and a substantive process to qualify as a business. IFRS 3 amendments, effective January 1, 2020, provide for an optional concentration test to permit a simplified assessment of whether an acquired set of activities and assets is not a business. The concentration test is met if substantially all of the fair value of the gross assets acquired is concentrated in a single identifiable asset or group of similar identifiable assets. The Trust applies the acquisition method to account for business combinations. The consideration transferred for a business combination is the fair value of the assets transferred, the liabilities incurred to the former owners of the acquiree and the equity interests issued by the Trust. The total consideration includes the fair value of any asset or liability resulting from a contingent consideration arrangement. Identifiable assets acquired as well as liabilities and contingent liabilities assumed in a business combination are initially measured at fair value at the acquisition date.
The Trust recognizes any non-controlling interest in the acquiree on an acquisition-by-acquisition basis, either at fair value or at the non-controlling interest’s proportionate share of the recognized amounts of the acquiree’s identifiable net assets.
Acquisition related costs are expensed as incurred.
Any contingent consideration is recognized at fair value at the acquisition date. Subsequent changes to the fair value of contingent consideration that is recorded as an asset or liability is recognized in net income.
Goodwill is initially measured as the excess of the aggregate of the consideration transferred and the fair value of non-controlling interest over the identifiable net assets acquired. If the consideration transferred is lower than the fair value of the net assets acquired, the difference is recognized in net income.
(f)Assets Held for Sale
Non-current assets (and disposal groups) are classified as held for sale if their carrying amounts will be recovered principally through a sale transaction rather than through continuing use. This condition is satisfied when the asset is available for immediate sale in its present condition, management is committed to the sale and the sale is highly probable to occur within one year.
(g)Foreign Currency Translation
The assets and liabilities of the Trust’s foreign operations are translated into Canadian dollars using exchange rates prevailing at the end of each reporting period. Income and expense
items are translated at the average exchange rates for the period, unless exchange rates fluctuate significantly during that period, in which case, for material transactions, the exchange rates at the dates of those transactions are used. Exchange differences arising are recognized in other comprehensive income and accumulated in equity.
In preparing the financial statements of each entity, transactions in currencies other than the entity’s functional currency (foreign currencies) are recognized at the average rates of exchange prevailing in the period. At the end of each reporting period, monetary items denominated in foreign currencies are retranslated at the rates prevailing at that date. Non-monetary items carried at fair value that are denominated in foreign currencies are retranslated at the rates prevailing at the date when the fair value was determined. Non-monetary items that are measured in terms of historical cost in a foreign currency are not retranslated. Exchange differences on monetary items are recognized in net income in the period in which they arise except for:
•The effective portion of exchange differences on transactions entered into in order to hedge certain foreign currency risks are recognized in other comprehensive income;
•Exchange differences on monetary items receivable from or payable to a foreign operation for which settlement is neither planned nor likely to occur (therefore forming part of the net investment in the foreign operation) are recognized in other comprehensive income; and
•Exchange differences on foreign currency borrowings related to capitalized interest for assets under construction are recognized in investment properties.
(h)Financial Instruments and Hedging
Financial Assets and Financial Liabilities
The following summarizes the Trust’s classification and measurement basis of its financial assets and liabilities:
| | | | | |
| Classification and Measurement Basis |
| Financial assets | |
| |
| Long-term receivables included in other assets | Amortized Cost |
| Derivatives | Fair Value |
| Loan receivable | Amortized Cost |
| Accounts receivable | Amortized Cost |
| |
| Cash and cash equivalents | Amortized Cost |
| |
| Financial liabilities | |
| Unsecured debentures, net | Amortized Cost |
| Unsecured term loans, net | Amortized Cost |
| Secured debt | Amortized Cost |
| Derivatives | Fair Value |
| Accounts payable and accrued liabilities | Amortized Cost |
| Foreign exchange collar contracts | Fair Value |
| Distributions payable | Amortized Cost |
The Trust recognizes an allowance for expected credit losses (“ECL”) for financial assets measured at amortized cost. The impact of the credit loss modeling process is summarized as follows:
•The Trust did not record an ECL allowance against long-term receivables as historical experience of loss on these balances is insignificant and, based on the assessment of forward-looking information, no significant increases in losses are expected. The Trust will continue to assess the valuation of these instruments.
•The Trust did not record an ECL allowance against accounts receivable and loan receivable and has determined that its internal processes of evaluating each receivable on a specific basis for collectability using historical experience and adjusted for forward-looking information, would appropriately allow the Trust to determine if there are significant increases in credit risk to then record a corresponding ECL allowance.
For financial liabilities measured at amortized cost, the liability is amortized using the effective interest rate method. Under the effective interest rate method, any transaction fees, costs, discounts and premiums directly related to the financial liabilities are recognized in net income over the expected life of the obligation.
In regards to modifications to financial liabilities, when a financial liability measured at amortized cost is modified or exchanged, and such modification or exchange does not result in derecognition, the adjustment to the amortized cost of the financial liability as a result of the modification or exchange is recognized in net income.
Derivatives and Hedging
Derivative instruments, such as the cross currency interest rate swaps, interest rate swaps and foreign exchange collar contracts, are recorded in the combined balance sheet at fair value, including those derivatives that are embedded in financial or non-financial contracts. Changes in the fair value of derivative instruments which are not designated as hedges for accounting purposes are recognized in the combined statements of net income. The Trust utilizes derivative financial instruments from time to time in the management of its foreign currency and interest rate exposures. The Trust’s policy is not to utilize derivative financial instruments for trading or speculative purposes.
The Trust applies hedge accounting to certain derivative and non-derivative financial instruments designated as hedges of net investments in subsidiaries with a functional currency other than the Canadian dollar. Hedge accounting is discontinued prospectively when the hedge relationship is terminated or no longer qualifies as a hedge, or when the hedging item is sold or terminated. In a net investment hedging relationship, the effective portion of foreign exchange gains or losses on the hedging instruments is recognized in other comprehensive income and the ineffective portion is recognized in net income. The amounts recorded in accumulated other comprehensive income are recognized in net income when there is a disposition or partial disposition of the foreign subsidiary.
Interest Rate Benchmark Reform
In August 2020, the IASB issued Interest Rate Benchmark Reform – Phase 2 Amendments to IFRS 9, Financial Instruments; IFRS 7, Financial Instruments: Disclosures; IAS 39, Financial Instruments: Recognition and Measurement; IFRS 4, Insurance Contracts and IFRS 16, Leases, which addresses issues that might affect financial reporting once an existing interest rate benchmark is replaced with an alternative benchmark interest rate and provides specific disclosure requirements. The amendments introduce a practical expedient for modifications of
financial instruments, where the basis for determining the contractual cash flows changes as a result of the Interbank Offer Rate (“IBOR”) reform, allowing for prospective application of the alternative benchmark interest rate. In addition, the amendments relate to the application of hedge accounting, providing an exception such that changes in the formal designation and documentation of hedge accounting relationships that are needed to reflect the changes required by IBOR reform do not result in the discontinuation of hedge accounting or the designation of new hedging relationships.
The amendments are effective for annual reporting periods beginning on or after January 1, 2021. As some of the Trust's unsecured debt and related derivatives will be impacted by the IBOR reform, the reformed IFRS guidance has been adopted. However, accounting under the adopted standard will take place once the IBOR related arrangements are modified, which constitutes as an accounting event. As no accounting events have occurred to date, the Trust has determined there is no impact on its combined financial statements as of December 31, 2022. Refer to note 8 for details of the unsecured debt and related derivatives that will be affected by the IBOR reform and progress of the Trust's current transition plan to alternative benchmark interest rates.
(i)Cash and Cash Equivalents
Cash and cash equivalents include cash and short-term investments with original maturities of three months or less.
(j)Fixed Assets
Fixed assets include computer hardware and software, furniture and fixtures and leasehold improvements, which are recorded at cost less accumulated depreciation. Depreciation expense is recorded on a straight-line basis over the estimated useful lives of the fixed assets, which typically range from 3 to 5 years for computer hardware and software and 5 to 7 years for other furniture and fixtures. Leasehold improvements are amortized over the term of the applicable lease. Fixed assets also include right-of-use assets identified in accordance with IFRS 16, Leases. Refer to note 2(k) for the measurement basis of right-of-use assets.
(k)Leases
The Trust recognizes a right-of-use asset and a lease obligation at the lease commencement date, in accordance with IFRS 16, Leases. The Trust accounts for its right-of-use assets that do not meet the definition of investment property as fixed assets. The right-of-use asset is initially measured at cost and, subsequently, at cost less any accumulated depreciation and impairment, and adjusted for certain remeasurements of the lease obligation. When a right-of-use asset meets the definition of investment property, it is initially measured at cost and subsequently measured at fair value (note 2(d)).
The lease liability is initially measured at the present value of the lease payments at the commencement date, discounted using the interest rate implicit in the lease or, if that rate cannot be readily determined, at the Trust’s incremental borrowing rate. Generally, the Trust uses its incremental borrowing rate as the discount rate.
The lease obligation is subsequently increased by the interest cost on the lease liability and decreased by lease payments made. It is remeasured when there is a change in future lease payments arising from a change in an index or rate, a change in the estimate of the amount expected to be payable under a residual value guarantee or, as appropriate, a change in the
assessment of whether a purchase or extension option is reasonably certain to be exercised or a termination option is reasonably certain not to be exercised.
(l)Revenue Recognition
Where Granite has retained substantially all the benefits and risks of ownership of its rental properties, leases with its tenants are accounted for as operating leases. Where substantially all the benefits and risks of ownership of the Trust’s rental properties have been transferred to its tenants, the Trust’s leases are accounted for as finance leases. All of the Trust’s current leases are operating leases.
Revenue from investment properties includes base rents earned from tenants under lease agreements, property tax and operating cost recoveries and other incidental income. Rents from tenants may contain rent escalation clauses or free rent periods which are recognized in revenue on a straight-line basis over the term of the lease. The difference between the revenue recognized and the contractual rent is included in investment properties as straight-line rents receivable. In addition, tenant incentives including cash allowances provided to tenants are recognized as a reduction in rental revenue on a straight-line basis over the term of the lease where it is determined that the tenant fixturing has no benefit to the property beyond the existing tenancy. Property tax and operating cost recoveries from tenants are recognized as revenue in the period in which applicable costs are incurred.
(m) Unit-based Compensation Plans
Incentive Stock Option Plan
Compensation expense for option grants is based on the fair value of the options at the grant date and is recognized over the period from the grant date to the date the award is vested. A liability is recognized for outstanding options based upon the fair value as the Trust is an open- ended trust making its units redeemable. During the period in which options are outstanding, the liability is adjusted for changes in the fair value with such adjustments being recognized as compensation expense in general and administrative expenses in the period in which they occur. The liability balance is reduced as options are exercised and recorded in equity as stapled units along with the proceeds received on exercise.
Executive Deferred Stapled Unit Plan
The executive deferred stapled unit plan is measured at fair value at the date of grant and amortized to compensation expense from the effective date of the grant to the final vesting date. Compensation expense is recognized on a proportionate basis consistent with the vesting features of each tranche of the grant. Compensation expense for executive deferred stapled units granted under the plan is recognized in general and administrative expenses with a corresponding liability recognized based upon the fair value of the Trust’s stapled units as the Trust is an open-ended trust making its units redeemable. During the period in which the executive deferred stapled units are outstanding, for grants with no performance criteria, the liability is adjusted for changes in the market value of the Trust’s stapled unit, and for grants with performance criteria, the liability is measured at fair value using the Monte Carlo simulation model (note 13), with both such adjustments being recognized as compensation expense in general and administrative expenses in the period in which they occur. The liability balance is reduced as deferred stapled units are settled for stapled units and recorded in equity.
Director/Trustee Deferred Share Unit Plan
The compensation expense and a corresponding liability associated with the director/trustee deferred share unit plan are measured based on the market value of the underlying stapled units. During the period in which the awards are outstanding, the liability is adjusted for changes in the market value of the underlying stapled unit, with such positive or negative adjustments being recognized in general and administrative expenses in the period in which they occur. The liability balance is settled for cash or stapled units when a director/trustee ceases to be a member of the Board.
(n)Income Taxes
Operations in Canada
Granite qualifies as a mutual fund trust under the Income Tax Act (Canada) (the “Act”) and as such the Trust itself will not be subject to income taxes provided it continues to qualify as a REIT for purposes of the Act. A REIT is not taxable and not considered to be a Specified Investment Flow-through Trust provided it complies with certain tests and it distributes all of its taxable income in a taxation year to its unitholders.
The Trust’s qualification as a REIT results in no current or deferred income tax being recognized in the combined financial statements for income taxes related to the Canadian investment properties.
Operations in the United States
The Trust’s investment property operations in the United States are conducted in a qualifying United States REIT (“US REIT”) for purposes of the Internal Revenue Code of 1986, as amended. As a qualifying US REIT, it is not taxable provided it complies with certain tests in addition to the requirement to distribute substantially all of its taxable income.
As a qualifying US REIT, current income taxes on U.S. taxable income have not been recorded in the combined financial statements. However, the Trust has recorded deferred income taxes that may arise on the disposition of its investment properties as the Trust will likely be subject to entity level income tax in connection with such transactions pursuant to the Foreign Investment in Real Property Tax Act.
Operations in Europe
The Trust consolidates certain entities that continue to be subject to income tax.
Income taxes for taxable entities in Europe, as well as other entities in Canada or the United States subject to tax, are recorded as follows:
Current Income Tax
The current income tax expense is determined on the basis of enacted or substantively enacted tax rates and laws at each balance sheet date.
Deferred Income Tax
Deferred income tax is recorded, using the liability method, on temporary differences arising between the tax basis of assets and liabilities and the amounts reported on the combined
financial statements. Deferred income tax assets and liabilities are measured at tax rates that are expected to apply to the period when the asset is realized or the liability is settled, based on the tax rates and laws that have been enacted or substantively enacted at the balance sheet date. Deferred income tax assets are recognized to the extent that it is probable that deductions, tax credits or tax losses will be utilized.
Each of the current and deferred tax assets and liabilities are offset when they are levied by the same taxation authority in either the same taxable entity or different taxable entities within the same reporting group that settle on a net basis.
(o)Significant Accounting Judgments, Estimates and Assumptions
The preparation of the combined financial statements requires management to make judgments, estimates and assumptions that affect the reported amounts and disclosures made in the financial statements and accompanying notes.
Management believes that the judgments, estimates and assumptions utilized in preparing the combined financial statements are reasonable and prudent; however, actual results could be materially different and require an adjustment to the reported results.
Judgments
The following are the critical judgments that have been made in applying the Trust’s accounting policies and that have the most significant effect on the amounts recognized in the combined financial statements:
(i) Leases
The Trust’s policy for revenue recognition is described in note 2(l). The Trust makes judgments in determining whether certain leases are operating or finance leases, in particular tenant leases with long contractual terms or leases where the property is a large square-footage and/or architecturally specialized. The Trust also makes judgments in determining the lease term for some lease contracts in which it is a lessee that include renewal or termination options. The assessment of whether the Trust is reasonably certain to exercise such options impacts the lease term which, in turn, significantly affects the amount of lease obligations and right-of-use assets recognized.
(ii) Investment Properties
The Trust’s policy relating to investment properties is described in note 2(d). In applying this policy, judgment is used in determining whether certain costs incurred for tenant improvements are additions to the carrying amount of the property or represent incentives, identifying the point at which practical completion of properties under development occurs and determining borrowing costs to be capitalized to the carrying value of properties under development. Judgment is also applied in determining the use, extent and frequency of independent appraisals.
(iii) Income Taxes
The Trust applies judgment in determining whether it will continue to qualify as a REIT for both Canadian and U.S. tax purposes for the foreseeable future. However, should it at some point no longer qualify, it would be subject to income tax and would be required to recognize current and deferred income taxes.
Estimates and Assumptions
The key assumptions concerning the future and other key sources of estimation uncertainty that have a significant risk of causing a material adjustment to the carrying amounts of assets and liabilities include the following:
(i) Valuation of Investment Properties
The fair value of investment properties is determined by management using primarily the discounted cash flow method in which the income and expenses are projected over the anticipated term of the investment plus a terminal value discounted using an appropriate discount rate. The Trust obtains, from time to time, appraisals from independent qualified real estate valuation experts. However, the Trust does not measure its investment properties based on these appraisals but uses them as data points, together with other external market information accumulated by management, in arriving at its own conclusions on values. Management uses valuation assumptions such as discount rates, terminal capitalization rates and market rental rates applied in external appraisals or sourced from valuation experts; however, the Trust also uses its historical renewal experience with tenants, its direct knowledge of the specialized nature of certain of Granite’s portfolio and tenant profile and the actual condition of the properties in making business judgments about lease renewal probabilities, renewal rents and capital expenditures. The critical assumptions relating to the Trust’s estimates of fair values of investment properties include contractual rents, contractual renewal terms, expected future market rental rates, discount rates that reflect current market uncertainties, capitalization rates and recent investment property prices. If there is any change in these assumptions or regional, national or international economic conditions, the fair value of investment properties may change materially. Refer to note 4 for further information on the estimates and assumptions made by management.
(ii) Fair Value of Financial Instruments
Where the fair value of financial assets or liabilities recorded on the balance sheet or disclosed in the notes cannot be derived from active markets, they are determined using valuation techniques including the discounted cash flow method. The inputs to these models are taken from observable markets where possible, but where this is not feasible, a degree of judgment is required in establishing fair values. The judgments include considerations of inputs such as credit risk and volatility. Changes in assumptions about these factors could materially affect the reported fair value of financial instruments.
(iii) Income Taxes
The Trust operates in a number of countries and is subject to the income tax laws and related tax treaties in each of its operating jurisdictions. These laws and treaties can be subject to different interpretations by relevant taxation authorities. Significant judgment is required in the estimation of Granite’s income tax expense, the interpretation and application of the relevant tax laws and treaties and the provision for any exposure that may arise from tax positions that are under audit by relevant taxation authorities.
The recognition and measurement of deferred tax assets or liabilities is dependent on management’s estimate of future taxable profits and income tax rates that are expected to be in effect in the period the asset is realized or the liability is settled. Any changes in management’s estimate can result in changes in deferred tax assets or liabilities as reported in the combined balance sheets and also the deferred income tax expense in the combined statements of net income.
(p)Future Accounting Policy Changes
As at December 31, 2022, there are no new accounting standards with a material effect issued but not yet applicable to the combined financial statements.
During the years ended December 31, 2022 and 2021, Granite made the following property acquisitions:
| | | | | | | | | | | | | | | | | |
| | | | | |
| 2022 Acquisitions |
| Property | Location | Date acquired | Property purchase price | Transaction
costs | Total acquisition cost |
| | | | | |
| | | | | |
| | | | | |
| | | | | |
| Income-producing properties: | | | | |
| Georg-Beatzel Straße 15 | Wiesbaden, Germany | February 3, 2022 | $ | 62,033 | | $ | 3,919 | | $ | 65,952 | |
| Raiffeisenstraße 28-32 | Korbach, Germany | February 3, 2022 | 60,295 | | 3,819 | | 64,114 | |
| In der Langen Else 4 | Erfurt, Germany | February 3, 2022 | 17,636 | | 1,225 | | 18,861 | |
| 10566 Gateway Pt. | Clayton, IN | April 14, 2022 | 121,258 | | 98 | | 121,356 | |
| 2128 Gateway Pt. | Clayton, IN | April 14, 2022 | 57,886 | | 105 | | 57,991 | |
| 102 Parkshore Dr. | Brampton, ON | May 24, 2022 | 20,850 | | 696 | | 21,546 | |
| 195 Steinway Blvd. | Etobicoke, ON | May 26, 2022 | 17,700 | | 1,266 | | 18,966 | |
| Swaardvenstraat 75 | Tilburg, Netherlands | July 1, 2022 | 102,141 | | 185 | | 102,326 | |
| | | | | |
| | | | | |
| | | 459,799 | 11,313 | 471,112 |
| | | | | |
| Property under development: | | | | |
| 905 Belle Ln. | Bolingbrook, IL | May 5, 2022 | 14,516 | 87 | 14,603 |
| | | | | |
| Development land: | | | | |
| 161 Markel Dr. | Brant County, ON | August 19, 2022 | 6,368 | 210 | 6,578 |
| | | | | |
| | | | | |
| | | | | |
| | | | | |
| | | $ | 480,683 | | $ | 11,610 | | $ | 492,293 | |
| | | | | | | | | | | | | | | | | |
| | | | | |
| 2021 Acquisitions |
| Property | Location | Date acquired | Property purchase price | Transaction
costs | Total acquisition cost |
| | | | | |
| Income-producing properties: | | | | |
3090 Highway 42(1) | Locust Grove, GA | March 12, 2021 | $ | 85,138 | | $ | 401 | | $ | 85,539 | |
| 3801 Rock Creek Blvd. | Joliet, IL | June 25, 2021 | 30,247 | 75 | 30,322 |
| 3900 Rock Creek Blvd. | Joliet, IL | June 25, 2021 | 34,673 | 85 | 34,758 |
| 1695-1701 Crossroads Dr. | Joliet, IL | June 25, 2021 | 50,657 | 118 | 50,775 |
| US Portfolio (four properties): | | | | |
| 1243 Gregory Dr. | Antioch, IL | | | | |
| 60 Logistics Blvd. | Richwood, KY | | | | |
| 8740 South Crossroads Dr. | Olive Branch, MS | | | | |
| 12577 State Line Rd. | Olive Branch, MS | September 3, 2021 | 243,697 | 337 | 244,034 |
| 1600 Rock Creek Blvd. | Joliet, IL | September 7, 2021 | 20,705 | 616 | 21,321 |
| Sophialaan 5 | Utrecht, Netherlands | September 17, 2021 | 42,125 | 3,432 | 45,557 |
| 100 Ronson Dr. | Toronto, ON | December 13, 2021 | 18,436 | 818 | 19,254 |
| 110 Ronson Dr. | Toronto, ON | December 13, 2021 | 16,164 | 1,001 | 17,165 |
| 115 Sinclair Blvd. | Brantford, ON | December 17, 2021 | 66,000 | 1,491 | 67,491 |
| Hazeldonk 6520-6524 | Breda, Netherlands | December 17, 2021 | 87,931 | 7,030 | 94,961 |
| Hazeldonk 6526-6530 | Breda, Netherlands | December 17, 2021 | 54,699 | 4,373 | 59,072 |
| 5400 E. 500 S. | Whitestown, IN | December 22, 2021 | 87,478 | 212 | 87,690 |
| | | 837,950 | 19,989 | 857,939 |
| Properties under development: | | | | |
| 2120 Logistics Way | Murfreesboro, TN | June 30, 2021 | 17,308 | 213 | 17,521 |
| Highway 109 | Lebanon, TN | September 8, 2021 | 6,505 | | 67 | | 6,572 | |
| | | 23,813 | | 280 | | 24,093 | |
| Development land: | | | | | |
| 375/395 Hardy Rd. | Brantford, ON | August 16, 2021 | 62,201 | | 1,491 | | 63,692 | |
| | | $ | 923,964 | | $ | 21,760 | | $ | 945,724 | |
| | | | | |
| | | | | |
| | | | | |
| | | | | |
| | | | | |
| | | | | |
| | | | | |
| | | | | |
| | | | | |
| | | | | |
| | | | | |
| | | | | |
| | | | | |
| | | | | |
| | | | | |
| | | | | |
| | | | | |
| | | | | |
| | | | | |
| | | | |
| | | | | |
| | | | | |
| | | | | |
| | | | | |
| | | | |
| | | | | |
| | | | | |
(1) The Trust acquired the leasehold interest in the property which resulted in the recognition of a right-of-use asset, including transaction costs, of $85,539. The Trust will acquire freehold title to the property on December 1, 2028.
During the year ended December 31, 2022, transaction costs of $11.6 million (2021 — $21.8 million), which included land transfer taxes, and legal and advisory costs, were first capitalized to the cost of the respective properties and then subsequently expensed to net fair value losses (gains) on investment properties on the combined statements of net income as a result of measuring the properties at fair value.
| | | | | | | | |
| | |
| As at December 31, | 2022 | 2021 |
| | |
| Income-producing properties | $ | 8,486,105 | | $ | 7,727,368 | |
| Properties under development | 272,504 | | 162,817 | |
| Land held for development | 80,962 | | 80,973 | |
| $ | 8,839,571 | | $ | 7,971,158 | |
Changes in investment properties are shown in the following table:
| | | | | | | | | | | | | | | | | | | | |
| | |
| Years ended December 31, | 2022 | 2021 |
| | |
| Income-producing properties | Properties under development | Land held for development | Income-producing properties | Properties
under development | Land held for development |
| Balance, beginning of year | $ | 7,727,368 | | $ | 162,817 | | $ | 80,973 | | $ | 5,786,338 | | $ | 31,488 | | $ | 37,757 | |
| Maintenance or improvements | 9,680 | | — | | — | | 10,897 | | — | | — | |
| Leasing costs | 10,153 | | — | | — | | 2,456 | | 3,298 | | — | |
| Tenant allowances | 574 | | — | | — | | 3,439 | | — | | — | |
| Developments or expansions | 43,940 | | 228,099 | | 2,853 | | 8,726 | | 88,729 | | 1,906 | |
| Acquisitions (note 3) | 471,112 | | 14,603 | | 6,578 | | 857,939 | | 24,093 | | 63,692 | |
| | | | | | |
| Costs to complete acquired property | — | | — | | — | | 8,344 | | — | | — | |
| Disposals | — | | — | | — | | (36,793) | | — | | — | |
| Transfer to properties under development | — | | 17,549 | | (17,549) | | — | | 16,812 | | (16,812) | |
| Transfer to income-producing properties | 223,040 | | (223,040) | | — | | — | | — | | — | |
| | | | | | |
| | | | | | |
| Amortization of straight-line rent | 10,591 | | — | | — | | 8,889 | | — | | — | |
| Amortization of tenant allowances | (4,149) | | — | | — | | (5,105) | | — | | — | |
| Other changes | 374 | | 21 | | 14 | | 350 | | — | | — | |
| Fair value (losses) gains, net | (285,127) | | 56,536 | | 6,929 | | 1,300,499 | | (280) | | (1,354) | |
| Foreign currency translation, net | 321,078 | | 15,919 | | 1,164 | | (157,468) | | (1,323) | | (747) | |
| Classified as assets held for sale (note 5) | (42,529) | | — | | — | | (61,143) | | — | | (3,469) | |
| Balance, end of year | $ | 8,486,105 | | $ | 272,504 | | $ | 80,962 | | $ | 7,727,368 | | $ | 162,817 | | $ | 80,973 | |
The Trust determines the fair value of an income-producing property based upon, among other things, rental income from current leases and assumptions about rental income from future leases reflecting market conditions and lease renewals at the applicable balance sheet dates, less future cash outflows in respect of such leases. Fair values are primarily determined by discounting the expected future cash flows, generally over a term of 10 years, plus a terminal value based on the application of a capitalization rate to estimated year 11 cash flows. The fair values of properties under development are measured using a discounted cash flow model, net of costs to complete, as of the balance sheet date. The Trust measures its investment properties using valuations prepared by management. The Trust does not measure its investment properties based on valuations prepared by external appraisers but uses such external appraisals as data points, together with other external market information accumulated by management, in arriving at its own conclusions on values. Management uses
valuation assumptions such as discount rates, terminal capitalization rates and market rental rates applied in external appraisals or sourced from valuation experts; however, the Trust also uses its historical renewal experience with tenants, its direct knowledge of the specialized nature of certain of Granite's portfolio and tenant profile and its knowledge of the actual condition of the properties in making business judgments about lease renewal probabilities, renewal rents and capital expenditures. There has been no change in the valuation methodology during the year.
Included in investment properties as at December 31, 2022 is $48.6 million (2021 — $35.7 million) of net straight-line rent receivables arising from the recognition of rental revenue on a straight-line basis over the lease term.
Details about contractual obligations to purchase, construct and develop properties can be found in the commitments and contingencies note (note 22).
Tenant minimum rental commitments payable to Granite on non-cancellable operating leases as at December 31, 2022 are as follows:
| | | | | |
| 2023 | $ | 413,975 | |
| 2024 | 365,694 | |
| 2025 | 338,939 | |
| 2026 | 298,168 | |
| 2027 | 267,601 | |
| 2028 and thereafter | 1,111,127 | |
| $ | 2,795,504 | |
Valuations are most sensitive to changes in discount rates and terminal capitalization rates. The key valuation metrics for income-producing properties by country are set out below:
| | | | | | | | | | | | | | | | | | | | | | | |
| | | |
| As at December 31, | 2022(1) | | 2021(1) |
| Weighted
average(2) | Maximum | Minimum | | Weighted
average(2) | Maximum | Minimum |
| Canada | | | | | | | |
| Discount rate | 6.26 | % | 7.25 | % | 5.25 | % | | 5.14 | % | 6.50 | % | 4.50 | % |
| Terminal capitalization rate | 5.19 | % | 6.50 | % | 4.25 | % | | 4.54 | % | 5.75 | % | 4.00 | % |
| | | | | | | |
| United States | | | | | | | |
| Discount rate | 6.45 | % | 10.25 | % | 5.50 | % | | 5.54 | % | 9.25 | % | 4.75 | % |
| Terminal capitalization rate | 5.57 | % | 9.25 | % | 4.75 | % | | 4.79 | % | 8.50 | % | 3.75 | % |
| | | | | | | |
| Germany | | | | | | | |
| Discount rate | 6.48 | % | 11.00 | % | 4.90 | % | | 6.48 | % | 9.75 | % | 4.90 | % |
| Terminal capitalization rate | 5.50 | % | 10.00 | % | 4.30 | % | | 5.38 | % | 8.75 | % | 3.90 | % |
| | | | | | | |
| Austria | | | | | | | |
| Discount rate | 8.59 | % | 9.90 | % | 8.15 | % | | 8.28 | % | 9.50 | % | 7.90 | % |
| Terminal capitalization rate | 7.32 | % | 7.90 | % | 6.75 | % | | 7.16 | % | 7.65 | % | 6.65 | % |
| | | | | | | |
| Netherlands | | | | | | | |
| Discount rate | 5.43 | % | 6.85 | % | 4.75 | % | | 4.44 | % | 6.25 | % | 3.60 | % |
| Terminal capitalization rate | 5.73 | % | 8.50 | % | 5.00 | % | | 4.94 | % | 7.40 | % | 3.80 | % |
| | | | | | | |
| | | | | | | |
| | | | | | | |
| | | | | | | |
| | | | | | | |
| Total | | | | | | | |
| Discount rate | 6.50 | % | 11.00 | % | 4.75 | % | | 5.67 | % | 9.75 | % | 3.60 | % |
| Terminal capitalization rate | 5.66 | % | 10.00 | % | 4.25 | % | | 5.03 | % | 8.75 | % | 3.75 | % |
| | | | | | | |
| | | | | | | |
(1)Excludes assets held for sale (note 5).
(2)Weighted based on income-producing property fair value.
The table below summarizes the sensitivity of the fair value of income-producing properties to changes in either the discount rate or terminal capitalization rate:
| | | | | | | | | | | | | | | | | | | | |
| Discount Rate | Terminal Capitalization Rate |
| Rate sensitivity | Fair value | Change in fair value | Fair value | Change in fair value |
| +50 basis points | $ | 8,166,669 | | | $ | (319,436) | | $ | 8,043,519 | | | $ | (442,586) | |
| +25 basis points | 8,324,712 | | | (161,393) | | 8,255,203 | | | (230,902) | |
| Base rate | 8,486,105 | | | — | | 8,486,105 | | | — | |
| -25 basis points | 8,652,412 | | | 166,307 | | 8,740,637 | | | 254,532 | |
| -50 basis points | $ | 8,822,283 | | | $ | 336,178 | | $ | 9,020,938 | | | $ | 534,833 | |
| | | | | |
| 5. | ASSETS HELD FOR SALE AND DISPOSITIONS |
Assets Held for Sale
At December 31, 2022, two income-producing properties located in Canada and the United States having a total fair value of $41.2 million were classified as assets held for sale, and are expected to be disposed within the next 12 months. At December 31, 2021, two income-
producing properties and one piece of land located in Poland and the Czech Republic having a total fair value of $64.6 million were classified as assets held for sale.
Dispositions
During the year ended December 31, 2022, Granite disposed of two income-producing properties and one piece of land located in Poland and the Czech Republic. The details of the disposed properties and land are as follows:
| | | | | | | | | | | |
| Property | Location | Date disposed | Sale price |
| 10 Topolowa | Mirków, Poland | February 18, 2022 | $ | 34,486 | |
378 10 Hospodářský Park, České Velenice(1) | Třeboň, Czech Republic | June 9, 2022 | 31,535 | |
| | | $ | 66,021 | |
| | | |
| | | |
| | | |
(1)In conjunction with the disposal of the income-producing property, the associated carrying value of the non- controlling interest of $1.4 million was derecognized on June 9, 2022.
During the year ended December 31, 2021, Granite disposed of three income-producing properties located in the United Kingdom and Austria for gross proceeds totaling $36.8 million.
During the year ended December 31, 2022, Granite incurred $0.7 million (2021 — $0.8 million) of broker commissions and legal and advisory costs associated with the disposals which are included in loss on sale of investment properties on the combined statements of net income.
The following table summarizes the fair value changes in properties classified as assets held for sale:
| | | | | | | | | |
| | | |
| Years ended December 31, | 2022 | 2021 | |
| Balance, beginning of year | $ | 64,612 | | $ | — | | |
| Fair value gains, net | 1,934 | | — | | |
| Foreign currency translation, net | (1,877) | | — | | |
| Other changes | 5 | | — | | |
| | | |
| Disposals | (66,021) | | — | | |
| Classified as assets held for sale | 42,529 | | 64,612 | | |
| Balance, end of year | $ | 41,182 | | $ | 64,612 | | |
| | | | | | | | |
| | |
| As at December 31, | 2022 | 2021 |
| | |
| Deferred financing costs associated with the revolving credit facility | $ | 1,890 | | $ | 2,472 | |
| Long-term receivables | 291 | | 308 | |
| $ | 2,181 | | $ | 2,780 | |
The loan receivable represents a loan to the developer of two industrial properties being constructed in Indiana, United States. As at December 31, 2022, the loan balance is $69.2 million (US$51.1 million). The loan, due upon completion of the development which is expected to be completed in the next 12 months, is secured by the properties under construction and related land for which Granite has a commitment to purchase upon completion (note 22(b)). As at December 31, 2021, the loan balance was $10.5 million (US$8.3 million) and was included in non-current assets on the combined balance sheet.
| | | | | |
| 8. | UNSECURED DEBT AND RELATED DERIVATIVES |
(a)Unsecured Revolving Credit Facility
The Trust has an unsecured revolving credit facility (the ‘‘Credit Facility’’) with a limit of $1.0 billion, maturing March 31, 2026. Draws on the Credit Facility are available by way of Canadian dollar, US dollar or Euro denominated loans or Canadian dollar or US dollar denominated letters of credit. The Credit Facility provides Granite the ability to increase the amount of the commitment by an additional aggregate principal amount of up to $500.0 million with the consent of the participating lenders. As at December 31, 2022, the Trust had no amounts drawn (2021 — nil) on the Credit Facility and $3.5 million (2021 — $1.7 million) in letters of credit issued against the Credit Facility.
On March 3, 2023, Granite amended the Credit Facility to extend the maturity date for a new five-year term to March 31, 2028 (note 23(b)). Included in the amendment, Granite also updated the benchmark rates from the London Interbank Offered Rate ("LIBOR") to the Secured Overnight Financing Rate ("SOFR"), including a fixed spread for the basis difference between LIBOR and SOFR, for US dollar denominated draws and from LIBOR to the Euro Interbank Offered Rate ("EURIBOR") for Euro denominated draws. Such amendments to the benchmark rates result in no economic impact to Granite’s borrowing rates. As it is anticipated that the administrator of the Canadian Dollar Offered Rate ("CDOR") will cease publication of CDOR by June 28, 2024 and the Canadian financial benchmark will be replaced by the Canadian Overnight Repo Rate Average ("CORRA"), Granite's Credit Facility contains fallback provisions to transition from CDOR to CORRA for Canadian denominated draws when CDOR is discontinued.
(b) Unsecured Debentures and Term Loans, Net
| | | | | | | | | | | | | | | | | |
| | |
| As at December 31, | | 2022 | | 2021 |
| Maturity Date | Amortized Cost(1) | Principal
issued and outstanding | Amortized Cost(1) | Principal
issued and outstanding |
| 2023 Debentures | November 30, 2023 | $ | 399,707 | | $ | 400,000 | | $ | 399,387 | | $ | 400,000 | |
| 2027 Debentures | June 4, 2027 | 498,057 | | 500,000 | | 497,618 | | 500,000 | |
| 2028 Debentures | August 30, 2028 | 497,806 | | 500,000 | | 497,420 | | 500,000 | |
| 2030 Debentures | December 18, 2030 | 497,616 | | 500,000 | | 497,317 | | 500,000 | |
| 2024 Term Loan | December 19, 2024 | 250,088 | | 250,351 | | 233,740 | | 234,136 | |
| 2025 Term Loan | September 15, 2025 | 540,677 | | 541,300 | | — | | — | |
| 2026 Term Loan | December 11, 2026 | 299,686 | | 300,000 | | 299,607 | | 300,000 | |
| | $ | 2,983,637 | | $ | 2,991,651 | | $ | 2,425,089 | | $ | 2,434,136 | |
(1)The amounts outstanding are net of deferred financing costs and, in the case of the term loans, debt modification losses. The deferred financing costs and debt modification losses are amortized using the effective interest method and are included in interest expense.
| | | | | | | | |
| As at December 31, | 2022 | 2021 |
| Unsecured Debentures and Term Loans, Net | | |
| Non-current | $ | 2,583,930 | | $ | 2,425,089 | |
| Current | 399,707 | | — | |
| $ | 2,983,637 | | $ | 2,425,089 | |
2021 Debentures
On January 4, 2021, Granite REIT Holdings Limited Partnership ("Granite LP"), a wholly-owned
subsidiary of Granite, redeemed in full the outstanding $250.0 million aggregate principal amount of the 2021 Debentures. Upon redemption in 2021, Granite incurred an early redemption premium of $4.0 million, which had been recorded in interest expense and other financing costs in the combined statement of net income (note 14(d)). In conjunction with the redemption, the 2021 Cross Currency Interest Rate Swap was terminated on January 4, 2021, and the related mark to market liability of $18.8 million was settled.
2023 Debentures
On December 20, 2016, Granite LP issued $400.0 million aggregate principal amount of 3.873% Series 3 senior debentures due November 30, 2023 (the “2023 Debentures”) at a nominal premium. Interest on the 2023 Debentures is payable semi-annually in arrears on May 30 and November 30 of each year. Deferred financing costs of $2.2 million were incurred and recorded as a reduction against the principal owing.
The 2023 Debentures are redeemable, in whole or in part, at Granite’s option at any time and from time to time, at a price equal to accrued and unpaid interest plus the greater of (a) 100% of the principal amount of the 2023 Debentures to be redeemed; and (b) the Canada Yield Price. The Canada Yield Price means, in respect of a 2023 Debenture, a price equal to which, if the 2023 Debenture were to be issued at such price on the redemption date, would provide a yield thereon from the redemption date to its maturity date equal to 62.5 basis points above the yield that a non-callable Government of Canada bond, trading at par, would carry if issued on the redemption date with a maturity date of November 30, 2023. Granite also has the
option to redeem the 2023 Debentures at par plus any accrued and unpaid interest within two months of the maturity date of November 30, 2023.
2027 Debentures
On June 4, 2020, Granite LP issued at par $500.0 million aggregate principal amount of 3.062% Series 4 senior debentures due June 4, 2027 (the “2027 Debentures”). Interest on the 2027 Debentures is payable semi-annually in arrears on June 4 and December 4 of each year. Deferred financing costs of $3.0 million were incurred in connection with the issuance of the 2027 Debentures and are recorded as a reduction against the principal owing.
The 2027 Debentures are redeemable, in whole or in part, at Granite’s option at any time and from time to time, at a price equal to accrued and unpaid interest plus the greater of (a) 100% of the principal amount of the 2027 Debentures to be redeemed; and (b) the Canada Yield Price. The Canada Yield Price means, in respect of a 2027 Debenture, a price equal to which, if the 2027 Debenture were to be issued at such price on the redemption date, would provide a yield thereon from the redemption date to its maturity date equal to 65.0 basis points above the yield that a non-callable Government of Canada bond, trading at par, would carry if issued on the redemption date with a maturity date of June 4, 2027. Granite also has the option to redeem the 2027 Debentures at par plus any accrued and unpaid interest within two months of the maturity date of June 4, 2027.
2028 Debentures
On August 30, 2021, Granite LP issued at par $500.0 million aggregate principal amount of 2.194% Series 6 senior unsecured debentures due August 30, 2028 (the “2028 Debentures”). Interest on the 2028 Debentures is payable semi-annually in arrears on February 28 and August 30 of each year. Deferred financing costs of $2.7 million were incurred in connection with the issuance of the 2028 Debentures and are recorded as a reduction against the principal owing.
The 2028 Debentures are redeemable, in whole or in part, at Granite’s option at any time and from time to time, at a price equal to accrued and unpaid interest plus the greater of (a) 100% of the principal amount of the 2028 Debentures to be redeemed; and (b) the Canada Yield Price. The Canada Yield Price means, in respect of a 2028 Debenture, a price equal to which, if the 2028 Debenture were to be issued at such price on the redemption date, would provide a yield thereon from the redemption date to its maturity date equal to 28.5 basis points above the yield that a non-callable Government of Canada bond, trading at par, would carry if issued on the redemption date with a maturity date of August 30, 2028. Granite also has the option to redeem the 2028 Debentures at par plus any accrued and unpaid interest within two months of the maturity date of August 30, 2028.
2030 Debentures
On December 18, 2020, Granite LP issued at par $500.0 million aggregate principal amount of 2.378% Series 5 senior debentures due December 18, 2030 (the “2030 Debentures”). Interest on the 2030 Debentures is payable semi-annually in arrears on June 18 and December 18 of each year. Deferred financing costs of $3.0 million were incurred in connection with the issuance of the 2030 Debentures and are recorded as a reduction against the principal owing.
The 2030 Debentures are redeemable, in whole or in part, at Granite’s option at any time and from time to time, at a price equal to accrued and unpaid interest plus the greater of (a) 100% of the principal amount of the 2030 Debentures to be redeemed; and (b) the Canada Yield Price. The Canada Yield Price means, in respect of a 2030 Debenture, a price equal to which, if
the 2030 Debenture were to be issued at such price on the redemption date, would provide a yield thereon from the redemption date to its maturity date equal to 39.5 basis points above the yield that a non-callable Government of Canada bond, trading at par, would carry if issued on the redemption date with a maturity date of December 18, 2030. Granite also has the option to redeem the 2030 Debentures at par plus any accrued and unpaid interest within three months of the maturity date of December 18, 2030.
2024 Term Loan
On December 19, 2018, Granite LP entered into and fully drew upon a US$185.0 million senior unsecured non-revolving term facility that originally matured on December 19, 2022. On October 10, 2019, Granite refinanced the US$185.0 million term facility and extended the maturity date two years to December 19, 2024 (the “2024 Term Loan”). The 2024 Term Loan is fully prepayable without penalty. Any amount repaid may not be re-borrowed. Interest on drawn amounts is calculated based on LIBOR plus an applicable margin determined by reference to the external credit rating of Granite LP and is payable monthly in arrears. Deferred financing costs of $0.8 million were incurred and are recorded as a reduction against the principal owing.
In conjunction with the extension, the previously existing cross currency interest rate swap associated with the term facility was terminated on September 24, 2019 and blended into a new cross currency interest rate swap (note 8(c)).
As the Federal Reserve Board has identified that the publication of the remainder of the US dollar LIBOR benchmark rates will be discontinued on June 30, 2023 and will be replaced by SOFR, Granite intends to amend the 2024 Term Loan and 2024 Cross Currency Interest Rate Swap before the end of June 2023 to update the benchmark rates in these agreements from LIBOR to SOFR without any economic impact.
2025 Term Loan
On September 15, 2022, Granite LP entered into and fully drew upon a US$400.0 million senior unsecured non-revolving term facility that will mature on September 15, 2025 (the “2025 Term Loan”). The 2025 Term Loan is fully prepayable without penalty. Any amount repaid may not be re-borrowed. Interest on drawn amounts is calculated based on the SOFR plus an applicable margin determined by reference to the external credit rating of Granite LP and is payable monthly in arrears. Deferred financing costs of $0.7 million were incurred and are recorded as a reduction against the principal owing.
2026 Term Loan
On December 12, 2018, Granite LP entered into and fully drew upon a $300.0 million senior unsecured non-revolving term facility that originally matured on December 12, 2025. On November 27, 2019, Granite refinanced the $300.0 million term facility and extended the maturity date one year to December 11, 2026 (the “2026 Term Loan”). The 2026 Term Loan is fully prepayable without penalty. Any amount repaid may not be re-borrowed. Interest on drawn amounts is calculated based on the Canadian Dollar Offered Rate (“CDOR”) plus an applicable margin determined by reference to the external credit rating of Granite LP and is payable monthly in advance. Deferred financing costs of $1.5 million were incurred and are recorded as a reduction against the principal owing.
In conjunction with the extension, the previously existing cross currency interest rate swap associated with the term facility was settled on November 27, 2019 and a new cross currency interest rate swap was entered into (note 8(c)).
As a result of the anticipated cessation of the publication of CDOR by June 28, 2024 and the Canadian financial benchmark being replaced by CORRA, Granite intends to amend the 2026 Term Loan and 2026 Cross Currency Interest Rate Swap before the end of June 2024 to update the benchmark rates in these agreements from CDOR to CORRA without any economic impact.
The 2023 Debentures, 2027 Debentures, 2028 Debentures, 2030 Debentures, 2024 Term Loan, 2025 Term Loan and 2026 Term Loan rank pari passu with all of Granite LP’s other existing and future senior unsecured indebtedness and are guaranteed by Granite REIT and Granite GP.
(c) Derivatives
| | | | | | | | | | | | | | | | | | | | | | | | | | | | | | | | | | | | | | | |
| | | | | | | | | | | | | |
| As at December 31, | | | | | | | | | | | 2022 | 2021 |
| | | | | | | | | |
| Notional amount to be paid | Interest payment rate | | Notional amount to be received | Interest receipt rate | | Maturity date | | | Fair value assets (liabilities) | Fair value assets (liabilities) |
| 2023 Cross Currency Interest Rate Swap | 281,100 | | EUR | 2.430 | % | | 400,000 | | CAD | 3.873 | % | | Nov. 30, 2023 | | | $ | (7,076) | | $ | (6,551) | |
| 2024 Cross Currency Interest Rate Swap | 168,200 | | EUR | 0.522 | % | | 185,000 | | USD | LIBOR plus margin | | Dec. 19, 2024 | | | 24,891 | | (5,056) | |
2025 Interest Rate Swap (1) | — | | — | | — | | | — | | — | | — | | | Sept. 15, 2025 | | | 5,244 | | — | |
| 2026 Cross Currency Interest Rate Swap | 205,500 | | EUR | 1.355 | % | | 300,000 | | CAD | CDOR plus margin | | Dec. 11, 2026 | | | 39,264 | | 7,844 | |
| 2027 Cross Currency Interest Rate Swap | 370,300 | | USD | 2.964 | % | | 500,000 | | CAD | 3.062 | % | | June 4, 2027 | | | 8,123 | | 28,752 | |
2028 Cross Currency Interest Rate Swap (2) | 397,000 | | USD | 2.096 | % | | 500,000 | | CAD | 2.194 | % | | Aug. 30, 2028 | | | — | | (7,017) | |
| 2028 Cross Currency Interest Rate Swap | 119,100 | | USD | 2.096 | % | | 150,000 | | CAD | 2.194 | % | | Aug. 30, 2028 | | | (6,391) | | — | |
2028 Cross Currency Interest Rate Swap (2) | 242,100 | | EUR | 0.536 | % | | 350,000 | | CAD | 2.194 | % | | Aug. 30, 2028 | | | 19,450 | | — | |
| 2030 Cross Currency Interest Rate Swap | 319,400 | | EUR | 1.045 | % | | 500,000 | | CAD | 2.378 | % | | Dec. 18, 2030 | | | 54,883 | | 26,172 | |
| | | | | | | | | | | | $ | 138,388 | | $ | 44,144 | |
(1)On September 15, 2022, Granite LP entered into a float to fixed interest rate swap (the “2025 Interest Rate Swap”) to exchange the floating SOFR portion of the interest payments of the 2025 Term Loan for fixed interest payments resulting in an all-in fixed interest rate of 5.016%.
(2)On February 3, 2022, Granite terminated $350.0 million of a total $500.0 million principal of the 2028 Cross Currency Interest Rate Swap and simultaneously entered into a new $350.0 million cross-currency interest rate swap maturing August 30, 2028, to exchange the Canadian dollar denominated principal and interest payments of the 2028 Debentures for Euro denominated payments at a fixed interest rate of 0.536%. Upon termination, Granite paid $6.6 million to settle the mark-to-market liability relating to the $350.0 million principal portion of the 2028 Cross Currency Interest Rate Swap.
| | | | | | | | |
| As at December 31, | 2022 | 2021 |
| Financial assets at fair value | | |
| Non-current | $ | 151,855 | | $ | 62,768 | |
| Current | — | | — | |
| $ | 151,855 | | $ | 62,768 | |
| | | | | | | | |
| Financial liabilities at fair value | | |
| Non-current | $ | 6,391 | | $ | 18,624 | |
| Current | 7,076 | | — | |
| $ | 13,467 | | $ | 18,624 | |
For the year ended December 31, 2022, the cross currency interest rate swaps, the combination of the 2025 Term Loan and 2025 Interest Rate Swap and the US dollar draws under the Credit Facility are designated as net investment hedges of the Trust’s investments in foreign operations. The effectiveness of the hedges is assessed quarterly. Gains and losses associated with the effective portion of the hedges are recognized in other comprehensive income. For the year ended December 31, 2022, the Trust has assessed the net investment hedge associated with each cross currency interest rate swap, the combination of the 2025 Term Loan and 2025 Interest Rate Swap and the US dollar draws under the Credit Facility, except for a portion of the 2024 Cross Currency Interest Rate Swap and a portion of the combination of the 2025 Term Loan and 2025 Interest Rate Swap, to be effective.
For the year ended December 31, 2022, a net fair value gain of $13.8 million has been recognized in fair value (gains) losses on financial instruments, net (note 14(e)) in the combined statement of net income, due to ineffectiveness relating to the interest rate portion of certain hedging relationships described above.
The Trust has elected to record the differences resulting from the interest rates associated with the derivatives in the combined statements of net income.
On December 17, 2021, Granite entered into a secured construction loan relating to a development project in Texas, United States. The loan has a maximum draw amount of $59.9 million (US$44.3 million) and is secured by the property under construction and related land. The loan matures on December 17, 2023 and bears interest at the US prime rate minus 90 basis points. Granite has the option to extend the maturity date to December 17, 2024, subject to certain terms and conditions, which was not exercised as of December 31, 2022. As at December 31, 2022, the balance of the loan is $51.4 million (US$38.0 million) (2021 — $0.8 million (US$0.6 million) included in non-current liabilities on the combined balance sheet).
As at December 31, 2022, the Trust had leases for the use of office space, office and other equipment, and ground leases for the land upon which four income-producing properties in Europe and Canada are situated. The Trust recognized these leases as right-of-use assets and recorded related lease liability obligations. During the year ended December 31, 2022, Granite recorded a right-of-use asset and related lease obligation of $2.2 million for office space in Canada.
The present value of future minimum lease payments relating to the right-of-use assets as at December 31, 2022 in aggregate for the next five years and thereafter are as follows:
| | | | | |
| |
| |
| |
| 2023 | $ | 746 | |
| 2024 | 741 | |
| 2025 | 739 | |
| 2026 | 735 | |
| 2027 | 458 | |
| 2028 and thereafter | 30,304 | |
| $ | 33,723 | |
During the year ended December 31, 2022, the Trust recognized $1.5 million (2021 — $1.6 million) of interest expense related to lease obligations (note 14(d)).
Deferred Revenue
Deferred revenue relates to prepaid and unearned revenue received from tenants and fluctuates with the timing of rental receipts.
Accounts Payable and Accrued Liabilities
| | | | | | | | |
| | |
| As at December 31, | 2022 | 2021 |
| | |
| Accounts payable | $ | 11,204 | | $ | 7,982 | |
| Commodity tax payable | 6,087 | | 8,385 | |
| Tenant security deposits | 7,257 | | 6,822 | |
| Employee unit-based compensation | 5,994 | | 11,525 | |
| Trustee/director unit-based compensation | 6,932 | | 8,935 | |
| Accrued salaries, incentives and benefits | 6,826 | | 5,875 | |
| Accrued interest payable | 9,974 | | 7,235 | |
| Accrued construction costs | 36,659 | | 21,817 | |
| Accrued professional fees | 1,445 | | 1,641 | |
| Acquisition related liabilities | 5,042 | | 19,963 | |
| Accrued property operating costs | 8,750 | | 5,768 | |
| | |
| Other tenant related liabilities | 5,104 | | 5,511 | |
| | |
| | |
| Other accrued liabilities | 3,501 | | 1,785 | |
| $ | 114,775 | | $ | 113,244 | |
| | | | | |
| 12. | DISTRIBUTIONS TO STAPLED UNITHOLDERS |
Total distributions declared to stapled unitholders in the year ended December 31, 2022 were $202.3 million (2021 — $192.6 million) or $3.11 per stapled unit (2021 — $3.01 per stapled unit).
Distributions payable at December 31, 2022 of $17.0 million (26.7 cents per stapled unit), representing the December 2022 monthly distribution, were paid on January 17, 2023.
Distributions payable at December 31, 2021 of $17.0 million were paid on January 14, 2022 and represented the December 2021 monthly distribution.
Subsequent to December 31, 2022, the distributions declared in January 2023 in the amount of $17.0 million or 26.7 cents per stapled unit were paid on February 15, 2023 and the distributions declared in February 2023 of $17.0 million or 26.7 cents per stapled unit will be paid on March 15, 2023.
| | | | | |
| 13. | STAPLED UNITHOLDERS' EQUITY |
(a)Stapled Units
The stapled units consist of one unit of Granite REIT and one common share of Granite GP. Granite REIT is authorized to issue an unlimited number of units. Granite GP’s authorized share capital consists of an unlimited number of common shares without par value. Each stapled unit is entitled to distributions and/or dividends in the case of Granite GP as and when declared and, in the event of termination of Granite REIT and Granite GP, to the net assets of Granite REIT and Granite GP remaining after satisfaction of all liabilities.
(b)Unit-Based Compensation
Incentive Stock Option Plan
The Incentive Stock Option Plan allows for the grant of stock options or stock appreciation rights to directors, officers, employees and consultants. As at December 31, 2022 and December 31, 2021, there were no options outstanding under this plan.
Director/Trustee Deferred Share Unit Plan
The Trust has two Non-Employee Director Share-Based Compensation Plans (the “DSPs”) which provide for a deferral of up to 100% of each non-employee director’s total annual remuneration, at specified levels elected by each director. The amounts deferred under the DSPs are reflected by notional deferred share units (“DSUs”) whose value at the time that the particular payment to the director is determined reflects the fair market value of a stapled unit. The value of a DSU subsequently appreciates or depreciates with changes in the market price of the stapled units. The DSPs also provide for the accrual of notional distribution equivalents on any distributions paid on the stapled units. On June 9, 2022, amendments were made to the
DSPs to allow, at the discretion of the Compensation, Governance and Nominating Committee
(the "CGN Committee)" for the DSUs to be settled in cash or stapled units, equal to the value of
the accumulated DSUs at such date.
A reconciliation of the changes in the DSUs outstanding is presented below:
| | | | | | | | | | | | | | | | | | | | | | | |
| 2022 | | 2021 |
| Number (000s) | Weighted Average Grant Date
Fair Value | | Number (000s) | Weighted Average Grant Date
Fair Value |
| DSUs outstanding, January 1 | 85 | | | $58.50 | | 67 | | | $52.93 |
| New grants and distributions | 16 | | | 97.41 | | 18 | | | 79.64 |
| | | | | | | |
| DSUs outstanding, December 31 | 101 | | | $64.58 | | 85 | | | $58.50 |
Executive Deferred Stapled Unit Plan
The Executive Stapled Unit Plan (the “Restricted Stapled Unit Plan”) of the Trust provides for the issuance of Restricted Share Units (“RSUs”) and Performance Share Units (“PSUs”) and is designed to provide equity-based compensation in the form of stapled units to executives and other employees (the “Participants”). The maximum number of stapled units which may be issued pursuant to the Restricted Stapled Unit Plan is 1.0 million. The Restricted Stapled Unit Plan entitles a Participant to receive a stapled unit or a cash payment equal to the market value of the stapled unit, which on any date is the volume weighted average trading price of a stapled unit on the Toronto Stock Exchange or New York Stock Exchange over the preceding five trading days. The form of redemption of the stapled units is determined by the Compensation, Governance and Nominating Committee and is not at the option of the Participant. Vesting conditions in respect of a grant are determined by the Compensation, Governance and Nominating Committee at the time the grant is made and may result in the vesting of more or less than 100% of the number of stapled units. The Restricted Stapled Unit Plan also provides for the accrual of distribution equivalent amounts based on distributions paid on the stapled units. Stapled units are, unless otherwise agreed or otherwise required by the Restricted Stapled Unit Plan, settled within 60 days following vesting.
A reconciliation of the changes in notional stapled units outstanding under the Restricted Stapled Unit Plan is presented below:
| | | | | | | | | | | | | | | | | | | | | | | |
| 2022 | | 2021 |
| Number (000s) | Weighted Average
Grant Date
Fair Value | | Number (000s) | Weighted Average
Grant Date
Fair Value |
| RSUs and PSUs outstanding, January 1 | 128 | | | $ | 67.19 | | | 128 | | | $ | 59.83 | |
New grants and distributions(1) | 58 | | | 101.30 | | | 51 | | | 78.91 | |
| Forfeited | — | | | 88.02 | | | — | | | — | |
| PSUs added by performance factor | 27 | | | 96.22 | | | — | | | — | |
| Settled in cash | (45) | | | 69.89 | | | (24) | | | 59.38 | |
| Settled in stapled units | (44) | | | 69.89 | | | (27) | | | 59.38 | |
RSUs and PSUs outstanding, December 31(2) | 124 | | | $ | 87.18 | | | 128 | | | $ | 67.19 | |
(1)Includes 29.6 RSUs and 22.0 PSUs granted during the year ended December 31, 2022 (2021 — 18.7 RSUs and 25.0 PSUs).
(2)Total restricted stapled units outstanding at December 31, 2022 include a total of 47.3 RSUs and 76.2 PSUs granted (2021 — 50.2 RSUs and 78.1 PSUs).
The fair value of the outstanding RSUs was $2.6 million at December 31, 2022 and is based on the market price of the Trust’s stapled unit. The fair value is adjusted for changes in the market
price of the Trust’s stapled unit and recorded as a liability in the employee unit-based compensation payables (note 11).
The fair value of the outstanding PSUs was $3.4 million at December 31, 2022 and is recorded as a liability in the employee unit-based compensation payables (note 11). The fair value is calculated using the Monte-Carlo simulation model based on the assumptions below as well as a market adjustment factor based on the total unitholder return of the Trust's stapled units relative to the S&P/TSX Capped REIT Index.
| | | | | |
| Grant date | January 1, 2022, January 1, 2021 and January 1, 2020 |
| PSUs outstanding | 76,189 |
| Weighted average term to expiry | 1.0 year |
| Average volatility rate | 22.8% |
| Weighted average risk free interest rate | 1.6% |
The Trust's unit-based compensation (recovery) expense recognized in general and administrative expenses was:
| | | | | | | | | | | |
| | | |
| Years ended December 31, | | | | 2022 | 2021 |
| | | | | |
DSUs for trustees/directors(1) | | | | $ | (2,002) | | $ | 3,693 | |
| Restricted Stapled Unit Plan for executives and employees | | | | 1,835 | | 8,749 | |
| Unit-based compensation (recovery) expense | | | | $ | (167) | | $ | 12,442 | |
| | | | | |
| Fair value remeasurement (recovery) expense include in the above: | | | | | |
DSUs for trustees/directors | | | | $ | (3,534) | | $ | 2,275 | |
| Restricted Stapled Unit Plan for executives and employees | | | | (2,733) | | 3,778 | |
| Total fair value remeasurement (recovery) expense | | | | $ | (6,267) | | $ | 6,053 | |
(1)In respect of fees mandated and elected to be taken as DSUs.
(c)Normal Course Issuer Bid
On May 19, 2022, Granite announced the acceptance by the Toronto Stock Exchange ("TSX") of Granite’s Notice of Intention to Make a Normal Course Issuer Bid (“NCIB”). Pursuant to the NCIB, Granite proposes to purchase through the facilities of the TSX and any alternative trading system in Canada, from time to time and if considered advisable, up to an aggregate of 6,566,292 of Granite’s issued and outstanding stapled units. The NCIB commenced on May 24, 2022 and will conclude on the earlier of the date on which purchases under the bid have been completed and May 23, 2023. Pursuant to the policies of the TSX, daily purchases made by Granite through the TSX may not exceed 39,046 stapled units, subject to certain exceptions. Granite has entered into an automatic securities purchase plan with a broker in order to facilitate repurchases of the stapled units under the NCIB during specified blackout periods. Pursuant to a previous notice of intention to conduct a NCIB, Granite received approval from the TSX to purchase stapled units for the period May 21, 2021 to May 20, 2022.
During the year ended December 31, 2022, Granite repurchased 2,165,600 stapled units at an average stapled unit cost of $71.81 for total consideration of $155.5 million, excluding commissions. The difference between the repurchase price and the average cost of the stapled units of $41.7 million was recorded to contributed surplus. During the year ended December 31, 2021, there were no stapled unit repurchases under the NCIB.
(d)Stapled Unit Offerings
During the year ended December 31, 2022, there were no stapled unit offerings. During the year ended December 31, 2021, Granite completed an offering of 3,979,000 stapled units at a price of $79.50 per unit for gross proceeds of $316.3 million, including 519,000 stapled units issued pursuant to the exercise of the over-allotment option granted to the underwriters. Costs related to the offering totaled $13.2 million and were recorded as a reduction to stapled unitholders’ equity. The net proceeds received by Granite after deducting the total costs related to the offering were $303.1 million.
(e)At-The-Market Equity Distribution Program
On November 3, 2021, Granite filed a prospectus supplement to the base shelf prospectus of Granite REIT and Granite GP establishing an at-the-market equity distribution program (the “ATM Program”), in each of the provinces and territories of Canada, that allows it to issue and sell, at its discretion, up to $250.0 million of stapled units to the public, from time to time. Stapled units sold under the ATM Program will be sold at the prevailing market prices at the time of sale when issued, directly through the facilities of the Toronto Stock Exchange or any other recognized marketplace upon which the stapled units are listed or quoted or where the stapled units are traded in Canada.
During the year ended December 31, 2022, Granite issued 136,100 stapled units under the ATM Program at an average stapled unit price of $98.77 for gross proceeds of $13.4 million, and incurred issuance costs of $0.3 million, for net proceeds of $13.1 million. The issuance costs were recorded as a reduction to stapled unitholders’ equity.
(f)Accumulated Other Comprehensive Income
Accumulated other comprehensive income consists of the following:
| | | | | | | | |
| As at December 31, | 2022 | 2021 |
| | |
Foreign currency translation gains on investments in subsidiaries, net of related hedging activities and non-controlling interests(1) | $ | 324,484 | | $ | 53,798 | |
| Fair value gains on derivatives designated as net investment hedges | 89,048 | | 18,153 | |
| $ | 413,532 | | $ | 71,951 | |
(1)Includes foreign currency translation gains and losses from non-derivative financial instruments designated as net investment hedges.
| | | | | |
| 14. | RENTAL REVENUE, RECOVERIES, COSTS AND EXPENSES |
(a) Rental revenue consists of:
| | | | | | | | | | | |
| | | |
| Years ended December 31, | | | | 2022 | 2021 |
| Base rent | | | | $ | 376,296 | | $ | 331,403 | |
| Straight-line rent amortization | | | | 10,596 | | 8,889 | |
| Tenant incentive amortization | | | | (4,149) | | (5,105) | |
| Property tax recoveries | | | | 48,147 | | 38,898 | |
| Property insurance recoveries | | | | 4,947 | | 3,290 | |
| Operating cost recoveries | | | | 19,742 | | 16,113 | |
| | | | $ | 455,579 | | $ | 393,488 | |
(b) Property operating costs consist of:
| | | | | | | | | | | |
| | | |
| Years ended December 31, | | | | 2022 | 2021 |
| Non-recoverable from tenants: | | | | | |
| Property taxes and utilities | | | | $ | 910 | | $ | 656 | |
| Property insurance | | | | 776 | | 449 | |
| Repairs and maintenance | | | | 420 | | 331 | |
| Property management fees | | | | 339 | | 451 | |
| Professional fees | | | | 83 | | 199 | |
| Environmental and appraisals | | | | 404 | | 294 | |
| | | | | |
| Other | | | | 246 | | 290 | |
| | | | $ | 3,178 | | $ | 2,670 | |
| Recoverable from tenants: | | | | | |
| Property taxes and utilities | | | | $ | 52,456 | | $ | 42,961 | |
| Property insurance | | | | 5,538 | | 4,282 | |
| Repairs and maintenance | | | | 10,079 | | 7,642 | |
| Property management fees | | | | 3,818 | | 2,951 | |
| Other | | | | 152 | | 306 | |
| | | | $ | 72,043 | | $ | 58,142 | |
| Property operating costs | | | | $ | 75,221 | | $ | 60,812 | |
(c) General and administrative expenses consist of:
| | | | | | | | | | | | | | | | |
| | | | | | | | |
| Years ended December 31, | | | | 2022 | 2021 | | | | | |
| | | | | | | | | | |
| Salaries, incentives and benefits | | | | $ | 18,225 | | $ | 17,092 | | | | | | |
| Audit, legal and consulting | | | | 3,205 | | 3,444 | | | | | | |
Trustee/director fees including distributions, revaluations and expenses(1) | | | | (1,777) | | 3,898 | | | | | | |
RSU and PSU compensation expense including distributions and revaluations(1) | | | | 1,835 | | 8,749 | | | | | | |
| Other public entity costs | | | | 2,615 | | 1,961 | | | | | | |
| Office rents including property taxes and common area maintenance costs | | | | 491 | | 437 | | | | | | |
| Capital tax | | | | 867 | | 630 | | | | | | |
| Information technology costs | | | | 2,213 | | 1,825 | | | | | | |
| Other | | | | 2,779 | | 1,030 | | | | | | |
| | | | $ | 30,453 | | $ | 39,066 | | | | | | |
| Less: capitalized general and administrative expenses | | | | (988) | | (666) | | | | | | |
| | | | $ | 29,465 | | $ | 38,400 | | | | | | |
(1)For fair value remeasurement (recovery) expense amounts see note 13(b).
(d) Interest expense and other financing costs consist of:
| | | | | | | | | | | |
| | | |
| Years ended December 31, | | | | 2022 | 2021 |
| | | | | |
| Interest and amortized issuance costs and modification losses relating to debentures and term loans | | | | $ | 47,304 | | $ | 38,428 | |
| | | | | |
| Early redemption premium relating to 2021 Debentures (note 8(b)) | | | | — | | 3,963 | |
| Amortization of deferred financing costs and other interest expense and charges | | | | 5,784 | | 3,870 | |
| Interest expense related to lease obligations (note 10) | | | | 1,549 | | 1,572 | |
| | | | $ | 54,637 | | $ | 47,833 | |
| Less: capitalized interest | | | | (3,670) | | (607) | |
| | | | $ | 50,967 | | $ | 47,226 | |
(e) Fair value (gains) losses on financial instruments, net, consist of:
| | | | | | | | | | | |
| | | |
| Years ended December 31, | | | | 2022 | 2021 |
| | | | | |
| | | | | |
| Foreign exchange collar contracts, net (note 18(a)) | | | | $ | 2,426 | | $ | 2,627 | |
| | | | | |
| | | | | |
| Derivatives (note 8(c)) | | | | (13,809) | | (1,413) | |
| | | | $ | (11,383) | | $ | 1,214 | |
For the year ended December 31, 2022, the net fair value gain on financial instruments of $11.4 million is comprised of the net fair value gain on the derivatives of $13.8 million which is associated with the fair value movements of the 2024 Cross Currency Interest Rate Swap and the combination of the 2025 Term Loan and 2025 Interest Rate Swap, offset partially by the net fair value loss on the foreign exchange collar contracts of $2.4 million. The Trust partially
employed or did not employ hedge accounting for the derivatives and foreign exchange collars, therefore the change in fair value is recognized in fair value gains on financial instruments, net, in the combined statement of net income.
For the year ended December 31, 2021, the net fair value loss on financial instruments of $1.2 million was comprised of the net fair value loss on the foreign exchange collar contracts of $2.6 million, offset partially by the net fair value gain on the derivatives of $1.4 million which was associated with the fair value movements of the 2021 Cross Currency Interest Rate Swap and 2024 Cross Currency Interest Rate Swap. The Trust partially employed or did not employ hedge accounting for the derivatives and foreign exchange collars, therefore the change in fair value was recognized in fair value losses on financial instruments, net, in the combined statement of net income.
(a)The major components of the income tax (recovery) expense are:
| | | | | | | | |
| Years ended December 31, | 2022 | 2021 |
| Current income tax: | | |
| Current taxes | $ | 8,079 | | $ | 13,572 | |
| Current taxes referring to previous periods | (819) | (1,916) |
| Withholding taxes and other | 120 | (37) |
| $ | 7,380 | | $ | 11,619 | |
| Deferred income tax: | | |
| Origination and reversal of temporary differences | $ | (71,195) | | $ | 224,411 | |
| Impact of changes in tax rates | (17,330) | 1,955 |
| Benefits arising from a previously unrecognized tax loss that reduced: | | |
| | |
| | |
| | |
| Deferred tax expense arising from the write-down, or reversal of a previous write-down, of a deferred tax asset | 16,771 | 3,277 |
| Other | 709 | (695) |
| $ | (71,045) | | $ | 228,948 | |
| Income tax (recovery) expense | $ | (63,665) | | $ | 240,567 | |
For the year ended December 31, 2022, there was no current tax expense associated with property dispositions. For the year ended December 31, 2021, there was $5.1 million of current tax expense associated with the disposition of two properties in Austria.
(b) The effective income tax rate reported in the combined statements of net income varies from the Canadian statutory rate for the following reasons:
| | | | | | | | | | | |
| | | |
| Years ended December 31, | | | | 2022 | 2021 |
| Income before income taxes | | | | $ | 92,157 | | $ | 1,550,839 | |
| Expected income taxes at the Canadian statutory tax rate of 26.5% (2021 - 26.5%) | | | | $ | 24,422 | | $ | 410,972 | |
| Income distributed and taxable to unitholders | | | | (92,252) | | (150,899) | |
| Net foreign rate differentials | | | | 9,145 | | (22,772) | |
| Net change in provisions for uncertain tax positions | | | | 719 | | (458) | |
| Net permanent differences | | | | (6,151) | | 176 | |
| Net effect of change in tax rates | | | | (17,330) | | 628 | |
| Non-recognition of deferred tax assets | | | | 16,770 | | 3,277 | |
| | | | | |
| Withholding taxes and other | | | | 1,012 | | (357) | |
| Income tax (recovery) expense | | | | $ | (63,665) | | $ | 240,567 | |
(c)Deferred tax assets and liabilities consist of temporary differences related to the following:
| | | | | | | | |
| As at December 31, | 2022 | 2021 |
| Deferred tax assets: | | |
| | |
| Eligible capital expenditures | $ | — | | $ | 1,964 | |
| Other | 629 | | 2,488 | |
| Deferred tax assets | $ | 629 | | $ | 4,452 | |
| Deferred tax liabilities: | | |
| Investment properties | $ | 562,578 | | $ | 609,418 | |
| | |
| Other | (5,187) | | (4,751) |
| Deferred tax liabilities | $ | 557,391 | $ | 604,667 |
(d)Changes in the net deferred tax liabilities consist of the following:
| | | | | | | | |
| Years ended December 31, | 2022 | 2021 |
| Balance, beginning of year | $ | 600,215 | $ | 388,111 |
| Deferred tax (recovery) expense recognized in net income | (71,045) | 228,948 |
| Foreign currency translation of deferred tax balances | 27,592 | | (16,844) | |
| Net deferred tax liabilities, end of year | $ | 556,762 | $ | 600,215 |
(e) Net cash payments of income taxes amounted to a payment of $18.1 million for the year ended December 31, 2022 (2021 — $7.0 million) which included less than $0.1 million of withholding taxes paid (2021 — $0.3 million).
(f) The Trust conducts operations in a number of countries with varying statutory rates of taxation. Judgment is required in the estimation of income tax expense and deferred income tax assets and liabilities in each of the Trust’s operating jurisdictions. This process involves estimating actual current tax exposure, assessing temporary differences that result from the different treatments of items for tax and accounting purposes, assessing whether it is more likely than not that deferred income tax assets will be realized and, based on all the available evidence, determining if a provision is required on all or a portion of such deferred income tax
assets. The Trust reports a liability for uncertain tax positions (‘‘unrecognized tax benefits’’) taken or expected to be taken in a tax return. The Trust recognizes interest and penalties, if any, related to unrecognized tax benefits in income tax expense.
As at December 31, 2022, the Trust had $10.3 million (2021 — $10.5 million) of unrecognized income tax benefits, (including $0.2 million (2021 — $0.3 million) related to accrued interest and penalties), all of which could ultimately reduce the Trust’s effective tax rate should these tax benefits become recognized. The Trust believes that it has adequately provided for reasonably foreseeable outcomes related to tax examinations and that any resolution will not have a material effect on the combined financial position, results of operations, or cash flows. However, the Trust cannot predict with any level of certainty the exact nature of any future possible outcome.
A reconciliation of the beginning and ending amounts of unrecognized tax benefits is as follows:
| | | | | | | | |
| As at December 31, | 2022 | 2021 |
| Unrecognized tax benefits balance, beginning of year | $ | 10,470 | | $ | 11,568 | |
| Decreases for tax positions of prior years | (1,692) | | (2,085) | |
| Increases for tax positions of current year | 1,452 | | 1,859 | |
| Foreign currency impact | 49 | | (872) | |
| Unrecognized tax benefits balance, end of year | $ | 10,279 | | $ | 10,470 | |
It is reasonably possible that the gross unrecognized tax benefits, as of December 31, 2022, could decrease in the next 12 months. The quantum of the decrease could range between a nominal amount and $2.6 million (2021 — a nominal amount and $2.0 million) and relates primarily to tax years becoming statute barred for purposes of future tax examinations by local taxing authorities and the outcome of current tax examinations. For the year ended December 31, 2022, $0.1 million of interest and penalties was recorded (2021 — $0.1 million) as part of the provision for income taxes in the combined statements of net income.
As at December 31, 2022, the following tax years remained subject to examination:
| | | | | |
| Major Jurisdictions | |
| Canada | 2018 through 2022 |
| United States | 2018 through 2022 |
| Austria | 2017 through 2022 |
| Germany | 2016 through 2022 |
| Netherlands | 2017 through 2022 |
As at December 31, 2022, the Trust has approximately $285.5 million (2021 — $203.5 million) of losses and other deductible temporary differences in various tax jurisdictions that the Trust believes are not probable to be realized. As a result, no deferred tax asset has been recognized for these losses and other deductible temporary differences as of December 31, 2022. Included in this number are Canadian capital loss carryforwards that do not expire of $140.5 million (2021 — $140.5 million).
The aggregate amount of temporary differences associated with investments in subsidiaries for which deferred tax liabilities have not been recognized as at December 31, 2022 is approximately $194.7 million (2021 — approximately $321.4 million).
| | | | | |
| 16. | SEGMENTED DISCLOSURES INFORMATION |
The Trust has one reportable segment — the ownership and rental of industrial real estate as determined by the information reviewed by the chief operating decision maker who is the President and Chief Executive Officer. The following tables present certain information with respect to geographic segmentation:
| | | | | | | | | | | | | | |
| Revenue | | | | |
| Years ended December 31, | 2022 | | 2021 | |
| Canada | $ | 75,934 | | 17 | % | $ | 65,542 | | 17 | % |
| United States | 251,746 | | 55 | % | 203,273 | | 51 | % |
| Austria | 59,523 | | 13 | % | 64,994 | | 17 | % |
| Germany | 31,823 | | 7 | % | 27,075 | | 7 | % |
| Netherlands | 34,945 | | 8 | % | 27,540 | | 7 | % |
| Other Europe | 1,608 | | — | % | 5,064 | | 1 | % |
| $ | 455,579 | | 100 | % | $ | 393,488 | | 100 | % |
For the year ended December 31, 2022, revenue from Magna comprised approximately 25%
(2021 — 31%) of the Trust’s total revenue.
| | | | | | | | | | | | | | |
| Investment Properties | | | | |
| As at December 31, | 2022 | | 2021 | |
| Canada | $ | 1,918,822 | | 22 | % | $ | 1,712,946 | | 21 | % |
| United States | 4,757,867 | | 54 | % | 4,229,477 | | 53 | % |
| Austria | 759,977 | | 8 | % | 773,772 | | 10 | % |
| Germany | 588,804 | | 7 | % | 465,478 | | 6 | % |
| Netherlands | 814,101 | | 9 | % | 789,485 | | 10 | % |
| | | | |
| $ | 8,839,571 | | 100 | % | $ | 7,971,158 | | 100 | % |
(a)Items not involving operating cash flows are shown in the following table:
| | | | | | | | | | | |
| | | |
| Years ended December 31, | | | | 2022 | 2021 |
| | | | | |
| Straight-line rent amortization | | | | $ | (10,596) | | $ | (8,889) | |
| Tenant incentive amortization | | | | 4,149 | | 5,105 | |
| Unit-based compensation (recovery) expense (note 13(b)) | | | | (167) | | 12,442 | |
| Fair value losses (gains) on investment properties, net | | | | 219,728 | | (1,298,865) | |
| Depreciation and amortization | | | | 1,598 | | 1,320 | |
| Fair value (gains) losses on financial instruments, net (note 14(e)) | | | | (11,383) | | 1,214 | |
| Loss on sale of investment properties | | | | 666 | | 761 | |
| Amortization of issuance costs and modification losses relating to debentures and term loans | | | | 1,729 | | 1,489 | |
| Amortization of deferred financing costs | | | | 582 | | 1,033 | |
| Deferred income tax (recovery) expense (note 15(a)) | | | | (71,045) | | 228,948 | |
| Early redemption premium (note 8(b)) | | | | — | | 3,963 | |
| Other | | | | (173) | | (171) | |
| | | | $ | 135,088 | | $ | (1,051,650) | |
(b)Changes in working capital balances are shown in the following table:
| | | | | | | | | | | |
| | | |
| | | |
| Years ended December 31, | | | | 2022 | 2021 |
| Accounts receivable | | | | $ | 1,674 | | $ | (4,119) | |
| Prepaid expenses and other | | | | (2,269) | | (2,899) | |
| Accounts payable and accrued liabilities | | | | (4,209) | | 4,781 | |
| Deferred revenue | | | | 4,702 | | 191 | |
| | | | | |
| | | | $ | (102) | | $ | (2,046) | |
(c)Non-cash investing and financing activities
For the year ended December 31, 2022, 44 thousand stapled units (2021 — 27 thousand stapled units) with a value of $4.1 million (2021 — $2.2 million) were issued under the Restricted Stapled Unit Plan (note 13(b)) and are not recorded in the combined statements of cash flows.
In addition, for the year ended December 31, 2022, the total impact from the foreign currency translations on the secured debt, unsecured debt and related derivatives of $40.8 million gain (2021 — $1.8 million loss) are not recorded in the combined statements of cash flows.
(d)Cash and cash equivalents consist of:
| | | | | | | | |
| | |
| As at December 31, | 2022 | 2021 |
| Cash | $ | 127,091 | | $ | 401,954 | |
| Short-term deposits | 7,990 | | 559 | |
| $ | 135,081 | | $ | 402,513 | |
| | | | | |
| 18. | FAIR VALUE AND RISK MANAGEMENT |
(a)Fair Value of Financial Instruments
The following table provides the measurement basis of financial assets and liabilities as at December 31, 2022 and 2021:
| | | | | | | | | | | | | | | | | | | | |
| | |
| As at December 31, | | | 2022 | | | 2021 |
| Carrying
Value | | Fair Value | Carrying
Value | | Fair Value |
| Financial assets | | | | | | |
| | | | | | |
| Other assets | $ | 291 | | (1) | $ | 291 | | $ | 308 | | (1) | $ | 308 | |
| Derivatives | 151,855 | | | 151,855 | 62,768 | | | 62,768 | |
| Loan receivable | 69,186 | | | 69,186 | | 10,471 | | | 10,471 | |
| Accounts receivable | 12,176 | | | 12,176 | | 10,771 | | | 10,771 | |
| | | | | | |
| | | | | | |
| Cash and cash equivalents | 135,081 | | | 135,081 | | 402,513 | | | 402,513 | |
| $ | 368,589 | | | $ | 368,589 | | $ | 486,831 | | | $ | 486,831 | |
| | | | | | |
| Financial liabilities | | | | | | |
| Unsecured debentures, net | $ | 1,893,186 | | (3) | $ | 1,672,290 | | $ | 1,891,742 | | | $ | 1,914,560 | |
| Unsecured term loans, net | 1,090,451 | | | 1,090,451 | | 533,347 | | | 533,347 | |
| | | | | | |
| Secured debt | 51,373 | | | 51,373 | | 763 | | | 763 | |
| Derivatives | 13,467 | | (4) | 13,467 | | 18,624 | | | 18,624 | |
| Accounts payable and accrued liabilities | 114,775 | | (2) | 114,775 | | 113,244 | | | 113,244 | |
| Distributions payable | 16,991 | | | 16,991 | | 16,969 | | | 16,969 | |
| $ | 3,180,243 | | | $ | 2,959,347 | | $ | 2,574,689 | | | $ | 2,597,507 | |
(1) Long-term receivables included in other assets (note 6).
(2) Foreign exchange collars of $2.4 million included in accounts payable and accrued liabilities.
(3) Balance includes current and non-current portions (note 8(b)).
(4) Balance includes current and non-current portions (note 8(c)).
The fair values of the Trust’s loan receivable, accounts receivable, cash and cash equivalents, accounts payable and accrued liabilities and distributions payable approximate their carrying amounts due to the relatively short periods to maturity of these financial instruments. The fair value of the long-term receivable included in other assets approximates its carrying amount as the receivable bears interest at rates comparable to current market rates. The fair values of the unsecured debentures are determined using quoted market prices. The fair values of the secured debt and term loans approximate their carrying amounts as the secured debt and term loans bear interest at rates comparable to the current market rates. The fair values of the derivatives and foreign exchange collars are determined using market inputs quoted by their counterparties.
The Trust periodically purchases foreign exchange collars to hedge specific anticipated foreign currency transactions and to mitigate its foreign exchange exposure on its net cash flows. At December 31, 2022, the Trust held 12 outstanding foreign exchange collar contracts with a notional value of US$72.0 million and contracts the Trust to sell US dollars and receive Canadian dollars if specific US dollar exchange rates relative to the Canadian dollar are met. At December 31, 2022, the Trust also held 18 outstanding foreign exchange collar contracts with a notional value of €24.0 million and contracts the Trust to sell Euros and receive Canadian
dollars if specific Euro exchange rates relative to the Canadian dollar are met. For the year ended December 31, 2022, the Trust recorded a net fair value loss of $2.4 million related to the outstanding foreign exchange collar contracts (note 14(e)). The Trust did not employ hedge accounting for these financial instruments.
As at December 31, 2021, the Trust did not have any outstanding foreign exchange collar contracts. During the year ended December 31, 2021, the Trust held foreign exchange collar contracts to sell US dollars and Euros which resulted in a net fair value loss of $2.6 million (note 14(e)). The Trust did not employ hedge accounting for these financial instruments.
(b)Fair Value Hierarchy
Fair value measurements are based on inputs of observable and unobservable market data that a market participant would use in pricing an asset or liability. IFRS establishes a fair value hierarchy which is summarized below:
Level 1: Fair value determined using quoted prices in active markets for identical assets or liabilities.
Level 2: Fair value determined using significant observable inputs, generally either quoted prices in active markets for similar assets or liabilities or quoted prices in markets that are not active.
Level 3: Fair value determined using significant unobservable inputs, such as pricing models, discounted cash flows or similar techniques.
The following tables represent information related to the Trust’s assets and liabilities measured or disclosed at fair value on a recurring and non-recurring basis and the level within the fair value hierarchy in which the fair value measurements fall.
| | | | | | | | | | | |
| As at December 31, 2022 | Level 1 | Level 2 | Level 3 |
| ASSETS AND LIABILITIES MEASURED OR DISCLOSED AT FAIR VALUE | | | |
| Assets measured at fair value | | | |
| Investment properties (note 4) | $ | — | | $ | — | | $ | 8,839,571 | |
| Assets held for sale (note 5) | — | | — | | 41,182 | |
| Derivatives (note 8) | — | | 151,855 | | — | |
| Loan receivable (note 7) | — | | 69,186 | | — | |
| | | |
| | | |
| | | |
| Liabilities measured or disclosed at fair value | | | |
| Unsecured debentures, net (note 8) | 1,672,290 | | — | | — | |
| Unsecured term loans, net (note 8) | — | | 1,090,451 | | — | |
| | | |
| Secured debt (note 9) | — | | 51,373 | | — | |
| Foreign exchange collars included in accounts payable and accrued liabilities | — | | 2,426 | | — | |
| Derivatives (note 8) | — | | 13,467 | | — | |
| Net (liabilities) assets measured or disclosed at fair value | $ | (1,672,290) | | $ | (936,676) | | $ | 8,880,753 | |
| | | | | | | | | | | |
| As at December 31, 2021 | Level 1 | Level 2 | Level 3 |
| ASSETS AND LIABILITIES MEASURED OR DISCLOSED AT FAIR VALUE | | | |
| Assets measured at fair value | | | |
| Investment properties (note 4) | $ | — | | $ | — | | $ | 7,971,158 | |
| Assets held for sale (note 5) | — | | — | | 64,612 | |
| Derivatives (note 8) | — | | 62,768 | | — | |
| Loan receivable (note 7) | — | | 10,471 | | — | |
| | | |
| | | |
| | | |
| Liabilities measured or disclosed at fair value | | | |
| Unsecured debentures, net (note 8) | 1,914,560 | | — | | — | |
| Unsecured term loans, net (note 8) | — | | 533,347 | | — | |
| Secured debt (note 9) | — | | 763 | | — | |
| Derivatives (note 8) | — | | 18,624 | | — | |
| Net (liabilities) assets measured or disclosed at fair value | $ | (1,914,560) | | $ | (479,495) | | $ | 8,035,770 | |
For assets and liabilities that are measured at fair value on a recurring basis, the Trust determines whether transfers between the levels of the fair value hierarchy have occurred by reassessing categorization (based on the lowest level input that is significant to the fair value measurement as a whole) at the end of each reporting period. For the years ended December 31, 2022 and 2021, there were no transfers between the levels.
Refer to note 4, Investment Properties, for a description of the valuation technique and inputs used in the fair value measurement and for a reconciliation of the fair value measurements of investment properties which are recognized in Level 3 of the fair value hierarchy.
(c)Risk Management
The main risks arising from the Trust’s financial instruments are credit, interest rate, foreign exchange and liquidity risks. The Trust’s approach to managing these risks is summarized below:
(i)Credit risk
The Trust’s financial assets that are exposed to credit risk consist primarily of cash and cash equivalents, loan receivable and accounts receivable.
Cash and cash equivalents include short-term investments, such as term deposits, which are invested in governments and financial institutions with a minimum credit rating of BBB+ (based on Standard & Poor’s (“S&P”) rating scale) or Baa1 (based on Moody’s Investor Services’ (“Moody’s”) rating scale). Concentration of credit risk is further reduced by limiting the amount that is invested in any one government or financial institution according to its credit rating. Further credit risk arises in the event that a borrower of a loan receivable defaults on the repayment of amount owing to the Trust. The Trust endeavours to ensure adequate security has been provided in support of the loan receivable.
Magna accounted for approximately 25% of the Trust’s rental revenue during the year ended December 31, 2022. Although its operating subsidiaries are not individually rated, Magna International Inc. has an investment grade credit rating from Moody’s, S&P and
DBRS Morningstar which mitigates the Trust’s credit risk. Substantially all of the Trust’s accounts receivable are collected within 30 days. The balance of accounts receivable past due is not significant.
(ii)Interest rate risk
As at December 31, 2022, the Trust’s exposure to interest rate risk is limited. Approximately 62% of the Trust’s interest bearing debt consists of fixed rate debt in the form of the 2023 Debentures, the 2027 Debentures, the 2028 Debentures and the 2030 Debentures. After taking into account the related derivatives, the 2023 Debentures, the 2027 Debentures, the 2028 Debentures and the 2030 Debentures have effective fixed interest rates of 2.430%, 2.964%, 1.004% and 1.045%, respectively. The remaining 38% of the Trust’s interest bearing debt consists of variable rate debt in the form of the 2024 Term Loan, the 2025 Term Loan, the 2026 Term Loan and secured debt. After taking into account the related derivatives, the 2024 Term Loan, the 2025 Term Loan and the 2026 Term Loan have effective fixed interest rates of 0.272%, 5.016% and 1.105%, respectively. The secured debt is carried at a variable rate of interest equal to the US prime rate less 90 basis points.
(iii)Foreign exchange risk
As at December 31, 2022, the Trust is exposed to foreign exchange risk primarily in respect of movements in the Euro and the US dollar. The Trust is structured such that its foreign operations are primarily conducted by entities with a functional currency which is the same as the economic environment in which the operations take place. As a result, the net income impact of currency risk associated with financial instruments is limited as its financial assets and liabilities are generally denominated in the functional currency of the subsidiary that holds the financial instrument. However, the Trust is exposed to foreign currency risk on its net investment in its foreign currency denominated operations and certain Trust level foreign currency denominated assets and liabilities. At December 31, 2022, the Trust’s foreign currency denominated net assets are $6.4 billion primarily in US dollars and Euros. A 1% change in the US dollar and Euro exchange rates relative to the Canadian dollar would result in a gain or loss of approximately $44.5 million and $19.5 million, respectively, to comprehensive income.
Granite generates rental income that is not all denominated in Canadian dollars. Since the financial results are reported in Canadian dollars, the Trust is subject to foreign currency fluctuations that could, from time to time, have an impact on the operating results. For the year ended December 31, 2022, a 1% change in the US dollar and Euro exchange rates relative to the Canadian dollar would have impacted revenue by approximately $2.5 million and $1.3 million, respectively.
For the year ended December 31, 2022, the Trust has designated its derivatives relating to the $1.3 billion of unsecured debentures and $550.4 million of unsecured term loans as hedges of its net investment in the European operations (note 8(c)). Furthermore, the Trust has designated its derivatives relating to the $650.0 million of unsecured debentures, the combination of the $541.3 million of unsecured term loan and its related derivative, and the US dollar draws under the Credit Facility, as hedges of its net investment in the United States operations (note 8(c)).
(iv)Liquidity risk
Liquidity risk is the risk the Trust will encounter difficulties in meeting its financial obligations as they become due. The Trust may also be subject to the risks associated with
debt financing, including the risks that the unsecured debentures, term loans and credit facility may not be able to be refinanced. The Trust’s objectives in minimizing liquidity risk are to maintain prudent levels of leverage on its investment properties, maintaining ample capacity on its Credit Facility, staggering its debt maturity profile and maintaining an investment grade credit rating. In addition, the Declaration of Trust establishes certain debt ratio limits.
The estimated contractual maturities of the Trust’s financial liabilities are summarized below:
| | | | | | | | | | | | | | | | | | | | | | | |
| Payments due by year |
| As at December 31, 2022 | Total | 2023 | 2024 | 2025 | 2026 | 2027 | Thereafter |
| Unsecured debentures | $ | 1,900,000 | | $ | 400,000 | | $ | — | | $ | — | | $ | — | | $ | 500,000 | | $ | 1,000,000 | |
| Unsecured term loans | 1,091,651 | | — | | 250,351 | | 541,300 | | 300,000 | | — | | — | |
| Derivatives | 13,467 | | 7,076 | | — | | — | | — | | — | | 6,391 | |
| Secured debt | 51,373 | | 51,373 | | — | | — | | — | | — | | — | |
Interest payments(1): | | | | | | | |
| Unsecured debentures, net of derivatives | 146,891 | | 34,798 | | 24,971 | | 24,971 | | 24,971 | | 17,516 | | 19,664 | |
| Unsecured term loans, net of derivatives | 88,275 | | 31,563 | | 31,714 | | 24,998 | | — | | — | | — | |
| Accounts payable and accrued liabilities | 114,775 | | 112,755 | | 1,458 | | 562 | | — | | — | | — | |
| Distributions payable | 16,991 | | 16,991 | | — | | — | | — | | — | | — | |
| $ | 3,423,423 | | $ | 654,556 | | $ | 308,494 | | $ | 591,831 | | $ | 324,971 | | $ | 517,516 | | $ | 1,026,055 | |
(1) Represents aggregated interest expense expected to be paid over the term of the debt, on an undiscounted basis, based on actual current interest rates and average foreign exchange rates.
The Trust’s capital structure comprises the total of the stapled unitholders’ equity and debt. The total managed capital of the Trust is summarized below:
| | | | | | | | |
As at December 31, | 2022 | 2021 |
| Unsecured debentures, net | $ | 1,893,186 | | $ | 1,891,742 | |
| Unsecured term loans, net | 1,090,451 | | 533,347 | |
Derivative (assets) liabilities, net(1) | (138,388) | | (44,144) | |
| Secured debt | 51,373 | | 763 | |
| Total debt | 2,896,622 | | 2,381,708 | |
| Stapled unitholders’ equity | 5,475,375 | | 5,318,653 | |
| Total managed capital | $ | 8,371,997 | | $ | 7,700,361 | |
(1) Balance represents derivative (assets) net of derivative liabilities (note 8(c)).
The Trust manages, monitors and adjusts its capital balances in response to the availability of capital, economic conditions and investment opportunities with the following objectives in mind:
•Compliance with investment and debt restrictions pursuant to the Amended and Restated Declaration of Trust;
• Compliance with existing debt covenants;
• Maintaining investment grade credit ratings;
•Supporting the Trust’s business strategies including ongoing operations, property development and acquisitions;
• Generating stable and growing cash distributions; and
• Building long-term unitholder value.
The Amended and Restated Declaration of Trust contains certain provisions with respect to capital management which include:
• The Trust shall not incur or assume any indebtedness if, after giving effect to the incurring or assumption of the indebtedness, the total indebtedness of the Trust would be more than 65% of the Gross Book Value (as defined in the Amended and Restated Declaration of Trust); and
• The Trust shall not invest in raw land for development, except for (i) existing properties with
additional development, (ii) the purpose of renovating or expanding existing properties or
(iii) the development of new properties, provided that the aggregate cost of the
investments of the Trust in raw land, after giving effect to the proposed investment, will not
exceed 15% of Gross Book Value.
At December 31, 2022, the Trust’s combined debt consists of the unsecured debentures, the term loans, the secured debt and the credit facility when drawn, each of which have various financial covenants. These covenants are defined within the trust indenture, the term loan agreements, the secured debt agreement and the credit facility agreement and, depending on the debt instrument, include a total indebtedness ratio, a secured indebtedness ratio, an interest coverage ratio, an unencumbered asset ratio, and a minimum equity threshold. The Trust monitors these provisions and covenants and was in compliance with their respective requirements as at December 31, 2022 and 2021.
Distributions are made at the discretion of the Board of Trustees (the “Board”) and Granite REIT intends to distribute each year all of its taxable income pursuant to its Amended and Restated Declaration of Trust as calculated in accordance with the Income Tax Act. For the fiscal year 2022, the Trust declared a monthly distribution of $0.258 per stapled unit from January to November and a monthly distribution of $0.267 per stapled unit for the month of December. The Board determines monthly distribution levels having considered, among other factors, estimated 2022 and 2023 cash generated from operations and capital requirements, the alignment of its current and targeted payout ratios with the Trust’s strategic objectives and compliance with the above noted provisions and financial covenants.
| | | | | |
| 20. | RELATED PARTY TRANSACTIONS |
For the year ended December 31, 2022, key management personnel include the Trustees/ Directors, the President and Chief Executive Officer, the Chief Financial Officer, the Executive Vice President, Head of Global Real Estate, the Executive Vice President, Global Real Estate and Head of Investments and the Executive Vice President, General Counsel. For the year ended December 31, 2021, key management personnel include the Trustees/ Directors, the President and Chief Executive Officer, the Chief Financial Officer, the Executive Vice President, Head of Global Real Estate and the Executive Vice President, Global Real Estate and Head of Investments. Information with respect to the Trustees’/Directors’ fees is included in notes 13(b) and 14(c). The compensation paid or payable to the Trust’s key management personnel was as follows:
| | | | | | | | |
Years ended December 31, | 2022 | 2021 |
| Salaries, incentives and short-term benefits | $ | 5,760 | | $ | 4,793 | |
| Unit-based compensation expense including fair value adjustments | 2,102 | | 4,673 | |
| $ | 7,862 | | $ | 9,466 | |
| | | | | |
| 21. | COMBINED FINANCIAL INFORMATION |
The combined financial statements include the financial position and results of operations and cash flows of each of Granite REIT and Granite GP. Below is a summary of the financial information for each entity along with the elimination entries and other adjustments that aggregate to the combined financial statements:
| | | | | | | | | | | | | | |
| Balance Sheet | As at December 31, 2022 |
| | | | |
| Granite REIT | Granite GP | Eliminations/
Adjustments | Granite REIT and Granite GP Combined |
| ASSETS | | | | |
| Non-current assets: | | | | |
| Investment properties | $8,839,571 | | — | | — | | $8,839,571 | |
Investment in Granite LP(1) | — | | 40 | | (40) | | — | |
| Other non-current assets | 167,189 | | — | | — | | 167,189 | |
| 9,006,760 | | 40 | | (40) | | 9,006,760 | |
| Current assets: | | | | |
| Assets held for sale | 41,182 | | — | | — | | 41,182 | |
| Other current assets | 97,310 | | 21 | | — | | 97,331 | |
Intercompany receivable(2) | — | | 15,594 | | (15,594) | | — | |
| Cash and cash equivalents | 135,020 | | 61 | | — | | 135,081 | |
| Total assets | $9,280,272 | | 15,716 | | (15,634) | | $9,280,354 | |
| | | | | | | | | | | | | | |
| LIABILITIES AND EQUITY | | | |
| Non-current liabilities: | | | | |
| Unsecured debt, net | $2,583,930 | | — | | — | | $2,583,930 | |
| Other non-current liabilities | 596,759 | | — | | — | | 596,759 | |
| 3,180,689 | | — | | — | | 3,180,689 | |
| Current liabilities: | | | | |
| Unsecured debt, net | 399,707 | | — | | — | | 399,707 | |
Intercompany payable(2) | 15,594 | | — | | (15,594) | | — | |
| Other current liabilities | 203,935 | | 15,676 | | — | | 219,611 | |
| Total liabilities | 3,799,925 | | 15,676 | | (15,594) | | 3,800,007 | |
| | | | |
| Equity: | | | | |
| Stapled unitholders’ equity | 5,475,335 | | 40 | | — | | 5,475,375 | |
| Non-controlling interests | 5,012 | | — | | (40) | | 4,972 | |
| Total liabilities and equity | $9,280,272 | | 15,716 | | (15,634) | | $9,280,354 | |
(1) Granite REIT Holdings Limited Partnership ("Granite LP") is 100% owned by Granite REIT and Granite GP.
(2) Represents employee and trustee/director compensation related amounts which will be reimbursed by Granite LP.
| | | | | | | | | | | | | | |
| Balance Sheet | As at December 31, 2021 |
| | | | |
| Granite REIT | Granite GP | Eliminations/
Adjustments | Granite REIT and Granite GP Combined |
| ASSETS | | | | |
| | | | |
| Non-current assets: | | | | |
| Investment properties | $7,971,158 | | — | | — | | $7,971,158 | |
Investment in Granite LP(1) | — | | 38 | | (38) | | — | |
| Other non-current assets | 109,010 | | — | | — | | 109,010 | |
| 8,080,168 | | 38 | | (38) | | 8,080,168 | |
| Current assets: | | | | |
| Assets held for sale | 64,612 | | — | | — | | 64,612 | |
| Other current assets | 19,404 | | — | | — | | 19,404 | |
Intercompany receivable(2) | — | | 21,429 | | (21,429) | | — | |
| Cash and cash equivalents | 402,059 | | 454 | | — | | 402,513 | |
| Total assets | $8,566,243 | | 21,921 | | (21,467) | | $8,566,697 | |
| | | | | | | | | | | | | | |
| LIABILITIES AND EQUITY | | | |
| | | | |
| Non-current liabilities: | | | | |
| Unsecured debt, net | $2,425,089 | | — | | — | | $2,425,089 | |
| Other non-current liabilities | 655,699 | | — | | — | | 655,699 | |
| 3,080,788 | | — | | — | | 3,080,788 | |
| Current liabilities: | | | | |
| | | | |
Intercompany payable(2) | 21,429 | | — | | (21,429) | | — | |
| Other current liabilities | 142,492 | | 21,883 | | — | | 164,375 | |
| Total liabilities | 3,244,709 | | 21,883 | | (21,429) | | 3,245,163 | |
| | | | |
| Equity: | | | | |
| Stapled unitholders’ equity | 5,318,615 | | 38 | | — | | 5,318,653 | |
| Non-controlling interests | 2,919 | | — | | (38) | | 2,881 | |
| Total liabilities and equity | $8,566,243 | | 21,921 | | (21,467) | | $8,566,697 | |
(1) Granite LP is 100% owned by Granite REIT and Granite GP.
(2) Represents employee and trustee/director compensation related amounts which will be reimbursed by Granite LP.
| | | | | | | | | | | | | | |
| Income Statement | Year Ended December 31, 2022 |
| Granite REIT | Granite GP | Eliminations/
Adjustments | Granite REIT and Granite GP Combined |
| Revenue | $455,579 | | — | | — | | $455,579 | |
| | | | |
| General and administrative expenses | 29,465 | | — | | — | | 29,465 | |
| Interest expense and other financing costs | 50,967 | | — | | — | | 50,967 | |
| Other costs and expenses, net | 73,979 | | — | | — | | 73,979 | |
| Share of (income) loss of Granite LP | — | | (2) | | 2 | | — | |
| Fair value losses on investment properties, net | 219,728 | | — | | — | | 219,728 | |
| Fair value gains on financial instruments, net | (11,383) | | — | | — | | (11,383) | |
| Loss on sale of investment properties | 666 | | — | | — | | 666 | |
| Income before income taxes | 92,157 | | 2 | | (2) | | 92,157 | |
| Income tax recovery | (63,665) | | — | | — | | (63,665) | |
| Net income | 155,822 | | 2 | | (2) | | 155,822 | |
| Less net income attributable to non-controlling interests | 56 | | — | | (2) | | 54 | |
| Net income attributable to stapled unitholders | $155,766 | | 2 | | — | | $155,768 | |
| | | | | | | | | | | | | | |
| Income Statement | Year Ended December 31, 2021 |
| Granite REIT | Granite GP | Eliminations/
Adjustments | Granite REIT and Granite GP Combined |
| Revenue | $393,488 | | — | | — | | $393,488 | |
| | | | |
| General and administrative expenses | 38,400 | | — | | — | | 38,400 | |
| Interest expense and other financing costs | 47,226 | | — | | — | | 47,226 | |
| Other costs and expenses, net | 53,913 | | — | | — | | 53,913 | |
| Share of (income) loss of Granite LP | — | | (13) | | 13 | | — | |
| Fair value gains on investment properties, net | (1,298,865) | | — | | — | | (1,298,865) | |
| Fair value losses on financial instruments, net | 1,214 | | — | | — | | 1,214 | |
| Loss on sale of investment properties | 761 | | — | | — | | 761 | |
| Income before income taxes | 1,550,839 | | 13 | | (13) | | 1,550,839 | |
| Income tax expense | 240,567 | | — | | — | | 240,567 | |
| | | | |
| | | | |
| Net income | 1,310,272 | | 13 | | (13) | | 1,310,272 | |
| Less net income attributable to non-controlling interests | 348 | | — | | (13) | | 335 | |
| | | | |
| Net income attributable to stapled unitholders | $1,309,924 | | 13 | | — | | $1,309,937 | |
| | | | | | | | | | | | | | | | | | | | |
| Statement of Cash Flows | Year Ended December 31, 2022 |
| Granite REIT | Granite GP | Eliminations/
Adjustments | Granite REIT and Granite GP Combined |
| OPERATING ACTIVITIES | | | | | | |
| Net income | | $155,822 | | 2 | | (2) | | | $155,822 | |
| Items not involving operating cash flows | | 135,088 | | (2) | | 2 | | | 135,088 | |
| Changes in working capital balances | | 292 | | (394) | | — | | | (102) | |
| Other operating activities | | (13,312) | | — | | — | | | (13,312) | |
| Cash provided by (used in) operating activities | | 277,890 | | (394) | | — | | | 277,496 | |
| INVESTING ACTIVITIES | | | | | | |
| Property acquisitions | | (492,717) | | — | | — | | | (492,717) | |
| Proceeds from disposals, net | | 63,943 | | — | | — | | | 63,943 | |
| Additions to income-producing properties | | (54,933) | | — | | — | | | (54,933) | |
| Additions to properties under development | | (212,245) | | — | | — | | | (212,245) | |
| Construction funds in escrow | | (4,720) | | — | | — | | | (4,720) | |
| Other investing activities | | (65,884) | | — | | — | | | (65,884) | |
| Cash used in investing activities | | (766,556) | | — | | — | | | (766,556) | |
| FINANCING ACTIVITIES | | | | | | |
| Distributions paid | | (202,284) | | — | | — | | | (202,284) | |
| Other financing activities | | 416,843 | | — | | — | | | 416,843 | |
| Cash provided by financing activities | | 214,559 | | — | | — | | | 214,559 | |
| Effect of exchange rate changes | | 7,069 | | — | | — | | | 7,069 | |
| Net decrease in cash and cash equivalents during the year | | $(267,038) | (394) | | — | | | $(267,432) |
| | | | | | | | | | | | | | | | | | | | |
| Statement of Cash Flows | Year Ended December 31, 2021 |
| Granite REIT | Granite GP | Eliminations/
Adjustments | Granite REIT and Granite GP Combined |
| OPERATING ACTIVITIES | | | | | | |
| Net income | | $1,310,272 | | 13 | | (13) | | | $1,310,272 | |
| Items not involving operating cash flows | | (1,051,650) | | (13) | | 13 | | | (1,051,650) | |
| Changes in working capital balances | | (1,675) | | (371) | | — | | | (2,046) | |
| Other operating activities | | 5,688 | | — | | — | | | 5,688 | |
| Cash provided by (used in) operating activities | | 262,635 | | (371) | | — | | | 262,264 | |
| INVESTING ACTIVITIES | | | | | | |
| Property acquisitions | | (925,447) | | — | | — | | | (925,447) | |
| Proceeds from disposals, net | | 35,428 | | — | | — | | | 35,428 | |
| Additions to income-producing properties | | (28,003) | | — | | — | | | (28,003) | |
| Additions to properties under development | | (71,168) | | — | | — | | | (71,168) | |
| Construction funds released from escrow | | 8,341 | | — | | — | | | 8,341 | |
| Other investing activities | | (44,575) | | — | | — | | | (44,575) | |
| Cash used in investing activities | | (1,025,424) | | — | | — | | | (1,025,424) | |
| FINANCING ACTIVITIES | | | | | | |
| Distributions paid | | (191,082) | | — | | — | | | (191,082) | |
| Other financing activities | | 524,557 | | — | | — | | | 524,557 | |
| Cash provided by financing activities | | 333,475 | | — | | — | | | 333,475 | |
| Effect of exchange rate changes | | 918 | | | | | 918 | |
| Net decrease in cash and cash equivalents during the year | | $(428,396) | (371) | | — | | | $(428,767) |
| | | | | |
| 22. | COMMITMENTS AND CONTINGENCIES |
(a) The Trust is subject to various legal proceedings and claims that arise in the ordinary course of business. Management evaluates all claims with the advice of legal counsel. Management believes these claims are generally covered by Granite's insurance policies and that any liability from remaining claims is not probable to occur and would not have a material adverse effect on the combined financial statements. However, actual outcomes may differ from management's expectations.
(b) As at December 31, 2022, the Trust's contractual commitments totaled $177.9 million which comprised of construction and development projects of $143.1 million and the committed acquisitions of two properties in Indiana upon completion totaling $34.8 million. As at December 31, 2022, the Trust has made deposits of $8.5 million in respect of the above committed acquisitions. The deposits are recorded as acquisition deposits on the combined balance sheet.
(c) In connection with the acquisitions of investment properties located in Palmetto, Georgia on November 12, 2020 and in Locust Grove, Georgia on March 12, 2021, $131.4 million (US$97.1 million) of bonds were assumed. The authorized amount of the bonds is $140.7 million (US$104.0 million), of which $131.4 million (US$97.1 million) was outstanding as at December 31, 2022. The bonds provide for a real estate tax abatement for the acquired investment properties. Through a series of transactions, the Trust is both the bondholder and the obligor of the bonds. Therefore, in accordance with IAS 32, the bonds are not recorded in the combined balance sheet.
The Trust is involved, in the normal course of business, in discussions, and has various letters of intent or conditional agreements, with respect to possible acquisitions of new properties and dispositions of existing properties in its portfolio. None of these commitments or contingencies, individually or in aggregate, would have a material impact on the combined financial statements.
(a) Subsequent to December 31, 2022, the Trust declared monthly distributions for January and February 2023 of $17.0 million each (note 12).
(b) On March 3, 2023, Granite amended its Credit Facility to extend the maturity date for a new five-year term to March 31, 2028.

| | | | | | | | | | | | | | |
| Board of Trustees | | Officers | | Office Location |
| | | | |
Kelly Marshall Chairman
Peter Aghar Trustee
Remco Daal Trustee
Kevan Gorrie Trustee
Fern Grodner Trustee
Al Mawani Trustee
Gerald Miller Trustee
Sheila Murray Trustee
Emily Pang Trustee
Jennifer Warren Trustee | | Kevan Gorrie President and Chief Executive Officer
Teresa Neto Chief Financial Officer
Lorne Kumer Executive Vice President, Head of Global Real Estate
Michael Ramparas Executive Vice President, Global Real Estate and Head of Investments
Lawrence Clarfield Executive Vice President, General Counsel and Corporate Secretary | | 77 King Street West Suite 4010, P.O. Box 159 Toronto-Dominion Centre Toronto, ON M5K 1H1 Phone: (647) 925-7500 Fax: (416) 861-1240 |
| |
| |
| |
| |
| |
| |
| | Investor Relations Queries |
| |
Kevan Gorrie President and Chief Executive Officer (647) 925-7500
Teresa Neto Chief Financial Officer (647) 925-7560 |
| |
| |
| |
| |
| |
| |
| |
| | |
| | |
| | |
| | | | |
| | Transfer Agents and Registrars | | |
| | | | |
| | Canada Computershare Investor Services Inc. 100 University Avenue, 8th Floor, North Tower Toronto, Ontario, Canada M5J 2Y1 Phone: 1 (800) 564-6253 www.computershare.com | | United States Computershare Trust Company N.A. 462 S. 4th Street Louisville, Kentucky, USA 40202 |
| | |
| | |
| | |
| | |
| | | | |
| Exchange Listings | | | | |
| Stapled Units | | – Toronto Stock Exchange (GRT.UN) and New York Stock Exchange (GRP.U) |
| | | | |
| Please refer to our website (www.granitereit.com) for information on Granite’s compliance with the corporate governance standards of the New York Stock Exchange and applicable Canadian standards and guidelines. |
| | | | |
| Publicly Available Documents | | |
Copies of the financial statements for the year ended December 31, 2022 are available through the Internet on the Electronic Data Gathering Analysis and Retrieval System (EDGAR), which can be accessed at www.sec.gov, and on the System for Electronic Document Analysis and Retrieval (SEDAR), which can be accessed at www.sedar.com. Other required securities filings can also be found on EDGAR and SEDAR. |
|
|
|
| | |
| Granite REIT |
|
| 77 King Street West |
| Suite 4010, P.O. Box 159 |
| Toronto-Dominion Centre |
| Toronto, ON M5K 1H1 |
| Phone: (647) 925-7500 |
| Fax: (416) 861-1240 |
| www.granitereit.com |