UNITED STATES
SECURITIES AND EXCHANGE COMMISSION
Washington, D.C. 20549
FORM N-CSR
CERTIFIED SHAREHOLDER REPORT OF
REGISTERED MANAGEMENT INVESTMENT COMPANIES
Investment Company Act file number 811-22779
Nuveen Intermediate Duration Quality Municipal Term Fund
(Exact name of registrant as specified in charter)
Nuveen Investments
333 West Wacker Drive
Chicago, IL 60606
(Address of principal executive offices) (Zip code)
Kevin J. McCarthy
Nuveen Investments
333 West Wacker Drive
Chicago, IL 60606
(Name and address of agent for service)
Registrant's telephone number, including area code: (312) 917-7700
Date of fiscal year end: May 31
Date of reporting period: May 31, 2013
Form N-CSR is to be used by management investment companies to file reports with the Commission not later than 10 days after the transmission to stockholders of any report that is required to be transmitted to stockholders under Rule 30e-1 under the Investment Company Act of 1940 (17 CFR 270.30e-1). The Commission may use the information provided on Form N-CSR in its regulatory, disclosure review, inspection, and policymaking roles.
A registrant is required to disclose the information specified by Form N-CSR, and the Commission will make this information public. A registrant is not required to respond to the collection of information contained in Form N-CSR unless the Form displays a currently valid Office of Management and Budget (“OMB”) control number. Please direct comments concerning the accuracy of the information collection burden estimate and any suggestions for reducing the burden to Secretary, Securities and Exchange Commission, 450 Fifth Street, NW, Washington, DC 20549-0609. The OMB has reviewed this collection of information under the clearance requirements of 44 U.S.C. ss. 3507.
ITEM 1. REPORTS TO STOCKHOLDERS.
LIFE IS COMPLEX.
Nuveen makes things e-simple.
It only takes a minute to sign up for e-Reports. Once enrolled, you’ll receive an e-mail as soon as your Nuveen Fund information is ready. No more waiting for delivery by regular mail. Just click on the link within the e-mail to see the report and save it on your computer if you wish.
Free e-Reports right to your e-mail!
www.investordelivery.com
If you receive your Nuveen Fund distributions and statements from your financial advisor or brokerage account.
OR
www.nuveen.com/accountaccess
If you receive your Nuveen Fund distributions and statements directly from Nuveen.
Table of Contents
| Chairman’s Letter to Shareholders | 4 |
| | |
| Portfolio Managers’ Comments | 5 |
| | |
| Fund Leverage | 9 |
| | |
| Common Share Information | 10 |
| | |
| Risk Considerations | 11 |
| | |
| Performance Overview and Holding Summaries | 12 |
| | |
| Report of Independent Registered Public Accounting Firm | 14 |
| | |
| Portfolios of Investments | 15 |
| | |
| Statement of Assets and Liabilities | 41 |
| | |
| Statement of Operations | 42 |
| | |
| Statement of Changes in Net Assets | 43 |
| | |
| Statement of Cash Flows | 44 |
| | |
| Financial Highlights | 46 |
| | |
| Notes to Financial Statements | 48 |
| | |
| Board Members & Officers | 58 |
| | |
| Annual Investment Management Agreement Approval Process | 63 |
| | |
| Reinvest Automatically, Easily and Conveniently | 74 |
| | |
| Glossary of Terms Used in this Report | 76 |
| | |
| Additional Fund Information | 79 |
Chairman’s
Letter to Shareholders
Dear Shareholders,
After nine years of serving as lead director and independent chairman of the Nuveen Fund Board, my term of office is coming to an end. It has been a privilege to use this space to communicate with you on some of the broad economic trends in the U.S. and abroad and how they are impacting the investment environment in which your funds operate. In addition, I have enjoyed offering some perspective on how your Board views the various Nuveen investment teams as they apply their investment disciplines in that investment environment.
My term has coincided with a particularly challenging period for both mutual fund sponsors and investors. Since 2000 there have been three periods of unusually strong stock market growth and two major market declines. Recent years have been characterized by a search for yield in fixed income securities to compensate for an extended period of very low interest rates. Funds are investing more in foreign and emerging markets that require extensive research capabilities to overcome the more limited transparency and higher volatility in those markets. New fund concepts often incorporate derivative financial instruments that offer efficient ways to hedge investment risk or gain exposure to selected markets. Fund trading teams operate in many new domestic and international venues with quite different characteristics. Electronic trading and global communication networks mean that fund managers must be able to thrive in financial markets that react instantaneously to newsworthy events and are more interconnected than ever.
Nuveen has committed additional resources to respond to these changes in the fund industry environment. It has added IT and research resources to assemble and evaluate the increased flow of detailed information on economies, markets and individual companies. Based on its experience during the financial crisis of 2008-09, Nuveen has expanded its resources dedicated to valuing and trading portfolio securities with a particular focus on stressed financial market conditions. It has added systems and experienced risk management professionals to work with investment teams to better help evaluate whether their funds’ risk exposures are appropriate in view of the return targets. The investment teams have also reflected on recent experience to reaffirm or modify their investment disciplines. Finally, experienced professionals and IT resources have been added to address new regulatory requirements designed to better inform and protect investors. The Board has enthusiastically encouraged these initiatives.
The Nuveen Fund Board has always viewed itself as your representatives to assure that Nuveen brings together experienced people, proven technologies and effective processes designed to produce results that meet investor expectations. It is important to note that our activities are highlighted by the annual contract renewal process. Despite its somewhat formal language, I strongly encourage you to read the summary because it offers an insight into our oversight process. The report is included in the back of this or a subsequent shareholder report. The renewal process is very comprehensive and includes a number of evaluations and discussions between the Board and Nuveen during the year. The summary also describes what has been achieved across the Nuveen fund complex and at individual funds such as yours.
As I leave the chairmanship and resume my role as a member of the Board, please be assured that I and my fellow Board members will continue to hold your interests uppermost in our minds as we oversee the management of your funds and that we greatly appreciate your confidence in your Nuveen fund.
Very sincerely,
Robert P. Bremner
Chairman of the Board
July 23, 2013
Portfolio Managers’ Comments
Nuveen Intermediate Duration Municipal Term Fund (NID)
Nuveen Intermediate Duration Quality Municipal Term Fund (NIQ)
Portfolio managers Daniel Close, John Miller, Timothy Ryan and Steve Hlavin discuss key investment strategies and the since inception performance of these two Funds. John, Timothy and Steve have managed NID since its inception in December 2012. Dan has managed NIQ since its inception in February 2013.
While this is an annual report, the Funds’ performance discussions encompasses abbreviated reporting periods from inception on December 5, 2012 through May 31, 2013 and February 7, 2013 through May 31, 2013.
What factors affected the U.S. economy and municipal market during the Funds’ abbreviated reporting period ended May 31, 2013?
During the reporting periods, the U.S. economy’s progress toward recovery from recession continued at a moderate pace. The Federal Reserve (Fed) maintained its efforts to improve the overall economic environment by holding the benchmark fed funds rate at the record low level of zero to 0.25% that it established in December 2008. The Fed also continued its monthly purchases of $40 billion of mortgage-backed securities and $45 billion of longer-term Treasury securities in an open-ended effort to bolster growth. However, at its June 2013 meeting (subsequent to the end of this reporting period), the Central Bank indicated that downside risks to the economy had diminished since the fall of 2012. Although the Fed made no changes to its highly accommodative monetary policies at the June meeting, Chairman Bernanke’s remarks afterward indicated the Central Bank could slow the pace of its bond buying program later this year if the economy continues to improve.
As measured by gross domestic product (GDP), the U.S. economy grew at an annualized rate of 1.8% in the first quarter of 2013, compared with 0.4% for the fourth quarter of 2012, continuing the pattern of positive economic growth for the 15th consecutive quarter. The Consumer Price Index (CPI) rose 1.4% year-over-year as of May 2013, while the core CPI (which excludes food and energy) increased 1.7% during the twelve-month reporting period, staying within the Fed’s unofficial objective of 2.0% or lower for this inflation measure. Meanwhile, labor market conditions continued to slowly show signs of improvement, although unemployment remained above the Central Bank’s 6.5% target. As of May 2013, the national unemployment rate was 7.6%, down from 8.2% a year ago. The housing market, long a major weak spot in the U.S. economic recovery, also delivered some good news as the average home price in the S&P/Case-Shiller Index of 20 major metropolitan areas rose 12.1% for the twelve months ended April 2013 (most recent data available at the time this report was prepared). This marked the largest twelve-month percentage gain for the index since 2006.
| Certain statements in this report are forward-looking statements. Discussions of specific investments are for illustration only and are not intended as recommendations of individual investments. The forward-looking statements and other views expressed herein are those of the portfolio managers as of the date of this report. Actual future results or occurrences may differ significantly from those anticipated in any forward-looking statements, and the views expressed herein are subject to change at any time, due to numerous market and other factors. The Funds disclaim any obligation to update publicly or revise any forward-looking statements or views expressed herein. |
Ratings shown are the highest rating given by one of the following national rating agencies: Standard & Poor’s, Moody’s Investors Service, Inc. or Fitch, Inc. Credit ratings are subject to change. AAA, AA, A, and BBB are investment grade ratings; BB, B, CCC, CC, C and D are below-investment grade ratings. Certain bonds backed by U.S. Government or agency securities are regarded as having an implied rating equal to the rating of such securities. Holdings designated N/R are not rated by these national rating agencies.
However, the outlook for the U.S. economy continued to be clouded by uncertainty about global financial markets and the outcome of the “fiscal cliff.” The tax consequences of the fiscal cliff situation, which had been scheduled to become effective in January 2013, were averted through a last minute deal that raised payroll taxes, but left in place a number of tax breaks. However, lawmakers postponed and then failed to reach a resolution on $1.2 trillion in spending cuts intended to address the federal budget deficit. As a result, automatic spending cuts (or sequestration) affecting both defense and non-defense programs (excluding Social Security and Medicaid) took effect March 1, 2013, with potential implications for U.S. economic growth over the next decade. In late March 2013, Congress passed legislation that established federal funding levels for the remainder of fiscal 2013, which ends on September 30, 2013, preventing a federal government shutdown. The proposed federal budget for fiscal 2014 remains under debate.
Municipal bond prices generally rallied nationally during this period, as strong demand and tight supply combined to create favorable market conditions for municipal bonds. However, the market also encountered some additional volatility generated by the political environment, particularly the fiscal cliff at the end of 2012 and the approach of federal tax season. Although the total volume of tax-exempt supply improved, the issuance pattern remained light compared with long-term historical trends and new money issuance was relatively flat. This supply/demand dynamic served as a key driver of performance. At the state level, state governments in aggregate appeared to have made good progress in dealing with budget issues. On the revenue side, state tax collections have grown for 13 straight quarters, exceeding pre-recession levels beginning in September 2011, while on the expense side, the states made headway in cutting and controlling costs. The current low level of municipal issuance reflects the current political distaste for additional borrowing by state and local governments facing fiscal constraints and the prevalent atmosphere of municipal budget austerity. We continued to see municipal yields remain relatively low. Borrowers seeking to take advantage of the low rate environment sparked an increase in refunding activity, with approximately two thirds of municipal paper issued by borrowers that were calling existing debt and refinancing at lower rates.
What key strategies were used to manage these Funds during the abbreviated reporting period ended May 31, 2013?
In the abbreviated reporting period since its inception date of December 5, 2012 through the end of May 2013, our primary management focus for NID was to get the portfolio fully invested in securities with long-term potential. We focused on bonds with maturities in the center/middle third of the yield curve. We also favored bonds with slightly longer maturities with shorter call features. We maintained a balance between 60% investment grade and 40% below investment grade during the invest-up period. As the reporting period progressed, we opportunistically swapped out some of our investment grade bonds for below investment grade ones. We believe the incremental yield on BBB and lower rated credits, which is currently wider than average, may help cushion the Fund during periods of rising rates. To help deliver more consistently on our intermediate mandate, we focused on option adjusted or effective duration when managing interest rate risk. We believe this helps us more accurately measure the extension risk of any given bond and project price sensitivity to more pronounced interest rate movements.
For NIQ, the brief span between the Fund’s inception date of February 7th, and the end of May 2013, our primary management focus was to get the portfolio fully invested in securities with long-term potential.
We were successful in building a portfolio of intermediate-duration bonds that fell within both our duration and target maturity range. Given market conditions in this initial period of investment, the Fund’s duration was at the longer end of that range because we believed that investors could be disproportionately rewarded for investing in longer bonds, given the significant differential in yields between longer-dated and shorter-dated issues. Our purchases were broadly diversified across multiple sectors and geographic regions, and we also owned bonds across the credit-rating spectrum consisting of a good mix of highly rated securities as well as some below-investment-grade bonds that we believed offered our shareholders good long-term value. Our purchases included both the primary and secondary market, with secondary market purchases constituting relatively more activity.
As of May 31, 2013, both Funds invested in inverse floating rate securities. We employ inverse floaters for a variety of reasons, including duration management, income enhancement and total return enhancement. Specifically, in NID, we tactically levered floating rate notes secured by appropriation bonds from the state of New Jersey. As the demand for floating rate securities increased, the notes traded higher. In both Funds, we entered into duration shortening swaps to help maintain our 10-year duration mandate. These swaps made a modestly positive contribution to performance during the period.
How did the Funds perform during the abbreviated reporting period ended May 31, 2013?
The tables in each Fund’s Performance Overview and Holding Summaries section of this report provide total returns for the Funds for the since inception periods ended May 31, 2013. Each Fund’s total returns are compared with performance of a corresponding market index and Lipper classification average.
For the abbreviated periods ended May 31, 2013, the cumulative return on common share net asset value (NAV) for NID outperformed the S&P Municipal Bond Intermediate Index, while the cumulative return on common share on NAV for NIQ underperformed the index. For the same periods both NID and NIQ performed in line with their respective Lipper classification average.
Key management factors that influenced the Funds’ returns during this period included duration and yield curve positioning, credit exposure and sector allocation.
During the abbreviated periods for both Funds, credits at the longest end of the municipal yield curve posted the weakest returns, while bonds at the shortest end produced stronger results. Duration and yield curve positioning was a net negative contributor to the performance of these Funds. Both Funds were generally overweight in the longer part of the yield curve which underperformed. In particular for NIQ, we expect the Fund to maintain a longer duration profile versus the S&P Municipal Bond Intermediate Index, which is positioned lower than the Fund.
Credit exposure was a positive contributor to both Funds’ performance, as lower quality bonds generally outperformed higher quality bonds. This outperformance was due in part to the greater demand for lower rated bonds as investors looked for investment vehicles offering higher yields. As investors became more comfortable taking on additional investment risk, credit spreads or the difference in yield spreads between U.S. Treasury securities and comparable investments such as municipal bonds, narrowed through a variety of rating categories. As a result of this spread compression, the Funds generally benefited from their holdings of lower rated credits. NID and NIQ were also helped by being underweighted in the underperforming AAA and AA rated quality sector.
During this period, NID had several specific holdings that positively contributed to performance, for example, Foxwoods Resort Casino in Connecticut. We bought the position when it was in default. It has rallied based on anticipated higher recovery rates. We sold out this position during reporting period. Navistar International Corp. recovery zone facility revenue bonds, also aided performance as the company reported better than expected results for the company’s turnaround plan. Also helping performance were our tactically levered floating rate notes secured by appropriation bonds from the state of New Jersey. As the demand for floating rate securities increased, the notes traded higher.
From a sector standpoint, NID benefited from our overweight to tobacco, health care and industrial development (IDRs) bonds. Our underweight in higher education and tax-supported bonds helped performance as these sectors underperformed. However, several of our individual holdings in the higher education sector underperformed as well. In NIQ, our overweight to appropriation and tobacco positively contributed to the Fund’s performance.
Shareholders also should be aware of issues impacting some of the Funds’ non-state holdings, i.e., the downgrades of bonds issued by Puerto Rico. In December 2012, Moody’s down-graded Puerto Rico general obligation (GO) bonds to Baa3 from Baa1 based on Puerto Rico’s ongoing economic problems, unfunded pension liabilities, elevated debt levels and structural budget gaps. In addition, during July 2012, bonds issued by the Puerto Rico Sales Tax Financing Corporation (COFINA) also were downgraded by Moody’s to Aa3 from Aa2. The downgrade of the COFINA bonds was due mainly to the performance of Puerto Rico’s economy and its impact on the projected growth of sales tax revenues. In addition, the COFINA bonds were able to maintain a higher rating than the GOs because, unlike the revenue streams supporting some Puerto Rican issues, the sales taxes supporting the COFINA bonds cannot be diverted and used to support the commonwealth’s GO bonds. Both of the Funds invested in Puerto Rico bonds during their invest-up period. Our purchases focused on Puerto Rico GOs, which are backed by MBIA who assures timely interest payments. NID also invested in shorter maturity Puerto Rico bonds that have generally been less volatile.
Fund Leverage
IMPACT OF THE FUNDS’ LEVERAGE STRATEGIES ON PERFORMANCE
One important factor impacting the returns of both these Funds relative to the comparative indexes was the Funds’ use of leverage. The Funds use leverage because their managers believe that, over time, leveraging provides opportunities for additional income and total return for common shareholders. However, use of leverage also can expose common shareholders to additional volatility. For example, as the prices of securities held by a Fund decline, the negative impact of these valuation changes on common share net asset value and common shareholder total return is magnified by the use of leverage. Conversely, leverage may enhance common share returns during periods when the prices of securities held by a Fund generally are rising. Leverage detracted from the performance of both Funds since their respective inception dates.
As of May 31, 2013, the Funds’ percentages of effective and regulatory leverage are shown in the accompanying table.
| | | | | | | | |
| | | | Effective | | | Regulatory | |
| Fund | | | Leverage | * | | Leverage | * |
| NID | | | 34.05 | % | | 21.00 | % |
| NIQ | | | 37.58 | % | | 22.93 | % |
| * | Effective Leverage is a Fund’s effective economic leverage, and includes both regulatory leverage and the leverage effects of certain derivative and other investments in a Fund’s portfolio that increase the Fund’s investment exposure. Currently, the leverage effects of Tender Option Bond (TOB) inverse floater holdings are included in effective leverage values, in addition to any regulatory leverage. Regulatory leverage consists of preferred shares issued or borrowings of a Fund. Both of these are part of a Fund’s capital structure. Regulatory leverage is sometimes referred to as “40 Act Leverage” and is subject to asset coverage limits set forth in the Investment Company Act of 1940. |
THE FUNDS’ REGULATORY LEVERAGE
As of May 31, 2013, the Funds have issued and outstanding Variable Rate MuniFund Term Preferred (VMTP) Shares as shown in the accompanying tables.
VMTP Shares
| | | | | | | | |
| | | | | | | VMTP Shares Issued | |
| Fund | | | Series | | | at Liquidation Value | |
| NID | | | 2016 | | $ | 175,000,000 | |
| NIQ | | | 2016 | | $ | 55,000,000 | |
Refer to Notes to Financial Statements, Footnote 1 – General Information and Significant Accounting Policies for further details on VMTP Shares.
Common Share Information
COMMON SHARE DIVIDEND INFORMATION
During the current reporting period ended May 31, 2013, the Funds’ monthly dividends to shareholders were as shown in the accompanying table.
| | | | Per Common Share Amounts | |
| | | | NID | * | | NIQ | ** |
| February | | $ | 0.0550 | | $ | — | |
| March | | | 0.0550 | | | — | |
| April | | | 0.0550 | | $ | 0.0480 | |
| May | | | 0.0550 | | | 0.0480 | |
| | | | | | | | |
| Market Yield*** | | | 5.08 | % | | 4.40 | % |
| Taxable-Equivalent Yield*** | | | 7.06 | % | | 6.11 | % |
| * | The Fund declared its initial monthly distribution to common shareholders in January 2013. |
| ** | The Fund declared its initial monthly distribution to common shareholders in March 2013. |
| *** | Market Yield is based on the Fund’s current annualized monthly dividend divided by the Fund’s current market price as of the end of the reporting period. Taxable-Equivalent Yield represents the yield that must be earned on a fully taxable investment in order to equal the yield of the Fund on an after-tax basis. It is based on a federal income tax rate of 28.0%. When comparing a Fund to investments that generate qualified dividend income, the Taxable-Equivalent Yield is lower. |
The Funds in this report seek to pay stable dividends at rates that reflect each Fund’s past results and projected future performance. During certain periods, each Fund may pay dividends at a rate that may be more or less than the amount of net investment income actually earned by the Fund during the period. If a Fund has cumulatively earned more than it has paid in dividends, it holds the excess in reserve as undistributed net investment income (UNII) as part of the Fund’s NAV. Conversely, if a Fund has cumulatively paid dividends in excess of its earnings, the excess constitutes negative UNII that is likewise reflected in the Fund’s NAV. Each Fund will, over time, pay all of its net investment income as dividends to shareholders. As of May 31, 2013, both Funds in this report had positive UNII balances for both tax purposes and financial reporting purposes.
COMMON SHARE OTHER INFORMATION
As of May 31, 2013, and during the current reporting period, the of the Funds’ common share prices were trading at a premium/(discount) to their common share NAVs as shown in the accompanying table.
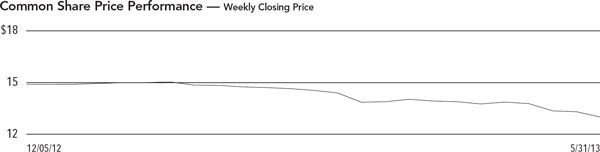
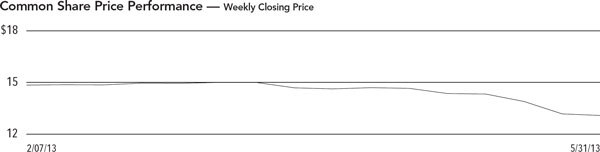
| | | | NID | | | NIQ | |
| Common Share NAV | | $ | 14.04 | | $ | 14.12 | |
| Common Share Price | | $ | 13.00 | | $ | 13.09 | |
| Premium/(Discount) to NAV | | | -7.41 | % | | -7.29 | % |
Since Inception Average Premium/(Discount) to NAV | | | 1.08 | % | | 1.84 | % |
Risk Considerations
Fund shares are not guaranteed or endorsed by any bank or other insured depository institution, and are not federally insured by the Federal Deposit Insurance Corporation. Past performance is no guarantee of future results. Fund common shares are subject to a variety of risks, including:
Investment, Market and Price Risk. An investment in common shares is subject to investment risk, including the possible loss of the entire principal amount that you invest. Your investment in common shares represents an indirect investment in the municipal securities owned by the Fund, which generally trade in the over-the-counter markets. Shares of closed-end investment companies like these Funds frequently trade at a discount to their net asset value (NAV). Your common shares at any point in time may be worth less than your original investment, even after taking into account the reinvestment of Fund dividends and distributions.
Tax Risk. The tax treatment of Fund distributions may be affected by new IRS interpretations of the Internal Revenue Code and future changes in tax laws and regulations.
Issuer Credit Risk. This is the risk that a security in a Fund’s portfolio will fail to make dividend or interest payments when due.
Ten-Year Term Risk. The fund has a ten year term, at which time the fund will liquidate its portfolio investments and return the proceeds to its shareholders at that time. The fund’s investment objectives and policies are not designed to return a shareholder’s initial investment.
Interest Rate Risk. Fixed-income securities such as bonds, preferred, convertible and other debt securities will decline in value if market interest rates rise.
Reinvestment Risk. If market interest rates decline, income earned from a Fund’s portfolio may be reinvested at rates below that of the original bond that generated the income.
Call Risk or Prepayment Risk. Issuers may exercise their option to prepay principal earlier than scheduled, forcing a Fund to reinvest in lower-yielding securities.
Inverse Floater Risk. The Funds may invest in inverse floaters. Due to their leveraged nature, these investments can greatly increase a Fund’s exposure to interest rate risk and credit risk. In addition, investments in inverse floaters involve the risk that the Fund could lose more than its original principal investment.
Derivatives Risk. The Funds may use derivative instruments which involve a high degree of financial risk, including the risk that the loss on a derivative may be greater than the principal amount investment.
Leverage Risk. Each Fund’s use of leverage creates the possibility of higher volatility for the Fund’s per share NAV, market price, distributions and returns. There is no assurance that a Fund’s leveraging strategy will be successful.
Nuveen Intermediate Duration Municipal Term Fund (NID)
Performance Overview and Holding Summaries as of May 31, 2013
Cumulative Total Returns as of May 31, 2013
| | Cumulative |
| | Since Inception5 |
| NID at Common Share NAV | (0.46)% |
| NID at Common Share Price | (11.94)% |
| S&P Municipal Bond Intermediate Index | (0.88)% |
| Lipper General & Insured Leveraged Municipal Debt Funds Classification Average | (0.49)% |
Past performance is not predictive of future results. Current performance may be higher or lower than the data shown. Returns do not reflect the deduction of taxes that shareholders may have to pay on Fund distributions or upon the sale of Fund shares. Comparative index and Lipper return information is provided for the Fund’s shares at NAV only. Indexes and Lipper averages are not available for direct investment.
Portfolio Composition1,4 | |
| (as a % of total investments) | |
| Tax Obligation/Limited | 26.3% |
| Health Care | 10.5% |
| Consumer Staples | 9.2% |
| Transportation | 9.0% |
| Tax Obligation/General | 8.9% |
| Education and Civic Organizations | 7.3% |
| Industrials | 6.6% |
| Utilities | 6.1% |
| Long-Term Care | 4.2% |
| Other | 11.9% |
Credit Quality1,2,3 | |
| (as a % of total investment exposure) | |
| AA | 18.1% |
| A | 20.8% |
| BBB | 16.0% |
| BB or lower | 25.1% |
| N/R | 18.9% |
States1,4 | |
| (as a % of total investments) | |
| California | 12.3% |
| Illinois | 8.3% |
| Texas | 7.9% |
| Florida | 6.4% |
| New York | 5.6% |
| New Jersey | 5.4% |
| Puerto Rico | 5.1% |
| Ohio | 5.1% |
| Michigan | 4.6% |
| Colorado | 3.4% |
| Alabama | 3.0% |
| Pennsylvania | 3.0% |
| Virginia | 2.7% |
| Kansas | 2.0% |
| National | 1.7% |
| Wisconsin | 1.6% |
| Indiana | 1.6% |
| Missouri | 1.6% |
| Other | 18.7% |
| Refer to the Glossary of Terms Used in this Report for further definition of the terms used within this page. |
| 1 | Holdings are subject to change. |
| 2 | Ratings shown are the highest rating given by one of the following national rating agencies: Standard & Poor’s Group, Moody’s Investors Service, Inc. or Fitch, Inc. Credit ratings are subject to change. AAA, AA, A and BBB are investment grade ratings; BB, B, CCC, CC, C and D are below-investment grade ratings. Certain bonds backed by U.S. Government or agency securities are regarded as having an implied rating equal to the rating of such securities. Holdings designated N/R are not rated by these national rating agencies. |
| 3 | Percentage may not add to 100% due to the exclusion of Other Assets Less Liabilities from the table. |
| 4 | Excluding investments in derivatives. |
| 5 | Since inception returns are from 12/5/12. |
Nuveen Intermediate Duration Quality Municipal Term Fund (NIQ)
Performance Overview and Holding Summaries as of May 31, 2013
Cumulative Total Returns as of May 31, 2013
| | Cumulative |
| | Since Inception5 |
| NIQ at Common Share NAV | (0.77)% |
| NIQ at Common Share Price | (12.12)% |
| S&P Municipal Bond Intermediate Index | (0.25)% |
| Lipper Intermediate Municipal Debt Funds Classification Average | (0.80)% |
Past performance is not predictive of future results. Current performance may be higher or lower than the data shown. Returns do not reflect the deduction of taxes that shareholders may have to pay on Fund distributions or upon the sale of Fund shares. Comparative index and Lipper return information is provided for the Fund’s shares at NAV only. Indexes and Lipper averages are not available for direct investment.
Portfolio Composition1,4 | |
| (as a % of total investments) | |
| Tax Obligation/Limited | 20.7% |
| Health Care | 14.5% |
| Utilities | 13.4% |
| Tax Obligation/General | 12.6% |
| Education and Civic Organizations | 9.9% |
| Transportation | 9.8% |
| Consumer Staples | 7.3% |
| Water and Sewer | 5.2% |
| Other | 6.6% |
Credit Quality1,2,3 | |
| (as a % of total investment exposure) | |
| AAA/U.S. Guaranteed | 0.5% |
| AA | 33.0% |
| A | 30.4% |
| BBB | 14.4% |
| BB or Lower | 12.8% |
| N/R | 7.5% |
States1,4 | |
| (as a % of total investments) | |
| California | 12.3% |
| Michigan | 8.7% |
| New Jersey | 8.3% |
| Texas | 7.2% |
| Illinois | 7.2% |
| Florida | 6.2% |
| Puerto Rico | 5.7% |
| Tennessee | 4.7% |
| Pennsylvania | 3.6% |
| New York | 3.5% |
| Ohio | 2.9% |
| Colorado | 2.8% |
| Rhode Island | 2.7% |
| Alabama | 2.5% |
| Massachusetts | 2.2% |
| Other | 19.5% |
| Refer to the Glossary of Terms Used in this Report for further definition of the terms used within this page. |
| 1 | Holdings are subject to change. |
| 2 | Ratings shown are the highest rating given by one of the following national rating agencies: Standard & Poor’s Group, Moody’s Investors Service, Inc. or Fitch, Inc. Credit ratings are subject to change. AAA, AA, A and BBB are investment grade ratings; BB, B, CCC, CC, C and D are below-investment grade ratings. Certain bonds backed by U.S. Government or agency securities are regarded as having an implied rating equal to the rating of such securities. Holdings designated N/R are not rated by these national rating agencies. |
| 3 | Percentage may not add to 100% due to the exclusion of Other Assets Less Liabilities from the table. |
| 4 | Excluding investments in derivatives. |
| 5 | Since inception returns are from 2/7/13. |
Report of Independent
Registered Public Accounting Firm
The Board of Trustees and Shareholders
Nuveen Intermediate Duration Municipal Term Fund
Nuveen Intermediate Duration Quality Municipal Term Fund
We have audited the accompanying statements of assets and liabilities, including the portfolios of investments, of Nuveen Intermediate Duration Municipal Term Fund and Nuveen Intermediate Duration Quality Municipal Term Fund (the “Funds”) as of May 31, 2013, and the related statements of operations, statements of cash flows, statements of changes in net assets, and the financial highlights for the periods indicated therein. These financial statements and financial highlights are the responsibility of the Funds’ management. Our responsibility is to express an opinion on these financial statements and financial highlights based on our audits.
We conducted our audits in accordance with the standards of the Public Company Accounting Oversight Board (United States). Those standards require that we plan and perform the audits to obtain reasonable assurance about whether the financial statements and financial highlights are free of material misstatement. We were not engaged to perform an audit of the Funds’ internal control over financial reporting. Our audits included consideration of internal control over financial reporting as a basis for designing audit procedures that are appropriate in the circumstances, but not for the purpose of expressing an opinion on the effectiveness of the Funds’ internal control over financial reporting. Accordingly, we express no such opinion. An audit also includes examining, on a test basis, evidence supporting the amounts and disclosures in the financial statements and financial highlights, assessing the accounting principles used and significant estimates made by management, and evaluating the overall financial statement presentation. Our procedures included confirmation of securities owned as of May 31, 2013, by correspondence with the custodian and counterparties. We believe that our audits provide a reasonable basis for our opinion.
In our opinion, the financial statements and financial highlights referred to above present fairly, in all material respects, the financial positions of Nuveen Intermediate Duration Municipal Term Fund and Nuveen Intermediate Duration Quality Municipal Term Fund at May 31, 2013, and the results of their operations, their cash flows, the changes in their net assets , and the financial highlights for the periods indicated therein, in conformity with U.S. generally accepted accounting principles.
Chicago, Illinois
July 25, 2013
| | | Nuveen Intermediate Duration Municipal Term Fund |
| NID | | Portfolio of Investments |
| | | May 31, 2013 |
| | Principal | | | | Optional Call | | | | |
| | Amount (000) | | Description (1) | | Provisions (2) | Ratings (3) | | Value | |
| | | | National – 2.1% (1.7% of Total Investments) | | | | | | |
| $ | 7,900 | | MuniMae Tax-Exempt Bond Subsidiary Redeemable Preferred Shares, Multifamily Housing Pool, Series 2013A-5, 5.000%, 1/31/28 (Mandatory put 1/31/18) (Alternative Minimum Tax) | | 1/18 at 100.00 | Ba1 | $ | 7,896,603 | |
| | 5,000 | | MuniMae Tax-Exempt Bond Subsidiary Redeemable Preferred Shares, Multifamily Housing Pool, Series 2000B, 5.750%, 6/30/50 (Mandatory put 9/30/19) (Alternative Minimum Tax) | | 9/19 at 100.00 | Ba2 | | 4,992,000 | |
| | 1,000 | | MuniMae Tax-Exempt Bond Subsidiary Redeemable Preferred Shares, Multifamily Housing Pool, Series 2004A-2, 4.900%, 7/31/49 (Mandatory put 9/30/14) (Alternative Minimum Tax) | | 9/14 at 100.00 | Ba1 | | 989,950 | |
| | 13,900 | | Total National | | | | | 13,878,553 | |
| | | | Alabama – 3.7% (3.0% of Total Investments) | | | | | | |
| | 235 | | Jefferson County Public Building Authority, Alabama, Lease Revenue Warrants, Series 2006, 5.125%, 4/01/21 – AMBAC Insured | | 4/16 at 100.00 | Ca | | 206,422 | |
| | 7,000 | | Jefferson County, Alabama, General Obligation Refunding Warrants, Series 2003A, 5.000%, 4/01/22 – NPFG Insured | | 10/13 at 100.00 | A | | 6,833,120 | |
| | 665 | | Jefferson County, Alabama, General Obligation Warrants, Series 2004A, 5.000%, 4/01/18 – NPFG Insured | | 4/14 at 100.00 | A | | 647,491 | |
| | | | Jefferson County, Alabama, Limited Obligation School Warrants, Education Tax Revenue Bonds, Series 2004A: | | | | | | |
| | 625 | | 5.250%, 1/01/16 | | 1/14 at 100.00 | B | | 625,081 | |
| | 12,915 | | 5.250%, 1/01/20 | | 1/14 at 100.00 | B | | 12,903,761 | |
| | 200 | | 5.500%, 1/01/22 – AGM Insured | | 1/14 at 100.00 | AA | | 200,770 | |
| | 3,185 | | Prattville Industrial Development Board, Alabama, Environmental Improvement Revenue Bonds, International Paper Co. Projects, Series 2006A, 4.750%, 12/01/30 (Alternative Minimum Tax) | | 6/13 at 100.00 | BBB | | 3,240,706 | |
| | 24,825 | | Total Alabama | | | | | 24,657,351 | |
| | | | Alaska – 0.3% (0.2% of Total Investments) | | | | | | |
| | 2,000 | | Northern Tobacco Securitization Corporation, Alaska, Tobacco Settlement Asset-Backed Bonds, Series 2006A, 5.000%, 6/01/32 | | 6/14 at 100.00 | B+ | | 1,864,060 | |
| | | | Arizona – 0.8% (0.7% of Total Investments) | | | | | | |
| | 1,000 | | Arizona Health Facilities Authority, Health Care Facilities Revenue Bonds, The Beatitudes Campus Project, Series 2006, 5.100%, 10/01/22 | | 10/16 at 100.00 | N/R | | 1,011,770 | |
| | | | Downtown Phoenix Hotel Corporation, Arizona, Senior Revenue Bonds, Series 2005A: | | | | | | |
| | 260 | | 4.125%, 7/01/19 – FGIC Insured | | No Opt. Call | BB+ | | 258,198 | |
| | 200 | | 5.250%, 7/01/22 – FGIC Insured | | 1/16 at 100.00 | BB+ | | 207,314 | |
| | 270 | | 5.250%, 7/01/25 – FGIC Insured | | No Opt. Call | BB+ | | 278,197 | |
| | | | Florence Town Inc., Industrial Development Authority, Arizona, Education Revenue Bonds, Legacy Traditional School Project – Queen Creek and Casa Grande Campuses, Series 2013: | | | | | | |
| | 150 | | 4.000%, 7/01/18 | | No Opt. Call | BB | | 149,859 | |
| | 800 | | 5.000%, 7/01/23 | | No Opt. Call | BB | | 795,584 | |
| | 100 | | Phoenix Industrial Development Authority, Arizona, Education Revenue Bonds, Great Hearts Academies – Veritas Project, Series 2012, 6.250%, 7/01/32 | | 7/21 at 100.00 | BB | | 106,378 | |
| | 760 | | Pima County Industrial Development Authority, Arizona, Education Facility Revenue and Refunding Bonds, Edkey Charter Schools Project, Series 2013, 5.000%, 7/01/25 | | 7/20 at 102.00 | BB+ | | 754,520 | |
| | 800 | | University Medical Center Corporation, Tucson, Arizona, Hospital Revenue Bonds, Series 2011, 5.000%, 7/01/19 | | No Opt. Call | BBB+ | | 932,832 | |
| | 1,000 | | Watson Road Community Facilities District, Arizona, Special Assessment Revenue Bonds, Series 2005, 5.750%, 7/01/22 | | 7/16 at 100.00 | N/R | | 1,029,770 | |
| | 5,340 | | Total Arizona | | | | | 5,524,422 | |
| | | | California – 15.4% (12.3% of Total Investments) | | | | | | |
| | 3,050 | | ABAG Finance Authority for Nonprofit Corporations, California, Revenue Bonds, Sharp HealthCare, Series 2009B, 6.375%, 8/01/34 | | 8/14 at 100.00 | A+ | | 3,234,647 | |
| | 100 | | Alameda Corridor Transportation Authority, California, Revenue Bonds, Refunding Subordinate Lien Series 2004A, 5.300%, 10/01/23 – AMBAC Insured | | No Opt. Call | BBB+ | | 110,821 | |
| | 2,490 | | Alvord Unified School District, Riverside County, California, General Obligation Bonds, Tender Option Bond 3306, 26.382%, 8/01/23 (IF) (4) | | No Opt. Call | AA– | | 5,740,446 | |
| | | Nuveen Intermediate Duration Municipal Term Fund (continued) |
| NID | | Portfolio of Investments |
| | | May 31, 2013 |
| | Principal | | | | Optional Call | | | | |
| | Amount (000) | | Description (1) | | Provisions (2) | Ratings (3) | | Value | |
| | | | California (continued) | | | | | | |
| | | | California Statewide Community Development Authority, Revenue Bonds, International School of the Peninsula, Palo Alto, California, Series 2006: | | | | | | |
| $ | 1,190 | | 5.000%, 11/01/16 | | No Opt. Call | N/R | $ | 1,245,811 | |
| | 2,125 | | 5.000%, 11/01/21 | | 11/16 at 100.00 | N/R | | 2,194,211 | |
| | 4,965 | | Ceres Redevelopment Agency, California, Tax Allocation Bonds, Ceres Redevelopment Project Area 1, Series 2006, 4.000%, 11/01/31 – AMBAC Insured | | 11/16 at 100.00 | A– | | 4,591,781 | |
| | 5,000 | | Compton Community Redevelopment Agency, California, Tax Allocation Revenue Bonds, Redevelopment Projects, Second Lien Series 2010B, 5.750%, 8/01/26 | | 8/20 at 100.00 | N/R | | 5,210,950 | |
| | | | Corona-Norco Unified School District Public Financing Authority, Riverside County, California, Special Tax Revenue Refunding Bonds, Junior Lien Series 2013B: | | | | | | |
| | 490 | | 3.000%, 9/01/19 | | No Opt. Call | N/R | | 484,527 | |
| | 500 | | 3.125%, 9/01/20 | | No Opt. Call | N/R | | 489,450 | |
| | 525 | | 3.375%, 9/01/21 | | No Opt. Call | N/R | | 514,332 | |
| | 535 | | 3.500%, 9/01/22 | | No Opt. Call | N/R | | 520,523 | |
| | | | Corona-Norco Unified School District Public Financing Authority, Riverside County, California, Special Tax Revenue Refunding Bonds, Senior Lien Series 2013A: | | | | | | |
| | 500 | | 5.000%, 9/01/21 | | No Opt. Call | BBB+ | | 575,605 | |
| | 500 | | 5.000%, 9/01/22 | | No Opt. Call | BBB+ | | 575,870 | |
| | 2,000 | | Foothill/Eastern Transportation Corridor Agency, California, Toll Road Revenue Bonds, Series 1995A, 5.000%, 1/01/35 – NPFG Insured | | 7/13 at 100.00 | A | | 1,999,820 | |
| | | | Foothill/Eastern Transportation Corridor Agency, California, Toll Road Revenue Refunding Bonds, Series 1999: | | | | | | |
| | 8,750 | | 0.000%, 1/15/33 | | No Opt. Call | BBB– | | 2,715,038 | |
| | 5,000 | | 0.000%, 1/15/34 | | No Opt. Call | BBB– | | 1,455,150 | |
| | | | Golden State Tobacco Securitization Corporation, California, Tobacco Settlement Asset-Backed Bonds, Series 2007A-1: | | | | | | |
| | 4,380 | | 4.500%, 6/01/27 | | 6/17 at 100.00 | B | | 4,308,518 | |
| | 15,000 | | 5.000%, 6/01/33 | | 6/17 at 100.00 | B | | 14,045,247 | |
| | 3,475 | | Hesperia Public Financing Authority, California, Redevelopment and Housing Projects Tax Allocation Bonds, Series 2007A, 5.500%, 9/01/17 – SYNCORA GTY Insured | | No Opt. Call | Ba1 | | 3,808,878 | |
| | | | Indio Redevelopment Agency, California, Tax Allocation Bonds, Merged Area Redevelopment Project, Subordinate Lien Refunding Series 2008A: | | | | | | |
| | 310 | | 5.000%, 8/15/23 | | 8/18 at 100.00 | BBB– | | 319,130 | |
| | 2,365 | | 5.000%, 8/15/24 | | 8/18 at 100.00 | BBB– | | 2,422,493 | |
| | 2,500 | | Los Angeles Department of Airports, California, Revenue Bonds, Los Angeles International Airport, Private Activity, Senior Series 2012A, 5.000%, 5/15/28 (Alternative Minimum Tax) | | 5/22 at 100.00 | AA | | 2,830,275 | |
| | 250 | | National City Community Development Commission, California, Tax Allocation Bonds, National City Redevelopment Project, Series 2011, 7.000%, 8/01/32 | | 8/21 at 100.00 | A– | | 309,565 | |
| | 495 | | Oak Valley Hospital District, Stanislaus County, California, General Obligation Bonds, Series 2005, 4.500%, 7/01/25 – FGIC Insured | | 7/14 at 101.00 | A2 | | 500,826 | |
| | | | Palm Desert Financing Authority, California, Tax Allocation Revenue Bonds, Project Area 2, Series 2006D: | | | | | | |
| | 1,020 | | 0.000%, 8/01/18 | | No Opt. Call | Ba1 | | 784,135 | |
| | 1,165 | | 0.000%, 8/01/19 | | No Opt. Call | Ba1 | | 839,872 | |
| | 1,310 | | 0.000%, 8/01/20 | | No Opt. Call | Ba1 | | 885,691 | |
| | 1,450 | | 0.000%, 8/01/21 | | No Opt. Call | Ba1 | | 916,473 | |
| | | | Palomar Pomerado Health Care District, California, Certificates of Participation, Series 2009: | | | | | | |
| | 2,430 | | 5.500%, 11/01/19 | | No Opt. Call | Baa3 | | 2,768,159 | |
| | 5,000 | | 6.625%, 11/01/29 | | 11/19 at 100.00 | Baa3 | | 5,608,400 | |
| | 700 | | Redwood City, California, Special Tax Refunding Bonds, Redwood Shores Community Facilities District 99-1, Shores Transportation Improvement Project, Series 2012B, 5.000%, 9/01/29 | | No Opt. Call | N/R | | 773,297 | |
| | 410 | | Riverside County, California, Community Facilities District 05-8, Scott Road, Special Tax Bonds Series 2013, 4.000%, 9/01/21 | | No Opt. Call | N/R | | 416,904 | |
| | Principal | | | | Optional Call | | | | |
| | Amount (000) | | Description (1) | | Provisions (2) | Ratings (3) | | Value | |
| | | | California (continued) | | | | | | |
| $ | 2,395 | | San Bernardino Joint Powers Financing Authority, California, Tax Allocation Bonds, Series 2005A, 5.750%, 10/01/24 – AGM Insured | | No Opt. Call | AA– | $ | 2,759,615 | |
| | 175 | | San Diego County, California, Certificates of Participation, Burnham Institute, Series 2006, 5.000%, 9/01/16 | | 9/15 at 102.00 | Baa2 | | 189,172 | |
| | | | San Diego, California, Community Facilities District 3 Liberty Station Special Tax Refunding Bonds Series 2013: | | | | | | |
| | 260 | | 5.000%, 9/01/20 | | No Opt. Call | N/R | | 293,644 | |
| | 455 | | 5.000%, 9/01/22 | | No Opt. Call | N/R | | 512,339 | |
| | 485 | | 5.000%, 9/01/23 | | No Opt. Call | N/R | | 541,420 | |
| | | | San Francisco, California, Community Facilities District 6, Mission Bay South Public Improvements, Special Tax Refunding Bonds, Series 2013A: | | | | | | |
| | 600 | | 5.000%, 8/01/21 | | No Opt. Call | N/R | | 681,204 | |
| | 875 | | 5.000%, 8/01/22 | | No Opt. Call | N/R | | 991,795 | |
| | 420 | | San Jose Redevelopment Agency, California, Tax Allocation Bonds, Merged Area Redevelopment Project, Series 2003, 5.000%, 8/01/25 – FGIC Insured | | 8/13 at 100.00 | A | | 420,685 | |
| | | | San Jose Redevelopment Agency, California, Tax Allocation Bonds, Merged Area Redevelopment Project, Series 2006D: | | | | | | |
| | 100 | | 5.000%, 8/01/18 – AMBAC Insured | | 8/17 at 100.00 | BBB | | 103,216 | |
| | 500 | | 5.000%, 8/01/21 – AMBAC Insured | | 8/17 at 100.00 | BBB | | 521,720 | |
| | 550 | | San Jose Redevelopment Agency, California, Tax Allocation Bonds, Merged Area Redevelopment Project, Series 2007B, 5.000%, 8/01/19 – SYNCORA GTY Insured | | No Opt. Call | BBB | | 564,300 | |
| | 1,040 | | Stockton Unified School District, San Joaquin County, California, General Obligation Bonds, Series 2007, 5.000%, 8/01/20 – AGM Insured | | 8/17 at 100.00 | AA– | | 1,154,566 | |
| | | | Tejon Ranch Public Facilities Financing Authority, California, Community Facilities District 2008-1 Tejon Industrial Complex East 2012A: | | | | | | |
| | 1,100 | | 5.000%, 9/01/27 | | No Opt. Call | N/R | | 1,113,464 | |
| | 1,500 | | 5.000%, 9/01/32 | | No Opt. Call | N/R | | 1,481,625 | |
| | | | Tejon Ranch Public Facilities Financing Authority, California, Community Facilities District 2008-1 Tejon Industrial Complex East 2012B: | | | | | | |
| | 1,010 | | 5.000%, 9/01/27 | | No Opt. Call | N/R | | 1,022,362 | |
| | 1,500 | | 5.000%, 9/01/32 | | No Opt. Call | N/R | | 1,481,625 | |
| | 10,000 | | Tobacco Securitization Authority of Northern California, Tobacco Settlement Asset-Backed Bonds, Refunding Series 2005A-2, 5.400%, 6/01/27 | | 6/17 at 100.00 | B+ | | 10,014,200 | |
| | 1,610 | | Tobacco Securitization Authority of Northern California, Tobacco Settlement Asset-Backed Bonds, Series 2005A-1, 4.750%, 6/01/23 | | 6/15 at 100.00 | B+ | | 1,610,853 | |
| | | | Ventura County Public Financing Authority, California, Lease Revenue Bonds Series 2013A: | | | | | | |
| | 1,080 | | 5.000%, 11/01/24 | | 11/22 at 100.00 | AA | | 1,265,036 | |
| | 1,000 | | 5.000%, 11/01/28 | | 11/22 at 100.00 | AA | | 1,137,910 | |
| | 400 | | Vernon, California, Electric System Revenue Bonds, Series 2009A, 5.125%, 8/01/21 | | 8/19 at 100.00 | A– | | 451,376 | |
| | 107,035 | | Total California | | | | | 101,508,972 | |
| | | | Colorado – 4.3% (3.4% of Total Investments) | | | | | | |
| | 505 | | Bromley Park Metropolitan District 2, Brighton, Colorado, General Obligation Bonds, Refunding Series 2007A, 4.375%, 12/01/18 – RAAI Insured | | 12/17 at 100.00 | N/R | | 497,066 | |
| | 4,005 | | Castle Oaks Metropolitan District, In the Town of Castle Rock, Douglas County, Colorado, General Obligation Bonds, Limited Tax Refunding and Improvement Series 2012, 5.500%, 12/01/22 | | No Opt. Call | N/R | | 4,011,288 | |
| | 1,125 | | Colorado Educational and Cultural Facilities Authority, Charter School Revenue Bonds, Academy of Charter Schools Project, Series 2010B, 6.125%, 11/01/20 | | No Opt. Call | B– | | 1,203,289 | |
| | 500 | | Colorado Educational and Cultural Facilities Authority, Charter School Revenue Bonds, Flagstaff Academy Project, Series 2008A, 6.750%, 8/01/28 | | 8/18 at 100.00 | N/R | | 558,555 | |
| | 200 | | Colorado Educational and Cultural Facilities Authority, Charter School Revenue Bonds, Littleton Preparatory Charter School, Series 2013, 5.000%, 12/01/22 | | No Opt. Call | BBB– | | 214,372 | |
| | 975 | | Colorado Health Facilities Authority, Colorado, Revenue Bonds, Total Long-term Care National Obligated Group Project, Series 2010A, 5.250%, 11/15/20 | | No Opt. Call | BBB– | | 1,075,805 | |
| | | | | | | | | | |
| | | Nuveen Intermediate Duration Municipal Term Fund (continued) |
| NID | | Portfolio of Investments |
| | | May 31, 2013 |
| | Principal | | | | Optional Call | | | | |
| | Amount (000) | | Description (1) | | Provisions (2) | Ratings (3) | | Value | |
| | | | Colorado (continued) | | | | | | |
| $ | 1,000 | | Colorado Housing and Finance Authority, Revenue Bonds, Confluence Energy LLC Project, Series 2013, 6.875%, 10/01/27 (Alternative Minimum Tax) | | No Opt. Call | N/R | $ | 991,880 | |
| | 3,270 | | Colorado Springs, Colorado, Utilities System Revenue Bonds, Tender Option Bond Trust 2012-5A, 13.906%, 11/15/30 (IF) | | 11/22 at 100.00 | AA | | 3,992,016 | |
| | | | Colorado State Board of Governors, Colorado State University Auxiliary Enterprise System Revenue Bonds, Tender Option Bond Trust 3316: | | | | | | |
| | 100 | | 22.158%, 9/01/22 (IF) (4) | | No Opt. Call | Aa2 | | 205,570 | |
| | 300 | | 22.158%, 3/01/23 (IF) (4) | | No Opt. Call | Aa2 | | 604,680 | |
| | 430 | | 22.108%, 3/01/24 (IF) (4) | | No Opt. Call | Aa2 | | 858,934 | |
| | 725 | | 22.158%, 3/01/25 (IF) (4) | | No Opt. Call | Aa2 | | 1,432,854 | |
| | 200 | | 22.158%, 9/01/25 (IF) (4) | | No Opt. Call | Aa2 | | 395,850 | |
| | 3,385 | | Denver Convention Center Hotel Authority, Colorado, Revenue Bonds, Convention Center Hotel, Senior Lien Series 2006, 5.125%, 12/01/24 – SYNCORA GTY Insured | | 11/16 at 100.00 | BBB– | | 3,620,528 | |
| | 300 | | E-470 Public Highway Authority, Colorado, Senior Revenue Bonds, Series 2007C-1, 5.500%, 9/01/24 – NPFG Insured | | No Opt. Call | A | | 323,955 | |
| | 250 | | Lincoln Park Metropolitan District, Douglas County, Colorado, General Obligation Refunding and Improvement Bonds, Series 2008, 5.625%, 12/01/20 | | 12/17 at 100.00 | BBB– | | 275,265 | |
| | 225 | | North Range Metropolitan District 1, Adams County, Colorado, Limited Tax General Obligation Bonds, Refunding Series 2007, 4.300%, 12/15/19 – ACA Insured | | 12/16 at 100.00 | N/R | | 230,036 | |
| | | | Plaza Metropolitan District 1, Lakewood, Colorado, Tax Increment Revenue Bonds, Refunding Series 2013: | | | | | | |
| | 500 | | 5.000%, 12/01/18 | | No Opt. Call | N/R | | 560,315 | |
| | 1,000 | | 5.000%, 12/01/21 | | No Opt. Call | N/R | | 1,111,020 | |
| | 625 | | Rendezvous Residential Metropolitan District, Colorado, Limited Tax General Obligation Bonds, Refunding Series 2007, 5.200%, 12/01/17 | | No Opt. Call | N/R | | 606,250 | |
| | 1,930 | | Tallyn’s Reach Metropolitan District 3, Aurora, Colorado, General Obligation Bonds, Refunding Series 2012, 4.000%, 12/01/21 | | No Opt. Call | BBB | | 2,069,983 | |
| | 3,150 | | Westminster Economic Development Authority, Colorado, Tax Increment Revenue Bonds, Mandalay Gardens Urban Renewal Project, Series 2012, 5.000%, 12/01/27 | | No Opt. Call | A | | 3,511,998 | |
| | 24,700 | | Total Colorado | | | | | 28,351,509 | |
| | | | Connecticut – 0.5% (0.4% of Total Investments) | | | | | | |
| | 2,500 | | Mashantucket Western Pequot Tribe, Connecticut, Special Revenue Bonds, Subordinate Lien Series 1997B, 5.700%, 9/01/12 (5) | | No Opt. Call | N/R | | 1,162,525 | |
| | 2,000 | | Mashantucket Western Pequot Tribe, Connecticut, Subordinate Special Revenue Bonds, Series 2006A, 5.500%, 9/01/36 (5) | | 9/16 at 100.00 | N/R | | 931,720 | |
| | 2,440 | | Mashantucket Western Pequot Tribe, Connecticut, Subordinate Special Revenue Bonds, Series 2007A, 6.500%, 9/01/31 (5) | | 11/17 at 100.00 | N/R | | 1,137,382 | |
| | 6,940 | | Total Connecticut | | | | | 3,231,627 | |
| | | | District of Columbia – 0.3% (0.2% of Total Investments) | | | | | | |
| | | | District of Columbia Student Dormitory Revenue Bonds, Provident Group – Howard Properties LLC Issue, Series 2013: | | | | | | |
| | 500 | | 4.000%, 10/01/19 | | No Opt. Call | BBB– | | 526,855 | |
| | 500 | | 4.000%, 10/01/20 | | No Opt. Call | BBB– | | 521,290 | |
| | 670 | | 4.000%, 10/01/21 | | No Opt. Call | BBB– | | 692,050 | |
| | 1,670 | | Total District of Columbia | | | | | 1,740,195 | |
| | | | Florida – 8.0% (6.4% of Total Investments) | | | | | | |
| | | | Atlantic Beach, Florida, Healthcare Facilities Revenue Refunding Bonds, Fleet Landing Project, Series 2013A: | | | | | | |
| | 425 | | 5.000%, 11/15/20 | | No Opt. Call | BBB | | 484,071 | |
| | 150 | | 5.000%, 11/15/23 | | No Opt. Call | BBB | | 168,005 | |
| | 125 | | Boynton Beach, Florida, Revenue Bonds, Charter Schools of Boynton Beach, Series 2012A, 5.750%, 6/01/22 | | No Opt. Call | BBB– | | 128,176 | |
| | 430 | | Capital Projects Finance Authority, Florida, Student Housing Revenue Bonds, Capital Projects Loan Program, Series 2001F-1, 5.000%, 10/01/31 – NPFG Insured | | 10/13 at 100.00 | A | | 425,898 | |
| | Principal | | | | Optional Call | | | | |
| | Amount (000) | | Description (1) | | Provisions (2) | Ratings (3) | | Value | |
| | | | Florida (continued) | | | | | | |
| $ | 1,500 | | Capital Trust Agency, Florida, Fixed Rate Air Cargo Revenue Refunding Bonds, Aero Miami FX, LLC Project, Series 2010A, 5.350%, 7/01/29 | | 7/20 at 100.00 | Baa3 | $ | 1,622,925 | |
| | 3,915 | | Cory Lakes Community Development District, Florida, Special Assessment Bonds, Refunding Series 2001A, 7.200%, 5/01/23 | | 11/13 at 100.00 | N/R | | 3,883,563 | |
| | 3,500 | | Florida Development Finance Corporation, Educational Facilities Revenue Bonds, Renaissance Charter School, Inc. Projects, Series 2011A, 6.500%, 6/15/21 | | No Opt. Call | BB– | | 4,044,320 | |
| | 1,540 | | Fontainbleau Lakes Community Development District, Miami-Dade County, Florida, Special Assessment Revenue Bonds, Series 2007B, 6.000%, 5/01/15 | | No Opt. Call | N/R | | 1,583,351 | |
| | | | Jacksonville, Florida, Economic Development Commission Health Care Facilities Revenue Bonds, Florida Proton Therapy Institute Project, Series 2007A: | | | | | | |
| | 730 | | 6.000%, 9/01/17 | | No Opt. Call | N/R | | 823,265 | |
| | 500 | | 6.250%, 9/01/27 | | 9/17 at 100.00 | N/R | | 558,225 | |
| | | | Lake Powell Residential Golf Community Development District, Bay County, Florida, Special Assessment Revenue Refunding Bonds, Series 2012: | | | | | | |
| | 1,555 | | 5.250%, 11/01/22 | | No Opt. Call | N/R | | 1,605,444 | |
| | 1,380 | | 5.750%, 11/01/32 | | No Opt. Call | N/R | | 1,430,825 | |
| | 2,500 | | Lee County Industrial Development Authority, Florida, Charter School Revenue Bonds, Lee County Community Charter Schools, Series 2007A, 5.250%, 6/15/27 | | 6/17 at 100.00 | BB | | 2,552,750 | |
| | 430 | | Madison County, Florida, First Mortgage Revenue Bonds, Twin Oaks Project, Series 2005A, 6.000%, 7/01/25 | | 7/15 at 100.00 | N/R | | 423,094 | |
| | 5,615 | | Martin County Industrial Development Authority, Florida, Industrial Development Revenue Refunding Bonds, Indiantown Cogeneration LP, Series 2013, 3.950%, 12/15/21 (Alternative Minimum Tax) | | 6/20 at 100.00 | Ba1 | | 5,647,511 | |
| | | | Miami-Dade County Expressway Authority, Florida, Toll System Revenue Bonds, Tender Option Bond Trust 1156: | | | | | | |
| | 700 | | 21.457%, 7/01/22 (IF) (4) | | No Opt. Call | A– | | 1,361,675 | |
| | 820 | | 21.457%, 7/01/23 (IF) (4) | | 7/22 at 100.00 | A– | | 1,533,646 | |
| | 1,115 | | 21.457%, 7/01/24 (IF) (4) | | 7/22 at 100.00 | A– | | 2,000,477 | |
| | 800 | | 21.457%, 7/01/25 (IF) (4) | | 7/22 at 100.00 | A– | | 1,402,720 | |
| | 630 | | North Springs Improvement District, Broward County, Florida, Special Assessment Bonds, Heron Bay North Assessment Area, Series 2006B, 5.000%, 5/01/14 | | No Opt. Call | N/R | | 636,577 | |
| | 6,300 | | Palm Glades Community Development District, Florida, Special Assessment Bonds, Series 2011B, 7.250%, 8/01/16 | | No Opt. Call | N/R | | 6,820,758 | |
| | 215 | | Seminole Tribe of Florida, Special Obligation Bonds, Series 2007A, 144A, 5.250%, 10/01/27 | | 10/17 at 100.00 | BBB– | | 230,381 | |
| | 1,735 | | South-Dade Venture Community Development District, Florida, Special Assessment Revenue Bonds, Refunding Series 2012, 5.000%, 5/01/26 | | No Opt. Call | BBB– | | 1,838,614 | |
| | 100 | | South-Dade Venture Community Development District, Florida, Special Assessment Revenue Bonds, Series 2004, 6.125%, 5/01/34 | | 5/14 at 101.00 | N/R | | 103,113 | |
| | | | Tampa-Hillsborough County Expressway Authority, Florida, Revenue Bonds, Tender Option Bond Trust 1132: | | | | | | |
| | 400 | | 21.558%, 7/01/27 (IF) (4) | | 7/22 at 100.00 | A– | | 675,860 | |
| | 290 | | 21.558%, 7/01/28 (IF) (4) | | 7/22 at 100.00 | A– | | 481,458 | |
| | 1,000 | | 16.526%, 7/01/29 (IF) (4) | | 7/22 at 100.00 | A– | | 1,108,900 | |
| | 1,000 | | 16.526%, 7/01/30 (IF) (4) | | 7/22 at 100.00 | A– | | 1,093,400 | |
| | 1,000 | | 21.558%, 7/01/31 (IF) (4) | | 7/22 at 100.00 | A– | | 1,568,850 | |
| | 2,250 | | Venetian Community Development District, Sarasota County, Florida, Capital Improvement Revenue Bonds, Series 2012-A2, 5.000%, 5/01/23 | | 5/22 at 100.00 | N/R | | 2,346,570 | |
| | 3,000 | | Verandah West Community Development District, Florida, Capital Improvement Revenue Bonds, Refunding Series 2013, 4.000%, 5/01/23 | | No Opt. Call | N/R | | 2,963,640 | |
| | 825 | | Vizcaya in Kendall Community Development District, Florida, Special Assessment Revenue Bonds, Phase Two Assessment Area, Refunding Series 2012A-2, 5.600%, 5/01/22 | | No Opt. Call | N/R | | 867,496 | |
| | 46,475 | | Total Florida | | | | | 52,415,558 | |
| | | Nuveen Intermediate Duration Municipal Term Fund (continued) |
| NID | | Portfolio of Investments |
| | | May 31, 2013 |
| | Principal | | | | Optional Call | | | | |
| | Amount (000) | | Description (1) | | Provisions (2) | Ratings (3) | | Value | |
| | | | Georgia – 1.6% (1.3% of Total Investments) | | | | | | |
| $ | 435 | | Coffee County Hospital Authority, Georgia, Revenue Bonds, Coffee County Regional Medical Center, Series 2004, 5.000%, 12/01/26 | | 12/14 at 100.00 | BB– | $ | 438,341 | |
| | | | Fulton County Residential Care Facilities Authority, Georgia, Revenue Bonds, Elderly Care, Lenbrook Square Project, Series 2006A: | | | | | | |
| | 5,220 | | 5.000%, 7/01/17 | | No Opt. Call | N/R | | 5,464,766 | |
| | 4,500 | | 5.000%, 7/01/27 | | 7/17 at 100.00 | N/R | | 4,531,185 | |
| | 10,155 | | Total Georgia | | | | | 10,434,292 | |
| | | | Guam – 1.1% (0.9% of Total Investments) | | | | | | |
| | 500 | | Government of Guam, Hotel Occupancy Tax Revenue Bonds, Series 2011A, 5.000%, 11/01/16 | | No Opt. Call | BBB+ | | 548,185 | |
| | 1,500 | | Guam Government Department of Education, Certificates of Participation, John F. Kennedy High School Project, Series 2010A, 6.000%, 12/01/20 | | No Opt. Call | B | | 1,619,115 | |
| | 2,000 | | Guam Government Waterworks Authority, Water and Wastewater System Revenue Bonds, Series 2010, 5.250%, 7/01/25 | | 7/20 at 100.00 | Ba2 | | 2,140,080 | |
| | 2,500 | | Guam Government, General Obligation Bonds, 2009 Series A, 6.750%, 11/15/29 | | 11/19 at 100.00 | B+ | | 2,775,125 | |
| | 6,500 | | Total Guam | | | | | 7,082,505 | |
| | | | Hawaii – 0.1% (0.1% of Total Investments) | | | | | | |
| | 740 | | Hawaii Housing Finance and Development Corporation, Multifamily Housing Revenue Bonds, Wilikina Apartments Project, Series 2012A, 4.250%, 5/01/22 | | No Opt. Call | BBB– | | 798,001 | |
| | | | Idaho – 0.7% (0.6% of Total Investments) | | | | | | |
| | 4,645 | | Madison County, Idaho, Hospital Revenue Certificates of Participation, Madison Memorial Hospital, Series 2006, 5.250%, 9/01/26 | | 9/16 at 100.00 | BB+ | | 4,818,584 | |
| | | | Illinois – 10.4% (8.3% of Total Investments) | | | | | | |
| | 1,260 | | Bellwood, Illinois, General Obligation Bonds, Series 2006, 5.000%, 12/01/21 – SYNCORA GTY Insured | | No Opt. Call | N/R | | 1,286,901 | |
| | 1,070 | | Bellwood, Illinois, General Obligation Bonds, Series 2008, 7.000%, 12/01/29 | | No Opt. Call | N/R | | 1,089,014 | |
| | 10,000 | | CenterPoint Intermodal Center Program Trust, Illinois, Series 2004 Class A Certificates, 3.730%, 6/15/23 | | 6/13 at 100.00 | N/R | | 9,994,000 | |
| | 9,535 | | Chicago Board of Education, Illinois, Unlimited Tax General Obligation Bonds, Dedicated Tax Revenues, Series 1999A, 5.500%, 12/01/26 – FGIC Insured | | No Opt. Call | A+ | | 11,489,866 | |
| | 2,952 | | Chicago, Illinois, Certificates of Participation Tax Increment Bonds, 35th and State Redevelopment Project, Series 2012, 6.100%, 1/15/29 | | No Opt. Call | N/R | | 2,954,978 | |
| | 330 | | Chicago, Illinois, Certificates of Participation Tax Increment Bonds, MetraMarket Project, Series 2010, 6.870%, 2/15/24 | | 5/15 at 100.00 | Baa1 | | 350,378 | |
| | 975 | | Chicago, Illinois, Certificates of Participation Tax Increment Allocation Revenue Bonds, Diversey-Narragansett Project, Series 2006, 7.460%, 2/15/26 | | 8/13 at 100.00 | N/R | | 781,121 | |
| | | | Cook County, Illinois, General Obligation Bonds, Tender Option Bond Trust 4279: | | | | | | |
| | 1,000 | | 22.073%, 11/15/20 (IF) (4) | | No Opt. Call | AA | | 1,648,650 | |
| | 3,040 | | 22.073%, 11/15/20 (IF) (4) | | No Opt. Call | AA | | 4,648,920 | |
| | 1,000 | | Cook County, Illinois, Recovery Zone Facility Revenue Bonds, Navistar International Corporation Project, Series 2010, 6.500%, 10/15/40 | | 10/20 at 100.00 | B3 | | 1,093,410 | |
| | | | Illinois Finance Authority, Charter School Revenue Bonds, Chicago Charter School Foundation, Series 2007: | | | | | | |
| | 1,650 | | 5.000%, 12/01/21 | | 12/16 at 100.00 | BBB+ | | 1,779,608 | |
| | 4,000 | | 5.000%, 12/01/26 | | 12/16 at 100.00 | BBB+ | | 4,208,160 | |
| | 5,530 | | Illinois Finance Authority, Recovery Zone Facility Revenue Bonds, Navistar International Corporation Project, Series 2010, 6.500%, 10/15/40 | | 10/20 at 100.00 | B3 | | 6,046,557 | |
| | | | Illinois Finance Authority, Revenue Bonds, Centegra Health System, Tender Option Bond Trust 1122: | | | | | | |
| | 480 | | 21.011%, 9/01/21 (IF) (4) | | No Opt. Call | A– | | 875,971 | |
| | 330 | | 20.972%, 9/01/21 (IF) (4) | | No Opt. Call | A– | | 601,712 | |
| | 435 | | 20.955%, 9/01/22 (IF) (4) | | No Opt. Call | A– | | 769,324 | |
| | | | Illinois Finance Authority, Revenue Bonds, Friendship Village of Schaumburg, Series 2005A: | | | | | | |
| | 665 | | 5.000%, 2/15/15 | | No Opt. Call | BB– | | 684,571 | |
| | 3,525 | | 5.375%, 2/15/25 | | 2/15 at 100.00 | BB– | | 3,576,289 | |
| | Principal | | | | Optional Call | | | | |
| | Amount (000) | | Description (1) | | Provisions (2) | Ratings (3) | | Value | |
| | | | Illinois (continued) | | | | | | |
| $ | 2,680 | | Illinois Finance Authority, Revenue Bonds, Illinois Institute of Technology, Refunding Series 2006A, 5.000%, 4/01/24 | | 4/16 at 100.00 | Baa3 | $ | 2,730,813 | |
| | | | Illinois Finance Authority, Revenue Bonds, Ingalls Health System, Series 2013: | | | | | | |
| | 650 | | 4.000%, 5/15/18 | | No Opt. Call | Baa1 | | 714,610 | |
| | 770 | | 4.000%, 5/15/19 | | No Opt. Call | Baa1 | | 846,761 | |
| | 895 | | 5.000%, 5/15/20 | | No Opt. Call | Baa1 | | 1,031,971 | |
| | 1,035 | | 5.000%, 5/15/21 | | No Opt. Call | Baa1 | | 1,192,237 | |
| | 1,210 | | 5.000%, 5/15/22 | | No Opt. Call | Baa1 | | 1,378,710 | |
| | 1,390 | | 5.000%, 5/15/23 | | 5/22 at 100.00 | Baa1 | | 1,558,621 | |
| | 1,575 | | 5.000%, 5/15/24 | | 5/22 at 100.00 | Baa1 | | 1,750,975 | |
| | 500 | | Illinois Finance Authority, Revenue Bonds, Montgomery Place Project, Series 2006A, 5.500%, 5/15/26 | | 5/17 at 100.00 | N/R | | 521,415 | |
| | 620 | | Illinois Finance Authority, Revenue Refunding Bonds, Swedish Covenant Hospital, Refunding Series 2010A, 5.000%, 8/15/17 | | No Opt. Call | BBB+ | | 688,665 | |
| | 1,000 | | Illinois State, General Obligation Bonds, Refunding Series 2012, 5.000%, 8/01/20 – AGM Insured | | No Opt. Call | AA– | | 1,144,950 | |
| | 1,000 | | Pingree Grove Village, Illinois, Tax Assessment Bonds, Special Service Area 2 – Cambridge Lakes Project, Series 2005-2, 6.000%, 3/01/35 | | 3/15 at 102.00 | N/R | | 1,026,740 | |
| | 61,102 | | Total Illinois | | | | | 68,465,898 | |
| | | | Indiana – 2.0% (1.6% of Total Investments) | | | | | | |
| | 1,250 | | Carmel, Indiana, Revenue Bonds, Barrington of Carmel Project, Series 2012A, 6.000%, 11/15/22 | | No Opt. Call | N/R | | 1,355,988 | |
| | 4,345 | | Indiana Finance Authority, Educational Facilities Revenue Bonds, 21st Century Charter School Project, Series 2013A, 6.000%, 3/01/33 | | 3/23 at 100.00 | BB– | | 4,295,033 | |
| | 1,050 | | Indiana Finance Authority, Educational Facilities Revenue Bonds, Drexel Foundation For Educational Excellence, Inc., Series 2009A, 6.000%, 10/01/21 | | 10/19 at 100.00 | BB– | | 1,131,092 | |
| | 60 | | Indiana Finance Authority, Environmental Improvement Revenue Bonds, United States Steel Corporation Project, Refunding Series 2011, 6.000%, 12/01/19 | | No Opt. Call | BB | | 66,773 | |
| | 5,000 | | Indiana Finance Authority, Private Activity Bonds, Ohio River Bridges East End Crossing Project, Series 2013B, 5.000%, 1/01/19 (Alternative Minimum Tax) | | 1/17 at 100.00 | BBB | | 5,510,650 | |
| | 1,000 | | Indiana Finance Authority, Revenue Bonds, Marquette Project, Series 2012, 5.000%, 3/01/19 | | No Opt. Call | BBB | | 1,089,530 | |
| | 12,705 | | Total Indiana | | | | | 13,449,066 | |
| | | | Iowa – 1.3% (1.1% of Total Investments) | | | | | | |
| | 2,600 | | Iowa Finance Authority, Health Facility Revenue Bonds, Care Initiatives Project, Series 2006A, 5.500%, 7/01/25 | | 7/16 at 100.00 | BB+ | | 2,733,562 | |
| | 5,320 | | Iowa Finance Authority, Iowa, Midwestern Disaster Area Revenue Bonds, Iowa Fertilizer Company Project, Series 2013, 5.000%, 12/01/19 | | No Opt. Call | BB– | | 5,492,687 | |
| | | | Iowa Higher Education Loan Authority, Private College Facility Revenue Bonds, Upper Iowa University Project, Series 2012: | | | | | | |
| | 125 | | 3.000%, 9/01/16 | | No Opt. Call | BBB | | 129,658 | |
| | 180 | | 4.000%, 9/01/18 | | No Opt. Call | BBB | | 193,201 | |
| | 200 | | 3.000%, 9/01/19 | | No Opt. Call | BBB | | 202,274 | |
| | 8,425 | | Total Iowa | | | | | 8,751,382 | |
| | | | Kansas – 2.5% (2.0% of Total Investments) | | | | | | |
| | 4,000 | | Kansas Development Finance Authority Hospital Revenue Bonds, Adventist Health System/Sunbelt Obligated Group, Tender Option Bond Trust 1125, 22.233%, 11/15/32 (IF) (4) | | 5/22 at 100.00 | AA | | 6,297,200 | |
| | 2,000 | | Overland Park, Kansas, Sales Tax Revenue Bonds, Prairiefire Community Improvement District No. 1 Project, Series 2012B, 6.100%, 12/15/34 | | No Opt. Call | N/R | | 1,985,260 | |
| | 8,000 | | Overland Park, Kansas, Sales Tax Special Obligation Revenue Bonds, Prairiefire at Lionsgate Project, Series 2012, 5.250%, 12/15/29 | | No Opt. Call | N/R | | 7,912,720 | |
| | 14,000 | | Total Kansas | | | | | 16,195,180 | |
| | | | Louisiana – 1.8% (1.5% of Total Investments) | | | | | | |
| | 3,750 | | Louisiana Local Government Environmental Facilities and Community Development Authority, Revenue Bonds, Westlake Chemical Corporation Project, Series 2007, 6.750%, 11/01/32 | | 11/17 at 100.00 | BBB– | | 4,259,400 | |
| | | Nuveen Intermediate Duration Municipal Term Fund (continued) |
| NID | | Portfolio of Investments |
| | | May 31, 2013 |
| | Principal | | | | Optional Call | | | | |
| | Amount (000) | | Description (1) | | Provisions (2) | Ratings (3) | | Value | |
| | | | Louisiana (continued) | | | | | | |
| $ | 2,395 | | Louisiana Local Government Environmental Facilities and Community Development Authority, Revenue Bonds, Capital Projects and Equipment Acquisition Program, Series 2000A, 6.300%, 7/01/30 – AMBAC Insured | | No Opt. Call | N/R | $ | 2,670,473 | |
| | | | Louisiana Public Facilities Authority, Revenue Bonds, Ochsner Clinic Foundation Project, Series 2011: | | | | | | |
| | 250 | | 5.250%, 5/15/22 | | No Opt. Call | Baa1 | | 286,175 | |
| | 500 | | 6.250%, 5/15/31 | | No Opt. Call | Baa1 | | 582,480 | |
| | 3,000 | | Louisiana Public Facilities Authority, Solid Waste Disposal Facility Revenue Bonds, Louisiana Pellets Inc Project, Series 2013A, 9.750%, 8/01/14 (Alternative Minimum Tax) | | 1/14 at 100.00 | N/R | | 2,999,730 | |
| | 1,000 | | Louisiana Stadium and Exposition District, Revenue Refunding Bonds, Senior Lien Series 2013A, 5.000%, 7/01/22 | | No Opt. Call | A | | 1,173,620 | |
| | 10,895 | | Total Louisiana | | | | | 11,971,878 | |
| | | | Maine – 0.1% (0.0% of Total Investments) | | | | | | |
| | 350 | | Maine Health and Higher Educational Facilities Authority Revenue Bonds, Eastern Maine Medical Center Obligated Group Issue, Series 2013, 5.000%, 7/01/22 | | No Opt. Call | Baa1 | | 401,842 | |
| | | | Maryland – 0.2% (0.2% of Total Investments) | | | | | | |
| | 1,500 | | Maryland Economic Development Corporation, Senior Lien Student Housing Revenue Bonds, University of Maryland – Baltimore, Series 2003A, 5.625%, 10/01/23 | | 10/13 at 100.00 | B3 | | 1,496,970 | |
| | | | Massachusetts – 1.2% (0.9% of Total Investments) | | | | | | |
| | 1,755 | | Massachusetts Development Finance Agency, Revenue Bonds, Boston Architectural College, Series 2006, 5.000%, 1/01/27 – ACA Insured | | 1/17 at 100.00 | N/R | | 1,737,871 | |
| | 1,750 | | Massachusetts Development Finance Authority, Revenue Bonds, Eastern Nazarene College, Series 1999, 5.625%, 4/01/29 | | 10/13 at 100.00 | BB+ | | 1,755,303 | |
| | 1,000 | | Massachusetts Health and Educational Facilities Authority, Revenue Bonds, Milton Hospital Project, Series 2005D, 5.250%, 7/01/30 | | 7/15 at 100.00 | BB– | | 1,028,140 | |
| | 3,150 | | Massachusetts Port Authority, Special Facilities Revenue Bonds, Delta Air Lines Inc., Series 2001A, 5.000%, 1/01/27 – AMBAC Insured (Alternative Minimum Tax) | | 7/13 at 100.00 | N/R | | 3,143,700 | |
| | 7,655 | | Total Massachusetts | | | | | 7,665,014 | |
| | | | Michigan – 5.7% (4.6% of Total Investments) | | | | | | |
| | 2,000 | | Detroit City School District, Wayne County, Michigan, General Obligation Bonds, Tender Option Bond Trust 3308, 23.115%, 11/01/27 – AGM Insured (IF) (4) | | No Opt. Call | Aa2 | | 3,325,600 | |
| | 3,500 | | Detroit Water and Sewerage Department, Michigan, Sewage Disposal System Revenue Bonds, Refunding Senior Lien Series 2012A, 5.250%, 7/01/26 | | 7/22 at 100.00 | A+ | | 3,886,680 | |
| | | | Detroit Water Supply System, Michigan, Water Supply System Revenue Senior Lien Bonds, Series 2006A: | | | | | | |
| | 510 | | 5.250%, 7/01/22 – NPFG Insured | | 7/16 at 100.00 | A | | 543,930 | |
| | 225 | | 5.250%, 7/01/23 – NPFG Insured | | 7/16 at 100.00 | A | | 239,627 | |
| | 230 | | Detroit, Michigan, Downtown Development Authority, Tax Increment Refunding Bonds, Development Area 1 Projects, Series 1998A, 4.750%, 7/01/25 – NPFG Insured | | 7/13 at 100.00 | A | | 230,005 | |
| | 2,000 | | Detroit, Michigan, General Obligation Bonds, Limited Tax Capital Improvement Series 2008-A1, 5.000%, 4/01/15 | | No Opt. Call | B | | 1,873,180 | |
| | 2,000 | | Detroit, Michigan, General Obligation Bonds, Series 2001A-1, 5.000%, 4/01/19 – NPFG Insured | | 10/13 at 100.00 | A | | 1,908,280 | |
| | 300 | | Detroit, Michigan, General Obligation Bonds, Series 2005A, 5.000%, 4/01/22 – AGM Insured | | 4/16 at 100.00 | AA– | | 302,658 | |
| | 1,000 | | Detroit, Michigan, General Obligation Bonds, Unlimited Tax Series 2008A, 5.000%, 4/01/20 | | No Opt. Call | AA– | | 1,016,660 | |
| | 100 | | Detroit, Michigan, Second Lien Water Supply System Revenue Bonds, Series 2003B, 5.000%, 7/01/34 – NPFG Insured | | 7/13 at 100.00 | A | | 100,003 | |
| | | | Detroit, Michigan, Senior Lien Sewerage Disposal System Revenue Bonds, Series 2001B: | | | | | | |
| | 310 | | 5.500%, 7/01/29 – FGIC Insured | | No Opt. Call | AA– | | 358,744 | |
| | 10,340 | | 5.500%, 7/01/29 – FGIC Insured | | No Opt. Call | A | | 11,848,810 | |
| | 100 | | Detroit, Michigan, Senior Lien Water Supply System Revenue Bonds, Series 2003A, 5.000%, 7/01/34 – NPFG Insured | | 7/13 at 100.00 | A+ | | 100,003 | |
| | Principal | | | | Optional Call | | | | |
| | Amount (000) | | Description (1) | | Provisions (2) | Ratings (3) | | Value | |
| | | | Michigan (continued) | | | | | | |
| $ | 2,000 | | Detroit, Michigan, Sewerage Disposal System Revenue Bonds, Series 1999A, 0.000%, 7/01/21 – FGIC Insured | | No Opt. Call | A+ | $ | 1,471,240 | |
| | | | Detroit-Wayne County Stadium Authority, Michigan, Wayne County Limited Tax General Obligation Bonds, Building Authority Stadium Refunding Series 2012: | | | | | | |
| | 1,000 | | 5.000%, 10/01/17 | | No Opt. Call | BBB+ | | 1,094,610 | |
| | 1,000 | | 5.000%, 10/01/18 | | No Opt. Call | BBB+ | | 1,100,830 | |
| | 735 | | East Lansing, Michigan, Economic Development Corporation Limited Obligation Bonds, Burcham Hills Retirement Community First Mortgage, Series 2007-B1, 5.250%, 7/01/37 | | 7/13 at 100.00 | N/R | | 734,949 | |
| | 1,270 | | Flint Hospital Building Authority, Michigan, Building Authority Revenue Bonds, Hurley Medical Center, Series 2013A, 5.000%, 7/01/23 | | No Opt. Call | Ba1 | | 1,312,647 | |
| | 465 | | Michigan Finance Authority, Public School Academy Limited Obligation Revenue and Refunding Bonds, Detroit Service Learning Academy Project, Series 2011, 6.000%, 10/01/21 | | No Opt. Call | BB+ | | 509,273 | |
| | 1,000 | | Michigan Finance Authority, Public School Academy Limited Obligation Revenue Bonds, Old Redford Academy Project, Series 2010A, 5.250%, 12/01/20 | | No Opt. Call | BB | | 1,072,940 | |
| | 825 | | Michigan Finance Authority, Revenue Bonds, Trinity Health Credit Group, Tender Option Bond Trust 4286, 22.344%, 12/01/18 (IF) (4) | | No Opt. Call | AA | | 1,396,131 | |
| | 720 | | Michigan Public Educational Facilities Authority, Limited Obligation Revenue Bonds, Richfield Public School Academy, Series 2007, 5.000%, 9/01/22 | | 9/17 at 100.00 | BBB– | | 736,250 | |
| | 315 | | Summit Academy North, Michigan, Revenue Bonds, Public School Academy Series 2005, 5.000%, 11/01/15 | | No Opt. Call | BB | | 316,052 | |
| | 250 | | Troy Downtown Development Authority, Michigan, Tax Increment Revenue Bonds, Development & Refunding Series 2001, 5.500%, 11/01/15 – NPFG Insured | | 11/13 at 100.00 | A | | 252,063 | |
| | 1,685 | | Wayne Charter County, Michigan, Limited Tax General Obligation Airport Hotel Revenue Bonds, | | 6/13 at 100.00 | A | | 1,689,263 | |
| | | | Detroit Metropolitan Wayne County Airport, Series 2001A, 5.000%, 12/01/30 – NPFG Insured | | | | | | |
| | 33,880 | | Total Michigan | | | | | 37,420,428 | |
| | | | Minnesota – 0.8% (0.6% of Total Investments) | | | | | | |
| | 3,500 | | Cloquet, Minnesota, Pollution Control Revenue Bonds, Potlatch Corporation, Refunding Series 1996, 5.900%, 10/01/26 | | 10/13 at 100.00 | BB+ | | 3,513,020 | |
| | 1,445 | | Minneapolis, Minnesota, Tax Increment Revenue Bonds, Village at St. Anthony Falls Project, Refunding Series 2004, 5.750%, 2/01/27 | | 8/13 at 100.00 | N/R | | 1,439,466 | |
| | 4,945 | | Total Minnesota | | | | | 4,952,486 | |
| | | | Mississippi – 0.7% (0.6% of Total Investments) | | | | | | |
| | 1,445 | | Mississippi Business Finance Corporation, Gulf Opportunity Zone Industrial Development Revenue Bonds, Northrop Grumman Ship Systems Inc. Project, Series 2006, 4.550%, 12/01/28 | | 12/16 at 100.00 | BBB+ | | 1,451,820 | |
| | | | Mississippi Development Bank Special Obligation Bonds, Marshall County Industrial Development Authority, Mississippi Highway Construction Project, Tender Option Bond Trust 3315: | | | | | | |
| | 800 | | 22.533%, 1/01/20 (IF) (4) | | No Opt. Call | AA– | | 1,425,920 | |
| | 500 | | 22.533%, 1/01/20 (IF) (4) | | No Opt. Call | AA– | | 848,425 | |
| | 985 | | Mississippi Hospital Equipment and Facilities Authority, Revenue Bonds, South Central Regional Medical Center, Refunding & Improvement Series 2006, 5.250%, 12/01/21 | | 12/16 at 100.00 | BBB | | 1,048,444 | |
| | 3,730 | | Total Mississippi | | | | | 4,774,609 | |
| | | | Missouri – 1.9% (1.6% of Total Investments) | | | | | | |
| | 590 | | I-470 and 350 Transportation Development District, Lee’s Summit, Missouri, Transportation Sales Tax Revenue Bonds, Refunding & Improvement Series 2007, 4.600%, 6/01/29 – RAAI Insured | | 6/15 at 100.00 | A– | | 605,535 | |
| | 2,000 | | Kansas City Industrial Development Authority, Missouri, Downtown Redevelopment District Revenue Bonds, Series 2011A, 5.500%, 9/01/29 | | 9/21 at 100.00 | AA– | | 2,260,660 | |
| | 3,500 | | Kansas City Tax Increment Financing Commission, Missouri, Tax Increment Revenue Bonds, Briarcliff West Project, Series 2006A, 5.400%, 6/01/24 | | 6/14 at 102.00 | N/R | | 3,623,970 | |
| | 600 | | Pevely, Missouri, Neighborhood Improvement District Bonds, Southern Heights Project, Series 2004, 5.250%, 3/01/22 – RAAI Insured | | 9/13 at 100.00 | N/R | | 601,140 | |
| | 3,000 | | Poplar Bluff Regional Transportation Development District, Missouri, Transportation Sales Tax Revenue Bonds, Series 2012, 4.000%, 12/01/36 | | No Opt. Call | BBB | | 2,908,740 | |
| | | Nuveen Intermediate Duration Municipal Term Fund (continued) |
| NID | | Portfolio of Investments |
| | | May 31, 2013 |
| | Principal | | | | Optional Call | | | | |
| | Amount (000) | | Description (1) | | Provisions (2) | Ratings (3) | | Value | |
| | | | Missouri (continued) | | | | | | |
| $ | 1,275 | | Saint Louis, Missouri, Parking Revenue Bonds, Series 2006A, 5.000%, 12/15/22 – NPFG Insured | | 12/16 at 100.00 | A | $ | 1,347,866 | |
| | | | St. Joseph Industrial Development Authority, Missouri, Tax Increment Bonds, Shoppes at North Village Project, Series 2005B: | | | | | | |
| | 500 | | 5.375%, 11/01/23 | | 11/14 at 100.00 | N/R | | 502,445 | |
| | 905 | | 5.500%, 11/01/27 | | 11/14 at 100.00 | N/R | | 907,516 | |
| | 12,370 | | Total Missouri | | | | | 12,757,872 | |
| | | | Nebraska – 0.5% (0.4% of Total Investments) | | | | | | |
| | 3,000 | | Central Plains Energy Project, Nebraska, Gas Project 1 Revenue Bonds, Series 2007A, 5.250%, 12/01/21 | | No Opt. Call | A | | 3,459,000 | |
| | | | Nevada – 1.6% (1.3% of Total Investments) | | | | | | |
| | 1,630 | | Carson City, Nevada, Hospital Revenue Refunding Bonds, Carson-Tahoe Regional Healthcare Project, Series 2012, 5.000%, 9/01/27 | | No Opt. Call | BBB+ | | 1,793,505 | |
| | 2,650 | | Henderson Local Improvement Districts T-18, Nevada, Limited Obligation Improvement Bonds, Inspirada Series 2006, 5.150%, 9/01/21 | | 9/13 at 100.00 | N/R | | 2,432,303 | |
| | | | Henderson, Nevada, Local Improvement District T-13 Cornerstone, Limited Obligation Refunding Bonds, Series 2013: | | | | | | |
| | 710 | | 4.000%, 3/01/17 | | No Opt. Call | N/R | | 723,547 | |
| | 850 | | 4.000%, 3/01/18 | | No Opt. Call | N/R | | 856,477 | |
| | 800 | | 4.000%, 3/01/19 | | No Opt. Call | N/R | | 797,112 | |
| | 920 | | 5.000%, 3/01/20 | | No Opt. Call | N/R | | 961,437 | |
| | 970 | | 5.000%, 3/01/21 | | No Opt. Call | N/R | | 1,006,317 | |
| | 1,010 | | 5.000%, 3/01/22 | | No Opt. Call | N/R | | 1,040,815 | |
| | 1,000 | | Las Vegas Redevelopment Agency, Nevada, Tax Increment Revenue Bonds, Series 2009A, 7.500%, 6/15/23 | | 6/19 at 100.00 | BBB– | | 1,137,830 | |
| | 10,540 | | Total Nevada | | | | | 10,749,343 | |
| | | | New Hampshire – 0.2% (0.2% of Total Investments) | | | | | | |
| | | | Manchester Housing and Redevelopment Authority, New Hampshire, Meals and Rooms Tax Revenue Bonds, Series 2000A: | | | | | | |
| | 335 | | 6.750%, 1/01/14 – ACA Insured | | 7/13 at 100.00 | Caa1 | | 334,900 | |
| | 100 | | 6.750%, 1/01/15 – ACA Insured | | 7/13 at 100.00 | Caa1 | | 99,682 | |
| | | | Manchester Housing and Redevelopment Authority, New Hampshire, Revenue Bonds, Series 2000B: | | | | | | |
| | 265 | | 0.000%, 1/01/17 – ACA Insured | | No Opt. Call | Caa1 | | 212,999 | |
| | 500 | | 0.000%, 1/01/18 – ACA Insured | | No Opt. Call | Caa1 | | 377,275 | |
| | 320 | | 0.000%, 1/01/19 – ACA Insured | | No Opt. Call | N/R | | 225,718 | |
| | 370 | | 0.000%, 1/01/20 – ACA Insured | | No Opt. Call | Caa1 | | 242,683 | |
| | 1,890 | | Total New Hampshire | | | | | 1,493,257 | |
| | | | New Jersey – 6.8% (5.4% of Total Investments) | | | | | | |
| | 4,420 | | Camden County Improvement Authority, New Jersey, Revenue Bonds, Cooper Health System, Series 2005A, 5.000%, 2/15/25 | | 2/15 at 100.00 | BBB | | 4,554,722 | |
| | 2,500 | | New Jersey Economic Development Authority, Cigarette Tax Revenue Refunding Bonds, Series 2012, 4.000%, 6/15/19 | | No Opt. Call | BBB+ | | 2,762,325 | |
| | 7,500 | | New Jersey Economic Development Authority, School Facilities Construction Financing Program Bonds, Refunding Series 2012II, 5.000%, 3/01/26 | | No Opt. Call | A+ | | 8,536,200 | |
| | 1,440 | | New Jersey Economic Development Authority, School Facilities Construction Financing Program Bonds, Tender Option Bond Trust 1151, 3.180%, 9/01/25 (IF) (4) | | 3/25 at 100.00 | A+ | | 1,582,128 | |
| | 7,500 | | New Jersey Economic Development Authority, Special Facilities Revenue Bonds, Continental | | 9/22 at 101.00 | B | | 7,975,725 | |
| | | | Airlines Inc., Series 1999, 5.250%, 9/15/29 (Alternative Minimum Tax) | | | | | | |
| | | | New Jersey Health Care Facilities Financing Authority, New Jersey, Revenue Bonds, Saint Peters University Hospital, Refunding Series 2011: | | | | | | |
| | 3,335 | | 5.000%, 7/01/20 | | No Opt. Call | BB+ | | 3,797,665 | |
| | 1,670 | | 5.000%, 7/01/21 | | No Opt. Call | BB+ | | 1,894,699 | |
| | 1,235 | | New Jersey Health Care Facilities Financing Authority, Revenue Bonds, Palisades Medical Center of New York Presbyterian Healthcare System Obligated Group, Series 1999, 5.250%, 7/01/28 – ACA Insured | | 7/13 at 100.00 | BB+ | | 1,223,527 | |
| | Principal | | | | Optional Call | | | | |
| | Amount (000) | | Description (1) | | Provisions (2) | Ratings (3) | | Value | |
| | | | New Jersey (continued) | | | | | | |
| $ | 5,000 | | New Jersey Health Care Facilities Financing Authority, Revenue Bonds, Saint Joseph’s Healthcare System Obligated Group Issue, Series 2008, 6.625%, 7/01/38 | | 7/18 at 100.00 | BBB– | $ | 5,695,450 | |
| | 500 | | New Jersey Turnpike Authority, Revenue Bonds, Tender Option Bond Trust 1154, 21.558%, 1/01/24 (IF) (4) | | 7/22 at 100.00 | A+ | | 932,900 | |
| | 5,985 | | Tobacco Settlement Financing Corporation, New Jersey, Tobacco Settlement Asset-Backed Bonds, Series 2007-1A, 4.625%, 6/01/26 | | 6/17 at 100.00 | B1 | | 5,822,507 | |
| | 41,085 | | Total New Jersey | | | | | 44,777,848 | |
| | | | New Mexico – 1.0% (0.8% of Total Investments) | | | | | | |
| | 1,320 | | Bernalillo County, New Mexico, Multifamily Housing Revenue Bonds, Valencia Retirement Apartments Project, Series 2001A, 5.450%, 6/01/34 – AMBAC Insured (Alternative Minimum Tax) | | 6/13 at 100.00 | N/R | | 1,320,158 | |
| | | | Jicarilla Apache Nation, New Mexico, Revenue Bonds, Series 2002A: | | | | | | |
| | 2,145 | | 5.000%, 9/01/13 | | No Opt. Call | N/R | | 2,147,252 | |
| | 1,000 | | 5.500%, 9/01/23 | | No Opt. Call | N/R | | 988,350 | |
| | 2,000 | | Santa Fe, New Mexico, Retirement Facilities Revenue Bonds, EL Castillo Retirement Residences Project, Series 2012, 5.000%, 5/15/32 | | No Opt. Call | BBB– | | 2,117,600 | |
| | 6,465 | | Total New Mexico | | | | | 6,573,360 | |
| | | | New York – 7.0% (5.6% of Total Investments) | | | | | | |
| | 1,190 | | Buffalo and Erie County Industrial Land Development Corporation, New York, Revenue Bonds, Medaille College, Series 2012, 5.000%, 4/01/22 | | No Opt. Call | BB+ | | 1,277,763 | |
| | | | Build NYC Resource Corporation, New York, Revenue Bonds, Bronx Charter School for Excellence, Series 2013A: | | | | | | |
| | 505 | | 4.000%, 4/01/20 | | No Opt. Call | BBB– | | 536,295 | |
| | 570 | | 4.000%, 4/01/23 | | No Opt. Call | BBB– | | 590,155 | |
| | | | Dormitory Authority of the State of New York, Insured Revenue Bonds, Pace University, Series 2013A: | | | | | | |
| | 1,000 | | 5.000%, 5/01/21 | | No Opt. Call | BBB– | | 1,154,370 | |
| | 840 | | 5.000%, 5/01/23 | | No Opt. Call | BBB– | | 974,711 | |
| | | | New York City Industrial Development Agency, New York, American Airlines-JFK International Airport Special Facility Revenue Bonds, Series 2005: | | | | | | |
| | 7,470 | | 7.500%, 8/01/16 (Alternative Minimum Tax) | | No Opt. Call | N/R | | 7,960,630 | |
| | 7,850 | | 7.625%, 8/01/25 (Alternative Minimum Tax) | | 8/16 at 101.00 | N/R | | 9,053,798 | |
| | | | New York City Industrial Development Agency, New York, Civic Facility Revenue Bonds, Vaughn College of Aeronautics, Series 2006A: | | | | | | |
| | 1,000 | | 5.000%, 12/01/16 | | No Opt. Call | BB+ | | 1,066,320 | |
| | 1,500 | | 5.000%, 12/01/21 | | 12/16 at 100.00 | BB+ | | 1,593,840 | |
| | 255 | | New York City Industrial Development Agency, New York, Civic Facility Revenue Bonds, Vaughn College of Aeronautics, Series 2006B, 5.000%, 12/01/16 | | No Opt. Call | BB+ | | 271,912 | |
| | 190 | | New York City Industrial Development Agency, New York, PILOT Revenue Bonds, Queens Baseball Stadium Project, Series 2006, 5.000%, 1/01/22 – AMBAC Insured | | 1/17 at 100.00 | Ba1 | | 201,885 | |
| | 2,300 | | Port Authority of New York and New Jersey, Special Project Bonds, JFK International Air Terminal LLC Project, Eighth Series 2010, 6.500%, 12/01/28 | | 12/15 at 100.00 | BBB– | | 2,520,869 | |
| | 3,240 | | Seneca Nation of Indians Capital Improvements Authority, New York, Special Obligation Bonds, Series 2007A, 5.250%, 12/01/16 | | No Opt. Call | BB | | 3,447,230 | |
| | 2,000 | | Suffolk County Industrial Development Agency, New York, Continuing Care Retirement Community Revenue Bonds, Jefferson’s Ferry Project, Series 2006, 5.000%, 11/01/28 | | 11/16 at 100.00 | BBB– | | 2,099,380 | |
| | | | TSASC Inc., New York, Tobacco Asset-Backed Bonds, Series 2006: | | | | | | |
| | 4,060 | | 5.000%, 6/01/26 | | 6/16 at 100.00 | BB– | | 4,019,847 | |
| | 10,000 | | 5.000%, 6/01/34 | | 6/16 at 100.00 | B+ | | 9,030,200 | |
| | 43,970 | | Total New York | | | | | 45,799,205 | |
| | | | North Carolina – 0.4% (0.3% of Total Investments) | | | | | | |
| | 2,600 | | Charlotte, North Carolina, Special Facility Refunding Revenue Bonds, Charlotte/Douglas International Airport, US Airways, Inc. Project, Series 1998, 5.600%, 7/01/27 (Alternative Minimum Tax) | | 7/13 at 100.00 | N/R | | 2,602,964 | |
| | | Nuveen Intermediate Duration Municipal Term Fund (continued) |
| NID | | Portfolio of Investments |
| | | May 31, 2013 |
| | Principal | | | | Optional Call | | | | |
| | Amount (000) | | Description (1) | | Provisions (2) | Ratings (3) | | Value | |
| | | | Ohio – 6.3% (5.1% of Total Investments) | | | | | | |
| $ | 24,900 | | Buckeye Tobacco Settlement Financing Authority, Ohio, Tobacco Settlement Asset-Backed Revenue Bonds, Senior Lien, Series 2007A-2, 5.125%, 6/01/24 | | 6/17 at 100.00 | B– | $ | 23,373,625 | |
| | 95 | | Ohio Air Quality Development Authority, Revenue Refunding Bonds, AK Steel Holding Corporation, Series 2012A, 6.750%, 6/01/24 (Alternative Minimum Tax) | | 2/22 at 100.00 | B– | | 91,096 | |
| | 3,400 | | Southeastern Ohio Port Authority, Hospital Facilities Revenue Bonds, Memorial Health System Obligated Group Project, Refunding and Improvement Series 2012, 5.000%, 12/01/22 | | No Opt. Call | N/R | | 3,688,932 | |
| | 6,000 | | State of Ohio, Solid Waste Disposal Revenue Bonds (USG Corporation Project) Series 1997 Remarketed, 5.600%, 8/01/32 (Alternative Minimum Tax) | | 8/13 at 100.00 | B– | | 5,902,620 | |
| | 8,445 | | Toledo-Lucas County Port Authority, Ohio, Special Assessment Revenue Bonds, Crocker Park Project, Series 2003, 5.375%, 12/01/35 | | 12/13 at 102.00 | BB | | 8,662,797 | |
| | 42,840 | | Total Ohio | | | | | 41,719,070 | |
| | | | Oklahoma – 1.4% (1.1% of Total Investments) | | | | | | |
| | 9,096 | | Tulsa Municipal Airport Trust, Oklahoma, Revenue Bonds, American Airlines Inc., Series 1995, 6.250%, 6/01/20 | | 12/13 at 100.00 | N/R | | 9,118,285 | |
| | | | Oregon – 0.3% (0.2% of Total Investments) | | | | | | |
| | 1,000 | | Astoria Hospital Facilities Authority, Oregon, Hospital Revenue and Refunding Bonds, Columbia Memorial Hospital, Series 2012, 5.000%, 8/01/31 | | No Opt. Call | BBB– | | 1,059,120 | |
| | 730 | | Port of Saint Helens, Oregon, Pollution Control Revenue Bonds, Boise Cascade Project, Series 1997, 5.650%, 12/01/27 | | No Opt. Call | N/R | | 726,146 | |
| | 1,730 | | Total Oregon | | | | | 1,785,266 | |
| | | | Pennsylvania – 3.7% (3.0% of Total Investments) | | | | | | |
| | 2,500 | | Aliquippa Municipal Water Authority, Pennsylvania, Water and Sewer Revenue Bonds, Subordinated Series 2013, 5.000%, 5/15/26 | | No Opt. Call | N/R | | 2,496,850 | |
| | 3,025 | | Butler County Industrial Development Authority, Pennsylvania, Revenue Refunding Bonds, AK Steel Corporation Project, Series 2012-A, 6.250%, 6/01/20 (Alternative Minimum Tax) | | No Opt. Call | B2 | | 2,917,280 | |
| | 1,450 | | Doylestown Hospital Authority, Pennsylvania, Hospital Revenue Bonds, Series 2013A, 5.000%, 7/01/23 | | No Opt. Call | BBB | | 1,612,574 | |
| | 2,385 | | Lebanon County Health Facilities Authority, Pennsylvania, Revenue Bonds, Good Samaritan Hospital Project, Series 2002, 6.000%, 11/15/35 | | 7/13 at 100.00 | Ba2 | | 2,385,143 | |
| | 1,595 | | Northampton County Industrial Development Authority, Pennsylvania, Revenue Bonds, Morningstar Senior Living, Inc., Series 2012, 5.000%, 7/01/27 | | No Opt. Call | BBB– | | 1,692,949 | |
| | 3,000 | | Pennsylvania Economic Development Financing Authority, Solid Waste Disposal Revenue Bonds (USG Corporation Project) Series 1999, 6.000%, 6/01/31 (Alternative Minimum Tax) | | 12/13 at 100.00 | B– | | 3,011,820 | |
| | 3,000 | | Pennsylvania Economic Development Financing Authority, Exempt Facilities Revenue Bonds, Allegheny Energy Supply Company LLC., Senior Lien Series 2009, 7.000%, 7/15/39 | | 7/19 at 100.00 | BBB– | | 3,560,340 | |
| | 1,020 | | Pennsylvania Economic Development Financing Authority, Revenue Bonds, Northwestern Human Services Inc., Series 1998A, 5.250%, 6/01/28 | | 12/13 at 100.00 | N/R | | 1,020,867 | |
| | 750 | | Pennsylvania Economic Development Financing Authority, Sewage Sludge Disposal Revenue Bonds, Philadelphia Biosolids Facility Project, Series 2009, 6.250%, 1/01/32 | | 1/20 at 100.00 | BBB | | 847,485 | |
| | 5,000 | | Susquehanna Area Regional Airport Authority, Pennsylvania, Airport System Revenue Bonds, Series 2012C, 3.000%, 1/01/17 | | No Opt. Call | Ba1 | | 5,030,400 | |
| | 23,725 | | Total Pennsylvania | | | | | 24,575,708 | |
| | Principal | | | | Optional Call | | | | |
| | Amount (000) | | Description (1) | | Provisions (2) | Ratings (3) | | Value | |
| | | | Puerto Rico – 6.4% (5.1% of Total Investments) | | | | | | |
| $ | 5,000 | | Puerto Rico Aqueduct and Sewerage Authority, Revenue Bonds, Senior Lien Series 2008A, 6.125%, 7/01/24 | | No Opt. Call | BBB– | $ | 5,344,300 | |
| | 1,000 | | Puerto Rico Convention Center District Authority, Hotel Occupancy Tax Revenue Bonds, Series 2006A, 5.000%, 7/01/23 – FGIC Insured | | 7/16 at 100.00 | BBB+ | | 998,400 | |
| | 600 | | Puerto Rico Electric Power Authority, Power Revenue Bonds, Series 2003NN, 5.250%, 7/01/19 – NPFG Insured | | No Opt. Call | A | | 647,868 | |
| | 1,000 | | Puerto Rico Electric Power Authority, Power Revenue Bonds, Series 2005SS, 5.000%, 7/01/21 – NPFG Insured | | 7/15 at 100.00 | A | | 1,015,270 | |
| | 875 | | Puerto Rico Electric Power Authority, Power Revenue Refunding Bonds, Series 2002, 5.000%, 7/01/19 – NPFG Insured | | No Opt. Call | A | | 933,013 | |
| | 875 | | Puerto Rico Government Development Bank, Adjustable Refunding Bonds, Variable Rate Demand Obligations, Series 1985, 4.750%, 12/01/15 – NPFG Insured | | 12/13 at 100.00 | A | | 894,101 | |
| | | | Puerto Rico Government Development Bank, Senior Note Revenue Bonds, Senior Lien, Series 2006B: | | | | | | |
| | 3,655 | | 5.000%, 12/01/15 | | No Opt. Call | BBB– | | 3,820,864 | |
| | 100 | | 5.000%, 12/01/16 | | No Opt. Call | BBB– | | 105,080 | |
| | 2,000 | | Puerto Rico Government Development Bank, Senior Note Revenue Bonds, Senior Notes, Series 2006C, 5.250%, 1/01/15 (Alternative Minimum Tax) | | No Opt. Call | BBB– | | 2,056,820 | |
| | 2,375 | | Puerto Rico Highway and Transportation Authority, Highway Revenue Refunding Bonds, Series 2002E, 5.500%, 7/01/22 – AGM Insured | | No Opt. Call | AA– | | 2,647,888 | |
| | 1,080 | | Puerto Rico Highway and Transportation Authority, Subordinate Lien Highway Revenue Bonds, Series 2003, 5.000%, 7/01/23 – CIFG Insured | | No Opt. Call | BBB– | | 1,076,166 | |
| | 795 | | Puerto Rico Infrastructure Financing Authority, Special Tax Revenue Bonds, Series 2005A, 4.000%, 7/01/16 – FGIC Insured | | No Opt. Call | BBB+ | | 808,022 | |
| | 890 | | Puerto Rico Public Buildings Authority, Guaranteed Government Facilities Revenue Bonds, Series 2007M, 6.250%, 7/01/23 | | No Opt. Call | BBB– | | 975,760 | |
| | | | Puerto Rico, General Obligation and Public Improvement Bonds, Series 2002A: | | | | | | |
| | 1,040 | | 5.500%, 7/01/18 – NPFG Insured (Alternative Minimum Tax) | | No Opt. Call | A | | 1,113,070 | |
| | 4,170 | | 5.500%, 7/01/19 – NPFG Insured | | No Opt. Call | A | | 4,446,763 | |
| | 1,195 | | 5.500%, 7/01/21 – NPFG Insured | | No Opt. Call | A | | 1,255,778 | |
| | | | Puerto Rico, General Obligation Bonds, Public Improvement Refunding Series 2007A: | | | | | | |
| | 3,700 | | 5.250%, 7/01/15 | | No Opt. Call | BBB– | | 3,869,164 | |
| | 4,280 | | 5.500%, 7/01/21 – FGIC Insured | | No Opt. Call | BBB– | | 4,497,681 | |
| | 5,255 | | University of Puerto Rico, University System Revenue Bonds, Series 2006P, 5.000%, 6/01/15 | | No Opt. Call | BBB– | | 5,377,442 | |
| | 39,885 | | Total Puerto Rico | | | | | 41,883,450 | |
| | | | Rhode Island – 1.0% (0.8% of Total Investments) | | | | | | |
| | 6,000 | | Rhode Island Health & Educational Building Corporation, Public Schools Financing ProgramRevenue Bonds, Pooled Series 2009E, 6.000%, 5/15/29 | | 5/19 at 100.00 | A3 | | 6,621,840 | |
| | | | South Carolina – 1.6% (1.3% of Total Investments) | | | | | | |
| | | | South Carolina JOBS Economic Development Authority, Hospital Revenue Bonds, Bon Secours Health System Obligated Group, Tender Option Bond Trust 1141: | | | | | | |
| | 1,500 | | 21.096%, 11/01/27 (IF) (4) | | 11/22 at 100.00 | A– | | 2,356,350 | |
| | 1,010 | | 21.076%, 11/01/28 (IF) (4) | | 11/22 at 100.00 | A– | | 1,546,330 | |
| | 1,255 | | 21.096%, 11/01/29 (IF) (4) | | 11/22 at 100.00 | A– | | 1,864,428 | |
| | 5,000 | | York County, South Carolina, Celanese, Series 1994, 5.700%, 1/01/24 (Alternative Minimum Tax) | | 7/13 at 100.00 | BB– | | 4,999,950 | |
| | 8,765 | | Total South Carolina | | | | | 10,767,058 | |
| | | | South Dakota – 0.2% (0.1% of Total Investments) | | | | | | |
| | 1,000 | | South Dakota Educational Enhancement Funding Corporation, Tobacco Settlement Revenue Bonds Series 2013B, 5.000%, 6/01/23 | | No Opt. Call | A | | 1,194,590 | |
| | | Nuveen Intermediate Duration Municipal Term Fund (continued) |
| NID | | Portfolio of Investments |
| | | May 31, 2013 |
| | Principal | | | | Optional Call | | | | |
| | Amount (000) | | Description (1) | | Provisions (2) | Ratings (3) | | Value | |
| | | | Tennessee – 0.4% (0.3% of Total Investments) | | | | | | |
| $ | 2,000 | | Clarksville Natural Gas Acquisition Corporation, Tennessee, Natural Gas Revenue Bonds, Series 2006, 5.000%, 12/15/21 – SYNCORA GTY Insured | | No Opt. Call | A | $ | 2,306,880 | |
| | | | Texas – 9.9% (7.9% of Total Investments) | | | | | | |
| | | | Austin Convention Enterprises Inc., Texas, Convention Center Hotel Revenue Bonds, First Tier Series 2006A: | | | | | | |
| | 3,780 | | 5.250%, 1/01/24 – SYNCORA GTY Insured | | 1/17 at 100.00 | BB+ | | 3,985,216 | |
| | 275 | | 5.000%, 1/01/34 – SYNCORA GTY Insured | | 1/17 at 100.00 | BB+ | | 282,054 | |
| | 7,000 | | Austin Convention Enterprises Inc., Texas, Convention Center Hotel Revenue Bonds, Second Tier Series 2006B, 5.750%, 1/01/24 | | 1/17 at 100.00 | Ba2 | | 7,468,720 | |
| | 710 | | Bexar County, Texas, Health Facilities Development Corporation Revenue Bonds, Army Retirement Residence, Series 2007, 5.000%, 7/01/27 | | 7/17 at 100.00 | BBB | | 740,424 | |
| | 1,895 | | Board of Managers, Joint Guadalupe County – Seguin City Hospital, Texas, FHA Insured Hospital Mortgage Revenue Bonds, Guadalupe Regional Medical Center Project, Series 2007, 5.500%, 8/15/36 | | 8/18 at 100.00 | Baa3 | | 2,083,761 | |
| | 2,000 | | Dallas Area Rapid Transit, Texas, Sales Tax Revenue Bonds, Tender Option Bond Trust 3307, 24.909%, 12/01/26 – AMBAC Insured (IF) (4) | | No Opt. Call | AA+ | | 4,645,700 | |
| | | | Harris County Cultural Education Facilities Finance Corporation, Texas, Revenue Refunding Bonds, Young Men’s Christian Association of the Greater Houston Area, Series 2013A: | | | | | | |
| | 330 | | 5.000%, 6/01/18 | | No Opt. Call | Baa3 | | 372,181 | |
| | 1,500 | | 5.000%, 6/01/20 | | No Opt. Call | Baa3 | | 1,697,925 | |
| | 535 | | 5.000%, 6/01/21 | | No Opt. Call | Baa3 | | 605,128 | |
| | 855 | | 5.000%, 6/01/22 | | No Opt. Call | Baa3 | | 961,961 | |
| | 915 | | 5.000%, 6/01/23 | | No Opt. Call | Baa3 | | 1,031,626 | |
| | 4,735 | | Harris County-Houston Sports Authority, Texas, Junior Lien Revenue Refunding Bonds, Series 2001B, 5.250%, 11/15/40 – NPFG Insured | | 11/13 at 100.00 | A | | 4,744,659 | |
| | 750 | | Health Facilities Development District of Central Texas, Revenue Bonds, Legacy at Willow Bend Project, Series 2006A, 5.625%, 11/01/26 | | 11/16 at 100.00 | N/R | | 785,543 | |
| | 200 | | Love Field Airport Modernization Corporation, Texas, Special Facilities Revenue Bonds, Southwest Airlines Company – Love Field Modernization Program Project, Series 2012, 5.000%, 11/01/21 (Alternative Minimum Tax) | | No Opt. Call | BBB– | | 221,240 | |
| | 1,500 | | Red River Authority, Texas, Pollution Control Revenue Bonds, AEP Texas North Company, Public Service Company of Oklahoma and AEP Texas Central Company Oklaunion Project, Refunding Series 2007, 4.450%, 6/01/20 – NPFG Insured | | No Opt. Call | A | | 1,646,010 | |
| | 2,680 | | San Antonio Public Facilities Corporation, Texas, Improvement and Refunding Lease RevenueBonds, Convention Center Refinancing and Expansion Project, Tender Option Bond Trust 4281, 22.129%, 9/15/20 (IF) (4) | | No Opt. Call | AA+ | | 4,642,752 | |
| | | | Tarrant County Cultural Education Facilities Finance Corporation, Texas, Hospital Revenue Bonds, Scott & White Healthcare Project, Tender Option Bond Trust 1149: | | | | | | |
| | 100 | | 21.690%, 8/15/22 (IF) (4) | | No Opt. Call | AA– | | 197,560 | |
| | 155 | | 21.489%, 8/15/24 (IF) (4) | | 8/23 at 100.00 | AA– | | 281,260 | |
| | 200 | | 21.690%, 8/15/26 (IF) (4) | | 8/23 at 100.00 | AA– | | 336,960 | |
| | 170 | | 21.449%, 8/15/27 (IF) (4) | | 8/23 at 100.00 | AA– | | 279,832 | |
| | | | Texas Municipal Gas Acquisition and Supply Corporation I, Gas Supply Revenue Bonds, Senior Lien Series 2008D: | | | | | | |
| | 1,070 | | 5.625%, 12/15/17 | | No Opt. Call | A– | | 1,196,100 | |
| | 10,145 | | 6.250%, 12/15/26 | | No Opt. Call | A– | | 12,849,147 | |
| | | | Texas Municipal Gas Acquisition and Supply Corporation III, Gas Supply Revenue Bonds, Series 2012: | | | | | | |
| | 2,500 | | 5.000%, 12/15/19 | | No Opt. Call | A3 | | 2,835,650 | |
| | 5,000 | | 5.000%, 12/15/20 | | No Opt. Call | A3 | | 5,684,800 | |
| | 5,000 | | 5.000%, 12/15/22 | | No Opt. Call | A3 | | 5,655,750 | |
| | 54,000 | | Total Texas | | | | | 65,231,959 | |
| | | | Vermont – 0.5% (0.4% of Total Investments) | | | | | | |
| | 3,600 | | Vermont Economic Development Authority, Solid Waste Disposal Revenue Bonds, Casella Waste Systems, Inc. Project, Series 2013, 4.750%, 4/01/36 (Mandatory put 4/01/18) (Alternative Minimum Tax) | | No Opt. Call | B+ | | 3,602,844 | |
| | Principal | | | | Optional Call | | | | |
| | Amount (000) | | Description (1) | | Provisions (2) | Ratings (3) | | Value | |
| | | | Virgin Islands – 1.0% (0.8% of Total Investments) | | | | | | |
| $ | 6,000 | | Virgin Islands Public Finance Authority, Gross Receipts Taxes Loan Note, Refunding Series 2012A, 4.000%, 10/01/22 | | No Opt. Call | BBB+ | $ | 6,378,960 | |
| | | | Virginia – 3.3% (2.7% of Total Investments) | | | | | | |
| | | | Dulles Town Center Community Development Authority, Loudon County, Virginia Special Assessment Refunding Bonds, Dulles Town Center Project, Series 2012: | | | | | | |
| | 1,265 | | 4.000%, 3/01/20 | | No Opt. Call | N/R | | 1,273,058 | |
| | 1,000 | | 5.000%, 3/01/21 | | No Opt. Call | N/R | | 1,059,720 | |
| | 1,410 | | 5.000%, 3/01/22 | | No Opt. Call | N/R | | 1,490,624 | |
| | | | Fairfax County Industrial Development Authority, Virginia, Healthcare Revenue Bonds, Inova Health System, Tender Option Bond Trust 3309: | | | | | | |
| | 1,800 | | 22.158%, 5/15/20 (IF) (4) | | No Opt. Call | AA+ | | 3,124,350 | |
| | 400 | | 22.158%, 5/15/20 (IF) (4) | | No Opt. Call | AA+ | | 689,260 | |
| | 400 | | 17.208%, 5/15/20 (IF) (4) | | No Opt. Call | AA+ | | 475,500 | |
| | 2,615 | | Giles County Industrial Development Authority, Virginia, Exempt Facility Revenue Bonds, Hoechst Celanese Project, Series 1996, 6.450%, 5/01/26 | | 11/13 at 100.00 | BB– | | 2,616,804 | |
| | 3,074 | | Peninsula Town Center Community Development Authority, Virginia, Special Obligation Bonds, Series 2007, 5.800%, 9/01/17 | | No Opt. Call | N/R | | 3,330,556 | |
| | 1,000 | | Roanoke Economic Development Authority, Virginia, Residential Care Facility Mortgage Revenue Refunding Bonds, Virginia Lutheran Homes Brandon Oaks Project, Series 2012, 5.000%, 12/01/32 | | No Opt. Call | N/R | | 1,003,000 | |
| | | | Route 460 Funding Corporation, Virginia, Toll Road Revenue Bonds, Series 2012B: | | | | | | |
| | 90 | | 0.000%, 7/01/24 | | No Opt. Call | BBB– | | 58,340 | |
| | 465 | | 0.000%, 7/01/25 | | No Opt. Call | BBB– | | 283,413 | |
| | 1,600 | | 0.000%, 7/01/26 | | No Opt. Call | BBB– | | 914,688 | |
| | 2,515 | | 0.000%, 7/01/27 | | No Opt. Call | BBB– | | 1,342,935 | |
| | 2,220 | | 0.000%, 7/01/28 | | No Opt. Call | BBB– | | 1,112,242 | |
| | | | Virginia Gateway Community Development Authority, Prince William County, Virginia, Special Assessment Refunding Bonds, Series 2012: | | | | | | |
| | 695 | | 5.000%, 3/01/25 | | No Opt. Call | N/R | | 732,196 | |
| | 1,000 | | 4.500%, 3/01/29 | | No Opt. Call | N/R | | 976,770 | |
| | 1,505 | | 5.000%, 3/01/30 | | No Opt. Call | N/R | | 1,563,138 | |
| | 23,054 | | Total Virginia | | | | | 22,046,594 | |
| | | | Washington – 1.8% (1.4% of Total Investments) | | | | | | |
| | 550 | | Tacoma Consolidated Local Improvement District 65, Washington, Special Assessment Bonds, Series 2013, 5.750%, 4/01/43 | | 4/14 at 100.00 | N/R | | 544,484 | |
| | 2,000 | | Washington State Health Care Facilities Authority, Revenue Bonds, Group Health Cooperative of Puget Sound, Series 2006, 5.000%, 12/01/24 – RAAI Insured | | 12/16 at 100.00 | BBB– | | 2,041,080 | |
| | | | Washington State Housing Finance Commission, Non-Profit Housing Revenue Bonds, Mirabella Project, Series 2012A: | | | | | | |
| | 4,700 | | 6.000%, 10/01/22 | | No Opt. Call | N/R | | 4,783,519 | |
| | 2,135 | | 6.500%, 10/01/32 | | No Opt. Call | N/R | | 2,152,571 | |
| | | | Washington State Housing Finance Commission, Non-Profit Revenue Bonds, Emerald Heights Project, Refunding 2013: | | | | | | |
| | 1,000 | | 5.000%, 7/01/21 | | No Opt. Call | A– | | 1,144,540 | |
| | 1,000 | | 5.000%, 7/01/23 | | No Opt. Call | A– | | 1,131,040 | |
| | 11,385 | | Total Washington | | | | | 11,797,234 | |
| | | Nuveen Intermediate Duration Municipal Term Fund (continued) |
| NID | | Portfolio of Investments |
| | | May 31, 2013 |
| | Principal | | | | Optional Call | | | | |
| | Amount (000) | | Description (1) | | Provisions (2) | Ratings (3) | | Value | |
| | | | Wisconsin – 2.1% (1.6% of Total Investments) | | | | | | |
| $ | 1,740 | | Green Bay Redevelopment Authority, Wisconsin, Industrial Development Revenue Bonds, Fort James Project, Series 1999, 5.600%, 5/01/19 (Alternative Minimum Tax) | | No Opt. Call | N/R | $ | 1,986,575 | |
| | 5,805 | | Oneida Tribe of Indians of Wisconsin, Retail Sales Revenue Bonds, Series 2010, 144A, 5.500%, 2/01/21 | | No Opt. Call | AA– | | 6,535,327 | |
| | 350 | | Oneida Tribe of Indians of Wisconsin, Retail Sales Revenue Bonds, Series 2010, 144A, 6.500%, 2/01/31 | | 2/19 at 102.00 | AA– | | 395,441 | |
| | | | Public Finance Authority of Wisconsin, Educational Facility Revenue Bonds, Cottonwood Classical Preparatory School in Albuquerque, New Mexico, Series 2012A: | | | | | | |
| | 1,200 | | 5.250%, 12/01/22 | | No Opt. Call | N/R | | 1,196,448 | |
| | 1,610 | | 6.000%, 12/01/32 | | No Opt. Call | N/R | | 1,595,397 | |
| | 930 | | Public Finance Authority of Wisconsin, Revenue Bonds, Roseman University of Health Sciences, Series 2012, 5.000%, 4/01/22 | | No Opt. Call | BB+ | | 958,058 | |
| | | | University of Wisconsin Hospitals and Clinics Authority, Revenue Bonds, Tender Option Bond Trust 4287: | | | | | | |
| | 50 | | 21.108%, 4/01/20 (IF) (4) | | No Opt. Call | Aa3 | | 96,553 | |
| | 100 | | 21.957%, 10/01/20 (IF) (4) | | No Opt. Call | Aa3 | | 195,755 | |
| | 185 | | 21.556%, 10/01/20 (IF) (4) | | No Opt. Call | Aa3 | | 344,664 | |
| | 100 | | 21.957%, 10/01/20 (IF) (4) | | No Opt. Call | Aa3 | | 182,740 | |
| | 12,070 | | Total Wisconsin | | | | | 13,486,958 | |
| $ | 781,182 | | Total Investments (cost $833,339,204) – 124.9% | | | | | 822,579,927 | |
| | | | Variable Rate MuniFund Term Preferred Shares, at Liquidation Value – (26.6)% (6) | | | | | (175,000,000 | ) |
| | | | Other Assets Less Liabilities – 1.7% (7) | | | | | 10,894,230 | |
| | | | Net Assets Applicable to Common Shares – 100% | | | | $ | 658,474,157 | |
Investments in Derivatives as of May 31, 2013
Swaps outstanding:
| | | | | Fund | | | | | | Fixed Rate | | | | | | Unrealized | |
| | | Notional | | Pay/Receive | | Floating Rate | | Fixed Rate | | Payment | | Effective | | Termination | | Appreciation | |
| Counterparty | | Amount | | Floating Rate | | Index | | (Annualized) | | Frequency | | Date (8) | | Date | | (Depreciation) (7) | |
| JPMorgan | | $45,300,000 | | Receive | | 3-Month USD-LIBOR | | 2.591% | | Semi-Annually | | 5/15/14 | | 5/15/25 | | $1,018,743 | |
| (1) | | All percentages shown in the Portfolio of Investments are based on net assets applicable to Common shares unless otherwise noted. |
| (2) | | Optional Call Provisions (not covered by the report of independent registered public accounting firm): Dates (month and year) and prices of the earliest optional call or redemption. There may be other call provisions at varying prices at later dates. Certain mortgage-backed securities may be subject to periodic principal paydowns. |
| (3) | | Ratings (not covered by the report of independent registered public accounting firm): Using the highest of Standard & Poor’s Group (“Standard & Poor’s”), Moody’s Investors Service, Inc. (“Moody’s”) or Fitch, Inc. (“Fitch”) rating. Ratings below BBB by Standard & Poor’s, Baa by Moody’s or BBB by Fitch are considered to be below investment grade. Holdings designated N/R are not rated by any of these national rating agencies. |
| (4) | | Investment, or portion of investment, has been pledged to collateralize the net payment obligations for investments in derivatives and/or inverse floating rate transactions. |
| (5) | | At or subsequent to the end of the reporting period, this security is non-income producing. Non-income producing security, in the case of a fixed-income security, generally denotes that the issuer has (1) defaulted on the payment of principal or interest, (2) is under the protection of the Federal Bankruptcy Court or (3) the Fund’s Adviser has concluded that the issue is not likely to meet its future interest payment obligations and has directed the Fund’s custodian to cease accruing additional income on the Fund’s records. |
| (6) | | Variable Rate MuniFund Term Preferred Shares, at Liquidation Value as a percentage of Total Investments is 21.3%. |
| (7) | | Other Assets Less Liabilities includes the Unrealized Appreciation (Depreciation) of derivative instruments as listed within Investments in Derivatives as of the end of the reporting period. |
| (8) | | Effective date represents the date on which both the Fund and Counterparty commence interest payment accruals on each forward swap contract. |
| N/R | | Not rated. |
| (IF) | | Inverse floating rate investment. |
| 144A | | Investment is exempt from registration under Rule 144A of the Securities Act of 1933, as amended. These investments may only be resold in transactions exempt from registration, which are normally those transactions with qualified institutional buyers. |
| USD-LIBOR | | United States Dollar-London Inter-Bank Offered Rate. |
See accompanying notes to financial statements.
| | | Nuveen Intermediate Duration Quality Municipal Term Fund |
| NIQ | | Portfolio of Investments |
| | | May 31, 2013 |
| | Principal | | | | Optional Call | | | | |
| | Amount (000) | | Description (1) | | Provisions (2) | Ratings (3) | | Value | |
| | | | Alabama – 3.2% (2.5% of Total Investments) | | | | | | |
| $ | 2,000 | | Alabama Federal Aid Highway Finance Authority, Federal Highway Grant Anticipation Revenue Bonds, Tender Option Bond Trust 2013-2W, 22.133%, 9/01/26 (IF) (4) | | 9/22 at 100.00 | AA | $ | 3,556,500 | |
| | 2,500 | | Jefferson County, Alabama, General Obligation Refunding Warrants, Series 2003A, 5.000%, 4/01/22 – NPFG Insured | | 10/13 at 100.00 | A | | 2,440,400 | |
| | 4,500 | | Total Alabama | | | | | 5,996,900 | |
| | | | Arizona – 2.1% (1.7% of Total Investments) | | | | | | |
| | 455 | | Arizona Health Facilities Authority, Health Care Facilities Revenue Bonds, The Beatitudes Campus Project, Series 2006, 5.100%, 10/01/22 | | 10/16 at 100.00 | N/R | | 460,355 | |
| | | | Arizona Health Facilities Authority, Hospital Revenue Bonds, Phoenix Children’s Hospital, Series 2013D: | | | | | | |
| | 965 | | 5.000%, 2/01/24 | | 2/23 at 100.00 | BBB+ | | 1,091,319 | |
| | 1,065 | | 5.000%, 2/01/26 | | 2/23 at 100.00 | BBB+ | | 1,177,666 | |
| | 1,000 | | University Medical Center Corporation, Tucson, Arizona, Hospital Revenue Bonds, Series 2011, 5.000%, 7/01/19 | | No Opt. Call | BBB+ | | 1,166,040 | |
| | 3,485 | | Total Arizona | | | | | 3,895,380 | |
| | | | California – 15.7% (12.3% of Total Investments) | | | | | | |
| | 1,000 | | ABAG Finance Authority for Nonprofit Corporations, California, Revenue Bonds, Sharp HealthCare, Series 2009B, 6.375%, 8/01/34 | | 8/14 at 100.00 | A+ | | 1,060,540 | |
| | 3,000 | | Alameda Corridor Transportation Authority, California, Senior Lien Revenue Refunding Bonds, Series 2013A, 5.000%, 10/01/27 – AGM Insured | | 10/23 at 100.00 | AA– | | 3,483,270 | |
| | | | California Municipal Finance Authority, Revenue Bonds, Biola University, Series 2013: | | | | | | |
| | 560 | | 5.000%, 10/01/19 | | No Opt. Call | Baa1 | | 650,233 | |
| | 415 | | 5.000%, 10/01/21 | | No Opt. Call | Baa1 | | 482,425 | |
| | 3,000 | | Foothill/Eastern Transportation Corridor Agency, California, Toll Road Revenue Bonds, Series 1995A, 5.000%, 1/01/35 – NPFG Insured | | 7/13 at 100.00 | A | | 2,999,730 | |
| | 5,000 | | Foothill/Eastern Transportation Corridor Agency, California, Toll Road Revenue Refunding Bonds, Series 1999, 0.000%, 1/15/33 | | No Opt. Call | BBB– | | 1,551,450 | |
| | 3,000 | | Golden State Tobacco Securitization Corporation, California, Tobacco Settlement Asset-Backed Bonds, Series 2007A-1, 5.000%, 6/01/33 | | 6/17 at 100.00 | B | | 2,809,050 | |
| | | | Hesperia Public Financing Authority, California, Redevelopment and Housing Projects Tax Allocation Bonds, Series 2007A: | | | | | | |
| | 1,350 | | 5.500%, 9/01/17 – SYNCORA GTY Insured | | No Opt. Call | Ba1 | | 1,479,708 | |
| | 660 | | 5.500%, 9/01/27 – SYNCORA GTY Insured | | No Opt. Call | Ba1 | | 675,226 | |
| | 1,265 | | Independent Cities Finance Authority, California, Mobile Home Park Revenue Bonds, Rancho Vallecitos Mobile Home Park, Series 2013, 4.500%, 4/15/23 | | No Opt. Call | BBB | | 1,381,595 | |
| | | | Inland Empire Tobacco Securitization Authority, California, Tobacco Settlement Asset-Backed Bonds, Series 2007: | | | | | | |
| | 1,460 | | 5.000%, 6/01/21 | | 6/17 at 100.00 | B | | 1,473,943 | |
| | 1,170 | | 4.625%, 6/01/21 | | 6/17 at 100.00 | B | | 1,161,518 | |
| | | | Jurupa, California, Community Services District, Community Facilities District 31 Eastvale Area Special Tax Bonds Series 2013: | | | | | | |
| | 150 | | 4.000%, 9/01/25 | | 9/22 at 100.00 | N/R | | 148,559 | |
| | 305 | | 4.000%, 9/01/26 | | 9/22 at 100.00 | N/R | | 299,748 | |
| | 250 | | 4.000%, 9/01/27 | | 9/22 at 100.00 | N/R | | 244,143 | |
| | | | Monrovia Redevelopment Agency, California, Central Project Area 1 Subordinate Tax Allocation Refunding Bonds, Series 2012: | | | | | | |
| | 335 | | 4.000%, 8/01/14 | | No Opt. Call | BBB– | | 346,233 | |
| | 695 | | 4.000%, 8/01/15 | | No Opt. Call | BBB– | | 731,585 | |
| | 760 | | Palomar Pomerado Health Care District, California, Certificates of Participation, Series 2010, 5.250%, 11/01/21 | | 11/20 at 100.00 | Baa3 | | 835,331 | |
| | 185 | | Riverside County Redevelopment Agency, California, Tax Allocation Housing Bonds, Series 2011A, 0.000%, 10/01/26 | | No Opt. Call | A– | | 116,348 | |
| | Principal | | | | Optional Call | | | | |
| | Amount (000) | | Description (1) | | Provisions (2) | Ratings (3) | | Value | |
| | | | California (continued) | | | | | | |
| $ | 490 | | San Bernardino County Financing Authority, California, Revenue Bonds, Courthouse Facilities Project, Series 2007, 5.100%, 6/01/17 | | No Opt. Call | N/R | $ | 512,878 | |
| | | | San Diego, California, Community Facilities District 3 Liberty Station Special Tax Refunding Bonds Series 2013: | | | | | | |
| | 200 | | 5.000%, 9/01/14 | | No Opt. Call | N/R | | 209,576 | |
| | 395 | | 5.000%, 9/01/15 | | No Opt. Call | N/R | | 425,466 | |
| | 340 | | 5.000%, 9/01/17 | | No Opt. Call | N/R | | 379,144 | |
| | 155 | | San Joaquin Hills Transportation Corridor Agency, Orange County, California, Toll Road Revenue Refunding Bonds, Series 1997A, 5.250%, 1/15/30 – NPFG Insured | | 7/13 at 100.00 | A | | 154,957 | |
| | 1,080 | | San Jose Redevelopment Agency, California, Tax Allocation Bonds, Merged Area Redevelopment Project, Series 2005A, 5.000%, 8/01/17 – NPFG Insured | | 8/15 at 100.00 | A | | 1,152,371 | |
| | 2,865 | | Vernon, California, Electric System Revenue Bonds, Series 2009A, 5.125%, 8/01/21 | | 8/19 at 100.00 | A– | | 3,232,981 | |
| | 925 | | Washington Township Health Care District, California, Revenue Bonds, Series 2009A, 6.000%, 7/01/29 | | 7/19 at 100.00 | Baa1 | | 1,050,967 | |
| | 31,010 | | Total California | | | | | 29,048,975 | |
| | | | Colorado – 3.5% (2.8% of Total Investments) | | | | | | |
| | | | Colorado Educational and Cultural Facilities Authority, Charter School Refunding Revenue Bonds, Pinnacle Charter School, Inc. K-8 Facility Project, Series 2013: | | | | | | |
| | 280 | | 4.000%, 6/01/18 | | No Opt. Call | A | | 303,041 | |
| | 310 | | 4.000%, 6/01/20 | | No Opt. Call | A | | 333,024 | |
| | 200 | | 5.000%, 6/01/21 | | No Opt. Call | A | | 226,820 | |
| | | | Colorado State Board of Governors, Colorado State University Auxiliary Enterprise System Revenue Bonds, Tender Option Bond Trust 3316: | | | | | | |
| | 100 | | 22.158%, 9/01/22 (IF) (4) | | No Opt. Call | Aa2 | | 205,570 | |
| | 300 | | 22.158%, 3/01/23 (IF) (4) | | No Opt. Call | Aa2 | | 604,680 | |
| | 430 | | 22.108%, 3/01/24 (IF) (4) | | No Opt. Call | Aa2 | | 858,934 | |
| | 725 | | 22.158%, 3/01/25 (IF) (4) | | No Opt. Call | Aa2 | | 1,432,854 | |
| | 200 | | 22.158%, 9/01/25 (IF) (4) | | No Opt. Call | Aa2 | | 395,850 | |
| | 200 | | Denver Convention Center Hotel Authority, Colorado, Revenue Bonds, Convention Center Hotel, Senior Lien Series 2006, 4.500%, 12/01/25 – SYNCORA GTY Insured | | 11/16 at 100.00 | BBB– | | 208,204 | |
| | 340 | | E-470 Public Highway Authority, Colorado, Senior Revenue Bonds, Series 1997B, 0.000%, 9/01/21 – NPFG Insured | | No Opt. Call | A | | 252,175 | |
| | 1,535 | | Lincoln Park Metropolitan District, Douglas County, Colorado, General Obligation Refunding and Improvement Bonds, Series 2008, 5.625%, 12/01/20 | | 12/17 at 100.00 | BBB– | | 1,690,127 | |
| | 4,620 | | Total Colorado | | | | | 6,511,279 | |
| | | | Florida – 7.9% (6.2% of Total Investments) | | | | | | |
| | | | Atlantic Beach, Florida, Healthcare Facilities Revenue Refunding Bonds, Fleet Landing Project, Series 2013A: | | | | | | |
| | 420 | | 5.000%, 11/15/20 | | No Opt. Call | BBB | | 478,376 | |
| | 150 | | 5.000%, 11/15/23 | | No Opt. Call | BBB | | 168,005 | |
| | 515 | | Belmont Community Development District, Florida, Capital Improvement Revenue Bonds, Phase 1 Project, Series 2013A, 5.500%, 11/01/23 | | No Opt. Call | N/R | | 514,974 | |
| | 1,270 | | Broward County, Florida, Fuel System Revenue Bonds, Fort Lauderdale Fuel Facilities LLC Project, Series 2013A, 5.000%, 4/01/23 – AGM Insured (Alternative Minimum Tax) | | No Opt. Call | AA– | | 1,455,750 | |
| | 500 | | Capital Trust Agency, Florida, Fixed Rate Air Cargo Revenue Refunding Bonds, Aero Miami FX, LLC Project, Series 2010A, 5.350%, 7/01/29 | | 7/20 at 100.00 | Baa3 | | 540,975 | |
| | 2,960 | | Florida Municipal Power Agency, Revenue Bonds, St. Lucie Project, Refunding Series 2012A, 5.000%, 10/01/26 | | No Opt. Call | A2 | | 3,425,638 | |
| | 1,535 | | Fontainbleau Lakes Community Development District, Miami-Dade County, Florida, Special Assessment Revenue Bonds, Series 2007B, 6.000%, 5/01/15 | | No Opt. Call | N/R | | 1,578,210 | |
| | | | Martin County Industrial Development Authority, Florida, Industrial Development Revenue Refunding Bonds, Indiantown Cogeneration LP, Series 2013: | | | | | | |
| | 2,535 | | 3.950%, 12/15/21 (Alternative Minimum Tax) | | 6/20 at 100.00 | Ba1 | | 2,549,678 | |
| | 500 | | 4.200%, 12/15/25 (Alternative Minimum Tax) | | 6/20 at 100.00 | Ba1 | | 502,870 | |
| | 1,400 | | Palm Beach County Health Facilities Authority, Florida, Revenue Bonds, Jupiter Medical Center, Series 2013A, 5.000%, 11/01/22 | | No Opt. Call | BBB+ | | 1,576,148 | |
| | | Nuveen Intermediate Duration Quality Municipal Term Fund (continued) |
| NIQ | | Portfolio of Investments |
| | | May 31, 2013 |
| | Principal | | | | Optional Call | | | | |
| | Amount (000) | | Description (1) | | Provisions (2) | Ratings (3) | | Value | |
| | | | Florida (continued) | | | | | | |
| $ | 250 | | Seminole Tribe of Florida, Special Obligation Bonds, Series 2007A, 144A, 5.750%, 10/01/22 | | 10/17 at 100.00 | BBB– | $ | 275,380 | |
| | 1,630 | | Verandah West Community Development District, Florida, Capital Improvement Revenue Bonds, Refunding Series 2013, 4.000%, 5/01/23 | | No Opt. Call | N/R | | 1,610,244 | |
| | 13,665 | | Total Florida | | | | | 14,676,248 | |
| | | | Georgia – 1.6% (1.3% of Total Investments) | | | | | | |
| | 2,000 | | Fulton County Development Authority, Georgia, Revenue Bonds, Robert W. Woodruff Arts Center, Inc. Project, Refunding Series 2009B, 5.000%, 3/15/16 | | No Opt. Call | A2 | | 2,223,700 | |
| | 973 | | Liberty County Industrial Authority, Georgia, Revenue Bonds, Series 2012A-2, 3.930%, 7/01/26 | | 7/13 at 100.00 | N/R | | 797,111 | |
| | 2,973 | | Total Georgia | | | | | 3,020,811 | |
| | | | Idaho – 0.6% (0.4% of Total Investments) | | | | | | |
| | 1,000 | | Madison County, Idaho, Hospital Revenue Certificates of Participation, Madison Memorial Hospital, Series 2006, 5.250%, 9/01/20 | | 9/16 at 100.00 | BB+ | | 1,053,940 | |
| | | | Illinois – 9.2% (7.2% of Total Investments) | | | | | | |
| | 2,500 | | Cook County, Illinois, General Obligation Bonds, Tender Option Bond Trust 2013-2A, 17.848%, 11/15/25 (IF) | | 11/22 at 100.00 | AA | | 4,046,800 | |
| | 1,500 | | Hillside, Cook County, Illinois, Senior Lien Tax Increment Revenue Bonds, Mannheim Redevelopment Project, Series 2008, 6.550%, 1/01/20 | | 1/18 at 102.00 | N/R | | 1,555,275 | |
| | 1,000 | | Illinois Finance Authority, Charter School Revenue Bonds, Chicago Charter School Foundation, Series 2007, 5.000%, 12/01/26 | | 12/16 at 100.00 | BBB+ | | 1,052,040 | |
| | 1,500 | | Illinois Finance Authority, Revenue Bonds, Friendship Village of Schaumburg, Series 2005A, 5.375%, 2/15/25 | | 2/15 at 100.00 | BB– | | 1,521,825 | |
| | 2,680 | | Illinois Finance Authority, Revenue Bonds, Illinois Institute of Technology, Refunding Series 2006A, 5.000%, 4/01/24 | | 4/16 at 100.00 | Baa3 | | 2,730,813 | |
| | 250 | | Illinois Finance Authority, Revenue Bonds, Montgomery Place Project, Series 2006A, 5.500%, 5/15/26 | | 5/17 at 100.00 | N/R | | 260,708 | |
| | 5,000 | | Illinois State, General Obligation Bonds, Refunding Series 2012, 4.000%, 8/01/25 | | No Opt. Call | A2 | | 5,112,247 | |
| | 1,000 | | Southwestern Illinois Development Authority, Local Government Revenue Bonds, Edwardsville Community Unit School District 7 Project, Series 2007, 0.000%, 12/01/22 – AGM Insured | | No Opt. Call | AA– | | 726,270 | |
| | 15,430 | | Total Illinois | | | | | 17,005,978 | |
| | | | Indiana – 1.3% (1.0% of Total Investments) | | | | | | |
| | 1,180 | | Indiana Finance Authority, Educational Facilities Revenue Bonds, 21st Century Charter School Project, Series 2013A, 6.000%, 3/01/33 | | 3/23 at 100.00 | BB– | | 1,166,430 | |
| | 1,145 | | Indiana Finance Authority, Private Activity Bonds, Ohio River Bridges East End Crossing Project, Series 2013B, 5.000%, 1/01/19 (Alternative Minimum Tax) | | 1/17 at 100.00 | BBB | | 1,261,939 | |
| | 2,325 | | Total Indiana | | | | | 2,428,369 | |
| | | | Iowa – 2.4% (1.9% of Total Investments) | | | | | | |
| | 1,000 | | Iowa Finance Authority, Health Facility Revenue Bonds, Care Initiatives Project, Series 2006A, 5.500%, 7/01/25 | | 7/16 at 100.00 | BB+ | | 1,051,370 | |
| | 1,405 | | Iowa Higher Education Loan Authority, Private College Facility Revenue Bonds, Wartburg College, Series 2005A, 5.000%, 10/01/22 | | 10/13 at 100.00 | BB | | 1,416,254 | |
| | 2,000 | | Iowa Tobacco Settlement Authority, Tobacco Asset-Backed Revenue Bonds, Series 2005B, 5.600%, 6/01/34 | | 6/17 at 100.00 | B+ | | 1,997,560 | |
| | 4,405 | | Total Iowa | | | | | 4,465,184 | |
| | | | Kentucky – 0.8% (0.7% of Total Investments) | | | | | | |
| | | | Kentucky Economic Development Finance Authority, Louisville Arena Project Revenue Bonds, Louisville Arena Authority, Inc., Series 2008-A1: | | | | | | |
| | 1,320 | | 5.750%, 12/01/28 – AGC Insured | | 6/18 at 100.00 | AA– | | 1,427,158 | |
| | 115 | | 6.000%, 12/01/33 – AGC Insured | | 6/18 at 100.00 | AA– | | 124,329 | |
| | 1,435 | | Total Kentucky | | | | | 1,551,487 | |
| | Principal | | | | Optional Call | | | | |
| | Amount (000) | | Description (1) | | Provisions (2) | Ratings (3) | | Value | |
| | | | Louisiana – 1.1% (0.9% of Total Investments) | | | | | | |
| $ | 500 | | Louisiana Local Government Environmental Facilities & Community Development Authority, Revenue Bonds, Westlake Chemical Corporation Project, Series 2007, 6.750%, 11/01/32 | | 11/17 at 100.00 | BBB– | $ | 567,920 | |
| | 1,500 | | Louisiana Public Facilities Authority, Solid Waste Disposal Facility Revenue Bonds, Louisiana Pellets Inc Project, Series 2013A, 9.750%, 8/01/14 (Alternative Minimum Tax) | | 1/14 at 100.00 | N/R | | 1,499,865 | |
| | 2,000 | | Total Louisiana | | | | | 2,067,785 | |
| | | | Maine – 0.6% (0.5% of Total Investments) | | | | | | |
| | 1,000 | | Maine Health and Higher Educational Facilities Authority Revenue Bonds, Eastern Maine Medical Center Obligated Group Issue, Series 2013, 5.000%, 7/01/33 | | 7/23 at 100.00 | Baa1 | | 1,074,970 | |
| | | | Maryland – 0.3% (0.2% of Total Investments) | | | | | | |
| | | | Maryland Health and Higher Educational Facilities Authority, Revenue Bonds, Frederick Memorial Hospital Issue, Series 2012A: | | | | | | |
| | 195 | | 5.000%, 7/01/20 | | No Opt. Call | BBB+ | | 229,301 | |
| | 275 | | 5.000%, 7/01/22 | | No Opt. Call | BBB+ | | 321,423 | |
| | 470 | | Total Maryland | | | | | 550,724 | |
| | | | Massachusetts – 2.9% (2.2% of Total Investments) | | | | | | |
| | 1,000 | | Massachusetts Development Finance Agency Revenue Bonds, Boston Medical Center Issue, Series 2012C, 5.000%, 7/01/29 | | No Opt. Call | BBB+ | | 1,092,630 | |
| | 250 | | Massachusetts Development Finance Agency, First Mortgage Revenue Bonds, Brookhaven at Lexington Project, Series 2005A, 5.000%, 3/01/35 – RAAI Insured | | 9/13 at 100.00 | A | | 251,418 | |
| | 1,000 | | Massachusetts Development Finance Agency, Resource Recovery Revenue Bonds, Covanta Energy Project, Series 2012A, 4.875%, 11/01/27 (Alternative Minimum Tax) | | No Opt. Call | BB+ | | 1,018,440 | |
| | 1,770 | | Massachusetts Development Finance Authority, Revenue Bonds, Eastern Nazarene College, Series 1999, 5.625%, 4/01/19 | | 10/13 at 100.00 | BB+ | | 1,775,292 | |
| | | | Massachusetts Port Authority, Special Facilities Revenue Bonds, Delta Air Lines Inc., Series 2001A: | | | | | | |
| | 140 | | 5.000%, 1/01/21 – AMBAC Insured | | 7/13 at 100.00 | N/R | | 140,011 | |
| | 1,000 | | 5.000%, 1/01/27 – AMBAC Insured (Alternative Minimum Tax) | | 7/13 at 100.00 | N/R | | 998,000 | |
| | 5,160 | | Total Massachusetts | | | | | 5,275,791 | |
| | | | Michigan – 11.0% (8.7% of Total Investments) | | | | | | |
| | 1,000 | | Detroit City School District, Wayne County, Michigan, General Obligation Bonds, Tender Option Bond Trust 3308, 23.033%, 11/01/26 – AGM Insured (IF) (4) | | No Opt. Call | Aa2 | | 1,752,750 | |
| | 10 | | Detroit Water Supply System, Michigan, Water Supply System Revenue Bonds, Refunding Senior Lien Series 2006D, 5.000%, 7/01/32 – AGM Insured | | 7/16 at 100.00 | AA– | | 10,193 | |
| | 440 | | Detroit Water Supply System, Michigan, Water Supply System Revenue Bonds, Refunding, Series 2006D, 5.000%, 7/01/33 – NPFG Insured | | No Opt. Call | A | | 447,964 | |
| | 290 | | Detroit Water Supply System, Michigan, Water Supply System Revenue Refunding Second Lien Bonds, Series 2006C, 5.000%, 7/01/33 – AGM Insured | | No Opt. Call | AA– | | 295,249 | |
| | 250 | | Detroit Water Supply System, Michigan, Water Supply System Revenue Senior Lien Bonds, Series 2006A, 5.000%, 7/01/34 – AGM Insured | | 7/16 at 100.00 | AA– | | 254,235 | |
| | 810 | | Detroit, Michigan, General Obligation Bonds, Refunding Series 2005C, 5.000%, 4/01/15 – AGM Insured | | No Opt. Call | AA– | | 833,830 | |
| | 400 | | Detroit, Michigan, General Obligation Bonds, Series 2005A, 5.000%, 4/01/25 – AGM Insured | | No Opt. Call | AA– | | 403,016 | |
| | 500 | | Detroit, Michigan, Second Lien Sewerage Disposal System Revenue Bonds, Series 2005A, 5.000%, 7/01/35 – NPFG Insured | | 7/15 at 100.00 | A | | 502,085 | |
| | 735 | | Detroit, Michigan, Second Lien Water Supply System Revenue Bonds, Series 2003B, 5.000%, 7/01/34 – NPFG Insured | | 7/13 at 100.00 | A | | 735,022 | |
| | 370 | | Detroit, Michigan, Senior Lien Sewerage Disposal System Revenue Bonds, Remarketed Series 1998A, 5.250%, 7/01/23 – AGC Insured | | 7/17 at 100.00 | AA– | | 399,915 | |
| | 2,500 | | Detroit, Michigan, Senior Lien Sewerage Disposal System Revenue Bonds, Series 2004A, 5.250%, 7/01/19 – AGM Insured | | No Opt. Call | AA– | | 2,880,400 | |
| | | Nuveen Intermediate Duration Quality Municipal Term Fund (continued) |
| NIQ | | Portfolio of Investments |
| | | May 31, 2013 |
| | Principal | | | | Optional Call | | | | |
| | Amount (000) | | Description (1) | | Provisions (2) | Ratings (3) | | Value | |
| | | | Michigan (continued) | | | | | | |
| | | | Detroit, Michigan, Senior Lien Water Supply System Revenue Bonds, Series 2003A: | | | | | | |
| $ | 250 | | 5.000%, 7/01/27 – NPFG Insured | | 7/13 at 100.00 | A+ | $ | 250,375 | |
| | 565 | | 5.000%, 7/01/34 – NPFG Insured | | 7/13 at 100.00 | A+ | | 565,017 | |
| | | | Detroit, Michigan, Sewer Disposal System Revenue Bonds, Second Lien, Series 2006B: | | | | | | |
| | 60 | | 5.000%, 7/01/33 – FGIC Insured | | 7/16 at 100.00 | A | | 60,913 | |
| | 1,185 | | 5.000%, 7/01/36 – MBIA-NPFG Insured | | 7/16 at 100.00 | A | | 1,202,348 | |
| | 730 | | Flint Hospital Building Authority, Michigan, Building Authority Revenue Bonds, Hurley Medical Center, Series 2013A, 5.000%, 7/01/23 | | No Opt. Call | Ba1 | | 754,513 | |
| | 2,020 | | Michigan Finance Authority, Hospital Revenue and Refunding Bonds, Crittenton Hospital Medical Center, Series 2012A, 4.125%, 6/01/32 | | No Opt. Call | A– | | 1,943,927 | |
| | 250 | | Michigan Finance Authority, Public School Academy Limited Obligation Revenue Bonds, Old Redford Academy Project, Series 2010A, 5.250%, 12/01/20 | | No Opt. Call | BB | | 268,235 | |
| | 1,405 | | Michigan Finance Authority, Revenue Bonds, Trinity Health Credit Group, Tender Option Bond Trust 4286, 22.344%, 12/01/18 (IF) (4) | | No Opt. Call | AA | | 2,377,653 | |
| | 2,900 | | Taylor Brownfield Redevelopment Authority, Wayne County, Michigan, Tax Increment Bonds, Series 2005A, 5.000%, 5/01/29 – NPFG Insured | | 5/15 at 100.00 | A | | 2,900,667 | |
| | 500 | | Troy Downtown Development Authority, Michigan, Tax Increment Revenue Bonds, Development & Refunding Series 2001, 5.500%, 11/01/15 – NPFG Insured | | 11/13 at 100.00 | A | | 504,125 | |
| | 1,000 | | Wayne County Airport Authority, Michigan, Revenue Bonds, Detroit Metropolitan Airport, Refunding Series 2010C, 5.000%, 12/01/14 | | No Opt. Call | A | | 1,066,720 | |
| | 18,170 | | Total Michigan | | | | | 20,409,152 | |
| | | | Minnesota – 1.6% (1.3% of Total Investments) | | | | | | |
| | 750 | | Rochester, Minnesota, Health Care Facilities Revenue Bonds, Olmsted Medical Center Project, Series 2013, 5.000%, 7/01/20 | | No Opt. Call | A– | | 889,470 | |
| | | | Saint Paul Housing and Redevelopment Authority, Minnesota, Lease Revenue Bonds, Saint Paul Conservatory for Performing Artists Charter School Project, Series 2013A: | | | | | | |
| | 205 | | 3.550%, 3/01/21 | | No Opt. Call | BBB– | | 205,683 | |
| | 100 | | 3.700%, 3/01/22 | | No Opt. Call | BBB– | | 100,219 | |
| | | | Sauk Rapids, Minnesota, Health Care and Housing Facilities Revenue Bonds, Good Shepherd Lutheran Home, Refunding Series 2013: | | | | | | |
| | 610 | | 5.000%, 1/01/17 | | No Opt. Call | N/R | | 659,660 | |
| | 500 | | 5.000%, 1/01/18 | | No Opt. Call | N/R | | 545,760 | |
| | 500 | | 5.000%, 1/01/19 | | No Opt. Call | N/R | | 548,215 | |
| | 2,665 | | Total Minnesota | | | | | 2,949,007 | |
| | | | Mississippi – 2.6% (2.0% of Total Investments) | | | | | | |
| | | | Mississippi Development Bank Special Obligation Bonds, Marshall County Industrial Development Authority, Mississippi Highway Construction Project, Tender Option Bond Trust 3315: | | | | | | |
| | 800 | | 22.533%, 1/01/20 (IF) (4) | | No Opt. Call | AA– | | 1,502,240 | |
| | 1,000 | | 22.533%, 1/01/20 (IF) (4) | | No Opt. Call | AA– | | 1,836,100 | |
| | 200 | | 22.533%, 1/01/20 (IF) (4) | | No Opt. Call | AA– | | 356,480 | |
| | 1,000 | | Mississippi Hospital Equipment and Facilities Authority, Revenue Bonds, South Central Regional Medical Center, Refunding & Improvement Series 2006, 5.250%, 12/01/21 | | 12/16 at 100.00 | BBB | | 1,064,410 | |
| | 3,000 | | Total Mississippi | | | | | 4,759,230 | |
| | | | Missouri – 1.0% (0.8% of Total Investments) | | | | | | |
| | 750 | | Franklin County Industrial Development Authority, Missouri, Sales Tax Refunding Revenue Bonds, Phoenix Center II Community Improvement District Project, Series 2013A, 4.000%, 11/01/25 | | 11/20 at 100.00 | N/R | | 748,890 | |
| | 1,000 | | Kansas City Tax Increment Financing Commission, Missouri, Tax Increment Revenue Bonds, Briarcliff West Project, Series 2006A, 5.400%, 6/01/24 | | 6/14 at 102.00 | N/R | | 1,035,420 | |
| | 1,750 | | Total Missouri | | | | | 1,784,310 | |
| | | | Nebraska – 1.8% (1.4% of Total Investments) | | | | | | |
| | 3,000 | | Central Plains Energy Project, Nebraska, Gas Project 3 Revenue Bonds, Series 2012, 5.000%, 9/01/32 | | 9/22 at 100.00 | A | | 3,300,210 | |
| | Principal | | | | Optional Call | | | | |
| | Amount (000) | | Description (1) | | Provisions (2) | Ratings (3) | | Value | |
| | | | New Jersey – 10.6% (8.3% of Total Investments) | | | | | | |
| | | | Atlantic City, New Jersey, General Obligation Bonds, Tax Appeal Series 2012: | | | | | | |
| $ | 1,425 | | 4.000%, 11/01/23 – AGM Insured | | 11/22 at 100.00 | AA– | $ | 1,519,193 | |
| | 4,805 | | 4.000%, 11/01/24 – AGM Insured | | 11/22 at 100.00 | AA– | | 5,072,541 | |
| | 2,405 | | 4.000%, 11/01/25 – AGM Insured | | 11/22 at 100.00 | AA– | | 2,520,705 | |
| | 615 | | New Jersey Economic Development Authority, Charter School Revenue Bonds, Lady Liberty Academy Charter School Project, Series 2013A, 5.150%, 8/01/23 | | No Opt. Call | BB+ | | 613,991 | |
| | | | New Jersey Economic Development Authority, Cigarette Tax Revenue Refunding Bonds, Series 2012: | | | | | | |
| | 2,000 | | 5.000%, 6/15/24 | | 6/22 at 100.00 | BBB+ | | 2,271,200 | |
| | 1,000 | | 5.000%, 6/15/28 | | No Opt. Call | BBB+ | | 1,099,490 | |
| | 1,000 | | New Jersey Economic Development Authority, School Facilities Construction Financing Program Bonds, Tender Option Bond Trust 1151, 3.180%, 9/01/25 (IF) (4) | | 3/25 at 100.00 | A+ | | 1,098,700 | |
| | 1,000 | | New Jersey Economic Development Authority, Special Facilities Revenue Bonds, Continental Airlines Inc., Series 1999, 5.250%, 9/15/29 (Alternative Minimum Tax) | | 9/22 at 101.00 | B | | 1,063,430 | |
| | 1,045 | | New Jersey Health Care Facilities Financing Authority, New Jersey, Revenue Bonds, Saint Peters University Hospital, Series 2007, 5.250%, 7/01/21 | | 7/18 at 100.00 | BB+ | | 1,148,612 | |
| | 195 | | New Jersey Health Care Facilities Financing Authority, Revenue Bonds, Saint Joseph’s Healthcare System Obligated Group Issue, Series 2008, 6.000%, 7/01/18 | | No Opt. Call | BBB– | | 219,740 | |
| | 3,000 | | Tobacco Settlement Financing Corporation, New Jersey, Tobacco Settlement Asset-Backed Bonds, Series 2007-1A, 5.000%, 6/01/29 | | 6/17 at 100.00 | B2 | | 2,869,410 | |
| | 18,490 | | Total New Jersey | | | | | 19,497,012 | |
| | | | New York – 4.4% (3.5% of Total Investments) | | | | | | |
| | | | New York City Industrial Development Agency, New York, American Airlines-JFK International Airport Special Facility Revenue Bonds, Series 2005: | | | | | | |
| | 2,000 | | 7.500%, 8/01/16 (Alternative Minimum Tax) | | No Opt. Call | N/R | | 2,131,360 | |
| | 2,000 | | 7.625%, 8/01/25 (Alternative Minimum Tax) | | 8/16 at 101.00 | N/R | | 2,306,700 | |
| | | | New York City Industrial Development Agency, New York, Civic Facility Revenue Bonds, Vaughn College of Aeronautics, Series 2006A: | | | | | | |
| | 435 | | 5.000%, 12/01/16 | | No Opt. Call | BB+ | | 463,849 | |
| | 1,800 | | 5.000%, 12/01/21 | | 12/16 at 100.00 | BB+ | | 1,912,608 | |
| | 255 | | New York City Industrial Development Agency, New York, Civic Facility Revenue Bonds, Vaughn College of Aeronautics, Series 2006B, 5.000%, 12/01/16 | | No Opt. Call | BB+ | | 271,912 | |
| | 1,000 | | Suffolk County Industrial Development Agency, New York, Continuing Care Retirement Community Revenue Bonds, Jefferson’s Ferry Project, Series 2006, 5.000%, 11/01/28 | | 11/16 at 100.00 | BBB– | | 1,049,690 | |
| | 7,490 | | Total New York | | | | | 8,136,119 | |
| | | | North Carolina – 1.5% (1.2% of Total Investments) | | | | | | |
| | 1,000 | | Charlotte, North Carolina, Special Facility Refunding Revenue Bonds, Charlotte/Douglas International Airport, US Airways, Inc. Project, Series 1998, 5.600%, 7/01/27 (Alternative Minimum Tax) | | 7/13 at 100.00 | N/R | | 1,001,140 | |
| | 1,040 | | North Carolina Eastern Municipal Power Agency, Power System Revenue Refunding Bonds, Series 1993B, 6.000%, 1/01/18 – AMBAC Insured | | No Opt. Call | Baa1 | | 1,255,509 | |
| | 400 | | North Carolina Turnpike Authority, Triangle Expressway System Revenue Bonds, Series 2009A, 5.250%, 1/01/25 – AGC Insured | | No Opt. Call | AA– | | 451,752 | |
| | 2,440 | | Total North Carolina | | | | | 2,708,401 | |
| | | | Ohio – 3.8% (2.9% of Total Investments) | | | | | | |
| | 5,000 | | Buckeye Tobacco Settlement Financing Authority, Ohio, Tobacco Settlement Asset-Backed Revenue Bonds, Senior Lien, Series 2007A-2, 5.875%, 6/01/30 | | 6/17 at 100.00 | B | | 4,652,149 | |
| | 2,000 | | Ross County, Ohio, Hospital Revenue Refunding Bonds, Adena Health System Series 2008, 5.750%, 12/01/28 | | 12/18 at 100.00 | A– | �� | 2,275,320 | |
| | 7,000 | | Total Ohio | | | | | 6,927,469 | |
| | | | Oregon – 0.6% (0.5% of Total Investments) | | | | | | |
| | 965 | | Astoria Hospital Facilities Authority, Oregon, Hospital Revenue and Refunding Bonds, Columbia Memorial Hospital, Series 2012, 5.000%, 8/01/22 | | No Opt. Call | BBB– | | 1,084,882 | |
| | | Nuveen Intermediate Duration Quality Municipal Term Fund (continued) |
| NIQ | | Portfolio of Investments |
| | | May 31, 2013 |
| | Principal | | | | Optional Call | | | | |
| | Amount (000) | | Description (1) | | Provisions (2) | Ratings (3) | | Value | |
| | | | Pennsylvania – 4.6% (3.6% of Total Investments) | | | | | | |
| $ | 90 | | East Hempfield Township Industrial Development Authority, Pennsylvania, Student Services Inc – Student Housing Project at Millersville University, Series 2013, 4.000%, 7/01/19 | | No Opt. Call | BBB– | $ | 96,260 | |
| | | | Erie Higher Education Building Authority, Pennsylvania, Revenue Bonds, Gannon University Project, Series 2013: | | | | | | |
| | 465 | | 4.000%, 5/01/20 | | No Opt. Call | BBB | | 504,530 | |
| | 480 | | 4.000%, 5/01/21 | | No Opt. Call | BBB | | 517,930 | |
| | 500 | | 4.000%, 5/01/22 | | No Opt. Call | BBB | | 532,805 | |
| | 520 | | 4.000%, 5/01/23 | | No Opt. Call | BBB | | 549,661 | |
| | 2,190 | | Erie Sewer Authority, Erie County, Pennsylvania, Sewer Revenue Bonds, Series 2012A, 5.000%, 6/01/21 – AGM Insured | | No Opt. Call | AA– | | 2,546,291 | |
| | | | Lebanon County Health Facilities Authority, Pennsylvania, Revenue Bonds, Good Samaritan Hospital Project, Series 2002: | | | | | | |
| | 255 | | 5.900%, 11/15/28 | | 11/13 at 100.00 | Ba2 | | 255,005 | |
| | 1,000 | | 6.000%, 11/15/35 | | 11/13 at 100.00 | Ba2 | | 1,000,060 | |
| | 500 | | Pennsylvania Economic Development Financing Authority, Revenue Bonds, Northwestern Human Services Inc., Series 1998A, 5.250%, 6/01/28 | | 12/13 at 100.00 | N/R | | 500,425 | |
| | 1,000 | | Pittsburgh Water and Sewerage Authority, Pennsylvania, First Lien Water and Sewerage System Revenue Bonds, Series 2005, 5.000%, 9/01/19 (Pre-refunded 9/01/15) – NPFG Insured | | 9/15 at 100.00 | A (5) | | 1,100,580 | |
| | | | Southcentral Pennsylvania General Authority, Revenue Bonds, Hanover Hospital Inc., Series 2013: | | | | | | |
| | 370 | | 5.000%, 12/01/20 | | No Opt. Call | BBB– | | 413,656 | |
| | 435 | | 5.000%, 12/01/21 | | No Opt. Call | BBB– | | 484,077 | |
| | 7,805 | | Total Pennsylvania | | | | | 8,501,280 | |
| | | | Puerto Rico – 7.3% (5.7% of Total Investments) | | | | | | |
| | 2,100 | | Puerto Rico Aqueduct and Sewerage Authority, Revenue Bonds, Senior Lien Series 2012A, 5.000%, 7/01/19 | | No Opt. Call | BBB– | | 2,153,046 | |
| | 2,095 | | Puerto Rico Municipal Finance Agency, Series 2005B, 5.250%, 7/01/19 – CIFG Insured | | No Opt. Call | AA– | | 2,310,596 | |
| | 1,465 | | Puerto Rico Sales Tax Financing Corporation, Sales Tax Revenue Bonds, First Subordinate Series 2009A, 5.000%, 8/01/18 | | No Opt. Call | A+ | | 1,641,576 | |
| | 2,445 | | Puerto Rico, General Obligation and Public Improvement Bonds, Series 2002A, 5.500%, 7/01/18 – NPFG Insured (Alternative Minimum Tax) | | No Opt. Call | A | | 2,616,786 | |
| | 1,700 | | Puerto Rico, General Obligation Bonds, Public Improvement Refunding Series 2007A, 5.500%, 7/01/19 – NPFG Insured | | No Opt. Call | A | | 1,812,829 | |
| | 2,570 | | Puerto Rico, Highway Revenue Bonds, Highway and Transportation Authority, Series 2005BB, 5.250%, 7/01/22 – AGM Insured | | No Opt. Call | AA– | | 2,830,110 | |
| | 80 | | Puerto Rico, The Children’s Trust Fund, Tobacco Settlement Asset-Backed Refunding Bonds, Series 2002, 5.500%, 5/15/39 | | 11/13 at 100.00 | BBB | | 80,899 | |
| | 12,455 | | Total Puerto Rico | | | | | 13,445,842 | |
| | | | Rhode Island – 3.5% (2.7% of Total Investments) | | | | | | |
| | 4,000 | | Rhode Island Health & Educational Building Corporation, Public Schools Financing Program Revenue Bonds, Pooled Series 2009E, 6.000%, 5/15/29 | | 5/19 at 100.00 | A3 | | 4,414,559 | |
| | 2,000 | | Rhode Island Tobacco Settlement Financing Corporation, Tobacco Settlement Asset-Backed Bonds, Series 2002A, 6.250%, 6/01/42 | | 6/13 at 100.00 | BBB– | | 2,035,000 | |
| | 6,000 | | Total Rhode Island | | | | | 6,449,559 | |
| | | | South Carolina – 2.3% (1.8% of Total Investments) | | | | | | |
| | 1,000 | | Piedmont Municipal Power Agency, South Carolina, Electric Revenue Bonds, Series 2010-A2, 5.000%, 1/01/18 | | No Opt. Call | A– | | 1,159,990 | |
| | 2,000 | | South Carolina JOBS Economic Development Authority, Hospital Revenue Bonds, Bon Secours Health System Obligated Group, Tender Option Bond Trust 1141, 21.096%, 11/01/28 (IF) (4) | | 11/22 at 100.00 | A– | | 3,063,100 | |
| | 3,000 | | Total South Carolina | | | | | 4,223,090 | |
| | | | Tennessee – 6.0% (4.7% of Total Investments) | | | | | | |
| | | | Knox County Health, Educational and Housing Facility Board, Tennessee, Hospital Revenue Refunding Bonds, Covenant Health, Series 2012A: | | | | | | |
| | 1,440 | | 5.000%, 1/01/25 | | No Opt. Call | A | | 1,632,730 | |
| | 2,000 | | 5.000%, 1/01/26 | | No Opt. Call | A | | 2,255,440 | |
| | Principal | | | | Optional Call | | | | |
| | Amount (000) | | Description (1) | | Provisions (2) | Ratings (3) | | Value | |
| | | | Tennessee (continued) | | | | | | |
| $ | 2,000 | | Memphis-Shelby County Airport Authority, Tennessee, Airport Revenue Bonds, Series 2010B, 5.750%, 7/01/22 (Alternative Minimum Tax) | | 7/20 at 100.00 | A2 | $ | 2,409,460 | |
| | 400 | | The Tennessee Energy Acquisition Corporation, Gas Revenue Bonds, Series 2006B, 5.625%, 9/01/26 | | No Opt. Call | BBB | | 461,856 | |
| | | | The Tennessee Energy Acquisition Corporation, Gas Revenue Bonds, Series 2006C: | | | | | | |
| | 1,020 | | 5.000%, 2/01/21 | | No Opt. Call | A– | | 1,157,873 | |
| | 1,490 | | 5.000%, 2/01/24 | | No Opt. Call | A– | | 1,684,117 | |
| | 1,365 | | 5.000%, 2/01/25 | | No Opt. Call | A– | | 1,547,787 | |
| | 9,715 | | Total Tennessee | | | | | 11,149,263 | |
| | | | Texas – 9.2% (7.2% of Total Investments) | | | | | | |
| | 200 | | Central Texas Regional Mobility Authority, Revenue Bonds, Senior Lien Series 2010, 5.750%, 1/01/25 | | 1/20 at 100.00 | Baa2 | | 235,506 | |
| | 500 | | Central Texas Regional Mobility Authority, Revenue Bonds, Subordinate Lien Refunding Series 2013, 5.000%, 1/01/22 | | No Opt. Call | Baa3 | | 558,715 | |
| | 685 | | Denton County Fresh Water Supply District 7, Texas, General Obligation Bonds, Refunding Series 2007, 4.000%, 2/15/21 – AGM Insured | | No Opt. Call | AA– | | 737,170 | |
| | 125 | | Harris County-Houston Sports Authority, Texas, Junior Lien Revenue Refunding Bonds, Series 2001B, 5.250%, 11/15/40 – NPFG Insured | | 11/13 at 100.00 | A | | 125,255 | |
| | 200 | | Harris County-Houston Sports Authority, Texas, Revenue Bonds, Senior Lien Series 2001G, 5.250%, 11/15/30 – NPFG Insured | | 11/13 at 100.00 | A | | 201,242 | |
| | 150 | | Harris County-Houston Sports Authority, Texas, Senior Lien Revenue Refunding Bonds, Series 2001A, 5.250%, 11/15/30 – NPFG Insured | | 11/13 at 100.00 | A | | 150,306 | |
| | 305 | | Harris County-Houston Sports Authority, Texas, Senior Lien Special Revenue Bonds, Series 1998A, 5.000%, 11/15/25 – NPFG Insured | | 11/13 at 100.00 | A | | 307,272 | |
| | 515 | | Houston, Texas, Hotel Occupancy Tax and Special Revenue Bonds, Convention and Entertainment Facilities Department, Refunding Series 2011A, 5.250%, 9/01/19 | | No Opt. Call | A2 | | 600,397 | |
| | 930 | | Lewisville, Texas, Combination Contract Revenue and Special Assessment Bonds, Lewisville Castle Hills Public Improvement District 3 Project, Series 2004, 6.125%, 9/01/29 – ACA Insured | | No Opt. Call | N/R | | 961,973 | |
| | 100 | | Love Field Airport Modernization Corporation, Texas, Special Facilities Revenue Bonds, Southwest Airlines Company – Love Field Modernization Program Project, Series 2012, 5.000%, 11/01/20 (Alternative Minimum Tax) | | No Opt. Call | BBB– | | 110,892 | |
| | 430 | | Lufkin Health Facilities Development Corporation, Texas, Health System Revenue Bonds, Memorial Health System of East Texas, Refunding Series 2009, 6.000%, 2/15/24 | | 2/19 at 100.00 | BBB– | | 478,758 | |
| | | | Tarrant County Cultural Education Facilities Finance Corporation, Texas, Hospital Revenue Bonds, Scott & White Healthcare Project, Tender Option Bond Trust 1149: | | | | | | |
| | 100 | | 21.690%, 8/15/22 (IF) (4) | | No Opt. Call | AA– | | 197,560 | |
| | 155 | | 21.489%, 8/15/24 (IF) (4) | | 8/23 at 100.00 | AA– | | 281,260 | |
| | 200 | | 21.690%, 8/15/26 (IF) (4) | | 8/23 at 100.00 | AA– | | 336,960 | |
| | 175 | | 21.449%, 8/15/27 (IF) (4) | | 8/23 at 100.00 | AA– | | 288,062 | |
| | 3,000 | | Texas Municipal Gas Acquisition and Supply Corporation I, Gas Supply Revenue Bonds, Senior Lien Series 2008D, 6.250%, 12/15/26 | | No Opt. Call | A– | | 3,799,650 | |
| | | | Texas Municipal Gas Acquisition and Supply Corporation III, Gas Supply Revenue Bonds, Series 2012: | | | | | | |
| | 3,000 | | 5.000%, 12/15/27 | | No Opt. Call | A3 | | 3,252,030 | |
| | 3,000 | | 5.000%, 12/15/28 | | No Opt. Call | A3 | | 3,207,750 | |
| | 230 | | Texas Public Finance Authority Charter School Finance Corporation, Education Revenue Bonds, Uplift Education, Series 2007A, 5.750%, 12/01/27 | | 12/17 at 100.00 | BBB– | | 247,112 | |
| | 360 | | Texas Public Finance Authority, Revenue Bonds, Texas Southern University Financing System, Series 2011, 6.000%, 5/01/23 | | 5/21 at 100.00 | BBB+ | | 426,949 | |
| | 460 | | Waco Health Facilities Development Corporation, Texas, Hillcrest Health System Project, FHA Insured Mortgage Revenue Bonds, Series 2006A, 5.000%, 8/01/31 (Pre-refunded 8/01/16) – NPFG Insured | | 8/16 at 100.00 | A (5) | | 522,896 | |
| | 14,820 | | Total Texas | | | | | 17,027,715 | |
| | | | Vermont – 0.5% (0.4% of Total Investments) | | | | | | |
| | 900 | | Vermont Economic Development Authority, Solid Waste Disposal Revenue Bonds, Casella Waste Systems, Inc. Project, Series 2013, 4.750%, 4/01/36 (Mandatory put 4/01/18) (Alternative Minimum Tax) | | No Opt. Call | B+ | | 900,711 | |
| | | Nuveen Intermediate Duration Quality Municipal Term Fund (continued) |
| NIQ | | Portfolio of Investments |
| | | May 31, 2013 |
| | Principal | | | | Optional Call | | | | |
| | Amount (000) | | Description (1) | | Provisions (2) | Ratings (3) | | Value | |
| | | | Virgin Islands – 1.2% (0.9% of Total Investments) | | | | | | |
| $ | 2,000 | | Virgin Islands Public Finance Authority, Gross Receipts Taxes Loan Note, Refunding Series 2012A, 4.000%, 10/01/22 – AGM Insured | | No Opt. Call | AA– | $ | 2,173,580 | |
| | | | Virginia – 0.3% (0.3% of Total Investments) | | | | | | |
| | 535 | | Chesapeake, Virginia, Transportation System Senior Toll Road Revenue Bonds, Series 2012A, 5.000%, 7/15/21 | | No Opt. Call | BBB | | 616,630 | |
| | | | Wisconsin – 0.4% (0.3% of Total Investments) | | | | | | |
| | | | University of Wisconsin Hospitals and Clinics Authority, Revenue Bonds, Tender Option Bond Trust 4287: | | | | | | |
| | 50 | | 21.108%, 4/01/20 (IF) (4) | | No Opt. Call | Aa3 | | 96,553 | |
| | 100 | | 21.957%, 10/01/20 (IF) (4) | | No Opt. Call | Aa3 | | 195,755 | |
| | 185 | | 21.556%, 10/01/20 (IF) (4) | | No Opt. Call | Aa3 | | 344,663 | |
| | 100 | | 21.957%, 10/01/20 (IF) (4) | | No Opt. Call | Aa3 | | 182,740 | |
| | 435 | | Total Wisconsin | | | | | 819,711 | |
| $ | 216,113 | | Total Investments (cost $238,828,363) – 127.4% | | | | | 235,486,994 | |
| | | | Variable Rate MuniFund Term Preferred Shares, at Liquidation Value – (29.8)% (6) | | | | | (55,000,000 | ) |
| | | | Other Assets Less Liabilities – 2.4% (7) | | | | | 4,397,665 | |
| | | | Net Assets Applicable to Common Shares – 100% | | | | $ | 184,884,659 | |
Investments in Derivatives as of May 31, 2013
Swaps outstanding:
| | | | | Fund | | | | | | Fixed Rate | | | | | | Unrealized | |
| | | Notional | | Pay/Receive | | Floating Rate | | Fixed Rate | | Payment | | Effective | | Termination | | Appreciation | |
| Counterparty | | Amount | | Floating Rate | | Index | | (Annualized) | | Frequency | | Date (8) | | Date | | (Depreciation) (7) | |
| Barclays Bank PLC | | $ 4,700,000 | | Receive | | 3-Month USD-LIBOR | | 2.310% | | Semi-Annually | | 5/15/14 | | 5/15/23 | | $ 99,268 | |
| Barclays Bank PLC | | 5,000,000 | | Receive | | 3-Month USD-LIBOR | | 2.735 | | Semi-Annually | | 5/05/15 | | 5/05/25 | | 144,758 | |
| Barclays Bank PLC | | 11,500,000 | | Receive | | 3-Month USD-LIBOR | | 3.129 | | Semi-Annually | | 5/15/14 | | 5/15/33 | | 220,590 | |
| | | | | | | | | | | | | | | | | $464,616 | |
| (1) | | All percentages shown in the Portfolio of Investments are based on net assets applicable to Common shares unless otherwise noted. |
| (2) | | Optional Call Provisions (not covered by the report of independent registered public accounting firm): Dates (month and year) and prices of the earliest optional call or redemption. There may be other call provisions at varying prices at later dates. Certain mortgage-backed securities may be subject to periodic principal paydowns. |
| (3) | | Ratings (not covered by the report of independent registered public accounting firm): Using the highest of Standard & Poor’s Group (“Standard & Poor’s”), Moody’s Investors Service, Inc. (“Moody’s”) or Fitch, Inc. (“Fitch”) rating. Ratings below BBB by Standard & Poor’s, Baa by Moody’s or BBB by Fitch are considered to be below investment grade. Holdings designated N/R are not rated by any of these national rating agencies. |
| (4) | | Investment, or portion of investment, has been pledged to collateralize the net payment obligations for investments in derivatives and/or inverse floating rate transactions. |
| (5) | | Backed by an escrow or trust containing sufficient U.S. Government or U.S. Government agency securities, which ensure the timely payment of principal and interest. Certain bonds backed by U.S. Government or agency securities are regarded as having an implied rating equal to the rating of such securities. |
| (6) | | Variable Rate MuniFund Term Preferred Shares, at Liquidation Value as a percentage of Total Investments is 23.4%. |
| (7) | | Other Assets Less Liabilities includes the Unrealized Appreciation (Depreciation) of derivative instruments as listed within Investments in Derivatives as of the end of the reporting period. |
| (8) | | Effective date represents the date on which both the Fund and Counterparty commence interest payment accruals on each forward swap contract. |
| N/R | | Not rated. |
| (IF) | | Inverse floating rate investment. |
| 144A | | Investment is exempt from registration under Rule 144A of the Securities Act of 1933, as amended. These investments may only be resold in transactions exempt from registration, which are normally those transactions with qualified institutional buyers. |
| USD-LIBOR | | United States Dollar-London Inter-Bank Offered Rate. |
See accompanying notes to financial statements.
| | | Statement of |
| | | Assets & Liabilities |
| | | May 31, 2013 |
| | | | | | | | |
| | | | | | | Intermediate | |
| | | | Intermediate | | | Duration | |
| | | | Duration | | | Quality | |
| | | | (NID | ) | | (NIQ | ) |
| Assets | | | | | | | |
| Investments, at value (cost $833,339,204 and $238,828,363, respectively) | | $ | 822,579,927 | | $ | 235,486,994 | |
| Cash | | | — | | | 356,052 | |
| Receivables: | | | | | | | |
| Interest | | | 14,570,217 | | | 3,835,673 | |
| Investments sold | | | 3,855,000 | | | 495,000 | |
| Deferred offering costs | | | 112,265 | | | 92,089 | |
| Unrealized appreciation on swaps | | | 1,018,743 | | | 464,616 | |
| Other assets | | | 2,779 | | | — | |
| Total assets | | | 842,138,931 | | | 240,730,424 | |
| Liabilities | | | | | | | |
| Cash overdraft | | | 5,566,152 | | | — | |
| Payables: | | | | | | | |
| Common share dividends | | | 2,465,121 | | | 599,459 | |
| Offering costs | | | 36,000 | | | 81,000 | |
| Variable Rate MuniFund Term Preferred (VMTP) Shares, at liquidation value | | | 175,000,000 | | | 55,000,000 | |
| Accrued expenses: | | | | | | | |
| Management fees | | | 461,076 | | | 115,880 | |
| Trustees fees | | | 7,833 | | | 2,851 | |
| Other | | | 128,592 | | | 46,575 | |
| Total liabilities | | | 183,664,774 | | | 55,845,765 | |
| Net assets applicable to Common shares | | $ | 658,474,157 | | $ | 184,884,659 | |
| Common shares outstanding | | | 46,909,660 | | | 13,097,144 | |
| Net asset value per Common share outstanding (net assets applicable to Common shares, divided by Common shares outstanding) | | $ | 14.04 | | $ | 14.12 | |
| Net assets applicable to Common shares consist of: | | | | | | | |
| Common shares, $.01 par value per share | | $ | 469,097 | | $ | 130,971 | |
| Paid-in surplus | | | 670,189,992 | | | 187,085,186 | |
| Undistributed (Over-distribution of) net investment income | | | 1,902,688 | | | 560,300 | |
| Accumulated net realized gain (loss) | | | (4,347,086 | ) | | (15,045 | ) |
| Net unrealized appreciation (depreciation) | | | (9,740,534 | ) | | (2,876,753 | ) |
| Net assets applicable to Common shares | | $ | 658,474,157 | | $ | 184,884,659 | |
| Authorized shares: | | | | | | | |
| Common | | | Unlimited | | | Unlimited | |
| Preferred | | | Unlimited | | | Unlimited | |
See accompanying notes to financial statements.
| | | | | | | Intermediate | |
| | | | Intermediate | | | Duration | |
| | | | Duration | | | Quality | |
| | | | (NID | )* | | (NIQ) | ** |
| Investment Income | | $ | 15,438,919 | | $ | 2,415,395 | |
| Expenses | | | | | | | |
| Management fees | | | 2,316,180 | | | 380,835 | |
| Shareholder servicing agent fees and expenses | | | 2,787 | | | 1,422 | |
| Interest expense and amortization of offering costs | | | 719,639 | | | 162,710 | |
| Custodian fees and expenses | | | 61,848 | | | 15,543 | |
| Trustees fees and expenses | | | 15,145 | | | 7,105 | |
| Professional fees | | | 36,739 | | | 19,588 | |
| Shareholder reporting expenses | | | 26,474 | | | 6,916 | |
| Investor relations expenses | | | 41,183 | | | 7,921 | |
| Other expenses | | | 8,981 | | | 3,705 | |
| Total expenses | | | 3,228,976 | | | 605,745 | |
| Net investment income (loss) | | | 12,209,943 | | | 1,809,650 | |
| Realized and Unrealized Gain (Loss) | | | | | | | |
| Net realized gain (loss) from investments | | | (4,347,097 | ) | | (15,067 | ) |
| Change in net unrealized appreciation (depreciation) of: | | | | | | | |
| Investments | | | (10,759,277 | ) | | (3,341,369 | ) |
| Swaps | | | 1,018,743 | | | 464,616 | |
| Net realized and unrealized gain (loss) | | | (14,087,631 | ) | | (2,891,820 | ) |
| Net increase (decrease) in net assets applicable to Common shares from operations | | $ | (1,877,688 | ) | $ | (1,082,170 | ) |
| * | For the period December 5, 2012 (commencement of operations) through May 31, 2013. |
| ** | For the period February 7, 2013 (commencement of operations) through May 31, 2013. |
See accompanying notes to financial statements.
| | | Statement of |
| | | Changes in Net Assets |
| | | | | | | Intermediate | |
| | | | Intermediate | | | Duration | |
| | | | Duration | | | Quality | |
| | | | (NID | )* | | (NIQ) | ** |
| Operations | | | | | | | |
| Net investment income (loss) | | $ | 12,209,943 | | $ | 1,809,650 | |
| Net realized gain (loss) from investments | | | (4,347,097 | ) | | (15,067 | ) |
| Change in net unrealized appreciation (depreciation) of: | | | | | | | |
| Investments | | | (10,759,277 | ) | | (3,341,369 | ) |
| Swaps | | | 1,018,743 | | | 464,616 | |
| Net increase (decrease) in net assets applicable to Common shares from operations | | | (1,877,688 | ) | | (1,082,170 | ) |
| Distributions to Common Shareholders | | | | | | | |
| From net investment income | | | (10,319,979 | ) | | (1,257,239 | ) |
| Decrease in net assets applicable to Common shares from distributions to Common shareholders | | | (10,319,979 | ) | | (1,257,239 | ) |
| Capital Share Transactions | | | | | | | |
| Proceeds from sale of Common Shares, net of offering costs | | | 670,533,500 | | | 187,097,749 | |
| Net proceeds from Common shares issued to shareholders due to reinvestment of distributions | | | 38,049 | | | 26,044 | |
| Net increase (decrease) in net assets applicable to Common shares from capital share transactions | | | 670,571,549 | | | 187,123,793 | |
| Net increase (decrease) in net assets applicable to Common shares | | | 658,373,882 | | | 184,784,384 | |
| Net assets applicable to Common shares at the beginning of period | | | 100,275 | | | 100,275 | |
| Net assets applicable to Common shares at the end of period | | $ | 658,474,157 | | $ | 184,884,659 | |
| Undistributed (Over-distribution of) net investment income at the end of period | | $ | 1,902,688 | | $ | 560,300 | |
| * | For the period December 5, 2012 (commencement of operations) through May 31, 2013. |
| ** | For the period February 7, 2013 (commencement of operations) through May 31, 2013. |
See accompanying notes to financial statements.
| | | | | | | Intermediate | |
| | | | Intermediate | | | Duration | |
| | | | Duration | | | Quality | |
| | | | (NID | )* | | (NIQ) | ** |
| Cash Flows from Operating Activities: | | | | | | | |
| Net Increase (Decrease) in Net Assets Applicable to Common Shares from Operations | | $ | (1,877,688 | ) | $ | (1,082,170 | ) |
| Adjustments to reconcile the net increase (decrease) in net assets applicable to Common shares from operations to net cash provided by (used in) operating activities: | | | | | | | |
| Purchases of investments | | | (993,144,933 | ) | | (241,109,784 | ) |
| Proceeds from sales and maturities of investments | | | 152,137,043 | | | 1,251,258 | |
| Amortization (Accretion) of premiums and discounts, net | | | 3,321,589 | | | 1,015,096 | |
| (Increase) Decrease in: | | | | | | | |
| Receivable for interest | | | (14,570,217 | ) | | (3,835,673 | ) |
| Receivable for investments sold | | | (3,855,000 | ) | | (495,000 | ) |
| Other assets | | | (2,779 | ) | | — | |
| Increase (Decrease) in: | | | | | | | |
| Accrued management fees | | | 461,076 | | | 115,880 | |
| Accrued Trustees fees | | | 7,833 | | | 2,851 | |
| Accrued other expenses | | | 128,592 | | | 46,575 | |
| Net realized (gain) loss from investments | | | 4,347,097 | | | 15,067 | |
| Change in net unrealized (appreciation) depreciation of: | | | | | | | |
| Investments | | | 10,759,277 | | | 3,341,369 | |
| Swaps | | | (1,018,743 | ) | | (464,616 | ) |
| Net cash provided by (used in) operating activities | | | (843,306,853 | ) | | (241,199,147 | ) |
| Cash Flows from Financing Activities: | | | | | | | |
| (Increase) Decrease in deferred offering costs | | | (112,265 | ) | | (92,089 | ) |
| Increase (Decrease) in: | | | | | | | |
| Cash overdraft | | | 5,566,152 | | | — | |
| Payable for offering costs | | | 36,000 | | | 81,000 | |
| VMTP Shares, at liquidation value | | | 175,000,000 | | | 55,000,000 | |
| Cash distributions paid to Common shareholders | | | (7,816,809 | ) | | (631,736 | ) |
| Proceeds from sale of Common shares, net of offering costs | | | 670,533,500 | | | 187,097,749 | |
| Net cash provided by (used in) financing activities | | | 843,206,578 | | | 241,454,924 | |
| Net Increase (Decrease) in Cash | | | (100,275 | ) | | 255,777 | |
| Cash at the beginning of period | | | 100,275 | | | 100,275 | |
| Cash at the End of Period | | $ | — | | $ | 356,052 | |
| * | For the period December 5, 2012 (commencement of operations) through May 31, 2013. |
| ** | For the period February 7, 2013 (commencement of operations) through May 31, 2013. |
Supplemental Disclosure of Cash Flow Information
Non-cash financing activities not included herein consists of reinvestments of Common share distributions of $38,049 and $26,044 for Intermediate Duration (NID) and Intermediate Duration Quality (NIQ), respectively.
Cash paid for interest (excluding amortization of offering costs) was $706,904 and $154,799 for Intermediate Duration (NID) and Intermediate Duration Quality (NIQ), respectively.
See accompanying notes to financial statements.
THIS PAGE INTENTIONALLY LEFT BLANK
| | | Financial |
| | | Highlights |
| | | |
| | Selected data for a Common share outstanding throughout each period: |
| | | | | | | Investment Operations | | | Less Distributions | | | | | | | | | | |
| | | | | | | | | | | | | | | | From | | | From | | | | | | | | | | | | | |
| | | | | | | | | | | | | | | | Net | | | Accumulated | | | | | | | | | | | | | |
| | | | | | | | | | | | | | | | Investment | | | Net Realized | | | | | | | | | | | | | |
| | | | Beginning | | | | | | | | | | | | Income | | | Gains | | | | | | | | | Ending | | | | |
| | | | Common | | | Net | | | Net | | | | | | to | | | to | | | | | | | | | Common | | | | |
| | | | Share | | | Investment | | | Realized/ | | | | | | Common | | | Common | | | | | | | | | Share | | | Ending | |
| | | | Net Asset | | | Income | | | Unrealized | | | | | | Share- | | | Share- | | | | | | Offering | | | Net Asset | | | Market | |
| | | | Value | | | (Loss) | | | Gain (Loss) | | | Total | | | holders | | | holders | | | Total | | | Costs | | | Value | | | Value | |
| Intermediate Duration (NID) | | | | | | | | | | | | | | | | | | | | | | | | | | | | |
| Year Ended 5/31: | | | | | | | | | | | | | | | | | | | | | | | | | | | | | | | |
| 2013(d) | | $ | 14.33 | | $ | .26 | | $ | (.30 | ) | $ | (.04 | ) | $ | (.22 | ) | $ | — | | $ | (.22 | ) | $ | (.03 | ) | $ | 14.04 | | $ | 13.00 | |
| | | | | | | | | | | | | | | | | | | | | | | | | | | | | | | | |
| Intermediate Duration Quality (NIQ) | | | | | | | | | | | | | | | | | | | | | | | | | | | |
| Year Ended 5/31: | | | | | | | | | | | | | | | | | | | | | | | | | | | | | | | |
| 2013(e) | | | 14.33 | | | .14 | | | (.22 | ) | | (.08 | ) | | (.10 | ) | | — | | | (.10 | ) | | (.03 | ) | | 14.12 | | | 13.09 | |
| | | | VMTP Shares at the End of Period | |
| | | | Aggregate | | | Asset | |
| | | | Amount | | | Coverage | |
| | | | Outstanding | | | Per $100,000 | |
| | | | (000 | ) | | Share | |
| Intermediate Duration (NID) | | | | | | | |
| Year Ended 5/31: | | | | | | | |
| 2013(d) | | $ | 175,000 | | $ | 476,271 | |
| | | | | | | | |
| Intermediate Duration Quality (NIQ) | | | | | | | |
| Year Ended 5/31: | | | | | | | |
| 2013(e) | | | 55,000 | | | 436,154 | |
| | | | | | | | Ratios/Supplemental Data |
| | Total Returns | | | | | | Ratios to Average Net Assets Applicable to Common Shares(b) | | | | |
| | Based on Market Value | (a) | | Based on Common Share Net Asset Value | (a) | | Ending Net Assets Applicable to Common Shares (000 | ) | | Expenses | (c) | | Net Investment Income (Loss) | | | Portfolio Turnover Rate | |
| | | | | | | | | | | | | | | | | | |
| | (11.94 | )% | | (.46 | )% | $ | 658,474 | | | 1.05 | %* | | 3.97 | %* | | 20 | % |
| | | | | | | | | | | | | | | | | | |
| | | | | | | | | | | | | | | | | | |
| | (12.12 | ) | | (.77 | ) | | 184,885 | | | 1.10 | * | | 3.30 | * | | 1 | |
| (a) | Total Return Based on Market Value is the combination of changes in the market price per share and the effect of reinvested dividend income and reinvested capital gains distributions, if any, at the average price paid per share at the time of reinvestment. The last dividend declared in the period, which is typically paid on the first business day of the following month, is assumed to be reinvested at the ending market price. The actual reinvestment for the last dividend declared in the period may take place over several days, and in some instances may not be based on the market price, so the actual reinvestment price may be different from the price used in the calculation. Total returns are not annualized. |
| | |
| | Total Return Based on Common Share Net Asset Value is the combination of changes in Common Share net asset value, reinvested dividend income at net asset value and reinvested capital gains distributions at net asset value, if any. The last dividend declared in the period, which is typically paid on the first business day of the following month, is assumed to be reinvested at the ending net asset value. The actual reinvest price for the last dividend declared in the period may often be based on the Fund’s market price (and not its net asset value), and therefore may be different from the price used in the calculation. Total returns are not annualized. |
| (b) | Net Investment Income (Loss) ratios reflect income earned and expenses incurred on assets attributable to VMTP Shares. |
| (c) | The expense ratios reflect, among other things, all interest expense and other costs related to VMTP Shares and/or the interest expense deemed to have been paid by the Fund on the floating rate certificates issued by the special purpose trusts for the self-deposited inverse floaters held by the Fund, where applicable, both as described in Footnote 1 – General Information and Significant Accounting Policies, Variable Rate MuniFund Term Preferred Shares and Inverse Floating Rate Securities, respectively, as follows: |
| Intermediate Duration (NID) | | | |
| Year Ended 5/31: | | | |
| 2013(d) | | | .23 | %* |
| Intermediate Duration Quality (NIQ) | | | | |
| Year Ended 5/31: | | | | |
| 2013(e) | | | .30 | %* |
| (d) | For the period December 5, 2013 (commencement of operations) through May 31, 2013. |
| (e) | For the period February 7, 2013 (commencement of operations) through May 31, 2013. |
| * | Annualized. |
See accompanying notes to financial statements.
| | | Notes to |
| | | Financial Statements |
1. General Information and Significant Accounting Policies
General Information
The funds covered in this report and their corresponding New York Stock Exchange (“NYSE”) symbols are Nuveen Intermediate Duration Municipal Term Fund (NID) and Nuveen Intermediate Duration Quality Municipal Term Fund (NIQ) (each a “Fund” and collectively, the “Funds”). The Funds are registered under the Investment Company Act of 1940, as amended, as diversified closed-end registered investment companies. Intermediate Duration and Intermediate Duration Quality each have a term of ten years and intend to liquidate and distribute their net assets to shareholders on or before March 31, 2023 and June 30, 2023, respectively.
On December 31, 2012, the Funds’ investment adviser converted from a Delaware corporation to a Delaware limited liability company. As a result, Nuveen Fund Advisers, Inc., a wholly-owned subsidiary of Nuveen Investments, Inc. (“Nuveen”), changed its name to Nuveen Fund Advisers, LLC (the “Adviser”). There were no changes to the identities or roles of any personnel as a result of the change.
Intermediate Duration seeks to provide a high level of current income exempt from regular federal income tax with a secondary objective of seeking additional total return. Intermediate Duration will seek to achieve its investment objectives by investing in municipal securities that Nuveen Asset Management, LLC (the “Sub-Adviser”), a wholly-owned subsidiary of the Adviser believes are underrated or undervalued, based upon its bottom-up, research-driven investment strategy. The Fund also will seek to reduce the risk of rising interest rates by maintaining a portfolio with an intermediate duration (including the effects of leverage). The Fund’s portfolio will be actively managed, with the goal of capitalizing on historically favorable municipal credit spreads (the difference between yields on municipal securities across all debt rating categories) currently available in the market. Under normal circumstances, the Fund will invest at least 80% of its managed assets (as defined in Footnote 7 – Management Fees and Other Transactions with Affiliates) in municipal securities and other related investments, the income from which is exempt from regular federal income tax. The Fund will invest at least 50% of its managed assets in investment grade municipal securities; it also may invest in below investment grade securities, which are regarded as having predominately speculative characteristics with respect to an issuer’s capacity to pay interest and repay principal, and are commonly referred to as junk bonds or high yield debt.
Intermediate Duration Quality seeks to provide current income exempt from regular federal income tax with a secondary objective of seeking additional total return. The Fund seeks to achieve its investment objectives by investing in a diversified portfolio of primarily investment grade quality municipal securities (at least 80%), the income from which is exempt from regular federal income tax. The Fund also will seek to reduce the risk of rising interest rates by maintaining a portfolio with an intermediate duration of between three and ten years (including the effects of leverage). The Fund will emphasize the purchase of municipal securities that the Sub-Adviser believes are underrated or undervalued. The Fund’s portfolio will be actively managed, seeking to capitalize on favorable relative value opportunities, with the goal of outperforming broad municipal market benchmarks over the life of the Fund.
Prior to the commencement of operations for Intermediate Duration and Intermediate Duration Quality on December 5, 2012, and February 7, 2013, respectively, the Funds had no operations other than those related to organizational matters, each Fund’s initial contribution of $100,275 by the Adviser, and the recording of each Funds’ organizational expenses ($11,000) and its reimbursement by the Adviser.
Significant Accounting Policies
The following is a summary of significant accounting policies followed by the Funds in the preparation of their financial statements in accordance with U.S. generally accepted accounting principles (“U.S. GAAP”).
Investment Valuation
Prices of municipal bonds and swap contracts are provided by a pricing service approved by the Funds’ Board of Trustees. These securities are generally classified as Level 2 for fair value measurement purposes. The pricing service establishes a security’s fair value using methods that may include consideration of the following: yields or prices of investments of comparable quality, type of issue, coupon, maturity and rating, market quotes or indications of value from security dealers, evaluations of anticipated cash flows or collateral, general market conditions and other information and analysis, including the obligor’s credit characteristics considered relevant. In pricing certain securities, particularly less liquid and lower quality securities, the pricing service may consider information about a security, its issuer or market activity provided by the Adviser. These securities are generally classified as Level 2 or Level 3 depending on the priority of the significant inputs.
Certain securities may not be able to be priced by the pre-established pricing methods as described above. Such securities may be valued by the Funds’ Board of Trustees or its designee at fair value. These securities generally include, but are not limited to, restricted securities (securities which may not be publicly sold without registration under the Securities Act of 1933, as amended) for which a pricing service is unable to provide a market price; securities whose trading has been formally suspended; debt securities that have gone into default and for which there is no current market quotation; a security whose market price is not available from a pre-established pricing source; a security with respect to which an event has occurred that is likely to materially affect the value of the security after the market has closed but before the calculation of a Fund’s net asset value (as may be the case in non-U.S. markets on which the security is primarily traded) or make it difficult or impossible to obtain a reliable market quotation; and a security whose price, as provided by the pricing service, is not deemed to reflect the security’s fair value. As a general principle, the fair value of a security would appear to be the amount that the owner might reasonably expect to receive for it in a current sale. A variety of factors may be considered in determining the fair value of such securities, which may include consideration of the following: yields or prices of investments of comparable quality, type of issue, coupon, maturity and rating, market quotes or indications of value from securities dealers, evaluations of anticipated cash flows or collateral, general market conditions and other information and analysis, including the obligor’s credit characteristics considered relevant. These securities are generally classified as Level 2 or Level 3 depending on the priority of the significant inputs. Regardless of the method employed to value a particular security, all valuations are subject to review by the Funds’ Board of Trustees or its designee.
Refer to Footnote 2 – Fair Value Measurements for further details on the leveling of securities held by the Funds as of the end of the reporting period.
Investment Transactions
Investment transactions are recorded on a trade date basis. Realized gains and losses from transactions are determined on the specific identification method, which is the same basis used for federal income tax purposes. Investments purchased on a when-issued/delayed delivery basis may have extended settlement periods. Any investments so purchased are subject to market fluctuation during this period. The Funds have instructed the custodian to earmark securities in the Funds’ portfolios with a current value at least equal to the amount of the when-issued/delayed delivery purchase commitments. As of May 31, 2013, there were no such outstanding purchase commitments in either of the Funds.
Investment Income
Investment income, which reflects the amortization of premiums and includes accretion of discounts for financial reporting purposes, is recorded on an accrual basis. Investment income also reflects paydown gains and losses, if any.
Professional Fees
Professional fees presented on the Statement of Operations consist of legal fees incurred in the normal course of operations, audit fees, tax consulting fees and, in some cases, workout expenditures. Workout expenditures are incurred in an attempt to protect or enhance an investment, or to pursue other claims or legal actions on behalf of Fund shareholders. Legal fee refund presented on the Statement of Operations reflects a refund of workout expenditures paid in a prior reporting period, when applicable.
Income Taxes
Each Fund is a separate taxpayer for federal income tax purposes. Each Fund intends to distribute substantially all of its net investment income and net capital gains to shareholders and to otherwise comply with the requirements of Subchapter M of the Internal Revenue Code applicable to regulated investment companies. Therefore, no federal income tax provision is required. Furthermore, each Fund intends to satisfy conditions that will enable interest from municipal securities, which is exempt from regular federal income tax, to retain such tax-exempt status when distributed to shareholders of the Funds. Net realized capital gains and ordinary income distributions paid by the Funds are subject to federal taxation.
For all open tax years and all major taxing jurisdictions, management of the Funds has concluded that there are no significant uncertain tax positions that would require recognition in the financial statements. Open tax years are those that are open for examination by taxing authorities (i.e., generally the last four tax year ends and the interim tax period since then). Furthermore, management of the Funds is also not aware of any tax positions for which it is reasonably possible that the total amounts of unrecognized tax benefits will significantly change in the next twelve months.
Dividends and Distributions to Common Shareholders
Dividends from net investment income are declared monthly. Net realized capital gains and/or market discount from investment transactions, if any, are distributed to shareholders at least annually. Furthermore, capital gains are distributed only to the extent they exceed available capital loss carryforwards.
Distributions to Common shareholders of net investment income, net realized capital gains and/or market discount, if any, are recorded on the ex-dividend date. The amount and timing of distributions are determined in accordance with federal income tax regulations, which may differ from U.S. GAAP.
Variable Rate MuniFund Term Preferred Shares
Each Fund has issued and outstanding Variable Rate MuniFund Term Preferred (“VMTP”) Shares, with a $100,000 liquidation value per share. Each Fund issued their VMTP Shares in privately negotiated offerings, which were offered to qualified institutional buyers pursuant to Rule 144A under the Securities Act of 1933.
| | | Notes to |
| | | Financial Statements (continued) |
As of May 31, 2013, the number of VMTP Shares outstanding, at liquidation value, for each Fund were as follows:
| | | | | | | Intermediate | |
| | | | Intermediate | | | Duration | |
| | | | Duration | | | Quality | |
| | | | (NID | ) | | (NIQ | ) |
| Series 2016 | | $ | 175,000,000 | | $ | 55,000,000 | |
Each Fund is obligated to redeem its VMTP Shares by the date as specified in its offering document (“Term Redemption Date”), unless earlier redeemed or repurchased by the Fund. VMTP Shares are subject to optional and mandatory redemption in certain circumstances . The VMTP Shares are subject to redemption at the option of each Fund (“Optional Redemption Date”), subject to payment of premium for one year following the Optional Redemption Date (“Premium Expiration Date”), and at par thereafter. Each Fund may be obligated to redeem certain of the VMTP Shares if the Fund fails to maintain certain asset coverage and leverage ratio requirements and such failures are not cured by the applicable cure date. The redemption price per share is equal to the sum of the liquidation value per share plus any accumulated but unpaid dividends. The Term Redemption Date, Optional Redemption Date and Premium Expiration Date for each Fund’s VMTP Shares are as follows:
| | | | | Intermediate | |
| | Intermediate | | | Duration | |
| | Duration | | | Quality | |
| | (NID | ) | | (NIQ | ) |
| Term Redemption Date | March 1, 2016 | | | April 1, 2016 | |
| Optional Redemption Date | August 7, 2014 | | | September 4, 2014 | |
| Premium Expiration Date | August 6, 2014 | | | September 3, 2014 | |
The average liquidation value of VMTP Shares outstanding and annualized dividend rate of VMTP Shares for each Fund during the period from each Fund’s commencement of operations through May 31, 2013, were as follows:
| | | | | | | | |
| | | | | | | Intermediate | |
| | | | Intermediate | | | Duration | |
| | | | Duration | | | Quality | |
| | | | (NID | )* | | (NIQ) | ** |
| Average liquidation value of VMTP Shares outstanding | | $ | 175,000,000 | | $ | 55,000,000 | |
| Annualized dividend rate | | | 1.29 | % | | 1.15 | % |
| * | For the period February 7, 2013 (first issuance date of shares) through May 31, 2013. |
| ** | For the period March 4, 2013 (first issuance date of shares) through May 31, 2013. |
Dividends on the VMTP Shares (which are treated as interest payments for financial reporting purposes) are set weekly. VMTP shares generally do not trade, and market quotations are generally not available. VMTP shares are short-term or short/intermediate-term instruments that pay a variable dividend rate tied to a short-term index, plus an additional fixed “spread” amount established at the time of issuance. The fair value of VMTP shares is expected to be approximately their liquidation (“par”) value so long as the fixed “spread” on the VMTP shares remains roughly in line with the “spread” rates being demanded by investors on instruments having similar terms in the current market environment. In present market conditions, the Funds’ Adviser has determined that fair value of VMTP shares is their liquidation value, but their fair value could vary if market conditions change materially.
For financial reporting purposes only, the liquidation value of VMTP Shares is recorded as a liability and recognized as “Variable Rate MuniFund Term Preferred (VMTP) Shares, at liquidation value” on the Statement of Assets and Liabilities. Unpaid dividends on VMTP Shares are recognized as a component of “Interest payable” on the Statement of Assets and Liabilities. Dividends paid on VMTP Shares are recognized as a component of “Interest expense and amortization of offering costs” on the Statement of Operations. Offering costs incurred of $125,000 and $100,000 by Intermediate Duration (NID) and Intermediate Duration Quality (NIQ), respectively, in connection with their offering of VMTP Shares were recorded as a deferred charge, which are amortized over the life of the shares and are recognized as components of “Deferred offering costs” on the Statement of Assets and Liabilities and “Interest expense and amortization of offering costs” on the Statement of Operations.
Inverse Floating Rate Securities
Each Fund is authorized to invest in inverse floating rate securities. An inverse floating rate security is created by depositing a municipal bond, typically with a fixed interest rate, into a special purpose trust created by a broker-dealer. In turn, this trust (a) issues floating rate certificates, in face amounts equal to some fraction of the deposited bond’s par amount or market value, that typically pay short-term tax-exempt interest rates to third parties, and (b) issues to a long-term investor (such as one of the Funds) an inverse floating rate certificate (sometimes referred to as an “inverse floater”) that represents all remaining or residual interest in the trust. The income received by the inverse floater holder varies inversely with the short-term rate paid
to the floating rate certificates’ holders, and in most circumstances the inverse floater holder bears substantially all of the underlying bond’s downside investment risk and also benefits disproportionately from any potential appreciation of the underlying bond’s value. The price of an inverse floating rate security will be more volatile than that of the underlying bond because the interest rate is dependent on not only the fixed coupon rate of the underlying bond but also on the short-term interest paid on the floating rate certificates, and because the inverse floating rate security essentially bears the risk of loss of the greater face value of the underlying bond.
A Fund may purchase an inverse floating rate security in a secondary market transaction without first owning the underlying bond (referred to as an “externally-deposited inverse floater”), or instead by first selling a fixed-rate bond to a broker-dealer for deposit into the special purpose trust and receiving in turn the residual interest in the trust (referred to as a “self-deposited inverse floater”). The inverse floater held by a Fund gives the Fund the right (a) to cause the holders of the floating rate certificates to tender their notes at par, and (b) to have the broker transfer the fixed-rate bond held by the trust to the Fund, thereby collapsing the trust. An investment in an externally-deposited inverse floater is identified in the Portfolio of Investments as “(IF) – Inverse floating rate investment.” An investment in a self-deposited inverse floater is accounted for as a financing transaction. In such instances, a fixed-rate bond deposited into a special purpose trust is identified in the Portfolio of Investments as “(UB) – Underlying bond of an inverse floating rate trust reflected as a financing transaction,” with the Fund accounting for the short-term floating rate certificates issued by the trust, at their liquidation value, as “Floating rate obligations” on the Statement of Assets and Liabilities. In addition, the Fund reflects in “Investment Income” the entire earnings of the underlying bond and the related interest paid to the holders of the short-term floating rate certificates as a component of “Interest expense and amortization of offering costs” on the Statement of Operations.
During the period from each Fund’s commencement of operations through May 31, 2013, each Fund invested in externally-deposited inverse floaters. The Funds did not make any such investments in self-deposited inverse floaters.
Each Fund may also enter into shortfall and forbearance agreements (sometimes referred to as a “recourse trust” or “credit recovery swap”) (such agreements referred to herein as “Recourse Trusts”) with a broker-dealer by which a Fund agrees to reimburse the broker-dealer, in certain circumstances, for the difference between the liquidation value of the fixed-rate bond held by the trust and the liquidation value of the floating rate certificates issued by the trust plus any shortfalls in interest cash flows. Under these agreements, a Fund’s potential exposure to losses related to or on inverse floaters may increase beyond the value of a Fund’s inverse floater investments as a Fund may potentially be liable to fulfill all amounts owed to holders of the floating rate certificates. At period end, any such shortfall is recognized as “Unrealized depreciation on Recourse Trusts” on the Statement of Assets and Liabilities.
As of May 31, 2013, each Fund’s maximum exposure to the floating rate obligations issued by externally-deposited Recourse Trusts was as follows:
| | | | | | | Intermediate | |
| | | | Intermediate | | | Duration | |
| | | | Duration | | | Quality | |
| | | | (NID | ) | | (NIQ | ) |
| Maximum exposure to Recourse Trusts | | $ | 165,005,000 | | $ | 56,320,000 | |
Market and Counterparty Credit Risk
In the normal course of business each Fund may invest in financial instruments and enter into financial transactions where risk of potential loss exists due to changes in the market (market risk) or failure of the other party to the transaction to perform (counterparty credit risk). The potential loss could exceed the value of the financial assets recorded on the financial statements. Financial assets, which potentially expose each Fund to counterparty credit risk, consist principally of cash due from counterparties on forward, option and swap transactions, when applicable. The extent of each Fund’s exposure to counterparty credit risk in respect to these financial assets approximates their carrying value as recorded on the Statement of Assets and Liabilities. Futures contracts, when applicable, expose a Fund to minimal counterparty credit risk as they are exchange traded and the exchange’s clearinghouse, which is counterparty to all exchange traded futures, guarantees the futures contracts against default.
Each Fund helps manage counterparty credit risk by entering into agreements only with counterparties the Adviser believes have the financial resources to honor their obligations and by having the Adviser monitor the financial stability of the counterparties. Additionally, counterparties may be required to pledge collateral daily (based on the daily valuation of the financial asset) on behalf of each Fund with a value approximately equal to the amount of any unrealized gain above a pre-determined threshold. Reciprocally, when each Fund has an unrealized loss, the Funds have instructed the custodian to pledge assets of the Funds as collateral with a value approximately equal to the amount of the unrealized loss above a pre-determined threshold. Collateral pledges are monitored and subsequently adjusted if and when the valuations fluctuate, either up or down, by at least the predetermined threshold amount.
Zero Coupon Securities
Each Fund is authorized to invest in zero coupon securities. A zero coupon security does not pay a regular interest coupon to its holders during the life of the security. Income to the holder of the security comes from accretion of the difference between the original purchase price of the security at issuance and the par value of the security at maturity and is effectively paid at maturity. The market prices of zero coupon securities generally are more volatile than the market prices of securities that pay interest periodically.
| | | Notes to |
| | | Financial Statements (continued) |
Indemnifications
Under the Funds’ organizational documents, their officers and trustees are indemnified against certain liabilities arising out of the performance of their duties to the Funds. In addition, in the normal course of business, the Funds enter into contracts that provide general indemnifications to other parties. The Funds’ maximum exposure under these arrangements is unknown as this would involve future claims that may be made against the Funds that have not yet occurred. However, the Funds have not had prior claims or losses pursuant to these contracts and expect the risk of loss to be remote.
Use of Estimates
The preparation of financial statements in conformity with U.S. GAAP requires management to make estimates and assumptions that affect the reported amounts of assets and liabilities at the date of the financial statements and the reported amounts of increases and decreases in net assets applicable to Common shares from operations during the reporting period. Actual results may differ from those estimates.
2. Fair Value Measurements
Fair value is defined as the price that the Funds would receive upon selling an investment or transferring a liability in an orderly transaction to an independent buyer in the principal or most advantageous market for the investment. A three-tier hierarchy is used to maximize the use of observable market data and minimize the use of unobservable inputs and to establish classification of fair value measurements for disclosure purposes.Observable inputs reflect the assumptions market participants would use in pricing the asset or liability. Observable inputs are based on market data obtained from sources independent of the reporting entity. Unobservable inputs reflect the reporting entity’s own assumptions about the assumptions market participants would use in pricing the asset or liability. Unobservable inputs are based on the best information available in the circumstances. The following is a summary of the three-tiered hierarchy of valuation input levels.
| Level 1 – | Inputs are unadjusted and prices are determined using quoted prices in active markets for identical securities. |
| Level 2 – | Prices are determined using other significant observable inputs (including quoted prices for similar securities, interest rates, prepayment speeds, credit risk, etc.). |
| Level 3 – | Prices are determined using significant unobservable inputs (including management’s assumptions in determining the fair value of investments). |
The inputs or methodologies used for valuing securities are not an indication of the risks associated with investing in those securities. The following is a summary of each Fund’s fair value measurements as of the end of the reporting period:
| Intermediate Duration (NID) | | | Level 1 | | | Level 2 | | | Level 3 | | | Total | |
| Long-Term Investments*: | | | | | | | | | | | | | |
| Municipal Bonds | | $ | — | | $ | 822,579,927 | | $ | — | | $ | 822,579,927 | |
| Derivatives: | | | | | | | | | | | | | |
| Swaps** | | | — | | | 1,018,743 | | �� | — | | | 1,018,743 | |
| Total | | $ | — | | $ | 823,598,670 | | $ | — | | $ | 823,598,670 | |
| Intermediate Duration Quality (NIQ) | | | Level 1 | | | Level 2 | | | Level 3 | | | Total | |
| Long-Term Investments*: | | | | | | | | | | | | | |
| Municipal Bonds | | $ | — | | $ | 235,486,994 | | $ | — | | $ | 235,486,994 | |
| Derivatives: | | | | | | | | | | | | | |
| Swaps** | | | — | | | 464,616 | | | — | | | 464,616 | |
| Total | | $ | — | | $ | 235,951,610 | | $ | — | | $ | 235,951,610 | |
| * | Refer to the Fund’s Portfolio of Investments for state classifications. |
| ** | Represents net unrealized appreciation (depreciation) as reported in the Fund’s Portfolio of Investments. |
The Nuveen funds’ Board of Directors/Trustees is responsible for the valuation process and has delegated the oversight of the daily valuation process to the Adviser’s Valuation Committee. The Valuation Committee, pursuant to the valuation policies and procedures adopted by the Board of Directors/Trustees, is responsible for making fair value determinations, evaluating the effectiveness of the funds’ pricing policies and reporting to the Board of Directors/Trustees. The Valuation Committee is aided in its efforts by the Adviser’s dedicated Securities Valuation Team, which is responsible for administering the daily valuation process and applying fair value methodologies as approved by the Valuation Committee. When determining the reliability of independent pricing services for investments owned by the funds, the Valuation Committee, among other things, conducts due diligence reviews of the pricing services and monitors the quality of security prices received through various testing reports conducted by the Securities Valuation Team.
The Valuation Committee will consider pricing methodologies it deems relevant and appropriate when making a fair value determination, based on the facts and circumstances specific to the portfolio instrument. Fair value determinations generally will be derived as follows, using public or private market information:
| | (i.) | If available, fair value determinations shall be derived by extrapolating from recent transactions or quoted prices for identical or comparable securities. |
| | (ii.) | If such information is not available, an analytical valuation methodology may be used based on other available information including, but not limited to: analyst appraisals, research reports, corporate action information, issuer financial statements and shelf registration statements. Such analytical valuation methodologies may include, but are not limited to: multiple of earnings, discount from market value of a similar freely-traded security, discounted cash flow analysis, book value or a multiple thereof, risk premium/yield analysis, yield to maturity and/or fundamental investment analysis. |
The purchase price of a portfolio instrument will be used to fair value the instrument only if no other valuation methodology is available or deemed appropriate, and it is determined that the purchase price fairly reflects the instrument’s current value.
For each portfolio security that has been fair valued pursuant to the policies adopted by the Board of Directors/Trustees, the fair value price is compared against the last available and next available market quotations. The Valuation Committee reviews the results of such testing and fair valuation occurrences are reported to the Board of Directors/Trustees.
3. Derivative Instruments and Hedging Activities
Each Fund is authorized to invest in certain derivative instruments, such as futures, options and swap contracts. Each Fund will limit its investments in futures, options on futures and swap contracts to the extent necessary for the Adviser to claim the exclusion from regulation by the Commodity Futures Trading Commission as a commodity pool operator with respect to the Fund. The Funds record derivative instruments at fair value, with changes in fair value recognized on the Statement of Operations, when applicable. Even though the Funds’ investments in derivatives may represent economic hedges, they are not considered to be hedge transactions for financial reporting purposes.
Swap Contracts
Each Fund is authorized to enter into interest rate swap and forward interest rate swap contracts (“swap contracts”) consistent with their investment objectives and policies to reduce, increase or otherwise alter its risk profile or to alter its portfolio characteristics (i.e. duration, yield curve positioning and credit quality). Each Fund’s use of swap contracts is intended to help manage its overall interest rate sensitivity, either shorter or longer, generally to more closely align the Fund’s interest rate sensitivity with that of the broader market.
Interest rate swap contracts involve each Fund’s agreement with the counterparty to pay or receive a fixed rate payment in exchange for the counterparty receiving or paying a variable rate payment. Forward interest rate swap transactions involve a Fund’s agreement with a counterparty to pay or receive, in the future, a fixed or variable rate payment in exchange for the counterparty receiving or paying a Fund a variable or fixed rate payment, the accruals for which would begin at a specified date in the future (the “effective date”). Accordingly, the risk of loss with respect to the swap counterparty on such transactions is limited to the net amount of interest payments that each Fund is to receive. The payment obligation is based on the notional amount of the swap contract and the termination date of the swap (which is akin to a bond’s maturity). The value of a Fund’s swap contract would increase or decrease based primarily on the extent to which long-term interest rates for bonds having a maturity of the swap contract’s termination date increase or decrease. Swap contracts are valued daily. Upon entering into an interest rate swap (and beginning on the effective date for a forward interest rate swap), each Fund accrues the fixed rate payment expected to be paid or received and the variable rate payment expected to be received or paid on a daily basis, and recognizes the daily change in the market value of the Fund’s contractual rights and obligations under the contracts. The net amount recorded for these transactions for each counterparty is recognized on the Statement of Assets and Liabilities as a component of “Unrealized appreciation or depreciation on swaps (,net)” with the change during the fiscal period recognized on the Statement of Operations as a component of “Change in net unrealized appreciation (depreciation) of swaps.” Income received or paid by each Fund is recognized as a component of “Net realized gain (loss) from swaps” on the Statement of Operations, in addition to the net realized gains or losses recognized upon the termination of a swap contract, and are equal to the difference between the Fund’s basis in the swap contract and the proceeds from (or cost of) the closing transaction. Payments received or made at the beginning of the measurement period are recognized as a component of “Swap premiums paid and/or received” on the Statement of Assets and Liabilities, when applicable. For tax purposes, periodic payments are treated as ordinary income or expense.
Each Fund may terminate a swap contract prior to the effective date, at which point a realized gain or loss is recognized. When a swap contract is terminated, it ordinarily does not involve the delivery of securities or other underlying assets or principal, but rather is settled in cash on a net basis. Once periodic payments are settled in cash, they are combined with the net realized gain or loss recorded upon the termination of the swap contract.
During the period from each Fund’s commencement of operations through May 31, 2013, each Fund used swap contracts to reduce the target duration of its portfolio. The average notional amount of swap contracts outstanding during the period from each Fund’s commencement of operations through May 31, 2013, was as follows:
| | | | | | | Intermediate | |
| | | | Intermediate | | | Duration | |
| | | | Duration | | | Quality | |
| | | | (NID | )* | | (NIQ) | ** |
| Average notional amount of swap contracts outstanding*** | | $ | 15,100,000 | | $ | 7,066,667 | |
| * | For the period December 5, 2012 (commencement of operations) through May 31, 2013. |
| ** | For the period February 7, 2013 (commencement of operations) through May 31, 2013. |
| *** | The average notional amount is calculated based on the outstanding notional at the beginning of the period and at the end of each fiscal quarter within the current fiscal year. |
| | | Notes to |
| | | Financial Statements (continued) |
The following tables present the fair value of all derivative instruments held by the Funds as of May 31, 2013, the location of these instruments on the Statement of Assets and Liabilities and the primary underlying risk exposure.
| | | | | Location on the Statement of Assets and Liabilities |
| | | | | Asset Derivatives | | Liability Derivatives |
| Underlying | | Derivative | | | | | | | | | |
| Risk Exposure | | Instrument | | Location | | Value | | Location | | Value | |
| Intermediate Duration (NID) | | | | | | | | | | | |
| Interest Rate | | Swaps | | Unrealized appreciation on swaps | $ | 1,018,743 | | — | $ | — | |
| Intermediate Duration Quality (NIQ) | | | | | | | | | | | |
| Interest Rate | | Swaps | | Unrealized appreciation | $ | 464,616 | | — | $ | — | |
| | | | | on swaps | | | | | | | |
In the ordinary course of business, the Funds have entered into transactions subject to enforceable netting agreements or other similar agreements. Generally, the right to offset in those agreements allows the Funds to offset any exposure to a specific counterparty with any collateral received or delivered to that counterparty based on the terms of the agreements. Generally, the Funds manage cash and securities collateral on a counterparty basis. The table below presents the derivative instruments that are offset, if any, as well as collateral pledged.
| | | | Gross | | | Amounts | | | Net | | | | | | | |
| | | | Unrealized | | | Netted on | | | Unrealized | | | Collateral | | | | |
| | | | Appreciation | | | Statement of Assets | | | Appreciation | | | Pledged to | | | | |
| Fund | Counterparty | | on Swaps | | | and Liabilities | | | on Swaps | | | Counterparty | | | Net Exposure | |
| Intermediate Duration (NID) | JP Morgan | | $ | 1,018,743 | | | $ | — | | | $ | 1,018,743 | | | $ | — | | | $ | 1,018,743 | |
| Intermediate Duration Quality (NIQ) | Barclays Bank PLC | | | 464,616 | | | | — | | | | 464,616 | | | | — | | | | 464,616 | |
The following table presents the amount of change in net unrealized appreciation (deprecation) recognized for the period from each Fund’s commencement of operations through May 31, 2013, on derivative instruments, as well as the primary risk exposure.
| | | | | | Change in | |
| | | | | | Net Unrealized | |
| | | | Derivative | | Appreciation | |
| Fund | Risk Exposure | | Instrument | | (Depreciation) | |
| Intermediate Duration (NID)* | Interest Rate | | Swaps | | $1,018,743 | |
| Intermediate Duration Quality (NIQ)** | Interest Rate | | Swaps | | 464,616 | |
| * | For the period December 5, 2012 (commencement of operations) through May 31, 2013. |
| ** | For the period February 7, 2013 (commencement of operations) through May 31, 2013. |
4. Fund Shares
Transactions in Common shares were as follows:
| | | | | | | | |
| | | | | | | Intermediate | |
| | | | Intermediate | | | Duration | |
| | | | Duration | | | Quality | |
| | | | (NID | )* | | (NIQ) | ** |
| Common Shares sold | | | 46,907,000 | | | 13,095,335 | |
| Common Shares issued to shareholders due to reinvestment of distributions | | | 2,660 | | | 1,809 | |
| * | For the period December 5, 2012 (commencement of operations) through May 31, 2013. |
| ** | For the period February 7, 2013 (commencement of operations) through May 31, 2013. |
5. Investment Transactions
Purchases and sales (including maturities but excluding short-term investments and derivative transactions) during the period from each Fund’s commencement of operations through May 31, 2013, were as follows:
| | | | | | | | |
| | | | | | | Intermediate | |
| | | | Intermediate | | | Duration | |
| | | | Duration | | | Quality | |
| | | | (NID | )* | | (NIQ | )** |
| Purchases | | $ | 993,144,933 | | $ | 241,109,784 | |
| Sales and maturities | | | 152,137,043 | | | 1,251,258 | |
| * | For the period December 5, 2012 (commencement of operations) through May 31, 2013. |
| ** | For the period February 7, 2013 (commencement of operations) through May 31, 2013. |
6. Income Tax Information
The following information is presented on an income tax basis. Differences between amounts for financial statement and federal income tax purposes are primarily due to timing differences in recognizing taxable market discount, timing differences in recognizing certain gains and losses on investment transactions and the treatment of investments in inverse floating rate securities reflected as financing transactions, if any. To the extent that differences arise that are permanent in nature, such amounts are reclassified within the capital accounts as detailed below. Temporary differences do not require reclassification. Temporary and permanent differences do not impact the net asset values of the Funds.
As of May 31, 2013, the cost and unrealized appreciation (depreciation) of investments (excluding investments in derivatives), as determined on a federal income tax basis, were as follows:
| | | | | | | Intermediate | |
| | | | Intermediate | | | Duration | |
| | | | Duration | | | Quality | |
| | | | (NID | ) | | (NIQ | ) |
| Cost of investments | | $ | 833,402,044 | | $ | 238,819,118 | |
| Gross unrealized: | | | | | | | |
| Appreciation | | $ | 4,583,130 | | $ | 846,576 | |
| Depreciation | | | (15,405,247 | ) | | (4,178,700 | ) |
| Net unrealized appreciation (depreciation) of investments | | $ | (10,822,117 | ) | $ | (3,332,124 | ) |
Permanent differences, primarily due to taxable market discount and nondeductible offering costs, resulted in reclassifications among the Funds’ components of net assets as of May 31, 2013, the Funds’ tax year end, as follows:
| | | | | | | Intermediate | |
| | | | Intermediate | | | Duration | |
| | | | Duration | | | Quality | |
| | | | (NID | ) | | (NIQ | ) |
| Paid-in surplus | | $ | (12,735 | ) | $ | (7,911 | ) |
| Undistributed (Over-distribution of) net investment income | | | 12,724 | | | 7,889 | |
| Accumulated net realized gain (loss) | | | 11 | | | 22 | |
| | | Notes to |
| | | Financial Statements (continued) |
The tax components of undistributed net tax-exempt income, net ordinary income and net long-term capital gains as of May 31, 2013, the Funds’ tax year end, were as follows:
| | | | | | | Intermediate | |
| | | | Intermediate | | | Duration | |
| | | | Duration | | | Quality | |
| | | | (NID | ) | | (NIQ | ) |
Undistributed net tax-exempt income1 | | $ | 4,358,364 | | $ | 1,179,718 | |
Undistributed net ordinary income2 | | | — | | | — | |
| Undistributed net long-term capital gains | | | — | | | — | |
| 1 | Undistributed net tax-exempt income (on a tax basis) has not been reduced for the dividend declared on May 1, 2013, and paid on June 3, 2013. |
| 2 | Net ordinary income consists of taxable market discount income and net short-term capital gains, if any. |
The tax character of distributions paid during the period from each Fund’s commencement of operations through May 31, 2013, was designated for purposes of the dividends paid deduction as follows:
| | | | | | | Intermediate | |
| | | | Intermediate | | | Duration | |
| | | | Duration | | | Quality | |
| | | | (NID | ) | | (NIQ | ) |
Distributions from net tax-exempt income3 | | $ | 8,446,467 | | $ | 783,375 | |
Distributions from net ordinary income2 | | | 385 | | | — | |
Distributions from net long-term capital gains4 | | | — | | | — | |
| 2 | Net ordinary income consists of taxable market discount income and net short-term capital gains, if any. |
| 3 | The Funds hereby designate these amounts paid during the period ended May 31, 2013, as Exempt Interest Dividends. |
| 4 | The Funds designate as long term capital gain dividend, pursuant to the Internal Revenue Code 852(b)(3), the amount necessary to reduce earnings and profits of the Funds related to net capital gain to zero for tax period ended May 31, 2013. |
The Funds have elected to defer late-year losses in accordance with federal income tax rules. These losses are treated as having arisen on the first day of the following fiscal year. The Funds have elected to defer losses as follows:
| | | | | | | Intermediate | |
| | | | Intermediate | | | Duration | |
| | | | Duration | | | Quality | |
| | | | (NID | ) | | (NIQ | ) |
Post-October capital losses1 | | $ | 4,159,891 | | $ | 15,045 | |
Late-year ordinary losses2 | | | — | | | — | |
| 1 | Capital losses incurred from each Fund’s commencement of operations through May 31, 2013, the Funds’ tax year end. |
| 2 | Ordinary losses incurred from January 1, 2013 or from the Fund’s commencement of operations through May 31, 2013, and specified losses incurred from each Fund’s commencement of operations through May 31, 2013. |
7. Management Fees and Other Transactions with Affiliates
Each Fund’s management fee consists of two components – a fund-level fee, based only on the amount of assets within the Fund, and a complex-level fee, based on the aggregate amount of all eligible fund assets managed by the Adviser. This pricing structure enables Fund shareholders to benefit from growth in the assets within their respective Fund as well as from growth in the amount of complex-wide assets managed by the Adviser.
The annual fund-level fee for each Fund, payable monthly, is calculated according to the following schedule:
| | | | | | | Intermediate | |
| | | | Intermediate | | | Duration | |
| | | | Duration | | | Quality | |
| | | | (NID | ) | | (NIQ | ) |
| Average Daily Managed Assets* | | | Fund-Level Fee Rate | | | Fund-Level Fee Rate | |
| For the first $125 million | | | .4000 | % | | .3000 | % |
| For the next $125 million | | | .3875 | | | .2875 | |
| For the next $250 million | | | .3750 | | | .2750 | |
| For the next $500 million | | | .3625 | | | .2625 | |
| For the next $1 billion | | | .3500 | | | .2500 | |
| For the next $3 billion | | | .3375 | | | .2375 | |
| For managed assets over $5 billion | | | .3250 | | | .2250 | |
The annual complex-level fee for each Fund, payable monthly, is calculated according to the following schedule:
| Complex-Level Managed Asset Breakpoint Level* | Effective Rate at Breakpoint Level | |
| $55 billion | .2000 | % |
| $56 billion | .1996 | |
| $57 billion | .1989 | |
| $60 billion | .1961 | |
| $63 billion | .1931 | |
| $66 billion | .1900 | |
| $71 billion | .1851 | |
| $76 billion | .1806 | |
| $80 billion | .1773 | |
| $91 billion | .1691 | |
| $125 billion | .1599 | |
| $200 billion | .1505 | |
| $250 billion | .1469 | |
| $300 billion | .1445 | |
| * | For the fund-level and complex-level fees, managed assets include closed-end fund assets managed by the Adviser that are attributable to financial leverage. For these purposes, financial leverage includes the funds’ use of preferred stock and borrowings and certain investments in the residual interest certificates (also called inverse floating rate securities) in tender option bond (TOB) trusts, including the portion of assets held by a TOB trust that has been effectively financed by the trust’s issuance of floating rate securities, subject to an agreement by the Adviser as to certain funds to limit the amount of such assets for determining managed assets in certain circumstances. The complex-level fee is calculated based upon the aggregate daily managed assets of all Nuveen Funds that constitute “eligible assets.” Eligible assets do not include assets attributable to investments in other Nuveen Funds or assets in excess of $2 billion added to the Nuveen Fund complex in connection with the Adviser’s assumption of the management of the former First American Funds effective January 1, 2011. As of May 31, 2013, the complex-level fee rate for each of these Funds was .1661%. |
The management fee compensates the Adviser for overall investment advisory and administrative services and general office facilities. The Adviser is responsible for each Fund’s overall strategy and asset allocation decisions. The Adviser has entered into sub-advisory agreements with the Sub-Adviser, a wholly owned subsidiary of the Adviser, under which the Sub-Adviser manages the investment portfolios of the Funds. The Sub-Adviser is compensated for its services to the Funds from the management fees paid to the Adviser.
The Funds pay no compensation directly to those of its trustees who are affiliated with the Adviser or to its officers, all of whom receive remuneration for their services to the Funds from the Adviser or its affiliates. The Board of Trustees has adopted a deferred compensation plan for independent trustees that enables trustees to elect to defer receipt of all or a portion of the annual compensation they are entitled to receive from certain Nuveen-advised funds. Under the plan, deferred amounts are treated as though equal dollar amounts had been invested in shares of select Nuveen-advised funds.
Board Members & Officers (Unaudited)
| | | The management of the Funds, including general supervision of the duties performed for the Funds by the Adviser, is the responsibility of the Board of Trustees of the Funds. The number of trustees of the Funds is currently set at ten. None of the trustees who are not “interested” persons of the Funds (referred to herein as “independent trustees”) has ever been a director or employee of, or consultant to, Nuveen or its affiliates. The names and business addresses of the trustees and officers of the Funds, their principal occupations and other affiliations during the past five years, the number of portfolios each oversees and other directorships they hold are set forth below. |
| | Name, | | Position(s) Held | | Year First | | Principal | | Number |
| | Year of Birth | | with the Funds | | Elected or | | Occupation(s) | | of Portfolios |
| | & Address | | | | Appointed | | including other | | in Fund Complex |
| | | | | | and Term(1) | | Directorships | | Overseen by |
| | | | | | | | During Past 5 Years | | Board Member |
| | | | | | | | | | |
| Independent Board Members: | | | | | | | | |
| ■ | ROBERT P. BREMNER 1940 333 W. Wacker Drive Chicago, IL 60606 | | Board Member | | 1996 Class III | | Private Investor and Management Consultant; Treasurer and Director, Humanities Council of Washington, D.C.; Board Member, Independent Directors Council affiliated with the Investment Company Institute. | | 210 |
| | | | | | | | | | |
| ■ | JACK B. EVANS 1948 333 W. Wacker Drive Chicago, IL 60606 | | Board Member | | 1999 Class III | | President, The Hall-Perrine Foundation, a private philanthropic corporation (since 1996); Chairman, United Fire Group, a publicly held company; formerly, President of the Board of Regents for the State of Iowa University System; Director, Source Media Group; Life Trustee of Coe College; formerly, Director, Alliant Energy; formerly, Director, Federal Reserve Bank of Chicago; formerly, President and Chief Operating Officer, SCI Financial Group, Inc., a regional financial services firm. | | 210 |
| | | | | | | | | | |
| ■ | WILLIAM C. HUNTER 1948 333 W. Wacker Drive Chicago, IL 60606 | | Board Member | | 2004 Class I | | Dean Emeritus (since June 30, 2012), formerly, Dean, Tippie College of Business, University of Iowa (2006-2012); Director (since 2004) of Xerox Corporation; Director (since 2005), and President (since July 2012) Beta Gamma Sigma, Inc., The International Honor Society; Director of Wellmark, Inc. (since 2009); formerly, Dean and Distinguished Professor of Finance, School of Business at the University of Connecticut (2003-2006); previously, Senior Vice President and Director of Research at the Federal Reserve Bank of Chicago (1995-2003); formerly, Director (1997-2007), Credit Research Center at Georgetown University. | | 210 |
| | | | | | | | | | |
| ■ | DAVID J. KUNDERT 1942 333 W. Wacker Drive Chicago, IL 60606 | | Board Member | | 2005 Class II | | Formerly, Director, Northwestern Mutual Wealth Management Company; (2006-2013) retired (since 2004) as Chairman, JPMorgan Fleming Asset Management, President and CEO, Banc One Investment Advisors Corporation, and President, One Group Mutual Funds; prior thereto, Executive Vice President, Banc One Corporation and Chairman and CEO, Banc One Investment Management Group; Regent Emeritus, Member of Investment Committee, Luther College; member of the Wisconsin Bar Association; member of Board of Directors, Friends of Boerner Botanical Gardens; member of Board of Directors and Chair of Investment Committee, Greater Milwaukee Foundation; member of the Board of Directors (Milwaukee), College Possible. | | 210 |
| | | | | | | | | | |
| ■ | WILLIAM J. SCHNEIDER 1944 333 W. Wacker Drive Chicago, IL 60606 | | Board Member | | 1996 Class III | | Chairman of Miller-Valentine Partners Ltd., a real estate investment company; formerly, Senior Partner and Chief Operating Officer (retired 2004) of Miller-Valentine Group; an owner in several other Miller Valentine entities; member, Mid-America Health System; Board Member of Tech Town, Inc., a not-for-profit community development company; Board Member of WDPR Public Radio station; formerly, member, Business Advisory Council, Cleveland Federal Reserve Bank and University of Dayton Business School Advisory Council. | | 210 |
| | Name, | | Position(s) Held | | Year First | | Principal | | Number |
| | Year of Birth | | with the Funds | | Elected or | | Occupation(s) | | of Portfolios |
| | & Address | | | | Appointed | | Including other | | in Fund Complex |
| | | | | | and Term(1) | | Directorships | | Overseen by |
| | | | | | | | During Past 5 Years | | Board Member |
| | | | | | | | | | |
| Independent Board Members: | | | | | | | | |
| ■ | JUDITH M. STOCKDALE 1947 333 W. Wacker Drive Chicago, IL 60606 | | Board Member | | 1997 Class I | | Formerly, Executive Director (1994-2012), Gaylord and Dorothy Donnelley Foundation (since 1994); prior thereto, Executive Director, Great Lakes Protection Fund (1990-1994). | | 210 |
| | | | | | | | | | |
| ■ | CAROLE E. STONE 1947 333 W. Wacker Drive Chicago, IL 60606 | | Board Member | | 2007 Class I | | Director, Chicago Board Options Exchange (since 2006); Director, C2 Options Exchange, Incorporated (since 2009); formerly, Commissioner, New York State Commission on Public Authority Reform (2005-2010); formerly, Chair, New York Racing Association Oversight Board (2005-2007). | | 210 |
| | | | | | | | | | |
| ■ | VIRGINIA L. STRINGER 1944 333 W. Wacker Drive Chicago, IL 60606 | | Board Member | | 2011 Class I | | Board Member, Mutual Fund Directors Forum; former governance consultant and non-profit board member; former Owner and President, Strategic Management Resources, Inc. a management consulting firm; former Member, Governing Board, Investment Company Institute’s Independent Directors Council; previously, held several executive positions in general management, marketing and human resources at IBM and The Pillsbury Company; Independent Director, First American Fund Complex (1987-2010) and Chair (1997-2010). | | 210 |
| | | | | | | | | | |
| ■ | TERENCE J. TOTH 1959 333 W. Wacker Drive Chicago, IL 60606 | | Board Member | | 2008 Class II | | Managing Partner, Promus Capital (since 2008); Director, Fulcrum IT Service LLC (since 2010), Quality Control Corporation (since 2012) and LogicMark LLC (since 2012); formerly, Director, Legal & General Investment Management America, Inc. (2008-2013); formerly, CEO and President, Northern Trust Global Investments (2004-2007); Executive Vice President, Quantitative Management & Securities Lending (2000-2004); prior thereto, various positions with Northern Trust Company (since 1994); member: Chicago Fellowship Board (since 2005), Catalyst Schools of Chicago Board (since 2008) and Chairman, and Mather Foundation Board (since 2012), and a member of its investment committee; formerly, Member, Northern Trust Mutual Funds Board (2005-2007), Northern Trust Global Investments Board (2004-2007), Northern Trust Japan Board (2004-2007), Northern Trust Securities Inc. Board (2003-2007) and Northern Trust Hong Kong Board (1997-2004). | | 210 |
| Interested Board Member: | | | | | | | | |
| ■ | JOHN P. AMBOIAN(2) 1961 333 W. Wacker Drive Chicago, IL 60606 | | Board Member | | 2008 Class II | | Chief Executive Officer and Chairman (since 2007) and Director (since 1999) of Nuveen Investments, Inc., formerly, President (1999-2007); Chief Executive Officer (since 2007) of Nuveen Investments Advisers, Inc.; Director (since 1998) formerly, Chief Executive Officer (2007-2010) of Nuveen Fund Advisors, LLC. | | 210 |
Board Members & Officers (Unaudited) (continued)
| | Name, | | Position(s) Held | | Year First | | Principal | | Number |
| | Year of Birth | | with the Funds | | Elected or | | Occupation(s) | | of Portfolios |
| | and Address | | | | Appointed(3) | | During Past 5 Years | | in Fund Complex |
| | | | | | | | | | Overseen |
| | | | | | | | | | by Officer |
| | | | | | | | | | |
| Officers of the Funds: | | | | | | | | |
| ■ | GIFFORD R. ZIMMERMAN 1956 333 W. Wacker Drive Chicago, IL 60606 | | Chief Administrative Officer | | 1988 | | Managing Director (since 2002), and Assistant Secretary of Nuveen Securities, LLC; Managing Director (since 2004) and Assistant Secretary (since 1994) of Nuveen Investments, Inc.; Managing Director (since 2002), Assistant Secretary (since 1997) and Co-General Counsel (since 2011) of Nuveen Fund Advisors, LLC; Managing Director, Assistant Secretary and Associate General Counsel of Nuveen Asset Management, LLC (since 2011); Managing Director, Associate General Counsel and Assistant Secretary, of Symphony Asset Management LLC (since 2003); Vice President and Assistant Secretary of NWQ Investment Management Company, LLC (since 2002), Nuveen Investments Advisers Inc. (since 2002), Santa Barbara Asset Management, LLC (since 2006), and of Winslow Capital Management, LLC, (since 2010); Vice President and Assistant Secretary (since 2013), formerly, Chief Administrative Officer and Chief Compliance Officer (2006-2013) of Nuveen Commodities Asset Management, LLC; Chartered Financial Analyst. | | 210 |
| | | | | | | | | | |
| ■ | WILLIAM ADAMS IV 1955 333 W. Wacker Drive Chicago, IL 60606 | | Vice President | | 2007 | | Senior Executive Vice President, Global Structured Products (since 2010), formerly, Executive Vice President (1999-2010) of Nuveen Securities, LLC; Co-President of Nuveen Fund Advisors, LLC (since 2011); President (since 2011), formerly, Managing Director (2010-2011) of Nuveen Commodities Asset Management, LLC. | | 103 |
| | | | | | | | | | |
| ■ | CEDRIC H. ANTOSIEWICZ 1962 333 W. Wacker Drive Chicago, IL 60606 | | Vice President | | 2007 | | Managing Director of Nuveen Securities, LLC. | | 103 |
| | | | | | | | | | |
| ■ | MARGO L. COOK 1964 333 W. Wacker Drive Chicago, IL 60606 | | Vice President | | 2009 | | Executive Vice President (since 2008) of Nuveen Investments, Inc. and of Nuveen Fund Advisors, LLC (since 2011); Managing Director-Investment Services of Nuveen Commodities Asset Management, LLC (since August 2011), previously, Head of Institutional Asset Management (2007-2008) of Bear Stearns Asset Management; Head of Institutional Asset Management (1986-2007) of Bank of NY Mellon; Chartered Financial Analyst. | | 210 |
| | | | | | | | | | |
| ■ | LORNA C. FERGUSON 1945 333 W. Wacker Drive Chicago, IL 60606 | | Vice President | | 1998 | | Managing Director (since 2005) of Nuveen Fund Advisors, LLC and Nuveen Securities, LLC (since 2004). | | 210 |
| | | | | | | | | | |
| ■ | STEPHEN D. FOY 1954 333 W. Wacker Drive Chicago, IL 60606 | | Vice President and Controller | | 1998 | | Senior Vice President (2010-2011), formerly, Vice President (2005-2010) and Funds Controller of Nuveen Securities, LLC; Senior Vice President (since 2013), formerly, Vice President of Nuveen Fund Advisors, LLC; Chief Financial Officer of Nuveen Commodities Asset Management, LLC (since 2010); Certified Public Accountant. | | 210 |
| | Name, | | Position(s) Held | | Year First | | Principal | | Number |
| | Year of Birth | | with the Funds | | Elected or | | Occupation(s) | | of Portfolios |
| | and Address | | | | Appointed(3) | | During Past 5 Years | | in Fund Complex |
| | | | | | | | | | Overseen |
| | | | | | | | | | by Officer |
| | | | | | | | | | |
| Officers of the Funds: | | | | | | | | |
| ■ | SCOTT S. GRACE 1970 333 W. Wacker Drive Chicago, IL 60606 | | Vice President and Treasurer | | 2009 | | Managing Director, Corporate Finance & Development, Treasurer (since 2009) of Nuveen Securities, LLC; Managing Director and Treasurer (since 2009) of Nuveen Fund Advisors, LLC, Nuveen Investments Advisers, Inc., Nuveen Investments Holdings Inc. and (since 2011) Nuveen Asset Management, LLC; Vice President and Treasurer of NWQ Investment Management Company, LLC, Tradewinds Global Investors, LLC, Symphony Asset Management LLC and Winslow Capital Management, LLC.; Vice President of Santa Barbara Asset Management, LLC; formerly, Treasurer (2006-2009), Senior Vice President (2008-2009), previously, Vice President (2006-2008) of Janus Capital Group, Inc.; formerly, Senior Associate in Morgan Stanley’s Global Financial Services Group (2000-2003); Chartered Accountant Designation. | | 210 |
| | | | | | | | | | |
| ■ | WALTER M. KELLY 1970 333 W. Wacker Drive Chicago, IL 60606 | | Chief Compliance Officer and Vice President | | 2003 | | Senior Vice President (since 2008) and Assistant Secretary (since 2003) of Nuveen Fund Advisors, LLC; Senior Vice President (since 2008) of Nuveen Investment Holdings, Inc.; formerly, Senior Vice President (2008-2011) of Nuveen Securities, LLC. | | 210 |
| | | | | | | | | | |
| ■ | TINA M. LAZAR 1961 333 W. Wacker Drive Chicago, IL 60606 | | Vice President | | 2002 | | Senior Vice President (since 2010), formerly, Vice President (2005-2010) of Nuveen Fund Advisors, LLC. | | |
| | | | | | | | | | |
| ■ | KEVIN J. MCCARTHY 1966 333 W. Wacker Drive Chicago, IL 60606 | | Vice President and Secretary | | 2007 | | Managing Director and Assistant Secretary (since 2008), Nuveen Securities, LLC; Managing Director (since 2008), Assistant Secretary (since 2007) and Co-General Counsel (since 2011) of Nuveen Fund Advisors, LLC; Managing Director, Assistant Secretary and Associate General Counsel (since 2011) of Nuveen Asset Management, LLC; Managing Director (since 2008), and Assistant Secretary, Nuveen Investment Holdings, Inc.; Vice President (since 2007) and Assistant Secretary of Nuveen Investments Advisers Inc., NWQ Investment Management Company, LLC, NWQ Holdings, LLC, Symphony Asset Management LLC, Santa Barbara Asset Management, LLC, and of Winslow Capital Management, LLC. (since 2010); Vice President and Secretary (since 2010) of Nuveen Commodities Asset Management, LLC. | | 210 |
Board Members & Officers (Unaudited) (continued)
| | Name, | | Position(s) Held | | Year First | | Principal | | Number |
| | Year of Birth | | with the Funds | | Elected or | | Occupation(s) | | of Portfolios |
| | and Address | | | | Appointed(3) | | During Past 5 Years | | in Fund Complex |
| | | | | | | | | | Overseen |
| | | | | | | | | | by Officer |
| | | | | | | | | | |
| Officers of the Funds: | | | | | | | | |
| ■ | KATHLEEN L. PRUDHOMME 1953 901 Marquette Avenue Minneapolis, MN 55402 | | Vice President and Assistant Secretary | | 2011 | | Managing Director, Assistant Secretary and Co-General Counsel (since 2011) of Nuveen Fund Advisors, LLC; Managing Director, Assistant Secretary and Associate General Counsel (since 2011) of Nuveen Asset Management, LLC; Managing Director and Assistant Secretary (since 2011) of Nuveen Securities, LLC; formerly, Deputy General Counsel, FAF Advisors, Inc. (2004-2010). | | 210 |
| (1) | Board Members serve three year terms, except for two board members who are elected by the holders of Preferred Shares. The Board of Trustees is divided into three classes, Class I, Class II, and Class III, with each being elected to serve until the third succeeding annual shareholders’ meeting subsequent to its election or thereafter in each case when its respective successors are duly elected or appointed, except two board members are elected by the holders of Preferred Shares to serve until the next annual shareholders’ meeting subsequent to its election or thereafter in each case when its respective successors are duly elected or appointed. The first year elected or appointed represents the year in which the board member was first elected or appointed to any fund in the Nuveen Complex. |
| (2) | Mr. Amboian is an interested trustee because of his position with Nuveen Investments, Inc. and certain of its subsidiaries, which are affiliates of the Nuveen Funds. |
| (3) | Officers serve one year terms through August of each year. The year first elected or appointed represents the year in which the Officer was first elected or appointed to any fund in the Nuveen Complex. |
Annual Investment Management
Agreement Approval Process (Unaudited)
The Board of Trustees (each, a “Board” and each Trustee, a “Board Member”) of each Fund, including the Board Members who are not parties to the Fund’s advisory or sub-advisory agreement or “interested persons” of any such parties (the “Independent Board Members”), is responsible for approving the advisory arrangements for its Fund. At a meeting held on October 12-14, 2012 (the “October Meeting”), the Board Members were asked to approve the advisory arrangements for the Nuveen Intermediate Duration Municipal Term Fund (the “Intermediate Duration Fund”), and at a meeting held on January 16, 2013 (the “January Meeting”; the October Meeting and the January Meeting are each a “Meeting”), the Board Members were asked to approve the advisory arrangements for the Nuveen Intermediate Duration Quality Municipal Term Fund (the “Intermediate Duration Quality Fund”). At each Meeting, the Board Members, including the Independent Board Members, considered and approved the investment management agreement (each, an “Investment Management Agreement”) between the applicable Fund and Nuveen Fund Advisors, LLC (the “Advisor”), and the investment sub-advisory agreement (each, a “Sub-Advisory Agreement”) between the Advisor and Nuveen Asset Management, LLC (the “Sub-Advisor”), on behalf of such Fund. The Advisor and the Sub-Advisor are each hereafter a “Fund Adviser.” The Investment Management Agreements and the Sub-Advisory Agreements are each hereafter an “Advisory Agreement.”
The discussion of the approvals for the Intermediate Duration Fund is set forth in Section I, followed by the discussion in Section II of the approvals for the Intermediate Duration Quality Fund.
I.
Nuveen Intermediate Duration Municipal Term Fund
With respect to the fund listed immediately above (for purposes of this Section I, the “Fund”), to assist the Board in its evaluation of an Advisory Agreement with a Fund Adviser at the October Meeting (for purposes of this Section I, the “Meeting”), the Independent Board Members had received, in adequate time in advance of the Meeting or at prior meetings, materials which outlined, among other things:
| • | | the nature, extent and quality of services expected to be provided by the Fund Adviser; |
| | | |
| • | | the organization of the Fund Adviser, including the responsibilities of various departments and key personnel; |
| | | |
| • | | the expertise and background of the Fund Adviser with respect to the Fund’s investment strategy; |
| | | |
| • | | certain performance-related information (as described below); |
| | | |
| • | | the profitability of Nuveen Investments, Inc. (“Nuveen”); |
| | | |
| • | | the proposed management fees of the Fund Adviser, including comparisons of such fees with the management fees of comparable funds; |
| | | |
| • | | the expected expenses of the Fund, including comparisons of the Fund’s expected expense ratio with the expense ratios of comparable funds; and |
| | | |
| • | | the soft dollar practices of the Fund Adviser, if any. |
Annual Investment Management Agreement
Approval Process (Unaudited) (continued)
At the Meeting, the Advisor made a presentation to and responded to questions from the Board. During the Meeting, the Independent Board Members also met privately with their legal counsel to review the Board’s duties under the Investment Company Act of 1940 (the “1940 Act”), the general principles of state law in reviewing and approving advisory contracts, the standards used by courts in determining whether investment company boards of directors have fulfilled their duties, factors to be considered in voting on advisory contracts and an adviser’s fiduciary duty with respect to advisory agreements and compensation. It is with this background that the Independent Board Members considered the Fund’s Advisory Agreements. As outlined in more detail below, the Independent Board Members considered all factors they believed relevant with respect to the Fund, including the following: (a) the nature, extent and quality of the services to be provided by the Fund Advisers; (b) investment performance, as described below; (c) the advisory fees and costs of the services to be provided to the Fund and the profitability of the Fund Advisers; (d) the extent of any anticipated economies of scale; (e) any benefits expected to be derived by the Fund Advisers from their relationships with the Fund; and (f) other factors. Each Board Member may have accorded different weight to the various factors in reaching his or her conclusions with respect to the Fund’s Advisory Agreements.
A. Nature, Extent and Quality of Services
The Independent Board Members considered the nature, extent and quality of the respective Fund Adviser’s services, including advisory services and administrative services. As the Advisor and the Sub-Advisor already serve as adviser and sub-adviser, respectively, to other Nuveen funds overseen by the Board Members, the Board has a good understanding of each Fund Adviser’s organization, operations and personnel. As the Independent Board Members meet regularly throughout the year to oversee the Nuveen funds, including funds currently advised by the Fund Advisers, the Independent Board Members have relied upon their knowledge from their meetings and any other interactions throughout the year of the respective Fund Adviser and its services in evaluating the Advisory Agreements.
At the Meeting and at prior meetings, the Independent Board Members reviewed materials outlining, among other things, the respective Fund Adviser’s organization and business; the types of services that such Fund Adviser or its affiliates provide to the Nuveen funds and are expected to provide to the Fund; and the experience of the respective Fund Adviser with applicable investment strategies. Further, the Independent Board Members have evaluated the background and experience of the Fund Adviser’s investment personnel.
In addition to advisory services, the Independent Board Members have considered the quality and extent of administrative and other non-investment advisory services to be provided. In this regard, the Advisor is expected to provide the Fund with such administrative and other services (exclusive of, and in addition to, any such services provided by others for the Fund) and officers and other personnel as are necessary for the operations of the Fund. In addition to investment management services, the Advisor and its affiliates will provide the Fund with a wide range of services, including, among other things, product management, investment services (such as oversight of investment policies and procedures, risk management, and pricing), fund administration, oversight of service providers, shareholder services and communications, administration of Board relations, regulatory and portfolio compliance, legal support, managing leverage and promoting an orderly secondary market for common shares. The Independent Board Members also recognized that the Advisor would oversee the Sub-Advisor. In addition to the foregoing services, the Independent Board Members have also noted the additional services that the Advisor or its affiliates provide to closed-end funds, including in particular Nuveen’s continued commitment to supporting the secondary market for the common shares of its closed-end funds through a comprehensive secondary market communication program designed to raise investor
and analyst awareness and understanding of closed-end funds. These efforts include, among other things, sponsoring and participating in conferences; communicating with closed-end fund analysts covering the Nuveen funds; providing marketing and product updates for the closed-end funds; and maintaining and enhancing a closed-end fund website.
In evaluating the services of the Sub-Advisor, the Independent Board Members noted that the Sub-Advisor was generally expected to supply portfolio investment management services to the Fund. In addition, the Board Members recognized the Sub-Advisor’s experience and investment process.
Based on their review, the Independent Board Members found that, overall, the nature, extent and quality of services expected to be provided to the Fund under each Advisory Agreement were satisfactory.
B. Investment Performance
The Fund was new and therefore did not have its own performance history. However, the Independent Board Members are familiar with the performance records of other Nuveen funds advised by the Advisor and sub-advised by the Sub-Advisor.
The Independent Board Members recognized that the Fund was expected to use a strategy similar to that of the Nuveen High Yield Municipal Bond Fund, an open-end fund in the Nuveen fund family that was launched in June 1999. In this regard, the Independent Board Members reviewed certain performance information relating to the Nuveen High Yield Municipal Bond Fund, including average annual total returns for one-year, three-year, five-year and ten-year periods and calendar-year returns for 2000 thru 2011 and part of 2012. The Independent Board Members further noted that the Fund was expected to be similar, in certain respects, to the Nuveen Municipal High Income Opportunity Fund and the Nuveen Municipal High Income Opportunity Fund 2, closed-end funds in the Nuveen fund family that were launched in November 2003 and November 2007, respectively.
| C. | Fees, Expenses and Profitability |
| | |
| | 1. Fees and Expenses |
| | In evaluating the management fees and expenses that the Fund was expected to bear, the Independent Board Members considered, among other things, the Fund’s proposed management fee structure, the rationale for its proposed fee levels, and its expected expense ratio in absolute terms as well as compared with the fees and expense ratios of comparable funds. In this regard, the Independent Board Members reviewed, among other things, fee and expense structure data for the Lipper intermediate municipal debt funds and Lipper high yield municipal debt funds classifications, and noted that the Fund had similarities to funds in both groups. In addition, the Independent Board Members noted that the Fund may make investments in certain instruments that have the economic effect of leverage. The Independent Board Members recognized that assets attributable to the Fund’s use of effective leverage would be included in the amount of assets upon which the advisory fee is calculated. In this regard, the Independent Board Members noted that the advisory fee is based on a percentage of average daily “Managed Assets.” “Managed Assets” generally means the total assets of the Fund minus the sum of its accrued liabilities (other than Fund liabilities incurred for the express purpose of creating effective leverage). “Total assets” for this purpose generally includes assets attributable to the Fund’s use of effective leverage (whether or not those assets are reflected in the Fund’s financial statements for purposes of U.S. generally accepted accounting principles). The Board Members recognized that because a decision to increase the Fund’s leverage would have the effect, all other things being equal, of increasing Managed Assets, and, therefore, the Fund Advisers’ respective fees, the Advisor and the Sub-Advisor may have a conflict of interest in determining whether to increase the |
Annual Investment Management Agreement
Approval Process (Unaudited) (continued)
| | Fund’s use of leverage. Notwithstanding the foregoing, the Independent Board Members considered that the Advisor would seek to manage that potential conflict by increasing the Fund’s use of leverage only when it determines that such increase is consistent with the Fund’s investment objectives, and by periodically reviewing the Fund’s performance and use of leverage with the Board. |
| | |
| | In addition, the Independent Board Members considered the fund-level breakpoint schedule and the complex-wide breakpoint schedule (described in further detail below) and any applicable fee waivers and expense reimbursements expected to be provided. Based on their review of the fee and expense information provided, the Independent Board Members determined that the Fund’s management fees were reasonable in light of the nature, extent and quality of services to be provided to it. |
| | |
| | 2. Comparisons with the Fees of Other Clients |
| | Due to their experience with other Nuveen funds, the Board Members were familiar with the nature of services and range of fees offered by the Advisor to other clients. Such other clients include municipal separately managed accounts and passively managed exchange-traded funds (ETFs) sub-advised by the Advisor. In evaluating the comparisons of fees, the Independent Board Members have noted, at the Meeting or at prior meetings, that the fee rates charged to a fund (such as the Fund) and charged to other clients vary, among other things, because of the different services involved and the additional regulatory and compliance requirements associated with registered investment companies, such as the Fund. Accordingly, the Independent Board Members have considered the differences in the product types, including, but not limited to, the services to be provided, the structure and operations, product distribution and costs thereof, portfolio investment policies, investor profiles, account sizes and regulatory requirements. The Independent Board Members have noted, in particular, that the range of services as described above to be provided to a fund (such as the Fund) is much more extensive than that provided to separately managed accounts. Given the inherent differences in the various products, particularly the extensive services to be provided to the Fund, the Independent Board Members believe such facts justify the different levels of fees. |
| | |
| | In considering the fees of the Sub-Advisor, the Independent Board Members are familiar with the pricing schedule or fees that the Sub-Advisor charges for similar investment management services for other Nuveen funds, funds of other sponsors (if any), and other clients (such as retail and/or institutional managed accounts). |
| | |
| | 3. Profitability of Fund Advisers |
| | In conjunction with their review of fees at prior meetings, the Independent Board Members have considered the profitability of Nuveen for its advisory activities and its financial condition. At the Meeting or prior meetings, the Independent Board Members reviewed the revenues and expenses of Nuveen’s advisory activities, the allocation methodology used in preparing the profitability data and an analysis of the key drivers behind the changes in revenues and expenses that impacted profitability. They also reviewed certain financial information included in a report dated August 14, 2012 and Nuveen’s June 30, 2012 consolidated financial statements. The Independent Board Members have also considered, at the Meeting or at prior meetings, Nuveen’s revenues for advisory activities, expenses, and profit margin compared to that of various unaffiliated management firms with comparable assets under management (based on asset size and asset composition). |
| | |
| | In reviewing profitability, the Independent Board Members have recognized the Advisor’s continued investment in its business to enhance its services, including capital improvements to investment technology, updated compliance systems, and additional personnel in compliance, risk management, and product development as well as its ability to allocate resources to various areas of the Advisor as the need arises. In addition, in evaluating profitability, the |
| | Independent Board Members have also recognized the subjective nature of determining profitability which may be affected by numerous factors, including the allocation of expenses. Further, the Independent Board Members have recognized the difficulties in making comparisons as the profitability of other advisers generally is not publicly available and the profitability information that is available for certain advisers or management firms may not be representative of the industry and may be affected by, among other things, the adviser’s particular business mix, capital costs, types of funds managed and expense allocations. Notwithstanding the foregoing, the Independent Board Members have reviewed Nuveen’s methodology and assumptions for allocating expenses across product lines to determine profitability. In reviewing profitability, the Independent Board Members have recognized Nuveen’s investment in its fund business. Based on their review, the Independent Board Members concluded that the Advisor’s level of profitability for its advisory activities was reasonable in light of the services to be provided. |
| | |
| | With respect to sub-advisers that are affiliated with Nuveen, including the Sub-Advisor, the Independent Board Members have previously reviewed such sub-advisers’ revenues, expenses and profitability margins (pre- and post-tax) for their advisory activities and the methodology used for allocating expenses among the internal sub-advisers. Based on their review, the Independent Board Members were satisfied that the Sub-Advisor’s level of profitability was reasonable in light of the services to be provided to the Fund. |
| | |
| | In evaluating the reasonableness of the compensation, the Independent Board Members also considered any other amounts expected to be paid to a Fund Adviser by the Fund as well as any indirect benefits (such as soft dollar arrangements, if any) the respective Fund Adviser and its affiliates are expected to receive that are directly attributable to the management of the Fund, if any. See Section E below for additional information on indirect benefits a Fund Adviser may receive as a result of its relationship with the Fund. Based on their review of the overall fee arrangements of the Fund, the Independent Board Members determined that the advisory fees and expected expenses of the Fund were reasonable. |
D. Economies of Scale and Whether Fee Levels Reflect These Economies of Scale
With respect to economies of scale, the Independent Board Members have recognized the potential benefits resulting from the costs of a fund being spread over a larger asset base, although economies of scale are difficult to measure and predict with precision, particularly on a fund-by-fund basis. The Independent Board Members therefore considered whether the Fund could be expected to benefit from any economies of scale. One method to help ensure that the shareholders share in these benefits is to include breakpoints in the advisory fee schedule. Generally, management fees for funds in the Nuveen complex are comprised of a fund-level component and a complex-level component. Accordingly, the Independent Board Members received and reviewed the schedule of proposed advisory fees for the Fund, including fund-level breakpoints thereto. In this regard, however, given that the Fund is a closed-end fund, the Independent Board Members recognized that although closed-end funds (such as the Fund) may from time to time make additional share offerings, the growth of their assets will occur primarily through the appreciation of such funds’ investment portfolios.
In addition to fund-level advisory fee breakpoints, the Board also considered the Fund’s complex-wide fee arrangement. Pursuant to the complex-wide fee arrangement, the fees of the funds in the Nuveen complex, including the Fund, are generally reduced as the assets in the fund complex reach certain levels. In evaluating the complex-wide fee arrangement, the Independent Board Members have considered that the complex-wide fee arrangement seeks to provide the benefits of economies of scale to fund shareholders when total fund complex assets increase, even if assets of a particular fund are unchanged or have decreased. The approach reflects the notion that some of Nuveen’s costs are attributable to services provided to all its funds in the complex and therefore all funds benefit if these costs
Annual Investment Management Agreement
Approval Process (Unaudited) (continued)
are spread over a larger asset base. Based on their review, the Independent Board Members concluded that the breakpoint schedules and complex-wide fee arrangement were acceptable and reflect economies of scale to be shared with the Fund’s shareholders when assets under management increase.
E. Indirect Benefits
In evaluating fees, the Independent Board Members also considered information regarding potential “fall out” or ancillary benefits that a Fund Adviser or its affiliates may receive as a result of its relationship with the Fund. In this regard, the Independent Board Members considered any revenues expected to be received by affiliates of the Advisor for serving as co-manager in an initial public offering of new closed-end funds.
In addition to the above, the Independent Board Members considered whether the Fund Advisers will receive any benefits from soft dollar arrangements whereby a portion of the commissions paid by the Fund for brokerage may be used to acquire research that may be useful to a Fund Adviser in managing the assets of the Fund and other clients. The Independent Board Members recognized that each Fund Adviser has the authority to pay a higher commission in return for brokerage and research services if it determines in good faith that the commission paid is reasonable in relation to the value of the brokerage and research services provided and may benefit from such soft dollar arrangements. Similarly, the Board recognized that the research received pursuant to soft dollar arrangements by a Fund Adviser may also benefit the Fund and shareholders to the extent the research enhances the ability of the Fund Adviser to manage the Fund. The Independent Board Members noted that the Fund Advisers’ profitability may be somewhat lower if they did not receive the research services pursuant to the soft dollar arrangements and had to acquire such services directly.
Based on their review, the Independent Board Members concluded that any indirect benefits expected to be received by a Fund Adviser as a result of its relationship with the Fund were reasonable and within acceptable parameters.
F. Approval
The Independent Board Members did not identify any single factor discussed previously as all-important or controlling. The Board Members, including a majority of the Independent Board Members, concluded that the terms of the Investment Management Agreement and Sub-Advisory Agreement were fair and reasonable, that the respective Fund Adviser’s fees are reasonable in light of the services to be provided to the Fund and that the Investment Management Agreement and Sub-Advisory Agreement should be and were approved on behalf of the Fund.
II.
Nuveen Intermediate Duration Quality Municipal Term Fund
With respect to the fund listed immediately above (for purposes of this Section II, the “Fund”), to assist the Board in its evaluation of an Advisory Agreement with a Fund Adviser at the January Meeting (for purposes of this Section II, the “Meeting”), the Independent Board Members had received, in adequate time in advance of the Meeting or at prior meetings, materials which outlined, among other things:
| • | | the nature, extent and quality of services expected to be provided by the Fund Adviser; |
| | | |
| • | | the organization of the Fund Adviser, including the responsibilities of various departments and key personnel; |
| | | |
| • | | the expertise and background of the Fund Adviser with respect to the Fund’s investment strategy; |
| | | |
| • | | certain performance-related information (as described below); |
| • | | the profitability of Nuveen; |
| | | |
| • | | the proposed management fees of the Fund Adviser, including comparisons of such fees with the management fees of comparable funds; |
| | | |
| • | | the expected expenses of the Fund, including comparisons of the Fund’s expected expense ratio with the expense ratios of comparable funds; and |
| | | |
| • | | the soft dollar practices of the Fund Adviser, if any. |
At the Meeting, the Advisor made a presentation to and responded to questions from the Board. During the Meeting, the Independent Board Members also met privately with their legal counsel to review the Board’s duties under the 1940 Act, the general principles of state law in reviewing and approving advisory contracts, the standards used by courts in determining whether investment company boards of directors have fulfilled their duties, factors to be considered in voting on advisory contracts and an adviser’s fiduciary duty with respect to advisory agreements and compensation. It is with this background that the Independent Board Members considered the Fund’s Advisory Agreements. As outlined in more detail below, the Independent Board Members considered all factors they believed relevant with respect to the Fund, including the following: (a) the nature, extent and quality of the services to be provided by the Fund Advisers; (b) investment performance, as described below; (c) the advisory fees and costs of the services to be provided to the Fund and the profitability of the Fund Advisers; (d) the extent of any anticipated economies of scale; (e) any benefits expected to be derived by the Fund Advisers from their relationships with the Fund; and (f) other factors. Each Board Member may have accorded different weight to the various factors in reaching his or her conclusions with respect to the Fund’s Advisory Agreements.
A. Nature, Extent and Quality of Services
The Independent Board Members considered the nature, extent and quality of the respective Fund Adviser’s services, including advisory services and administrative services. As the Advisor and the Sub-Advisor already serve as adviser and sub-adviser, respectively, to other Nuveen funds overseen by the Board Members, the Board has a good understanding of each such Fund Adviser’s organization, operations and personnel. As the Independent Board Members meet regularly throughout the year to oversee the Nuveen funds, including funds currently advised by the Fund Advisers, the Independent Board Members have relied upon their knowledge from their meetings and any other interactions throughout the year of the respective Fund Adviser and its services in evaluating the Advisory Agreements.
At the Meeting and at prior meetings, the Independent Board Members reviewed materials outlining, among other things, the respective Fund Adviser’s organization and business; the types of services that such Fund Adviser or its affiliates provide to the Nuveen funds and are expected to provide to the Fund; and the experience of the respective Fund Adviser with applicable investment strategies. Further, the Independent Board Members have evaluated the background and experience of each Fund Adviser’s investment personnel.
In addition to advisory services, the Independent Board Members have considered the quality and extent of administrative and other non-investment advisory services to be provided. In this regard, the Advisor is expected to provide the Fund with such administrative and other services (exclusive of, and in addition to, any such services provided by others for the Fund) and officers and other personnel as are necessary for the operations of the Fund. In addition to investment management services, the Advisor and its affiliates will provide the Fund with a wide range of services, including, among other things, product management, investment services (such as oversight of investment policies and procedures, risk management, and pricing), fund administration, oversight of service providers, shareholder services
Annual Investment Management Agreement
Approval Process (Unaudited) (continued)
and communications, administration of Board relations, regulatory and portfolio compliance, legal support, managing leverage and promoting an orderly secondary market for common shares. The Independent Board Members also recognized that the Advisor would oversee the Sub-Advisor. In addition to the foregoing services, the Independent Board Members have also noted the additional services that the Advisor or its affiliates provide to closed-end funds, including in particular Nuveen’s continued commitment to supporting the secondary market for the common shares of its closed-end funds through a comprehensive secondary market communication program designed to raise investor and analyst awareness and understanding of closed-end funds. These efforts include, among other things, sponsoring and participating in conferences; communicating with closed-end fund analysts covering the Nuveen funds; providing marketing and product updates for the closed-end funds; and maintaining and enhancing a closed-end fund website.
In evaluating the services of the Sub-Advisor, the Independent Board Members noted that the Sub-Advisor was generally expected to supply portfolio investment management services to the Fund. In addition, the Board Members recognized the Sub-Advisor’s experience and investment process.
Based on their review, the Independent Board Members found that, overall, the nature, extent and quality of services expected to be provided to the Fund under each Advisory Agreement were satisfactory.
B. Investment Performance
The Fund was new and therefore did not have its own performance history. However, the Independent Board Members are familiar with the performance records of other Nuveen funds advised by the Advisor and sub-advised by the Sub-Advisor. The Independent Board Members recognized that the Fund was expected to use a strategy similar to that of the Nuveen Intermediate Duration Municipal Bond Fund (the “Intermediate Duration Open-End Fund”), an open-end fund in the Nuveen fund family that was launched in June 1995. In that regard, the Independent Board Members reviewed certain performance information relating to the Intermediate Duration Open-End Fund, including annualized returns for the year-to-date period as of January 8, 2013 and for the one-month, three-month, one-year, three-year, five-year, ten-year and since inception periods as of December 31, 2012. They also reviewed calendar year returns for the Intermediate Duration Open-End Fund for 2008 through 2012.
| C. | Fees, Expenses and Profitability |
| | |
| | 1. Fees and Expenses |
| | In evaluating the management fees and expenses that the Fund was expected to bear, the Independent Board Members considered, among other things, the Fund’s proposed management fee structure, the rationale for its proposed fee levels, and its expected expense ratio in absolute terms as well as compared with the fees and expense ratios of comparable funds. In this regard, the Independent Board Members reviewed, among other things, comparative fee and expense structure data for the Lipper intermediate municipal debt funds category. They also considered the Fund’s intermediate portfolio and significant investment grade allocation. In addition, the Independent Board Members noted that the Fund may make investments in certain instruments that have the economic effect of leverage. Further, the Independent Board Members recognized that assets attributable to the Fund’s use of effective leverage would be included in the amount of assets upon which the advisory fee is calculated. In this regard, the Independent Board Members noted that the advisory fee is based on a percentage of average daily “Managed Assets.” “Managed Assets” generally means the total assets of the Fund minus the sum of its accrued liabilities (other than Fund liabilities incurred for the express purpose of creating effective leverage). “Total assets” for this purpose generally includes assets attributable to the Fund’s use of effective leverage (whether or not those assets are reflected in the Fund’s financial statements for purposes of generally accepted |
| | accounting principles). The Board Members recognized that because a decision to increase the Fund’s leverage would have the effect, all other things being equal, of increasing Managed Assets, and, therefore, the Fund Advisers’ respective fees, the Fund Advisers may have a conflict of interest in determining whether to increase the Fund’s use of leverage. Notwithstanding the foregoing, the Independent Board Members considered that the Advisor would seek to manage that potential conflict by increasing the Fund’s use of leverage only when it determines that such increase is consistent with the Fund’s investment objectives, and by periodically reviewing the Fund’s performance and use of leverage with the Board. |
| | |
| | In addition, the Independent Board Members considered the fund-level breakpoint schedule and the complex-wide breakpoint schedule (described in further detail below) and any applicable fee waivers and expense reimbursements expected to be provided. Based on their review of the fee and expense information provided, the Independent Board Members determined that the Fund’s management fees were reasonable in light of the nature, extent and quality of services to be provided to the Fund. |
| | |
| | 2. Comparisons with the Fees of Other Clients |
| | Due to their experience with other Nuveen funds, the Board Members were familiar with the nature of services and range of fees offered by the Advisor to other clients. Such other clients include municipal separately managed accounts and passively managed exchange-traded funds (ETFs) sub-advised by the Advisor. In evaluating the comparisons of fees, the Independent Board Members have noted, at the Meeting or at prior meetings, that the fee rates charged to a fund (such as the Fund) and charged to other clients vary, among other things, because of the different services involved and the additional regulatory and compliance requirements associated with registered investment companies, such as the Fund. Accordingly, the Independent Board Members have considered the differences in the product types, including, but not limited to, the services to be provided, the structure and operations, product distribution and costs thereof, portfolio investment policies, investor profiles, account sizes and regulatory requirements. The Independent Board Members have noted, in particular, that the range of services as described above to be provided to a fund (such as the Fund) is much more extensive than that provided to separately managed accounts. Given the inherent differences in the various products, particularly the extensive services to be provided to the Fund, the Independent Board Members believe such facts justify the different levels of fees. |
| | |
| | In considering the fees of the Sub-Advisor, the Independent Board Members are familiar with the pricing schedule or fees that the Sub-Advisor charges for similar investment management services for other Nuveen funds, funds of other sponsors (if any), and other clients (such as retail and/or institutional managed accounts). |
| | |
| | 3. Profitability of Fund Advisers |
| | In conjunction with their review of fees at prior meetings, the Independent Board Members have considered the profitability of Nuveen for its advisory activities and its financial condition. At the Meeting or prior meetings, the Independent Board Members reviewed the revenues and expenses of Nuveen’s advisory activities, the allocation methodology used in preparing the profitability data and an analysis of the key drivers behind the changes in revenues and expenses that impacted profitability. They also reviewed certain Nuveen business and financial information dated January 15, 2013, certain Nuveen financial information included in a report dated November 7, 2012, and Nuveen’s September 30, 2012 consolidated financial statements. The Independent Board Members have also considered, at the Meeting or at prior meetings, Nuveen’s revenues for advisory activities, expenses, and profit margin compared to that of various unaffiliated management firms with comparable assets under management (based on asset size and asset composition). |
Annual Investment Management Agreement
Approval Process (Unaudited) (continued)
| | In reviewing profitability, the Independent Board Members have recognized the Advisor’s continued investment in its business to enhance its services, including capital improvements to investment technology, updated compliance systems, and additional personnel in compliance, risk management, and product development. In addition, in evaluating profitability, the Independent Board Members have also recognized the subjective nature of determining profitability which may be affected by numerous factors, including the allocation of expenses. Further, the Independent Board Members have recognized the difficulties in making comparisons as the profitability of other advisers generally is not publicly available and the profitability information that is available for certain advisers or management firms may not be representative of the industry and may be affected by, among other things, the adviser’s particular business mix, capital costs, types of funds managed and expense allocations. Notwithstanding the foregoing, the Independent Board Members have reviewed Nuveen’s methodology and assumptions for allocating expenses across product lines to determine profitability. In reviewing profitability, the Independent Board Members have recognized Nuveen’s investment in its fund business. Based on their review, the Independent Board Members concluded that the Advisor’s level of profitability for its advisory activities was reasonable in light of the services to be provided. |
| | |
| | With respect to the Sub-Advisor, which is affiliated with Nuveen, the Independent Board Members have previously reviewed its revenues, expenses and profitability margins (pre- and post-tax) for its advisory activities and the methodology used for allocating expenses among the internal sub-advisers. Based on their review, the Independent Board Members were satisfied that the Sub-Advisor’s level of profitability was reasonable in light of the services to be provided to the Fund. |
| | |
| | In evaluating the reasonableness of the compensation, the Independent Board Members also considered any other amounts expected to be paid to a Fund Adviser by the Fund as well as any indirect benefits (such as soft dollar arrangements, if any) the respective Fund Adviser and its affiliates are expected to receive that are directly attributable to the management of the Fund, if any. See Section E below for additional information on indirect benefits a Fund Adviser may receive as a result of its relationship with the Fund. Based on their review of the overall fee arrangements of the Fund, the Independent Board Members determined that the advisory fees and expected expenses of the Fund were reasonable. |
D. Economies of Scale and Whether Fee Levels Reflect These Economies of Scale
With respect to economies of scale, the Independent Board Members have recognized the potential benefits resulting from the costs of a fund being spread over a larger asset base, although economies of scale are difficult to measure and predict with precision, particularly on a fund-by-fund basis. The Independent Board Members therefore considered whether the Fund could be expected to benefit from any economies of scale. One method to help ensure that the shareholders share in these benefits is to include breakpoints in the advisory fee schedule. Generally, management fees for funds in the Nuveen complex are comprised of a fund-level component and a complex-level component. Accordingly, the Independent Board Members received and reviewed the schedule of proposed advisory fees for the Fund, including fund-level breakpoints thereto. In this regard, however, given that the Fund is a closed-end fund, the Independent Board Members recognized that although closed-end funds (such as the Fund) may from time to time make additional share offerings, the growth of their assets will occur primarily through the appreciation of such funds’ investment portfolios.
In addition to fund-level advisory fee breakpoints, the Board also considered the Fund’s complex-wide fee arrangement. Pursuant to the complex-wide fee arrangement, the fees of the funds in the Nuveen complex, including the Fund, are generally reduced as the assets in the fund complex reach certain levels. In evaluating the complex-wide fee
arrangement, the Independent Board Members have considered that the complex-wide fee arrangement seeks to provide the benefits of economies of scale to fund shareholders when total fund complex assets increase, even if assets of a particular fund are unchanged or have decreased. The approach reflects the notion that some of Nuveen’s costs are attributable to services provided to all its funds in the complex and therefore all funds benefit if these costs are spread over a larger asset base.
Based on their review, the Independent Board Members concluded that the breakpoint schedules and complex-wide fee arrangement were acceptable and reflect economies of scale to be shared with the Fund’s shareholders when assets under management increase.
E. Indirect Benefits
In evaluating fees, the Independent Board Members also considered information previously received regarding potential “fall out” or ancillary benefits that a Fund Adviser or its affiliates may receive as a result of its relationship with the Fund. In this regard, the Independent Board Members considered any revenues expected to be received by affiliates of the Advisor for serving as co-manager in an initial public offering of new closed-end funds.
In addition to the above, the Independent Board Members considered whether the Fund Advisers will receive any benefits from soft dollar arrangements whereby a portion of the commissions paid by the Fund for brokerage may be used to acquire research that may be useful to a Fund Adviser in managing the assets of the Fund and other clients. The Independent Board Members recognized that each Fund Adviser has the authority to pay a higher commission in return for brokerage and research services if it determines in good faith that the commission paid is reasonable in relation to the value of the brokerage and research services provided and may benefit from such soft dollar arrangements. Similarly, the Board recognized that the research received pursuant to soft dollar arrangements by a Fund Adviser may also benefit the Fund and shareholders to the extent the research enhances the ability of the Fund Adviser to manage the Fund. The Independent Board Members noted that the Fund Advisers’ profitability may be somewhat lower if they did not receive the research services pursuant to the soft dollar arrangements and had to acquire such services directly.
Based on their review, the Independent Board Members concluded that any indirect benefits expected to be received by a Fund Adviser as a result of its relationship with the Fund were reasonable and within acceptable parameters.
F. Approval
The Independent Board Members did not identify any single factor discussed previously as all-important or controlling. The Board Members, including a majority of the Independent Board Members, concluded that the terms of the Investment Management Agreement and Sub-Advisory Agreement were fair and reasonable, that the respective Fund Adviser’s fees are reasonable in light of the services to be provided to the Fund and that the Investment Management Agreement and Sub-Advisory Agreement should be and were approved on behalf of the Fund.
Reinvest Automatically,
Easily and Conveniently
Nuveen makes reinvesting easy. A phone call is all it takes to set up your reinvestment account.
Nuveen Closed-End Funds Automatic Reinvestment Plan
Your Nuveen Closed-End Fund allows you to conveniently reinvest distributions in additional Fund shares.
By choosing to reinvest, you’ll be able to invest money regularly and automatically, and watch your investment grow through the power of compounding. Just like distributions in cash, there may be times when income or capital gains taxes may be payable on distributions that are reinvested.
It is important to note that an automatic reinvestment plan does not ensure a profit, nor does it protect you against loss in a declining market.
Easy and convenient
To make recordkeeping easy and convenient, each month you’ll receive a statement showing your total distributions, the date of investment, the shares acquired and the price per share, and the total number of shares you own.
How shares are purchased
The shares you acquire by reinvesting will either be purchased on the open market or newly issued by the Fund. If the shares are trading at or above net asset value at the time of valuation, the Fund will issue new shares at the greater of the net asset value or 95% of the then-current market price. If the shares are trading at less than net asset value, shares for your account will be purchased on the open market. If the Plan Agent begins purchasing Fund shares on the open market while shares are trading below net asset value, but the Fund’s shares subsequently trade at or above their net asset value before the Plan Agent is able to complete its purchases, the Plan Agent may cease open-market purchases and may invest the uninvested portion of the distribution in newly-issued Fund shares at a price equal to the greater of the shares’ net asset value or 95% of the shares’ market value on the last business day immediately prior to the purchase date. Distributions received to purchase shares in the open market will normally be invested shortly after the distribution payment date. No interest will be paid on distributions awaiting reinvestment. Because the market price of the shares may increase before purchases are completed, the average purchase price per share may exceed the market price at the time of valuation, resulting in the acquisition of fewer shares than if the distribution had been paid in shares issued by the Fund. A pro rata portion of any applicable brokerage commissions on open market purchases will be paid by Plan participants. These commissions usually will be lower than those charged on individual transactions.
Flexible
You may change your distribution option or withdraw from the Plan at any time, should your needs or situation change.
You can reinvest whether your shares are registered in your name, or in the name of a brokerage firm, bank, or other nominee. Ask your investment advisor if his or her firm will participate on your behalf. Participants whose shares are registered in the name of one firm may not be able to transfer the shares to another firm and continue to participate in the Plan.
The Fund reserves the right to amend or terminate the Plan at any time. Although the Fund reserves the right to amend the Plan to include a service charge payable by the participants, there is no direct service charge to participants in the Plan at this time.
Call today to start reinvesting distributions
For more information on the Nuveen Automatic Reinvestment Plan or to enroll in or withdraw from the Plan, speak with your financial advisor or call us at (800) 257-8787.
Glossary of Terms
Used in this Report
| ■ | Auction Rate Bond: An auction rate bond is a security whose interest payments are adjusted periodically through an auction process, which process typically also serves as a means for buying and selling the bond. Auctions that fail to attract enough buyers for all the shares offered for sale are deemed to have “failed,” with current holders receiving a formula-based interest rate until the next scheduled auction. |
| | |
| ■ | Average Annual Total Return: This is a commonly used method to express an investment’s performance over a particular, usually multi-year time period. It expresses the return that would have been necessary each year to equal the investment’s actual cumulative performance (including change in NAV or market price and reinvested dividends and capital gains distributions, if any) over the time period being considered. |
| | |
| ■ | Duration: Duration is a measure of the expected period over which a bond’s principal and interest will be paid, and consequently is a measure of the sensitivity of a bond’s or bond Fund’s value to changes when market interest rates change. Generally, the longer a bond’s or Fund’s duration, the more the price of the bond or Fund will change as interest rates change. |
| | |
| ■ | Effective Leverage: Effective leverage is a Fund’s effective economic leverage, and includes both regulatory leverage (see leverage) and the leverage effects of certain derivative investments in a Fund’s portfolio. Currently, the leverage effects of Tender Option Bond (TOB) inverse floater holdings are included in effective leverage values, in addition to any regulatory leverage. |
| | |
| ■ | Forward Interest Rate Swap: A contractual agreement between two counterparties under which one party agrees to make periodic payments to the other for an agreed period of time based on a fixed rate, while the other party agrees to make periodic payments based on a floating rate of interest based on an underlying index. Alternatively, both series of cash flows to be exchanged could be calculated using floating rates of interest but floating rates that are based upon different underlying indices. |
| | |
| ■ | Gross Domestic Product (GDP): The total market value of all final goods and services produced in a country/region in a given year, equal to total consumer, investment and government spending, plus the value of exports, minus the value of imports. |
| | |
| ■ | Inverse Floating Rate Securities: Inverse floating rate securities, also known as inverse floaters or tender option bonds (TOBs), are created by depositing a municipal bond, typically with a fixed interest rate, into a special purpose trust created by a broker-dealer. This trust, in turn, (a) issues floating rate certificates typically paying short-term tax-exempt interest rates to third parties in amounts equal to some fraction of the deposited bond’s par amount or market value, and (b) issues an inverse floating rate certificate (sometimes referred to as an “inverse floater”) to an investor (such as a Fund) interested in gaining investment exposure to a long-term municipal bond. The income received by the holder of the inverse floater varies inversely with the short-term rate paid to the floating rate certificates’ holders, and in most circumstances the holder of the inverse floater bears substantially all of the underlying bond’s downside investment risk. The holder of the inverse floater typically also benefits disproportionately from any potential appreciation of the underlying bond’s value. Hence, an inverse floater essentially represents an investment in the underlying bond on a leveraged basis. |
| ■ | Leverage: Using borrowed money to invest in securities or other assets, seeking to increase the return of an investment or portfolio. |
| | |
| ■ | Lipper General & Insured Leveraged Municipal Debt Funds Classification Average: Calculated using the returns of all closed-end funds in this category. Lipper returns account for the effects of management fees and assume reinvestment of distributions, but do not reflect any applicable sales charges. |
| | |
| ■ | Lipper Intermediate Municipal Debt Funds Classification Average: Represents the average annualized total return for all reporting funds in the Lipper Intermediate Municipal Debt Funds Classification. Lipper returns account for the effects of management fees and assume reinvestment of distributions, but do not reflect any applicable sales charge. |
| | |
| ■ | Net Asset Value (NAV): The net market value of all securities held in a portfolio. |
| | |
| ■ | Net Asset Value (NAV) Per Share: The market value of one share of a mutual fund or closed-end fund. For a Fund, the NAV is calculated daily by taking the Fund’s total assets (securities, cash, and accrued earnings), subtracting the Fund’s liabilities, and dividing by the number of shares outstanding. |
| | |
| ■ | Pre-Refunding: Pre-Refunding, also known as advanced refundings or refinancings, is a procedure used by state and local governments to refinance municipal bonds to lower interest expenses. The issuer sells new bonds with a lower yield and uses the proceeds to buy U.S. Treasury securities, the interest from which is used to make payments on the higher-yielding bonds. Because of this collateral, pre-refunding generally raises a bond’s credit rating and thus its value. |
| | |
| ■ | Regulatory Leverage: Regulatory Leverage consists of preferred shares issued by or borrowings of a Fund. Both of these are part of a Fund’s capital structure. Regulatory leverage is sometimes referred to as “40 Act Leverage” and is subject to asset coverage limits set in the Investment Company Act of 1940. |
| | |
| ■ | S&P Municipal Bond Intermediate Index: An unleveraged, market value-weighted index containing all of the bonds in the S&P Municipal Bond Index with maturity dates between 3 and 14.999 years. Index returns assume reinvestment of distributions, but do not reflect any applicable sales charges or management fees. |
| | |
| ■ | Total Investment Exposure: Total investment exposure is a Fund’s assets managed by the Adviser that are attributable to financial leverage. For these purposes, financial leverage includes a Fund’s use of preferred stock and borrowings and investments in the residual interest certificates (also called inverse floating rate securities) in tender option bond (TOB) trusts, including the portion of assets held by a TOB trust that has been effectively financed by the trust’s issuance of floating rate securities. |
| | |
| ■ | Zero Coupon Bond: A zero coupon bond does not pay a regular interest coupon to its holders during the life of the bond. Tax-exempt income to the holder of the bond comes from accretion of the difference between the original purchase price of the bond at issuance and the par value of the bond at maturity and is effectively paid at maturity. The market prices of zero coupon bonds generally are more volatile than the market prices of bonds that pay interest periodically. |
Notes
Additional Fund Information
Board of Trustees
John P. Amboian
Robert P. Bremner
Jack B. Evans
William C. Hunter
David J. Kundert
William J. Schneider
Judith M. Stockdale
Carole E. Stone
Virginia L. Stringer
Terence J. Toth
Fund Manager
Nuveen Fund Advisors, LLC
333 West Wacker Drive
Chicago, IL 60606
Custodian
State Street Bank
& Trust Company
Boston, MA
Transfer Agent and
Shareholder Services
State Street Bank
& Trust Company
Nuveen Funds
P.O. Box 43071
Providence, RI 02940-3071
(800) 257-8787
Legal Counsel
Chapman and Cutler LLP
Chicago, IL
Independent Registered
Public Accounting Firm
Ernst & Young LLP
Chicago, IL
Quarterly Form N-Q Portfolio of Investments Information
Each Fund is required to file its complete schedule of portfolio holdings with the Securities and Exchange Commission (SEC) for the first and third quarters of each fiscal year on Form N-Q. You may obtain this information directly from the SEC. Visit the SEC on-line at http://www.sec.gov or in person at the SEC’s Public Reference Room in Washington, D.C. Call the SEC toll-free at (800) SEC -0330 for room hours and operation.
Nuveen Funds’ Proxy Voting Information
You may obtain (i) information regarding how each Fund voted proxies relating to portfolio securities held during the most recent twelve-month period ended June 30, without charge, upon request, by calling Nuveen Investments toll-free at (800) 257-8787 or on Nuveen’s website at www.nuveen.com and (ii) a description of the policies and procedures that each Fund used to determine how to vote proxies relating to portfolio securities without charge, upon request, by calling Nuveen Investments toll-free at (800) 257-8787. You may also obtain this information directly from the SEC. Visit the SEC on-line at http://www.sec.gov.
CEO Certification Disclosure
Each Fund’s Chief Executive Officer (CEO) has submitted to the New York Stock Exchange (NYSE) the annual CEO certification as required by Section 303A.12(a) of the NYSE Listed Company Manual.
Each Fund has filed with the SEC the certification of its Chief Executive Officer and Chief Financial Officer required by Section 302 of the Sarbanes-Oxley Act.
Nuveen Investments:
Serving Investors for Generations
Since 1898, financial advisors and their clients have relied on Nuveen Investments to provide dependable investment solutions through continued adherence to proven, long-term investing principles. Today, we offer a range of high quality equity and fixed-income solutions designed to be integral components of a well-diversified core portfolio.
Focused on meeting investor needs.
Nuveen Investments provides high-quality investment services designed to help secure the long-term goals of institutional and individual investors as well as the consultants and financial advisors who serve them. Nuveen Investments markets a wide range of specialized investment solutions which provide investors access to capabilities of its high-quality boutique investment affiliates—Nuveen Asset Management, Symphony Asset Management, NWQ Investment Management Company, Santa Barbara Asset Management, Tradewinds Global Investors, Winslow Capital Management and Gresham Investment Management. In total, Nuveen Investments managed $224 billion as of March 31, 2013.
Find out how we can help you.
To learn more about how the products and services of Nuveen Investments may be able to help you meet your financial goals, talk to your financial advisor, or call us at (800) 257-8787. Please read the information provided carefully before you invest. Investors should consider the investment objective and policies, risk considerations, charges and expenses of any investment carefully. Where applicable, be sure to obtain a prospectus, which contains this and other relevant information. To obtain a prospectus, please contact your securities representative or Nuveen Investments, 333 W. Wacker Dr., Chicago, IL 60606. Please read the prospectus carefully before you invest or send money.
Learn more about Nuveen Funds at: www.nuveen.com/cef
Distributed by
Nuveen Securities, LLC
333 West Wacker Drive
Chicago, IL 60606
www.nuveen.com
EAN-C-0513D
ITEM 2. CODE OF ETHICS.
As of the end of the period covered by this report, the registrant has adopted a code of ethics that applies to the registrant's principal executive officer, principal financial officer, principal accounting officer or controller, or persons performing similar functions. There were no amendments to or waivers from the Code during the period covered by this report. The registrant has posted the code of ethics on its website at www.nuveen.com/CEF/Shareholder/FundGovernance.aspx. (To view the code, click on Code of Conduct.)
ITEM 3. AUDIT COMMITTEE FINANCIAL EXPERT.
The registrant's Board of Directors or Trustees (“Board”) determined that the registrant has at least one “audit committee financial expert” (as defined in Item 3 of Form N-CSR) serving on its Audit Committee. The registrant's audit committee financial expert is Carole E. Stone, who is “independent” for purposes of Item 3 of Form N-CSR.
Ms. Stone served for five years as Director of the New York State Division of the Budget. As part of her role as Director, Ms. Stone was actively involved in overseeing the development of the State's operating, local assistance and capital budgets, its financial plan and related documents; overseeing the development of the State's bond-related disclosure documents and certifying that they fairly presented the State's financial position; reviewing audits of various State and local agencies and programs; and coordinating the State's system of internal audit and control. Prior to serving as Director, Ms. Stone worked as a budget analyst/examiner with increasing levels of responsibility over a 30 year period, including approximately five years as Deputy Budget Director. Ms. Stone has also served as Chair of the New York State Racing Association Oversight Board, as Chair of the Public Authorities Control Board, as a Commissioner on the New York State Commission on Public Authority Reform and as a member of the Boards of Directors of several New York State public authorities. These positions have involved overseeing operations and finances of certain entities and assessing the adequacy of project/entity financing and financial reporting. Currently, Ms. Stone is on the Board of Directors of CBOE Holdings, Inc., of the Chicago Board Options Exchange, and of C2 Options Exchange. Ms. Stone's position on the boards of these entities and as a member of both CBOE Holdings' Audit Committee and its Finance Committee has involved, among other things, the oversight of audits, audit plans and preparation of financial statements.
ITEM 4. PRINCIPAL ACCOUNTANT FEES AND SERVICES.
Nuveen Intermediate Duration Quality Municipal Term Fund
The following tables show the amount of fees that Ernst & Young LLP, the Fund's auditor, billed to the Fund during the Fund's last two full fiscal years. For engagements with Ernst & Young LLP the Audit Committee approved in advance all audit services and non-audit services that Ernst & Young LLP provided to the Fund, except for those non-audit services that were subject to the pre-approval exception under Rule 2-01 of Regulation S-X (the “pre-approval exception”). The pre-approval exception for services provided directly to the Fund waives the pre-approval requirement for services other than audit, review or attest services if: (A) the aggregate amount of all such services provided constitutes no more than 5% of the total amount of revenues paid by the Fund to its accountant during the fiscal year in which the services are provided; (B) the Fund did not recognize the services as non-audit services at the time of the engagement; and (C) the services are promptly brought to the Audit Committee's attention, and the Committee (or its delegate) approves the services before the audit is completed.
The Audit Committee has delegated certain pre-approval responsibilities to its Chairman (or, in his absence, any other member of the Audit Committee).
SERVICES THAT THE FUND'S AUDITOR BILLED TO THE FUND
| | | Audit Fees Billed | | | Audit-Related Fees | | | Tax Fees | | | All Other Fees | |
| Fiscal Year Ended | | to Fund 1 | | | Billed to Fund 2 | | | Billed to Fund 3 | | | Billed to Fund 4 | |
| May 31, 2013 | | $ | 18,500 | | | $ | 0 | | | $ | 0 | | | $ | 0 | |
| | | | | | | | | | | | | | | | | |
| Percentage approved | | | 0 | % | | | 0 | % | | | 0 | % | | | 0 | % |
| pursuant to | | | | | | | | | | | | | | | | |
| pre-approval | | | | | | | | | | | | | | | | |
| exception | | | | | | | | | | | | | | | | |
| | | | | | | | | | | | | | | | | |
May 31, 2012 5 | | | N/A | | | | N/A | | | | N/A | | | | N/A | |
| | | | | | | | | | | | | | | | | |
| Percentage approved | | | N/A | | | | N/A | | | | N/A | | | | N/A | |
| pursuant to | | | | | | | | | | | | | | | | |
| pre-approval | | | | | | | | | | | | | | | | |
| exception | | | | | | | | | | | | | | | | |
| | | | | | | | | | | | | | | | | |
1 "Audit Fees" are the aggregate fees billed for professional services for the audit of the Fund's annual financial statements and services provided in | |
| connection with statutory and regulatory filings or engagements. | | | | | | | | | |
| | | | | | | | | | | | | | | | | |
2 "Audit Related Fees" are the aggregate fees billed for assurance and related services reasonably related to the performance of the audit or review of | |
| financial statements that are not reported under "Audit Fees". These fees include offerings related to the Fund's common shares and leverage. | |
| | | | | | | | | | | | | | | | | |
3 "Tax Fees" are the aggregate fees billed for professional services for tax advice, tax compliance, and tax planning. These fees include: all global | |
| withholding tax services; excise and state tax reviews; capital gain, tax equalization and taxable basis calculation performed by the principal accountant. | |
| | | | | | | | | | | | | | | | | |
4 "All Other Fees" are the aggregate fees billed for products and services other than "Audit Fees", "Audit-Related Fees" and "Tax Fees". These fees | |
| represent all "Agreed-Upon Procedures" engagements pertaining to the Fund's use of leverage. | | | | | |
| | | | | | | | | | | | | | | | | |
5 Fund commenced operations February 7, 2013. | | | | | | | | | | | | | |
SERVICES THAT THE FUND'S AUDITOR BILLED TO THE ADVISER AND AFFILIATED FUND SERVICE PROVIDERS
The following tables show the amount of fees billed by Ernst & Young LLP to Nuveen Fund Advisors, LLC (formerly Nuveen Fund Advisors, Inc.) (the “Adviser” or “NFA”), and any entity controlling, controlled by or under common control with the Adviser that provides ongoing services to the Fund (“Affiliated Fund Service Provider”), for engagements directly related to the Fund's operations and financial reporting, during the Fund's last two full fiscal years.
The tables also show the percentage of fees subject to the pre-approval exception. The pre-approval exception for services provided to the Adviser and any Affiliated Fund Service Provider (other than audit, review or attest services) waives the pre-approval requirement if: (A) the aggregate amount of all such services provided constitutes no more than 5% of the total amount of revenues paid to Ernst & Young LLP by the Fund, the Adviser and Affiliated Fund Service Providers during the fiscal year in which the services are provided that would have to be pre-approved by the Audit Committee; (B) the Fund did not recognize the services as non-audit services at the time of the engagement; and (C) the services are promptly brought to the Audit Committee's attention, and the Committee (or its delegate) approves the services before the Fund's audit is completed.
| | Audit-Related Fees | Tax Fees Billed to | All Other Fees |
| | Billed to Adviser and | Adviser and | Billed to Adviser |
| | Affiliated Fund | Affiliated Fund | and Affiliated Fund |
| Fiscal Year Ended | Service Providers | Service Providers | Service Providers |
| May 31, 2013 | $ 0 | $ 0 | $ 0 |
| | | | |
| Percentage approved | 0% | 0% | 0% |
| pursuant to | | | |
| pre-approval | | | |
| exception | | | |
May 31, 2012 1 | N/A | N/A | N/A |
| | | | |
| Percentage approved | N/A | N/A | N/A |
| pursuant to | | | |
| pre-approval | | | |
| exception | | | |
| | | | |
1 Fund commenced operations February 7, 2013. | | |
NON-AUDIT SERVICES
The following table shows the amount of fees that Ernst & Young LLP billed during the Fund's last two full fiscal years for non-audit services. The Audit Committee is required to pre-approve non-audit services that Ernst & Young LLP provides to the Adviser and any Affiliated Fund Services Provider, if the engagement related directly to the Fund's operations and financial reporting (except for those subject to the pre-approval exception described above). The Audit Committee requested and received information from Ernst & Young LLP about any non-audit services that Ernst & Young LLP rendered during the Fund's last fiscal year to the Adviser and any Affiliated Fund Service Provider. The Committee considered this information in evaluating Ernst & Young LLP's independence.
| | | Total Non-Audit Fees | | |
| | | billed to Adviser and | | |
| | | Affiliated Fund Service | Total Non-Audit Fees | |
| | | Providers (engagements | billed to Adviser and | |
| | | related directly to the | Affiliated Fund Service | |
| | Total Non-Audit Fees | operations and financial | Providers (all other | |
| Fiscal Year Ended | Billed to Fund | reporting of the Fund) | engagements) | Total |
| May 31, 2013 | $ 0 | $ 0 | $ 0 | $ 0 |
May 31, 2012 1 | N/A | N/A | N/A | N/A |
| | | | | |
| | | | | |
| "Non-Audit Fees billed to Fund" for both fiscal year ends represent "Tax Fees" and "All Other Fees" billed to Fund in their respective |
| amounts from the previous table. | | | | |
| | | | | |
Less than 50 percent of the hours expended on the principal accountant's engagement to audit the registrant's financial statements for the most recent fiscal year were |
| attributed to work performed by persons other than the principal accountant's full-time, permanent employees. | |
| | | | | |
1 Fund commenced operations February 7, 2013. | | | |
Audit Committee Pre-Approval Policies and Procedures. Generally, the Audit Committee must approve (i) all non-audit services to be performed for the Fund by the Fund's independent accountants and (ii) all audit and non-audit services to be performed by the Fund's independent accountants for the Affiliated Fund Service Providers with respect to operations and financial reporting of the Fund. Regarding tax and research projects conducted by the independent accountants for the Fund and Affiliated Fund Service Providers (with respect to operations and financial reports of the Fund) such engagements will be (i) pre-approved by the Audit Committee if they are expected to be for amounts greater than $10,000; (ii) reported to the Audit Committee chairman for his verbal approval prior to engagement if they are expected to be for amounts under $10,000 but greater than $5,000; and (iii) reported to the Audit Committee at the next Audit Committee meeting if they are expected to be for an amount under $5,000.
ITEM 5. AUDIT COMMITTEE OF LISTED REGISTRANTS.
The registrant's Board has a separately designated Audit Committee established in accordance with Section 3(a)(58)(A) of the Securities Exchange Act of 1934, as amended (15 U.S.C. 78c(a)(58)(A)). The members of the audit committee are Robert P. Bremner, Terence J. Toth, William J. Schneider, Carole E. Stone and David J. Kundert.
ITEM 6. SCHEDULE OF INVESTMENTS.
a) See Portfolio of Investments in Item 1.
b) Not applicable.
ITEM 7. DISCLOSURE OF PROXY VOTING POLICIES AND PROCEDURES FOR CLOSED-END MANAGEMENT INVESTMENT COMPANIES.
Nuveen Fund Advisors, LLC, formerly known as Nuveen Fund Advisors, Inc., is the registrant’s investment adviser (also referred to as the “Adviser”). The Adviser is responsible for the on-going monitoring of the Fund’s investment portfolio, managing the Fund’s business affairs and providing certain clerical, bookkeeping and administrative services. The Adviser has engaged Nuveen Asset Management, LLC (“Sub-Adviser”) as Sub-Adviser to provide discretionary investment advisory services. As part of these services, the Adviser has delegated to the Sub-Adviser the full responsibility for proxy voting on securities held in the registrant’s portfolio and related duties in accordance with the Sub-Adviser's policies and procedures. The Adviser periodically monitors the Sub-Adviser's voting to ensure that it is carrying out its duties. The Sub-Adviser’s proxy voting policies and procedures are attached to this filing as an exhibit and incorporated herein by reference.
ITEM 8. PORTFOLIO MANAGERS OF CLOSED-END MANAGEMENT INVESTMENT COMPANIES.
Nuveen Fund Advisors, LLC, formerly known as Nuveen Fund Advisors, Inc., is the registrant’s investment adviser (also referred to as the “Adviser”). The Adviser is responsible for the selection and on-going monitoring of the Fund’s investment portfolio, managing the Fund’s business affairs and providing certain clerical, bookkeeping and administrative services. The Adviser has engaged Nuveen Asset Management, LLC (“Nuveen Asset Management” or “Sub-Adviser”) as Sub-Adviser to provide discretionary investment advisory services. The following section provides information on the portfolio manager at the Sub-Adviser:
The Portfolio Manager
The following individual has primary responsibility for the day-to-day implementation of the registrant’s investment strategies:
| Name | Fund |
| Daniel J. Close | Nuveen Intermediate Duration Quality Municipal Term Fund |
Other Accounts Managed. In addition to managing the registrant, the portfolio manager is also primarily responsible for the day-to-day portfolio management of the following accounts:
| Portfolio Manager | Type of Account Managed | Number of Accounts | Assets* |
| Daniel J. Close | Registered Investment Company | 16 | $5.844 billion |
| | Other Pooled Investment Vehicles | 0 | $0 |
| | Other Accounts | 11 | $205.89 million |
| * | Assets are as of May 31, 2013. None of the assets in these accounts are subject to an advisory fee based on performance. |
POTENTIAL MATERIAL CONFLICTS OF INTEREST
Actual or apparent conflicts of interest may arise when a portfolio manager has day-to-day management responsibilities with respect to more than one account. More specifically, portfolio managers who manage multiple accounts are presented a number of potential conflicts, including, among others, those discussed below.
The management of multiple accounts may result in a portfolio manager devoting unequal time and attention to the management of each account. Nuveen Asset Management seeks to manage such competing interests for the time and attention of portfolio managers by having portfolio managers focus on a particular investment discipline. Most accounts managed by a portfolio manager in a particular investment strategy are managed using the same investment models.
If a portfolio manager identifies a limited investment opportunity which may be suitable for more than one account, an account may not be able to take full advantage of that opportunity due to an allocation of filled purchase or sale orders across all eligible accounts. To deal with these situations, Nuveen Asset Management has adopted procedures for allocating limited opportunities across multiple accounts.
With respect to many of its clients’ accounts, Nuveen Asset Management determines which broker to use to execute transaction orders, consistent with its duty to seek best execution of the transaction. However, with respect to certain other accounts, Nuveen Asset Management may be limited by the client with respect to the selection of brokers or may be instructed to direct trades through a particular broker. In these cases, Nuveen Asset Management may place separate, non-simultaneous, transactions for a Fund and other accounts which may temporarily affect the market price of the security or the execution of the transaction, or both, to the detriment of the Fund or the other accounts.
Some clients are subject to different regulations. As a consequence of this difference in regulatory requirements, some clients may not be permitted to engage in all the investment techniques or transactions or to engage in these transactions to the same extent as the other accounts managed by the portfolio manager. Finally, the appearance of a conflict of interest may arise where Nuveen Asset Management has an incentive, such as a performance-based management fee, which relates to the management of some accounts, with respect to which a portfolio manager has day-to-day management responsibilities.
Nuveen Asset Management has adopted certain compliance procedures which are designed to address these types of conflicts common among investment managers. However, there is no guarantee that such procedures will detect each and every situation in which a conflict arises.
| Item 8(a)(3). | FUND MANAGER COMPENSATION |
Portfolio manager compensation consists primarily of base pay, an annual cash bonus and long term incentive payments.
Base pay. Base pay is determined based upon an analysis of the portfolio manager’s general performance, experience, and market levels of base pay for such position.
Annual cash bonus. The Fund’s portfolio managers are eligible for an annual cash bonus based on investment performance, qualitative evaluation and financial performance of Nuveen Asset Management.
A portion of each portfolio manager’s annual cash bonus is based on the Fund’s investment performance, generally measured over the past one- and three or five-year periods unless the portfolio manager’s tenure is shorter. Investment performance for the Fund generally is determined by evaluating the Fund’s performance relative to its benchmark(s) and/or Lipper industry peer group.
A portion of the cash bonus is based on a qualitative evaluation made by each portfolio manager’s supervisor taking into consideration a number of factors, including the portfolio manager’s team collaboration, expense management, support of personnel responsible for asset growth, and his or her compliance with Nuveen Asset Management’s policies and procedures.
The final factor influencing a portfolio manager’s cash bonus is the financial performance of Nuveen Asset Management based on its operating earnings.
Long-term incentive compensation. Certain key employees of Nuveen Investments and its affiliates, including certain portfolio managers, have received equity interests in the parent company of Nuveen Investments. In addition, certain key employees of Nuveen Asset Management, including certain portfolio managers, have received profits interests in Nuveen Asset Management which entitle their holders to participate in the firm’s growth over time.
There are generally no differences between the methods used to determine compensation with respect to the Fund and the Other Accounts shown in the table above.
Beneficial Ownership of Securities. As of May 31, 2013, the portfolio manager beneficially owned the following dollar range of equity securities issued by the Fund and other Nuveen Funds managed by Nuveen Asset Management’s municipal investment team.
| Name of Portfolio Manager | Fund | Dollar range of equity securities beneficially owned in Fund | Dollar range of equity securities beneficially owned in the remainder of Nuveen funds managed by Nuveen Asset Management’s municipal investment team |
| Daniel J. Close | Nuveen Intermediate Duration Quality Municipal Term Fund | $0 | $0 |
PORTFOLIO MANAGER BIO:
Daniel J. Close, CFA, is a Senior Vice President of Nuveen Investments. He joined Nuveen Investments in 2000 as a member of Nuveen’s product management and development team. He then served as a research analyst for Nuveen’s municipal investing team, covering corporate-backed, energy, transportation and utility credits. He received his BS in Business from Miami University and his MBA from Northwestern University’s Kellogg School of Management. Mr. Close has earned the Chartered Financial Analyst designation. Mr. Close also serves as a portfolio manager for various Nuveen Build America Bond strategies.
ITEM 9. PURCHASES OF EQUITY SECURITIES BY CLOSED-END MANAGEMENT INVESTMENT COMPANY AND AFFILIATED PURCHASERS.
Not applicable.
ITEM 10. SUBMISSION OF MATTERS TO A VOTE OF SECURITY HOLDERS.
There have been no material changes to the procedures by which shareholders may recommend nominees to the registrant's Board implemented after the registrant last provided disclosure in response to this Item.
ITEM 11. CONTROLS AND PROCEDURES.
| (a) | The registrant's principal executive and principal financial officers, or persons performing similar functions, have concluded that the registrant's disclosure controls and procedures (as defined in Rule 30a-3(c) under the Investment Company Act of 1940, as amended (the “1940 Act”) (17 CFR 270.30a-3(c))) are effective, as of a date within 90 days of the filing date of this report that includes the disclosure required by this paragraph, based on their evaluation of the controls and procedures required by Rule 30a-3(b) under the 1940 Act (17 CFR 270.30a-3(b)) and Rules 13a-15(b) or 15d-15(b) under the Securities Exchange Act of 1934, as amended (the “Exchange Act”) (17 CFR 240.13a-15(b) or 240.15d-15(b)). |
| (b) | There were no changes in the registrant's internal control over financial reporting (as defined in Rule 30a-3(d) under the 1940 Act (17 CFR 270.30a-3(d)) that occurred during the second fiscal quarter of the period covered by this report that has materially affected, or is reasonably likely to materially affect, the registrant's internal control over financial reporting. |
ITEM 12. EXHIBITS.
File the exhibits listed below as part of this Form.
| (a)(1) | Any code of ethics, or amendment thereto, that is the subject of the disclosure required by Item 2, to the extent that the registrant intends to satisfy the Item 2 requirements through filing of an exhibit: Not applicable because the code is posted on registrant's website at www.nuveen.com/CEF/Shareholder/FundGovernance.aspx and there were no amendments during the period covered by this report. (To view the code, click on Code of Conduct.) |
| (a)(2) | A separate certification for each principal executive officer and principal financial officer of the registrant as required by Rule 30a-2(a) under the 1940 Act (17 CFR 270.30a-2(a)) in the exact form set forth below: Ex-99.CERT Attached hereto. |
| (a)(3) | Any written solicitation to purchase securities under Rule 23c-1 under the 1940 Act (17 CFR 270.23c-1) sent or given during the period covered by the report by or on behalf of the registrant to 10 or more persons. Not applicable. |
| (b) | If the report is filed under Section 13(a) or 15(d) of the Exchange Act, provide the certifications required by Rule 30a-2(b) under the 1940 Act (17 CFR 270.30a-2(b)); Rule 13a-14(b) or Rule 15d-14(b) under the Exchange Act (17 CFR 240.13a-14(b) or 240.15d-14(b)), and Section 1350 of Chapter 63 of Title 18 of the United States Code (18 U.S.C. 1350) as an exhibit. A certification furnished pursuant to this paragraph will not be deemed “filed” for purposes of Section 18 of the Exchange Act (15 U.S.C. 78r), or otherwise subject to the liability of that section. Such certification will not be deemed to be incorporated by reference into any filing under the Securities Act of 1933 or the Exchange Act, except to the extent that the registrant specifically incorporates it by reference. Ex-99.906 CERT attached hereto. |
SIGNATURES
Pursuant to the requirements of the Securities Exchange Act of 1934 and the Investment Company Act of 1940, the registrant has duly caused this report to be signed on its behalf by the undersigned, thereunto duly authorized.
(Registrant) Nuveen Intermediate Duration Quality Municipal Term Fund
By (Signature and Title) /s/ Kevin J. McCarthy
Kevin J. McCarthy
Vice President and Secretary
Date: August 8, 2013
Pursuant to the requirements of the Securities Exchange Act of 1934 and the Investment Company Act of 1940, this report has been signed below by the following persons on behalf of the registrant and in the capacities and on the dates indicated.
By (Signature and Title) /s/ Gifford R. Zimmerman
Gifford R. Zimmerman
Chief Administrative Officer
(principal executive officer)
By (Signature and Title) /s/ Stephen D. Foy
Stephen D. Foy
Vice President and Controller
(principal financial officer)