Life is Complex.
Nuveen makes things e-simple.
It only takes a minute to sign up for e-Reports. Once enrolled, you’ll receive an e-mail as soon as your Nuveen Fund information is ready—no more waiting for delivery by regular mail. Just click on the link within the e-mail to see the report and save it on your computer if you wish.
Free e-Reports
right to your e-mail!
www.investordelivery.com
If you receive your Nuveen Fund
dividends and statements from your
financial professional or brokerage account.
or
www.nuveen.com/client-access
If you receive your Nuveen Fund
dividends and statements directly from
Nuveen.
NOT FDIC INSURED MAY LOSE
VALUE NO BANK GUARANTEE
3
Chair’s Letterto Shareholders Dear Shareholders,
As 2020 draws to a close, the concerns that dominated much of the year are beginning to show signs of easing. COVID-19 vaccines are being administered around the world, with several of the vaccine candidates announcing high efficacy rates during their phase 3 trials. Markets took a generally positive view of Joe Biden winning the Electoral College, with Congress’s final confirmation of the Electoral College vote on January 7, 2021. The U.S. economy has made a significant, although incomplete, turnaround from the depths of a historic recession. In late December, the U.S. government enacted another $900 billion in aid to individuals and businesses, extending some of the programs enacted earlier in the crisis. Ongoing fiscal and monetary stimulus along with widening vaccine distribution have bolstered confidence that a semblance of normalcy can return in 2021.
While the markets’ longer-term outlook has brightened, we expect intermittent bouts of volatility to continue into the New Year. COVID-19 cases are still alarmingly high in some regions, and the renewed restrictions on social and business activity taken by local and, in some cases, national authorities will undoubtedly hinder the economy’s momentum. The pandemic’s course can still be unpredictable. The timeline of vaccine rollouts depends on many variables, public confidence can shift and real-world efficacy remains to be seen. Additionally, after Democrats won both of Georgia’s Senate run-off elections, which provided them with a democratic majority (the Democratic Vice President-elect casts the tie breaking vote in a 50/50 split Senate), this changing political landscape may cause investment outlooks to shift. Nevertheless, short-term market fluctuations can provide opportunities to invest in new ideas as well as upgrade existing positioning, within our goal of providing long-term value for our shareholders.
The New Year can be an opportune time to assess your portfolio’s resilience and readiness for what may come next. We encourage you to review your time horizon, risk tolerance and investment goals with your financial professional. On behalf of the other members of the Nuveen Fund Board, we look forward to continuing to earn your trust in the months and years ahead.
Sincerely,
Terence J. Toth
Chair of the Board
January 21, 2021
4
Portfolio Managers’ CommentsNuveen Intermediate Duration Municipal Term Fund (NID)Nuveen Intermediate Duration Quality Municipal Term Fund (NIQ) These Funds feature portfolio management by Nuveen Asset Management, LLC (NAM), an affiliate of Nuveen Fund Advisors, LLC, the Funds’ investment adviser. Portfolio managers John V. Miller, CFA, Timothy T. Ryan, CFA, Steven M. Hlavin and Daniel J. Close, CFA, discuss key investment strategies and the six-month performance of these two Nuveen Funds. John, Tim and Steve have managed NID since its inception in December 2012 and Dan has managed NIQ since its inception in February 2013.
An Update on COVID-19 Coronavirus and its Impact on the Securities Markets
Renewed COVID-19 coronavirus outbreaks across the U.S. and Europe prompted tightening COVID-19 restrictions at the local and, in some cases, national levels during the fall of 2020, weighing on short-term economic indicators. Additionally, certain government programs supporting businesses and workers are expiring with little clarity on extensions or replacement options. In late December 2020 (subsequent to the close of this reporting period), the U.S. government approved a $900 billion relief package. In November 2020, three vaccine trials announced successful results, paving the way for selective distribution at year end 2020 and inoculation of the wider public during 2021.
Markets rallied on optimism for normalization in daily life and in the economy, furthering the recovery from the March 2020 sell-off. Although the detection of the virus in China was made public in December 2019, markets did not start to fully acknowledge the risks and potential economic impact until the latter portion of February 2020, when outbreaks outside of China were first reported. Global stock markets sold off severely, with the S&P 500® index reaching a bear market (a 20% drop from the previous high) within three weeks, the fastest bear market decline in history. Even certain parts of the bond market suffered; below investment grade municipal and corporate bonds generally dropped the furthest, mostly out of concerns for the continued financial stability of lower quality issuers. Demand for safe-haven assets, along with mounting recession fears, drove the yield on the 10-year U.S. Treasury note to 0.5% in March 2020, an all-time low. Additionally, oil prices collapsed to an 18-year low on supply glut concerns, as shutdowns across the global economy sharply reduced oil demand, although oil prices have recovered to well above those lows.
This material is not intended to be a recommendation or investment advice, does not constitute a solicitation to buy, sell or hold a security or an investment strategy and is not provided in a fiduciary capacity. The information provided does not take into account the specific objectives or circumstances of any particular investor, or suggest any specific course of action. Investment decisions should be made based on an investor’s objectives and circumstances and in consultation with his or her advisors.Certain statements in this report are forward-looking statements. Discussions of specific investments are for illustration only and are not intended as recommendations of individual investments. The forward-looking statements and other views expressed herein are those of the portfolio managers as of the date of this report. Actual future results or occurrences may differ significantly from those anticipated in any forward-looking statements, and the views expressed herein are subject to change at any time, due to numerous market and other factors. The Funds disclaim any obligation to update publicly or revise any forward-looking statements or views expressed herein.
For financial reporting purposes, the ratings disclosed are the highest rating given by one of the following national rating agencies: Standard & Poor’s Group (S&P), Moody’s Investors Service, Inc. (Moody’s) or Fitch, Inc. (Fitch). This treatment of split-rated securities may differ from that used for other purposes, such as for Fund investment policies. Credit ratings are subject to change. AAA, AA, A and BBB are investment grade ratings, while BB, B, CCC, CC, C and D are below investment grade ratings. Holdings designated N/R are not rated by these national rating agencies.
Bond insurance guarantees only the payment of principal and interest on the bond when due, and not the value of the bonds themselves, which will fluctuate with the bond market and the financial success of the issuer and the insurer. Insurance relates specifically to the bonds in the portfolio and not to the share prices of a Fund. No representation is made as to the insurers’ ability to meet their commitments.
Refer to the Glossary of Terms Used in this Report for further definition of the terms used within this section.
5
Portfolio Managers’ Comments (continued)
While most markets have recovered most of their losses, volatility will likely remain elevated until the health crisis itself is under control (via fewer new cases, lower infection rates and/or verified treatments or widespread vaccination). The situation remains fluid, given production and logistical challenges with rolling out the vaccine as well as public trust in it, and new information is incoming daily, compounding the difficulty of modeling outcomes for epidemiologists and economists alike.
Nuveen Fund Advisors, LLC, and our portfolio management teams are monitoring the situation carefully and continuously refining our views and approaches to managing the Funds to best pursue investment objectives while mitigating risks through all market environments.
What key strategies were used to manage the Funds during the six-month reporting period ended November 30, 2020?
The Funds’ primary investment objective is to provide a high level of current income exempt from regular federal income tax. The Funds’ secondary investment objective is to seek additional total return. NID has a 10-year term and intends to liquidate and distribute its then-current net assets to shareholders on or before March 31, 2023. NIQ has a 10-year term and intends to liquidate and distribute its then-current net assets to shareholders on or before June 30, 2023.
The broad municipal bond market performed well in the six-month reporting period, continuing its recovery from the COVID-19 crisis downturn earlier in 2020. Municipal yields declined meaningfully and credit spreads contracted, particularly in lower rated, higher yielding areas of the market, as investors grew more comfortable with the economic outlook and the prospects for municipal bonds in general. Positive sentiment was especially strong in the final month of the reporting period, with the election outcome suggesting that significant tax reform was unlikely and positive vaccine news spurring hope for wide distribution in 2021.
Management continues to take a bottom-up approach to discovering sectors that appeared undervalued as well as individual credits that we believed had the potential to perform well over the long term. NID’s trading was mainly driven by the reinvestment of coupon income and the proceeds of called and maturing bonds. There were several notable maturities during the reporting period including Navistar, PPL Energy, Guam Waterworks, Los Angeles County Tobacco Settlement and AK Steel. We bought bonds with the potential to perform well in an economic recovery that were trading at attractive credit spreads. These purchases spanned a diverse range of sectors and names such as New York Metropolitan Transportation Authority (MTA), American Airlines, United Airlines, U.S. Steel, Puerto Rico sales tax revenue (known as COFINAs), Ochsner Health (Louisiana) and South Jersey Port Marine Terminal. We also took advantage of prevailing market conditions earlier in the reporting period to do some tax loss swaps. This tactic entailed selling depreciated bonds with lower yields and buying similarly structured but higher yielding bonds. We implemented this approach to enhance the Fund’s income earning capability and seek to make the Fund more tax efficient.
NIQ added bonds across a range of sectors, in particular taking advantage of attractive credit spreads in the new issue market. We bought two tobacco deals (Los Angeles County Tobacco Settlement and Michigan Tobacco Settlement), airport revenue bonds for Port of Portland, a dedicated tax bond for Broward County (Florida) Half-Cent Sales Tax Revenue, a New York City local general obligation (GO) bond, a toll road issue for Central Texas Regional Mobility Partners and New York MTA bonds. The purchases were largely funded with the proceeds from maturing and called bonds. We also sold a pre-refunded bond and a position we bought in the mid-/late-summer 2020 that had depreciated due to yield curve movements.
As of November 30, 2020, both Funds continued to use inverse floating rate securities. We employ inverse floaters for a variety of reasons, including duration management, income enhancement and total return enhancement. As part of our duration manage-
6
ment strategies, NID entered into interest rate swap agreements and shorted interest rate futures contracts to help reduce price volatility risk due to movements in U.S. interest rates relative to the Fund’s benchmark. We have allowed the positions to roll off over time, reducing the amount of hedging in the portfolio. The futures contracts had a negligible impact on NID’s performance in this reporting period.
How did NID and NIQ perform during the six-month reporting period ended November 30, 2020?
The tables in each Fund’s Performance Overview and Holding Summaries section of this report provide the Funds’ total returns at net asset value (NAV) for the period ended November 30, 2020. Each Fund’s total returns at common share NAV are compared with the performance of a corresponding market index.
For the six months ended November 30, 2020, the total returns at common share NAV for NID outperformed the return for the S&P Municipal Bond Index but underperformed the S&P Intermediate Duration Municipal Yield Index, and NIQ outperformed the returns for both the S&P Municipal Bond Index and the S&P Municipal Bond Intermediate Index. Please see Glossary of Terms for index definitions.
The main factors influencing the Funds’ relative performance during this reporting period were duration and yield curve positioning, credit ratings allocations, sector positioning and credit selection. In addition, the use of regulatory leverage was an important factor affecting the performance of the Funds. Leverage is discussed in more detail later in the Fund Leverage section of this report.
Duration and yield curve positioning was a positive contributor for the two Funds. The Funds’ longer duration profiles relative to their benchmarks were beneficial at a time when municipal bond yields and municipal high yield spreads were both falling. Although NIQ held an overweight allocation to the 0- to 2-year duration category, which was somewhat detrimental, the outperformance of its overweight allocations to durations of 10- to 12-years and 12-years and longer more than compensated.
Credit quality allocation was a non-factor in NID’s relative performance in this reporting period because the ratings allocations closely matched that of the benchmark. NIQ strongly benefited from its credit quality positioning. NIQ’s overweight to A and BBB rated bonds and underweight to AAA and AA rated paper was advantageous as lower rated credits outperformed high grade bonds in this reporting period.
Sector positioning worked against the Funds in this reporting period. NID’s underperformance relative to the S&P Intermediate Duration Municipal Yield Index was almost entirely driven by sector allocations. NID’s overweight to hospitals was the largest sector level detractor, as credit spreads have not yet fully recovered in this COVID sensitive sector. Underweight allocations to the transportation and higher education sectors also detracted. Although these sectors were also among the more COVID sensitive areas of the market, they outperformed in this reporting period. Puerto Rico was another strong performing sector, but NID’s underweight to Puerto Rico bonds detracted from performance despite strong security selection there. NID’s overweight to the outperforming tobacco sector was advantageous and further enhanced by our favorable credit selection there. An underweight to local GOs was beneficial as the local GO sector lagged due to its higher quality. Like NID, NIQ was also negatively affected by sector allocations. Namely, underweight allocations to the “other transportation” sector, which is primarily the New York MTA bonds, and the industrial development revenue (IDR) sector detracted from NIQ’s relative performance, as these sectors performed well.
7
Portfolio Managers’ Comments (continued)
NID’s credit selection was positive, with our selections in New Jersey appropriate debt and IDR bonds (including Big River Steel, U.S. Steel, several airlines and Iowa Fertilizer) outperforming. NIQ also benefited from individual credit selection, with its tender option bond positions adding to performance and outperformance from lower rated, longer dated credits. However, a position in Energy Harbor common stock somewhat detracted from both Funds’ performance. The Funds acquired shares in Energy Harbor when their holdings of certain municipal bonds issued by FirstEnergy Solutions were converted into Energy Harbor equity as part of FirstEnergy Solution’s emergence from bankruptcy protection. The share price appreciated strongly post its March 2020 issuance, which increased both the size of each Fund’s position and its impact to performance. In July 2020, the stock suffered a correction on negative headline news about the predecessor company and its former parent company.
8
IMPACT OF THE FUNDS’ LEVERAGE STRATEGIES ON PERFORMANCE
One important factor impacting the returns of the Funds’ common shares relative to their comparative benchmarks was the Funds’ use of leverage through their issuance of preferred shares and/or investments in inverse floating rate securities, which represent leveraged investments in underlying bonds. The Funds use leverage because our research has shown that, over time, leveraging provides opportunities for additional income. The opportunity arises when short-term rates that a Fund pays on its leveraging instruments are lower than the interest a Fund earns on its portfolio of long-term bonds that it has bought with the proceeds of that leverage. This has been particularly true in the recent market environment where short-term rates have been low by historical standards.
However, use of leverage can expose Fund common shares to additional price volatility. When a Fund uses leverage, the Fund’s common shares will experience a greater increase in their net asset value if the municipal bonds acquired through the use of leverage increase in value, but will also experience a correspondingly larger decline in their net asset value if the bonds acquired through leverage decline in value. All this will make the shares’ total return performance more variable over time.
In addition, common share income in levered funds will typically decrease in comparison to unlevered funds when short-term interest rates increase and increase when short-term interest rates decrease. In recent quarters, fund leverage expenses have generally tracked the overall movement of short-term tax-exempt interest rates. While fund leverage expenses are somewhat higher than their recent lows, leverage nevertheless continues to provide the opportunity for incremental common share income, particularly over longer-term periods.
Leverage had a positive impact on the total return performance of the Funds over the reporting period.
As of November 30, 2020, the Funds’ percentages of leverage are as shown in the accompanying table.
| | | |
| NID | NIQ |
Effective Leverage* | 37.20% | 34.84% |
Regulatory Leverage* | 20.96% | 22.17% |
* | Effective Leverage is a Fund’s effective economic leverage, and includes both regulatory leverage and the leverage effects of certain derivative and other investments in a Fund’s portfolio that increase the Fund’s investment exposure. Currently, the leverage effects of Tender Option Bond (TOB) inverse floater holdings are included in effective leverage values, in addition to any regulatory leverage. Regulatory leverage consists of preferred shares issued or borrowings of a Fund. Both of these are part of a Fund’s capital structure. A Fund, however, may from time to time borrow on a typically transient basis in connection with its day-to-day operations, primarily in connection with the need to settle portfolio trades. Such incidental borrowings are excluded from the calculation of a Fund’s effective leverage ratio. Regulatory leverage is subject to asset coverage limits set forth in the Investment Company Act of 1940. |
9
Fund Leverage (continued)
THE FUNDS’ REGULATORY LEVERAGE
As of November 30, 2020, the Funds have issued and outstanding preferred shares as shown in the accompanying table.
| | | | |
| | Variable Rate | |
| Variable Rate | Remarketed | |
| Preferred* | Preferred** | |
| Shares | Shares | |
| Issued at | Issued at | |
| Liquidation | Liquidation | |
| Preference | Preference | Total |
NID | $175,000,000 | $ — | $175,000,000 |
NIQ | $ 55,000,000 | $ — | $ 55,000,000 |
* | Preferred shares of the Fund featuring a floating rate dividend based on a predetermined formula or spread to an index rate. Includes the following preferred shares AMTP, iMTP, MFP-VRM and VRDP in Special Rate Mode, where applicable. See Notes to Financial Statements, Note 5 – Fund Shares for further details. |
** | Preferred shares of the Fund featuring floating rate dividends set by a remarketing agent via a regular remarketing. Includes the following preferred shares VRDP not in Special Rate Mode, MFP- VRRM and MFP-VRDM, where applicable. See Notes to Financial Statements, Note 5 – Fund Shares for further details. |
Refer to Notes to Financial Statements, Note 5 – Fund Shares for further details on preferred shares and each Funds’ respective transactions.
10
COMMON SHARE DISTRIBUTION INFORMATION
The following information regarding the Funds’ distributions is current as of November 30, 2020. Each Fund’s distribution levels may vary over time based on each Fund’s investment activity and portfolio investment value changes.
During the current reporting period, each Fund’s distributions to common shareholders were as shown in the accompanying table.
| | | | | | | |
| | | Per Common | |
| | | Share Amounts | |
| Month Distributions (Ex-Dividend Date) | | NID | | | NIQ | |
June 2020 | | $ | 0.0425 | | | $ | 0.0355 | |
July | | | 0.0425 | | | | 0.0355 | |
August | | | 0.0425 | | | | 0.0355 | |
September | | | 0.0425 | | | | 0.0355 | |
October | | | 0.0440 | | | | 0.0395 | |
November 2020 | | | 0.0440 | | | | 0.0395 | |
| Total Distributions from Net Investment Income | | $ | 0.2580 | | | $ | 0.2210 | |
| Yields | | | | | | | | |
Market Yield* | | | 3.84 | % | | | 3.26 | % |
Taxable-Equivalent Yield* | | | 6.47 | % | | | 5.50 | % |
* | Market Yield is based on the Fund’s current annualized monthly dividend divided by the Fund’s current market price as of the end of the reporting period. Taxable-Equivalent Yield represents the yield that must be earned on a fully taxable investment in order to equal the yield of the Fund on an after-tax basis. It is based on an income tax rate of 40.8%. Your actual federal income tax rate may differ from the assumed rate. The Taxable-Equivalent Yield also takes into account the percentage of the Fund’s income generated and paid by the Fund (based on payments made during the previous calendar year) that was not exempt from federal income tax. Separately, if the comparison were instead to investments that generate qualified dividend income, which is taxable at a rate lower than an individual’s ordinary graduated tax rate, the fund’s Taxable-Equivalent Yield would be lower. |
Each Fund seeks to pay regular monthly dividends out of its net investment income at a rate that reflects its past and projected net income performance. To permit each Fund to maintain a more stable monthly dividend, the Fund may pay dividends at a rate that may be more or less than the amount of net income actually earned by the Fund during the period. Distributions to common shareholders are determined on a tax basis, which may differ from amounts recorded in the accounting records. In instances where the monthly dividend exceeds the earned net investment income, the Fund would report a negative undistributed net ordinary income. Refer to Note 6 – Income Tax Information for additional information regarding the amounts of undistributed net ordinary income and undistributed net long-term capital gains and the character of the actual distributions paid by the Fund during the period.
All monthly dividends paid by each Fund during the current reporting period were paid from net investment income. If a portion of the Fund’s monthly distributions is sourced from or comprised of elements other than net investment income, including capital gains and/or a return of capital, shareholders will be notified of those sources. For financial reporting purposes, per share amounts of each Fund’s distributions for the reporting period are presented in this report’s Financial Highlights. For income tax purposes, distribution information for each Fund as of its most recent tax year end is presented in Note 6 — Income Tax Information within the Notes to Financial Statements of this report.
11
Common Share Information (continued)
NUVEEN CLOSED-END FUND DISTRIBUTION AMOUNTS
The Nuveen Closed-End Funds’ monthly and quarterly periodic distributions to shareholders are posted on www.nuveen.com and can be found on Nuveen’s enhanced closed-end fund resource page, which is at https://www.nuveen.com/resource-center-closed-end funds, along with other Nuveen closed-end fund product updates. To ensure timely access to the latest information, shareholders may use a subscribe function, which can be activated at this web page (https://www.nuveen.com/subscriptions).
COMMON SHARE REPURCHASES
During August 2020, the Funds’ Board of Trustees reauthorized an open-market share repurchase program, allowing each Fund to repurchase an aggregate of up to approximately 10% of its outstanding common shares.
As of November 30, 2020, and since the inception of the Funds’ repurchase programs, the Funds have cumulatively repurchased and retired their outstanding common shares as shown in the accompanying table.
| | | |
| NID | NIQ |
Common shares cumulatively repurchased and retired | — | — |
Common shares authorized for repurchase | 4,690,000 | 1,310,000 |
During the current reporting period, the Funds did not repurchase any of their outstanding common shares.
OTHER COMMON SHARE INFORMATION
As of November 30, 2020, and during the current reporting period, the Funds’ common share prices were trading at a premium/ (discount) to their common share NAVs as shown in the accompanying table.
| | | | | | | |
| | NID | | | NIQ | |
Common share NAV | | $ | 14.07 | | | $ | 14.75 | |
Common share price | | $ | 13.75 | | | $ | 14.54 | |
Premium/(Discount) to NAV | | | (2.27 | )% | | | (1.42 | )% |
6-month average premium/(discount) to NAV | | | (4.05 | )% | | | (2.46 | )% |
12
Fund shares are not guaranteed or endorsed by any bank or other insured depository institution, and are not federally insured by the Federal Deposit Insurance Corporation.
Nuveen Intermediate Duration Municipal Term Fund (NID)
Investing in closed-end funds involves risk; principal loss is possible. There is no guarantee the Fund’s investment objectives will be achieved. Closed-end fund shares may frequently trade at a discount or premium to their net asset value. Debt or fixed income securities such as those held by the Fund, are subject to market risk, credit risk, interest rate risk, derivatives risk, liquidity risk, and income risk. As interest rates rise, bond prices fall. Lower credit debt securities may be more likely to fail to make timely interest or principal payments. Leverage increases return volatility and magnifies the Fund’s potential return and its risks; there is no guarantee a fund’s leverage strategy will be successful. For these and other risks, including the Fund’s limited term and inverse floater risk, see the Fund’s web page at www.nuveen.com/NID.
Nuveen Intermediate Duration Quality Municipal Term Fund (NIQ)
Investing in closed-end funds involves risk; principal loss is possible. There is no guarantee the Fund’s investment objectives will be achieved. Closed-end fund shares may frequently trade at a discount or premium to their net asset value. Debt or fixed income securities such as those held by the Fund, are subject to market risk, credit risk, interest rate risk, derivatives risk, liquidity risk, and income risk. As interest rates rise, bond prices fall. Leverage increases return volatility and magnifies the Fund’s potential return and its risks; there is no guarantee a fund’s leverage strategy will be successful. For these and other risks, including the Fund’s limited term and inverse floater risk, see the Fund’s web page at www.nuveen.com/NIQ.
13
| | |
| NID | Nuveen Intermediate Duration Municipal Term Fund Performance Overview and Holding Summaries as of November 30, 2020 |
| | | | | |
Refer to the Glossary of Terms Used in this Report for further definition of the terms used within this section. |
| Average Annual Total Returns as of November 30, 2020 |
|
| Cumulative | Average Annual |
| | | | Since |
| 6-Month | 1-Year | 5-Year | Inception |
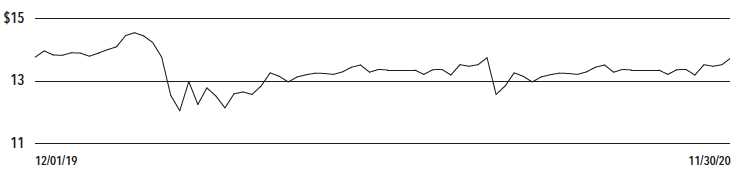
NID at Common Share NAV | 5.00% | 2.01% | 4.85% | 4.25% |
NID at Common Share Price | 5.63% | 4.12% | 6.38% | 3.65% |
S&P Intermediate Duration Municipal Yield Index | 5.75% | 3.66% | 4.59% | 4.45% |
S&P Municipal Bond Index | 3.12% | 4.68% | 3.85% | 3.35% |
Since inception returns are from 12/05/12. Past performance is not predictive of future results. Current performance may be higher or lower than the data shown. Returns do not reflect the deduction of taxes that shareholders may have to pay on Fund distributions or upon the sale of Fund shares. Returns at NAV are net of Fund expenses, and assume reinvestment of distributions. Comparative index return information is provided for the Fund’s shares at NAV only. Indexes are not available for direct investment.
Common Share Price Performance — Weekly Closing Price
14
This data relates to the securities held in the Fund’s portfolio of investments as of the end of the reporting period. It should not be construed as a measure of performance for the Fund itself. Holdings are subject to change.
For financial reporting purposes, the ratings disclosed are the highest rating given by one of the following national rating agencies: Standard & Poor’s Group, Moody’s Investors Service, Inc. or Fitch, Inc. This treatment of split-rated securities may differ from that used for other purposes, such as for Fund investment policies. Credit ratings are subject to change. AAA, AA, A and BBB are investment grade ratings; BB, B, CCC, CC, C and D are below-investment grade ratings. Holdings designated N/R are not rated by these national rating agencies.
| | |
| Fund Allocation | |
| (% of net assets) | |
Long-Term Municipal Bonds | 126.4% |
Common Stocks | 3.3% |
Other Assets Less Liabilities | 1.5% |
| Net Assets Plus Floating Rate | |
| Obligations & AMTP Shares, | |
| net of deferred offering costs | 131.2% |
Floating Rate Obligations | (4.7)% |
AMTP Shares, net of deferred | |
| offering costs | (26.5)% |
| Net Assets | 100% |
| | |
| Portfolio Credit Quality | |
| (% of total investment exposure) | |
U.S. Guaranteed | 6.2% |
AAA | 0.2% |
AA | 23.0% |
A | 11.1% |
BBB | 25.5% |
BB or Lower | 17.6% |
N/R (not rated) | 14.3% |
N/A (not applicable) | 2.1% |
| Total | 100% |
| | |
| Portfolio Composition | |
| (% of total investments) | |
Tax Obligation/Limited | 23.9% |
Transportation | 16.3% |
Health Care | 12.8% |
Tax Obligation/General | 11.7% |
Consumer Staples | 8.4% |
Utilities | 8.4% |
Education and Civic Organizations | 5.1% |
Other | 13.4% |
| Total | 100% |
| | |
| States and Territories | |
| (as a % of total investments) | |
Illinois | 14.3% |
New York | 10.8% |
California | 10.4% |
New Jersey | 8.4% |
Florida | 7.2% |
Pennsylvania | 4.4% |
Texas | 3.3% |
Michigan | 3.1% |
Ohio | 3.1% |
Guam | 2.5% |
Puerto Rico | 2.5% |
Wisconsin | 2.3% |
Colorado | 2.2% |
Washington | 2.2% |
Indiana | 1.9% |
Iowa | 1.9% |
Other1 | 19.5% |
| Total | 100% |
1 See Portfolio of Investments for details on “other” States and Territories.
15
| | |
| NIQ | Nuveen Intermediate Duration Quality Municipal Term Fund Performance Overview and Holding Summaries as of November 30, 2020 |
| | | | | |
Refer to the Glossary of Terms Used in this Report for further definition of the terms used within this section. |
| Average Annual Total Returns as of November 30, 2020 |
|
| Cumulative | Average Annual |
| | | | Since |
| 6-Month | 1-Year | 5-Year | Inception |
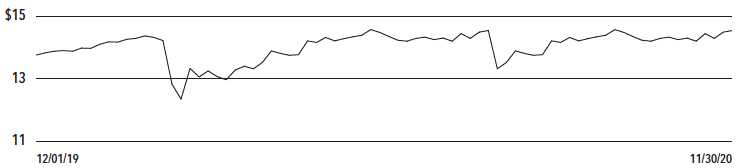
NIQ at Common Share NAV | 4.28% | 4.74% | 4.48% | 3.95% |
NIQ at Common Share Price | 6.30% | 8.92% | 6.36% | 8.42% |
S&P Municipal Bond Intermediate Index | 2.64% | 4.88% | 3.67% | 3.36% |
S&P Municipal Bond Index | 3.12% | 4.68% | 3.85% | 3.52% |
Since inception returns are from 2/07/13. Past performance is not predictive of future results. Current performance may be higher or lower than the data shown. Returns do not reflect the deduction of taxes that shareholders may have to pay on Fund distributions or upon the sale of Fund shares. Returns at NAV are net of Fund expenses, and assume reinvestment of distributions. Comparative index return information is provided for the Fund’s shares at NAV only. Indexes are not available for direct investment.
Common Share Price Performance — Weekly Closing Price
16
This data relates to the securities held in the Fund’s portfolio of investments as of the end of the reporting period. It should not be construed as a measure of performance for the Fund itself. Holdings are subject to change.
For financial reporting purposes, the ratings disclosed are the highest rating given by one of the following national rating agencies: Standard & Poor’s Group, Moody’s Investors Service, Inc. or Fitch, Inc. This treatment of split-rated securities may differ from that used for other purposes, such as for Fund investment policies. Credit ratings are subject to change. AAA, AA, A and BBB are investment grade ratings; BB, B, CCC, CC, C and D are below-investment grade ratings. Holdings designated N/R are not rated by these national rating agencies.
| | |
| Fund Allocation | |
| (% of net assets) | |
Long-Term Municipal Bonds | 124.3% |
Common Stocks | 1.2% |
Other Assets Less Liabilities | 2.9% |
| Net Assets Plus Floating Rate | |
| Obligations & AMTP Shares, | |
| net of deferred offering costs | 128.4% |
AMTP Shares, net of deferred | |
| offering costs | (28.4)% |
| Net Assets | 100% |
| | |
| Portfolio Credit Quality | |
| (% of total investment exposure) | |
U.S. Guaranteed | 8.8% |
AA | 32.0% |
A | 30.4% |
BBB | 20.2% |
BB or Lower | 3.8% |
N/R (not rated) | 4.0% |
N/A (not applicable) | 0.8% |
| Total | 100% |
| | |
| Portfolio Composition | |
| (% of total investments) | |
Utilities | 29.0% |
Tax Obligation/Limited | 16.3% |
Health Care | 15.8% |
Transportation | 15.0% |
Education and Civic Organizations | 8.9% |
Tax Obligation/General | 7.7% |
Other | 7.3% |
| Total | 100% |
| | |
| States and Territories | |
| (as a % of total investments) | |
Colorado | 11.7% |
California | 8.5% |
Illinois | 8.4% |
Tennessee | 6.8% |
Texas | 6.2% |
Florida | 6.1% |
Michigan | 5.8% |
New York | 5.2% |
New Jersey | 3.5% |
Kentucky | 2.7% |
Pennsylvania | 2.7% |
Maine | 2.3% |
Nebraska | 2.1% |
Nevada | 2.0% |
Ohio | 1.9% |
South Carolina | 1.8% |
Virginia | 1.8% |
Alabama | 1.7% |
Other1 | 18.8% |
| Total | 100% |
1 See Portfolio of Investments for details on “other” States and Territories.
17
| | |
| NID | Nuveen Intermediate Duration Municipal Term Fund Portfolio of Investments November 30, 2020 (Unaudited) |
| | | | | | |
| Principal | | | Optional Call | | |
| Amount (000) | | Description (1) | Provisions (2) | Ratings (3) | Value |
| | LONG-TERM INVESTMENTS – 129.7% (100.0% of Total Investments) | | | |
| | MUNICIPAL BONDS – 126.4% (97.5% of Total Investments) | | | |
| | Alabama – 0.1% (0.1% of Total Investments) | | | |
| $ 755 | | Hoover Industrial Development Board, Alabama, Environmental Improvement Revenue Bonds, | 10/29 at 100.00 | B– | $ 688,643 |
| | United States Steel Corporation Project, Series 2019, 5.750%, 10/01/49 (AMT) | | | |
| | Alaska – 0.4% (0.3% of Total Investments) | | | |
| | Northern Tobacco Securitization Corporation, Alaska, Tobacco Settlement Asset-Backed | | | |
| | Bonds, Series 2006A: | | | |
| 2,000 | | 5.000%, 6/01/32 | 12/20 at 100.00 | B3 | 2,000,840 |
| 350 | | 5.000%, 6/01/46 | 12/20 at 100.00 | B3 | 351,771 |
| 2,350 | | Total Alaska | | | 2,352,611 |
| | Arizona – 1.1% (0.8% of Total Investments) | | | |
| 2,000 | | Arizona Health Facilities Authority, Hospital System Revenue Bonds, Phoenix Children’s | 2/22 at 100.00 | A1 | 2,103,000 |
| | Hospital, Refunding Series 2012A, 5.000%, 2/01/27 | | | |
| 680 | | Estrella Mountain Ranch Community Facilities District, Goodyear City, Arizona, Special | 7/25 at 100.00 | N/R | 612,354 |
| | Assessment Revenue Bonds, Montecito Assessment District 2, Series 2015, 4.750%, 7/01/30, 144A | | | |
| 665 | | Florence Town Inc, Industrial Development Authority, Arizona, Education Revenue Bonds, | No Opt. Call | BB+ | 692,192 |
| | Legacy Traditional School Project – Queen Creek and Casa Grande Campuses, Series 2013, | | | |
| | 5.000%, 7/01/23 | | | |
| 2,000 | | Phoenix Civic Improvement Corporation, Arizona, Rental Car Facility Charge Revenue | 7/29 at 100.00 | A3 | 2,382,240 |
| | Bonds, Series 2019A, 5.000%, 7/01/32 | | | |
| 75 | | Phoenix Industrial Development Authority, Arizona, Education Facility Revenue Bonds, | 7/21 at 100.00 | N/R (4) | 77,519 |
| | Great Hearts Academies – Veritas Project, Series 2012, 6.250%, 7/01/32 (Pre-refunded 7/01/21) | | | |
| 290 | | Phoenix Industrial Development Authority, Arizona, Education Facility Revenue Bonds, | 7/25 at 100.00 | BB+ | 306,997 |
| | Legacy Traditional Schools Projects, Series 2015, 5.000%, 7/01/45, 144A | | | |
| 1,000 | | Phoenix Industrial Development Authority, Arizona, Lease Revenue Bonds, Guam Facilities | 2/24 at 100.00 | B+ | 1,027,710 |
| | Foundation, Inc Project, Series 2014, 5.125%, 2/01/34 | | | |
| 6,710 | | Total Arizona | | | 7,202,012 |
| | Arkansas – 0.4% (0.3% of Total Investments) | | | |
| 2,665 | | Arkansas Development Finance Authority, Industrial Development Revenue Bonds, Big River | 9/26 at 103.00 | B | 2,810,642 |
| | Steel Project, Series 2019, 4.500%, 9/01/49 (AMT), 144A | | | |
| | California – 13.5% (10.4% of Total Investments) | | | |
| 1,850 | | Alameda Corridor Transportation Authority, California, Revenue Bonds, Refunding Second | 10/26 at 100.00 | AA | 2,075,866 |
| | Subordinate Lien Series 2016B, 4.000%, 10/01/35 – AGM Insured | | | |
| 2,490 | | Alvord Unified School District, Riverside County, California, General Obligation Bonds, | No Opt. Call | AA | 6,023,559 |
| | Tender Option Bond Trust 2016-XG0089, Formerly Tender Option Bond Trust 3306, 26.797%, | | | |
| | 8/01/30, 144A (IF) (5) | | | |
| 620 | | Antelope Valley Healthcare District, California, Revenue Bonds, Series 2011A, 6.875%, | 3/21 at 100.00 | N/R (4) | 630,112 |
| | 3/01/26 (Pre-refunded 3/01/21) | | | |
| 750 | | Bay Area Toll Authority, California, Revenue Bonds, San Francisco Bay Area Toll Bridge, | 1/21 at 100.00 | AA | 795,630 |
| | Tender Option Bond Trust 2016-XG0019, Formerly Tender Option Bond Trust 4740, 3.359%, | | | |
| | 4/01/36, 144A (IF) (5) | | | |
| 3,440 | | California Community Housing Agency, California, Essential Housing Revenue Bonds, | 2/30 at 100.00 | N/R | 3,894,183 |
| | Serenity at Larkspur Apartments, Series 2020A, 5.000%, 2/01/50, 144A | | | |
| 10 | | California Housing Finance Agency, Municipal Certificate Revenue Bonds, Class A Series | No Opt. Call | BBB+ | 11,001 |
| | 2019-2, 4.000%, 3/20/33 | | | |
| | California Municipal Finance Authority, Revenue Bonds, NorthBay Healthcare Group, Series | | | |
| | 2017A: | | | |
| 1,095 | | 5.250%, 11/01/29 | 11/26 at 100.00 | BBB– | 1,296,349 |
| 1,140 | | 5.000%, 11/01/30 | 11/26 at 100.00 | BBB– | 1,318,752 |
18
| | | | | | |
| Principal | | | Optional Call | | |
| Amount (000) | | Description (1) | Provisions (2) | Ratings (3) | Value |
| | California (continued) | | | |
| $ 1,000 | | California Pollution Control Financing Authority, Water Furnishing Revenue Bonds, | 7/22 at 100.00 | BBB | $ 1,048,990 |
| | Poseidon Resources Channelside LP Desalination Project, Series 2012, 5.000%, 11/21/45 | | | |
| | (AMT), 144A | | | |
| | California Statewide Communities Development Authority, California, Revenue Bonds, Loma | | | |
| | Linda University Medical Center, Series 2014A: | | | |
| 500 | | 5.250%, 12/01/29 | 12/24 at 100.00 | BB | 559,025 |
| 2,500 | | 5.250%, 12/01/34 | 12/24 at 100.00 | BB | 2,765,300 |
| 2,500 | | 5.250%, 12/01/44 | 12/24 at 100.00 | BB | 2,718,000 |
| 1,713 | | 5.500%, 12/01/54 | 12/24 at 100.00 | BB | 1,873,594 |
| 2,300 | | California Statewide Communities Development Authority, California, Revenue Bonds, Loma | 6/26 at 100.00 | BB | 2,645,759 |
| | Linda University Medical Center, Series 2016A, 5.000%, 12/01/27, 144A | | | |
| 2,765 | | California Statewide Community Development Authority, Certificates of Participation, | 1/28 at 100.00 | BBB+ | 2,987,970 |
| | Methodist Hospital of Southern California, Series 2018, 4.250%, 1/01/43 | | | |
| 5,000 | | Compton Community Redevelopment Agency, California, Tax Allocation Revenue Bonds, | 12/20 at 100.00 | N/R | 5,018,500 |
| | Redevelopment Projects, Second Lien Series 2010B, 5.750%, 8/01/26 | | | |
| 3,000 | | Foothill/Eastern Transportation Corridor Agency, California, Toll Road Revenue Bonds, | No Opt. Call | AA | 3,432,330 |
| | Refunding Series 2013A, 0.000%, 1/15/29 – AGM Insured (6) | | | |
| | Golden State Tobacco Securitization Corporation, California, Tobacco Settlement | | | |
| | Asset-Backed Bonds, Series 2018A-1: | | | |
| 2,000 | | 5.000%, 6/01/30 | 6/28 at 100.00 | BBB | 2,515,600 |
| 3,260 | | 5.000%, 6/01/32 | 6/28 at 100.00 | BBB | 4,055,766 |
| 5,290 | | 5.000%, 6/01/33 | 6/28 at 100.00 | BBB | 6,547,539 |
| 3,805 | | 5.000%, 6/01/34 | 6/28 at 100.00 | BBB– | 4,678,742 |
| 1,415 | | 5.000%, 6/01/35 | 6/28 at 100.00 | BB+ | 1,733,460 |
| 2,235 | | 3.500%, 6/01/36 | 6/22 at 100.00 | BB– | 2,276,660 |
| 100 | | Indio Redevelopment Agency, California, Tax Allocation Bonds, Merged Area Redevelopment | 12/20 at 100.00 | A | 100,389 |
| | Project, Subordinate Lien Refunding Series 2008A, 5.000%, 8/15/23 | | | |
| 2,315 | | Lake Elsinore Public Financing Authority, California, Local Agency Revenue Bonds, | 9/25 at 100.00 | N/R | 2,625,534 |
| | Refunding Series 2015, 5.000%, 9/01/35 | | | |
| 250 | | National City Community Development Commission, California, Tax Allocation Bonds, | 8/21 at 100.00 | A (4) | 261,233 |
| | National City Redevelopment Project, Series 2011, 7.000%, 8/01/32 (Pre-refunded 8/01/21) | | | |
| 4,100 | | Natomas Unified School District, Sacramento County, California, General Obligation | 8/26 at 100.00 | AA | 4,309,059 |
| | Bonds, Election 2018, Series 2019, 3.000%, 8/01/46 – AGM Insured (UB) (5) | | | |
| 700 | | Redwood City, California, Special Tax Refunding Bonds, Redwood Shores Community | 9/22 at 100.00 | N/R | 741,762 |
| | Facilities District 99-1, Shores Transportation Improvement Project, Series 2012B, | | | |
| | 5.000%, 9/01/29 | | | |
| 1,975 | | Riverside County Redevelopment Agency Successor Agency, California, Tax Allocation | 10/24 at 100.00 | AA | 2,260,447 |
| | Bonds, Refunding Series 2014A, 5.000%, 10/01/34 – AGM Insured | | | |
| 85 | | Riverside County, California, Special Tax Bonds, Community Facilities District 05-8 | No Opt. Call | N/R | 87,170 |
| | Scott Road, Series 2013, 4.000%, 9/01/21 | | | |
| 500 | | Roseville, California, Special Tax Bonds, Community Facilities District 1 Westbrook, | 9/24 at 100.00 | N/R | 564,195 |
| | Series 2014, 5.000%, 9/01/29 | | | |
| 2,395 | | San Bernardino Joint Powers Financing Authority, California, Tax Allocation Bonds, | No Opt. Call | AA | 2,871,509 |
| | Series 2005A, 5.750%, 10/01/24 – AGM Insured | | | |
| 440 | | San Buenaventura, California, Revenue Bonds, Community Memorial Health System, Series | 12/21 at 100.00 | BB | 465,854 |
| | 2011, 7.500%, 12/01/41 | | | |
| 1,500 | | Tejon Ranch Public Facilities Financing Authority, California, Special Tax Bonds, | 3/23 at 100.00 | N/R | 1,600,080 |
| | Community Facilities District 2008-1 Tejon Industrial Complex East 2012A, 5.000%, 9/01/32 | | | |
| 1,500 | | Tejon Ranch Public Facilities Financing Authority, California, Special Tax Bonds, | 3/23 at 100.00 | N/R | 1,600,080 |
| | Community Facilities District 2008-1 Tejon Industrial Complex East 2012B, 5.000%, 9/01/32 | | | |
| 10,000 | | Tobacco Securitization Authority of Northern California, Tobacco Settlement Asset-Backed | 12/20 at 100.00 | B | 10,047,700 |
| | Bonds, Refunding Series 2005A-2, 5.400%, 6/01/27 | | | |
| 880 | | Tobacco Securitization Authority of Northern California, Tobacco Settlement Asset-Backed | 12/20 at 100.00 | Baa1 | 881,531 |
| | Bonds, Series 2005A-1, 4.750%, 6/01/23 | | | |
| 77,418 | | Total California | | | 89,319,230 |
19
| | |
| NID | Nuveen Intermediate Duration Municipal Term Fund Portfolio of Investments (continued) November 30, 2020 (Unaudited) |
| | | | | | |
| Principal | | | Optional Call | | |
| Amount (000) | | Description (1) | Provisions (2) | Ratings (3) | Value |
| | Colorado – 2.9% (2.2% of Total Investments) | | | |
| | Colorado Bridge Enterprise, Revenue Bonds, Central 70 Project, Senior Series 2017: | | | |
| $ 750 | | 4.000%, 12/31/30 (AMT) | 12/27 at 100.00 | A– | $ 858,045 |
| 250 | | 4.000%, 6/30/31 (AMT) | 12/27 at 100.00 | A– | 285,410 |
| 645 | | Colorado Educational and Cultural Facilities Authority, Charter School Refunding Revenue | 6/23 at 100.00 | A+ | 698,161 |
| | Bonds, Pinnacle Charter School, Inc K-8 Facility Project, Series 2013, 5.000%, 6/01/29 | | | |
| 50 | | Colorado Educational and Cultural Facilities Authority, Charter School Revenue Bonds, | No Opt. Call | BB+ | 51,171 |
| | Littleton Preparatory Charter School, Series 2013, 5.000%, 12/01/22 | | | |
| 851 | | Colorado Housing and Finance Authority, Revenue Bonds, Confluence Energy LLC Project, | No Opt. Call | N/R | 11,747 |
| | Series 2017, 6.875%, 10/01/27 (AMT) (7), (8) | | | |
| 3,270 | | Colorado Springs, Colorado, Utilities System Revenue Bonds, Tender Option Bond Trust | 11/22 at 100.00 | AA+ | 4,102,084 |
| | 2015-XF0223, 14.041%, 11/15/30, 144A (IF) (5) | | | |
| | Colorado State Board of Governors, Colorado State University Auxiliary Enterprise System | | | |
| | Revenue Bonds, Tender Option Bond Trust 2016-XF2354, Formerly Tender Option Bond Trust 3316: | | | |
| 100 | | 22.093%, 3/01/25, 144A (IF) (5) | No Opt. Call | AA | 195,477 |
| 300 | | 22.093%, 3/01/26, 144A (IF) (5) | No Opt. Call | AA | 649,257 |
| 430 | | 22.043%, 3/01/27, 144A (IF) (5) | No Opt. Call | AA | 1,005,710 |
| 725 | | 22.093%, 3/01/28, 144A (IF) (5) | No Opt. Call | AA | 1,810,543 |
| 200 | | 22.093%, 3/01/29, 144A (IF) (5) | No Opt. Call | AA | 525,868 |
| 2,000 | | Denver Convention Center Hotel Authority, Colorado, Revenue Bonds, Convention Center | No Opt. Call | Baa2 | 2,338,100 |
| | Hotel, Refunding Senior Lien Series 2016, 5.000%, 12/01/26 | | | |
| 1,000 | | Plaza Metropolitan District 1, Lakewood, Colorado, Tax Increment Revenue Bonds, | No Opt. Call | N/R | 1,025,670 |
| | Refunding Series 2013, 5.000%, 12/01/21, 144A | | | |
| 1,900 | | Rangely Hospital District, Rio Blanco County, Colorado, General Obligation Bonds, | 11/21 at 100.00 | Baa3 | 1,960,800 |
| | Refunding Series 2011, 6.000%, 11/01/26 | | | |
| 205 | | SouthGlenn Metropolitan District, Colorado, Special Revenue Bonds, Refunding Series | No Opt. Call | N/R | 205,012 |
| | 2016, 3.000%, 12/01/21 | | | |
| 3,150 | | Westminster Economic Development Authority, Colorado, Tax Increment Revenue Bonds, | 12/22 at 100.00 | AA– | 3,432,681 |
| | Mandalay Gardens Urban Renewal Project, Series 2012, 5.000%, 12/01/27 | | | |
| 15,826 | | Total Colorado | | | 19,155,736 |
| | Connecticut – 0.2% (0.2% of Total Investments) | | | |
| 900 | | Connecticut Health and Educational Facilities Authority, Revenue Bonds, Stamford | 7/22 at 100.00 | BBB+ | 939,465 |
| | Hospital, Series 2012J, 5.000%, 7/01/37 | | | |
| 7,995 | | Mashantucket Western Pequot Tribe, Connecticut, Special Revenue Bonds, Subordinate | No Opt. Call | N/R | 519,665 |
| | Series 2013A, 6.050%, 7/01/31, (cash 4.000%, PIK 2.050%), (8) | | | |
| 8,895 | | Total Connecticut | | | 1,459,130 |
| | District of Columbia – 0.6% (0.5% of Total Investments) | | | |
| 670 | | District of Columbia Student Dormitory Revenue Bonds, Provident Group – Howard | No Opt. Call | BB– | 664,405 |
| | Properties LLC Issue, Series 2013, 4.000%, 10/01/21 | | | |
| 800 | | District of Columbia, Revenue Bonds, District of Columbia International School, Series | 7/29 at 100.00 | BBB | 944,944 |
| | 2019, 5.000%, 7/01/39 | | | |
| 355 | | District of Columbia, Revenue Bonds, Ingleside at Rock Creek Project, Series 2017A, | 7/24 at 103.00 | N/R | 353,271 |
| | 4.125%, 7/01/27 | | | |
| | District of Columbia, Tax Increment Revenue Bonds, Gallery Place Project, Tender Option | | | |
| | Bond Trust 2016-XF2341: | | | |
| 745 | | 21.489%, 6/01/29, 144A (IF) (5) | 6/21 at 100.00 | AA+ | 829,461 |
| 785 | | 21.410%, 6/01/30, 144A (IF) (5) | 6/21 at 100.00 | AA+ | 873,462 |
| 520 | | 21.489%, 6/01/31, 144A (IF) (5) | 6/21 at 100.00 | AA+ | 578,687 |
| 3,875 | | Total District of Columbia | | | 4,244,230 |
| | Florida – 9.4% (7.2% of Total Investments) | | | |
| 150 | | Atlantic Beach, Florida, Healthcare Facilities Revenue Refunding Bonds, Fleet Landing | No Opt. Call | BBB | 162,570 |
| | Project, Series 2013A, 5.000%, 11/15/23 | | | |
| 590 | | Ave Maria Stewardship Community District, Florida, Capital Improvement Revenue Bonds, | 5/25 at 100.00 | N/R | 617,524 |
| | Series 2015, 5.000%, 5/01/30 | | | |
20
| | | | | | |
| Principal | | | Optional Call | | |
| Amount (000) | | Description (1) | Provisions (2) | Ratings (3) | Value |
| | Florida (continued) | | | |
| $ 7,200 | | Cape Coral Health Facilities Authority, Florida, Senior Housing Revenue Bonds, Gulf Care | 7/25 at 100.00 | N/R | $ 7,329,888 |
| | Inc Project, Series 2015, 5.750%, 7/01/30, 144A | | | |
| 1,715 | | Capital Trust Agency, Florida, Fixed Rate Air Cargo Revenue Refunding Bonds, Aero Miami | 12/20 at 100.00 | Baa3 | 1,721,448 |
| | FX, LLC Project, Series 2010A, 5.350%, 7/01/29 | | | |
| 505 | | Collier County Educational Facilities Authority, Florida, Revenue Bonds, Ave Maria | No Opt. Call | BBB– | 515,979 |
| | University, Refunding Series 2013A, 4.500%, 6/01/23 | | | |
| 150 | | Corkscrew Farms Community Development District, Lee County, Florida, Special Assessment | No Opt. Call | N/R | 151,277 |
| | Bonds, Area One Project, Series 2016, 3.500%, 11/01/21 | | | |
| 195 | | Florida Development Finance Corporation, Educational Facilities Revenue Bonds, | No Opt. Call | N/R (4) | 198,383 |
| | Renaissance Charter School, Inc Projects, Series 2011A, 6.500%, 6/15/21 (ETM) | | | |
| 10,750 | | Florida Development Finance Corporation, Florida, Surface Transportation Facility | 12/20 at 104.00 | N/R | 9,575,132 |
| | Revenue Bonds, Virgin Trains USA Passenger Rail Project , Series 2019A, 6.250%, 1/01/49 (AMT) | | | |
| | (Mandatory Put 1/01/24), 144A | | | |
| 335 | | Grand Bay at Doral Community Development District, Miami-Dade County, Florida, Special | No Opt. Call | N/R | 348,906 |
| | Assessment Bonds, Doral Breeze Project Series 2012, 5.125%, 11/01/22 | | | |
| | Lake Powell Residential Golf Community Development District, Bay County, Florida, | | | |
| | Special Assessment Revenue Refunding Bonds, Series 2012: | | | |
| 355 | | 5.250%, 11/01/22 | No Opt. Call | N/R | 370,411 |
| 1,255 | | 5.750%, 11/01/32 | 11/23 at 100.00 | N/R | 1,338,633 |
| 1,500 | | Lee County Industrial Development Authority, Florida, Charter School Revenue Bonds, Lee | 12/20 at 100.00 | BB– | 1,501,560 |
| | County Community Charter Schools, Series 2007A, 5.250%, 6/15/27 | | | |
| | Miami-Dade County Expressway Authority, Florida, Toll System Revenue Bonds, Tender | | | |
| | Option Bond Trust 2016-XG0099: | | | |
| 700 | | 21.370%, 7/01/22, 144A (IF) (5) | No Opt. Call | A | 936,705 |
| 820 | | 21.370%, 7/01/23, 144A (IF) (5) | 7/22 at 100.00 | A | 1,096,906 |
| 1,115 | | 21.370%, 7/01/24, 144A (IF) (5) | 7/22 at 100.00 | A | 1,488,781 |
| 800 | | 21.370%, 7/01/25, 144A (IF) (5) | 7/22 at 100.00 | A | 1,068,184 |
| 370 | | Miromar Lakes Community Development District, Lee County, Florida, Capital Improvement | No Opt. Call | N/R | 379,990 |
| | Revenue Bonds, Refunding Series 2012, 4.875%, 5/01/22 | | | |
| 645 | | Northern Palm Beach County Improvement District, Florida, Water Control and Improvement | No Opt. Call | N/R | 667,865 |
| | Bonds, Development Unit 16, Refunding Series 2012, 5.125%, 8/01/22 | | | |
| | Osceola County, Florida, Transportation Revenue Bonds, Osceola Parkway, Refunding & | | | |
| | Improvement Capital Appreciation Series 2019A-2: | | | |
| 1,500 | | 0.000%, 10/01/40 | 10/29 at 68.72 | BBB+ | 796,860 |
| 2,000 | | 0.000%, 10/01/41 | 10/29 at 66.18 | BBB+ | 1,018,920 |
| 2,000 | | 0.000%, 10/01/42 | 10/29 at 63.69 | BBB+ | 976,520 |
| 1,000 | | 0.000%, 10/01/44 | 10/29 at 59.08 | BBB+ | 449,850 |
| 4,000 | | 0.000%, 10/01/45 | 10/29 at 56.95 | BBB+ | 1,730,240 |
| 500 | | Palm Beach County Health Facilities Authority, Florida, Hospital Revenue Bonds, BRCH | 12/24 at 100.00 | N/R (4) | 592,210 |
| | Corporation Obligated Group, Refunding Series 2014, 5.000%, 12/01/25 (Pre-refunded 12/01/24) | | | |
| 900 | | Palm Beach County Health Facilities Authority, Florida, Revenue Bonds, Jupiter Medical | 11/22 at 100.00 | BBB+ | 948,159 |
| | Center, Series 2013A, 5.000%, 11/01/33 | | | |
| 365 | | Palm Beach County, Florida, Revenue Bonds, Provident Group – PBAU Properties LLC – Palm | 4/29 at 100.00 | Ba1 | 368,690 |
| | Beach Atlantic University Housing Project, Series 2019A, 5.000%, 4/01/39, 144A | | | |
| 2,325 | | Saint Johns County Industrial Development Authority, Florida, First Mortgage Revenue | 8/25 at 103.00 | A– | 2,489,633 |
| | Bonds, Presbyterian Retirement Communities Obligated Group Project, Series 2020A, | | | |
| | 4.000%, 8/01/55 | | | |
| 2,610 | | South Fork Community Development District, Florida, Capital Improvement Revenue Bonds, | 5/27 at 100.00 | BBB | 2,905,322 |
| | Refunding Series 2017, 4.000%, 5/01/31 | | | |
| 1,735 | | South-Dade Venture Community Development District, Florida, Special Assessment Revenue | 5/22 at 100.00 | BBB | 1,833,236 |
| | Bonds, Refunding Series 2012, 5.000%, 5/01/26 | | | |
| 800 | | Stonegate Community Development District, Florida, Special Assessment Revenue Bonds, | 5/23 at 100.00 | N/R | 824,320 |
| | Refunding Series 2013, 4.000%, 5/01/25 | | | |
21
| | |
| NID | Nuveen Intermediate Duration Municipal Term Fund Portfolio of Investments (continued) November 30, 2020 (Unaudited) |
| | | | | | |
| Principal | | | Optional Call | | |
| Amount (000) | | Description (1) | Provisions (2) | Ratings (3) | Value |
| | Florida (continued) | | | |
| | Sumter County Industrial Development Authority, Florida, Hospital Revenue Bonds, Central | | | |
| | Florida Health Alliance Projects, Series 2014B: | | | |
| $ 2,925 | | 5.000%, 7/01/29 | 7/24 at 100.00 | A– | $ 3,279,685 |
| 2,350 | | 5.000%, 7/01/30 | 7/24 at 100.00 | A– | 2,624,363 |
| 1,560 | | 5.000%, 7/01/31 | 7/24 at 100.00 | A– | 1,738,308 |
| 1,400 | | 5.000%, 7/01/32 | 7/24 at 100.00 | A– | 1,555,932 |
| | Tampa-Hillsborough County Expressway Authority, Florida, Revenue Bonds, Tender Option | | | |
| | Bond Trust 2016-XG0097: | | | |
| 400 | | 21.471%, 7/01/27 (Pre-Refunded 7/01/22), 144A (IF) (5) | 7/22 at 100.00 | A+ (4) | 550,420 |
| 290 | | 21.471%, 7/01/28 (Pre-Refunded 7/01/22), 144A (IF) (5) | 7/22 at 100.00 | A+ (4) | 399,055 |
| 1,000 | | 16.438%, 7/01/29 (Pre-Refunded 7/01/22), 144A (IF) (5) | 7/22 at 100.00 | A+ (4) | 1,297,220 |
| 1,000 | | 16.438%, 7/01/30 (Pre-Refunded 7/01/22), 144A (IF) (5) | 7/22 at 100.00 | A+ (4) | 1,297,220 |
| 1,000 | | 21.471%, 7/01/31 (Pre-Refunded 7/01/22), 144A (IF) (5) | 7/22 at 100.00 | A+ (4) | 1,376,050 |
| 785 | | Venetian Community Development District, Sarasota County, Florida, Capital Improvement | 5/22 at 100.00 | N/R | 811,792 |
| | Revenue Bonds, Series 2012-A2, 5.000%, 5/01/23 | | | |
| 1,030 | | Verandah West Community Development District, Florida, Capital Improvement Revenue | No Opt. Call | N/R | 1,050,157 |
| | Bonds, Refunding Series 2013, 4.000%, 5/01/23 | | | |
| 205 | | Vizcaya in Kendall Community Development District, Florida, Special Assessment Revenue | No Opt. Call | BBB– | 213,218 |
| | Bonds, Phase Two Assessment Area, Refunding Series 2012A-2, 5.600%, 5/01/22 | | | |
| 1,230 | | West Villages Improvement District, Florida, Special Assessment Revenue Bonds, Unit of | No Opt. Call | N/R | 1,238,622 |
| | Development 3, Refunding Series 2017, 3.500%, 5/01/22 | | | |
| 64,060 | | Total Florida | | | 61,836,144 |
| | Georgia – 0.3% (0.3% of Total Investments) | | | |
| 650 | | Atlanta Development Authority, Georgia, Senior Health Care Facilities Revenue Bonds, | 1/28 at 100.00 | N/R | 409,883 |
| | Georgia Proton Treatment Center Project, Current Interest Series 2017A-1, 6.500%, 1/01/29 | | | |
| 1,867 | | Clayton County Development Authority, Georgia, Special Facilities Revenue Bonds, Delta | 12/20 at 100.00 | Baa3 | 1,876,595 |
| | Air Lines, Inc Project, Series 2009A, 8.750%, 6/01/29 | | | |
| 2,517 | | Total Georgia | | | 2,286,478 |
| | Guam – 3.2% (2.5% of Total Investments) | | | |
| | Government of Guam, Business Privilege Tax Bonds, Refunding Series 2015D: | | | |
| 1,860 | | 5.000%, 11/15/24 | No Opt. Call | BB | 2,095,941 |
| 2,170 | | 5.000%, 11/15/33 | 11/25 at 100.00 | BB | 2,453,272 |
| 340 | | Guam Government Department of Education, Certificates of Participation, John F Kennedy | No Opt. Call | B+ | 340,000 |
| | High School Project, Series 2010A, 6.000%, 12/01/20 | | | |
| 1,100 | | Guam Government Waterworks Authority, Water and Wastewater System Revenue Bonds, | 7/24 at 100.00 | A– | 1,234,618 |
| | Refunding Series 2014A, 5.000%, 7/01/29 | | | |
| | Guam Government Waterworks Authority, Water and Wastewater System Revenue Bonds, | | | |
| | Series 2013: | | | |
| 1,365 | | 5.250%, 7/01/24 | 7/23 at 100.00 | A– | 1,511,014 |
| 2,500 | | 5.500%, 7/01/43 (Pre-refunded 7/01/23) | 7/23 at 100.00 | A– (4) | 2,833,225 |
| | Guam Government, Limited Obligation Section 30 Revenue Bonds, Series 2016A: | | | |
| 2,500 | | 5.000%, 12/01/25 | No Opt. Call | BB | 2,891,075 |
| 3,750 | | 5.000%, 12/01/26 | No Opt. Call | BB | 4,416,413 |
| 1,000 | | Guam International Airport Authority, Revenue Bonds, Series 2013C, 6.250%, 10/01/34 (AMT) | 10/23 at 100.00 | Baa2 | 1,085,440 |
| 2,025 | | Guam Power Authority, Revenue Bonds, Series 2012A, 5.000%, 10/01/30 – AGM Insured | 10/22 at 100.00 | AA | 2,184,023 |
| 200 | | Guam Power Authority, Revenue Bonds, Series 2014A, 5.000%, 10/01/31 | 10/24 at 100.00 | BBB | 222,382 |
| 18,810 | | Total Guam | | | 21,267,403 |
| | Hawaii – 1.2% (0.9% of Total Investments) | | | |
| 6,215 | | Hawaii Department of Budget and Finance, Special Purpose Revenue Bonds, Hawaii Pacific | 7/27 at 100.00 | N/R | 6,432,836 |
| | University, Series 2018, 6.000%, 7/01/28, 144A | | | |
| 160 | | Hawaii Housing Finance and Development Corporation, Multifamily Housing Revenue Bonds, | No Opt. Call | BBB | 162,598 |
| | Wilikina Apartments Project, Series 2012A, 4.250%, 5/01/22 | | | |
| 1,550 | | Hawaii State Department of Transportation, Special Facility Revenue Bonds, Continental | 12/20 at 100.00 | Ba3 | 1,552,682 |
| | Airlines Inc, Series 1997, 5.625%, 11/15/27 (AMT) | | | |
| 7,925 | | Total Hawaii | | | 8,148,116 |
22
| | | | | | |
| Principal | | | Optional Call | | |
| Amount (000) | | Description (1) | Provisions (2) | Ratings (3) | Value |
| | Idaho – 0.4% (0.3% of Total Investments) | | | |
| $ 2,530 | | Idaho Health Facilities Authority, Revenue Bonds, Madison Memorial Hospital Project, | 9/26 at 100.00 | BB+ | $ 2,914,788 |
| | Refunding Series 2016, 5.000%, 9/01/30 | | | |
| | Illinois – 18.5% (14.3% of Total Investments) | | | |
| 4,250 | | CenterPoint Intermodal Center Program Trust, Illinois, Series 2004 Class A Certificates, | No Opt. Call | N/R | 4,279,495 |
| | 4.000%, 6/15/23 (Mandatory Put 12/15/22), 144A | | | |
| 5,000 | | Chicago Board of Education, Illinois, Dedicated Capital Improvement Tax Revenue Bonds, | 4/27 at 100.00 | A– | 5,848,000 |
| | Series 2016, 5.750%, 4/01/34 | | | |
| 440 | | Chicago Board of Education, Illinois, Dedicated Capital Improvement Tax Revenue Bonds, | 4/27 at 100.00 | A– | 478,504 |
| | Series 2017, 5.000%, 4/01/42 | | | |
| 750 | | Chicago Board of Education, Illinois, General Obligation Bonds, Dedicated Revenues | 12/21 at 100.00 | BB | 756,900 |
| | Series 2011A, 5.000%, 12/01/41 | | | |
| | Chicago Board of Education, Illinois, General Obligation Bonds, Dedicated Revenues, | | | |
| | Project Series 2015C: | | | |
| 470 | | 5.250%, 12/01/35 | 12/24 at 100.00 | BB | 499,995 |
| 555 | | 5.250%, 12/01/39 | 12/24 at 100.00 | BB | 585,425 |
| | Chicago Board of Education, Illinois, General Obligation Bonds, Dedicated Revenues, | | | |
| | Refunding Series 2010F: | | | |
| 1,230 | | 5.000%, 12/01/20 | No Opt. Call | BB | 1,230,000 |
| 3,420 | | 5.000%, 12/01/31 | 12/20 at 100.00 | BB | 3,424,514 |
| 3,405 | | Chicago Board of Education, Illinois, General Obligation Bonds, Dedicated Revenues, | 12/22 at 100.00 | BB | 3,435,236 |
| | Refunding Series 2012B, 5.000%, 12/01/33 | | | |
| | Chicago Board of Education, Illinois, General Obligation Bonds, Dedicated Revenues, | | | |
| | Refunding Series 2017C: | | | |
| 7,225 | | 5.000%, 12/01/26 | No Opt. Call | BB | 8,052,118 |
| 1,875 | | 5.000%, 12/01/27 | No Opt. Call | BB | 2,094,769 |
| 1,000 | | Chicago Board of Education, Illinois, General Obligation Bonds, Dedicated Revenues, | 12/27 at 100.00 | BB | 1,081,650 |
| | Refunding Series 2017G, 5.000%, 12/01/34 | | | |
| 1,000 | | Chicago Board of Education, Illinois, General Obligation Bonds, Dedicated Revenues, | 12/28 at 100.00 | AA | 1,240,180 |
| | Refunding Series 2018A, 5.000%, 12/01/30 – AGM Insured | | | |
| 2,115 | | Chicago Board of Education, Illinois, General Obligation Bonds, Dedicated Revenues, | No Opt. Call | BB | 2,270,854 |
| | Refunding Series 2018C, 5.000%, 12/01/23 | | | |
| 1,000 | | Chicago Board of Education, Illinois, General Obligation Bonds, Dedicated Revenues, | 12/25 at 100.00 | BB | 1,217,810 |
| | Series 2016A, 7.000%, 12/01/26 | | | |
| | Chicago Board of Education, Illinois, Unlimited Tax General Obligation Bonds, Dedicated | | | |
| | Tax Revenues, Series 1998B-1: | | | |
| 1,470 | | 0.000%, 12/01/22 – FGIC Insured | No Opt. Call | Baa2 | 1,407,716 |
| 1,500 | | 0.000%, 12/01/27 – NPFG Insured | No Opt. Call | Baa2 | 1,243,260 |
| 2,119 | | Chicago, Illinois, Certificates of Participation Tax Increment Bonds, 35th and State | 12/20 at 100.00 | N/R | 2,119,377 |
| | Redevelopment Project, Series 2012, 6.100%, 1/15/29 | | | |
| 768 | | Chicago, Illinois, Certificates of Participation, Tax Increment Allocation Revenue | 12/20 at 100.00 | N/R | 558,980 |
| | Bonds, Diversey-Narragansett Project, Series 2006, 7.460%, 2/15/26 (8) | | | |
| 2,630 | | Chicago, Illinois, General Obligation Bonds, City Colleges, Series 1999, 0.000%, | No Opt. Call | BBB+ | 1,684,068 |
| | 1/01/34 – FGIC Insured | | | |
| 225 | | Chicago, Illinois, General Obligation Bonds, Project and Refunding Series 2008C, | No Opt. Call | BBB+ | 168,712 |
| | 0.000%, 1/01/29 | | | |
| 3,215 | | Chicago, Illinois, General Obligation Bonds, Project Series 2011A, 5.000%, 1/01/40 | 1/21 at 100.00 | BBB+ | 3,217,186 |
| 2,680 | | Chicago, Illinois, General Obligation Bonds, Refunding Series 2012C, 5.000%, 1/01/23 | 1/22 at 100.00 | BBB+ | 2,742,632 |
| | Chicago, Illinois, General Obligation Bonds, Refunding Series 2016C: | | | |
| 850 | | 5.000%, 1/01/24 | No Opt. Call | BBB+ | 901,111 |
| 1,500 | | 5.000%, 1/01/25 | No Opt. Call | BBB+ | 1,615,410 |
| 515 | | 5.000%, 1/01/31 | 1/26 at 100.00 | BBB+ | 550,896 |
| 1,685 | | 5.000%, 1/01/38 | 1/26 at 100.00 | BBB+ | 1,784,752 |
| 2,000 | | Chicago, Illinois, General Obligation Bonds, Series 2019A, 5.500%, 1/01/49 | 1/29 at 100.00 | BBB+ | 2,186,560 |
23
| | |
| NID | Nuveen Intermediate Duration Municipal Term Fund Portfolio of Investments (continued) November 30, 2020 (Unaudited) |
| | | | | | |
| Principal | | | Optional Call | | |
| Amount (000) | | Description (1) | Provisions (2) | Ratings (3) | Value |
| | Illinois (continued) | | | |
| | Cook County, Illinois, General Obligation Bonds, Tender Option Bond Trust 2015-XF0124: | | | |
| $ 1,000 | | 20.876%, 11/15/29, 144A (IF) (5) | 11/22 at 100.00 | A+ | $ 1,340,740 |
| 3,040 | | 20.876%, 11/15/33, 144A (IF) (5) | 11/22 at 100.00 | A+ | 3,992,310 |
| | Illinois Finance Authority, Revenue Bonds, Centegra Health System, Tender Option Bond | | | |
| | Trust 2016-XF2339: | | | |
| 330 | | 21.777%, 9/01/21, 144A (IF) (5) | No Opt. Call | AA+ | 387,984 |
| 480 | | 21.817%, 9/01/21, 144A (IF) (5) | No Opt. Call | AA+ | 564,504 |
| 435 | | 21.759%, 9/01/22, 144A (IF) (5) | No Opt. Call | AA+ | 607,812 |
| | Illinois Finance Authority, Revenue Bonds, Illinois Wesleyan University, Refunding | | | |
| | Series 2016: | | | |
| 1,500 | | 3.000%, 9/01/30 | 9/26 at 100.00 | A– | 1,553,715 |
| 1,475 | | 3.000%, 9/01/31 | 9/26 at 100.00 | A– | 1,522,436 |
| | Illinois Finance Authority, Revenue Bonds, Ingalls Health System, Series 2013: | | | |
| 1,035 | | 5.000%, 5/15/21 (ETM) | No Opt. Call | A1 (4) | 1,055,514 |
| 1,210 | | 5.000%, 5/15/22 (ETM) | No Opt. Call | A1 (4) | 1,285,431 |
| 1,575 | | 5.000%, 5/15/24 (Pre-refunded 5/15/22) | 5/22 at 100.00 | A1 (4) | 1,673,186 |
| 775 | | Illinois Finance Authority, Student Housing & Academic Facility Revenue Bonds, | 8/27 at 100.00 | Baa3 | 768,149 |
| | CHF-Collegiate Housing Foundation – Chicago LLC University of Illinois at Chicago Project, | | | |
| | Series 2017A, 5.000%, 2/15/37 | | | |
| 2,500 | | Illinois Sports Facility Authority, State Tax Supported Bonds, Refunding Series 2014, | 6/24 at 100.00 | AA | 2,820,725 |
| | 5.000%, 6/15/27 – AGM Insured | | | |
| 1,000 | | Illinois Sports Facility Authority, State Tax Supported Bonds, Series 2001, 0.000%, | No Opt. Call | BB+ | 902,650 |
| | 6/15/25 – AMBAC Insured | | | |
| | Illinois State, General Obligation Bonds, December Series 2017A: | | | |
| 890 | | 5.000%, 12/01/27 | No Opt. Call | BBB– | 993,552 |
| 1,020 | | 5.000%, 12/01/28 | 12/27 at 100.00 | BBB– | 1,130,762 |
| 2,250 | | Illinois State, General Obligation Bonds, February Series 2014, 5.000%, 2/01/21 | No Opt. Call | BBB– | 2,263,433 |
| 1,875 | | Illinois State, General Obligation Bonds, June Series 2016, 3.500%, 6/01/29 | 6/26 at 100.00 | BBB– | 1,883,831 |
| 1,500 | | Illinois State, General Obligation Bonds, November Series 2016, 5.000%, 11/01/26 | No Opt. Call | BBB– | 1,660,725 |
| 5,175 | | Illinois State, General Obligation Bonds, November Series 2017D, 5.000%, 11/01/27 | No Opt. Call | BBB– | 5,709,733 |
| 3,050 | | Illinois State, General Obligation Bonds, November Series 2019B, 4.000%, 11/01/34 | 11/29 at 100.00 | BBB– | 3,112,403 |
| 4,565 | | Illinois State, General Obligation Bonds, October Series 2016, 5.000%, 2/01/26 | No Opt. Call | BBB– | 5,021,454 |
| 1,870 | | Illinois State, General Obligation Bonds, Refunding Series 2010, 5.000%, 1/01/24 | 12/20 at 100.00 | BBB– | 1,875,348 |
| | Illinois State, General Obligation Bonds, Refunding Series 2012: | | | |
| 1,750 | | 5.000%, 8/01/22 | No Opt. Call | BBB– | 1,833,825 |
| 4,000 | | 5.000%, 8/01/23 – AGM Insured | No Opt. Call | AA | 4,342,280 |
| 2,000 | | Illinois State, General Obligation Bonds, Tender Option Bond Trust 2015-XF1010, 17.780%, | No Opt. Call | AA | 2,684,560 |
| | 8/01/23, 144A (IF) (5) | | | |
| 3,560 | | Illinois State, Sales Tax Revenue Bonds, Build Illinois, Refunding Junior Obligation | 6/26 at 100.00 | AA | 3,957,652 |
| | September Series 2016C, 4.000%, 6/15/30 – BAM Insured | | | |
| 2,275 | | Metropolitan Pier and Exposition Authority, Illinois, McCormick Place Expansion Project | 6/22 at 100.00 | BBB | 2,369,617 |
| | Bonds, Refunding Series 2012B, 5.000%, 12/15/28 | | | |
| 1,000 | | Metropolitan Pier and Exposition Authority, Illinois, McCormick Place Expansion Project | No Opt. Call | BBB | 1,151,370 |
| | Bonds, Series 2017B, 5.000%, 12/15/26 | | | |
| 2,250 | | Romeoville, Will County, Illinois, Revenue Bonds, Lewis University Project, Refunding | 4/25 at 100.00 | BBB | 2,317,478 |
| | Series 2018B, 4.125%, 10/01/46 | | | |
| | Romeoville, Will County, Illinois, Revenue Bonds, Lewis University Project, Series 2015: | | | |
| 1,100 | | 5.000%, 10/01/25 | 4/25 at 100.00 | BBB | 1,230,570 |
| 200 | | 5.000%, 10/01/26 | 4/25 at 100.00 | BBB | 222,866 |
| 435 | | Southwestern Illinois Development Authority, Environmental Improvement Revenue Bonds, US | 8/22 at 100.00 | B– | 408,970 |
| | Steel Corporation Project, Series 2012, 5.750%, 8/01/42 (AMT) | | | |
| 2,500 | | Wauconda, Illinois, Special Service Area 1 Special Tax Bonds, Liberty Lake Project, | 3/25 at 100.00 | AA | 2,877,025 |
| | Refunding Series 2015, 5.000%, 3/01/33 – BAM Insured | | | |
| 114,512 | | Total Illinois | | | 122,198,720 |
24
| | | | | | |
| Principal | | | Optional Call | | |
| Amount (000) | | Description (1) | Provisions (2) | Ratings (3) | Value |
| | Indiana – 2.5% (1.9% of Total Investments) | | | |
| $ 880 | | Carmel, Indiana, Revenue Bonds, Barrington of Carmel Project, Series 2012A, | No Opt. Call | N/R | $ 8,800 |
| | 0.000%, 11/15/22 (8) | | | |
| 145 | | Gary Local Public Improvement Bond Bank, Indiana, Economic Development Revenue Bonds, | 6/30 at 100.00 | N/R | 148,505 |
| | Drexel Foundation for Educational Excellence Project, Refunding Series 2020A, 5.125%, | | | |
| | 6/01/32, 144A | | | |
| 3,840 | | Indiana Finance Authority, Educational Facilities Revenue Bonds, 21st Century Charter | 3/23 at 100.00 | B+ | 3,931,776 |
| | School Project, Series 2013A, 6.000%, 3/01/33 | | | |
| 600 | | Indiana Finance Authority, Educational Facilities Revenue Bonds, Lighthouse Academies of | No Opt. Call | N/R | 636,672 |
| | Indiana Inc Project, Series 2016, 6.250%, 12/01/24, 144A | | | |
| 615 | | Indiana Finance Authority, Educational Facilities Revenue Bonds, Lighthouse Academies of | No Opt. Call | N/R | 650,289 |
| | Northwest Indiana Inc Project, Series 2016, 6.250%, 12/01/24, 144A | | | |
| 5,590 | | Indiana Finance Authority, Environmental Improvement Revenue Bonds, United States Steel | 12/20 at 100.00 | B– | 5,594,416 |
| | Corporation Project, Refunding Series 2010, 6.000%, 12/01/26 | | | |
| 1,295 | | Indiana Finance Authority, Health Facilities Revenue Bonds, Good Samaritan Hospital | No Opt. Call | Baa3 | 1,463,246 |
| | Project, Series 2016A, 5.500%, 4/01/24 | | | |
| 200 | | Valparaiso, Indiana, Exempt Facilities Revenue Bonds, Pratt Paper LLC Project, Series | No Opt. Call | N/R | 213,940 |
| | 2013, 5.875%, 1/01/24 (AMT) | | | |
| 3,000 | | Whiting, Indiana, Environmental Facilities Refunding Revenue Bonds, BP Products North | No Opt. Call | A1 | 3,641,550 |
| | America Inc Project, Refunding Series 2019A, 5.000%, 12/01/44 (AMT) (Mandatory Put 6/05/26) | | | |
| 16,165 | | Total Indiana | | | 16,289,194 |
| | Iowa – 2.4% (1.9% of Total Investments) | | | |
| 1,925 | | Iowa Finance Authority, Iowa, Midwestern Disaster Area Revenue Bonds, Alcoa Inc Project, | 8/22 at 100.00 | BBB– | 1,978,881 |
| | Series 2012, 4.750%, 8/01/42 | | | |
| 3,000 | | Iowa Finance Authority, Iowa, Midwestern Disaster Area Revenue Bonds, Iowa Fertilizer | 12/23 at 100.00 | BB– | 3,262,260 |
| | Company Project, Series 2013, 5.250%, 12/01/25 | | | |
| 3,990 | | Iowa Finance Authority, Iowa, Midwestern Disaster Area Revenue Bonds, Iowa Fertilizer | 12/20 at 103.00 | BB– | 4,117,520 |
| | Company Project, Series 2016, 5.875%, 12/01/26, 144A | | | |
| 4,640 | | Iowa Finance Authority, Iowa, Midwestern Disaster Area Revenue Bonds, Iowa Fertilizer | 12/22 at 103.00 | BB– | 4,968,327 |
| | Company Project, Series 2018A, 5.250%, 12/01/50 (Mandatory Put 12/01/33) | | | |
| 1,500 | | Iowa Tobacco Settlement Authority, Tobacco Asset-Backed Revenue Bonds, Series 2005B, | 12/20 at 100.00 | B– | 1,522,440 |
| | 5.600%, 6/01/34 | | | |
| 15,055 | | Total Iowa | | | 15,849,428 |
| | Kansas – 1.4% (1.0% of Total Investments) | | | |
| | Kansas Development Finance Authority Hospital Revenue Bonds, Adventist Health | | | |
| | System/Sunbelt Obligated Group, Tender Option Bond Trust 2016-XG0056: | | | |
| 310 | | 17.718%, 11/15/32, 144A (IF) (5) | 5/22 at 100.00 | AA | 385,150 |
| 2,000 | | 22.100%, 11/15/32, 144A (IF) (5) | 5/22 at 100.00 | AA | 2,601,220 |
| 200 | | Kansas Power Pool, a Municipal Energy Agency Electric Utility Revenue Bonds, DogWood | 12/25 at 100.00 | A3 | 238,836 |
| | Facility, Series 2015A, 5.000%, 12/01/28 | | | |
| 2,000 | | Overland Park, Kansas, Sales Tax Revenue Bonds, Prairiefire Community Improvement | 12/22 at 100.00 | N/R | 1,000,000 |
| | District No 1 Project, Series 2012B, 0.000%, 12/15/34 (8) | | | |
| 8,000 | | Overland Park, Kansas, Sales Tax Special Obligation Revenue Bonds, Prairiefire at | 12/22 at 100.00 | N/R | 4,725,200 |
| | Lionsgate Project, Series 2012, 5.250%, 12/15/29 | | | |
| 12,510 | | Total Kansas | | | 8,950,406 |
| | Kentucky – 1.1% (0.8% of Total Investments) | | | |
| | Ashland, Kentucky, Medical Center Revenue Bonds, Ashland Hospital Corporation d/b/a | | | |
| | King’s Daughters Medical Center Project, Refunding Series 2019: | | | |
| 920 | | 5.000%, 2/01/31 | 2/30 at 100.00 | BBB– | 1,104,156 |
| 125 | | 4.000%, 2/01/33 | 2/30 at 100.00 | BBB– | 135,359 |
25
| | |
| NID | Nuveen Intermediate Duration Municipal Term Fund Portfolio of Investments (continued) November 30, 2020 (Unaudited) |
| | | | | | |
| Principal | | | Optional Call | | |
| Amount (000) | | Description (1) | Provisions (2) | Ratings (3) | Value |
| | Kentucky (continued) | | | |
| | Kentucky Economic Development Finance Authority, Hospital Revenue Bonds, Owensboro | | | |
| | Health, Refunding Series 2017A: | | | |
| $ 3,000 | | 5.000%, 6/01/30 | 6/27 at 100.00 | Baa3 | $ 3,411,690 |
| 1,315 | | 5.000%, 6/01/31 | 6/27 at 100.00 | Baa3 | 1,489,921 |
| 685 | | Kentucky Economic Development Finance Authority, Revenue Bonds, Next Generation Kentucky | 7/25 at 100.00 | BBB+ | 747,321 |
| | Information Highway Project, Senior Series 2015A, 5.000%, 7/01/33 | | | |
| 175 | | Owensboro, Kentucky, Water Revenue Bonds, Refunding & Improvement Series 2014, 2.500%, | No Opt. Call | AA | 177,881 |
| | 9/15/21 – BAM Insured | | | |
| 6,220 | | Total Kentucky | | | 7,066,328 |
| | Louisiana – 2.0% (1.6% of Total Investments) | | | |
| | Jefferson Parish Hospital Service District 2, Louisiana, Hospital Revenue Bonds, East | | | |
| | Jefferson General Hospital, Refunding Series 2011: | | | |
| 780 | | 5.625%, 7/01/26 (Pre-refunded 7/01/21) | 7/21 at 100.00 | N/R (4) | 804,352 |
| 60 | | 6.250%, 7/01/31 (Pre-refunded 7/01/21) | 7/21 at 100.00 | N/R (4) | 62,087 |
| 3,300 | | Louisiana Local Government Environmental Facilities and Community Development Authority, | 11/27 at 100.00 | Baa2 | 3,615,876 |
| | Revenue Bonds, Westlake Chemical Corporation Projects, Refunding Series 2017, 3.500%, 11/01/32 | | | |
| 1,500 | | Louisiana Public Facilities Authority, Louisiana, Revenue Bonds, Ochsner Clinic Foundation | 5/30 at 100.00 | A | 1,709,145 |
| | Project, Series 2020A, 4.000%, 5/15/49 | | | |
| 2,840 | | Louisiana Public Facilities Authority, Revenue Bonds, Loyola University Project, | No Opt. Call | Baa1 | 2,831,934 |
| | Refunding Series 2017, 0.000%, 10/01/31 (6) | | | |
| | Louisiana Public Facilities Authority, Revenue Bonds, Ochsner Clinic Foundation Project, | | | |
| | Series 2011: | | | |
| 250 | | 5.250%, 5/15/22 (Pre-refunded 5/15/21) | 5/21 at 100.00 | A3 (4) | 255,757 |
| 500 | | 6.250%, 5/15/31 (Pre-refunded 5/15/21) | 5/21 at 100.00 | A3 (4) | 513,775 |
| 1,000 | | Louisiana Stadium and Exposition District, Revenue Refunding Bonds, Senior Lien Series | No Opt. Call | AA– | 1,062,070 |
| | 2013A, 5.000%, 7/01/22 | | | |
| | New Orleans Aviation Board, Louisiana, General Airport Revenue Bonds, North Terminal | | | |
| | Project, Series 2017B: | | | |
| 500 | | 5.000%, 1/01/31 (AMT) | 1/27 at 100.00 | A2 | 600,945 |
| 800 | | 5.000%, 1/01/32 (AMT) | 1/27 at 100.00 | A2 | 957,944 |
| 720 | | Saint John the Baptist Parish, Louisiana, Revenue Bonds, Marathon Oil Corporation | No Opt. Call | BBB– | 727,711 |
| | Project, Refunding Series 2017A-1, 2.000%, 6/01/37 (Mandatory Put 4/01/23) | | | |
| 285 | | Saint Tammany Public Trust Financing Authority, Louisiana, Revenue Bonds, Christwood | 11/24 at 100.00 | N/R | 300,242 |
| | Project, Refunding Series 2015, 5.250%, 11/15/29 | | | |
| 12,535 | | Total Louisiana | | | 13,441,838 |
| | Maine – 0.1% (0.1% of Total Investments) | | | |
| 500 | | Maine Finance Authority, Solid Waste Disposal Revenue Bonds, Coastal Resources of Maine | 12/26 at 100.00 | N/R | 275,000 |
| | LLC Project, Green Series 2017, 5.375%, 12/15/33 (AMT), 144A (8) | | | |
| 350 | | Maine Health and Higher Educational Facilities Authority Revenue Bonds, Eastern Maine | No Opt. Call | BBB | 369,852 |
| | Medical Center Obligated Group Issue, Series 2013, 5.000%, 7/01/22 | | | |
| 850 | | Total Maine | | | 644,852 |
| | Maryland – 0.6% (0.4% of Total Investments) | | | |
| | Baltimore, Maryland, Convention Center Hotel Revenue Bonds, Refunding Series 2017: | | | |
| 350 | | 5.000%, 9/01/26 | No Opt. Call | BB– | 320,302 |
| 1,000 | | 5.000%, 9/01/33 | 9/27 at 100.00 | BB– | 918,220 |
| 2,000 | | 5.000%, 9/01/34 | 9/27 at 100.00 | BB– | 1,836,940 |
| 775 | | Maryland Economic Development Corporation, Port Facilities Revenue Bonds, CNX Marine | 12/20 at 100.00 | BB– | 783,440 |
| | Terminals Inc Port of Baltimore Facility, Refunding Series 2010, 5.750%, 9/01/25 | | | |
| 4,125 | | Total Maryland | | | 3,858,902 |
26
| | | | | | |
| Principal | | | Optional Call | | |
| Amount (000) | | Description (1) | Provisions (2) | Ratings (3) | Value |
| | Massachusetts – 0.3% (0.3% of Total Investments) | | | |
| $ 1,000 | | Massachusetts Development Finance Agency, Revenue Bonds, Boston Medical Center Issue, | No Opt. Call | BBB | $ 1,199,900 |
| | Series 2016E, 5.000%, 7/01/26 | | | |
| 995 | | Massachusetts Educational Financing Authority, Education Loan Revenue Bonds, Issue K, | 7/22 at 100.00 | AA | 1,047,476 |
| | Series 2013, 5.250%, 7/01/29 (AMT) | | | |
| 1,995 | | Total Massachusetts | | | 2,247,376 |
| | Michigan – 4.0% (3.1% of Total Investments) | | | |
| 930 | | Flint Hospital Building Authority, Michigan, Building Authority Revenue Bonds, Hurley | No Opt. Call | BBB– | 979,792 |
| | Medical Center, Series 2013A, 5.000%, 7/01/23 | | | |
| | Michigan Finance Authority, Local Government Loan Program Revenue Bonds, Detroit Water & | | | |
| | Sewerage Department Water Supply System Local Project, Series 2014C-3: | | | |
| 5,000 | | 5.000%, 7/01/24 – AGM Insured | No Opt. Call | AA | 5,817,250 |
| 5,000 | | 5.000%, 7/01/25 – AGM Insured | 7/24 at 100.00 | AA | 5,799,800 |
| 5,000 | | 5.000%, 7/01/26 – AGM Insured | 7/24 at 100.00 | AA | 5,774,700 |
| 1,945 | | 5.000%, 7/01/31 – AGM Insured | 7/24 at 100.00 | AA | 2,232,918 |
| | Michigan Finance Authority, Local Government Loan Program Revenue Bonds, Detroit Water & | | | |
| | Sewerage Department Water Supply System Local Project, Series 2014C-7: | | | |
| 2,000 | | 5.000%, 7/01/25 – NPFG Insured | 7/24 at 100.00 | A+ | 2,320,680 |
| 2,000 | | 5.000%, 7/01/26 – NPFG Insured | 7/24 at 100.00 | A+ | 2,319,140 |
| 165 | | Michigan Finance Authority, Public School Academy Limited Obligation Revenue Bonds, Old | No Opt. Call | BB– | 165,000 |
| | Redford Academy Project, Series 2010A, 5.250%, 12/01/20 | | | |
| 65 | | Michigan Finance Authority, Public School Academy Revenue Bonds, Detroit Service | No Opt. Call | B | 63,909 |
| | Learning Academy Project, Refunding Series 2011, 6.000%, 10/01/21 | | | |
| 820 | | Michigan Finance Authority, Revenue Bonds, Trinity Health Credit Group, Tender Option | 1/21 at 100.00 | AA– | 834,186 |
| | Bond Trust 2015-XF0126, 21.701%, 12/01/27, 144A (IF) (5) | | | |
| 175 | | Michigan Public Educational Facilities Authority, Limited Obligation Revenue Bonds, | 12/20 at 100.00 | BBB– | 175,469 |
| | Richfield Public School Academy, Series 2007, 5.000%, 9/01/22 | | | |
| 23,100 | | Total Michigan | | | 26,482,844 |
| | Minnesota – 0.1% (0.1% of Total Investments) | | | |
| | Minnesota Higher Education Facilities Authority, Revenue Bonds, Minneapolis College of | | | |
| | Art and Design, Series 2015-8D: | | | |
| 260 | | 4.000%, 5/01/24 | 5/23 at 100.00 | Baa2 | 271,708 |
| 250 | | 4.000%, 5/01/26 | 5/23 at 100.00 | Baa2 | 260,712 |
| 510 | | Total Minnesota | | | 532,420 |
| | Mississippi – 0.5% (0.4% of Total Investments) | | | |
| 1,845 | | Mississippi Business Finance Corporation, Gulf Opportunity Zone Industrial Development | 12/20 at 100.00 | BBB | 1,826,716 |
| | Revenue Bonds, Northrop Grumman Ship Systems Inc Project, Series 2006, 4.550%, 12/01/28 | | | |
| | Mississippi Development Bank Special Obligation Bonds, Marshall County Industrial | | | |
| | Development Authority, Mississippi Highway Construction Project, Tender Option Bond Trust 3315: | | | |
| 800 | | 22.468%, 1/01/26 (Pre-Refunded 1/01/22), 144A (IF) (5) | 1/22 at 100.00 | AA- (4) | 1,008,032 |
| 500 | | 22.468%, 1/01/28 (Pre-Refunded 1/01/22), 144A (IF) (5) | 1/22 at 100.00 | AA- (4) | 630,020 |
| 3,145 | | Total Mississippi | | | 3,464,768 |
| | Missouri – 1.7% (1.3% of Total Investments) | | | |
| 1,515 | | Boone County, Missouri, Hospital Revenue Bonds, Boone Hospital Center, Refunding Series | No Opt. Call | BBB– | 1,652,971 |
| | 2016, 5.000%, 8/01/24 | | | |
| 1,125 | | Branson Industrial Development Authority, Missouri, Tax Increment Revenue Bonds, Branson | 11/25 at 100.00 | N/R | 1,135,980 |
| | Shoppes Redevelopment Project, Refunding Series 2017A, 4.000%, 11/01/27 | | | |
| 2,500 | | Poplar Bluff Regional Transportation Development District, Missouri, Transportation | 12/22 at 100.00 | BBB | 2,585,950 |
| | Sales Tax Revenue Bonds, Series 2012, 4.000%, 12/01/36 | | | |
| 865 | | Raymore, Missouri, Tax Increment Revenue Bonds, Raymore Galleria Project, Refunding & | 5/23 at 100.00 | N/R | 878,641 |
| | Improvement Series 2014A, 5.000%, 5/01/24 | | | |
27
| | |
| NID | Nuveen Intermediate Duration Municipal Term Fund Portfolio of Investments (continued) November 30, 2020 (Unaudited) |
| | | | | | |
| Principal | | | Optional Call | | |
| Amount (000) | | Description (1) | Provisions (2) | Ratings (3) | Value |
| | Missouri (continued) | | | |
| | Saint Louis County Industrial Development Authority, Missouri, Health Facilities Revenue | | | |
| | Bonds, Ranken-Jordan Project, Refunding & Improvement Series 2016: | | | |
| $ 385 | | 5.000%, 11/15/23 | No Opt. Call | N/R | $ 405,817 |
| 800 | | 5.000%, 11/15/25 | No Opt. Call | N/R | 866,984 |
| 1,580 | | Saint Louis County, Missouri, Special Obligation Bonds, Meramec Building Replacement & | No Opt. Call | AA | 1,580,000 |
| | Capital Projects, Series 2017B, 5.000%, 12/01/20 | | | |
| 1,595 | | Saint Louis Land Clearance for Redevelopment Authority, Missouri, Annual Appropriation | 4/27 at 100.00 | A | 1,788,489 |
| | Revenue Bonds, Contractual Payments of St Louis City Scottrade Center Project, Series 2018A, | | | |
| | 5.000%, 4/01/38 | | | |
| 10,365 | | Total Missouri | | | 10,894,832 |
| | Nebraska – 0.9% (0.7% of Total Investments) | | | |
| 2,000 | | Central Plains Energy Project, Nebraska, Gas Project 1 Revenue Bonds, Series 2007A, | No Opt. Call | A | 2,095,820 |
| | 5.250%, 12/01/21 | | | |
| 1,445 | | Central Plains Energy Project, Nebraska, Gas Project 3 Revenue Bonds, Series 2012, | 9/22 at 100.00 | A | 1,552,176 |
| | 5.000%, 9/01/32 | | | |
| 635 | | Douglas County Hospital Authority 2, Nebraska, Hospital Revenue Bonds, Madonna | 5/24 at 100.00 | A– | 725,354 |
| | Rehabilitation Hospital Project, Series 2014, 5.000%, 5/15/26 | | | |
| 1,205 | | Nebraska Investment Finance Authority, Single Family Housing Revenue Bonds, Series | 9/27 at 100.00 | AA+ | 1,333,152 |
| | 2018C, 3.750%, 9/01/38 | | | |
| 5,285 | | Total Nebraska | | | 5,706,502 |
| | Nevada – 0.8% (0.6% of Total Investments) | | | |
| | Carson City, Nevada, Hospital Revenue Bonds, Carson Tahoe Regional Healthcare Project, | | | |
| | Series 2017A: | | | |
| 320 | | 5.000%, 9/01/29 | 9/27 at 100.00 | A– | 385,328 |
| 495 | | 5.000%, 9/01/31 | 9/27 at 100.00 | A– | 589,753 |
| 1,630 | | Carson City, Nevada, Hospital Revenue Bonds, Carson-Tahoe Regional Healthcare Project, | 9/22 at 100.00 | A– (4) | 1,759,520 |
| | Refunding Series 2012, 5.000%, 9/01/27 (Pre-refunded 9/01/22) | | | |
| | Henderson, Nevada, Limited Obligation Bonds, Local Improvement District T-13 | | | |
| | Cornerstone, Refunding Series 2013: | | | |
| 180 | | 5.000%, 3/01/21 | No Opt. Call | N/R | 181,168 |
| 180 | | 5.000%, 3/01/22 | No Opt. Call | N/R | 185,742 |
| 1,465 | | Las Vegas Redevelopment Agency, Nevada, Tax Increment Revenue Bonds, Refunding Series | 6/26 at 100.00 | BBB+ | 1,693,979 |
| | 2016, 5.000%, 6/15/31 | | | |
| 160 | | North Las Vegas, Nevada, Local Improvement Bonds, Special Improvement District 65 | 12/27 at 100.00 | N/R | 174,720 |
| | Northern Beltway Commercial Area, Series 2017, 5.000%, 12/01/37, 144A | | | |
| 4,430 | | Total Nevada | | | 4,970,210 |
| | New Jersey – 10.9% (8.4% of Total Investments) | | | |
| 3,000 | | Camden County Improvement Authority, New Jersey, Health Care Redevelopment Revenue | 2/24 at 100.00 | BBB+ | 3,309,180 |
| | Bonds, Cooper Health System Obligated Group Issue, Refunding Series 2014A, 5.000%, 2/15/31 | | | |
| 900 | | New Jersey Economic Development Authority, Cigarette Tax Revenue Refunding Bonds, Series | 6/22 at 100.00 | BBB | 925,578 |
| | 2012, 5.000%, 6/15/25 | | | |
| 2,500 | | New Jersey Economic Development Authority, Lease Revenue Bonds, State Government | 12/27 at 100.00 | Baa1 | 2,866,125 |
| | Buildings-Health Department & Taxation Division Office Project, Series 2018A, 5.000%, 6/15/42 | | | |
| 1,875 | | New Jersey Economic Development Authority, Lease Revenue Bonds, State House Project, | 12/28 at 100.00 | Baa1 | 2,222,850 |
| | Series 2017B, 5.000%, 6/15/35 | | | |
| 1,400 | | New Jersey Economic Development Authority, New Jersey, Transit Transportation Project | 11/29 at 100.00 | Baa1 | 1,529,598 |
| | Revenue Bonds, Series 2020A, 4.000%, 11/01/37 | | | |
| 2,705 | | New Jersey Economic Development Authority, Revenue Bonds, Motor Vehicle Surcharge, | 7/27 at 100.00 | BBB | 2,733,700 |
| | Refunding Series 2017A, 3.375%, 7/01/30 | | | |
| 2,175 | | New Jersey Economic Development Authority, School Facilities Construction Bonds, Series | 6/27 at 100.00 | Baa1 | 2,472,823 |
| | 2017DDD, 5.000%, 6/15/42 | | | |
| 1,200 | | New Jersey Economic Development Authority, School Facilities Construction Bonds, Tender | 3/23 at 100.00 | Baa1 | 1,086,264 |
| | Option Bond Trust Series 2018-XG0168, 4.879%, 9/01/27, 144A (IF) (5) | | | |
28
| | | | | | |
| Principal | | | Optional Call | | |
| Amount (000) | | Description (1) | Provisions (2) | Ratings (3) | Value |
| | New Jersey (continued) | | | |
| $ 1,615 | | New Jersey Economic Development Authority, School Facilities Construction Financing | 6/24 at 100.00 | Baa1 | $ 1,724,239 |
| | Program Bonds, Refunding Series 2014PP, 4.000%, 6/15/28 | | | |
| 1,440 | | New Jersey Economic Development Authority, School Facilities Construction Financing | 3/25 at 100.00 | Baa1 | 1,273,867 |
| | Program Bonds, Tender Option Bond Trust 2016-XF2340, 3.394%, 9/01/25, 144A (IF) (5) | | | |
| | New Jersey Economic Development Authority, Special Facilities Revenue Bonds, Continental | | | |
| | Airlines Inc, Series 1999: | | | |
| 2,320 | | 5.125%, 9/15/23 (AMT) | 8/22 at 101.00 | Ba3 | 2,431,801 |
| 7,550 | | 5.250%, 9/15/29 (AMT) | 8/22 at 101.00 | Ba3 | 7,919,950 |
| 2,410 | | New Jersey Economic Development Authority, Special Facilities Revenue Bonds, Continental | 3/24 at 101.00 | Ba3 | 2,558,432 |
| | Airlines Inc, Series 2000A & 2000B, 5.625%, 11/15/30 (AMT) | | | |
| 5,000 | | New Jersey Educational Facilities Authority, Revenue Bonds, Higher Education Capital | 9/24 at 100.00 | Baa1 | 5,295,100 |
| | Improvement Fund Issue, Series 2014A, 4.000%, 9/01/29 | | | |
| 7,000 | | New Jersey Health Care Facilities Financing Authority, New Jersey, Revenue Bonds, Saint | 7/21 at 100.00 | BB+ | 7,163,660 |
| | Peters University Hospital, Refunding Series 2011, 6.000%, 7/01/26 | | | |
| 1,200 | | New Jersey Health Care Facilities Financing Authority, Revenue Bonds, Princeton | 7/26 at 100.00 | AA | 1,456,284 |
| | HealthCare System, Series 2016A, 5.000%, 7/01/30 (5) | | | |
| 1,625 | | New Jersey Transportation Trust Fund Authority, Transportation System Bonds, Refunding | No Opt. Call | Baa1 | 1,266,996 |
| | Series 2006C, 0.000%, 12/15/31 – FGIC Insured | | | |
| 15,000 | | New Jersey Transportation Trust Fund Authority, Transportation System Bonds, Series | No Opt. Call | Baa1 | 8,228,100 |
| | 2009A, 0.000%, 12/15/39 (UB) (5) | | | |
| 1,000 | | New Jersey Transportation Trust Fund Authority, Transportation System Bonds, Series | 12/24 at 100.00 | Baa1 | 1,123,970 |
| | 2009C, 5.250%, 6/15/32 | | | |
| 2,250 | | New Jersey Transportation Trust Fund Authority, Transportation System Bonds, Series | 12/28 at 100.00 | Baa1 | 2,718,022 |
| | 2019AA, 5.000%, 6/15/31 | | | |
| 500 | | New Jersey Turnpike Authority, Revenue Bonds, Tender Option Bond Trust 2016-XF1057, | 7/22 at 100.00 | N/R (4) | 690,095 |
| | 22.017%, 1/01/24 (Pre-Refunded 7/01/22), 144A (IF) (5) | | | |
| | South Jersey Port Corporation, New Jersey, Marine Terminal Revenue Bonds, Refunding | | | |
| | Series 2016S: | | | |
| 915 | | 5.000%, 1/01/34 | 1/26 at 100.00 | Baa1 | 1,030,034 |
| 1,505 | | 5.000%, 1/01/35 | 1/26 at 100.00 | Baa1 | 1,692,132 |
| 1,000 | | 5.000%, 1/01/39 | 1/26 at 100.00 | Baa1 | 1,111,020 |
| 1,705 | | South Jersey Port Corporation, New Jersey, Marine Terminal Revenue Bonds, Subordinate | 1/28 at 100.00 | Baa1 | 1,909,975 |
| | Series 2017B, 5.000%, 1/01/42 (AMT) | | | |
| | Tobacco Settlement Financing Corporation, New Jersey, Tobacco Settlement Asset-Backed | | | |
| | Bonds, Series 2018A: | | | |
| 2,250 | | 5.000%, 6/01/27 | No Opt. Call | A | 2,860,740 |
| 1,920 | | 5.000%, 6/01/30 | 6/28 at 100.00 | A– | 2,461,574 |
| 73,960 | | Total New Jersey | | | 72,062,109 |
| | New Mexico – 0.5% (0.4% of Total Investments) | | | |
| 1,020 | | Bernalillo County, New Mexico, Multifamily Housing Revenue Bonds, Valencia Retirement | 12/20 at 100.00 | N/R | 1,020,683 |
| | Apartments Project, Series 2001A, 5.450%, 6/01/34 – AMBAC Insured (AMT) | | | |
| 2,000 | | Santa Fe, New Mexico, Retirement Facilities Revenue Bonds, EL Castillo Retirement | 5/22 at 100.00 | BB+ | 2,039,260 |
| | Residences Project, Series 2012, 5.000%, 5/15/32 | | | |
| 3,020 | | Total New Mexico | | | 3,059,943 |
| | New York – 14.1% (10.8% of Total Investments) | | | |
| 570 | | Build New York City Resource Corporation, New York, Revenue Bonds, Bronx Charter School | No Opt. Call | BBB– | 593,991 |
| | for Excellence, Series 2013A, 4.000%, 4/01/23 | | | |
| 985 | | Build New York City Resource Corporation, New York, Solid Waste Disposal Revenue Bonds, | No Opt. Call | N/R | 1,049,242 |
| | Pratt Paper NY, Inc Project, Series 2014, 4.500%, 1/01/25 (AMT), 144A | | | |
29
| | |
| NID | Nuveen Intermediate Duration Municipal Term Fund Portfolio of Investments (continued) November 30, 2020 (Unaudited) |
| | | | | | |
| Principal | | | Optional Call | | |
| Amount (000) | | Description (1) | Provisions (2) | Ratings (3) | Value |
| | New York (continued) | | | |
| | Dormitory Authority of the State of New York, Insured Revenue Bonds, Pace University, | | | |
| | Series 2013A: | | | |
| $ 20 | | 5.000%, 5/01/23 (ETM) | No Opt. Call | N/R (4) | $ 22,316 |
| 820 | | 5.000%, 5/01/23 | No Opt. Call | BBB– | 885,133 |
| 25 | | 5.000%, 5/01/28 (Pre-refunded 5/01/23) | 5/23 at 100.00 | N/R (4) | 27,830 |
| 975 | | 5.000%, 5/01/28 | 5/23 at 100.00 | BBB– | 1,041,563 |
| 10,000 | | Hudson Yards Infrastructure Corporation, New York, Revenue Bonds, Second Indenture | No Opt. Call | Aa2 | 12,543,700 |
| | Fiscal 2017 Series A, 5.000%, 2/15/27 (UB) (5) | | | |
| 790 | | Jefferson County Civic Facility Development Corporation, New York, Revenue Bonds, | 11/27 at 100.00 | BBB– | 798,895 |
| | Samaritan Medical Center Project, Series 2017A, 4.000%, 11/01/42 | | | |
| | Metropolitan Transportation Authority, New York, Transportation Revenue Bonds, Bond | | | |
| | Anticipation Note Series 2019B-1: | | | |
| 1,500 | | 5.000%, 5/15/22 | No Opt. Call | N/R | 1,553,895 |
| 10,000 | | 5.000%, 5/15/22 (UB) (5) | No Opt. Call | N/R | 10,359,300 |
| 6,555 | | Metropolitan Transportation Authority, New York, Transportation Revenue Bonds, Bond | No Opt. Call | N/R | 6,836,668 |
| | Anticipation Note Series 2019D-1, 5.000%, 9/01/22 | | | |
| 780 | | Metropolitan Transportation Authority, New York, Transportation Revenue Bonds, Bond | No Opt. Call | N/R | 820,778 |
| | Anticipation Note Series 2020A-1, 5.000%, 2/01/23 | | | |
| 1,000 | | Nassau County Tobacco Settlement Corporation, New York, Tobacco Settlement Asset-Backed | 12/20 at 100.00 | B– | 1,013,570 |
| | Bonds, Refunding Series 2006A-2, 5.250%, 6/01/26 | | | |
| | New York City Industrial Development Agency, New York, PILOT Payment in Lieu of Taxes | | | |
| | Revenue Bonds, Queens Baseball Stadium Project, Series 2006: | | | |
| 190 | | 5.000%, 1/01/22 – AMBAC Insured | 12/20 at 100.00 | Baa3 | 190,038 |
| 2,740 | | 5.000%, 1/01/39 – AMBAC Insured | 12/20 at 100.00 | Baa3 | 2,741,096 |
| 3,300 | | New York Counties Tobacco Trust VI, New York, Tobacco Settlement Pass-Through Bonds, | No Opt. Call | BBB | 3,561,063 |
| | Series Series 2016A-1, 5.625%, 6/01/35 | | | |
| 1,325 | | New York Liberty Development Corporation, New York, Liberty Revenue Bonds, 3 World Trade | 11/24 at 100.00 | N/R | 1,373,469 |
| | Center Project, Class 1 Series 2014, 5.000%, 11/15/44, 144A | | | |
| 6,500 | | New York Liberty Development Corporation, New York, Liberty Revenue Bonds, 3 World Trade | 11/24 at 100.00 | N/R | 6,806,995 |
| | Center Project, Class 2 Series 2014, 5.150%, 11/15/34, 144A | | | |
| 2,705 | | New York Liberty Development Corporation, New York, Liberty Revenue Bonds, 4 World Trade | 11/21 at 100.00 | A | 2,810,495 |
| | Center Project, Series 2011, 5.000%, 11/15/31 | | | |
| | New York Transportation Development Corporation, New York, Special Facilities Bonds, | | | |
| | LaGuardia Airport Terminal B Redevelopment Project, Series 2016A: | | | |
| 760 | | 4.000%, 7/01/32 (AMT) | 7/24 at 100.00 | BBB | 805,091 |
| 500 | | 4.000%, 7/01/33 (AMT) | 7/24 at 100.00 | BBB | 528,465 |
| | New York Transportation Development Corporation, New York, Special Facility Revenue Bonds, | | | |
| | American Airlines, Inc John F Kennedy International Airport Project, Refunding Series 2016: | | | |
| 2,390 | | 5.000%, 8/01/26 (AMT) | 8/21 at 100.00 | B+ | 2,411,462 |
| 430 | | 5.000%, 8/01/31 (AMT) | 8/21 at 100.00 | B+ | 432,172 |
| 1,135 | | New York Transportation Development Corporation, New York, Special Facility Revenue | 8/30 at 100.00 | B+ | 1,239,170 |
| | Bonds, American Airlines, Inc John F Kennedy International Airport Project, Series 2020, | | | |
| | 5.250%, 8/01/31 (AMT) | | | |
| 1,000 | | New York Transportation Development Corporation, New York, Special Facility Revenue | No Opt. Call | BBB | 1,002,950 |
| | Refunding Bonds, Terminal One Group Association, LP Project, Series 2015, 5.000%, 1/01/21 (AMT) | | | |
| | New York Transportation Development Corporation, Special Facility Revenue Bonds, Delta | | | |
| | Air Lines, Inc – LaGuardia Airport Terminals C&D Redevelopment Project, Series 2018: | | | |
| 2,000 | | 5.000%, 1/01/28 (AMT) | No Opt. Call | Baa3 | 2,350,840 |
| 2,000 | | 5.000%, 1/01/30 (AMT) | 1/28 at 100.00 | Baa3 | 2,321,300 |
| 2,315 | | 5.000%, 1/01/32 (AMT) | 1/28 at 100.00 | Baa3 | 2,665,097 |
| 1,680 | | 5.000%, 1/01/33 (AMT) | 1/28 at 100.00 | Baa3 | 1,924,188 |
| 935 | | 5.000%, 1/01/36 (AMT) | 1/28 at 100.00 | Baa3 | 1,061,141 |
| 4,110 | | Port Authority of New York and New Jersey, Consolidated Revenue Bonds, Two Hundred | 7/30 at 100.00 | Aa3 | 4,695,634 |
| | Twenty-one Series 2020, 4.000%, 7/15/50 (AMT) (UB) (5) | | | |
30
| | | | | | |
| Principal | | | Optional Call | | |
| Amount (000) | | Description (1) | Provisions (2) | Ratings (3) | Value |
| | New York (continued) | | | |
| | Syracuse Industrial Development Authority, New York, PILOT Revenue Bonds, Carousel | | | |
| | Center Project, Refunding Series 2016A: | | | |
| $ 820 | | 5.000%, 1/01/32 (AMT) | 1/26 at 100.00 | BB | $ 753,654 |
| 3,820 | | 5.000%, 1/01/35 (AMT) | 1/26 at 100.00 | BB | 3,396,706 |
| 650 | | 5.000%, 1/01/36 (AMT) | 1/26 at 100.00 | BB | 571,935 |
| 6,890 | | TSASC Inc, New York, Tobacco Asset-Backed Bonds, Series 2006, 5.000%, 6/01/45 | 6/27 at 100.00 | CCC+ | 7,258,615 |
| | TSASC Inc, New York, Tobacco Settlement Asset-Backed Bonds, Fiscal 2017 Series B: | | | |
| 2,000 | | 5.000%, 6/01/24 | No Opt. Call | B– | 2,067,100 |
| 2,250 | | 5.000%, 6/01/25 | No Opt. Call | B– | 2,343,645 |
| 86,465 | | Total New York | | | 92,859,202 |
| | North Carolina – 1.1% (0.9% of Total Investments) | | | |
| 6,225 | | North Carolina Turnpike Authority, Triangle Expressway System Revenue Bonds, Senior Lien | 1/30 at 100.00 | Aa1 | 7,578,004 |
| | Series 2019, 5.000%, 1/01/49 | | | |
| | Ohio – 4.0% (3.1% of Total Investments) | | | |
| 7,450 | | Buckeye Tobacco Settlement Financing Authority, Ohio, Tobacco Settlement Asset-Backed | 6/30 at 100.00 | BBB+ | 7,604,736 |
| | Revenue Bonds, Refunding Senior Lien Series 2020A-2 Class 1, 3.000%, 6/01/48 | | | |
| 5,650 | | Buckeye Tobacco Settlement Financing Authority, Ohio, Tobacco Settlement Asset-Backed | 6/30 at 100.00 | N/R | 6,354,103 |
| | Revenue Bonds, Refunding Senior Lien Series 2020B-2 Class 2, 5.000%, 6/01/55 | | | |
| 3,240 | | Cleveland, Ohio, Airport Special Revenue Bonds, Continental Airlines Inc Project, Series | 12/20 at 100.00 | Ba3 | 3,245,022 |
| | 1998, 5.375%, 9/15/27 (AMT) | | | |
| 560 | | Franklin County Convention Facilities Authority, Ohio, Hotel Project Revenue Bonds, | 12/29 at 100.00 | BBB– | 578,693 |
| | Greater Columbus Convention Center Hotel Expansion Project, Series 2019, 5.000%, 12/01/51 | | | |
| 4,190 | | Ohio Air Quality Development Authority, Ohio, Air Quality Development Revenue Bonds, | No Opt. Call | N/R | 5,238 |
| | FirstEnergy Generation Corporation Project, Series 2009A, 5.700%, 8/01/20 (8) | | | |
| 6,000 | | Ohio Air Quality Development Authority, Ohio, Pollution Control Revenue Bonds, | No Opt. Call | N/R | 6,045,000 |
| | FirstEnergy Generation Corporation Project, Refunding Series 2009D, 4.250%, 8/01/29 | | | |
| | (Mandatory Put 9/15/21) | | | |
| 17,065 | | Ohio Air Quality Development Authority, Ohio, Pollution Control Revenue Bonds, | No Opt. Call | N/R | 21,331 |
| | FirstEnergy Generation Project, Refunding Series 2006A, 3.750%, 12/01/23 (8) | | | |
| 320 | | Ohio Air Quality Development Authority, Ohio, Pollution Control Revenue Bonds, | No Opt. Call | N/R | 322,400 |
| | FirstEnergy Nuclear Generation Project, Refunding Series 2009A, 4.375%, 6/01/33 (Mandatory | | | |
| | Put 6/01/22) | | | |
| 130 | | Ohio Air Quality Development Authority, Ohio, Revenue Bonds, AK Steel Holding | 2/22 at 100.00 | CCC | 127,604 |
| | Corporation, Refunding Series 2012A, 6.750%, 6/01/24 (AMT) | | | |
| 260 | | Ohio Air Quality Development Authority, Ohio, Revenue Bonds, Pratt Paper Ohio, LLC | 1/28 at 100.00 | N/R | 285,407 |
| | Project, Series 2017, 4.250%, 1/15/38 (AMT), 144A | | | |
| 250 | | Ohio Water Development Authority, Ohio, Environmental Improvement Bonds, United States | 11/21 at 100.00 | B– | 252,318 |
| | Steel Corporation Project, Refunding Series 2011, 6.600%, 5/01/29 | | | |
| 6,000 | | Ohio Water Development Authority, Pollution Control Revenue Refunding Bonds, FirstEnergy | No Opt. Call | N/R | 7,500 |
| | Nuclear Generating Corporation Project, Series 2006B, 4.000%, 12/01/33 (8) | | | |
| 1,430 | | Southeastern Ohio Port Authority, Hospital Facilities Revenue Bonds, Memorial Health | No Opt. Call | BB– | 1,480,708 |
| | System Obligated Group Project, Refunding and Improvement Series 2012, 5.000%, 12/01/22 | | | |
| 52,545 | | Total Ohio | | | 26,330,060 |
| | Oklahoma – 1.1% (0.9% of Total Investments) | | | |
| 975 | | Oklahoma Development Finance Authority, Health System Revenue Bonds, OU Medicine | 8/28 at 100.00 | Baa3 | 1,148,365 |
| | Project, Series 2018B, 5.000%, 8/15/38 | | | |
| 6,050 | | Tulsa Municipal Airport Trust, Oklahoma, Revenue Bonds, American Airlines Inc, Refunding | 6/25 at 100.00 | B– | 6,304,342 |
| | Series 2015, 5.000%, 6/01/35 (AMT) (Mandatory Put 6/01/25) | | | |
| 7,025 | | Total Oklahoma | | | 7,452,707 |
31
| | |
| NID | Nuveen Intermediate Duration Municipal Term Fund Portfolio of Investments (continued) November 30, 2020 (Unaudited) |
| | | | | | |
| Principal | | | Optional Call | | |
| Amount (000) | | Description (1) | Provisions (2) | Ratings (3) | Value |
| | Oregon – 0.3% (0.2% of Total Investments) | | | |
| $ 1,000 | | Astoria Hospital Facilities Authority, Oregon, Hospital Revenue and Refunding Bonds, | 8/22 at 100.00 | A– | $ 1,057,600 |
| | Columbia Memorial Hospital, Series 2012, 5.000%, 8/01/31 | | | |
| 730 | | Port of Saint Helens, Oregon, Pollution Control Revenue Bonds, Boise Cascade Project, | 12/20 at 100.00 | N/R | 701,202 |
| | Series 1997, 5.650%, 12/01/27 | | | |
| 1,730 | | Total Oregon | | | 1,758,802 |
| | Pennsylvania – 5.7% (4.4% of Total Investments) | | | |
| | Allegheny County Industrial Development Authority, Pennsylvania, Environmental | | | |
| | Improvement Revenue Bonds, United States Steel Corp, Refunding Series 2019: | | | |
| 815 | | 4.875%, 11/01/24 | No Opt. Call | B– | 794,348 |
| 725 | | 5.125%, 5/01/30 | No Opt. Call | B– | 675,511 |
| 530 | | Allegheny County Redevelopment Authority, Pennsylvania, TIF Revenue Bonds, Pittsburg | 12/20 at 100.00 | N/R | 477,000 |
| | Mills Project, Series 2004, 5.600%, 7/01/23 | | | |
| 3,685 | | Allentown Neighborhood Improvement Zone Development Authority, Pennsylvania, Tax | 5/22 at 100.00 | Baa3 | 3,835,643 |
| | Revenue Bonds, Series 2012A, 5.000%, 5/01/32 | | | |
| 1,000 | | Allentown Neighborhood Improvement Zone Development Authority, Pennsylvania, Tax Revenue | No Opt. Call | Baa3 | 1,125,670 |
| | Bonds, City Center Project, Series 2018, 5.000%, 5/01/28, 144A | | | |
| 420 | | Beaver County Industrial Development Authority, Pennsylvania, Pollution Control Revenue | No Opt. Call | N/R | 525 |
| | Bonds, FirstEnergy Nuclear Generation Project, Refunding Series 2005A, 4.000%, 1/01/35 (8) | | | |
| 400 | | Beaver County Industrial Development Authority, Pennsylvania, Pollution Control Revenue | No Opt. Call | N/R | 500 |
| | Bonds, FirstEnergy Nuclear Generation Project, Refunding Series 2008A, 2.700%, 4/01/35 (8) | | | |
| 1,450 | | Doylestown Hospital Authority, Pennsylvania, Hospital Revenue Bonds, Series 2013A, | No Opt. Call | BBB– | 1,573,192 |
| | 5.000%, 7/01/23 | | | |
| 825 | | East Hempfield Township Industrial Development Authority, Pennsylvania, Student Services | 7/25 at 100.00 | BB+ | 834,718 |
| | Inc – Student Housing Project at Millersville University, Series 2015, 5.000%, 7/01/30 | | | |
| 1,000 | | Montgomery County Industrial Development Authority, Pennsylvania, Revenue Bonds, | 1/25 at 100.00 | N/R | 1,029,680 |
| | Whitemarsh Continuing Care Retirement Community Project, Series 2015, 5.000%, 1/01/30 | | | |
| 1,595 | | Northampton County Industrial Development Authority, Pennsylvania, Revenue Bonds, | 7/22 at 100.00 | BB+ | 1,631,191 |
| | Morningstar Senior Living, Inc, Series 2012, 5.000%, 7/01/27 | | | |
| 1,805 | | Pennsylvania Economic Development Financing Authority, Exempt Facilities Revenue Bonds, | No Opt. Call | N/R | 2,256 |
| | Shippingport Project, First Energy Guarantor, Series 2005A, 3.750%, 12/01/40 (8) | | | |
| 1,970 | | Pennsylvania Higher Educational Facilities Authority, Revenue Bonds, University of | 8/29 at 100.00 | AA | 2,272,868 |
| | Pennsylvania Health System, Series 2019, 4.000%, 8/15/49 | | | |
| 4,000 | | Pennsylvania Public School Building Authority, Lease Revenue Bonds, School District of | No Opt. Call | AA | 4,994,640 |
| | Philadelphia, Series 2006B, 5.000%, 6/01/27 – AGM Insured | | | |
| 3,500 | | Pennsylvania Turnpike Commission, Turnpike Revenue Bonds, Refunding Subordinate Second | 12/27 at 100.00 | A3 | 4,260,655 |
| | Series 2017, 5.000%, 12/01/35 | | | |
| 10,980 | | Philadelphia Hospitals and Higher Education Facilities Authority, Pennsylvania, Hospital | 7/27 at 100.00 | BBB– | 12,608,663 |
| | Revenue Bonds, Temple University Health System Obligated Group, Series of 2017, 5.000%, 7/01/34 | | | |
| 1,610 | | Scranton, Lackawanna County, Pennsylvania, General Obligation Notes, Series 2016, | 5/24 at 100.00 | BB+ | 1,743,566 |
| | 5.000%, 11/15/32 | | | |
| 36,310 | | Total Pennsylvania | | | 37,860,626 |
| | Puerto Rico – 3.3% (2.5% of Total Investments) | | | |
| 3,000 | | Puerto Rico Aqueduct and Sewerage Authority, Revenue Bonds, Senior Lien Series 2012A, | 7/22 at 100.00 | CCC | 3,150,000 |
| | 5.750%, 7/01/37 | | | |
| 3,500 | | Puerto Rico Highway and Transportation Authority, Highway Revenue Bonds, Series 2007N, | No Opt. Call | C | 3,297,140 |
| | 2.430%, 7/01/27 | | | |
| | Puerto Rico Sales Tax Financing Corporation, Sales Tax Revenue Bonds, Restructured 2018A-1: | | | |
| 4,000 | | 0.000%, 7/01/31 | 7/28 at 91.88 | N/R | 3,058,840 |
| 3,041 | | 0.000%, 7/01/33 | 7/28 at 86.06 | N/R | 2,146,703 |
| 449 | | 4.500%, 7/01/34 | 7/25 at 100.00 | N/R | 481,386 |
| 1,245 | | 0.000%, 7/01/51 | 7/28 at 30.01 | N/R | 270,128 |
| 2,031 | | 4.750%, 7/01/53 | 7/28 at 100.00 | N/R | 2,206,539 |
| 4,500 | | 5.000%, 7/01/58 | 7/28 at 100.00 | N/R | 4,963,365 |
32
| | | | | | |
| Principal | | | Optional Call | | |
| Amount (000) | | Description (1) | Provisions (2) | Ratings (3) | Value |
| | Puerto Rico (continued) | | | |
| $ 1,791 | | Puerto Rico Sales Tax Financing Corporation, Sales Tax Revenue Bonds, Taxable | 7/28 at 100.00 | N/R | $ 1,914,507 |
| | Restructured Cofina Project Series 2019A-2, 4.329%, 7/01/40 | | | |
| 23,557 | | Total Puerto Rico | | | 21,488,608 |
| | Rhode Island – 0.5% (0.4% of Total Investments) | | | |
| | Providence Redevelopment Agency, Rhode Island, Revenue Bonds, Public Safety and | | | |
| | Municipal Building Projects, Refunding Series 2015A: | | �� | |
| 1,400 | | 5.000%, 4/01/23 | No Opt. Call | BBB | 1,492,890 |
| 1,500 | | 5.000%, 4/01/24 | No Opt. Call | BBB | 1,638,345 |
| 2,900 | | Total Rhode Island | | | 3,131,235 |
| | South Carolina – 1.1% (0.8% of Total Investments) | | | |
| 1,450 | | South Carolina Jobs-Economic Development Authority, Economic Development Revenue Bonds, | 2/25 at 100.00 | BB+ | 1,548,281 |
| | Palmetto Scholars Academy Project, Series 2015A, 5.125%, 8/15/35, 144A | | | |
| | South Carolina Jobs-Economic Development Authority, Hospital Revenue Bonds, Bon Secours | | | |
| | Health System Obligated Group, Tender Option Bond Trust 2016-XG0098: | | | |
| 1,500 | | 21.701%, 11/01/27 (Pre-Refunded 11/01/22), 144A (IF) (5) | 11/22 at 100.00 | N/R (4) | 2,179,755 |
| 1,010 | | 21.680%, 11/01/28 (Pre-Refunded 11/01/22), 144A (IF) (5) | 11/22 at 100.00 | N/R (4) | 1,467,247 |
| 1,255 | | 21.701%, 11/01/29 (Pre-Refunded 11/01/22), 144A (IF) (5) | 11/22 at 100.00 | N/R (4) | 1,823,729 |
| 5,215 | | Total South Carolina | | | 7,019,012 |
| | Tennessee – 1.0% (0.8% of Total Investments) | | | |
| 2,000 | | Clarksville Natural Gas Acquisition Corporation, Tennessee, Natural Gas Revenue Bonds, | No Opt. Call | A+ | 2,091,180 |
| | Series 2006, 5.000%, 12/15/21 – SYNCORA GTY Insured | | | |
| 1,935 | | Knox County Health, Educational and Housing Facility Board, Tennessee, Hospital Revenue | 1/23 at 100.00 | A+ | 2,104,893 |
| | Bonds, Covenant Health, Refunding Series 2012A, 5.000%, 1/01/26 | | | |
| | Knox County Health, Educational, and Housing Facilities Board, Tennessee, Revenue Bonds, | | | |
| | Provision Center for Proton Therapy Project, Series 2014: | | | |
| 3,055 | | 5.250%, 5/01/25, 144A (8) | 11/24 at 100.00 | N/R | 2,291,250 |
| 525 | | 6.000%, 5/01/34, 144A (8) | 11/24 at 100.00 | N/R | 393,750 |
| 7,515 | | Total Tennessee | | | 6,881,073 |
| | Texas – 4.3% (3.3% of Total Investments) | | | |
| 1,265 | | Austin, Travis, Williamson and Hays Counties, Texas, Special Assessment Revenue Bonds, | 11/23 at 100.00 | N/R | 1,315,347 |
| | Estancia Hill Country Public Improvement District, Series 2013, 6.000%, 11/01/28 | | | |
| 2,000 | | Central Texas Regional Mobility Authority, Revenue Bonds, Senior Lien, Series 2015A, | 7/25 at 100.00 | A– | 2,298,100 |
| | 5.000%, 1/01/40 | | | |
| 355 | | Clifton Higher Education Finance Corporation, Texas, Education Revenue Bonds, Idea | No Opt. Call | A– | 365,281 |
| | Public Schools, Series 2012, 3.750%, 8/15/22 | | | |
| 2,000 | | Dallas Area Rapid Transit, Texas, Sales Tax Revenue Bonds, Tender Option Bond Trust | No Opt. Call | AA+ | 6,038,020 |
| | 3307, 23.461%, 12/01/30, 144A (IF) (5) | | | |
| 2,000 | | Gulf Coast Industrial Development Authority, Texas, Solid Waste Disposal Revenue Bonds, | 10/22 at 100.00 | BB | 2,027,660 |
| | Citgo Petroleum Corporation Project, Series 1995, 4.875%, 5/01/25 (AMT) | | | |
| | Harris County Cultural Education Facilities Finance Corporation, Texas, Revenue | | | |
| | Refunding Bonds, Young Men’s Christian Association of the Greater Houston Area, Series 2013A: | | | |
| 535 | | 5.000%, 6/01/21 | No Opt. Call | Baa2 | 540,880 |
| 855 | | 5.000%, 6/01/22 | No Opt. Call | Baa2 | 881,633 |
| 915 | | 5.000%, 6/01/23 | No Opt. Call | Baa2 | 960,512 |
| 3,750 | | Harris County-Houston Sports Authority, Texas, Revenue Bonds, Third Lien Series 2004A-3, | 11/24 at 49.42 | Baa2 | 1,637,962 |
| | 0.000%, 11/15/36 | | | |
| 3,000 | | Houston, Texas, Airport System Special Facilities Revenue Bonds, United Airlines, Inc | No Opt. Call | B | 3,297,030 |
| | Airport Improvement Projects, Series 2018C, 5.000%, 7/15/28 (AMT) | | | |
| 250 | | Houston, Texas, Airport System Special Facilities Revenue Bonds, United Airlines, Inc | No Opt. Call | BB– | 273,550 |
| | Terminal Improvements Project, Refunding Series 2020B-2, 5.000%, 7/15/27 (AMT) | | | |
| 200 | | Love Field Airport Modernization Corporation, Texas, Special Facilities Revenue Bonds, | No Opt. Call | Baa1 | 207,520 |
| | Southwest Airlines Company – Love Field Modernization Program Project, Series 2012, 5.000%, | | | |
| | 11/01/21 (AMT) | | | |
33
| | |
| NID | Nuveen Intermediate Duration Municipal Term Fund Portfolio of Investments (continued) November 30, 2020 (Unaudited) |
| | | | | | |
| Principal | | | Optional Call | | |
| Amount (000) | | Description (1) | Provisions (2) | Ratings (3) | Value |
| | Texas (continued) | | | |
| $ 1,000 | | New Hope Cultural Education Facilities Finance Corporation, Texas, Student Housing | 4/24 at 100.00 | B– | $ 942,300 |
| | Revenue Bonds, CHF-Collegiate Housing Corpus Christi I, LLC-Texas A&M University-Corpus | | | |
| | Christi Project, Series 2014A, 5.000%, 4/01/34 | | | |
| 2,680 | | San Antonio Public Facilities Corporation, Texas, Lease Revenue Bonds, Convention Center | 9/22 at 100.00 | AA+ | 3,601,116 |
| | Refinancing & Expansion Project, Tender Option Bond Trust 2015-XF0125, 21.613%, | | | |
| | 9/15/29, 144A (IF) (5) | | | |
| | Tarrant County Cultural Education Facilities Finance Corporation, Texas, Hospital | | | |
| | Revenue Bonds, Scott & White Healthcare Project, Tender Option Bond Trust 2016-XG0058: | | | |
| 100 | | 22.273%, 8/15/22, 144A (IF) (5) | No Opt. Call | AA– | 136,678 |
| 155 | | 22.064%, 8/15/24, 144A (IF) (5) | 8/23 at 100.00 | AA– | 249,397 |
| 200 | | 22.273%, 8/15/26, 144A (IF) (5) | 8/23 at 100.00 | AA– | 323,780 |
| 170 | | 22.023%, 8/15/27, 144A (IF) (5) | 8/23 at 100.00 | AA– | 271,194 |
| 1,675 | | Texas Department of Housing and Community Affairs, Single Family Mortgage Revenue Bonds, | 9/27 at 100.00 | Aaa | 1,867,508 |
| | Series 2018A, 4.250%, 9/01/48 | | | |
| 1,190 | | Westlake, Texas, Special Assessment Revenue Bonds, Solana Public Improvement District, | 9/25 at 100.00 | N/R | 1,211,896 |
| | Series 2015, 6.125%, 9/01/35 | | | |
| 24,295 | | Total Texas | | | 28,447,364 |
| | Virgin Islands – 0.2% (0.1% of Total Investments) | | | |
| 1,085 | | Virgin Islands Public Finance Authority, Matching Fund Loan Notes Revenue Bonds, Senior | No Opt. Call | AA | 1,176,129 |
| | Lien, Refunding Series 2013B, 5.000%, 10/01/24 – AGM Insured | | | |
| | Virginia – 1.8% (1.4% of Total Investments) | | | |
| | Dulles Town Center Community Development Authority, Loudon County, Virginia Special | | | |
| | Assessment Refunding Bonds, Dulles Town Center Project, Series 2012: | | | |
| 1,000 | | 5.000%, 3/01/21 | No Opt. Call | N/R | 1,004,320 |
| 1,410 | | 5.000%, 3/01/22 | No Opt. Call | N/R | 1,438,468 |
| | Fairfax County Industrial Development Authority, Virginia, Healthcare Revenue Bonds, | | | |
| | Inova Health System,Tender Option Bond Trust 2016-XG0080, Formerly Tender Option | | | |
| | Bond Trust 3309: | | | |
| 1,800 | | 22.216%, 5/15/27, 144A (IF) (5) | 5/22 at 100.00 | AA+ | 2,397,996 |
| 400 | | 17.239%, 5/15/29, 144A (IF) (5) | 5/22 at 100.00 | AA+ | 492,116 |
| 120 | | 22.216%, 5/15/29, 144A (IF) (5) | 5/22 at 100.00 | AA+ | 159,677 |
| 1,000 | | Roanoke Economic Development Authority, Virgina, Residential Care Facility Mortgage | 12/22 at 100.00 | N/R | 1,007,740 |
| | Revenue Refunding Bonds, Virginia Lutheran Homes Brandon Oaks Project, Series 2012, | | | |
| | 5.000%, 12/01/32 | | | |
| | Virginia Gateway Community Development Authority, Prince William County, Virginia, | | | |
| | Special Assessment Refunding Bonds, Series 2012: | | | |
| 695 | | 5.000%, 3/01/25 | 3/22 at 100.00 | N/R | 703,159 |
| 120 | | 4.500%, 3/01/29 | 3/22 at 100.00 | N/R | 119,993 |
| 1,505 | | 5.000%, 3/01/30 | 3/22 at 100.00 | N/R | 1,515,926 |
| 2,500 | | Virginia Housing Development Authority, Rental Housing Bonds, Series 2018E, | 12/27 at 100.00 | AA+ | 2,794,600 |
| | 4.150%, 12/01/49 | | | |
| 10,550 | | Total Virginia | | | 11,633,995 |
| | Washington – 2.8% (2.2% of Total Investments) | | | |
| 2,200 | | Port of Seattle Industrial Development Corporation, Washington, Special Facilities | 4/23 at 100.00 | BB+ | 2,337,808 |
| | Revenue Refunding Bonds, Delta Air Lines, Inc Project, Series 2012, 5.000%, 4/01/30 (AMT) | | | |
| 4,000 | | Port of Seattle, Washington, Revenue Bonds, Refunding First Lien Series 2016B, 5.000%, | 4/26 at 100.00 | Aa2 | 4,668,040 |
| | 10/01/32 (AMT) (UB) | | | |
| 270 | | Tacoma Consolidated Local Improvement District 65, Washington, Special Assessment Bonds, | 12/20 at 100.00 | N/R | 270,308 |
| | Series 2013, 5.750%, 4/01/43 | | | |
| 5,000 | | Washington Health Care Facilities Authority, Revenue Bonds, Catholic Health Initiative, | 7/24 at 100.00 | BBB+ | 4,826,900 |
| | Tender Option Bonds Trust 2015-XF1017, 3.717%, 1/01/35, 144A (IF) (5) | | | |
| 970 | | Washington Health Care Facilities Authority, Revenue Bonds, CommonSpirit Health, Series | 8/29 at 100.00 | BBB+ | 1,207,572 |
| | 2019A-2, 5.000%, 8/01/35 | | | |
| | Washington State Housing Finance Commission, Non-Profit Housing Revenue Bonds, Mirabella | | | |
| | Project, Series 2012A: | | | |
| 1,200 | | 6.000%, 10/01/22, 144A | No Opt. Call | N/R | 1,233,012 |
| 2,085 | | 6.500%, 10/01/32, 144A | 10/22 at 100.00 | N/R | 2,133,018 |
34
| | | | | | |
| Principal | | | Optional Call | | |
| Amount (000) | | Description (1) | Provisions (2) | Ratings (3) | Value |
| | Washington (continued) | | | |
| | Washington State Housing Finance Commission, Non-Profit Revenue Bonds, Emerald Heights | | | |
| | Project, Refunding 2013: | | | |
| $ 1,000 | | 5.000%, 7/01/21 | No Opt. Call | A– | $ 1,014,070 |
| 1,000 | | 5.000%, 7/01/23 | No Opt. Call | A– | 1,056,940 |
| 17,725 | | Total Washington | | | 18,747,668 |
| | West Virginia – 0.1% (0.1% of Total Investments) | | | |
| 500 | | West Virginia Economic Development Authority, Excess Lottery Revenue Bonds, Series | 7/27 at 100.00 | AAA | 633,270 |
| | 2017A, 5.000%, 7/01/30 | | | |
| | Wisconsin – 3.0% (2.3% of Total Investments) | | | |
| 415 | | Platteville Redevelopment Authority, Wisconsin, Revenue Bonds, University of Wisconsin - | 7/22 at 100.00 | BBB– | 421,354 |
| | Platteville Real Estate Foundation Project, Series 2012A, 5.000%, 7/01/42 | | | |
| | Public Finance Authority of Wisconsin, Educational Facility Revenue Bonds, Cottonwood | | | |
| | Classical Preparatory School in Albuquerque, New Mexico, Series 2012A: | | | |
| 450 | | 5.250%, 12/01/22 (ETM) | No Opt. Call | N/R (4) | 467,991 |
| 1,610 | | 6.000%, 12/01/32 (Pre-refunded 12/01/22) | 12/22 at 100.00 | N/R (4) | 1,791,222 |
| 3,190 | | Public Finance Authority of Wisconsin, Limited Obligation Grant Revenue Bonds, American | No Opt. Call | N/R | 2,767,006 |
| | Dream @ Meadowlands Project, Series 2017A, 6.250%, 8/01/27, 144A | | | |
| | Public Finance Authority of Wisconsin, Limited Obligation PILOT Revenue Bonds, American | | | |
| | Dream @ Meadowlands Project, Series 2017: | | | |
| 1,200 | | 5.000%, 12/01/27, 144A | No Opt. Call | N/R | 1,064,724 |
| 1,000 | | 6.500%, 12/01/37, 144A | 12/27 at 100.00 | N/R | 876,180 |
| 395 | | Public Finance Authority of Wisconsin, Revenue Bonds, Prime Healthcare Foundation, Inc, | No Opt. Call | BBB– | 434,302 |
| | Series 2017A, 5.000%, 12/01/27 | | | |
| 255 | | Public Finance Authority of Wisconsin, Revenue Bonds, Roseman University of Health | No Opt. Call | BB | 259,618 |
| | Sciences, Series 2012, 5.000%, 4/01/22 | | | |
| 390 | | Public Finance Authority of Wisconsin, Senior Airport Facilities Revenue and Refunding | No Opt. Call | BBB+ | 406,126 |
| | Bonds, TrIPS Obligated Group, Series 2012B, 5.000%, 7/01/22 (AMT) | | | |
| 4,300 | | Public Finance Authority of Wisconsin, Solid Waste Disposal Revenue Bonds, Waste | 5/26 at 100.00 | A– | 4,631,874 |
| | Management Inc, Refunding Series 2016A-2, 2.875%, 5/01/27 (AMT) | | | |
| 1,115 | | Public Finance Authority of Wisconsin, Student Housing Revenue Bonds, Collegiate Housing | 7/25 at 100.00 | BBB– | 1,181,722 |
| | Foundation – Cullowhee LLC – Western California University Project, Series 2015A, | | | |
| | 5.000%, 7/01/30 | | | |
| | University of Wisconsin Hospitals and Clinics Authority, Revenue Bonds, Tender Option | | | |
| | Bond Trust 2015-XF0127: | | | |
| 50 | | 20.386%, 4/01/22, 144A (IF) (5) | No Opt. Call | AA– | 63,806 |
| 100 | | 21.198%, 4/01/23, 144A (IF) (5) | No Opt. Call | AA– | 149,756 |
| 185 | | 20.813%, 4/01/24, 144A (IF) (5) | 4/23 at 100.00 | AA– | 274,897 |
| 100 | | 21.198%, 4/01/25, 144A (IF) (5) | 4/23 at 100.00 | AA– | 149,404 |
| | Wisconsin Center District, Dedicated Tax Revenue Bonds, Refunding Junior Series 1999: | | | |
| 5 | | 5.250%, 12/15/23 | No Opt. Call | AA | 5,599 |
| 10 | | 5.250%, 12/15/23 (ETM) | No Opt. Call | AA (4) | 10,651 |
| 5 | | 5.250%, 12/15/27 (ETM) | No Opt. Call | AA (4) | 6,262 |
| 10 | | 5.250%, 12/15/27 | No Opt. Call | AA | 12,473 |
| 2,175 | | Wisconsin Housing and Economic Development Authority, Housing Revenue Bonds, Series | 11/26 at 100.00 | AA | 2,368,162 |
| | 2017A, 4.000%, 11/01/47 | | | |
| 2,000 | | Wisconsin Housing and Economic Development Authority, Housing Revenue Bonds, Series | 11/28 at 100.00 | AA | 2,140,400 |
| | 2019A, 3.150%, 11/01/44 | | | |
| 18,960 | | Total Wisconsin | | | 19,483,529 |
| $ 824,720 | | Total Municipal Bonds (cost $807,459,611) | | | 833,887,119 |
35
| | |
| NID | Nuveen Intermediate Duration Municipal Term Fund Portfolio of Investments (continued) November 30, 2020 (Unaudited) |
| | | | |
| Shares | | Description (1) | Value |
| | COMMON STOCKS – 3.3% (2.5% of Total Investments) | |
| | Electric Utilities – 3.3% (2.5% of Total Investments) | |
| 965,836 | | Energy Harbor Corp (9), (10), (11) | $ 21,792,158 |
| | Total Common Stocks (cost $25,699,081) | 21,792,158 |
| | Total Long-Term Investments (cost $833,158,692) | 855,679,277 |
| | Floating Rate Obligations – (4.7)% | (30,968,000) |
| | Adjustable Rate MuniFund Term Preferred Shares, net of deferred offering costs – (26.5)% (12) | (174,911,185) |
| | Other Assets Less Liabilities – 1.5% (13) | 10,191,511 |
| | Net Assets Applicable to Common Shares – 100% | $ 659,991,603 |
Investments in Derivatives
Futures Contracts
| | | | | | | | |
| | | | | | | | Variation |
| | | | | | | Unrealized | Margin |
| | Contract | Number of | Expiration | Notional | | Appreciation | Receivable/ |
| Description | Position | Contracts | Date | Amount | Value | (Depreciation) | (Payable) |
U.S. Treasury Ultra Bond | Short | (17) | 3/21 | $(3,685,308) | $(3,672,531) | $12,777 | $(531) |
| | |
(1) | All percentages shown in the Portfolio of Investments are based on net assets applicable to common shares unless otherwise noted. |
(2) | Optional Call Provisions: Dates (month and year) and prices of the earliest optional call or redemption. There may be other call provisions at varying prices at later dates. Certain mortgage-backed securities may be subject to periodic principal paydowns. |
(3) | For financial reporting purposes, the ratings disclosed are the highest of Standard & Poor’s Group (“Standard & Poor’s”), Moody’s Investors Service, Inc. (“Moody’s”) or Fitch, Inc. (“Fitch”) rating. This treatment of split-rated securities may differ from that used for other purposes, such as for Fund investment policies. Ratings below BBB by Standard & Poor’s, Baa by Moody’s or BBB by Fitch are considered to be below investment grade. Holdings designated N/R are not rated by any of these national rating agencies. |
(4) | Backed by an escrow or trust containing sufficient U.S. Government or U.S. Government agency securities, which ensure the timely payment of principal and interest. |
(5) | Investment, or portion of investment, has been pledged to collateralize the net payment obligations for investments in inverse floating rate transactions. |
(6) | Step-up coupon bond, a bond with a coupon that increases (“steps up”), usually at regular intervals, while the bond is outstanding. The rate shown is the coupon as of the end of the reporting period. |
(7) | Investment valued at fair value using methods determined in good faith by, or at the discretion of, the Board. For fair value measurement disclosure purposes, investment classified as Level 3. See Notes to Financial Statements, Note 3 - Investment Valuation and Fair Value Measurements for more information. |
(8) | Defaulted security. A security whose issuer has failed to fully pay principal and/or interest when due, or is under the protection of bankruptcy. |
(9) | For fair value measurement disclosure purposes, investment classified as Level 2. See Notes to Financial Statements, Note 3 - Investment Valuation and Fair Value Measurements for more information. |
(10) | Common Stock received as part of the bankruptcy settlement for Beaver County Industrial Development Authority, Pennsylvania, Pollution Control Revenue Bonds, FirstEnergy Nuclear Generation Project, Refunding Series 2005A, 4.000%, 1/01/35, Beaver County Industrial Development Authority, Pennsylvania, Pollution Control Revenue Refunding Bonds, FirstEnergy Nuclear Generation Project, Series 2008A, 2.700%, 4/01/35, Ohio Air Quality Development Authority, Ohio, Air Quality Development Revenue Bonds, FirstEnergy Generation Corporation Project, Series 2009A, 5.700%, 8/01/20, Ohio Air Quality Development Authority, Ohio, Pollution Control Revenue Bonds, FirstEnergy Generation Project, Refunding Series 2006A, 3.750%, 12/01/23, Ohio Water Development Authority, Pollution Control Revenue Refunding Bonds, FirstEnergy Nuclear Generating Corporation Project, Series 2006B, 0.000%, 12/01/33 and Pennsylvania Economic Development Financing Authority, Exempt Facilities Revenue Bonds, Shippingport Project, First Energy Guarantor, Series 2005A, 3.750%, 12/01/40. |
(11) | Non-income producing; issuer has not declared an ex-dividend date within the past twelve months. |
(12) | Adjustable Rate MuniFund Term Preferred Shares, net of deferred offering cost as a percentage of Total Investments is 20.4%. |
(13) | Other assets less liabilities includes the unrealized appreciation (depreciation) of certain over-the-counter (“OTC”) derivatives as presented on the Statement of Assets and Liabilities, when applicable. The unrealized appreciation (depreciation) of OTC cleared and exchange-traded derivatives is recognized as part of the cash collateral at brokers and/or the receivable or payable for variation margin as presented on the Statement of Assets and Liabilities, when applicable. |
144A | Investment is exempt from registration under Rule 144A of the Securities Act of 1933, as amended. These investments may only be resold in transactions exempt from registration, which are normally those transactions with qualified institutional buyers. |
AMT | Alternative Minimum Tax |
ETM | Escrowed to maturity. |
IF | Inverse floating rate security issued by a tender option bond (“TOB”) trust, the interest rate on which varies inversely with the Securities Industry Financial Markets Association (SIFMA) short-term rate, which resets weekly, or a similar short-term rate, and is reduced by the expenses related to the TOB trust. |
PIK | Payment-in-kind (“PIK”) security. Depending on the terms of the security, income may be received in the form of cash, securities, or a combination of both. The PIK rate shown, where applicable, represents the annualized rate of the last PIK payment made by the issuer as of the end of the reporting period. |
UB | Underlying bond of an inverse floating rate trust reflected as a financing transaction. See Notes to Financial Statements, Note 4 – Portfolio Securities and Investments in Derivatives, for more information. |
| See accompanying notes to financial statements. |
36
| | |
| NIQ | Nuveen Intermediate Duration Quality Municipal Term Fund Portfolio of Investments November 30, 2020 (Unaudited) |
| | | | | | |
| Principal | | | Optional Call | | |
| Amount (000) | | Description (1) | Provisions (2) | Ratings (3) | Value |
| | LONG-TERM INVESTMENTS – 125.5% (100.0% of Total Investments) | | | |
| | MUNICIPAL BONDS – 124.3% (99.1% of Total Investments) | | | |
| | Alabama – 2.2% (1.7% of Total Investments) | | | |
| $ 2,000 | | Alabama Federal Aid Highway Finance Authority, Federal Highway Grant Anticipation Revenue | 9/22 at 100.00 | AA (5) | $ 2,840,440 |
| | Bonds, Tender Option Bond Trust 2016-XL0024, 21.613%, 9/01/26 (Pre-Refunded 9/01/22), | | | |
| | 144A (IF) (4) | | | |
| 1,000 | | Lower Alabama Gas District, Alabama, Gas Project Revenue Bonds, Series 2016A, 5.000%, 9/01/34 | No Opt. Call | A | 1,376,170 |
| 290 | | Tuscaloosa County Industrial Development Authority, Alabama, Gulf Opportunity Zone Bonds, | 5/29 at 100.00 | N/R | 322,129 |
| | Hunt Refining Project, Refunding Series 2019A, 4.500%, 5/01/32, 144A | | | |
| 3,290 | | Total Alabama | | | 4,538,739 |
| | Arizona – 1.1% (0.9% of Total Investments) | | | |
| | Arizona Health Facilities Authority, Hospital Revenue Bonds, Phoenix Children’s | | | |
| | Hospital, Series 2013D: | | | |
| 965 | | 5.000%, 2/01/24 | 2/23 at 100.00 | A1 | 1,059,531 |
| 1,065 | | 5.000%, 2/01/26 | 2/23 at 100.00 | A1 | 1,168,273 |
| 2,030 | | Total Arizona | | | 2,227,804 |
| | California – 10.7% (8.5% of Total Investments) | | | |
| 3,000 | | Alameda Corridor Transportation Authority, California, Revenue Bonds, Refunding Senior | 10/23 at 100.00 | AA | 3,351,780 |
| | Lien Series 2013A, 5.000%, 10/01/27 – AGM Insured | | | |
| 55 | | California County Tobacco Securitization Agency, Tobacco Settlement Asset-Backed Bonds, | 6/30 at 100.00 | BBB+ | 62,634 |
| | Los Angeles County Securitization Corporation, Series 2020A, 4.000%, 6/01/49 | | | |
| 500 | | California Health Facilities Financing Authority, California, Revenue Bonds, Sutter | 11/27 at 100.00 | A+ | 627,200 |
| | Health, Refunding Series 2017A, 5.000%, 11/15/36 | | | |
| 415 | | California Municipal Finance Authority, Revenue Bonds, Biola University, Series 2013, | No Opt. Call | Baa1 | 426,935 |
| | 5.000%, 10/01/21 | | | |
| 2,170 | | California Municipal Finance Authority, Revenue Bonds, Linxs APM Project, Senior Lien | 6/28 at 100.00 | BBB– | 2,546,148 |
| | Series 2018A, 5.000%, 12/31/43 (AMT) | | | |
| 370 | | California Pollution Control Financing Authority, Water Furnishing Revenue Bonds, San | 1/29 at 100.00 | BBB | 430,236 |
| | Diego County Water Authority Desalination Project Pipeline, Refunding Series 2019, 5.000%, | | | |
| | 11/21/45, 144A | | | |
| 1,930 | | California Statewide Communities Development Authority, California, Revenue Bonds, Loma | 12/24 at 100.00 | BB | 2,134,812 |
| | Linda University Medical Center, Series 2014A, 5.250%, 12/01/34 | | | |
| 3,335 | | Eastern Municipal Water District Financing Authority, California, Water and Wastewater | 7/27 at 100.00 | AA+ | 4,163,080 |
| | Revenue Bonds, Series 2017D, 5.250%, 7/01/42 | | | |
| 500 | | Independent Cities Finance Authority, California, Mobile Home Park Revenue Bonds, | No Opt. Call | A– | 524,220 |
| | Rancho Vallecitos Mobile Home Park, Series 2013, 4.500%, 4/15/23 | | | |
| | Jurupa Community Services District, California, Special Tax Bonds, Community Facilities | | | |
| | District 31 Eastvale Area, Series 2013: | | | |
| 150 | | 4.000%, 9/01/25 | 9/22 at 100.00 | N/R | 158,271 |
| 305 | | 4.000%, 9/01/26 | 9/22 at 100.00 | N/R | 321,318 |
| 250 | | 4.000%, 9/01/27 | 9/22 at 100.00 | N/R | 262,858 |
| 1,775 | | Patterson Public Finance Authority, California, Revenue Bonds, Community Facilities | No Opt. Call | N/R | 1,901,912 |
| | District 2001-1, Senior Series 2013A, 5.000%, 9/01/22 | | | |
| 185 | | Riverside County Redevelopment Agency, California, Tax Allocation Housing Bonds, Series | No Opt. Call | A (5) | 217,895 |
| | 2011A, 0.000%, 10/01/26 (ETM) (6) | | | |
| 1,500 | | San Diego Association of Governments, California, South Bay Expressway Toll Revenue | 7/27 at 100.00 | A | 1,775,070 |
| | Bonds, First Senior Lien Series 2017A, 5.000%, 7/01/36 | | | |
| 1,400 | | San Joaquin County Transportation Authority, California, Sales Tax Revenue, Limited Tax | 3/27 at 100.00 | AA | 1,755,068 |
| | Measure K Series 2017, 5.000%, 3/01/32 | | | |
| 17,840 | | Total California | | | 20,659,437 |
37
| | |
| NIQ | Nuveen Intermediate Duration Quality Municipal Term Fund Portfolio of Investments (continued) November 30, 2020 (Unaudited) |
| | | | | | |
| Principal | | | Optional Call | | |
| Amount (000) | | Description (1) | Provisions (2) | Ratings (3) | Value |
| | Colorado – 14.7% (11.7% of Total Investments) | | | |
| $ 250 | | Colorado Educational and Cultural Facilities Authority, Charter School Refunding Revenue | No Opt. Call | A+ | $ 254,835 |
| | Bonds, Pinnacle Charter School, Inc K-8 Facility Project, Series 2013, 5.000%, 6/01/21 | | | |
| 3,045 | | Colorado Health Facilities Authority, Colorado, Revenue Bonds, CommonSpirit Health, | 8/29 at 100.00 | BBB+ | 3,889,348 |
| | Series 2019A-2, 5.000%, 8/01/30 | | | |
| 5,000 | | Colorado Springs, Colorado, Utilities System Revenue Bonds, Refunding Series 2017A-2, | 11/27 at 100.00 | AA+ | 6,176,800 |
| | 5.000%, 11/15/47 | | | |
| | Colorado State Board of Governors, Colorado State University Auxiliary Enterprise System | | | |
| | Revenue Bonds, Tender Option Bond Trust 2016-XF2354, Formerly Tender Option Bond Trust 3316: | | | |
| 100 | | 22.093%, 3/01/25, 144A (IF) (4) | No Opt. Call | AA | 195,477 |
| 300 | | 22.093%, 3/01/26, 144A (IF) (4) | No Opt. Call | AA | 649,257 |
| 430 | | 22.043%, 3/01/27, 144A (IF) (4) | No Opt. Call | AA | 1,005,710 |
| 725 | | 22.093%, 3/01/28, 144A (IF) (4) | No Opt. Call | AA | 1,810,542 |
| 200 | | 22.093%, 3/01/29, 144A (IF) (4) | No Opt. Call | AA | 525,868 |
| 1,870 | | Denver Convention Center Hotel Authority, Colorado, Revenue Bonds, Convention Center | 12/26 at 100.00 | Baa2 | 2,137,111 |
| | Hotel, Refunding Senior Lien Series 2016, 5.000%, 12/01/30 | | | |
| 350 | | E-470 Public Highway Authority, Colorado, Senior Revenue Bonds, Series 1997B, 0.000%, | No Opt. Call | A | 348,723 |
| | 9/01/21 – NPFG Insured | | | |
| 1,000 | | Public Authority for Colorado Energy, Natural Gas Purchase Revenue Bonds, Colorado | No Opt. Call | A+ | 1,583,240 |
| | Springs Utilities, Series 2008, 6.500%, 11/15/38 | | | |
| 4,000 | | University of Colorado, Enterprise System Revenue Bonds, Refunding Series 2019B, | 6/29 at 100.00 | Aa1 | 5,119,240 |
| | 5.000%, 6/01/44 | | | |
| 4,000 | | University of Northern Colorado at Greeley, Institutional Enterprise System Revenue | 6/26 at 100.00 | Aa2 | 4,667,160 |
| | Bonds, Refunding Series 2016A, 5.000%, 6/01/46 | | | |
| 21,270 | | Total Colorado | | | 28,363,311 |
| | Florida – 7.7% (6.1% of Total Investments) | | | |
| 150 | | Atlantic Beach, Florida, Healthcare Facilities Revenue Refunding Bonds, Fleet Landing | No Opt. Call | BBB | 162,570 |
| | Project, Series 2013A, 5.000%, 11/15/23 | | | |
| 365 | | Belmont Community Development District, Florida, Capital Improvement Revenue Bonds, | No Opt. Call | N/R | 386,758 |
| | Phase 1 Project, Series 2013A, 5.500%, 11/01/23 | | | |
| 825 | | Broward County, Florida, Half-Cent Sales Tax Revenue Bonds, Refunding Series 2020, | 10/30 at 100.00 | AA+ | 1,007,152 |
| | 4.000%, 10/01/40 | | | |
| 1,270 | | Broward County, Florida, Fuel System Revenue Bonds, Fort Lauderdale Fuel Facilities LLC | No Opt. Call | AA | 1,403,248 |
| | Project, Series 2013A, 5.000%, 4/01/23 – AGM Insured (AMT) | | | |
| 1,740 | | Cape Coral, Florida, Water and Sewer Revenue Bonds, Refunding Series 2017, 5.000%, 10/01/33 | 10/27 at 100.00 | A+ | 2,185,806 |
| 340 | | Capital Trust Agency, Florida, Fixed Rate Air Cargo Revenue Refunding Bonds, Aero Miami | 12/20 at 100.00 | Baa3 | 341,278 |
| | FX, LLC Project, Series 2010A, 5.350%, 7/01/29 | | | |
| 1,010 | | Collier County Educational Facilities Authority, Florida, Revenue Bonds, Ave Maria | No Opt. Call | BBB– | 1,031,957 |
| | University, Refunding Series 2013A, 4.500%, 6/01/23 | | | |
| 1,000 | | Florida Mid-Bay Bridge Authority, Revenue Bonds, 1st Senior Lien Series 2015A, 5.000%, 10/01/23 | No Opt. Call | BBB+ | 1,107,480 |
| 2,960 | | Florida Municipal Power Agency, Revenue Bonds, Saint Lucie Project, Refunding Series | 10/22 at 100.00 | A2 | 3,204,911 |
| | 2012A, 5.000%, 10/01/26 | | | |
| 500 | | Gainesville, Florida, Utilities System Revenue Bonds, Series 2017A, 5.000%, 10/01/37 | 10/27 at 100.00 | AA– | 625,060 |
| 1,400 | | Palm Beach County Health Facilities Authority, Florida, Revenue Bonds, Jupiter Medical | No Opt. Call | BBB+ | 1,508,416 |
| | Center, Series 2013A, 5.000%, 11/01/22 | | | |
| 510 | | Putnam County Development Authority, Florida, Pollution Control Revenue Bonds, Seminole | 5/28 at 100.00 | A– | 621,608 |
| | Electric Cooperatice, Inc Project, Refunding Series 2018B, 5.000%, 3/15/42 | | | |
| 305 | | Southeast Overtown/Park West Community Redevelopment Agency, Florida, Tax Increment | No Opt. Call | BBB+ | 343,400 |
| | Revenue Bonds, Series 2014A-1, 5.000%, 3/01/24, 144A | | | |
| 560 | | Verandah West Community Development District, Florida, Capital Improvement Revenue | No Opt. Call | N/R | 570,959 |
| | Bonds, Refunding Series 2013, 4.000%, 5/01/23 | | | |
| 12,935 | | Total Florida | | | 14,500,603 |
38
| | | | | | |
| Principal | | | Optional Call | | |
| Amount (000) | | Description (1) | Provisions (2) | Ratings (3) | Value |
| | Georgia – 2.1% (1.7% of Total Investments) | | | |
| $ 1,025 | | Atlanta, Georgia, Tax Allocation Bonds, Perry Bolton Project Series 2014, 4.000%, 7/01/22 | No Opt. Call | A– | $ 1,080,903 |
| 1,000 | | Gainesville and Hall County Hospital Authority, Georgia, Revenue Anticipation | 2/27 at 100.00 | AA | 1,225,620 |
| | Certificates, Northeast Georgia Health Services Inc, Series 2017B, 5.500%, 2/15/42 | | | |
| 1,465 | | Municipal Electric Authority of Georgia, General Resolution Projects Subordinated Bonds, | 1/28 at 100.00 | A1 | 1,782,202 |
| | Series 20188HH, 5.000%, 1/01/44 | | | |
| 3,490 | | Total Georgia | | | 4,088,725 |
| | Hawaii – 2.0% (1.6% of Total Investments) | | | |
| 3,000 | | Honolulu City and County, Hawaii, Wastewater System Revenue Bonds, First Bond | 1/28 at 100.00 | Aa2 | 3,780,510 |
| | Resolution, Senior Series 2018A, 5.000%, 7/01/37 | | | |
| | Illinois – 10.6% (8.4% of Total Investments) | | | |
| 2,500 | | Cook County, Illinois, General Obligation Bonds, Tender Option Bond Trust 2015-XF1007, | 11/22 at 100.00 | A+ | 3,259,675 |
| | 17.259%, 11/15/25, 144A (IF) (4) | | | |
| 4,000 | | Illinois Municipal Electric Agency, Power Supply System Revenue Bonds, Refunding Series | 8/25 at 100.00 | A1 | 4,750,760 |
| | 2015A, 5.000%, 2/01/27 | | | |
| 2,500 | | Illinois State, General Obligation Bonds, November Series 2017D, 5.000%, 11/01/27 | No Opt. Call | BBB– | 2,758,325 |
| 5,000 | | Illinois State, General Obligation Bonds, Series 2013, 5.000%, 7/01/23 | No Opt. Call | BBB– | 5,327,900 |
| 290 | | Madison, Macoupin, Jersey, Calhoun, Morgan, Scott, and Greene Counties Community College | 11/26 at 100.00 | AA | 353,365 |
| | District 536, Illinois, General Obligation Bonds, Lewis & Clark Community College, Refunding | | | |
| | Series 2017A, 5.000%, 11/01/33 – AGM Insured | | | |
| 665 | | Metropolitan Pier and Exposition Authority, Illinois, McCormick Place Expansion Project | 12/29 at 100.00 | BBB | 681,113 |
| | Bonds, Refunding Series 2020A, 4.000%, 6/15/50 | | | |
| 1,000 | | Southwestern Illinois Development Authority, Local Government Revenue Bonds, Edwardsville | No Opt. Call | AA | 979,890 |
| | Community Unit School District 7 Project, Series 2007, 0.000%, 12/01/22 – AGM Insured | | | |
| 2,000 | | Springfield, Illinois, Electric Revenue Bonds, Senior Lien Series 2015, 5.000%, 3/01/33 | 3/25 at 100.00 | A | 2,332,260 |
| 17,955 | | Total Illinois | | | 20,443,288 |
| | Indiana – 1.5% (1.2% of Total Investments) | | | |
| 1,045 | | Indiana Finance Authority, Educational Facilities Revenue Bonds, 21st Century Charter | 3/23 at 100.00 | B+ | 1,069,975 |
| | School Project, Series 2013A, 6.000%, 3/01/33 | | | |
| 1,500 | | Indiana Finance Authority, Lease Appropriation Bonds, Stadium Project, Refunding Series | No Opt. Call | AA+ | 1,788,510 |
| | 2015A, 5.000%, 2/01/25 | | | |
| 2,545 | | Total Indiana | | | 2,858,485 |
| | Iowa – 1.5% (1.2% of Total Investments) | | | |
| 855 | | Iowa Finance Authority, Iowa, Midwestern Disaster Area Revenue Bonds, Iowa Fertilizer | 12/20 at 103.00 | BB– | 882,326 |
| | Company Project, Series 2016, 5.875%, 12/01/27, 144A | | | |
| 2,000 | | Iowa Tobacco Settlement Authority, Tobacco Asset-Backed Revenue Bonds, Series 2005B, | 12/20 at 100.00 | B– | 2,029,920 |
| | 5.600%, 6/01/34 | | | |
| 2,855 | | Total Iowa | | | 2,912,246 |
| | Kentucky – 3.3% (2.7% of Total Investments) | | | |
| 1,000 | | Kentucky Bond Development Corporation, Transient Room Tax Revenue Bonds, Lexington | 9/28 at 100.00 | A2 | 1,143,500 |
| | Center Corporation Project, Series 2018A, 5.000%, 9/01/43 | | | |
| | Kentucky Economic Development Finance Authority, Revenue Bonds, Next Generation Kentucky | | | |
| | Information Highway Project, Senior Series 2015A: | | | |
| 925 | | 4.250%, 7/01/35 | 7/25 at 100.00 | BBB+ | 970,898 |
| 1,400 | | 5.000%, 1/01/45 | 7/25 at 100.00 | BBB+ | 1,499,848 |
| 3,000 | | Kentucky Public Transportation Infrastructure Authority, First Tier Toll Revenue Bonds, | No Opt. Call | Baa3 | 2,838,570 |
| | Downtown Crossing Project, Capital Appreciation Series 2013B, 0.000%, 7/01/23 | | | |
| 6,325 | | Total Kentucky | | | 6,452,816 |
39
| | |
| NIQ | Nuveen Intermediate Duration Quality Municipal Term Fund Portfolio of Investments (continued) November 30, 2020 (Unaudited) |
| | | | | | |
| Principal | | | Optional Call | | |
| Amount (000) | | Description (1) | Provisions (2) | Ratings (3) | Value |
| | Louisiana – 0.9% (0.7% of Total Investments) | | | |
| $ 530 | | New Orleans Aviation Board, Louisiana, Special Facility Revenue Bonds, Parking | 10/28 at 100.00 | AA | $ 638,782 |
| | Facilities Corporation Consolidated Garage System, Series 2018A, 5.000%, 10/01/43 – AGM Insured | | | |
| 1,000 | | New Orleans, Louisiana, Water Revenue Bonds, Refunding Series 2014, 5.000%, 12/01/22 | No Opt. Call | A– | 1,088,270 |
| 1,530 | | Total Louisiana | | | 1,727,052 |
| | Maine – 2.8% (2.3% of Total Investments) | | | |
| 1,000 | | Maine Health and Higher Educational Facilities Authority Revenue Bonds, Eastern Maine | 7/23 at 100.00 | BBB | 1,062,780 |
| | Medical Center Obligated Group Issue, Series 2013, 5.000%, 7/01/33 | | | |
| | Maine Health and Higher Educational Facilities Authority Revenue Bonds, MaineHealth | | | |
| | Issue, Series 2018A: | | | |
| 435 | | 5.000%, 7/01/43 | 7/28 at 100.00 | A+ | 527,320 |
| 565 | | 5.000%, 7/01/48 | 7/28 at 100.00 | A+ | 679,622 |
| | Maine Turnpike Authority, Special Obligation Bonds, Series 2014: | | | |
| 620 | | 5.000%, 7/01/25 | 7/24 at 100.00 | A+ | 716,298 |
| 340 | | 5.000%, 7/01/27 | 7/24 at 100.00 | A+ | 390,850 |
| 1,850 | | 5.000%, 7/01/29 | 7/24 at 100.00 | A+ | 2,113,977 |
| 4,810 | | Total Maine | | | 5,490,847 |
| | Maryland – 0.5% (0.4% of Total Investments) | | | |
| 615 | | Baltimore, Maryland, Convention Center Hotel Revenue Bonds, Refunding Series 2017, | 9/27 at 100.00 | BB– | 564,859 |
| | 5.000%, 9/01/34 | | | |
| 310 | | Maryland Health and Higher Educational Facilities Authority, Revenue Bonds, Frederick | No Opt. Call | A– | 329,849 |
| | Memorial Hospital Issue, Series 2012A, 5.000%, 7/01/22 | | | |
| 925 | | Total Maryland | | | 894,708 |
| | Massachusetts – 0.5% (0.4% of Total Investments) | | | |
| | Massachusetts Development Finance Agency, Revenue Bonds, Boston Medical Center Issue, | | | |
| | Series 2012C: | | | |
| 80 | | 5.000%, 7/01/29 (Pre-refunded 7/01/22) | 7/22 at 100.00 | N/R (5) | 85,950 |
| 420 | | 5.000%, 7/01/29 | 7/22 at 100.00 | BBB | 443,495 |
| 500 | | 5.000%, 7/01/29 (Pre-refunded 7/01/22) | 7/22 at 100.00 | Baa2 (5) | 537,190 |
| 1,000 | | Total Massachusetts | | | 1,066,635 |
| | Michigan – 7.3% (5.8% of Total Investments) | | | |
| 1,000 | | Detroit City School District, Wayne County, Michigan, General Obligation Bonds, Tender | No Opt. Call | Aa1 | 2,739,970 |
| | Option Bond Trust 3308, 22.450%, 5/01/30, 144A (IF) (4) | | | |
| 5 | | Detroit, Michigan, Sewer Disposal System Revenue Bonds, Second Lien, Series 2006B, | 12/20 at 100.00 | A+ | 5,018 |
| | 5.000%, 7/01/36 – FGIC Insured | | | |
| 5 | | Detroit, Michigan, Water Supply System Revenue Bonds, Second Lien Series 2003B, 5.000%, | 12/20 at 100.00 | A+ | 5,019 |
| | 7/01/34 – NPFG Insured | | | |
| 540 | | Flint Hospital Building Authority, Michigan, Building Authority Revenue Bonds, Hurley | No Opt. Call | BBB– | 568,912 |
| | Medical Center, Series 2013A, 5.000%, 7/01/23 | | | |
| 2,020 | | Michigan Finance Authority, Hospital Revenue Bonds, Crittenton Hospital Medical Center, | 6/22 at 100.00 | N/R (5) | 2,137,523 |
| | Refunding Series 2012A, 4.125%, 6/01/32 (Pre-refunded 6/01/22) | | | |
| 3,000 | | Michigan Finance Authority, Local Government Loan Program Revenue Bonds, Detroit Water & | No Opt. Call | AA | 3,359,340 |
| | Sewerage Department Water Supply System Local Project, Refunding Senior Loan Series 2014D-1, | | | |
| | 5.000%, 7/01/23 – AGM Insured | | | |
| 40 | | Michigan Finance Authority, Public School Academy Limited Obligation Revenue Bonds, Old | No Opt. Call | BB– | 40,000 |
| | Redford Academy Project, Series 2010A, 5.250%, 12/01/20 | | | |
| 1,390 | | Michigan Finance Authority, Revenue Bonds, Trinity Health Credit Group, Tender Option | 1/21 at 100.00 | AA– | 1,414,047 |
| | Bond Trust 2015-XF0126, 21.701%, 12/01/27, 144A (IF) (4) | | | |
| 1,500 | | Michigan Finance Authority, Tobacco Settlement Asset- Backed Bonds, 2007 Sold Tobacco | 12/30 at 100.00 | BBB– | 1,799,055 |
| | Receipts, Series 2020B-1-CL2, 5.000%, 6/01/49 | | | |
| 1,500 | | Michigan State Building Authority, Revenue Bonds, Facilities Program, Refunding Series | 10/29 at 100.00 | Aa2 | 1,969,230 |
| | 2019-I, 5.000%, 4/15/36 | | | |
| 11,000 | | Total Michigan | | | 14,038,114 |
40
| | | | | | |
| Principal | | | Optional Call | | |
| Amount (000) | | Description (1) | Provisions (2) | Ratings (3) | Value |
| | Minnesota – 1.3% (1.0% of Total Investments) | | | |
| $ 2,000 | | Duluth Economic Development Authority, Minnesota, Health Care Facilities Revenue Bonds, | 2/28 at 100.00 | A– | $ 2,213,820 |
| | Essentia Health Obligated Group, Series 2018A, 4.250%, 2/15/43 | | | |
| | Saint Paul Housing and Redevelopment Authority, Minnesota, Lease Revenue Bonds, Saint | | | |
| | Paul Conservatory for Performing Artists Charter School Project, Series 2013A: | | | |
| 205 | | 3.550%, 3/01/21 | No Opt. Call | BB | 205,523 |
| 100 | | 3.700%, 3/01/22 | No Opt. Call | BB | 101,400 |
| 2,305 | | Total Minnesota | | | 2,520,743 |
| | Mississippi – 1.3% (1.0% of Total Investments) | | | |
| | Mississippi Development Bank Special Obligation Bonds, Marshall County Industrial | | | |
| | Development Authority, Mississippi Highway Construction Project, Tender Option Bond Trust 3315: | | | |
| 800 | | 22.468%, 1/01/24 (Pre-Refunded 1/01/22), 144A (IF) (4) | 1/22 at 100.00 | AA- (5) | 1,008,032 |
| 1,000 | | 22.468%, 1/01/25 (Pre-Refunded 1/01/22), 144A (IF) (4) | 1/22 at 100.00 | AA- (5) | 1,260,040 |
| 200 | | 22.468%, 1/01/26 (Pre-Refunded 1/01/22), 144A (IF) (4) | 1/22 at 100.00 | AA- (5) | 252,008 |
| 2,000 | | Total Mississippi | | | 2,520,080 |
| | Missouri – 1.7% (1.4% of Total Investments) | | | |
| 3,000 | | Missouri Joint Municipal Electric Utility Commission, Power Project Revenue Bonds, Plum | No Opt. Call | A | 3,288,150 |
| | Point Project, Refunding Series 2014A, 5.000%, 1/01/23 | | | |
| | Montana – 1.4% (1.1% of Total Investments) | | | |
| | Montana Facility Finance Authority, Healthcare Facility Revenue Bonds, Kalispell | | | |
| | Regional Medical Center, Series 2018B: | | | |
| 985 | | 5.000%, 7/01/28 | No Opt. Call | BBB | 1,226,975 |
| 1,270 | | 5.000%, 7/01/29 | 7/28 at 100.00 | BBB | 1,559,992 |
| 2,255 | | Total Montana | | | 2,786,967 |
| | Nebraska – 2.6% (2.1% of Total Investments) | | | |
| 3,000 | | Central Plains Energy Project, Nebraska, Gas Project 3 Revenue Bonds, Series 2012, | 9/22 at 100.00 | A | 3,222,510 |
| | 5.000%, 9/01/32 | | | |
| 1,270 | | Lincoln, Nebraska, Electric System Revenue Bonds, Series 2020A, 5.000%, 9/01/31 | 3/30 at 100.00 | AA | 1,747,622 |
| 4,270 | | Total Nebraska | | | 4,970,132 |
| | Nevada – 2.5% (2.0% of Total Investments) | | | |
| 515 | | Carson City, Nevada, Hospital Revenue Bonds, Carson Tahoe Regional Healthcare Project, | 9/27 at 100.00 | A– | 591,426 |
| | Series 2017A, 5.000%, 9/01/47 | | | |
| 1,000 | | Las Vegas Convention and Visitors Authority, Nevada, Revenue Bonds, Series 2018C, | 7/28 at 100.00 | Aa3 | 1,202,440 |
| | 5.250%, 7/01/43 | | | |
| | Las Vegas Redevelopment Agency, Nevada, Tax Increment Revenue Bonds, Refunding Series 2016: | | | |
| 1,295 | | 5.000%, 6/15/26 | No Opt. Call | BBB+ | 1,540,053 |
| 1,210 | | 5.000%, 6/15/27 | 6/26 at 100.00 | BBB+ | 1,430,087 |
| 4,020 | | Total Nevada | | | 4,764,006 |
| | New Jersey – 4.3% (3.5% of Total Investments) | | | |
| | New Jersey Economic Development Authority, Cigarette Tax Revenue Refunding Bonds, Series 2012: | | | |
| 2,000 | | 5.000%, 6/15/24 | 6/22 at 100.00 | BBB | 2,058,140 |
| 1,000 | | 5.000%, 6/15/28 | 6/22 at 100.00 | BBB | 1,022,410 |
| | New Jersey Economic Development Authority, Private Activity Bonds, The Goethals Bridge | | | |
| | Replacement Project, Series 2013: | | | |
| 860 | | 5.000%, 1/01/21 (AMT) | No Opt. Call | A2 | 862,821 |
| 500 | | 5.000%, 1/01/22 (AMT) | No Opt. Call | A2 | 521,725 |
| 500 | | 5.000%, 7/01/22 (AMT) | No Opt. Call | A2 | 531,630 |
| 620 | | 5.000%, 1/01/23 (AMT) | No Opt. Call | A2 | 671,392 |
| 1,000 | | New Jersey Economic Development Authority, School Facilities Construction Financing | 3/25 at 100.00 | Baa1 | 884,630 |
| | Program Bonds, Tender Option Bond Trust 2016-XF2340, 3.394%, 9/01/25, 144A (IF) (4) | | | |
| 1,000 | | New Jersey Economic Development Authority, Special Facilities Revenue Bonds, Continental | 8/22 at 101.00 | Ba3 | 1,049,000 |
| | Airlines Inc, Series 1999, 5.250%, 9/15/29 (AMT) | | | |
41
| | |
| NIQ | Nuveen Intermediate Duration Quality Municipal Term Fund Portfolio of Investments (continued) November 30, 2020 (Unaudited) |
| | | | | | |
| Principal | | | Optional Call | | |
| Amount (000) | | Description (1) | Provisions (2) | Ratings (3) | Value |
| | New Jersey (continued) | | | |
| $ 275 | | New Jersey Health Care Facilities Financing Authority, New Jersey, Revenue Bonds, Saint | 12/20 at 100.00 | BB+ | $ 275,712 |
| | Peters University Hospital, Series 2007, 5.250%, 7/01/21 | | | |
| 450 | | Tobacco Settlement Financing Corporation, New Jersey, Tobacco Settlement Asset-Backed | 6/28 at 100.00 | BB+ | 518,503 |
| | Bonds, Series 2018B, 5.000%, 6/01/46 | | | |
| 8,205 | | Total New Jersey | | | 8,395,963 |
| | New York – 6.5% (5.2% of Total Investments) | | | |
| 495 | | Buffalo and Erie County Industrial Land Development Corporation, New York, Revenue | 7/25 at 100.00 | BBB | 569,092 |
| | Bonds, Catholic Health System, Inc Project, Series 2015, 5.000%, 7/01/29 | | | |
| 435 | | Liberty Development Corporation, New York, Goldman Sachs Headquarters Revenue Bonds | No Opt. Call | A | 658,803 |
| | Series 2007, 5.500%, 10/01/37 | | | |
| 3,545 | | Long Island Power Authority, New York, Electric System General Revenue Bonds, Series | 9/27 at 100.00 | A | 4,339,151 |
| | 2017, 5.000%, 9/01/42 | | | |
| 1,390 | | Metropolitan Transportation Authority, New York, Transportation Revenue Bonds, Green | 5/30 at 100.00 | A3 | 1,596,345 |
| | Climate Bond Certified Series 2020C-1, 5.000%, 11/15/50 | | | |
| 750 | | Metropolitan Transportation Authority, New York, Transportation Revenue Bonds, Refunding | No Opt. Call | A3 | 891,015 |
| | Green Climate Certified Series 2020E, 5.000%, 11/15/30 | | | |
| 710 | | New York City, New York, General Obligation Bonds, Fiscal 2021 Series C, 5.000%, 8/01/43 | 8/30 at 100.00 | AA | 901,004 |
| 2,000 | | New York Convention Center Development Corporation, New York, Revenue Bonds, Hotel Unit | No Opt. Call | A1 | 2,350,800 |
| | Fee Secured, Refunding Series 2015, 5.000%, 11/15/25 | | | |
| 1,000 | | New York State Power Authority, General Revenue Bonds, Series 2020A, 4.000%, 11/15/50 | 5/30 at 100.00 | AA | 1,181,560 |
| 10,325 | | Total New York | | | 12,487,770 |
| | North Dakota – 0.7% (0.6% of Total Investments) | | | |
| 1,250 | | Cass County, North Dakota, Health Care Facilities Revenue Bonds, Essential Health | 2/28 at 100.00 | A– | 1,383,638 |
| | Obligated Group, Series 2018B, 4.250%, 2/15/43 | | | |
| | Ohio – 2.3% (1.9% of Total Investments) | | | |
| 620 | | Buckeye Tobacco Settlement Financing Authority, Ohio, Tobacco Settlement Asset-Backed | 6/30 at 100.00 | BBB+ | 700,991 |
| | Revenue Bonds, Refunding Senior Lien Series 2020A-2 Class 1, 4.000%, 6/01/48 | | | |
| 2,175 | | Buckeye Tobacco Settlement Financing Authority, Ohio, Tobacco Settlement Asset-Backed | 6/30 at 100.00 | N/R | 2,446,048 |
| | Revenue Bonds, Refunding Senior Lien Series 2020B-2 Class 2, 5.000%, 6/01/55 | | | |
| 3,000 | | Ohio Air Quality Development Authority, Ohio, Pollution Control Revenue Bonds, | No Opt. Call | N/R | 3,750 |
| | FirstEnergy Generation Project, Refunding Series 2006A, 3.750%, 12/01/23 (7) | | | |
| 1,150 | | Ohio State, Private Activity Bonds, Portsmouth Gateway Group, LLC – Borrower, Portsmouth | 6/25 at 100.00 | AA | 1,355,229 |
| | Bypass Project, Series 2015, 5.000%, 12/31/27 – AGM Insured (AMT) | | | |
| 6,945 | | Total Ohio | | | 4,506,018 |
| | Oklahoma – 0.2% (0.1% of Total Investments) | | | |
| 255 | | Oklahoma Development Finance Authority, Health System Revenue Bonds, OU Medicine | 8/28 at 100.00 | Baa3 | 302,369 |
| | Project, Series 2018B, 5.250%, 8/15/43 | | | |
| | Oregon – 1.8% (1.4% of Total Investments) | | | |
| 965 | | Astoria Hospital Facilities Authority, Oregon, Hospital Revenue and Refunding Bonds, | No Opt. Call | A– | 1,034,181 |
| | Columbia Memorial Hospital, Series 2012, 5.000%, 8/01/22 | | | |
| 2,000 | | Port of Portland, Oregon, International Airport Revenue Bonds, Series 2017-24B, 5.000%, | 1/27 at 100.00 | A+ | 2,358,100 |
| | 7/01/36 (AMT) | | | |
| 2,965 | | Total Oregon | | | 3,392,281 |
| | Pennsylvania – 3.4% (2.7% of Total Investments) | | | |
| | Erie Higher Education Building Authority, Pennsylvania, Revenue Bonds, Gannon University | | | |
| | Project, Series 2013: | | | |
| 480 | | 4.000%, 5/01/21 | No Opt. Call | BBB+ | 482,040 |
| 500 | | 4.000%, 5/01/22 | No Opt. Call | BBB+ | 507,140 |
| 520 | | 4.000%, 5/01/23 | No Opt. Call | BBB+ | 533,790 |
42
| | | | | | |
| Principal | | | Optional Call | | |
| Amount (000) | | Description (1) | Provisions (2) | Ratings (3) | Value |
| | Pennsylvania (continued) | | | |
| $ 1,905 | | Erie Sewer Authority, Erie County, Pennsylvania, Sewer Revenue Bonds, Series 2012A, | No Opt. Call | AA | $ 1,947,615 |
| | 5.000%, 6/01/21 – AGM Insured | | | |
| 1,700 | | Pennsylvania Economic Development Financing Authority, Private Activity Revenue Bonds, | 6/26 at 100.00 | BBB | 2,024,020 |
| | Pennsylvania Rapid Bridge Replacement Project, Series 2015, 5.000%, 6/30/28 (AMT) | | | |
| 285 | | Pittsburgh Water and Sewer Authority, Pennsylvania, Water and Sewer System Revenue | 9/29 at 100.00 | AA | 343,419 |
| | Bonds, Refunding Subordinate Series 2019B, 4.000%, 9/01/34 – AGM Insured | | | |
| | Southcentral Pennsylvania General Authority, Revenue Bonds, Hanover Hospital Inc, Series 2013: | | | |
| 370 | | 5.000%, 12/01/20 | No Opt. Call | A | 370,000 |
| 435 | | 5.000%, 12/01/21 | No Opt. Call | A | 453,779 |
| 6,195 | | Total Pennsylvania | | | 6,661,803 |
| | Puerto Rico – 1.6% (1.3% of Total Investments) | | | |
| | Puerto Rico Sales Tax Financing Corporation, Sales Tax Revenue Bonds, Restructured 2018A-1: | | | |
| 660 | | 4.500%, 7/01/34 | 7/25 at 100.00 | N/R | 707,606 |
| 2,175 | | 4.550%, 7/01/40 | 7/28 at 100.00 | N/R | 2,356,895 |
| 2,835 | | Total Puerto Rico | | | 3,064,501 |
| | South Carolina – 2.3% (1.8% of Total Investments) | | | |
| 2,000 | | South Carolina Public Service Authority, Electric System Revenue Bonds, Santee Cooper, | 6/22 at 100.00 | A (5) | 2,142,500 |
| | Refunding Series 2012D, 5.000%, 12/01/43 (Pre-refunded 6/01/22) | | | |
| 2,000 | | South Carolina Public Service Authority, Santee Cooper Revenue Obligations, Refunding | 6/24 at 100.00 | A | 2,286,580 |
| | Series 2014B, 5.000%, 12/01/31 | | | |
| 4,000 | | Total South Carolina | | | 4,429,080 |
| | Tennessee – 8.5% (6.8% of Total Investments) | | | |
| | Greeneville Health and Educational Facilities Board, Tennessee, Hospital Revenue Bonds, | | | |
| | Ballad Health, Series 2018A: | | | |
| 1,000 | | 5.000%, 7/01/36 | 7/28 at 100.00 | A | 1,212,330 |
| 1,605 | | 5.000%, 7/01/37 | 7/28 at 100.00 | A | 1,940,654 |
| 2,290 | | Jackson, Tennessee, Hospital Revenue Bonds, Jackson-Madison County General Hospital | 10/28 at 100.00 | A | 2,830,005 |
| | Project, Series 2018A, 5.000%, 4/01/35 | | | |
| | Knox County Health, Educational and Housing Facility Board, Tennessee, Hospital Revenue | | | |
| | Bonds, Covenant Health, Refunding Series 2012A: | | | |
| 1,440 | | 5.000%, 1/01/25 | 1/23 at 100.00 | A+ | 1,565,409 |
| 2,170 | | 5.000%, 1/01/26 | 1/23 at 100.00 | A+ | 2,360,526 |
| 450 | | Metropolitan Government of Nashville-Davidson County, Tennessee, Water and Sewerage | 7/27 at 100.00 | AA | 551,799 |
| | Revenue Bonds, Green Series 2017A, 5.000%, 7/01/42 | | | |
| 1,400 | | The Tennessee Energy Acquisition Corporation, Gas Revenue Bonds, Series 2006B, | No Opt. Call | BBB | 1,718,878 |
| | 5.625%, 9/01/26 | | | |
| | The Tennessee Energy Acquisition Corporation, Gas Revenue Bonds, Series 2006C: | | | |
| 1,020 | | 5.000%, 2/01/21 | No Opt. Call | A | 1,027,793 |
| 1,490 | | 5.000%, 2/01/24 | No Opt. Call | A | 1,683,327 |
| 1,365 | | 5.000%, 2/01/25 | No Opt. Call | A | 1,586,294 |
| 14,230 | | Total Tennessee | | | 16,477,015 |
| | Texas – 7.8% (6.2% of Total Investments) | | | |
| 1,225 | | Bexar County Hospital District, Texas, Certificates of Obligation, Series 2020, 5.000%, 2/15/45 | 2/29 at 100.00 | Aa1 | 1,541,907 |
| 500 | | Central Texas Regional Mobility Authority, Revenue Bonds, Refunding Subordinate Lien | No Opt. Call | BBB+ | 522,270 |
| | Series 2013, 5.000%, 1/01/22 | | | |
| 1,070 | | Central Texas Regional Mobility Authority, Revenue Bonds, Refunding Subordinate Lien | 1/30 at 100.00 | BBB+ | 1,215,927 |
| | Series 2020G, 4.000%, 1/01/45 | | | |
| 685 | | Denton County Fresh Water Supply District 7, Texas, General Obligation Bonds, Refunding | No Opt. Call | AA | 689,877 |
| | Series 2013, 4.000%, 2/15/21 – AGM Insured | | | |
| 2,000 | | Gulf Coast Industrial Development Authority, Texas, Solid Waste Disposal Revenue Bonds, | 10/22 at 100.00 | BB | 2,027,660 |
| | Citgo Petroleum Corporation Project, Series 1995, 4.875%, 5/01/25 (AMT) | | | |
43
| | |
| NIQ | Nuveen Intermediate Duration Quality Municipal Term Fund Portfolio of Investments (continued) November 30, 2020 (Unaudited) |
| | | | | | |
| Principal | | | Optional Call | | |
| Amount (000) | | Description (1) | Provisions (2) | Ratings (3) | Value |
| | Texas (continued) | | | |
$
| | Harris County-Houston Sports Authority, Texas, Revenue Bonds, Refunding Second Lien | | | |
| | Series 2014C: | | | |
| 1,660 | | 5.000%, 11/15/23 | No Opt. Call | Baa1 | $ 1,758,737 |
| 960 | | 5.000%, 11/15/25 | 11/24 at 100.00 | Baa1 | 1,032,576 |
| 1,005 | | Harris County-Houston Sports Authority, Texas, Revenue Bonds, Third Lien Series 2004A-3, | 11/24 at 59.10 | Baa2 | 526,771 |
| | 0.000%, 11/15/33 – NPFG Insured | | | |
| | Tarrant County Cultural Education Facilities Finance Corporation, Texas, Hospital | | | |
| | Revenue Bonds, Scott & White Healthcare Project, Tender Option Bond Trust 2016-XG0058: | | | |
| 100 | | 22.273%, 8/15/22, 144A (IF) (4) | No Opt. Call | AA– | 136,678 |
| 155 | | 22.064%, 8/15/24, 144A (IF) (4) | 8/23 at 100.00 | AA– | 249,397 |
| 200 | | 22.273%, 8/15/26, 144A (IF) (4) | 8/23 at 100.00 | AA– | 323,780 |
| 175 | | 22.023%, 8/15/27, 144A (IF) (4) | 8/23 at 100.00 | AA– | 279,170 |
| 1,055 | | Texas Municipal Gas Acquisition and Supply Corporation I, Gas Supply Revenue Bonds, | No Opt. Call | A2 | 1,238,000 |
| | Senior Lien Series 2008D, 6.250%, 12/15/26 | | | |
| 3,000 | | Texas Municipal Gas Acquisition and Supply Corporation III, Gas Supply Revenue Bonds, | 12/22 at 100.00 | A3 | 3,234,600 |
| | Series 2012, 5.000%, 12/15/27 | | | |
| 360 | | Texas Public Finance Authority, Revenue Bonds, Texas Southern University Financing | 5/21 at 100.00 | BBB | 365,911 |
| | System, Series 2011, 6.000%, 5/01/23 | | | |
| 14,150 | | Total Texas | | | 15,143,261 |
| | Utah – 0.7% (0.5% of Total Investments) | | | |
| 435 | | Utah Water Finance Agency, Revenue Bonds, Pooled Loan Financing Program, Series 2017A, | 3/27 at 100.00 | AA | 536,890 |
| | 5.000%, 3/01/35 | | | |
| 600 | | Utah Water Finance Agency, Revenue Bonds, Pooled Loan Financing Program, Series 2017C, | 3/27 at 100.00 | AA | 741,678 |
| | 5.000%, 3/01/34 | | | |
| 1,035 | | Total Utah | | | 1,278,568 |
| | Virgin Islands – 0.1% (0.1% of Total Investments) | | | |
| 175 | | Virgin Islands Public Finance Authority, Gross Receipts Taxes Loan Note, Refunding | No Opt. Call | AA | 181,906 |
| | Series 2012A, 4.000%, 10/01/22 – AGM Insured | | | |
| | Virginia – 2.3% (1.8% of Total Investments) | | | |
| 1,340 | | Chesapeake Bay Bridge and Tunnel District, Virginia, General Resolution Revenue Bonds, | 7/26 at 100.00 | AA | 1,587,230 |
| | First Tier Series 2016, 5.000%, 7/01/41 – AGM Insured | | | |
| 535 | | Chesapeake, Virginia, Transportation System Senior Toll Road Revenue Bonds, Series | No Opt. Call | BBB+ | 549,531 |
| | 2012A, 5.000%, 7/15/21 | | | |
| 1,900 | | Metropolitan Washington Airports Authority, Virginia, Dulles Toll Road Revenue Bonds, | 10/29 at 100.00 | A– | 2,307,892 |
| | Dulles Metrorail & Capital improvement Projects, Refunding & Subordinate Lien Series 2019B, | | | |
| | 5.000%, 10/01/47 | | | |
| 3,775 | | Total Virginia | | | 4,444,653 |
| | Washington – 1.3% (1.0% of Total Investments) | | | |
| 700 | | Port of Seattle, Washington, Revenue Bonds, Intermediate Lien Series 2015A, | 10/24 at 100.00 | AA– | 807,548 |
| | 5.000%, 4/01/27 | | | |
| 1,445 | | Washington State Convention Center Public Facilities District, Lodging Tax Revenue | 7/28 at 100.00 | A3 | 1,626,897 |
| | Bonds, Series 2018, 5.000%, 7/01/43 | | | |
| 2,145 | | Total Washington | | | 2,434,445 |
44
| | | | | | |
| Principal | | | Optional Call | | |
| Amount (000) | | Description (1) | Provisions (2) | Ratings (3) | Value |
| | Wisconsin – 0.3% (0.3% of Total Investments) | | | |
| | University of Wisconsin Hospitals and Clinics Authority, Revenue Bonds, Tender Option | | | |
| | Bond Trust 2015-XF0127: | | | |
| $ 50 | | 20.386%, 4/01/22, 144A (IF) (4) | No Opt. Call | AA– | $ 63,807 |
| 100 | | 21.198%, 4/01/23, 144A (IF) (4) | No Opt. Call | AA– | 149,756 |
| 185 | | 20.813%, 4/01/24, 144A (IF) (4) | 4/23 at 100.00 | AA– | 274,897 |
| 100 | | 21.198%, 4/01/25, 144A (IF) (4) | 4/23 at 100.00 | AA– | 149,404 |
| 435 | | Total Wisconsin | | | 637,864 |
| $ 209,570 | | Total Municipal Bonds (cost $222,562,111) | | | 240,114,533 |
|
| Shares | | Description (1) | | | Value |
| | COMMON STOCKS – 1.2% (0.9% of Total Investments) | | | |
| | Electric Utilities – 1.2% (0.9% of Total Investments) | | | |
| 97,015 | | Energy Harbor Corp (8), (9), (10) | | | $ 2,188,949 |
| | Total Common Stocks (cost $2,765,568) | | | 2,188,949 |
| | Total Long-Term Investments (cost $225,327,679) | | | 242,303,482 |
| | Adjustable Rate MuniFund Term Preferred Shares, net of deferred offering costs – (28.4)% (11) | | | (54,930,624) |
| | Other Assets Less Liabilities – 2.9% | | | 5,759,613 |
| | Net Assets Applicable to Common Shares – 100% | | | $ 193,132,471 |
| | |
(1) | All percentages shown in the Portfolio of Investments are based on net assets applicable to common shares unless otherwise noted. |
(2) | Optional Call Provisions: Dates (month and year) and prices of the earliest optional call or redemption. There may be other call provisions at varying prices at later dates. Certain mortgage-backed securities may be subject to periodic principal paydowns. |
(3) | For financial reporting purposes, the ratings disclosed are the highest of Standard & Poor’s Group (“Standard & Poor’s”), Moody’s Investors Service, Inc. (“Moody’s”) or Fitch, Inc. (“Fitch”) rating. This treatment of split-rated securities may differ from that used for other purposes, such as for Fund investment policies. Ratings below BBB by Standard & Poor’s, Baa by Moody’s or BBB by Fitch are considered to be below investment grade. Holdings designated N/R are not rated by any of these national rating agencies. |
(4) | Investment, or portion of investment, has been pledged to collateralize the net payment obligations for investments in inverse floating rate transactions. |
(5) | Backed by an escrow or trust containing sufficient U.S. Government or U.S. Government agency securities, which ensure the timely payment of principal and interest. |
(6) | Step-up coupon bond, a bond with a coupon that increases (“steps up”), usually at regular intervals, while the bond is outstanding. The rate shown is the coupon as of the end of the reporting period. |
(7) | Defaulted security. A security whose issuer has failed to fully pay principal and/or interest when due, or is under the protection of bankruptcy. |
(8) | For fair value measurement disclosure purposes, investment classified as Level 2. See Notes to Financial Statements, Note 3 - Investment Valuation and Fair Value Measurements for more information. |
(9) | Non-income producing; issuer has not declared an ex-dividend date within the past twelve months. |
(10) | Common Stock received as part of the bankruptcy settlement for Ohio Air Quality Development Authority, Ohio, Pollution Control Revenue Bonds, FirstEnergy Generation Project, Refunding Series 2006A, 3.750%, 12/01/23. |
(11) | Adjustable Rate MuniFund Term Preferred Shares, net of deferred offering cost as a percentage of Total Investments is 22.7%. |
144A | Investment is exempt from registration under Rule 144A of the Securities Act of 1933, as amended. These investments may only be resold in transactions exempt from registration, which are normally those transactions with qualified institutional buyers. |
AMT | Alternative Minimum Tax |
ETM | Escrowed to maturity. |
IF | Inverse floating rate security issued by a tender option bond (“TOB”) trust, the interest rate on which varies inversely with the Securities Industry Financial Markets Association (SIFMA) short-term rate, which resets weekly, or a similar short-term rate, and is reduced by the expenses related to the TOB trust. |
| See accompanying notes to financial statements |
45
Statement of Assets and Liabilities
November 30, 2020 (Unaudited)
| | | | | | | |
| | NID | | | NIQ | |
| Assets | | | | | | |
Long-term investments, at value (cost $833,158,692 and $225,327,679, respectively) | | $ | 855,679,277 | | | $ | 242,303,482 | |
Cash collateral at brokers for investments in futures contracts(1) | | | 153,003 | | | | — | |
Cash collateral at brokers for investments in inverse floating rate transactions(1) | | | 850,000 | | | | — | |
Receivable for: | | | | | | | | |
| Interest | | | 14,334,318 | | | | 3,714,263 | |
| Investments sold | | | 7,445,939 | | | | 3,792,944 | |
Other assets | | | 49,300 | | | | 618 | |
| Total assets | | | 878,511,837 | | | | 249,811,307 | |
| Liabilities | | | | | | | | |
Cash overdraft | | | 9,908,437 | | | | 1,082,900 | |
Floating rate obligations | | | 30,968,000 | | | | — | |
Payable for: | | | | | | | | |
| Dividends | | | 1,967,460 | | | | 495,025 | |
| Interest | | | 121,700 | | | | — | |
| Variation margin on futures contracts | | | 531 | | | | — | |
Adjustable Rate MuniFund Term Preferred (“AMTP”) Shares, net of deferred offering costs (liquidation preference | | | | | | | | |
| $175,000,000 and $55,000,000, respectively) | | | 174,911,185 | | | | 54,930,624 | |
Accrued expenses: | | | | | | | | |
| Management fees | | | 453,341 | | | | 108,373 | |
| Trustees fees | | | 50,033 | | | | 810 | |
| Other | | | 139,547 | | | | 61,104 | |
| Total liabilities | | | 218,520,234 | | | | 56,678,836 | |
Net Assets applicable to common shares | | $ | 659,991,603 | | | $ | 193,132,471 | |
Common shares outstanding | | | 46,909,660 | | | | 13,097,144 | |
Net asset value (“NAV”) per common share outstanding | | $ | 14.07 | | | $ | 14.75 | |
| Net assets applicable to common shares consist of: | | | | | | | | |
Common shares, $0.01 par value per share | | $ | 469,097 | | | $ | 130,971 | |
Paid-in surplus | | | 670,084,824 | | | | 186,825,698 | |
Total distributable earnings | | | (10,562,318 | ) | | | 6,175,802 | |
Net assets applicable to common shares | | $ | 659,991,603 | | | $ | 193,132,471 | |
Authorized shares: | | | | | | | | |
| Common | | Unlimited | | | Unlimited | |
| Preferred | | Unlimited | | | Unlimited | |
(1)
| Cash pledged to collateralize the net payment obligations for investments in derivatives and inverse floating rate transactions. |
See accompanying notes to financial statements.
46
Six Months Ended November 30, 2020 (Unaudited)
| | | | | | | |
| | NID | | | NIQ | |
| Investment Income | | $ | 17,496,715 | | | $ | 4,202,503 | |
| Expenses | | | | | | | | |
Management fees | | | 2,751,788 | | | | 661,621 | |
Interest expense and amortization of offering costs | | | 957,834 | | | | 279,732 | |
Custodian fees | | | 40,259 | | | | 15,627 | |
Trustees fees | | | 12,022 | | | | 3,573 | |
Professional fees | | | 33,237 | | | | 21,166 | |
Shareholder reporting expenses | | | 32,809 | | | | 11,584 | |
Shareholder servicing agent fees | | | 6,870 | | | | 6,860 | |
Stock exchange listing fees | | | 6,181 | | | | 3,216 | |
Investor relations expenses | | | 17,497 | | | | 5,091 | |
Other | | | 28,769 | | | | 15,231 | |
Total expenses | | | 3,887,266 | | | | 1,023,701 | |
Net investment income (loss) | | | 13,609,449 | | | | 3,178,802 | |
| Realized and Unrealized Gain (Loss) | | | | | | | | |
Net realized gain (loss) from: | | | | | | | | |
| Investments | | | (26,318 | ) | | | (459,642 | ) |
| Futures contracts | | | 36,636 | | | | — | |
Change in net unrealized appreciation (depreciation) of: | | | | | | | | |
| Investments | | | 18,284,352 | | | | 5,283,556 | |
| Futures contracts | | | 25,747 | | | | — | |
Net realized and unrealized gain (loss) | | | 18,320,417 | | | | 4,823,914 | |
Net increase (decrease) in net assets applicable to common shares from operations | | $ | 31,929,866 | | | $ | 8,002,716 | |
See accompanying notes to financial statements.
47
Statement of Changes in Net Assets
(Unaudited)
| | | | | | | | | | | | | |
| | NID | | | NIQ | |
| | Six Months | | | Year | | | Six Months | | | Year | |
| | Ended | | | Ended | | | Ended | | | Ended | |
| | 11/30/20 | | | 5/31/20 | | | 11/30/20 | | | 5/31/20 | |
| Operations | | | | | | | | | | | | |
Net investment income (loss) | | $ | 13,609,449 | | | $ | 25,433,661 | | | $ | 3,178,802 | | | $ | 5,405,009 | |
Net realized gain (loss) from: | | | | | | | | | | | | | | | | |
| Investments | | | (26,318 | ) | | | (3,706,295 | ) | | | (459,642 | ) | | | 66,415 | |
| Futures contracts | | | 36,636 | | | | (490,137 | ) | | | — | | | | — | |
| Swaps | | | — | | | | (804,923 | ) | | | — | | | | — | |
Change in net unrealized appreciation (depreciation) of: | | | | | | | | | | | | | | | | |
| Investments | | | 18,284,352 | | | | (26,212,399 | ) | | | 5,283,556 | | | | 217,189 | |
| Futures contracts | | | 25,747 | | | | (12,970 | ) | | | — | | | | — | |
| Swaps | | | — | | | | 502,317 | | | | — | | | | — | |
Net increase (decrease) in net assets applicable to common shares | | | | | | | | | | | | | | | | |
| from operations | | | 31,929,866 | | | | (5,290,746 | ) | | | 8,002,716 | | | | 5,688,613 | |
| Distributions to Common Shareholders | | | | | | | | | | | | | | | | |
Dividends | | | (12,102,692 | ) | | | (23,923,927 | ) | | | (2,894,469 | ) | | | (5,003,109 | ) |
Decrease in net assets applicable to common shares from distributions | | | | | | | | | | | | | | | | |
| to common shareholders | | | (12,102,692 | ) | | | (23,923,927 | ) | | | (2,894,469 | ) | | | (5,003,109 | ) |
Net increase (decrease) in net assets applicable to common shares | | | 19,827,174 | | | | (29,214,673 | ) | | | 5,108,247 | | | | 685,504 | |
Net assets applicable to common shares at the beginning of period | | | 640,164,429 | | | | 669,379,102 | | | | 188,024,224 | | | | 187,338,720 | |
Net assets applicable to common shares at the end of period | | $ | 659,991,603 | | | $ | 640,164,429 | | | $ | 193,132,471 | | | $ | 188,024,224 | |
See accompanying notes to financial statements.
48
Six Months Ended November 30, 2020 (Unaudited)
| | | | | | | |
| | NID | | | NIQ | |
| Cash Flows from Operating Activities: | | | | | | |
| Net Increase (Decrease) in Net Assets Applicable to Common Shares from Operations | | $ | 31,929,866 | | | $ | 8,002,716 | |
Adjustments to reconcile the net increase (decrease) in net assets applicable to common | | | | | | | | |
| shares from operations to net cash provided by (used in) operating activities: | | | | | | | | |
Purchases of investments | | | (61,282,858 | ) | | | (8,954,939 | ) |
Proceeds from sales and maturities of investments | | | 46,783,050 | | | | 8,602,351 | |
Payment-in-kind distributions | | | (2,650 | ) | | | — | |
Amortization (Accretion) of premiums and discounts, net | | | 4,000,589 | | | | 1,760,061 | |
Amortization of deferred offering costs | | | 19,120 | | | | 13,493 | |
(Increase) Decrease in: | | | | | | | | |
| Receivable for interest | | | (566,627 | ) | | | (161,697 | ) |
| Receivable for investments sold | | | (5,620,939 | ) | | | (3,097,944 | ) |
| Other assets | | | 3,423 | | | | 3,213 | |
Increase (Decrease) in: | | | | | | | | |
| Payable for interest | | | 1,936 | | | | — | |
| Payable for variation margin on futures contracts | | | (45,032 | ) | | | — | |
| Accrued management fees | | | (960 | ) | | | (1,280 | ) |
| Accrued Trustees fees | | | (2,095 | ) | | | (1,496 | ) |
| Accrued other expenses | | | (1,104 | ) | | | (8,028 | ) |
Net realized (gain) loss from: | | | | | | | | |
| Investments | | | 26,318 | | | | 459,642 | |
| Paydowns | | | (24 | ) | | | — | |
Change in net unrealized appreciation (depreciation) of investments | | | (18,284,352 | ) | | | (5,283,556 | ) |
Net cash provided by (used in) operating activities | | | (3,042,339 | ) | | | 1,332,536 | |
| Cash Flow from Financing Activities: | | | | | | | | |
Increase (Decrease) in cash overdraft | | | 4,116,536 | | | | 1,082,900 | |
Proceeds from floating rate obligations | | | 10,856,000 | | | | — | |
Cash distributions paid to common shareholders | | | (12,033,594 | ) | | | (2,840,663 | ) |
Net cash provided by (used in) financing activities | | | 2,938,942 | | | | (1,757,763 | ) |
| Net Increase (Decrease) in Cash and Cash Collateral at Brokers | | | (103,397 | ) | | | (425,227 | ) |
Cash and cash collateral at brokers at the beginning of period | | | 1,106,400 | | | | 425,227 | |
Cash and cash collateral at brokers at the end of period | | $ | 1,003,003 | | | $ | — | |
| | |
| Supplemental Disclosure of Cash Flow Information | | | | | | | | |
Cash paid for interest (excluding amortization of offering costs) | | $ | 936,778 | | | $ | 266,239 | |
See accompanying notes to financial statements.
49
Financial Highlights (Unaudited)
Selected data for a common share outstanding throughout each period:
| | | | | | | | | | | | | | | | | | | | | | | | | | | | |
| | | | | Investment Operations | | | Less Distributions to Common Shareholders | | | Common Share | |
| | | Beginning Common Share NAV | | | Net Investment Income (Loss) | | | Net Realized/ Unrealized Gain (Loss) | | | Total | | | From Net Investment Income | | | From Accumulated Net Realized Gains | | | Total | | | Ending NAV | | | Ending Share Price | |
| NID | | | | | | | | | | | | | | | | | | | | | | |
Year Ended 5/31: | | | | | | | | | | | | | | | | | | | |
2021(d) | | $ | 13.65 | | | $ | 0.29 | | | $ | 0.39 | | | $ | 0.68 | | | $ | (0.26 | ) | | $ | — | | | $ | (0.26 | ) | | $ | 14.07 | | | $ | 13.75 | |
2020 | | | 14.27 | | | | 0.54 | | | | (0.65 | ) | | | (0.11 | ) | | | (0.51 | ) | | | — | | | | (0.51 | ) | | | 13.65 | | | | 13.27 | |
2019 | | | 13.61 | | | | 0.54 | | | | 0.63 | | | | 1.17 | | | | (0.51 | ) | | | — | | | | (0.51 | ) | | | 14.27 | | | | 13.38 | |
2018 | | | 13.72 | | | | 0.59 | | | | (0.08 | ) | | | 0.51 | | | | (0.62 | ) | | | — | | | | (0.62 | ) | | | 13.61 | | | | 12.57 | |
2017 | | | 14.19 | | | | 0.63 | | | | (0.43 | ) | | | 0.20 | | | | (0.67 | ) | | | — | | | | (0.67 | ) | | | 13.72 | | | | 13.39 | |
2016 | | | 13.72 | | | | 0.68 | | | | 0.47 | | | | 1.15 | | | | (0.68 | ) | | | — | | | | (0.68 | ) | | | 14.19 | | | | 13.68 | |
| | |
| NIQ | | | | | | | | | | | | | | | | | | | | | | | | | | | | | |
Year Ended 5/31: | | | | | | | | | | | | | | | | | | | | | |
2021(d) | | | 14.36 | | | | 0.24 | | | | 0.37 | | | | 0.61 | | | | (0.22 | ) | | | — | | | | (0.22 | ) | | | 14.75 | | | | 14.54 | |
2020 | | | 14.30 | | | | 0.41 | | | | 0.03 | | | | 0.44 | | | | (0.38 | ) | | | — | | | | (0.38 | ) | | | 14.36 | | | | 13.89 | |
2019 | | | 13.66 | | | | 0.41 | | | | 0.60 | | | | 1.01 | | | | (0.37 | ) | | | — | | | | (0.37 | ) | | | 14.30 | | | | 13.26 | |
2018 | | | 13.95 | | | | 0.45 | | | | (0.28 | ) | | | 0.17 | | | | (0.46 | ) | | | — | | | | (0.46 | ) | | | 13.66 | | | | 12.52 | |
2017 | | | 14.30 | | | | 0.49 | | | | (0.33 | ) | | | 0.16 | | | | (0.51 | ) | | | — | | | | (0.51 | ) | | | 13.95 | | | | 13.15 | |
2016 | | | 13.69 | | | | 0.53 | | | | 0.66 | | | | 1.19 | | | | (0.58 | ) | | | — | | | | (0.58 | ) | | | 14.30 | | | | 13.53 | |
| | |
| | AMTP Shares at the End of Period | | | VMTP Shares
at the End of Period | |
| | | Aggregate Amount Outstanding (000) | | | Asset Coverage Per $100,000
Share | | | Aggregate Amount Outstanding (000) | | | Asset Coverage Per $100,000 Share | |
| NID | | | | | | | | | | | | |
Year Ended 5/31: | | | | | | | |
2021(d) | | $ | 175,000 | | | $ | 477,138 | | | $ | — | | | $ | — | |
2020 | | | 175,000 | | | | 465,808 | | | | — | | | | — | |
2019 | | | 175,000 | | | | 482,502 | | | | — | | | | — | |
2018 | | | 175,000 | | | | 464,903 | | | | — | | | | — | |
2017 | | | — | | | | — | | | | 175,000 | | | | 467,902 | |
2016 | | | — | | | | — | | | | 175,000 | | | | 480,319 | |
| | |
| NIQ | | | | | | | | | | | | | | | | |
Year Ended 5/31: | | | | | | | | | |
2021(d) | | | 55,000 | | | | 451,150 | | | | — | | | | — | |
2020 | | | 55,000 | | | | 441,862 | | | | — | | | | — | |
2019 | | | 55,000 | | | | 440,616 | | | | — | | | | — | |
2018 | | | 55,000 | | | | 425,356 | | | | — | | | | — | |
2017 | | | — | | | | — | | | | 55,000 | | | | 432,163 | |
2016 | | | — | | | | — | | | | 55,000 | | | | 440,588 | |
50
| | | | | | | | | | | | | | | | | |
| | | | | | | Common Share Supplemental Data/ Ratios Applicable to Common Shares | |
Common Share Total Returns | | | | | | Ratios to Average Net Assets(b) | | | | |
Based on NAV(a) | | | Based on Share Price(a) | | | Ending Net Assets (000) | | | Expenses | | | Net Investment Income (Loss) | | | Portfolio Turnover Rate(c) | |
| | |
| | |
| | 5.00 | % | | | 5.63 | % | | $ | 659,992 | | | | 1.19 | %* | | | 4.17 | %* | | | 6 | % |
| | (0.83 | ) | | | 2.97 | | | | 640,164 | | | | 1.51 | | | | 3.83 | | | | 17 | |
| | 8.80 | | | | 10.80 | | | | 669,379 | | | | 1.59 | | | | 3.95 | | | | 13 | |
| | 3.75 | | | | (1.56 | ) | | | 638,580 | | | | 1.48 | | | | 4.35 | | | | 19 | |
| | 1.49 | | | | 2.84 | | | | 643,828 | | | | 1.32 | | | | 4.61 | | | | 19 | |
| | 8.66 | | | | 15.59 | | | | 665,559 | | | | 1.20 | | | | 4.96 | | | | 10 | |
| | |
| | |
| | |
| | 4.28 | | | | 6.30 | | | | 193,132 | | | | 1.07 | | | | 3.32 | | | | 4 | |
| | 3.11 | | | | 7.70 | | | | 188,024 | | | | 1.43 | | | | 2.86 | | | | 13 | |
| | 7.54 | | | | 9.06 | | | | 187,339 | | | | 1.55 | | | | 2.96 | | | | 20 | |
| | 1.21 | | | | (1.37 | ) | | | 178,946 | | | | 1.41 | | | | 3.24 | | | | 10 | |
| | 1.20 | | | | 1.06 | | | | 182,690 | | | | 1.28 | | | | 3.55 | | | | 8 | |
| | 8.85 | | | | 13.26 | | | | 187,323 | | | | 1.20 | | | | 3.83 | | | | 7 | |
| | |
(a) | Total Return Based on Common Share NAV is the combination of changes in common share NAV, reinvested dividend income at NAV and reinvested capital gains distributions at NAV, if any. The last dividend declared in the period, which is typically paid on the first business day of the following month, is assumed to be reinvested at the ending NAV. The actual reinvest price for the last dividend declared in the period may often be based on the Fund’s market price (and not its NAV), and therefore may be different from the price used in the calculation. Total returns are not annualized. |
| Total Return Based on Common Share Price is the combination of changes in the market price per share and the effect of reinvested dividend income and reinvested capital gains distributions, if any, at the average price paid per share at the time of reinvestment. The last dividend declared in the period, which is typically paid on the first business day of the following month, is assumed to be reinvested at the ending market price. The actual reinvestment for the last dividend declared in the period may take place over several days, and in some instances may not be based on the market price, so the actual reinvestment price may be different from the price used in the calculation. Total returns are not annualized. |
(b) | • Net Investment Income (Loss) ratios reflect income earned and expenses incurred on assets attributable to preferred shares issued by the Fund. |
| • The expense ratios reflect, among other things, all interest expense and other costs related to preferred shares (as described in Note 5 – Fund Shares) and/or the interest expense deemed to have been paid by the Fund on the floating rate certificates issued by the special purpose trusts for the self-deposited inverse floaters held by the Fund (as described in Note 4 – Portfolio Securities and Investments in Derivatives), where applicable, as follows: |
| | | | | |
| NID | | | NIQ | |
Year Ended 5/31: | | | Year Ended 5/31: | |
2021(d) | 0.29%* | | 2021(d) | 0.29%* |
2020 | 0.62 | | 2020 | 0.64 |
2019 | 0.69 | | 2019 | 0.74 |
2018 | 0.57 | | 2018 | 0.61 |
2017 | 0.42 | | 2017 | 0.47 |
2016 | 0.30 | | 2016 | 0.38 |
| | |
(c) | Portfolio Turnover Rate is calculated based on the lesser of long-term purchases or sales (as disclosed in Note 4 – Portfolio Securities and Investments in Derivatives), divided by the average long-term market value during the period. |
(d) | For the six months ended November 30, 2020. |
* | Annualized. |
See accompanying notes to financial statements.
51
Financial Statements (Unaudited)
1. General Information
Fund Information
The funds covered in this report and their corresponding New York Stock Exchange (“NYSE”) symbols are as follows (each a “Fund” and collectively, the “Funds”):
| ● | Nuveen Intermediate Duration Municipal Term Fund (NID) |
| ● | Nuveen Intermediate Duration Quality Municipal Term Fund (NIQ) |
The Funds are registered under the Investment Company Act of 1940 (the “1940 Act”), as amended, as diversified closed-end management investment companies. NID and NIQ were organized as Massachusetts business trusts on September 11, 2012 and December 11, 2012, respectively. NID and NIQ each have a term of ten years and intend to liquidate and distribute their net assets to shareholders on or before March 31, 2023 and June 30, 2023, respectively.
The end of the reporting period for the Funds is November 30, 2020, and the period covered by these Notes to Financial Statements is the six months ended November 30, 2020 (the “current fiscal period”).
Investment Adviser and Sub-Adviser
The Funds’ investment adviser is Nuveen Fund Advisors, LLC (the “Adviser”), a subsidiary of Nuveen, LLC (“Nuveen”). Nuveen is the investment management arm of Teachers Insurance and Annuity Association of America (TIAA). The Adviser has overall responsibility for management of the Funds, oversees the management of the Funds’ portfolios, manages the Funds’ business affairs and provides certain clerical, bookkeeping and other administrative services, and, if necessary, asset allocation decisions. The Adviser has entered into sub-advisory agreements with Nuveen Asset Management, LLC (the “Sub-Adviser”), a subsidiary of the Adviser, under which the Sub-Adviser manages the investment portfolios of the Funds.
Other Matters
The outbreak of the novel coronavirus (“COVID-19”) and subsequent global pandemic began significantly impacting the U.S. and global financial markets and economies during the calendar quarter ended March 31, 2020. The worldwide spread of COVID-19 has created significant uncertainty in the global economy. The duration and extent of COVID-19 over the long term cannot be reasonably estimated at this time. The ultimate impact of COVID-19 and the extent to which COVID-19 impacts the Funds’ normal course of business, results of operations, investments, and cash flows will depend on future developments, which are highly uncertain and difficult to predict. Management continues to monitor and evaluate this situation.
2. Significant Accounting Policies
The accompanying financial statements were prepared in accordance with accounting principles generally accepted in the United States of America (“U.S. GAAP”), which may require the use of estimates made by management and the evaluation of subsequent events. Actual results may differ from those estimates. Each Fund is an investment company and follows the accounting guidance in the Financial Accounting Standards Board (“FASB”) Accounting Standards Codification 946, Financial Services—Investment Companies. The net asset value (“NAV”) for financial reporting purposes may differ from the NAV for processing security and common share transactions. The NAV for financial reporting purposes includes security and common share transactions through the date of the report. Total return is computed based on the NAV used for processing security and common share transactions. The following is a summary of the significant accounting policies consistently followed by the Funds.
Compensation
The Funds pay no compensation directly to those of its trustees who are affiliated with the Adviser or to its officers, all of whom receive remuneration for their services to the Funds from the Adviser or its affiliates. The Funds’ Board of Trustees (the “Board”) has adopted a deferred compensation plan for independent trustees that enables trustees to elect to defer receipt of all or a portion of the annual compensation they are entitled to receive from certain Nuveen-advised funds. Under the plan, deferred amounts are treated as though equal dollar amounts had been invested in shares of select Nuveen-advised funds.
Distributions to Common Shareholders
Distributions to common shareholders are recorded on the ex-dividend date. The amount, character and timing of distributions are determined in accordance with federal income tax regulations, which may differ from U.S. GAAP.
52
Indemnifications
Under the Funds’ organizational documents, their officers and trustees are indemnified against certain liabilities arising out of the performance of their duties to the Funds. In addition, in the normal course of business, the Funds enter into contracts that provide general indemnifications to other parties. The Funds’ maximum exposure under these arrangements is unknown as this would involve future claims that may be made against the Funds that have not yet occurred. However, the Funds have not had prior claims or losses pursuant to these contracts and expect the risk of loss to be remote.
Investments and Investment Income
Securities transactions are accounted for as of the trade date for financial reporting purposes. Realized gains and losses on securities transactions are based upon the specific identification method. Investment income is comprised of interest income, which is recorded on an accrual basis and includes accretion of discounts and amortization of premiums for financial reporting purposes. Investment income also reflects payment-in-kind (“PIK”) interest and paydown gains and losses, if any. PIK interest represents income received in the form of securities in lieu of cash. Investment income also reflects dividend income, which is recorded on the ex-dividend date.
Netting Agreements
In the ordinary course of business, the Funds may enter into transactions subject to enforceable International Swaps and Derivatives Association, Inc. (ISDA) master agreements or other similar arrangements (“netting agreements”). Generally, the right to offset in netting agreements allows each Fund to offset certain securities and derivatives with a specific counterparty, when applicable, as well as any collateral received or delivered to that counterparty based on the terms of the agreements. Generally, each Fund manages its cash collateral and securities collateral on a counterparty basis.
The Funds’ investments subject to netting agreements as of the end of the reporting period, if any, are further described in Note 4 – Portfolio Securities and Investments in Derivatives.
New Accounting Pronouncements and Rule Issuances
Reference Rate Reform
In March 2020, FASB issued Accounting Standards Update (“ASU”) 2020-04, Reference Rate Reform: Facilitation of the Effects of Reference Rate Reform on Financial Reporting. The main objective of the new guidance is to provide relief to companies that will be impacted by the expected change in benchmark interest rates at the end of 2021, when participating banks will no longer be required to submit London Interbank Offered Rate (LIBOR) quotes by the UK Financial Conduct Authority (FCA). The new guidance allows companies to, provided the only change to existing contracts are a change to an approved benchmark interest rate, account for modifications as a continuance of the existing contract without additional analysis. For new and existing contracts, the Funds may elect to apply the amendments as of March 12, 2020 through December 31, 2022. Management has not yet elected to apply the amendments, but is currently assessing the impact of the ASU’s adoption to the Funds’ financial statements and various filings.
3. Investment Valuation and Fair Value Measurements
The Funds’ investments in securities are recorded at their estimated fair value utilizing valuation methods approved by the Board. Fair value is defined as the price that would be received upon selling an investment or transferring a liability in an orderly transaction to an independent buyer in the principal or most advantageous market for the investment. U.S. GAAP establishes the three-tier hierarchy is used to maximize the use of observable market data and minimize the use of unobservable inputs and to establish classification of fair value measurements for disclosure purposes. Observable inputs reflect the assumptions market participants would use in pricing the asset or liability. Observable inputs are based on market data obtained from sources independent of the reporting entity. Unobservable inputs reflect management’s assumptions about the assumptions market participants would use in pricing the asset or liability. Unobservable inputs are based on the best information available in the circumstances. The following is a summary of the three-tiered hierarchy of valuation input levels.
Level 1 – Inputs are unadjusted and prices are determined using quoted prices in active markets for identical securities.
Level 2 – Prices are determined using other significant observable inputs (including quoted prices for similar securities, interest rates, credit spreads, etc.).
Level 3 – Prices are determined using significant unobservable inputs (including management’s assumptions in determining the fair value of investments).
A description of the valuation techniques applied to the Funds’ major classifications of assets and liabilities measured at fair value follows:
Prices of fixed-income securities are generally provided by an independent pricing service (“pricing service”) approved by the Board. The pricing service establishes a security’s fair value using methods that may include consideration of the following: yields or prices of investments of comparable quality, type of issue, coupon, maturity and rating, market quotes or indications of value from security dealers, evaluations of anticipated cash flows or collateral, general market conditions and other information and analysis, including the obligor’s credit characteristics considered relevant. In pricing certain securities, particularly less liquid and lower quality securities, the pricing service may consider information about a security, its issuer or market activity, provided by the Adviser. These securities are generally classified as Level 2.
53
Notes to Financial Statements (Unaudited) (continued)
Equity securities and exchange-traded fund listed or traded on a national market or exchange are valued based on their sale price at the official close of business of such market or exchange on the valuation date. Foreign equity securities are valued at the last sale price or official closing price reported on the exchange where traded and converted to U.S. dollars at the prevailing rates of exchange on the date of valuation. To the extent these securities are actively traded and that valuation adjustments are not applied, they are generally classified as Level 1. If there is no official close of business, then the latest available sale price is utilized. If no sales are reported, then the mean of the latest available bid and ask prices is utilized and are generally classified as Level 2.
Futures contracts are valued using the closing settlement price or, in the absence of such a price, the last traded price and are generally classified as Level 1.
Any portfolio security or derivative for which market quotations are not readily available or for which the above valuation procedures are deemed not to reflect fair value are valued at fair value, as determined in good faith using procedures approved by the Board. As a general principle, the fair value of a security would appear to be the amount that the owner might reasonably expect to receive for it in a current sale. A variety of factors may be considered in determining the fair value of such securities, which may include consideration of the following: yields or prices of investments of comparable quality, type of issue, coupon, maturity and rating, market quotes or indications of value from security dealers, evaluations of anticipated cash flows or collateral, general market conditions and other information and analysis, including the obligor’s credit characteristics considered relevant. To the extent the inputs are observable and timely, the values would be classified as Level 2 of the fair value hierarchy; otherwise they would be classified as Level 3.
The following table summarizes the market value of the Funds’ investments as of the end of the reporting period, based on the inputs used to value them:
| | | | | | | | | | | | | |
| NID | | Level 1 | | | Level 2 | | | Level 3 | | | Total | |
Long-Term Investments*: | | | | | | | | | | | | |
| Municipal Bonds | | $ | — | | | $ | 833,875,372 | | | $ | 11,747 | ** | | $ | 833,887,119 | |
| Common Stocks | | | — | | | | 21,792,158 | *** | | | — | | | | 21,792,158 | |
Investments in Derivatives: | | | | | | | | | | | | | | | | |
| Futures Contracts**** | | | 12,777 | | | | — | | | | — | | | | 12,777 | |
Total | | $ | 12,777 | | | $ | 855,667,530 | | | $ | 11,747 | | | $ | 855,692,054 | |
| | |
| NIQ | | | | | | | | | | | | | | | | |
Long-Term Investments*: | | | | | | | | | | | | | | | | |
| Municipal Bonds | | $ | — | | | $ | 240,114,533 | | | $ | — | | | $ | 240,114,533 | |
| Common Stocks | | | — | | | | 2,188,949 | *** | | | — | | | | 2,188,949 | |
Total | | $ | — | | | $ | 242,303,482 | | | $ | — | | | $ | 242,303,482 | |
| |
*
| Refer to the Fund’s Portfolio of Investments for state and/or industry classifications, where applicable. |
**
| Refer to the Fund’s Portfolio of Investments for securities classified as Level 2. |
***
| Refer to the Fund’s Portfolio of Investments for securities classified as Level 3. |
****
| Represents net unrealized appreciation (depreciation) as reported in the Fund’s Portfolio of Investments. |
4. Portfolio Securities and Investments in Derivatives
Portfolio Securities
Inverse Floating Rate Securities
Each Fund is authorized to invest in inverse floating rate securities. An inverse floating rate security is created by depositing a municipal bond (referred to as an “Underlying Bond”), typically with a fixed interest rate, into a special purpose tender option bond (“TOB”) trust (referred to as the “TOB Trust”) created by or at the direction of one or more Funds. In turn, the TOB Trust issues (a) floating rate certificates (referred to as “Floaters”), in face amounts equal to some fraction of the Underlying Bond’s par amount or market value, and (b) an inverse floating rate certificate (referred to as an “Inverse Floater”) that represents all remaining or residual interest in the TOB Trust. Floaters typically pay short-term tax-exempt interest rates to third parties who are also provided a right to tender their certificate and receive its par value, which may be paid from the proceeds of a remarketing of the Floaters, by a loan to the TOB Trust from a third party liquidity provider (“Liquidity Provider”), or by the sale of assets from the TOB Trust. The Inverse Floater is issued to a long term investor, such as one or more of the Funds. The income received by the Inverse Floater holder varies inversely with the short-term rate paid to holders of the Floaters, and in most circumstances the Inverse Floater holder bears substantially all of the Underlying Bond’s downside investment risk and also benefits disproportionately from any potential appreciation of the Underlying Bond’s value. The value of an Inverse Floater will be more volatile than that of the Underlying Bond because the interest rate is dependent on not only the fixed coupon rate of the Underlying Bond but also on the short-term interest paid on the Floaters, and because the Inverse Floater essentially bears the risk of loss (and possible gain) of the greater face value of the Underlying Bond.
54
The Inverse Floater held by a Fund gives the Fund the right to (a) cause the holders of the Floaters to tender their certificates at par (or slightly more than par in certain circumstances), and (b) have the trustee of the TOB Trust (the “Trustee”) transfer the Underlying Bond held by the TOB Trust to the Fund, thereby collapsing the TOB Trust.
The Fund may acquire an Inverse Floater in a transaction where it (a) transfers an Underlying Bond that it owns to a TOB Trust created by a third party or (b) transfers an Underlying Bond that it owns, or that it has purchased in a secondary market transaction for the purpose of creating an Inverse Floater, to a TOB Trust created at its direction, and in return receives the Inverse Floater of the TOB Trust (referred to as a “self-deposited Inverse Floater”). A Fund may also purchase an Inverse Floater in a secondary market transaction from a third party creator of the TOB Trust without first owning the Underlying Bond (referred to as an “externally-deposited Inverse Floater”).
An investment in a self-deposited Inverse Floater is accounted for as a “financing” transaction (i.e., a secured borrowing). For a self-deposited Inverse Floater, the Underlying Bond deposited into the TOB Trust is identified in the Fund’s Portfolio of Investments as “(UB) – Underlying bond of an inverse floating rate trust reflected as a financing transaction,” with the Fund recognizing as liabilities, labeled “Floating rate obligations” on the Statement of Assets and Liabilities, (a) the liquidation value of Floaters issued by the TOB Trust, and (b) the amount of any borrowings by the TOB Trust from a Liquidity Provider to enable the TOB Trust to purchase outstanding Floaters in lieu of a remarketing. In addition, the Fund recognizes in “Investment Income” the entire earnings of the Underlying Bond, and recognizes (a) the interest paid to the holders of the Floaters or on the TOB Trust’s borrowings, and (b) other expenses related to remarketing, administration, trustee, liquidity and other services to a TOB Trust, as a component of “Interest expense and amortization of offering costs” on the Statement of Operations. Earnings due from the Underlying Bond and interest due to the holders of the Floaters as of the end of the reporting period are recognized as components of “Receivable for interest” and “Payable for interest” on the Statement of Assets and Liabilities, respectively.
In contrast, an investment in an externally-deposited Inverse Floater is accounted for as a purchase of the Inverse Floater and is identified in the Fund’s Portfolio of Investments as “(IF) – Inverse floating rate investment.” For an externally-deposited Inverse Floater, a Fund’s Statement of Assets and Liabilities recognizes the Inverse Floater and not the Underlying Bond as an asset, and the Fund does not recognize the Floaters, or any related borrowings from a Liquidity Provider, as a liability. Additionally, the Fund reflects in “Investment Income” only the net amount of earnings on the Inverse Floater (net of the interest paid to the holders of the Floaters or the Liquidity Provider as lender, and the expenses of the Trust), and does not show the amount of that interest paid or the expenses of the TOB Trust as described above as interest expense on the Statement of Operations.
Fees paid upon the creation of a TOB Trust for self-deposited Inverse Floaters and externally-deposited Inverse Floaters are recognized as part of the cost basis of the Inverse Floater and are capitalized over the term of the TOB Trust.
As of the end of the reporting period, the aggregate value of Floaters issued by each Fund’s TOB Trust for self-deposited Inverse Floaters and externally-deposited Inverse Floaters was as follows:
| | | | | | | |
| Floating Rate Obligations Outstanding | | NID | | | NIQ | |
Floating rate obligations: self-deposited Inverse Floaters | | $ | 30,968,000 | | | $ | — | |
Floating rate obligations: externally-deposited Inverse Floaters | | | 185,041,250 | | | | 48,263,750 | |
Total | | $ | 216,009,250 | | | $ | 48,263,750 | |
During the current fiscal period, the average amount of Floaters (including any borrowings from a Liquidity Provider) outstanding, and the average annual interest rate and fees related to self-deposited Inverse Floaters, were as follows:
| | | | | | | |
| Self-Deposited Inverse Floaters | | NID | | | NIQ | |
Average floating rate obligations outstanding | | $ | 24,544,781 | | | $ | — | |
Average annual interest rate and fees | | | 0.74 | % | | | — | % |
TOB Trusts are supported by a liquidity facility provided by a Liquidity Provider pursuant to which the Liquidity Provider agrees, in the event that Floaters are (a) tendered to the Trustee for remarketing and the remarketing does not occur, or (b) subject to mandatory tender pursuant to the terms of the TOB Trust agreement, to either purchase Floaters or to provide the Trustee with an advance from a loan facility to fund the purchase of Floaters by the TOB Trust. In certain circumstances, the Liquidity Provider may otherwise elect to have the Trustee sell the Underlying Bond to retire the Floaters that were tendered and not remarketed prior to providing such a loan. In these circumstances, the Liquidity Provider remains obligated to provide a loan to the extent that the proceeds of the sale of the Underlying Bond is not sufficient to pay the purchase price of the Floaters.
The size of the commitment under the loan facility for a given TOB Trust is at least equal to the balance of that TOB Trust’s outstanding Floaters plus any accrued interest. In consideration of the loan facility, fee schedules are in place and are charged by the Liquidity Provider(s). Any loans made by the Liquidity Provider will be secured by the purchased Floaters held by the TOB Trust. Interest paid on any outstanding loan balances will be effectively borne by the Fund that owns the Inverse Floaters of the TOB Trust that has incurred the borrowing and may be at a rate that is greater than the rate that would have been paid had the Floaters been successfully remarketed.
55
Notes to Financial Statements (Unaudited) (continued)
As described above, any amounts outstanding under a liquidity facility are recognized as a component of “Floating rate obligations” on the Statement of Assets and Liabilities by the Fund holding the corresponding Inverse Floaters issued by the borrowing TOB Trust. As of the end of the reporting period there were no loans outstanding under any such facility.
Each Fund may also enter into shortfall and forbearance agreements (sometimes referred to as a “recourse arrangement”) (TOB Trusts involving such agreements are referred to herein as “Recourse Trusts”), under which a Fund agrees to reimburse the Liquidity Provider for the Trust’s Floaters, in certain circumstances, for the amount (if any) by which the liquidation value of the Underlying Bond held by the TOB Trust may fall short of the sum of the liquidation value of the Floaters issued by the TOB Trust plus any amounts borrowed by the TOB Trust from the Liquidity Provider, plus any shortfalls in interest cash flows. Under these agreements, a Fund’s potential exposure to losses related to or on an Inverse Floater may increase beyond the value of the Inverse Floater as a Fund may potentially be liable to fulfill all amounts owed to holders of the Floaters or the Liquidity Provider. Any such shortfall amount in the aggregate is recognized as “Unrealized depreciation on Recourse Trusts” on the Statement of Assets and Liabilities.
As of the end of the reporting period, each Fund’s maximum exposure to the Floaters issued by Recourse Trusts for self-deposited Inverse Floaters and externally-deposited Inverse Floaters was as follows:
| | | | | | | |
| Floating Rate Obligations – Recourse Trusts | | NID | | | NIQ | |
Maximum exposure to Recourse Trusts: self-deposited Inverse Floaters | | $ | 30,968,000 | | | $ | — | |
Maximum exposure to Recourse Trusts: externally-deposited Inverse Floaters | | | 185,041,250 | | | | 48,263,750 | |
Total | | $ | 216,009,250 | | | $ | 48,263,750 | |
Zero Coupon Securities
A zero coupon security does not pay a regular interest coupon to its holders during the life of the security. Income to the holder of the security comes from accretion of the difference between the original purchase price of the security at issuance and the par value of the security at maturity and is effectively paid at maturity. The market prices of zero coupon securities generally are more volatile than the market prices of securities that pay interest periodically.
Investment Transactions
Long-term purchases and sales (including maturities but excluding derivative transactions, where applicable) during the current fiscal period were as follows:
| | | | | | | |
| | NID | | | NIQ | |
Purchases | | $ | 61,282,858 | | | $ | 8,954,939 | |
Sales and maturities | | | 46,783,050 | | | | 8,602,351 | |
The Funds may purchase securities on a when-issued or delayed-delivery basis. Securities purchased on a when-issued or delayed-delivery basis may have extended settlement periods; interest income is not accrued until settlement date. Any securities so purchased are subject to market fluctuation during this period. The Funds have earmarked securities in their portfolios with a current value at least equal to the amount of the when issued/ delayed-delivery purchase commitments. If the Funds have outstanding when-issued/delayed-delivery purchases commitments as of the end of the reporting period, such amounts are recognized on the Statement of Assets and Liabilities.
Investments in Derivatives
In addition to the inverse floating rate securities in which each Fund may invest, which are considered portfolio securities for financial reporting purposes, each Fund is authorized to invest in certain other derivative instruments such as futures, options and swap contracts. Each Fund limits its investments in futures, options on futures and swap contracts to the extent necessary for the Adviser to claim the exclusion from registration by the Commodity Futures Trading Commission as a commodity pool operator with respect to the Fund. The Funds record derivative instruments at fair value, with changes in fair value recognized on the Statement of Operations, when applicable. Even though the Funds’ investments in derivatives may represent economic hedges, they are not considered to be hedge transactions for financial reporting purposes.
Futures Contracts
Upon execution of a futures contract, a Fund is obligated to deposit cash or eligible securities, also known as “initial margin,” into an account at its clearing broker equal to a specified percentage of the contract amount. Cash held by the broker to cover initial margin requirements on open futures contracts, if any, is recognized as “Cash collateral at brokers for investments in futures contracts” on the Statement of Assets and Liabilities. Investments in futures contracts obligate a Fund and the clearing broker to settle monies on a daily basis representing changes in the prior days “mark-to-market” of the open contracts. If a Fund has unrealized appreciation the clearing broker would credit the Fund’s account with an amount equal to appreciation and conversely if a Fund has unrealized depreciation the clearing broker would debit the Fund’s account with an amount equal to depreciation. These daily cash settlements are also known as “variation margin.” Variation margin is recognized as a receivable and/or payable for “Variation margin on futures contracts” on the Statement of Assets and Liabilities.
56
During the period the futures contract is open, changes in the value of the contract are recognized as an unrealized gain or loss by “marking-to-market” on a daily basis to reflect the changes in market value of the contract, which is recognized as a component of “Change in net unrealized appreciation (depreciation) of futures contracts” on the Statement of Operations. When the contract is closed or expired, a Fund records a realized gain or loss equal to the difference between the value of the contract on the closing date and value of the contract when originally entered into, which is recognized as a component of “Net realized gain (loss) from futures contracts” on the Statement of Operations.
Risks of investments in futures contracts include the possible adverse movement in the price of the securities or indices underlying the contracts, the possibility that there may not be a liquid secondary market for the contracts and/or that a change in the value of the contract may not correlate with a change in the value of the underlying securities or indices.
During the current fiscal period, NID invested in interest rate futures to manage the duration of its portfolio by shorting interest rate futures contracts.
The average notional amount of futures contracts outstanding during the current fiscal period was as follows:
| | |
| NID |
Average notional amount of futures contracts outstanding* | $2,272,299 |
* The average notional amount is calculated based on the absolute aggregate notional amount of contracts outstanding at the beginning of the current fiscal period and at the end of each fiscal quarter within the current fiscal period.
The following table presents the fair value of all futures contracts held by the Fund as of the end of the reporting period, the location of these instruments on the Statement of Assets and Liabilities and the primary underlying risk exposure.
| | | | | | | |
| | | Location on the Statement of Assets and Liabilities
|
| | Asset Derivatives | | (Liability) Derivatives |
| Underlying | Derivative | | | | | |
| Risk Exposure | Instrument | Location | Value | | Location | Value |
| NID | | | | | | |
Interest rate | Futures contracts | — | $ — | | Payable for | $12,777 |
| | | | | variation margin on | |
| | | | | futures contracts* | |
* Value represents the cumulative unrealized appreciation (depreciation) of futures contracts as reported in the Fund’s Portfolio of Investments and not the daily asset and/or liability derivatives location as described in the table above.
The following table presents the amount of net realized gain (loss) and change in net unrealized appreciation (depreciation) recognized on futures contracts on the Statement of Operations during the current fiscal period, and the primary underlying risk exposure.
| | | | |
| | | Change in Net |
| | Net Realized | Unrealized Appreciation |
| Underlying | Derivative | Gain (Loss) from | (Depreciation) of |
| Risk Exposure | Instrument | Futures Contracts | Futures Contracts |
Interest rate | Futures contracts | $36,636 | $25,747 |
Market and Counterparty Credit Risk
In the normal course of business each Fund may invest in financial instruments and enter into financial transactions where risk of potential loss exists due to changes in the market (market risk) or failure of the other party to the transaction to perform (counterparty credit risk). The potential loss could exceed the value of the financial assets recorded on the financial statements. Financial assets, which potentially expose each Fund to counterparty credit risk, consist principally of cash due from counterparties on forward, option and swap transactions, when applicable. The extent of each Fund’s exposure to counterparty credit risk in respect to these financial assets approximates their carrying value as recorded on the Statement of Assets and Liabilities.
Each Fund helps manage counterparty credit risk by entering into agreements only with counterparties the Adviser believes have the financial resources to honor their obligations and by having the Adviser monitor the financial stability of the counterparties. Additionally, counterparties may be required to pledge collateral daily (based on the daily valuation of the financial asset) on behalf of each Fund with a value approximately equal to the amount of any unrealized gain above a pre-determined threshold. Reciprocally, when each Fund has an unrealized loss, the Funds have instructed the custodian to pledge assets of the Funds as collateral with a value approximately equal to the amount of the unrealized loss above a pre-determined threshold. Collateral pledges are monitored and subsequently adjusted if and when the valuations fluctuate, either up or down, by at least the pre-determined threshold amount.
57
Notes to Financial Statements (Unaudited) (continued)
5. Fund Shares
Common Share Transactions
The Funds did not have any transactions in common shares during current and prior fiscal period.
Preferred Shares
Adjustable Rate MuniFund Term Preferred Shares
The Funds have issued and have outstanding Adjustable Rate MuniFund Term Preferred (“AMTP”) Shares, with a $100,000 liquidation preference per share. AMTP Shares are issued via private placement and are not publicly available.
As of the end of the reporting period, details of each Fund’s AMTP Shares outstanding were as follows:
| | | | | |
| | | | Liquidation |
| | | | Preference, |
| | Shares | Liquidation | net of deferred |
| Fund | Series | Outstanding | Preference | offering cost |
| NID | 2023 | 1,750 | $175,000,000 | $174,911,185 |
| NIQ | 2023 | 550 | $55,000,000 | $54,930,624 |
Each Fund is obligated to redeem its AMTP Shares by the date as specified in its offering document (“Term Redemption Date”), unless earlier redeemed by the Fund. AMTP Shares are subject to optional and mandatory redemption in certain circumstances. The AMTP Shares may be redeemed at the option of each Fund, subject to payment of premium for approximately six months following the date of issuance (“Premium Expiration Date”), and at the redemption price per share thereafter. The redemption price per share is equal to the sum of the liquidation preference per share plus any accumulated but unpaid dividends.
AMTP Shares are short-term or short/intermediate-term instruments that pay a variable dividend rate tied to a short-term index, plus an additional fixed “spread” amount which is initially established at the time of issuance and may be adjusted in the future based upon a mutual agreement between the majority owner and each Fund. From time-to-time the majority owner may propose to each Fund an adjustment to the dividend rate. Should the majority owner and the Funds fail to agree upon an adjusted dividend rate, and such proposed dividend rate adjustment is not withdrawn, the Funds will be required to redeem all outstanding shares upon the end of a notice period.
In addition, the Funds may be obligated to redeem a certain amount of the AMTP Shares if the Funds fail to maintain certain asset coverage and leverage ratio requirements and such failures are not cured by the applicable cure date. The Term Redemption Date and Premium Expiration Date for each Fund’s AMTP Shares are as follows:
| | | | | |
| Notice | | Term | Premium |
| Fund | Period | Series | Redemption Date | Expiration Date |
| NID | 360-day | 2023 | March 31, 2023* | August 31, 2018 |
| NIQ | 360-day | 2023 | June 30, 2023* | August 31, 2018 |
* Subject to early termination by either the Fund or the holder.
The average liquidation preference of AMTP Shares outstanding and annualized dividend rate for the Funds during the current fiscal period were as follows:
| | | | | | | |
| | NID | | | NIQ | |
Average liquidation preference of AMTP Shares outstanding | | $ | 175,000,000 | | | $ | 55,000,000 | |
Annualized dividend rate | | | 0.97 | % | | | 0.97 | % |
AMTP Shares are subject to restrictions on transfer, generally do not trade, and market quotations are generally not available. The fair value of AMTP Shares is expected to be approximately their liquidation preference so long as the fixed “spread” on the AMTP Shares remains roughly in line with the “spread” being demanded by investors on instruments having similar terms in the current market environment. In present market conditions, the Funds’ Adviser has determined that the fair value of AMTP Shares is approximately their liquidation preference, but their fair value could vary if market conditions change materially. For financial reporting purposes, the liquidation preference of AMTP Shares is a liability and is recognized as a component of “Adjustable Rate MuniFund Term Preferred (“AMTP”) Shares, net of deferred offering costs” on the Statement of Assets and Liabilities.
58
AMTP Share dividends are treated as interest payments for financial reporting purposes. Unpaid dividends on AMTP Shares are recognized as a component of “Interest payable” on the Statement of Assets and Liabilities. Dividends accrued on AMTP Shares are recognized as a component of “Interest expense and amortization of offering costs” on the Statement of Operations.
Costs incurred in connection each Fund’s offering of AMTP Shares were recorded as deferred charges, which are amortized over the life of the shares and are recognized as components of “Adjustable Rate MuniFund Term Preferred (“AMTP”) Shares, net of deferred offering costs” on the Statement of Assets and Liabilities and “Interest expense and amortization of offering costs” on the Statement of Operations.
Preferred Share Transactions
The Funds did not have any transactions in preferred shares during the current or prior fiscal period.
6. Income Tax Information
Each Fund is a separate taxpayer for federal income tax purposes. Each Fund intends to distribute substantially all of its net investment income and net capital gains to shareholders and to otherwise comply with the requirements of Subchapter M of the Internal Revenue Code applicable to regulated investment companies. Therefore, no federal income tax provision is required. Furthermore, each Fund intends to satisfy conditions that will enable interest from municipal securities, which is exempt from regular federal income tax, to retain such tax-exempt status when distributed to shareholders of the Funds. Net realized capital gains and ordinary income distributions paid by the Funds are subject to federal taxation.
For all open tax years and all major taxing jurisdictions, management of the Funds has concluded that there are no significant uncertain tax positions that would require recognition in the financial statements. Open tax years are those that are open for examination by taxing authorities (i.e., generally the last four tax year ends and the interim tax period since then). Furthermore, management of the Funds is also not aware of any tax positions for which it is reasonably possible that the total amounts of unrecognized tax benefits will significantly change in the next twelve months.
The following information is presented on an income tax basis. Differences between amounts for financial statement and federal income tax purposes are primarily due to timing differences in recognizing taxable market discount, timing differences in recognizing certain gains and losses on investment transactions and the treatment of investments in inverse floating rate securities reflected as financing transactions, if any. To the extent that differences arise that are permanent in nature, such amounts are reclassified within the capital accounts as detailed below. Temporary differences do not require reclassification. Temporary and permanent differences do not impact the NAVs of the Funds.
The table below presents the cost and unrealized appreciation (depreciation) of each Fund’s investment portfolio, as determined on a federal income tax basis, as of November 30, 2020.
For purposes of this disclosure, derivative tax cost is generally the sum of any upfront fees or premiums exchanged and any amounts unrealized for income statement reporting but realized in income and/or capital gains for tax reporting. If a particular derivative category does not disclose any tax unrealized appreciation or depreciation, the change in value of those derivatives have generally been fully realized for tax purposes.
| | | | | | | |
| | NID | | | NIQ | |
Tax cost of investments | | $ | 802,417,617 | | | $ | 225,278,959 | |
Gross unrealized: | | | | | | | | |
| Appreciation | | $ | 44,597,952 | | | $ | 17,763,270 | |
| Depreciation | | | (22,291,603 | ) | | | (738,747 | ) |
Net unrealized appreciation (depreciation) of investments | | $ | 22,306,349 | | | $ | 17,024,523 | |
Permanent differences, primarily due to taxable market discount, treatment of notional principal contracts, federal taxes paid, paydowns and nondeductible offering costs, resulted in reclassifications among the Funds’ components of net assets as of May 31, 2020, the Funds’ last tax year end.
The tax components of undistributed net tax-exempt income, net ordinary income and net long-term capital gains as of May 31, 2020, the Funds’ last tax year end, were as follows:
| | | | | | | |
| | NID | | | NIQ | |
Undistributed net tax-exempt income1 | | $ | 3,566,224 | | | $ | 869,397 | |
Undistributed net ordinary income2 | | | 196,564 | | | | 125,834 | |
Undistributed net long-term capital gains | | | — | | | | — | |
| |
1
| Undistributed net tax-exempt income (on a tax basis) has not been reduced for the dividend declared on May 1, 2020, and paid on June 1, 2020. |
2
| Net ordinary income consists of taxable market discount income and net short-term capital gains, if any. |
59
Notes to Financial Statements (Unaudited) (continued)
The tax character of distributions paid during the Funds’ last tax years ended May 31, 2020 was designated for purposes of the dividends paid deduction as follows:
| | | | | | | |
| | NID | | | NIQ | |
Distributions from net tax-exempt income | | $ | 23,750,762 | | | $ | 4,998,837 | |
Distributions from net ordinary income2 | | | 173,165 | | | | 4,272 | |
Distributions from net long-term capital gains | | | — | | | | — | |
| |
2
| Net ordinary income consists of taxable market discount income and net short-term capital gains, if any |
As of May 31, 2020, the Funds’ last tax year end, the Funds had unused capital losses carrying forward available for federal income tax purposes to be applied against future capital gains, if any. The capital losses are not subject to expiration.
| | | | | | | |
| | NID | | | NIQ | |
Not subject to expiration: | | | | | | |
| Short-term | | $ | 20,019,259 | | | $ | 8,007,051 | |
| Long-term | | | 16,087,876 | | | | 3,191,632 | |
Total | | $ | 36,107,135 | | | $ | 11,198,683 | |
During the Funds’ last tax year ended May 31, 2020, NIQ utilized $75,009 of its capital loss carryforward.
7. Management Fees and Other Transactions with Affiliates
Management Fees
Each Fund’s management fee compensates the Adviser for overall investment advisory and administrative services and general office facilities. The Sub-Adviser is compensated for its services to the Funds from the management fees paid to the Adviser.
Each Fund’s management fee consists of two components – a fund-level fee, based only on the amount of assets within each individual Fund, and a complex-level fee, based on the aggregate amount of all eligible fund assets managed by the Adviser. This pricing structure enables Fund shareholders to benefit from growth in the assets within their respective Fund as well as from growth in the amount of complex-wide assets managed by the Adviser.
The annual fund-level fee, payable monthly, for each Fund is calculated according to the following schedule:
| | | | | | | |
| | NID | | | NIQ | |
| Average Daily Managed Assets* | | Fund-Level Fee Rate | | | Fund-Level Fee Rate | |
For the first $125 million | | | 0.4000 | % | | | 0.3000 | % |
For the next $125 million | | | 0.3875 | | | | 0.2875 | |
For the next $250 million | | | 0.3750 | | | | 0.2750 | |
For the next $500 million | | | 0.3625 | | | | 0.2625 | |
For the next $1 billion | | | 0.3500 | | | | 0.2500 | |
For the next $3 billion | | | 0.3250 | | | | 0.2250 | |
For managed assets over $5 billion | | | 0.3125 | | | | 0.2125 | |
60
The annual complex-level fee, payable monthly, for each Fund is calculated by multiplying the current complex-wide fee rate, determined according to the following schedule by the Fund’s daily managed assets:
| | | | |
| Complex-Level Eligible Asset Breakpoint Level* | | Effective Complex-Level Fee Rate at Breakpoint Level | |
$55 billion | | | 0.2000 | % |
$56 billion | | | 0.1996 | |
$57 billion | | | 0.1989 | |
$60 billion | | | 0.1961 | |
$63 billion | | | 0.1931 | |
$66 billion | | | 0.1900 | |
$71 billion | | | 0.1851 | |
$76 billion | | | 0.1806 | |
$80 billion | | | 0.1773 | |
$91 billion | | | 0.1691 | |
$125 billion | | | 0.1599 | |
$200 billion | | | 0.1505 | |
$250 billion | | | 0.1469 | |
$300 billion | | | 0.1445 | |
* | For the complex-level fees, managed assets include closed-end fund assets managed by the Adviser that are attributable to certain types of leverage. For these purposes, leverage includes the funds’ use of preferred stock and borrowings and certain investments in the residual interest certificates (also called inverse floating rate securities) in tender option bond (TOB) trusts, including the portion of assets held by a TOB trust that has been effectively financed by the trust’s issuance of floating rate securities, subject to an agreement by the Adviser as to certain funds to limit the amount of such assets for determining managed assets in certain circumstances. The complex-level fee is calculated based upon the aggregate daily managed assets of all Nuveen open-end and closed-end funds that constitute “eligible assets.” Eligible assets do not include assets attributable to investments in other Nuveen Funds or assets in excess of a determined amount (originally $2 billion) added to the Nuveen fund complex in connection with the Adviser’s assumption of the management of the former First American Funds effective January 1, 2011, but do not include certain Nuveen funds that were reorganized into funds advised by an affiliate of the Adviser during the 2019 calendar year. As of November 30, 2020, the complex-level fee for each Fund was 0.1561%. |
Other Transactions with Affiliates
Each Fund is permitted to purchase or sell securities from or to certain other funds or accounts managed by the Sub-Adviser (“Affiliated Entity”) under specified conditions outlined in procedures adopted by the Board (“cross-trade”). These procedures have been designed to ensure that any cross-trade of securities by the Fund from or to an Affiliated Entity by virtue of having a common investment adviser (or affiliated investment adviser), common officer and/or common trustee complies with Rule 17a-7 under the 1940 Act. These transactions are effected at the current market price (as provided by an independent pricing service) without incurring broker commissions.
During the current fiscal period, the Funds did not engage in cross-trades pursuant to these procedures.
8. Borrowing Arrangements
Committed Line of Credit
The Funds, along with certain other funds managed by the Adviser (“Participating Funds”), have established a 364-day, $2.405 billion standby credit facility with a group of lenders, under which the Participating Funds may borrow for various purposes other than leveraging for investment purposes. Each Participating Fund is allocated a designated proportion of the facility’s capacity (and its associated costs, as described below) based upon a multi-factor assessment of the likelihood and frequency of its need to draw on the facility, the size of the Fund and its anticipated draws, and the potential importance of such draws to the operations and well-being of the Fund, relative to those of the other Funds. A Fund may effect draws on the facility in excess of its designated capacity if and to the extent that other Participating Funds have undrawn capacity. The credit facility expires in June 2021 unless extended or renewed.
The credit facility has the following terms: a fee of 0.10% upfront fee, 0.15% per annum on unused commitment amounts, and interest at a rate equal to the higher of (a) one-month LIBOR (London Inter-Bank Offered Rate) plus 1.25% (1.00% prior to June 24, 2020) per annum or (b) the Fed Funds rate plus 1.25% (1.00% prior to June 24, 2020) per annum on amounts borrowed. Participating Funds paid administration, legal and arrangement fees, which are recognized as a component of “Other expenses” on the Statement of Operations, and along with commitment fees, have been allocated among such Participating Funds based upon the relative proportions of the facility’s aggregate capacity reserved for them and other factors deemed relevant by the Adviser and the Board of each Participating Fund.
61
Notes to Financial Statements (Unaudited) (continued)
During the current fiscal period, the Funds did not utilized this facility.
Inter-Fund Borrowing and Lending
The Securities and Exchange Commission (“SEC”) has granted an exemptive order permitting registered open-end and closed-end Nuveen funds to participate in an inter-fund lending facility whereby the Nuveen funds may directly lend to and borrow money from each other for temporary purposes (e.g., to satisfy redemption requests or when a sale of securities “fails,” resulting in an unanticipated cash shortfall) (the “Inter-Fund Program”). The closed-end Nuveen funds, including the Funds covered by this shareholder report, will participate only as lenders, and not as borrowers, in the Inter-Fund Program because such closed-end funds rarely, if ever, need to borrow cash to meet redemptions. The Inter-Fund Program is subject to a number of conditions, including, among other things, the requirements that (1) no fund may borrow or lend money through the Inter-Fund Program unless it receives a more favorable interest rate than is typically available from a bank or other financial institution for a comparable transaction; (2) no fund may borrow on an unsecured basis through the Inter-Fund Program unless the fund’s outstanding borrowings from all sources immediately after the inter-fund borrowing total 10% or less of its total assets; provided that if the borrowing fund has a secured borrowing outstanding from any other lender, including but not limited to another fund, the inter-fund loan must be secured on at least an equal priority basis with at least an equivalent percentage of collateral to loan value; (3) if a fund’s total outstanding borrowings immediately after an inter-fund borrowing would be greater than 10% of its total assets, the fund may borrow through the inter-fund loan on a secured basis only; (4) no fund may lend money if the loan would cause its aggregate outstanding loans through the Inter-Fund Program to exceed 15% of its net assets at the time of the loan; (5) a fund’s inter-fund loans to any one fund shall not exceed 5% of the lending fund’s net assets; (6) the duration of inter-fund loans will be limited to the time required to receive payment for securities sold, but in no event more than seven days; and (7) each inter-fund loan may be called on one business day’s notice by a lending fund and may be repaid on any day by a borrowing fund. In addition, a Nuveen fund may participate in the Inter-Fund Program only if and to the extent that such participation is consistent with the fund’s investment objective and investment policies. The Board is responsible for overseeing the Inter-Fund Program.
The limitations detailed above and the other conditions of the SEC exemptive order permitting the Inter-Fund Program are designed to minimize the risks associated with Inter-Fund Program for both the lending fund and the borrowing fund. However, no borrowing or lending activity is without risk. When a fund borrows money from another fund, there is a risk that the loan could be called on one day’s notice or not renewed, in which case the fund may have to borrow from a bank at a higher rate or take other actions to payoff such loan if an inter-fund loan is not available from another fund. Any delay in repayment to a lending fund could result in a lost investment opportunity or additional borrowing costs.
During the current reporting period, none of the Funds covered by this shareholder report have entered into any inter-fund loan activity.
62
Changes Occurring During the Reporting Period
The following information in this semi-annual report is a summary of certain changes during the reporting period. This information may not reflect all of the changes that have occurred since you purchased shares of the Fund.
Amended and Restated By-Laws
On October 5, 2020, after a rigorous and deliberative review, and consistent with the interests of each Fund’s long-term shareholders, the Board of Trustees of each Fund adopted Amended and Restated By-Laws.
Among other changes, the Amended and Restated By-Laws require compliance with certain amended deadlines and procedural and informational requirements in connection with advance notice of shareholder proposals or nominations, including certain information about the proponent and the proposal, or in the case of a nomination, the nominee. Any shareholder considering making a nomination or other proposal should carefully review and comply with those provisions of the Amended and Restated By-Laws.
The Amended and Restated By-Laws also include provisions (the “Control Share By-Law”) pursuant to which, in summary, a shareholder who obtains beneficial ownership of common shares of a Fund in a “Control Share Acquisition” may exercise voting rights with respect to such shares only to the extent the authorization of such voting rights is approved by other shareholders of the Fund. The Control Share By-Law is primarily intended to protect the interests of the Fund and its long-term shareholders by limiting the risk that the Fund will become subject to undue influence by opportunistic traders pursuing short-term agendas adverse to the best interests of the Fund and its long-term shareholders. The Control Share By-Law does not eliminate voting rights for common shares acquired in Control Share Acquisitions, but rather entrusts the Fund’s other “non-interested” shareholders with determining whether to approve the authorization of the voting rights of the person acquiring such shares.
Subject to various conditions and exceptions, the Control Share By-Law defines a “Control Share Acquisition” to include an acquisition of common shares that, but for the Control Share By-Law, would give the beneficial owner, upon the acquisition of such shares, the ability to exercise voting power in the election of Trustees of a Fund in any of the following ranges:
(i) one-tenth or more, but less than one-fifth of all voting power;
(ii) one-fifth or more, but less than one-third of all voting power;
(iii) one-third or more, but less than a majority of all voting power; or
(iv) a majority or more of all voting power.
The Control Share By-Law generally excludes certain acquisitions of common shares from the definition of a Control Share Acquisition, including acquisitions of common shares that occurred prior to October 5, 2020, though such shares are included in assessing whether any subsequent share acquisition exceeds one of the enumerated thresholds.
Subject to certain conditions and procedural requirements set forth in the Control Share By-Law, including the delivery of a “Control Share Acquisition Statement” to the Funds’ Secretary setting forth certain required information, a shareholder who obtains or proposes to obtain beneficial ownership of common shares in a Control Share Acquisition generally may demand a special meeting of shareholders for the purpose of considering whether the voting rights of such acquiring person with respect to such shares shall be authorized.
This discussion is only a high-level summary of certain aspects of the Amended and Restated By-Laws, and is qualified in its entirety by reference to the Amended and Restated By-Laws. Shareholders should refer to the Amended and Restated By-Laws for more information. A copy of the Amended and Restated By-Laws can be found in the Current Report on Form 8-K filed by the Funds with the Securities and Exchange Commission on October 6, 2020, which is available at www.sec.gov, and may also be obtained by writing to the Secretary of the Funds at 333 West Wacker Drive, Chicago, Illinois 60606.
63
Additional FundInformation | | | | | | | |
| Board of Trustees | | | | | | |
Jack B. Evans | William C. Hunter | Albin F. Moschner | John K. Nelson | Judith M. Stockdale | Carole E. Stone |
Matthew Thornton III | Terence J. Toth | Margaret L Wolff | Robert L. Young | | | |
|
| Investment Adviser | Custodian | Legal Counsel | Independent Registered | Transfer Agent and |
Nuveen Fund Advisors, LLC | State Street Bank | Chapman and Cutler LLP | Public Accounting Firm | Shareholder Services |
333 West Wacker Drive | & Trust Company | Chicago, IL 60603 | KPMG LLP | | Computershare Trust |
Chicago, IL 60606 | One Lincoln Street | | 200 East Randolph Street | Company, N.A. |
| Boston, MA 02111 | | Chicago, IL 60601 | 150 Royall Street |
| | | | | Canton, MA 02021 |
| | | | | (800) 257-8787 |
Portfolio of Investments Information
Each Fund is required to file its complete schedule of portfolio holdings with the Securities and Exchange Commission (SEC) for the first and third quarters of each fiscal year as an exhibit to its report on Form N-PORT. You may obtain this information on the SEC’s website at http://www.sec.gov.
Nuveen Funds’ Proxy Voting InformationYou may obtain (i) information regarding how each fund voted proxies relating to portfolio securities held during the most recent twelve-month period ended June 30, without charge, upon request, by calling Nuveen toll-free at (800) 257-8787 or on Nuveen’s website at www.nuveen.com and (ii) a description of the policies and procedures that each fund used to determine how to vote proxies relating to portfolio securities without charge, upon request, by calling Nuveen toll free at (800) 257-8787. You may also obtain this information directly from the SEC. Visit the SEC on-line at http://www.sec.gov.
CEO Certification DisclosureEach Fund’s Chief Executive Officer (CEO) has submitted to the New York Stock Exchange (NYSE) the annual CEO certification as required by Section 303A.12(a) of the NYSE Listed Company Manual. Each Fund has filed with the SEC the certification of its CEO and Chief Financial Officer required by Section 302 of the Sarbanes-Oxley Act.
Common Share RepurchasesEach Fund intends to repurchase, through its open-market share repurchase program, shares of its own common stock at such times and in such amounts as is deemed advisable. During the period covered by this report, each Fund repurchased shares of its common stock, as shown in the accompanying table. Any future repurchases will be reported to shareholders in the next annual or semi-annual report.
| | | |
| NID | NIQ |
Common shares repurchased | — | — |
FINRA BrokerCheck
The Financial Industry Regulatory Authority (FINRA) provides information regarding the disciplinary history of FINRA member firms and associated investment professionals. This information as well as an investor brochure describing FINRA BrokerCheck is available to the public by calling the FINRA BrokerCheck Hotline number at (800) 289-9999 or by visiting www.FINRA.org.
64
Glossary of Terms Used in this Report
| ■ | Average Annual Total Return: This is a commonly used method to express an investment’s performance over a particular, usually multi-year time period. It expresses the return that would have been necessary each year to equal the investment’s actual cumulative performance (including change in NAV or market price and reinvested dividends and capital gains distributions, if any) over the time period being considered. |
| ■ | Duration: Duration is a measure of the expected period over which a bond’s principal and interest will be paid, and consequently is a measure of the sensitivity of a bond’s or bond fund’s value to changes when market interest rates change. Generally, the longer a bond’s or fund’s duration, the more the price of the bond or fund will change as interest rates change. |
| ■ | Effective Leverage: Effective leverage is a fund’s effective economic leverage, and includes both regulatory leverage (see leverage) and the leverage effects of certain derivative investments in a fund’s portfolio. Currently, the leverage effects of Tender Option Bond (TOB) inverse floater holdings are included in effective leverage values, in addition to any regulatory leverage. |
| ■ | Forward Interest Rate Swap: A contractual agreement between two counterparties under which one party agrees to make periodic payments to the other for an agreed period of time based on a fixed rate, while the other party agrees to make periodic payments based on a floating rate of interest based on an underlying index. Alternatively, both series of cash flows to be exchanged could be calculated using floating rates of interest but floating rates that are based upon different underlying indices. |
| ■ | Industrial Development Revenue Bond (IDR): A unique type of revenue bond issued by a state or local government agency on behalf of a private sector company and intended to build or acquire factories or other heavy equipment and tools. |
| ■ | Inverse Floating Rate Securities: Inverse floating rate securities, also known as inverse floaters or tender option bonds (TOBs), are created by depositing a municipal bond, typically with a fixed interest rate, into a special purpose trust. This trust, in turn, (a) issues floating rate certificates typically paying short-term tax-exempt interest rates to third parties in amounts equal to some fraction of the deposited bond’s par amount or market value, and (b) issues an inverse floating rate certificate (sometimes referred to as an “inverse floater”) to an investor (such as a Fund) interested in gaining investment exposure to a long-term municipal bond. The income received by the holder of the inverse floater varies inversely with the short-term rate paid to the floating rate certificates’ holders, and in most circumstances the holder of the inverse floater bears substantially all of the underlying bond’s downside investment risk. The holder of the inverse floater typically also benefits disproportionately from any potential appreciation of the underlying bond’s value. Hence, an inverse floater essentially represents an investment in the underlying bond on a leveraged basis. |
| ■ | Leverage: Leverage is created whenever a fund has investment exposure (both reward and/or risk) equivalent to more than 100% of the investment capital. |
| ■ | Net Asset Value (NAV) Per Share: A fund’s Net Assets is equal to its total assets (securities, cash, accrued earnings and receivables) less its total liabilities. NAV per share is equal to the fund’s Net Assets divided by its number of shares outstanding. |
| ■ | Pre-Refunding: Pre-Refunding, also known as advanced refundings or refinancings, is a procedure used by state and local governments to refinance municipal bonds to lower interest expenses. The issuer sells new bonds with a lower yield and uses the proceeds to buy U.S. Treasury securities, the interest from which is used to make payments on the higher-yielding bonds. Because of this collateral, pre-refunding generally raises a bond’s credit rating and thus its value. |