 NASDAQ: IBTX Initial Public Offering March 2013 Filed Pursuant to Rule 433 File No. 333-186912 |
 Offering Disclosure 2 This presentation has been prepared by Independent Bank Group, Inc. (“Independent Bank Group” or the “Company”) solely for informational purposes based on its own information, as well as information from public sources. This presentation has been prepared to assist interested parties in making their own evaluation of Independent Bank Group and does not purport to contain all of the information that may be relevant. In all cases, interested parties should conduct their own investigation and analysis of Independent Bank Group and the data set forth in this presentation and other information provided by or on behalf of Independent Bank Group. This presentation does not constitute an offer to sell, nor a solicitation of an offer to buy, any securities of Independent Bank Group by any person in any jurisdiction in which it is unlawful for such person to make such an offering or solicitation. Neither the Securities and Exchange Commission nor any other regulatory body has approved or disapproved of the securities of Independent Bank Group or passed upon the accuracy or adequacy of this presentation. Any representation to the contrary is a criminal offense. Except as otherwise indicated, this presentation speaks as of the date hereof. The delivery of this presentation shall not, under any circumstances, create any implication that there has been no change in the affairs of the Company after the date hereof. Certain of the information contained herein may be derived from information provided by industry sources. Independent Bank Group believes that such information is accurate and that the sources from which it has been obtained are reliable. Independent Bank Group cannot guarantee the accuracy of such information, however, and has not independently verified such information. From time to time, Independent Bank Group may make forward-looking statements that reflect the Company’s views with respect to, among other things, future events and financial performance. Words such as “outlook,” “believes,” “expects,” “potential,” “continues,” “may,” “will,” “could,” “should,” “seeks,” “approximately,” “predicts,” “intends,” “plans,” “estimates,” “anticipates” or the negative version of those words or other comparable words are intended to identify forward-looking statements, but are not the exclusive means of identifying such statements. These forward-looking statements are not historical facts, and are based on current expectations, estimates and projections about the Company’s industry, management’s beliefs and certain assumptions made by management, many of which, by their nature, are inherently uncertain and beyond the Company’s control. Accordingly, you are cautioned that any such forward-looking statements are not guarantees of future performance and are subject to certain risks, uncertainties and assumptions that are difficult to predict. Although the Company believes that the expectations reflected in such forward-looking statements are reasonable as of the date made, actual results may prove to be materially different from the expected results expressed or implied by such forward-looking statements. Unless otherwise required by law, the Company also disclaims any obligation to update its view of any such risks or uncertainties or to announce publicly the result of any revisions to the forward- looking statements made in this presentation. Independent Bank Group has filed a registration statement (including a prospectus), which is preliminary and subject to completion, with the Securities and Exchange Commission for the offering to which this communication relates. Before you invest, you should read the prospectus in that registration statement and the other documents that Independent Bank Group has filed with the Securities and Exchange Commission for more complete information about Independent Bank Group and the offering. You may get these documents for free by visiting Edgar on the SEC web site at www.Sec.Gov. Alternatively, the Company, any underwriter or any dealer participating in the offering will arrange to send you the prospectus if you request it by contacting: Sandler O’Neill + Partners, L.P. at toll-free 1-866-805-4128 or by emailing syndicate@sandleroneill.com. |
 Offering Summary 3 Issuer: Independent Bank Group, Inc., parent of Independent Bank Offering Size: 3.2 million shares / $80 million at the midpoint of range Filing Range $24.00 - $26.00 per share Offering Structure: 100% Primary Overallotment: 15% (Primary) Lock-Up: 180 days Proposed Exchange / Ticker: NASDAQ / “IBTX” Use of Proceeds: Debt retirement and general corporate purposes Anticipated Dividend: $0.06 quarterly / 0.96% at midpoint of range Joint Bookrunners: Sandler O’Neill + Partners, L.P. (Lead Left) Evercore Partners Keefe, Bruyette & Woods |
 Investment Highlights 4 Experienced Management Team and Board of Directors Significant Inside Ownership A Leading Texas Community Bank Franchise Focused in Major Metropolitan Markets Demonstrated Growth and Proven Acquiror Expanded Profitability Solid Capital for Continued Growth Strong Credit Culture |
 Experienced Management Team 5 (1) Title to be effective upon completion of the offering. Name / Title Background David R. Brooks Chairman of the Board, CEO, Director • 34 years in the financial services industry; 26 years at Independent Bank • Active in community banking since the early 1980s - led the investor group that acquired the Company in 1988 • Previously served as the Chief Financial Officer at Baylor University from 2000 to 2004 • Serves on the Board of Managers of Noel-Levitz, LLC, and on the Board of Trustees of Houston Baptist University Torry Berntsen President, COO, Director (1) • 32 years in the financial services industry; four years at Independent Bank • Has served as Vice Chairman of Corporate Development since 2009 • Vice Chairman of Virtu Management, LLC • 25 years in various senior management roles at The Bank of New York Mellon Daniel W. Brooks Vice Chairman, Chief Risk Officer, Director (1) • 30 years in the financial services industry; 23 years at Independent Bank • Previously served as President and a Director of the Company from 2002 to 2009 • Active in community banking since the late 1980s • Chairman of the Board for Medical Center of McKinney and on the Boards of Directors of McKinney Christian Academy and the McKinney Education Foundation Brian E. Hobart Vice Chairman, Chief Lending Officer (1) • 20 years in the financial services industry; nine years at Independent Bank • Since 2009 he has functioned as Chief Lending Officer as well as serving as President and director at the Company • One of the founders of IBG Central Texas - served as its President from 2004 until 2009 Michelle S. Hickox EVP, Chief Financial Officer • 23 years in the financial services industry; one year at the Company • Previously a Financial Services Audit Partner at McGladrey LLP • Licensed certified public accountant, member of the AICPA, the Texas Society of Certified Public Accountants and the Dallas CPA Society Jan C. Webb EVP, Secretary to the Board of Directors (1) • 30 years in the financial services industry; 25 years at Independent Bank • Has served in various roles at the Company including Chief Operations Officer and Chief Financial Officer |
 Significant Insider Ownership • Insiders / Affiliates currently own approximately 85.0% of the Company • No secondary selling • Plan to buy in offering 6 Holder % Out – Pre-Offering (1) David Brooks 12.6% Other Executive Officers / Directors 15.4 Vincent Viola 56.5 Total 84.5% (1) Shares beneficially owned as of January 31, 2013. |
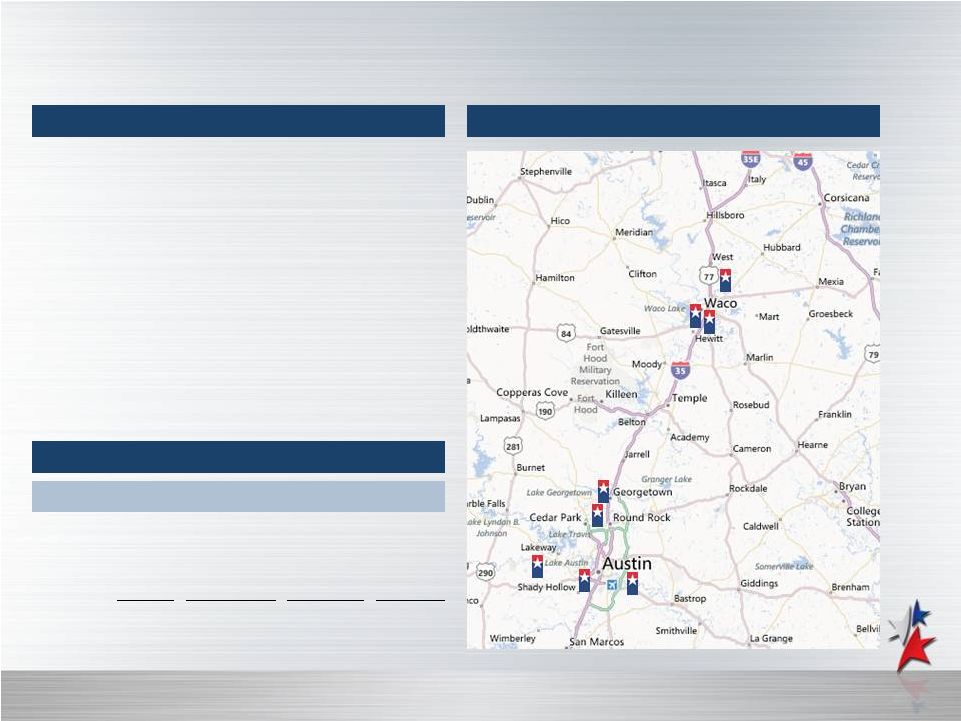
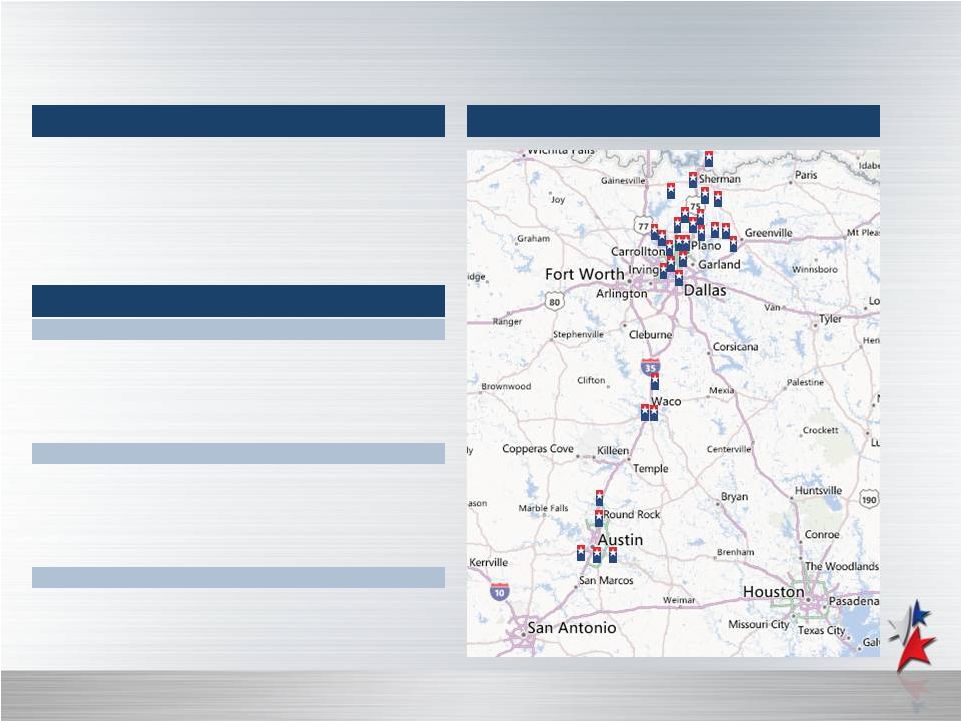 Company Snapshot 7 Overview Branch Map Financial Highlights • Headquartered in McKinney, Texas • 100+ years of operating history • 30 banking offices in 26 communities • Dallas-Fort Worth metropolitan area • Greater Austin area • Focused on relationship-driven commercial banking products (1) Assuming $80 million in gross proceeds. (2) Adjusted for C-Corp status. See Appendix for GAAP reconciliation. Note: Financial data as of and for the year ended December 31, 2012. / Assets Balance Sheet ($ in millions) Total Assets $1,740 Total Loans 1,379 Total Deposits 1,391 Pro Forma Equity (1) 197 Pro Forma Equity (1) 11.04% Asset Quality NPAs / Assets 1.59% NPLs / Loans 0.81 Allowance / NPLs 104.02 Allowance / Loans 0.83 NCO Ratio 0.06 Profitability ROAA (2) 0.82% ROAE (2) 11.56 Net Interest Margin 4.40 Efficiency Ratio 69.64 |
 Texas: Among Strongest Economies in USA 8 • 52 Fortune 500 companies headquartered in Texas • Population - 25.5 million, 2 largest State • 3.02% population growth since 2010 versus 1.42% for the nation • Dallas-Fort Worth – 4 largest MSA in USA • Austin – 4 largest MSA in State of Texas • Projected household income growth of 16.3% through 2017 versus 13.4% for the nation • Texas unemployment rate of 6.3% compares favorably to United States at 7.7% Note: State and national unemployment rates as of January 2013 and February 2013, respectively. Source: SNL Financial, Environmental Systems Research Institute (ESRI), U.S. Census Bureau, Bureau of Labor Statistics. nd th th |
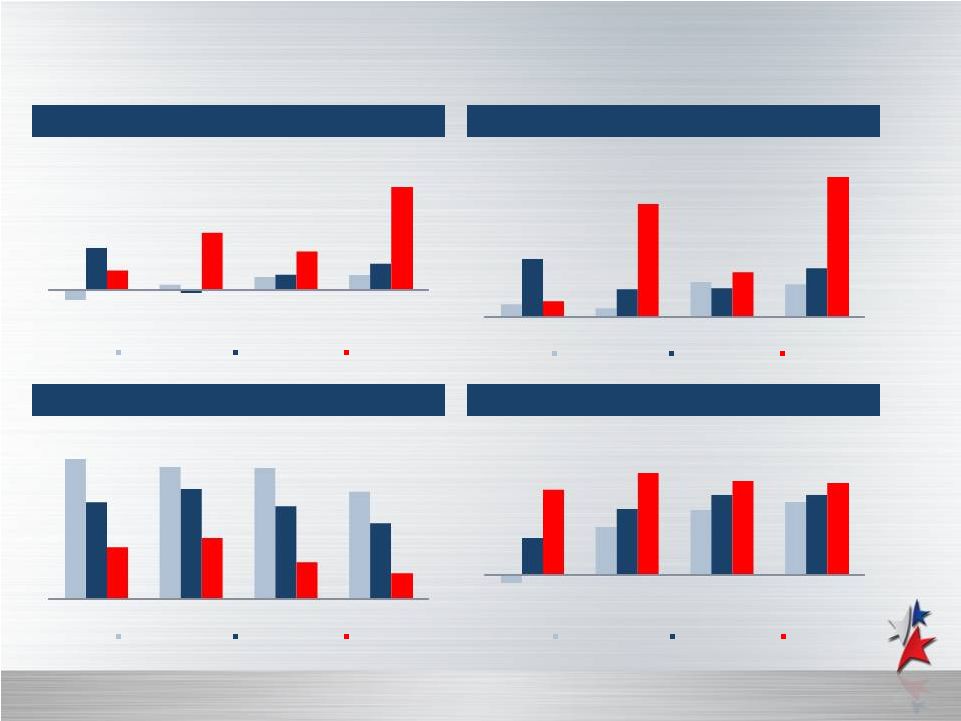 Fertile Texas Banking Environment 9 Asset Growth NPLs / Loans Pro Forma Return on Average Equity (1) Deposit Growth (1) Independent Bank Group adjusted for C–Corp status. See Appendix for GAAP reconciliation. Note: Peer groups include all commercial banks headquartered in the U.S. and Texas, respectively. Source: SNL Financial. (4.0%) 2.1% 4.8% 5.8% 15.7% (1.4%) 5.7% 9.7% 7.0% 21.3% 14.2% 38.7% 2009 2010 2011 2012 U.S. Commercial Banks TX Commercial Banks IBTX 3.1% 2.2% 8.7% 8.1% 14.5% 6.9% 7.2% 12.3% 3.96% 28.19% 11.10% 34.96% 2009 2010 2011 2012 U.S. Commercial Banks TX Commercial Banks IBTX 4.41% 4.15% 4.11% 3.36% 3.03% 3.43% 2.91% 2.38% 1.62% 1.89% 1.14% 0.81% 2009 2010 2011 2012 U.S. Commercial Banks TX Commercial Banks IBTX (0.98%) 5.95% 9.06% 4.57% 8.24% 9.92% 10.68% 12.84% 11.86% 11.56% 2009 2010 2011 2012 U.S. Commercial Banks TX Commercial Banks IBTX 10.03% 8.11% |
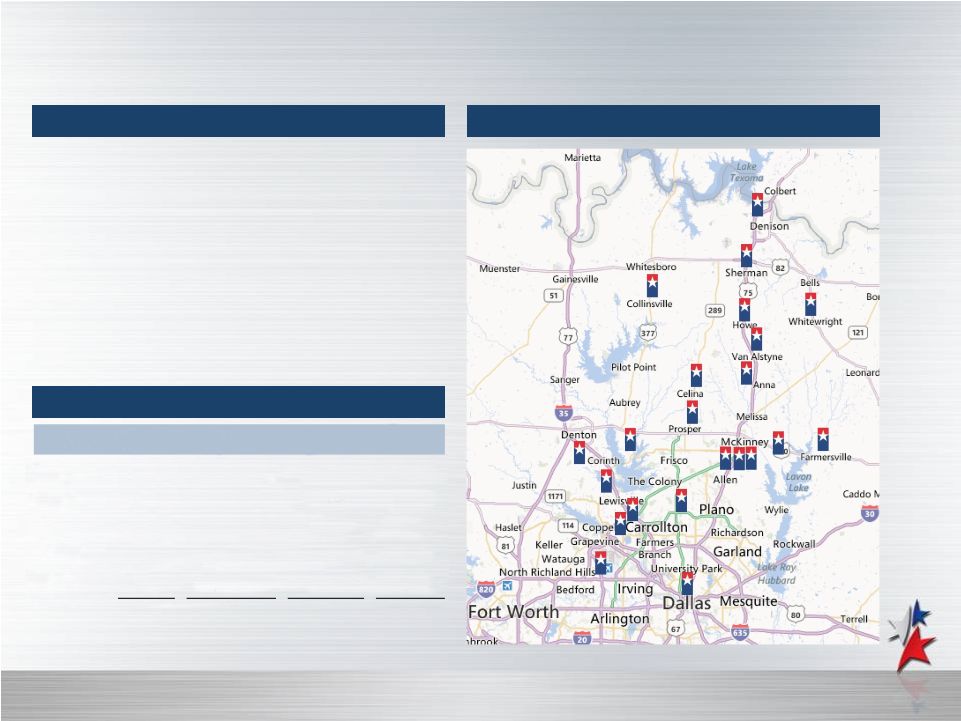 Dallas / North Texas Region 10 Market Overview Branch Map Demographic Highlights • Dallas-Fort Worth metropolitan area is the fourth largest MSA in the United States as of 2011 • 19% of total state population • Headquarters to 18 Fortune 500 companies (2012) • 269 locally-headquartered companies with 1,000+ employees • Headquarters to eight of the top 200 largest privately held companies in the United States (by revenue) • The region adds an average of 187 new jobs and 470 new residents daily (1) Demographic totals are deposit-weighted as of June 30, 2012 totals. Source: Dallas Office of Economic Development (April 2011), SNL Financial, U.S. Census Bureau. County # of IBTX Branches Total Population Proj. Pop. Chg. '11- '16 Median HHI 2011 Collin Grayson Denton Dallas Tarrant Total Total: Texas 10 6 3 2 1 22 804,469 121,773 680,782 2,386,191 1,836,199 5,829,414 13.99% 3.95 13.26 3.23 9.01 10.56% $86,909 40,861 68,023 50,320 55,312 7.76% $69,153 $47,753 (1) 25,525,763 |
 Austin / Central Texas Region 11 Market Overview Branch Map Demographic Highlights (1) Demographic totals are deposit-weighted as of June 30, 2012 totals. Source: Economic Growth & Redevelopment Services Office of Austin, Brookings Institution, SNL Financial. • 14 largest city in the United States • Ranked 2 of U.S. cities in population growth from 2010 to 2011 • Several public high tech companies maintain their corporate headquarters or significant operations in the region • Top-rated city in global rankings of post-recession economies as of December 2012 • Highest ranking in the United States • Several prominent public and private universities • Among CNNMoney’s national rankings of “Smartest Cities” as of 2010 County # of IBTX Branches Total Population Proj. Pop. Chg. '11- '16 Median HHI 2011 Travis 3 1,047,498 10.79% $56,472 Williamson 2 438,456 18.18 75,174 McLennan 3 236,775 4.08 38,483 Total (1) 8 1,722,729 11.51% $58,010 Total: Texas 25,525,763 7.76% $47,753 nd th |
 Awards and Honors 12 • 2012 & 2011 - Top 100 Places to Work (1) • 2012 – Gold Eagle Award, Marketing (3) Silver Eagle Award, Marketing (3) • 2011 – Dallas 100 Fastest-Growing Private Companies in North Texas (2) • 2010 – Largest North Texas- Headquartered Private Companies (2) (1) Based on anonymous employee surveys conducted by WorkplaceDynamics. (2) Based on independent, privately-held corporations in the Dallas Metroplex area, chosen on increased growth in sales, giving weight to percentage of growth and absolute dollar growth in the three years preceding the award. (3) Based on IBAT’s “Best of Community Banking Awards” company-submitted presentations of marketing initiatives. Note: The trademarks and any associated registrations are owned by their respective entities and not by Independent Bank Group. |
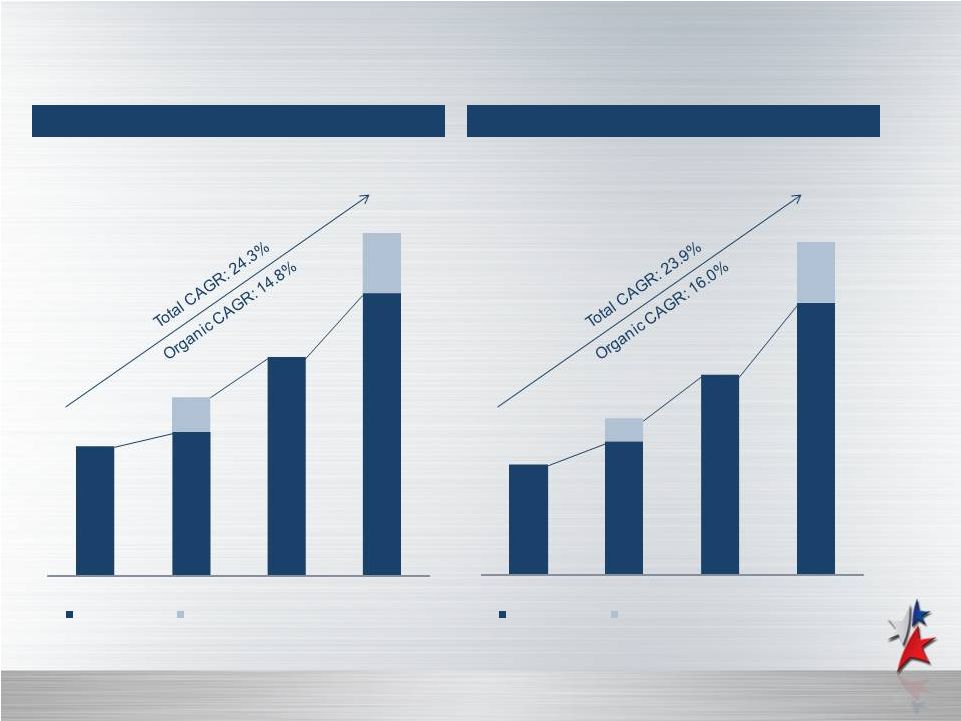 Demonstrated Growth 13 Total Assets Gross Loans $905 $1,098 $1,254 $1,740 2009 2010 2011 2012 Organic Growth Impact of Acquisitions (In Year Acquired) $725 $860 $989 $1,379 2009 2010 2011 2012 Organic Growth Impact of Acquisitions (In Year Acquired) Note: Dollars in millions. Financial data as of and for the year ended. |
 Proven Acquiror 14 Bank / Market Date of Acquisition Total Assets Town Center Bank Dallas/North Texas July 31, 2010 $37.5 million Farmersville Bancshares, Inc. Dallas/North Texas September 30, 2010 $99.4 million I Bank Holding Company, Inc. Austin/Central Texas April 1, 2012 $172.6 million The Community Group, Inc. Dallas/North Texas October 1, 2012 $111.0 million • Experienced and disciplined acquisition and integration approach • Four transactions since 2010; Two acquisitions priced below tangible book value • There are ~500 banks in Texas with total assets of less than $1.0 billion Source: SNL Financial. Source: SNL Financial. |
 Other Growth Initiatives • Expand footprint in “Texas Triangle” • Hire new lending teams • Seek more C&I opportunities • Continue niche specialization – Enhance energy lending team – Cultivate healthcare focus 15 |
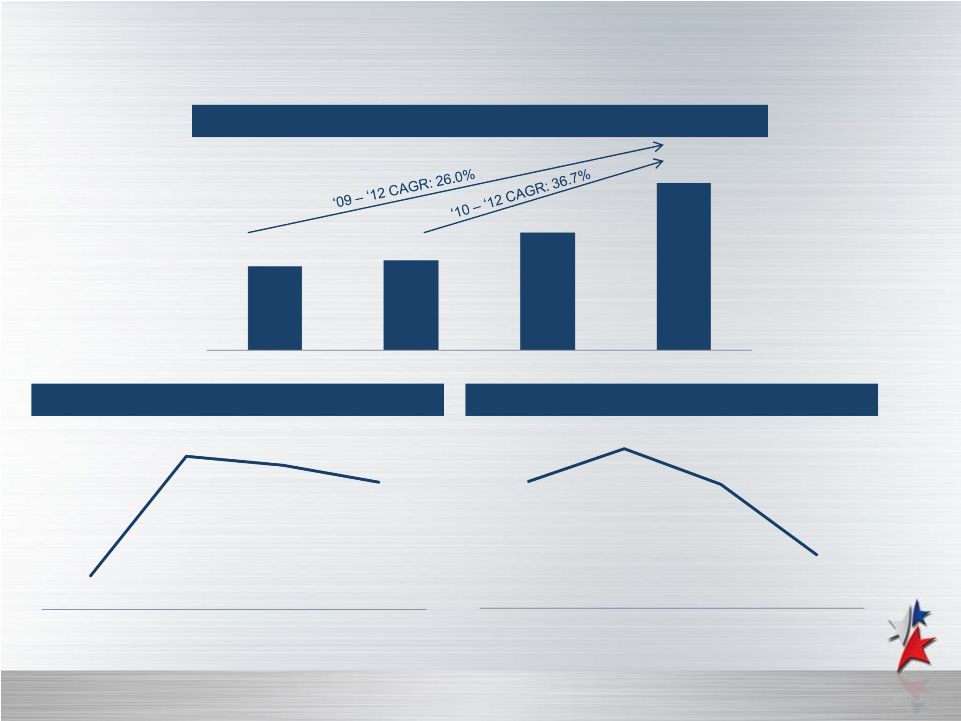 Expanded Profitability 16 Core Pre-Tax Pre-Provision Earnings Income Net Interest Margin Core Efficiency Ratio (1) Adjusted for certain nonrecurring items. See Appendix for GAAP reconciliation. Note: Dollars in thousands. Financial data as of and for year ended. $11,041 $11,803 $15,466 $22,061 2012 2011 2010 2009 2012 2011 2010 2009 4.29% 4.43% 4.42% 4.40% 2012 2011 2010 2009 71.0% 72.8% 70.8% 67.0% (1) (1) |
 Opportunity for Better Deposit Pricing 17 Deposit Composition at 12/31/12 Deposit Growth versus Average Rate Rate on Interest-Bearing Deposits: 0.83% (1) Annual average rate for total deposits. Note: Dollars in millions. Financial data as of and for year ended. Noninterest- bearing 19% Interest-bearing Checking 50% Savings Accounts 8% MMAs 2% IRAs 2% CDs <$100k 7% CDs >$100k 12% $724 $928 $1,030 $1,391 1.77% 1.35% 1.00% 0.69% $200 $400 $600 $800 $1,000 $1,200 $1,400 $1,600 2009 2010 2011 2012 0.00% 0.20% 0.40% 0.60% 0.80% 1.00% 1.20% 1.40% 1.60% 1.80% 2.00% Deposits Avg. Rate (1) |
 Solid Capital for Continued Growth 18 (dollars in thousands, except per share data) As of December 31, 2012 Actual As Adjusted (1) Stockholders' Equity Common Stock, $0.01 Par Value $83 $115 Additional Paid-In Capital 88,791 194,886 Retained Earnings 33,290 0 Treasury Stock, at Cost (8,647 Shares) (232) (232) Accumulated Other Comprehensive Income 2,578 2,578 Total Stockholders' Equity $124,510 $197,347 Capital Ratios Tier 1 Capital to Average Assets 6.45% 10.82% Tier 1 Capital to Risk-Weighted Assets (2) 8.22 13.79 Total Capital to Risk-Weighted Assets 10.51 15.25 Total Equity to Assets 7.16 11.04 Tangible Common Equity to Tangible Assets (2) 5.42 9.42 Per Share Data Book Value $15.06 $17.21 Tangible Book Value (2) 11.19 14.42 (1) On an as adjusted basis after giving effect to (i) the receipt of the net proceeds to Independent from the sale in this offering of 3.2 million shares of its common stock at an assumed initial public offering price of $25.00 per share, which is the mid-point of the estimated public offering price set forth on the cover page of the prospectus, after deducting the underwriting discounts and commissions and the estimated offering expenses payable by Independent, assuming all of the shares reserved for the directed share program are purchased by participants in that program, and not assuming the sale of any shares of common stock upon the exercise of the underwriters’ option to purchase additional shares; (ii) the application of the net proceeds of the offer and sale of such shares, estimated to be $72.8 million based on the mid-point of the estimated public offering price set forth on the cover page of the prospectus, to the repayment of $12.3 million of senior secured notes and $13.1 million of subordinated debentures; (iii) the reclassification of undistributed S corporation earnings of $33.3 million from retained earnings to additional paid-in capital as a result of the Independent’s conversion to a C corporation in connection with this offering; and (iv) the 3.2-for-one stock split that was effective as of February 22, 2013. (2) See Appendix for GAAP reconciliation. |
 Strong Credit Culture • Lend to borrowers we know • Experienced relationship managers • Multi-tiered committee-based credit approval • Sound lending practices • Traditional community bank business credit focus • In-market (Texas) focused • Deep knowledge of sectors / industries • Strong metrics 19 |
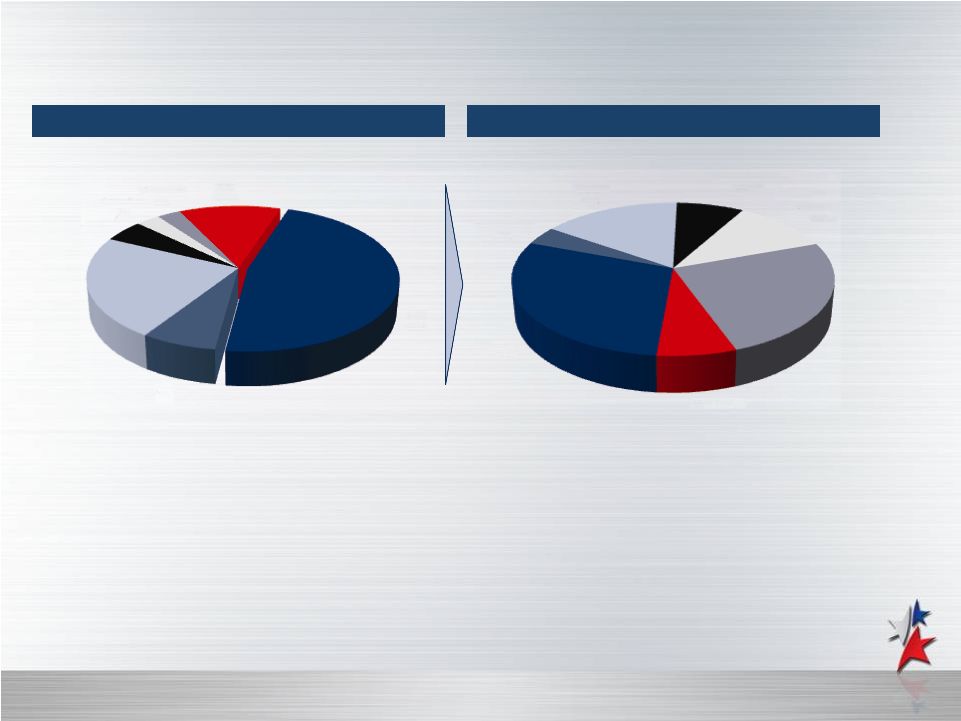 Diversified Loan Portfolio 20 Loan Composition at 12/31/12 CRE Loan Composition at 12/31/12 2012 Yield on Loans: 5.89% 55% of CRE Loans are Owner-Occupied C&I 12% CRE 47% C&D 7% 1-4 Family 23% 1-4 Family Const. 5% Agriculture 3% Consumer 3% Multi-family 7% Office 29% Hotel / Motel 4% Retail 16% Industrial / WH 8% Healthcare 11% Misc. 25% |
 Strong Credit Culture 21 NPLs / Loans NCOs / Average Loans Note: Financial data as of and for year ended. Source: U.S. and Texas Commercial Bank numbers from SNL Financial. 4.41% 4.15% 4.11% 3.36% 3.03% 3.43% 2.91% 2.38% 1.62% 1.89% 1.14% 0.81% 2009 2010 2011 2012 U.S. Commercial Banks TX Commercial Banks IBTX 1.22% 1.05% 0.74% 0.39% 2.67% 2.67% 1.64% 1.13% 0.21% 0.31% 0.11% 0.06% 2009 2010 2011 2012 U.S. Commercial Banks TX Commercial Banks IBTX |
 IBG Adriatica Overview • Mixed commercial / residential development in McKinney, TX • Originally acquired $17.0 million REO from out- of-state bank in June 2011 for $16.3 million • Represented a one-time opportunity: • Protect local franchise • Very familiar with development • Important to community • Believed to be a good value • IBTX has been successfully selling properties • Balance of REO down to $9.7 million as of December 31, 2012 • Temporarily impacts credit metrics and efficiency measures • Expect to dispose of remaining property by year end 2014 22 NPAs / Assets Note: Financial data as of and for year ended. 1.92% 2.19% 1.57% 1.03% 1.92% 2.19% 2.85% 1.59% 2009 2010 2011 2012 NPAs / Assets (ex. Adriatica) NPAs / Assets |
 Summary 23 Experienced Management Team and Board of Directors Significant Inside Ownership A Leading Texas Community Bank Franchise Focused in Major Metropolitan Markets Demonstrated Growth and Proven Acquiror Expanded Profitability Solid Capital for Continued Growth Strong Credit Culture |
 APPENDIX 24 |
 Reconciliation of GAAP and Adjusted Measures 25 ($ in thousands) Year Ended December 31, 2009 2010 2011 2012 Net Interest Income - Reported $33,026 $38,065 $46,281 $58,553 (a) Provision Expense - Reported $3,446 $4,043 $1,650 $3,184 (b) Noninterest Income - Reported $5,212 $12,156 $7,708 $9,168 (c) Bargain Purchase Loss / (Gain) $0 ($6,692) $0 $0 Loss / (Gain) on Sale of Branch 0 0 0 (38) Loss / (Gain) on Sale of OREO 190 (136) (918) (1,135) Loss / (Gain) on Sale of Securities 0 0 0 3 Loss / (Gain) on Sale of PP&E (326) (1) (21) 343 Adjusted Noninterest Income $5,076 $5,327 $6,769 $8,341 (d) Noninterest Expense - Reported $27,136 $33,062 $38,639 $47,160 (e) Adriatica Expenses $0 $0 ($871) ($832) OREO Impairment (75) (805) (184) (94) Acquisition Expense 0 (668) 0 (1,401) Adjusted Noninterest Expense $27,061 $31,589 $37,584 $44,833 (f) Pre-Tax Pre-Provision Earnings $11,102 $17,159 $15,350 $20,561 (a) + (c) - (e) Core Pre-Tax Pre-Provision Earnings $11,041 $11,803 $15,466 $22,061 (a) + (d) - (f) Adjusted Pre-Tax Income $7,595 $7,760 $13,816 $18,877 (a) - (b) + (d) - (f) Taxes $2,430 $2,483 $4,421 $6,041 Adjusted Net Income $5,165 $5,277 $9,395 $12,836 (g) Reported Efficiency Ratio 71.0% 65.8% 71.6% 69.6% (e) / (c + a) Adjusted Efficiency Ratio 71.0% 72.8% 70.8% 67.0% (f) / (d + a) |
 Reconciliation of GAAP and Adjusted Measures 26 ($ in thousands) Year Ended December 31, 2009 2010 2011 2012 Net Income - Reported $7,656 $13,116 $13,700 $17,377 Effective Tax Rate 32.2% 33.1% 31.7% 30.1% Pro Forma Net Income $5,189 $8,775 $9,357 $12,147 Average Assets $876,615 $969,322 $1,180,693 $1,487,614 Average Stockholders' Equity $48,603 $68,350 $78,922 $105,055 Pro Forma ROAA 0.59% 0.91% 0.79% 0.82% Pro Forma ROAE 10.68% 12.84% 11.86% 11.56% |
 Reconciliation of GAAP and Adjusted Measures 27 ($ in thousands, except per share data) As of 12/31/2012 Total Stockholders' Equity $124,510 Goodwill (28,714) Core Deposit Intangibles (3,251) Tangible Common Equity $92,545 Common Shares Outstanding 8,269,707 Book Value per Share $15.06 Tangible Book Value per Share $11.19 ($ in thousands) As of 12/31/2012 Total Stockholders' Equity $124,510 Unrealized Gain on AFS Securities (2,578) Goodwill (28,714) Other Intangibles (3,251) Qualifying Restricted Core Capital 17,600 Tier 1 Capital $107,567 Risk-Weighted Assets On Balance Sheet $1,297,795 Off Balance Sheet 10,860 Total Risk-Weighted Assets $1,308,655 Tier 1 Capital to Risk-Weighted Capital Ratio 8.22% |
 Outside Board of Directors 28 Name Past Experience M. Brian Aynesworth • President and Chief Executive Officer of Southwestern Commercial Properties, LLC Douglas A. Cifu • President and Chief Operating Officer of Virtu Financial, LLC • Former Partner, Paul, Weiss, Rifkind, Wharton & Garrison, LLP William E. Fair • Chairman and Chief Executive Officer of Home Abstract and Title Company Craig E. Holmes • Chief Financial Officer of Digital Generation, Inc. • Former Chief Financial Officer: Quickoffice Inc., Intervoice, Inc., Masergy Communications, Inc., EpicRealm Inc. and Excel Communications, Inc. • Former Partner, Arthur Andersen Jack M. Radke • President / Owner, Ag-Power, Inc. G. Stacy Smith • Co-founder / Partner of Trinity Investment Group • Chairman of Stonelake Capital Partners • Co-founder of Walker Smith Capital and Gryphon Partners Michael T. Viola • Energy Trader, Virtu Financial, LLC |