 Merger with November 21, 2016 Exhibit 99.1 |
 Safe Harbor Statement 2 From time to time, our comments and releases may contain “forward-looking statements” within the meaning of the Private Securities Litigation Reform Act of 1995 (the “Act”). Forward-looking statements can be identified by words such as “believes,” “anticipates,” “expects,” “forecast,” “guidance,” “intends,” “targeted,” “continue,” “remain,” “should,” “may,” “plans,” “estimates,” “will,” “will continue,” “will remain,” variations on such words or phrases, or similar references to future occurrences or events in future periods; however, such words are not the exclusive means of identifying such statements. Examples of forward-looking statements include, but are not limited to: (i) projections of revenues, expenses, income or loss, earnings or loss per share, and other financial items; (ii) statements of plans, objectives, and expectations of Independent Bank Group or its management or Board of Directors; (iii) statements of future economic performance; (iv) statements of assumptions underlying such statements; and (v) statements regarding the transaction, including statements related to accretion to earnings, effect on tangible book value and earnback period, cost savings, return on investment on uninvested funds, and similar statements. Forward-looking statements are based on Independent Bank Group’s current expectations and assumptions regarding its business, the economy, and other future conditions. Because forward-looking statements relate to the future, they are subject to inherent uncertainties, risks, and changes in circumstances that are difficult to predict. Independent Bank Group’s actual results may differ materially from those contemplated by the forward-looking statements, which are neither statements of historical fact nor guarantees or assurances of future performance. Factors that could cause actual results to differ from those discussed in the forward-looking statements include, but are not limited to: (1) local, regional, national, and international economic conditions and the impact they may have on us and our customers and our assessment of that impact; (2) volatility and disruption in national and international financial markets; (3) government intervention in the U.S. financial system, whether through changes in the discount rate or money supply or otherwise; (4) changes in the level of non- performing assets and charge-offs; (5) changes in estimates of future reserve requirements based upon the periodic review thereof under relevant regulatory and accounting requirements; (6) adverse conditions in the securities markets that lead to impairment in the value of securities in our investment portfolio; (7) inflation, deflation, changes in market interest rates, developments in the securities market, and monetary fluctuations; (8) the timely development and acceptance of new products and services and perceived overall value of these products and services by customers; (9) changes in consumer spending, borrowings, and savings habits; (10) technological changes; (11) the ability to increase market share and control expenses; (12) changes in the competitive environment among banks, bank holding companies, and other financial service providers; (13) the effect of changes in laws and regulations (including laws and regulations concerning taxes, banking, securities, and insurance) with which we and our subsidiaries must comply; (14) the effect of changes in accounting policies and practices, as may be adopted by the regulatory agencies, as well as the Public Company Accounting Oversight Board, the Financial Accounting Standards Board, and other accounting standard setters; (15) the costs and effects of legal and regulatory developments including the resolution of legal proceedings; and (16) our success at managing the risks involved in the foregoing items and (17) the other factors that are described in the Company’s Annual Report on Form 10-K for the year ended December 31, 2015 and its Quarterly Report on Form 10-Q for the quarter ended September 30, 2016 and other reports and statements made by the Company with the SEC. Any forward-looking statement made by the Company in this release speaks only as of the date on which it is made. Factors or events that could cause the Company’s actual results to differ may emerge from time to time, and it is not possible for the Company to predict all of them. The Company undertakes no obligation to publicly update any forward-looking statement, whether as a result of new information, future developments or otherwise, except as may be required by law. |
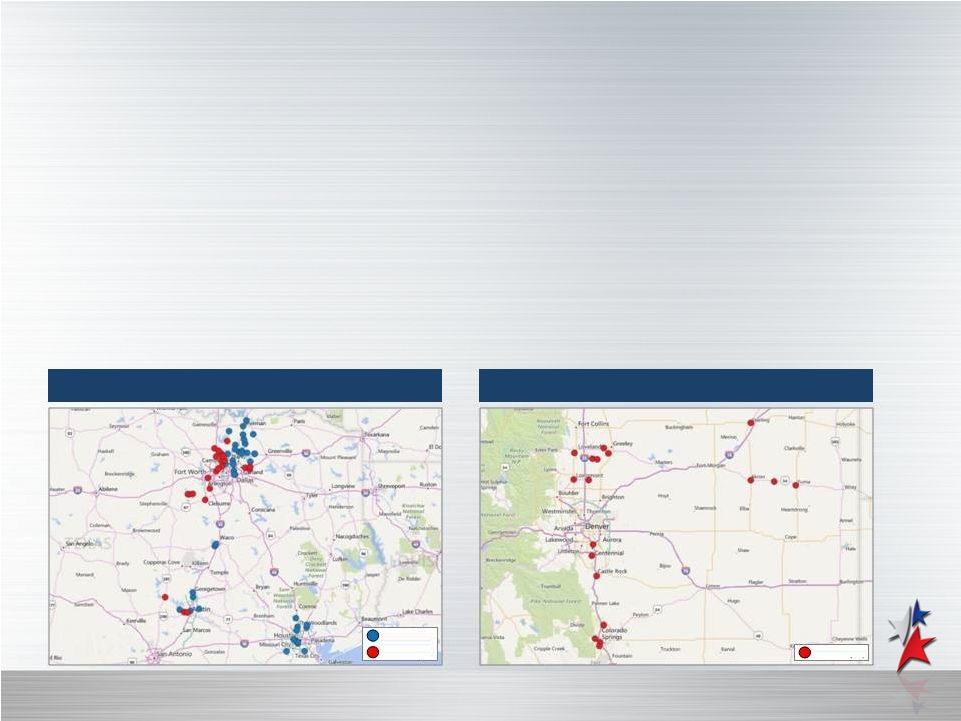 Strategically Compelling Transaction • The merger provides Independent Bank Group with increased scale across attractive markets – As of September 30, 2016, Carlile Bancshares had $2.3 billion in assets, $1.5 billion in loans, $1.9 billion in deposits and 42 branches • Franchise enhancement and market expansion: – Strengthens our presence and significantly increases market share in the Dallas / Fort Worth MSA – Entrance into Fort Worth and related sub markets, and significantly enhances presence in Denton County along the I-35 corridor – Entrance into the Colorado MSAs of Denver and Colorado Springs, centered on the dynamic I-25 corridor • Improves Independent Bank Group’s capital ratios, cost of funds, loan to deposit ratio, and CRE / C&D concentrations 3 Source: SNL Financial Colorado Franchise Texas Franchise Carlile (18) IBTX (41) Carlile (24) |
 Overview of Carlile Bancshares, Inc. 4 • Headquartered in Fort Worth, TX • Founded in 2009 and achieved growth through six strategic acquisitions • Strong branch footprint in diverse, metropolitan markets including Dallas / Fort Worth, Austin, Denver and Colorado Springs • Attractive loan to deposit ratio and core deposit base – approximately 90% of total deposits • Diverse loan mix with a yield on loans of approximately 5.5% over the last twelve months Source: SNL Financial 1) Data as of and for the quarter ending September 30, 2016 Financial Summary (1) Balance Sheet Data Total Assets ($M) 2,324.9 Total Loans ($M) 1,547.7 Total Deposits ($M) 1,875.5 Loans / Deposits (%) 82.5 Profitability Data (MRQ Ann.) Net Income ($M) 25.1 ROAA (%) 1.10 Net Interest Margin (%) 4.24 Efficiency Ratio (%) 66.2 Asset Quality NPAs / Assets (%) 1.37 Reserves / Loans (%) 1.01 NCOs / Avg. Loans (%) 0.02 |
 Transaction Summary 5 Aggregate Deal Value $434 million (1) Consideration to Common 100% stock to Carlile common shareholders Options Treatment – Value Cashed out – $13.7 million (2) Shares Issued to Common 8.9 million shares of IBTX stock (2) issued to Carlile common shareholders Maximum Dividend $55.25 million Minimum Tangible Common Equity $200 million required at close Common Equity Raise 400,000 shares of IBTX common stock have been subscribed for in a private placement at $52.50 per share for gross proceeds of $21 million Board Seats Representatives of Carlile Bancshares will receive the greater of three board seats or 25% of the Independent Bank Group board Lock-Up Agreement One year for directors and principal shareholders of Carlile Bancshares with respect to 94% of the shares they receive in the transaction Anticipated Closing Second quarter of 2017 1) Based on a negotiated IBTX stock price of $47.40 per share 2) Based on an IBTX closing stock price of $53.95 per share on November 18, 2016 |
 Merger Multiples 6 Notes: Carlile Bancshares financial data as of September 30, 2016 Adjusted for Carlile dividend of $53.5 million 1) Based on a negotiated IBTX stock price of $47.40 per share 2) Core deposits calculated as total deposits less CDs > $100,000 Carlile Bancshares $434.0 million (1) Transaction Multiples Price / Tangible Book Value 2.13x Price / LTM Net Income 19.7x Price / Est. 2017 Net Income 17.5x Price / Est. 2018 Net Income 15.8x Core Deposit Premium (2) 13.7% Major Assumptions: Cost Saves 35.0% Loan and OREO Mark $19 million |
 Financial Impact 7 Assumes impact of merger and $21 million common equity raise EPS Accretion (1) ~3.8% accretive in 2017 ~8.4% accretive in 2018 Tang. Book Value Per Share Accretion ~1.6% accretive Tang. Book Value Per Share Earnback 0 years Internal Rate of Return ~20% Capital Ratios Pro Forma at Close (Accretion) (2) : Leverage Ratio 8.2% (~65bps Accretive) Tier 1 Common Ratio 9.0% (~90bps Accretive) Tier 1 Risk Based Capital Ratio 9.4% (~90bps Accretive) Total Risk Based Capital Ratio 11.5% (~15bps Accretive) Note: Capital raise issuance price of $52.50 1) Excludes one-time transaction costs 2) Change versus Independent Bank Group standalone projected capital ratios as of March 31, 2017 |
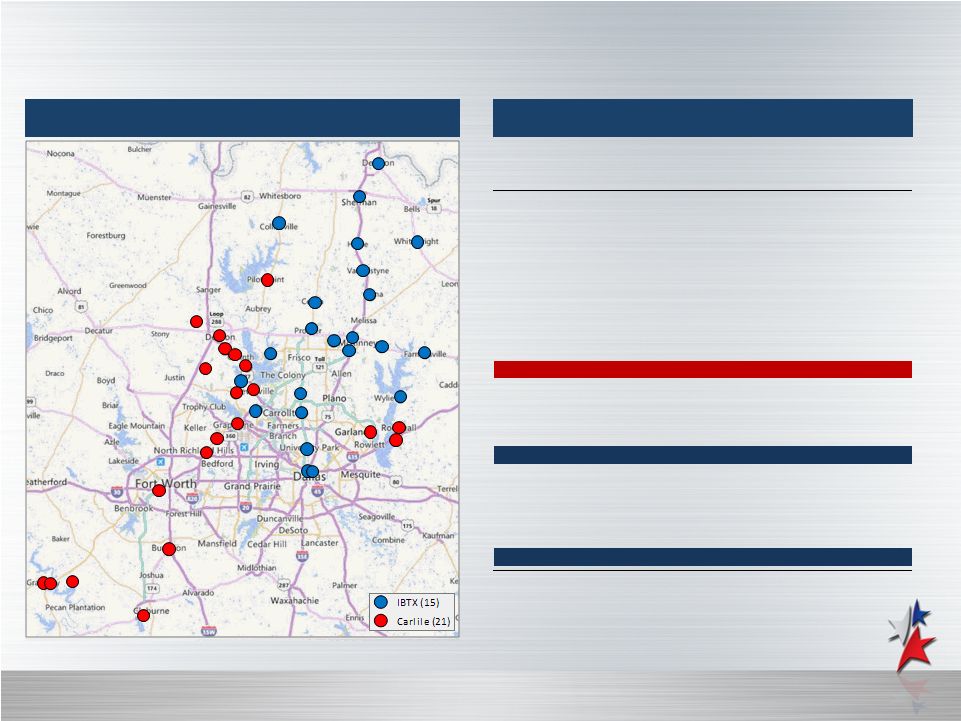 Expanding D/FW Area Footprint 8 Pro Forma Branch Map Dallas-Fort Worth MSA Source: SNL Financial Note: Deposit data as of June 30, 2016 per FDIC filings Note: Dallas-Fort Worth MSA deposit market share data does not include Grayson County, where Independent has six branches located in the Sherman-Denison MSA with ~$420 million of total deposits 2016 Rank Institution (ST) 2016 Branches 2016 Deposits ($M) 2016 Market Share (%) 1 Bank of America Corp. (NC) 147 71,594 29.48 2 JPMorgan Chase & Co. (NY) 234 53,497 22.03 3 Wells Fargo & Co. (CA) 185 19,911 8.20 4 Texas Capital Bancshares Inc. (TX) 7 13,154 5.42 5 BBVA 101 10,320 4.25 6 Cullen/Frost Bankers Inc. (TX) 38 6,277 2.58 7 LegacyTexas Finl Group Inc (TX) 46 5,571 2.29 8 Comerica Inc. (TX) 54 5,088 2.09 9 Hilltop Holdings Inc. (TX) 19 3,665 1.51 10 BOK Financial Corp. (OK) 22 3,618 1.49 Pro Forma 36 3,454 1.42 11 BB&T Corp. (NC) 58 2,886 1.19 12 Capital One Financial Corp. (VA) 36 2,825 1.16 13 NexBank Capital Inc. (TX) 3 2,404 0.99 14 ANB Corp. (TX) 24 2,256 0.93 15 Independent Bk Group Inc. (TX) 15 2,179 0.90 16 Inwood Bancshares Inc. (TX) 15 2,072 0.85 17 Regions Financial Corp. (AL) 17 1,565 0.64 18 First Texas BHC Inc. (TX) 16 1,416 0.58 19 Prosperity Bancshares Inc. (TX) 36 1,394 0.57 20 First Financial Bankshares (TX) 26 1,378 0.57 21 Carlile Bancshares Inc. (TX) 21 1,275 0.52 Top 10 Institutions 853 192,696 79.3 Total For Institutions In Market 1,677 242,892 100.0 |
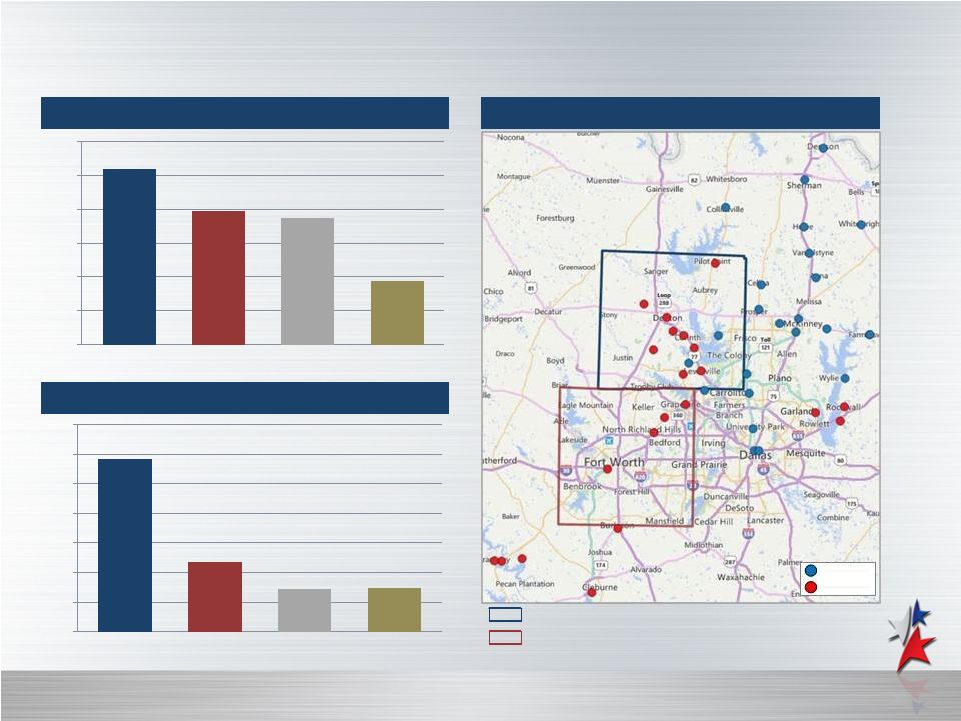 Expansion into Attractive North Texas Counties 9 Source: SNL Financial Median Household Income 2017 – 2022 Projected Population Growth Denton County Tarrant County Texas North Texas Branch Map $79.1 $61.8 $57.2 $57.5 $50 $55 $60 $65 $70 $75 $80 $85 10.4% 7.9% 7.5% 3.8% 0% 2% 4% 6% 8% 10% 12% Nationwide Denton County Tarrant County Texas Nationwide Tarrant County Denton County IBTX (22) Carlile (21) |
 10 Source: SNL Financial, Forbes, Fort Worth Chamber, Texas Christian University Website, University of North Texas Website, Denton Economic Development Partnership • Entering Tarrant and Denton County, two markets which we have long wanted to have a meaningful presence due to their attractive demographics and adjacency to our principal operations • Nine branches in Denton, and a top four deposit market share in the county: – Denton was one of the fastest growing counties in Texas over the past five years, with a population increase of over 10% – Home to The University of North Texas, which enrolls over 36,000 students and employs over 8,500 faculty and staff – Headquarters for Peterbilt Motors, a leading manufacturer of medium and heavy duty Class 5 through Class 8 trucks • Four branches in Tarrant County, including one branch in Fort Worth, provide a platform for future growth: – Headquarters for American Airlines and Texas Health Resources, which together employee over 40,000 people in the county – Texas Christian University is located near downtown Fort Worth, and enrolls over 10,000 students – Arlington, TX is home to the Dallas Cowboys and Texas Rangers • The Cowboys franchise was recently recognized by Forbes as the most valuable professional sports team in the world at over $4 billion Expansion into Attractive Markets |
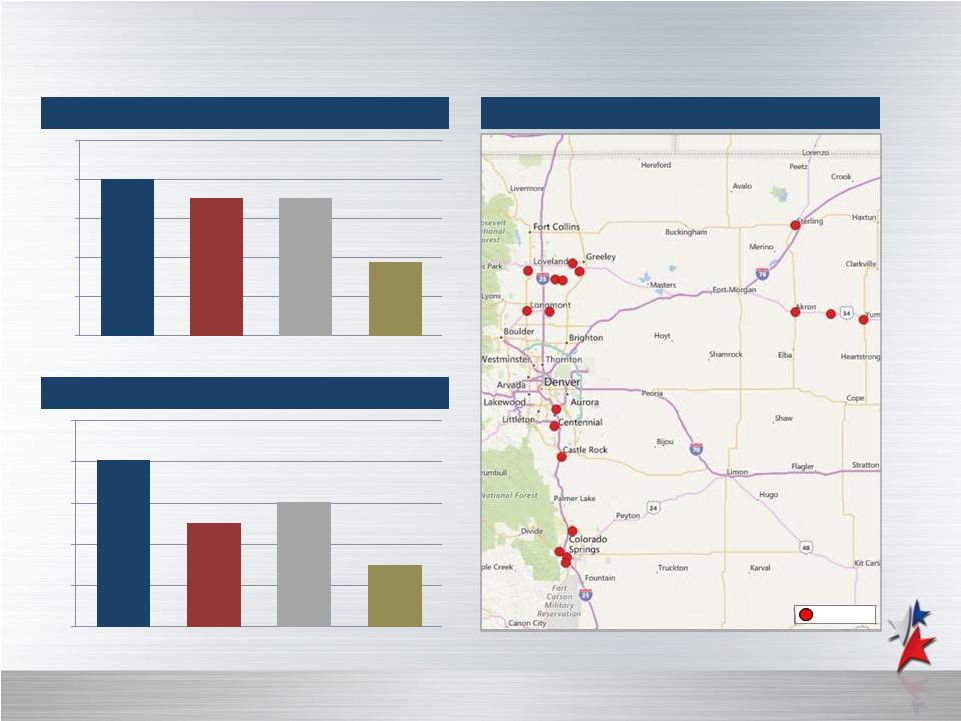 $70.2 $62.6 $65.1 $57.5 $50 $55 $60 $65 $70 $75 Franchise Expansion – Colorado 11 Source: SNL Financial Median Household Income 2017 – 2022 Projected Population Growth Denver Colorado Springs Nationwide Denver Colorado Springs Nationwide Colorado Branch Map 8.1% 7.1% 7.1% 3.8% 0% 2% 4% 6% 8% 10% Colorado Colorado Carlile (18) |
 Entry Into Colorado 12 Source: SNL Financial, Forbes, CNBC • The opportunity to expand into Colorado’s dynamic economy, including the Denver and Colorado Springs markets • Three branches in the Denver MSA provide us with a platform for growth in the state’s largest market: – Denver is ranked 1 st for “Best Places for Business and Careers” by Forbes and 4 th in CNBC’s 2016 “Top Metro Areas to Start a Business in America” – Large employers in the MSA include Centura Health, Lockheed Martin and CenturyLink – Home to the Denver Broncos, Denver Nuggets, Colorado Rockies and Colorado Avalanche • Four branches in Colorado Springs and a top ten deposit market share in the MSA: – Economically diverse metropolitan area, with employment opportunities in the defense, manufacturing and high-tech industries – Home to the United States Air Force Academy, which enrolls approximately 4,000 cadets and attracts over a million visitors each year – The city is located near the base of Pike’s Peak, the highest summit of the southern Front Range and one of the most popular tourist attractions in Colorado |
 Summary 13 • Financially rewarding with immediate EPS and tangible book value accretion, and ~20% internal rate of return • Accretive to regulatory capital and improves loan to deposit and CRE / C&D concentration ratios • Enhanced presence in the dynamic Dallas / Fort Worth market • Entry into the Front Range region of Colorado provides Independent a new market for organic growth and acquisition opportunities • Independent will rank as the 9 th largest Texas-based bank by assets and 8 th largest by total deposits with $8.0 billion in assets and $6.3 billion in deposits (1) 1) As of September 30, 2016 |
 Carlile Bancshares Financial Highlights 14 Source: SNL Financial 12/31/12 - For the Years Ended: Quarters Ended: 9/30/16 2012 2013 2014 2015 12/31/2015 3/31/2016 6/30/2016 9/30/2016 CAGR Balance Sheet ($000) Assets 1,987,055 1,792,847 2,392,485 2,343,262 2,343,262 2,297,281 2,270,108 2,324,879 4.3% Total Loans & Leases 1,124,318 1,047,710 1,454,955 1,401,384 1,401,384 1,399,548 1,475,651 1,547,690 8.9% Deposits 1,581,429 1,476,571 1,963,612 1,895,385 1,895,385 1,879,249 1,820,387 1,875,537 4.7% Equity 263,995 270,053 376,083 398,282 398,282 371,141 378,072 384,667 10.6% Tangible Common Equity 193,350 193,429 246,966 271,232 271,232 244,562 250,007 257,014 7.9% Profitability (%) Net Income ($000) 2,429 5,169 13,205 21,660 5,100 4,895 5,810 6,274 ROAA NA 0.28 0.65 0.94 0.88 0.86 1.03 1.10 ROAE NA 1.93 4.21 5.60 5.14 5.09 6.20 6.58 Net Interest Margin NA 4.45 4.46 4.10 3.98 4.11 4.18 4.24 Efficiency Ratio 80.2 74.8 73.8 67.4 69.8 68.0 67.2 66.2 Balance Sheet Ratios (%) Loans/Deposits 71.1 71.0 74.1 73.9 73.9 74.5 81.1 82.5 Leverage Ratio 15.2 11.6 11.2 13.2 13.2 11.9 12.1 12.2 Tier 1 Common Ratio 15.1 15.1 14.9 16.7 16.7 14.7 14.7 14.3 Tier 1 Risk Based Ratio 16.2 16.4 15.9 17.5 17.5 15.5 15.3 14.8 Total Risk-Based Capital Ratio 16.5 17.2 16.7 18.4 18.4 16.5 16.2 15.7 Asset Quality (%) NPAs / Assets 4.33 2.96 1.39 1.11 1.11 1.11 1.42 1.37 LLR / Loans 0.30 0.97 0.88 1.03 1.03 1.07 1.05 1.01 LLR / NPAs 3.9 19.1 38.3 55.5 55.5 58.8 47.8 49.1 NCOs/Avg Loans NA 0.2 0.1 0.0 0.1 0.0 0.1 0.0 |
  Independent Bank Group Financial Highlights 15 Source: SNL Financial and Independent Bank Group 12/31/12 - For the Years Ended: Quarters Ended: 9/30/16 2012 2013 2014 2015 12/31/2015 3/31/2016 6/30/2016 9/30/2016 CAGR Balance Sheet ($000) Assets 1,740,060 2,163,984 4,132,639 5,055,000 5,055,000 5,261,967 5,446,797 5,667,195 37.0% Total Loans & Leases 1,378,676 1,726,543 3,205,050 4,000,151 4,000,151 4,137,072 4,263,407 4,365,889 36.0% Deposits 1,390,740 1,710,319 3,249,598 4,028,279 4,028,279 4,171,952 4,208,405 4,416,493 36.1% Equity 124,510 233,772 540,851 627,309 627,309 616,258 629,628 643,253 54.9% Tangible Common Equity 92,517 195,920 275,001 328,371 328,371 342,286 356,148 370,265 44.7% Profitability (%) Net Income ($000) 17,377 19,800 28,978 38,786 10,561 12,452 11,809 14,504 ROAA 1.17 1.04 0.87 0.88 0.87 0.95 0.88 1.05 ROAE 16.54 9.90 6.65 6.87 7.09 8.01 7.56 9.09 Net Interest Margin 4.40 4.30 4.19 4.05 4.00 4.06 3.94 3.68 Efficiency Ratio 67.0 63.9 56.4 57.3 57.5 53.5 59.2 50.9 Balance Sheet Ratios (%) Loans/Deposits 98.5 100.8 98.5 99.0 99.0 99.0 101.0 98.7 Leverage Ratio 6.45 10.71 8.15 8.28 8.28 7.36 7.42 7.46 Tier 1 Common Ratio 6.87 11.61 8.53 7.94 7.94 7.92 7.89 7.92 Tier 1 Risk Based Ratio 8.22 12.64 9.83 8.92 8.92 8.36 8.27 8.29 Total Risk-Based Capital Ratio 10.5 13.8 12.6 11.1 11.1 10.5 11.4 11.2 Asset Quality (%) NPAs / Assets 1.58 0.58 0.35 0.36 0.36 0.62 0.34 0.23 LLR / Loans 0.83 0.81 0.58 0.68 0.68 0.73 0.73 0.68 LLR / NPAs 41.6 111.8 128.6 149.5 149.5 93.1 165.0 223.1 NCOs/Avg Loans 0.06 0.09 0.03 0.02 0.00 0.01 0.11 0.32 |
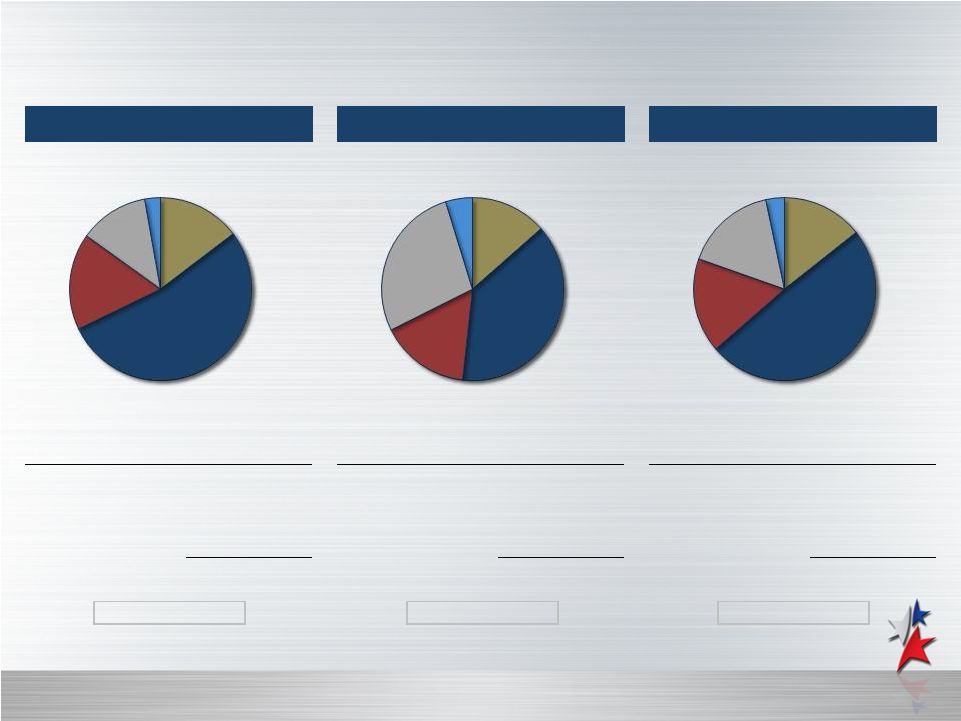 Pro Forma Loan Portfolio 16 Yield on loans: 4.73% Yield on loans: 5.34% Yield on loans: 4.89% Independent Bank Group Carlile Bancshares Pro Forma Source: SNL Financial, Independent Bank Group, Carlile Bancshares Note: Financial data as of September 30, 2016 Resi. RE 14.6% Comm. RE & Multi 53.1% Const. & Land 17.1% C&I 12.3% Cons. & Other 2.8% Resi. RE 13.5% Comm. RE & Multi 38.2% Const. & Land 15.9% C&I 27.6% Cons. & Other 4.8% Resi. RE 14.3% Comm. RE & Multi 49.2% Const. & Land 16.8% C&I 16.3% Cons. & Other 3.3% Loans ($M) Residential RE 640 $ 14.6% Commercial RE & Multi 2,320 53.1% Construction & Land 748 17.1% C&I 537 12.3% Consumer & Other 121 2.8% Total 4,366 $ 100.0% Loans ($M) Residential RE 209 $ 13.5% Commercial RE & Multi 592 38.2% Construction & Land 246 15.9% C&I 428 27.6% Consumer & Other 74 4.8% Total 1,548 $ 100.0% Loans ($M) Residential RE 848 $ 14.3% Commercial RE & Multi 2,912 49.2% Construction & Land 994 16.8% C&I 965 16.3% Consumer & Other 195 3.3% Total 5,914 $ 100.0% |
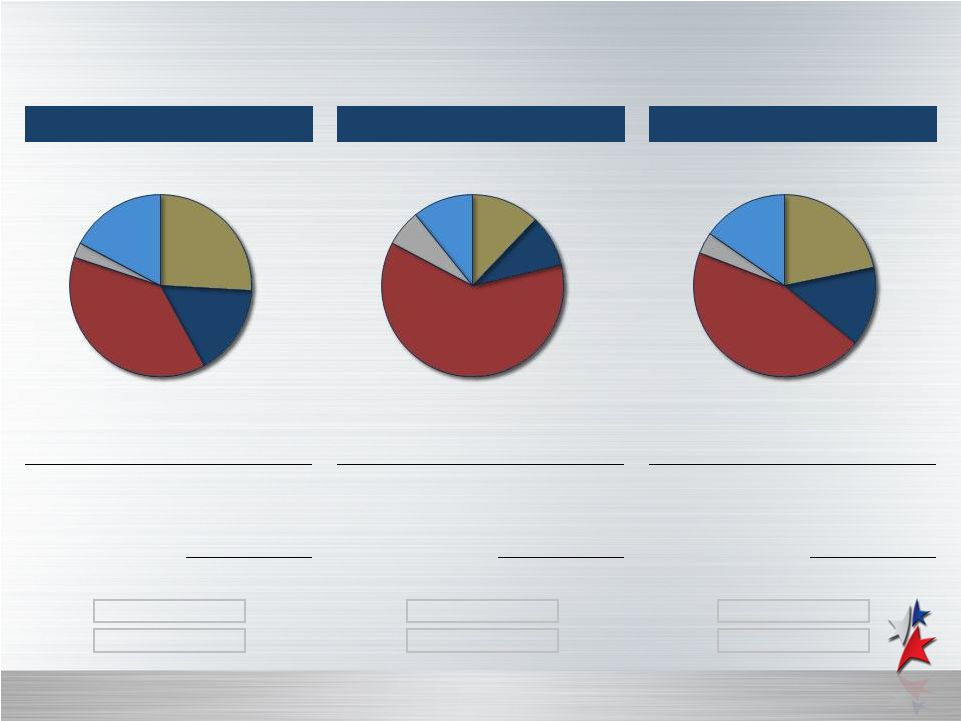 Pro Forma Deposit Composition 17 Independent Bank Group Carlile Bancshares Pro Forma Cost of deposits: 0.38% Cost of deposits: 0.24% Cost of deposits: 0.34% Loans / Deposits: 98.9% Loans / Deposits: 82.5% Loans / Deposits: 94.0% Deposits ($M) NIB Demand 1,143 $ 25.9% NOW & Other Trans. 714 16.2% Savings & MMDA 1,679 38.0% Retail CDs 119 2.7% Jumbo CDs 762 17.2% Total 4,416 $ 100.0% Deposits ($M) NIB Demand 227 $ 12.1% NOW & Other Trans. 172 9.2% Savings & MMDA 1,153 61.5% Retail CDs 121 6.5% Jumbo CDs 202 10.8% Total 1,876 $ 100.0% Deposits ($M) NIB Demand 1,371 $ 21.8% NOW & Other Trans. 886 14.1% Savings & MMDA 2,832 45.0% Retail CDs 240 3.8% Jumbo CDs 963 15.3% Total 6,292 $ 100.0% NIB Demand 25.9% NOW & Other Trans. 16.2% Savings & MMDA 38.0% Retail CDs 2.7% Jumbo CDs 17.2% NIB Demand 12.1% NOW & Other Trans. 9.2% Savings & MMDA 61.5% Retail CDs 6.5% Jumbo CDs 10.8% NIB Demand 21.8% NOW & Other Trans. 14.1% Savings & MMDA 45.0% Retail CDs 3.8% Jumbo CDs 15.3% Source: SNL Financial, Independent Bank Group Note: Financial data as of September 30, 2016 |
 Contact Information 18 Corporate Headquarters Analysts/Investors: Independent Bank Group, Inc. Michelle Hickox 1600 Redbud Blvd Executive Vice President and Chief Financial Officer Suite 400 (972) 562-9004 McKinney, TX 75069 mhickox@ibtx.com (972) 562-9004 Telephone Media: (972) 562-7734 Fax Peggy Smolen www.ibtx.com Director of Marketing (972) 562-9004 psmolen@ibtx.com |
 |