
Colony NorthStar Credit Real Estate, Inc. Creating a Leading Commercial Real Estate Credit REIT Combination of Certain Debt and Equity Investments from Colony NorthStar, Inc., NorthStar Real Estate Income Trust, Inc. and NorthStar Real Estate Income II, Inc. Exhibit 99.2
Forward-Looking Statements Cautionary Statement Regarding Forward-Looking Statements This presentation may contain forward-looking statements within the meaning of the federal securities laws. Forward-looking statements relate to expectations, beliefs, projections, future plans and strategies, anticipated events or trends and similar expressions concerning matters that are not historical facts. In some cases, you can identify forward-looking statements by the use of forward-looking terminology, such as “may,” “will,” “should,” “expects,” “intends,” “plans,” “anticipates,” “believes,” “estimates,” “predicts” or “potential” or the negative of these words and phrases or similar words or phrases which are predictions of or indicate future events or trends and which do not relate solely to historical matters. Forward-looking statements involve known and unknown risks, uncertainties, assumptions and contingencies, many of which are beyond our control, and may cause actual results to differ significantly from those expressed in any forward-looking statement. Among others, the following uncertainties and other factors could cause actual results to differ from those set forth in the forward-looking statements: the failure to receive, on a timely basis or otherwise, the required approvals by NorthStar Real Estate Income Trust, Inc. and NorthStar Real Estate Income II, Inc. stockholders, government or regulatory agencies and third parties; the risk that a condition to closing of the combination may not be satisfied; each company’s ability to consummate the combination; operating costs and business disruption may be greater than expected; the ability of each company to retain it senior executives and maintain relationships with business partners pending consummation of the combination; the ability to realize substantial efficiencies and synergies as well as anticipated strategic and financial benefits and the impact of legislative, regulatory and competitive changes and other risk factors relating to the industries in which each company operates, as detailed from time to time in each company’s reports filed with Securities and Exchange Commission (“SEC”). There can be no assurance that the combination will in fact be consummated. None of Colony NorthStar, Inc., NorthStar Real Estate Income Trust, Inc., NorthStar Real Estate Income II, Inc. or any other person assumes responsibility for the accuracy or completeness of any of these forward-looking statements. You should not rely upon forward-looking statements as predictions of future events. The forward-looking statements speak only as of the date of this presentation. None of Colony NorthStar, Inc., NorthStar Real Estate Income Trust, Inc. or NorthStar Real Estate Income II, Inc. are under any duty to update any of these forward-looking statements after the date of this presentation, nor to conform prior statements to actual results or revised expectation, and none of Colony NorthStar, Inc., NorthStar Real Estate Income Trust, Inc. or NorthStar Real Estate Income II, Inc. intends to do so. Additional Information and Where to Find It In connection with the proposed transaction, Colony NorthStar, Inc., NorthStar Real Estate Income Trust, Inc. and NorthStar Real Estate Income II, Inc. will cause Colony NorthStar Credit Real Estate, Inc., the surviving company of the combination, to file with the SEC a registration statement on Form S-4 that will include a joint proxy statement of NorthStar Real Estate Income Trust, Inc. and NorthStar Real Estate Income II, Inc. and that also will constitute a prospectus of Colony NorthStar Credit Real Estate, Inc.. Each of Colony NorthStar, Inc., NorthStar Real Estate Income Trust, Inc. and NorthStar Real Estate Income II, Inc. may also file other documents with the SEC regarding the proposed transaction. This document is not a substitute for the joint proxy statement/prospectus or registration statement or any other document which Colony NorthStar, Inc., NorthStar Real Estate Income Trust, Inc. or NorthStar Real Estate Income II, Inc. may file with the SEC. INVESTORS AND SECURITY HOLDERS OF COLONY NORTHSTAR, INC., NORTHSTAR REAL ESTATE INCOME TRUST, INC. AND NORTHSTAR REAL ESTATE INCOME II, INC. ARE URGED TO READ THE REGISTRATION STATEMENT, THE JOINT PROXY STATEMENT/PROSPECTUS, THE CURRENT REPORT ON FORM 8-K TO BE FILED BY EACH OF COLONY NORTHSTAR, INC., NORTHSTAR REAL ESTATE INCOME TRUST, INC. AND NORTHSTAR REAL ESTATE INCOME II, INC. IN CONNECTION WITH THE ANNOUNCEMENT OF THE ENTRY INTO THE COMBINATION AGREEMENT AND ANY OTHER RELEVANT DOCUMENTS THAT ARE FILED OR WILL BE FILED WITH THE SEC, AS WELL AS ANY AMENDMENTS OR SUPPLEMENTS TO THESE DOCUMENTS, CAREFULLY AND IN THEIR ENTIRETY BECAUSE THEY CONTAIN OR WILL CONTAIN IMPORTANT INFORMATION ABOUT THE PROPOSED TRANSACTION AND RELATED MATTERS. Investors and security holders may obtain free copies of the registration statement and the joint proxy statement/prospectus (when available) and other documents filed with the SEC by Colony NorthStar, Inc., NorthStar Real Estate Income Trust, Inc. and NorthStar Real Estate Income II, Inc. through the website maintained by the SEC at www.sec.gov or by contacting the investor relations department of Colony NorthStar, Inc., NorthStar Real Estate Income Trust, Inc. or NorthStar Real Estate Income II, Inc. at the following: Contacts: Colony NorthStar, Inc. Darren J. Tangen Kevin P. TraenkleLasse Glasser Executive Vice President and Chief Financial OfficerExecutive Vice President and Chief Investment OfficerAddo Investor Relations 310-552-7230310-552-7212 310-829-5400 NorthStar Real Estate Income Trust, Inc. NorthStar Real Estate Income II, Inc. Investor RelationsInvestor Relations 877-940-8777877-940-8777 Participants in the Solicitation Each of NorthStar Real Estate Income Trust, Inc. and NorthStar Real Estate Income II, Inc. and their respective directors, executive officers and employees may be deemed to be participants in the solicitation of proxies from their respective stockholders in connection with the proposed transaction. Information regarding NorthStar Real Estate Income Trust, Inc.’s directors and executive officers, including a description of their direct interests, by security holdings or otherwise, is contained in NorthStar Real Estate Income Trust, Inc.’s Annual Report on Form 10-K for the year ended December 31, 2016, its annual proxy statement filed with the SEC on April 28, 2017 and in a Current Report on Form 8-K to be filed by NorthStar Real Estate Income Trust, Inc. with the SEC in connection with the announcement of the proposed transaction. Information regarding NorthStar Real Estate Income II, Inc.’s directors and executive officers, including a description of their direct interests, by security holdings or otherwise, is contained in NorthStar Real Estate Income II, Inc.’s Annual Report on Form 10-K for the year ended December 31, 2016, its annual proxy statement filed with the SEC on April 28, 2017 and in a Current Report on Form 8-K to be filed by NorthStar Real Estate Income II, Inc. with the SEC in connection with the announcement of the proposed transaction. A more complete description will be available in the registration statement on Form S-4 to be filed by Colony NorthStar Credit Real Estate, Inc. and the joint proxy statement/prospectus. You may obtain free copies of these documents as described in the preceding paragraph. No Offer or Solicitation This communication is not intended to and shall not constitute an offer to sell or the solicitation of an offer to sell or the solicitation of an offer to buy any securities or a solicitation of any vote of approval, nor shall there be any sale of securities in any jurisdiction in which such offer, solicitation or sale would be unlawful prior to registration or qualification under the securities laws of any such jurisdiction. No offer of securities shall be made except by means of a prospectus meeting the requirements of Section 10 of the Securities Act of 1933, as amended. Rounded figures may not foot.
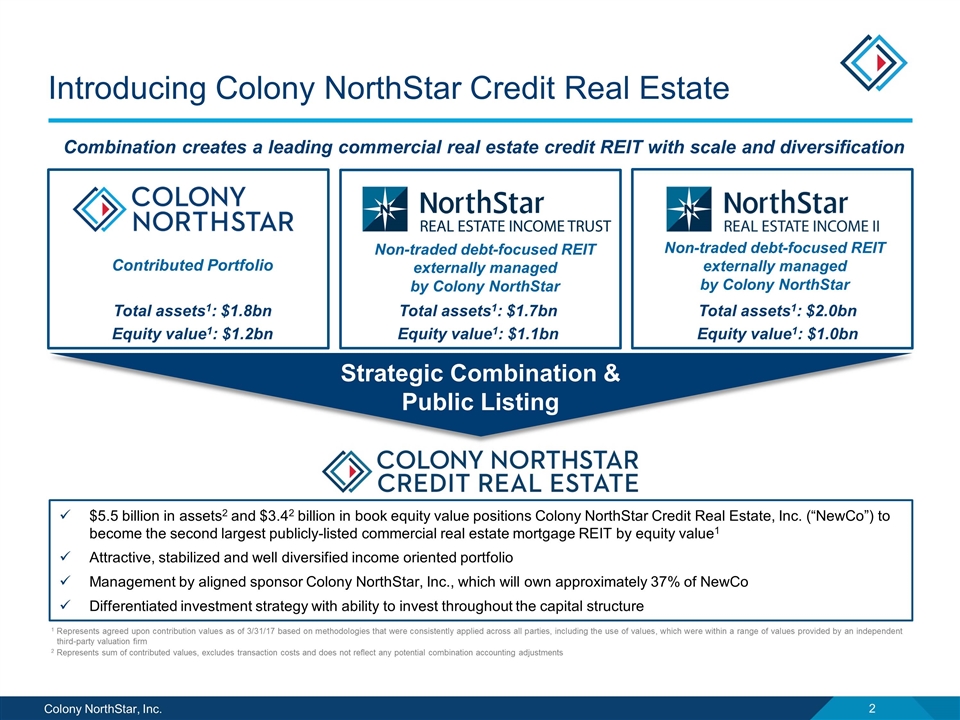
Introducing Colony NorthStar Credit Real Estate $5.5 billion in assets2 and $3.42 billion in book equity value positions Colony NorthStar Credit Real Estate, Inc. (“NewCo”) to become the second largest publicly-listed commercial real estate mortgage REIT by equity value1 Attractive, stabilized and well diversified income oriented portfolio Management by aligned sponsor Colony NorthStar, Inc., which will own approximately 37% of NewCo Differentiated investment strategy with ability to invest throughout the capital structure ü Propels Colony NorthStar’ objective of becoming an equity REIT… ü Attractive market backdrop and opportunity for growth ü Compelling value proposition to NorthStar I and NorthStar II shareholders through liquidity event and more efficient overhead ü Strong sponsorship in Colony NorthStar as a manager and successful track record across multiple Commercial Mortgage REITs ü Strategic Combination & Public Listing Contributed Portfolio Total assets1: $1.8bn Equity value1: $1.2bn Total assets1: $2.0bn Equity value1: $1.0bn 1 Represents agreed upon contribution values as of 3/31/17 based on methodologies that were consistently applied across all parties, including the use of values, which were within a range of values provided by an independent third-party valuation firm 2 Represents sum of contributed values, excludes transaction costs and does not reflect any potential combination accounting adjustments Total assets1: $1.7bn Equity value1: $1.1bn Combination creates a leading commercial real estate credit REIT with scale and diversification Non-traded debt-focused REIT externally managed by Colony NorthStar Non-traded debt-focused REIT externally managed by Colony NorthStar
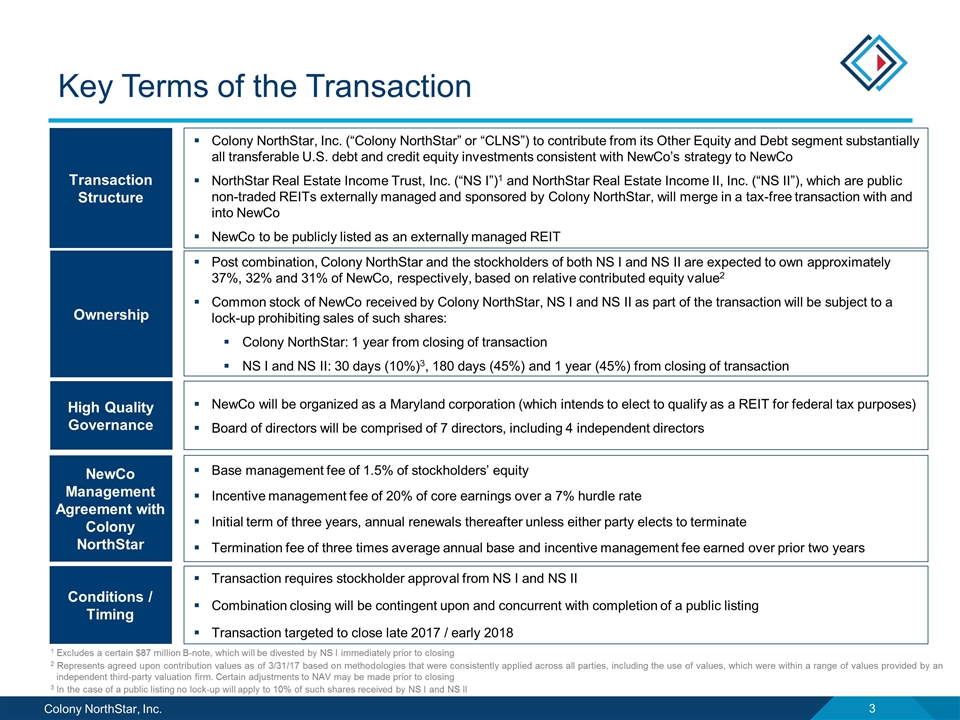
Key Terms of the Transaction Transaction Structure Colony NorthStar, Inc. (“Colony NorthStar” or “CLNS”) to contribute from its Other Equity and Debt segment substantially all transferable U.S. debt and credit equity investments consistent with NewCo’s strategy to NewCo NorthStar Real Estate Income Trust, Inc. (“NS I”)1 and NorthStar Real Estate Income II, Inc. (“NS II”), which are public non-traded REITs externally managed and sponsored by Colony NorthStar, will merge in a tax-free transaction with and into NewCo NewCo to be publicly listed as an externally managed REIT NewCo Management Agreement with Colony NorthStar Base management fee of 1.5% of stockholders’ equity Incentive management fee of 20% of core earnings over a 7% hurdle rate Initial term of three years, annual renewals thereafter unless either party elects to terminate Termination fee of three times average annual base and incentive management fee earned over prior two years Conditions / Timing Transaction requires stockholder approval from NS I and NS II Combination closing will be contingent upon and concurrent with completion of a public listing Transaction targeted to close late 2017 / early 2018 High Quality Governance NewCo will be organized as a Maryland corporation (which intends to elect to qualify as a REIT for federal tax purposes) Board of directors will be comprised of 7 directors, including 4 independent directors Colony NorthStar I NorthStar II Public Listing only Public offering2 [35%] [34%] [30%] - TBU TBU TBU TBU Ownership Post combination, Colony NorthStar and the stockholders of both NS I and NS II are expected to own approximately 37%, 32% and 31% of NewCo, respectively, based on relative contributed equity value2 Common stock of NewCo received by Colony NorthStar, NS I and NS II as part of the transaction will be subject to a lock-up prohibiting sales of such shares: Colony NorthStar: 1 year from closing of transaction NS I and NS II: 30 days (10%)3, 180 days (45%) and 1 year (45%) from closing of transaction 1 Excludes a certain $87 million B-note, which will be divested by NS I immediately prior to closing 2 Represents agreed upon contribution values as of 3/31/17 based on methodologies that were consistently applied across all parties, including the use of values, which were within a range of values provided by an independent third-party valuation firm. Certain adjustments to NAV may be made prior to closing 3 In the case of a public listing no lock-up will apply to 10% of such shares received by NS I and NS II
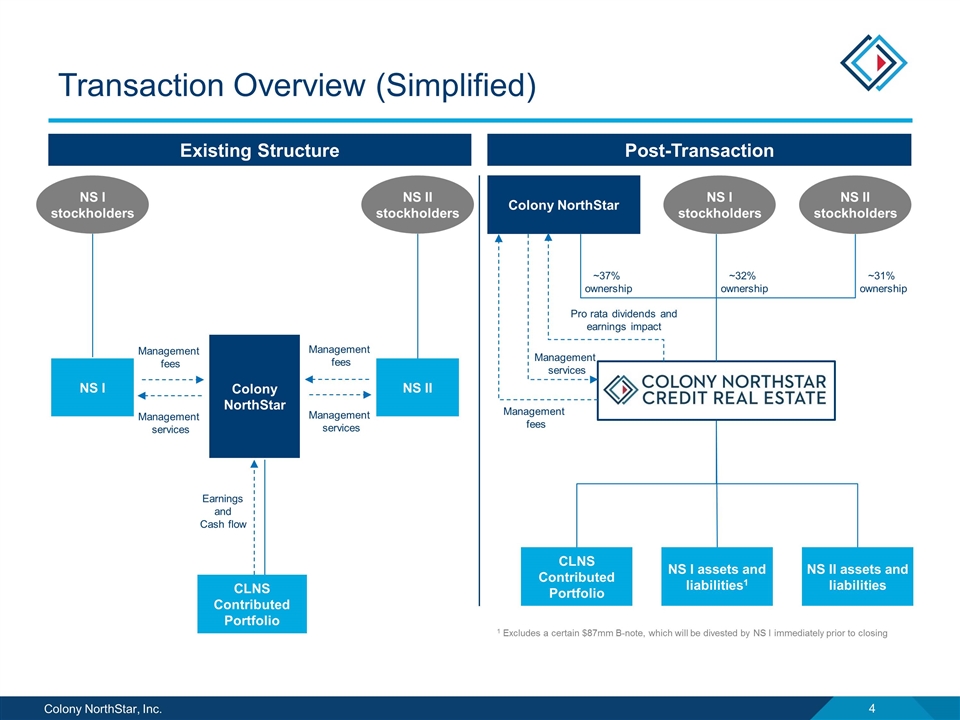
Transaction Overview (Simplified) Existing Structure Post-Transaction Management fees Management agreement Earnings and Cash flow Internally managed Management fees + Share of earnings Management agreement NS I NS II Contribution Portfolio CLNS + + NS I stockholders CLNS NS II stockholders Management services NS II NS I Colony NorthStar CLNS Contributed Portfolio Earnings and Cash flow NS I stockholders NS II stockholders Colony NorthStar Management fees Management services CLNS Contributed Portfolio NS I assets and liabilities1 NS II assets and liabilities ~37% ownership ~32% ownership ~31% ownership 1 Excludes a certain $87mm B-note, which will be divested by NS I immediately prior to closing Management fees Management services Pro rata dividends and earnings impact Management fees Management services
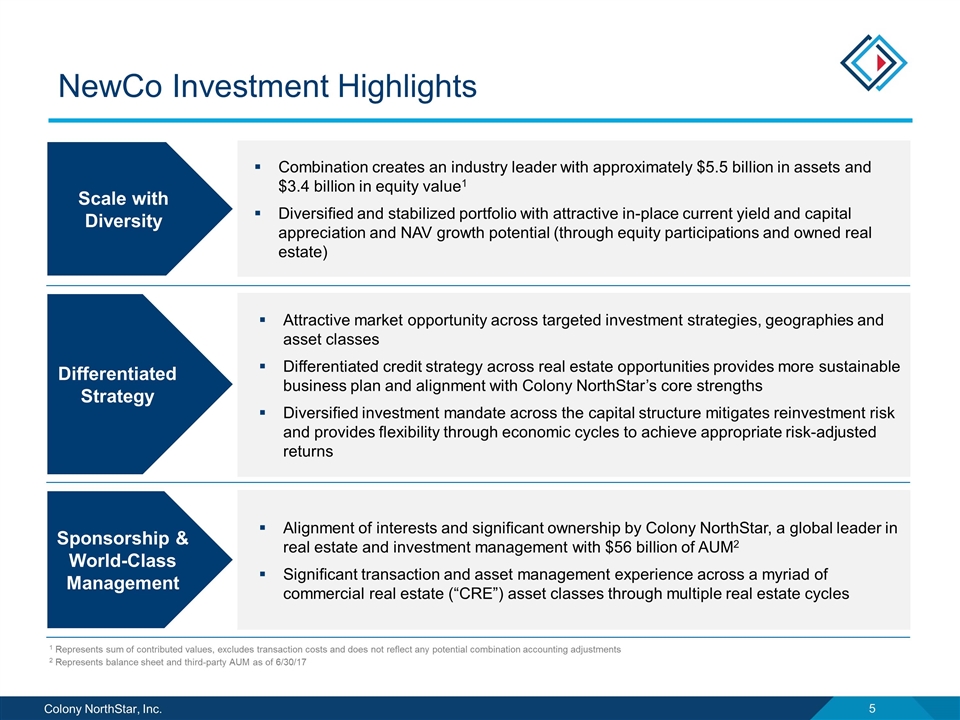
NewCo Investment Highlights Proposed Structure 1 Proposed Structure Proposed Structure Proposed Structure Proposed Structure Proposed Structure 2 3 4 5 6 Combination creates an industry leader with approximately $5.5 billion in assets and $3.4 billion in equity value1 Diversified and stabilized portfolio with attractive in-place current yield and capital appreciation and NAV growth potential (through equity participations and owned real estate) Attractive market opportunity across targeted investment strategies, geographies and asset classes Differentiated credit strategy across real estate opportunities provides more sustainable business plan and alignment with Colony NorthStar’s core strengths Diversified investment mandate across the capital structure mitigates reinvestment risk and provides flexibility through economic cycles to achieve appropriate risk-adjusted returns Alignment of interest and significant ownership by Colony NorthStar, a premier global real estate and investment management firm with $56 billion of AUM2 Deep transaction and asset management experience across the capital stack through multiple real estate cycles Multiple in-place funding sources to support investment strategy and near-term growth 1 Represents sum of contributed values, excludes transaction costs and does not reflect any potential combination accounting adjustments 2 Represents balance sheet and third-party AUM as of 6/30/17 Differentiated strategy of diversity across income-oriented assets provides more sustainable and flexible business plan and alignment with sponsor’s core competencies Alignment of interests and significant ownership by Colony NorthStar, a global leader in real estate and investment management with $56 billion of AUM2 Significant transaction and asset management experience across a myriad of commercial real estate (“CRE”) asset classes through multiple real estate cycles Scale with Diversity Differentiated Strategy Sponsorship & World-Class Management
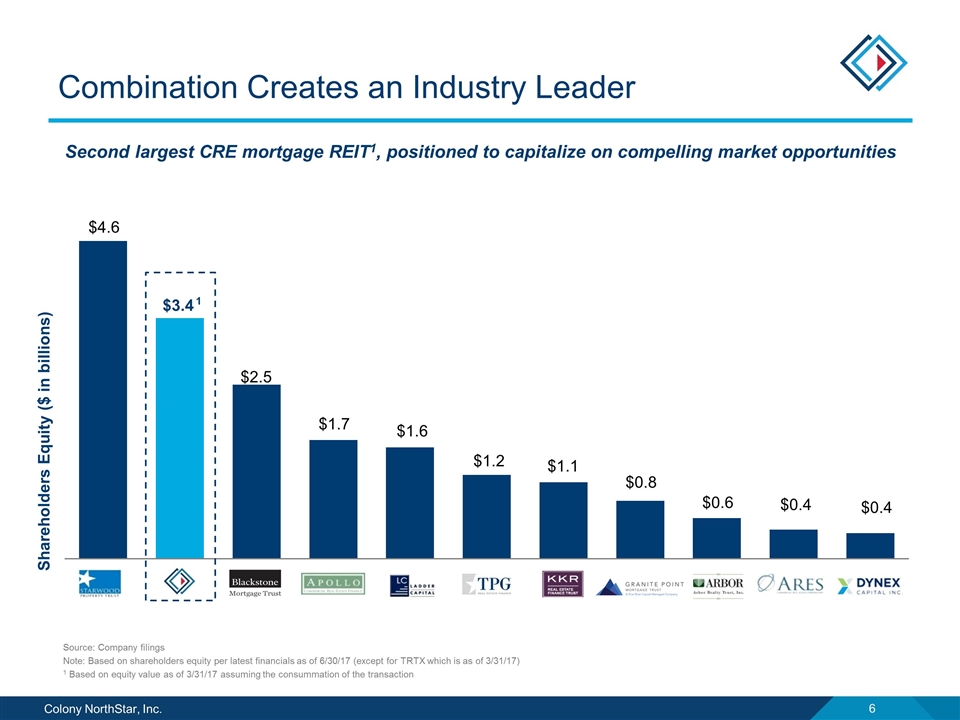
Combination Creates an Industry Leader Shareholders Equity ($ in billions) Source: Company filings Note: Based on shareholders equity per latest financials as of 6/30/17 (except for TRTX which is as of 3/31/17) 1 Based on equity value as of 3/31/17 assuming the consummation of the transaction Equity market cap2: $5,865 $2,950 $1,644 $1,730 -5 n/a $1,017 $1,199 $398 n/a - Second largest CRE mortgage REIT1, positioned to capitalize on compelling market opportunities 1
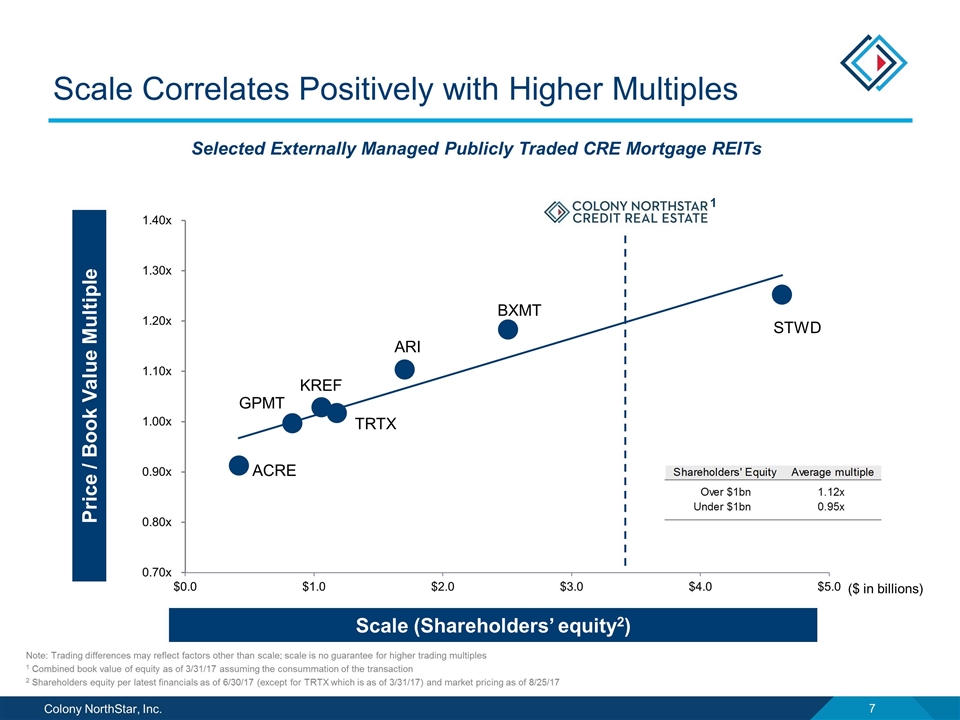
Scale Correlates Positively with Higher Multiples Price / Book Value Multiple 1 Scale (Shareholders’ equity2) ($ in billions) Note: Trading differences may reflect factors other than scale; scale is no guarantee for higher trading multiples 1 Combined book value of equity as of 3/31/17 assuming the consummation of the transaction 2 Shareholders equity per latest financials as of 6/30/17 (except for TRTX which is as of 3/31/17) and market pricing as of 8/25/17 Selected Externally Managed Publicly Traded CRE Mortgage REITs
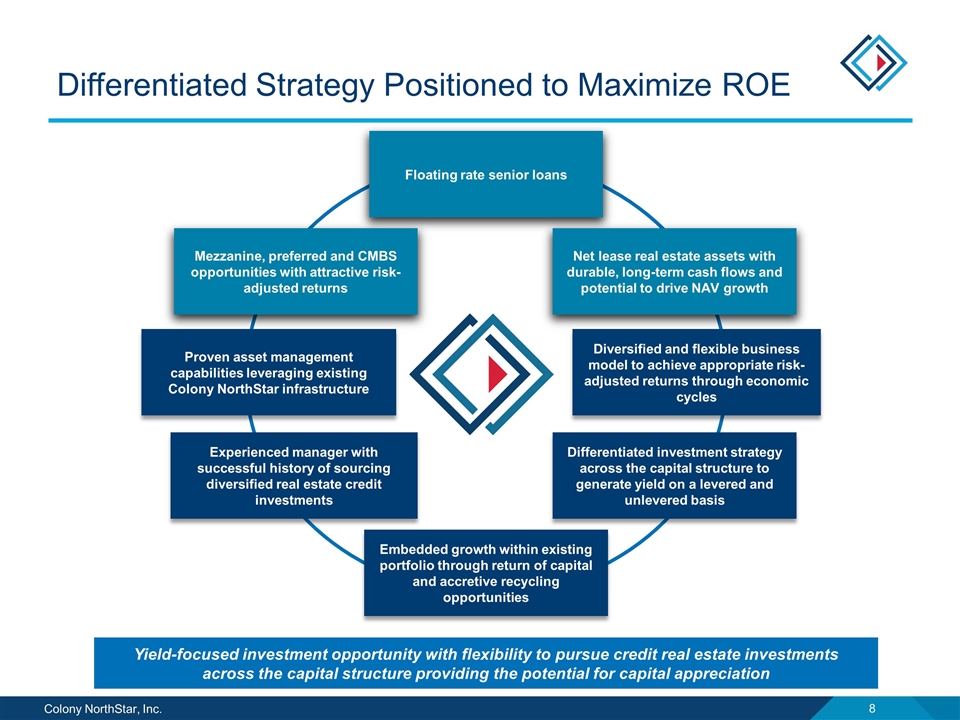
Differentiated Strategy Positioned to Maximize ROE Proposed Structure 1 Proposed Structure Proposed Structure Proposed Structure Proposed Structure Proposed Structure 2 3 4 5 6 Floating rate senior loans Mezzanine, preferred and CMBS opportunities with attractive risk-adjusted returns Net lease real estate assets with durable, long-term cash flows and potential to drive NAV growth Proven asset management capabilities leveraging existing Colony NorthStar infrastructure Yield-focused investment opportunity with flexibility to pursue credit real estate investments across the capital structure providing the potential for capital appreciation Experienced manager with successful history of sourcing diversified real estate credit investments Differentiated investment strategy across the capital structure to generate yield on a levered and unlevered basis Diversified and flexible business model to achieve appropriate risk-adjusted returns through economic cycles Embedded growth within existing portfolio through return of capital and accretive recycling opportunities
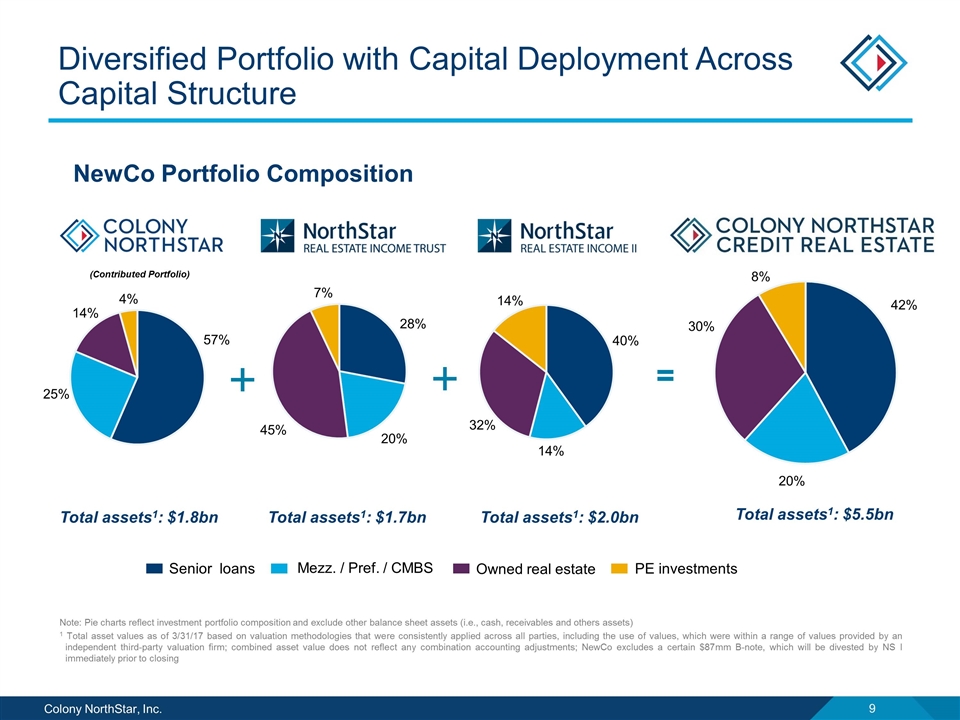
Diversified Portfolio with Capital Deployment Across Capital Structure NewCo Portfolio Composition Note: Pie charts reflect investment portfolio composition and exclude other balance sheet assets (i.e., cash, receivables and others assets) 1 Total asset values as of 3/31/17 based on valuation methodologies that were consistently applied across all parties, including the use of values, which were within a range of values provided by an independent third-party valuation firm; combined asset value does not reflect any combination accounting adjustments; NewCo excludes a certain $87mm B-note, which will be divested by NS I immediately prior to closing 14% (Contributed Portfolio) È È 57% 25% 28% 20% 45% 40% 14% 32% Senior loans Mezz. / Pref. / CMBS PE investments Owned real estate Total assets1: $1.8bn Total assets1: $1.7bn Total assets1: $2.0bn 4% 7% 14% = 42% 20% 8% 30% Total assets1: $5.5bn
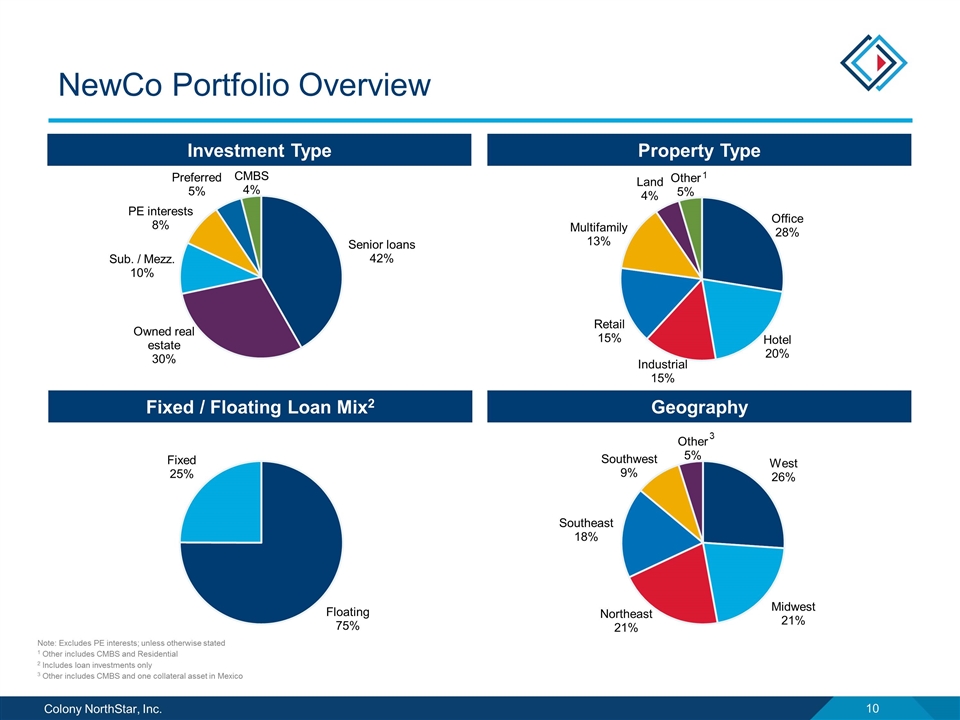
NewCo Portfolio Overview Note: Excludes PE interests; unless otherwise stated 1 Other includes CMBS and Residential 2 Includes loan investments only 3 Other includes CMBS and one collateral asset in Mexico Investment Type Property Type Fixed / Floating Loan Mix2 Geography Weighted average fixed coupon: 8.4% Weighted average floating coupon: L + 5.8% 3 1
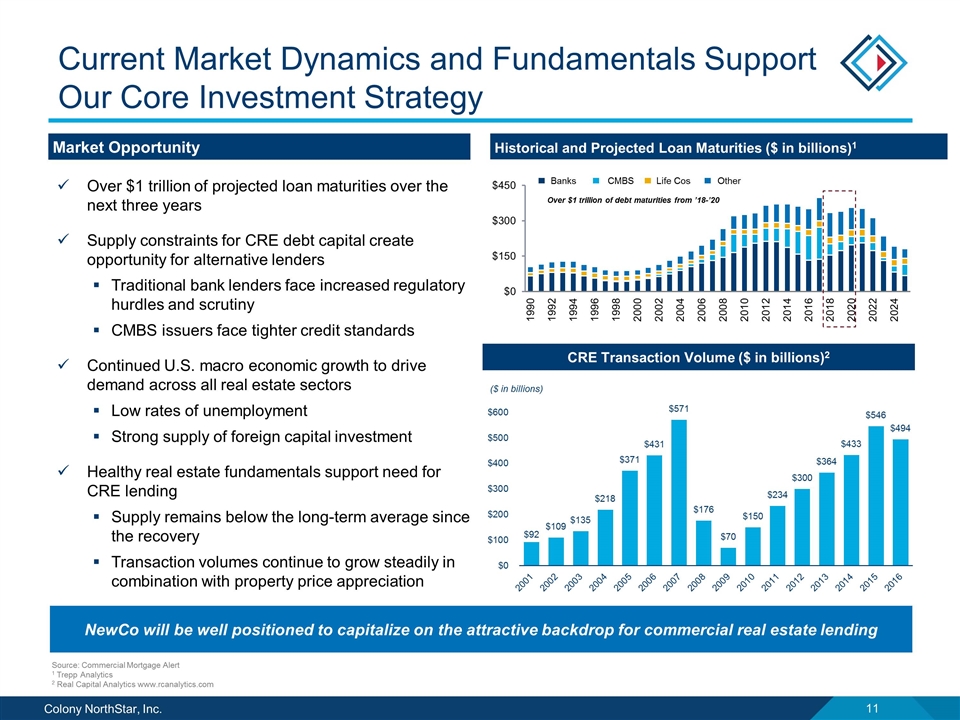
Current Market Dynamics and Fundamentals Support Our Core Investment Strategy Historical and Projected Loan Maturities ($ in billions)1 Banks CMBS Life Cos Other Operating US commercial banks1 Source: Commercial Mortgage Alert 1 Trepp Analytics 2 Real Capital Analytics www.rcanalytics.com New completions as a % of existing stock2 NewCo will be well positioned to capitalize on the attractive backdrop for commercial real estate lending New completions below long-term average and historic highs Over $1 trillion of debt maturities from ’18-’20 Market Opportunity Over $1 trillion of projected loan maturities over the next three years Supply constraints for CRE debt capital create opportunity for alternative lenders Traditional bank lenders face increased regulatory hurdles and scrutiny CMBS issuers face tighter credit standards Continued U.S. macro economic growth to drive demand across all real estate sectors Low rates of unemployment Strong supply of foreign capital investment Healthy real estate fundamentals support need for CRE lending Supply remains below the long-term average since the recovery Transaction volumes continue to grow steadily in combination with property price appreciation CRE Transaction Volume ($ in billions)2
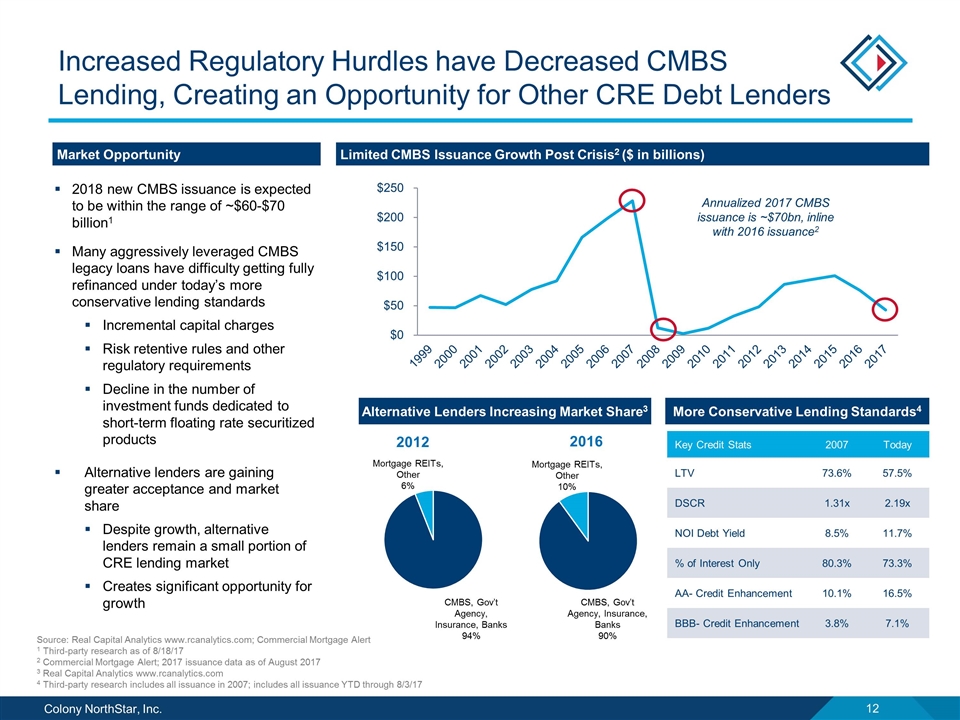
Increased Regulatory Hurdles have Decreased CMBS Lending, Creating an Opportunity for Other CRE Debt Lenders 2018 new CMBS issuance is expected to be within the range of ~$60-$70 billion1 Many aggressively leveraged CMBS legacy loans have difficulty getting fully refinanced under today’s more conservative lending standards Incremental capital charges Risk retentive rules and other regulatory requirements Decline in the number of investment funds dedicated to short-term floating rate securitized products Alternative lenders are gaining greater acceptance and market share Despite growth, alternative lenders remain a small portion of CRE lending market Creates significant opportunity for growth Key Credit Stats 2007 Today LTV 73.6% 57.5% DSCR 1.31x 2.19x NOI Debt Yield 8.5% 11.7% % of Interest Only 80.3% 73.3% AA- Credit Enhancement 10.1% 16.5% BBB- Credit Enhancement 3.8% 7.1% Source: Real Capital Analytics www.rcanalytics.com; Commercial Mortgage Alert 1 Third-party research as of 8/18/17 2 Commercial Mortgage Alert; 2017 issuance data as of August 2017 3 Real Capital Analytics www.rcanalytics.com 4 Third-party research includes all issuance in 2007; includes all issuance YTD through 8/3/17 Limited CMBS Issuance Growth Post Crisis2 ($ in billions) Annualized 2017 CMBS issuance is ~$70bn, inline with 2016 issuance2 More Conservative Lending Standards4 Market Opportunity CMBS, Gov’t Agency, Insurance, Banks 94% Mortgage REITs, Other 6% CMBS, Gov’t Agency, Insurance, Banks 90% Mortgage REITs, Other 10% 2012 2016 Alternative Lenders Increasing Market Share3
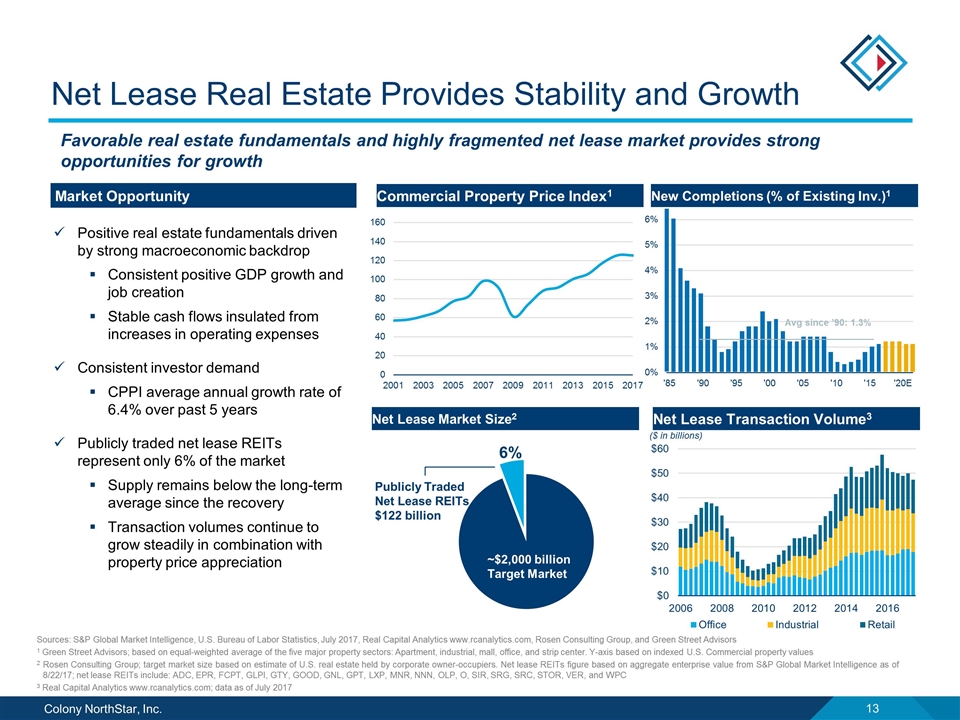
Net Lease Real Estate Provides Stability and Growth Favorable real estate fundamentals and highly fragmented net lease market provides strong opportunities for growth Market Opportunity Positive real estate fundamentals driven by strong macroeconomic backdrop Consistent positive GDP growth and job creation Stable cash flows insulated from increases in operating expenses Consistent investor demand CPPI average annual growth rate of 6.4% over past 5 years Publicly traded net lease REITs represent only 6% of the market Supply remains below the long-term average since the recovery Transaction volumes continue to grow steadily in combination with property price appreciation Commercial Property Price Index1 New Completions (% of Existing Inv.)1 Net Lease Transaction Volume3 Avg since ’90: 1.3% Net Lease Market Size2 Publicly Traded Net Lease REITs $122 billion ~$2,000 billion Target Market ($ in billions) Sources: S&P Global Market Intelligence, U.S. Bureau of Labor Statistics, July 2017, Real Capital Analytics www.rcanalytics.com, Rosen Consulting Group, and Green Street Advisors 1 Green Street Advisors; based on equal-weighted average of the five major property sectors: Apartment, industrial, mall, office, and strip center. Y-axis based on indexed U.S. Commercial property values 2 Rosen Consulting Group; target market size based on estimate of U.S. real estate held by corporate owner-occupiers. Net lease REITs figure based on aggregate enterprise value from S&P Global Market Intelligence as of 8/22/17; net lease REITs include: ADC, EPR, FCPT, GLPI, GTY, GOOD, GNL, GPT, LXP, MNR, NNN, OLP, O, SIR, SRG, SRC, STOR, VER, and WPC 3 Real Capital Analytics www.rcanalytics.com; data as of July 2017
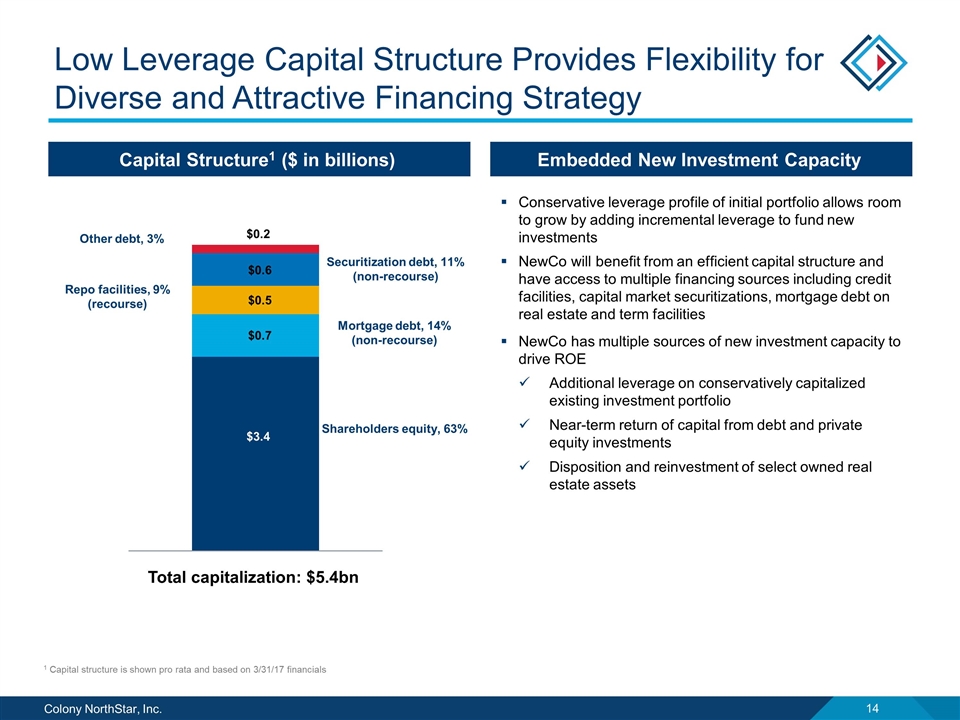
Low Leverage Capital Structure Provides Flexibility for Diverse and Attractive Financing Strategy Capital Structure1 ($ in billions) Embedded New Investment Capacity Conservative leverage profile of initial portfolio allows room to grow by adding incremental leverage to fund new investments NewCo will benefit from an efficient capital structure and have access to multiple financing sources including credit facilities, capital market securitizations, mortgage debt on real estate and term facilities NewCo has multiple sources of new investment capacity to drive ROE Additional leverage on conservatively capitalized existing investment portfolio Near-term return of capital from debt and private equity investments Disposition and reinvestment of select owned real estate assets 1 Capital structure is shown pro rata and based on 3/31/17 financials Shareholders equity, 63% Securitization debt, 11% (non-recourse) Repo facilities, 9% (recourse) Other debt, 3% Total capitalization: $5.4bn Mortgage debt, 14% (non-recourse)
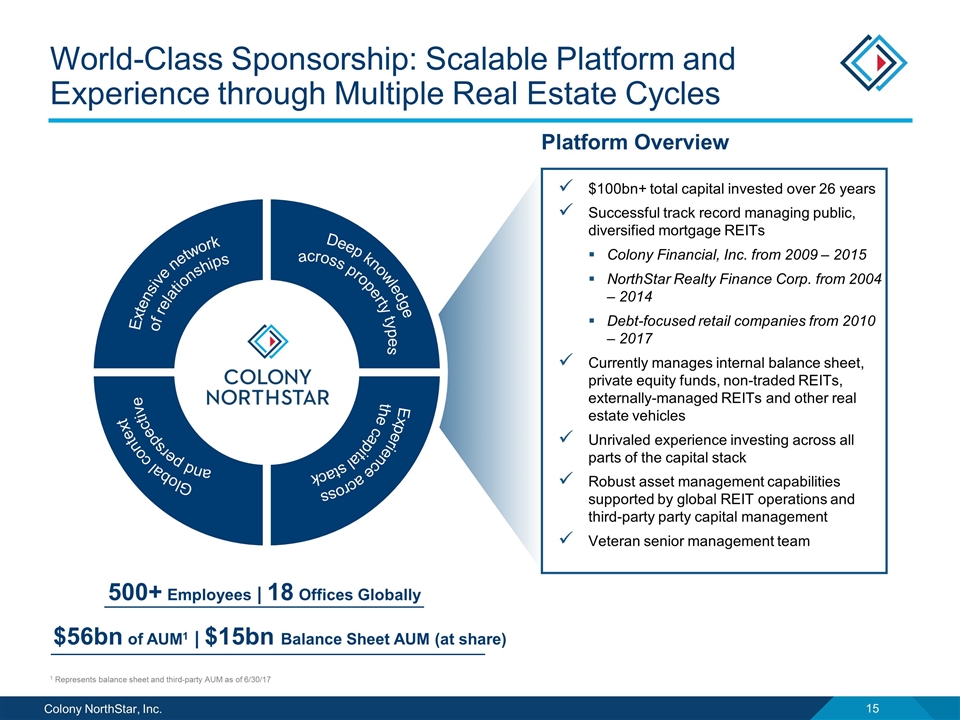
Deep knowledge across property types Global context and perspective Experience across the capital stack World-Class Sponsorship: Scalable Platform and Experience through Multiple Real Estate Cycles Platform Overview $100bn+ total capital invested over 26 years Successful track record managing public, diversified mortgage REITs Colony Financial, Inc. from 2009 – 2015 NorthStar Realty Finance Corp. from 2004 – 2014 Debt-focused retail companies from 2010 – 2017 Currently manages internal balance sheet, private equity funds, non-traded REITs, externally-managed REITs and other real estate vehicles Unrivaled experience investing across all parts of the capital stack Robust asset management capabilities supported by global REIT operations and third-party party capital management Veteran senior management team $56bn of AUM1 | $15bn Balance Sheet AUM (at share) 500+ Employees | 18 Offices Globally 1 Represents balance sheet and third-party AUM as of 6/30/17 Extensive network of relationships
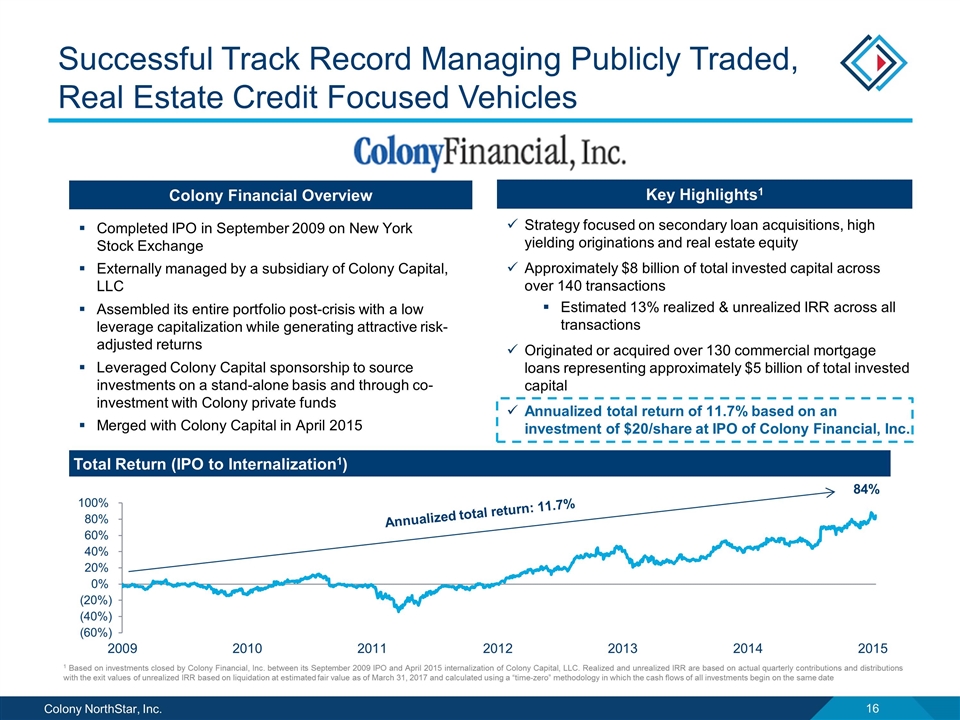
1 Strategy focused on secondary loan acquisitions, high yielding originations and real estate equity Approximately $8 billion of total invested capital across over 140 transactions Estimated 13% realized & unrealized IRR across all transactions Originated or acquired over 130 commercial mortgage loans representing approximately $5 billion of total invested capital Annualized total return of 11.7% based on an investment of $20/share at IPO of Colony Financial, Inc. Successful Track Record Managing Publicly Traded, Real Estate Credit Focused Vehicles Completed IPO in September 2009 on New York Stock Exchange Externally managed by a subsidiary of Colony Capital, LLC Assembled its entire portfolio post-crisis with a low leverage capitalization while generating attractive risk-adjusted returns Leveraged Colony Capital sponsorship to source investments on a stand-alone basis and through co-investment with Colony private funds Merged with Colony Capital in April 2015 1 Based on investments closed by Colony Financial, Inc. between its September 2009 IPO and April 2015 internalization of Colony Capital, LLC. Realized and unrealized IRR are based on actual quarterly contributions and distributions with the exit values of unrealized IRR based on liquidation at estimated fair value as of March 31, 2017 and calculated using a “time-zero” methodology in which the cash flows of all investments begin on the same date Colony Financial Overview Key Highlights1 84% Total Return (IPO to Internalization1) Annualized total return: 11.7%
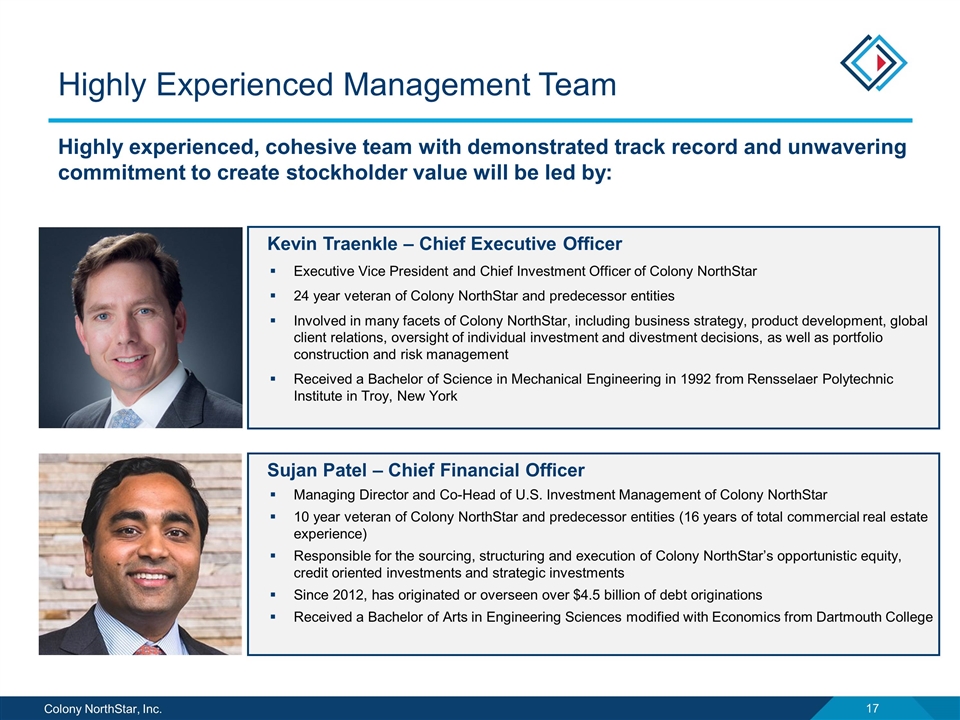
Highly Experienced Management Team Highly experienced, cohesive team with demonstrated track record and unwavering commitment to create stockholder value will be led by: Kevin Traenkle – Chief Executive Officer Executive Vice President and Chief Investment Officer of Colony NorthStar 24 year veteran of Colony NorthStar and predecessor entities Involved in many facets of Colony NorthStar, including business strategy, product development, global client relations, oversight of individual investment and divestment decisions, as well as portfolio construction and risk management Received a Bachelor of Science in Mechanical Engineering in 1992 from Rensselaer Polytechnic Institute in Troy, New York Sujan Patel – Chief Financial Officer Managing Director and Co-Head of U.S. Investment Management of Colony NorthStar 10 year veteran of Colony NorthStar and predecessor entities (16 years of total commercial real estate experience) Responsible for the sourcing, structuring and execution of Colony NorthStar’s opportunistic equity, credit oriented investments and strategic investments Since 2012, has originated or overseen over $4.5 billion of debt originations Received a Bachelor of Arts in Engineering Sciences modified with Economics from Dartmouth College


