Exhibit 99.2
FY14Q2 Earnings Call Presentation February 6, 2014

© 2014 Truett - Hurst Inc. Safe Harbor Statement This presentation (including the presentation and any subsequent questions and answers) contains statements that are forward - looking within the meaning of Section 27 A of the Securities Act of 1933 and Section 21 E of the Securities Exchange Act of 1934 . Such forward - looking statements are only predictions and are not guarantees of future performance . Any such forward - looking statements are and will be, as the case may be, subject to many risks, uncertainties, certain assumptions and factors relating to the operations and business environments of Truett - Hurst, Inc . and its subsidiaries that may cause the actual results of the companies to be materially different from any future results expressed or implied in such forward - looking statements . These risk factors, include, but are not limited to, a reduction in the supply of grapes and bulk wine available to us ; significant competition ; any change in our relationships with retailers could harm our business ; we may not achieve or maintain profitability in the future ; the loss of key employees ; a reduction in our access to, or an increase in the cost of, the third - party services we use to produce our wine could harm our business ; credit facility restrictions on our current and future operations ; failure to protect, or infringement of, trademarks and proprietary rights ; these factors should not be construed as exhaustive and should be read in conjunction with the other cautionary statements that are included in this report or detailed in the Company’s periodic filings (including Forms 8 - K, 10 - K and 10 - Q) or other documents filed with the Securities and Exchange Commission . For more detailed information on the Company, please refer to the Company filings with the Securities and Exchange Commission, which are readily available at http : //www . sec . gov, or through the Company’s Investor Relations website at http : //www . truetthurstinc . com . This presentation is intended to be viewed in conjunction with the Truett - Hurst, Inc . second quarter 2014 earnings call . The Company undertakes no obligation to publicly update any forward - looking statement, whether as a result of new information, future events or otherwise . 1

© 2014 Truett - Hurst Inc. Presenters 2 Phillip L. Hurst Chief Executive Officer James D. Bielenberg Chief Financial Officer
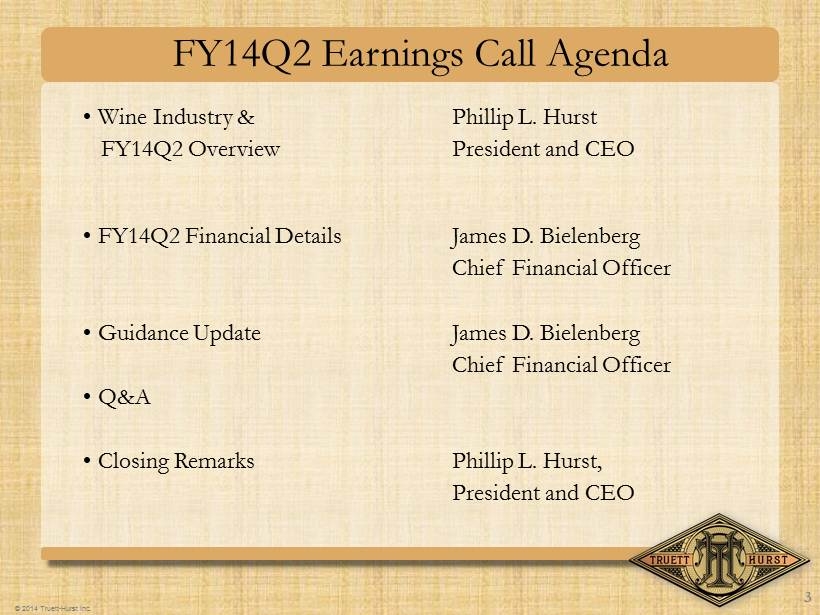
© 2014 Truett - Hurst Inc. FY14Q2 Earnings Call Agenda • Wine Industry & Phillip L. Hurst FY14Q2 Overview President and CEO • FY14Q2 Financial Details James D. Bielenberg Chief Financial Officer • Guidance Update James D. Bielenberg Chief Financial Officer • Q&A • Closing Remarks Phillip L. Hurst, President and CEO 3
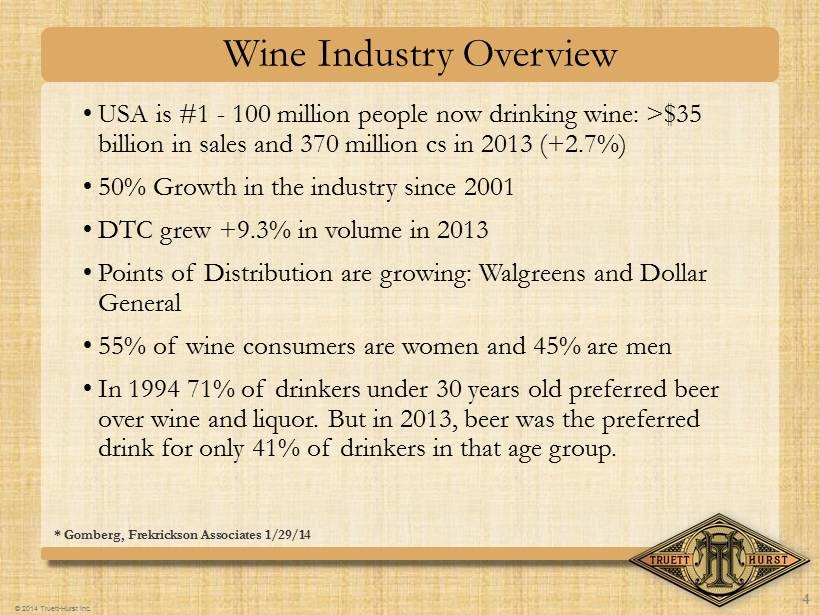
© 2014 Truett - Hurst Inc. Wine Industry Overview • USA is #1 - 100 million people now drinking wine: >$35 billion in sales and 370 million cs in 2013 (+2.7%) • 50% Growth in the industry since 2001 • DTC grew +9.3% in volume in 2013 • Points of Distribution are growing: Walgreens and Dollar General • 55% of wine consumers are women and 45% are men • In 1994 71% of drinkers under 30 years old preferred beer over wine and liquor. But in 2013, beer was the preferred drink for only 41% of drinkers in that age group. * Gomberg , Frekrickson Associates 1/29/14 4
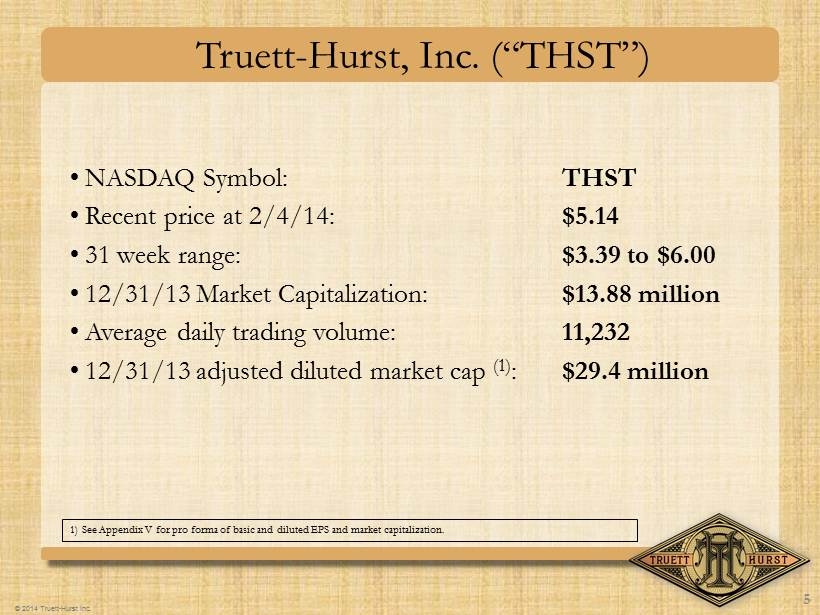
© 2014 Truett - Hurst Inc. Truett - Hurst, Inc. (“THST”) • NASDAQ Symbol: THST • Recent price at 2/4/14: $5.14 • 31 week range: $3.39 to $6.00 • 12/31/13 Market Capitalization: $13.88 million • Average daily trading volume: 11,232 • 12/31/13 adjusted diluted market cap (1) : $29.4 million 1) See Appendix V for pro forma of basic and diluted EPS and market capitalization. 5
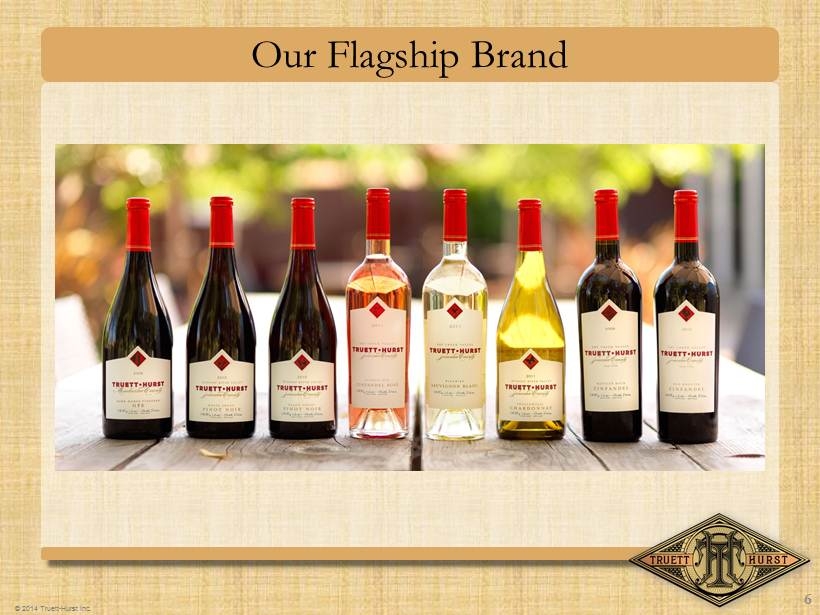
© 2014 Truett - Hurst Inc. Our Flagship Brand 6
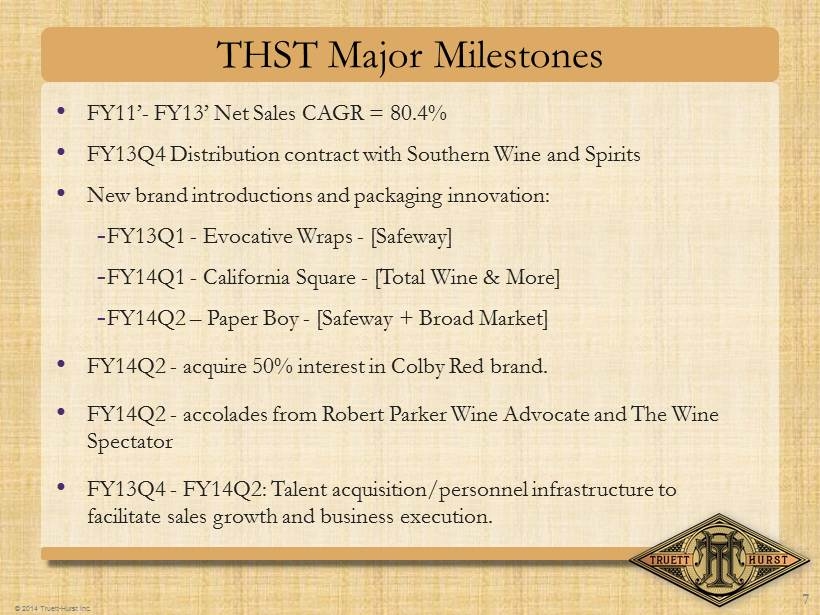
© 2014 Truett - Hurst Inc. 7 • FY11’ - FY13’ Net Sales CAGR = 80.4% • FY13Q4 Distribution contract with Southern Wine and Spirits • New brand introductions and packaging innovation: - FY13Q1 - Evocative Wraps - [ Safeway] - FY14Q1 - California Square - [Total Wine & More] - FY14Q2 – Paper Boy - [ Safeway + Broad Market] • FY14Q2 - acquire 50% interest in Colby Red brand. • FY14Q2 - accolades from Robert Parker Wine Advocate and The Wine Spectator • FY13Q4 - FY14Q2 : Talent acquisition/personnel infrastructure to facilitate sales growth and business execution . THST Major Milestones
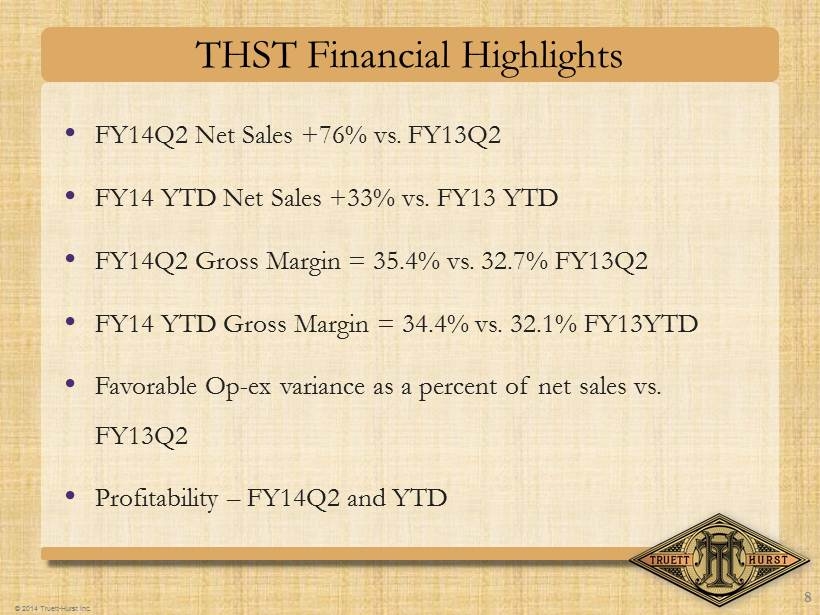
© 2014 Truett - Hurst Inc. 8 THST Financial Highlights • FY14Q2 Net Sales +76% vs. FY13Q2 • FY14 YTD Net Sales +33% vs. FY13 YTD • FY14Q2 Gross Margin = 35.4% vs. 32.7% FY13Q2 • FY14 YTD Gross Margin = 34.4% vs. 32.1% FY13YTD • Favorable Op - ex variance as a percent of net sales vs. FY13Q2 • Profitability – FY14Q2 and YTD
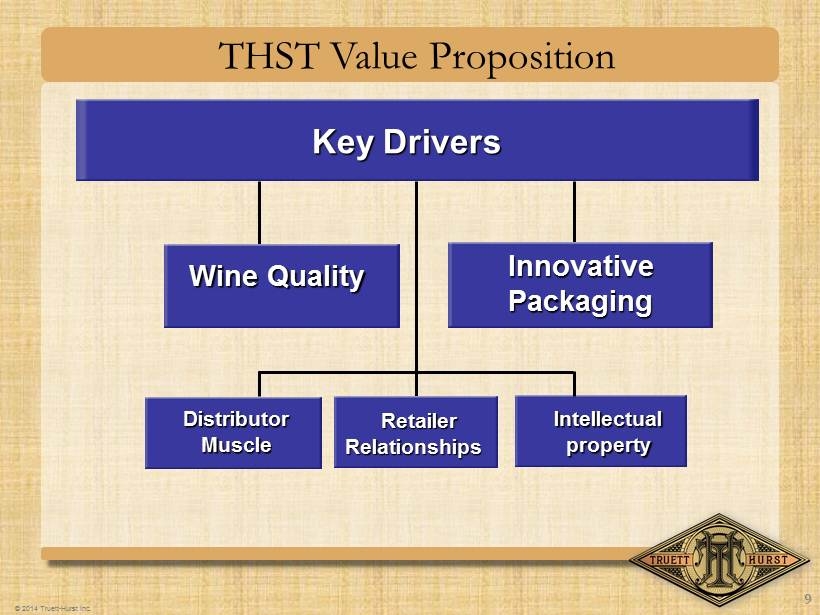
© 2014 Truett - Hurst Inc. Retailer Relationships Distributor Muscle Intellectual property Innovative Packaging Wine Quality THST Value Proposition 9 Key Drivers
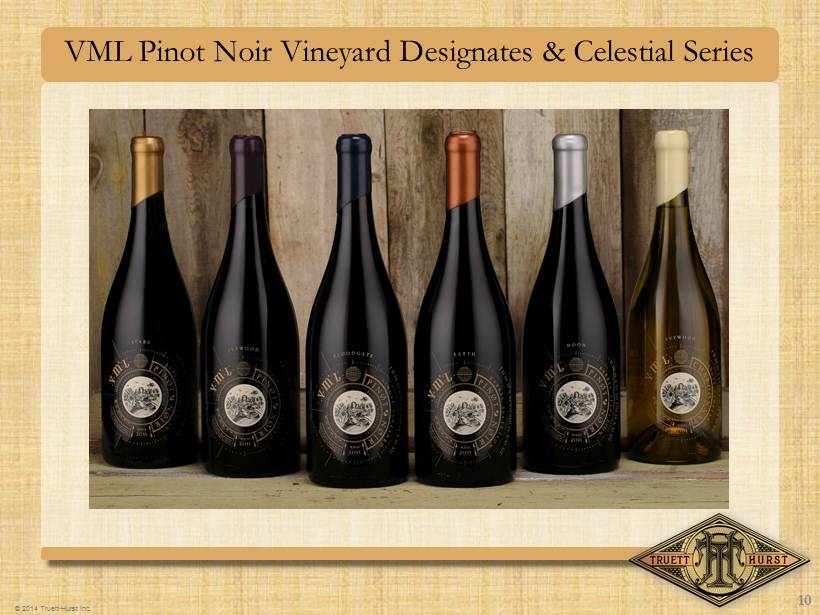
© 2014 Truett - Hurst Inc. 10 VML Pinot Noir Vineyard Designates & Celestial Series
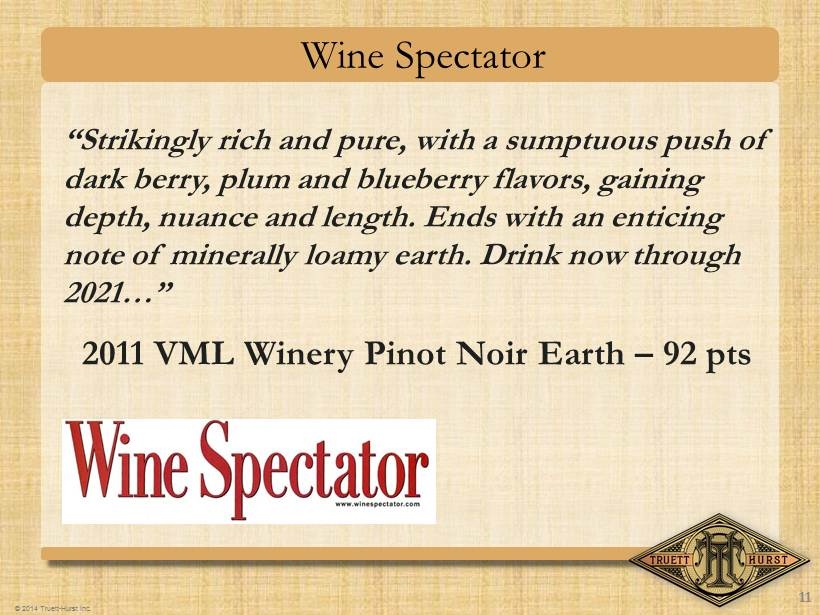
© 2014 Truett - Hurst Inc. 11 “Strikingly rich and pure, with a sumptuous push of dark berry, plum and blueberry flavors, gaining depth, nuance and length. Ends with an enticing note of minerally loamy earth. Drink now through 2021…” 2011 VML Winery Pinot Noir Earth – 92 pts Wine Spectator
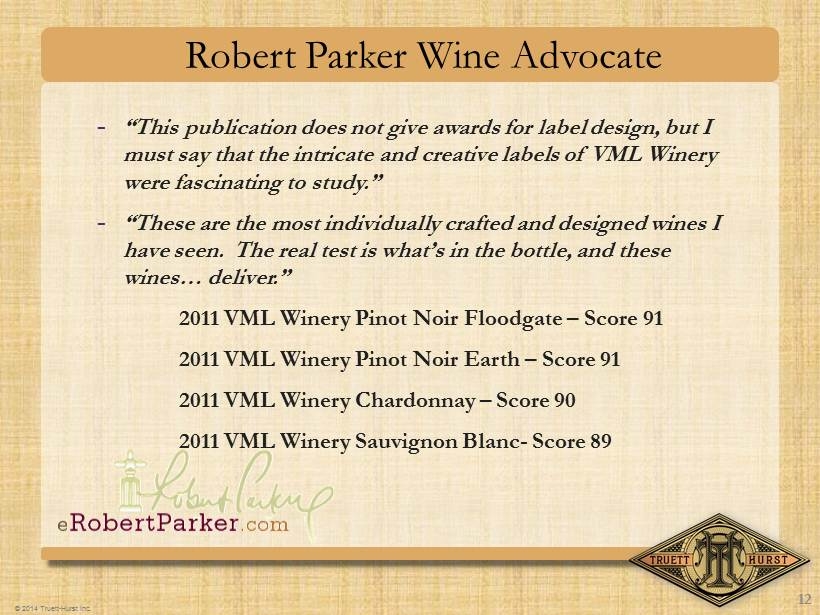
© 2014 Truett - Hurst Inc. 12 - “This publication does not give awards for label design, but I must say that the intricate and creative labels of VML Winery were fascinating to study .” - “These are the most individually crafted and designed wines I have seen. The real test is what’s in the bottle, and these wines… deliver.” 2011 VML Winery Pinot Noir Floodgate – Score 91 2011 VML Winery Pinot Noir Earth – Score 91 2011 VML Winery Chardonnay – Score 90 2011 VML Winery Sauvignon Blanc - Score 89 Robert Parker Wine Advocate
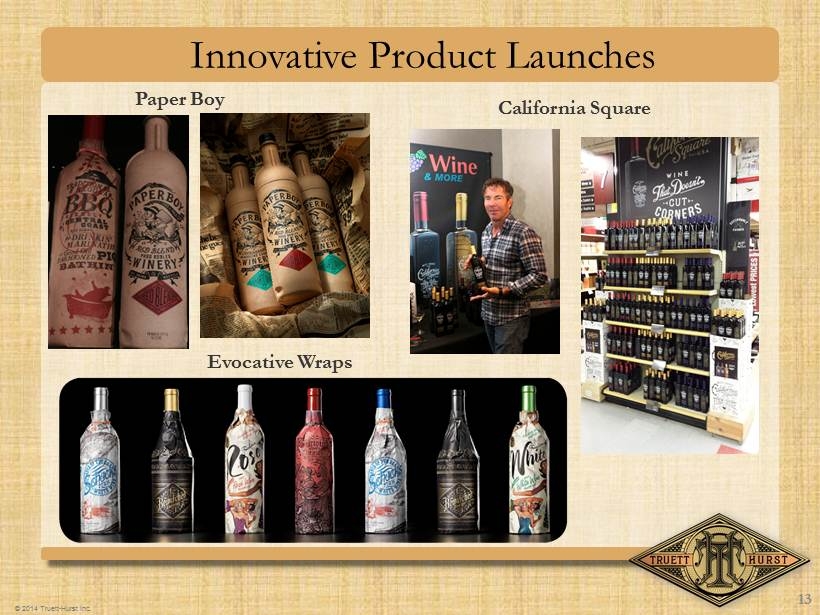
© 2014 Truett - Hurst Inc. Paper Boy California Square Evocative Wraps Innovative Product Launches 13
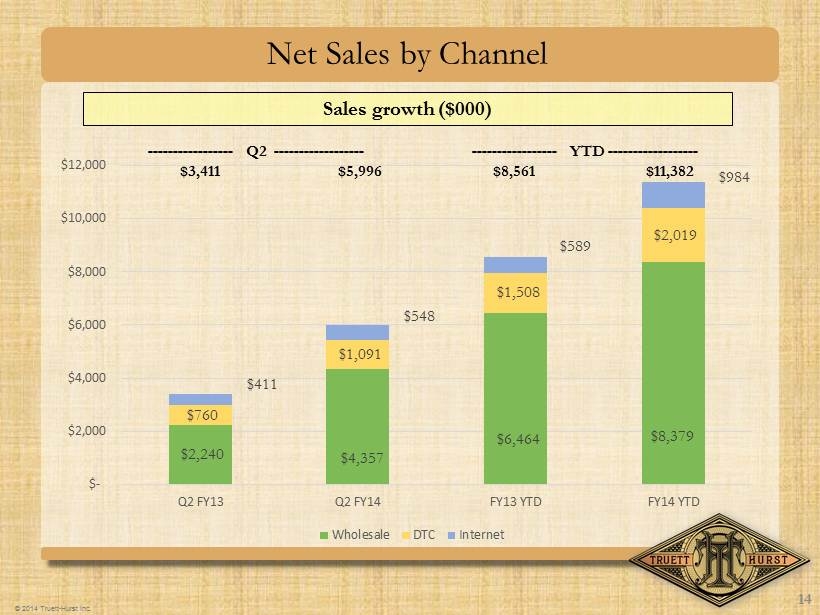
© 2014 Truett - Hurst Inc. Net Sales by Channel $2,240 $4,357 $6,464 $8,379 $760 $1,091 $1,508 $2,019 $411 $548 $589 $984 $- $2,000 $4,000 $6,000 $8,000 $10,000 $12,000 Q2 FY13 Q2 FY14 FY13 YTD FY14 YTD Wholesale DTC Internet ----------------- Q2 ------------------ ----------------- YTD ------------------ 14 $3,411 $8,561 $5,996 $11,382 Sales growth ($000)
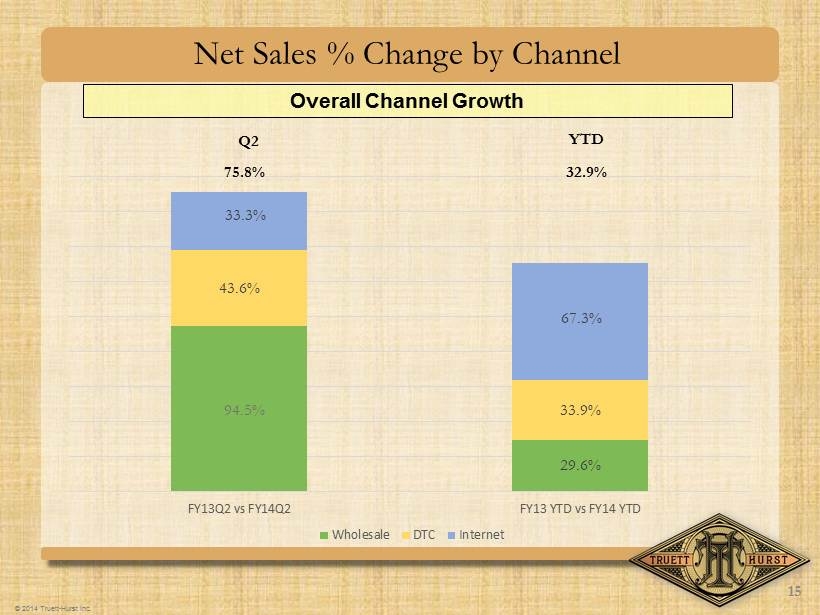
© 2014 Truett - Hurst Inc. Net Sales % Change by Channel 29.6% 43.6% 33.9% 33.3% 67.3% FY13Q2 vs FY14Q2 FY13 YTD vs FY14 YTD Wholesale DTC Internet 15 94.5% 75.8% Overall Channel Growth 32.9% Q2 YTD
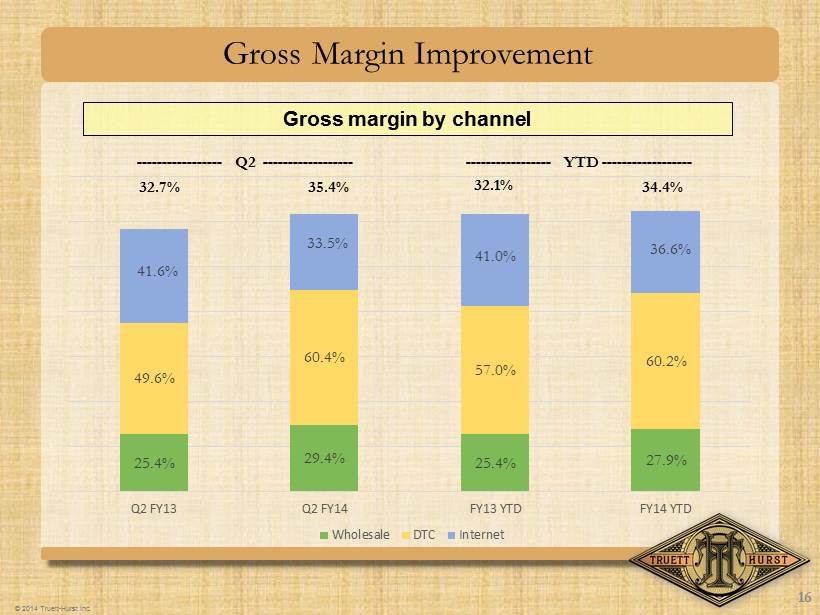
© 2014 Truett - Hurst Inc. Gross Margin Improvement 25.4% 29.4% 25.4% 27.9% 49.6% 60.4% 57.0% 60.2% 41.6% 33.5% 41.0% 36.6% Q2 FY13 Q2 FY14 FY13 YTD FY14 YTD Wholesale DTC Internet 16 32.1% 32.7% 34.4% 35.4% Gross margin by channel ----------------- Q2 ------------------ ----------------- YTD ------------------
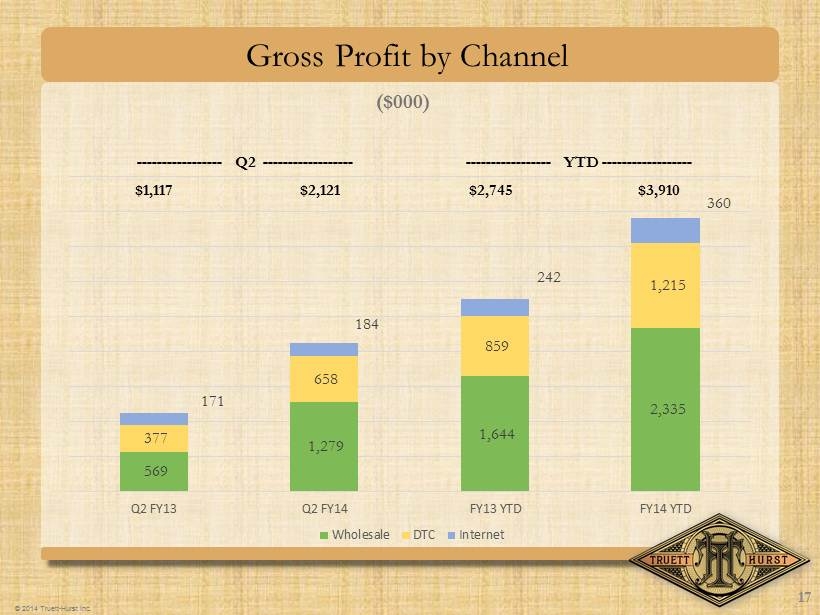
© 2014 Truett - Hurst Inc. Gross Profit by Channel 569 1,279 1,644 2,335 377 658 859 1,215 171 184 242 360 Q2 FY13 Q2 FY14 FY13 YTD FY14 YTD Wholesale DTC Internet 17 ----------------- Q2 ------------------ ----------------- YTD ------------------ $1,117 $2,121 $2,745 $3,910 ($000)
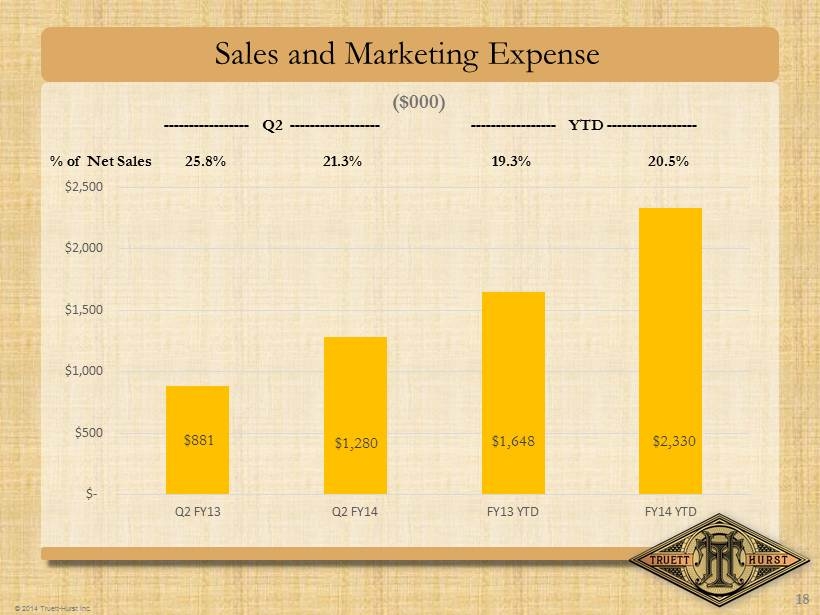
© 2014 Truett - Hurst Inc. Sales and Marketing Expense $881 $1,280 $1,648 $2,330 $- $500 $1,000 $1,500 $2,000 $2,500 Q2 FY13 Q2 FY14 FY13 YTD FY14 YTD 18 25.8% 19.3% 21.3% 20.5% ----------------- YTD ------------------ ----------------- Q2 ------------------ % of Net Sales ($000)

© 2014 Truett - Hurst Inc. General and Administrative Expense $746 $707 $1,105 $1,547 $- $200 $400 $600 $800 $1,000 $1,200 $1,400 $1,600 $1,800 Q2 FY13 Q2 FY14 FY13 YTD FY14 YTD 19 21.9% 12.9% 11.8% 13.6% ----------------- Q2 ------------------ ----------------- YTD ------------------ % of Net Sales ($000)
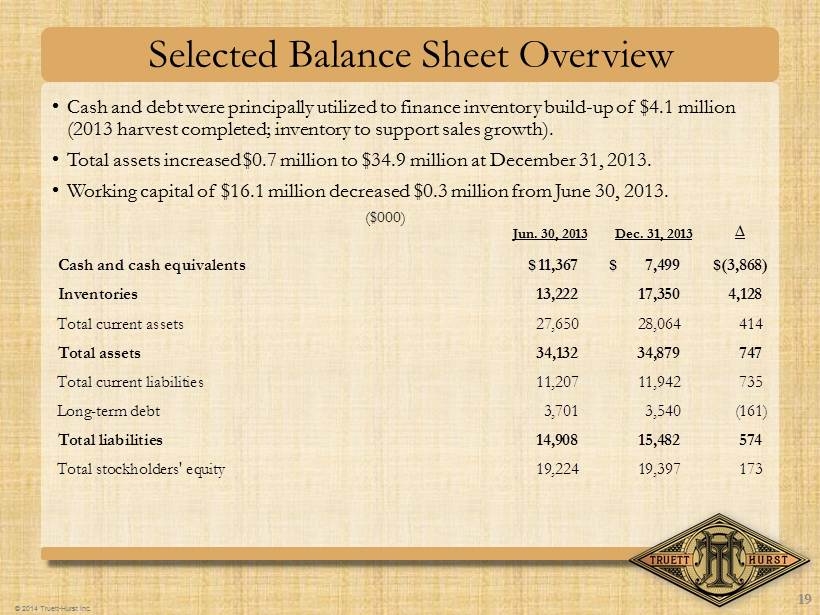
© 2014 Truett - Hurst Inc. Selected Balance Sheet Overview • Cash and debt were principally utilized to finance inventory build - up of $4.1 million (2013 harvest completed; inventory to support sales growth). • Total assets increased $0.7 million to $34.9 million at December 31, 2013. • Working capital of $16.1 million decreased $0.3 million from June 30, 2013. ($000) Jun. 30, 2013 Dec. 31, 2013 Cash and cash equivalents 11,367$ 7,499$ (3,868)$ Inventories 13,222 17,350 4,128 Total current assets 27,650 28,064 414 Total assets 34,132 34,879 747 Total current liabilities 11,207 11,942 735 Long-term debt 3,701 3,540 (161) Total liabilities 14,908 15,482 574 Total stockholders' equity 19,224 19,397 173 19 ∆
© 2014 Truett - Hurst Inc. Q&A 20
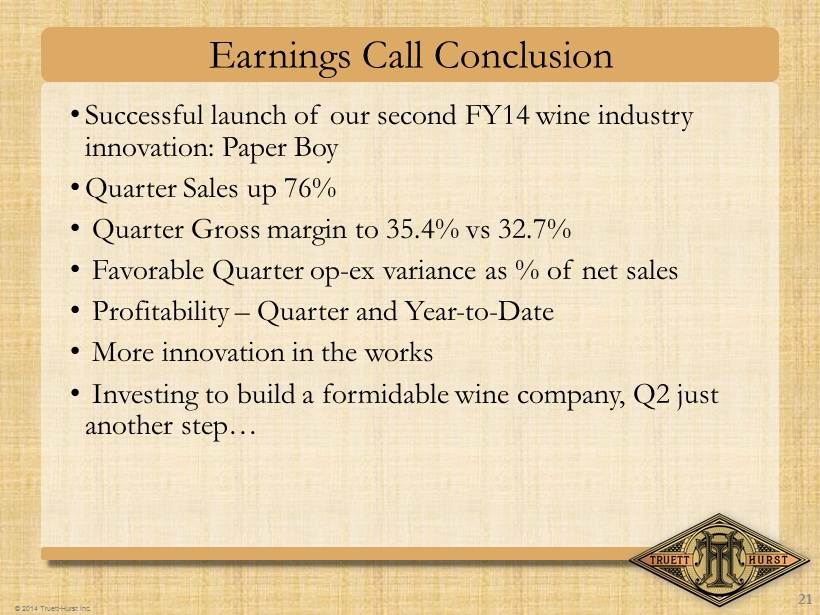
© 2014 Truett - Hurst Inc. Earnings Call Conclusion • Successful launch of our second FY14 wine industry innovation: Paper Boy • Quarter Sales up 76% • Quarter Gross margin to 35.4% vs 32.7% • Favorable Quarter op - ex variance as % of net sales • Profitability – Quarter and Year - to - Date • More innovation in the works • Investing to build a formidable wine company, Q2 just another step… 21
© 2014 Truett - Hurst Inc. APPENDIX 1. Contact Information 2. Conference Call Playback Information 3. Second Quarter’s Selected Statement of Operations 4. Six Months Selected Statement of Operations 5. Pro forma Basic and Diluted EPS & Market Cap – Quarter 6. Pro forma Basic and Diluted EPS & Market Cap – Six Months 22
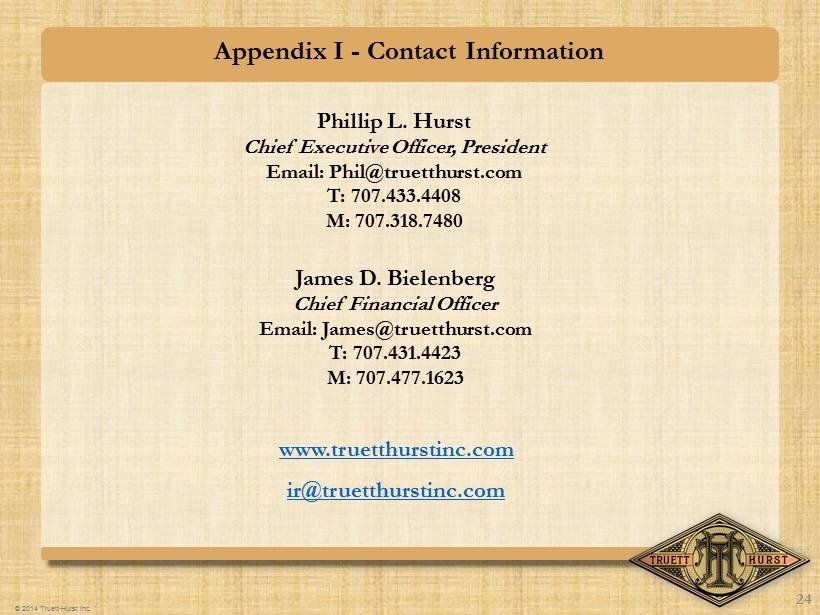
© 2014 Truett - Hurst Inc. Appendix I - Contact Information Phillip L. Hurst Chief Executive Officer, President Email: Phil@truetthurst.com T: 707.433.4408 M: 707.318.7480 James D. Bielenberg Chief Financial Officer Email: James@truetthurst.com T: 707.431.4423 M: 707.477.1623 www.truetthurstinc.com ir@truetthurstinc.com 24
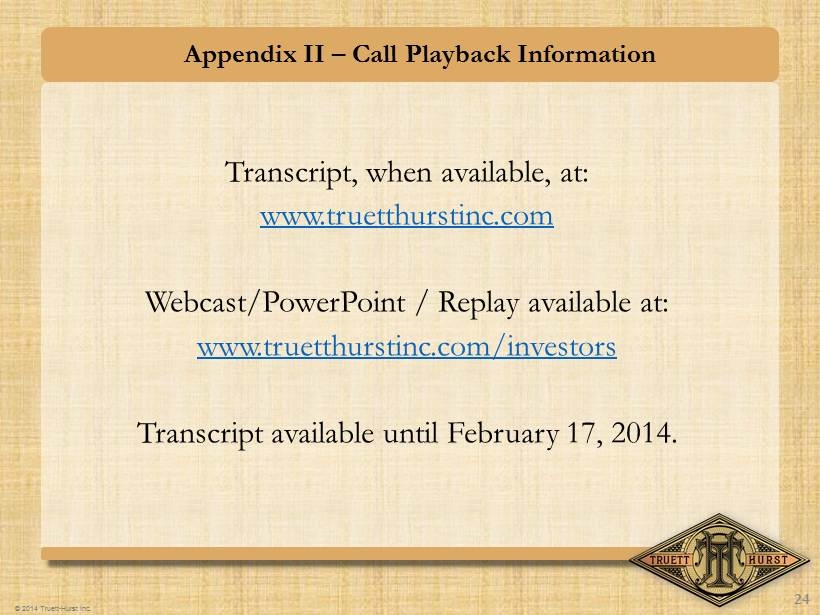
© 2014 Truett - Hurst Inc. Appendix II – Call Playback Information Transcript, when available, at: www.truetthurstinc.com Webcast/PowerPoint / Replay available at: www.truetthurstinc.com/investors Transcript available until February 17, 2014. 24
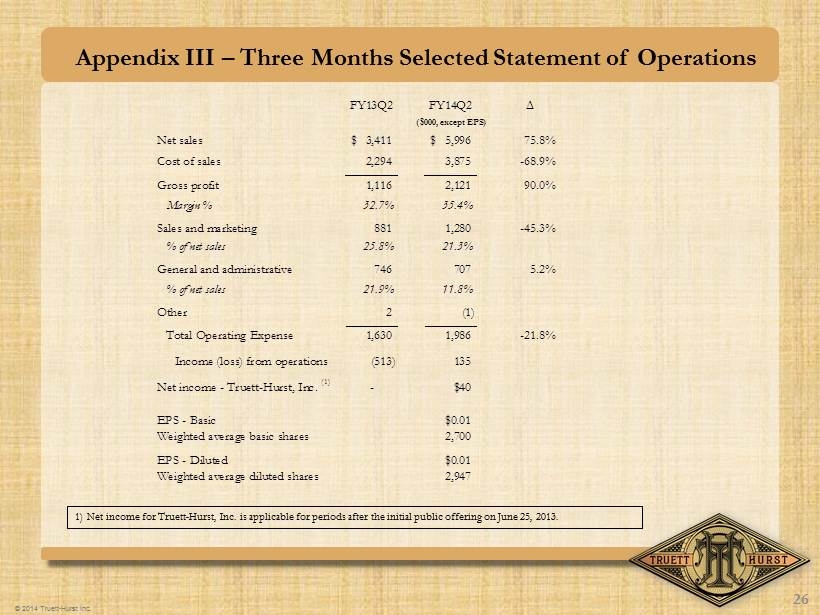
© 2014 Truett - Hurst Inc. Appendix III – Three Months Selected Statement of Operations FY13Q2 FY14Q2 ∆ Net sales 3,411$ 5,996$ 75.8% Cost of sales 2,294 3,875 -68.9% Gross profit 1,116 2,121 90.0% Margin % 32.7% 35.4% Sales and marketing 881 1,280 -45.3% % of net sales 25.8% 21.3% General and administrative 746 707 5.2% % of net sales 21.9% 11.8% Other 2 (1) Total Operating Expense 1,630 1,986 -21.8% Income (loss) from operations (513) 135 Net income - Truett-Hurst, Inc. (1) - $40 EPS - Basic $0.01 Weighted average basic shares 2,700 EPS - Diluted $0.01 Weighted average diluted shares 2,947 ($000, except EPS) 26 1) Net income for Truett - Hurst , Inc. is applicable for periods after the initial public offering on June 25, 2013.
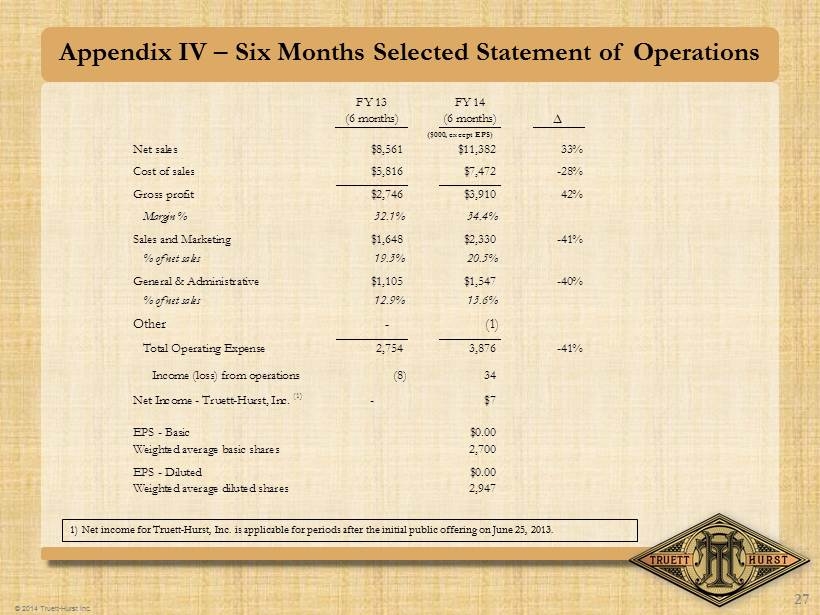
© 2014 Truett - Hurst Inc. Appendix IV – Six Months Selected Statement of Operations FY 13 (6 months) FY 14 (6 months) ∆ Net sales $8,561 $11,382 33% Cost of sales $5,816 $7,472 -28% Gross profit $2,746 $3,910 42% Margin % 32.1% 34.4% Sales and Marketing $1,648 $2,330 -41% % of net sales 19.3% 20.5% General & Administrative $1,105 $1,547 -40% % of net sales 12.9% 13.6% Other - (1) Total Operating Expense 2,754 3,876 -41% Income (loss) from operations (8) 34 Net Income - Truett-Hurst, Inc. (1) - $7 EPS - Basic $0.00 Weighted average basic shares 2,700 EPS - Diluted $0.00 Weighted average diluted shares 2,947 ($000, except EPS) 27 1) Net income for Truett - Hurst , Inc. is applicable for periods after the initial public offering on June 25, 2013.
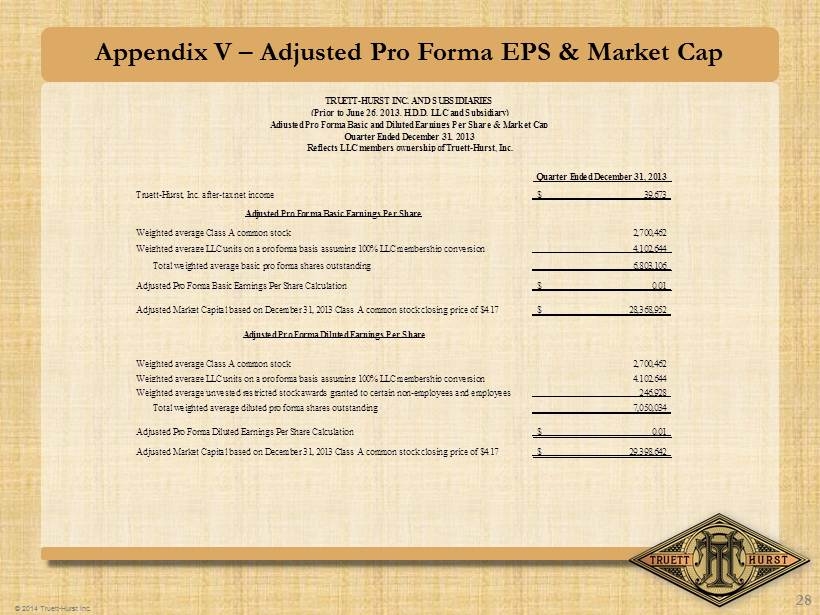
© 2014 Truett - Hurst Inc. Appendix V – Adjusted Pro Forma EPS & Market Cap 28 Quarter Ended December 31, 2013 Truett-Hurst, Inc. after-tax net income 39,673$ Adjusted Pro Forma Basic Earnings Per Share Weighted average Class A common stock 2,700,462 Weighted average LLC units on a pro forma basis assuming 100% LLC membership conversion 4,102,644 Total weighted average basic pro forma shares outstanding 6,803,106 Adjusted Pro Forma Basic Earnings Per Share Calculation 0.01$ Adjusted Market Capital based on December 31, 2013 Class A common stock closing price of $4.17 28,368,952$ Adjusted Pro Forma Diluted Earnings Per Share Weighted average Class A common stock 2,700,462 Weighted average LLC units on a pro forma basis assuming 100% LLC membership conversion 4,102,644 Weighted average unvested restricted stock awards granted to certain non-employees and employees 246,928 Total weighted average diluted pro forma shares outstanding 7,050,034 Adjusted Pro Forma Diluted Earnings Per Share Calculation 0.01$ Adjusted Market Capital based on December 31, 2013 Class A common stock closing price of $4.17 29,398,642$ TRUETT-HURST INC. AND SUBSIDIARIES (Prior to June 26, 2013, H.D.D. LLC and Subsidiary) Adjusted Pro Forma Basic and Diluted Earnings Per Share & Market Cap Quarter Ended December 31, 2013 Reflects LLC members ownership of Truett-Hurst, Inc.
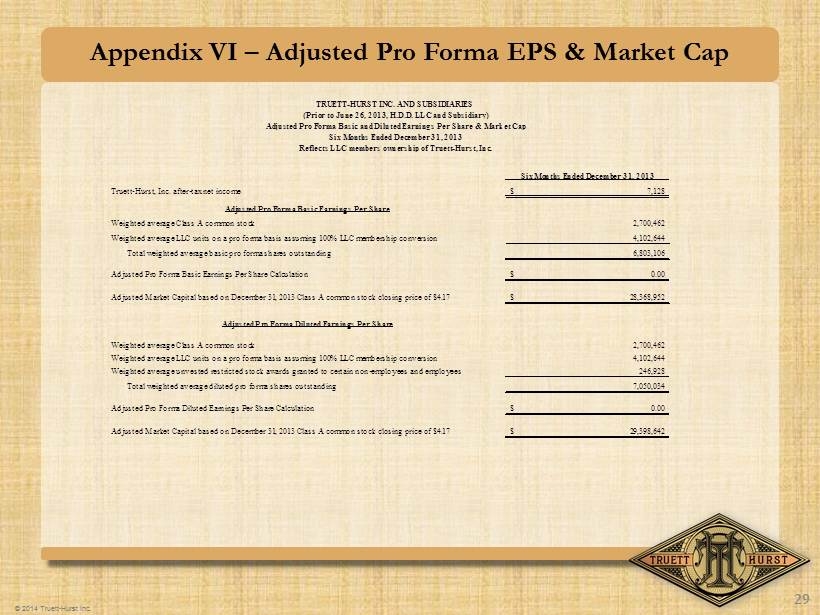
© 2014 Truett - Hurst Inc. Appendix VI – Adjusted Pro Forma EPS & Market Cap 29 Six Months Ended December 31, 2013 Truett-Hurst, Inc. after-tax net income 7,128$ Adjusted Pro Forma Basic Earnings Per Share Weighted average Class A common stock 2,700,462 Weighted average LLC units on a pro forma basis assuming 100% LLC membership conversion 4,102,644 Total weighted average basic pro forma shares outstanding 6,803,106 Adjusted Pro Forma Basic Earnings Per Share Calculation 0.00$ Adjusted Market Capital based on December 31, 2013 Class A common stock closing price of $4.17 28,368,952$ Adjusted Pro Forma Diluted Earnings Per Share Weighted average Class A common stock 2,700,462 Weighted average LLC units on a pro forma basis assuming 100% LLC membership conversion 4,102,644 Weighted average unvested restricted stock awards granted to certain non-employees and employees 246,928 Total weighted average diluted pro forma shares outstanding 7,050,034 Adjusted Pro Forma Diluted Earnings Per Share Calculation 0.00$ Adjusted Market Capital based on December 31, 2013 Class A common stock closing price of $4.17 29,398,642$ TRUETT-HURST INC. AND SUBSIDIARIES (Prior to June 26, 2013, H.D.D. LLC and Subsidiary) Adjusted Pro Forma Basic and Diluted Earnings Per Share & Market Cap Six Months Ended December 31, 2013 Reflects LLC members ownership of Truett-Hurst, Inc.