Exhibit 99.1
Pinnacle Foods Presentation to CAGNY
March 24, 2016
Forward-Looking Statements
& Non-GAAP Financial Measures
This presentation contains _forward-looking statements_ within the meaning of U.S. federal securities laws. Forward-looking statements are not historical facts, and are based upon management_s current expectations, beliefs, projections and targets, many of which, by their nature, are inherently uncertain. Such expectations, beliefs, projections and targets are expressed in good faith. However, there can be no assurance that management_s expectations, beliefs, projections and targets will be achieved and actual results may differ materially from what is expressed in or indicated by the forward- looking statements. Forward-looking statements are subject to significant business, economic, regulatory and competitive risks and uncertainties that could cause actual performance or results to differ materially from those expressed in the forward-looking statements, including risks detailed in Pinnacle Foods Inc._s (_Pinnacle Foods, Pinnacle_ or the _Company_) filings with the U.S. Securities and Exchange Commission (the _SEC_). Nothing in this presentation should be regarded as a representation by any person that these forward-looking statements will be achieved.
Forward-looking statements speak only as of the date the statements are made. The Company assumes no obligation to update forward-looking statements to reflect actual results, subsequent events or circumstances or other changes affecting forward-looking information except to the extent required by applicable securities laws.
This presentation includes certain financial measures, including Adjusted Gross Profit and Unleveraged Free Cash Flow, which differ from results using U.S. Generally Accepted Accounting Principles (GAAP). Non-GAAP financial measures typically exclude certain charges, which are not expected to occur routinely in future periods. The Company uses non-GAAP financial measures internally to focus management on performance excluding these special charges to gauge our business operating performance. Management believes this information is helpful to investors in understanding trends in the business. The most directly comparable GAAP financial measures and reconciliations to non-GAAP financial measures are set forth in the slides in this presentation and included in the Company_s filings with the SEC.
2
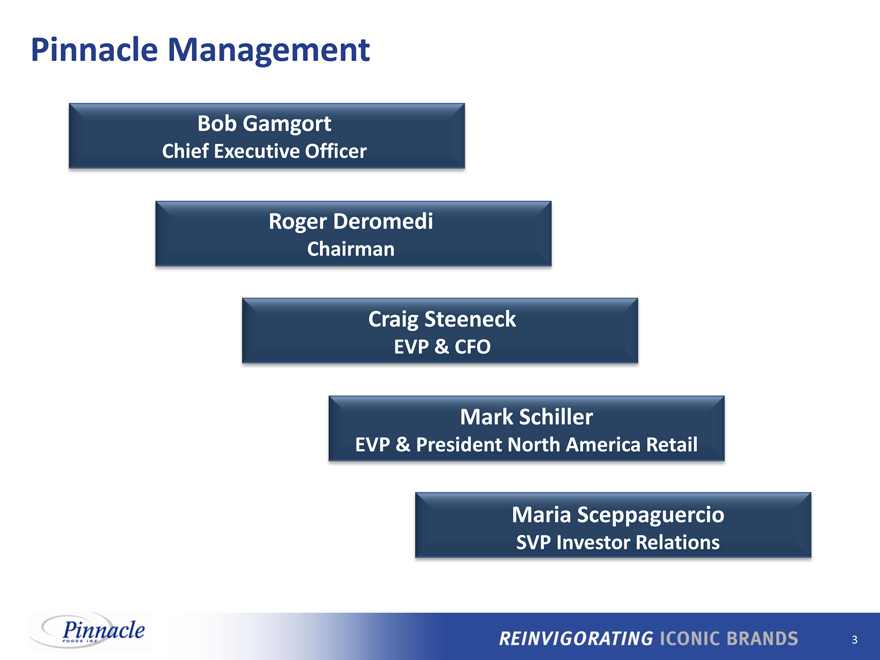
Pinnacle Management
Bob Gamgort
Chief Executive Officer
Roger Deromedi
Chairman
Craig Steeneck
EVP & CFO
Mark Schiller
EVP & President North America Retail
Maria Sceppaguercio
SVP Investor Relations
3
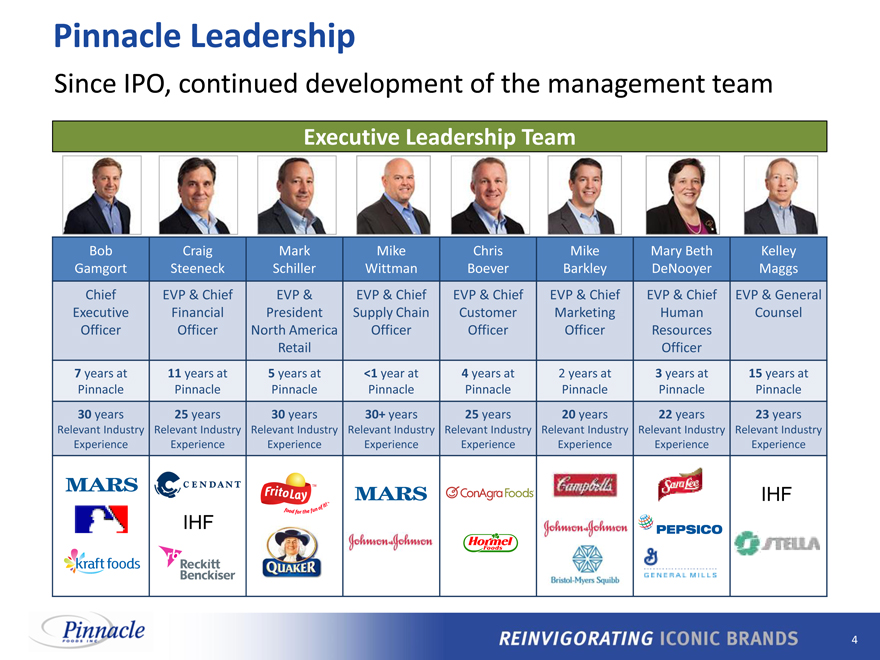
Pinnacle Leadership
Since IPO, continued development of the management team
Executive Leadership Team
Bob Craig Mark Mike Chris Mike Mary Beth Kelley
Gamgort Steeneck Schiller Wittman Boever Barkley DeNooyer Maggs
Chief EVP & Chief EVP & EVP & Chief EVP & Chief EVP & Chief EVP & Chief EVP & General
Executive Financial President Supply Chain Customer Marketing Human Counsel
Officer Officer North America Officer Officer Officer Resources
Retail Officer
7 years at 11 years at 5 years at <1 year at 4 years at 2 years at 3 years at 15 years at
Pinnacle Pinnacle Pinnacle Pinnacle Pinnacle Pinnacle Pinnacle Pinnacle
30 years 25 years 30 years 30+ years 25 years 20 years 22 years 23 years
Relevant Industry Relevant Industry Relevant Industry Relevant Industry Relevant Industry Relevant Industry Relevant Industry Relevant Industry
Experience Experience Experience Experience Experience Experience Experience Experience
IHF
IHF
4
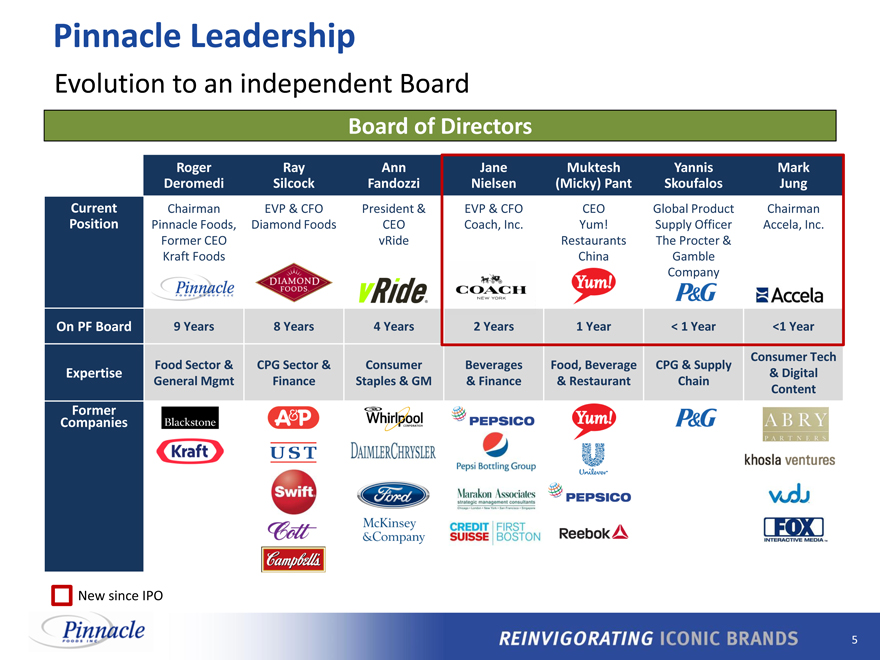
Pinnacle Leadership
Evolution to an independent Board
Board of Directors
Roger Ray Ann Jane Muktesh Yannis Mark
Deromedi Silcock Fandozzi Nielsen(Micky) Pant Skoufalos Jung
Current Chairman EVP & CFO President & EVP & CFO CEO Global Product Chairman
Position Pinnacle Foods, Diamond Foods CEO Coach, Inc. Yum! Supply Officer Accela, Inc.
Former CEO vRide Restaurants The Procter &
Kraft Foods China Gamble
Company
On PF Board 9 Years 8 Years 4 Years 2 Years 1 Year < 1 Year <1 Year
Consumer Tech
Food Sector & CPG Sector & Consumer Beverages Food, Beverage CPG & Supply
Expertise & Digital
General Mgmt Finance Staples & GM & Finance & Restaurant Chain
Content
Former
Companies
New since IPO
5
Agenda
Overview
How We Create Value
Executing Our Playbook Expanding Our Business Evolving Our Portfolio Focus
Financial Update
6
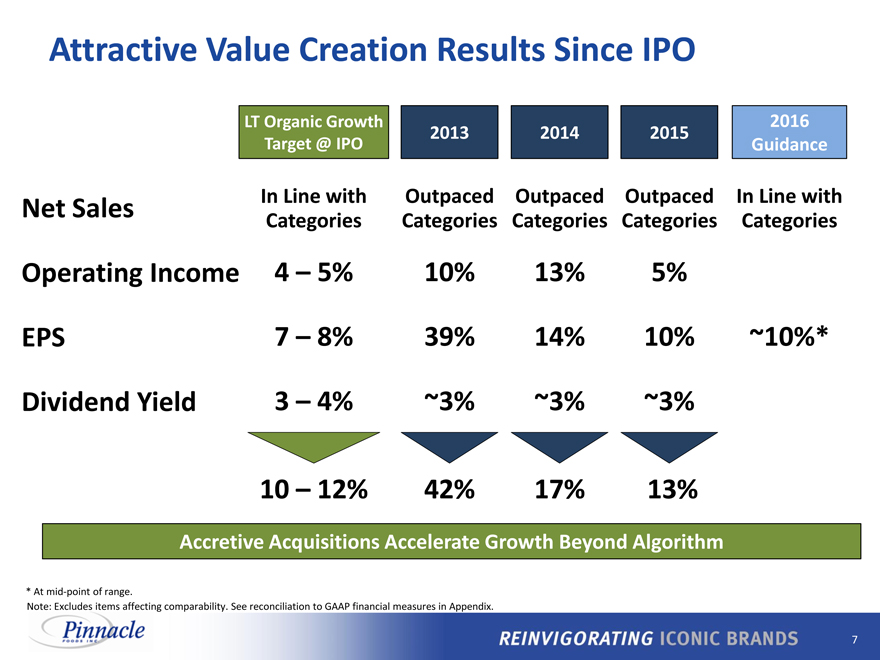
Attractive Value Creation Results Since IPO
LT Organic Growth 2016
2013 2014 2015
Target @ IPO Guidance
Net Sales In Line with Outpaced Outpaced Outpaced In Line with
Categories Categories Categories Categories Categories
Operating Income 4 _ 5% 10% 13% 5% X%
EPS 7 _ 8% 39% 14% 10% ~10%*
Dividend Yield 3 _ 4% ~3% ~3% ~3% ~X%
10 _ 12% 42% 17% 13%
Accretive Acquisitions Accelerate Growth Beyond Algorithm
* At mid-point of range.
Note: Excludes items affecting comparability. See reconciliation to GAAP financial measures in Appendix.
7
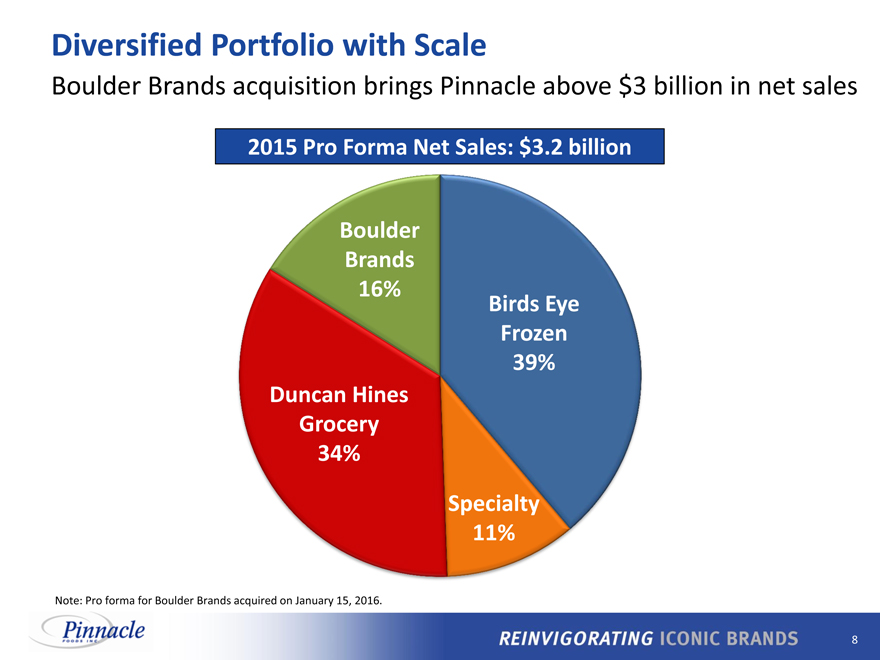
Diversified Portfolio with Scale
Boulder Brands acquisition brings Pinnacle above $3 billion in net sales
2015 Pro Forma Net Sales: $3.2 billion
Boulder
Brands
16%
Birds Eye
Frozen
39%
Duncan Hines
Grocery
34%
Specialty
11%
Note: Pro forma for Boulder Brands acquired on January 15, 2016.
8
Agenda
Overview
How We Create Value
Executing Our Playbook Expanding Our Business Evolving Our Portfolio Focus
Financial Update
9
Executing Our Playbook
Invest differentially in brands using
Portfolio Management Strategy
Deliver industry-leading efficiency
Generate exceptional cash flow
10
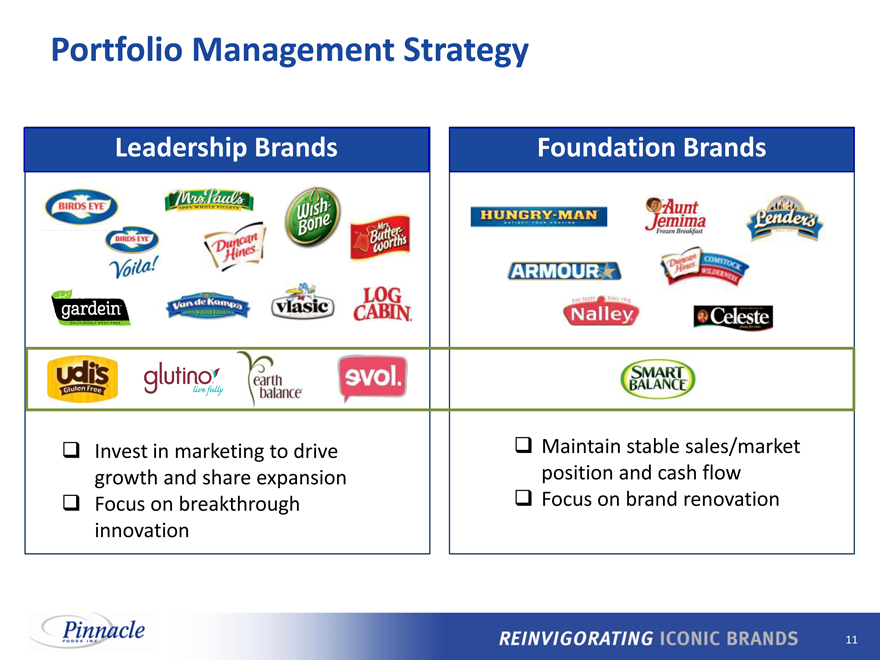
Portfolio Management Strategy
Leadership Brands Foundation Brands
Invest in marketing to drive Maintain stable sales/market
growth and share expansion position and cash flow
Focus on breakthrough Focus on brand renovation
innovation
11
Consistent Market Share Growth
Composite share growth driven by Leadership Brands
Composite $ Market Share vs. Year Ago
2012 2013 2014 2015 2016 YTD
Change +0.1 pts. +0.3 pts. +0.2 pts. +0.5 pts. +0.9 pts.
Leadership Brands
Pinnacle Growing/
Market Holding
Category Position Share
Frozen Vegetables #1
Frozen Complete Bagged Meals #1
Frozen Prepared Seafood #2
Frozen Meat Substitutes #2
Shelf-Stable Pickles #1
Table Syrups #1
Cake/Brownie Mixes and Frostings #2
Shelf-Stable Salad Dressings #3
Source: IRI US Multi-Outlet data, based on IRI_s Pinnacle custom definitions; market position ranks are among branded players.
12
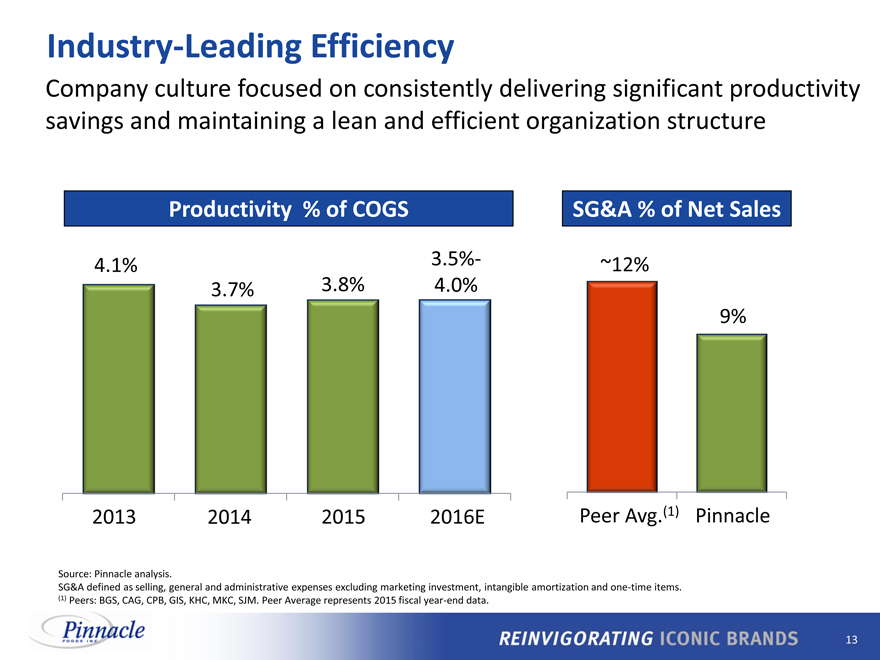
Industry-Leading Efficiency
Company culture focused on consistently delivering significant productivity
savings and maintaining a lean and efficient organization structure
Productivity% of COGS SG&A % of Net Sales
4.1% 3.5%- ~12%
3.7% 3.8% 4.0%
9%
2013
2014
2015
2016E
Peer Avg.(1) Pinnacle
Source: Pinnacle analysis.
SG&A defined as selling, general and administrative expenses excluding marketing investment, intangible amortization and one-time items. (1) Peers: BGS, CAG, CPB, GIS, KHC, MKC, SJM. Peer Average represents 2015 fiscal year-end data.
13
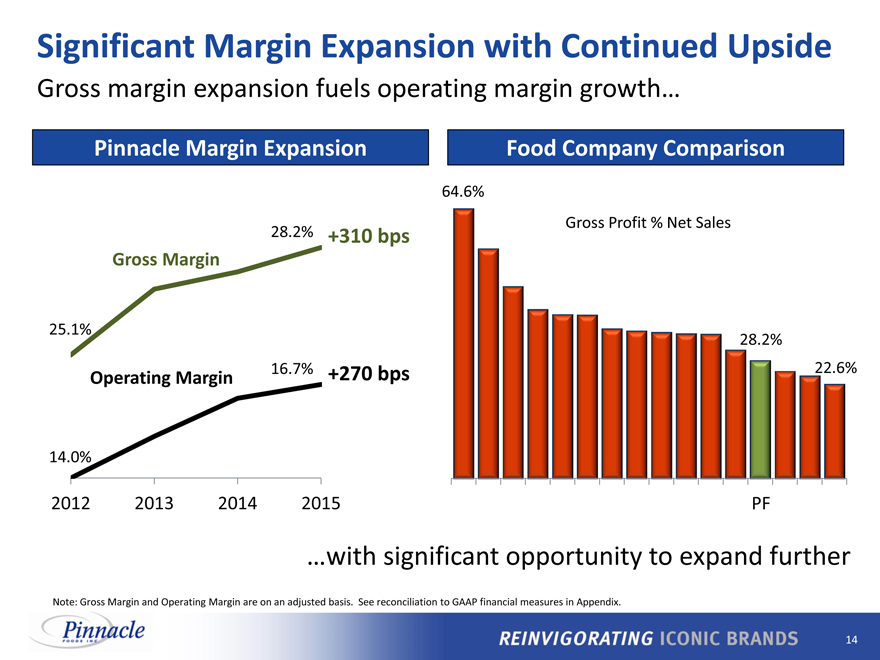
Significant Margin Expansion with Continued Upside
Gross margin expansion fuels operating margin growth
Pinnacle Margin Expansion Food Company Comparison
64.6%
Gross Profit % Net Sales
28.2% +310 bps
Gross Margin
25.1%
28.2%
Operating Margin 16.7% +270 bps 22.6%
14.0%
2012 2013 2014 2015 PF
with significant opportunity to expand further
Note: Gross Margin and Operating Margin are on an adjusted basis. See reconciliation to GAAP financial measures in Appendix.
14
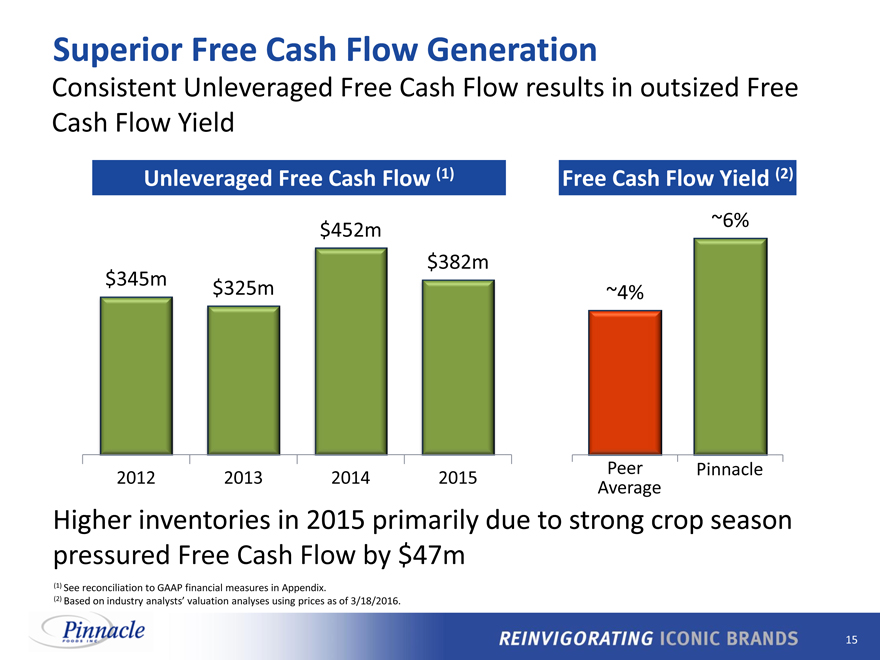
Superior Free Cash Flow Generation
Consistent Unleveraged Free Cash Flow results in outsized Free Cash Flow Yield
Unleveraged Free Cash Flow (1) Free Cash Flow Yield (2)
~6% $452m $345m $382m $325m ~4%
Peer Pinnacle 2012 2013 2014 2015 Average
Higher inventories in 2015 primarily due to strong crop season pressured Free Cash Flow by $47m
See reconciliation to GAAP financial measures in Appendix.
Based on industry analysts_ valuation analyses using prices as of 3/18/2016.
15
Expanding Our Business
16
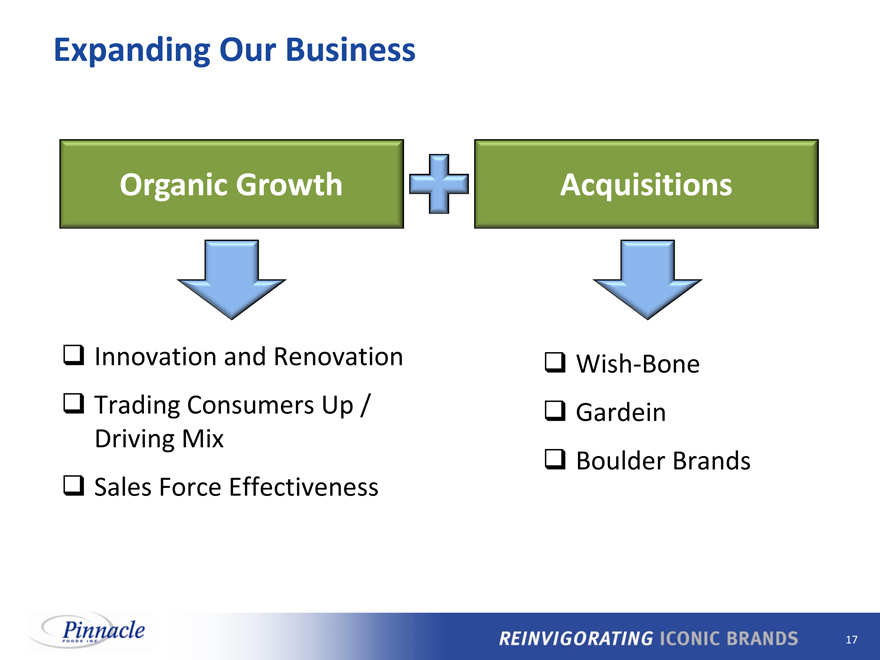
Expanding Our Business
Organic Growth
Acquisitions
Innovation and Renovation Wish-Bone
Trading Consumers Up / Gardein
Driving Mix
Boulder Brands
Sales Force Effectiveness
17
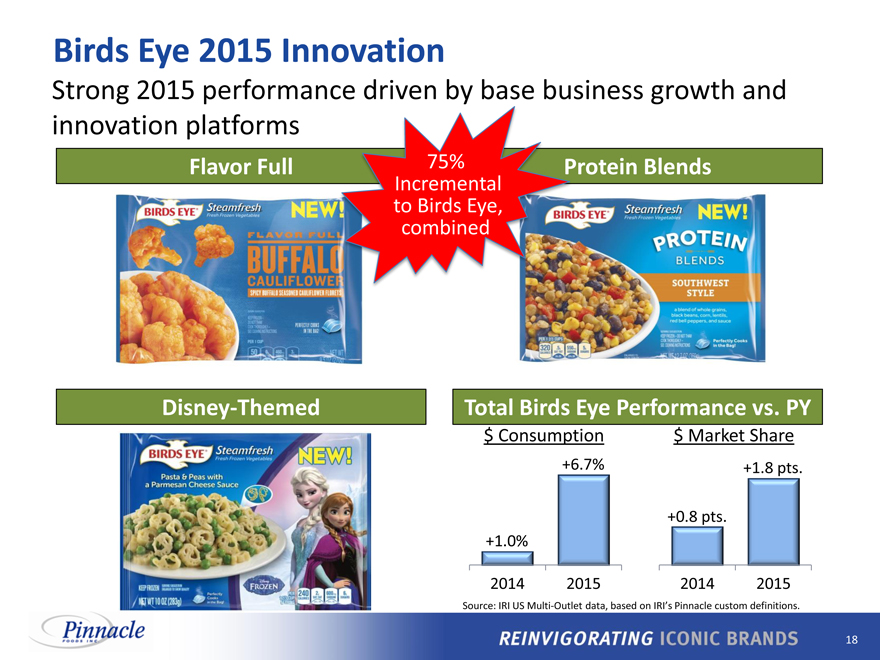
Birds Eye 2015 Innovation
Strong 2015 performance driven by base business growth and innovation platforms
Flavor Full 75% Protein Blends
Incremental
to Birds Eye,
combined
Disney-Themed Total Birds Eye Performance vs. PY
$ Consumption $ Market Share
+6.7% +1.8 pts.
+0.8 pts.
+1.0%
2014 2015 2014 2015
Source: IRI US Multi-Outlet data, based on IRI_s Pinnacle custom definitions.
18
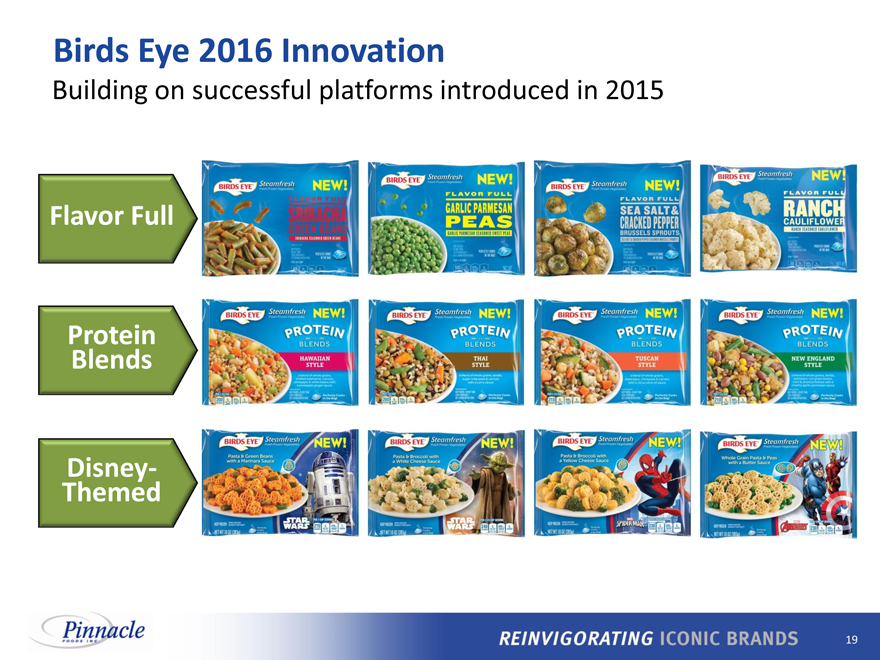
Birds Eye 2016 Innovation
Building on successful platforms introduced in 2015
Flavor Full
Protein
Blends
Disney-
Themed
19
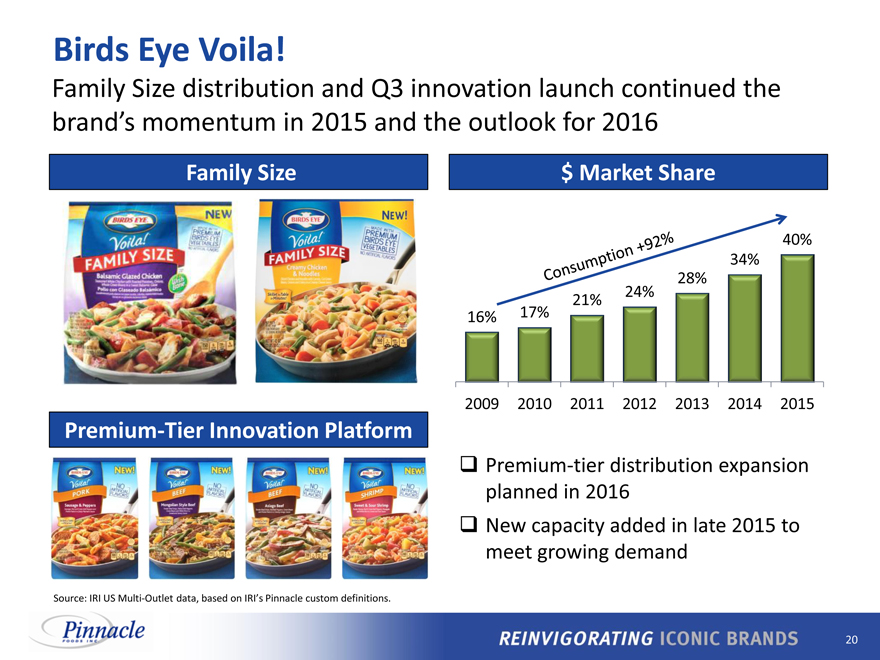
Birds Eye Voila!
Family Size distribution and Q3 innovation launch continued the brand_s momentum in 2015 and the outlook for 2016
Family Size $ Market Share
40%
34%
28%
21% 24%
16% 17%
2009 2010 2011 2012 2013 2014 2015
Premium-Tier Innovation Platform
Premium-tier distribution expansion
planned in 2016
New capacity added in late 2015 to
meet growing demand
Source: IRI US Multi-Outlet data, based on IRI_s Pinnacle custom definitions.
20
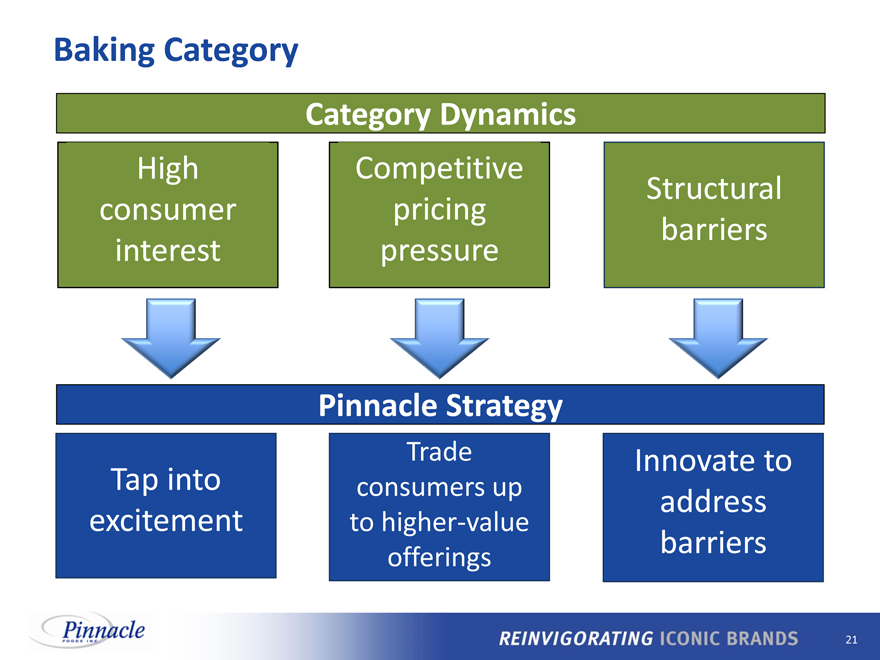
Baking Category
Category Dynamics
High Competitive
Structural
consumer pricing
barriers
interest pressure
Pinnacle Strategy
Trade Innovate to
Tap into consumers up address
excitement to higher-value
offerings barriers
21
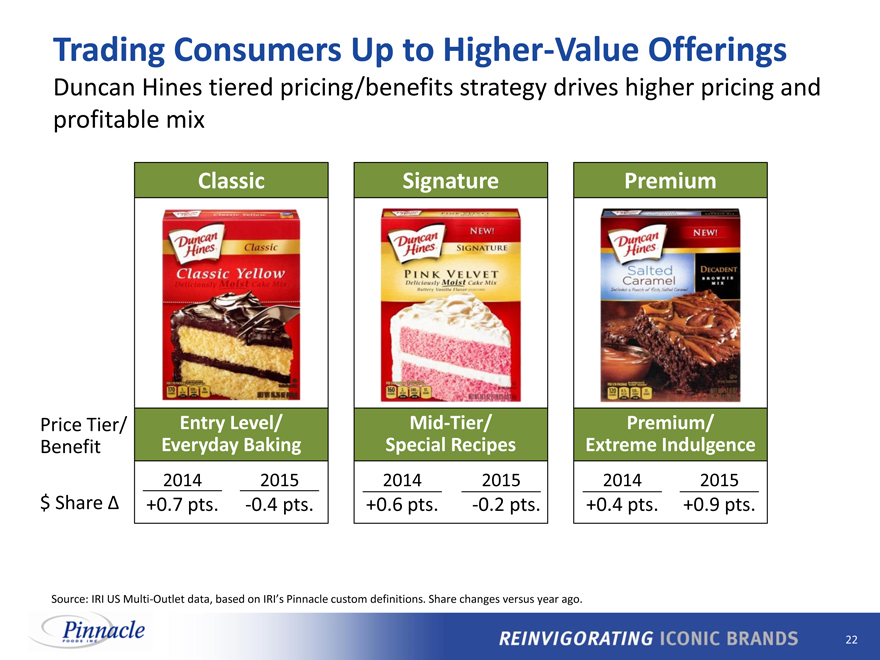
Trading Consumers Up to Higher-Value Offerings
Duncan Hines tiered pricing/benefits strategy drives higher pricing and profitable mix
Price Tier/ Entry Level/ Mid-Tier/ Premium/
Benefit Everyday Baking Special Recipes Extreme Indulgence
2014 2015 2014 2015 2014 2015
$ Share +0.7 pts. -0.4 pts. +0.6 pts. +-0.2 pts. +0.4 pts. +0.9 pts.
Source: IRI US Multi-Outlet data, based on IRI_s Pinnacle custom definitions. Share changes versus year ago.
22
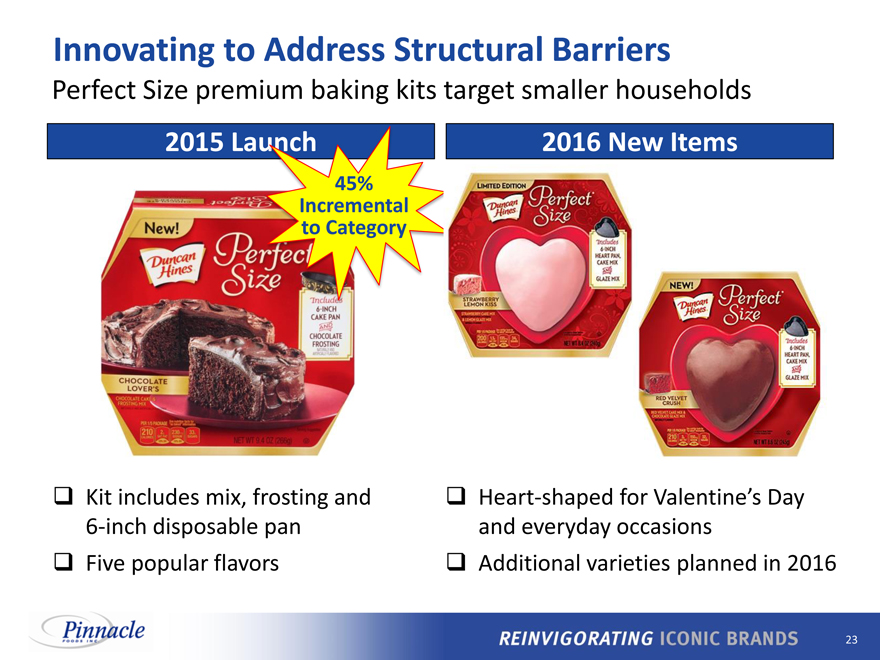
Innovating to Address Structural Barriers
Perfect Size premium baking kits target smaller households
2015 2016 New Items
45%
Incremental
to Category
Kit includes mix, frosting and Heart-shaped for Valentine_s Day
6-inch disposable pan and everyday occasions
Five popular flavors Additional varieties planned in 2016
23
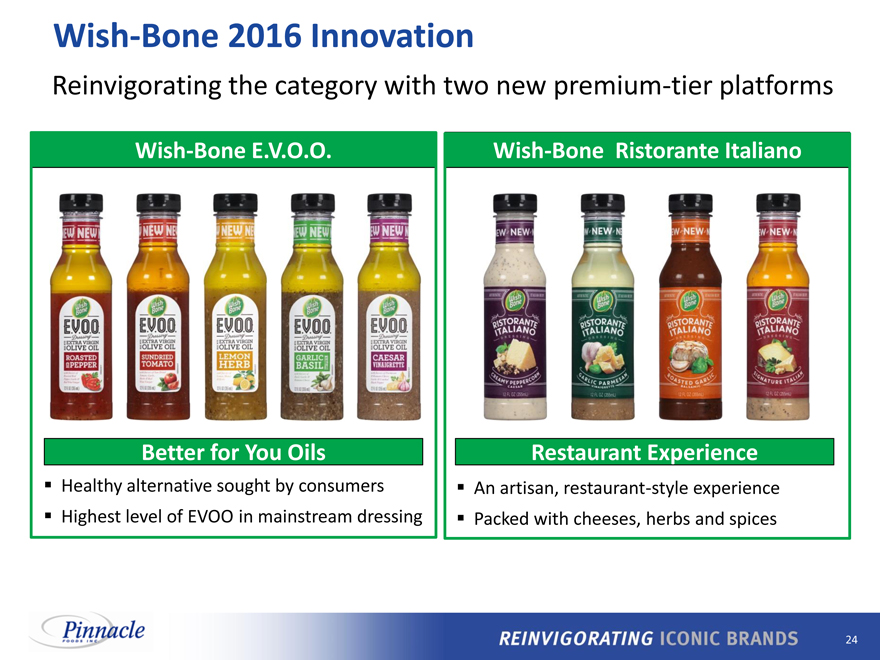
Wish-Bone 2016 Innovation
Reinvigorating the category with two new premium-tier platforms
Wish-Bone E.V.O.O. Wish-Bone Ristorante Italiano
Better for You Oils Restaurant Experience
Healthy alternative sought by consumers An artisan, restaurant-style experience
Highest level of EVOO in mainstream dressing Packed with cheeses, herbs and spices
24
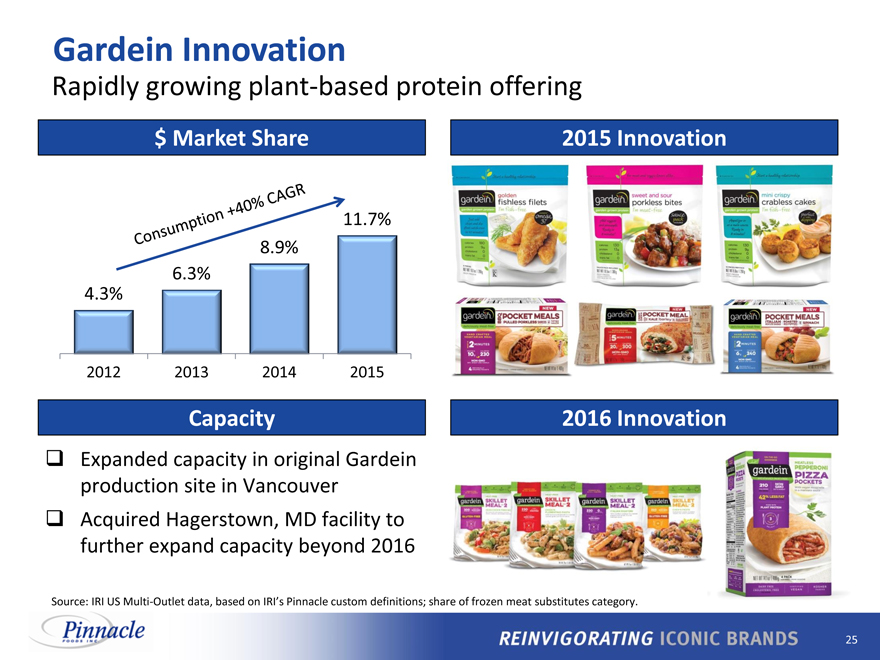
Gardein Innovation
Rapidly growing plant-based protein offering
$ Market Share 2015 Innovation
11.7%
8.9%
6.3%
4.3%
2012 2013 2014 2015
Capacity 2016 Innovation
Expanded capacity in original Gardein production site in Vancouver
Acquired Hagerstown, MD facility to further expand capacity beyond 2016
Source: IRI US Multi-Outlet data, based on IRI_s Pinnacle custom definitions; share of frozen meat substitutes category.
25
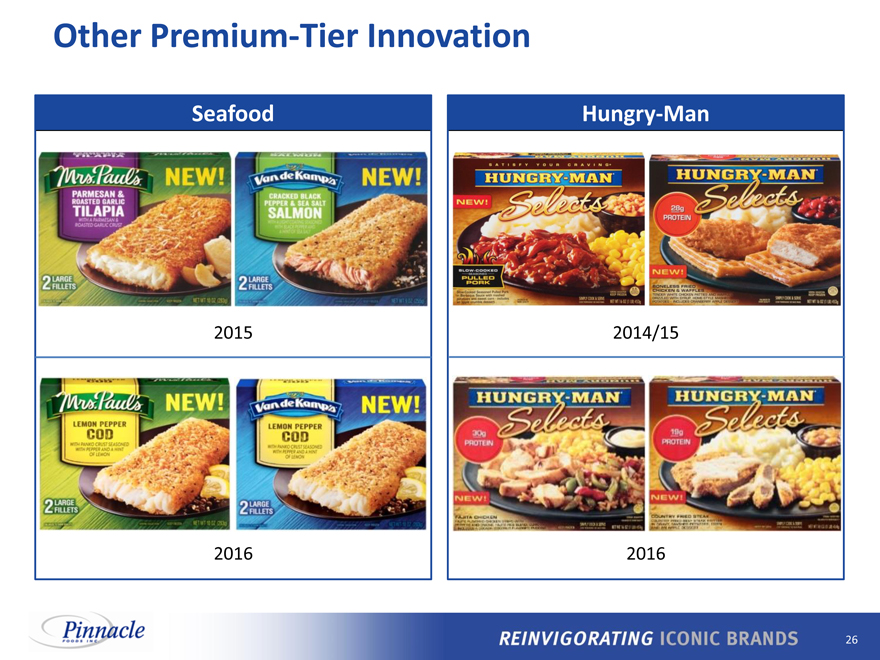
Other Premium-Tier Innovation
Seafood Hungry-Man
2015 2014/15
2016 2016
26
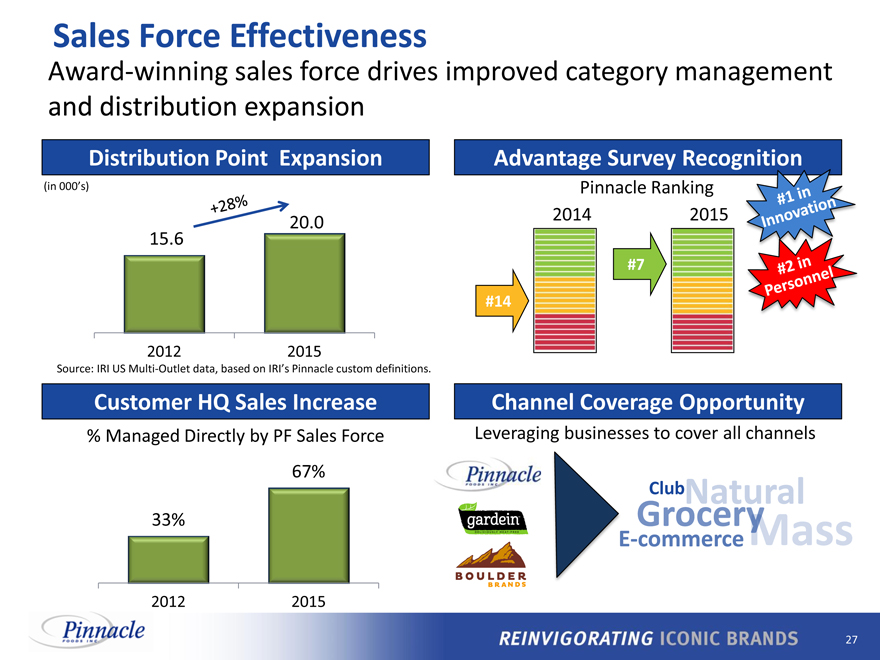
Sales Force Effectiveness
Award-winning sales force drives improved category management
and distribution expansion
Distribution Point Expansion Advantage Survey Recognition
(in 000_s) Pinnacle Ranking
20.0 2014 2015
15.6
#7
#14
2012 2015
Source: IRI US Multi-Outlet data, based on IRI_s Pinnacle custom definitions.
Customer HQ Sales Increase Channel Coverage Opportunity
% Managed Directly by PF Sales Force Leveraging businesses to cover all channels
67%
Club
33%
2012 2015
27
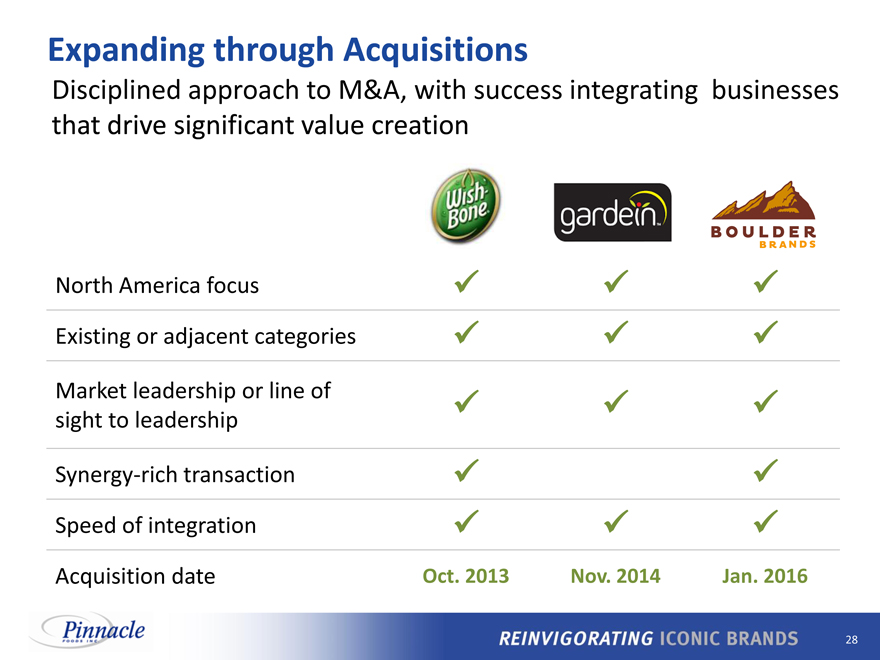
Expanding through Acquisitions
Disciplined approach to M&A, with success integrating businesses
that drive significant value creation
North America focus
Existing or adjacent categories
Market leadership or line of
sight to leadership
Synergy-rich transaction
Speed of integration
Acquisition date Oct. 2013 Nov. 2014 Jan. 2016
28
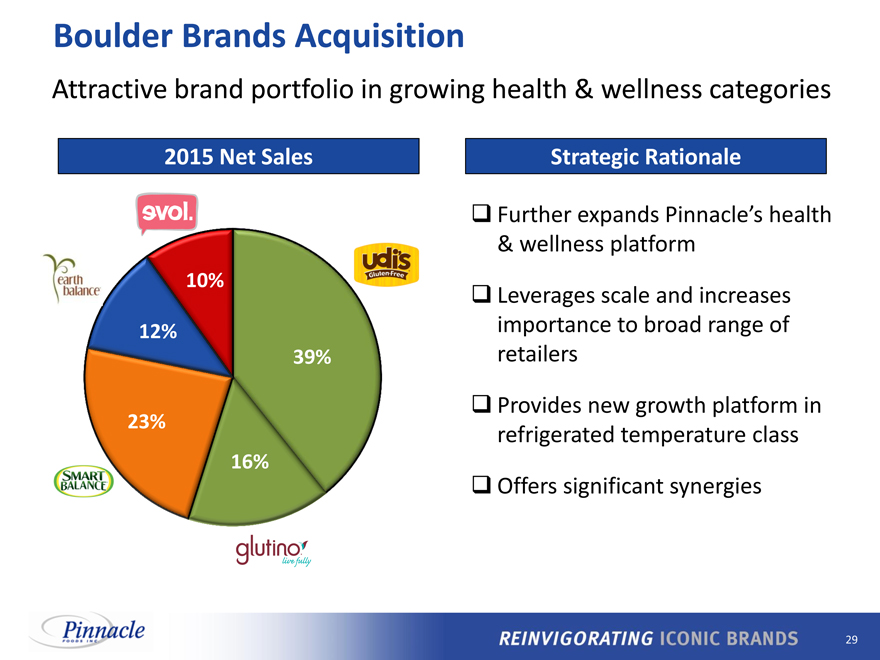
Boulder Brands Acquisition
Attractive brand portfolio in growing health & wellness categories
2015 Net Sales Strategic Rationale
Further expands Pinnacle_s health
& wellness platform
10% Leverages scale and increases
12% importance to broad range of
39% retailers
Provides new growth platform in
23% refrigerated temperature class
16%
Offers significant synergies
29
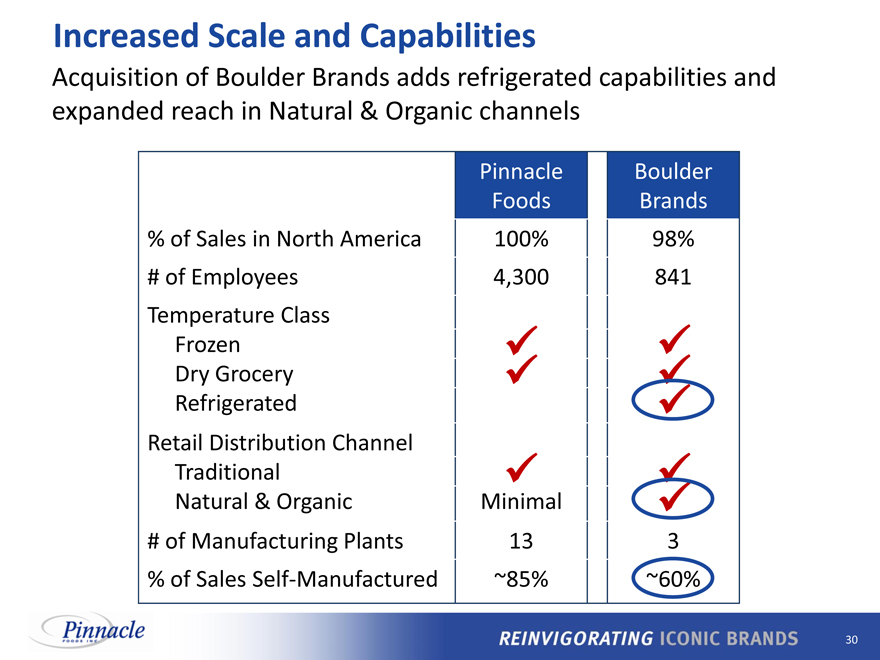
Increased Scale and Capabilities
Acquisition of Boulder Brands adds refrigerated capabilities and expanded reach in Natural & Organic channels
Pinnacle Boulder
Foods Brands
% of Sales in North America 100% 98%
# of Employees 4,300 841
Temperature Class
Frozen
Dry Grocery
Refrigerated
Retail Distribution Channel
Traditional
Natural & Organic Minimal
# of Manufacturing Plants 13 3
% of Sales Self-Manufactured ~85% ~60%
30
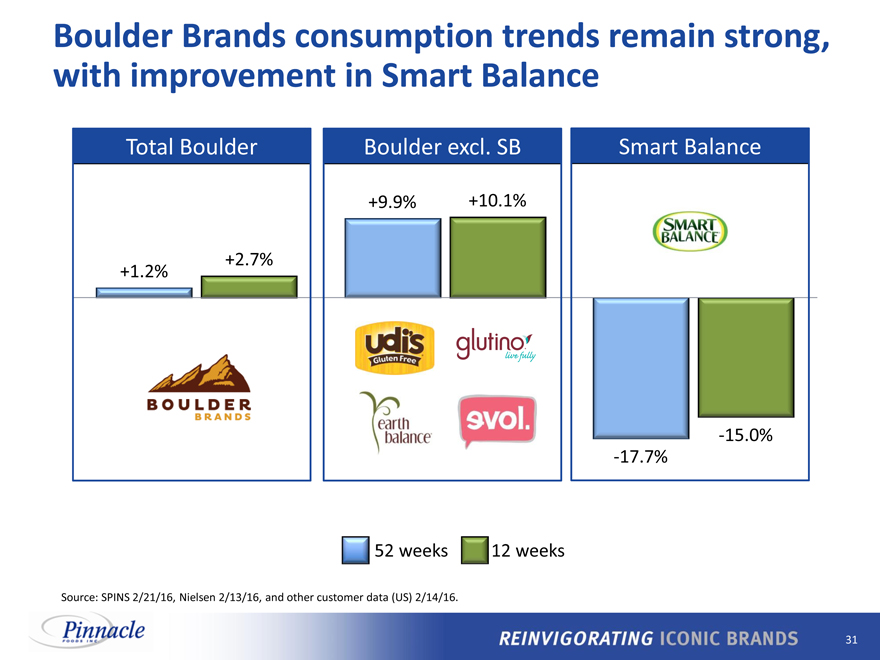
Boulder Brands consumption trends remain strong, with improvement in Smart Balance
Total Boulder Boulder excl. SB Smart Balance
+9.9% +10.1%
+2.7%
+1.2%
-15.0%
-17.7%
52 weeks 12 weeks
Source: SPINS 2/21/16, Nielsen 2/13/16, and other customer data (US) 2/14/16.
31
Evolving Our Portfolio
32
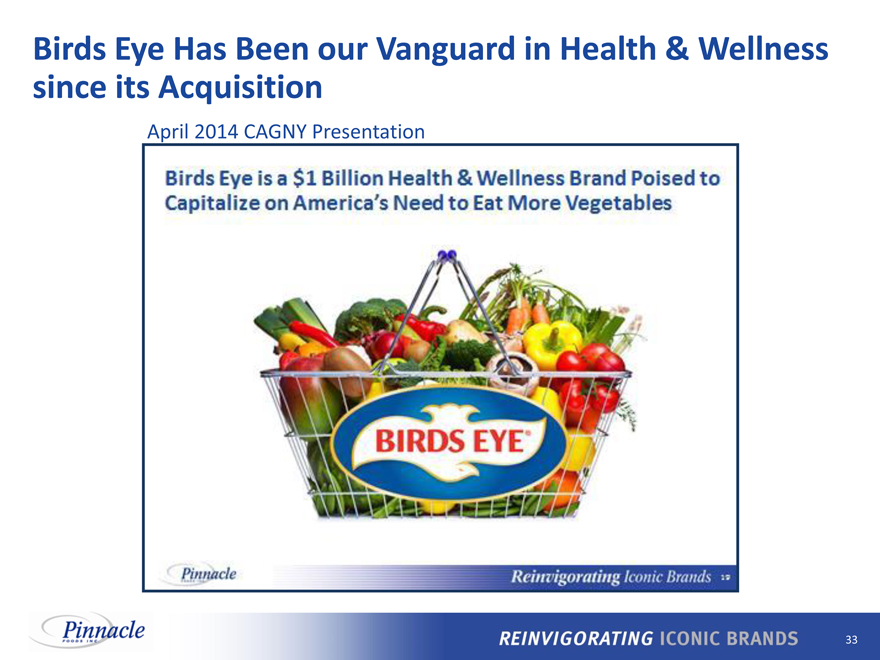
Birds Eye Has Been our Vanguard in Health & Wellness
since its Acquisition
April 2014 CAGNY Presentation
33
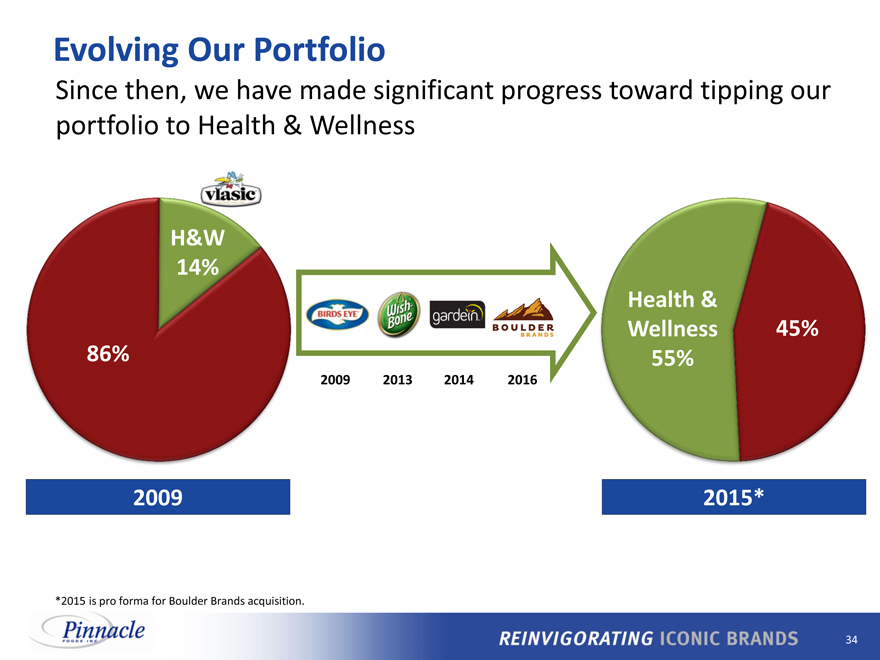
Evolving Our Portfolio
Since then, we have made significant progress toward tipping our portfolio to Health & Wellness
H&W
14%
Health &
Wellness 45%
86% 55%
2009 2013 2014 2016
2009 2015*
*2015 is pro forma for Boulder Brands acquisition.
34
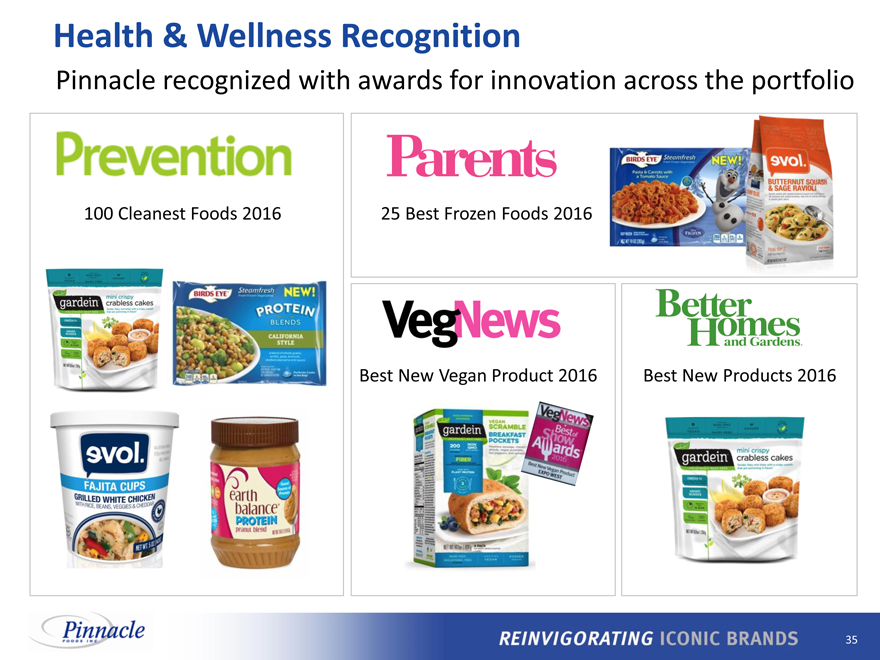
Health & Wellness Recognition
Pinnacle recognized with awards for innovation across the portfolio
100 Cleanest Foods 2016 25 Best Frozen Foods 2016
Best New Vegan Product 2016 Best New Products 2016
35
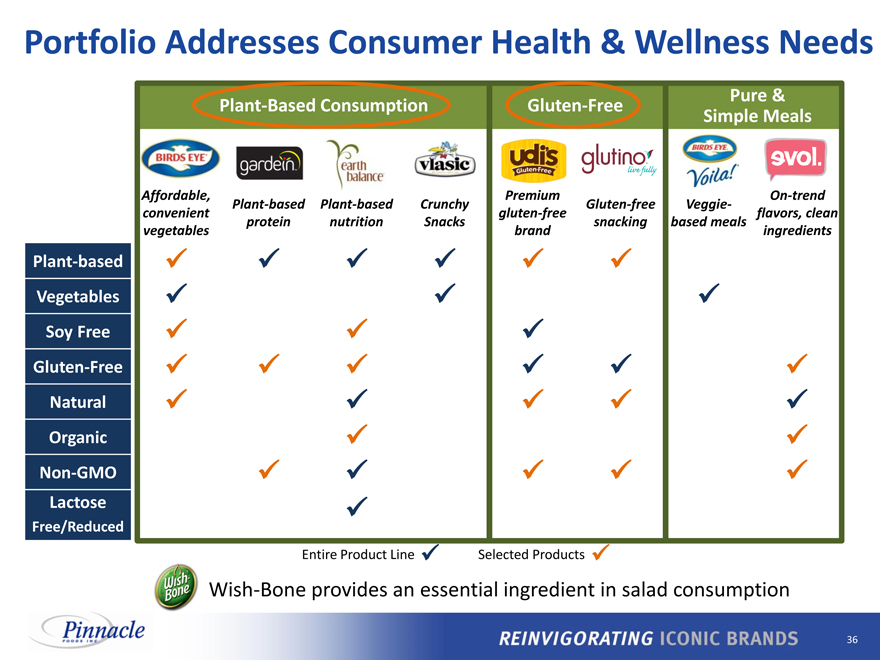
Portfolio Addresses Consumer Health & Wellness Needs
Plant-based Vegetables Soy Free Gluten-Free Natural Organic
Non-GMO Lactose
Free/Reduced
Plant-Based Consumption Gluten-Free Pure &
Simple Meals
Affordable, Premium On-trend
Plant-based Plant-based Crunchy Gluten-free Veggie-
convenient gluten-free flavors, clean
protein nutrition Snacks snacking based meals
vegetables brand ingredients
Entire Product Line Selected Products
Wish-Bone provides an essential ingredient in salad consumption
36
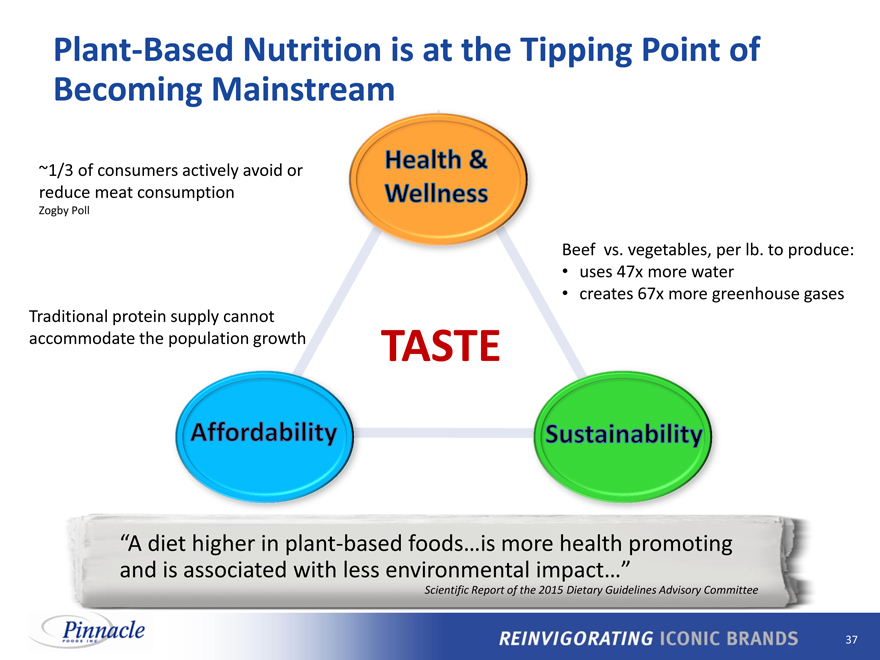
Plant-Based Nutrition is at the Tipping Point of
Becoming Mainstream
~1/3 of consumers actively avoid or
reduce meat consumption
Zogby Poll
Beef vs. vegetables, per lb. to produce:
uses 47x more water
creates 67x more greenhouse gases
Traditional protein supply cannot
accommodate the population growth TASTE
_A diet higher in plant-based foodsis more health promoting and is associated with less environmental impact_
Scientific Report of the 2015 Dietary Guidelines Advisory Committee
37
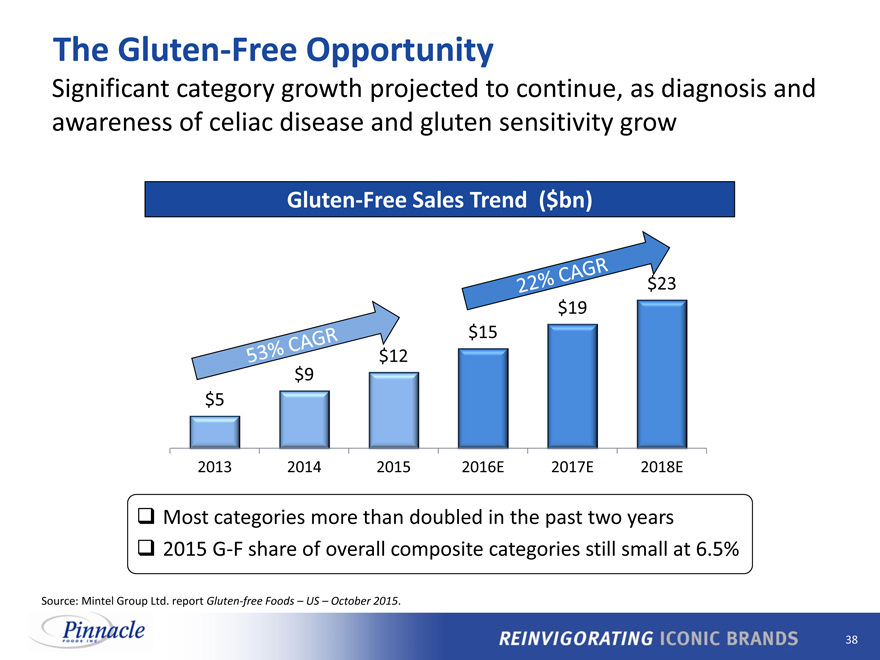
The Gluten-Free Opportunity
Significant category growth projected to continue, as diagnosis and awareness of celiac disease and gluten sensitivity grow
Gluten-Free Sales Trend($bn)
$23
$19
$15
$12
$9
$5
2013 2014 2015 2016E 2017E 2018E
Most categories more than doubled in the past two years
2015 G-F share of overall composite categories still small at 6.5%
Source: Mintel Group Ltd. report Gluten-free Foods _ US _ October 2015.
38
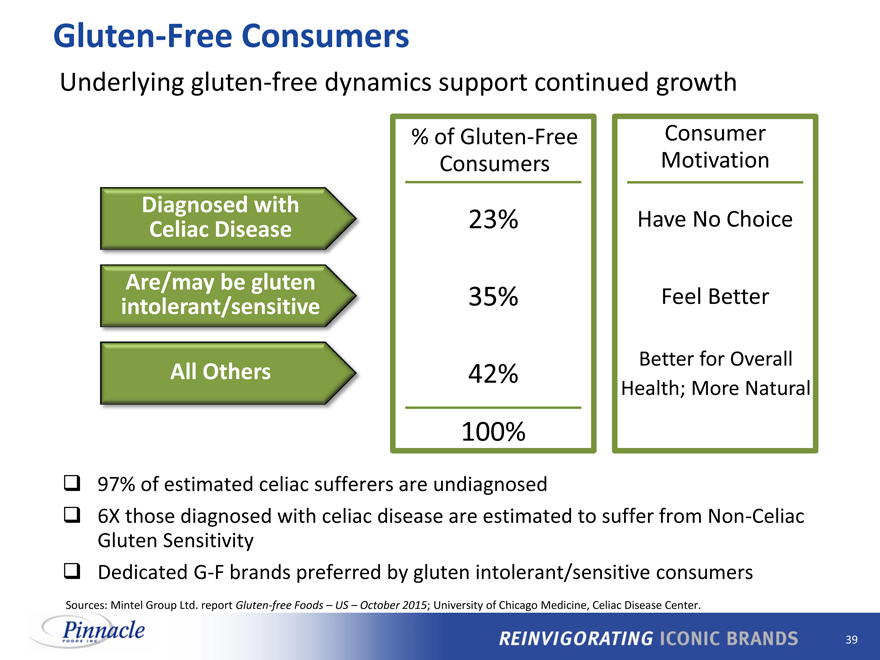
Gluten-Free Consumers
Underlying gluten-free dynamics support continued growth
% of Gluten-Free Consumer
Consumers Motivation
Diagnosed with
Celiac Disease 23% Have No Choice
Are/may be gluten
intolerant/sensitive 35% Feel Better
Better for Overall
All Others 42% Health; More Natural
100%
97% of estimated celiac sufferers are undiagnosed
6X those diagnosed with celiac disease are estimated to suffer from Non-Celiac Gluten Sensitivity
Dedicated G-F brands preferred by gluten intolerant/sensitive consumers
Sources: Mintel Group Ltd. report Gluten-free Foods _ US _ October 2015; University of Chicago Medicine, Celiac Disease Center.
39
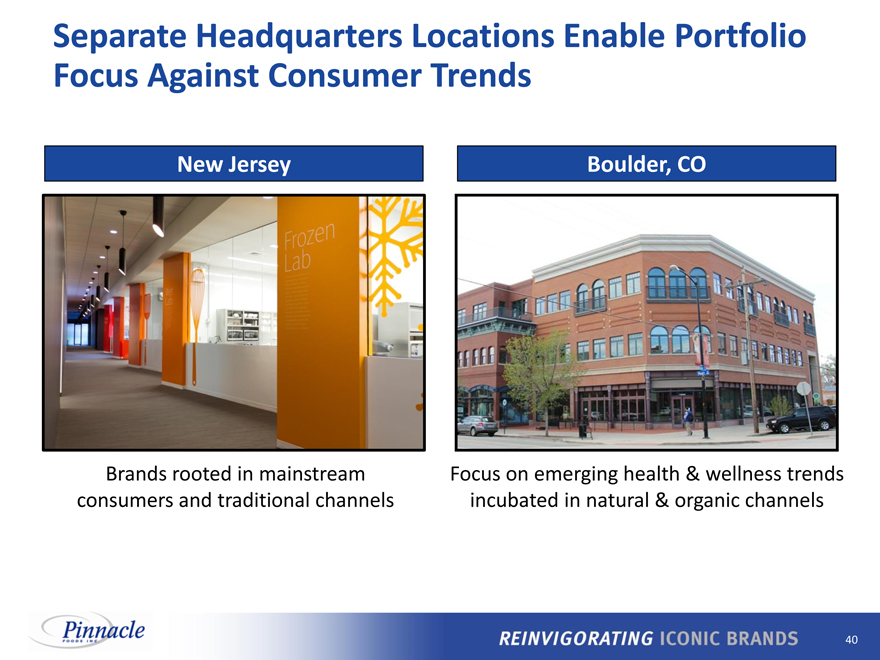
Separate Headquarters Locations Enable Portfolio
Focus Against Consumer Trends
New Jersey Boulder, CO
Brands rooted in mainstream
consumers and traditional channels
Focus on emerging health & wellness trends
incubated in natural & organic channels
40
Agenda
Overview
How We Create Value
Executing Our Playbook Expanding Our Business Evolving Our Portfolio Focus
Financial Update
41
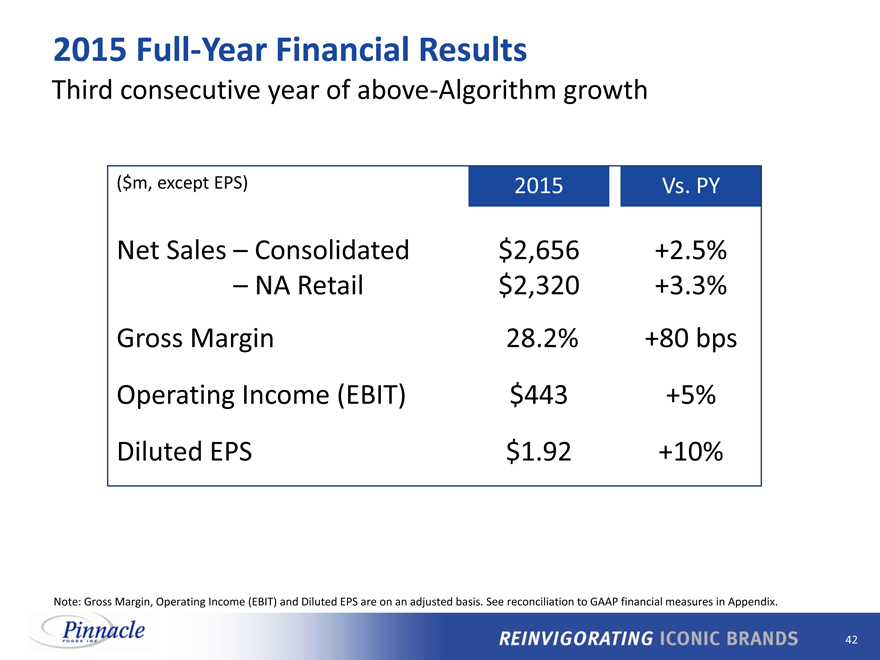
2015 Full-Year Financial Results
Third consecutive year of above-Algorithm growth
($m, except EPS) 2015 Vs. PY
Net Sales _ Consolidated $2,656 +2.5%
Net Sales _ NA Retail $2,320 +3.3%
Gross Margin 28.2% +80 bps
Operating Income (EBIT) $443 +5%
Diluted EPS $1.92 +10%
Note: Gross Margin, Operating Income (EBIT) and Diluted EPS are on an adjusted basis. See reconciliation to GAAP financial measures in Appendix.
42
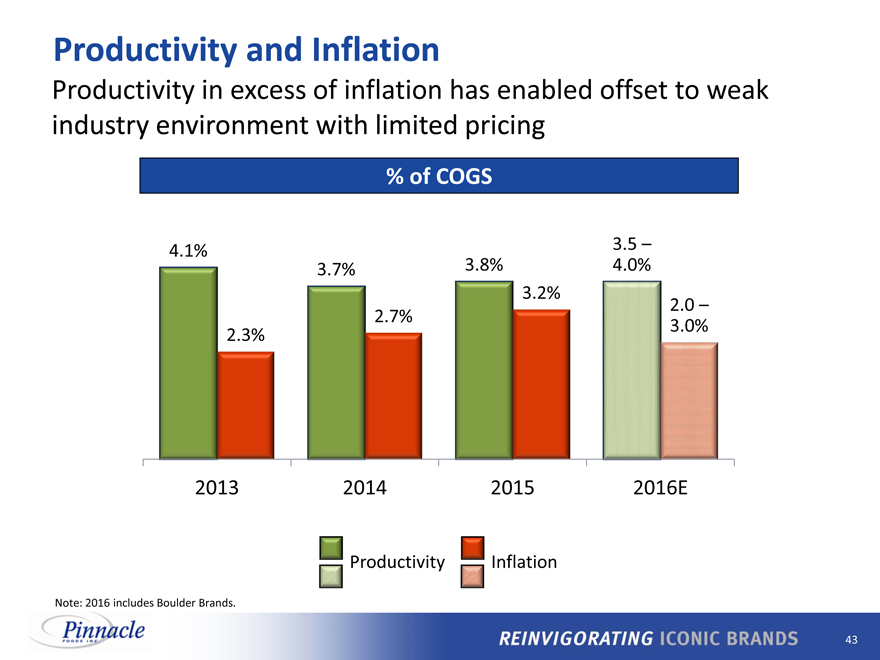
Productivity and Inflation
Productivity in excess of inflation has enabled offset to weak industry environment with limited pricing
% of COGS
4.1% 3.5 _
3.7% 3.8% 4.0%
3.2%
2.0 _
2.7%
2.3% 3.0%
2013 2014 2015 2016E
Productivity Inflation
Note: 2016 includes Boulder Brands.
43
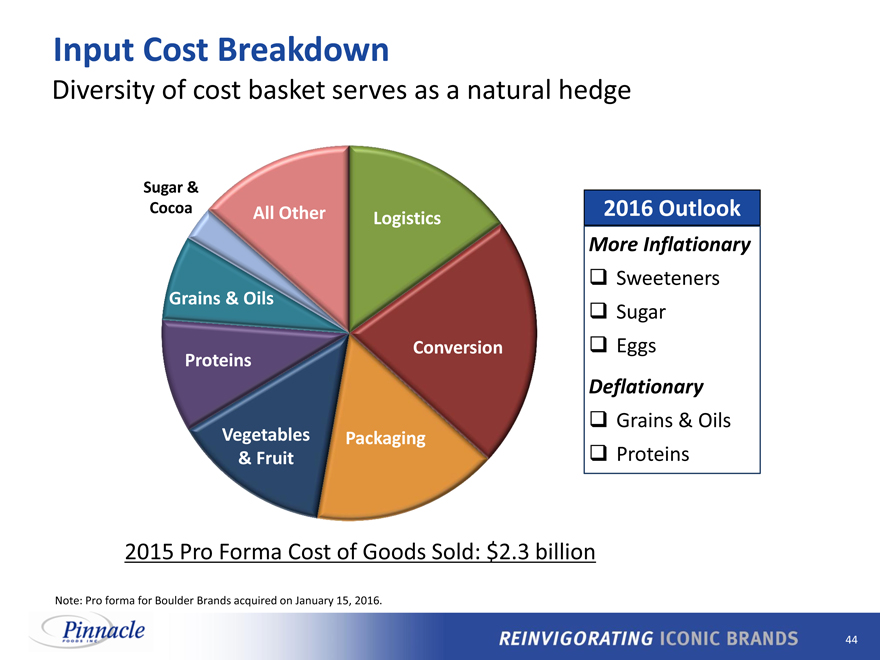
Input Cost Breakdown
Diversity of cost basket serves as a natural hedge
Sugar &
Cocoa All Other 2016 Outlook
Logistics
Grains & Oils
Conversion
Proteins
Vegetables Packaging
& Fruit
More Inflationary
Sweeteners
Sugar
Eggs
Deflationary
Grains & Oils
Proteins
2015 Pro Forma Cost of Goods Sold: $2.3 billion
Note: Pro forma for Boulder Brands acquired on January 15, 2016.
44
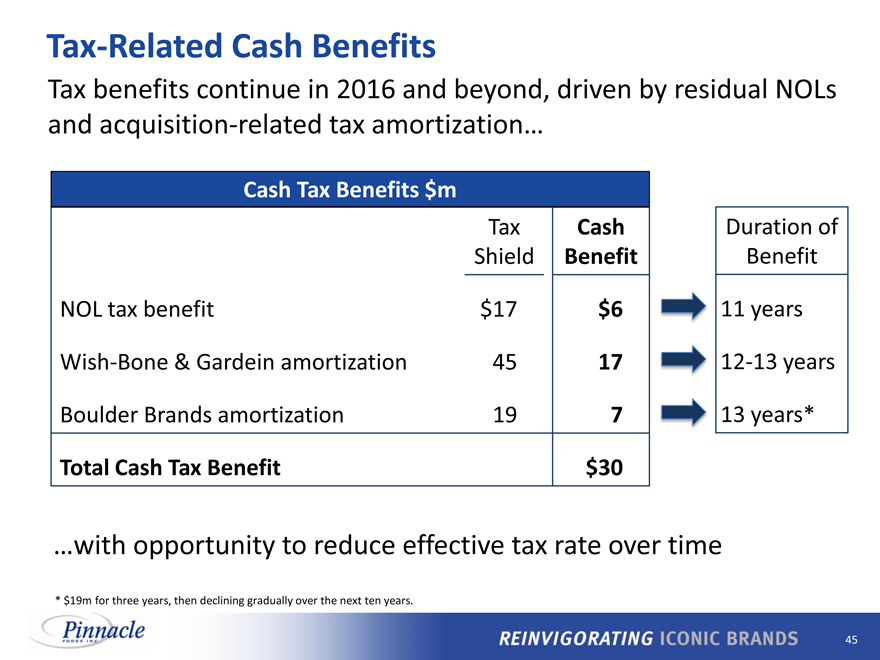
Tax-Related Cash Benefits
Tax benefits continue in 2016 and beyond, driven by residual NOLs and acquisition-related tax amortization
Cash Tax Benefits $m
Tax Cash Duration of
Shield Benefit Benefit
NOL tax benefit $17 $6 11 years
Wish-Bone & Gardein amortization 45 17 12-13 years
Boulder Brands amortization 19 7 13 years*
Total Cash Tax Benefit $30
with opportunity to reduce effective tax rate over time
* $19m for three years, then declining gradually over the next ten years.
45
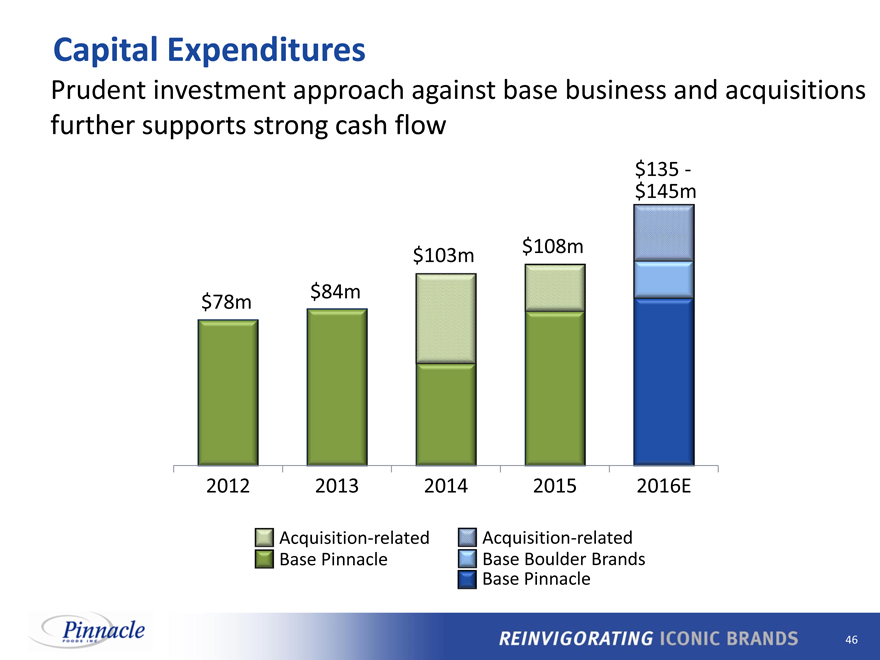
Capital Expenditures
Prudent investment approach against base business and acquisitions
further supports strong cash flow
$ 135 -
$ 145m
$ 103m $ 108m
$ 78m $ 84m
2012 2013 2014 2015 2016E
Acquisition-related Acquisition-related
Base Pinnacle Base Boulder Brands
Base Pinnacle
46
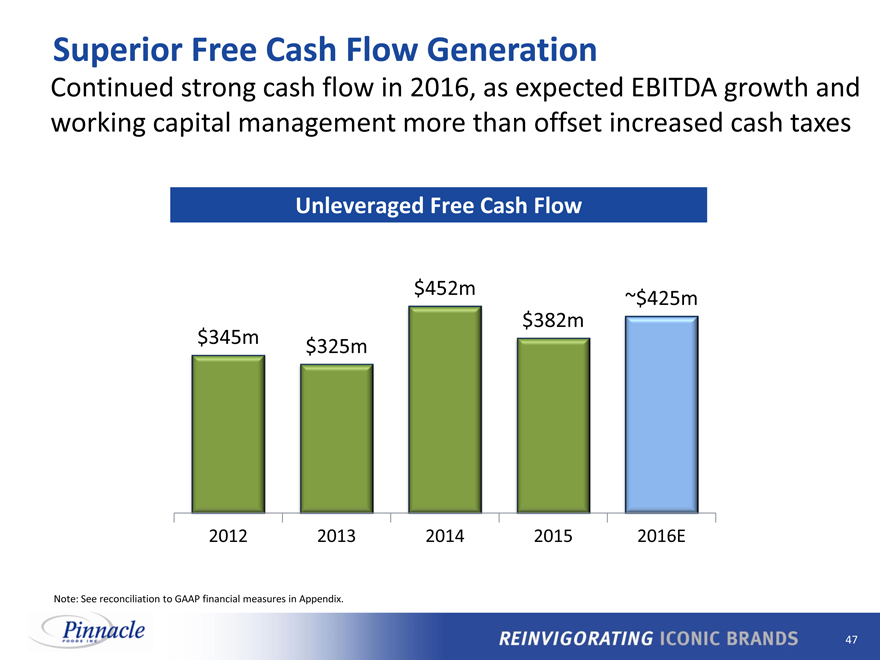
Superior Free Cash Flow Generation
Continued strong cash flow in 2016, as expected EBITDA growth and working capital management more than offset increased cash taxes
Unleveraged Free Cash Flow
$452m ~$425m
$382m
$345m $325m
2012 2013 2014 2015 2016E
Note: See reconciliation to GAAP financial measures in Appendix.
47
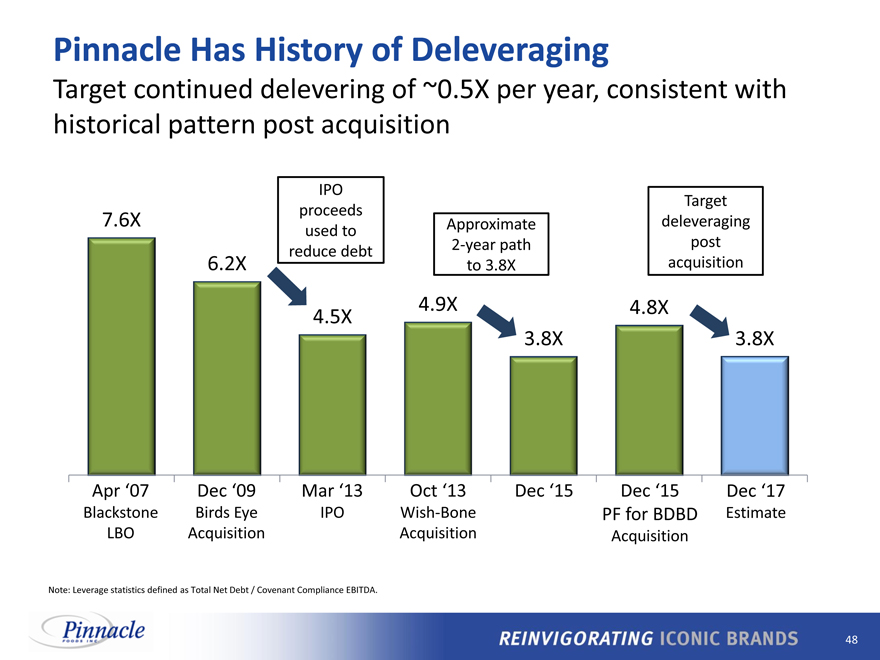
Pinnacle Has History of Deleveraging
Target continued delevering of ~0.5X per year, consistent with historical pattern post acquisition
IPO
proceeds Target
7.6X Approximate deleveraging
used to
2-year path post
6.2X to 3.8X acquisition
4.5X 4.9X 4.8X
3.8X 3.8X
Apr ‘07 Dec 09 Mar 13 Oct 13 Dec 15 Dec 15 Dec 17
Blackstone Birds Eye IPO Wish-Bone PF for BDBD Estimate
LBO Acquisition Acquisition Acquisition
Note: Leverage statistics defined as Total Net Debt / Covenant Compliance EBITDA.
48
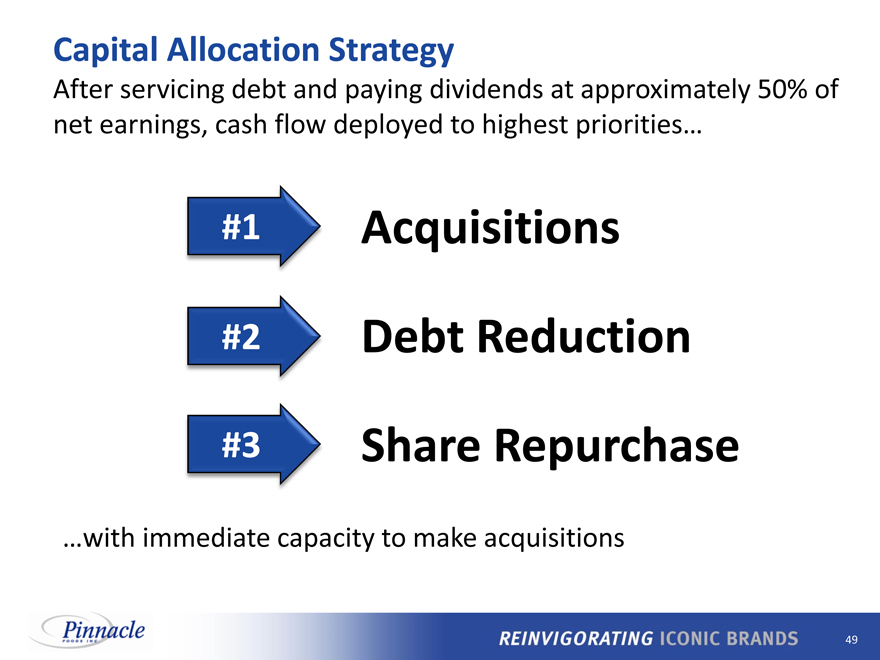
Capital Allocation Strategy
After servicing debt and paying dividends at approximately 50% of net earnings, cash flow deployed to highest priorities
#1
Acquisitions
#2
Debt Reduction
#3 Share Repurchase
with immediate capacity to make acquisitions
49
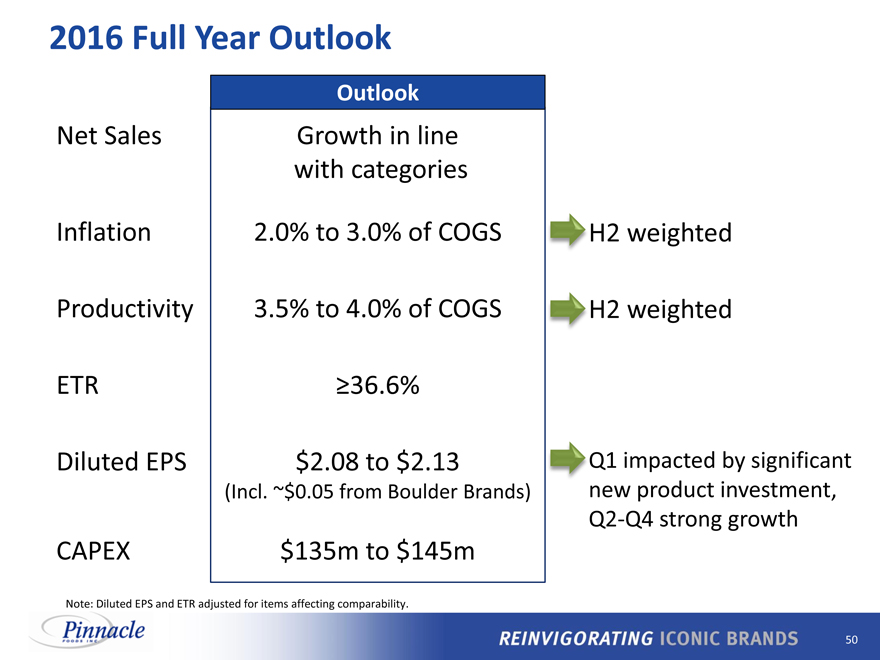
2016 Full Year Outlook
Outlook
Net Sales Growth in line
with categories
Inflation 2.0% to 3.0% of COGS H2 weighted
Nm
Productivity 3.5% to 4.0% of COGS H2 weighted
ETR ?36.6%
Diluted EPS $2.08 to $ 2.13 Q1 impacted by significant
(Incl. ~$0.05 from Boulder Brands) new product investment,
Q2-Q4 strong growth
CAPEX $135m to $ 145m
Note: Diluted EPS and ETR adjusted for items affecting comparability.
50
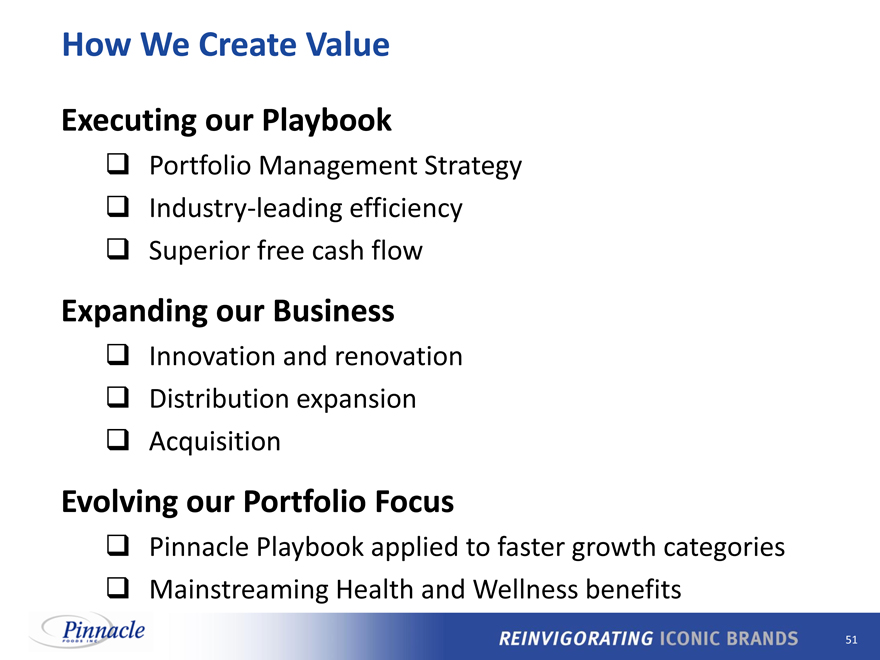
How We Create Value
Executing our Playbook
Portfolio Management Strategy
Industry-leading efficiency
Superior free cash flow
Expanding our Business
Innovation and renovation
Distribution expansion
Acquisition
Evolving our Portfolio Focus
Pinnacle Playbook applied to faster growth categories
Mainstreaming Health and Wellness benefits
51
Appendix
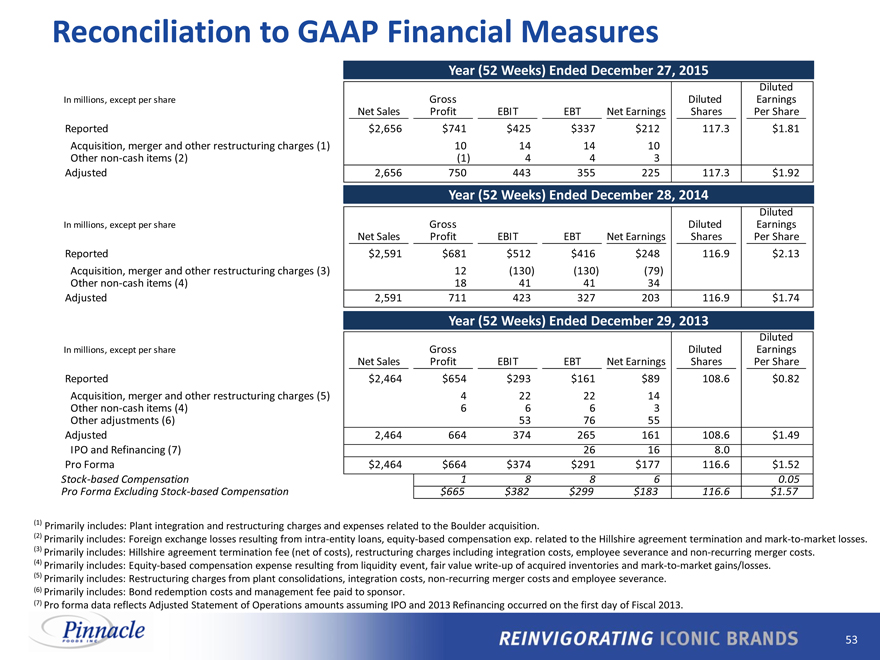
Reconciliation to GAAP Financial Measures
Year (52 Weeks) Ended December 27, 2015
Diluted
In millions, except per share Gross Diluted Earnings
Net Sales Profit EBIT EBT Net Earnings Shares Per Share
Reported $2,656 $741 $425 $337 $212 117.3 $1.81
Acquisition, merger and other restructuring charges (1) 10 14 14 10
Other non-cash items (2)(1) 4 4 3
Adjusted 2,656 750 443 355 225 117.3 $1.92
Year (52 Weeks) Ended December 28, 2014
Diluted
In millions, except per share Gross Diluted Earnings
Net Sales Profit EBIT EBT Net Earnings Shares Per Share
Reported $2,591 $681 $512 $416 $248 116.9 $2.13
Acquisition, merger and other restructuring charges (3) 12(130)(130)(79)
Other non-cash items (4) 18 41 41 34
Adjusted 2,591 711 423 327 203 116.9 $1.74
Year (52 Weeks) Ended December 29, 2013
Diluted
In millions, except per share Gross Diluted Earnings
Net Sales Profit EBIT EBT Net Earnings Shares Per Share
Reported $2,464 $654 $293 $161 $89 108.6 $0.82
Acquisition, merger and other restructuring charges (5) 4 22 22 14
Other non-cash items (4) 6 6 6 3
Other adjustments (6) 53 76 55
Adjusted 2,464 664 374 265 161 108.6 $1.49
IPO and Refinancing (7) 26 16 8.0
Pro Forma $2,464 $664 $374 $291 $177 116.6 $1.52
Stock-based Compensation 1 8 8 6 0.05
Pro Forma Excluding Stock-based Compensation $665 $382 $299 $183 116.6 $1.57
Primarily includes: Plant integration and restructuring charges and expenses related to the Boulder acquisition.
Primarily includes: Foreign exchange losses resulting from intra-entity loans, equity-based compensation exp. related to the Hillshire agreement termination and mark-to-market losses.
Primarily includes: Hillshire agreement termination fee (net of costs), restructuring charges including integration costs, employee severance and non-recurring merger costs.
Primarily includes: Equity-based compensation expense resulting from liquidity event, fair value write-up of acquired inventories and mark-to-market gains/losses.
Primarily includes: Restructuring charges from plant consolidations, integration costs, non-recurring merger costs and employee severance.
Primarily includes: Bond redemption costs and management fee paid to sponsor.
Pro forma data reflects Adjusted Statement of Operations amounts assuming IPO and 2013 Refinancing occurred on the first day of Fiscal 2013.
53
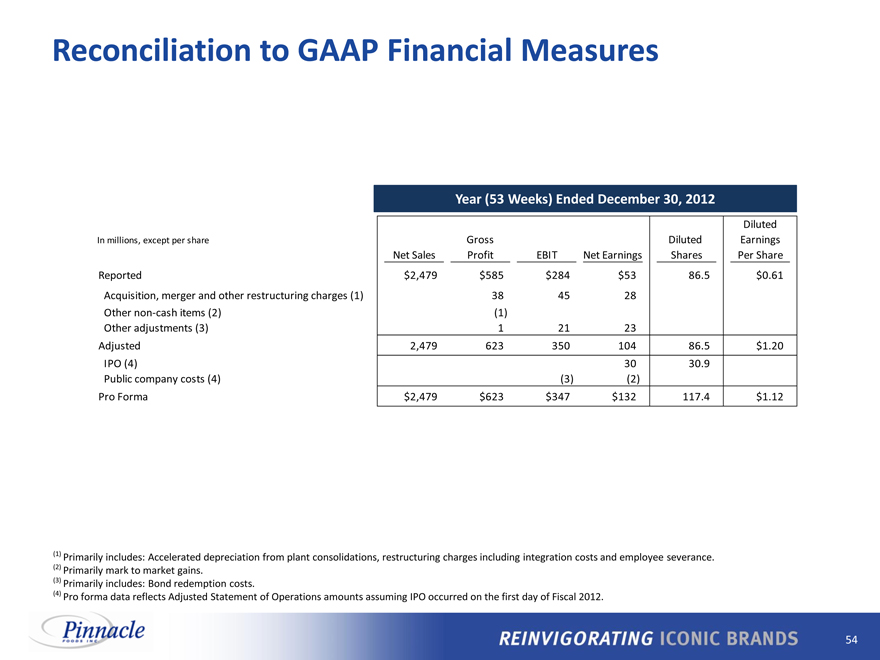
Reconciliation to GAAP Financial Measures
Year (53 Weeks) Ended December 30, 2012
Diluted
In millions, except per share Gross Diluted Earnings
Net Sales Profit EBIT Net Earnings Shares Per Share
Reported $ 2,479 $ 585 $ 284 $53 86.5 $ 0.61
Acquisition, merger and other restructuring charges (1) 38 45 28
Other non-cash items (2)(1)
Other adjustments (3) 1 21 23
Adjusted 2,479 623 350 104 86.5 $ 1.20
IPO (4) 30 30.9
Public company costs (4)(3)(2)
Pro Forma $ 2,479 $ 623 $ 347 $132 117.4 $ 1.12
Primarily includes: Accelerated depreciation from plant consolidations, restructuring charges including integration costs and employee severance.
Primarily mark to market gains.
Primarily includes: Bond redemption costs.
Pro forma data reflects Adjusted Statement of Operations amounts assuming IPO occurred on the first day of Fiscal 2012.
54
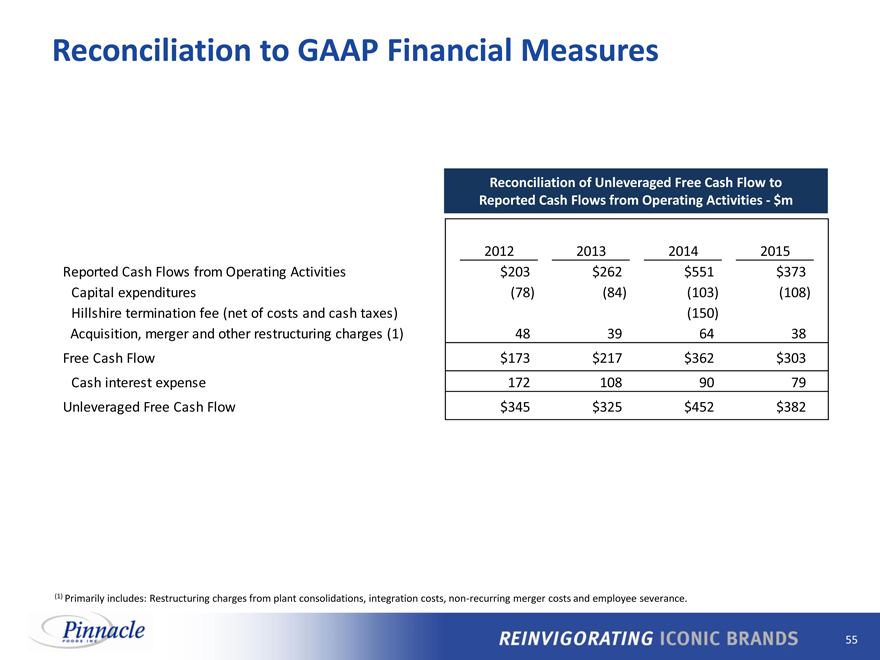
Reconciliation to GAAP Financial Measures
Reconciliation of Unleveraged Free Cash Flow to
Reported Cash Flows from Operating Activities—$m
2012 2013 2014 2015
Reported Cash Flows from Operating Activities $ 203 $ 262 $551 $373
Capital expenditures(78)(84)(103)(108)
Hillshire termination fee (net of costs and cash taxes)(150)
Acquisition, merger and other restructuring charges (1) 48 39 64 38
Free Cash Flow $ 173 $ 217 $362 $303
Cash interest expense 172 108 90 79
Unleveraged Free Cash Flow $ 345 $ 325 $452 $382
(1) Primarily includes: Restructuring charges from plant consolidations, integration costs, non-recurring merger costs and employee severance.
55