Exhibit 99.1

Pinnacle Foods
AMPLIFYING
THE PLAYBOOK
Investor Meeting
December 15, 2016
Forward-Looking Statements
&Non-GAAP Financial Measures
This presentation contains “forward-looking statements” within the meaning of U.S. federal securities laws. Forward-looking statements are not historical facts, and are based upon management’s current expectations, beliefs, projections and targets, many of which, by their nature, are inherently uncertain. Such expectations, beliefs, projections and targets are expressed in good faith. However, there can be no assurance that management’s expectations, beliefs, projections and targets will be achieved and actual results may differ materially from what is expressed in or indicated by the forward- looking statements. Forward-looking statements are subject to significant business, economic, regulatory and competitive risks and uncertainties that could cause actual performance or results to differ materially from those expressed in the forward-looking statements, including risks detailed in Pinnacle Foods Inc.’s (“Pinnacle Foods,” “Pinnacle” or the “Company”) filings with the U.S. Securities and Exchange Commission (the “SEC”). Nothing in this presentation should be regarded as a representation by any person that these forward-looking statements will be achieved.
Forward-looking statements speak only as of the date the statements are made. The Company assumes no obligation to update forward-looking statements to reflect actual results, subsequent events or circumstances or other changes affecting forward-looking information except to the extent required by applicable securities laws.
This presentation includes certainnon-GAAP financial measures, which differ from results using U.S. Generally Accepted Accounting Principles (GAAP). Thesenon-GAAP financial measures should be considered as supplements to the GAAP reported measures, should not be considered replacements for, or superior to, the GAAP measures and may not be comparable to similarly named measures used by other companies.Non-GAAP financial measures typically exclude certain charges, which are not expected to occur routinely in future periods. The Company usesnon-GAAP financial measures internally to focus management on performance excluding these special charges to gauge our business operating performance. Management believes this information is helpful to investors because it increases transparency, and assists investors in understanding the underlying performance of the Company and in the analysis of ongoing operating trends. Additionally, management believes thatnon-GAAP financial measures are frequently used by analysts and investors in their evaluation of companies, and its continued inclusion provides consistency in financial reporting and enables analysts and investors to perform meaningful comparisons of past, present and future operating results. The most directly comparable GAAP financial measures and reconciliations tonon-GAAP financial measures are set forth in the appendix to this presentation and included in the Company’s filings with the SEC.
2 Pinnacle FOODS INC.
Pinnacle Management Team
Mark Clouse Craig Steeneck Mark Schiller
CEO EVP & CFO President N.A. Retail
3 Pinnacle FOODS INC.

Pinnacle Management Team
Chris Boever
EVP & Chief Customer Officer
Mike Wittman
EVP & Chief Supply Chain Officer
Michael Allen
EVP & President Boulder
4 Pinnacle FOODS INC.

Pinnacle Management Team
Mike Barkley
EVP & Chief Marketing Officer
Mary Beth DeNooyer
EVP & Chief HR Officer
Kelley Maggs
EVP, Secretary & General Counsel
5 Pinnacle FOODS INC.
Agenda
• Overview
• Amplifying the Playbook
• Financial Performance
• Outlook
6 Pinnacle FOODS INC.
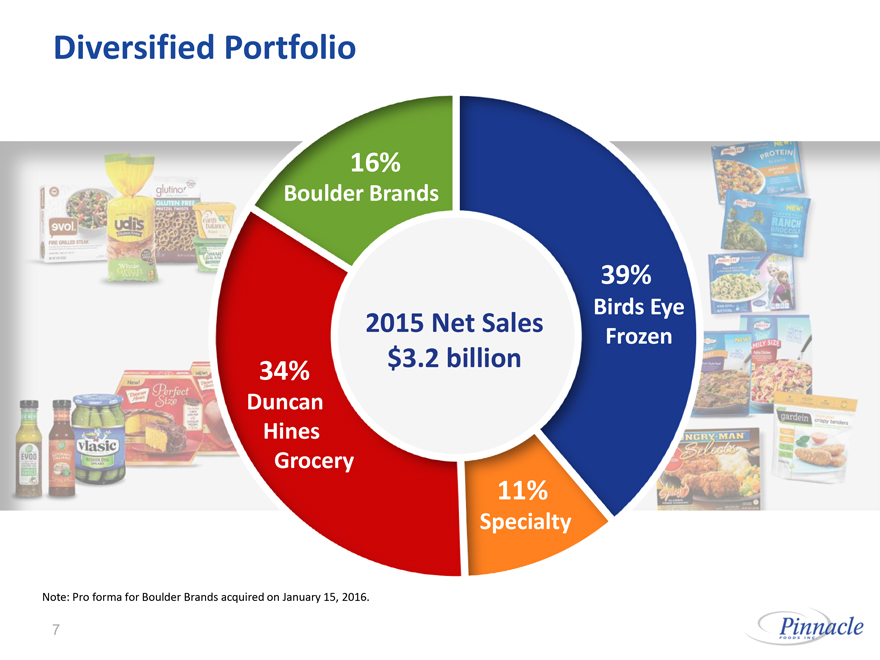
Diversified Portfolio
16% Boulder Brands
34% Duncan Hines Grocery
2015 Net Sales $3.2 billion
39% Birds Eye Frozen
11% Specialty
Note: Pro forma for Boulder Brands acquired on January 15, 2016.
7 Pinnacle FOODS INC.
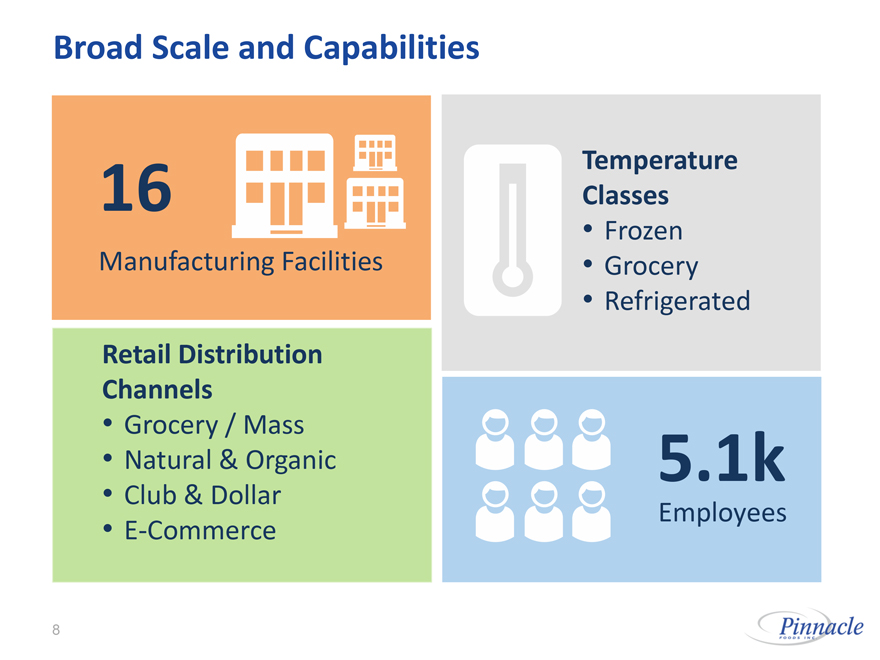
Broad Scale and Capabilities
16
Manufacturing Facilities
Retail Distribution Channels
Grocery / Mass
Natural & Organic
Club & Dollar
E-Commerce
Temperature
Classes
Frozen
Grocery
Refrigerated
5.1k
Employees
8 Pinnacle FOODS INC.
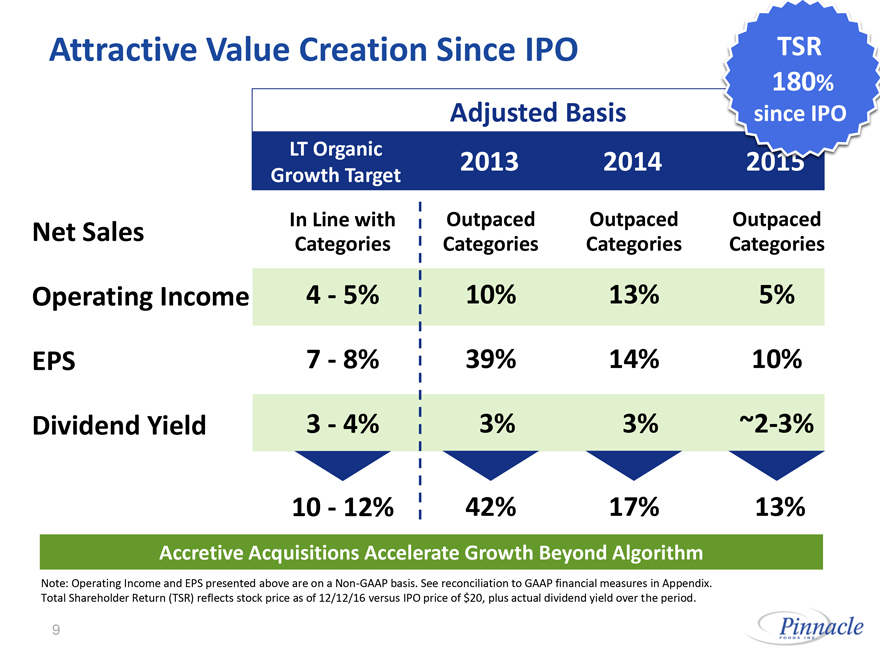
Attractive Value Creation Since IPO
TSR 180% since IPO
Adjusted Basis
LT Organic Growth Target 2013 2014 2015
Net Sales In Line with Categories Outpaced Categories Outpaced Categories Outpaced Categories
Operating Income 4 - 5% 10% 13% 5%
EPS 7 - 8% 39% 14% 10%
Dividend Yield 3 - 4% 3% 3%~2-3%
10 - 12% 42% 17% 13%
Accretive Acquisitions Accelerate Growth Beyond Algorithm
Note: Operating Income and EPS presented above are on aNon-GAAP basis. See reconciliation to GAAP financial measures in Appendix. Total Shareholder Return (TSR) reflects stock price as of 12/12/16 versus IPO price of $20, plus actual dividend yield over the period.
9 Pinnacle FOODS INC.
Agenda
Overview
Amplifying the Playbook
Financial Performance
Outlook
10 Pinnacle FOODS INC.
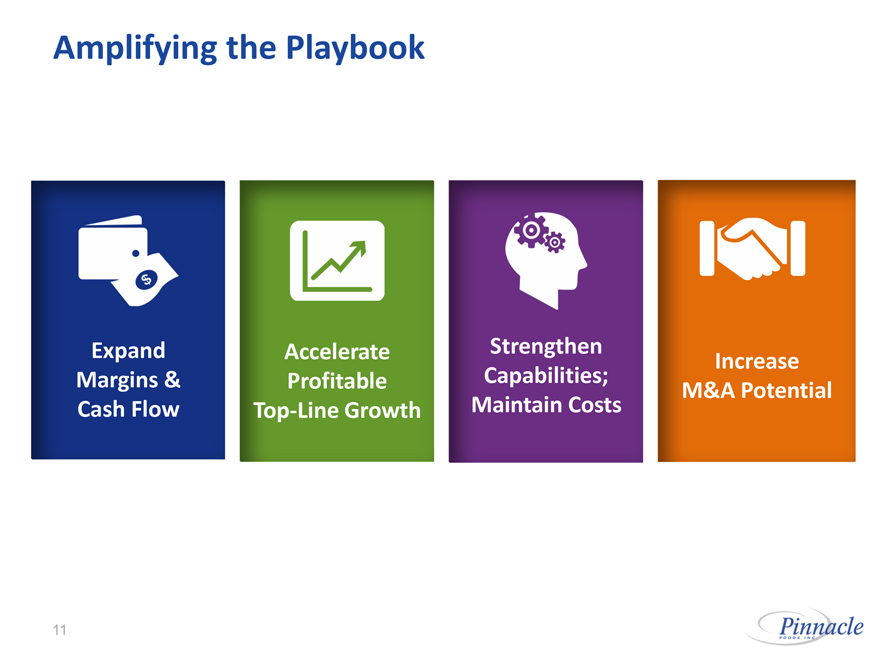
Amplifying the Playbook
Expand Margins & Cash Flow
Accelerate ProfitableTop-Line Growth
Strengthen Capabilities; Maintain Costs
Increase M&A Potential
11 Pinnacle FOODS INC.
Margin & Cash
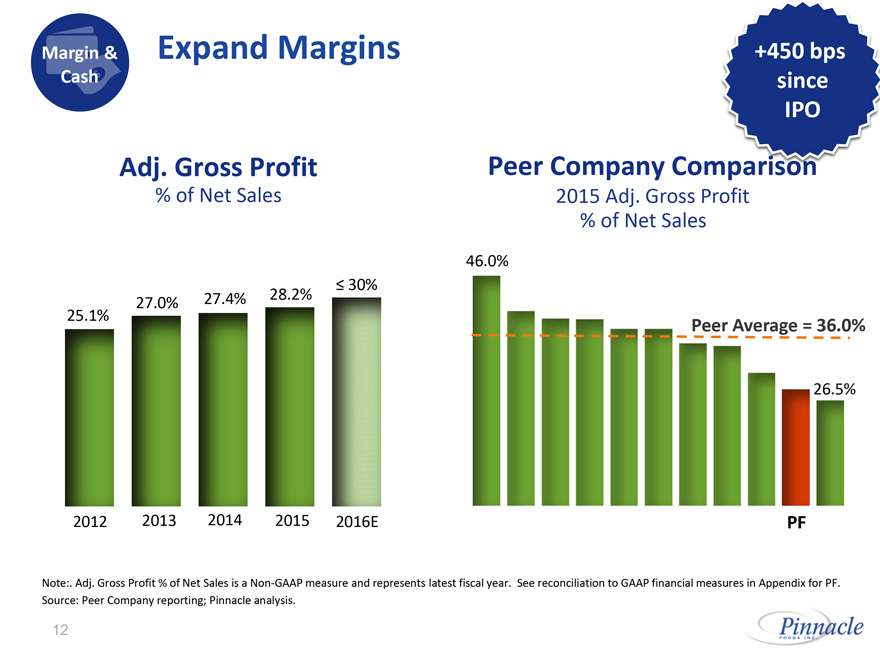
Expand Margins
Adj. Gross Profit
% of Net Sales
25.1% 27.0% 27.4% 28.2%£ 30%
2012 2013 2014 2015 2016E
+450 bps since IPO
Peer Company Comparison
2015 Adj. Gross Profit
% of Net Sales
46.0%
Peer Average = 36.0%
26.5%
PF
Note:. Adj. Gross Profit % of Net Sales is aNon-GAAP measure and represents latest fiscal year. See reconciliation to GAAP financial measures in Appendix for PF. Source: Peer Company reporting; Pinnacle analysis.
12 Pinnacle FOODS INC.
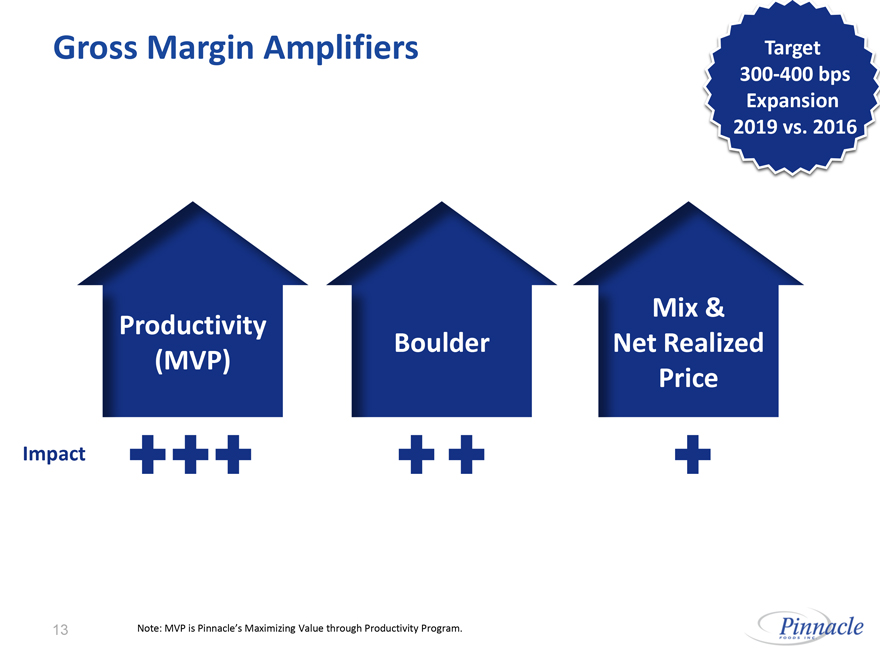
Gross Margin Amplifiers
Target300-400 bps
Expansion
2019 vs. 2016
Productivity (MVP) Boulder Mix & Net Realized Price
Impact +++ ++ +
Note: MVP is Pinnacle’s Maximizing Value through Productivity Program.
13 Pinnacle FOODS INC.
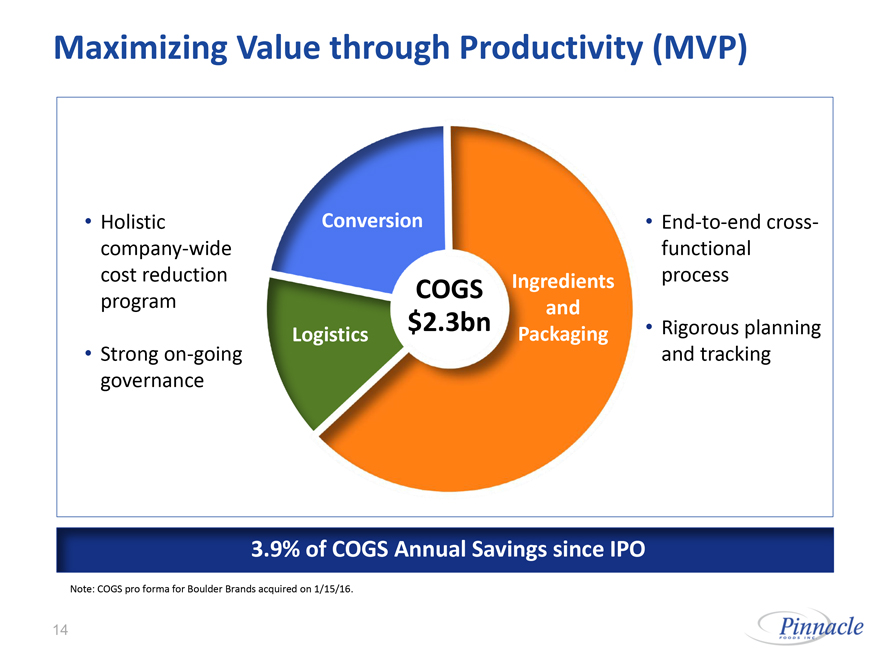
Maximizing Value through Productivity (MVP)
Holistic company-wide cost reduction program
Strongon-going governance
Conversion
Logistics
COGS $2.3bn
Ingredients and Packaging
End-to-end cross- functional process
Rigorous planning and tracking
3.9% of COGS Annual Savings since IPO
Note: COGS pro forma for Boulder Brands acquired on 1/15/16.
14 Pinnacle FOODS INC.
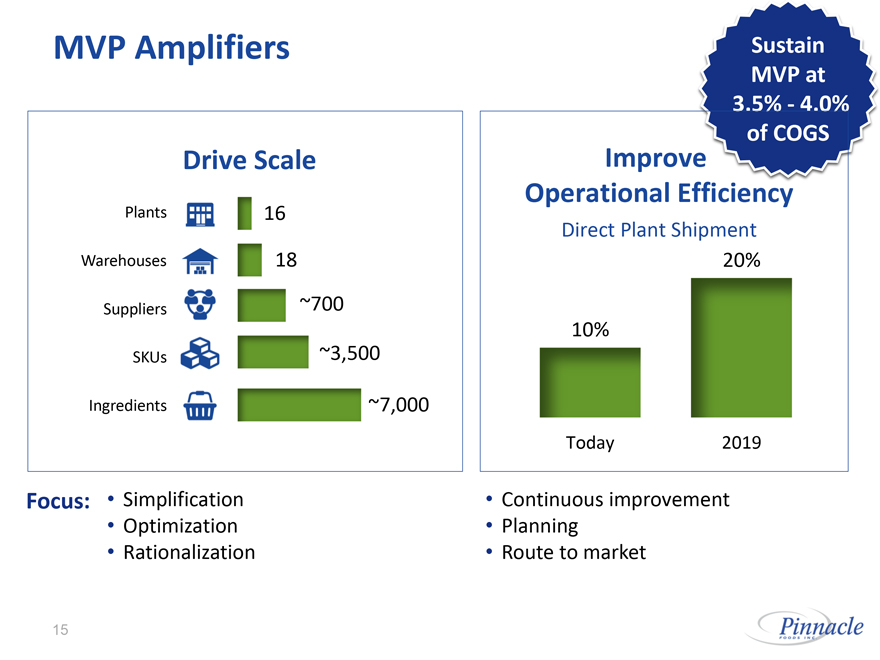
MVP Amplifiers
Sustain MVP at 3.5% - 4.0% of COGS
Drive Scale
Plants 16
Warehouses 18
Suppliers ~700
SKUs ~3,500
Ingredients ~7,000
Focus: • Simplification
• Optimization
• Rationalization
Improve
Operational Efficiency
Direct Plant Shipment
10% 20%
Today 2019
Continuous improvement
Planning
Route to market
15 Pinnacle FOODS INC.
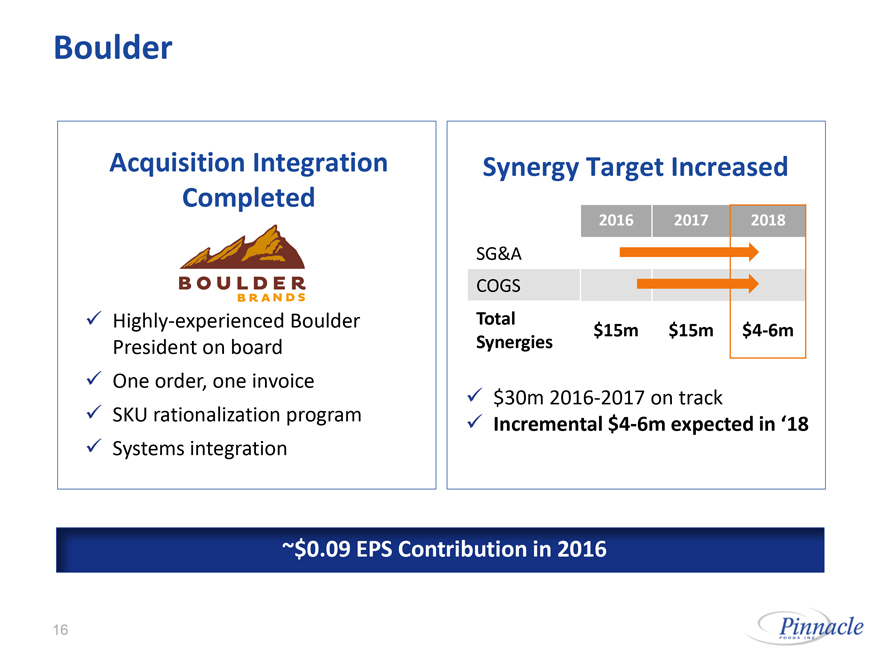
Boulder
Acquisition Integration Completed
BOULDER BRANDS
Highly-experienced Boulder President on board
One order, one invoice
SKU rationalization program
Systems integration
Synergy Target Increased
2016 2017 2018
SG&A
COGS
Total
$15m $15m$4-6m
Synergies
$30m 2016-2017 on track
Incremental$4-6m expected in ‘18
~$0.09 EPS Contribution in 2016
16 Pinnacle FOODS INC.
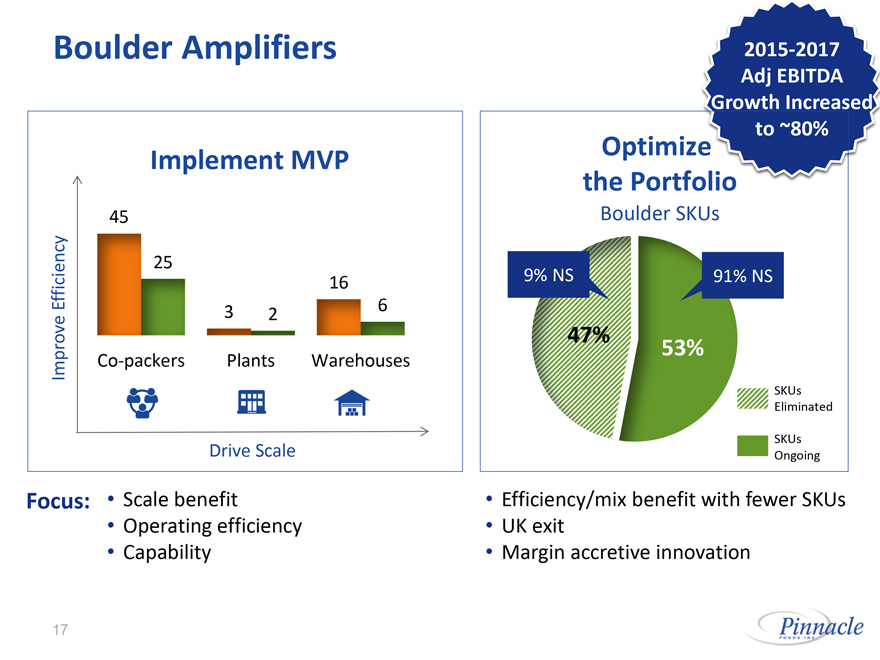
Boulder Amplifiers
Implement MVP
Improve Efficiency
45
25
Co-packers
3 2
Plants
16
6
Warehouses
Drive Scale
Focus:
Scale benefit
Operating efficiency
Capability
2015-2017 Adj EBITDA Growth Increased to ~80%
Optimize the Portfolio
Boulder SKUs
9% NS 91% NS
47% 53%
SKUs Eliminated
SKUs Ongoing
Efficiency/mix benefit with fewer SKUs
UK exit
Margin accretive innovation
17 Pinnacle FOODS INC.
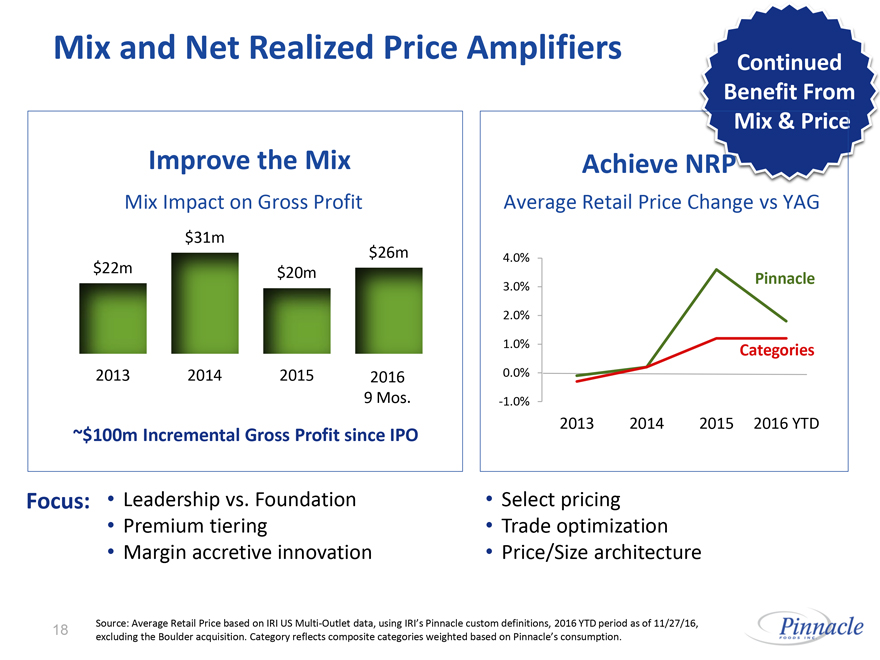
Mix and Net Realized Price Amplifiers
Improve the Mix
Mix Impact on Gross Profit
$22m $31m $20m $26m
2013 2014 2015 2016
9 Mos.
~$100m Incremental Gross Profit since IPO
Focus:
Leadership vs. Foundation
Premium tiering
Margin accretive innovation
Continued Benefit From Mix & Price
Achieve NRP
Average Retail Price Change vs YAG
4.0%
3.0% Pinnacle
2.0%
1.0% Categories
0.0%
-1.0%
2013 2014 2015 2016 YTD
Select pricing
Trade optimization
Price/Size architecture
Source: Average Retail Price based on IRI US Multi-Outlet data, using IRI’s Pinnacle custom definitions, 2016 YTD period as of 11/27/16, excluding the Boulder acquisition. Category reflects composite categories weighted based on Pinnacle’s consumption.
18 Pinnacle FOODS INC.
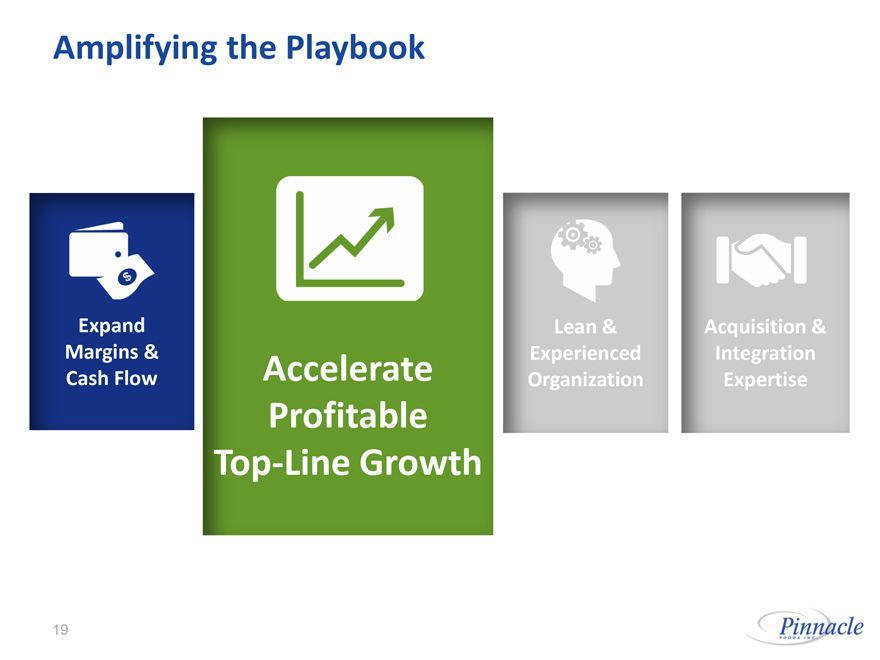
Amplifying the Playbook
Expand Margins & Cash Flow
Accelerate ProfitableTop-Line Growth
Lean & Experienced Organization
Acquisition & Integration Expertise
19 Pinnacle FOODS INC.
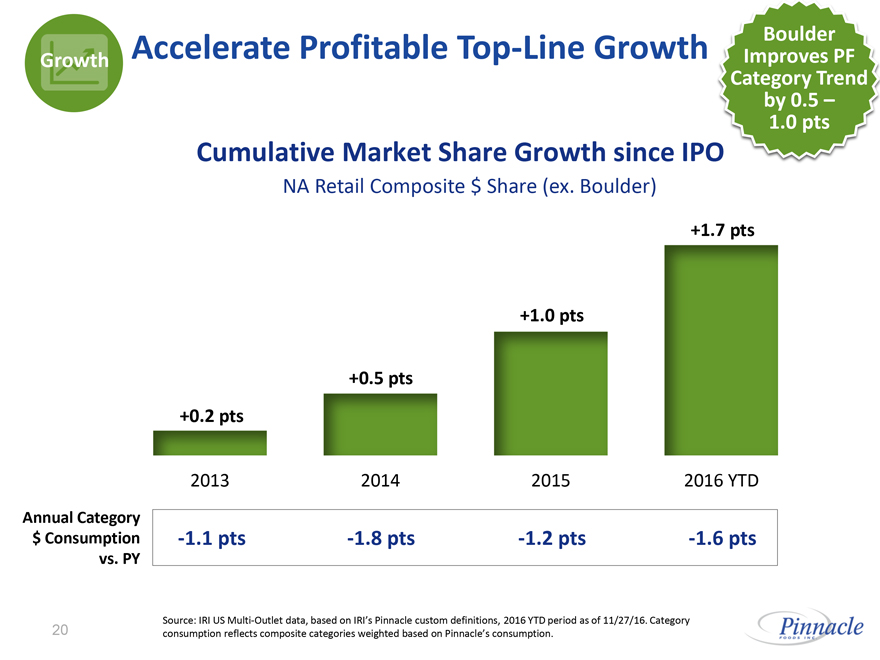
Growth Accelerate ProfitableTop-Line Growth
Boulder Improves PF Category Trend by 0.5 – 1.0 pts
Cumulative Market Share Growth since IPO
NA Retail Composite $ Share (ex. Boulder)
+0.2 pts +0.5 pts +1.0 pts +1.7 pts
2013 2014 2015 2016 YTD
Annual Category $ Consumption vs. PY -1.1 pts -1.8 pts -1.2 pts -1.6 pts
Source: IRI US Multi-Outlet data, based on IRI’s Pinnacle custom definitions, 2016 YTD period as of 11/27/16. Category consumption reflects composite categories weighted based on Pinnacle’s consumption.
20 Pinnacle FOODS INC.
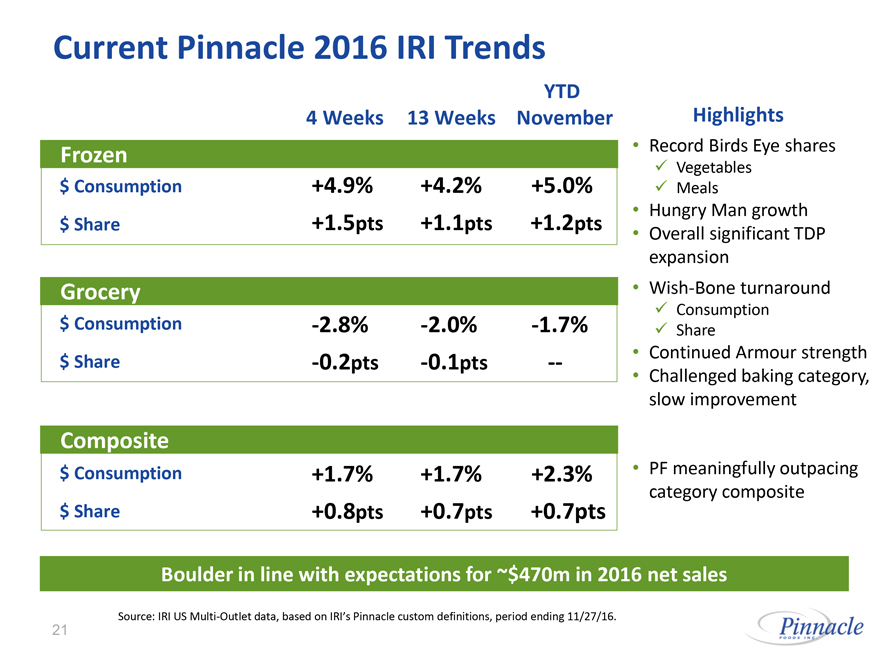
Current Pinnacle 2016 IRI Trends
4 Weeks 13 Weeks YTD November
Frozen
$ Consumption +4.9% +4.2% +5.0%
$ Share +1.5pts +1.1pts +1.2pts
Grocery
$ Consumption -2.8% -2.0% -1.7%
$ Share -0.2pts -0.1pts -
Composite
$ Consumption +1.7% +1.7% +2.3%
$ Share +0.8pts +0.7pts +0.7pts
Highlights
Record Birds Eye shares
Vegetables
Meals
Hungry Man growth
Overall significant TDP expansion
Wish-Bone turnaround
Consumption
Share
Continued Armour strength
Challenged baking category, slow improvement
PF meaningfully outpacing category composite
Boulder in line with expectations for ~$470m in 2016 net sales
Source: IRI US Multi-Outlet data, based on IRI’s Pinnacle custom definitions, period ending 11/27/16.
21 Pinnacle FOODS INC.
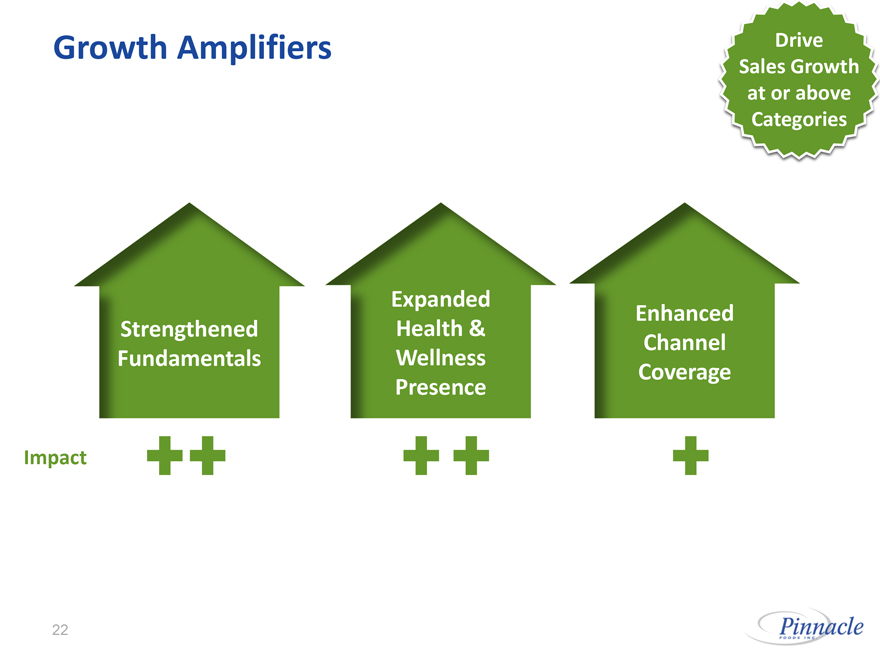
Growth Amplifiers
Drive Sales Growth at or above Categories
Strengthened Fundamentals
Expanded Health & Wellness Presence
Enhanced Channel Coverage
Impact
22 Pinnacle FOODS INC.
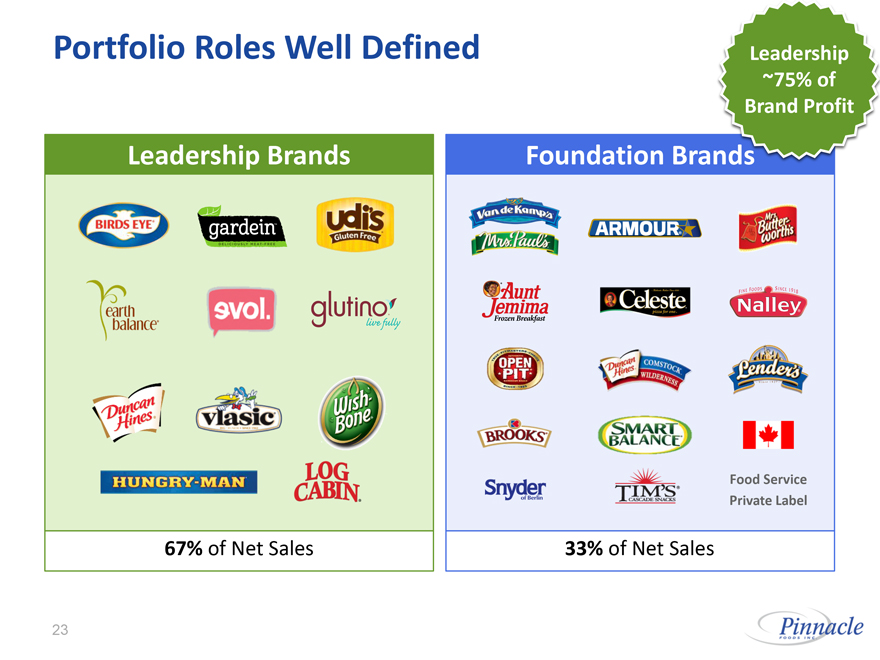
Portfolio Roles Well Defined
Leadership ~75% of Brand Profit
Leadership Brands
67% of Net Sales
Foundation Brands
Food Service
Private Label
33% of Net Sales
23 Pinnacle FOODS INC.
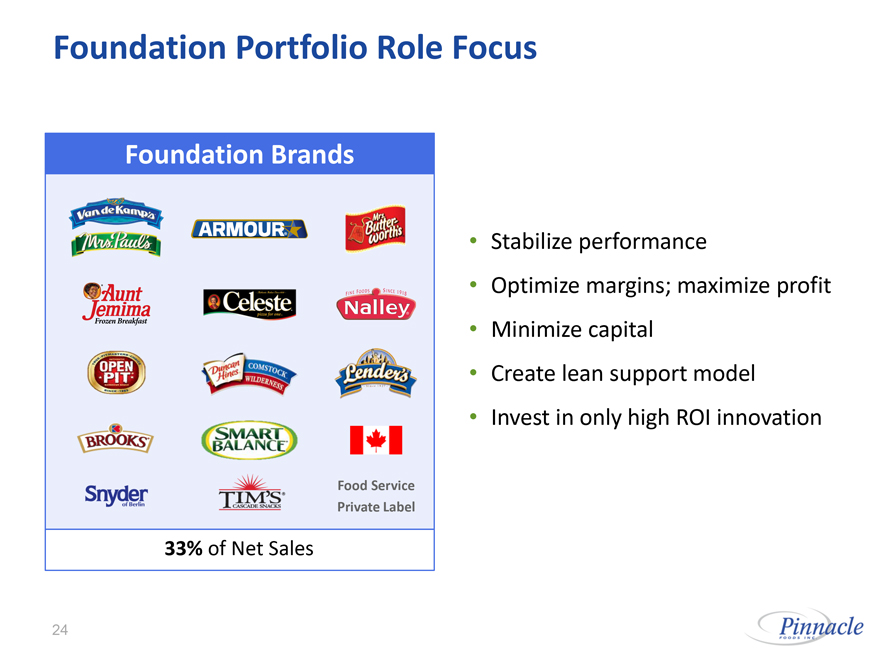
Foundation Portfolio Role Focus
Foundation Brands
Food Service
Private Label
33% of Net Sales
Stabilize performance
Optimize margins; maximize profit
Minimize capital
Create lean support model
Invest in only high ROI innovation
24 Pinnacle FOODS INC.
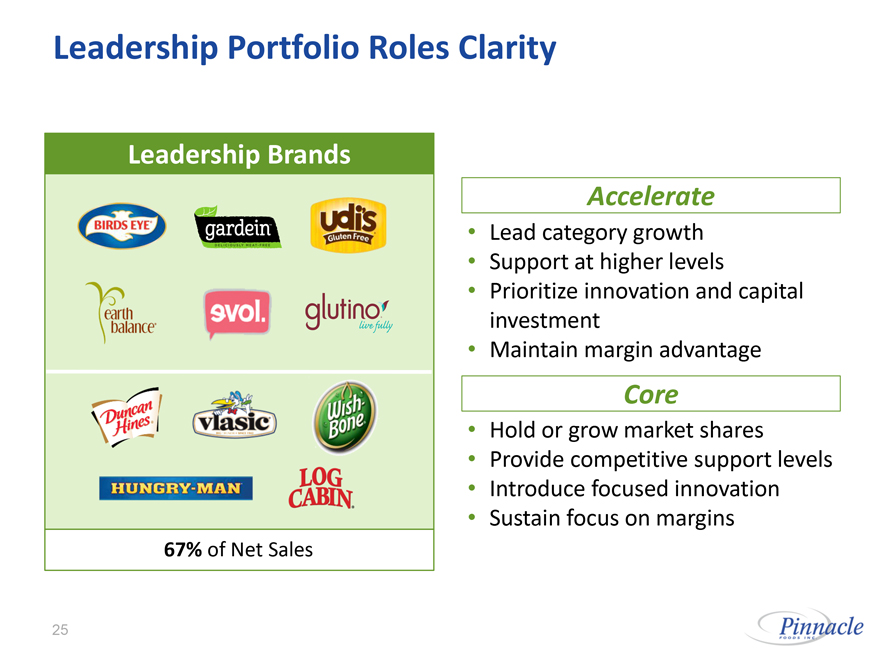
Leadership Portfolio Roles Clarity
Leadership Brands
67% of Net Sales
Accelerate
Lead category growth
Support at higher levels
Prioritize innovation and capital investment
Maintain margin advantage
Core
Hold or grow market shares
Provide competitive support levels
Introduce focused innovation
Sustain focus on margins
25 Pinnacle FOODS INC.
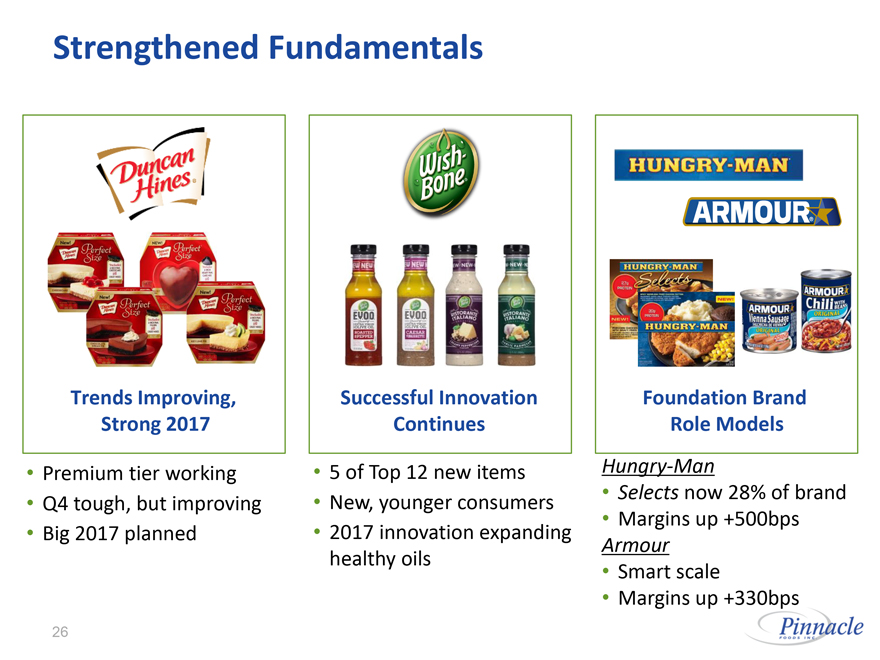
Strengthened Fundamentals
Trends Improving, Strong 2017
Premium tier working
Q4 tough, but improving
Big 2017 planned
Successful Innovation Continues
5 of Top 12 new items
New, younger consumers
2017 innovation expanding healthy oils
Foundation Brand Role Models
Hungry-Man
Selects now 28% of brand
Margins up +500bps
Armour
Smart scale
Margins up +330bps
26 Pinnacle FOODS INC.
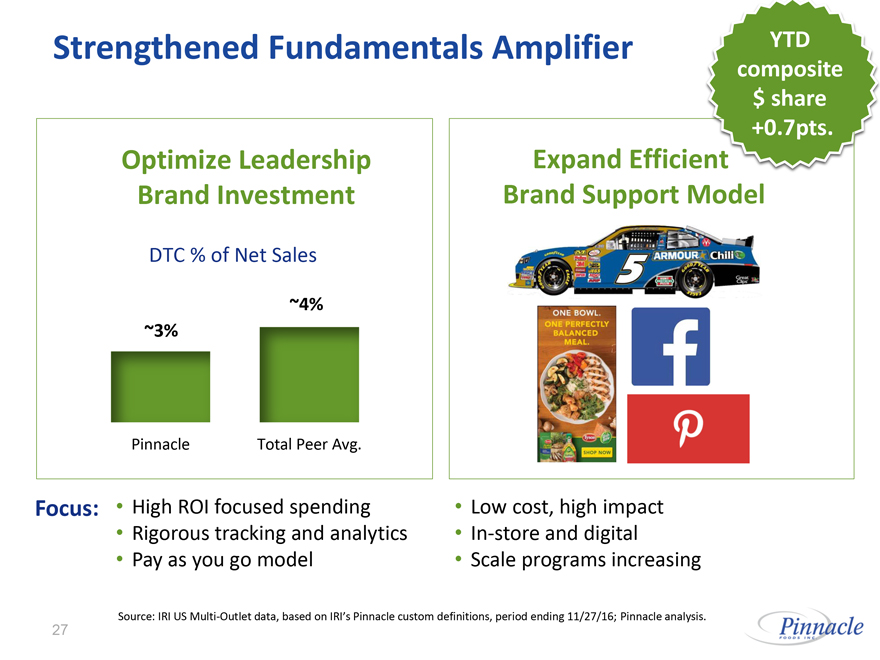
Strengthened Fundamentals Amplifier
YTD composite $ share +0.7pts.
Optimize Leadership Brand Investment
DTC % of Net Sales
~3%
Pinnacle
~4%
Total Peer Avg.
Focus: High ROI focused spending
Rigorous tracking and analytics
Pay as you go model
Expand Efficient
Brand Support Model
ARMOUR Chili
ONE BOWL
ONE PERFECTLY
BALANCED
MEAL.
f p
Low cost, high impact
In-store and digital
Scale programs increasing
Source: IRI US Multi-Outlet data, based on IRI’s Pinnacle custom definitions, period ending 11/27/16; Pinnacle analysis.
27 Pinnacle FOODS INC.
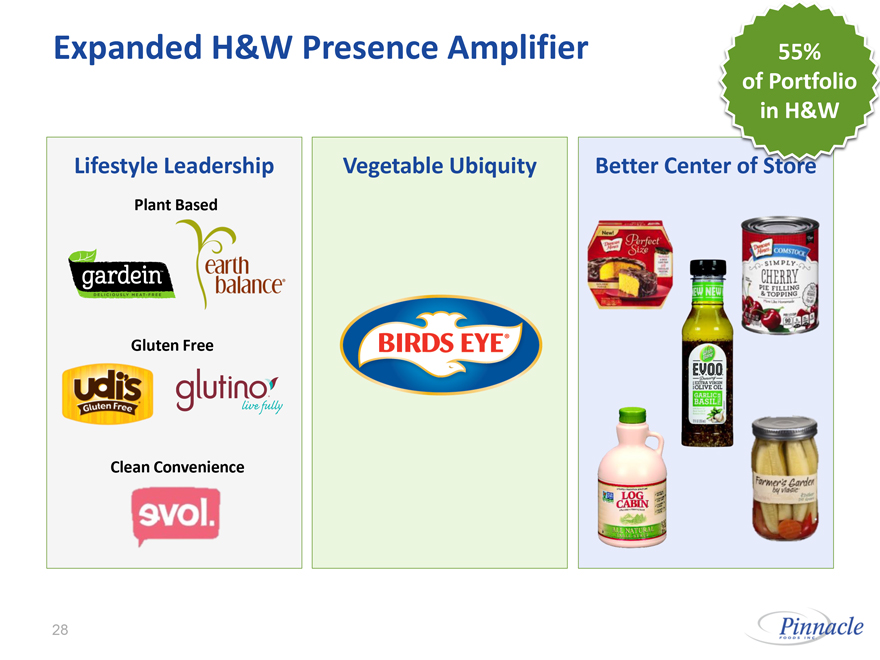
Expanded H&W Presence Amplifier
55% of Portfolio in H&W
Lifestyle Leadership
Plant Based
gardein
earth balance
Gluten Free
udis Gluten Free
glutino
live fully
Clean Convenience
evol.
Vegetable Ubiquity
BIRDS EYE
Better Center of Store
SIMPLY
CHERRY
PIE FILLING
& TOPPING
EVOO
EXTRA VIRGIN
OLIVE OIL
LOG CABIN
28 Pinnacle FOODS INC.
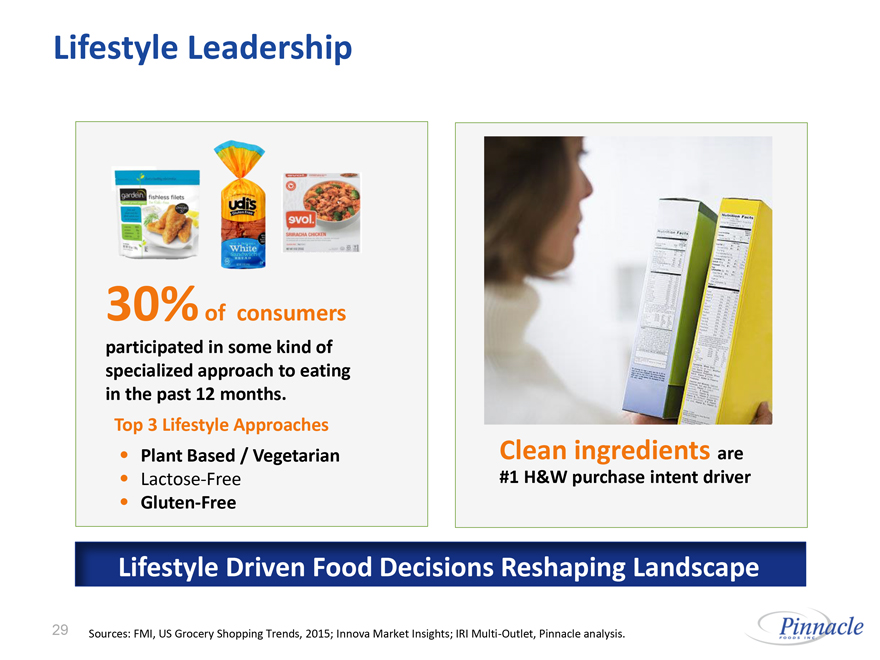
Lifestyle Leadership
30% of consumers
participated in some kind of specialized approach to eating in the past 12 months.
Top 3 Lifestyle Approaches
Plant Based / Vegetarian
Lactose-Free
Gluten-Free
Clean ingredients are #1 H&W purchase intent driver
Lifestyle Driven Food Decisions Reshaping Landscape
Sources: FMI, US Grocery Shopping Trends, 2015; Innova Market Insights; IRI Multi-Outlet, Pinnacle analysis.
29 Pinnacle FOODS INC.
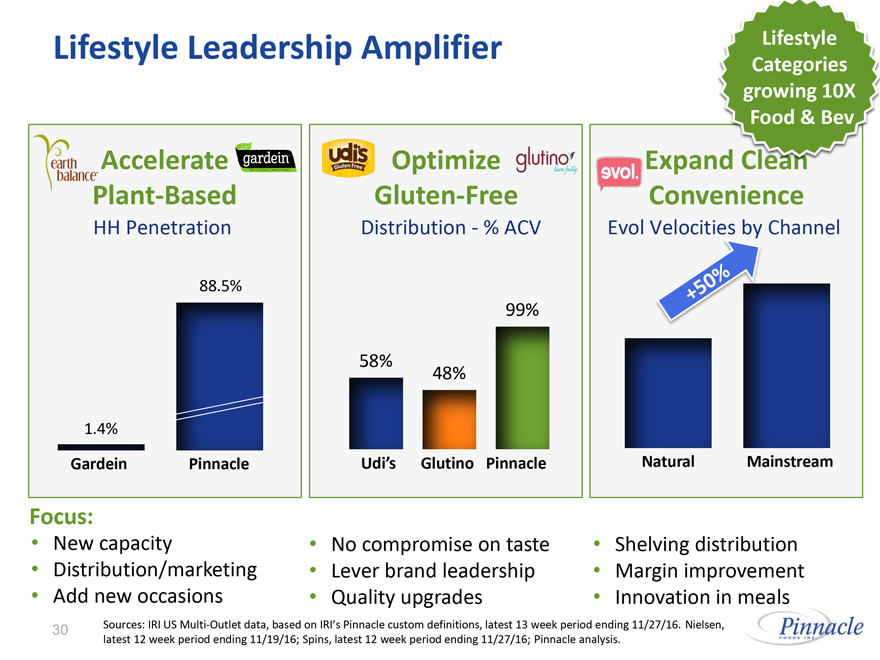
Lifestyle Leadership Amplifier
Lifestyle Categories growing 10X Food & Bev
earth balance
Accelerate
gardein
Plant-Based
HH Penetration
1.4% 88.5%
Gardein Pinnacle
udis
Optimize
glutino
Gluten-Free
Distribution - % ACV
58% 48% 99%
Udi’s Glutino Pinnacle
evol
Expand Clean Convenience
Evol Velocities by Channel
+50%
Natural Mainstream
Focus:
New capacity
Distribution/marketing
Add new occasions
No compromise on taste
Lever brand leadership
Quality upgrades
Shelving distribution
Margin improvement
Innovation in meals
Sources: IRI US Multi-Outlet data, based on IRI’s Pinnacle custom definitions, latest 13 week period ending 11/27/16. Nielsen, latest 12 week period ending 11/19/16; Spins, latest 12 week period ending 11/27/16; Pinnacle analysis.
30 Pinnacle FOODS INC.
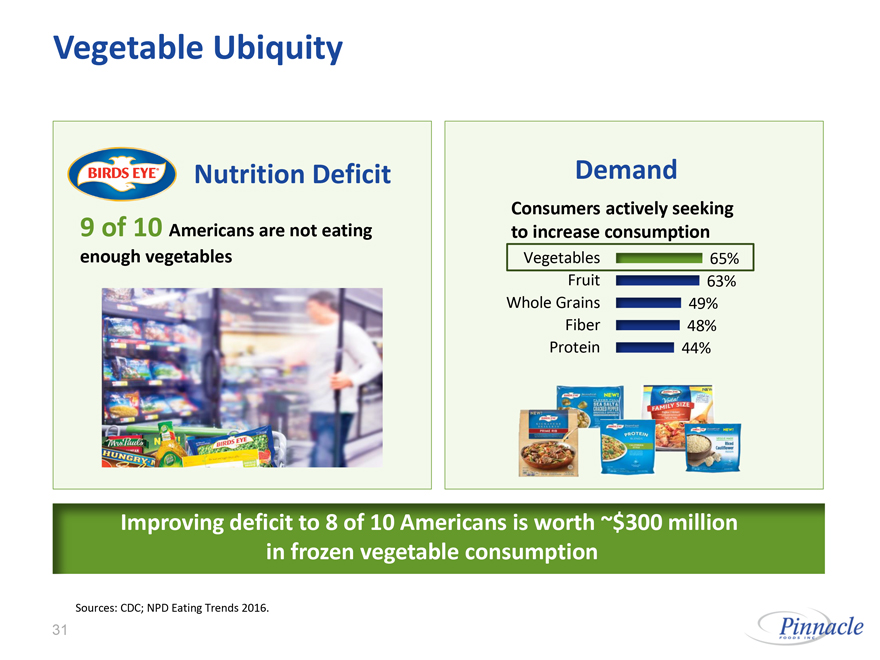
Vegetable Ubiquity
BIRDS EYE
Nutrition Deficit
9 of 10 Americans are not eating enough vegetables
Demand
Consumers actively seeking to increase consumption
Vegetables 65%
Fruit 63%
Whole Grains 49%
Fiber 48%
Protein 44%
Improving deficit to 8 of 10 Americans is worth ~$300 million in frozen vegetable consumption
Sources: CDC; NPD Eating Trends 2016.
31 Pinnacle FOODS INC.
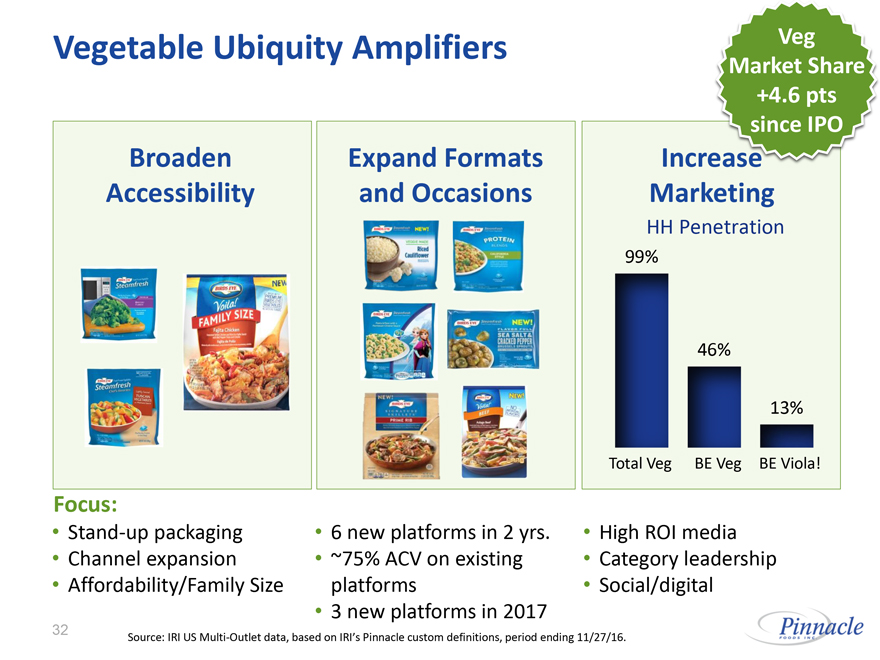
Vegetable Ubiquity Amplifiers
Veg Market Share +4.6 pts since IPO
Broaden Accessibility
Focus:
Stand-up packaging
Channel expansion
Affordability/Family Size
Expand Formats and Occasions
6 new platforms in 2 yrs.
~75% ACV on existing platforms
3 new platforms in 2017
Increase Marketing
HH Penetration
99% 46% 13%
Total Veg BE Veg BE Viola!
High ROI media
Category leadership
Social/digital
Source: IRI US Multi-Outlet data, based on IRI’s Pinnacle custom definitions, period ending 11/27/16.
32 Pinnacle FOODS INC.

Better Center of Store
43% of consumers planning on eating less processed foods this year
61% of households are1-2 persons, driving need for smaller servings size options
1% PF Center of Store Growth is worth ~$15 million in Net Sales
Sources: Mintel Oxygen American Lifestyles 2014: Looking Forward; US Census Bureau.
33 Pinnacle FOODS INC.
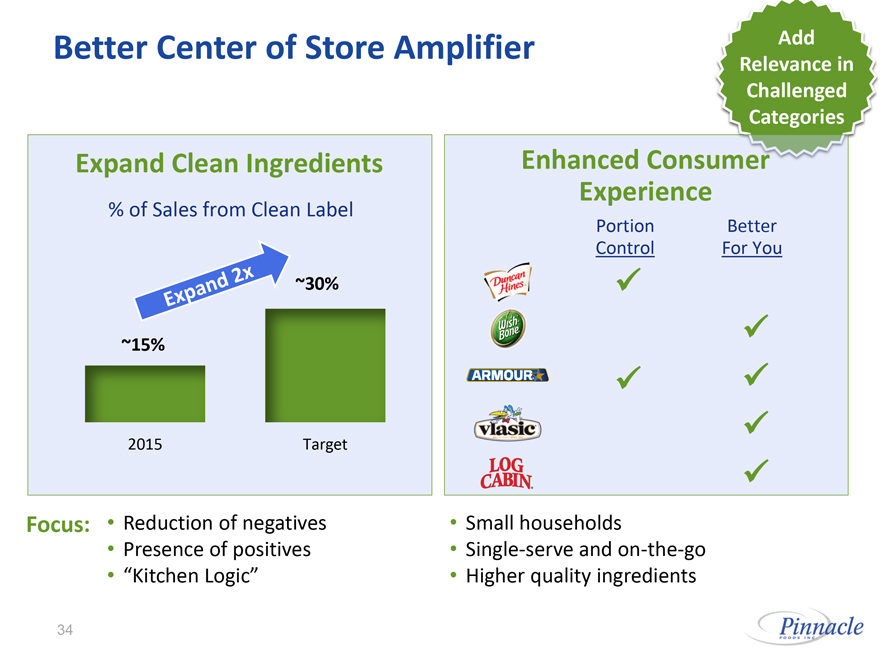
Better Center of Store Amplifier
Add Relevance in Challenged Categories
Expand Clean Ingredients
% of Sales from Clean Label
Expand 2x
~15% ~30%
2015 Target
Focus: Reduction of negatives
Presence of positives
“Kitchen Logic”
Enhanced Consumer Experience
Portion Better
Control For You
Duncan Hines
Wish Bone
ARMOUR
vlasic
LOG CABIN.
Small households
Single-serve andon-the-go
Higher quality ingredients
34 Pinnacle FOODS INC.
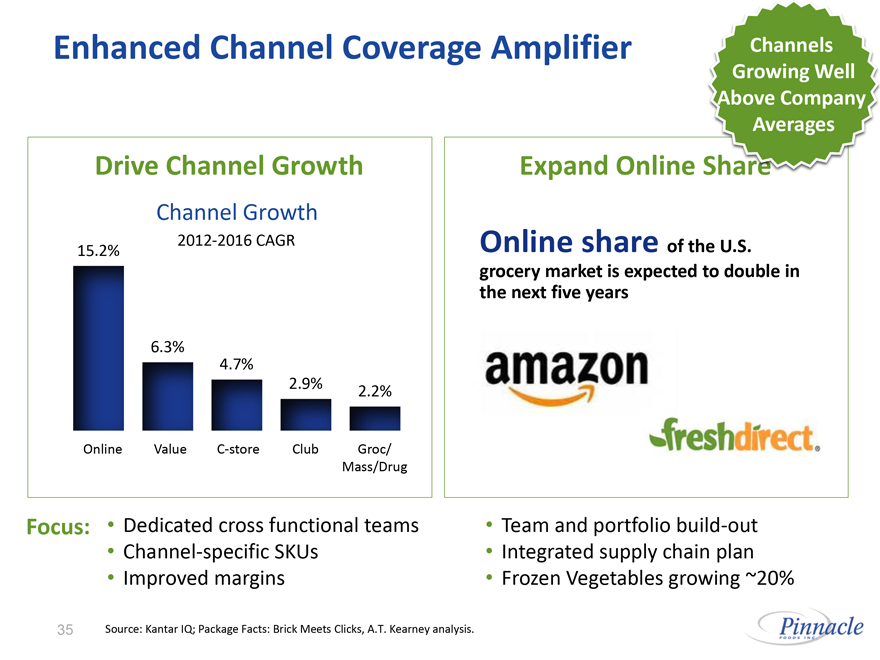
Enhanced Channel Coverage Amplifier
Channels Growing Well Above Company Averages
Drive Channel Growth
Channel Growth
2012-2016 CAGR
15.2% 6.3% 4.7% 2.9% 2.2%
Online ValueC-store Club Groc/
Mass/Drug
Focus: Dedicated cross functional teams
Channel-specific SKUs
Improved margins
Expand Online Share
Online share of the U.S. grocery market is expected to double in the next five years
amazon
freshdirect.
Team and portfoliobuild-out
Integrated supply chain plan
Frozen Vegetables growing ~20%
Source: Kantar IQ; Package Facts: Brick Meets Clicks, A.T. Kearney analysis.
35 Pinnacle FOODS INC.
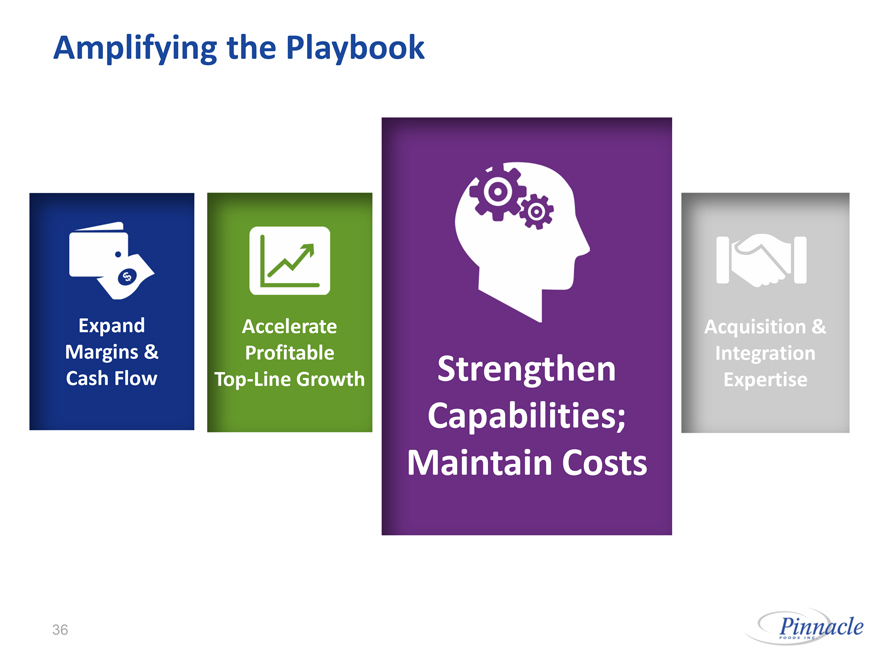
Amplifying the Playbook
Expand Margins & Cash Flow
Accelerate ProfitableTop-Line Growth
Strengthen Capabilities; Maintain Costs
Acquisition & Integration Expertise
36 Pinnacle FOODS INC.
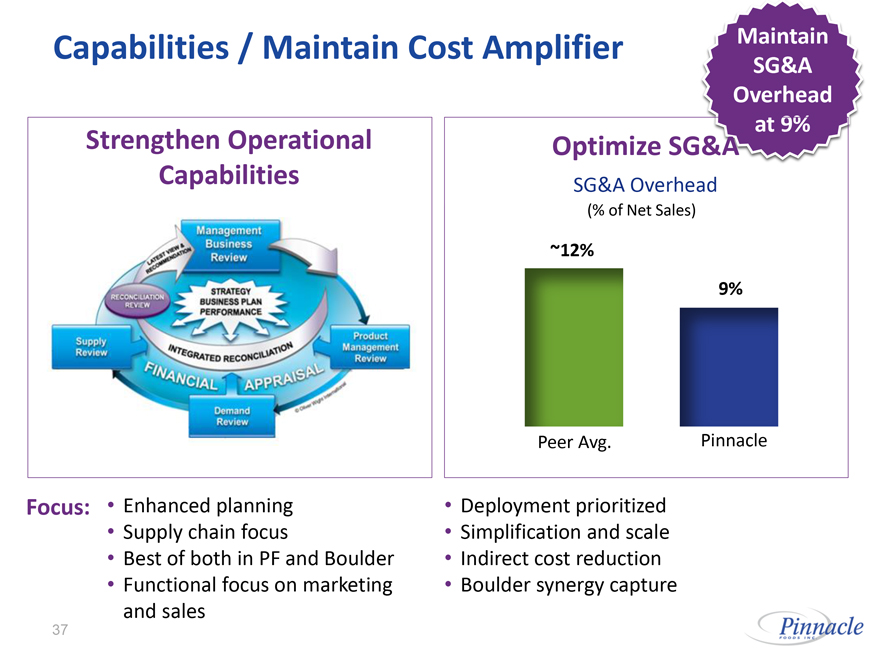
Capabilities / Maintain Cost Amplifier
Maintain SG&A Overhead at 9%
Strengthen Operational Capabilities
Management Business Review
RECONCILIATION REVIEW
STRATEGY BUSINESS PLAN PERFORMANCE
INTEGRATED RECONCILIATION
Supply Review
FINANCIAL APPRAISAL
Demand Review
Product Management Review
Focus: Enhanced planning
Supply chain focus
Best of both in PF and Boulder
Functional focus on marketing and sales
Optimize SG&A
SG&A Overhead
(% of Net Sales)
~12%
Peer Avg.
9%
Pinnacle
Deployment prioritized
Simplification and scale
Indirect cost reduction
Boulder synergy capture
37 Pinnacle FOODS INC.
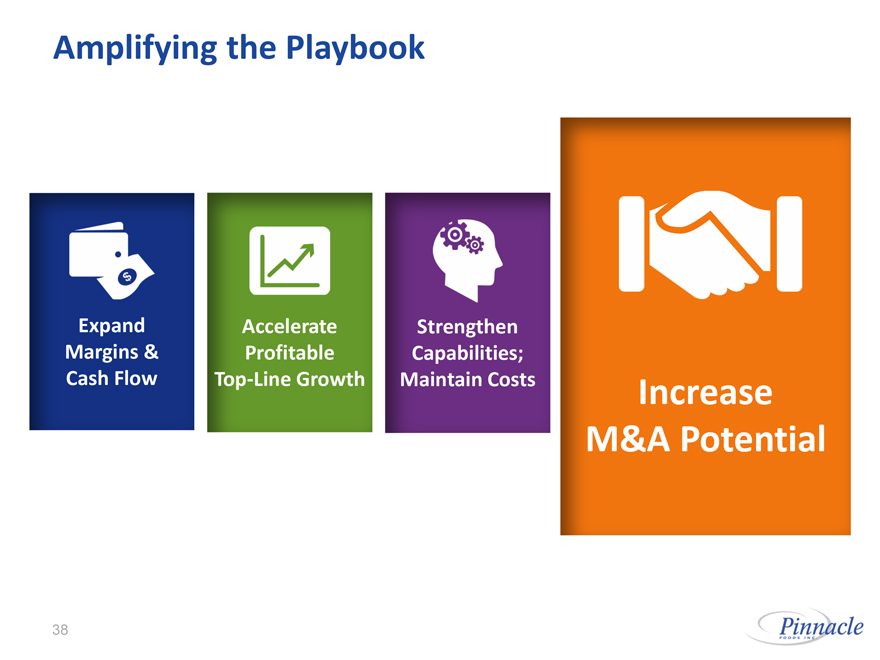
Amplifying the Playbook
$
Expand Margins & Cash Flow
Accelerate ProfitableTop-Line Growth
Strengthen Capabilities; Maintain Costs
Increase M&A Potential
38 Pinnacle FOODS INC.
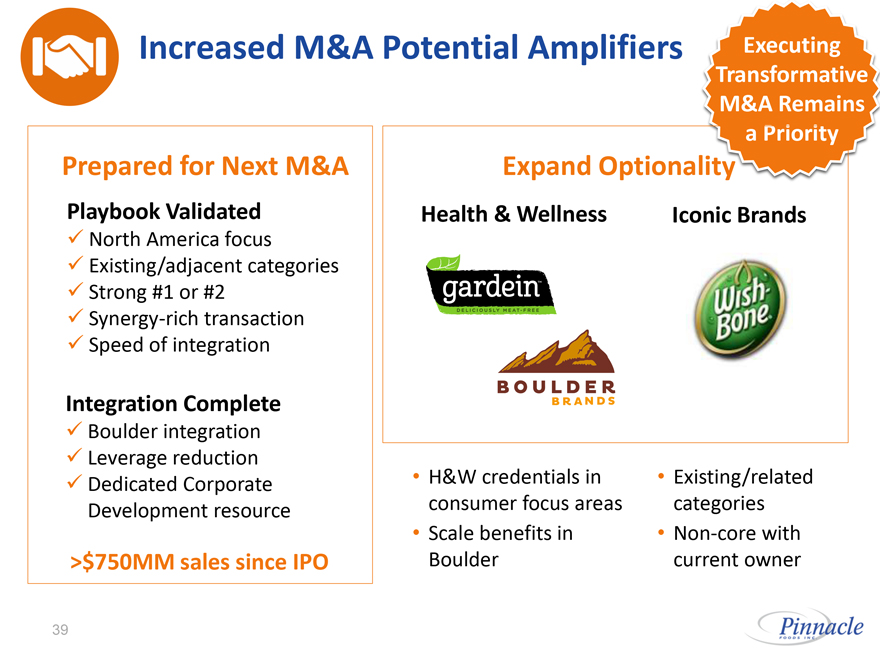
Increased M&A Potential Amplifiers
Executing Transformative M&A Remains a Priority
Prepared for Next M&A
Playbook Validated
North America focus
Existing/adjacent categories
Strong #1 or #2
Synergy-rich transaction
Speed of integration
Integration Complete
Boulder integration
Leverage reduction
Dedicated Corporate Development resource
>$750MM sales since IPO
Expand Optionality
Health & Wellness Iconic Brands
gardein
Wish Bone
BOULDER BRANDS
H&W credentials in consumer focus areas
Scale benefits in Boulder
Existing/related categories
Non-core with current owner
39 Pinnacle FOODS INC.
Agenda
Overview
Amplifying the Playbook
Financial Performance
Outlook
40 Pinnacle FOODS INC.
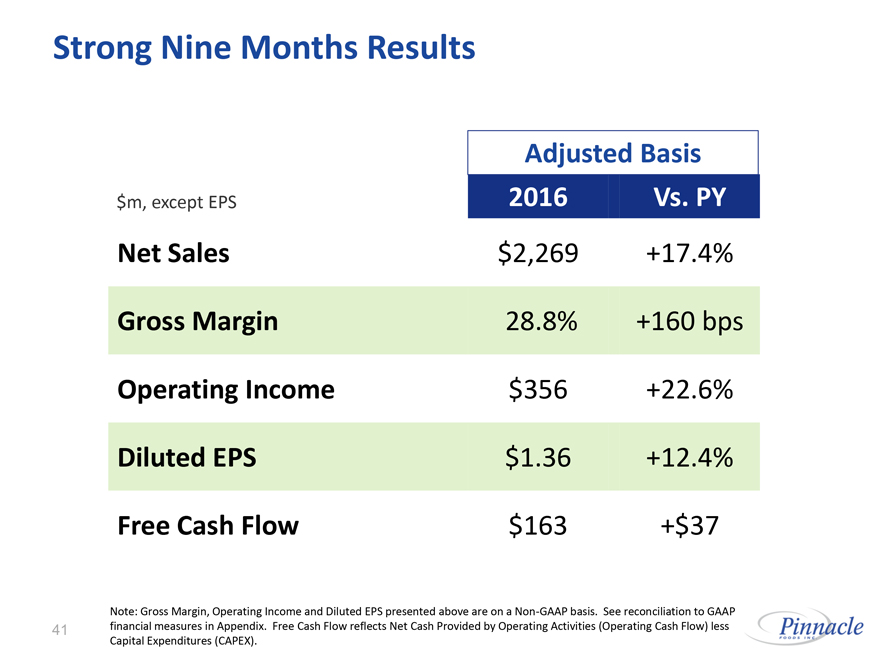
Strong Nine Months Results
Adjusted Basis
$m, except EPS 2016 Vs. PY
Net Sales $2,269 +17.4%
Gross Margin 28.8% +160 bps
Operating Income $356 +22.6%
Diluted EPS $1.36 +12.4%
Free Cash Flow $163 +$37
Note: Gross Margin, Operating Income and Diluted EPS presented above are on aNon-GAAP basis. See reconciliation to GAAP financial measures in Appendix. Free Cash Flow reflects Net Cash Provided by Operating Activities (Operating Cash Flow) less Capital Expenditures (CAPEX).
41 Pinnacle FOODS INC.
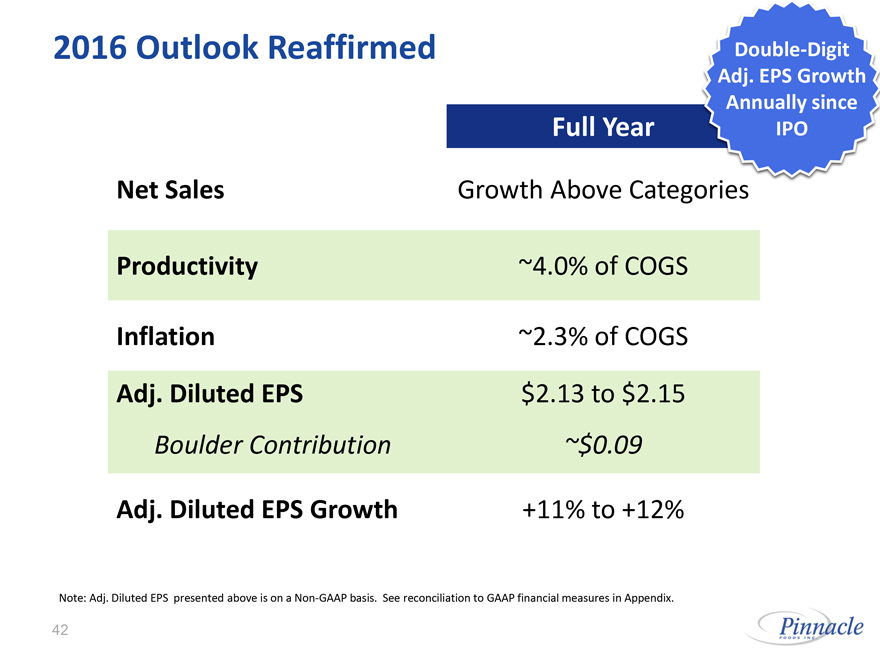
2016 Outlook Reaffirmed
Double-Digit Adj. EPS Growth Annually since IPO
Full Year
Net Sales Growth Above Categories
Productivity ~4.0% of COGS
Inflation ~2.3% of COGS
Adj. Diluted EPS $2.13 to $2.15
Boulder Contribution ~$0.09
Adj. Diluted EPS Growth +11% to +12%
Note: Adj. Diluted EPS presented above is on aNon-GAAP basis. See reconciliation to GAAP financial measures in Appendix.
42 Pinnacle FOODS INC.
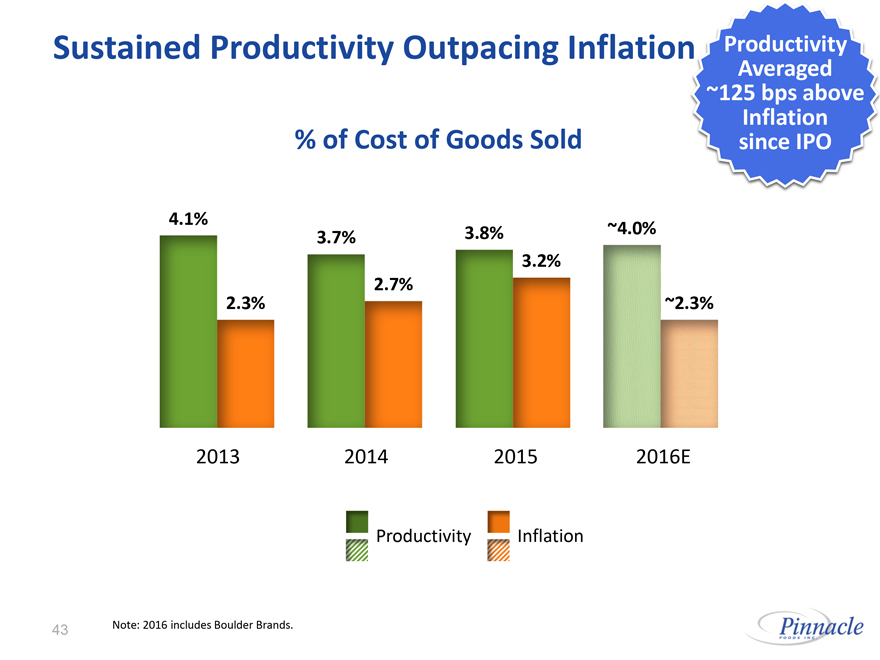
Sustained Productivity Outpacing Inflation
Productivity Averaged ~125 bps above Inflation since IPO
% of Cost of Goods Sold
4.1% 2.3% 3.7% 2.7% 3.8% 3.2% ~4.0% ~2.3%
2013 2014 2015 2016E
Productivity Inflation
Note: 2016 includes Boulder Brands.
43 Pinnacle FOODS INC.
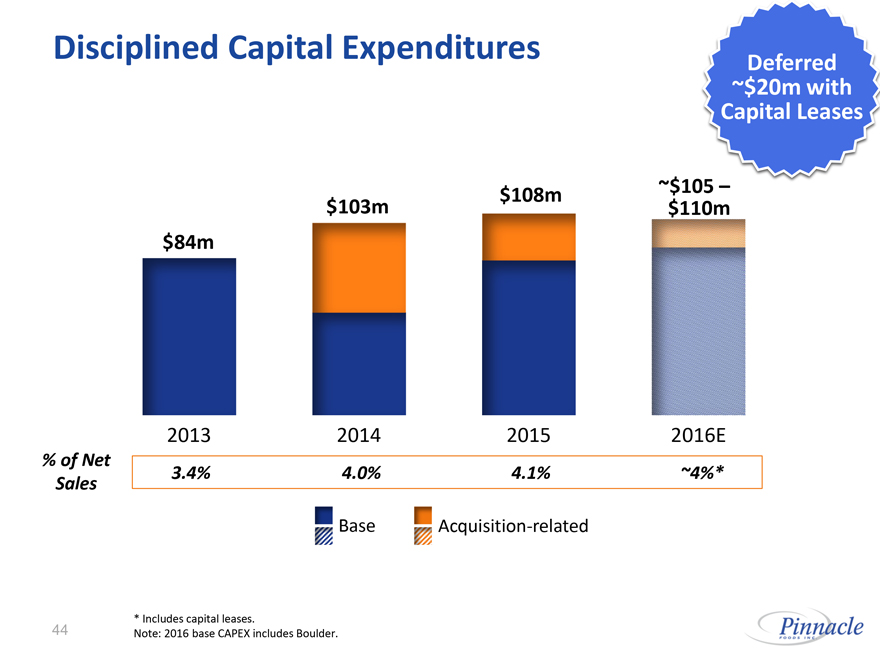
Disciplined Capital Expenditures
Deferred ~$20m with Capital Leases
$84m $103m $108m
$105 – $110m
2013 2014 2015 2016E
% of Net Sales 3.4% 4.0% 4.1% ~4%*
Base Acquisition-related
* Includes capital leases.
Note: 2016 base CAPEX includes Boulder.
44 Pinnacle FOODS INC.
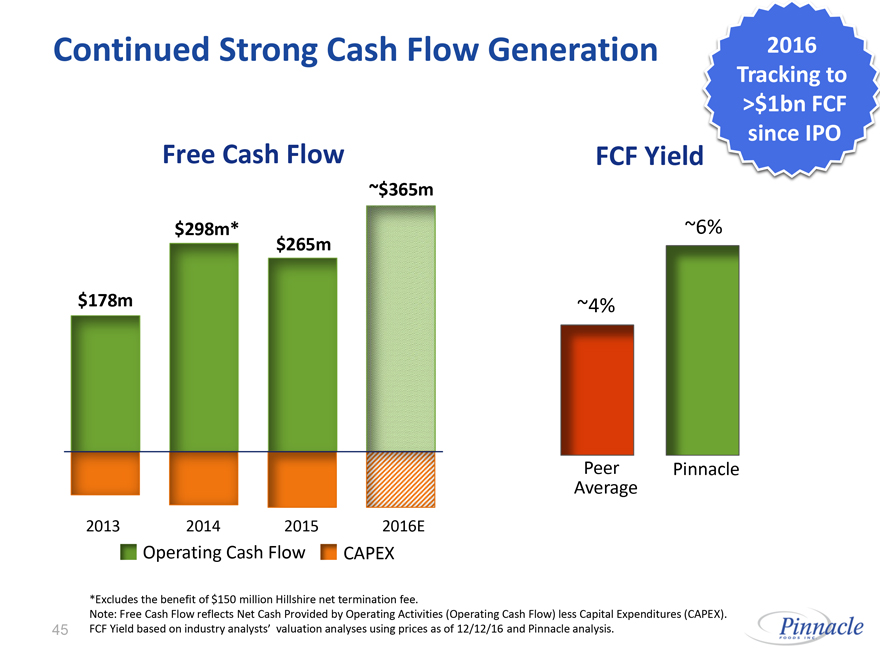
Continued Strong Cash Flow Generation
2016 Tracking to >$1bn FCF since IPO
Free Cash Flow
$178m $298m* $265m ~$365m
2013 2014 2015 2016E
Operating Cash Flow CAPEX
FCF Yield
~4% ~6%
Peer Average Pinnacle
*Excludes the benefit of $150 million Hillshire net termination fee.
Note: Free Cash Flow reflects Net Cash Provided by Operating Activities (Operating Cash Flow) less Capital Expenditures (CAPEX).
FCF Yield based on industry analysts’ valuation analyses using prices as of 12/12/16 and Pinnacle analysis.
45 Pinnacle FOODS INC.
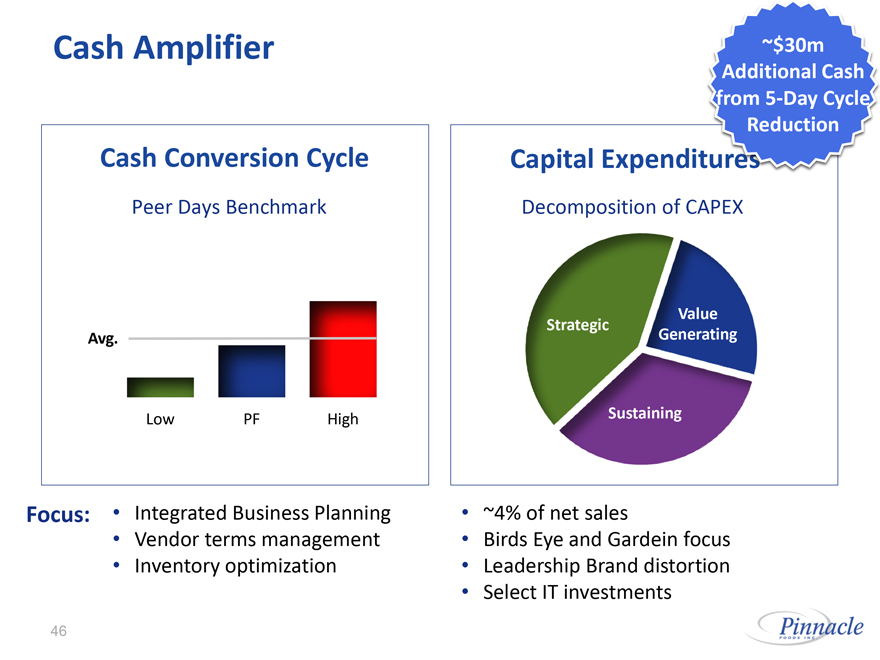
Cash Amplifier
~$30m Additional Cash from5-Day Cycle Reduction
Cash Conversion Cycle
Peer Days Benchmark
Avg.
Low PF High
Focus: Integrated Business Planning
Vendor terms management
Inventory optimization
Capital Expenditures
Decomposition of CAPEX
Strategic Value Generating
Sustaining
~4% of net sales
Birds Eye and Gardein focus
Leadership Brand distortion
Select IT investments
46 Pinnacle FOODS INC.
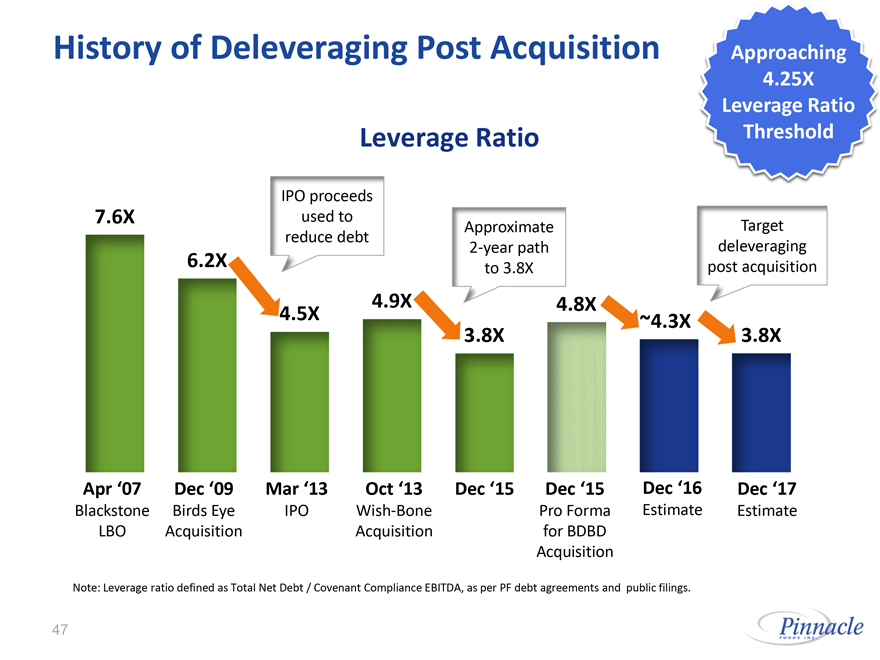
History of Deleveraging Post Acquisition
Approaching 4.25X Leverage Ratio Threshold
Leverage Ratio
IPO proceeds used to reduce debt
Approximate2-year path to 3.8X
Target deleveraging post acquisition
7.6X 6.2X 4.5X 4.9X 3.8X 4.8X
~4.3X 3.8X
Apr ‘07 Blackstone LBO Dec ‘09 Birds Eye Acquisition Mar ‘13 IPO Oct ‘13 Wish-Bone Acquisition Dec ‘15 Dec ‘15 Pro Forma for BDBD Acquisition Dec ‘16 Estimate Dec ‘17 Estimate
Note: Leverage ratio defined as Total Net Debt / Covenant Compliance EBITDA, as per PF debt agreements and public filings.
47 Pinnacle FOODS INC.
Agenda
Overview
Amplifying the Playbook
Financial Performance
Outlook
48 Pinnacle FOODS INC.
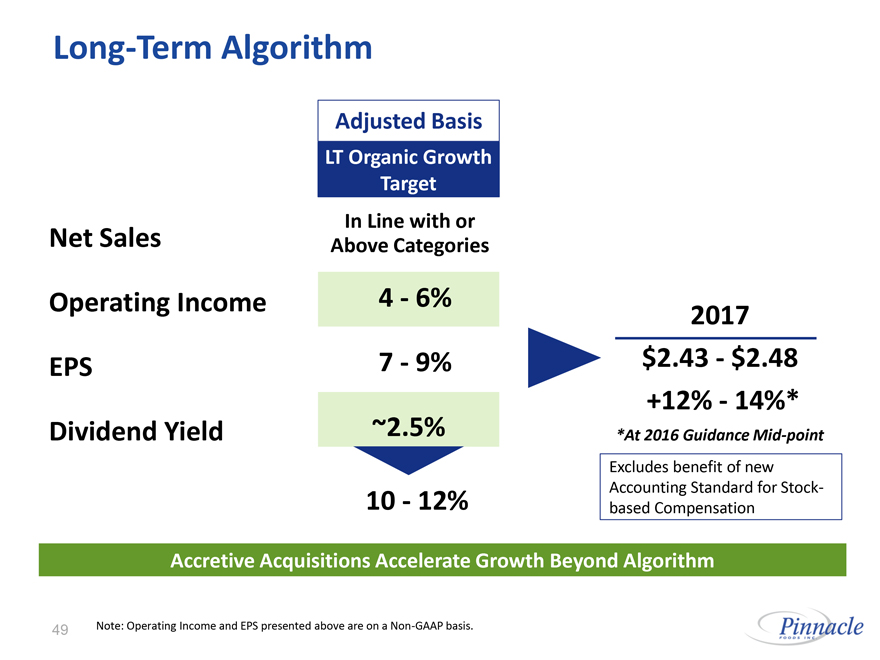
Long-Term Algorithm
Adjusted Basis
LT Organic Growth Target
In Line with or
Net Sales Above Categories
Operating Income 4 - 6%
EPS 7 - 9%
Dividend Yield
~2.5%
10 - 12%
2017
$2.43 - $2.48
+12% - 14%*
*At 2016 GuidanceMid-point
Excludes benefit of new Accounting Standard for Stock- based Compensation
Accretive Acquisitions Accelerate Growth Beyond Algorithm
Note: Operating Income and EPS presented above are on aNon-GAAP basis.
49 Pinnacle FOODS INC.
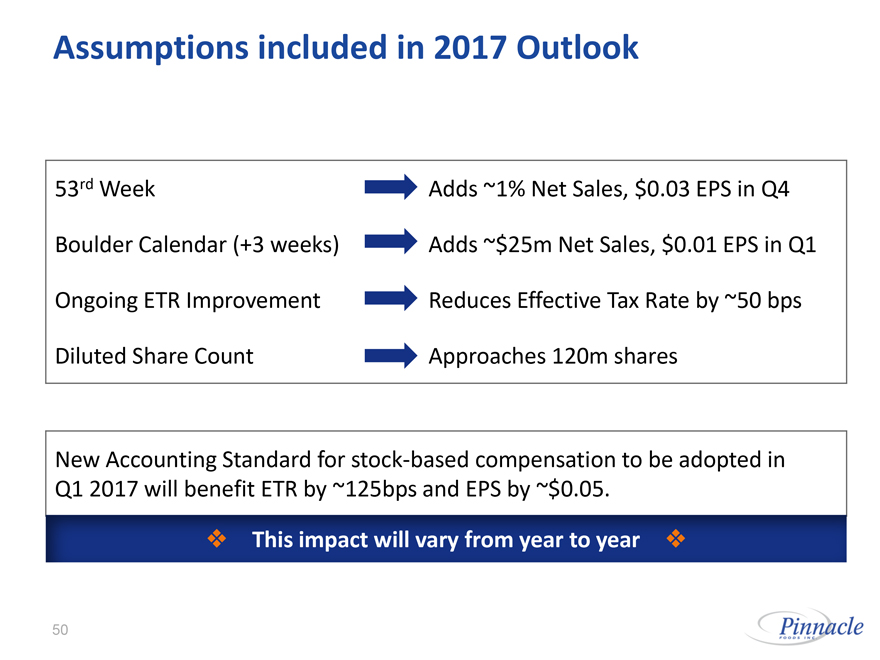
Assumptions included in 2017 Outlook
53rd Week Adds
~1% Net Sales, $0.03 EPS in Q4
Boulder Calendar (+3 weeks) Adds
~$25m Net Sales, $0.01 EPS in Q1
Ongoing ETR Improvement Reduces Effective Tax Rate by
~50 bps
Diluted Share Count Approaches 120m shares
New Accounting Standard for stock-based compensation to be adopted in Q1 2017 will benefit ETR by ~125bps and EPS by ~$0.05.
This impact will vary from year to year
50 Pinnacle FOODS INC.

Amplifying the Playbook
$
Expand Margins & Cash Flow
Accelerate ProfitableTop-Line Growth
Strengthen Capabilities; Maintain Costs
Increase M&A Potential
51 Pinnacle FOODS INC.
Pinnacle Foods
Appendix
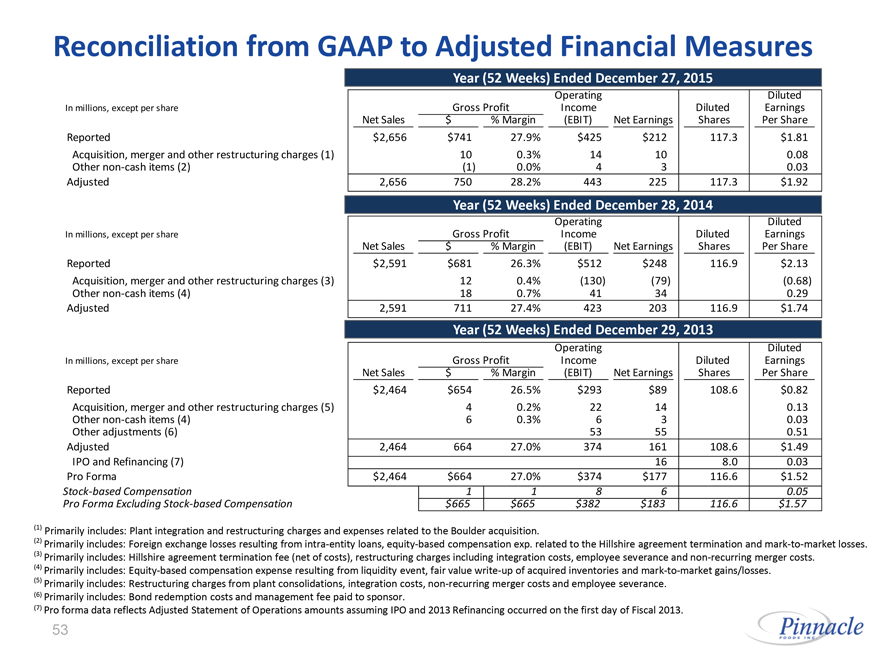
Reconciliation from GAAP to Adjusted Financial Measures
Year (52 Weeks) Ended December 27, 2015
Gross Profit Operating Diluted
In millions, except per share Income Diluted Earnings
Net Sales $ % Margin (EBIT) Net Earnings Shares Per Share
Reported $2,656 $741 27.9% $425 $212 117.3 $1.81
Acquisition, merger and other restructuring charges (1) 10 0.3% 14 10 0.08
Othernon-cash items (2) (1) 0.0% 4 3 0.03
Adjusted 2,656 750 28.2% 443 225 117.3 $1.92
Year (52 Weeks) Ended December 28, 2014
Operating Diluted
In millions, except per share Gross Profit Income Diluted Earnings
Net Sales $ % Margin (EBIT) Net Earnings Shares Per Share
Reported $2,591 $681 26.3% $512 $248 116.9 $2.13
Acquisition, merger and other restructuring charges (3) 12 0.4% (130) (79) (0.68)
Othernon-cash items (4) 18 0.7% 41 34 0.29
Adjusted 2,591 711 27.4% 423 203 116.9 $1.74
Year (52 Weeks) Ended December 29, 2013
Operating Diluted
In millions, except per share Gross Profit Income Diluted Earnings
Net Sales $ % Margin (EBIT) Net Earnings Shares Per Share
Reported $2,464 $654 26.5% $293 $89 108.6 $0.82
Acquisition, merger and other restructuring charges (5) 4 0.2% 22 14 0.13
Othernon-cash items (4) 6 0.3% 6 3 0.03
Other adjustments (6) 53 55 0.51
Adjusted 2,464 664 27.0% 374 161 108.6 $1.49
IPO and Refinancing (7) 16 8.0 0.03
Pro Forma $2,464 $664 27.0% $374 $177 116.6 $1.52
Stock-based Compensation 1 1 8 6 0.05
Pro Forma Excluding Stock-based Compensation $665 $665 $382 $183 116.6 $1.57
(1) Primarily includes: Plant integration and restructuring charges and expenses related to the Boulder acquisition.
(2) Primarily includes: Foreign exchange losses resulting from intra-entity loans, equity-based compensation exp. related to the Hillshire agreement termination andmark-to-market losses.
(3) Primarily includes: Hillshire agreement termination fee (net of costs), restructuring charges including integration costs, employee severance andnon-recurring merger costs.
(4) Primarily includes: Equity-based compensation expense resulting from liquidity event, fair valuewrite-up of acquired inventories andmark-to-market gains/losses.
(5) Primarily includes: Restructuring charges from plant consolidations, integration costs,non-recurring merger costs and employee severance.
(6) Primarily includes: Bond redemption costs and management fee paid to sponsor.
(7) Pro forma data reflects Adjusted Statement of Operations amounts assuming IPO and 2013 Refinancing occurred on the first day of Fiscal 2013.
53 Pinnacle FOODS INC.
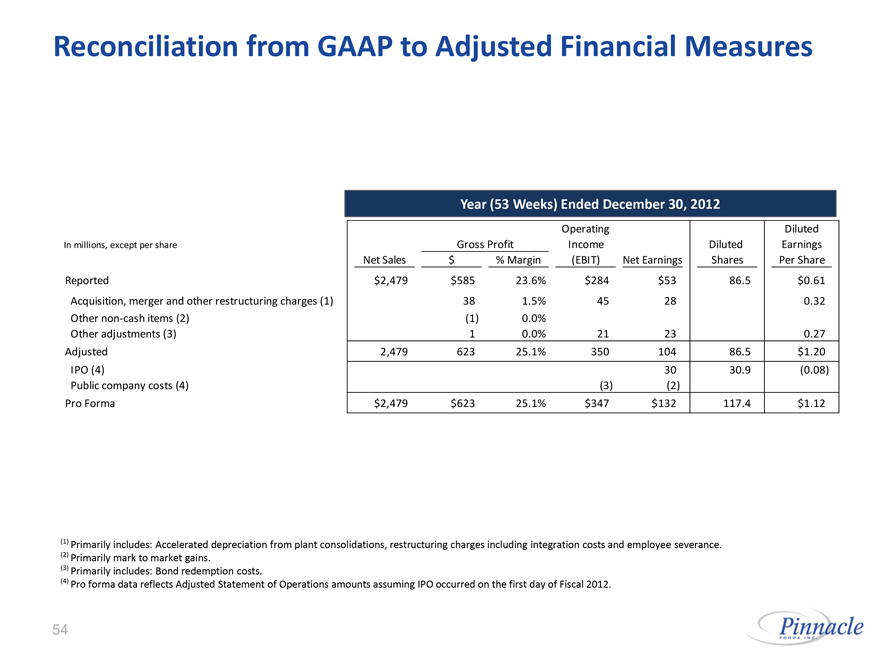
Reconciliation from GAAP to Adjusted Financial Measures
Year (53 Weeks) Ended December 30, 2012
In millions, except per share Net Sales Gross Profit $ % Margin Operating Income (EBIT) Net Earnings Diluted Shares Diluted Earnings Per Share
Reported $2,479 $585 23.6% $284 $53 86.5 $0.61
Acquisition, merger and other restructuring charges (1) 38 1.5% 45 28 0.32
Othernon-cash items (2) (1) 0.0%
Other adjustments (3) 1 0.0% 21 23 0.27
Adjusted 2,479 623 25.1% 350 104 86.5 $1.20
IPO (4) 30 30.9 (0.08)
Public company costs (4) (3) (2)
Pro Forma $2,479 $623 25.1% $347 $132 117.4 $1.12
(1) Primarily includes: Accelerated depreciation from plant consolidations, restructuring charges including integration costs and employee severance.
(2) Primarily mark to market gains.
(3) Primarily includes: Bond redemption costs.
(4) Pro forma data reflects Adjusted Statement of Operations amounts assuming IPO occurred on the first day of Fiscal 2012.
54 Pinnacle FOODS INC.
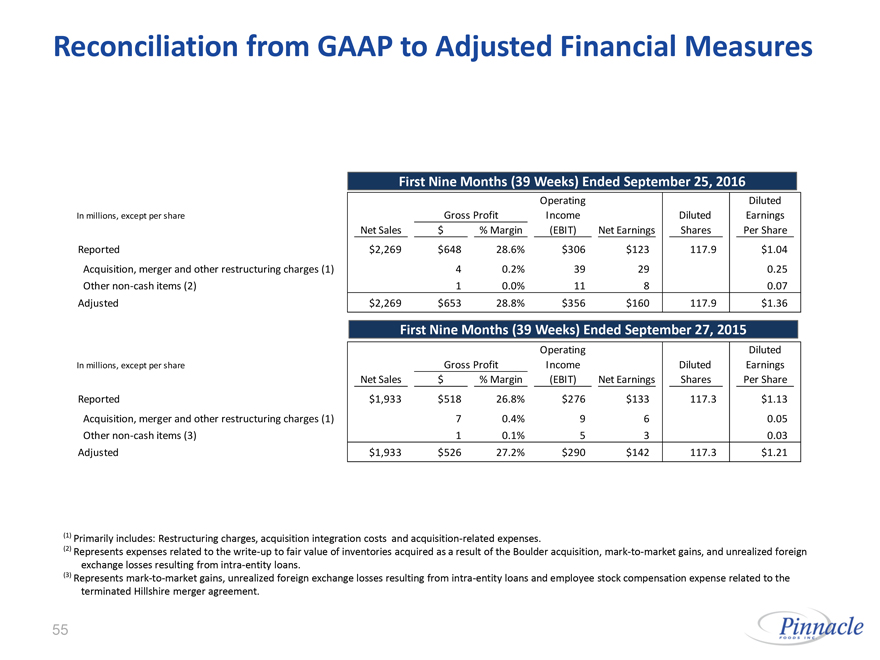
Reconciliation from GAAP to Adjusted Financial Measures
First Nine Months (39 Weeks) Ended September 25, 2016
In millions, except per share Net Sales Gross Profit $ % Margin Operating Income (EBIT) Net Earnings Diluted Shares Diluted Earnings Per Share
Reported $2,269 $648 28.6% $306 $123 117.9 $1.04
Acquisition, merger and other restructuring charges (1) 4 0.2% 39 29 0.25
Othernon-cash items (2) 1 0.0% 11 8 0.07
Adjusted $2,269 $653 28.8% $356 $160 117.9 $1.36
First Nine Months (39 Weeks) Ended September 27, 2015
In millions, except per share Gross Profit Operating Income Diluted Diluted Earnings
Net Sales $ % Margin (EBIT) Net Earnings Shares Per Share
Reported $1,933 $518 26.8% $276 $133 117.3 $1.13
Acquisition, merger and other restructuring charges (1) 7 0.4% 9 6 0.05
Othernon-cash items (3) 1 0.1% 5 3 0.03
Adjusted $1,933 $526 27.2% $290 $142 117.3 $1.21
(1) Primarily includes: Restructuring charges, acquisition integration costs and acquisition-related expenses.
(2) Represents expenses related to thewrite-up to fair value of inventories acquired as a result of the Boulder acquisition,mark-to-market gains, and unrealized foreign exchange losses resulting from intra-entity loans.
(3) Representsmark-to-market gains, unrealized foreign exchange losses resulting from intra-entity loans and employee stock compensation expense related to the terminated Hillshire merger agreement.
55 Pinnacle FOODS INC.