SUPPLEMENT dated April 21, 2014
(To Prospectus Supplement dated January 28, 2013
to Prospectus dated September 13, 2012)
Sequoia MORTGAGE Trust 2013-2
Mortgage Pass-Through Certificates, Series 2013-2
RWT Holdings, Inc., Sponsor
Redwood Residential Acquisition Corporation, Seller
Sequoia Residential Funding, Inc., Depositor
Sequoia Mortgage Trust 2013-2, Issuing Entity
The prospectus supplement is hereby revised as follows:
1. The following paragraph supplements the information on the cover page of the prospectus supplement:
“RBS Securities, Inc. (the “underwriter” with respect to the initial public offering hereby of the Class A-IO1 Certificates) previously purchased from the Depositor the Class A-IO1 Certificates with an initial class notional amount of $619,163,000.00 on January 30, 2013. Proceeds to the Depositor from such sale to the underwriter were $10,661,986.86 before deducting expenses. The underwriter now intends to offer the Class A-IO1 Certificates from time to time for sale to the public in negotiated transactions or otherwise at varying prices determined at the time of sale. Compensation to the underwriter will equal the excess, if any, of the purchase price received by the underwriter over the underwriter’s purchase price specified above, taking into account payments received by the underwriter since the date of its initial purchase. The class notional amount of the Class A-IO1 Certificates as of the date of this supplement is $542,802,418.94; if investors purchase the Class A-IO1 Certificates prior to the scheduled distribution date occurring on April 25, 2014, they will not be entitled to payments made on such distribution date and will receive their first payment on the distribution date occurring on May 27, 2014.”
(continued on following pages)
This supplement may be used to offer or sell the certificates offered hereby only if accompanied by the prospectus supplement and the prospectus described above, which should be read in their entirety by anyone considering an investment in the certificates.
Consider carefully the risk factors beginning on page S-14 of the prospectus supplement.
The investments referred to above are not insured or guaranteed by any governmental agency. Offers of these securities are made by prospectus.
Neither the Securities and Exchange Commission nor any state securities commission has approved or disapproved these securities or determined if the prospectus supplement listed above, the accompanying prospectus or this supplement are accurate or complete. Any representation to the contrary is a criminal offense.

Underwriter
2. The information in “SUMMARY OF TERMS – Master Servicer and Securities Administrator” is replaced in its entirety with the followings:
“Wells Fargo Bank, N.A. will act as master servicer for the mortgage loans pursuant to the pooling and servicing agreement.
Citibank, N.A., a national banking association and wholly owned subsidiary of Citigroup Inc., a Delaware corporation, will act as securities administrator for the certificates pursuant to the pooling and servicing agreement.
As securities administrator, Citibank, N.A. will perform certain administrative duties with respect to the certificates, on behalf of the trustee, including acting as authentication agent, calculation agent, paying agent, certificate registrar and the party responsible for preparing distribution statements and tax information for certificateholders and preparing tax filings for the issuing entity.”
3. The third paragraph of the Risk Factor entitled “Recent Trends in the Residential Mortgage Market May Adversely Affect the Performance and Market Value of Your Certificates” is replaced with the following:
“Current market conditions may impair borrowers’ ability to refinance or sell their residential properties, which may also contribute to higher delinquency and default rates. In response to increased delinquencies and losses with respect to mortgage loans, many mortgage loan originators recently have implemented more restrictive underwriting criteria for mortgage loans, which will likely result in reduced availability of refinancing alternatives for borrowers. The recent effectiveness of a final rule relating to “qualified mortgages” may further limit the availability of refinancing alternatives, as described more fully under “Financial Regulatory Reforms and Additional Proposed Regulations Could Have a Significant Impact on the Depositor, the Servicers or Any Successor Servicer or on the Value of the Certificates” below. These risks would be exacerbated to the extent that prevailing mortgage interest rates increase from current levels. Home price depreciation experienced to date, and any further price depreciation, may also leave borrowers with insufficient equity in their homes to enable them to refinance. Borrowers who intend to sell their homes on or before the maturity of their mortgage loans may find that they cannot sell their property for an amount equal to or greater than the unpaid principal balance of their mortgage loans. While some mortgage loan originators and servicers have created or otherwise are participating in modification programs in order to assist borrowers with refinancing or otherwise meeting their payment obligations, not all borrowers will qualify for or will take advantage of these opportunities.”
4. The fourth and fifth paragraphs of the Risk Factor entitled “Financial Regulatory Reforms and Additional Proposed Regulations Could Have a Significant Impact on the Depositor, the Servicers or Any Successor Servicer or on the Value of the Certificates” are replaced with the following:
“The Dodd-Frank Act also prohibits lenders from originating residential mortgage loans unless the lender determines that the borrower has a reasonable ability to repay the loan. Under the Dodd-Frank Act, a lender and its assignees will not have liability under this prohibition with respect to any “qualified mortgage.” The CFPB has issued a final rule, which became effective on January 10, 2014, specifying the characteristics of a qualified mortgage for this purpose. Interest-only loans, hybrid mortgage loans and balloon loans, as well as loans with a debt-to-income ratio exceeding 43%, in general do not constitute qualified mortgages. The final rule may result in a reduction in the availability of these types of loans in the future and may adversely affect the ability of mortgagors to refinance mortgage loans included in the mortgage pool. The final rule is not applicable to the mortgage loans included in the mortgage pool and no assurances are given as to the effect of the new rule on the value of your certificates.
| 2 |
On August 28, 2013, the SEC issued a release soliciting public comment on re-proposed rules that were first proposed in March 2011. If adopted, the re-proposed rules would require, among other things, that the sponsor or an affiliate of the sponsor retain at least 5% of the credit risk of a non-exempt securitization, and in general prohibit, for a period of at least five (5) years after the close of the securitization, the transfer or hedging, and restrict the pledge, of the retained credit risk. In April 2010, the SEC proposed rules, some of which were re-proposed in July 2011, that, if adopted, would further revise substantially Regulation AB and other rules regarding the offering process, disclosure and reporting for publicly-issued asset-backed securities. Among other things, the proposed changes would require (i) enhanced disclosure of loan level information at the time of securitization and on an ongoing basis, (ii) that the transaction agreements provide for review of the underlying assets by an independent credit risk manager if certain trigger events occur and (iii) periodic assessments of an asset-backed security issuer’s continued ability to conduct shelf offerings. We cannot predict what effect the proposed rules will have, if adopted, on the marketability of asset-backed securities such as the certificates. In addition, if the proposed rules are adopted, your certificates, which may not be subject to all of the requirements included in the proposed rules, may be less marketable than those that are offered in compliance with the proposed rules.”
5. The seventh paragraph of the Risk Factor entitled “Financial Regulatory Reforms and Additional Proposed Regulations Could Have a Significant Impact on the Depositor, the Servicers or Any Successor Servicer or on the Value of the Certificates” is replaced with the following:
“Prospective investors should be aware of the requirements of Articles 404 to 410 of the Capital Requirements Regulation (Regulation (EU) No. 575/2013 of 26 June, 2013) (the “CRR”). Articles 404 to 410 of the CRR have replaced, with effect from January 1, 2014, Article 122a of the Capital Requirements Directive (Directive 2006/48/EC (as amended by Directive 2009/111/EC) (the “CRD”). Credit institutions subject to Article 122a of the CRD were only able to be exposed to the credit risk of a securitization position if certain risk retention and ongoing due diligence requirements were complied with. Articles 404 to 410 of the CRR replaced and to some extent amended Article 122a of the CRD, including by extending its risk retention and due diligence requirements to “investment firms”, in addition to “credit institutions”, assuming exposure to a “securitisation position” (each as defined in the CRR). Furthermore, the current guidelines on Article 122a of the CRD will be replaced by new and potentially different regulatory technical standards in relation to which, the European Banking Authority published on December 17, 2013 the final draft regulatory technical standards (“RTS”) specifying, inter alia, securitization retention rules and related requirements, due diligence requirements, and final draft implementing technical standards (“ITS”) aimed at facilitating the convergence of supervisory practices related to the implementation of additional risk weighting in the case of non-compliance with the retention rules consultation paper. These RTS and ITS have been developed in accordance with article 410(2) and 410(3) respectively of the CRR. On December 17, 2013, the final standards were submitted by the European Banking Authority to the European Commission for their possible adoption as EU Regulations that would be directly applicable throughout the European Union. It is not clear, as at the date of this supplement, when the RTS and the ITS will be finalized and adopted by the European Commission and how any changes to the current regime will affect transactions entered into previously. No assurance can be given that the implementation throughout the European Union of the CRR and related legislation (including through the applicable regulatory technical standards) will not affect the requirements relating to investments in a securitisation position applying to relevant investors.
It should also be noted that similar, but not identical, requirements to those set out in Articles 404 to 410 of the CRR have been finalized for alternative investment fund managers which are required to become authorized under the European Union’s Alternative Investment Fund Managers Directive (Directive 2011/61/EU) (“AIFMD”). AIFMD has been implemented in the Member States of the European Union pursuant to Section 5 of Regulation (EU) No 231/2013 (the “AIFM Regulation”); Articles 50 to 56 of the AIFM Regulation contain the risk retention and diligence requirements applicable to alternative investment fund managers assuming exposure to securitisation positions on behalf of one or more alternative investment funds they manage. Similar requirements are expected to be implemented for other types of EU regulated investors or investment managers (for example, insurance and reinsurance undertakings) in the future.
| 3 |
Articles 404 to 410 of the CRR, Articles 50 to 56 of the AIFM Regulation, and any other changes to the regulation or regulatory treatment of the offered certificates for some or all investors or investment managers subject to regulation in the European Union may negatively impact the regulatory position of individual investors and, in addition, have a negative impact on the price and liquidity of the offered certificates in the secondary market. Although the sponsor or one or more affiliates will purchase the Class B-4 and Class B-5 Certificates at the closing, the sponsor is under no obligation to satisfy the minimum 5% net economic interest with respect to the offered certificates in one of the forms prescribed by Articles 404 to 410 of the CRR or Articles 50 to 56 of the AIFM Regulation, there is no obligation on the part of the sponsor to maintain any level of risk retention in a manner that would comply with Articles 404 to 410 of the CRR or Articles 50 to 56 of the AIFM Regulation, and none of the sponsor or affiliates of the sponsor make any representation or assurance to retain any such level of risk retention after the closing date. Investors who are subject to Articles 404 to 410 of the CRR or Articles 50 to 56 of the AIFM Regulation should consider carefully investing in the offered certificates as a failure to comply with one or more of the requirements set out in Articles 404 to 410 of the CRR or Articles 50 to 56 of the AIFM Regulation will result in the imposition of a penal capital charge in respect of the offered certificates acquired by the relevant investor.
Prospective investors should assess and determine independently their compliance with Articles 404 to 410 of the CRR and Articles 50 to 56 of the AIFM Regulation (and any corresponding implementing rules of their regulator) should they invest in the offered certificates.”
6. The final paragraph of the Risk Factor entitled “Financial Regulatory Reforms and Additional Proposed Regulations Could Have a Significant Impact on the Depositor, the Servicers or Any Successor Servicer or on the Value of the Certificates” is replaced with the following:
“On February 9, 2012, the Department of Justice, the Department of Housing and Urban Development, and attorneys general representing 49 states and the District of Columbia reached a settlement agreement with five large mortgage servicers in connection with servicing and foreclosure issues. Consent judgments implementing the agreement were filed in the U.S. District Court in Washington, D.C. in March, 2012. The settlement agreement provides for financial relief for homeowners, including mortgage loan principal reduction, refinancing and increased benefits and protections for servicemembers and veterans, and requires a comprehensive reform of mortgage servicing practices for the five servicers. While none of the servicers servicing mortgage loans included in the mortgage pool are subject to the settlement agreement, it is possible that future actions against additional servicers will result in similar agreements with similar terms, or regulations or rules enacted by the CFPB or other governmental entities could require the servicers to implement these types of reforms with respect to the mortgage loans. For example, the CFPB has released final rules relating to mortgage servicing, which became effective in January 2014, that prohibit a servicer from commencing a foreclosure until a mortgage loan is more than 120 days delinquent. The final rules also require servicers to provide certain notices and follow specific procedures relating to loss mitigation and foreclosure alternatives. In addition, the State of California recently enacted the Homeowner’s Bill of Rights, which requires similar changes in delinquent loan servicing and foreclosure procedures and creates a private right of action permitting borrowers to bring legal actions against lenders who violate the law. Any changes to a servicer’s servicing procedures could cause delays in payments to or increase losses to the certificateholders.”
| 4 |
7. The first paragraph of the Risk Factor entitled “Governmental Actions May Affect Servicing of Mortgage Loans and May Limit the Servicers’ Ability to Foreclose” is replaced with the following:
“The federal government, state and local governments, consumer advocacy groups and others continue to urge servicers to be aggressive in modifying mortgage loans to avoid foreclosure, and federal, state and local governmental authorities have enacted and continue to propose numerous laws, regulations and rules relating to mortgage loans generally, and foreclosure actions particularly. For example, the CFPB has released final rules relating to mortgage servicing, which became effective in January 2014, that prohibit a servicer from commencing a foreclosure until a mortgage loan is more than 120 days delinquent. The final rules also require servicers to provide certain notices and follow specific procedures relating to loss mitigation and foreclosure alternatives.”
8. The second paragraph of the Risk Factor entitled “The Return on Your Certificates Could Be Reduced by Shortfalls due to the Servicemembers Civil Relief Act” is replaced with the following:
“The Relief Act also limits the ability of the servicers to foreclose on a mortgage loan during the borrower’s period of active duty and, in some cases, during an additional one year period thereafter. As a result, there may be delays in payment and increased losses on the mortgage loans. Those delays and increased losses will be borne primarily by the class of certificates with a certificate principal amount greater than zero with the lowest payment priority.”
9. The first two paragraphs of the Risk Factor entitled “Proposals to Acquire Mortgage Loans by Eminent Domain May Adversely Affect Your Certificates” are replaced with the following:
“Numerous cities and local governments throughout the United States have been considering programs to assist homeowners in their jurisdictions who are obligated on residential mortgage loans with outstanding balances in excess of the market value of the related mortgaged properties. The proposed programs include authorization to acquire any such mortgage loans by voluntary purchase or eminent domain and to modify those mortgage loans to allow homeowners to continue to own and occupy their homes, irrespective of whether the mortgage loans are actually in default or foreclosure.
In April 2013, the City of Richmond, California (the “City of Richmond”), approved such a program and in July 2013, the City of Richmond commenced the program by sending letters to trustees and servicers of mortgage loans included in securitization trusts. The letters state that the City of Richmond had the mortgage loans appraised to determine their fair market value, and include offers to purchase specific mortgage loans at specific purchase prices based on such appraisals. The letters state further that if the owners of the mortgage loans elect not to sell the mortgage loans to the City of Richmond for the specified prices, the City of Richmond may proceed with the acquisition of the mortgage loans through exercising its power of eminent domain. In an eminent domain proceeding, if the seller and purchaser do not agree on a purchase price, the purchase price would be determined through additional legal proceedings. Two recent lawsuits were filed by three mortgage-bond trustees against the City of Richmond’s eminent domain program, both of which have been dismissed without prejudice as not being ripe for determination. Among other things, the lawsuits alleged that the City of Richmond’s proposed use of eminent domain is unconstitutional as a violation of the law on interstate commerce and as a violation of the criterion that mortgage loans being seized are for valid public purpose. The lawsuits sought a preliminary injunction against the City of Richmond and Mortgage Resolution Partners, an investment firm the city has partnered with on the eminent domain plan. Although proponents of the eminent domain plan have not been able to obtain the vote of a supermajority of the Richmond City Council that is necessary to implement the plan, the mayor and other supporters are continuing to pursue it, including alternatives such as establishing a joint powers authority to implement the plan, which does not require a supermajority vote but does require the participation of one or more other governmental entities.
| 5 |
Although none of the mortgage loans included in the mortgage pool are located in the City of Richmond, there is no certainty as to whether any other governmental entity will take steps to acquire any mortgage loans under such a program in the future, whether any other mortgage loans sought to be purchased will be mortgage loans held in securitization trusts and what purchase price would be paid for any such mortgage loans. Any such actions could have a material adverse effect on the market value of residential mortgage-backed certificates such as the certificates. There is also no certainty as to whether any such action without the consent of investors would face legal challenge, and, if so, the outcome of any such challenge.”
10. The Risk Factor entitled “Risks Related to the Potential Elimination or Reduction of the Mortgage-Interest Tax Deduction” is replaced in its entirety with the following:
“Risks Related to the Potential Elimination or Reduction of the Mortgage-Interest Tax Deduction
Various tax reform proposals continue to circulate in Congress, some of which would change the manner in which home interest deductions are treated. It is unclear whether any of the pending tax reform proposals will be enacted, either piecemeal as revenue raisers or as part of a more comprehensive package of tax reforms. Elimination or further restrictions on the mortgage-interest tax deduction could negatively affect the U.S. housing market, the market value of residential mortgage loans and the certificates.”
11. The Risk Factor entitled “Risks Associated With Mortgage Loan Origination or Ownership” is replaced by the following:
“Risks Associated With Mortgage Loan Origination or Ownership; No “Qualified Mortgage” Representation
The Truth in Lending Act provides that subsequent purchasers of mortgage loans originated in violation of certain requirements specified in the Truth in Lending Act may have liability for such violations. As described more fully above under “—Financial Regulatory Reforms and Additional Proposed Regulations Could Have a Significant Impact on the Depositor, the Servicers or Any Successor Servicer or on the Value of the Certificates,” the CFPB has issued regulations, which became effective in January 2014, specifying the standards for a “qualified mortgage” that would have the benefit of a safe harbor from such liability if certain requirements are satisfied, or a rebuttable presumption from such liability if only certain of these requirements are satisfied. Although the regulations do not apply to the mortgage loans included in the mortgage pool, many of such mortgage loans may not satisfy the requirements for a “qualified mortgage” under either set of requirements. Possible liabilities that could be required to be paid by an assignee of a mortgage loan include actual damages suffered by the borrower, litigation costs, statutory damages and special statutory damages. Various state and local legislatures may adopt similar or more onerous provisions in the future. We are unable to predict how these laws and regulations relating to assignee liability may affect the value of your certificates. In addition, the qualified mortgage rule may adversely affect the market generally for mortgage-backed securities, if investors are not willing to invest in pools of mortgage loans that do not satisfy the qualified mortgage requirements, thereby reducing the liquidity of your certificates. No representation as to whether any mortgage loans included in the mortgage pool satisfy the qualified mortgage requirements will be given.”
| 6 |
12. The first paragraph of the Risk Factor entitled “Market Exit of Originators and Servicers; Financial Condition of Originators, Servicers and the Seller” is replaced with the following:
“The financial difficulties of originators and servicers of residential mortgage loans may be exacerbated by higher delinquencies and defaults that reduce the value of mortgage loan portfolios, requiring originators to sell their portfolios at greater discounts to par. In addition, the costs of servicing an increasingly delinquent mortgage loan portfolio may be rising without a corresponding increase in servicing compensation. The value of many residual interests retained by sellers of mortgage loans in the securitization market has also been declining in these market conditions. Currently, overall origination volumes are down significantly. Many originators and servicers of residential mortgage loans also have been the subject of governmental investigations and litigations, many of which have the potential to impact the financial condition of those financial institutions. In addition, any regulatory oversight, proposed legislation and/or governmental intervention designed to protect consumers may have an adverse impact on originators and servicers. The CFPB has released final rules relating to mortgage servicing, which became effective in January 2014, and such rules may increase the costs associated with servicing mortgage loans. On January 7, 2013, federal regulators reached an $8.5 billion settlement agreement with ten U.S. banks regarding alleged foreclosure abuses. While none of the servicers servicing mortgage loans included in the mortgage pool are currently subject to the settlement agreement, it is possible that similar settlement agreements will be reached with similar terms. These factors, among others, may have the overall effect of increasing costs and expenses of originators and servicers while at the same time decreasing servicing cash flow and loan origination revenues, and in turn may lead to originators or servicers leaving the industry.”
13. The Risk Factor entitled “Actions to Enforce Breaches of Representations and Warranties Relating to Mortgage Loan Characteristics May Take a Significant Amount of Time or Cause Delays or Reductions in the Amount of Payments Made to Certificateholders”is amended by adding the phrase “and May Become Barred by Statute of Limitations” to the title thereof and the following paragraph at the end of such Risk Factor:
“In December 2013, the New York Supreme Court, Appellate Division, First Department, ruled that the six-year statute of limitations applicable to contract causes of action barred an action for breach of representations and warranties contained in a mortgage loan purchase agreement and incorporated by reference in a pooling and servicing agreement governed by New York law. The court held that the claims for breach of representations and warranties accrued on the date of the breach, which in this case was the closing date of the transaction. The court found that the case was time barred because the action had not commenced within six years after the date of the breach. Most of the mortgage loans have been acquired pursuant to purchase agreements with the originators that are governed by New York law, and the purchase agreement with the seller is also governed by New York law. Accordingly, unless there is a legislative change or the above holding is overturned by the New York courts, the proceedings described in the preceding paragraph may become barred if not commenced within six years after the date of a breach.”
14. The first paragraph of the text under the caption “STATIC POOL INFORMATION” is replaced with the following:
“Static pool information with respect to mortgage loans included in prior securitizations of the sponsor that are similar to the mortgage loans of the issuing entity for the period from March 2011 to January 2014 is attached as Annex C to this supplement. Static pool information with respect to mortgage loans originated by First Republic Bank that are similar to the mortgage loans of the issuing entity for the vintage origination years of 2008 through 2014 is attached as Annex D to this supplement.”
| 7 |
15. The following paragraph is added under the caption “ADDITIONAL INFORMATION”:
“The Form 10-D distribution reports relating to the distributions made to the certificateholders since the initial closing have been filed with the SEC and are available at the locations and website as noted above. Investors are encouraged to review such reports. A copy of the March 2014 monthly statement to certificateholders is attached hereto as Exhibit A.”
16. The text under the caption “SPONSOR MATERIAL LEGAL PROCEEDINGS” is replaced with the following:
“At the date of this supplement, other than litigation in the ordinary course of business, such as litigation involving foreclosures or other exercise of its rights as a creditor, and other than as described below, there were no material pending legal proceedings to which any of the sponsor, the seller, the depositor or the issuing entity was a party or of which any of their property was subject, and, other than as described below, the depositor is not aware of any material pending legal proceedings known to be contemplated by governmental authorities against the sponsor, the seller, the depositor or the issuing entity.
On or about December 23, 2009, the Federal Home Loan Bank of Seattle (the “FHLB-Seattle”) filed a complaint in the Superior Court for the State of Washington (case number 09-2-46348-4 SEA) against the depositor, Redwood Trust, Inc., Morgan Stanley & Co., and Morgan Stanley Capital I, Inc. (collectively, the “FHLB-Seattle Defendants”) alleging that the FHLB-Seattle Defendants made false or misleading statements in offering materials for a mortgage pass-through certificate (the “Seattle Certificate”) issued in the Sequoia Mortgage Trust 2005-4 securitization transaction (the “2005-4 RMBS”) and purchased by the FHLB-Seattle. Specifically, the complaint alleges that the alleged misstatements concern the (1) loan-to-value ratio of mortgage loans and the appraisals of the properties that secured loans supporting the 2005-4 RMBS, (2) occupancy status of the properties, (3) standards used to underwrite the loans, and (4) ratings assigned to the Seattle Certificate. The FHLB-Seattle alleges claims under the Securities Act of Washington (Section 21.20.005, et seq.) and seeks to rescind the purchase of the Seattle Certificate and to collect interest on the original purchase price at the statutory interest rate of 8% per annum from the date of original purchase (net of interest received) as well as attorneys’ fees and costs. The Seattle Certificate was issued with an original principal amount of approximately $133 million, and, as of December 31, 2013, the FHLB-Seattle has received approximately $114.4 million of principal and $11.0 million of interest payments in respect of the Seattle Certificate. As of December 31, 2013, the Seattle Certificate had a remaining outstanding principal amount of approximately $19.0 million. The claims were subsequently dismissed for lack of personal jurisdiction as to the depositor and Redwood Trust. The depositor and Redwood Trust agreed to indemnify the underwriters of the 2005-4 RMBS for certain losses and expenses they might incur as a result of claims made against them relating to this RMBS, including, without limitation, certain legal expenses. The FHLB-Seattle’s claims against the underwriters of this RMBS were not dismissed and remain pending. Regardless of the outcome of this litigation, the depositor and Redwood Trust could incur a loss as a result of these indemnities.
On or about July 15, 2010, The Charles Schwab Corporation (“Schwab”) filed a complaint in the Superior Court for the State of California in San Francisco (case number CGC-10-501610) against the depositor and 26 other defendants (collectively, the “Schwab Defendants”) alleging that the Schwab Defendants made false or misleading statements in offering materials for various residential mortgage-backed securities sold or issued by the Schwab Defendants. With respect to the depositor, Schwab alleges that the depositor made false or misleading statements in offering materials for a mortgage pass-through certificate (the “Schwab Certificate”) issued in the 2005-4 RMBS and purchased by Schwab. Specifically, the complaint alleges that the misstatements for the 2005-4 RMBS concern the (1) loan-to-value ratio of mortgage loans and the appraisals of the properties that secured loans supporting the 2005-4 RMBS, (2) occupancy status of the properties, (3) standards used to underwrite the loans, and (4) ratings assigned to the Schwab Certificate. Schwab alleges a claim for negligent misrepresentation under California state law and seeks unspecified damages and attorneys’ fees and costs. The Schwab Certificate was issued with an original principal amount of approximately $14.8 million, and, as of December 31, 2013, Schwab has received approximately $12.7 million of principal and $1.3 million of interest payments in respect of the Schwab Certificate. As of December 31, 2013, the Schwab Certificate had a remaining outstanding principal amount of approximately $2.1 million. The depositor has denied Schwab’s allegations. The depositor and Redwood Trust intend to defend the action vigorously. The depositor and Redwood Trust agreed to indemnify the underwriters of the 2005-4 RMBS, which underwriters are also named defendants in this action, for certain losses and expenses they might incur as a result of claims made against them relating to this RMBS, including, without limitation, certain legal expenses. Regardless of the outcome of this litigation, the depositor and Redwood Trust could incur a loss as a result of these indemnities.
| 8 |
On or about October 15, 2010, the Federal Home Loan Bank of Chicago (“FHLB-Chicago”) filed a complaint in the Circuit Court of Cook County, Illinois (case number 10-CH-45033) against the depositor and more than 45 other named defendants (collectively, the “FHLB-Chicago Defendants”) alleging that the FHLB-Chicago Defendants made false or misleading statements in offering materials for various residential mortgage-backed securities sold or issued by the FHLB-Chicago Defendants or entities controlled by them. FHLB-Chicago subsequently amended the complaint to name Redwood Trust and another one of Redwood Trust’s subsidiaries, RWT Holdings, Inc., as defendants. With respect to Redwood Trust, RWT Holdings, and the depositor, the FHLB-Chicago alleges that Redwood Trust, RWT Holdings, and the depositor made false or misleading statements in the offering materials for two mortgage pass-through certificates (the “Chicago Certificates”) issued in the Sequoia Mortgage Trust 2006-1 securitization transaction (the “2006-1 RMBS”) and purchased by the FHLB-Chicago. The complaint alleges that the alleged misstatements concern, among other things, the (1) loan-to-value ratio of mortgage loans and the appraisals of the properties that secured loans supporting the 2006-1 RMBS, (2) occupancy status of the properties, (3) standards used to underwrite the loans, (4) ratings assigned to the Chicago Certificates, and (5) due diligence performed on these mortgage loans. The FHLB-Chicago alleges claims under Illinois Securities Law (815 ILCS Sections 5/12(F)-(H)) and North Carolina Securities Law (N.C.G.S.A. §78A-8(2) & §78A-56(a)) as well as a claim for negligent misrepresentation under Illinois common law. On some of the causes of action, the FHLB-Chicago seeks to rescind the purchase of the Chicago Certificates and to collect interest on the original purchase prices at the statutory interest rate of 10% per annum from the dates of original purchase (net of interest received). On one cause of action, the FHLB-Chicago seeks unspecified damages. The FHLB-Chicago also seeks attorneys’ fees and costs. The first of the Chicago Certificates was issued with an original principal amount of approximately $105 million and, as of December 31, 2013, the FHLB Chicago has received approximately $72.3 million of principal and $24.2 million of interest payments in respect of this Chicago Certificate. As of December 31, 2013, this Chicago Certificate had a remaining outstanding principal amount of approximately $32.0 million (after taking into account approximately $1.0 million of principal losses allocated to this Chicago Certificate). The second of the Chicago Certificates was issued with an original principal amount of approximately $379 million and, as of December 31, 2013, the FHLB Chicago has received approximately $258.6 million of principal and $81.5 million of interest payments in respect of this Chicago Certificate. As of December 31, 2013, this Chicago Certificate had a remaining outstanding principal amount of approximately $113.7 million (after taking into account approximately $6.3 million of principal losses allocated to this Chicago Certificate). The depositor, Redwood Trust, and RWT Holdings have denied FHLB-Chicago’s allegations. This case is in early stages of discovery, and no trial date has been set. The depositor and Redwood Trust intend to defend the action vigorously. The depositor and Redwood Trust agreed to indemnify the underwriters of the 2006-1 RMBS, which underwriters are also named defendants in this action, for certain losses and expenses they might incur as a result of claims made against them relating to this RMBS, including, without limitation, certain legal expenses. Regardless of the outcome of this litigation, the depositor and Redwood Trust could incur a loss as a result of these indemnities.
| 9 |
The business of the sponsor, the depositor, the seller and their affiliates has included, and continues to include, activities relating to the acquisition and securitization of residential mortgage loans. In addition, the business of the sponsor has, in the past, included activities relating to the acquisition and securitization of debt obligations and other assets through the issuance of collateralized debt obligations (commonly referred to as CDO transactions). Because of their involvement in the securitization and CDO businesses, the sponsor, the depositor, the seller and their affiliates could become the subject of litigation relating to these businesses, including additional litigation of the type described above, and could also become the subject of governmental investigations, enforcement actions, or lawsuits and governmental authorities could allege that these entities violated applicable law or regulation in the conduct of their business.
In fact, the sponsor and its affiliates have received, and responded to, information requests and subpoenas from two governmental authorities (one by the SEC relating to the sponsor’s CDO business and one by the National Credit Union Administration relating to a residential mortgage securitization conducted by the sponsor and the depositor). It is possible that the sponsor, the depositor, the seller or their affiliates might not be successful in defending or responding to any litigation, governmental investigation or related action and any losses incurred as a result of the resolution of any such action or investigation could have a material adverse effect on the sponsor, the depositor, the seller or their affiliates. In any case, regardless of the merits of any allegation or legal action that may be brought against the sponsor, the depositor, the seller or their affiliates, or of their success in defending against such allegations or legal actions, the costs of defending against any such allegation or legal action may be significant or material and could have a material adverse effect on the sponsor, the depositor, the seller or their affiliates.”
17. The second and third paragraphs and the table under the caption “THE SPONSOR AND THE SELLER AND SERVICING ADMINISTRATOR” are replaced with the following:
“As of April 2, 2014, RWT Holdings has sponsored the securitization of approximately $34.58 billion of residential mortgage loans ($4,077,538,500 in 2002, $6,198,200,700 in 2003, $10,199,107,364 in 2004, $1,440,123,400 in 2005, $1,035,362,200 in 2006, $2,833,909,600 in 2007, $237,838,333 in 2010, $670,664,551 in 2011, $1,972,280,986 in 2012, $5,578,298,816 in 2013 and $347,304,602 in 2014). RWT Holdings acquires, directly or indirectly through its subsidiaries, residential mortgage loans secured by first and second liens on one- to four- family residential properties under several loan purchase agreements from mortgage loan originators or sellers nationwide that meet its seller/servicer eligibility requirements. We refer you to “Loan Program—Qualifications of Sellers” in the prospectus for a general description of the characteristics used to determine eligibility of collateral sellers. Prior to acquiring the mortgage loans, RWT Holdings conducts a review of the related mortgage loan seller and of the mortgage loans. We refer you to “Risk Factors—Appraisals May Not Accurately Reflect the Value or Condition of the Mortgaged Property” and “—Pre-offering Review of the Mortgage Loans Underlying the Certificates May Not Reveal Aspects of the Mortgage Loans Which Could Lead to Losses” and “Pre-offering Review of the Mortgage Loans” in the prospectus supplement for a discussion of the pre-offering review procedures conducted by the sponsor with respect to the mortgage loans. No assurance can be made that the mortgage pool does not contain mortgage loans as to which there may be breaches of the original representations and warranties or that the mortgage loans will not default for other reasons.
During calendar years 2011 and 2012 and the first quarter of 2013, no mortgage loans securitized by the sponsor were the subject of a demand to repurchase or replace for breach of the representations and warranties concerning the pool assets contained in the related underlying transaction documents, or any related activity, for all asset-backed securities held by non-affiliates of the sponsor during such periods. During the second quarter of 2013, an affiliate of the sponsor submitted to a mortgage loan originator a repurchase demand with respect to a mortgage loan included in a securitization of the sponsor for which there was an alleged breach of a mortgage loan representation and warranty. Such demand was conditionally withdrawn during the third quarter of 2013 and no additional repurchase activity with respect to securitizations of the sponsor has occurred in the fourth quarter of 2013. In addition, in April 2013 and in October 2013, repurchase demands for securitizations of the sponsor were made in accordance with a covenant of originators to repurchase any mortgage loan that experiences an early payment default, and both of such mortgage loans were repurchased by their respective originators.
| 10 |
The sponsor filed its most recent Form ABS-15G on February 11, 2014. The sponsor’s CIK number is 0001530239.
Additional information with respect to repurchase activity with respect to the breach of a mortgage loan representation and warranty for securitizations of the sponsor for the prior three years is set forth on the following page:
| 11 |
| Name of Issuing Entity | Check if Registered | Name of Originator | Total Assets in ABS by Originator | Assets That Were Subject of Demand | Assets That Were Repurchased or Replaced | Assets Pending Repurchase or Replacement (within cure period) | ||||||||
| # | $ | (% of principal balance) | # | $ | (% of principal balance) | # | $ | (% of principal balance) | # | $ | (% of principal balance) | |||
| Sequoia Mortgage Trust 2012-6, CIK#0001561167SEC File 333-179292-05 | X | Evergreen Home Loans | 4 | $2,506,198 | 0.83% | 1 | $480,369.91 | 0.182259% | 0 | - | 0 | - | - | |
| Demand in Dispute | Demand Withdrawn** | Demand Rejected | Outstanding Principal Balance (02/25/2014) | ||||||
| # | $ | (% of principal balance) | # | $ | (% of principal balance) | # | $ | (% of principal balance) | |
| 0 | - | - | 1 | $480,369.91 | 0.182259% | 0 | - | - | $263,563,793.58 |
| TOTALS | ||||||||||||||
| Name of Issuing Entity | Check if Registered | Name of Originator | Total Assets in ABS by Originator | Assets That Were Subject of Demand | Assets That Were Repurchased or Replaced | Assets Pending Repurchase or Replacement (within cure period) | ||||||||
| # | $ | (% of principal balance) | # | $ | (% of principal balance) | # | $ | (% of principal balance) | # | $ | (% of principal balance) | ||
| Sequoia Mortgage Trust 2012-6, CIK#0001561167SEC File 333-179292-05 | X | Evergreen Home Loans | 4 | $2,506,198 | 0.83% | 1 | $480,369.91 | 0.182259% | 0 | - | - | 0 | - | - |
| Demand in Dispute |
Demand Withdrawn** | Demand Rejected | Outstanding Principal Balance (02/25/2014) | ||||||
| # | $ | (% of principal balance) | # | $ | (% of principal balance) | # | $ | (% of principal balance) | |
| 0 | - | - | 1 | $480,369.91 | 0.182259% | 0 | - | - | $263,563,793.58 |
**Conditionally withdrawn.”
| 12 |
18. The following paragraphs are inserted after the first two paragraphs under the caption“THE MASTER SERVICER, THE SECURITIES ADMINISTRATOR, THE CUSTODIAN AND THE SERVICERS”:
“Citibank, N.A. replaced Wells Fargo Bank, N.A., as securities administrator under the pooling and servicing agreement as of January 1, 2014. Wells Fargo Bank, N.A., remains the master servicer and custodian with respect to the mortgage loans.
Citibank, N.A.
Citibank, N.A. (“Citibank”), a national banking association and wholly owned subsidiary of Citigroup Inc., a Delaware corporation, will act as securities administrator under the pooling and servicing agreement. Citibank is wholly owned subsidiary of Citigroup Inc., a Delaware corporation. Citibank performs as securities administrator through the Agency and Trust line of business, which is part of the Global Transaction Services division. Citibank has primary corporate trust offices located in both New York and London. Citibank is a leading provider of corporate trust services offering a full range of agency, fiduciary, tender and exchange, depositary and escrow services. As of the end of the first quarter of 2014, Citibank’s Agency and Trust group manages in excess of $5.1 trillion in fixed income and equity investments on behalf of approximately 2,500 corporations worldwide. Since 1987, Citibank Agency and Trust has provided trustee and securities administrator services for asset-backed securities containing pool assets consisting of airplane leases, auto loans and leases, boat loans, commercial loans, commodities, credit cards, durable goods, equipment leases, foreign securities, funding agreement backed note programs, truck loans, utilities, student loans and commercial and residential mortgages. As of the end of the first quarter of 2014, Citibank acts as trustee, securities administrator and/or paying agent for approximately 512 various residential mortgage-backed transactions.
Under the terms of the pooling and servicing agreement, Citibank is responsible for securities administration, which includes pool performance calculations, distribution calculations and the preparation of monthly distribution reports. As securities administrator, Citibank is responsible for the preparation and filing of all REMIC tax returns on behalf of the issuing entity and the preparation of monthly reports and annual reports that are required to be prepared on behalf of the issuing entity.
At the date of this supplement, there were no material pending legal proceedings to which Citibank was a party or of which any of its property was subject, or any material pending legal proceedings known to be contemplated by governmental authorities against Citibank, in each case that is material to holders of certificates.”
19. The third and fourth sentences of the first paragraph under the caption“THE MASTER SERVICER, THE SECURITIES ADMINISTRATOR, THE CUSTODIAN AND THE SERVICERS—First Republic Bank” are replaced in their entirety with the following:
“As of December 31, 2013, First Republic’s mortgage loan servicing portfolio of loans serviced for others contained loans with an aggregate principal balance of approximately $6.0 billion. As of December 31, 2012, 2011, 2010 and 2009, total loans serviced for others were $4.6 billion, $3.4 billion, $3.8 billion and $4.0 billion, respectively.”
| 13 |
20. The text and table under the caption“THE MASTER SERVICER, THE SECURITIES ADMINISTRATOR, THE CUSTODIAN AND THE SERVICERS—First Republic Bank –Origination Experience and Loan Losses” are replaced in their entirety with the following:
“First Republic’s loan origination policies and consistent underwriting standards have resulted in low historical loan loss experience. Since First Republic’s inception in 1985, it has originated approximately $69.6 billion of single family residential loans (including HELOCs, single family owner occupied construction loans and single family loans sold in the secondary market) and has experienced approximate cumulative net loan losses of only $32.3 million, or 5 basis points, in 28 years, including losses on loans sold. A summary of First Republic’s single family residential loss experience is below.
First Republic Bank Historical Single Family Residence Net Losses
$ Thousands
| Total | Net Losses | |||||||||||
| Year | Originations | Amount | %Total | |||||||||
| 1985 | $ | 32,000 | $ | 0 | 0.00 | % | ||||||
| 1986 | $ | 128,000 | $ | 0 | 0.00 | % | ||||||
| 1987 | $ | 120,000 | $ | 0 | 0.00 | % | ||||||
| 1988 | $ | 230,000 | $ | 0 | 0.00 | % | ||||||
| 1989 | $ | 170,000 | $ | 371 | 0.22 | % | ||||||
| 1990 | $ | 144,525 | $ | 483 | 0.33 | % | ||||||
| 1991 | $ | 257,448 | $ | 1,282 | 0.50 | % | ||||||
| 1992 | $ | 547,909 | $ | 562 | 0.10 | % | ||||||
| 1993 | $ | 756,876 | $ | 26 | 0.00 | % | ||||||
| 1994 | $ | 598,878 | $ | 0 | 0.00 | % | ||||||
| 1995 | $ | 428,549 | $ | 0 | 0.00 | % | ||||||
| 1996 | $ | 684,806 | $ | 0 | 0.00 | % | ||||||
| 1997 | $ | 856,845 | $ | 0 | 0.00 | % | ||||||
| 1998 | $ | 1,179,266 | $ | 0 | 0.00 | % | ||||||
| 1999 | $ | 1,220,391 | $ | 0 | 0.00 | % | ||||||
| 2000 | $ | 1,275,876 | $ | 0 | 0.00 | % | ||||||
| 2001 | $ | 1,858,733 | $ | 0 | 0.00 | % | ||||||
| 2002 | $ | 2,688,262 | $ | 328 | 0.01 | % | ||||||
| 2003 | $ | 3,081,007 | $ | 942 | 0.03 | % | ||||||
| 2004 | $ | 2,891,483 | $ | 846 | 0.03 | % | ||||||
| 2005 | $ | 3,313,909 | $ | 2,965 | 0.09 | % | ||||||
| 2006 | $ | 2,927,310 | $ | 6,069 | 0.21 | % | ||||||
| 2007 | $ | 3,388,579 | $ | 13,475 | 0.40 | % | ||||||
| 2008 | $ | 5,647,715 | $ | 4,574 | 0.08 | % | ||||||
| 2009 | $ | 4,044,015 | $ | 352 | 0.01 | % | ||||||
| 2010 | $ | 4,611,242 | $ | 0 | 0.00 | % | ||||||
| 2011 | $ | 6,278,232 | $ | 0 | 0.00 | % | ||||||
| 2012 | $ | 9,800,660 | $ | 0 | 0.00 | % | ||||||
| 2013 | $ | 10,429,306 | $ | 0 | 0.00 | % | ||||||
| Totals | $ | 69,591,822 | $ | 32,275 | 0.05 | % | ||||||
| • | Includes prior experience with loans retained by Bank of America. |
| • | Originations include single family, home equity lines of credit, single family residence loans sold in secondary market, and single family residence owner occupied construction loans. |
| • | Losses are calculated based on year originated. |
| • | Losses include $7,534,922 for secondary market investors.” |
| 14 |
21. The fourth and fifth sentences in the second paragraph under the caption“THE MASTER SERVICER, THE SECURITIES ADMINISTRATOR, THE CUSTODIAN AND THE SERVICERS—Cenlar FSB” are replaced in their entirety with the following:
“As of December 31, 2013, Cenlar serviced or subserviced approximately 1,034,000 loans with an aggregate principal balance of $199,808,863,665 consisting of conventional, FHA and VA loans, for approximately 1,200 investors in all 50 states, the District of Columbia, Puerto Rico, and the Virgin Islands. Cenlar’s servicing is rated “Strong” by S&P, and its outlook is “Stable.” Fitch Ratings rated Cenlar as a Residential Primary Servicer and assigned a Primary Prime “RPS2” and an outlook of Stable.”
22. The table under the heading “Cenlar – Delinquency & Foreclosure Experience – Residential Mortgage Portfolio Serviced” under the caption“THE MASTER SERVICER, THE SECURITIES ADMINISTRATOR, THE CUSTODIAN AND THE SERVICERS – Cenlar FSB” is replaced with the following:
| 15 |
| Cenlar –Delinquency & Foreclosure Experience –Residential Mortgage Portfolio Serviced |
| As of December 31, 2010 | As of December 31, 2011 | As of December 31, 2012 | As of December 31, 2013 | |||||||||||||||||||||||||||||
| Number of Loans | Principal Balance | Number of Loans | Principal Balance | Number of Loans | Principal Balance | Number of Loans | Principal Balance | |||||||||||||||||||||||||
| Total Portfolio | 466,181 | $ | 76,239,252,568 | 534,247 | $ | 85,823,808,349 | 740,273 | $ | 130,551,865,159 | 1,034,208 | $ | 199,808,863,665 | ||||||||||||||||||||
| A] PAST DUE LOANS | ||||||||||||||||||||||||||||||||
| Period of Delinquency | ||||||||||||||||||||||||||||||||
| 30 days . . . . . | 20,150 | $ | 3,086,386,449 | 13,423 | $ | 1,934,809,769 | 13,667 | $ | 2,023,704,279 | 16,784 | $ | 2,581,145,378 | ||||||||||||||||||||
| Percent Delinquent | 4.32 | % | 4.05 | % | 2.51 | % | 2.25 | % | 1.85 | % | 1.55 | % | 1.62 | % | 1.29 | % | ||||||||||||||||
| 60 days . . . . . | 5,016 | $ | 798,013,185 | 3,881 | $ | 589,203,960 | 3,939 | $ | 592,824,895 | 4,389 | $ | 656,309,682 | ||||||||||||||||||||
| Percent Delinquent | 1.08 | % | 1.05 | % | 0.73 | % | 0.69 | % | 0.53 | % | 0.45 | % | 0.42 | % | 0.33 | % | ||||||||||||||||
| 90 days . . . . . | 6,465 | $ | 1,118,599,694 | 5,427 | $ | 871,420,015 | 4,897 | $ | 807,224,269 | 4,744 | $ | 687,943,293 | ||||||||||||||||||||
| Percent Delinquent | 1.39 | % | 1.47 | % | 1.02 | % | 1.02 | % | 0.66 | % | 0.62 | % | 0.46 | % | 0.34 | % | ||||||||||||||||
| Total Delinquencies | 31,631 | $ | 5,002,999,328 | 22,731 | $ | 3,395,433,744 | 22,503 | $ | 3,423,753,443 | 25,917 | $ | 3,925,398,353 | ||||||||||||||||||||
| Total Past Due by Percentage of Total Portfolio | 6.79 | % | 6.57 | % | 4.26 | % | 3.96 | % | 3.04 | % | 2.62 | % | 2.50 | % | 1.96 | % | ||||||||||||||||
| B] Foreclosure | 6,021 | $ | 1,192,155,348 | 12,197 | $ | 2,191,816,162 | 14,279 | $ | 2,460,698,281 | 13,036 | $ | 2,070,064,385 | ||||||||||||||||||||
| Bankruptcy | 3,454 | $ | 494,660,388 | 4,190 | $ | 577,087,641 | 4,438 | $ | 621,458,071 | 4,559 | $ | 633,669,952 | ||||||||||||||||||||
| Total Foreclosure’s and Bankruptcies | 9,475 | $ | 1,686,815,736 | 16,387 | $ | 2,768,903,803 | 18,717 | $ | 3,082,156,352 | 17,595 | $ | 2,703,734,337 | ||||||||||||||||||||
| Real Estate Owned | 0 | $ | 0 | 0 | $ | 0 | 0 | $ | 0 | 0 | $ | 0 | ||||||||||||||||||||
| Percent of Total Portfolio in Foreclosure or Bankruptcy | 2.03 | % | 2.21 | % | 3.07 | % | 3.23 | % | 2.53 | % | 2.36 | % | 1.70 | % | 1.35 | % | ||||||||||||||||
| Total Delinquent [Past Due + FCL] | 8.82 | % | 8.78 | % | 7.33 | % | 7.19 | % | 5.57 | % | 4.98 | % | 4.20 | % | 3.31 | % | ||||||||||||||||
| 16 |
23. The table and caption below on page S-118 of the prospectus supplement are replaced with the following:
“PRE-TAX YIELD TO MATURITY OF THE CLASS A-IO1 CERTIFICATES AT THE FOLLOWING PERCENTAGES OF CPR
The table below was prepared based on the following assumptions (collectively, the “Modeling Assumptions”): (1) the Class Principal Amounts and Class Notional Amounts of the certificates are as set forth under the caption “Current Principal Balance” in the March 2014 Monthly Report attached hereto as Exhibit A (the “March Monthly Report”); (2) for the distribution date in April 2014, a CPR of 8.17%, resulting in an assumed Class Notional Amount of the Class A-IO1 Certificates of $537,816,407.20; (3) each monthly scheduled payment of principal and interest is timely received on the first day of each month commencing in April 2014; (4) principal prepayments are received in full on the last day of the month preceding the related distribution date, commencing in March 2014, and there are no Net Prepayment Interest Shortfalls; (5) there are no defaults or delinquencies on the mortgage loans; (6) distribution dates occur on the 25th day of each month commencing in April 2014 regardless of whether such day is a business day; (7) there are no purchases or substitutions of mortgage loans; (8) there is no optional termination of the issuing entity; (9) the Class A-IO1 certificates are purchased on April 21, 2014; (10) the aggregate servicing fee rate, master servicing fee rate and trustee fee rate for any mortgage loan is equal to the rate of 0.264% per annum; and (11) the mortgage loans have the characteristics specified in the Free Writing Prospectus filed by the depositor with the SEC on April 15, 2014. Summary information regarding the characteristics of the mortgage loans is included in the March Monthly Report.
Although the Modeling Assumptions are based on the characteristics of the mortgage loans provided by the Master Servicer as of the date of the March 2014 Monthly Report, the actual characteristics and performance of the mortgage loans will differ from the assumptions used in constructing the table set forth below, which is hypothetical in nature and is provided only to give a general sense of how the yield on the Class A-IO1 Certificates may vary under varying prepayment scenarios. For example, it is not expected that the mortgage loans will prepay at a constant rate until maturity, that all of the mortgage loans will prepay at the same rate or that there will be no defaults or delinquencies on the mortgage loans. Moreover, the diverse remaining terms to maturity of the mortgage loans could produce slower or faster principal payments than indicated in the table, even if the weighted average remaining term to maturity is as assumed. Any difference between such assumptions and the actual characteristics and performance of the mortgage loans, or the actual prepayment or loss experience, will cause the yield on the Class A-IO1 Certificates to differ (which difference could be material) from the corresponding information in the table for each indicated percentage of CPR.
| 17 |
PRE-TAX YIELD TO MATURITY OF THE CLASS A-IO1 CERTIFICATES AT THE FOLLOWING PERCENTAGES OF CPR
| Price (%) | 5% CPR | 10% CPR | 15% CPR | 20% CPR | 30% CPR | 40% CPR | 50% CPR | |||||||||||||||||||||
| 2.4430 | 17.876 | % | 11.647 | % | 4.977 | % | (2.356 | )% | (20.349 | )% | (47.763 | )% | (74.864 | )% | ||||||||||||||
| 2.6930 | 15.318 | % | 9.151 | % | 2.517 | % | (4.819 | )% | (22.942 | )% | (51.036 | )% | (78.298 | )% | ||||||||||||||
| 2.9430 | 13.186 | % | 7.069 | % | 0.458 | % | (6.890 | )% | (25.143 | )% | (53.862 | )% | (81.269 | )% | ||||||||||||||
| 3.1930 | 11.376 | % | 5.301 | % | (1.296 | )% | (8.664 | )% | (27.042 | )% | (56.336 | )% | (83.874 | )% | ||||||||||||||
| 3.4430 | 9.818 | % | 3.776 | % | (2.814 | )% | (10.206 | )% | (28.704 | )% | (58.530 | )% | (86.186 | )% | ||||||||||||||
| 3.6930 | 8.458 | % | 2.444 | % | (4.145 | )% | (11.564 | )% | (30.177 | )% | (60.494 | )% | (88.258 | )% | ||||||||||||||
| 3.9430 | 7.258 | % | 1.267 | % | (5.325 | )% | (12.773 | )% | (31.494 | )% | (62.268 | )% | (90.130 | )% | ||||||||||||||
| 4.1930 | 6.189 | % | 0.218 | % | (6.380 | )% | (13.858 | )% | (32.683 | )% | (63.882 | )% | (91.834 | )% | ||||||||||||||
| 4.4430 | 5.230 | % | (0.725 | )% | (7.331 | )% | (14.840 | )% | (33.763 | )% | (65.360 | )% | (93.395 | )% | ||||||||||||||
Based upon the above assumptions, at approximately 12.9% CPR (at an assumed purchase price of 3.4430% of the assumed Class Notional Amount of the Class A-IO1 Certificates, excluding accrued interest, but adding accrued interest to the price for purposes of calculating yield), the pre-tax yield to the Class A-IO1 Certificates will be approximately 0%. If the rate of prepayments on the mortgage loans were to exceed such prepayment level for as little as one month, while equaling such level for all other months, the Class A-IO1 Certificateholders would not fully recoup their initial investment.
The pre-tax yields set forth in the preceding table were calculated by determining the monthly discount rates which, when applied to the assumed streams of cash flows to be paid on the Class A-IO1 Certificates, would cause the discounted present value of such assumed stream of cash flows to the purchase date of April 21, 2014 to equal the assumed purchase prices (plus accrued interest), and converting such monthly rates to CBE rates.”
24.ANNEX C – SPONSOR STATIC POOL INFORMATION to the prospectus supplement is replaced with Annex C attached to this supplement.
25.ANNEX D – FIRST REPUBLIC BANK STATIC POOL INFORMATION to the prospectus supplement is replaced with Annex D attached to this supplement.
| 18 |
ANNEX C – SPONSOR STATIC POOL INFORMATION
The following tables set forth static pool information with respect to securitizations of residential mortgage loans comparable to the mortgage loans included in the issuing entity that were sponsored by RWT Holdings, Inc.
All data should be reviewed in light of the following notes:
Calculations:
3 month CPR = 1-(1-(current balance from two periods prior -Current period’s current balance)/(current balance from two periods prior))^(4)
Cumulative CPR = 1-(1-(current balance from first period -Current period’s current balance)/(current balance from first period))^(12/total # of periods)
See also “Static Pool Information”in the prospectus supplement for a description of how the static pool information is calculated.
SEMT 2011-1
Original Pool Characteristics
| Total Stated Principal Balance | $ 296,326,815 |
| Number of Mortgage Loans | 303 |
| Average Stated Principal Balance | $ 977,976 |
| Weighted Average Mortgage Rate | 5.048% |
| Weighted Average Margin (HYB 10/1s only) | 1.496% |
| Weighted Average Remaining Term to Maturity (in Months) | 352 |
| Weighted Average FICO (by Securitized Balance) | 775 |
| Weighted Average Loan-to-Value Ratio (by Original Balance) | 58.76% |
Mortgage Rate Range
| 4.25% - 4.50% | 2.81% |
| 4.51% - 4.75% | 13.32% |
| 4.76% - 5.00% | 36.43% |
| 5.01% - 5.25% | 28.09% |
| 5.26% - 5.50% | 16.42% |
| 5.51% - UP | 2.94% |
Product Type
| Fixed Rate 30YR | 57.32% |
| HYB 10/1 | 42.68% |
Interest Only Loans
| Yes | 42.19% |
| No | 57.81% |
Geographic Distribution
| CA | 56.27% |
| NY | 8.15% |
| WA | 5.98% |
| MA | 4.94% |
| CO | 2.83% |
| CT | 2.67% |
| TX | 1.89% |
| MI | 1.81% |
| OR | 1.70% |
| NJ | 1.40% |
| Other | 12.36% |
| C-1 |
Occupancy
| Primary | 94.36% |
| Second Home | 5.41% |
| Investor Property | 0.23% |
Property Type
| Single Family | 75.48% |
| PUD Detached | 10.76% |
| PUD Attached | 4.62% |
| Condo High-Rise | 2.87% |
| Cooperative Unit | 2.55% |
| Condo Low-Rise | 1.89% |
| 2 Family | 1.16% |
| Townhouse | 0.68% |
Documentation
| Full Documentation | 100.00% |
| Less than Full | 0.00% |
| C-2 |
SEMT 2011-1
| SEMT 2011-1 | Ending Balance $ | 30 Day Delq # | 30 Day Delq Balance $ | 30 Day Delq Balance % | 60 Day Delq # | 60 Day Delq Balance $ | 60 Day Delq Balance % | 90+ Day Delq # | 90+ Day Delq Balance $ | 90+ Day Delq Balance % | Cumulative Loss Amount $ | Prepayment Amount $ | Cumulative Prepayment Amount $ | 3 Month CPR | Cumulative CPR |
| Mar-11 | 290,718,718 | 0 | - | 0.00% | 0 | - | 0.00% | 0 | - | 0.00% | 0.00 | 4,503,047 | 4,503,047 | 16.84 | |
| Apr-11 | 289,721,974 | 0 | - | 0.00% | 0 | - | 0.00% | 0 | - | 0.00% | 0.00 | 788,314 | 5,291,361 | 10.29 | |
| May-11 | 288,472,204 | 0 | - | 0.00% | 0 | - | 0.00% | 0 | - | 0.00% | 0.00 | 1,040,650 | 6,332,010 | 8.32 | 8.32 |
| Jun-11 | 287,968,144 | 0 | - | 0.00% | 0 | - | 0.00% | 0 | - | 0.00% | 0.00 | 295,090 | 6,627,101 | 2.90 | 6.60 |
| Jul-11 | 285,275,783 | 0 | - | 0.00% | 0 | - | 0.00% | 0 | - | 0.00% | 0.00 | 2,482,355 | 9,109,455 | 5.18 | 7.26 |
| Aug-11 | 283,534,803 | 0 | - | 0.00% | 0 | - | 0.00% | 0 | - | 0.00% | 0.00 | 1,530,753 | 10,640,208 | 5.85 | 7.10 |
| Sep-11 | 279,870,735 | 0 | - | 0.00% | 0 | - | 0.00% | 0 | - | 0.00% | 0.00 | 3,452,790 | 14,092,998 | 10.00 | 8.07 |
| Oct-11 | 271,994,742 | 0 | - | 0.00% | 0 | - | 0.00% | 0 | - | 0.00% | 0.00 | 7,666,545 | 21,759,543 | 16.63 | 10.90 |
| Nov-11 | 257,669,654 | 0 | - | 0.00% | 0 | - | 0.00% | 0 | - | 0.00% | 0.00 | 14,117,903 | 35,877,446 | 31.19 | 15.95 |
| Dec-11 | 248,462,206 | 1 | 592,315 | 0.23% | 0 | - | 0.00% | 0 | - | 0.00% | 0.00 | 9,004,975 | 44,882,421 | 37.33 | 18.06 |
| Jan-12 | 229,298,031 | 0 | - | 0.00% | 0 | - | 0.00% | 0 | - | 0.00% | 0.00 | 18,964,766 | 63,847,187 | 49.08 | 23.49 |
| Feb-12 | 216,298,512 | 0 | - | 0.00% | 0 | - | 0.00% | 0 | - | 0.00% | 0.00 | 12,810,450 | 76,657,637 | 49.93 | 26.15 |
| Mar-12 | 209,728,983 | 1 | 574,299 | 0.27% | 0 | - | 0.00% | 0 | - | 0.00% | 0.00 | 6,386,295 | 83,043,932 | 48.81 | 26.48 |
| Apr-12 | 202,848,143 | 0 | - | 0.00% | 0 | - | 0.00% | 0 | - | 0.00% | 0.00 | 6,699,486 | 89,743,418 | 38.17 | 26.91 |
| May-12 | 191,776,008 | 0 | - | 0.00% | 0 | - | 0.00% | 0 | - | 0.00% | 0.00 | 10,895,577 | 100,638,995 | 37.59 | 28.60 |
| Jun-12 | 181,118,396 | 0 | - | 0.00% | 0 | - | 0.00% | 0 | - | 0.00% | 0.00 | 10,490,142 | 111,129,138 | 43.83 | 30.11 |
| Jul-12 | 174,355,380 | 0 | - | 0.00% | 0 | - | 0.00% | 0 | - | 0.00% | 0.00 | 6,607,179 | 117,736,317 | 44.88 | 30.47 |
| Aug-12 | 165,547,136 | 0 | - | 0.00% | 0 | - | 0.00% | 0 | - | 0.00% | 0.00 | 8,653,526 | 126,389,843 | 43.92 | 31.43 |
| Sep-12 | 151,169,125 | 0 | - | 0.00% | 0 | - | 0.00% | 0 | - | 0.00% | 0.00 | 14,229,944 | 140,619,787 | 50.98 | 33.92 |
| Oct-12 | 141,439,046 | 0 | - | 0.00% | 0 | - | 0.00% | 0 | - | 0.00% | 0.00 | 9,591,007 | 150,210,794 | 56.25 | 35.15 |
| Nov-12 | 131,200,151 | 0 | - | 0.00% | 0 | - | 0.00% | 0 | - | 0.00% | 0.00 | 10,108,588 | 160,319,382 | 60.15 | 36.55 |
| Dec-12 | 120,562,228 | 0 | - | 0.00% | 0 | - | 0.00% | 0 | - | 0.00% | 0.00 | 10,516,203 | 170,835,586 | 59.12 | 38.12 |
| Jan-13 | 106,831,916 | 0 | - | 0.00% | 0 | - | 0.00% | 0 | - | 0.00% | 0.00 | 13,618,017 | 184,453,603 | 67.11 | 40.65 |
| Feb-13 | 99,351,579 | 1 | 581,033 | 0.58% | 0 | - | 0.00% | 0 | - | 0.00% | 0.00 | 7,378,502 | 191,832,105 | 66.78 | 41.49 |
| Mar-13 | 91,448,514 | 0 | - | 0.00% | 1 | 581,033 | 0.63% | 0 | - | 0.00% | 0.00 | 7,807,171 | 199,639,276 | 66.55 | 42.53 |
| Apr-13 | 83,929,436 | 0 | - | 0.00% | 0 | - | 0.00% | 1 | 581,033 | 0.69% | 0.00 | 7,426,909 | 207,066,186 | 61.49 | 43.55 |
| May-13 | 75,835,271 | 1 | 520,552 | 0.68% | 0 | - | 0.00% | 0 | - | 0.00% | 0.00 | 8,010,983 | 215,077,168 | 65.68 | 44.86 |
| Jun-13 | 73,720,090 | 0 | - | 0.00% | 0 | - | 0.00% | 0 | - | 0.00% | 0.00 | 2,037,953 | 217,115,121 | 57.30 | 44.34 |
| Jul-13 | 68,867,672 | 0 | - | 0.00% | 0 | - | 0.00% | 0 | - | 0.00% | 0.00 | 4,775,505 | 221,890,626 | 54.15 | 44.76 |
| Aug-13 | 63,585,806 | 0 | - | 0.00% | 0 | - | 0.00% | 0 | - | 0.00% | 0.00 | 5,209,136 | 227,099,762 | 49.98 | 45.41 |
| Sep-13 | 61,509,537 | 0 | - | 0.00% | 0 | - | 0.00% | 0 | - | 0.00% | 0.00 | 2,004,602 | 229,104,364 | 50.95 | 45.03 |
| Oct-13 | 61,272,401 | 0 | - | 0.00% | 0 | - | 0.00% | 0 | - | 0.00% | 0.00 | 167,532 | 229,271,896 | 36.55 | 44.05 |
| Nov-13 | 57,623,589 | 0 | ��- | 0.00% | 0 | - | 0.00% | 0 | - | 0.00% | 0.00 | 3,578,205 | 232,850,101 | 31.65 | 44.30 |
| Dec-13 | 56,041,889 | 0 | - | 0.00% | 0 | - | 0.00% | 0 | - | 0.00% | 0.00 | 1,512,862 | 234,362,963 | 30.15 | 43.87 |
| Jan-14 | 54,500,586 | 0 | - | 0.00% | 0 | - | 0.00% | 0 | - | 0.00% | 0.00 | 1,474,347 | 235,837,310 | 36.55 | 43.46 |
| C-3 |
SEMT 2011-2
Original Pool Characteristics
| Total Stated Principal Balance | $375,227,254 |
| Number of Mortgage Loans | 473 |
| Average Stated Principal Balance | $793,292 |
| Weighted Average Mortgage Rate | 4.882% |
| Weighted Average Remaining Term to Maturity (in Months) | 351 |
| Weight Average FICO (by Securitized Balance) | 773 |
| Weighted Average Loan-to-Value Ratio (by Original Balance) | 60.71% |
Mortgage Rate Range
| 3.50% - 4.00% | 3.12% |
| 4.01% - 4.50% | 12.72% |
| 4.51% - 5.00% | 47.66% |
| 5.01% - 5.50% | 35.29% |
| 5.51% - 6.00% | 1.21% |
| >6.00% | 0.00% |
Product Type
| Fixed Rate 30YR | 100.00% |
Interest Only Loans
| Yes | 0.95% |
| No | 99.05% |
Geographic Distribution
| CA | 53.64% |
| NY | 7.20% |
| MA | 6.35% |
| GA | 3.74% |
| TX | 3.05% |
| FL | 2.57% |
| WA | 2.31% |
| NJ | 2.24% |
| OR | 1.98% |
| AZ | 1.97% |
| Other | 14.96% |
Occupancy
| Primary | 95.12% |
| Second Home | 3.84% |
| Investor Property | 1.04% |
Property Type
| Single Family | 72.28% |
| PUD Detached | 8.09% |
| PUD Attached | 7.96% |
| Cooperative Unit | 4.26% |
| Condo High-Rise | 4.04% |
| Condo Low-Rise | 1.72% |
| 2-4 Family | 1.66% |
Documentation
| Full Documentation | 100.00% |
| Less than Full | 0.00% |
| C-4 |
| SEMT 2011-2 | Ending Balance $ | 30 Day Delq # | 30 Day Delq Balance $ | 30 Day Delq Balance % | 60 Day Delq # | 60 Day Delq Balance $ | 60 Day Delq Balance % | 90+ Day Delq # | 90+ Day Delq Balance $ | 90+ Day Delq Balance % | Cumulative Loss Amount $ | Prepayment Amount $ | Cumulative Prepayment Amount $ | 3 Month CPR | Cumulative CPR |
| Oct-11 | 366,017,512 | 0 | - | 0.00% | 0 | - | 0.00% | 0 | - | 0.00% | 0.00 | 8,725,118 | 8,725,118 | 24.63 | |
| Nov-11 | 356,234,340 | 0 | - | 0.00% | 0 | - | 0.00% | 0 | - | 0.00% | 0.00 | 9,305,670 | 18,030,787 | 26.62 | |
| Dec-11 | 351,647,249 | 0 | 0 | 0.00% | 0 | 0 | 0.00% | 0 | 0 | 0.00% | 0.00 | 4,117,991 | 4,117,991 | 21.65 | 21.65 |
| Jan-12 | 344,268,889 | 0 | 0 | 0.00% | 0 | 0 | 0.00% | 0 | 0 | 0.00% | 0.00 | 6,913,341 | 11,031,332 | 20.49 | 21.55 |
| Feb-12 | 336,587,797 | 0 | 0 | 0.00% | 0 | 0 | 0.00% | 0 | 0 | 0.00% | 0.00 | 7,220,467 | 18,251,799 | 19.02 | 21.74 |
| Mar-12 | 320,815,358 | 0 | 0 | 0.00% | 0 | 0 | 0.00% | 0 | 0 | 0.00% | 0.00 | 15,315,660 | 33,567,459 | 29.61 | 25.74 |
| Apr-12 | 311,187,100 | 1 | 1,057,779 | 0.33% | 0 | 0 | 0.00% | 0 | 0 | 0.00% | 0.00 | 9,191,839 | 42,759,298 | 32.16 | 26.29 |
| May-12 | 297,074,923 | 0 | 0 | 0.00% | 0 | 0 | 0.00% | 0 | 0 | 0.00% | 0.00 | 13,686,476 | 56,445,774 | 38.31 | 28.43 |
| Jun-12 | 285,950,712 | 0 | 0 | 0.00% | 0 | 0 | 0.00% | 0 | 0 | 0.00% | 0.00 | 10,714,287 | 67,160,061 | 35.84 | 29.28 |
| Jul-12 | 281,331,875 | 0 | 0 | 0.00% | 0 | 0 | 0.00% | 0 | 0 | 0.00% | 0.00 | 4,216,898 | 71,376,958 | 32.09 | 28.08 |
| Aug-12 | 271,344,069 | 0 | 0 | 0.00% | 0 | 0 | 0.00% | 0 | 0 | 0.00% | 0.00 | 9,590,287 | 80,967,246 | 29.23 | 28.65 |
| Sep-12 | 257,605,213 | 0 | 0 | 0.00% | 0 | 0 | 0.00% | 0 | 0 | 0.00% | 0.00 | 13,352,593 | 94,319,839 | 33.01 | 30.24 |
| Oct-12 | 240,660,034 | 0 | 0 | 0.00% | 0 | 0 | 0.00% | 0 | 0 | 0.00% | 0.00 | 16,576,155 | 110,895,994 | 45.53 | 32.56 |
| Nov-12 | 221,883,799 | 0 | 0 | 0.00% | 0 | 0 | 0.00% | 0 | 0 | 0.00% | 0.00 | 18,434,886 | 129,330,880 | 54.51 | 35.22 |
| Dec-12 | 212,684,793 | 0 | 0 | 0.00% | 0 | 0 | 0.00% | 0 | 0 | 0.00% | 0.00 | 8,883,510 | 138,214,390 | 52.72 | 35.47 |
| Jan-13 | 197,094,563 | 0 | 0 | 0.00% | 0 | 0 | 0.00% | 0 | 0 | 0.00% | 0.00 | 15,285,765 | 153,500,155 | 54.24 | 37.29 |
| Feb-13 | 183,177,848 | 0 | 0 | 0.00% | 0 | 0 | 0.00% | 0 | 0 | 0.00% | 0.00 | 13,629,535 | 167,129,690 | 52.75 | 38.73 |
| Mar-13 | 168,617,488 | 0 | 0 | 0.00% | 1 | 786,378 | 0.46% | 0 | 0 | 0.00% | 0.00 | 14,296,767 | 181,426,457 | 59.81 | 40.37 |
| Apr-13 | 159,084,943 | 0 | 0 | 0.00% | 0 | 0 | 0.00% | 1 | 786,378 | 0.49% | 0.00 | 9,289,580 | 190,716,036 | 56.80 | 40.88 |
| May-13 | 151,359,418 | 0 | 0 | 0.00% | 0 | 0 | 0.00% | 0 | 0 | 0.00% | 0.00 | 7,495,163 | 198,211,200 | 52.57 | 41.04 |
| Jun-13 | 140,208,238 | 0 | 0 | 0.00% | 0 | 0 | 0.00% | 0 | 0 | 0.00% | 0.00 | 10,929,251 | 209,140,451 | 51.35 | 42.08 |
| Jul-13 | 135,399,923 | 0 | 0 | 0.00% | 0 | 0 | 0.00% | 0 | 0 | 0.00% | 0.00 | 4,598,986 | 213,739,437 | 46.60 | 41.7 |
| Aug-13 | 128,143,640 | 0 | 0 | 0.00% | 0 | 0 | 0.00% | 0 | 0 | 0.00% | 0.00 | 7,051,285 | 220,790,722 | 47.71 | 41.96 |
| Sep-13 | 119,722,246 | 1 | 779,152 | 0.65% | 0 | 0 | 0.00% | 0 | 0 | 0.00% | 0.00 | 8,228,013 | 229,018,735 | 45.87 | 42.57 |
| Oct-13 | 116,562,189 | 1 | 778,100 | 0.66% | 0 | 0 | 0.00% | 0 | 0 | 0.00% | 0.00 | 2,979,114 | 231,997,849 | 44.06 | 41.99 |
| Nov-13 | 112,999,809 | 1 | 777,046 | 0.68% | 0 | 0 | 0.00% | 0 | 0 | 0.00% | 0.00 | 3,385,406 | 235,383,255 | 38.42 | 41.57 |
| Dec-13 | 110,574,148 | 0 | 0 | 0.00% | 0 | 0 | 0.00% | 0 | 0 | 0.00% | 0.00 | 2,252,906 | 237,636,161 | 25.90 | 40.92 |
| Jan-14 | 108,977,835 | 0 | 0 | 0.00% | 1 | 775,987 | 0.71% | 0 | 0 | 0.00% | 0.00 | 1,426,249 | 239,062,410 | 22.18 | 40.14 |
| C-5 |
SEMT 2012-1
Original Pool Characteristics
| Total Stated Principal Balance | $415,728,134 |
| Number of Mortgage Loans | 446 |
| Average Stated Principal Balance | $932,126 |
| Weighted Average Mortgage Rate | 4.549% |
| Weighted Average Margin (by Securitized Balance) (HYB only) | 1.783% |
| Weighted Average Remaining Term to Maturity (in Months by Securitized Balance) | 325 |
| Weighted Average FICO (by Securitized Balance) | 770 |
| Weighted Average Loan-to-Value Ratio (by Original Balance) | 62.80% |
Mortgage Rate Range
| 2.51% - 3.00% | 0.49% |
| 3.01% - 3.50% | 1.28% |
| 3.51% - 4.00% | 15.35% |
| 4.01% - 4.50% | 23.69% |
| 4.51% - 5.00% | 49.05% |
| 5.01% - 5.50% | 10.13% |
| >5.50% | 0.00% |
Product Type
| Fixed Rate 15YR | 16.62% |
| Fixed Rate 30YR | 52.88% |
| HYB 5/1 | 4.04% |
| HYB 7/1 | 3.01% |
| HYB 10/1 | 23.45% |
Interest Only Loans
| Yes | 22.59% |
| No | 77.41% |
Geographic Distribution
| CA | 48.57% |
| NY | 11.01% |
| TX | 10.80% |
| IL | 3.98% |
| MA | 3.78% |
| WA | 2.75% |
| CO | 2.73% |
| FL | 1.99% |
| NJ | 1.42% |
| CT | 1.41% |
| Other | 11.56% |
Occupancy
| Primary | 89.74% |
| Second Home | 8.27% |
| Investor Property | 1.98% |
Property Type
| Single Family | 67.48% |
| PUD | 19.30% |
| Condominium | 9.40% |
| Cooperative Unit | 2.21% |
| 2-4 Family | 1.61% |
Documentation
| Full Documentation | 100.00% |
| Less than Full | 0.0% |
| C-6 |
| SEMT 2012-1 | Ending Balance $ | 30 Day Delq # | 30 Day Delq Balance $ | 30 Day Delq Balance % | 60 Day Delq # | 60 Day Delq Balance $ | 60 Day Delq Balance % | 90+ Day Delq # | 90+ Day Delq Balance $ | 90+ Day Delq Balance % | Cumulative Loss Amount $ | Prepayment Amount $ | Cumulative Prepayment Amount $ | 3 Month CPR | Cumulative CPR |
| Feb-12 | 412,202,072 | 0 | - | 0.00% | 0 | - | 0.00% | 0 | - | 0.00% | 0.00 | 2,898,763 | 2,898,763 | 8.07 | |
| Mar-12 | 407,846,775 | 2 | 1,919,324 | 0.46% | 0 | - | 0.00% | 0 | - | 0.00% | 0.00 | 3,727,240 | 6,626,003 | 9.21 | |
| Apr-12 | 400,686,739 | 0 | - | 0.00% | 0 | - | 0.00% | 0 | - | 0.00% | 0.00 | 6,536,645 | 13,162,647 | 12.12 | 12.12 |
| May-12 | 395,577,690 | 0 | - | 0.00% | 0 | - | 0.00% | 0 | - | 0.00% | 0.00 | 4,489,730 | 17,652,377 | 13.61 | 12.26 |
| Jun-12 | 388,532,426 | 0 | - | 0.00% | 0 | - | 0.00% | 0 | - | 0.00% | 0.00 | 6,426,735 | 24,079,113 | 16.11 | 13.42 |
| Jul-12 | 380,446,563 | 0 | - | 0.00% | 0 | - | 0.00% | 0 | - | 0.00% | 0.00 | 7,470,434 | 31,549,546 | 17.19 | 14.7 |
| Aug-12 | 370,670,663 | 1 | 880,989 | 0.23% | 0 | - | 0.00% | 0 | - | 0.00% | 0.00 | 9,162,630 | 40,712,177 | 21.44 | 16.33 |
| Sep-12 | 362,632,559 | 1 | 1,200,694 | 0.33% | 0 | - | 0.00% | 0 | - | 0.00% | 0.00 | 7,437,314 | 48,149,490 | 22.65 | 17.01 |
| Oct-12 | 345,207,634 | 0 | - | 0.00% | 0 | - | 0.00% | 0 | - | 0.00% | 0.00 | 16,832,850 | 64,982,340 | 30.88 | 20.49 |
| Nov-12 | 333,324,402 | 0 | - | 0.00% | 0 | - | 0.00% | 0 | - | 0.00% | 0.00 | 11,308,311 | 76,290,651 | 33.32 | 21.85 |
| Dec-12 | 317,216,323 | 0 | - | 0.00% | 0 | - | 0.00% | 0 | - | 0.00% | 0.00 | 15,555,215 | 91,845,866 | 40.28 | 24.15 |
| Jan-13 | 297,185,541 | 0 | - | 0.00% | 0 | - | 0.00% | 0 | - | 0.00% | 0.00 | 19,505,229 | 111,351,095 | 43.96 | 27.17 |
| Feb-13 | 279,076,177 | 0 | - | 0.00% | 0 | - | 0.00% | 0 | - | 0.00% | 0.00 | 17,601,251 | 128,952,346 | 49.87 | 29.47 |
| Mar-13 | 263,903,044 | 0 | - | 0.00% | 0 | - | 0.00% | 0 | - | 0.00% | 0.00 | 14,684,604 | 143,636,950 | 51.13 | 30.98 |
| Apr-13 | 248,208,835 | 0 | - | 0.00% | 0 | - | 0.00% | 0 | - | 0.00% | 0.00 | 15,229,791 | 158,866,741 | 50.33 | 32.55 |
| May-13 | 237,135,171 | 1 | 493,065 | 0.20% | 0 | - | 0.00% | 0 | - | 0.00% | 0.00 | 10,638,321 | 169,505,062 | 46.76 | 33.12 |
| Jun-13 | 224,218,554 | 0 | - | 0.00% | 0 | - | 0.00% | 0 | - | 0.00% | 0.00 | 12,484,380 | 181,989,442 | 46.77 | 34.09 |
| Jul-13 | 213,227,290 | 0 | - | 0.00% | 0 | - | 0.00% | 0 | - | 0.00% | 0.00 | 10,576,937 | 192,566,379 | 44.37 | 34.7 |
| Aug-13 | 203,258,581 | 0 | - | 0.00% | 0 | - | 0.00% | 0 | - | 0.00% | 0.00 | 9,568,333 | 202,134,712 | 44.82 | 35.14 |
| Sep-13 | 196,889,693 | 0 | - | 0.00% | 0 | - | 0.00% | 0 | - | 0.00% | 0.00 | 5,978,077 | 208,112,789 | 39.20 | 34.91 |
| Oct-13 | 193,641,014 | 0 | - | 0.00% | 0 | - | 0.00% | 0 | - | 0.00% | 0.00 | 2,863,709 | 210,976,498 | 30.42 | 34.13 |
| Nov-13 | 187,098,556 | 0 | 0 | 0.00% | 0 | 0 | 0.00% | 0 | 0 | 0.00% | 0.00 | 6,160,262 | 217,136,760 | 26.52 | 34.05 |
| Dec-13 | 185,169,535 | 1 | 603,086 | 0.32% | 0 | 0 | 0.00% | 0 | 0 | 0.00% | 0.00 | 1,560,945 | 218,697,705 | 19.90 | 33.15 |
| Jan-14 | 181,668,291 | 0 | 0 | 0.00% | 0 | 0 | 0.00% | 0 | 0 | 0.00% | 0.00 | 3,132,180 | 221,829,885 | 20.66 | 32.61 |
| C-7 |
SEMT 2012-2
Original Pool Characteristics
| Total Stated Principal Balance | $327,935,218 |
| Number of Mortgage Loans | 366 |
| Average Stated Principal Balance | $895,998 |
| Weighted Average Mortgage Rate | 4.603% |
| Weighted Average Remaining Term to Maturity (in Months by Securitized Balance) | 325 |
| Weighted Average FICO (by Securitized Balance) | 769 |
| Weighted Average Loan-to-Value Ratio (by Original Balance) | 63.50% |
Mortgage Rate Range
| 3.51% - 4.00% | 1.66% |
| 4.01% - 4.50% | 38.97% |
| 4.51% - 5.00% | 50.05% |
| 5.01% - 5.50% | 9.23% |
| >5.500% | 0.08% |
Product Type
| Fixed Rate 30YR | 100.00% |
Interest Only Loans
| Yes | 10.02% |
| No | 89.98% |
Geographic Distribution
| CA | 49.61% |
| TX | 11.82% |
| NY | 7.95% |
| MA | 4.25% |
| IL | 3.32% |
| NJ | 2.57% |
| FL | 2.25% |
| OR | 1.92% |
| WA | 1.90% |
| CO | 1.43% |
| Other | 12.99% |
Occupancy
| Primary | 92.25% |
| Second Home | 5.68% |
| Investor Property | 2.07% |
Property Type
| Single Family | 69.51% |
| PUD Detached | 16.00% |
| Condo High-Rise | 4.86% |
| PUD Attached | 3.12% |
| Cooperative Unit | 3.09% |
| 2 Family | 1.91% |
| Condo Low-Rise | 1.03% |
| 4 Family | 0.48% |
Documentation
| Full Documentation | 100.00% |
| C-8 |
| SEMT 2012-2 | Ending Balance $ | 30 Day Delq # | 30 Day Delq Balance $ | 30 Day Delq Balance % | 60 Day Delq # | 60 Day Delq Balance $ | 60 Day Delq Balance % | 90+ Day Delq # | 90+ Day Delq Balance $ | 90+ Day Delq Balance % | Cumulative Loss Amount $ | Prepayment Amount $ | Cumulative Prepayment Amount $ | 3 Month CPR | Cumulative CPR |
| Apr-12 | 325,097,242 | 0 | 0 | 0.00% | 0 | 0 | 0.00% | 0 | 0 | 0.00% | 0.00 | 2,447,686 | 2,447,686 | 8.61 | |
| May-12 | 322,971,627 | 0 | 0 | 0.00% | 0 | 0 | 0.00% | 0 | 0 | 0.00% | 0.00 | 1,736,414 | 4,184,100 | 7.43 | |
| Jun-12 | 321,388,870 | 0 | 0 | 0.00% | 0 | 0 | 0.00% | 0 | 0 | 0.00% | 0.00 | 1,192,869 | 5,376,970 | 6.41 | 6.41 |
| Jul-12 | 320,630,016 | 0 | 0 | 0.00% | 0 | 0 | 0.00% | 0 | 0 | 0.00% | 0.00 | 367,226 | 5,744,195 | 4.01 | 5.18 |
| Aug-12 | 312,209,745 | 0 | 0 | 0.00% | 0 | 0 | 0.00% | 0 | 0 | 0.00% | 0.00 | 8,026,024 | 13,770,219 | 11.40 | 9.83 |
| Sep-12 | 304,353,532 | 0 | 0 | 0.00% | 0 | 0 | 0.00% | 0 | 0 | 0.00% | 0.00 | 7,470,724 | 21,240,944 | 18.38 | 12.61 |
| Oct-12 | 292,378,792 | 0 | 0 | 0.00% | 0 | 0 | 0.00% | 0 | 0 | 0.00% | 0.00 | 11,594,545 | 32,835,489 | 29.82 | 16.66 |
| Nov-12 | 288,923,641 | 0 | 0 | 0.00% | 0 | 0 | 0.00% | 0 | 0 | 0.00% | 0.00 | 3,090,299 | 35,925,788 | 25.56 | 16.09 |
| Dec-12 | 272,346,518 | 0 | 0 | 0.00% | 0 | 0 | 0.00% | 0 | 0 | 0.00% | 0.00 | 16,214,484 | 52,140,272 | 34.91 | 20.79 |
| Jan-13 | 257,591,728 | 0 | 0 | 0.00% | 0 | 0 | 0.00% | 0 | 0 | 0.00% | 0.00 | 14,407,439 | 66,547,711 | 38.84 | 24.05 |
| Feb-13 | 243,685,056 | 0 | 0 | 0.00% | 0 | 0 | 0.00% | 0 | 0 | 0.00% | 0.00 | 13,574,308 | 80,122,019 | 48.62 | 26.60 |
| Mar-13 | 232,666,575 | 0 | 0 | 0.00% | 0 | 0 | 0.00% | 0 | 0 | 0.00% | 0.00 | 10,705,061 | 90,827,080 | 45.91 | 28.00 |
| Apr-13 | 220,806,705 | 1 | 590,086 | 0.26% | 0 | 0 | 0.00% | 0 | 0 | 0.00% | 0.00 | 11,559,723 | 102,386,804 | 45.16 | 29.56 |
| May-13 | 213,644,621 | 0 | 0 | 0.00% | 0 | 0 | 0.00% | 0 | 0 | 0.00% | 0.00 | 6,878,000 | 109,264,803 | 39.99 | 29.71 |
| Jun-13 | 198,805,285 | 0 | 0 | 0.00% | 0 | 0 | 0.00% | 0 | 0 | 0.00% | 0.00 | 14,560,101 | 123,824,905 | 45.86 | 31.99 |
| Jul-13 | 192,987,062 | 1 | 587,882 | 0.30% | 0 | 0 | 0.00% | 0 | 0 | 0.00% | 0.00 | 5,554,797 | 129,379,702 | 40.73 | 31.81 |
| Aug-13 | 187,015,228 | 0 | 0 | 0.00% | 0 | 0 | 0.00% | 0 | 0 | 0.00% | 0.00 | 5,712,615 | 135,092,317 | 40.35 | 31.72 |
| Sep-13 | 184,125,877 | 0 | 0 | 0.00% | 0 | 0 | 0.00% | 0 | 0 | 0.00% | 0.00 | 2,634,630 | 137,726,947 | 25.24 | 30.92 |
| Oct-13 | 182,701,876 | 0 | 0 | 0.00% | 0 | 0 | 0.00% | 0 | 0 | 0.00% | 0.00 | 1,171,696 | 138,898,643 | 18.36 | 29.85 |
| Nov-13 | 180,611,415 | 0 | 0 | 0.00% | 0 | 0 | 0.00% | 0 | 0 | 0.00% | 0.00 | 1,838,149 | 140,736,792 | 11.57 | 29.03 |
| Dec-13 | 179,973,583 | 0 | 0 | 0.00% | 0 | 0 | 0.00% | 0 | 0 | 0.00% | 0.00 | 386,110 | 141,122,902 | 7.20 | 27.95 |
| Jan-14 | 177,908,706 | 0 | 0 | 0.00% | 0 | 0 | 0.00% | 0 | 0 | 0.00% | 0.00 | 1,812,475 | 142,935,377 | 8.58 | 27.28 |
| C-9 |
SEMT 2012-3
Original Pool Characteristics
| Total Stated Principal Balance | $293,590,499 |
| Number of Mortgage Loans | 331 |
| Average Stated Principal Balance | $886,980 |
| Weighted Average Mortgage Rate | 4.466% |
| Weighted Average Remaining Term to Maturity (in Months by Securitized Balance) | 360 |
| Weighted Average FICO (by Securitized Balance) | 768 |
| Weighted Average Loan-to-Value Ratio (by Original Balance) | 67.07% |
Mortgage Rate Range
| 3.51% - 4.00% | 0.77% |
| 4.01% - 4.50% | 65.47% |
| 4.51% - 5.00% | 33.56% |
| 5.01% - 5.50% | 0.19% |
| >5.00% | 0.00% |
Product Type
| Fixed Rate 30YR | 100.00% |
Interest Only Loans
| Yes | 5.17% |
| No | 94.83% |
Geographic Distribution
| CA | 49.22% |
| TX | 12.63% |
| NY | 5.31% |
| WA | 4.22% |
| MA | 3.86% |
| CT | 3.45% |
| FL | 3.29% |
| IL | 2.36% |
| MD | 1.56% |
| CO | 1.33% |
| Other | 12.76% |
Occupancy
| Primary | 94.13% |
| Second Home | 3.91% |
| Investor Property | 1.96% |
Property Type
| Single Family | 73.53% |
| PUD Detached | 15.93% |
| Condo High-Rise | 3.35% |
| PUD Attached | 1.44% |
| Condo Low-Rise | 2.56% |
| 2 -4 Family | 2.21% |
| Cooperative Unit | 0.99% |
Documentation
| Full Documentation | 100.00% |
| Less than Full | 0.00% |
| C-10 |
| SEMT 2012-3 | Ending Balance $ | 30 Day Delq # | 30 Day Delq Balance $ | 30 Day Delq Balance % | 60 Day Delq # | 60 Day Delq Balance $ | 60 Day Delq Balance % | 90+ Day Delq # | 90+ Day Delq Balance $ | 90+ Day Delq Balance % | Cumulative Loss Amount $ | Prepayment Amount $ | Cumulative Prepayment Amount $ | 3 Month CPR | Cumulative CPR |
| Jul-12 | 291,796,996 | 0 | 0 | 0.00% | 0 | 0 | 0.00% | 0 | 0 | 0.00% | 0.00 | 1,419,771 | 1,419,771 | 5.66 | |
| Aug-12 | 291,349,873 | 3 | 2,549,726 | 0.87% | 0 | 0 | 0.00% | 0 | 0 | 0.00% | 0.00 | 73,658 | 1,493,429 | 3.02 | |
| Sep-12 | 288,825,060 | 0 | 0 | 0.00% | 0 | 0 | 0.00% | 0 | 0 | 0.00% | 0.00 | 2,149,690 | 3,643,119 | 4.89 | 4.89 |
| Oct-12 | 282,571,860 | 0 | 0 | 0.00% | 0 | 0 | 0.00% | 0 | 0 | 0.00% | 0.00 | 5,879,394 | 9,522,513 | 10.69 | 9.46 |
| Nov-12 | 277,932,075 | 0 | 0 | 0.00% | 0 | 0 | 0.00% | 0 | 0 | 0.00% | 0.00 | 4,271,266 | 13,793,779 | 15.89 | 10.96 |
| Dec-12 | 271,377,172 | 0 | 0 | 0.00% | 0 | 0 | 0.00% | 0 | 0 | 0.00% | 0.00 | 6,187,002 | 19,980,781 | 20.83 | 13.23 |
| Jan-13 | 264,981,268 | 0 | 0 | 0.00% | 0 | 0 | 0.00% | 0 | 0 | 0.00% | 0.00 | 6,034,762 | 26,015,543 | 21.44 | 14.81 |
| Feb-13 | 253,842,050 | 0 | 0 | 0.00% | 0 | 0 | 0.00% | 0 | 0 | 0.00% | 0.00 | 10,784,641 | 36,800,184 | 29.30 | 18.34 |
| Mar-13 | 240,658,906 | 0 | 0 | 0.00% | 0 | 0 | 0.00% | 0 | 0 | 0.00% | 0.00 | 12,840,955 | 49,641,139 | 37.15 | 22.08 |
| Apr-13 | 231,316,513 | 0 | 0 | 0.00% | 0 | 0 | 0.00% | 0 | 0 | 0.00% | 0.00 | 9,016,499 | 58,657,638 | 40.98 | 23.7 |
| May-13 | 217,910,512 | 0 | 0 | 0.00% | 0 | 0 | 0.00% | 0 | 0 | 0.00% | 0.00 | 13,090,703 | 71,748,341 | 44.80 | 26.62 |
| Jun-13 | 216,038,247 | 1 | 1,967,562 | 0.90% | 0 | 0 | 0.00% | 0 | 0 | 0.00% | 0.00 | 1,574,224 | 73,322,564 | 33.99 | 25.25 |
| Jul-13 | 206,270,725 | 0 | 0 | 0.00% | 0 | 0 | 0.00% | 0 | 0 | 0.00% | 0.00 | 9,470,167 | 82,792,731 | 35.72 | 26.66 |
| Aug-13 | 202,871,014 | 1 | 1,471,662 | 0.72% | 0 | 0 | 0.00% | 0 | 0 | 0.00% | 0.00 | 3,111,294 | 85,904,025 | 23.63 | 25.99 |
| Sep-13 | 202,549,711 | 0 | 0 | 0.00% | 0 | 0 | 0.00% | 0 | 0 | 0.00% | 0.00 | 35,558 | 85,939,583 | 21.44 | 24.51 |
| Oct-13 | 201,465,017 | 0 | 0 | 0.00% | 0 | 0 | 0.00% | 0 | 0 | 0.00% | 0.00 | 797,760 | 86,737,343 | 7.45 | 23.4 |
| Nov-13 | 199,110,111 | 0 | 0 | 0.00% | 0 | 0 | 0.00% | 0 | 0 | 0.00% | 0.00 | 2,067,274 | 88,804,617 | 5.62 | 22.76 |
| Dec-13 | 197,938,677 | 1 | 543,838 | 0.27% | 0 | 0 | 0.00% | 0 | 0 | 0.00% | 0.00 | 885,218 | 89,689,835 | 7.23 | 21.88 |
| Jan-14 | 197,425,377 | 0 | 0 | 0.00% | 0 | 0 | 0.00% | 0 | 0 | 0.00% | 0.00 | 227,024 | 89,916,859 | 6.18 | 20.91 |
| C-11 |
SEMT 2012-4
Original Pool Characteristics
| Total Stated Principal Balance | $313,225,626 |
| Number of Mortgage Loans | 372 |
| Average Stated Principal Balance | $842,004 |
| Weighted Average Mortgage Rate | 4.355% |
| Weighted Average Remaining Term to Maturity (in Months by Securitized Balance) | 333 |
| Weighted Average FICO (by Securitized Balance) | 774 |
| Weighted Average Loan-to-Value Ratio (by Original Balance) | 66.38% |
Mortgage Rate Range
| 3.00% - 3.50% | 0.21% |
| 3.51% - 4.00% | 12.18% |
| 4.01% - 4.50% | 67.22% |
| 4.51% - 5.00% | 19.98% |
| 5.01% - 5.25% | 0.40% |
Product Type
| Fixed Rate 30YR | 86.75% |
| Fixed Rate 15YR | 12.15% |
| Fixed Rate 20YR | 1.09% |
Interest Only Loans
| Yes | 6.97% |
| No | 93.03% |
Geographic Distribution
| CA | 43.19% |
| TX | 15.56% |
| IL | 5.05% |
| MA | 4.75% |
| FL | 3.07% |
| WA | 3.00% |
| NY | 2.93% |
| CO | 2.59% |
| AZ | 2.31% |
| MD | 1.85% |
| Other | 15.70% |
Occupancy
| Primary | 94.12% |
| Second Home | 5.07% |
| Investor Property | 0.81% |
Property Type
| Single Family | 69.07% |
| Planned Unit Development | 20.68% |
| Condominium | 7.12% |
| Cooperative Unit | 1.95% |
| 2 -4 Family | 1.17% |
Documentation
| Full Documentation | 100.00% |
| Less than Full | 0.00% |
| C-12 |
| SEMT 2012-4 | Ending Balance $ | 30 Day Delq # | 30 Day Delq Balance $ | 30 Day Delq Balance % | 60 Day Delq # | 60 Day Delq Balance $ | 60 Day Delq Balance % | 90+ Day Delq # | 90+ Day Delq Balance $ | 90+ Day Delq Balance % | Cumulative Loss Amount $ | Prepayment Amount $ | Cumulative Prepayment Amount $ | 3 Month CPR | Cumulative CPR |
| Oct-12 | 311,445,972 | 4 | 4,196,792 | 1.34% | 0 | 0 | 0.00% | 0 | 0 | 0.00% | 0.00 | 1,196,013 | 1,196,013 | 4.77 | |
| Nov-12 | 305,746,603 | 2 | 1,320,814 | 0.43% | 0 | 0 | 0.00% | 0 | 0 | 0.00% | 0.00 | 5,186,625 | 6,382,638 | 11.82 | |
| Dec-12 | 303,888,849 | 0 | 0 | 0.00% | 0 | 0 | 0.00% | 0 | 0 | 0.00% | 0.00 | 1,346,252 | 7,728,891 | 9.67 | 9.67 |
| Jan-13 | 297,536,045 | 1 | 526,313 | 0.17% | 0 | 0 | 0.00% | 0 | 0 | 0.00% | 0.00 | 5,844,271 | 13,573,162 | 15.08 | 12.61 |
| Feb-13 | 292,336,896 | 0 | 0 | 0.00% | 0 | 0 | 0.00% | 0 | 0 | 0.00% | 0.00 | 4,704,319 | 18,277,481 | 14.72 | 13.57 |
| Mar-13 | 274,436,646 | 0 | 0 | 0.00% | 0 | 0 | 0.00% | 0 | 0 | 0.00% | 0.00 | 17,408,392 | 35,685,873 | 32.13 | 21.69 |
| Apr-13 | 267,473,577 | 0 | 0 | 0.00% | 0 | 0 | 0.00% | 0 | 0 | 0.00% | 0.00 | 6,497,496 | 42,183,369 | 33.37 | 21.75 |
| May-13 | 260,326,851 | 0 | 0 | 0.00% | 0 | 0 | 0.00% | 0 | 0 | 0.00% | 0.00 | 6,687,513 | 48,870,882 | 35.83 | 22.33 |
| Jun-13 | 249,627,386 | 1 | 745,597 | 0.29% | 0 | 0 | 0.00% | 0 | 0 | 0.00% | 0.00 | 10,256,736 | 59,127,618 | 30.13 | 24.29 |
| Jul-13 | 245,266,401 | 0 | 0 | 0.00% | 0 | 0 | 0.00% | 0 | 0 | 0.00% | 0.00 | 3,933,656 | 63,061,274 | 27.82 | 23.63 |
| Aug-13 | 236,346,092 | 1 | 520,753 | 0.22% | 0 | 0 | 0.00% | 0 | 0 | 0.00% | 0.00 | 8,493,768 | 71,555,042 | 30.65 | 24.69 |
| Sep-13 | 231,842,317 | 0 | 0 | 0.00% | 0 | 0 | 0.00% | 0 | 0 | 0.00% | 0.00 | 4,093,696 | 75,648,738 | 24.04 | 24.23 |
| Oct-13 | 229,781,264 | 0 | 0 | 0.00% | 0 | 0 | 0.00% | 0 | 0 | 0.00% | 0.00 | 1,654,948 | 77,303,686 | 21.33 | 23.11 |
| Nov-13 | 227,912,924 | 1 | 1,075,591 | 0.47% | 0 | 0 | 0.00% | 0 | 0 | 0.00% | 0.00 | 1,459,558 | 78,763,244 | 11.70 | 22.08 |
| Dec-13 | 226,695,671 | 0 | 0 | 0.00% | 0 | 0 | 0.00% | 0 | 0 | 0.00% | 0.00 | 808,791 | 79,572,035 | 6.63 | 21 |
| Jan-14 | 223,514,420 | 1 | 975,648 | 0.43% | 0 | 0 | 0.00% | 0 | 0 | 0.00% | 0.00 | 2,771,646 | 82,343,681 | 8.53 | 20.57 |
| C-13 |
SEMT 2012-5
Original Pool Characteristics
| Total Stated Principal Balance | $320,339,050 |
| Number of Mortgage Loans | 390 |
| Average Stated Principal Balance | $821,382 |
| Weighted Average Mortgage Rate | 4.214% |
| Weighted Average Remaining Term to Maturity (in Months by Securitized Balance) | 357 |
| Weighted Average FICO (by Securitized Balance) | 770 |
| Weighted Average Loan-to-Value Ratio (by Original Balance) | 67.52% |
Mortgage Rate Range
| 3.51% - 4.00% | 21.08% |
| 4.01% - 4.50% | 74.13% |
| 4.51% - 5.00% | 4.06% |
Product Type
| Fixed Rate 30YR | 99.40% |
| Fixed Rate 20YR | 0.60% |
Interest Only Loans
| Yes | 4.89% |
| No | 95.11% |
Geographic Distribution
| CA | 44.00% |
| TX | 13.44% |
| WA | 5.84% |
| CO | 4.54% |
| MA | 4.22% |
| NY | 4.03% |
| AZ | 2.77% |
| CT | 2.61% |
| GA | 2.47% |
| IL | 2.12% |
| Other | 13.96% |
Occupancy
| Primary | 94.32% |
| Second Home | 4.08% |
| Investor Property | 1.60% |
Property Type
| Single Family | 63.29% |
| Planned Unit Development | 27.49% |
| Condominium | 5.10% |
| 2 -4 Family | 2.68% |
| Cooperative Unit | 1.46% |
Documentation
| Full Documentation | 100.00% |
| Less than Full | 0.00% |
| C-14 |
| SEMT 2012-5 | Ending Balance $ | 30 Day Delq # | 30 Day Delq Balance $ | 30 Day Delq Balance % | 60 Day Delq # | 60 Day Delq Balance $ | 60 Day Delq Balance % | 90+ Day Delq # | 90+ Day Delq Balance $ | 90+ Day Delq Balance % | Cumulative Loss Amount $ | Prepayment Amount $ | Cumulative Prepayment Amount $ | 3 Month CPR | Cumulative CPR |
| Nov-12 | 319,640,528 | 1 | 1,247,086 | 0.38% | 0 | 0 | 0.00% | 0 | 0 | 0.00% | 0.00 | 268,335 | 268,335 | 1.00 | |
| Dec-12 | 319,162,100 | 1 | 710,533 | 0.22% | 0 | 0 | 0.00% | 0 | 0 | 0.00% | 0.00 | 46,505 | 314,839 | 0.59 | |
| Jan-13 | 316,659,175 | 1 | 557,477 | 0.17% | 0 | 0 | 0.00% | 0 | 0 | 0.00% | 0.00 | 2,069,329 | 2,384,168 | 2.96 | 2.96 |
| Feb-13 | 310,719,260 | 1 | 752,793 | 0.24% | 0 | 0 | 0.00% | 0 | 0 | 0.00% | 0.00 | 5,506,734 | 7,890,902 | 9.24 | 7.25 |
| Mar-13 | 303,686,310 | 1 | 439,864 | 0.14% | 0 | 0 | 0.00% | 0 | 0 | 0.00% | 0.00 | 6,605,900 | 14,496,802 | 16.68 | 10.58 |
| Apr-13 | 301,562,385 | 0 | 0 | 0.00% | 0 | 0 | 0.00% | 0 | 0 | 0.00% | 0.00 | 1,705,072 | 16,201,874 | 16.38 | 9.92 |
| May-13 | 292,650,309 | 0 | 0 | 0.00% | 0 | 0 | 0.00% | 0 | 0 | 0.00% | 0.00 | 8,492,499 | 24,694,373 | 20.02 | 12.94 |
| Jun-13 | 287,430,567 | 0 | 0 | 0.00% | 0 | 0 | 0.00% | 0 | 0 | 0.00% | 0.00 | 4,811,593 | 29,505,967 | 18.41 | 13.60 |
| Jul-13 | 285,257,797 | 1 | 437,298 | 0.15% | 0 | 0 | 0.00% | 0 | 0 | 0.00% | 0.00 | 1,769,088 | 31,275,055 | 18.58 | 12.91 |
| Aug-13 | 280,863,428 | 0 | 0 | 0.00% | 0 | 0 | 0.00% | 0 | 0 | 0.00% | 0.00 | 3,992,456 | 35,267,511 | 13.72 | 13.18 |
| Sep-13 | 279,056,815 | 0 | 0 | 0.00% | 0 | 0 | 0.00% | 0 | 0 | 0.00% | 0.00 | 1,409,663 | 36,677,174 | 9.64 | 12.54 |
| Oct-13 | 277,937,669 | 0 | 0 | 0.00% | 0 | 0 | 0.00% | 0 | 0 | 0.00% | 0.00 | 722,669 | 37,399,843 | 8.36 | 12.09 |
| Nov-13 | 275,353,780 | 0 | 0 | 0.00% | 0 | 0 | 0.00% | 0 | 0 | 0.00% | 0.00 | 707,118 | 38,106,961 | 5.30 | 11.42 |
| Dec-13 | 273,971,543 | 2 | 1,176,026 | 0.42% | 0 | 0 | 0.00% | 0 | 0 | 0.00% | 0.00 | 1,517,683 | 39,624,644 | 5.49 | 11.07 |
| Jan-14 | 271,899,706 | 2 | 964,663 | 0.35% | 0 | 0 | 0.00% | 0 | 0 | 0.00% | 0.00 | 1,675,158 | 41,299,802 | 6.83 | 10.82 |
| C-15 |
SEMT 2012-6
Original Pool Characteristics
| Total Stated Principal Balance | $301,462,461 |
| Number of Mortgage Loans | 358 |
| Average Stated Principal Balance | $842,074 |
| Weighted Average Mortgage Rate | 4.079% |
| Weighted Average Remaining Term to Maturity (in Months by Securitized Balance) | 356 |
| Weighted Average FICO (by Securitized Balance) | 771 |
| Weighted Average Loan-to-Value Ratio (by Original Balance) | 66.68% |
Mortgage Rate Range
| 3.25% - 3.50% | 1.62% |
| 3.51% - 4.00% | 48.43% |
| 4.01% - 4.50% | 47.94% |
| 4.51% - 5.00% | 2.01% |
Product Type
| Fixed Rate 30YR | 2.02% |
| Fixed Rate 20YR | 97.98% |
Interest Only Loans
| Yes | 1.59% |
| No | 98.41% |
Geographic Distribution
| CA | 44.90% |
| TX | 10.74% |
| WA | 6.24% |
| MA | 5.66% |
| CO | 5.44% |
| NY | 3.71% |
| AZ | 3.01% |
| GA | 2.99% |
| IL | 1.94% |
| VA | 1.66% |
| Other | 13.71% |
Occupancy
| Primary | 95.07% |
| Second Home | 4.12% |
| Investor Property | 0.82% |
Property Type
| Single Family | 69.24% |
| Planned Unit Development | 23.12% |
| Condominium | 4.64% |
| 2 -4 Family | 1.89% |
| Cooperative Unit | 1.11% |
Documentation
| Full Documentation | 100.00% |
| Less than Full | 0.00% |
| C-16 |
| SEMT 2012-6 | Ending Balance $ | 30 Day Delq # | 30 Day Delq Balance $ | 30 Day Delq Balance % | 60 Day Delq # | 60 Day Delq Balance $ | 60 Day Delq Balance % | 90+ Day Delq # | 90+ Day Delq Balance $ | 90+ Day Delq Balance % | Cumulative Loss Amount $ | Prepayment Amount $ | Cumulative Prepayment Amount $ | 3 Month CPR | Cumulative CPR |
| Dec-12 | 301,002,659 | 0 | 0 | 0.00% | 0 | 0 | 0.00% | 0 | 0 | 0.00% | 0.00 | 27,500 | 27,500 | 0.11 | |
| Jan-13 | 300,522,678 | 3 | 3,861,349 | 1.28% | 0 | 0 | 0.00% | 0 | 0 | 0.00% | 0.00 | 46,122 | 73,622 | 0.15 | |
| Feb-13 | 299,325,481 | 1 | 673,095 | 0.22% | 0 | 0 | 0.00% | 1 | 489,866 | 0.16% | 0.00 | 761,714 | 835,336 | 1.11 | 1.11 |
| Mar-13 | 294,007,895 | 1 | 996,123 | 0.33% | 0 | 0 | 0.00% | 1 | 489,150 | 0.16% | 0.00 | 4,880,728 | 5,716,064 | 7.38 | 5.61 |
| Apr-13 | 289,858,197 | 2 | 1,858,486 | 0.64% | 0 | 0 | 0.00% | 1 | 488,432 | 0.16% | 0.00 | 3,717,850 | 9,433,914 | 11.93 | 7.40 |
| May-13 | 283,437,191 | 1 | 1,268,934 | 0.44% | 0 | 0 | 0.00% | 1 | 487,711 | 0.17% | 0.00 | 5,992,845 | 15,426,760 | 18.17 | 10.05 |
| Jun-13 | 276,698,421 | 1 | 487,774 | 0.17% | 0 | 0 | 0.00% | 1 | 486,988 | 0.17% | 0.00 | 6,317,513 | 21,744,273 | 20.15 | 12.15 |
| Jul-13 | 274,933,635 | 0 | 0 | 0.00% | 0 | 0 | 0.00% | 1 | 486,262 | 0.17% | 0.00 | 1,350,636 | 23,094,909 | 17.60 | 11.37 |
| Aug-13 | 274,248,331 | 0 | 0 | 0.00% | 0 | 0 | 0.00% | 1 | 485,534 | 0.17% | 0.00 | 271,402 | 23,366,311 | 10.76 | 10.29 |
| Sep-13 | 271,872,516 | 0 | 0 | 0.00% | 0 | 0 | 0.00% | 1 | 484,804 | 0.17% | 0.00 | 1,959,620 | 25,325,931 | 5.10 | 10.09 |
| Oct-13 | 271,426,184 | 0 | 0 | 0.00% | 0 | 0 | 0.00% | 0 | 0 | 0.00% | 0.00 | 31,643 | 25,357,574 | 5.64 | 9.85 |
| Nov-13 | 267,310,958 | 0 | 0 | 0.00% | 0 | 0 | 0.00% | 1 | 483,336 | 0.18% | 0.00 | 2,017,828 | 27,375,402 | 8.07 | 9.75 |
| Dec-13 | 266,240,684 | 1 | 620,831 | 0.23% | 0 | 0 | 0.00% | 1 | 482,598 | 0.18% | 0.00 | 657,842 | 28,033,244 | 6.32 | 9.24 |
| Jan-14 | 264,200,362 | 0 | 0 | 0.00% | 0 | 0 | 0.00% | 0 | 0 | 0.00% | 0.00 | 1,627,326 | 29,660,570 | 6.25 | 9.09 |
| C-17 |
SEMT 2013-1
Original Pool Characteristics
| Total Stated Principal Balance | $397,887,279 |
| Number of Mortgage Loans | 511 |
| Average Stated Principal Balance | $778,632 |
| Weighted Average Mortgage Rate | 3.988% |
| Weighted Average Margin (by Securitized Balance) HYB only | 2.181% |
| Weighted Average Remaining Term to Maturity (in Months by Securitized Balance) | 317 |
| Weighted Average FICO (by Securitized Balance) | 769 |
| Weighted Average Loan-to-Value Ratio (by Original Balance) | 66.61% |
Mortgage Rate Range
| 2.51% - 3.00% | 1.16% |
| 3.01% - 3.50% | 9.72% |
| 3.51% - 4.00% | 46.36% |
| 4.01% - 4.50% | 38.97% |
| 4.51% - 5.00% | 3.79% |
Product Type
| Fixed Rate 10YR | 0.99% |
| Fixed Rate 15YR | 19.09% |
| Fixed Rate 20YR | 0.19% |
| Fixed Rate 30YR | 58.69% |
| HYB 5/1 | 3.26% |
| HYB 7/1 | 0.25% |
| HYB 10/1 | 17.52% |
Interest Only Loans
| Yes | 5.03% |
| No | 94.97% |
Geographic Distribution
| CA | 42.90% |
| TX | 13.23% |
| MA | 9.63% |
| FL | 7.29% |
| WA | 3.93% |
| IL | 3.32% |
| CO | 2.88% |
| VA | 1.43% |
| NY | 1.30% |
| CT | 1.20% |
| Other | 12.89% |
Occupancy
| Primary | 94.89% |
| Second Home | 4.45% |
| Investor Property | 0.65% |
Property Type
| Single Family | 69.99% |
| PUD | 25.28% |
| Condominium | 3.62% |
| Cooperative Unit | 0.62% |
| 2-4 Family | 0.49% |
Documentation
| Full Documentation | 100.00% |
| Less than Full | 0.00% |
| C-18 |
| SEMT 2013-1 | Ending Balance $ | 30 Day Delq # | 30 Day Delq Balance $ | 30 Day Delq Balance % | 60 Day Delq # | 60 Day Delq Balance $ | 60 Day Delq Balance % | 90+ Day Delq # | 90+ Day Delq Balance $ | 90+ Day Delq Balance % | Cumulative Loss Amount $ | Prepayment Amount $ | Cumulative Prepayment Amount $ | 3 Month CPR | Cumulative CPR |
| Feb-13 | 378,889,887 | 0 | 0 | 0.00% | 0 | 0 | 0.00% | 0 | 0 | 0.00% | 0.00 | 14,901,058 | 14,901,058 | 43.01 | |
| Mar-13 | 369,972,943 | 3 | 2,673,697 | 0.72% | 0 | 0 | 0.00% | 0 | 0 | 0.00% | 0.00 | 8,121,392 | 23,022,450 | 33.74 | |
| Apr-13 | 358,105,842 | 1 | 989,795 | 0.27% | 0 | 0 | 0.00% | 0 | 0 | 0.00% | 0.00 | 11,085,205 | 34,107,655 | 32.74 | 32.74 |
| May-13 | 346,607,134 | 0 | 0 | 0.00% | 0 | 0 | 0.00% | 0 | 0 | 0.00% | 0.00 | 10,736,170 | 44,843,825 | 28.17 | 32.23 |
| Jun-13 | 340,134,470 | 0 | 0 | 0.00% | 0 | 0 | 0.00% | 0 | 0 | 0.00% | 0.00 | 5,734,705 | 50,578,530 | 26.72 | 29.63 |
| Jul-13 | 333,718,760 | 0 | 0 | 0.00% | 0 | 0 | 0.00% | 0 | 0 | 0.00% | 0.00 | 5,688,621 | 56,267,151 | 22.63 | 27.88 |
| Aug-13 | 325,369,986 | 0 | 0 | 0.00% | 0 | 0 | 0.00% | 0 | 0 | 0.00% | 0.00 | 7,635,696 | 63,902,847 | 20.33 | 27.38 |
| Sep-13 | 321,013,646 | 0 | 0 | 0.00% | 0 | 0 | 0.00% | 0 | 0 | 0.00% | 0.00 | 3,658,094 | 67,560,941 | 18.59 | 25.69 |
| Oct-13 | 320,113,892 | 1 | 636,888 | 0.19% | 0 | 0 | 0.00% | 0 | 0 | 0.00% | 0.00 | 210,593 | 67,771,534 | 13.13 | 23.28 |
| Nov-13 | 317,448,920 | 0 | 0 | 0.00% | 0 | 0 | 0.00% | 0 | 0 | 0.00% | 0.00 | 1,969,649 | 69,741,183 | 7.00 | 21.79 |
| Dec-13 | 314,395,239 | 1 | 886,252 | 0.28% | 0 | 0 | 0.00% | 0 | 0 | 0.00% | 0.00 | 2,358,939 | 72,100,122 | 5.57 | 20.68 |
| Jan-14 | 312,954,975 | 0 | 0 | 0.00% | 0 | 0 | 0.00% | 0 | 0 | 0.00% | 0.00 | 750,133 | 72,850,255 | 6.22 | 19.32 |
| C-19 |
SEMT 2013-2
Original Pool Characteristics
| Total Stated Principal Balance | $666,125,405 |
| Number of Mortgage Loans | 777 |
| Average Stated Principal Balance | $857,304 |
| Weighted Average Mortgage Rate | 3.947% |
| Weighted Average Margin (by Securitized Balance) | NA |
| Weighted Average Remaining Term to Maturity (in Months by Securitized Balance) | 353 |
| Weighted Average FICO (by Securitized Balance) | 776 |
| Weighted Average Loan-to-Value Ratio (by Original Balance) | 63.06% |
Mortgage Rate Range
| 2.51% - 3.00% | 0.09% |
| 3.01% - 3.50% | 4.01% |
| 3.51% - 4.00% | 64.49% |
| 4.01% - 4.50% | 29.53% |
| 4.51% - 5.00% | 1.88% |
Product Type
| Fixed Rate 15YR | 1.56% |
| Fixed Rate 20YR | 0.36% |
| Fixed Rate 25YR | 0.11% |
| Fixed Rate 30YR | 97.97% |
Interest Only Loans
| Yes | 8.30% |
| No | 91.70% |
Geographic Distribution
| CA | 48.84% |
| MA | 16.64% |
| TX | 5.67% |
| WA | 5.42% |
| CO | 2.29% |
| CT | 2.28% |
| IL | 1.87% |
| VA | 1.69% |
| FL | 1.34% |
| MD | 1.06% |
| Other | 12.9% |
Occupancy
| Primary | 92.45% |
| Second Home | 5.23% |
| Investor Property | 2.32% |
Property Type
| Single Family | 69.60% |
| PUD | 16.14% |
| Condominium | 8.28% |
| 2-4 Family | 3.62% |
| Cooperative Unit | 2.07% |
| Townhouse | 0.29% |
Documentation
| Full Documentation | 100.00% |
| Less than Full | 0.0% |
| C-20 |
| SEMT 2013-2 | Ending Balance $ | 30 Day Delq # | 30 Day Delq Balance $ | 30 Day Delq Balance % | 60 Day Delq # | 60 Day Delq Balance $ | 60 Day Delq Balance % | 90+ Day Delq # | 90+ Day Delq Balance $ | 90+ Day Delq Balance % | Cumulative Loss Amount $ | Prepayment Amount $ | Cumulative Prepayment Amount $ | 3 Month CPR | Cumulative CPR |
| Feb-13 | 659,118,591 | 0 | 0 | 0.00% | 0 | 0 | 0.00% | 0 | 0 | 0.00% | 0.00 | 6,066,982 | 6,066,982 | 10.41 | |
| Mar-13 | 652,112,661 | 6 | 4,157,634 | 0.63% | 0 | 0 | 0.00% | 0 | 0 | 0.00% | 0.00 | 6,067,879 | 12,134,860 | 10.47 | |
| Apr-13 | 644,154,412 | 2 | 1,588,481 | 0.24% | 0 | 0 | 0.00% | 0 | 0 | 0.00% | 0.00 | 7,027,654 | 19,162,514 | 11.05 | 11.05 |
| May-13 | 642,287,742 | 0 | 0 | 0.00% | 0 | 0 | 0.00% | 0 | 0 | 0.00% | 0.00 | 941,963 | 20,104,477 | 8.27 | 8.81 |
| Jun-13 | 633,832,690 | 2 | 2,278,925 | 0.35% | 0 | 0 | 0.00% | 0 | 0 | 0.00% | 0.00 | 7,527,524 | 27,632,001 | 9.20 | 9.71 |
| Jul-13 | 623,050,541 | 0 | 0 | 0.00% | 0 | 0 | 0.00% | 0 | 0 | 0.00% | 0.00 | 9,864,459 | 37,496,460 | 10.95 | 11.00 |
| Aug-13 | 617,404,992 | 0 | 0 | 0.00% | 0 | 0 | 0.00% | 0 | 0 | 0.00% | 0.00 | 4,737,888 | 42,234,348 | 13.12 | 10.69 |
| Sep-13 | 614,165,035 | 0 | 0 | 0.00% | 0 | 0 | 0.00% | 0 | 0 | 0.00% | 0.00 | 2,337,626 | 44,571,974 | 10.29 | 9.93 |
| Oct-13 | 613,181,078 | 1 | 652,133 | 0.10% | 0 | 0 | 0.00% | 0 | 0 | 0.00% | 0.00 | 82,484 | 44,654,458 | 4.52 | 8.90 |
| Nov-13 | 606,519,410 | 0 | 0 | 0.00% | 0 | 0 | 0.00% | 0 | 0 | 0.00% | 0.00 | 5,756,971 | 50,411,429 | 5.21 | 9.08 |
| Dec-13 | 601,431,086 | 0 | 0 | 0.00% | 0 | 0 | 0.00% | 0 | 0 | 0.00% | 0.00 | 3,554,978 | 53,966,407 | 6.40 | 8.98 |
| Jan-14 | 599,399,890 | 0 | 0 | 0.00% | 0 | 0 | 0.00% | 0 | 0 | 0.00% | 0.00 | 1,131,520 | 55,097,927 | 7.05 | 8.44 |
| C-21 |
SEMT 2013-3
Original Pool Characteristics
| Total Stated Principal Balance | $600,210,241 |
| Number of Mortgage Loans | 746 |
| Average Stated Principal Balance | $804,571 |
| Weighted Average Mortgage Rate | 3.819% |
| Weighted Average Margin (by Securitized Balance) | NA |
| Weighted Average Remaining Term to Maturity (in Months by Securitized Balance) | 358 |
| Weighted Average FICO (by Securitized Balance) | 772 |
| Weighted Average Loan-to-Value Ratio (by Original Balance) | 65.27% |
Mortgage Rate Range
| 3.01% - 3.50% | 10.70% |
| 3.51% - 4.00% | 78.55% |
| 4.01% - 4.50% | 10.47% |
| 4.51% - 5.00% | 0.28% |
Product Type
| Fixed Rate 20YR | 0.37% |
| Fixed Rate 30YR | 99.63% |
Interest Only Loans
| Yes | 2.36% |
| No | 97.64% |
Geographic Distribution
| CA | 43.15% |
| MA | 10.52% |
| TX | 6.32% |
| WA | 5.02% |
| NY | 4.19% |
| VA | 3.76% |
| CO | 3.74% |
| MD | 3.25% |
| IL | 3.11% |
| CT | 2.74% |
| Other | 14.20% |
Occupancy
| Primary | 95.81% |
| Second Home | 3.72% |
| Investor Property | 0.47% |
Property Type
| Single Family | 72.02% |
| PUD | 22.09% |
| Condominium | 4.50% |
| Cooperative Unit | 0.74% |
| 2-4 Family | 0.64% |
Documentation
| Full Documentation | 100.00% |
| Less than Full | 0.0% |
| C-22 |
| SEMT 2013-3 | Ending Balance $ | 30 Day Delq # | 30 Day Delq Balance $ | 30 Day Delq Balance % | 60 Day Delq # | 60 Day Delq Balance $ | 60 Day Delq Balance % | 90+ Day Delq # | 90+ Day Delq Balance $ | 90+ Day Delq Balance % | Cumulative Loss Amount $ | Prepayment Amount $ | Cumulative Prepayment Amount $ | 3 Month CPR | Cumulative CPR |
| Mar-13 | 598,823,974 | 0 | 0 | 0.00% | 0 | 0 | 0.00% | 0 | 0 | 0.00% | 0.00 | 504,820 | 504,820 | 1.01 | |
| Apr-13 | 596,676,385 | 5 | 3,772,438 | 0.63% | 0 | 0 | 0.00% | 0 | 0 | 0.00% | 0.00 | 1,261,740 | 1,766,560 | 1.76 | |
| May-13 | 593,172,668 | 1 | 497,527 | 0.08% | 0 | 0 | 0.00% | 0 | 0 | 0.00% | 0.00 | 2,616,355 | 4,382,915 | 2.90 | 2.90 |
| Jun-13 | 587,303,182 | 2 | 2,124,533 | 0.36% | 0 | 0 | 0.00% | 0 | 0 | 0.00% | 0.00 | 4,982,521 | 9,365,436 | 5.81 | 4.63 |
| Jul-13 | 583,163,898 | 0 | 0 | 0.00% | 0 | 0 | 0.00% | 0 | 0 | 0.00% | 0.00 | 3,255,702 | 12,621,138 | 7.10 | 5.01 |
| Aug-13 | 580,119,463 | 0 | 0 | 0.00% | 0 | 0 | 0.00% | 0 | 0 | 0.00% | 0.00 | 2,162,501 | 14,783,639 | 6.85 | 4.90 |
| Sep-13 | 575,448,167 | 0 | 0 | 0.00% | 0 | 0 | 0.00% | 0 | 0 | 0.00% | 0.00 | 3,789,265 | 18,572,904 | 6.14 | 5.29 |
| Oct-13 | 571,029,034 | 0 | 0 | 0.00% | 0 | 0 | 0.00% | 0 | 0 | 0.00% | 0.00 | 3,539,831 | 22,112,735 | 6.38 | 5.53 |
| Nov-13 | 568,016,035 | 1 | 712,900 | 0.12% | 0 | 0 | 0.00% | 0 | 0 | 0.00% | 0.00 | 2,133,878 | 24,246,613 | 6.39 | 5.40 |
| Dec-13 | 564,384,775 | 2 | 1,530,895 | 0.27% | 0 | 0 | 0.00% | 0 | 0 | 0.00% | 0.00 | 1,498,739 | 25,745,352 | 5.75 | 5.43 |
| Jan-14 | 562,280,376 | 1 | 710,715 | 0.12% | 1 | 819,086 | 0.14% | 0 | 0 | 0.00% | 0.00 | 1,227,140 | 26,972,492 | 4.23 | 5.18 |
| C-23 |
SEMT 2013-4
Original Pool Characteristics
| Total Stated Principal Balance | $576,435,465 |
| Number of Mortgage Loans | 716 |
| Average Stated Principal Balance | $805,077 |
| Weighted Average Mortgage Rate | 3.783% |
| Weighted Average Margin (by Securitized Balance) | NA |
| Weighted Average Remaining Term to Maturity (in Months by Securitized Balance) | 357 |
| Weighted Average FICO (by Securitized Balance) | 773 |
| Weighted Average Loan-to-Value Ratio (by Original Balance) | 63.77% |
Mortgage Rate Range
| 3.01% - 3.50% | 11.63% |
| 3.51% - 4.00% | 81.04% |
| 4.01% - 4.50% | 7.33% |
Product Type
| Fixed Rate 20YR | 1.28% |
| Fixed Rate 25YR | 0.14% |
| Fixed Rate 30YR | 98.58% |
Interest Only Loans
| Yes | 2.21% |
| No | 97.79% |
Geographic Distribution
| CA | 42.13% |
| MA | 9.74% |
| WA | 7.19% |
| TX | 5.54% |
| NY | 5.32% |
| IL | 4.46% |
| VA | 3.59% |
| CO | 3.41% |
| MD | 2.73% |
| CT | 2.55% |
| Other | 13.34% |
Occupancy
| Primary | 98.00% |
| Second Home | 2.92% |
| Investor Property | 1.09% |
Property Type
| Single Family | 71.06% |
| PUD | 22.35% |
| Condominium | 4.49% |
| Cooperative Unit | 1.21% |
| 2-4 Family | 0.72% |
| Townhouse | 0.18% |
Documentation
| Full Documentation | 100.00% |
| Less than Full | 0.0% |
| C-24 |
| SEMT 2013-4 | Ending Balance $ | 30 Day Delq # | 30 Day Delq Balance $ | 30 Day Delq Balance % | 60 Day Delq # | 60 Day Delq Balance $ | 60 Day Delq Balance % | 90+ Day Delq # | 90+ Day Delq Balance $ | 90+ Day Delq Balance % | Cumulative Loss Amount $ | Prepayment Amount $ | Cumulative Prepayment Amount $ | 3 Month CPR | Cumulative CPR |
| Apr-13 | 575,244,709 | 0 | 0 | 0.00% | 0 | 0 | 0.00% | 0 | 0 | 0.00% | 0.00 | 330,605 | 330,605 | 0.69 | |
| May-13 | 574,017,847 | 3 | 2,559,731 | 0.44% | 0 | 0 | 0.00% | 0 | 0 | 0.00% | 0.00 | 362,996 | 693,601 | 0.72 | |
| Jun-13 | 572,858,722 | 2 | 1,608,994 | 0.28% | 0 | 0 | 0.00% | 0 | 0 | 0.00% | 0.00 | 291,375 | 984,975 | 0.69 | 0.69 |
| Jul-13 | 569,817,098 | 2 | 1,518,088 | 0.26% | 0 | 0 | 0.00% | 0 | 0 | 0.00% | 0.00 | 2,170,174 | 3,155,149 | 1.96 | 1.65 |
| Aug-13 | 565,337,910 | 3 | 2,549,230 | 0.45% | 0 | 0 | 0.00% | 0 | 0 | 0.00% | 0.00 | 3,606,682 | 6,761,831 | 4.18 | 2.82 |
| Sep-13 | 561,851,967 | 0 | 0 | 0.00% | 0 | 0 | 0.00% | 0 | 0 | 0.00% | 0.00 | 2,614,535 | 9,376,366 | 5.75 | 3.26 |
| Oct-13 | 559,303,396 | 1 | 791,670 | 0.14% | 0 | 0 | 0.00% | 0 | 0 | 0.00% | 0.00 | 1,678,195 | 11,054,561 | 5.45 | 3.30 |
| Nov-13 | 558,342,176 | 1 | 900,524 | 0.16% | 0 | 0 | 0.00% | 0 | 0 | 0.00% | 0.00 | 89,587 | 11,144,148 | 3.07 | 2.92 |
| Dec-13 | 556,598,345 | 2 | 1,918,586 | 0.34% | 0 | 0 | 0.00% | 0 | 0 | 0.00% | 0.00 | 869,173 | 12,013,321 | 1.87 | 2.80 |
| Jan-14 | 553,808,539 | 2 | 1,763,017 | 0.31% | 0 | 0 | 0.00% | 0 | 0 | 0.00% | 0.00 | 1,913,434 | 13,926,755 | 2.05 | 2.93 |
| C-25 |
SEMT 2013-5
Original Pool Characteristics
| Total Stated Principal Balance | $463,344,441 |
| Number of Mortgage Loans | 609 |
| Average Stated Principal Balance | $760,828 |
| Weighted Average Mortgage Rate | 3.811% |
| Weighted Average Remaining Term to Maturity (in Months by Securitized Balance) | 359 |
| Weighted Average FICO (by Securitized Balance) | 772 |
| Weighted Average Loan-to-Value Ratio (by Original Balance) | 64.85% |
Mortgage Rate Range
| 3.01% - 3.50% | 7.69% |
| 3.51% - 4.00% | 84.74% |
| 4.01% - 4.50% | 7.41% |
| 4.51% - 5.00% | 0.15% |
Product Type
| Fixed Rate 30YR | 100.00% |
Interest Only Loans
| Yes | 0.00% |
| No | 100.00% |
Geographic Distribution
| CA | 37.55% |
| WA | 7.80% |
| MA | 7.61% |
| TX | 7.10% |
| IL | 5.05% |
| VA | 5.01% |
| MD | 3.94% |
| CO | 3.64% |
| NY | 3.18% |
| AZ | 3.11% |
| Other | 16.01% |
Occupancy
| Primary | 96.09% |
| Second Home | 3.74% |
| Investor Property | 0.17% |
Property Type
| Single Family | 69.79% |
| PUD | 25.03% |
| Condominium | 3.91% |
| 2-4 Family | 0.74% |
| Cooperative Unit | 0.54% |
Documentation
| Full Documentation | 100.00% |
| Less than Full | 0.00% |
| C-26 |
| SEMT 2013-5 | Ending Balance $ | 30 Day Delq # | 30 Day Delq Balance $ | 30 Day Delq Balance % | 60 Day Delq # | 60 Day Delq Balance $ | 60 Day Delq Balance % | 90+ Day Delq # | 90+ Day Delq Balance $ | 90+ Day Delq Balance % | Cumulative Loss Amount $ | Prepayment Amount $ | Cumulative Prepayment Amount $ | 3 Month CPR | Cumulative CPR |
| May-13 | 462,054,503 | 0 | 0 | 0.00% | 0 | 0 | 0.00% | 0 | 0 | 0.00% | 0.00 | 595,087 | 595,087 | 0.33 | |
| Jun-13 | 460,663,246 | 2 | 2,864,896 | 0.62% | 0 | 0 | 0.00% | 0 | 0 | 0.00% | 0.00 | 694,495 | 1,289,582 | 1.28 | |
| Jul-13 | 459,121,679 | 4 | 2,973,887 | 0.64% | 0 | 0 | 0.00% | 0 | 0 | 0.00% | 0.00 | 843,265 | 2,132,846 | 1.46 | 1.46 |
| Aug-13 | 455,491,950 | 1 | 894,227 | 0.19% | 0 | 0 | 0.00% | 0 | 0 | 0.00% | 0.00 | 2,929,762 | 5,062,608 | 2.26 | 1.78 |
| Sep-13 | 454,005,471 | 2 | 1,268,165 | 0.27% | 0 | 0 | 0.00% | 0 | 0 | 0.00% | 0.00 | 788,479 | 5,851,087 | 1.65 | 1.51 |
| Oct-13 | 453,258,077 | 0 | 0 | 0.00% | 0 | 0 | 0.00% | 0 | 0 | 0.00% | 0.00 | 47,999 | 5,899,086 | 1.78 | 1.62 |
| Nov-13 | 450,635,179 | 0 | 0 | 0.00% | 0 | 0 | 0.00% | 0 | 0 | 0.00% | 0.00 | 1,921,138 | 7,820,224 | 0.95 | 1.43 |
| Dec-13 | 448,889,930 | 1 | 718,044 | 0.15% | 0 | 0 | 0.00% | 0 | 0 | 0.00% | 0.00 | 1,042,178 | 8,862,402 | 2.86 | 2.02 |
| Jan-14 | 448,134,835 | 1 | 641,270 | 0.14% | 0 | 0 | 0.00% | 0 | 0 | 0.00% | 0.00 | 51,023 | 8,913,425 | 4.34 | 2.54 |
| C-27 |
SEMT 2013-6
Original Pool Characteristics
| Total Stated Principal Balance | $424,966,578 |
| Number of Mortgage Loans | 545 |
| Average Stated Principal Balance | $779,755 |
| Weighted Average Mortgage Rate | 3.812% |
| Weighted Average Remaining Term to Maturity (in Months by Securitized Balance) | 359 |
| Weighted Average FICO (by Securitized Balance) | 771 |
| Weighted Average Loan-to-Value Ratio (by Original Balance) | 64.62% |
Mortgage Rate Range
| 3.01% - 3.50% | 7.98% |
| 3.51% - 4.00% | 84.80% |
| 4.01% - 4.50% | 7.01% |
| 4.51% - 5.00% | 0.20% |
Product Type
| Fixed Rate 25YR | 0.15% |
| Fixed Rate 30YR | 99.85% |
Interest Only Loans
| Yes | 0.00% |
| No | 100.00% |
Geographic Distribution
| CA | 37.10% |
| MA | 10.16% |
| TX | 6.81% |
| WA | 6.22% |
| VA | 5.30% |
| MD | 4.31% |
| IL | 4.19% |
| NY | 4.17% |
| AZ | 2.56% |
| CT | 2.40% |
| Other | 16.78% |
Occupancy
| Primary | 96.82% |
| Second Home | 3.18% |
Property Type
| Single Family | 69.18% |
| PUD | 25.06% |
| Condominium | 4.00% |
| Cooperative Unit | 1.61% |
| 2-4 Family | 0.15% |
Documentation
| Full Documentation | 100.00% |
| Less than Full | 0.00% |
| C-28 |
| SEMT 2013-6 | Ending Balance $ | 30 Day Delq # | 30 Day Delq Balance $ | 30 Day Delq Balance % | 60 Day Delq # | 60 Day Delq Balance $ | 60 Day Delq Balance % | 90+ Day Delq # | 90+ Day Delq Balance $ | 90+ Day Delq Balance % | Cumulative Loss Amount $ | Prepayment Amount $ | Cumulative Prepayment Amount $ | 3 Month CPR | Cumulative CPR |
| May-13 | 424,213,088 | 0 | 0 | 0.00% | 0 | 0 | 0.00% | 0 | 0 | 0.00% | 0.00 | 118,504 | 118,504 | 0.33 | |
| Jun-13 | 422,782,365 | 2 | 1,601,000 | 0.37% | 0 | 0 | 0.00% | 0 | 0 | 0.00% | 0.00 | 793,351 | 911,855 | 1.28 | |
| Jul-13 | 421,501,363 | 0 | 0 | 0.00% | 0 | 0 | 0.00% | 0 | 0 | 0.00% | 0.00 | 642,343 | 1,554,198 | 1.46 | 1.46 |
| Aug-13 | 419,886,976 | 1 | 1,076,742 | 0.25% | 0 | 0 | 0.00% | 0 | 0 | 0.00% | 0.00 | 973,835 | 2,528,033 | 2.26 | 1.78 |
| Sep-13 | 419,112,621 | 0 | 0 | 0.00% | 0 | 0 | 0.00% | 0 | 0 | 0.00% | 0.00 | 132,880 | 2,660,913 | 1.65 | 1.51 |
| Oct-13 | 417,694,827 | 1 | 1,333,059 | 0.31% | 0 | 0 | 0.00% | 0 | 0 | 0.00% | 0.00 | 773,868 | 3,434,781 | 1.78 | 1.62 |
| Nov-13 | 416,448,546 | 1 | 1,446,951 | 0.34% | 0 | 0 | 0.00% | 0 | 0 | 0.00% | 0.00 | 87,806 | 3,522,587 | 0.95 | 1.43 |
| Dec-13 | 414,155,571 | 1 | 873,603 | 0.21% | 0 | 0 | 0.00% | 0 | 0 | 0.00% | 0.00 | 2,156,899 | 5,679,486 | 2.86 | 2.02 |
| Jan-14 | 411,163,874 | 1 | 982,905 | 0.23% | 0 | 0 | 0.00% | 0 | 0 | 0.00% | 0.00 | 2,345,139 | 8,024,625 | 4.34 | 2.54 |
| C-29 |
SEMT 2013-7
Original Pool Characteristics
| Total Stated Principal Balance | $453,588,656 |
| Number of Mortgage Loans | 595 |
| Average Stated Principal Balance | $762,334 |
| Weighted Average Mortgage Rate | 3.834% |
| Weighted Average Remaining Term to Maturity (in Months by Securitized Balance) | 358 |
| Weighted Average FICO (by Securitized Balance) | 770 |
| Weighted Average Loan-to-Value Ratio (by Original Balance) | 66.03% |
Mortgage Rate Range
| 3.01% - 3.50% | 7.44% |
| 3.51% - 4.00% | 84.88% |
| 4.01% - 4.50% | 7.48% |
| 4.51% - 5.00% | 0.20% |
Product Type
| Fixed Rate 20YR | 1.22% |
| Fixed Rate 30YR | 98.78% |
Interest Only Loans
| Yes | 0.81% |
| No | 99.19% |
Geographic Distribution
| CA | 41.81% |
| TX | 9.80% |
| MA | 5.47% |
| IL | 5.09% |
| VA | 5.05% |
| WA | 4.75% |
| CO | 3.40% |
| NY | 2.84% |
| FL | 2.54% |
| AZ | 1.88% |
| Other | 17.37% |
Occupancy
| Primary | 96.24% |
| Second Home | 3.56% |
| Investor Property | 0.20% |
Property Type
| Single Family | 70.37% |
| PUD | 25.28% |
| Condominium | 2.17% |
| 2-4 Family | 1.56% |
| Cooperative Unit | 0.47% |
| Townhouse | 0.15% |
Documentation
| Full Documentation | 100.00% |
| Less than Full | 0.00% |
| C-30 |
| SEMT 2013-7 | Ending Balance $ | 30 Day Delq # | 30 Day Delq Balance $ | 30 Day Delq Balance % | 60 Day Delq # | 60 Day Delq Balance $ | 60 Day Delq Balance % | 90+ Day Delq # | 90+ Day Delq Balance $ | 90+ Day Delq Balance % | Cumulative Loss Amount $ | Prepayment Amount $ | Cumulative Prepayment Amount $ | 3 Month CPR | Cumulative CPR |
| Jun-13 | 452,666,944 | 0 | 0 | 0.00% | 0 | 0 | 0.00% | 0 | 0 | 0.00% | 0.00 | 243,223 | 243,223 | 0.64 | |
| Jul-13 | 450,592,803 | 4 | 2,568,194 | 0.56% | 0 | 0 | 0.00% | 0 | 0 | 0.00% | 0.00 | 1,392,761 | 1,635,984 | 2.15 | |
| Aug-13 | 448,403,496 | 0 | 0 | 0.00% | 0 | 0 | 0.00% | 0 | 0 | 0.00% | 0.00 | 1,507,303 | 3,143,287 | 2.76 | 2.76 |
| Sep-13 | 446,916,603 | 1 | 587,013 | 0.13% | 0 | 0 | 0.00% | 0 | 0 | 0.00% | 0.00 | 803,063 | 3,946,350 | 3.24 | 2.60 |
| Oct-13 | 445,206,469 | 1 | 652,048 | 0.14% | 0 | 0 | 0.00% | 0 | 0 | 0.00% | 0.00 | 1,024,944 | 4,971,294 | 2.94 | 2.63 |
| Nov-13 | 444,453,919 | 0 | 0 | 0.00% | 0 | 0 | 0.00% | 0 | 0 | 0.00% | 0.00 | 66,497 | 5,037,791 | 1.68 | 2.23 |
| Dec-13 | 442,840,289 | 2 | 1,024,786 | 0.23% | 0 | 0 | 0.00% | 0 | 0 | 0.00% | 0.00 | 925,182 | 5,962,973 | 1.80 | 2.26 |
| Jan-14 | 441,424,013 | 0 | 0 | 0.00% | 0 | 0 | 0.00% | 0 | 0 | 0.00% | 0.00 | 726,178 | 6,689,151 | 1.54 | 2.23 |
| C-31 |
SEMT 2013-8
Original Pool Characteristics
| Total Stated Principal Balance | $460,158,464 |
| Number of Mortgage Loans | 603 |
| Average Stated Principal Balance | $763,115 |
| Weighted Average Mortgage Rate | 3.835% |
| Weighted Average Remaining Term to Maturity (in Months by Securitized Balance) | 357 |
| Weighted Average FICO (by Securitized Balance) | 771 |
| Weighted Average Loan-to-Value Ratio (by Original Balance) | 66.86% |
Mortgage Rate Range
| 2.51% - 3.00% | 0.36% |
| 3.01% - 3.50% | 7.42% |
| 3.51% - 4.00% | 83.86% |
| 4.01% - 4.50% | 8.37% |
Product Type
| Fixed Rate 15YR | 0.67% |
| Fixed Rate 20YR | 0.61% |
| Fixed Rate 25YR | 0.14% |
| Fixed Rate 30YR | 98.59% |
Interest Only Loans
| Yes | 0.00% |
| No | 100.00% |
Geographic Distribution
| CA | 41.69% |
| TX | 7.34% |
| MA | 7.04% |
| VA | 5.92% |
| WA | 4.83% |
| MD | 4.78% |
| IL | 4.38% |
| CO | 3.77% |
| GA | 3.08% |
| AZ | 2.40% |
| Other | 14.77% |
Occupancy
| Primary | 96.80% |
| Second Home | 3.10% |
| Investor Property | 0.10% |
Property Type
| Single Family | 66.63% |
| PUD | 27.72% |
| Condominium | 4.19% |
| Cooperative Unit | 0.54% |
| 2-4 Family | 0.68% |
| Townhouse | 0.23% |
Documentation
| Full Documentation | 100.00% |
| Less than Full | 0.00% |
| C-32 |
| SEMT 2013-8 | Ending Balance $ | 30 Day Delq # | 30 Day Delq Balance $ | 30 Day Delq Balance % | 60 Day Delq # | 60 Day Delq Balance $ | 60 Day Delq Balance % | 90+ Day Delq # | 90+ Day Delq Balance $ | 90+ Day Delq Balance % | Cumulative Loss Amount $ | Prepayment Amount $ | Cumulative Prepayment Amount $ | 3 Month CPR | Cumulative CPR |
| Jul-13 | 458,687,958 | 0 | 0 | 0.00% | 0 | 0 | 0.00% | 0 | 0 | 0.00% | 0.00 | 767,795 | 767,795 | 1.99 | |
| Aug-13 | 456,457,508 | 5 | 4,093,090 | 0.89% | 0 | 0 | 0.00% | 0 | 0 | 0.00% | 0.00 | 1,528,384 | 2,296,179 | 2.98 | |
| Sep-13 | 453,096,205 | 0 | 0 | 0.00% | 1 | 664,084 | 0.14% | 0 | 0 | 0.00% | 0.00 | 2,657,509 | 4,953,688 | 4.27 | 4.27 |
| Oct-13 | 451,707,984 | 5 | 4,620,070 | 1.02% | 0 | 0 | 0.00% | 1 | 664,084 | 0.14% | 0.00 | 685,128 | 5,638,816 | 4.20 | 3.66 |
| Nov-13 | 449,798,327 | 0 | 0 | 0.00% | 0 | 0 | 0.00% | 0 | 0 | 0.00% | 0.00 | 545,455 | 6,184,271 | 3.94 | 3.56 |
| Dec-13 | 445,644,235 | 1 | 714,544 | 0.16% | 0 | 0 | 0.00% | 0 | 0 | 0.00% | 0.00 | 3,448,195 | 9,632,466 | 4.65 | 4.47 |
| Jan-14 | 443,102,261 | 3 | 2,313,563 | 0.52% | 0 | 0 | 0.00% | 0 | 0 | 0.00% | 0.00 | 1,838,616 | 11,471,082 | 5.65 | 4.52 |
| C-33 |
SEMT 2013-9
Original Pool Characteristics
| Total Stated Principal Balance | $462,610,260 |
| Number of Mortgage Loans | 606 |
| Average Stated Principal Balance | $765,033 |
| Weighted Average Mortgage Rate | 3.881% |
| Weighted Average Remaining Term to Maturity (in Months by Securitized Balance) | 359 |
| Weighted Average FICO (by Securitized Balance) | 771 |
| Weighted Average Loan-to-Value Ratio (by Original Balance) | 67.58% |
Mortgage Rate Range
| 3.01% - 3.50% | 5.15% |
| 3.51% - 4.00% | 78.78% |
| 4.01% - 4.50% | 15.66% |
| 4.51% - 5.00% | 0.41% |
Product Type
| Fixed Rate 30YR | 100.00% |
Interest Only Loans
| Yes | 0.00% |
| No | 100.00% |
Geographic Distribution
| CA | 40.84% |
| TX | 7.58% |
| MA | 6.34% |
| VA | 5.72% |
| IL | 5.39% |
| CO | 4.35% |
| WA | 4.12% |
| MD | 3.89% |
| GA | 3.20% |
| FL | 2.39% |
| Other | 16.18% |
Occupancy
| Primary | 94.84% |
| Second Home | 5.16% |
| Investor Property | NA |
Property Type
| Single Family | 66.32% |
| PUD | 27.86% |
| Condominium | 4.44% |
| Cooperative Unit | 1.00% |
| 2-4 Family | 0.37% |
Documentation
| Full Documentation | 100.00% |
| Less than Full | 0.00% |
| C-34 |
| SEMT 2013-9 | Ending Balance $ | 30 Day Delq # | 30 Day Delq Balance $ | 30 Day Delq Balance % | 60 Day Delq # | 60 Day Delq Balance $ | 60 Day Delq Balance % | 90+ Day Delq # | 90+ Day Delq Balance $ | 90+ Day Delq Balance % | Cumulative Loss Amount $ | Prepayment Amount $ | Cumulative Prepayment Amount $ | 3 Month CPR | Cumulative CPR |
| Jul-13 | 462,835,561 | 0 | 0 | 0.00% | 0 | 0 | 0.00% | 0 | 0 | 0.00% | 0.00 | 83,304 | 83,304 | 0.22 | |
| Aug-13 | 461,971,869 | 1 | 1,106,250 | 0.23% | 0 | 0 | 0.00% | 0 | 0 | 0.00% | 0.00 | 173,213 | 173,213 | 0.34 | |
| Sep-13 | 460,638,856 | 1 | 997,114 | 0.21% | 0 | 0 | 0.00% | 0 | 0 | 0.00% | 0.00 | 637,967 | 637,967 | 0.78 | 0.78 |
| Oct-13 | 459,181,835 | 0 | 0 | 0.00% | 0 | 0 | 0.00% | 0 | 0 | 0.00% | 0.00 | 759,348 | 759,348 | 1.36 | 1.08 |
| Nov-13 | 456,469,215 | 1 | 498,797 | 0.10% | 0 | 0 | 0.00% | 0 | 0 | 0.00% | 0.00 | 2,013,298 | 3,667,130 | 2.94 | 1.91 |
| Dec-13 | 453,833,401 | 1 | 476,670 | 0.10% | 0 | 0 | 0.00% | 0 | 0 | 0.00% | 0.00 | 1,936,971 | 5,604,101 | 4.04 | 2.43 |
| Jan-14 | 452,867,207 | 0 | 0 | 0.00% | 0 | 0 | 0.00% | 0 | 0 | 0.00% | 0.00 | 270,014 | 5,874,115 | 3.63 | 2.19 |
| C-35 |
SEMT 2013-10
Original Pool Characteristics
| Total Stated Principal Balance | $400,671,564.40 |
| Number of Mortgage Loans | 529 |
| Average Stated Principal Balance | $757,413.17 |
| Weighted Average Mortgage Rate | 3.872% |
| Weighted Average Remaining Term to Maturity (in Months by Securitized Balance) | 359 |
| Weighted Average FICO (by Securitized Balance) | 774 |
| Weighted Average Loan-to-Value Ratio (by Original Balance) | 67.17% |
Mortgage Rate Range
| 3.01% - 3.250% | 0.84% |
| 3.251% - 3.500% | 5.18% |
| 3.501% - 3.750% | 28.80% |
| 3.751% - 4.000% | 51.38% |
| 4.001% - 4.250% | 10.78% |
| 4.251% - 4.500% | 3.02% |
Product Type
| Fixed Rate 30YR | 99.62% |
| Fixed Rate 20YR | 0.38% |
Interest Only Loans
| Yes | 0.00% |
| No | 100.00% |
Geographic Distribution
| CA | 40.93% |
| TX | 9.44% |
| VA | 6.66% |
| WA | 6.48% |
| NY | 5.43% |
| MD | 3.71% |
| GA | 3.69% |
| MA | 3.45% |
| CO | 2.99% |
| FL | 2.56% |
| Other | 14.66% |
Occupancy
| Primary | 95.20% |
| Second Home | 4.80% |
Property Type
| Single Family | 65.70% |
| PUD | 28.70% |
| Condominium | 2.51% |
| Cooperative Unit | 0.90% |
| 2-4 Family | 0.45% |
Documentation
| Full Documentation | 100.00% |
| Less than Full | 0.00% |
| C-36 |
| SEMT 2013-10 | Ending Balance $ | 30 Day Delq # | 30 Day Delq Balance $ | 30 Day Delq Balance % | 60 Day Delq # | 60 Day Delq Balance $ | 60 Day Delq Balance % | 90+ Day Delq # | 90+ Day Delq Balance $ | 90+ Day Delq Balance % | Cumulative Loss Amount $ | Prepayment Amount $ | Cumulative Prepayment Amount $ | 3 Month CPR | Cumulative CPR |
| Aug-13 | 399,317,378 | 0 | 0 | 0.00% | 0 | 0 | 0.00% | 0 | 0 | 0.00% | 0.00 | 757,314 | 757,314 | 2.25 | |
| Sep-13 | 395,749,239 | 2 | 1,624,818 | 0.41% | 1 | 693,712 | 0.17% | 0 | 0 | 0.00% | 0.00 | 2,970,221 | 3,727,535 | 5.47 | |
| Oct-13 | 394,952,414 | 0 | 0 | 0.00% | 0 | 0 | 0.00% | 0 | 0 | 0.00% | 0.00 | 198,889 | 3,926,424 | 3.88 | 3.88 |
| Nov-13 | 392,625,680 | 1 | 991,680 | 0.25% | 0 | 0 | 0.00% | 1 | 518,163 | 0.13% | 0.00 | 1,723,543 | 5,649,967 | 4.83 | 4.19 |
| Dec-13 | 390,361,600 | 1 | 695,855 | 0.17% | 0 | 0 | 0.00% | 0 | 0 | 0.00% | 0.00 | 1,661,309 | 7,311,276 | 3.60 | 4.35 |
| Jan-14 | 388,751,545 | 2 | 1,457,226 | 0.37% | 0 | 0 | 0.00% | 0 | 0 | 0.00% | 0.00 | 1,007,507 | 8,318,783 | 4.40 | 4.14 |
| C-37 |
SEMT 2013-11
Original Pool Characteristics
| Total Stated Principal Balance | $346,322,235.83 |
| Number of Mortgage Loans | 453 |
| Average Stated Principal Balance | $764,508.25 |
| Weighted Average Mortgage Rate | 4.01% |
| Weighted Average Remaining Term to Maturity (in Months by Securitized Balance) | 357 |
| Weighted Average FICO (by Securitized Balance) | 773 |
| Weighted Average Loan-to-Value Ratio (by Original Balance) | 70.02% |
Mortgage Rate Range
| 3.01% - 3.50% | 0.15% |
| 3.51% - 4.00% | 69.43% |
| 4.01% - 4.50% | 26.99% |
| 4.51% - 5.00% | 2.69% |
| 5.01% - 5.50% | 0.74% |
Product Type
| Fixed Rate 30YR | 99.85% |
| Fixed Rate 20YR | 0.15% |
Interest Only Loans
| Yes | 0.00% |
| No | 100.00% |
Geographic Distribution
| CA | 46.87% |
| IL | 7.56% |
| MA | 7.05% |
| VA | 5.01% |
| CO | 4.34% |
| TX | 3.00% |
| MD | 3.00% |
| GA | 2.98% |
| NY | 2.93% |
| WA | 2.59% |
| Other | 14.66% |
Occupancy
| Primary | 96.11% |
| Second Home | 3.89% |
Property Type
| Single Family Det | 66.29% |
| Single Family Att | 1.14% |
| PUD | 26.33% |
| Condominium | 3.72% |
| Cooperative Unit | 0.41% |
| 2-4 Family | 2.11% |
Documentation
| Full Documentation | 100.00% |
| Less than Full | 0.00% |
| C-38 |
| SEMT 2013-11 | Ending Balance $ | 30 Day Delq # | 30 Day Delq Balance $ | 30 Day Delq Balance % | 60 Day Delq # | 60 Day Delq Balance $ | 60 Day Delq Balance % | 90+ Day Delq # | 90+ Day Delq Balance $ | 90+ Day Delq Balance % | Cumulative Loss Amount $ | Prepayment Amount $ | Cumulative Prepayment Amount $ | 3 Month CPR | Cumulative CPR |
| Sep-13 | 345,785,449 | 0 | 0 | 0.00% | 0 | 0 | 0.00% | 0 | 0 | 0.00% | 0.00 | 33,602 | 33,602 | 0.12 | |
| Oct-13 | 344,841,067 | 0 | 0 | 0.00% | 0 | 0 | 0.00% | 0 | 0 | 0.00% | 0.00 | 438,188 | 438,188 | 0.82 | |
| Nov-13 | 343,148,879 | 1 | 518,467 | 0.15% | 0 | 0 | 0.00% | 0 | 0 | 0.00% | 0.00 | 1,184,143 | 1,655,933 | 1.91 | 1.91 |
| Dec-13 | 340,366,343 | 4 | 2,804,476 | 0.82% | 0 | 0 | 0.00% | 0 | 0 | 0.00% | 0.00 | 2,272,928 | 3,928,861 | 4.45 | 3.39 |
| Jan-14 | 338,417,822 | 2 | 1,818,279 | 0.53% | 0 | 0 | 0.00% | 0 | 0 | 0.00% | 0.00 | 1,439,426 | 5,368,287 | 5.58 | 3.71 |
| C-39 |
SEMT 2013-12
Original Pool Characteristics
| Total Stated Principal Balance | $324,984,227 |
| Number of Mortgage Loans | 410 |
| Average Stated Principal Balance | $792,644 |
| Weighted Average Mortgage Rate | 4.686% |
| Weighted Average Remaining Term to Maturity (in Months by Securitized Balance) | 358 |
| Weighted Average FICO (by Securitized Balance) | 766 |
| Weighted Average Loan-to-Value Ratio (by Original Balance) | 69.83% |
Mortgage Rate Range
| 3.501% - 3.750% | 4.02% |
| 3.751% - 4.000% | 8.69% |
| 4.001% - 4.250% | 9.09% |
| 4.251% - 4.500% | 15.06% |
| 4.501% - 4.750% | 18.65% |
| 4.751% - 5.000% | 21.76% |
| 5.001% - 5.250% | 13.93% |
| 5.251% - 5.500% | 6.17% |
| 5.501% - 5.750% | 2.05% |
| 5.751% - 6.000% | 0.59% |
Product Type
| Fixed Rate 30YR | 100.00% |
Interest Only Loans
| Yes | 1.75% |
| No | 98.25% |
Geographic Distribution
| CA | 39.96% |
| TX | 7.75% |
| NY | 7.11% |
| MA | 4.61% |
| WA | 4.56% |
| VA | 4.24% |
| CO | 3.37% |
| AZ | 2.85% |
| MD | 2.41% |
| FL | 2.07% |
| Other | 21.07% |
Occupancy
| Primary | 91.76% |
| Second Home | 6.14% |
| Investment Property | 2.10% |
Property Type
| Single Family Det | 61.44% |
| Single Family Att | 1.03% |
| PUD | 25.02% |
| Condominium | 8.21% |
| Cooperative Unit | 1.76% |
| 2-4 Family | 2.53% |
Documentation
| Full Documentation | 100.00% |
| Less than Full | 0.00% |
| C-40 |
| SEMT 2013-12 | Ending Balance $ | 30 Day Delq # | 30 Day Delq Balance $ | 30 Day Delq Balance % | 60 Day Delq # | 60 Day Delq Balance $ | 60 Day Delq Balance % | 90+ Day Delq # | 90+ Day Delq Balance $ | 90+ Day Delq Balance % | Cumulative Loss Amount $ | Prepayment Amount $ | Cumulative Prepayment Amount $ | 3 Month CPR | Cumulative CPR |
| Dec-13 | 321,988,340 | 0 | 0 | 0.00% | 0 | 0 | 0.00% | 0 | 0 | 0.00% | 0.00 | 2,579,300 | 2,579,300 | 9.14 | |
| Jan-14 | 317,860,871 | 2 | 1,682,789 | 0.52% | 0 | 0 | 0.00% | 0 | 0 | 0.00% | 0.00 | 3,711,181 | 6,290,481 | 11.10 |
| C-41 |
ANNEX D – FIRST REPUBLIC BANK STATIC POOL INFORMATION
The following tables set forth static pool information for mortgage loans similar to the mortgage loans of the issuing entity originated by First Republic Bank for the vintage origination years indicated. Similar mortgage loans that were originated and paid in full during the same vintage year are not included. Quarterly performance data is based on the specified pool of mortgage loans originated in each vintage year as constituted on the last business day of such vintage year. Accordingly delinquencies and prepayments that may have occurred during the year of origination are not shown.
All data should be reviewed in light of the following notes:
Calculations:
3 month CPR = 1-(1-(current balance from two periods prior -Current period’s current balance)/(current balance from two periods prior))^(4)
LTD CPR = 1-(1-(current balance from first period -Current period’s current balance)/(current balance from first period))^(12/total # of periods)
Amounts specified under the heading “Prepayment ($)” include only the amount of prepayments received in the last month of the specified quarter, while amounts included under the heading “LTD Prepayment ($)” include all payments of principal received to date, including scheduled amortization and partial and full prepayments of principal.
See also “Static Pool Information”in the prospectus supplement for a description of how the static pool information is calculated.
| D-1 |
2008 Vintage Originations
Original Vintage Characteristics
| Total Stated Principal Balance | $ 115,132,408.79 |
| Number of Mortgage Loans | 276 |
| Average Stated Principal Balance | $417,146.41 |
| Weighted Average Mortgage Rate | 5.86 % |
| Weight Average Margin (Hybrids only) | 0 |
| Weighted Average Remaining Term to Maturity | 355 |
| Weight Average Credit Score | 773 |
| Weighted Average Loan-to-Value Ratio | 58.13% |
Mortgage Rate Range (%)
| Number of Loans | Ending Balance ($) | |
| 0.000 - 0.249 | 20 | 3,113,409.35 |
| 4.250 - 4.499 | 1 | 415,000.00 |
| 4.500 - 4.749 | 5 | 2,193,000.00 |
| 4.750 - 4.999 | 6 | 3,671,750.00 |
| 5.000 - 5.249 | 12 | 3,455,358.90 |
| 5.250 - 5.499 | 35 | 17,023,740.95 |
| 5.500 - 5.749 | 36 | 14,519,770.97 |
| 5.750 - 5.999 | 62 | 25,237,958.32 |
| 6.000 - 6.249 | 51 | 24,371,940.88 |
| 6.250 - 6.499 | 27 | 9,809,055.30 |
| 6.500 - 6.749 | 9 | 3,289,671.91 |
| 6.750 - 6.999 | 9 | 4,624,108.33 |
| 7.000 - 7.249 | 1 | 1,836,023.29 |
| 7.750 - 7.999 | 1 | 837,370.59 |
| 8.000 - 8.249 | 1 | 734,250.00 |
Product Type
| Number of Loans | Ending Balance ($) | |
| Fixed Rate | 276 | 115,132,408.79 |
| Hybrid | 0 | 0.00 |
Interest Only Loans
| Number of Loans | Ending Balance ($) | |
| Yes | 4 | 4,092,500.00 |
| No | 272 | 111,039,908.79 |
Geographic Distribution
| Number of Loans | Ending Balance ($) | |
| CA | 222 | 92,188,929.01 |
| NY | 19 | 9,701,670.44 |
| MA | 6 | 2,987,546.40 |
| CT | 4 | 2,474,828.11 |
| NJ | 5 | 2,319,525.35 |
| OR | 3 | 890,680.17 |
| AZ | 3 | 692,331.45 |
| IL | 2 | 655,696.02 |
| HI | 2 | 646,878.55 |
| NV | 3 | 604,080.01 |
Occupancy
| Number of Loans | Ending Balance ($) | |
| SFR - Owner-occupied (Primary Residence) | 224 | 97,513,484.48 |
| SFR - Non-owner-occupied (Investment Property) | 34 | 10,026,999.56 |
| SFR - Second Home/Vacation Home | 18 | 7,591,924.75 |
| D-2 |
Property Type
| Number of Loans | Ending Balance ($) | |
| Single Family - Previously Occupied | 138 | 67,751,570.90 |
| Condominium | 73 | 24,306,356.54 |
| PUD | 35 | 12,110,164.03 |
| Cooperative Unit | 16 | 5,195,315.34 |
| 2 Unit Residential | 4 | 1,762,402.46 |
| 3 Unit Residential | 4 | 1,716,207.55 |
| 4 Unit Residential | 4 | 1,459,631.32 |
| Single Family - Newly Built | 2 | 830,760.65 |
Documentation
| Number of Loans | Ending Balance | |
| Full Documentation | 276 | 115,132,408.79 |
| Less than Full | 0 | 0.00 |
| D-3 |
| 2008 Vintage | Ending Balance ($) | 30 Day Delq # | 30 Day Delq Balance | 30 Day Delq Balance % | 60 Day Delq # | 60 Day Delq Balance | 60 Day Delq Balance % | 90+ Day Delq # | 90+ Day Delq Balance | 90+ Day Delq Balance % | Cumulative Loss Amount | Prepayment ($) | LTD Prepayment ($) | 3 Month CPR | LTD CPR |
| 1Q2009 | 107,137,687.53 | 0 | 0 | 0 | 0 | 0 | 0 | 0 | 0 | 0 | 0 | 1,324,690.58 | 4,745,265.14 | 14.40% | 6.21% |
| 2Q2009 | 98,399,758.94 | 0 | 0 | 0 | 0 | 0 | 0 | 0 | 0 | 0 | 0 | 3,077,148.99 | 13,169,006.43 | 27.61% | 12.60% |
| 3Q2009 | 94,496,947.54 | 0 | 0 | 0 | 0 | 0 | 0 | 0 | 0 | 0 | 0 | 1,624,655.3 | 16,776,639.80 | 13.47% | 12.80% |
| 4Q2009 | 88,053,133.33 | 0 | 0 | 0 | 0 | 0 | 0 | 0 | 0 | 0 | 0 | 2,4537,71.8 | 22,928,876.63 | 23.23% | 14.71% |
| 1Q2010 | 82,573,239.09 | 0 | 0 | 0 | 0 | 0 | 0 | 0 | 0 | 0 | 0 | 1,882,534.92 | 28,132,017.53 | 21.07% | 15.71% |
| 2Q2010 | 77,725,567.46 | 0 | 0 | 0 | 0 | 0 | 0 | 0 | 0 | 0 | 0 | 1,738,512.92 | 32,712,955.97 | 19.97% | 16.23% |
| 3Q2010 | 64,113,958.52 | 0 | 0 | 0 | 0 | 0 | 0 | 0 | 0 | 0 | 0 | 4,733,702.62 | 46,089,376.70 | 52.12% | 21.25% |
| 4Q2010 | 52,864,246.43 | 0 | 0 | 0 | 0 | 0 | 0 | 0 | 0 | 0 | 0 | 4,148,484.54 | 57,143,623.49 | 50.31% | 24.95% |
| 1Q2011 | 46,245,767.3 | 0 | 0 | 0 | 0 | 0 | 0 | 0 | 0 | 0 | 0 | 1,920,555.9 | 63,595,749.46 | 38.11% | 26.28% |
| 2Q2011 | 43,266,803.7 | 0 | 0 | 0 | 0 | 0 | 0 | 0 | 0 | 0 | 0 | 867,560.51 | 66,620,056.83 | 22.82% | 25.92% |
| 3Q2011 | 39,500,300.76 | 0 | 0 | 0 | 0 | 0 | 0 | 0 | 0 | 0 | 0 | 2,098,976.53 | 69,957,009.29 | 27.06% | 25.77% |
| 4Q2011 | 35,461,463.01 | 0 | 0 | 0 | 0 | 0 | 0 | 0 | 0 | 0 | 0 | 1,084,041.85 | 73,863,081.73 | 32.56% | 26.12% |
| 1Q2012 | 33,121,247.62 | 0 | 0 | 0 | 0 | 0 | 0 | 0 | 0 | 0 | 0 | 15,296.31 | 76,081,499.93 | 22.13% | 25.63% |
| 2Q2012 | 29,889,359.98 | 0 | 0 | 0 | 0 | 0 | 0 | 0 | 0 | 0 | 0 | 1,991,601.9 | 79,198,767.35 | 32.61% | 25.90% |
| 3Q2012 | 27,787,109.59 | 0 | 0 | 0 | 0 | 0 | 0 | 0 | 0 | 0 | 0 | 1,335,759.18 | 81,201,127.71 | 22.83% | 25.58% |
| 4Q2012 | 16,617,158.25 | 0 | 0 | 0 | 0 | 0 | 0 | 0 | 0 | 0 | 0 | 774,811.89 | 81,153,198.18 | 22.74% | 26.75% |
| 1Q2013 | 13,996,970.77 | 0 | 0 | 0 | 0 | 0 | 0 | 0 | 0 | 0 | 0 | 1,042,658.26 | 83,716,288.09 | 47.11% | 26.80% |
| 2Q2013 | 12,054,808.41 | 0 | 0 | 0 | 0 | 0 | 0 | 0 | 0 | 0 | 0 | 8,325.78 | 84,116,658.51 | 10.22% | 26.09% |
| 3Q2013 | 10,569,380.42 | 0 | 0 | 0 | 0 | 0 | 0 | 0 | 0 | 0 | 0 | 4,850.96 | 85,558,911.30 | 39.87% | 25.69% |
| 4Q2013 | 9,292,327.88 | 0 | 0 | 0 | 0 | 0 | 0 | 0 | 0 | 0 | 0 | 626,957.40 | 86,796,749.64 | 39.18% | 25.34% |
| D-4 |
2009 Vintage Originations
Original Vintage Characteristics
| Total Stated Principal Balance | $ 451,024,969.58 |
| Number of Mortgage Loans | 1,105 |
| Average Stated Principal Balance | $408,167.39 |
| Weighted Average Mortgage Rate | 4.89% |
| Weight Average Margin (Hybrids only) | 0 |
| Weighted Average Remaining Term to Maturity | 354 |
| Weight Average Credit Score | 778 |
| Weighted Average Loan-to-Value Ratio | 43.74% |
Mortgage Rate Range (%)
| Number of Loans | Ending Balance ($) | |
| 3.750 - 3.999 | 15 | 6,713,831.54 |
| 4.000 - 4.249 | 18 | 6,920,057.68 |
| 4.250 - 4.499 | 96 | 40,472,576.35 |
| 4.500 - 4.749 | 277 | 98,902,253.94 |
| 4.750 - 4.999 | 374 | 144,612,183.94 |
| 5.000 - 5.249 | 147 | 69,273,495.73 |
| 5.250 - 5.499 | 99 | 45,892,731.98 |
| 5.500 - 5.749 | 49 | 25,124,859.48 |
| 5.750 - 5.999 | 17 | 7,369,153.72 |
| 6.000 - 6.249 | 8 | 3,357,673.99 |
| 6.250 - 6.499 | 4 | 1,477,579.14 |
| 6.750 - 6.999 | 1 | 908,572.09 |
Product Type
| Number of Loans | Ending Balance ($) | |
| Fixed Rate | 1105 | 451,024,969.58 |
| Hybrid | 0 | 0.00 |
Interest Only Loans
| Number of Loans | Ending Balance ($) | |
| Yes | 4 | 5,107,545.00 |
| No | 1101 | 445,917,424.58 |
Geographic Distribution
| Number of Loans | Ending Balance ($) | |
| CA | 865 | 357,580,921.28 |
| NY | 69 | 31,739,646.92 |
| MA | 58 | 23,274,098.58 |
| OR | 42 | 12,705,035.55 |
| NJ | 13 | 5,091,563.60 |
| CT | 8 | 3,374,371.02 |
| WA | 10 | 3,005,189.28 |
| FL | 5 | 2,026,147.97 |
| HI | 4 | 1,714,492.41 |
| NV | 4 | 1,363,982.83 |
Occupancy
| Number of Loans | Ending Balance ($) | |
| SFR - Owner-occupied (Primary Residence) | 942 | 390,215,573.39 |
| SFR - Second Home/Vacation Home | 111 | 43,188,311.23 |
| SFR - Non-owner-occupied (Investment Property) | 52 | 17,621,084.96 |
| D-5 |
Property Type
| Number of Loans | Ending Balance ($) | |
| Single Family - Previously Occupied | 691 | 292,462,377.44 |
| Condominium | 210 | 78,471,813.28 |
| PUD | 114 | 44,403,599.72 |
| Cooperative Unit | 59 | 19,510,603.55 |
| 2 Unit Residential | 18 | 7,955,721.44 |
| 4 Unit Residential | 7 | 3,989,763.20 |
| 3 Unit Residential | 3 | 2,389,763.73 |
| Single Family - Newly Built | 3 | 1,841,327.22 |
Documentation
| Number of Loans | Ending Balance($) | |
| Full Documentation | 1105 | 451,024,969.58 |
| Less than Full | 0 | 0.00 |
| D-6 |
| 2009 Vintage | Ending Balance ($) | 30 Day Delq # | 30 Day Delq Balance | 30 Day Delq Balance % | 60 Day Delq # | 60 Day Delq Balance | 60 Day Delq Balance % | 90+ Day Delq # | 90+ Day Delq Balance | 90+ Day Delq Balance % | Cumulative Loss Amount | Prepayment ($) | LTD Prepayment ($) | 3 Month CPR | LTD CPR |
| 1Q2010 | 441,887,356.26 | 0 | 0 | 0 | 0 | 0 | 0 | 0 | 0 | 0 | 0 | 610,681.76 | 8,853,841.40 | 2.56% | 2.46% |
| 2Q2010 | 435,565,382.39 | 0 | 0 | 0 | 0 | 0 | 0 | 0 | 0 | 0 | 0 | 1,194,279.23 | 12,859,083.39 | 3.57% | 2.72% |
| 3Q2010 | 401,673,644.64 | 0 | 0 | 0 | 0 | 0 | 0 | 0 | 0 | 0 | 0 | 18,076,826.12 | 45,685,169.28 | 26.81% | 7.86% |
| 4Q2010 | 361,837,594.06 | 0 | 0 | 0 | 0 | 0 | 0 | 0 | 0 | 0 | 0 | 14,226,870.32 | 84,007,088.80 | 31.78% | 12.32% |
| 1Q2011 | 346,715,023.44 | 0 | 0 | 0 | 0 | 0 | 0 | 0 | 0 | 0 | 0 | 2,924,701.98 | 97,690,268.22 | 13.76% | 12.54% |
| 2Q2011 | 335,613,735.68 | 0 | 0 | 0 | 0 | 0 | 0 | 0 | 0 | 0 | 0 | 3,991,270.97 | 107,366,203.65 | 10.60% | 12.27% |
| 3Q2011 | 301,469,292.27 | 0 | 0 | 0 | 0 | 0 | 0 | 0 | 0 | 0 | 0 | 21,610,185.17 | 140,152,985.16 | 33.34% | 14.72% |
| 4Q2011 | 259,508,345.61 | 0 | 0 | 0 | 0 | 0 | 0 | 0 | 0 | 0 | 0 | 15,152,161.93 | 180,922,584.46 | 41.66% | 17.95% |
| 1Q2012 | 219,897,354.86 | 0 | 0 | 0 | 0 | 0 | 0 | 0 | 0 | 0 | 0 | 13,480,032.52 | 219,507,897.84 | 45.37% | 20.86% |
| 2Q2012 | 194,802,584.53 | 0 | 0 | 0 | 0 | 0 | 0 | 0 | 0 | 0 | 0 | 7,540,493.78 | 243,683,161.48 | 35.39% | 22.12% |
| 3Q2012 | 161,956,016.31 | 0 | 0 | 0 | 0 | 0 | 0 | 0 | 0 | 0 | 0 | 15,086,049.25 | 275,728,521.72 | 49.77 | 24.51% |
| 4Q2012 | 129,512,372.37 | 0 | 0 | 0 | 0 | 0 | 0 | 0 | 0 | 0 | 0 | 11,710,602.40 | 307,520,665.90 | 54.64% | 27.12% |
| 1Q2013 | 102,924,203.23 | 0 | 0 | 0 | 0 | 0 | 0 | 0 | 0 | 0 | 0 | 5,953,060.40 | 333,587,806.55 | 55.73% | 29.30% |
| 2Q2013 | 89,398,992.77 | 0 | 0 | 0 | 0 | 0 | 0 | 0 | 0 | 0 | 0 | 4,143,640.36 | 346,659,246.47 | 40.00% | 29.80% |
| 3Q2013 | 83,199,733.24 | 0 | 0 | 0 | 0 | 0 | 0 | 0 | 0 | 0 | 0 | 1,904,717.32 | 352,437,839.67 | 22.48% | 29.26% |
| 4Q2013 | 79,208,400.55 | 0 | 0 | 0 | 0 | 0 | 0 | 0 | 0 | 0 | 0 | 441,859.58 | 356,026,969.91 | 15.81% | 28.43% |
| D-7 |
2010 Vintage Originations
Original Vintage Characteristics
| Total Stated Principal Balance | $ 586,268,097.33 |
| Number of Mortgage Loans | 1065 |
| Average Stated Principal Balance | $550,486.48 |
| Weighted Average Mortgage Rate | 4.66% |
| Weight Average Margin (Hybrids only) | 0 |
| Weighted Average Remaining Term to Maturity | 357 |
| Weight Average Credit Score | 774 |
| Weighted Average Loan-to-Value Ratio | 49.99% |
Mortgage Rate Range (%)
| Number of Loans | Ending Balance ($) | |
| 0.000 - 0.249 | 9 | 1,970,240.58 |
| 3.500 - 3.749 | 3 | 1,521,684.26 |
| 3.750 - 3.999 | 33 | 12,531,087.39 |
| 4.000 - 4.249 | 141 | 58,376,774.08 |
| 4.250 - 4.499 | 259 | 131,213,150.00 |
| 4.500 - 4.749 | 194 | 121,860,454.32 |
| 4.750 - 4.999 | 212 | 139,879,093.54 |
| 5.000 - 5.249 | 141 | 79,440,093.59 |
| 5.250 - 5.499 | 52 | 31,662,840.92 |
| 5.500 - 5.749 | 17 | 5,045,712.17 |
| 5.750 - 5.999 | 4 | 2,766,966.48 |
Product Type
| Number of Loans | Ending Balance ($) | |
| Fixed Rate | 1065 | 586,268,097.33 |
| Hybrid | 0 | 0.00 |
Interest Only Loans
| Number of Loans | Ending Balance ($) | |
| Yes | 1 | 1,100,000.00 |
| No | 1064 | 585,168,097.33 |
Geographic Distribution
| Number of Loans | Ending Balance ($) | |
| CA | 884 | 483,477,082.50 |
| NY | 73 | 49,898,910.49 |
| MA | 46 | 28,478,056.06 |
| OR | 13 | 6,311,178.89 |
| NJ | 5 | 2,656,253.77 |
| NH | 5 | 2,248,563.26 |
| CT | 5 | 2,616,476.39 |
| AZ | 5 | 1,478,514.68 |
| WA | 7 | 1,982,451.34 |
| PA | 3 | 1,236,133.71 |
Occupancy
| Number of Loans | Ending Balance ($) | |
| SFR – Owner-occupied (Primary Residence) | 897 | 519,855,452.46 |
| SFR – Second Home/Vacation Home | 73 | 34,079,639.84 |
| SFR – Non-owner-occupied (Investment Property) | 95 | 32,333,005.03 |
| D-8 |
Property Type
| Number of Loans | Ending Balance ($) | |
| Single Family – Previously Occupied | 669 | 404,840,777.94 |
| Condominium | 171 | 71,854,419.50 |
| PUD | 111 | 50,724,325.91 |
| Cooperative Unit | 56 | 30,217,151.08 |
| 2 Unit Residential | 23 | 13,421,060.88 |
| 4 Unit Residential | 14 | 8,321,055.71 |
| Single Family – Newly Built | 15 | 4,417,914.26 |
| 3 Unit Residential | 5 | 2,021,086.45 |
| Townhouse | 1 | 450,305.60 |
Documentation
| Number of Loans | Ending Balance | |
| Full Documentation | 1065 | 586,268,097.33 |
| Less than Full | 0 | 0.00 |
| D-9 |
| 2010 Vintage | Ending Balance ($) | 30 Day Delq # | 30 Day Delq Balance | 30 Day Delq Balance % | 60 Day Delq # | 60 Day Delq Balance | 60 Day Delq Balance % | 90+ Day Delq # | 90+ Day Delq Balance | 90+ Day Delq Balance % | Cumulative Loss Amount | Prepayment ($) | LTD Prepayment ($) | 3 Month CPR | LTD CPR |
| 1Q2011 | 579,863,200.79 | 0 | 0 | 0 | 0 | 0 | 0 | 0 | 0 | 0 | 0 | 747,809.57 | 19,581,784.39 | 2.70% | 6.05% |
| 2Q2011 | 573,216,601.59 | 0 | 0 | 0 | 0 | 0 | 0 | 0 | 0 | 0 | 0 | 1,211,979.84 | 23,953,097.72 | 2.97% | 5.08% |
| 3Q2011 | 558,135,727.05 | 0 | 0 | 0 | 0 | 0 | 0 | 0 | 0 | 0 | 0 | 8,386,194.69 | 36,758,448.30 | 8.61% | 5.98% |
| 4Q2011 | 511,155,652.10 | 0 | 0 | 0 | 0 | 0 | 0 | 0 | 0 | 0 | 0 | 15,006,376.06 | 81,179,007.42 | 27.83% | 10.88% |
| 1Q2012 | 470,879,272.75 | 0 | 0 | 0 | 0 | 0 | 0 | 0 | 0 | 0 | 0 | 11,979,954.59 | 119,448,607.45 | 26.04% | 13.68% |
| 2Q2012 | 432,841,624.98 | 0 | 0 | 0 | 0 | 0 | 0 | 0 | 0 | 0 | 0 | 9,669,715.99 | 155,615,969.07 | 26.73% | 14.45% |
| 3Q2012 | 372,968,576.02 | 0 | 0 | 0 | 0 | 0 | 0 | 0 | 0 | 0 | 0 | 22,915,495.40 | 213,791,164.56 | 43.05% | 19.71% |
| 4Q2012 | 305,831,422.69 | 0 | 0 | 0 | 0 | 0 | 0 | 0 | 0 | 0 | 0 | 25,733,620.08 | 278,387,954.37 | 50.91% | 24.19% |
| 1Q2013 | 250,689,111.35 | 0 | 0 | 0 | 0 | 0 | 0 | 0 | 0 | 0 | 0 | 15,912,795.11 | 332,348,947.82 | 50.68% | 27.49% |
| 2Q2013 | 215,036,106.02 | 0 | 0 | 0 | 0 | 0 | 0 | 0 | 0 | 0 | 0 | 11,571,544.30 | 366,981,655.05 | 42.64% | 29.04% |
| 3Q2013 | 197,235,556.68 | 0 | 0 | 0 | 0 | 0 | 0 | 0 | 0 | 0 | 0 | 1,846,810.05 | 383,857,637.82 | 26.59% | 28.80% |
| 4Q2013 | 189,015,522.69 | 0 | 0 | 0 | 0 | 0 | 0 | 0 | 0 | 0 | 0 | 1,074,519.63 | 391,189,480.51 | 13.92% | 27.66% |
| D-10 |
2011 Vintage Originations
Original Vintage Characteristics
| Total Stated Principal Balance | $ 667,023,141.74 |
| Number of Mortgage Loans | 981 |
| Average Stated Principal Balance | $679,942.04 |
| Weighted Average Mortgage Rate | 4.55% |
| Weight Average Margin (Hybrids only) | 0 |
| Weighted Average Remaining Term to Maturity | 357 |
| Weight Average Credit Score | 773 |
| Weighted Average Loan-to-Value Ratio | 56.65% |
Mortgage Rate Range (%)
| Number of Loans | Ending Balance ($) | |
| 3.000 - 3.249 | 3 | 1,033,050.00 |
| 3.250 - 3.499 | 1 | 123,790.30 |
| 3.500 - 3.749 | 21 | 7,114,601.00 |
| 3.750 - 3.999 | 111 | 41,513,810.57 |
| 4.000 - 4.249 | 178 | 104,318,473.33 |
| 4.250 - 4.499 | 178 | 137,768,514.53 |
| 4.500 - 4.749 | 183 | 139,569,449.00 |
| 4.750 - 4.999 | 171 | 130,155,362.55 |
| 5.000 - 5.249 | 96 | 80,531,104.69 |
| 5.250 - 5.499 | 31 | 20,572,406.69 |
| 5.500 - 5.749 | 8 | 4,322,579.08 |
Product Type
| Number of Loans | Ending Balance ($) | |
| Fixed Rate | 981 | 667,023,141.74 |
| Hybrid | 0 | 0.00 |
Interest Only Loans
| Number of Loans | Ending Balance ($) | |
| Yes | 48 | 58,801,208.32 |
| No | 933 | 608,221,933.40 |
Geographic Distribution
| Number of Loans | Ending Balance ($) | |
| CA | 783 | 528,994,722.53 |
| NY | 68 | 60,620,295.87 |
| MA | 63 | 43,138,745.30 |
| CT | 9 | 7,033,182.24 |
| OR | 23 | 7,193,379.23 |
| NJ | 5 | 5,384,563.33 |
| NV | 5 | 2,809,397.15 |
| ID | 4 | 2,632,473.71 |
| HI | 2 | 1,891,168.52 |
| FL | 4 | 1,838,700.73 |
Occupancy
| Number of Loans | Ending Balance ($) | |
| SFR - Owner-occupied (Primary Residence) | 793 | 580,787,033.11 |
| SFR - Second Home/Vacation Home | 91 | 51,170,679.26 |
| SFR - Non-owner-occupied (Investment Property) | 97 | 35,065,429.37 |
| D-11 |
Property Type
| Number of Loans | Ending Balance ($) | |
| Single Family - Previously Occupied | 619 | 458,779,273.95 |
| Condominium | 170 | 91,767,285.79 |
| PUD | 102 | 58,368,252.40 |
| Cooperative Unit | 38 | 26,175,588.72 |
| 2 Unit Residential | 36 | 22,301,449.23 |
| 4 Unit Residential | 10 | 5,608,244.98 |
| 3 Unit Residential | 5 | 3,608,965.59 |
| Single Family - Newly Built | 1 | 414,081.08 |
Documentation
| Number of Loans | Ending Balance ($) | |
| Full Documentation | 981 | 667,023,141.74 |
| Less than Full | 0 | 0.00 |
| D-12 |
| 2011 Vintage | Ending Balance ($) | 30 Day Delq # | 30 Day Delq Balance | 30 Day Delq Balance % | 60 Day Delq # | 60 Day Delq Balance | 60 Day Delq Balance % | 90+ Day Delq # | 90+ Day Delq Balance | 90+ Day Delq Balance % | Cumulative Loss Amount | Prepayment ($) | LTD Prepayment ($) | 3 Month CPR | LTD CPR |
| 1Q2012 | 646,756,918.99 | 0 | 0 | 0 | 0 | 0 | 0 | 0 | 0 | 0 | 0 | 5,397,964.44 | 49,984,006.34 | 11.88% | 13.43% |
| 2Q2012 | 624,040,897.06 | 0 | 0 | 0 | 0 | 0 | 0 | 0 | 0 | 0 | 0 | 9,268,409.54 | 69,509,527.53 | 11.43% | 13.28% |
| 3Q2012 | 567,335,515.11 | 0 | 0 | 0 | 0 | 0 | 0 | 0 | 0 | 0 | 0 | 20,542,962.94 | 120,970,544.12 | 28.72% | 18.19% |
| 4Q2012 | 491,924,069.28 | 0 | 0 | 0 | 0 | 0 | 0 | 0 | 0 | 0 | 0 | 29,385,338.28 | 187,627,089.29 | 38.17% | 23.68% |
| 1Q2013 | 428,714,923.44 | 0 | 0 | 0 | 0 | 0 | 0 | 0 | 0 | 0 | 0 | 18,017,953.52 | 243,870,762.26 | 36.51% | 27.02% |
| 2Q2013 | 375,047,033.82 | 0 | 0 | 0 | 0 | 0 | 0 | 0 | 0 | 0 | 0 | 13,685,103.25 | 284,035,530.04 | 31.28% | 28.23% |
| 3Q2013 | 354,100,526.44 | 0 | 0 | 0 | 0 | 0 | 0 | 0 | 0 | 0 | 0 | 1,882,704.47 | 300,495,273.78 | 15.76% | 26.97% |
| 4Q2013 | 341,491,675.12 | 0 | 0 | 0 | 0 | 0 | 0 | 0 | 0 | 0 | 0 | 2,237,908.88 | 311,277,119.00 | 11.56% | 25.49% |
| D-13 |
2012 Vintage Originations
Original Vintage Characteristics
| Total Stated Principal Balance | $ 1,643,750,181.13 |
| Number of Mortgage Loans | 2,651 |
| Average Stated Principal Balance | $620,049.11 |
| Weighted Average Mortgage Rate | 3.85% |
| Weight Average Margin (Hybrids only) | 0 |
| Weighted Average Remaining Term to Maturity | 356 |
| Weight Average Credit Score | 773 |
| Weighted Average Loan-to-Value Ratio | 57.98% |
Mortgage Rate Range (%)
| Number of Loans | Ending Balance ($) | |
| 0.000 - 0.249 | 19 | 2,844,558.39 |
| 2.500 - 2.749 | 2 | 272,000.00 |
| 2.750 - 2.999 | 26 | 7,254,955.14 |
| 3.000 - 3.249 | 85 | 34,080,323.78 |
| 3.250 - 3.499 | 323 | 164,791,173.30 |
| 3.500 - 3.749 | 675 | 399,010,371.48 |
| 3.750 - 3.999 | 784 | 478,548,093.19 |
| 4.000 - 4.249 | 431 | 319,033,519.32 |
| 4.250 - 4.499 | 233 | 191,192,725.57 |
| 4.500 - 4.749 | 66 | 43,542,373.32 |
| 4.750 - 4.999 | 6 | 2,337,261.13 |
| 5.000 - 5.249 | 1 | 842,826.51 |
Product Type
| Number of Loans | Ending Balance ($) | |
| Fixed Rate | 2,651 | 1,643,750,181.13 |
| Hybrid | 0 | 0.00 |
Interest Only Loans
| Number of Loans | Ending Balance ($) | |
| Yes | 160 | 197,992,361.86 |
| No | 2,491 | 1,445,757,819.27 |
Geographic Distribution
| Number of Loans | Ending Balance ($) | |
| CA | 2,030 | 1,274,482,131.56 |
| MA | 264 | 150,764,661.05 |
| NY | 158 | 115,876,330.71 |
| CT | 28 | 29,572,324.52 |
| OR | 77 | 25,167,979.55 |
| NJ | 37 | 21,876,604.09 |
| WA | 9 | 4,161,859.89 |
| CO | 6 | 2,324,020.48 |
| HI | 6 | 3,151,782.41 |
| FL | 7 | 1,978,584.63 |
Occupancy
| Number of Loans | Ending Balance ($) | |
| SFR - Owner-occupied (Primary Residence) | 2,097 | 1,394,116,773.71 |
| SFR - Second Home/Vacation Home | 215 | 119,285,860.85 |
| SFR - Non-owner-occupied (Investment Property) | 339 | 130,347,546.57 |
| D-14 |
Property Type
| Number of Loans | Ending Balance ($) | |
| Single Family - Previously Occupied | 1,630 | 1,103,706,431.13 |
| Condominium | 521 | 251,809,868.78 |
| PUD | 232 | 138,572,288.27 |
| Cooperative Unit | 108 | 50,122,964.07 |
| 2 Unit Residential | 78 | 45,708,719.42 |
| 4 Unit Residential | 30 | 18,050,339.00 |
| 3 Unit Residential | 41 | 27,610,121.91 |
| Single Family - Newly Built | 9 | 5,881,448.65 |
| Townhouse | 2 | 2,287,999.90 |
Documentation
| Number of Loans | Ending Balance ($) | |
| Full Documentation | 2,651 | 1,643,750,181.13 |
| Less than Full | 0 | 0.00 |
| D-15 |
| 2012 Vintage | Ending Balance ($) | 30 Day Delq # | 30 Day Delq Balance | 30 Day Delq Balance % | 60 Day Delq # | 60 Day Delq Balance | 60 Day Delq Balance % | 90+ Day Delq # | 90+ Day Delq Balance | 90+ Day Delq Balance % | Cumulative Loss Amount | Prepayment ($) | LTD Prepayment ($) | 3 Month CPR | LTD CPR |
| 1Q2013 | 1,597,856,249.82 | 0 | 0 | 0 | 0 | 0 | 0 | 0 | 0 | 0 | 0 | 9,174,265.26 | 55,650,547.52 | 8.87% | 6.18% |
| 2Q2013 | 1,553,713,882.65 | 0 | 0 | 0 | 0 | 0 | 0 | 0 | 0 | 0 | 0 | 13,204,667.29 | 88,743,411.06 | 7.96% | 7.04% |
| 3Q2013 | 1,529,510,654.41 | 0 | 0 | 0 | 0 | 0 | 0 | 0 | 0 | 0 | 0 | 1,763,800.14 | 106,356,436.23 | 4.41% | 6.58% |
| 4Q2013 | 1,509,080,007.20 | 1 | 117,540.76 | 0 | 0 | 0 | 0 | 0 | 0 | 0 | 0 | 3,199,056.64 | 116,761,537.74 | 2.69% | 5.92% |
| D-16 |
2013 Vintage Originations
Original Vintage Characteristics
| Total Stated Principal Balance | 2,123,763,028.64 |
| Number of Mortgage Loans | 2,697.00 |
| Average Stated Principal Balance | 787,453.85 |
| Weighted Average Mortgage Rate | 3.65 |
| Weight Average Margin (Hybrids only) | 0 |
| Weighted Average Remaining Term to Maturity | 353 |
| Weight Average Credit Score | 770 |
| Weighted Average Loan-to-Value Ratio | 60.52 |
Mortgage Rate Range (%)
| Number of Loans | Ending Balance ($) | |
| 2.750 - 2.999 | 22 | 9,379,844.97 |
| 3.000 - 3.249 | 102 | 82,567,635.62 |
| 3.250 - 3.499 | 707 | 643,317,110.23 |
| 3.500 - 3.749 | 966 | 767,955,842.28 |
| 3.750 - 3.999 | 383 | 296,350,235.10 |
| 4.000 - 4.249 | 200 | 118,609,840.02 |
| 4.250 - 4.499 | 167 | 109,056,388.65 |
| 4.500 - 4.749 | 82 | 52,299,325.61 |
| 4.750 - 4.999 | 46 | 28,751,673.31 |
| 5.000 - 5.249 | 12 | 6,943,488.92 |
| 5.250 - 5.499 | 7 | 7181283.16 |
| 5.500 - 5.749 | 2 | 848659.39 |
| 6.250 - 6.499 | 1 | 501,701.38 |
Product Type
| Number of Loans | Ending Balance ($) | |
| Fixed Rate | 2697 | 2,123,763,028.64 |
| Hybrid | 0 | 0.00 |
Interest Only Loans
| Number of Loans | Ending Balance ($) | |
| Yes | 259 | 337,571,181.34 |
| No | 2438 | 1,786,191,847.30 |
Geographic Distribution
| Number of Loans | Ending Balance ($) | |
| CA | 1868 | 1,416,168,858.78 |
| NY | 293 | 298,204,772.77 |
| MA | 345 | 265,796,321.58 |
| CT | 25 | 29,565,882.06 |
| NJ | 37 | 26,652,549.79 |
| OR | 31 | 17,116,198.45 |
| HI | 7 | 12,992,588.34 |
| FL | 12 | 8,325,576.11 |
| CO | 6 | 6,443,375.32 |
| NV | 8 | 5,564,135.38 |
Occupancy
| Number of Loans | Ending Balance ($) | |
| SFR - Owner-occupied (Primary Residence) | 2195 | 1,835,152,237.52 |
| SFR - Second Home/Vacation Home | 196 | 154,628,855.50 |
| SFR - Non-owner-occupied (Investment Property) | 306 | 133,981,935.62 |
| D-17 |
Property Type
| Number of Loans | Ending Balance ($) | |
| Single Family - Previously Occupied | 1592 | 1,360,835,829.17 |
| Condominium | 598 | 369,788,090.45 |
| PUD | 195 | 150,333,308.83 |
| Cooperative Unit | 126 | 84,499,565.97 |
| 2 Unit Residential | 94 | 72,860,322.38 |
| 4 Unit Residential | 35 | 24,994,065.47 |
| 3 Unit Residential | 43 | 35,714,102.62 |
| Single Family - Newly Built | 11 | 16,250,032.80 |
| Townhouse | 2 | 4,487,710.95 |
Documentation
| Number of Loans | Ending Balance ($) | |
| Full Documentation | 2697 | 2,123,763,028.64 |
| Less than Full | 0 | 0.00 |
| D-18 |
EXHIBIT A – MARCH 2014 MONTHLY REPORT
| A-1 |
| Distribution Date: | 03/25/2014 | Sequoia Mortgage Trust |  |
| Determination Date: | 03/17/2014 | ||
| Mortgage Pass-Through Certificates | |||
| Series 2013-2 |
Distribution Summary
DISTRIBUTION IN DOLLARS
| Prior | Pass- | Current | |||||||||
| Original | Principal | Through | Accrual | Accrual | Interest | Principal | Total | Deferred | Realized | Principal | |
| Class | Balance | Balance | Rate | Day Count | Dates | Distributed | Distributed | Distributed | Interest | Loss | Balance |
| (1) | (2) | (3) | (4) | (5) | (6) | (7) | (8) | (9)=(7+8) | (10) | (11) | (12)=(3-8+10-11) |
| A | 619,163,000.00 | 548,274,150.06 | 1.874000% | 30 / 360 | 02/01 - 02/28 | 856,221.46 | 5,471,731.12 | 6,327,952.58 | 0.00 | 0.00 | 542,802,418.94 |
| B-1 | 14,654,000.00 | 14,378,952.32 | 3.663709% | 30 / 360 | 02/01 - 02/28 | 43,900.25 | 21,746.25 | 65,646.50 | 0.00 | 0.00 | 14,357,206.07 |
| B-2 | 12,657,000.00 | 12,419,434.93 | 3.663709% | 30 / 360 | 02/01 - 02/28 | 37,917.66 | 18,782.74 | 56,700.40 | 0.00 | 0.00 | 12,400,652.19 |
| B-3 | 6,661,000.00 | 6,535,976.62 | 3.663709% | 30 / 360 | 02/01 - 02/28 | 19,954.93 | 9,884.80 | 29,839.73 | 0.00 | 0.00 | 6,526,091.82 |
| B-4 | 5,662,000.00 | 5,555,727.31 | 3.663709% | 30 / 360 | 02/01 - 02/28 | 16,962.14 | 8,402.30 | 25,364.44 | 0.00 | 0.00 | 5,547,325.01 |
| B-5 | 7,328,404.00 | 7,190,854.50 | 3.663709% | 30 / 360 | 02/01 - 02/28 | 21,954.34 | 10,875.21 | 32,829.55 | 0.00 | 0.00 | 7,179,979.29 |
| LT-R | 0.00 | 0.00 | 0.000000% | - | - | 0.00 | 0.00 | 0.00 | 0.00 | 0.00 | 0.00 |
| R | 0.00 | 0.00 | 0.000000% | - | - | 0.00 | 0.00 | 0.00 | 0.00 | 0.00 | 0.00 |
| Totals | 666,125,404.00 | 594,355,095.74 | 996,910.78 | 5,541,422.42 | 6,538,333.20 | 0.00 | 0.00 | 588,813,673.32 |
Notional Classes
| A-IO1 | 619,163,000.00 | 548,274,150.06 | 0.626000% | 30 / 360 | 02/01 - 02/28 | 286,016.35 | 0.00 | 286,016.35 | 0.00 | 0.00 | 542,802,418.94 |
| A-IO2 | 619,163,000.00 | 548,274,150.06 | 1.163709% | 30 / 360 | 02/01 - 02/28 | 531,693.06 | 0.00 | 531,693.06 | 0.00 | 0.00 | 542,802,418.94 |
| Totals | 1,238,326,000.00 | 1,096,548,300.12 | 817,709.41 | 0.00 | 817,709.41 | 0.00 | 0.00 | 1,085,604,837.88 |
Distribution Summary (Factors)
PER $1,000 OF ORIGINAL BALANCE
| Prior | Current | ||||||||
| Record | Principal | Interest | Principal | Total | Deferred | Realized | Principal | ||
| Class | CUSIP | Date | Balance | Distributed | Distributed | Distributed | Interest | Loss | Balance |
| (3/2 x 1000) | (7/2 x 1000) | (8/2 x 1000) | (9/2 x 1000) | (10/2 x 1000) | (11/2 x 1000) | (12/2 x 1000) | |||
| A | 81745MAA9 | 02/28/2014 | 885.508582 | 1.382869 | 8.837303 | 10.220172 | 0.000000 | 0.000000 | 876.671279 |
| B-1 | 81745MAD3 | 02/28/2014 | 981.230539 | 2.995786 | 1.483980 | 4.479767 | 0.000000 | 0.000000 | 979.746559 |
| B-2 | 81745MAE1 | 02/28/2014 | 981.230539 | 2.995786 | 1.483980 | 4.479766 | 0.000000 | 0.000000 | 979.746558 |
| B-3 | 81745MAF8 | 02/28/2014 | 981.230539 | 2.995786 | 1.483981 | 4.479767 | 0.000000 | 0.000000 | 979.746558 |
| B-4 | 81745MAG6 | 02/28/2014 | 981.230539 | 2.995786 | 1.483981 | 4.479767 | 0.000000 | 0.000000 | 979.746558 |
| B-5 | 81745MAH4 | 02/28/2014 | 981.230634 | 2.995787 | 1.483981 | 4.479768 | 0.000000 | 0.000000 | 979.746653 |
| LT-R | 81745MAK7 | 02/28/2014 | 0.000000 | 0.000000 | 0.000000 | 0.000000 | 0.000000 | 0.000000 | 0.000000 |
| R | 81745MAJ0 | 02/28/2014 | 0.000000 | 0.000000 | 0.000000 | 0.000000 | 0.000000 | 0.000000 | 0.000000 |
| A-IO1 | 81745MAB7 | 02/28/2014 | 885.508582 | 0.461940 | 0.000000 | 0.461940 | 0.000000 | 0.000000 | 876.671279 |
| A-IO2 | 81745MAC5 | 02/28/2014 | 885.508582 | 0.858729 | 0.000000 | 0.858729 | 0.000000 | 0.000000 | 876.671279 |
| A-2 |
| Distribution Date: | 03/25/2014 | Sequoia Mortgage Trust | |
| Determination Date: | 03/17/2014 | ||
| Mortgage Pass-Through Certificates | |||
| Series 2013-2 |
Interest Distribution Detail
DISTRIBUTION IN DOLLARS
| Prior | Pass- | Next Pass- | Interest | Optimal | Prior | Interest on | Non-Recov. | Current | ||||
| Principal | Through | Through | Accrual Day | Accrued | Unpaid | Prior Unpaid | Interest | Interest | Deferred | Interest | Unpaid | |
| Class | Balance | Rate | Rate | Cnt Fraction | Interest | Interest | Interest | Shortfall | Due | Interest | Distributed | Interest |
| (1) | (2) | (3) | (4) | (5) | (6) | (7) | (8) | (9) | (10)=(6)+(7)+(8)-(9) | (11) | (12) | (13)=(10)-(11)-(12) |
| A | 548,274,150.06 | 1.874000% | 1.874000% | 30 / 360 | 856,221.46 | 0.00 | 0.00 | 0.00 | 856,221.46 | 0.00 | 856,221.46 | 0.00 |
| B-1 | 14,378,952.32 | 3.663709% | 3.663643% | 30 / 360 | 43,900.25 | 0.00 | 0.00 | 0.00 | 43,900.25 | 0.00 | 43,900.25 | 0.00 |
| B-2 | 12,419,434.93 | 3.663709% | 3.663643% | 30 / 360 | 37,917.66 | 0.00 | 0.00 | 0.00 | 37,917.66 | 0.00 | 37,917.66 | 0.00 |
| B-3 | 6,535,976.62 | 3.663709% | 3.663643% | 30 / 360 | 19,954.93 | 0.00 | 0.00 | 0.00 | 19,954.93 | 0.00 | 19,954.93 | 0.00 |
| B-4 | 5,555,727.31 | 3.663709% | 3.663643% | 30 / 360 | 16,962.14 | 0.00 | 0.00 | 0.00 | 16,962.14 | 0.00 | 16,962.14 | 0.00 |
| B-5 | 7,190,854.50 | 3.663709% | 3.663643% | 30 / 360 | 21,954.34 | 0.00 | 0.00 | 0.00 | 21,954.34 | 0.00 | 21,954.34 | 0.00 |
| LT-R | 0.00 | 0.000000% | - | - | 0.00 | 0.00 | 0.00 | 0.00 | 0.00 | 0.00 | 0.00 | 0.00 |
| R | 0.00 | 0.000000% | - | - | 0.00 | 0.00 | 0.00 | 0.00 | 0.00 | 0.00 | 0.00 | 0.00 |
| Totals | 594,355,095.74 | 996,910.78 | 0.00 | 0.00 | 0.00 | 996,910.78 | 0.00 | 996,910.78 | 0.00 |
Notional Classes
| A-IO1 | 548,274,150.06 | 0.626000% | 0.626000% | 30 / 360 | 286,016.35 | 0.00 | 0.00 | 0.00 | 286,016.35 | 0.00 | 286,016.35 | 0.00 |
| A-IO2 | 548,274,150.06 | 1.163709% | 1.163643% | 30 / 360 | 531,693.06 | 0.00 | 0.00 | 0.00 | 531,693.06 | 0.00 | 531,693.06 | 0.00 |
| Totals | 1,096,548,300.12 | 817,709.41 | 0.00 | 0.00 | 0.00 | 817,709.41 | 0.00 | 817,709.41 | 0.00 |
| A-3 |
| Distribution Date: | 03/25/2014 | Sequoia Mortgage Trust | |
| Determination Date: | 03/17/2014 | ||
| Mortgage Pass-Through Certificates | |||
| Series 2013-2 |
Principal Distribution Detail
DISTRIBUTION IN DOLLARS
| Prior | Scheduled | Unscheduled | Current | Current | Current | Cumulative | Original | Current | Original | Current | |||
| Original | Principal | Principal | Principal | Accreted | Realized | Principal | Principal | Realized | Class | Class | Credit | Credit | |
| Class | Balance | Balance | Distribution | Distribution | Principal | Losses | Recoveries | Balance | Losses | (%) | (%) | Support | Support |
| (1) | (2) | (3) | (4) | (5) | (6) | (7) | (8) | (9)=(3)-(4)-(5)+ (6)-(7)+(8) | (10) | (11) | (12) | (13) | (14) |
| A | 619,163,000.00 | 548,274,150.06 | 829,191.77 | 4,642,539.35 | 0.00 | 0.00 | 0.00 | 542,802,418.94 | 0.00 | 92.95% | 92.19% | 7.05% | 7.81% |
| B-1 | 14,654,000.00 | 14,378,952.32 | 21,746.25 | 0.00 | 0.00 | 0.00 | 0.00 | 14,357,206.07 | 0.00 | 2.20% | 2.44% | 4.85% | 5.38% |
| B-2 | 12,657,000.00 | 12,419,434.93 | 18,782.74 | 0.00 | 0.00 | 0.00 | 0.00 | 12,400,652.19 | 0.00 | 1.90% | 2.11% | 2.95% | 3.27% |
| B-3 | 6,661,000.00 | 6,535,976.62 | 9,884.80 | 0.00 | 0.00 | 0.00 | 0.00 | 6,526,091.82 | 0.00 | 1.00% | 1.11% | 1.95% | 2.16% |
| B-4 | 5,662,000.00 | 5,555,727.31 | 8,402.30 | 0.00 | 0.00 | 0.00 | 0.00 | 5,547,325.01 | 0.00 | 0.85% | 0.94% | 1.10% | 1.22% |
| B-5 | 7,328,404.00 | 7,190,854.50 | 10,875.21 | 0.00 | 0.00 | 0.00 | 0.00 | 7,179,979.29 | 0.00 | 1.10% | 1.22% | 0.00% | 0.00% |
| Totals | 666,125,404.00 | 594,355,095.74 | 898,883.07 | 4,642,539.35 | 0.00 | 0.00 | 0.00 | 588,813,673.32 | 0.00 | 100% | 100% |
Reconciliation Detail
SOURCE OF FUNDS
| Interest Funds Available | ||
| Scheduled Interest | 1,945,378.45 | |
| Uncompensated PPIS | 0.00 | |
| Relief Act Shortfall | 0.00 | |
| Other Expenses | 0.00 | |
| Losses in Excess of Principal Balance | 0.00 | |
| Stop Advance Interest | 0.00 | |
| Other Interest Reductions | 0.00 | |
| Total Interest Funds Available: | 1,945,378.45 | |
| Principal Funds Available | ||
| Scheduled Principal | 898,883.07 | |
| Curtailments | 149,739.94 | |
| Curtailments Adjustments | 0.00 | |
| Prepayments in Full | 4,492,799.41 | |
| Liquidation Principal | 0.00 | |
| Repurchased Principal | 0.00 | |
| Other Principal | 0.00 | |
| Substitution Principal | 0.00 | |
| Principal Losses and Forgiveness | 0.00 | |
| Subsequent Recoveries / (Losses) | 0.00 | |
| Total Principal Funds Available: | 5,541,422.42 | |
| Total Funds Available | 7,486,800.87 |
| A-4 |
| Distribution Date: | 03/25/2014 | Sequoia Mortgage Trust | |
| Determination Date: | 03/17/2014 | ||
| Mortgage Pass-Through Certificates | |||
| Series 2013-2 |
ALLOCATION OF FUNDS
| Scheduled Fees | ||
| Master Servicing Fee | 1,807.82 | |
| Servicing Fee | 123,824.09 | |
| Trustee Fee | 421.04 | |
| Securities Administrator Fee | 4,705.31 | |
| Total Scheduled Fees: | 130,758.26 | |
| Additional Fees, Expenses, etc. | ||
| Trust Fund Expenses | 0.00 | |
| Other Expenses | 0.00 | |
| Total Additional Fees, Expenses, etc.: | 0.00 | |
| Distribution to Certificateholders | ||
| Interest Distribution | 1,814,620.19 | |
| Principal Distribution | 5,541,422.42 | |
| Total Distribution to Certificateholders: | 7,356,042.61 | |
| Total Funds Allocated | 7,486,800.87 |
| A-5 |
| Distribution Date: | 03/25/2014 | Sequoia Mortgage Trust | |
| Determination Date: | 03/17/2014 | ||
| Mortgage Pass-Through Certificates | |||
| Series 2013-2 |
Collateral Summary
ASSET CHARACTERISTICS
| Cut-Off | Beginning | Ending | Delta or % of Orig | |
| Aggregate Stated Principal Balance | 666,125,404.69 | 594,355,095.74 | 588,813,673.32 | 88.39% |
| Aggregate Actual Principal Balance | 666,125,404.69 | 595,088,727.69 | 589,544,837.71 | 88.50% |
| Loan Count | 777 | 715 | 712 | 65 |
| Weighted Average Coupon Rate (WAC) | 3.946533% | 3.927709% | 3.927643% | -0.018890% |
| Net Weighted Average Coupon Rate (Net WAC) | 3.682533% | 3.663709% | 3.663643% | -0.018890% |
| Weighted Average Remaining Term (WART in months) | 353 | 341 | 340 | 13 |
AVAILABLE PRINCIPAL
| Scheduled Principal | 898,883.07 | ||
| Curtailments | 149,739.94 | ||
| Curtailments Adjustments | 0.00 | ||
| Prepayments in Full | 4,492,799.41 | ||
| Liquidation Principal | 0.00 | ||
| Repurchased Principal | 0.00 | ||
| Other Principal | 0.00 | ||
| Substitution Principal | 0.00 | ||
| Principal Losses and Forgiveness | 0.00 | ||
| Subsequent Recoveries / (Losses) | 0.00 | ||
| TOTAL AVAILABLE PRINCIPAL | 5,541,422.42 |
Realized Loss Summary
| Principal Losses and Forgiveness | 0.00 | ||
| Losses in Excess of Principal Balance | 0.00 | ||
| Subsequent (Recoveries) / Losses | 0.00 | ||
| Cumulative Realized Losses | 0.00 |
AVAILABLE INTEREST
| Scheduled Interest | 1,945,378.45 | ||
| Less: Master Servicing Fee | 1,807.82 | ||
| Servicing Fee | 123,824.09 | ||
| Trustee Fee | 421.04 | ||
| Securities Administrator Fee | 4,705.31 | ||
| Uncompensated PPIS | 0.00 | ||
| Relief Act Shortfall | 0.00 | ||
| Other Expenses | 0.00 | ||
| Losses in Excess of Principal Balance | 0.00 | ||
| Stop Advance Interest | 0.00 | ||
| Other Interest Reductions | 0.00 | ||
| TOTAL AVAILABLE INTEREST | 1,814,620.19 |
| A-6 |
| Distribution Date: | 03/25/2014 | Sequoia Mortgage Trust | |
| Determination Date: | 03/17/2014 | ||
| Mortgage Pass-Through Certificates | |||
| Series 2013-2 |
Stratification Detail
Loan Rate
| # of | Ending Sched | % of Agg | ||||||||||||||||||
| Loan Rate | Loans | Balance | Balance | WAC | WART | |||||||||||||||
| 3.00 or Less | 2 | 591,319.62 | 0.10 | 3.0000 | 333 | |||||||||||||||
| 3.01 to 3.25 | 6 | 5,895,123.61 | 1.00 | 3.2303 | 248 | |||||||||||||||
| 3.26 to 3.50 | 26 | 19,238,851.52 | 3.27 | 3.4394 | 322 | |||||||||||||||
| 3.51 to 3.75 | 155 | 135,836,385.46 | 23.07 | 3.7014 | 339 | |||||||||||||||
| 3.76 to 4.00 | 316 | 257,054,995.27 | 43.66 | 3.9236 | 342 | |||||||||||||||
| 4.01 to 4.25 | 165 | 137,646,532.51 | 23.38 | 4.1485 | 341 | |||||||||||||||
| 4.26 to 4.50 | 31 | 26,766,899.85 | 4.55 | 4.3479 | 341 | |||||||||||||||
| 4.51 to 4.75 | 11 | 5,783,565.48 | 0.98 | 4.6503 | 333 | |||||||||||||||
| 4.76 to 5.00 | 0.00 | 0.00 | 0.0000 | |||||||||||||||||
| 5.01 to 5.25 | 0.00 | 0.00 | 0.0000 | |||||||||||||||||
| 5.26 to 5.50 | 0.00 | 0.00 | 0.0000 | |||||||||||||||||
| 5.51 to 5.75 | 0.00 | 0.00 | 0.0000 | |||||||||||||||||
| 5.76 to 6.00 | 0.00 | 0.00 | 0.0000 | |||||||||||||||||
| 6.01 or Greater | 0.00 | 0.00 | 0.0000 | |||||||||||||||||
| Totals | 712 | 588,813,673.32 | 100.00 | 3.9276 | 339 | |||||||||||||||
Ending Scheduled Balance
| Ending Sched | # of | Ending Sched | % of Agg | |||||||||||||||||
| Balance | Loans | Balance | Balance | WAC | WART | |||||||||||||||
| 1 to 150,000 | 8 | 893,330.55 | 0.15 | 3.9480 | 336 | |||||||||||||||
| 150,001 to 300,000 | 25 | 5,397,241.19 | 0.92 | 3.9926 | 336 | |||||||||||||||
| 300,001 to 450,000 | 30 | 11,823,440.90 | 2.01 | 3.8345 | 335 | |||||||||||||||
| 450,001 to 600,000 | 136 | 73,577,487.55 | 12.50 | 3.9580 | 339 | |||||||||||||||
| 600,001 to 750,000 | 161 | 108,650,430.55 | 18.45 | 3.9352 | 338 | |||||||||||||||
| 750,001 to 900,000 | 133 | 110,223,551.45 | 18.72 | 3.9542 | 337 | |||||||||||||||
| 900,001 to 1,050,000 | 92 | 88,817,024.06 | 15.08 | 3.9385 | 337 | |||||||||||||||
| 1,050,001 to 1,200,000 | 46 | 51,397,100.66 | 8.73 | 3.8953 | 342 | |||||||||||||||
| 1,200,001 to 1,350,000 | 16 | 20,213,307.48 | 3.43 | 3.9302 | 343 | |||||||||||||||
| 1,350,001 to 1,500,000 | 28 | 40,124,695.48 | 6.81 | 3.9265 | 342 | |||||||||||||||
| 1,500,001 to 1,650,000 | 6 | 9,454,466.57 | 1.61 | 3.7845 | 344 | |||||||||||||||
| 1,650,001 to 1,800,000 | 5 | 8,681,099.62 | 1.47 | 3.9895 | 342 | |||||||||||||||
| 1,800,001 to 1,950,000 | 11 | 21,115,526.57 | 3.59 | 3.8186 | 343 | |||||||||||||||
| 1,950,001 or Greater | 15 | 38,444,970.69 | 6.53 | 3.8902 | 340 | |||||||||||||||
| Totals | 712 | 588,813,673.32 | 100.00 | 3.9276 | 339 | |||||||||||||||
| A-7 |
| Distribution Date: | 03/25/2014 | Sequoia Mortgage Trust | |
| Determination Date: | 03/17/2014 | ||
| Mortgage Pass-Through Certificates | |||
| Series 2013-2 |
Delinquency Information
| DELINQUENT | BANKRUPTCY | FORECLOSURE | REO | TOTAL | ||||||||||
| Days | Balance | Count | Days | Balance | Count | Days | Balance | Count | Days | Balance | Count | Days | Balance | Count |
| < 30 | 0.00 | 0 | < 30 | 0.00 | 0 | < 30 | 0.00 | 0 | < 30 | 0.00 | 0 | |||
| 0.000000% | 0.0% | 0.000000% | 0.0% | 0.000000% | 0.0% | 0.000000% | 0.0% | |||||||
| 30-59 | 513,566.07 | 1 | 30-59 | 0.00 | 0 | 30-59 | 0.00 | 0 | 30-59 | 0.00 | 0 | 30-59 | 513,566.07 | 1 |
| 0.087220% | 0.1% | 0.000000% | 0.0% | 0.000000% | 0.0% | 0.000000% | 0.0% | 0.087220% | 0.1% | |||||
| 60-89 | 0.00 | 0 | 60-89 | 0.00 | 0 | 60-89 | 0.00 | 0 | 60-89 | 0.00 | 0 | 60-89 | 0.00 | 0 |
| 0.000000% | 0.0% | 0.000000% | 0.0% | 0.000000% | 0.0% | 0.000000% | 0.0% | 0.000000% | 0.0% | |||||
| 90-119 | 0.00 | 0 | 90-119 | 0.00 | 0 | 90-119 | 0.00 | 0 | 90-119 | 0.00 | 0 | 90-119 | 0.00 | 0 |
| 0.000000% | 0.0% | 0.000000% | 0.0% | 0.000000% | 0.0% | 0.000000% | 0.0% | 0.000000% | 0.0% | |||||
| 120-149 | 0.00 | 0 | 120-149 | 0.00 | 0 | 120-149 | 0.00 | 0 | 120-149 | 0.00 | 0 | 120-149 | 0.00 | 0 |
| 0.000000% | 0.0% | 0.000000% | 0.0% | 0.000000% | 0.0% | 0.000000% | 0.0% | 0.000000% | 0.0% | |||||
| 150-179 | 0.00 | 0 | 150-179 | 0.00 | 0 | 150-179 | 0.00 | 0 | 150-179 | 0.00 | 0 | 150-179 | 0.00 | 0 |
| 0.000000% | 0.0% | 0.000000% | 0.0% | 0.000000% | 0.0% | 0.000000% | 0.0% | 0.000000% | 0.0% | |||||
| 180+ | 0.00 | 0 | 180+ | 0.00 | 0 | 180+ | 0.00 | 0 | 180+ | 0.00 | 0 | 180+ | 0.00 | 0 |
| 0.000000% | 0.0% | 0.000000% | 0.0% | 0.000000% | 0.0% | 0.000000% | 0.0% | 0.000000% | 0.0% | |||||
| Total | 513,566.07 | 1 | Total | 0.00 | 0 | Total | 0.00 | 0 | Total | 0.00 | 0 | Total | 513,566.07 | 1 |
| 0.087220% | 0.1% | 0.000000% | 0.0% | 0.000000% | 0.0% | 0.000000% | 0.0% | 0.087220% | 0.1% | |||||
| Principal and Interest Advances | N/A | |||||||||||||
| A-8 |
| Distribution Date: | 03/25/2014 | Sequoia Mortgage Trust | |
| Determination Date: | 03/17/2014 | ||
| Mortgage Pass-Through Certificates | |||
| Series 2013-2 |
Historical Delinquency Information
| Distribution | 1 Month | 2 Month | 3 + Month | Bankruptcy | Foreclosure | REO | Total | |||||||
| Date | Balance | Cnt | Balance | Cnt | Balance | Cnt | Balance | Cnt | Balance | Cnt | Balance | Cnt | Balance | Cnt |
| �� | ||||||||||||||
| 03/2014 | 513,566 | 1 | 0 | 0 | 0 | 0 | 0 | 0 | 0 | 0 | 0 | 0 | 513,566 | 1 |
| 0.087% | 0.1% | 0.000% | 0.0% | 0.000% | 0.0% | 0.000% | 0.0% | 0.000% | 0.0% | 0.000% | 0.0% | 0.087% | 0.1% | |
| 02/2014 | 1,302,480 | 2 | 0 | 0 | 0 | 0 | 0 | 0 | 0 | 0 | 0 | 0 | 1,302,480 | 2 |
| 0.219% | 0.3% | 0.000% | 0.0% | 0.000% | 0.0% | 0.000% | 0.0% | 0.000% | 0.0% | 0.000% | 0.0% | 0.219% | 0.3% | |
| 01/2014 | 0 | 0 | 0 | 0 | 0 | 0 | 0 | 0 | 0 | 0 | 0 | 0 | 0 | 0 |
| 0.000% | 0.0% | 0.000% | 0.0% | 0.000% | 0.0% | 0.000% | 0.0% | 0.000% | 0.0% | 0.000% | 0.0% | 0.000% | 0.0% | |
| 12/2013 | 0 | 0 | 0 | 0 | 0 | 0 | 0 | 0 | 0 | 0 | 0 | 0 | 0 | 0 |
| 0.000% | 0.0% | 0.000% | 0.0% | 0.000% | 0.0% | 0.000% | 0.0% | 0.000% | 0.0% | 0.000% | 0.0% | 0.000% | 0.0% | |
| 11/2013 | 0 | 0 | 0 | 0 | 0 | 0 | 0 | 0 | 0 | 0 | 0 | 0 | 0 | 0 |
| 0.000% | 0.0% | 0.000% | 0.0% | 0.000% | 0.0% | 0.000% | 0.0% | 0.000% | 0.0% | 0.000% | 0.0% | 0.000% | 0.0% | |
| 10/2013 | 650,134 | 1 | 0 | 0 | 0 | 0 | 0 | 0 | 0 | 0 | 0 | 0 | 650,134 | 1 |
| 0.106% | 0.1% | 0.000% | 0.0% | 0.000% | 0.0% | 0.000% | 0.0% | 0.000% | 0.0% | 0.000% | 0.0% | 0.106% | 0.1% | |
| 09/2013 | 0 | 0 | 0 | 0 | 0 | 0 | 0 | 0 | 0 | 0 | 0 | 0 | 0 | 0 |
| 0.000% | 0.0% | 0.000% | 0.0% | 0.000% | 0.0% | 0.000% | 0.0% | 0.000% | 0.0% | 0.000% | 0.0% | 0.000% | 0.0% | |
| 08/2013 | 0 | 0 | 0 | 0 | 0 | 0 | 0 | 0 | 0 | 0 | 0 | 0 | 0 | 0 |
| 0.000% | 0.0% | 0.000% | 0.0% | 0.000% | 0.0% | 0.000% | 0.0% | 0.000% | 0.0% | 0.000% | 0.0% | 0.000% | 0.0% | |
| 07/2013 | 0 | 0 | 0 | 0 | 0 | 0 | 0 | 0 | 0 | 0 | 0 | 0 | 0 | 0 |
| 0.000% | 0.0% | 0.000% | 0.0% | 0.000% | 0.0% | 0.000% | 0.0% | 0.000% | 0.0% | 0.000% | 0.0% | 0.000% | 0.0% | |
| 06/2013 | 2,272,072 | 2 | 0 | 0 | 0 | 0 | 0 | 0 | 0 | 0 | 0 | 0 | 2,272,072 | 2 |
| 0.358% | 0.3% | 0.000% | 0.0% | 0.000% | 0.0% | 0.000% | 0.0% | 0.000% | 0.0% | 0.000% | 0.0% | 0.358% | 0.3% | |
| A-9 |
| Distribution Date: | 03/25/2014 | Sequoia Mortgage Trust | |
| Determination Date: | 03/17/2014 | ||
| Mortgage Pass-Through Certificates | |||
| Series 2013-2 |

Standard Prepayment and Default Information
| Wtd. Avg. | Current | |||||||||||||||||||||
| Payment | Age | Collateral | Scheduled | Unscheduled | Liquidation | |||||||||||||||||
| Date | (Months) | Balance | Principal | Principal | Principal | SMM | CPR | PSA | MDR | CDR | SDA | |||||||||||
| 25-Mar-2014 | 17.65 | 588,813,673.32 | 898,883.07 | 4,642,539.35 | 0.00 | 0.782% | 8.994% | 255% | 0.000% | 0.000% | 0% | |||||||||||
| 25-Feb-2014 | 16.69 | 594,355,095.74 | 901,782.35 | 4,143,011.45 | 0.00 | 0.692% | 7.998% | 240% | 0.000% | 0.000% | 0% | |||||||||||
| 27-Jan-2014 | 15.70 | 599,399,889.54 | 899,677.64 | 1,131,519.03 | 0.00 | 0.188% | 2.238% | 71% | 0.000% | 0.000% | 0% | |||||||||||
| 26-Dec-2013 | 14.69 | 601,431,086.21 | 898,852.58 | 3,554,974.65 | 0.00 | 0.588% | 6.828% | 232% | 0.000% | 0.000% | 0% | |||||||||||
| 25-Nov-2013 | 13.77 | 605,884,913.44 | 904,697.19 | 6,391,467.29 | 0.00 | 1.044% | 11.832% | 430% | 0.000% | 0.000% | 0% | |||||||||||
| 25-Oct-2013 | 12.78 | 613,181,077.92 | 901,475.24 | 82,481.46 | 0.00 | 0.013% | 0.161% | 6% | 0.000% | 0.000% | 0% | |||||||||||
| 25-Sep-2013 | 11.78 | 614,165,034.62 | 902,330.49 | 2,337,626.48 | 0.00 | 0.379% | 4.456% | 189% | 0.000% | 0.000% | 0% | |||||||||||
| 26-Aug-2013 | 10.80 | 617,404,991.59 | 907,664.51 | 4,737,885.07 | 0.00 | 0.762% | 8.765% | 406% | 0.000% | 0.000% | 0% | |||||||||||
| 25-Jul-2013 | 9.77 | 623,050,541.17 | 917,690.82 | 9,864,457.98 | 0.00 | 1.559% | 17.180% | 879% | 0.000% | 0.000% | 0% | |||||||||||
| 25-Jun-2013 | 8.84 | 633,832,689.97 | 927,528.38 | 7,527,524.03 | 0.00 | 1.174% | 13.210% | 747% | 0.000% | 0.000% | 0% |
| SMM (Single Month Mortality) = (Beginning Balance - Ending Balance - Scheduled Principal) / (Beginning Balance - Scheduled Principal) | MDR (Monthly Default Rate) = Beginning Balance of Liquidated Asset / Total Beginning Balance | |
| CPR (Constant Prepayment Rate) = 1 - ((1-SMM)^12) | CDR (Conditional Default Rate) = 1 - ((1-MDR)^12) | |
| PSA (Public Securities Association) = CPR / (min(.2% * Age, 6%)) | SDA (Standard Default Assumption) = CDR / (min(.2% * Age, 6%)) |
| A-10 |
| Distribution Date: | 03/25/2014 | Sequoia Mortgage Trust | |
| Determination Date: | 03/17/2014 | ||
| Mortgage Pass-Through Certificates | |||
| Series 2013-2 |
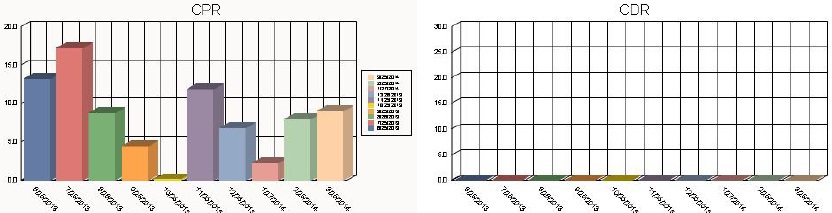
Waterfall Detail
| DISTRIBUTIONS | Amount | Remaining Available | ||||||
| Distributed | Funds | |||||||
| Available Distribution Amount | 7,356,042.61 | |||||||
| Senior Certificates, the Interest Distribution Amount and unpaid Interest Shortfalls | (1,673,930.87 | ) | 5,682,111.74 | |||||
| Senior Certificates, the Senior Principal Distribution Amount | (5,471,731.12 | ) | 210,380.62 | |||||
| Class B-1 Certificates, the Interest Distribution Amount and unpaid Interest Shortfalls | (43,900.25 | ) | 166,480.37 | |||||
| Class B-1 Certificates, the Subordinate Principal Distribution Amount | (21,746.25 | ) | 144,734.12 | |||||
| Class B-2 Certificates, the Interest Distribution Amount and unpaid Interest Shortfalls | (37,917.66 | ) | 106,816.46 | |||||
| Class B-2 Certificates, the Subordinate Principal Distribution Amount | (18,782.74 | ) | 88,033.72 | |||||
| Class B-3 Certificates, the Interest Distribution Amount and unpaid Interest Shortfalls | (19,954.93 | ) | 68,078.79 | |||||
| Class B-3 Certificates, the Subordinate Principal Distribution Amount | (9,884.80 | ) | 58,193.99 | |||||
| Class B-4 Certificates, the Interest Distribution Amount and unpaid Interest Shortfalls | (16,962.14 | ) | 41,231.85 | |||||
| Class B-4 Certificates, the Subordinate Principal Distribution Amount | (8,402.30 | ) | 32,829.55 | |||||
| Class B-5 Certificates, the Interest Distribution Amount and unpaid Interest Shortfalls | (21,954.34 | ) | 10,875.21 | |||||
| Class B-5 Certificates, the Subordinate Principal Distribution Amount | (10,875.21 | ) | 0.00 | |||||
| Class LT-R and R Certificates, any remaining amounts | 0.00 | 0.00 | ||||||
| A-11 |
| Distribution Date: | 03/25/2014 | Sequoia Mortgage Trust | |
| Determination Date: | 03/17/2014 | ||
| Mortgage Pass-Through Certificates | |||
| Series 2013-2 |
Other Information
| Principal Percentages | |
| Senior Percentage | 92.246900% |
| Subordinate Percentage | 7.753100% |
| Senior Prepayment Percentage | 100.000000% |
| Subordinate Prepayment Percentage | 0.000000% |
| Other Information | |
| Step-Down Test satisfied? | Yes |
| A-12 |
| Distribution Date: | 03/25/2014 | Sequoia Mortgage Trust | |
| Determination Date: | 03/17/2014 | ||
| Mortgage Pass-Through Certificates | |||
| Series 2013-2 |
Voluntary Prepayments, Repurchases, and Substitutions
| Scheduled | |||||||||||
| Original | Principal | Principal | Prepayment | Prepayment | Current | ||||||
| Principal Pay | Principal | Balance at | Pay Down | Penalties | Penalties | Note | Original | Original | |||
| Loan Number | Down Date | Payoff Type | Balance | Payoff | Amount | Collected | Waived | Rate | LTV | Term | State |
| 0000000048032106 | 03/01/2014 | Voluntary Prepayment | 951,000.00 | 931,815.62 | 931,815.62 | 0.00 | 0.00 | 4.12500% | 65.72 | 360 | CA |
| 0000000124885083 | 03/01/2014 | Voluntary Prepayment | 995,000.00 | 970,605.38 | 970,605.38 | 0.00 | 0.00 | 4.15000% | 61.23 | 360 | CA |
| 0000000124852471 | 03/01/2014 | Voluntary Prepayment | 2,680,000.00 | 2,597,526.52 | 2,597,526.52 | 0.00 | 0.00 | 3.80000% | 80.00 | 360 | MA |
| Count: 3 | TOTALS: | 4,626,000.00 | 4,499,947.52 | 4,499,947.52 | 0.00 | 0.00 | 3.942791% | 73.03 | 360 |
Liquidation / Loss Detail
| Most Recent | Cutoff | Prior Unpaid | Prior Scheduled | Current | Subsequent | |||||
| Prior | Next Due | Principal | Principal | Principal | Realized Loss | Loss / (Recovery) | Total Realized | Loss | ||
| Loan Number | Loss Type | Loan Status | Date | Balance | Balance | Balance | Amount | Amount | Loss Amount | Severity |
No Loans With Losses to Report.
REO Detail
| REO | Original | Unpaid Principal | Scheduled | REO | |||
| Group | Acquisition | Principal | Balance at | Principal | Book | ||
| Loan Number | No. | State | Date | Balance | Acquisition | Balance | Value |
No REOs to Report.
| A-13 |
| Distribution Date: | 03/25/2014 | Sequoia Mortgage Trust | |
| Determination Date: | 03/17/2014 | ||
| Mortgage Pass-Through Certificates | |||
| Series 2013-2 |
Material Modifications, Extensions, and Waivers Loan Detail: Part 1
| Current | Current | ||||||||
| Effective | Scheduled | Scheduled | Actual | Delinquency | Capitalized | Forgiven | Forgiven | ||
| Mod. Date | Loan Number | P&I | Balance | Balance | Balance | Status | Amount | Principal | Interest |
No Modified Loans to Report.
Material Modifications, Extensions, and Waivers Loan Detail: Part 2
| Interest | Period | Life | Initial Reset | Next | Int Reset | IO | Balloon | Maturity | |||
| Loan Number | Loan Type | Rate | Margin | Cap | Cap | Date | Reset Date | Period | Period | Payment | Date |
No Modified Loans to Report.
| CONTACT INFORMATION | CONTENTS |
| Depositor | Sequoia Residential Funding, Inc. | Distribution Summary | 2 | |
| One Belvedere Place | ||||
| Suite 330 | Distribution Summary (Factors) | 3 | ||
| Mill Valley, CA 94941 | ||||
| Trustee | Christiana Trust | Interest Distribution | 4 | |
| 500 Delaware Avenue | ||||
| 11th Floor | Principal Distribution | 5 | ||
| Wilmington, Delaware 19801 | ||||
| Master Servicer | Wells Fargo Bank, N.A. | Reconciliation Detail | 6 | |
| 9062 Old Annapolis Road | Collateral Summary | 7 | ||
| Columbia, MD 21045 | ||||
| Stratification Detail | 8 | |||
| Delinquency Information | 9 | |||
| Standard Prepayment and Default Information | 11 | |||
| Distribution Waterfall Detail | 12 | |||
| Other Information | 13 | |||
| Loan Level Detail | 14 | |||
| A-14 |
| Distribution Date: | 03/25/2014 | Sequoia Mortgage Trust | |
| Determination Date: | 03/17/2014 | ||
| Mortgage Pass-Through Certificates | |||
| Series 2013-2 |
| Deal Contact: | Karen Schluter | Citibank, N.A. | |
| karen.schluter@citi.com | Agency and Trust | ||
Tel: (212) 816-5827 | 388 Greenwich Street, 14th Floor | ||
Fax: (212) 816-5527 | New York City, NY 10013 |
| A-15 |