SECURITIES AND EXCHANGE COMMISSION
Washington, D.C. 20549
FORM 6-K
Report of Foreign Private Issuer
Pursuant to Rule 13a-16 or 15d-16 of the
Pursuant to Rule 13a-16 or 15d-16 of the
Securities Exchange Act of 1934
For the month of July, 2018
Commission File Number 1565025AMBEV S.A.
(Exact name of registrant as specified in its charter)
AMBEV S.A.
(Translation of Registrant's name into English)
Rua Dr. Renato Paes de Barros, 1017 - 3rd Floor
04530-000 São Paulo, SP
Federative Republic of Brazil
04530-000 São Paulo, SP
Federative Republic of Brazil
(Address of principal executive office)
Indicate by check mark whether the registrant files or will file annual reports under cover Form 20-F or Form 40-F.
Form 20-F ___X___ Form 40-F _______
Indicate by check mark whether the registrant by furnishing the information contained in this Form is also thereby furnishing the information to the Commission pursuant to Rule 12g3-2(b) under the Securities Exchange Act of 1934.
Yes _______ No ___X____
Second Quarter 2018 Results July 26, 2018 Page |1 | |
AMBEV REPORTS 2018 SECOND QUARTER RESULTS UNDER IFRS
São Paulo, July 26, 2018 – Ambev S.A. [B3: ABEV3; NYSE: ABEV] announces today its results for the 2018 second quarter. The following operating and financial information, unless otherwise indicated, is presented in nominalReais and prepared according to International Financial Reporting Standards (IFRS), and should be read together with our financial information for the six-month period ended June 30, 2018 filed with the CVM and submitted to the SEC.
OPERATING AND FINANCIAL HIGHLIGHTS
Net revenue:Top linewas up11.4% in 2Q18, with volume increasing by 2.6% and net revenue per hectoliter (NR/hl) by 8.6%. Net revenue growth in most of our operations, including Brazil (+9.3%), Central America and the Caribbean (CAC) (+16.2%) and Latin America South (LAS) (+25.6%), was partially impacted by Canada (-2.0%). In Brazil, volume resumed growth (+1.5%) and NR/hl increased by a healthy 7.7%. In CAC, volume and NR/hl grew by 10.8% and 4.9%, respectively. In LAS, volume was up 4.9% and NR/hl rose by 19.5%. And, in Canada, volume decline of 2.7% was partially offset by NR/hl growth of 0.8%. In HY18, on a consolidated basis, net revenue was up 8.5%, with volume declining by 1.9% and NR/hl growing by 10.7%.
Cost of goods sold (COGS): In 2Q18, COGS and cash COGS (excluding depreciation and amortization) were up 6.7% and 6.5%, respectively. On a per hectoliter basis, COGS (COGS/hl) was up 4.0% while cash COGS grew by 3.8%, mainly due to inflationary pressures in Argentina and higher commodities prices, partially offset by favorable FX in LAS and Brazil. In HY18, COGS and cash COGS increased by 3.3% and 2.8%, respectively. On a per hectoliter basis, COGS rose by 5.3% while cash COGS was up 4.8%.
Selling, general & administrative (SG&A) expenses:In 2Q18, SG&A and cash SG&A (excluding depreciation and amortization) were up 9.6% and 10.3%, respectively, above our weighted average inflation (approximately 7.2%). This is mostly due to higher concentration of marketing expenses incurred in connection with the 2018 FIFA World Cup Russia™. In HY18, SG&A and cash SG&A grew by 8.2% and 8.3%, respectively.
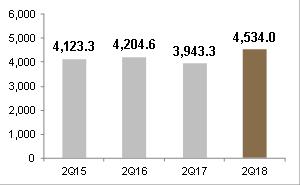
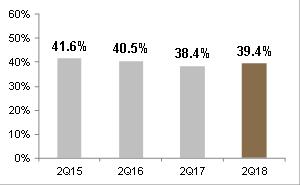
EBITDA, gross margin and EBITDA margin:EBITDA reached R$ 4,534.0 million (+16.7%) in 2Q18, with gross margin of 61.9% (+170bps) and EBITDA margin of 39.4% (+180bps).In HY18, EBITDA was R$9,172.7 million (+13.2%), with gross margin and EBITDA margin reaching 61.8% (+200bps) and 39.6% (+160bps), respectively.
Normalized profit and EPS:Normalized profit was R$ 2,348.5 million in 2Q18, 9.7% higher than in 2Q17, as the EBITDA organic growth and a lower tax rate were partially offset by higher net financial expenses. Normalized EPS in the quarter was R$ 0.14 (+11.0%). In HY18, normalized profit increased by 11.3%, reaching R$ 4,959.4 million, with normalized EPS of R$ 0.30 (+12.3%).
Cash generation and CAPEX:Cash generated from operations in 2Q18 was R$ 3,518.7 (+45.6%) and CAPEX reached R$ 805.1 million (+7.2%). In HY18, cash generated from operations totaled R$ 6,061.6 million (+9.7%) while CAPEX is declining by 2.5% to R$ 1,277.8 million.
Payout and financial discipline:Year to date, we have paid/announced R$ 3.6 billion in dividends. As of June 30, 2018, our net cash position was R$ 5,774.4 million.This figure does not include the dividend payment of R$ 0.16 per share (approximately R$ 2.5 billion) announced on May 15, 2018, to be paid as of July 30, 2018.
AMBEV REPORTS 2018 FIRST QUARTER RESULTS UNDER IFRS
Second Quarter 2018 Results July 26, 2018 Page |2 | |
Financial highlights - Ambev consolidated |
|
| % As | % |
|
| % As | % |
R$ million | 2Q17 | 2Q18 | Reported | Organic | YTD17 | YTD18 | Reported | Organic |
Volume ('000 hl) | 35,660.3 | 36,551.1 | 2.5% | 2.6% | 76,965.4 | 75,466.6 | -1.9% | -1.9% |
Net revenue | 10,268.0 | 11,509.5 | 12.1% | 11.4% | 21,509.8 | 23,149.8 | 7.6% | 8.5% |
Gross profit | 6,219.8 | 7,122.3 | 14.5% | 14.5% | 12,938.4 | 14,301.8 | 10.5% | 12.0% |
% Gross margin | 60.6% | 61.9% | 130 bps | 170 bps | 60.2% | 61.8% | 160 bps | 200 bps |
Normalized EBITDA | 3,943.3 | 4,534.0 | 15.0% | 16.7% | 8,299.5 | 9,172.7 | 10.5% | 13.2% |
% Normalized EBITDA margin | 38.4% | 39.4% | 100 bps | 180 bps | 38.6% | 39.6% | 100 bps | 160 bps |
|
|
|
|
|
|
|
|
|
Profit | 2,124.8 | 2,424.2 | 14.1% | 4,414.7 | 5,021.8 | 13.8% | ||
Normalized profit | 2,141.5 | 2,348.5 | 9.7% | 4,457.5 | 4,959.4 | 11.3% | ||
EPS (R$/shares) | 0.13 | 0.15 | 15.0% | 0.27 | 0.31 | 14.6% | ||
Normalized EPS (R$/shares) | 0.13 | 0.14 | 11.0% |
| 0.27 | 0.30 | 12.3% |
|
Note: Earnings per share calculation is based on outstanding shares (total existing shares excluding shares held in treasury).
MANAGEMENT COMMENTS
In 2Q18, top linewas up11.4% and EBITDA continued to accelerate versus 2017. After delivering 10.1% year over year EBITDA increase in 1Q18, we grew EBITDA by 16.7% in 2Q18 versus the same period last year, with EBITDA margin expansion of 180bps to 39.4%. In HY18, top line rose by 8.5% and EBITDA was R$ 9,172.7 million (+13.2%), with EBITDA margin reaching 39.6% (+160bps).
In Brazil, beer volume resumed growth in the second quarter, after an anticipated soft start. Despite the truck drivers’ strike, we managed to deliver a volume increase of 1.7%, supported in part by the 2018 FIFA World Cup RussiaTM,while the beer industry, according to ourestimates, was flattish. Along with that, we had another quarter of healthy NR/hl (+7.4%), which translated into top line and EBITDA growthof 9.2% and 11.1%, respectively, accompanied by EBITDA margin expansion of 70bps.
Our Non Alcoholic Beverages business in Brazil (NAB Brazil)[1] also had a good quarter. Volume grew by 1.0%, meanwhile the soft drink industry as a whole was down mid-single digits. Additionally, we posted solid NR/hl growth (+9.2%), which contributed to a top line increase of 10.2%. Coupled with that, a strong cost performance that was favorablyimpacted by FX and lower sugar prices drove EBITDA growth of 44.2% and EBITDA margin expansion of 920bps.
Our results in Brazil were driven by a combination of our operational excellence, which was key during the truck drivers’ strike, and a consistent execution of our growth platforms:
![]() Elevate the Core
Elevate the Core
· Brahma’s strong momentum was reinforced during this quarter by the 2018 FIFA World Cup RussiaTM. The brand sponsored the Brahma Arenas, set up in traditional venues in 7 Brazilian capitals, where consumers watched the games while enjoying free entertainment. The brand’s activation during the event was also marked by meaningful campaigns that boosted its visibility, reinforcing its heritage and recognized quality.
· Innovation is also key in the core segment. During the quarter, we launched Skol Hops, an innovative beer brewed with aromatic hops that provide a unique combination of lightness, freshness and flavor. Positioned within the core plus segment, Skol Hops was launched in northeastern Brazil and is expected to be rolled out across the country during the second half of 2018, reinforcing Skol’s innovative DNA.
· Our core plus portfolio continued to present strong growth, with Brahma Extra and Bohemia, the most important brands within this segment, growing more than 50% year over year.
1As of 1Q18, our Carbonated Soft Drinks and Non-Alcoholic and Non-Carbonated Beverages business in Brazil (CSD&NANC Brazil) is named Non-Alcoholic Beverages Brazil (NAB Brazil).
AMBEV REPORTS 2018 FIRST QUARTER RESULTS UNDER IFRS
Second Quarter 2018 Results July 26, 2018 Page |3 | |
![]() Accelerate Premium
Accelerate Premium
· Our portfolio of premium beers in Brazil, comprised of global brands -- Budweiser, Stella Artois and Corona - and domestic brands - Serramalte and Original, among others --, continued to deliver solid results, with volume growing by double digits during the quarter and driving a positive mix.
· Our global brands portfolio in particular grew by more than 30%. This performance was boosted by Budweiser, which led the way during the 2018 FIFA World Cup RussiaTM, supported by the innovative Light Up The FIFA World campaign, by an extensive distribution of the Budweiser Red Light Cup and by the Bud Basements set up across the country's main cities.
![]() Drive Smart Affordability
Drive Smart Affordability
· Fostering beer consumption in underdeveloped regions is at the core of our priorities. One initiative to address the affordability issue in Brazil is via returnable glass bottles in the off-trade channel. We are focusing on growing this package penetration in pit stops and small store formats – with less than 4 checkouts – which are closer to consumer houses, with the purpose of continuously enhancing consumers shopping experience.
![]() Shape In Home & Boost Out Of Home
Shape In Home & Boost Out Of Home
· We have been stepping up our route to market across the country via several different initiatives, including the use of new technology. Our distribution and high service level were key to keeping our products on shelves during the truck drivers’ strike. They also enabled us to react quickly after the strike, restoring inventory levels in the market rapidly.
· Along with meaningful campaigns for Budweiser, Brahma and Guaraná Antactica during the 2018 FIFA World Cup RussiaTM, we also delivered a remarkable execution in the on-trade and off-trade, leveraging this very unique opportunity to create memorable shopping experiences in both channels. With that, we executed a truly integrated 360º sales & marketing approach across the whole country, allowing us to build momentum not only for 2Q18, but also for the future.
AMBEV REPORTS 2018 FIRST QUARTER RESULTS UNDER IFRS
Second Quarter 2018 Results July 26, 2018 Page |4 | |
Regarding our international operations, in CAC we delivered top line growthof16.2% during 2Q18, once again benefiting from the combination of solid volume (+10.8%) and a healthy NR/hl (+4.9%). In the Dominican Republic, the most important country in the region, we continued to activate the Presidente brand through a remarkable execution that comprises, among other initiatives, the sponsorship of micro events and the introduction of new coolers in the market. In Panama, we embraced Panama´s first World Cup with a memorable activation of Balboa, which contributed to a strong volume increase in the country. CAC EBITDA was up 21.2%, with margin expansion of 170bps to 39.8%.
In LAS net revenue was up 25.6%, with NR/hl rising by 19.5%. Volume grew by 4.9%, with all the countries delivering a healthy growth. In Argentina in particular, organic beer volume was up mid-single digits on a hard comparable of more than 20% growth in 2Q17. This performance was mostly fueled by the core segment, with Brahma and Quilmes growing ahead of the industry and by the steady growth of single serve packages. We also introduced Budweiser to our portfolio in the country in May 2018, for which we have bold activation and distribution plans to further develop the brand. LAS EBITDA was up 37.4% in 2Q18, with margin expansion of 360bps to 39.4%.
Finally, in Canada top line was down 2.0%, as NR/hl increase of 0.8% was impacted by volume decline of 2.7%, driven by a soft industry as well as a difficult comparable in 2Q17, when we outperformed the market. Despite volume decline, our core brands Bud Light and Michelob Ultra continued to deliver strong results, being among the fastest-growing brands in Canada. On top of that, our high end brands Stella Artois and Corona outpaced the industry, and our local craft brands portfolio, comprised of Mill Street, Archibald and Stanley Park, grew by double digits. EBITDA in Canada declined by 6.6%, with margin contraction of 170bps to 33.8%, mainly explained by cash COGS/hl growth of 11.8%, due to operational deleverage and a hard comparable in 2Q17, when cash COGS/hl declined by low single digits.
AMBEV REPORTS 2018 FIRST QUARTER RESULTS UNDER IFRS
Second Quarter 2018 Results July 26, 2018 Page |5 | |
OUTLOOK
We are confident that we have a robust plan as well as the operational excellence required to support healthy top line and EBITDA across the regions in which we operate.
With regards to our operations in Brazil, we believe that the country is a unique market which provides a combination of growth opportunities and profitability, as favorable demographics, the closing of regional gaps in per capita income, and consumer demand for innovative and premium products should support long term growth.
With that in mind, our expectations for the year remain mostly unchanged: we are optimistic about our business. Although the environment in the country is still challenging and volatile, we are confident in our strategy and remain committed to maintaining a disciplined execution of our growth platforms to accelerate EBITDA growth versus 2017.
Furthermore, our NAB Brazil business delivered solid results this quarter, driven by a strong cost performance, among other factors. Based on our cost progression throughout the balance of the year, we expect cash COGS/hl for NAB Brazil to grow by mid-single digits in the full year of 2018.
With respect to CAC, we are very pleased with the development of our business and we remain enthusiastic about the opportunities we see for the region in both the short as well as long term.
In LAS, while cautious about the Argentinean macroeconomic environment, we have a track record of delivering solid results in the region and we remain confident in our ability to maintain this pattern, supported by the strength of our brands and by our financial discipline.
Finally, in Canada, while we are not satisfied with recent results, we will cycle COGS hard comparable as of 3Q18 and, supported by our powerful portfolio, we are committed to continuing to pursue an improved performance in the country in order to resume growth.
AMBEV REPORTS 2018 FIRST QUARTER RESULTS UNDER IFRS
Second Quarter 2018 Results July 26, 2018 Page |6 | |
AMBEV CONSOLIDATED INCOME STATEMENT
Consolidated income statement |
|
| Currency | Organic |
| % As | % |
R$ million | 2Q17 | Scope | Translation | Growth | 2Q18 | Reported | Organic |
Net revenue | 10,268.0 | (5.6) | 75.9 | 1,171.3 | 11,509.5 | 12.1% | 11.4% |
Cost of goods sold (COGS) | (4,048.2) | (11.0) | (56.3) | (271.8) | (4,387.2) | 8.4% | 6.7% |
Gross profit | 6,219.8 | (16.6) | 19.6 | 899.5 | 7,122.3 | 14.5% | 14.5% |
Selling, general and administrative (SG&A) | (3,371.4) | (22.2) | (34.1) | (324.1) | (3,751.7) | 11.3% | 9.6% |
Other operating income/(expenses) | 222.6 | (7.8) | 3.7 | 23.1 | 241.5 | 8.5% | 10.4% |
Normalized operating income | 3,070.9 | (46.6) | (10.8) | 598.5 | 3,612.1 | 17.6% | 19.6% |
Exceptional items above EBIT | (32.1) |
| 7.4 | 62.8 | 38.1 | nm | -195.8% |
Net finance results | (698.8) | (1,049.1) | 50.1% | ||||
Share of results of joint ventures | 5.3 | 2.6 | -51.5% | ||||
Income tax expense | (220.5) | (179.6) | -18.6% | ||||
Profit | 2,124.8 | 2,424.2 | 14.1% | ||||
Attributable to Ambev holders | 2,013.1 | 2,317.2 | 15.1% | ||||
Attributable to non-controlling interests | 111.7 | 107.0 | -4.2% | ||||
Normalized profit | 2,141.5 | 2,348.5 | 9.7% | ||||
Attributable to Ambev holders | 2,028.4 | 2,252.9 | 11.1% | ||||
|
|
|
|
|
|
|
|
Normalized EBITDA | 3,943.3 | (46.6) | (16.3) | 653.6 | 4,534.0 | 15.0% | 16.7% |
Consolidated income statement |
|
| Currency | Organic |
| % As | % |
R$ million | YTD17 | Scope | Translation | Growth | YTD18 | Reported | Organic |
Net revenue | 21,509.8 | (5.6) | (188.0) | 1,833.6 | 23,149.8 | 7.6% | 8.5% |
Cost of goods sold (COGS) | (8,571.3) | (11.0) | 14.7 | (280.4) | (8,848.0) | 3.2% | 3.3% |
Gross profit | 12,938.4 | (16.6) | (173.3) | 1,553.2 | 14,301.8 | 10.5% | 12.0% |
Selling, general and administrative (SG&A) | (6,852.3) | (22.2) | 17.2 | (561.9) | (7,419.2) | 8.3% | 8.2% |
Other operating income | 513.4 | (7.8) | 4.0 | (10.4) | 499.1 | -2.8% | -2.0% |
Normalized operating income | 6,599.5 | (46.6) | (152.1) | 980.8 | 7,381.7 | 11.9% | 14.9% |
Exceptional items above EBIT | (60.8) |
| 7.6 | 82.9 | 29.7 | -148.9% | -136.4% |
Net finance results | (1,571.4) | (1,593.4) | 1.4% | ||||
Share of results of joint ventures | 6.3 | 3.2 | -49.7% | ||||
Income tax expense | (559.0) | (799.4) | 43.0% | ||||
Profit | 4,414.7 | 5,021.8 | 13.8% | ||||
Attributable to Ambev holders | 4,212.3 | 4,833.1 | 14.7% | ||||
Attributable to non-controlling interests | 202.4 | 188.7 | -6.8% | ||||
Normalized profit | 4,457.5 | 4,959.4 | 11.3% | ||||
Attributable to Ambev holders | 4,253.7 | 4,782.1 | 12.4% | ||||
|
|
|
|
|
|
|
|
Normalized EBITDA | 8,299.5 | (46.6) | (172.2) | 1,091.9 | 9,172.7 | 10.5% | 13.2% |
AMBEV REPORTS 2018 FIRST QUARTER RESULTS UNDER IFRS
Second Quarter 2018 Results July 26, 2018 Page |7 | |
AMBEV CONSOLIDATED RESULTS
The combination of Ambev’s operations in Latin America North (LAN), Latin America South (LAS) and Canada’s business units, eliminating intercompany transactions, comprises our consolidated financial statements. The figures shown below are on an as-reported basis.
Volume (million hectoliters) | |
| |
Net revenue per hectoliter (R$) | COGS per hectoliter (R$) |
|
|
Normalized EBITDA (R$ million) | Normalized EBITDA Margin (%) |
|
|

AMBEV REPORTS 2018 FIRST QUARTER RESULTS UNDER IFRS
Second Quarter 2018 Results July 26, 2018 Page |8 | |
AMBEV CONSOLIDATED
We delivered during the quarter R$ 11,509.5 million of net revenue (+11.4%) and R$ 4,534.0 million of EBITDA (+16.7%). In HY18, net revenue totaled R$ 23,149.8 (+8.5%) and EBITDA R$ 9,172.7 million (+13.2%).
Ambev |
|
| Currency | Organic |
| % As | % |
R$ million | 2Q17 | Scope | Translation | Growth | 2Q18 | Reported | Organic |
Volume ('000 hl) | 35,660.3 | (20.2) |
| 911.1 | 36,551.1 | 2.5% | 2.6% |
Net revenue | 10,268.0 | (5.6) | 75.9 | 1,171.3 | 11,509.5 | 12.1% | 11.4% |
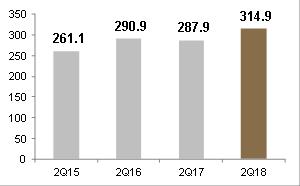
Net revenue/hl (R$) | 287.9 | 0.0 | 2.1 | 24.9 | 314.9 | 9.4% | 8.6% |
COGS | (4,048.2) | (11.0) | (56.3) | (271.8) | (4,387.2) | 8.4% | 6.7% |
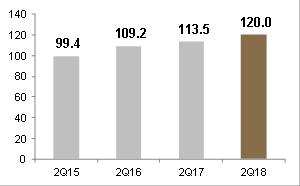
COGS/hl (R$) | (113.5) | (0.4) | (1.5) | (4.6) | (120.0) | 5.7% | 4.0% |
COGS excl. deprec. & amort. | (3,482.1) | (11.0) | (57.5) | (224.0) | (3,774.7) | 8.4% | 6.5% |
COGS/hl excl. deprec. & amort. (R$) | (97.6) | (0.4) | (1.6) | (3.7) | (103.3) | 5.8% | 3.8% |
Gross profit | 6,219.8 | (16.6) | 19.6 | 899.5 | 7,122.3 | 14.5% | 14.5% |
% Gross margin | 60.6% | 61.9% | 130 bps | 170 bps | |||
SG&A excl. deprec. & amort. | (3,065.4) | (22.2) | (38.4) | (316.4) | (3,442.4) | 12.3% | 10.3% |
SG&A deprec. & amort. | (306.0) |
| 4.4 | (7.7) | (309.3) | 1.1% | 2.5% |
SG&A total | (3,371.4) | (22.2) | (34.1) | (324.1) | (3,751.7) | 11.3% | 9.6% |
Other operating income/(expenses) | 222.6 | (7.8) | 3.7 | 23.1 | 241.5 | 8.5% | 10.4% |
Normalized EBIT | 3,070.9 | (46.6) | (10.8) | 598.5 | 3,612.1 | 17.6% | 19.6% |
% Normalized EBIT margin | 29.9% | 31.4% | 150 bps | 220 bps | |||
Normalized EBITDA | 3,943.3 | (46.6) | (16.3) | 653.6 | 4,534.0 | 15.0% | 16.7% |
% Normalized EBITDA margin | 38.4% |
|
|
| 39.4% | 100 bps | 180 bps |
Ambev |
|
| Currency | Organic |
| % As | % |
R$ million | YTD17 | Scope | Translation | Growth | YTD18 | Reported | Organic |
Volume ('000 hl) | 76,965.4 | (20.2) |
| (1,478.6) | 75,466.6 | -1.9% | -1.9% |
Net revenue | 21,509.8 | (5.6) | (188.0) | 1,833.6 | 23,149.8 | 7.6% | 8.5% |
Net revenue/hl (R$) | 279.5 | 0.0 | (2.5) | 29.8 | 306.8 | 9.8% | 10.7% |
COGS | (8,571.3) | (11.0) | 14.7 | (280.4) | (8,848.0) | 3.2% | 3.3% |
COGS/hl (R$) | (111.4) | (0.2) | 0.2 | (5.9) | (117.2) | 5.3% | 5.3% |
COGS excl. deprec.&amort. | (7,458.3) | (11.0) | 6.4 | (210.4) | (7,673.2) | 2.9% | 2.8% |
COGS/hl excl. deprec.&amort. (R$) | (96.9) | (0.2) | 0.1 | (4.7) | (101.7) | 4.9% | 4.8% |
Gross profit | 12,938.4 | (16.6) | (173.3) | 1,553.2 | 14,301.8 | 10.5% | 12.0% |
% Gross margin | 60.2% | 61.8% | 160 bps | 200 bps | |||
SG&A excl. deprec.& amort. | (6,265.8) | (22.2) | 5.5 | (520.4) | (6,802.9) | 8.6% | 8.3% |
SG&A deprec.& amort. | (586.5) |
| 11.7 | (41.5) | (616.3) | 5.1% | 7.1% |
SG&A total | (6,852.3) | (22.2) | 17.2 | (561.9) | (7,419.2) | 8.3% | 8.2% |
Other operating income/(expenses) | 513.4 | (7.8) | 4.0 | (10.4) | 499.1 | -2.8% | -2.0% |
Normalized EBIT | 6,599.5 | (46.6) | (152.1) | 980.8 | 7,381.7 | 11.9% | 14.9% |
% Normalized EBIT margin | 30.7% | 31.9% | 120 bps | 180 bps | |||
Normalized EBITDA | 8,299.5 | (46.6) | (172.2) | 1,091.9 | 9,172.7 | 10.5% | 13.2% |
% Normalized EBITDA margin | 38.6% |
|
|
| 39.6% | 100 bps | 160 bps |
AMBEV REPORTS 2018 FIRST QUARTER RESULTS UNDER IFRS
Second Quarter 2018 Results July 26, 2018 Page |9 | |
LATIN AMERICA NORTH (LAN)
Our LAN region includes Beer Brazil, Non-Alcoholic Beverages Brazil (NAB Brazil) and Central America and the Caribbean (CAC) operations. LAN EBITDA totaled R$ 2,943.5 million (+15.9%) in 2Q18 andR$ 5,974.2 million (+11.2%) in HY18.
LAN |
|
| Currency | Organic |
| % As | % |
R$ million | 2Q17 | Scope | Translation | Growth | 2Q18 | Reported | Organic |
Volume ('000 hl) | 25,943.9 | (18.2) |
| 668.7 | 26,594.4 | 2.5% | 2.6% |
Net revenue | 6,453.3 | (7.5) | 75.4 | 679.0 | 7,200.3 | 11.6% | 10.5% |
Net revenue/hl (R$) | 248.7 | (0.1) | 2.8 | 19.3 | 270.7 | 8.8% | 7.8% |
COGS | (2,631.3) | 4.1 | (32.3) | (108.0) | (2,767.5) | 5.2% | 4.1% |
COGS/hl (R$) | (101.4) | 0.1 | (1.2) | (1.5) | (104.1) | 2.6% | 1.5% |
COGS excl. deprec. & amort. | (2,208.5) | 4.1 | (28.8) | (83.2) | (2,316.4) | 4.9% | 3.8% |
COGS/hl excl. deprec. & amort. (R$) | (85.1) | 0.1 | (1.1) | (1.0) | (87.1) | 2.3% | 1.2% |
Gross profit | 3,822.0 | (3.4) | 43.1 | 571.0 | 4,432.7 | 16.0% | 15.0% |
% Gross margin | 59.2% | 61.6% | 240 bps | 240 bps | |||
SG&A excl. deprec. & amort. | (1,940.5) | 1.0 | (19.5) | (251.4) | (2,210.5) | 13.9% | 13.0% |
SG&A deprec. & amort. | (225.4) |
| (2.1) | 3.2 | (224.3) | -0.5% | -1.4% |
SG&A total | (2,165.9) | 1.0 | (21.7) | (248.2) | (2,434.8) | 12.4% | 11.5% |
Other operating income/(expenses) | 214.4 |
| 0.3 | 55.3 | 270.1 | 26.0% | 25.8% |
Normalized EBIT | 1,870.5 | (2.4) | 21.8 | 378.1 | 2,268.0 | 21.2% | 20.2% |
% Normalized EBIT margin | 29.0% | 31.5% | 250 bps | 250 bps | |||
Normalized EBITDA | 2,519.1 | (2.4) | 27.5 | 399.4 | 2,943.5 | 16.8% | 15.9% |
% Normalized EBITDA margin | 39.0% |
|
|
| 40.9% | 190 bps | 190 bps |
LAN |
|
| Currency | Organic |
| % As | % |
R$ million | YTD17 | Scope | Translation | Growth | YTD18 | Reported | Organic |
Volume ('000 hl) | 56,230.3 | (18.2) |
| (2,232.2) | 53,979.9 | -4.0% | -4.0% |
Net revenue | 13,805.4 | (7.5) | 75.5 | 657.0 | 14,530.4 | 5.3% | 4.8% |
Net revenue/hl (R$) | 245.5 | (0.1) | 1.4 | 22.3 | 269.2 | 9.6% | 9.1% |
COGS | (5,759.7) | 4.1 | (33.6) | 183.8 | (5,605.3) | -2.7% | -3.2% |
COGS/hl (R$) | (102.4) | 0.0 | (0.6) | (0.8) | (103.8) | 1.4% | 0.8% |
COGS excl. deprec. & amort. | (4,912.4) | 4.1 | (30.5) | 201.8 | (4,737.0) | -3.6% | -4.1% |
COGS/hl excl. deprec. & amort. (R$) | (87.4) | 0.0 | (0.6) | 0.1 | (87.8) | 0.4% | -0.1% |
Gross profit | 8,045.7 | (3.4) | 42.0 | 840.8 | 8,925.1 | 10.9% | 10.5% |
% Gross margin | 58.3% | 61.4% | 310 bps | 320 bps | |||
SG&A excl. deprec. & amort. | (4,044.8) | 1.0 | (20.1) | (302.7) | (4,366.7) | 8.0% | 7.5% |
SG&A deprec. & amort. | (447.1) |
| (2.0) | (0.5) | (449.6) | 0.6% | 0.1% |
SG&A total | (4,492.0) | 1.0 | (22.1) | (303.2) | (4,816.3) | 7.2% | 6.8% |
Other operating income/(expenses) | 502.7 |
| 0.3 | 44.6 | 547.5 | 8.9% | 8.9% |
Normalized EBIT | 4,056.4 | (2.4) | 20.1 | 582.2 | 4,656.2 | 14.8% | 14.4% |
% Normalized EBIT margin | 29.4% | 32.0% | 260 bps | 270 bps | |||
Normalized EBITDA | 5,351.1 | (2.4) | 25.2 | 600.3 | 5,974.2 | 11.6% | 11.2% |
% Normalized EBITDA margin | 38.8% |
|
|
| 41.1% | 230 bps | 240 bps |
AMBEV REPORTS 2018 FIRST QUARTER RESULTS UNDER IFRS
Second Quarter 2018 Results July 26, 2018 Page |10 | |
BRAZIL
In 2Q18, we delivered R$ 2,395.6 million of EBITDA in Brazil (+14.8%), with EBITDA margin of 41.1% (+190bps). Net revenue was up 9.3%, as a result of the combination of volume growth of 1.5% and NR/hl increase of 7.7%. Net revenue also benefited from the exclusion of the State VAT (ICMS) from the Excise Taxes (PIS/COFINS) basis, which was almost fully offset by the Excise Taxes (PIS/COFINS) increase implemented in January, 2018. Cash COGS and cash COGS/hl were up 1.7% and 0.2%, respectively, while cash SG&A grew by 11.7%.
In HY18, net revenue in Brazil was up 3.3%, with volume declining by 5.3%. EBITDA grew by 9.7%, with EBITDA margin expansion of 240bps to 41.5%.
Brazil |
|
| Currency | Organic |
| % As | % |
R$ million | 2Q17 | Scope | Translation | Growth | 2Q18 | Reported | Organic |
Volume ('000 hl) | 22,979.0 |
|
| 352.0 | 23,330.9 | 1.5% | 1.5% |
Net revenue | 5,325.0 |
|
| 497.7 | 5,822.7 | 9.3% | 9.3% |
Net revenue/hl (R$) | 231.7 |
|
| 17.8 | 249.6 | 7.7% | 7.7% |
COGS | (2,141.9) |
|
| (53.7) | (2,195.6) | 2.5% | 2.5% |
COGS/hl (R$) | (93.2) |
|
| (0.9) | (94.1) | 1.0% | 1.0% |
COGS excl. deprec. & amort. | (1,781.9) |
|
| (30.6) | (1,812.5) | 1.7% | 1.7% |
COGS/hl excl. deprec. & amort. (R$) | (77.5) |
|
| (0.1) | (77.7) | 0.2% | 0.2% |
Gross profit | 3,183.1 |
|
| 444.0 | 3,627.1 | 13.9% | 13.9% |
% Gross margin | 59.8% | 62.3% | 250 bps | 250 bps | |||
SG&A excl. deprec. & amort. | (1,677.1) |
|
| (196.6) | (1,873.7) | 11.7% | 11.7% |
SG&A deprec. & amort. | (189.0) |
|
| (0.0) | (189.0) | 0.0% | 0.0% |
SG&A total | (1,866.1) |
|
| (196.6) | (2,062.7) | 10.5% | 10.5% |
Other operating income/(expenses) | 221.2 |
|
| 37.8 | 259.0 | 17.1% | 17.1% |
Normalized EBIT | 1,538.2 |
|
| 285.2 | 1,823.4 | 18.5% | 18.5% |
% Normalized EBIT margin | 28.9% | 31.3% | 240 bps | 240 bps | |||
Normalized EBITDA | 2,087.2 |
|
| 308.4 | 2,395.6 | 14.8% | 14.8% |
% Normalized EBITDA margin | 39.2% |
|
|
| 41.1% | 190 bps | 190 bps |
Brazil |
|
| Currency | Organic |
| % As | % |
R$ million | YTD17 | Scope | Translation | Growth | YTD18 | Reported | Organic |
Volume ('000 hl) | 50,473.5 |
|
| (2,668.4) | 47,805.0 | -5.3% | -5.3% |
Net revenue | 11,619.2 | 384.0 | 12,003.2 | 3.3% | 3.3% | ||
Net revenue/hl (R$) | 230.2 | 20.9 | 251.1 | 9.1% | 9.1% | ||
COGS | (4,806.4) | 261.4 | (4,545.0) | -5.4% | -5.4% | ||
COGS/hl (R$) | (95.2) | 0.2 | (95.1) | -0.2% | -0.2% | ||
COGS excl. deprec. & amort. | (4,079.4) | 272.7 | (3,806.7) | -6.7% | -6.7% | ||
COGS/hl excl. deprec. & amort. (R$) | (80.8) | 1.2 | (79.6) | -1.5% | -1.5% | ||
Gross profit | 6,812.8 | 645.4 | 7,458.2 | 9.5% | 9.5% | ||
% Gross margin | 58.6% | 62.1% | 350 bps | 350 bps | |||
SG&A excl. deprec. & amort. | (3,498.9) | (248.6) | (3,747.4) | 7.1% | 7.1% | ||
SG&A deprec. & amort. | (377.2) | (1.1) | (378.3) | 0.3% | 0.3% | ||
SG&A total | (3,876.0) | (249.7) | (4,125.7) | 6.4% | 6.4% | ||
Other operating income/(expenses) | 501.3 | 30.8 | 532.1 | 6.1% | 6.1% | ||
Normalized EBIT | 3,438.1 | 426.5 | 3,864.6 | 12.4% | 12.4% | ||
% Normalized EBIT margin | 29.6% | 32.2% | 260 bps | 260 bps | |||
Normalized EBITDA | 4,542.3 | 438.9 | 4,981.2 | 9.7% | 9.7% | ||
% Normalized EBITDA margin | 39.1% |
| 41.5% | 240 bps | 240 bps |
AMBEV REPORTS 2018 FIRST QUARTER RESULTS UNDER IFRS
Second Quarter 2018 Results July 26, 2018 Page |11 | |
BEER BRAZIL
In 2Q18, EBITDA for Beer Brazil was R$ 2,061.6 million (+11.1%), with EBITDA margin expansion of 70bps to 41.5%.
Net revenue was up 9.2%. Volume increased by 1.7%, as the negative impact from the trucker’ strike was offset by the benefits of the 2018 FIFA World Cup RussiaTM. NR/hl grew by 7.4%, mostly driven by our revenue management initiatives and the carry-over of the price adjustment implemented in 3Q17. Cash COGS and cash COGS/hl were up 4.5% and 2.7%, respectively, as favorable FX was impacted by inflation, higher commodity prices and a higher weight of cans. Cash SG&A was up 11.4%, driven by phasing of marketing expenditures incurred in connection with the 2018 FIFA World Cup RussiaTM.
In HY18, Beer Brazil top line was up 3.7%, impacted by volume decline of 3.6%. EBITDA increased by 7.9%, with EBITDA margin expansion of 170bps to 42.7%.
Beer Brazil |
|
| Currency | Organic |
| % As | % |
R$ million | 2Q17 | Scope | Translation | Growth | 2Q18 | Reported | Organic |
Volume ('000 hl) | 17,430.2 | 299.2 | 17,729.4 | 1.7% | 1.7% | ||
Net revenue | 4,546.4 | 418.2 | 4,964.6 | 9.2% | 9.2% | ||
Net revenue/hl (R$) | 260.8 | 19.2 | 280.0 | 7.4% | 7.4% | ||
COGS | (1,721.3) | (84.2) | (1,805.5) | 4.9% | 4.9% | ||
COGS/hl (R$) | (98.8) | (3.1) | (101.8) | 3.1% | 3.1% | ||
COGS excl. deprec. & amort. | (1,411.7) | (63.7) | (1,475.4) | 4.5% | 4.5% | ||
COGS/hl excl. deprec. & amort. (R$) | (81.0) | (2.2) | (83.2) | 2.7% | 2.7% | ||
Gross profit | 2,825.0 | 334.0 | 3,159.1 | 11.8% | 11.8% | ||
% Gross margin | 62.1% | 63.6% | 150 bps | 150 bps | |||
SG&A excl. deprec. & amort. | (1,457.3) | (166.8) | (1,624.1) | 11.4% | 11.4% | ||
SG&A deprec. & amort. | (170.3) | (0.8) | (171.0) | 0.5% | 0.5% | ||
SG&A total | (1,627.6) | (167.6) | (1,795.2) | 10.3% | 10.3% | ||
Other operating income/(expenses) | 178.3 | 18.2 | 196.5 | 10.2% | 10.2% | ||
Normalized EBIT | 1,375.7 | 184.7 | 1,560.4 | 13.4% | 13.4% | ||
% Normalized EBIT margin | 30.3% | 31.4% | 110 bps | 110 bps | |||
Normalized EBITDA | 1,855.6 | 206.0 | 2,061.6 | 11.1% | 11.1% | ||
% Normalized EBITDA margin | 40.8% |
|
|
| 41.5% | 70 bps | 70 bps |
Beer Brazil |
|
| Currency | Organic |
| % As | % |
R$ million | YTD17 | Scope | Translation | Growth | YTD18 | Reported | Organic |
Volume ('000 hl) | 37,979.4 | (1,370.9) | 36,608.5 | -3.6% | -3.6% | ||
Net revenue | 9,916.8 | 363.4 | 10,280.2 | 3.7% | 3.7% | ||
Net revenue/hl (R$) | 261.1 | 19.7 | 280.8 | 7.5% | 7.5% | ||
COGS | (3,835.2) | 147.0 | (3,688.3) | -3.8% | -3.8% | ||
COGS/hl (R$) | (101.0) | 0.2 | (100.7) | -0.2% | -0.2% | ||
COGS excl. deprec. & amort. | (3,213.4) | 162.8 | (3,050.6) | -5.1% | -5.1% | ||
COGS/hl excl. deprec. & amort. (R$) | (84.6) | 1.3 | (83.3) | -1.5% | -1.5% | ||
Gross profit | 6,081.6 | 510.3 | 6,591.9 | 8.4% | 8.4% | ||
% Gross margin | 61.3% | 64.1% | 280 bps | 280 bps | |||
SG&A excl. deprec. & amort. | (3,033.9) | (216.3) | (3,250.3) | 7.1% | 7.1% | ||
SG&A deprec. & amort. | (338.0) | (3.5) | (341.4) | 1.0% | 1.0% | ||
SG&A total | (3,371.9) | (219.8) | (3,591.7) | 6.5% | 6.5% | ||
Other operating income/(expenses) | 401.1 | 12.0 | 413.1 | 3.0% | 3.0% | ||
Normalized EBIT | 3,110.7 | 302.5 | 3,413.3 | 9.7% | 9.7% | ||
% Normalized EBIT margin | 31.4% | 33.2% | 180 bps | 180 bps | |||
Normalized EBITDA | 4,070.5 | 321.9 | 4,392.4 | 7.9% | 7.9% | ||
% Normalized EBITDA margin | 41.0% |
|
|
| 42.7% | 170 bps | 170 bps |
AMBEV REPORTS 2018 FIRST QUARTER RESULTS UNDER IFRS
Second Quarter 2018 Results July 26, 2018 Page |12 | |
NAB BRAZIL
In 2Q18, EBITDA for NAB Brazil was R$ 334.0 million (+44.2%), with EBITDA margin expansion of 920bps to 38.9%.
Net revenue was up 10.2%, driven by volume growth of 1.0% coupled with a NR/hl increase of 9.2%, as a result of our revenue management initiatives and the carry-over of the price adjustment implemented at the end of 2017. Cash COGS and cash COGS/hl declined by 8.9% and by 9.8%, respectively, benefiting from favorable FX and lower sugar prices. Cash SG&A grew by 13.5%,driven by higher marketing expenses associated with timing of investments related to the 2018 FIFA World Cup RussiaTM.
In HY18, NAB Brazil top line was up 1.2%, with volume declining by 10.4%. EBITDA increased by 24.8%, with EBITDA margin expansion of 650bps to 34.2%.
NAB Brazil |
|
| Currency | Organic |
| % As | % |
R$ million | 2Q17 | Scope | Translation | Growth | 2Q18 | Reported | Organic |
Volume ('000 hl) | 5,548.7 | 52.8 | 5,601.5 | 1.0% | 1.0% | ||
Net revenue | 778.6 | 79.5 | 858.1 | 10.2% | 10.2% | ||
Net revenue/hl (R$) | 140.3 | 12.9 | 153.2 | 9.2% | 9.2% | ||
COGS | (420.6) | 30.5 | (390.1) | -7.2% | -7.2% | ||
COGS/hl (R$) | (75.8) | 6.2 | (69.6) | -8.1% | -8.1% | ||
COGS excl. deprec. & amort. | (370.2) | 33.1 | (337.1) | -8.9% | -8.9% | ||
COGS/hl excl. deprec. & amort. (R$) | (66.7) | 6.5 | (60.2) | -9.8% | -9.8% | ||
Gross profit | 358.1 | 110.0 | 468.0 | 30.7% | 30.7% | ||
% Gross margin | 46.0% | 54.5% | 850 bps | 850 bps | |||
SG&A excl. deprec. & amort. | (219.8) | (29.8) | (249.5) | 13.5% | 13.5% | ||
SG&A deprec. & amort. | (18.7) | 0.8 | (18.0) | -4.0% | -4.0% | ||
SG&A total | (238.5) | (29.0) | (267.5) | 12.2% | 12.2% | ||
Other operating income/(expenses) | 42.9 | 19.5 | 62.5 | 45.6% | 45.6% | ||
Normalized EBIT | 162.5 | 100.5 | 263.0 | 61.9% | 61.9% | ||
% Normalized EBIT margin | 20.9% | 30.6% | 970 bps | 970 bps | |||
Normalized EBITDA | 231.6 | 102.4 | 334.0 | 44.2% | 44.2% | ||
% Normalized EBITDA margin | 29.7% |
|
|
| 38.9% | 920 bps | 920 bps |
NAB Brazil |
|
| Currency | Organic |
| % As | % |
R$ million | YTD17 | Scope | Translation | Growth | YTD18 | Reported | Organic |
Volume ('000 hl) | 12,494.1 | (1,297.6) | 11,196.5 | -10.4% | -10.4% | ||
Net revenue | 1,702.4 | 20.6 | 1,723.0 | 1.2% | 1.2% | ||
Net revenue/hl (R$) | 136.3 | 17.6 | 153.9 | 12.9% | 12.9% | ||
COGS | (971.2) | 114.4 | (856.7) | -11.8% | -11.8% | ||
COGS/hl (R$) | (77.7) | 1.2 | (76.5) | -1.6% | -1.6% | ||
COGS excl. deprec. & amort. | (865.9) | 109.8 | (756.1) | -12.7% | -12.7% | ||
COGS/hl excl. deprec. & amort. (R$) | (69.3) | 1.8 | (67.5) | -2.6% | -2.6% | ||
Gross profit | 731.2 | 135.0 | 866.2 | 18.5% | 18.5% | ||
% Gross margin | 43.0% | 50.3% | 730 bps | 730 bps | |||
SG&A excl. deprec. & amort. | (464.9) | (32.2) | (497.1) | 6.9% | 6.9% | ||
SG&A deprec. & amort. | (39.2) | 2.3 | (36.8) | -6.0% | -6.0% | ||
SG&A total | (504.1) | (29.9) | (534.0) | 5.9% | 5.9% | ||
Other operating income/(expenses) | 100.3 | 18.7 | 119.0 | 18.7% | 18.7% | ||
Normalized EBIT | 327.4 | 123.9 | 451.3 | 37.8% | 37.8% | ||
% Normalized EBIT margin | 19.2% | 26.2% | 700 bps | 700 bps | |||
Normalized EBITDA | 471.8 | 117.0 | 588.8 | 24.8% | 24.8% | ||
% Normalized EBITDA margin | 27.7% |
|
|
| 34.2% | 650 bps | 650 bps |
AMBEV REPORTS 2018 FIRST QUARTER RESULTS UNDER IFRS
Second Quarter 2018 Results July 26, 2018 Page |13 | |
CENTRAL AMERICA AND THE CARIBBEAN (CAC)
CAC delivered EBITDA of R$ 548.0 million (+21.2%) in 2Q18, with EBITDA margin of 39.8% (+170bps).
Net revenue increased by 16.2%. Volume was up 10.8%, led by a strong activation of Presidente and Balboa brands in Dominican Republic and Panama, respectively. NR/hl was up 4.9%, due to our continued revenue management initiatives. Cash COGS and cash COGS/hl grew by 12.5% and by 1.5%, respectively, driven by a tight cost management. Cash SG&A increased by 20.9%, impacted by phasing of marketing expenditures related to the 2018 FIFA World Cup RussiaTM.
In HY18, top line in CAC was up 12.5%, with volume growth of 7.6%. EBITDA increased by 20.0%, with EBITDA margin expansion of 250bps to 39.3%.
The scope change in CAC refers to the disposal of Barbados Bottling Company Ltda. on June 1, 2018, as detailed in the “Exceptional items” section (page 16).
CAC |
|
| Currency | Organic |
| % As | % |
R$ million | 2Q17 | Scope | Translation | Growth | 2Q18 | Reported | Organic |
Volume ('000 hl) | 2,965.0 | (18.2) |
| 316.8 | 3,263.5 | 10.1% | 10.8% |
Net revenue | 1,128.3 | (7.5) | 75.4 | 181.3 | 1,377.5 | 22.1% | 16.2% |
Net revenue/hl (R$) | 380.5 | (0.2) | 23.1 | 18.6 | 422.1 | 10.9% | 4.9% |
COGS | (489.4) | 4.1 | (32.3) | (54.3) | (571.9) | 16.9% | 11.2% |
COGS/hl (R$) | (165.1) | 0.4 | (9.9) | (0.6) | (175.2) | 6.2% | 0.4% |
COGS excl. deprec. & amort. | (426.6) | 4.1 | (28.8) | (52.6) | (503.9) | 18.1% | 12.5% |
COGS/hl excl. deprec. & amort. (R$) | (143.9) | 0.5 | (8.8) | (2.2) | (154.4) | 7.3% | 1.5% |
Gross profit | 638.9 | (3.4) | 43.1 | 127.0 | 805.6 | 26.1% | 20.0% |
% Gross margin | 56.6% | 58.5% | 190 bps | 190 bps | |||
SG&A excl. deprec. & amort. | (263.4) | 1.0 | (19.5) | (54.8) | (336.8) | 27.9% | 20.9% |
SG&A deprec. & amort. | (36.4) |
| (2.1) | 3.2 | (35.3) | -3.1% | -8.9% |
SG&A total | (299.8) | 1.0 | (21.7) | (51.6) | (372.1) | 24.1% | 17.3% |
Other operating income/(expenses) | (6.7) |
| 0.3 | 17.5 | 11.1 | nm | nm |
Normalized EBIT | 332.3 | (2.4) | 21.8 | 92.9 | 444.7 | 33.8% | 28.2% |
% Normalized EBIT margin | 29.5% | 32.3% | 280 bps | 310 bps | |||
Normalized EBITDA | 431.9 | (2.4) | 27.5 | 91.0 | 548.0 | 26.9% | 21.2% |
% Normalized EBITDA margin | 38.3% |
|
|
| 39.8% | 150 bps | 170 bps |
CAC |
|
| Currency | Organic |
| % As | % |
R$ million | YTD17 | Scope | Translation | Growth | YTD18 | Reported | Organic |
Volume ('000 hl) | 5,756.9 | (18.2) |
| 436.3 | 6,174.9 | 7.3% | 7.6% |
Net revenue | 2,186.2 | (7.5) | 75.5 | 273.0 | 2,527.3 | 15.6% | 12.5% |
Net revenue/hl (R$) | 379.8 | (0.1) | 12.2 | 17.4 | 409.3 | 7.8% | 4.6% |
COGS | (953.3) | 4.1 | (33.6) | (77.6) | (1,060.3) | 11.2% | 8.2% |
COGS/hl (R$) | (165.6) | 0.2 | (5.4) | (0.9) | (171.7) | 3.7% | 0.5% |
COGS excl. deprec. & amort. | (833.1) | 4.1 | (30.5) | (70.9) | (930.3) | 11.7% | 8.6% |
COGS/hl excl. deprec. & amort. (R$) | (144.7) | 0.3 | (4.9) | (1.3) | (150.7) | 4.1% | 0.9% |
Gross profit | 1,232.9 | (3.4) | 42.0 | 195.5 | 1,466.9 | 19.0% | 15.9% |
% Gross margin | 56.4% | 58.0% | 160 bps | 170 bps | |||
SG&A excl. deprec. & amort. | (546.0) | 1.0 | (20.1) | (54.1) | (619.3) | 13.4% | 9.9% |
SG&A deprec. & amort. | (70.0) |
| (2.0) | 0.6 | (71.3) | 2.0% | -0.9% |
SG&A total | (615.9) | 1.0 | (22.1) | (53.5) | (690.6) | 12.1% | 8.7% |
Other operating income/(expenses) | 1.3 |
| 0.3 | 13.7 | 15.4 | nm | nm |
Normalized EBIT | 618.2 | (2.4) | 20.1 | 155.7 | 791.6 | 28.0% | 25.3% |
% Normalized EBIT margin | 28.3% | 31.3% | 300 bps | 320 bps | |||
Normalized EBITDA | 808.8 | (2.4) | 25.2 | 161.4 | 993.0 | 22.8% | 20.0% |
% Normalized EBITDA margin | 37.0% |
|
|
| 39.3% | 230 bps | 250 bps |
AMBEV REPORTS 2018 FIRST QUARTER RESULTS UNDER IFRS
Second Quarter 2018 Results July 26, 2018 Page |14 | |
LATIN AMERICA SOUTH (LAS)
LAS delivered EBITDA of R$ 940.9 million (+37.4%) in 2Q18, with EBITDA margin of 39.4% (+360bps).
Top line rose by 25.6%. Volume was up 4.9%, led by growth in all countries we operate. In Argentina in particular, beer volume grew by mid-single digits on a hard comparable of more than 20% growth in 2Q17. NR/hl was up 19.5%, driven by our revenue management initiatives. Cash COGS and cash COGS/hl went up 12.8% and 7.3%, respectively, favorably impacted by FX. Cash SG&A increased by 20.9%, as below inflation marketing expenses were impacted by higher distribution costs associatedwith volume increase.
In HY18, top line in LAS was up 25.0%, with volume growth of 5.4%. EBITDA increased by 30.0%, with EBITDA margin expansion of 170bps to 41.5%.
The scope change in LAS refers to the transaction carried out with Anheuser-Busch InBev SA/NV (AB InBev) on May 2, 2018, as detailed in the “Exceptional items” section (page 16).
LAS |
|
| Currency | Organic |
| % As | % |
R$ million | 2Q17 | Scope | Translation | Growth | 2Q18 | Reported | Organic |
Volume ('000 hl) | 6,729.8 | (2.0) |
| 324.0 | 7,051.9 | 4.8% | 4.9% |
Net revenue | 2,086.0 | 1.9 | (226.0) | 526.5 | 2,388.5 | 14.5% | 25.6% |
Net revenue/hl (R$) | 310.0 | 0.4 | (32.0) | 60.4 | 338.7 | 9.3% | 19.5% |
COGS | (861.2) | (15.1) | 56.3 | (124.9) | (944.9) | 9.7% | 14.6% |
COGS/hl (R$) | (128.0) | (2.3) | 8.0 | (11.7) | (134.0) | 4.7% | 9.1% |
COGS excl. deprec. & amort. | (758.8) | (15.1) | 46.5 | (96.1) | (823.4) | 8.5% | 12.8% |
COGS/hl excl. deprec. & amort. (R$) | (112.7) | (2.3) | 6.6 | (8.3) | (116.8) | 3.6% | 7.3% |
Gross profit | 1,224.8 | (13.2) | (169.6) | 401.6 | 1,443.6 | 17.9% | 33.4% |
% Gross margin | 58.7% | 60.4% | 170 bps | 370 bps | |||
SG&A excl. deprec. & amort. | (527.5) | (23.1) | 58.9 | (109.0) | (600.7) | 13.9% | 20.9% |
SG&A deprec. & amort. | (62.6) |
| 9.0 | (11.9) | (65.5) | 4.7% | 19.0% |
SG&A total | (590.1) | (23.1) | 67.9 | (120.9) | (666.2) | 12.9% | 20.7% |
Other operating income/(expenses) | 6.9 | (7.8) | 4.0 | (26.5) | (23.5) | nm | nm |
Normalized EBIT | 641.6 | (44.1) | (97.7) | 254.2 | 753.9 | 17.5% | 40.8% |
% Normalized EBIT margin | 30.8% | 31.6% | 80 bps | 370 bps | |||
Normalized EBITDA | 806.7 | (44.1) | (116.5) | 294.9 | 940.9 | 16.6% | 37.4% |
% Normalized EBITDA margin | 38.7% |
|
|
| 39.4% | 70 bps | 360 bps |
LAS |
|
| Currency | Organic |
| % As | % |
R$ million | YTD17 | Scope | Translation | Growth | YTD18 | Reported | Organic |
Volume ('000 hl) | 15,819.4 | (2.0) |
| 843.9 | 16,661.3 | 5.3% | 5.4% |
Net revenue | 4,850.0 | 1.9 | (577.0) | 1,205.1 | 5,480.0 | 13.0% | 25.0% |
Net revenue/hl (R$) | 306.6 | 0.2 | (34.6) | 56.8 | 328.9 | 7.3% | 18.5% |
COGS | (1,921.1) | (15.1) | 161.1 | (338.6) | (2,113.8) | 10.0% | 17.7% |
COGS/hl (R$) | (121.4) | (1.0) | 9.7 | (14.1) | (126.9) | 4.5% | 11.6% |
COGS excl. deprec. & amort. | (1,722.9) | (15.1) | 141.8 | (289.0) | (1,885.1) | 9.4% | 16.8% |
COGS/hl excl. deprec. & amort. (R$) | (108.9) | (1.0) | 8.5 | (11.8) | (113.1) | 3.9% | 10.8% |
Gross profit | 2,928.9 | (13.2) | (416.0) | 866.5 | 3,366.2 | 14.9% | 29.8% |
% Gross margin | 60.4% | 61.4% | 100 bps | 230 bps | |||
SG&A excl. deprec. & amort. | (1,125.5) | (23.1) | 140.6 | (276.2) | (1,284.2) | 14.1% | 24.7% |
SG&A deprec. & amort. | (123.0) |
| 17.6 | (22.7) | (128.1) | 4.2% | 18.5% |
SG&A total | (1,248.4) | (23.1) | 158.2 | (298.9) | (1,412.3) | 13.1% | 24.0% |
Other operating income/(expenses) | 8.3 | (7.8) | 4.9 | (42.2) | (36.8) | nm | nm |
Normalized EBIT | 1,688.8 | (44.1) | (252.9) | 525.4 | 1,917.1 | 13.5% | 31.5% |
% Normalized EBIT margin | 34.8% | 35.0% | 20 bps | 170 bps | |||
Normalized EBITDA | 2,010.0 | (44.1) | (289.7) | 597.8 | 2,273.9 | 13.1% | 30.0% |
% Normalized EBITDA margin | 41.4% |
|
|
| 41.5% | 10 bps | 170 bps |
AMBEV REPORTS 2018 FIRST QUARTER RESULTS UNDER IFRS
Second Quarter 2018 Results July 26, 2018 Page |15 | |
CANADA
Canada delivered EBITDA of R$ 649.5 million (-6.6%) in 2Q18, with EBITDA margin of 33.8% (-170bps).
Top line was down 2.0%, as a 2.7% volume decline was partially offset by NR/hl growth of 0.8%. Cash COGS and cash COGS/hl grew by 8.7% and 11.8%, respectively, due to a hard comparable in 2Q17. Cash SG&A decreased by 7.4%, as a result of cost savings in our non-working money, as well as phasing and efficiency gains in our working money.
In HY18, net revenue in Canada was down 1.0%, with volume decline of 1.8%. EBITDA decreased by 11.3%, with EBITDA margin compression of 340bps to 29.5%.
Canada |
|
| Currency | Organic |
| % As | % |
R$ million | 2Q17 | Scope | Translation | Growth | 2Q18 | Reported | Organic |
Volume ('000 hl) | 2,986.5 |
| (81.7) | 2,904.8 | -2.7% | -2.7% | |
Net revenue | 1,728.6 | 226.4 | (34.2) | 1,920.8 | 11.1% | -2.0% | |
Net revenue/hl (R$) | 578.8 | 78.0 | 4.5 | 661.2 | 14.2% | 0.8% | |
COGS | (555.7) | (80.3) | (38.8) | (674.8) | 21.4% | 7.0% | |
COGS/hl (R$) | (186.1) | (27.6) | (18.6) | (232.3) | 24.8% | 10.0% | |
COGS excl. deprec. & amort. | (514.9) | (75.2) | (44.8) | (634.9) | 23.3% | 8.7% | |
COGS/hl excl. deprec. & amort. (R$) | (172.4) | (25.9) | (20.3) | (218.6) | 26.8% | 11.8% | |
Gross profit | 1,172.9 | 146.2 | (73.0) | 1,246.0 | 6.2% | -6.2% | |
% Gross margin | 67.9% | 64.9% | -300 bps | -300 bps | |||
SG&A excl. deprec. & amort. | (597.4) | (77.8) | 44.0 | (631.3) | 5.7% | -7.4% | |
SG&A deprec. & amort. | (18.0) | (2.5) | 1.0 | (19.5) | 8.4% | -5.4% | |
SG&A total | (615.4) | (80.3) | 45.0 | (650.8) | 5.7% | -7.3% | |
Other operating income/(expenses) | 1.3 | (0.7) | (5.7) | (5.1) | nm | nm | |
Normalized EBIT | 558.8 | 65.1 | (33.8) | 590.2 | 5.6% | -6.0% | |
% Normalized EBIT margin | 32.3% | 30.7% | -160 bps | -130 bps | |||
Normalized EBITDA | 617.6 | 72.7 | (40.7) | 649.5 | 5.2% | -6.6% | |
% Normalized EBITDA margin | 35.7% |
|
|
| 33.8% | -190 bps | -170 bps |
Canada |
|
| Currency | Organic |
| % As | % |
R$ million | YTD17 | Scope | Translation | Growth | YTD18 | Reported | Organic |
Volume ('000 hl) | 4,915.7 |
| (90.3) | 4,825.4 | -1.8% | -1.8% | |
Net revenue | 2,854.4 | 313.5 | (28.6) | 3,139.3 | 10.0% | -1.0% | |
Net revenue/hl (R$) | 580.7 | 65.0 | 4.9 | 650.6 | 12.0% | 0.9% | |
COGS | (890.5) | (112.7) | (125.6) | (1,128.8) | 26.8% | 14.1% | |
COGS/hl (R$) | (181.2) | (23.4) | (29.4) | (233.9) | 29.1% | 16.2% | |
COGS excl. deprec. & amort. | (823.0) | (105.0) | (123.2) | (1,051.2) | 27.7% | 15.0% | |
COGS/hl excl. deprec. & amort. (R$) | (167.4) | (21.8) | (28.7) | (217.8) | 30.1% | 17.1% | |
Gross profit | 1,963.9 | 200.8 | (154.2) | 2,010.5 | 2.4% | -7.8% | |
% Gross margin | 68.8% | 64.0% | -480 bps | -480 bps | |||
SG&A excl. deprec. & amort. | (1,095.5) | (115.0) | 58.5 | (1,152.0) | 5.2% | -5.3% | |
SG&A deprec. & amort. | (16.4) | (3.8) | (18.2) | (38.5) | 134.3% | 110.9% | |
SG&A total | (1,111.9) | (118.9) | 40.3 | (1,190.5) | 7.1% | -3.6% | |
Other operating income/(expenses) | 2.4 | (1.2) | (12.8) | (11.6) | nm | nm | |
Normalized EBIT | 854.4 | 80.7 | (126.7) | 808.4 | -5.4% | -14.8% | |
% Normalized EBIT margin | 29.9% | 25.8% | -410 bps | -410 bps | |||
Normalized EBITDA | 938.4 | 92.3 | (106.1) | 924.6 | -1.5% | -11.3% | |
% Normalized EBITDA margin | 32.9% |
|
|
| 29.5% | -340 bps | -340 bps |
AMBEV REPORTS 2018 FIRST QUARTER RESULTS UNDER IFRS
Second Quarter 2018 Results July 26, 2018 Page |16 | |
OTHER OPERATING INCOME/EXPENSES
Other operating income totaled R$ 241.5 million in 2Q18 (+10.4%), mainly explained by government grants related to State VAT long-term tax incentives that were up year over year due to higher revenues and revenue geographic mix.
Other operating income/(expenses) |
|
|
|
|
R$ million | 2Q17 | 2Q18 | YTD17 | YTD18 |
Government grants/NPV of long term fiscal incentives | 205.6 | 214.1 | 427.5 | 408.9 |
(Additions to)/reversals of provisions | (17.2) | (9.1) | (27.7) | (15.8) |
(Losses)/gains on disposal of property, plant and equipment and intangible assets | 8.1 | 1.0 | 2.7 | (20.9) |
Net other operating income/(expenses) | 26.0 | 35.5 | 110.9 | 126.9 |
Other operating income/(expenses) | 222.6 | 241.5 | 513.4 | 499.1 |
EXCEPTIONAL ITEMS
During the second quarter we recorded an income of R$ 38.1 million in exceptional items (as compared to an expense of R$ 32.1 million in 2Q17), mostly explained by:
· An one-time gain of R$ 74.8 million recorded in 2Q18 as a result of the disposal of 100% of the shares of Barbados Bottling Company Ltda., a subsidiary that produces and distributes carbonated soft drinks in Barbados. The transaction was closed on June 1, 2018.
· A non-cash gain of R$ 50.8 million, in accordance with the applicable accounting practice of exchange of assets between companies under common control, as a result of the agreement between Cervecería y Maltería Quilmes S.A. (“Quilmes”), a wholly owned subsidiary of Ambev S.A., and AB InBev pursuant to which on May 2, 2018 AB InBev licensed in perpetuity to Quilmes the Budweiser brand, among other North American brands, in Argentina, upon the recovery of the distribution rights by AB InBev from Compañia Cervecerías Unidas S.A. – CCU. The transaction also included the transfer by AB InBev to Quilmes of Cerveceria Argentina Sociedad Anonima Isenbeck and the transfer by Quilmes of some Argentinean brands (Norte, Iguana and Baltica) and related business assets along with US$ 50 million.
Both of these gains were partially offset by restructuring expenses primarily linked to centralization and sizing projects in Brazil and LAS and our recent operations in Panama.
Exceptional items |
|
|
|
|
R$ million | 2Q17 | 2Q18 | YTD17 | YTD18 |
Result from exchange transaction of shareholdings |
| 50.8 |
| 50.8 |
Restructuring | (31.7) | (87.5) | (59.7) | (95.9) |
Disposal of subsidiary |
| 74.8 |
| 74.8 |
Other exceptional items | (0.4) |
| (1.1) |
|
Exceptional items | (32.1) | 38.1 | (60.8) | 29.7 |
AMBEV REPORTS 2018 FIRST QUARTER RESULTS UNDER IFRS
Second Quarter 2018 Results July 26, 2018 Page |17 | |
NET FINANCE RESULTS
Net finance results totaled an expense of R$ 1,049.1 million (+50.1%), explained by:
· Interest income of R$ 93.6 million, driven by our cash balance, mainly in Brazilian reais, US dollars and Canadian dollars;
· Interest expenses of R$ 294.6 million, that include interest expenses incurred in connection with the Brazilian Tax Regularization Program – PERT, as well as a non-cash accrual of approximately R$ 50.0 million related to the put option associated with our investment in the Dominican Republic;
· R$ 231.6 million of losses on derivative instruments, mostly driven by non-cash expenses related to negative results of equity swaps;
· Losses on non-derivative instruments of R$ 388.8 million, mainly related to non-cash expenses due to foreign exchange variation on intercompany loans;
· Taxes on financial transactions on the amount of R$ 104.7 million; and
· R$ 122.9 million of other financial expenses, mostly driven by interest on contingencies.
Net finance results |
|
|
|
|
R$ million | 2Q17 | 2Q18 | YTD17 | YTD18 |
Interest income | 117.8 | 93.6 | 226.4 | 196.9 |
Interest expenses | (389.6) | (294.6) | (791.9) | (642.7) |
Gains/(losses) on derivative instruments | (141.3) | (231.6) | (387.9) | (414.1) |
Gains/(losses) on non-derivative instruments | (101.2) | (388.8) | (179.6) | (296.2) |
Taxes on financial transactions | (33.6) | (104.7) | (71.6) | (195.9) |
Other financial income/(expenses), net | (150.7) | (122.9) | (366.8) | (241.4) |
Net finance results | (698.8) | (1,049.1) | (1,571.4) | (1,593.4) |
DEBT BREAKDOWN
As of June 30, 2018 we held a net cash position of R$ 5,774.4 million (down from R$ 7,811.6 million as of December 31, 2017). Consolidated debt corresponded to R$ 4,857.0 million whereas cash and cash equivalents less bank overdrafts totaled R$ 10,618.7 million, up from R$ 10,352.7 million as of December 31, 2017.
Debt breakdown | December 31, 2017 | June 30, 2018 | ||||
R$ million | Current | Non-current | Total | Current | Non-current | Total |
Local Currency | 351.4 | 733.5 | 1,084.9 | 334.7 | 569.3 | 904.0 |
Foreign Currency | 969.7 | 498.4 | 1,468.1 | 3,380.8 | 572.2 | 3,953.0 |
Consolidated Debt | 1,321.1 | 1,231.9 | 2,553.1 | 3,715.5 | 1,141.5 | 4,857.0 |
Cash and Cash Equivalents less Bank Overdrafts | 10,352.7 | 10,618.7 | ||||
Current Investment Securities | 11.9 | 12.6 | ||||
Net debt/(cash) |
|
| (7,811.6) |
|
| (5,774.4) |
AMBEV REPORTS 2018 FIRST QUARTER RESULTS UNDER IFRS
Second Quarter 2018 Results July 26, 2018 Page |18 | |
PROVISION FOR INCOME TAX & SOCIAL CONTRIBUTION
The weighted nominal tax rate for the quarter was 28.7%, compared to 26.4% in 2Q17. The effective tax rate decreased from 9.4% to 6.9%, mainly explained by an easy comparable in 2Q17, when the tax rate was adversely impacted by a one-time tax adjustment.
In HY18 the effective tax rate was 13.7% versus 11.2% in HY17, mainly driven by an increase in taxable profit, which is taxed at an average rate of 29.7%.
The table below shows the reconciliation for income tax and social contribution provision.
Income tax and social contribution |
|
|
|
|
R$ million | 2Q17 | 2Q18 | YTD17 | YTD18 |
Profit before tax | 2,345.3 | 2,603.7 | 4,973.6 | 5,821.2 |
Adjustment on taxable basis | ||||
Non-taxable net financial and other income | (63.2) | 24.8 | (168.0) | (53.4) |
Goverment grants (VAT) | (415.0) | (438.1) | (849.4) | (851.8) |
Share of results of joint ventures | (5.3) | (2.6) | (6.3) | (3.2) |
Expenses not deductible | (59.5) | 35.1 | 30.5 | 99.7 |
Foreign profits taxed in Brazil | (289.7) | (226.0) | (254.9) | (314.4) |
| 1,512.6 | 1,997.0 | 3,725.5 | 4,698.0 |
Aggregated weighted nominal tax rate | 26.4% | 28.7% | 28.3% | 29.7% |
Taxes – nominal rate | (398.7) | (574.1) | (1,054.3) | (1,393.6) |
Adjustment on tax expense | ||||
Tax benefit - interest on shareholders' equity | 369.0 | 425.6 | 653.4 | 725.3 |
Tax benefit - amortization on tax books | 46.3 | 18.3 | 82.6 | 36.5 |
Other tax adjustments | (237.1) | (49.4) | (240.7) | (167.7) |
Income tax and social contribution expense | (220.5) | (179.6) | (559.0) | (799.4) |
Effective tax rate | 9.4% | 6.9% | 11.2% | 13.7% |
SHAREHOLDING STRUCTURE
The table below summarizes Ambev S.A.’s shareholding structure as of June 30, 2018.
Ambev S.A.'s shareholding structure | ||
ON | % Outs | |
Anheuser-Busch InBev | 9,727,217,492 | 61.9% |
FAHZ | 1,608,916,101 | 10.2% |
Market | 4,383,353,675 | 27.9% |
Outstanding | 15,719,487,268 | 100.0% |
Treasury | 2,660,043 | |
TOTAL | 15,722,147,311 |
|
Free float B3 | 3,129,693,896 | 19.9% |
Free float NYSE | 1,253,659,779 | 8.0% |
AMBEV REPORTS 2018 FIRST QUARTER RESULTS UNDER IFRS
Second Quarter 2018 Results July 26, 2018 Page |19 | |
RECONCILIATION BETWEEN NORMALIZED EBITDA & PROFIT
Both Normalized EBITDA and EBIT are measures used by Ambev’s management to measure the Company’s performance.
Normalized EBITDA is calculated excluding from Profit the following effects: (i) Non-controlling interest, (ii) Income Tax expense, (iii) Share of results of associates, (iv) Net finance results, (v) Special items, and (vi) Depreciation & Amortization.
Normalized EBITDA and EBIT are not accounting measures under accounting practices in Brazil, IFRS or the United States of America (US GAAP) and should not be considered as an alternative to Profit as a measure of operational performance or an alternative to Cash Flow as a measure of liquidity. Normalized EBITDA and EBIT do not have a standard calculation method and Ambev’s definition of Normalized EBITDA and EBIT may not be comparable to that of other companies.
Reconciliation - Profit to EBITDA |
|
|
|
|
R$ million | 2Q17 | 2Q18 | YTD17 | YTD18 |
Profit - Ambev holders | 2,013.1 | 2,317.2 | 4,212.3 | 4,833.1 |
Non-controlling interest | 111.7 | 107.0 | 202.4 | 188.7 |
Income tax expense | 220.5 | 179.6 | 559.0 | 799.4 |
Profit before taxes | 2,345.3 | 2,603.7 | 4,973.6 | 5,821.2 |
Share of results of joint ventures | (5.3) | (2.6) | (6.3) | (3.2) |
Net finance results | 698.8 | 1,049.1 | 1,571.4 | 1,593.4 |
Exceptional items | 32.1 | (38.1) | 60.8 | (29.7) |
Normalized EBIT | 3,070.9 | 3,612.1 | 6,599.5 | 7,381.7 |
Depreciation & amortization - total | 872.4 | 921.9 | 1,700.0 | 1,791.0 |
Normalized EBITDA | 3,943.3 | 4,534.0 | 8,299.5 | 9,172.7 |
AMBEV REPORTS 2018 FIRST QUARTER RESULTS UNDER IFRS
Second Quarter 2018 Results July 26, 2018 Page |20 | |
Q2 2018 EARNINGS CONFERENCE CALL
Speakers: | Bernardo Paiva Chief Executive Officer Fernando Tennenbaum Chief Financial and Investor Relations Officer | |
Language: | English | |
Date: | July 26, 2018 (Thursday) | |
Time: | 12:00 (Brasília time) 11:00 (EST) | |
Phone number: | US participants International participants | +1 (844) 839-2182 +1 (412) 317-2503 |
Conference ID: | Ambev | |
Please call 15 minutes prior to the beginning of the conference call.
Webcast: The conference call will also be transmitted live through the Internet, available on Ambev’s website:https://webcastlite.mziq.com/cover.html?webcastId=84593d04-fc58-4d85-923d-952f7a858e3e
Playback: The conference call replay through internet will be available one hour after conclusion at Ambev’s website at the same link above. For Playback through telephone: participants calling from USA: +1 (877) 344-7529 / participants calling from other countries: +1 (412) 317-0088 / Code: 10121664 - enter "1" to start the playback.
For additional information, please contact the Investor Relations team:
Nicole Brink +55 (11) 2122-1415 nicole.brink@ambev.com.br
| André Thomaz +55 (11) 2122-1414 andre.thomaz@ambev.com.br
|
ir.ambev.com.br
AMBEV REPORTS 2018 FIRST QUARTER RESULTS UNDER IFRS
Second Quarter 2018 Results July 26, 2018 Page |21 | |
NOTES
This press release segregates the impact of organic changes from those arising from changes in scope or currency translation. Scope changes represent the impact of acquisitions and divestitures, the start up or termination of activities or the transfer of activities between segments, curtailment gains and losses and year over year changes in accounting estimates and other assumptions that management does not consider as part of the underlying performance of the business. Unless stated, percentage changes in this press release are both organic and normalized in nature. Whenever used in this document, the term “normalized” refers to performance measures (EBITDA, EBIT, Profit, EPS) before special items adjustments. Special items are either income or expenses which do not occur regularly as part of the normal activities of the Company. They are presented separately because they are important for the understanding of the underlying sustainable performance of the Company due to their size or nature. Normalized measures are additional measures used by management and should not replace the measures determined in accordance with IFRS as indicators of the Company’s performance. Comparisons, unless otherwise stated, refer to the second quarter of 2017 (2Q17). Values in this release may not add up due to rounding.
Statements contained in this press release may contain information that is forward-looking and reflects management’s current view and estimates of future economic circumstances, industry conditions, company performance, and finance results. Any statements, expectations, capabilities, plans and assumptions contained in this press release that do not describe historical facts, such as statements regarding the declaration or payment of dividends, the direction of future operations, the implementation of principal operating and financing strategies and capital expenditure plans, the factors or trends affecting financial condition, liquidity or results of operations, are forward-looking statements within the meaning of the U.S. Private Securities Litigation Reform Act of 1995 and involve a number of risks and uncertainties. There is no guarantee that these results will actually occur. The statements are based on many assumptions and factors, including general economic and market conditions, industry conditions, and operating factors. Any changes in such assumptions or factors could cause actual results to differ materially from current expectations.
AMBEV REPORTS 2018 FIRST QUARTER RESULTS UNDER IFRS
Second Quarter 2018 Results July 26, 2018 Page |22 | |
Ambev - Segment financial information | Brazil | CAC | LAS | Canada | Ambev | ||||||||||||||||
Organic results | Beer | NAB | Total |
|
|
| Consolidated | ||||||||||||||
| 2Q17 | 2Q18 | % | 2Q17 | 2Q18 | % | 2Q17 | 2Q18 | % | 2Q17 | 2Q18 | % | 2Q17 | 2Q18 | % | 2Q17 | 2Q18 | % | 2Q17 | 2Q18 | % |
Volume (000 hl) | 17,430.2 | 17,729.4 | 1.7% | 5,548.7 | 5,601.5 | 1.0% | 22,979.0 | 23,330.9 | 1.5% | 2,965.0 | 3,263.5 | 10.8% | 6,729.8 | 7,051.9 | 4.9% | 2,986.5 | 2,904.8 | -2.7% | 35,660.3 | 36,551.1 | 2.6% |
R$ million |
|
|
|
|
|
|
|
|
|
|
|
|
|
|
|
|
|
|
|
|
|
Net revenue | 4,546.4 | 4,964.6 | 9.2% | 778.6 | 858.1 | 10.2% | 5,325.0 | 5,822.7 | 9.3% | 1,128.3 | 1,377.5 | 16.2% | 2,086.0 | 2,388.5 | 25.6% | 1,728.6 | 1,920.8 | -2.0% | 10,268.0 | 11,509.5 | 11.4% |
% of total | 44.3% | 43.1% | 7.6% | 7.5% | 51.9% | 50.6% | 11.0% | 12.0% | 20.3% | 20.8% | 16.8% | 16.7% | 100.0% | 100.0% | |||||||
COGS | (1,721.3) | (1,805.5) | 4.9% | (420.6) | (390.1) | -7.2% | (2,141.9) | (2,195.6) | 1.0% | (489.4) | (571.9) | 11.2% | (861.2) | (944.9) | 14.6% | (555.7) | (674.8) | 7.0% | (4,048.2) | (4,387.2) | 6.7% |
% of total | 42.5% | 41.2% | 10.4% | 8.9% | 52.9% | 50.0% | 12.1% | 13.0% | 21.3% | 21.5% | 13.7% | 15.4% | 100.0% | 100.0% | |||||||
Gross profit | 2,825.0 | 3,159.1 | 11.8% | 358.1 | 468.0 | 30.7% | 3,183.1 | 3,627.1 | 13.9% | 638.9 | 805.6 | 20.0% | 1,224.8 | 1,443.6 | 33.4% | 1,172.9 | 1,246.0 | -6.2% | 6,219.8 | 7,122.3 | 14.5% |
% of total | 45.4% | 44.4% | 5.8% | 6.6% | 51.2% | 50.9% | 10.3% | 11.3% | 19.7% | 20.3% | 18.9% | 17.5% | 100.0% | 100.0% | |||||||
SG&A | (1,627.6) | (1,795.2) | 10.3% | (238.5) | (267.5) | 12.2% | (1,866.1) | (2,062.7) | 10.5% | (299.8) | (372.1) | 17.3% | (590.1) | (666.2) | 20.7% | (615.4) | (650.8) | -7.3% | (3,371.4) | (3,751.7) | 9.6% |
% of total | 48.3% | 47.8% | 7.1% | 7.1% | 55.4% | 55.0% | 8.9% | 9.9% | 17.5% | 17.8% | 18.3% | 17.3% | 100.0% | 100.0% | |||||||
Other operating income/(expenses) | 178.3 | 196.5 | 10.2% | 42.9 | 62.5 | 45.6% | 221.2 | 259.0 | 17.1% | (6.7) | 11.1 | nm | 6.9 | (23.5) | nm | 1.3 | (5.1) | nm | 222.6 | 241.5 | 10.4% |
% of total | 80.1% | 81.4% | 19.3% | 25.9% | 99.4% | 107.2% | -3.0% | 4.6% | 3.1% | -9.7% | 0.6% | -2.1% | 100.0% | 100.0% | |||||||
Normalized EBIT | 1,375.7 | 1,560.4 | 13.4% | 162.5 | 263.0 | 61.9% | 1,538.2 | 1,823.4 | 18.5% | 332.3 | 444.7 | 28.2% | 641.6 | 753.9 | 40.8% | 558.8 | 590.2 | -6.0% | 3,070.9 | 3,612.1 | 19.6% |
% of total | 44.8% | 43.2% | 5.3% | 7.3% | 50.1% | 50.5% | 10.8% | 12.3% | 20.9% | 20.9% | 18.2% | 16.3% | 100.0% | 100.0% | |||||||
Normalized EBITDA | 1,855.6 | 2,061.6 | 11.1% | 231.6 | 334.0 | 44.2% | 2,087.2 | 2,395.6 | 14.8% | 431.9 | 548.0 | 21.2% | 806.7 | 940.9 | 37.4% | 617.6 | 649.5 | -6.6% | 3,943.3 | 4,534.0 | 16.7% |
% of total | 47.1% | 45.5% | 5.9% | 7.4% | 52.9% | 52.8% | 11.0% | 12.1% | 20.5% | 20.8% | 15.7% | 14.3% | 100.0% | 100.0% | |||||||
% of net revenue |
|
|
|
|
|
|
|
|
|
|
|
|
|
|
|
|
|
|
|
|
|
Net revenue | 100.0% | 100.0% | 100.0% | 100.0% | 100.0% | 100.0% | 100.0% | 100.0% | 100.0% | 100.0% | 100.0% | 100.0% | 100.0% | 100.0% | |||||||
COGS | -37.9% | -36.4% | -54.0% | -45.5% | -40.2% | -37.7% | -43.4% | -41.5% | -41.3% | -39.6% | -32.1% | -35.1% | -39.4% | -38.1% | |||||||
Gross profit | 62.1% | 63.6% | 46.0% | 54.5% | 59.8% | 62.3% | 56.6% | 58.5% | 58.7% | 60.4% | 67.9% | 64.9% | 60.6% | 61.9% | |||||||
SG&A | -35.8% | -36.2% | -30.6% | -31.2% | -35.0% | -35.4% | -26.6% | -27.0% | -28.3% | -27.9% | -35.6% | -33.9% | -32.8% | -32.6% | |||||||
Other operating income/(expenses) | 3.9% | 4.0% | 5.5% | 7.3% | 4.2% | 4.4% | -0.6% | 0.8% | 0.3% | -1.0% | 0.1% | -0.3% | 2.2% | 2.1% | |||||||
Normalized EBIT | 30.3% | 31.4% | 20.9% | 30.6% | 28.9% | 31.3% | 29.5% | 32.3% | 30.8% | 31.6% | 32.3% | 30.7% | 29.9% | 31.4% | |||||||
Normalized EBITDA | 40.8% | 41.5% | 29.7% | 38.9% | 39.2% | 41.1% | 38.3% | 39.8% | 38.7% | 39.4% | 35.7% | 33.8% | 38.4% | 39.4% | |||||||
Per hectoliter - (R$/hl) |
|
|
|
|
|
|
|
|
|
|
|
|
|
|
|
|
|
|
|
|
|
Net revenue | 260.8 | 280.0 | 7.4% | 140.3 | 153.2 | 9.2% | 231.7 | 249.6 | 7.7% | 380.5 | 422.1 | 4.9% | 310.0 | 338.7 | 19.5% | 578.8 | 661.2 | 0.8% | 287.9 | 314.9 | 8.6% |
COGS | (98.8) | (101.8) | 3.1% | (75.8) | (69.6) | -8.1% | (93.2) | (94.1) | 1.0% | (165.1) | (175.2) | 0.4% | (128.0) | (134.0) | 9.2% | (186.1) | (232.3) | 10.0% | (113.5) | (120.0) | 4.1% |
Gross profit | 162.1 | 178.2 | 9.9% | 64.5 | 83.6 | 29.5% | 138.5 | 155.5 | 12.2% | 215.5 | 246.9 | 8.4% | 182.0 | 204.7 | 26.6% | 392.7 | 429.0 | -3.6% | 174.4 | 194.9 | 11.6% |
SG&A | (93.4) | (101.3) | 8.4% | (43.0) | (47.8) | 11.1% | (81.2) | (88.4) | 8.9% | (101.1) | (114.0) | 5.9% | (87.7) | (94.5) | 14.9% | (206.1) | (224.0) | -4.7% | (94.5) | (102.6) | 6.9% |
Other operating income/(expenses) | 10.2 | 11.1 | 8.4% | 7.7 | 11.2 | 44.2% | 9.6 | 11.1 | 15.3% | (2.3) | 3.4 | nm | 1.0 | (3.3) | nm | 0.4 | (1.8) | nm | 6.2 | 6.6 | 7.7% |
Normalized EBIT | 78.9 | 88.0 | 11.5% | 29.3 | 46.9 | 60.3% | 66.9 | 78.2 | 16.8% | 112.1 | 136.2 | 15.7% | 95.3 | 106.9 | 33.1% | 187.1 | 203.2 | -3.4% | 86.1 | 98.8 | 16.5% |
Normalized EBITDA | 106.5 | 116.3 | 9.2% | 41.7 | 59.6 | 42.8% | 90.8 | 102.7 | 13.0% | 145.7 | 167.9 | 9.4% | 119.9 | 133.4 | 30.3% | 206.8 | 223.6 | -4.0% | 110.6 | 124.0 | 13.7% |
AMBEV REPORTS 2018 FIRST QUARTER RESULTS UNDER IFRS
Second Quarter 2018 Results July 26, 2018 Page |23 | |
Ambev - Segment financial information | Brazil | CAC | LAS | Canada | Ambev | ||||||||||||||||
Organic results | Beer | NAB | Total |
|
|
| Consolidated | ||||||||||||||
| YTD17 | YTD18 | % | YTD17 | YTD18 | % | YTD17 | YTD18 | % | YTD17 | YTD18 | % | YTD17 | YTD18 | % | YTD17 | YTD18 | % | YTD17 | YTD18 | % |
Volume (000 hl) | 37,979.4 | 36,608.5 | -3.6% | 12,494.1 | 11,196.5 | -10.4% | 50,473.5 | 47,805.0 | -5.3% | 5,756.9 | 6,174.9 | 7.6% | 15,819.4 | 16,661.3 | 5.4% | 4,915.7 | 4,825.4 | -1.8% | 76,965.4 | 75,466.6 | -1.9% |
R$ million |
|
|
|
|
|
|
|
|
|
|
|
|
|
|
|
|
|
|
|
|
|
Net revenue | 9,916.8 | 10,280.2 | 3.7% | 1,702.4 | 1,723.0 | 1.2% | 11,619.2 | 12,003.2 | 3.3% | 2,186.2 | 2,527.3 | 12.5% | 4,850.0 | 5,480.0 | 25.0% | 2,854.4 | 3,139.3 | -1.0% | 21,509.8 | 23,149.8 | 8.5% |
% of total | 46.1% | 44.4% | 7.9% | 7.4% | 54.0% | 51.9% | 10.2% | 10.9% | 22.5% | 23.7% | 13.3% | 13.6% | 100.0% | 100.0% | |||||||
COGS | (3,835.2) | (3,688.3) | -3.8% | (971.2) | (856.7) | -11.8% | (4,806.4) | (4,545.0) | -5.4% | (953.3) | (1,060.3) | 8.2% | (1,921.1) | (2,113.8) | 17.7% | (890.5) | (1,128.8) | 14.1% | (8,571.3) | (8,848.0) | 3.3% |
% of total | 44.7% | 41.7% | 11.3% | 9.7% | 56.1% | 51.4% | 11.1% | 12.0% | 22.4% | 23.9% | 10.4% | 12.8% | 100.0% | 100.0% | |||||||
Gross profit | 6,081.6 | 6,591.9 | 8.4% | 731.2 | 866.2 | 18.5% | 6,812.8 | 7,458.2 | 9.5% | 1,232.9 | 1,466.9 | 15.9% | 2,928.9 | 3,366.2 | 29.8% | 1,963.9 | 2,010.5 | -7.8% | 12,938.4 | 14,301.8 | 12.0% |
% of total | 47.0% | 46.1% | 5.7% | 6.1% | 52.7% | 52.1% | 9.5% | 10.3% | 22.6% | 23.5% | 15.2% | 14.1% | 100.0% | 100.0% | |||||||
SG&A | (3,371.9) | (3,591.7) | 6.5% | (504.1) | (534.0) | 5.9% | (3,876.0) | (4,125.7) | 6.4% | (615.9) | (690.6) | 8.7% | (1,248.4) | (1,412.3) | 24.0% | (1,111.9) | (1,190.5) | -3.6% | (6,852.3) | (7,419.2) | 8.2% |
% of total | 49.2% | 48.4% | 7.4% | 7.2% | 56.6% | 55.6% | 9.0% | 9.3% | 18.2% | 19.0% | 16.2% | 16.0% | 100.0% | 100.0% | |||||||
Other operating income/(expenses) | 401.1 | 413.1 | 3.0% | 100.3 | 119.0 | 18.7% | 501.3 | 532.1 | 6.1% | 1.3 | 15.4 | nm | 8.3 | (36.8) | nm | 2.4 | (11.6) | nm | 513.4 | 499.1 | -2.0% |
% of total | 78.1% | 82.8% | 19.5% | 23.8% | 97.6% | 106.6% | 0.3% | 3.1% | 1.6% | -7.4% | 0.5% | -2.3% | 100.0% | 100.0% | |||||||
Normalized EBIT | 3,110.7 | 3,413.3 | 9.7% | 327.4 | 451.3 | 37.8% | 3,438.1 | 3,864.6 | 12.4% | 618.2 | 791.6 | 25.3% | 1,688.8 | 1,917.1 | 31.5% | 854.4 | 808.4 | -14.8% | 6,599.5 | 7,381.7 | 14.9% |
% of total | 47.1% | 46.2% | 5.0% | 6.1% | 52.1% | 52.4% | 9.4% | 10.7% | 25.6% | 26.0% | 12.9% | 11.0% | 100.0% | 100.0% | |||||||
Normalized EBITDA | 4,070.5 | 4,392.4 | 7.9% | 471.8 | 588.8 | 24.8% | 4,542.3 | 4,981.2 | 9.7% | 808.8 | 993.0 | 20.0% | 2,010.0 | 2,273.9 | 30.0% | 938.4 | 924.6 | -11.3% | 8,299.5 | 9,172.7 | 13.2% |
% of total | 49.0% | 47.9% | 5.7% | 6.4% | 54.7% | 54.3% | 9.7% | 10.8% | 24.2% | 24.8% | 11.3% | 10.1% | 100.0% | 100.0% | |||||||
% of net revenue |
|
|
|
|
|
|
|
|
|
|
|
|
|
|
|
|
|
|
|
|
|
Net revenue | 100.0% | 100.0% | 100.0% | 100.0% | 100.0% | 100.0% | 100.0% | 100.0% | 100.0% | 100.0% | 100.0% | 100.0% | 100.0% | 100.0% | |||||||
COGS | -38.7% | -35.9% | -57.0% | -49.7% | -41.4% | -37.9% | -43.6% | -42.0% | -39.6% | -38.6% | -31.2% | -36.0% | -39.8% | -38.2% | |||||||
Gross profit | 61.3% | 64.1% | 43.0% | 50.3% | 58.6% | 62.1% | 56.4% | 58.0% | 60.4% | 61.4% | 68.8% | 64.0% | 60.2% | 61.8% | |||||||
SG&A | -34.0% | -34.9% | -29.6% | -31.0% | -33.4% | -34.4% | -28.2% | -27.3% | -25.7% | -25.8% | -39.0% | -37.9% | -31.9% | -32.0% | |||||||
Other operating income/(expenses) | 4.0% | 4.0% | 5.9% | 6.9% | 4.3% | 4.4% | 0.1% | 0.6% | 0.2% | -0.7% | 0.1% | -0.4% | 2.4% | 2.2% | |||||||
Normalized EBIT | 31.4% | 33.2% | 19.2% | 26.2% | 29.6% | 32.2% | 28.3% | 31.3% | 34.8% | 35.0% | 29.9% | 25.8% | 30.7% | 31.9% | |||||||
Normalized EBITDA | 41.0% | 42.7% | 27.7% | 34.2% | 39.1% | 41.5% | 37.0% | 39.3% | 41.4% | 41.5% | 32.9% | 29.5% | 38.6% | 39.6% | |||||||
Per hectoliter - (R$/hl) |
|
|
|
|
|
|
|
|
|
|
|
|
|
|
|
|
|
|
|
|
|
Net revenue | 261.1 | 280.8 | 7.5% | 136.3 | 153.9 | 12.9% | 230.2 | 251.1 | 9.1% | 379.8 | 409.3 | 4.6% | 306.6 | 328.9 | 18.5% | 580.7 | 650.6 | 0.9% | 279.5 | 306.8 | 10.7% |
COGS | (101.0) | (100.7) | -0.2% | (77.7) | (76.5) | -1.6% | (95.2) | (95.1) | -0.2% | (165.6) | (171.7) | 0.5% | (121.4) | (126.9) | 11.7% | (181.2) | (233.9) | 16.2% | (111.4) | (117.2) | 5.3% |
Gross profit | 160.1 | 180.1 | 12.5% | 58.5 | 77.4 | 32.2% | 135.0 | 156.0 | 15.6% | 214.2 | 237.6 | 7.7% | 185.1 | 202.0 | 23.0% | 399.5 | 416.6 | -6.1% | 168.1 | 189.5 | 14.2% |
SG&A | (88.8) | (98.1) | 10.5% | (40.3) | (47.7) | 18.2% | (76.8) | (86.3) | 12.4% | (107.0) | (111.8) | 1.0% | (78.9) | (84.8) | 17.6% | (226.2) | (246.7) | -1.8% | (89.0) | (98.3) | 10.3% |
Other operating income/(expenses) | 10.6 | 11.3 | 6.9% | 8.0 | 10.6 | 32.4% | 9.9 | 11.1 | 12.1% | 0.2 | 2.5 | nm | 0.5 | (2.2) | nm | 0.5 | (2.4) | nm | 6.7 | 6.6 | -0.1% |
Normalized EBIT | 81.9 | 93.2 | 13.8% | 26.2 | 40.3 | 53.8% | 68.1 | 80.8 | 18.7% | 107.4 | 128.2 | 16.4% | 106.8 | 115.1 | 24.5% | 173.8 | 167.5 | -13.2% | 85.7 | 97.8 | 17.1% |
Normalized EBITDA | 107.2 | 120.0 | 11.9% | 37.8 | 52.6 | 39.3% | 90.0 | 104.2 | 15.8% | 140.5 | 160.8 | 11.5% | 127.1 | 136.5 | 23.2% | 190.9 | 191.6 | -9.7% | 107.8 | 121.5 | 15.4% |
AMBEV REPORTS 2018 FIRST QUARTER RESULTS UNDER IFRS
Second Quarter 2018 Results July 26, 2018 Page |24 | |
CONSOLIDATED BALANCE SHEET |
|
|
R$ million | December 31, 2017 | June 30, 2018 |
Assets | ||
Current assets | ||
Cash and cash equivalents | 10,354.5 | 10,620.0 |
Investment securities | 11.9 | 12.6 |
Derivative financial instruments | 350.0 | 1,132.4 |
Trade receivables | 4,944.8 | 4,412.7 |
Inventories | 4,319.0 | 4,933.3 |
Income tax and social contributions receivable | 2,770.4 | 2,987.8 |
Other taxes receivable | 600.2 | 1,115.2 |
Other assets | 1,367.3 | 1,195.1 |
24,718.1 | 26,409.1 | |
Non-current assets | ||
Investment securities | 122.0 | 144.7 |
Derivative financial instruments | 35.2 | 73.3 |
Income tax and social contributions receivable | 2,312.7 | 2,005.8 |
Deferred tax assets | 2,279.3 | 3,409.6 |
Other taxes receivable | 225.0 | 243.9 |
Other assets | 1,964.4 | 1,693.4 |
Employee benefits | 58.4 | 60.3 |
Investments in joint ventures | 238.0 | 263.5 |
Property, plant and equipment | 18,822.3 | 18,762.1 |
Intangible | 4,674.7 | 4,956.5 |
Goodwill | 31,401.9 | 32,899.1 |
62,133.9 | 64,512.2 | |
Total assets | 86,852.0 | 90,921.4 |
Equity and liabilities | ||
Current liabilities | ||
Trade payables | 11,853.9 | 11,161.2 |
Derivative financial instruments | 215.1 | 484.8 |
Interest-bearing loans and borrowings | 1,321.1 | 3,715.5 |
Bank overdrafts | 1.8 | 1.2 |
Payroll and social security payables | 1,047.2 | 879.5 |
Dividends and interest on shareholder´s equity payable | 1,778.6 | 3,283.7 |
Income tax and social contribution payable | 1,668.4 | 1,538.7 |
Taxes and contributions payable | 3,825.4 | 2,832.0 |
Put option granted on subsidiary and other liabilities | 6,807.9 | 3,283.9 |
Provisions | 169.0 | 174.3 |
28,688.5 | 27,354.8 | |
Non-current liabilities | ||
Trade payables | 175.1 | 136.9 |
Derivative financial instruments | 2.4 |
|
Interest-bearing loans and borrowings | 1,231.9 | 1,141.5 |
Deferred tax liabilities | 2,329.2 | 2,740.1 |
Income tax and social contribution payable | 2,418.0 | 2,197.9 |
Taxes and contributions payable | 771.6 | 731.0 |
Put option granted on subsidiary and other liabilities | 429.1 | 206.8 |
Provisions | 512.6 | 492.1 |
Employee benefits | 2,310.7 | 2,480.7 |
10,180.7 | 10,127.0 | |
Total liabilities | 38,869.1 | 37,481.8 |
Equity | ||
Issued capital | 57,614.1 | 57,710.2 |
Reserves | 63,361.1 | 63,357.2 |
Comprehensive income | (74,966.5) | (70,769.4) |
Retained earnings |
| 1,962.7 |
Equity attributable to equity holders of Ambev | 46,008.8 | 52,260.8 |
Non-controlling interests | 1,974.0 | 1,178.8 |
Total Equity | 47,982.9 | 53,439.5 |
Total equity and liabilities | 86,852.0 | 90,921.4 |
AMBEV REPORTS 2018 FIRST QUARTER RESULTS UNDER IFRS
Second Quarter 2018 Results July 26, 2018 Page |25 | |
CONSOLIDATED INCOME STATEMENT |
|
|
|
|
R$ million | 2Q17 | 2Q18 | YTD17 | YTD18 |
Net revenue | 10,268.0 | 11,509.5 | 21,509.8 | 23,149.8 |
Cost of goods sold | (4,048.2) | (4,387.2) | (8,571.3) | (8,848.0) |
Gross profit | 6,219.8 | 7,122.3 | 12,938.4 | 14,301.8 |
Distribution expenses | (1,467.3) | (1,591.5) | (2,978.7) | (3,215.3) |
Sales and marketing expenses | (1,383.4) | (1,577.5) | (2,797.1) | (3,049.0) |
Administrative expenses | (520.8) | (582.8) | (1,076.4) | (1,154.9) |
Other operating income/(expenses) | 222.6 | 241.5 | 513.4 | 499.1 |
Normalized EBIT | 3,070.9 | 3,612.1 | 6,599.5 | 7,381.7 |
Exceptional items | (32.1) | 38.1 | (60.8) | 29.7 |
Income from operations (EBIT) | 3,038.8 | 3,650.2 | 6,538.8 | 7,411.4 |
Net finance results | (698.8) | (1,049.1) | (1,571.4) | (1,593.4) |
Share of results of joint ventures | 5.3 | 2.6 | 6.3 | 3.2 |
Profit before income tax | 2,345.3 | 2,603.7 | 4,973.6 | 5,821.2 |
Income tax expense | (220.5) | (179.6) | (559.0) | (799.4) |
Profit | 2,124.8 | 2,424.2 | 4,414.7 | 5,021.8 |
Equity holders of Ambev | 2,013.1 | 2,317.2 | 4,212.3 | 4,833.1 |
Non-controlling interest | 111.7 | 107.0 | 202.4 | 188.7 |
Basic earnings per share (R$) | 0.13 | 0.15 | 0.27 | 0.31 |
Diluted earnings per share (R$) | 0.13 | 0.15 | 0.27 | 0.31 |
Normalized Profit | 2,141.5 | 2,348.5 | 4,457.5 | 4,959.4 |
Normalized basic earnings per share (R$) | 0.13 | 0.14 | 0.27 | 0.30 |
Normalized diluted earnings per share (R$) | 0.13 | 0.14 | 0.27 | 0.30 |
Nº of basic shares outstanding (million of shares) | 15,706.1 | 15,718.8 | 15,703.4 | 15,715.9 |
Nº of diluted shares outstanding (million if shares) | 15,834.3 | 15,846.6 | 15,831.6 | 15,843.8 |
AMBEV REPORTS 2018 FIRST QUARTER RESULTS UNDER IFRS
Second Quarter 2018 Results July 26, 2018 Page |26 | |
CONSOLIDATED STATEMENT OF CASH FLOWS |
|
|
|
|
R$ million | 2Q17 | 2Q18 | YTD17 | YTD18 |
Profit | 2,124.8 | 2,424.2 | 4,414.7 | 5,021.8 |
Depreciation, amortization and impairment | 872.4 | 923.2 | 1,700.0 | 1,792.3 |
Impairment losses on receivables and inventories | 42.6 | 39.0 | 70.8 | 74.0 |
Additions/(reversals) in provisions and employee benefits | 24.2 | 25.0 | 73.3 | 71.3 |
Net finance cost | 698.8 | 1,049.1 | 1,571.4 | 1,593.4 |
Loss/(gain) on sale of property, plant and equipment and intangible assets | (8.1) | (1.0) | (2.7) | 20.9 |
Equity-settled share-based payment expense | 41.4 | 46.3 | 86.4 | 80.1 |
Income tax expense | 220.5 | 179.6 | 559.0 | 799.4 |
Share of result of joint ventures | (5.3) | (2.6) | (6.3) | (3.2) |
Other non-cash items included in the profit | 63.6 | (403.6) | 187.1 | (519.2) |
Cash flow from operating activities before changes in working capital and provisions | 4,075.0 | 4,279.1 | 8,653.6 | 8,930.8 |
(Increase)/decrease in trade and other receivables | (377.4) | (1,065.9) | 1,060.9 | (200.4) |
(Increase)/decrease in inventories | (85.8) | (125.2) | (285.7) | (589.9) |
Increase/(decrease) in trade and other payables | (1,194.7) | 430.6 | (3,902.7) | (2,079.0) |
Cash generated from operations | 2,417.1 | 3,518.7 | 5,526.1 | 6,061.6 |
Interest paid | (95.8) | (273.9) | (250.9) | (375.2) |
Interest received | 80.7 | 145.2 | 136.0 | 245.4 |
Dividends received | 0.1 | 0.6 | 4.0 | 0.6 |
Income tax and social contributions paid | 22.5 | (315.1) | (1,006.0) | (2,064.7) |
Cash flow from operating activities | 2,424.6 | 3,075.4 | 4,409.1 | 3,867.7 |
Proceeds from sale of property, plant, equipment and intangible assets | 15.3 | 33.7 | 25.8 | 35.2 |
Acquisition of property, plant, equipment and intangible assets | (751.0) | (805.1) | (1,310.5) | (1,277.8) |
Acquisition of subsidiaries, net of cash acquired | 1.3 | (89.2) | (331.4) | (102.8) |
Acquisition of other investments |
|
|
| (5.0) |
(Investments)/net proceeds of debt securities | 18.6 | 3.3 | 291.2 | (4.5) |
Net proceeds/(acquisition) of other assets |
| (29.0) | 1.6 | (29.3) |
Cash flow used in investing activities | (715.9) | (886.3) | (1,323.5) | (1,384.1) |
Capital increase |
|
|
| 6.2 |
Proceeds/(repurchase) of shares | 15.6 | 6.2 | (32.8) | (2.4) |
Acquisition of non-controlling interests |
|
|
| (3,060.5) |
Proceeds from borrowings | 1,356.1 | 1,436.7 | 2,594.3 | 3,463.3 |
Repayment of borrowings | (1,460.3) | (1,415.0) | (2,943.1) | (1,508.5) |
Cash net finance costs other than interests | (288.2) | 4.1 | (718.1) | (303.2) |
Payment of finance lease liabilities | (2.2) | (2.3) | (4.5) | (4.5) |
Dividends and interest on shareholders’ equity paid | (83.0) | (46.6) | (1,215.0) | (1,146.3) |
Cash flow used in financing activities | (461.9) | (16.8) | (2,319.1) | (2,555.8) |
Net increase/(decrease) in Cash and cash equivalents | 1,246.8 | 2,172.3 | 766.6 | (72.2) |
Cash and cash equivalents less bank overdrafts at | 7,229.1 | 7,953.4 | 7,876.8 | 10,352.7 |
Effect of exchange rate fluctuations | 254.3 | 493.1 | 86.8 | 338.2 |
Cash and cash equivalents less bank overdrafts at | 8,730.3 | 10,618.7 | 8,730.3 | 10,618.7 |
AMBEV REPORTS 2018 FIRST QUARTER RESULTS UNDER IFRS
SIGNATURE
Pursuant to the requirements of the Securities Exchange Act of 1934, the registrant has duly caused this report to be signed on its behalf by the undersigned, thereunto duly authorized.
Date: July 26, 2018
| AMBEV S.A. | ||
| By: | /s/Fernando Mommensohn Tennenbaum | |
Fernando Mommensohn Tennenbaum Chief Financial and Investor Relations Officer | ||